As filed with the Securities and Exchange Commission on March 21, 2014
UNITED STATES
SECURITIES AND EXCHANGE COMMISSION
WASHINGTON, D.C. 20549
FORM 20-F
|
(Mark One)
|
||
| o |
REGISTRATION STATEMENT PURSUANT TO SECTION 12(b)
OR (g) OF THE SECURITIES EXCHANGE ACT OF 1934
|
|
|
OR
|
||
| x |
ANNUAL REPORT PURSUANT TO SECTION 13 OR 15(d)
OF THE SECURITIES EXCHANGE ACT OF 1934
For the fiscal year ended December 31, 2013
|
|
|
OR
|
||
| o |
TRANSITION REPORT PURSUANT TO SECTION 13 OR 15(d)
OF THE SECURITIES EXCHANGE ACT OF 1934
For the transition period from _____ to _____
|
|
|
OR
|
||
| o |
SHELL COMPANY REPORT PURSUANT TO SECTION 13 OR 15(d)
OF THE SECURITIES EXCHANGE ACT OF 1934
|
Commission file number: 001-09531
TELEFÓNICA, S.A.
(Exact name of Registrant as specified in its charter)
KINGDOM OF SPAIN
(Jurisdiction of incorporation or organization)
Distrito Telefónica, Ronda de la Comunicación, s/n
28050 Madrid, Spain
(Address of principal executive offices)
Consuelo Barbé Capdevila, Securities Market and Corporate Governance Legal Department
Distrito Telefónica, Ronda de la Comunicación, s/n, 28050 Madrid, Spain
Tel. +34 91 482 3733, Fax. +34 91 482 3817, e-mail: amv@telefonica.com
Pablo Eguiron Vidarte Ponce, Head of Investor Relations,
Distrito Telefónica, Ronda de la Comunicación, s/n, 28050 Madrid, Spain
Tel. +34 91 482 8700, Fax. +34 91 482 8600, e-mail: ir@telefonica.es
(Name, Telephone, E-Mail and/or Facsimile number and Address of Company Contact Person)
Securities registered or to be registered pursuant to Section 12(b) of the Act:
|
Title of each class
|
Name of each exchange on which registered
|
|
|
Ordinary Shares, nominal value 1.00 euro per share*
American Depositary Shares, each representing one
Ordinary Share
|
New York Stock Exchange
New York Stock Exchange
|
|
|
Guarantees** by Telefónica, S.A. of the $1,250,000,000 Fixed Rate Notes Due 2015; $900,000,000 Fixed Rate Guaranteed Senior Notes Due 2015; $1,250,000,000 Fixed Rate Guaranteed Senior Notes Due 2016; $1,250,000,000 Fixed Rate Guaranteed Senior Notes Due 2016; $700,000,000 Fixed Rate Guaranteed Senior Notes Due 2017; $1,250,000,000 Fixed Rate Guaranteed Senior Notes Due 2018; $1,000,000,000 Fixed Rate Notes Due 2019; $1,400,000,000 Fixed Rate Guaranteed Senior Notes Due 2020; $1,500,000,000 Fixed Rate Guaranteed Senior Notes Due 2021; $750,000,000 Fixed Rate Guaranteed Senior Notes Due 2023; $2,000,000,000 Fixed Rate Guaranteed Senior Notes Due 2036; each of Telefónica Emisiones, S.A.U.; and of the $1,250,000,000 Fixed Rate Guaranteed Senior Notes Due 2030 of Telefónica Europe, B.V.
|
New York Stock Exchange
|
|
|
*
|
Not for trading, but only in connection with the listing of American Depositary Shares, pursuant to the requirements of the New York Stock Exchange.
|
|
**
|
Not for trading, but only in connection with the listing of the $1,250,000,000 Fixed Rate Notes Due 2015; $900,000,000 Fixed Rate Guaranteed Senior Notes Due 2015; $1,250,000,000 Fixed Rate Guaranteed Senior Notes Due 2016; $1,250,000,000 Fixed Rate Guaranteed Senior Notes Due 2016; $700,000,000 Fixed Rate Guaranteed Senior Notes Due 2017; $1,250,000,000 Fixed Rate Guaranteed Senior Notes Due 2018; $1,000,000,000 Fixed Rate Notes Due 2019; $1,400,000,000 Fixed Rate Guaranteed Senior Notes Due 2020; $1,500,000,000 Fixed Rate Guaranteed Senior Notes Due 2021; $750,000,000 Fixed Rate Guaranteed Senior Notes Due 2023; $2,000,000,000 Fixed Rate Guaranteed Senior Notes Due 2036; each of Telefónica Emisiones, S.A.U. and $1,250,000,000 Fixed Rate Guaranteed Senior Notes Due 2030 of Telefónica Europe, B.V. (wholly-owned subsidiaries of Telefónica, S.A.)
|
Securities registered or to be registered pursuant to Section 12(g) of the Act: None
Securities for which there is a reporting obligation pursuant to Section 15(d) of the Act: None
The number of outstanding shares of each class of capital stock of Telefónica, S.A. at December 31, 2013 was:
Ordinary Shares, nominal value 1.00 euro per share: 4,551,024,586
Indicate by check mark if the registrant is a well-known seasoned issuer, as defined in Rule 405 of the Securities Act.
If this report is an annual or transition report, indicate by check mark if the registrant is not required to file reports pursuant to Section 13 or 15(d) of the Securities Exchange Act of 1934.
Yes
o
No
x
Indicate by check mark whether the registrant (1) has filed all reports required to be filed by Section 13 or 15(d) of the Securities Exchange Act of 1934 during the preceding 12 months (or for such shorter period that the registrant was required to file such reports) and (2) has been subject to such filing requirements for the past 90 days.
Yes
x
No
o
Indicate by check mark whether the registrant has submitted electronically and posted on its corporate Web site, if any, every Interactive Data File required to be submitted and posted pursuant to Rule 405 of Regulation S-T (Section 232.405 of this chapter) during the preceding 12 months (or for such shorter period that the registrant was required to submit and post such files).
Yes
o
No
o
Indicate by check mark whether the registrant is a large accelerated filer, an accelerated filer, or a non-accelerated filer. See definition of “accelerated filer” and “large accelerated filer” in Rule 12b-2 of the Securities Exchange Act.
Large accelerated filer
x
Accelerated filer
o
Non-accelerated filer
o
Indicate by check mark which basis of accounting the registrant has used to prepare the financial statements included in this filing:
U.S. GAAP
o
International Financial Reporting Standards as Issued by the international Accounting Standards Board
x
Other
o
If “Other” has been checked in response to the previous question, indicate by check mark which financial statement item the registrant has elected to follow.
Item 17
o
Item 18
o
If this is an annual report indicate by check mark whether the registrant is a shell company (as defined in Rule 12b-2 of the Securities Exchange Act).
Yes
o
No
x
This Annual Report contains statements that constitute forward-looking statements within the meaning of Section 27A of the Securities Act of 1933, as amended, Section 21E of the Securities Exchange Act of 1934 (the “Exchange Act”), as amended, and the safe harbor provisions of the Private Securities Litigation Reform Act of 1995. The forward-looking statements in this Annual Report can be identified, in some instances, by the use of words such as “will,” “expect,” “aim,” “hope,” “anticipate,” “intend,” “believe” and similar language or the negative thereof or by the forward-looking nature of discussions of strategy, plans or intentions. These statements appear in a number of places in this Annual Report including, without limitation, certain statements made in “Item 3. Key Information—Risk Factors,” “Item 4. Information on the Company,” “Item 5. Operating and Financial Review and Prospects” and “Item 11. Quantitative and Qualitative Disclosures About Market Risk” and include statements regarding our intent, belief or current expectations with respect to, among other things:
|
|
·
|
the effect on our results of operations of competition in telecommunications markets;
|
|
|
·
|
trends affecting our business financial condition, results of operations or cash flows;
|
|
|
·
|
acquisitions or investments which we may make in the future;
|
|
|
·
|
our capital expenditures plan;
|
|
|
·
|
our estimated availability of funds;
|
|
|
·
|
our ability to repay debt with estimated future cash flows;
|
|
|
·
|
our shareholder remuneration policies;
|
|
|
·
|
supervision and regulation of the telecommunications sectors where we have significant operations;
|
|
|
·
|
our strategic partnerships; and
|
|
|
·
|
the potential for growth and competition in current and anticipated areas of our business.
|
Such forward-looking statements are not guarantees of future performance and involve numerous risks and uncertainties, and actual results may differ materially from those anticipated in the forward-looking statements as a result of various factors. The risks and uncertainties involved in our business that could affect the matters referred to in such forward-looking statements include but are not limited to:
|
|
·
|
changes in general economic, business or political conditions in the domestic or international markets in which we operate or have material investments that may affect demand for our services;
|
|
|
·
|
exposure to currency exchange rates, interest rates or credit risk related to our treasury investments or in some of our financial transactions;
|
|
|
·
|
existing or worsening conditions in the international financial markets;
|
|
|
·
|
the impact of current, pending or future legislation and regulation in countries where we operate, as well as any failure to renew or obtain the necessary licenses, authorizations and concessions to carry out our operations and the impact of limitations in spectrum capacity;
|
|
|
·
|
customers’ perceptions of services offered by us;
|
|
|
·
|
the actions of existing and potential competitors in each of our markets as well as the potential effects of technological changes;
|
|
|
·
|
failure of suppliers to provide necessary equipment and services on a timely basis;
|
|
|
·
|
the impact of unanticipated network interruptions including due to cyber-security actions;
|
|
|
·
|
the effect of reports suggesting that electromagnetic fields may cause health problems;
|
|
|
·
|
the impact of impairment charges on our goodwill and assets as a result of changes in the regulatory, business or political environment;
|
|
|
·
|
potential liability resulting from our internet access and hosting services arising from illegal or illicit use of the internet, including the inappropriate dissemination or modification of consumer data; and
|
|
|
·
|
the outcome of pending or future litigation or other legal proceedings.
|
Readers are cautioned not to place undue reliance on those forward-looking statements, which speak only as of the date of this Annual Report. We undertake no obligation to release publicly the result of any revisions to these forward-looking statements which may be made to reflect events or circumstances after the date of this Annual Report including, without limitation, changes in our business or acquisition strategy or planned capital expenditures, or to reflect the occurrence of unanticipated events.
Our ordinary shares, nominal value 1.00 euro per share, are currently listed on each of the Madrid, Barcelona, Bilbao and Valencia stock exchanges and are quoted through the Automated Quotation System under the symbol “TEF.” They are also listed on various foreign stock exchanges such as the London and Buenos Aires stock exchanges. American Depositary Shares (“ADSs”), each representing the right to receive one ordinary share, are listed on the New York Stock Exchange and on the Lima Stock Exchange. ADSs are evidenced by American Depositary Receipts (“ADRs”) issued under a Deposit Agreement with Citibank, N.A., as Depositary.
As used herein, “Telefónica,” “Telefónica Group,” “Group”, the “Company” and terms such as “we,” “us” and “our” mean Telefónica, S.A. and its consolidated subsidiaries, unless the context requires otherwise.
As used herein, “Atento” means Atento Holding, Inversiones y Teleservicios, S.A. and its consolidated subsidiaries, unless the context requires otherwise.
Below are definitions of certain technical terms used in this Annual Report:
|
·
|
“Access” refers to a connection to any of the telecommunications services offered by us. Because a single fixed customer may contract for multiple services, we count the number of accesses, or services a customer has contracted for. For example, a customer that has fixed line telephony service and broadband service represents two accesses rather than one. The following are the main categories of accesses:
|
|
|
−
|
Fixed telephony accesses: includes public switched telephone network, or PSTN, lines (including public use telephony), and integrated services digital network, or ISDN, lines and circuits. For purposes of calculating our number of fixed line accesses, we multiply our lines in service as follows: PSTN (x1); basic ISDN (x1); primary ISDN (x30, x20 or x10); 2/6 digital accesses (x30).
|
|
|
−
|
Internet and data accesses: includes retail broadband accesses (retail asymmetrical digital subscriber line “ADSL,” very high bit-rate digital subscriber line “VDSL”, satellite, fiber optic and circuits over 2 Mbps), narrowband accesses (internet service through the PSTN lines) and other accesses, including the remaining non-broadband final client circuits. “Naked ADSL” allows customers to subscribe for a broadband connection without a monthly fixed line fee.
|
|
|
−
|
Pay TV: includes cable TV, direct to home satellite TV, or DTH, and Internet Protocol TV, or IPTV.
|
|
|
−
|
Mobile accesses: we count each active SIM as an access regardless of the number of services contracted through the SIM. Mobile accesses include accesses to mobile network for voice and/or data services (including connectivity). Mobile accesses are categorized into contract and prepay accesses.
|
|
|
−
|
Mobile broadband includes Mobile Internet (internet access from devices also used to make voice calls e.g. smartphones-), and Mobile Connectivity (internet access from devices that complement fixed broadband, such as PC Cards/dongles, which enable large amounts of data to be downloaded on the move).
|
|
|
−
|
Unbundled/shared local loop, or ULL: includes accesses to both ends of the copper local loop leased to other operators to provide voice and DSL services (fully unbundled loop, fully UL) or only DSL service (shared unbundled loop, “shared UL”).
|
|
·
|
“ARPU” is the average revenues per user per month. ARPU is calculated by dividing total gross service revenues (excluding inbound roaming in revenues) from sales to customers for the preceding 12 months by the weighted average number of accesses for the same period, and then divided by 12.
|
|
·
|
“CDMA” means Code Division Multiple Access, which is a type of radio communication technology.
|
|
·
|
“Cloud computing” is the delivery of computing as a service rather than a product, whereby shared resources, software, and information are provided to computers and other devices as a utility over a network (typically the Internet).
|
|
·
|
“Commercial activity” includes the addition of new lines, replacement of handsets and migrations.
|
|
·
|
“Churn” is the percentage of average customers disconnected over a period of time.
|
|
·
|
“Data ARPU” is the average data revenues per user per month. ARPU is calculated by dividing total data revenues (SMS, MMS and other data revenues like mobile connectivity and mobile internet, etc.) from sales to customers for the preceding 12 months by the weighted average number of accesses for the same period, and then divided by 12.
|
|
·
|
“Data traffic” includes all the traffic related to internet access service, messaging service (SMS, MMS) and to connectivity service that is transported by the company’s networks and that generates data revenue.
|
|
·
|
“Data revenues” includes revenues from SMS, MMS and other data services like mobile connectivity and mobile internet, etc. consumed by the customer.
|
|
·
|
“Digital Dividend” refers to the amount of spectrum that will be freed up in the switchover from analogue to digital terrestrial TV.
|
|
·
|
“Final client accesses” means accesses provided to residential and corporate clients.
|
|
·
|
“FTTx” is a generic term for any broadband network architecture that uses optical fiber to replace all or part of the metal local loop typically used for the last mile of telecommunications wiring.
|
|
·
|
“Gross adds” means the gross increase in the customer base measured in terms of accesses in a period.
|
|
·
|
“HSPA”/“HSDPA” means High Speed Downlink Packet Accesses, which is a 3G mobile telephony communications protocol in the High-Speed Packet Access (HSPA) family, which allows networks based on UMTS to have higher data transfers speeds and capacity.
|
|
·
|
“HDTV” or high definition TV has at least double resolution than standard definition TV (“SDTV”), being able to show higher level of details compared to an analogic TV or to a common DVD.
|
|
·
|
“Interconnection revenues” means revenues received from other operators which use our networks to connect to our customers.
|
|
·
|
“ISP” means Internet service provider.
|
|
·
|
“IT”, or information technology, is the acquisition, processing, storage and dissemination of vocal, pictorial, textual and numerical information by a microelectronics-based combination of computing and telecommunications.
|
|
·
|
“Local loop” means the physical circuit connecting the network termination point at the subscriber’s premises to the main distribution frame or equivalent facility in the fixed public telephone network.
|
|
·
|
“LTE” means Long Term Evolution, a 4G mobile access technology.
|
|
·
|
“Market share” is the percentage of final accesses or revenues of one operator compared to the total market in its operating area.
|
|
·
|
“M2M”, or machine to machine, refers to technologies that allow both mobile and wired systems to communicate with other devices of the same ability.
|
|
·
|
“MTR” means mobile termination rate, which is the charge per minute or SMS paid by a telecommunications network operator when a customer makes a call to another network operator.
|
|
·
|
“MVNO”
means
mobile virtual network operator, which is a mobile operator that is not entitled to use spectrum for the provision of mobile services. Consequently, an MVNO must subscribe to an access agreement with a mobile network operator in order to provide mobile access to their customers. An MVNO pays such mobile network operator for using the infrastructure to facilitate coverage to their customers.
|
|
·
|
“Net adds” means the difference between the customer base measured in terms of accesses at the end of the period and the beginning of the period.
|
|
·
|
“Non SMS data revenues” means data revenues excluding SMS revenues.
|
|
·
|
“OTT services” or “over the top services” means services provided through the Internet (such as television).
|
|
·
|
“P2P SMS” means person to person short messaging service (usually sent by mobile customers).
|
|
·
|
“Revenues” means net sales and revenues from rendering of services.
|
|
·
|
“Service revenues” means revenues less revenues from handset sales. Service revenues are related mainly with telecommunication services, especially voice and data services consumed by our customers.
|
|
·
|
“SIM” means subscriber identity module, a removable intelligent card used in mobile handsets, USB modems, etc. to identify the user in the network.
|
|
·
|
“Voice Traffic” means voice minutes used by our customers over a given period, both outbound and inbound.
|
|
·
|
“UMTS” means Universal Mobile Telecommunications System.
|
|
·
|
“VoIP” means voice over Internet protocol.
|
|
·
|
“Wholesale accesses” means accesses we provide to our competitors, who then sell services over such accesses to their residential and corporate clients.
|
In this Annual Report we make certain comparisons in local currency or on a “constant euro basis” or “excluding foreign exchange rate effects” in order to present an analysis of the development of our results of operations from year-to-year without the effects of currency fluctuations. To make comparisons on a local currency basis, we compare financial items in the relevant local currency for the periods indicated as recorded in the relevant local currency for such periods. To make comparisons on a “constant euro basis” or “excluding foreign exchange rate effects,” we convert the relevant financial item into euro using the prior year’s average euro to relevant local currency exchange rate. In addition, we present certain financial information excluding the effects of Venezuela being considered a hyperinflationary economy in 2011, 2012 and 2013 by eliminating all adjustments made as a result of such consideration.
In this Annual Report, references to “U.S. dollars,” “dollars” or “$,” are to United States dollars, references to “pounds sterling,” “sterling” or “£” are to British pounds sterling, references to “reais” refer to Brazilian reais and references to “euro”, “euros” or “€” are to the single currency of the participating member states in the Third Stage of the European Economic and Monetary Union pursuant to the treaty establishing the European Community, as amended from time to time.
Our consolidated financial statements as of December 31, 2012 and 2013, and for the years ended December 31, 2011, 2012 and 2013 included elsewhere in this Annual Report including the notes thereto (the “Consolidated Financial Statements”), are prepared in conformity with International Financial Reporting Standards (“IFRS”) as issued by the International Accounting Standards Board (“IASB”).
Not applicable.
Not applicable.
Not applicable.
Not applicable.
The following table presents certain selected consolidated financial data. It is to be read in conjunction with “Item 5. Operating and Financial Review and Prospects” and the Consolidated Financial Statements. The consolidated income statement and cash flow data for the years ended December 31, 2011, 2012 and 2013 and the consolidated statement of financial position data as of December 31, 2012 and 2013 set forth below are derived from, and are qualified in their entirety by reference to the Consolidated Financial Statements. The consolidated income statement and cash flow data for the years ended December 31, 2009 and 2010 and the consolidated statement of financial position data as of December 31, 2009, 2010 and 2011 set forth below are derived from Telefónica, S.A.’s consolidated financial statements for such years, which are not included herein.
Our Consolidated Financial Statements have been prepared in accordance with IFRS as issued by the IASB.
The basis of presentation is described in detail in Note 2 to our Consolidated Financial Statements.
|
2009
|
2010
|
2011
|
2012
|
2013
|
||||||||||||||||
|
Revenues
|
56,731 | 60,737 | 62,837 | 62,356 | 57,061 | |||||||||||||||
|
Other income
|
1,645 | 5,869 | 2,107 | 2,323 | 1,693 | |||||||||||||||
|
Supplies
|
(16,717 | ) | (17,606 | ) | (18,256 | ) | (18,074 | ) | (17,041 | ) | ||||||||||
|
Personnel expenses
|
(6,775 | ) | (8,409 | ) | (11,080 | ) | (8,569 | ) | (7,208 | ) | ||||||||||
|
Other expenses
|
(12,281 | ) | (14,814 | ) | (15,398 | ) | (16,805 | ) | (15,428 | ) | ||||||||||
|
Depreciation and amortization
|
(8,956 | ) | (9,303 | ) | (10,146 | ) | (10,433 | ) | (9,627 | ) | ||||||||||
|
OPERATING INCOME
|
13,647 | 16,474 | 10,064 | 10,798 | 9,450 | |||||||||||||||
|
Share of (loss) profit of associates
|
47 | 76 | (635 | ) | (1,275 | ) | (304 | ) | ||||||||||||
|
Net finance expense
|
(2,767 | ) | (2,537 | ) | (2,782 | ) | (3,062 | ) | (2,696 | ) | ||||||||||
|
Net exchange differences
|
(540 | ) | (112 | ) | (159 | ) | (597 | ) | (170 | ) | ||||||||||
|
Net financial expense
|
(3,307 | ) | (2,649 | ) | (2,941 | ) | (3,659 | ) | (2,866 | ) | ||||||||||
|
PROFIT BEFORE TAX FROM CONTINUING OPERATIONS
|
10,387 | 13,901 | 6,488 | 5,864 | 6,280 | |||||||||||||||
|
Corporate income tax
|
(2,450 | ) | (3,829 | ) | (301 | ) | (1,461 | ) | (1,311 | ) | ||||||||||
|
PROFIT FOR THE YEAR FROM CONTINUING OPERATIONS
|
7,937 | 10,072 | 6,187 | 4,403 | 4,969 | |||||||||||||||
|
Profit after taxes from discontinued operations
|
− | − | − | − | − | |||||||||||||||
|
PROFIT FOR THE YEAR
|
7,937 | 10,072 | 6,187 | 4,403 | 4,969 | |||||||||||||||
|
Non-controlling interests
|
(161 | ) | 95 | (784 | ) | (475 | ) | (376 | ) | |||||||||||
|
PROFIT FOR THE YEAR ATTRIBUTABLE TO EQUITY HOLDERS OF THE PARENT
|
7,776 | 10,167 | 5,403 | 3,928 | 4,593 | |||||||||||||||
|
Weighted average number of shares (thousands)
|
4,626,134 | 4,595,215 | 4,583,974 | 4,495,914 | 4,519,717 | |||||||||||||||
|
Basic and diluted earnings per share from continuing operations attributable to equity holders of the parent (euro)(1)
|
1.68 | 2.21 | 1.18 | 0.87 | 1.01 | |||||||||||||||
|
Basic and diluted earnings per share attributable to equity holders of the parent (euro)(1)
|
1.68 | 2.21 | 1.18 | 0.87 | 1.01 | |||||||||||||||
|
Earnings per ADS (euro)(1)(2)
|
1.68 | 2.21 | 1.18 | 0.87 | 1.01 | |||||||||||||||
|
Weighted average number of ADS (thousands)(2)
|
4,626,134 | 4,595,215 | 4,583,974 | 4,495,914 | 4,519,717 | |||||||||||||||
|
Cash dividends per ordinary share (euro)
|
1.00 | 1.30 | 1.52 | 0.82 | 0.35 | |||||||||||||||
|
Consolidated Statement of Financial Position Data
|
||||||||||||||||||||
|
Cash and cash equivalents
|
9,113 | 4,220 | 4,135 | 9,847 | 9,977 | |||||||||||||||
|
Property, plant and equipment
|
32,004 | 35,802 | 35,469 | 35,021 | 31,040 | |||||||||||||||
|
Total assets
|
108,141 | 129,775 | 129,623 | 129,773 | 118,862 | |||||||||||||||
|
Non-current liabilities
|
56,931 | 64,599 | 69,662 | 70,601 | 62,236 | |||||||||||||||
|
Equity (net)
|
24,274 | 31,684 | 27,383 | 27,661 | 27,482 | |||||||||||||||
|
Capital stock
|
4,564 | 4,564 | 4,564 | 4,551 | 4,551 | |||||||||||||||
|
Consolidated Cash Flow Data
|
||||||||||||||||||||
|
Net cash from operating activities
|
16,148 | 16,672 | 17,483 | 15,213 | 14,344 | |||||||||||||||
|
Net cash used in investing activities
|
(9,300 | ) | (15,861 | ) | (12,497 | ) | (7,877 | ) | (9,900 | ) | ||||||||||
|
Net cash used in financing activities
|
(2,281 | ) | (5,248 | ) | (4,912 | ) | (1,243 | ) | (2,685 | ) | ||||||||||
|
(1)
|
The per share and per ADS computations for all periods presented have been presented using the weighted average number of shares and ADSs, respectively, outstanding for each period, and have been adjusted to reflect the stock dividends which occurred during the periods presented, as if these had occurred at the beginning of the earliest period presented. In accordance with IAS 33 (“Earnings per share”), the weighted average number of ordinary shares and ADSs outstanding for each of the periods covered
has been restated to reflect the issuance of shares pursuant to Telefónica’s scrip dividend in June 2012. As a consequence, basic and diluted earnings per share have also been restated from 2009 to 2011.
|
|
(2)
|
Until January 20, 2011, each ADS represented the right to receive three ordinary shares. Since January 21, 2011, each ADS represents the right to receive one ordinary share. The above figures have been restated accordingly. Figures do not include any charges of the ADS Depositary.
|
Exchange Rate Information
As used in this Annual Report, the term “Noon Buying Rate” refers to the rate of exchange for euro, expressed in U.S. dollars per euro, in the City of New York for cable transfers payable in foreign currencies as certified by the Federal Reserve Bank of New York for customs purposes. The Noon Buying Rate certified by the New York Federal Reserve Bank for the euro on March 14, 2014 was $1.3924= 1.00 euro. The following tables describe, for the periods and dates indicated, information concerning the Noon Buying Rate for the euro. Amounts are expressed in U.S. dollars per 1.00 euro.
|
Year ended December 31,
|
Period end
|
Average (1)
|
High
|
Low
|
||||||||||||
|
2009
|
1.4332 | 1.3955 | 1.5100 | 1.2547 | ||||||||||||
|
2010
|
1.3269 | 1.3218 | 1.4536 | 1.1959 | ||||||||||||
|
2011
|
1.2973 | 1.4002 | 1.4875 | 1.2926 | ||||||||||||
|
2012
|
1.3186 | 1.2909 | 1.3463 | 1.2062 | ||||||||||||
|
2013
|
1.3779 | 1.3303 | 1.3816 | 1.2774 | ||||||||||||
|
2014 (through March 14, 2014)
|
1.3924 | 1.3743 | 1.3927 | 1.3500 | ||||||||||||
Source: Federal Reserve Bank of New York.
|
(1)
|
The average of the Noon Buying Rates for the euro on the last day reported of each month during the relevant period.
|
|
Month ended
|
High
|
Low
|
||||||
|
September 30, 2013
|
1.3537 | 1.3120 | ||||||
|
October 31, 2013
|
1.3810 | 1.3490 | ||||||
|
November 30, 2013
|
1.3606 | 1.3357 | ||||||
|
December 31, 2013
|
1.3816 | 1.3552 | ||||||
|
January 31, 2014
|
1.3682 | 1.3500 | ||||||
|
February 28, 2014
|
1.3806 | 1.3507 | ||||||
|
March 31, 2014 (through March 14, 2014)
|
1.3927 | 1.3731 | ||||||
Source: Federal Reserve Bank of New York.
Monetary policy within the member states of the euro zone is set by the European Central Bank. The European Central Bank has set the objective of containing inflation and will adjust interest rates in line with this policy without taking account of other economic variables such as the rate of unemployment. It has further declared that it will not set a target exchange rate for the euro.
Our ordinary shares are quoted on the Spanish stock exchanges in euro. Currency fluctuations may affect the dollar equivalent of the euro price of our shares listed on the Spanish stock exchanges and, as a result, the market price of our ADSs, which are listed on the New York Stock Exchange. Currency fluctuations may also affect the dollar amounts received by holders of ADSs on conversion by the depositary of any cash dividends paid in euro on the underlying shares.
Our consolidated results are affected by fluctuations between the euro and the currencies in which the revenues and expenses of some of our consolidated subsidiaries are denominated and recorded (principally the Brazilian real, the pound sterling, the bolivar fuerte, the Argentine peso, the Peruvian nuevo sol, the Chilean peso, the Czech koruna (crown), the Colombian peso and the Mexican peso). See Note 3 (b) to our Consolidated Financial Statements for the exchange rates we used in preparing our consolidated financial information.
Not applicable.
Not applicable.
The Telefónica Group’s business is conditioned by a series of intrinsic risk factors that affect exclusively the Group, as well as a series of external factors that are common to businesses of the same sector. The main risks and uncertainties facing the Company which could affect its business, financial position, reputation, corporate image and brand and its results, must be considered jointly with the information in the Consolidated Financial Statements, and are as follows:
Group-related risks
Worsening of the economic and political environment could negatively affect business.
Telefónica’s international presence enables the diversification of its activities across countries and regions, but entails the need of considering various legislations, as well as the political and economic environments of the countries in which it operates. Any adverse developments or even just uncertainties in this regard, or possible exchange-rate or sovereign-risk fluctuations may adversely affect the business, financial position, cash flows and/or the performance of some of the Group’s economic and financial indicators.
With respect to the economic environment, the Telefónica Group’s business is impacted by overall economic conditions in each of the countries in which it operates. Economic conditions may adversely affect the level of demand of existing and prospective customers, as they may no longer deem critical the services offered by the Group. The main macroeconomic factors that could have an adverse impact on consumption and, accordingly, on the level of demand for our services and finally, on the Telefónica
Group’s
results, are: the shortage of credit in an environment of adjustment of banks’ balance sheets; the evolution of the labor market; the worsening of consumer confidence, with an increase in savings rates as an immediate consequence; or the needs for greater fiscal adjustment, which would negatively impact on the household income levels and corporate investments, expenses and revenues.
This economic risk might be significant in some European countries which are on the road to recovery but are rebounding more slowly due to financial imbalances that must continue to be corrected. According to the European Economic and Financial Affairs Council, the European economy is expected to have shrunk by 0.4% in 2013 and will only grow 1.1% in 2014, assuming, therefore, that private consumption growth may be weak in certain cases. In this region, the Telefónica Group generated 47% of the Group’s total revenues in 2013 (including 22.7% in Spain, 11.7% in the UK and 8.6% in Germany).
Also, the impact of the sovereign debt crisis and the rating downgrades in certain Euro Area countries should be taken into account. Any additional deterioration in the sovereign debt markets, doubts about developments in European projects (e.g. implementation of the banking union project, the results of the European elections or progress towards fiscal integration), as well as further credit restrictions by the banking sector could have an adverse effect on Telefónica’s ability to access funding and/or liquidity which could have a significant adverse effect on the Group’s businesses, financial position, results of operations and cash flows. In addition, the Group’s business may be affected by other possible effects from the economic crisis, including a possible insolvency of key customers and suppliers.
In Latin America, the most important challenge is the exchange-rate risk in Venezuela and Argentina (with a sustained accelerated depreciation of the peso against the U.S. dollar), given the negative impact that a higher than expected depreciation in their currencies could have on cash flows from both countries. The economic outlook for the entire region suggests that growth rates will remain stable at around 3%, supported by solid domestic demand fundamentals. The international scenario, despite being not so favorable as in the past periods, will remain to have a relatively benign impact on the region, except for, among others, potential periods of volatility linked to the evolution of the developed financial markets (especially long-term interest rates in the United States affected by the U.S. Federal Reserve’s intervention that are not discounted in the market), a greater than envisaged economic slowdown in Asia (a key region for Latin America), and the slow progress being made with structural reforms projects in the majority of these countries which limits potentially higher growth rates. The most significant internal macroeconomic risk factors in the region would be the very high inflation rates in Venezuela and Argentina that could lead to economic stagnation in these countries, the delicate situation of Venezuela's public finance, and the deterioration in the external accounts of countries such as Argentina, Brazil, Chile and Peru; though with very different funding outlooks for the latter three (favorable) than the first.
In relation to the political environment, the Group’s investments and operations in Latin America could be affected by a series of risks related to economic, political and social factors in these countries, collectively denominated “country risk”. On this point, approximately 15% of our revenues in the telephony business are
generated in countries that do not have investment grade status (in order of importance Venezuela, Argentina, Ecuador, Guatemala, Nicaragua, El Salvador and Costa Rica), and other countries are only one notch away from losing this threshold. Also note that despite clear improvements in Brazil, recent announcements by the ratings agencies considering a possible downgrading of its credit rating could, depending on the extent of the downgrading, result in strong exchange-rate volatility due to an outflow of investments, especially strong in fixed-income.
Among the factors included in the concept of "country risk", we highlight:
|
|
·
|
government regulation or administrative polices may change unexpectedly, including changes that modify the terms and conditions of licenses and concessions and their renewal (or delay their approvals) which could negatively affect the Group’s interests in such countries;
|
|
|
·
|
abrupt exchange-rate fluctuations mainly due to situations of high levels of inflation and "twin deficits" (in public finance and external sector) with the resulting exchange-rate overvaluation. This movement could lead to a strong exchange-rate depreciation in the context of a floating exchange rate regime, to a significant devaluation off the back of abandoning fixed exchange rates regimes, or to the introduction of varying degrees of restrictions on capital movement. For example, in Venezuela, the official U.S. dollar to bolivar fuerte exchange rate is established by the Central Bank of Venezuela and the Minister of Finance, with an alternative market for attracting foreign currency through SICAD's fortnightly auctions. Additionally, the acquisition of foreign currencies by Venezuelan or Argentinian companies (in some cases) to pay foreign debt or dividends is subject to the pre-authorization of the relevant authorities. Also, the Argentinean peso is following a sustained accelerated depreciation against the U.S. dollar;
|
|
|
·
|
governments may expropriate or nationalize assets, or make adverse tax decisions, or increase their participation in the economy and in companies;
|
|
|
·
|
economic-financial downturns, political instability and civil disturbances may negatively affect the Telefónica Group’s operations in such countries; and
|
|
|
·
|
maximum profit margins limits may be imposed in order to limit the prices of goods and services through the analysis of cost structures. Thus, in Venezuela, a maximum profit margin has been introduced that will be set annually by the Superintendence for the defense of socio-economic rights.
|
The
Group’s
financial condition and results of operations may be adversely affected if it does not effectively manage its exposure to foreign currency exchange rates, interest rates or financial investment risks.
At December 31, 2013, 71% of the Group’s net debt (in nominal terms) had its interest rates fixed over a year, while 23% was denominated in a currency other than the euro.
To illustrate the sensitivity of financial expenses to a change in short-term interest rates at December 31, 2013: (i) a 100 basis points increase in interest rates in all currencies in which Telefónica has a financial position at that date would lead to an increase in financial expenses of 118 million euros, (ii) whereas a 100 basis points decrease in interest rates in all currencies except the euro, dollar and the pound sterling (these to zero rates in order to avoid negative rates), would lead to a reduction in financial expenses of 55 million euros. These calculations were made assuming a constant currency and balance position equivalent to the position at that date and bearing in mind the derivative financial instruments arranged.
According to the Group’s calculations, the impact on results and specifically changes in the value of a 10% depreciation of Latin American currencies against the U.S. dollar and a 10% depreciation of the rest of the currencies against the euro would result in exchange losses of 42 million euros, primarily due to the weakening of the bolivar fuerte and, to a lesser extent, the Argentinean peso. These calculations had been made assuming a constant currency position with an impact on profit or loss at December 31, 2013, including derivative instruments in place.
The Telefónica Group uses a variety of strategies to manage this risk, mainly through the use of financial derivatives, which themselves are also exposed to risk, including counterparty risk. Furthermore, the Group’s risk management strategies may not achieve the desired effect, which could adversely affect the Group’s business, financial condition, results of operations and cash flows.
Existing or worsening conditions in the financial markets may limit the
Group’s
ability to finance, and consequently, the ability to carry out its business plan.
The performance, expansion and improvement of the Telefónica Group’s networks, the development and distribution of the Telefónica Group’s services and products, the development and implementation of the Company’s
strategic plan, as well as the development and implementation of new technologies or the renewal of licenses require a substantial amount of financing.
The performance of financial markets in terms of liquidity, cost of credit, access and volatility, continues to be overshadowed by persisting uncertainty regarding certain factors such as the pace of economic recovery, the health of the international banking system and the concerns regarding the burgeoning deficits of some European countries. The worsening international financial market credit conditions caused by some of these factors could make it more difficult and more expensive to refinance existing financial debt or arrange new debt if necessary, and more difficult and costly to raise funds from our shareholders, and may negatively affect the Group’s liquidity. At December 31, 2013, gross financial debt scheduled to mature in 2014 amounted to 9,214 million euros (which includes: (i) the net position of derivative financial instruments, certain current payables and (ii) 582 million euros of notes with an option of early repayment and no contractual obligation to be repaid), and gross financial debt scheduled to mature in 2015 amounted to 6,802 million euros. Despite having covered gross debt maturities of 2014 and 2015 by available cash and lines of credit at December 31, 2013, possible difficulties to maintain the current safety margin, or the risk that this could be significantly and unexpectedly exhausted, could force Telefónica to use resources allocated for other investments or commitments for payment of its financial debt, which could have a negative effect on the Group’s businesses, financial position, results of operations or cash flows.
Although the Group maintains liquidity coverage on 24-month maturities, obtaining financing on the international capital markets could also be restricted, in terms of access and cost, if Telefónica’s credit ratings are revised downwards, either due to lower solvency or operating performance, or as a result of a downgrade in the rating for Spanish sovereign risk by rating agencies. Any of these situations could have a negative impact on our ability to deal with our debt maturities.
Moreover, market conditions could make it harder to renew existing undrawn credit lines, 10% of which, at December 31, 2013, initially mature prior to December 31, 2014.
Risks related to the Group’s industry
The Group operates in a highly regulated industry which requires government concessions for the provision of a large part of its services and the use of spectrum, which is a scarce and costly resource.
The telecommunications sector is subject to laws and regulations in different countries, and additionally, many of the services provided require the granting of a license, concession or official approval, which usually requires certain obligations and investments to be made, such as those relating to spectrum availability. Among the main risks of this nature are the spectrum and licenses/concessions, rates, universal service regulation, fiber networks, privacy, functional separation of businesses and network neutrality.
Thus, as the Group provides most of its services under licenses, authorizations or concessions, it is vulnerable to administrative bodies decisions, such us economic fines for serious breaches in the provision of services and, eventually, revocation or failure to renew these licenses, authorizations or concessions or the granting of new licenses to competitors for the provisions of services in a specific market.
The Telefónica Group pursues its license renewal in the terms referred in their respective contractual conditions, though it cannot guarantee that it will always complete this process successfully or under the most beneficial terms for the Group. In many cases complying with certain obligations is required, including, among others, minimum specified quality standards, service and coverage conditions and capital investment. Failure to comply with these obligations could result in the imposition of fines, revision of the contractual terms, or even the revocation of the license, authorization or concession. Additionally, the Telefónica Group could be affected by regulatory actions carried out by the antitrust authorities. These authorizations could prohibit certain actions, such as new acquisitions or specific practices, create obligations or lead to heavy fines. Any such measures implemented by the competition authorities could results in economic and/or reputational loss for the Group, in addition to a loss of market share and/or in harm to the future growth of certain businesses.
Regulation of spectrum and government concessions:
The “Digital Single Market” packaged of measures is currently being amended by the European Parliament to include important measures affecting,
inter alia
, spectrum regulation. Although these measures are not yet final, they could have significant implications as they include new provisions on secondary markets, criteria to apply at auctions, renewals and terms of licensees, etc.
In 2015/2016, in Germany, it is expected that frequencies in the 900/1800 MHz band licenses, expiring at the end of 2016, will be renewed. The German regulator has adopted a proposal decision envisaging an auction of spectrum in the 900 MHz, 1800 MHz, 700 MHz and 1500 MHz bands. Furthermore, it is proposed, for operators holding 900 MHz GSM band licenses, the reservation of 2X5 MHz in this band. The aforementioned reservation entails a 99% population coverage obligation. Moreover, European and National regulators are reviewing the implications of the merger of Telefónica Germany and E-Plus, and any potential remedies or conditions. Remedies could affect the spectrum finally available. In Spain, it is expected that the previously auctioned frequencies in the 800 MHz band from the digital dividend, will be allocated on January 1, 2015. For its part, in the UK a tax rate increase for the use of the spectrum in the 900 and 1800 MHz band is under discussion, which outcome is uncertain.
Main allocation criteria for the 700 MHz band (Digital Dividend II) will be defined in coming years in Europe. This could involve facing new cash outflow ahead of schedule (the most likely scenario is currently seen as to have this spectrum between 2018 and 2021).
In Latin America, spectrum auctions will take place entailing potential outflows to obtain new licenses or to meet the coverage requirements associated with these licenses. Specifically, the following procedures are in progress or expected to take place in 2014:
|
·
|
Brazil: Auction of the 700 MHz band. Allocation of frequencies in the 700 MHz band for fixed-line and mobile telephone and broadband services has been approved. However, the allocation process requires television channels currently occupying this band to be migrated and ANATEL to complete its analysis regarding spectrum interference between mobile and television services;
|
|
·
|
Chile: Auction of the 700 MHz band;
|
|
·
|
Ecuador: Negotiations underway to obtain additional frequencies in the 1900 MHz band;
|
|
·
|
El Salvador: The auction of one block in the 1900 MHz band and another in the AWS band had been postponed, although this issue might be resolved in the coming months; and
|
|
·
|
Venezuela: Auction in the AWS band (1710-2170 MHz frequencies) and in the 2.5 GHz band, has been suspended.
|
On the other hand, negotiations to renew 850 MHz/1900 MHz licenses in Colombia (where a legal action regarding the reversion of assets at the end of the license terms is in place) and 850/1900 MHz licenses in Panama are under way. In Peru, an application for partial renewal of the concessions for the provision of the fixed-line service for another five years has been made, although assurance has been given that the concession will remain in force until November 2027. Also, a new law has been enacted establishing mobile virtual network operator (MVNOs) and Rural Mobile Infrastructure Operators (RMIOs) in the Peruvian market. In Mexico, it is envisaged, in development of the constitutional reform enacted due to the "Pact for Mexico" political initiative, the creation of a wholesale network publicly owned which will offer wholesale services in the 700 MHz band, the funding and the marketing model of this project have not been determined at present.
On the other hand, Telefónica UK was awarded two 10 MHz blocks of spectrum in the 800 MHz band in 2013 to roll out a national 4G network. In Spain, the following license extensions have been granted: in the 900 MHz band, 4 MHz from July 2025 to December 2030 and 1 MHz from February 2015 to December 2030, likewise, in the 1800 MHz band a 20 MHz license has been extended from 2028 to December 2030. Moreover, in 2013, Telefónica also obtained spectrum licenses in Uruguay (2x5 MHz in the 1900 MHz band), Colombia (30 MHz in the AWS band) and Peru (20+20 MHz in the 1700 MHz band). In 2013 Telefónica Brasil requested the amendment of the Terms of its Authorization for the “L” band in order to relocate the blocks of radiofrequencies. Currently, the “L” band is located in the 3G radiofrequencies (1.9/2.1GHz). The notice of the “L” band provided for such relocation and the request ensured a more efficient use of the spectrum for Telefónica Brasil. CapEx associated with the new spectrum in 2013 amounted to 1,224 million euros.
In 2012, Telefónica Ireland was awarded spectrum in the 800, 900 and 1800 MHz bands. In Brazil, Telefónica was awarded a block of the 2500 MHz “X” band (20+20 MHz), including the 450 MHz band in certain states. In the spectrum auction, Telefónica Brasil had to compensate the former licensees of this bandwidth, used for multichannel multipoint distribution services. The other operators also awarded spectrum shall, in turn, compensate Telefónica Brasil. Part of these compensation requirements is being legally contested. In Venezuela, the concession agreement between Telefónica Venezolana and the Regulator for an additional 20 MHz in the 1900 MHz band was executed. Telefónica Móviles Chile, S.A. was awarded radiofrequencies for 4G technology in the 2.6 GHz band (2x20 MHz), and in Nicaragua Telefónica was granted 36 MHz in the 700 MHz band.
The Company’s failure to obtain sufficient or appropriate spectrum capacity in the jurisdictions discussed above or any others in which it operates or its capacity to assume the related costs, could have an adverse impact its ability to launch and provide new services and on the Company’s ability to maintain the quality of existing services, which may adversely affect the Group’s financial condition, results of operations and cash flows.
Regulation of wholesale and retail charges:
In terms of roaming, the regulated "Eurotariffs" will be reduced in July 2014, as per the Regulation approved in 2012. The structural roaming solutions which could lead to a price decrease in the intra-European roaming services, will also take effect in July 2014. Furthermore, the packet of
“Digital Single Market” measures mentioned above also includes a proposal to eliminate European Union roaming charges in July 2016 as well as international charges.
The decreases in wholesale mobile network termination rates in Europe are also noteworthy. In the UK, wholesale mobile network termination rates will be reduced to 0.845 pence/minute from April 1, 2014 (representing a 0.3% reduction compared to the current rates), while the termination rate in Germany was set at 0.0179 euro/minute as from December 31, 2013 (3.24% lower than the previous termination rates). The European Commission has requested that the German regulator withdraw or amend its latest decision on mobile termination rates. There is a risk that the European Commission will initiate infringement proceedings, against Germany, and rates may be further reduced. In Spain, the schedule for reducing mobile network termination rates has reached the target rate (0.0109 euro/minute) in July 2013, representing close to 61% lower than the wholesale prices in force until that date. As from July 2013, the target price reached will remain in force until new target prices are set. The Spanish regulator has yet to make its decision on this matter. Based on a High Court ruling in Ireland, a mobile termination rate of 2.60 euro cents was provisionally imposed (more favorable than the figure initially proposed by the regulator), applicable from July 1, 2013 (representing 29.35% lower the previous termination rates). The Irish regulator is also developing a more adverse cost model based on long-run incremental cost (LRIC) price calculation, which is expected to be announced in July 2014.
Also, in Latin America, there are moves to review mobile termination rates leading to these being reduced. Thus, for example, developments in Mexico are among the most relevant, where the declaration of dominant operators in the telecommunications market is expected to lead to asymmetric regulatory measures that must be set. The Company's competitive position may benefit to a greater or lesser extent depending on the scope of these measures. Telefónica México has filed an administrative appeal against the 2011 resolutions of the Federal Telecommunications Commission of México (Cofetel) regarding mobile network termination rates (representing a 61% reduction compared to the previous rates). As of today, no ruling has been made on this appeal. Once these appeals have been concluded, the rates applied may be further reduced retroactively. As of today, Cofetel has not approved the termination rates for 2012, 2013, or 2014.
In Brazil, in October 2011, the regulator (ANATEL) approved the fixed-mobile rate adjustment regulation, which provides a progressive reduction of these rates until 2014 through a reduction factor, which will be deducted from the inflation, and implying a reduction of approximately 29% in 2012-2014. However, the Plano Geral de Metas de Competiçao (PGMC) of the end of 2012 extended application of the reduction to 2015 and amended the rates for 2014 and 2015 (75% of the 2013 rate in 2014 and 50% of the 2013 rate in 2015). A draft law has been prepared in Brazil to abolish the basic telephony service monthly fee. “Price protection” practices (reimbursement of price differences of a product to customers if this falls within a relative short period of time) may also have a negative effect, both in economic and image terms.
In Chile, a process to set new fixed-line termination charges is ongoing. A Tariff Decree has been passed for mobile networks covering the 2014-2019 five-year period. The new Tariff Decree entered into effect on January 25, 2014, and implies a reduction of 73.4% with respect to the previous rates. In Ecuador the rate-related risks also concern a reduction in rural and urban telephony charges, a reimbursement of top-up balances, as well as rounding to the nearest minute.
The implementation of the Enabling Act (Ley Habilitante) in Venezuela also confers full powers to the President to implement price control measures, and it is therefore expected that it will not be possible to raise Movistar retail rates in line with high Venezuela inflation. In relation to mobile termination rates with the national operator of reference, these have been reduced 6% compared to the previous rates.
In Peru, the previously applicable rate was reduced by 24.24% in October 2013.
In Colombia, a decision was adopted establishing a gradual reduction for termination mobile rates. Regarding the termination model for time, the reduction for 2014 is 19.8% and 24.6% for 2015. For the capacity model the
reduction will be 10.9% for 2014 and 12.3% for 2015. In relation with fix networks (for extended local networks) the reduction will be 50% for 2014 and 100% for 2015.
Regulation of universal services:
The European Commission on its formal obligation to review the Universal Service Directive will launch a public consultation whose objective will be to modify the scope of their obligations and include, at a European level, far higher broadband speeds than are currently provided. Depending on the terms set forth in the new regulation, implementation at a local level could lead to higher costs for both the universal service provider and the operators forced to finance the Universal Service.
The regulator in Brazil has modified the universal service targets. This represents a risk on the Company's positive balance resulted from the fulfilment of 2003 universal service targets, whose implementation was less costly than the initially established targets, leaving a positive balance for the Company.
The new requirements that cause this positive balance could apply until 2025, and extend beyond on issues such as, for example, rural telephony services and the expansion of the backhaul network. Rural telephony services are another risk in Brazil given the obligations arising from the switched fixed-line telephone services model and the obligations to provide mobile coverage in certain rural areas of the country.
Regulation of fiber networks:
It is expected that in 2014, Spanish National Competition Authority (Comisión Nacional de los Mercados y la Competencia) will study broadband market regulation in Spain. This could increase Telefónica's regulatory obligations in Spain, especially wholesale market obligations concerning access to fiber networks, and its pricing.
Regulations on privacy:
In Europe, a new Data Protection Regulation is in the pipeline before the end of the current European legislative term (spring 2014). This could lead to certain critical provisions laid down in the current draft of the Regulation (presently under debate) being worded in such a way that stops or hinders Telefónica from launching some services, that focus on the processing of personal data.
Regulation of functional separation:
The new principles established in Europe's common regulatory framework, adopted in 2009 and transposed in the national legislation of each Member State in which Telefónica operated during 2011 and 2012 could result in greater regulatory pressure on the local competitive environment. Specifically, this framework supports the possibility of national regulators, in specific cases and under exceptional conditions, forcing operators with significant market power and vertically-integrated operators to separate their wholesale and retail businesses at a functional level. They would therefore be required to offer equal wholesale terms to third-party operators that acquire these products.
Regulation of network neutrality:
In Europe, application of the current regulatory framework means that it is likely that during 2014, the Body of European Regulators for Electronic Communications (BEREC) and national regulators will strengthen their supervision of operators with regard to blocking of access, discrimination of applications or Internet service quality. The European Parliament and the Council are simultaneously debating the draft of the European Digital Market Regulation proposed by the European Commission, in particular concerning network neutrality, network management or differentiation of Internet access service characteristics. All of them are aspects of great importance that have a direct impact on potential business models that can be developed in the future.
Presently we have countries where net neutrality has already been ruled, such us Chile and Colombia. But it is a live issue and with varying degree of development in the rest of the countries. In Germany, the Economy Minister published a draft law on June 20, 2013, to regulate neutrality, especially with regard to blocking and discrimination of content and Internet services. The text is pending approval by parliament in 2014 after the new government was sworn in during December 2013.
In Brazil, the Civil Rights Framework for Internet Governance is being debated by Congress and is expected to be approved in the first quarter of 2014. It includes policies on the Internet such as network neutrality. Activities regarding net neutrality have been, as of today, focused in supervision of the quality of the services: in October 2011, ANATEL approved the regulations of the Service Quality of Multimedia Communication Service (includes fixed internet) and Personal Mobile Service (including mobile internet). The aforementioned regulations, regulates the measurement made from independent entities on quality delivered and perceived by ISPs to customers.
If changes to regulation such as those described above, or otherwise, occur in the various jurisdictions where the Telefónica Group operates, it could have a material adverse effect on our business and results of operations.
Customers' perceptions of services offered by the Company may put it at a disadvantage
compared
to competitors' offerings.
Customers' perceptions of the services and products offered are critical to operating in highly-competitive markets. The ability to predict and respond to the changing needs and demands of customers affects the Company's competitive position relative to other technology sector companies, and its ability to extract the value generated during this process of transformation.
Failure to do so appropriately could have an adverse impact on the Group’s financial condition, results of operations and cash flows.
Company
may
not be able to adequately foresee and respond to technological changes and sector trends.
In a sector characterized by rapid technological change, it is essential to be able to offer the products and services demanded by the market, and consider the impacts of changes in the life cycle of technical assets, finely adjust margins, and select the right investments to make.
The Telefónica Group operates in markets that are highly competitive and subject to constant technological development. Therefore, as a consequence of both characteristics, it is subject to the effects of actions by competitors in these markets and to its ability to anticipate and adapt to constant technological changes taking place in the industry.
To compete effectively in these markets, the Telefónica Group needs to successfully market its products and services and respond to both commercial actions by competitors and other competitive factors affecting these markets, anticipating and adapting promptly to technological changes, changes in consumer preferences and general economic, political and social conditions. Failure to do so appropriately could have an adverse impact on the Group’s financial condition, results of operations and cash flows.
New products and technologies arise constantly, while the development can render obsolete the products and services the Telefónica Group offers and the technology it uses. This means that Telefónica must invest in the development of new products, technology and services so it can continue to compete effectively with current or future competitors, and which may result in the decrease of the Group’s profits and revenue margins. In this respect, margins from traditional voice and data business are shrinking, while new sources of revenues are deriving from mobile internet and connectivity services that are being launched. Research and development costs amounted to 1,046 million euros and 1,071 million euros in 2013 and 2012, respectively, representing 1.8% and 1.7% of the Group’s consolidated revenue, respectively. One technology that telecommunications operators, including Telefónica (in Spain and Latin America), are focused on is the new FTTx-type network, which offers broadband access using optical fiber with superior services, e.g. internet speed of up to 100MB or HD television services. However, substantial investment is required to deploy these networks, which entails fully or partially substituting copper loop access with optic fiber. An increasing demand for the capabilities offered by these new networks to end users exist, however, the high level of the investments requires a continuous analysis of the return on investment.
The explosion of the digital market, and entry of new players in the communications market, such as Mobile Virtual Network Operators (MVNOs), internet companies or device manufacturers, may cause the loss of value of certain assets, and affect its ability to generate income. Therefore, it is necessary to update the
business
model
, encouraging the pursuit of incomes and additional efficiencies to the more traditional. Failure to do so appropriately could have an adverse impact on the Group’s financial condition, results of operations and cash flows.
In addition, the ability of the Telefónica Group’s IT systems (operational and backup) to respond the Company’s operating requirements is a key factor to be taken into account with respect to the commercial development, customer satisfaction and business efficiency.
The
Company
depends on the suppliers.
The existence of critical suppliers in the supply chain, especially in areas such as network infrastructure, information systems or handsets, with a high concentration in a small number of suppliers, poses risks that may affect the operation, and may cause contingencies or damages to the Company’s image in the event that inappropriate practices were produced by a participant in the supply chain.
As of December 31, 2013, the Telefónica Group depends on 8 handset suppliers and 12 network infrastructure suppliers, which together accounted for 80% of orders. These suppliers may, among other things, extend delivery times, raise prices and limit supply due to their own shortages and business requirements.
If these suppliers fail to deliver products and services to the Telefónica Group on a timely basis, it could jeopardize network deployment and expansion plans, which in some cases could adversely affect the Telefónica Group’s ability to satisfy its license terms and requirements or have an adverse impact on the Group’s business, financial condition, results of operations and cash flows.
Unanticipated
network
interruptions can lead to quality loss or the interruption of the service.
Unanticipated network interruptions as a result of system failures, including those due to network, hardware or software or cyber-attacks, which affect the quality of or cause an interruption in the Telefónica Group’s service, could lead to customer dissatisfaction, reduced revenues and traffic, costly repairs, penalties or other measures imposed by regulatory authorities and could harm the Telefónica Group’s image and reputation.
Telefónica attempts to mitigate these risks through a number of measures, including backup systems and protective systems such as firewalls, virus scanners and other physical and logical security. However, these measures are not always effective. Although the Telefónica Group has insurance policies to cover this type of incidents and risks, these policies may not be sufficient to cover all possible monetary losses, although the claims and loss in revenue caused by service interruptions to date have been covered by these policies.
The telecommunications industry may be affected by the possible effects of electromagnetic fields, emitted by
mobile
devices and base stations, may have on human health.
In some countries, there is a concern regarding potential effects of electromagnetic fields, emitted by mobile devices and base stations, on human health. This public concern has caused certain governments and administrations to take measures that have hindered the deployment of the infrastructures necessary to ensure quality of service, and affected the deployment criteria of new networks and digital services such as smart meters development.
There is a consensus between various expert groups and public health agencies, including the World Health Organization (WHO), who claim that at the moment there have not been established risks for exposure to low frequency signals in mobile communications. The scientific community is still investigating this issue especially on mobile devices. Exposure limits for radio frequency suggested in the guidelines of the Protection of Non-Ionizing Radiation Protection Committee (ICNIRP) have been internationally recognized. The mobile industry has adopted these exposure limits and works to request authorities’ worldwide to adopt these standards.
Society's worries about radiofrequency emissions may discourage the use of mobile devices and new digital services, which could cause the public authorities to implement measures restricting where transmitters and cell sites can be located and how they operate, and the use of our mobile telephones, the massive deployment of smart meters and other products using mobile technology. This could lead to the Company being unable to expand or improve its mobile network.
The adoption of new measures by governments or administrations or other regulatory interventions in this respect, and any future assessment on the adverse impact of electromagnetic fields on health, may negatively affect the business, financial conditions, results and cash flows of the Telefónica Group.
Possible regulatory, business, economic or political changes could lead to asset impairment.
The Telefónica Group reviews on an annual basis, or more frequently when the circumstances require it, the value of assets and cash-generating units, to assess whether their carrying values can be supported by the future expected cash flows, including, in some cases synergies allowed for in acquisition cost. Potential changes in the regulatory, business, economic or political environment may result in the need to introduce changes to estimates made and recognize impairment losses in goodwill, intangible assets or fixed assets. Although the recognition of impairments of property, plant and equipment, intangible assets and financial assets results in a non-cash charge on the income statement, it could adversely affect the results of the Telefónica Group’s operations. In this respect, the Telefónica Group has experienced impairment losses on certain of its investments, affecting the results of the year in which they were made. Thus, with respect to the investment in Telco, S.p.A., value adjustments were made in fiscal years 2012 and 2013 for 1,277 million euros and 267 million euros, respectively. Also in 2012, the revision of the value of Telefónica operations in Ireland resulted in a negative impact of 527 million euros.
Our networks carry and store huge volumes of confidential, personal and corporate data, and our Internet access and hosting services may lead to claims for illegal or illicit use of the Internet.
Our networks carry and store huge volumes of confidential, personal and business data, both voice and data traffic. We store increasing quantities and types of customer data in both business and consumer segments. Despite our best efforts to prevent it, Telefónica may be found liable for the loss, transfer, or inappropriate modification of the customer data or general public data stored on its servers or transmitted through its networks which could involve many people and have an impact on the Company's reputation, or lead to legal claims and liabilities that are difficult to measure in advance.
Our Internet access and hosting servers could lead to claims for illegal or unlawful use of the Internet. Telefónica, like other telecommunications providers, may be held liable for the loss, transfer or inappropriate modification of the customer data stored on its servers or carried by its networks.
In most countries in which Telefónica operates, the provision of its internet access and hosting services (including the operation of websites with shelf-generated content) are regulated under a limited liability regime applicable to the content that it makes available to the public as a technical service provider, particularly content protected by copyright or similar laws. However, regulatory changes have been introduced imposing additional obligations on access providers (such as blocking access to a website) as part of the struggle against some illegal or illicit uses of the internet, notably in Europe.
Telefónica and Telefónica Group companies are party to lawsuits, tax claims, antitrust and other legal proceedings.
Telefónica and Telefónica Group companies are party to lawsuits, tax claims and other legal proceedings in the ordinary course of their businesses, the financial outcome of which is unpredictable. An adverse outcome or settlement in these or other proceedings could result in significant costs and may have a material adverse effect on the Group’s business, financial condition, results of operations, reputation and cash flows. In particular, regarding tax and antitrust claims, the Telefónica Group has open judicial procedures in Peru concerning the clearance of previous years' income tax, for which contentious-administrative appeal is currently in process; as well as in Brazil CADE’s (Conselho Administrativo de Defensa Ecônomica) as regards the acquisition of a 50% stake in VIVO and tax open procedures, primarily relating to the CIMS (tax on telecommunication services) (further details on these matters are provided in the Consolidated Financial Statements).
Overview
Telefónica, S.A., is a corporation duly organized and existing under the laws of the Kingdom of Spain, incorporated on April 19, 1924. We are:
|
·
|
a diversified telecommunications group which provides a comprehensive range of services through one of the world’s largest and most modern telecommunications networks;
|
|
·
|
focused on providing telecommunications services; and
|
|
·
|
present principally in Europe and Latin America.
|
The following significant events occurred in 2013:
|
·
|
On February 8, 2013, the bolivar fuerte was devalued from 4.3 bolivares fuertes per U.S. dollar to 6.3 bolivares fuertes per U.S. dollar.
|
The exchange rate of 6.3 bolivares fuertes per U.S. dollar has been used in the conversion of the financial information of Venezuelan subsidiaries for the whole year in 2013. The principal impacts of the devaluation of the bolivar fuerte have been the following:
|
-
|
The decrease of the Telefónica Group’s net assets in Venezuela as a result of the conversion to euros at the devalued exchange rate with a balancing entry in Group equity of approximately 1,000 million euros, based on the net assets as at December 31, 2012.
|
|
-
|
Increase in the net financial debt resulting from the application of the new exchange rate to the net asset value in bolivar fuerte of approximately 873 million euros, as per the balance as at December 31, 2012.
|
|
·
|
On February 20, 2013, Telefónica UK Limited won two 10MHz blocks in the 800 band in the spectrum auction.
Total investment by Telefónica UK in new frequencies amounted to 719 million euros.
|
|
·
|
On March 26, 2013 Telefónica, S.A. placed 90,067,896 treasury shares (representing 1.979% of its share capital) to qualified and professional investors, at 10.80 euros per share. These shares were the total treasury shares position of Telefónica as of that date. The terms and conditions of this sale and the final share price were duly notified by the company to the Spanish National Securities and Exchange Commission (CNMV).
|
|
·
|
On April 24, 2013, the Board of Directors of Telefónica, S.A. approved, upon the prior favorable report from its Nominating, Compensation and Corporate Governance Committee, the appointment as member and Chairman of the Audit and Control Committee of its independent director Mr. Carlos Colomer Casellas, to replace (having completed his legal term), as chairman, the independent director Mr. Gonzalo Hinojosa Fernández de Angulo, who remains as member of the aforementioned Committee.
|
Likewise, the Company’s Board of Directors resolved to appoint Mr. Gonzalo Hinojosa Fernández de Angulo as member and Chairman of the Regulation Committee, to replace, as chairman, the independent director Mr. Pablo Isla Álvarez de Tejera, who remains as member of the aforementioned Committee.
|
·
|
On April 30, 2013, Telefónica, S.A. reached an agreement with Corporación Multi Inversiones ("CMI"), for the sale of 40% of Telefónica´s stake in its subsidiaries in Guatemala, El Salvador, Nicaragua and Panama. The transaction amounted to 500 million U.S. dollars plus a variable amount of up to 72 million U.S. dollars, according to the future evolution of the transferred assets. Following the fulfilment of the conditions to which the closing of the sale was subject, the closing of the transaction was on August 2, 2013.
|
|
·
|
On May 31, 2013, the Telefónica, S.A.’s Annual General Shareholders’ Meeting took place on second call, with the attendance, present or represented, of 54.47% of the share capital. In such meeting, all the resolutions submitted by the Board of Directors for deliberation and vote were approved by majority of votes.
|
|
·
|
On May 31, 2013, the Board of Directors of Telefónica, S.A. upon the prior favorable report of the Nominating, Compensation and Corporate Governance Committee, adopted the resolutions listed below:
|
|
|
-
|
To re-elect directors Mr. José María Abril Pérez and Mr. Javier de Paz Mancho, members of the Executive Commission.
|
|
|
-
|
To appoint director Mr. Ignacio Moreno Martínez as a member of the Audit and Control Committee; Service Quality and Customer Service Committee; and Regulation Committee.
|
|
|
-
|
To appoint director Mr. Julio Linares López as a member of the Strategy Committee.
|
|
|
-
|
To accept the resignation of director Mr. Pablo Isla Álvarez de Tejera as member of the Service Quality and Customer Service Committee and to appoint the Director Mr. Javier de Paz Mancho member of the aforesaid Committee.
|
|
|
-
|
To create an Institutional Affairs Committee, which will be composed by the Directors: Mr. Javier de Paz Mancho, Mr. Alfonso Ferrari Herrero, Mr. Gonzalo Hinojosa Fernández de Angulo, Mr. Antonio Masanell Lavilla, Mr. Fernando de Almansa Moreno-Barreda and Mr. Julio Linares López, who will assume its presidency.
|
|
|
-
|
To eliminate the International Affairs Committee and the Human Resources, Corporate Reputation and Responsibility Committee.
|
Finally, the Board of Directors of the Company, as requested by the Nominating, Compensation and Corporate Governance Committee, resolved to appoint the Director Mr. Alfonso Ferrari Herrero, Coordinating Independent Director (“Lead Director”), in accordance with article 32 of the Corporate Bylaws approved by the Annual General Shareholders’ Meeting held such day.
|
·
|
On June 24, 2013, Telefónica, S.A. reached an agreement with Hutchison Whampoa Group for the total divestment of the Telefónica Group of its shares of Telefónica Ireland, Ltd. The value of the sale totaled 850 million euros, including an initial cash consideration of 780 million euros at closing of the transaction, and an additional deferred payment of 70 million euros based on the completion of agreed financial objectives. The transaction is pending closing and remains subject, among other conditions, to the relevant competition approvals.
|
|
·
|
On July 23, 2013, Telefónica, S.A. and its German listed subsidiary Telefónica Deutschland Holding AG entered into an agreement (amended on August 26, 2013) with the Dutch company Koninklijke KPN NV (“KPN”) under which Telefónica Deutschland committed itself to acquire the shares of the German subsidiary of KPN, E-Plus Mobilfunk GmbH & Co. KG, receiving KPN, as consideration, 24.9% of Telefónica Deutschland and 3,700 million euros.
|
Telefónica, S.A. committed to subsequently acquire from KPN, 4.4% of Telefónica Deutschland for a total amount of 1,300 million euros. Consequently, KPN’s stake in Telefónica Deutschland will be reduced to 20.5% after the acquisition. Telefónica, S.A. also committed to subscribe for the proportional corresponding share in the capital increase of Telefónica Deutschland to finance the cash consideration of the transaction.
The closing of this transaction is subject to certain conditions of which only the relevant authorization from the Competition Authority remains pending.
|
·
|
On September 24, 2013, Telefónica, S.A. and the remaining shareholders of the Italian company Telco, S.p.A. (which holds a capital stake of 22.4% of the voting share capital of Telecom Italia S.p.A.) reached an agreement by virtue of which Telefónica subscribed for and paid out a capital increase in Telco, S.p.A. through the contribution of 324 million euros in cash, receiving in return non-voting shares of Telco, S.p.A. As a result of this capital increase, the interest held by Telefónica in the voting share capital of Telco, S.p.A. remained unchanged (i.e. 46.18%), although its interest in the total share capital of Telco, S.p.A. increased to 66%. The current governance structure remained unaffected, including Telefónica’s obligation to abstain from participating in or
influencing any decisions that could affect the markets in which both Telefónica and Telecom Italia S.p.A. are present. See “Item 4. Information on the Company-Strategic Partnership” and “Item 10 Additional Information-Material Contracts”.
|
|
|
·
|
On September 25, 2013, the Board of Directors of Telefónica, S.A., pursuant to the resolution adopted by the Shareholders' Meeting of Telefónica, S.A., held on May 31, 2013, fixed November 6, 2013, as the date for the dividend distribution charged to unrestricted reserves, of a fixed gross amount of 0.35 euro for each Company share issued, in circulation, and carrying entitlement to this distribution.
|
|
|
·
|
On November 5, 2013, Telefónica, S.A. reached an agreement with PPF Group N.V. to sell 65.9% of Telefónica Czech Republic, a.s. for approximately 306 Czech Crowns per share in cash (approximately 2,467 million euros at the date of the agreement). The transaction was completed on January 28, 2014, after obtaining the relevant regulatory authorization.
|
|
|
·
|
On December 18, 2013, the Board of Directors of Telefónica, S.A. approved, upon the prior favorable report from the Nominating, Compensation and Corporate Governance Committee, the appointment of the Vice-Chairman of the Board of Directors, Mr. Julio Linares López, as a member of the Innovation Board Committee of Telefónica, S.A.
|
Business areas
On February 26, 2014, the Board of Directors of Telefónica approved the implementation of a new organizational structure (see Note 23 to our Consolidated Financial Statements and “item 4. Information on the company – Recent developments.”). As this change has taken place after the reporting period for this Annual Report, we present our results of operations throughout this Annual Report using the reporting structure that was in place during the reporting period.
The reporting structure of this Annual Report is as follows:
As of January 1, 2012, the Telefónica Group’s consolidated results have been reported in accordance with the organizational structure approved in September 2011, based on two regional business units, Telefónica Europe and Telefónica Latin America, and two global business units, Telefónica Digital and Telefónica Global Resources.
As a consequence, the digital world and global resources are included within “Other companies and eliminations”.
Additionally, from the beginning of 2013, the perimeter of consolidation of Telefónica Europe includes Tuenti Technologies, S.L. In 2012 and 2011 it was included in “Other companies and eliminations”. As a result, the results of Telefónica Europe and “Other companies and eliminations” have been revised for the fiscal years 2012 and 2011 to reflect the above mentioned organization. As this is an intragroup change, Telefónica’s consolidated results for 2012 and 2011 are not affected.
The following chart shows the organizational structure of the principal subsidiaries of the Telefónica Group at December 31, 2013, including their jurisdictions of incorporation and our ownership interest. For further detail, see Exhibit 8.1 to this Annual Report.
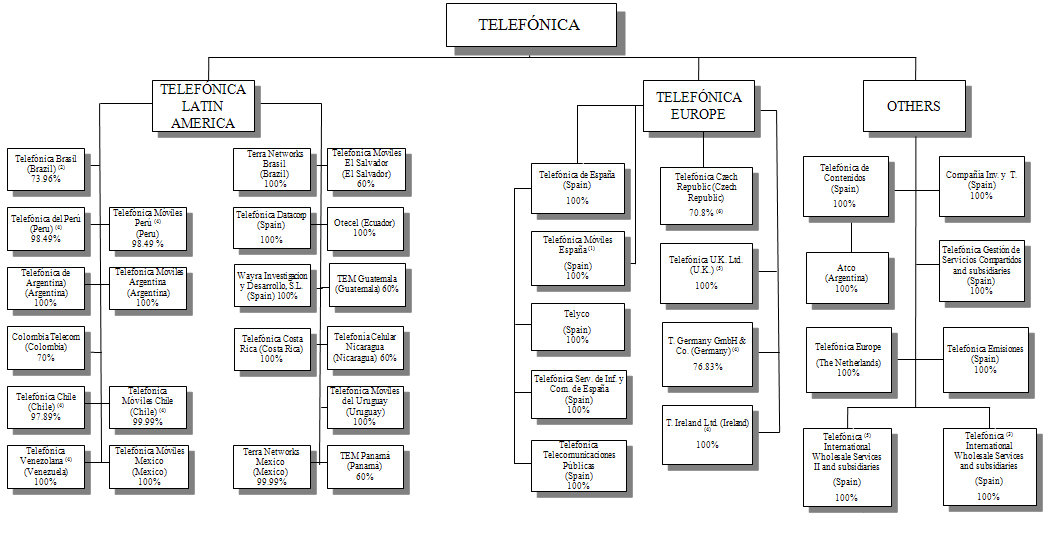
|
(1)
|
Ownership in Telefónica Móviles España, S.A.U. is held directly by Telefónica, S.A..
|
|
(2)
|
91.76% representing voting interest.
|
|
(3)
|
Ownership in Telefónica International Wholesale Services, S.L. is held 92.51% by Telefónica, S.A. and 7.49% by Telefónica Datacorp, S.A.U..
|
|
(4)
|
Companies held indirectly.
|
|
(5)
|
Ownership in TIWS II is held directly by Telefónica, S.A..
|
|
(6)
|
72.1% including treasury shares.
|
Telefónica, S.A., the parent company of the Telefónica Group, also operates as a holding company with the following objectives:
|
|
·
|
coordinate the Group’s activities;
|
|
|
·
|
allocate resources efficiently among the Group;
|
|
|
·
|
provide managerial guidelines for the Group;
|
|
|
·
|
manage the Group’s portfolio of businesses;
|
|
|
·
|
foster cohesion within the Group; and
|
|
|
·
|
foster synergies among the Group’s subsidiaries.
|
Our principal executive offices are located at Distrito Telefónica, Ronda de la Comunicación, s/n, 28050 Madrid, Spain, and our registered offices are located at Gran Vía, 28, 28013 Madrid, Spain. Our telephone number is +34 900 111 004.
Capital Expenditures and Divestitures
Our principal capital expenditures during the three years ended December 31, 2013, consisted of additions to property, plant and equipment and additions to intangible assets, including spectrum. In 2013, 2012 and 2011, we made capital expenditures of 9,395 million euros, 9,458 million euros and 10,224 million euros, respectively.
Year ended December 31, 2013
Capital expenditures in 2013 were in line with 2012. Capital expenditures in 2013 include the cost of spectrum mainly in United Kingdom, Brazil, Peru, Colombia and Spain, amounting to 1,224 million euros. Investment by Telefónica Europe in 2013 amounted to 3,872 million euros, mainly concentrated on continuing the roll-out of fiber optic across the fixed network in Spain, increasing the number of fiber optic-connected homes and customers. Development of the LTE mobile networks in Germany, the United Kingdom and Spain was ramped up to increase deployment and coverage, while investments continued to be made to boost the capacity of third-generation (3G) mobile networks. Telefónica Latin America’s investments in 2013 amounted to 5,252 million euros, mainly in the mobile business and centered primarily on overlay projects and expansion of the coverage, quality and density of 3G networks, as well as the minimum roll-out of LTE (Brazil, Colombia and Chile), the development of platforms to underpin new VASs, and the optimization of infrastructure and systems developments focusing on self-management. In the fixed line business, funds continued to be earmarked for rolling out UBB through speed upgrades in ADSL, fiber (FTTx) and VDSL in Brazil, Argentina and Chile, as well as the installation of fixed-mobile convergence systems (Brazil, Colombia, Chile and Peru).
Year ended December 31, 2012
Capital expenditures in 2012 declined 7.5% compared to 2011. Capital expenditures in 2012 include the cost of spectrum in Brazil, Nicaragua, Chile, Venezuela and Ireland, amounting to 586 million euros. In Telefónica Europe, there were significant investments in further capacity expansion and quality improvement of its mobile 3G networks in Spain, United Kingdom, Germany and Czech Republic, and additionally, into the development of the LTE network in Germany. In the fixed line business, there were significant investments in the fiber optic network roll-out and data services for large corporate customers in Spain, and in improving fixed broadband network in Czech Republic. Investments in Telefónica Latin America were focused on mobile business (mainly with overlay projects, and coverage expansion and enhancing the quality of its 3G networks), as well as on development of new platforms and evolving the existing ones to support new value-added services. In the fixed line business in Telefónica Latin America, significant investments were made in ultrabroadband and speed upgrades in DSL, FTTx and VDSL in Brazil, Argentina and Chile. Also, it is important to highlight the investments done by Telefónica Digital throughout 2012 in TV business including new HD channels introduction and commercial launches of OTT services and content delivery network in line with Telefónica Digital initiatives.
Year ended December 31, 2011
Capital expenditures in 2011 declined 5.7% compared with 2010. Capital expenditures in 2011 include the cost of spectrum in Spain, Brazil, Costa Rica and Colombia, amounting to 1,296 million euros. Investment in Europe continued to
be focused on improving capacity and coverage of the mobile networks in the United Kingdom and Germany as well as the broadband business, primarily in the Czech Republic and Germany. Investment in the mobile business was principally directed toward improving 3G network capability. However, significant investments were also made in the fixed line business in Europe, principally in Spain, including investments in broadband to continue the localized roll-out of fiber optics, TV and data services for large corporate customers, as well as the maintenance of the traditional business. Investments in Latin America were focused mainly on the mobile business, mostly in the expansion of coverage and on 3G and GSM network capacity. In the fixed line business, network and plant upgrades and investment in broadband accounted for the bulk of the investment.
Financial Investments and Divestitures
There were no significant financial investments in 2013. Our principal divestures in 2013 were the sale of 40.00% of our investment, through Telefónica Centroamérica de Inversiones, S.L., in Guatemala, Salvador, Nicaragua and Panama for 500 million U.S. dollars (equivalent to 377 million euros on the date of execution of the sale) with no impact in the results of the Group given our continued control over the company after the transaction; the agreement to sell 65.9% of our investment in Telefónica Czech Republic, a.s. for 306 Czech crown per share (approximately 2,467 million euros at the date of the agreement), resulting in a capital loss of 176 million euros and the agreement to sell our stake in Telefónica Ireland, Ltd for 850 million euros.
There were no significant financial investments in 2012. Our principal divestures in 2012 were the sale of 4.56 percentage points of our stake in China Unicom for approximately 1,142 million euros, resulting in a loss of 97 million euros; the sale of 23.17% of Telefónica Germany Holding, A.G. for 1,499 million euros, with no impact in the results of the Group given we maintain the control over the company after this transaction, and the sale of Atento for 1,051 million euros, including a vendor loan of 110 million euros as well as certain deferred payments for 110 million euros, resulting in a capital gain of 61 million euros.
Our principal financial investment in 2011 was the extension of our strategic partnership agreement with China Unicom, which extension was executed on January 23, 2011. Telefónica acquired through its subsidiary, Telefónica Internacional, S.A.U., a number of China Unicom shares for consideration totaling 501 million dollars in the aggregate (358 million euros at each acquisition date) from third parties during the nine months following the execution of the extension. Following the completion of the transaction, Telefónica holds, through Telefónica Internacional, S.A.U., approximately 9.57% of China Unicom’s voting share capital.
Public Takeover Offers
Not applicable
Recent Developments
The principal events that have occurred since December 31, 2013, are set forth below:
|
|
·
|
On January 24, 2014, exchange agreement No. 25 came into force, which regulates the sale of foreign currency in the Republic of Venezuela for certain sectors and items. This agreement does not amend the exchange rate of 6.3 bolivares fuertes per U.S. dollar, which has applied since exchange agreement No. 14 was approved on February 8, 2013, except for: (i) cash for travelling abroad and remittances to individuals domiciled abroad; (ii) payment of operations inherent to national civil aviation and the international air transportation public service; (iii) operations inherent to insurance activity; (iv) leasing and service agreements, agreements for the import of intangible assets, payments of rental contracts for networks, and payments corresponding to the telecommunications sector; and (v) foreign investments and payments of royalties, use and exploitation of patents, trademarks and franchises, as well as technology import and technical assistance agreements.
|
Requests for the liquidation in U.S. dollars of the aforementioned concepts will be settled, at the foreign exchange rate resulting from the allocations conducted through the Complementary System for Administration of Foreign Currency (SICAD). The SICAD allocation as of January 15, 2014, resulted in an exchange rate of 11.36 bolivares fuertes per U.S. dollar. Nonetheless, the aforesaid agreement stipulates that the liquidation of foreign currency operations requested before the Central Bank of Venezuela before exchange agreement No. 25 came into force, will be settled at the exchange rate established in the February 8, 2013, exchange agreement, i.e. at a rate of 6.3 bolivares fuertes per U.S. dollar.
The change to the currency exchange system introduced in the aforesaid agreement will take effect in the Telefónica Group's consolidated financial statements from the moment it comes into force, on January 24, 2014. It is therefore a subsequent event that does not impact the consolidated financial statements, as the previous exchange rate of 6.3 bolivares fuertes per U.S. dollar was in force as at the year ended December 31, 2013 and up to January 24, 2014, for all foreign currency transactions.
The main aspects to be considered in 2014 are as follows. In order to estimate the impacts in euro, the rate used is the exchange rate resulting from the SICAD allocation as of January 15, 2014, amounting to 11.36 bolivares fuertes per U.S. dollar, which will vary throughout 2014.
|
|
-
|
The decrease of the Telefónica Group's net assets in Venezuela as a result of the conversion to euro at the new exchange rate with a balancing entry in Group equity of approximately 1,800 million euros, based on the net assets as at December 31, 2013.
|
|
|
-
|
As part of the decrease mentioned in the preceding paragraph, the value in euro of the net financial assets denominated in bolivar fuerte will decrease by approximately 1,200 million euros, as per the balance sheet as at December 31, 2013.
|
|
|
-
|
On the other hand, it should be noted that Exchange regulations in Venezuela are in constant evolution. Thus, on February 20, 2014, the Government of Venezuela announced a complementary currency system identified as "SICAD 2", in addition to those already in existence, which will revoke the Act of Illicit Exchange ("Ley de Ilícitos Cambiarios") and will create an alternative market with bands of exchange rates, which will be regulated by the Central Bank of Venezuela. However, as of the date of authorisation for issue of this Annual Report, the system described in such announcement or the corresponding measures have not yet been formalised.
|
|
·
|
On January 28, 2014, after obtaining the relevant regulatory approval, the sale of Telefónica Czech Republic, a.s., was completed. Subsequent to the sale, Telefónica holds a 4.9% stake in Telefónica Czech Republic, a.s.
|
|
|
·
|
On February 26, 2014, the Board of Directors of Telefónica approved the implementation of a new organizational structure focused on clients and that incorporates our digital offering as the main focus for our commercial policies. The structure aims to give greater visibility to local operations, bringing them closer to the corporate decision-making center, simplifying the global structure and strengthening the transverse areas to make the decision-making process more efficient.
|
|
|
|
Within this framework, Telefónica has created the role of the Chief Commercial Digital Officer, who will be responsible for fostering revenue growth. On the cost side, the Company has strengthened the role of the Chief Global Resources Officer. Both Officers will report directly to the Chief Operating Officer (COO), as will the local business CEOs for Spain, Brazil, Germany and the United Kingdom, in addition to the Latin American Unit, which now no longer includes Brazil.
|
|
|
|
The new model integrates the activities carried out to date by Telefónica Digital Limited, Telefónica Europe Plc ("Telefónica Europe") and Telefónica Latin America (Telefónica Latam) into the Global Corporate Center, thus simplifying the organization.
|
|
|
·
|
On February 27, 2014, the Board of Directors of Telefónica has agreed, regarding the 2014 dividend, to determine the amount thereof at 0.75 euros per share, payable in two tranches:
|
|
|
|
- 0.35 euros per share by means of a "scrip dividend" in the fourth quarter of 2014.
|
|
|
|
- 0.40 euros per share in cash in the second quarter of 2015.
|
|
|
|
Regarding the 2013 dividend amounting to 0.75 euros per share, with a first tranche of 0.35 euros per share already paid in cash in November 2013, the Company confirms that the second tranche amounting to 0.40 euros per share will be paid in cash in the second quarter of 2014. The adoption of the corresponding corporate resolutions will be proposed in due course.
|
For information related to our significant financing transactions completed in 2013 and through the date of this Annual Report, see “Item 5. Operating and Financial Review and Prospects – Liquidity and Capital Resources – Anticipated Sources of Liquidity.
The Telefónica Group is one of the world’s leading mobile and fixed communications services providers. Its strategy is to become a leader in the new digital world and transform the possibilities it brings into reality.
Telefónica aim is to reinforce its position as an active player in the digital world capable of seizing all the opportunities afforded by its global scale and its industrial and strategic alliances.
Telefónica has a regional and integrated management model. The current organizational structure was defined in 2011 and its implementation continued through 2013. The different operations of the Telefónica Group, are organized around two geographic regions, Europe and Latin America, together with other Global Units. Telefónica Europe comprised, at year-end, the Spain, United Kingdom, Germany, Czech Republic, Slovakia and Ireland operations. Latin America includes operations in Brazil, Argentina, Peru, Chile Venezuela and Central America (El Salvador, Guatemala, Nicaragua, Panama and Costa Rica), Colombia, Mexico, Ecuador and Uruguay. Telefónica Digital is a global business division of Telefónica. Its mission is to seize the opportunities within the digital world and deliver new growth for Telefónica through research and development, venture capital, global partnerships and digital services.
Telefónica Global Resources is a global unit that aims to support the profitability and sustainability of the business by leveraging economies of scale, as well as by driving Telefónica’s transformation into a fully global company. Its goal is to maximize Telefónica's economies of scale while seeking greater efficiencies for the company, through, among other strategies, simplification, standardization, rationalization and consolidation, global procurement and the management of Telefónica's non-strategic assets.
In 2013, with the aim of strengthening direct contact with both retail and corporate clients in order to accelerate the transformation of the company into a digital telecommunications company, the Global Chief Marketing Officer position was created, which oversees all the related commercial areas, encompassing product, service, channels, handset and pricing policies, as well as advertising and brand strategies. Furthermore, Telefónica Global Solutions is facing the increasing complexity of the enterprise market where the adoption of digital solutions is increasingly common.
Telefónica Europe and Telefónica Latin America’s aim is to generate sustainable growth through available means and the support of the Telefónica Group. In this report two differentiated segments are presented: Telefónica Europe (T. Europe) and Telefónica Latin America (T. Latin America).
The Telefónica's Group strategy aims to:
|
|
·
|
Improve the customer experience in order to continue increasing accesses.
|
|
|
·
|
Lead growth:
|
|
|
-
|
Drive forward the penetration of smart phones in all markets in order to raise the rate of growth of mobile data by monetizing their increasingly widespread use;
|
|
|
-
|
Defend our competitive positioning, and leverage our customer knowledge;
|
|
|
-
|
Develop the growth opportunities that have arisen in an increasingly digital context, such as media, financial services, cloud, security, advertising, M2M, e-Health, etc; and
|
|
|
-
|
Capture the opportunity in the business segment.
|
|
|
·
|
Continue working on the transformation of the Group’s operating model:
|
|
|
-
|
Increase the modernization of networks in markets where we operate through technological advances and the acquisition of spectrum;
|
|
|
-
|
Maximize the benefits of economies of scale to increase efficiency;
|
|
|
-
|
Simplify the operative model; and
|
|
|
-
|
Reduce legacy cost, especially legacy network costs.
|
In addition, Telefónica maintains an industrial alliance with Telecom Italia, S.p.A and a strategic alliance with China Unicom in which the Group holds a 5% stake. Furthermore, in order to unlock the value of Telefónica's scale, the "Partners" program was created in 2011, and now includes five operators (Bouygues, Etisalat, Sunrise,
Megafon and O2 CZ
). The Partners Program is an initiative that makes available to selected operators and under commercial terms a host of services that allows partners to leverage on Telefónica’s scale and to cooperate on key business topics (roaming, services to multinationals, procurement, devices, etc.).
Elsewhere, in 2013 Telefónica Europe’s portfolio was restructured through a sale agreement of operations in the Czech Republic, which was closed in January 2014 after obtaining regulatory approval, and in Ireland, pending regulatory approval, and with the announcement of the acquisition of E-Plus by Telefónica Germany to form the leading operator in the European market.
Non-controlling or minority interests can be divided into two groups. Firstly, subsidiaries listed in a regulated market, such as Telefónica Brasil or Telefónica Deutschland, where minority shareholdings are widely dispersed and for which Telefónica protects minority interests by complying with the regulations of the related market. Secondly, subsidiaries with a main minority shareholder, with which agreements are entered into in order to guarantee the protection of its rights, and in certain cases (such as Colombia Telecomunicaciones) where there are also specific commitments resulting from corporate transactions (see Note 21.b).
The Company has a governance system, which applies to Telefónica’s entire structure. Pursuant to the Company’s commitment to its shareholders, the Board of Directors, supported by its Committees, manages the Company’s business in accordance with the corporate governance rules laid down primarily in the Corporate By-laws, Regulation of the General Shareholders' Meeting, and Regulation of the Board of Directors.
Telefónica’s Board of Directors consists of 18 directors and is responsible for overseeing and controlling the Company’s activity. It has sole powers regarding general strategy and policies on corporate governance, corporate social responsibility, remuneration of the Board and senior management, shareholder remuneration, and strategic investments.
In order to strengthen the corporate governance of the Company, the board of directors of Telefónica, S.A. has eight committees (including the Executive Commission) which are charged with examining and overseeing areas of particular relevance. Pursuant to its regulation, the Board also confers responsibility for day-to-day management of the businesses to Telefónica’s executive bodies (primarily through the Executive Committee) and management team.
2013 highlights
Telefónica managed a total of almost 323 million accesses at the end of 2013, up 2.3% year-on-
year, driven by contract mobile customers, in particular in the mobile broadband segment, and pay TV accesses. Telefónica Latin America (69% of the total) performed especially well, posting an increase in accesses of 4.2% year-on-year. It is important to note that the variance in accesses is impacted by the sale of the fixed business's residential assets in the UK and the disconnection of some inactive accesses (Czech Republic).
Revenues
totaled 57,061 million euros in 2013, and showed a year-on-year decline of 8.5%, impacted by exchange rate differences and the effect of
hyperinflation in Venezuela, which subtracted 7.5 percentage points from growth. Additionally, the year-on-year variance was also affected by the changes in the scope of consolidation mainly due to the sale of Atento (1.7 p.p.). Excluding these impacts, revenue in 2013 rose by 0.7% year-on-year.
The main growth drivers of Telefónica Group revenues are Latin America and mobile data revenue, partially offsetting the pressure on revenue in Europe
.
The structure of revenues reflects the Company's strong diversification and, despite the abovementioned exchange rate impact, T. Latin America accounted for 51% of total revenues in 2013 (+2.2 percentage points compared with 2012), while revenues from European operations as a percentage of Telefónica Group revenues fell by 1.1 percentage points year-on-year (47% of the total). Telefónica Spain's contribution to consolidated revenues decreased by 1.3 percentage points to less than 23% of the total.
OIBDA
reached 19,077 million euros, a decline of 10.1% in reported terms, impacted by exchange rate differences and the effect of hyperinflation in Venezuela, which reduced growth by 7.5 percentage points. It was also affected by the value adjustment or net loss on the sale of Telefónica Ireland and Telefónica Czech Republic, the sale of non-strategic towers in Spain, changes in the scope of consolidation (principally Atento, which is not consolidated since December 2012), and certain other impacts like
contractual changes in the commercial model for selling handsets in Chile
. Net of these impacts, OIBDA would have been flat with respect to the prior year. The
OIBDA margin
closed at 33.4% for 2013, down 0.6 percentage points year-on-year in reported terms.
The below table shows the evolution of accesses over the past three years:
|
Thousands of accesses
|
2011
|
2012
|
2013
|
%Var 11/12
|
%Var 12/13
|
|||||
|
Fixed telephony accesses (1)(2)
|
40,119.2
|
40,002.6
|
39,338.5
|
(0.3)%
|
(1.7)%
|
|||||
|
Internet and data accesses
|
19,134.2
|
19,402.6
|
19,102.0
|
1.4%
|
(1.5)%
|
|||||
|
Narrowband
|
909.2
|
653.2
|
510.8
|
(28.2)%
|
(21.8)%
|
|||||
|
Broadband (3)(4)
|
18,066.3
|
18,596.2
|
18,447.8
|
2.9%
|
(0.8)%
|
|||||
|
Other (5)
|
158.7
|
153.1
|
143.4
|
(3.5)%
|
(6.3)%
|
|||||
|
Mobile Accesses
|
238,748.6
|
247,346.9
|
254,717.2
|
3.6%
|
3.0%
|
|||||
|
Prepay
|
162,246.9
|
165,821.9
|
165,557.0
|
2.2%
|
(0.2)%
|
|||||
|
Contract (6)
|
76,501.7
|
81,525.0
|
89,160.3
|
6.6%
|
9.4%
|
|||||
|
Pay TV
|
3,309.9
|
3,336.2
|
3,602.2
|
0.8%
|
8.0%
|
|||||
|
Unbundled loops
|
2,928.7
|
3,308.8
|
3,833.4
|
13.0%
|
15.9%
|
|||||
|
Share ULL
|
205.0
|
183.5
|
130.6
|
(10.5)%
|
(28.9)%
|
|||||
|
Full ULL
|
2,723.7
|
3,125.3
|
3,702.9
|
14.7%
|
18.5%
|
|||||
|
Wholesale ADSL
|
849.3
|
845.4
|
866.9
|
(0.5)%
|
2.5%
|
|||||
|
Other
|
1,518.0
|
1,577.1
|
1,658.2
|
3.9%
|
5.1%
|
|||||
|
Final Client Accesses
|
301,311.8
|
310,088.3
|
316,759.9
|
2.9%
|
2.2%
|
|||||
|
Wholesale Accesses
|
5,296.0
|
5,731.3
|
6,358.5
|
8.2%
|
10.9%
|
|||||
|
Total Accesses
|
306,607.8
|
315,819.6
|
323,118.4
|
3.0%
|
2.3%
|
|||||
Note:
- Telefónica Spain mobile accesses include since 2013 the accesses of Tuenti and in 2012 they have been restated with the
same criteria.
|
(1)
|
PSTN (including Public Use Telephony) x1; ISDN Basic access x1; ISDN Primary access; 2/6 Access x30. Company´s accesses for internal use and total fixed wireless included. Includes VoIP and Naked ADSL.
|
|
(2)
|
In the second quarter of 2013, 209 thousand accesses were disconnected due to the disposal of the assets of the fixed business in UK.
|
|
(3)
|
ADSL, satellite, optical fiber, cable modem and broadband circuits.
|
|
(4)
|
In the second quarter of 2013, 511 thousand accesses were disconnected due to the disposal of the assets of the fixed business in UK.
|
|
(5)
|
Retail circuits other than broadband.
|
|
(6)
|
The first quarter of 2013 includes the disconnection of 114 thousand inactive accesses in Czech Republic.
|
The chart below shows the evolution of accesses by region over the past three years:
Accesses by region (millions)
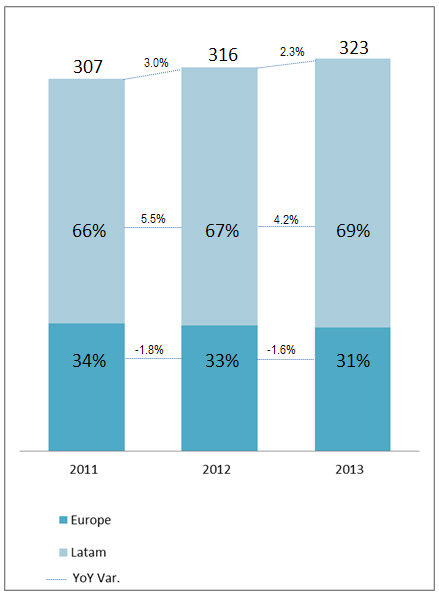
The Group
’
s
strategy
is based on capturing growth in our markets and especially on attracting high-value-added customers.
In the mobile segment
, contract accesses rose by 9.4% to 89.2 million and now account for 35% of the total mobile
customer
base (+2 percentage points year-on-year), underlining the focus on the high-value segment.
The Company's
mobile broadband accesses
stood at 72.8 million in December 2013, maintaining solid growth of 38%
year
-on-year, and representing 29% of mobile accesses (+7 percentage points year-on-year). Underpinning this growth was the strong performance of smartphones, which achieved a penetration of 27% in terms of mobile internet tariffs over the customer base (+8 percentage points year-on-year), with net additions of 20.7 million (+35% year-on-year).
Telefónica’s customer base includes the consumer and business segments, and therefore is not affected by customer concentration risk.
The below table shows our consolidated results of operations for the past three years:
|
Year ended December 31
|
Percent Change
|
|||||||||||||||||||
|
Results of operations
|
2013
|
2012
|
2011
|
2013 vs 2012
|
2012 vs 2011
|
|||||||||||||||
|
Millions of euros
|
Total
|
% of revenues
|
Total
|
% of revenues
|
Total
|
% of revenues
|
Total
|
%
|
Total
|
%
|
||||||||||
|
Revenues
|
57,061
|
100.0%
|
62,356
|
100.0%
|
62,837
|
100.0%
|
(5,295)
|
(8.5)%
|
(481)
|
(0.8)%
|
||||||||||
|
Other income
|
1,693
|
3.0%
|
2,323
|
3.7%
|
2,107
|
3.4%
|
(630)
|
(27.1)%
|
216
|
10.3%
|
||||||||||
|
Supplies
|
(17,041)
|
(29.9)%
|
(18,074)
|
(29.0)%
|
(18,256)
|
(29.1)%
|
1,033
|
(5.7)%
|
182
|
(1.0)%
|
||||||||||
|
Personnel expenses
|
(7,208)
|
(12.6)%
|
(8,569)
|
(13.7)%
|
(11,080)
|
(17.6)%
|
1,361
|
(15.9)%
|
2,511
|
(22.7)%
|
||||||||||
|
Other expenses
|
(15,428)
|
(27.0)%
|
(16,805)
|
(27.0)%
|
(15,398)
|
(24.5)%
|
1,377
|
(8.2)%
|
(1,407)
|
9.1%
|
||||||||||
|
Operating income before depreciation and amortization (OIBDA)
|
19,077
|
33.4%
|
21,231
|
34.0%
|
20,210
|
32.2%
|
(2,154)
|
(10.1)%
|
1,021
|
5.1%
|
||||||||||
|
Depreciation and amortization
|
(9,627)
|
(16.9)%
|
(10,433)
|
(16.7)%
|
(10,146)
|
(16.1)%
|
806
|
(7.7)%
|
(287)
|
2.8%
|
||||||||||
|
Operating income
|
9,450
|
16.6%
|
10,798
|
17.3%
|
10,064
|
16.0%
|
(1,348)
|
(12.5)%
|
734
|
7.3%
|
||||||||||
|
Share of profit (loss) of associates
|
(304)
|
(0.5)%
|
(1,275)
|
(2.0)%
|
(635)
|
(1.0)%
|
971
|
(76.2)%
|
(640)
|
n.m.
|
||||||||||
|
Net financial expense
|
(2,866)
|
(5.0)%
|
(3,659)
|
(5.9)%
|
(2,941)
|
(4.7)%
|
793
|
(21.7)%
|
(718)
|
24.4%
|
||||||||||
|
Corporate income tax
|
(1,311)
|
(2.3)%
|
(1,461)
|
(2.3)%
|
(301)
|
(0.5)%
|
150
|
(10.3)%
|
(1,160)
|
n.m.
|
||||||||||
|
Profit for the year
|
4,969
|
8.7%
|
4,403
|
7.1%
|
6,187
|
9.8%
|
566
|
12.9%
|
(1,784)
|
(28.8)%
|
||||||||||
|
Non-controlling interests
|
(376)
|
(0.7)%
|
(475)
|
(0.8)%
|
(784)
|
(1.2)%
|
99
|
(20.8)%
|
309
|
(39.4)%
|
||||||||||
|
Profit for the year attributable to equity holders of the parent
|
4,593
|
8.0%
|
3,928
|
6.3%
|
5,403
|
8.6%
|
665
|
16.9%
|
(1,475)
|
(27.3)%
|
||||||||||
n.m.: non meaningful
Year ended December 31, 2013 compared with year ended December 31, 2012
The main metrics in profit and loss statement were negatively impacted in 2013 by exchange rate fluctuations, mainly due to the devaluation of the bolivar fuerte and the depreciations of the Brazilian real and the Argentine peso against the euro. Thus, exchange rates reduced year-on-year revenue and OIBDA growth in 2013 by 7.5 percentage points.
Note that the Telefónica Group deconsolidated the results from the Atento Group as of the end of November 2012 (following the disposal of the company during the fourth quarter of 2012), therefore affecting year-on-year comparisons of Telefónica’s reported financial results.
Revenues
in 2013 totaled 57,061 million euros, decreasing 8.5% in reported terms, impacted by the exchange rate differences and the effect of hyperinflation in Venezuela which reduced year-on-year growth by 7.5 percentage points. Additionally, revenues were affected by changes in the consolidation perimeter especially the deconsolidation of the Atento group (-1.7 p.p
.). Excluding these impacts, revenue in 2013 rose by 0.7% year-on-year.
The Telefónica Group’s main revenue growth drivers were Telefónica Latin America and mobile data revenue, partially offsetting the pressure on revenue in Europe.
The structure of revenues reflects the Company’s diversification and despite the above mentioned exchange rate impact, Telefónica Latin America accounted for 51% of total revenues in 2013 (+2.2 percentage points compared with 2012), while revenues from European operations as a percentage of Telefónica Group revenues fell by 1.1 percentage points year-on-year (47% of the total). Telefónica Spain’s contribution to consolidated revenues decreased by 1.3 percentage points to less than 23% of the total.
Mobile data revenues decreased 0.7% in reported terms. Excluding the impact of exchange rate differences and the effect of the hyperinflation in Venezuela, mobile data revenues would have increased 9.3% being the main growth driver in 2013. They now account for 37% of mobile service revenues, +3 percentage points compared with 2012. Especially noteworthy is the growth in non-SMS data revenues (+11.2% in reported terms and +22.2% in the year excluding the impact of exchange rate differences and the effect of hyperinflation in Venezuela), which accounted for 64% of total data revenues in the year in reported terms (+7 percentage points year-on-year).
Other income:
mainly includes own work capitalized in our fixed assets, the profit from the sale of other assets, and the disposal of non-strategic towers in Latin America and Spain. The lower level of sales of non-strategic towers compared to 2012 is the main driver for its decrease.
Other income in 2013 consisted mainly of the sale of non-strategic towers in Latin America and Spain (113 million euros in other income and 111 million euros in OIBDA), the capital gain from the disposal of the assets of the fixed business in the United Kingdom (83 million euros), the capital gain from the sale of assets in Germany (76 million euros) and the capital gain from the sale of the stake in Hispasat (21 million euros).
In 2012 this item is mainly explained by the sale of non-strategic towers in Latin America and Spain (659 million euros in other income and 643 million euros in OIBDA), the gain from the sale of applications (39 million euros), and the capital gains from the sale of the Atento group (61 million euros), of Rumbo (27 million euros) and the partial sale of Hispasat (26 million euros).
Total consolidated
expenses
, which include supplies, personnel expenses and other expenses (primarily external services and taxes) amounted to 39,678 million euros in 2013. This represents an 8.7% decrease year-on-year in reported terms, which was primarily due to:
|
|
·
|
exchange rate differences and the effect of hyperinflation in Venezuela (-7.3 p.p.);
|
|
|
·
|
changes in the consolidation perimeter caused by the disposal of Atento and Rumbo (-1.9 p.p.);
|
|
|
·
|
value adjustments or impairment and loss on sale of companies in 2013 and 2012:
|
|
|
-
|
the impact of losses on the sale of companies in 2013, totaled an amount of 192 million euros, primarily from the sale agreements of Telefónica Ireland and Telefónica Czech Republic (+0.4 p.p.);
|
|
|
-
|
the impact of value adjustments or impairment and loss on sale of companies in 2012, which totaled an amount of 624 million euros, primarily from the sale of part of our stake in China Unicom and a value adjustment of Telefónica Ireland (-1.4 p.p.); and
|
|
|
·
|
a contractual change in the commercial model for selling handsets in Chile as a result of which we began from September 2012, to record all of the costs of handsets sold immediately rather than capitalizing such costs and depreciating them over the life of the contract (+0.4 p.p.).
|
Excluding the aforementioned items, total expenses grew 1.2% in 2013 compared with 2012, mainly as a result of the greater commercial activity in Telefónica Latin America, focused on capturing high-value customers.
|
|
·
|
Supplies
stood at 17,041 million euros in 2013, falling 5.7% with respect to 2012, impacted to a large degree by exchange rate differences and the effect of hyperinflation in Venezuela, which reduced this item by 7.3 percentage points. Additionally, the year-on-year change is affected by changes in the consolidation perimeter (-1.4 p.p.) and by
the contractual change in the commercial model for selling handsets in Chile discussed above (+0.9 p.p.). E
xcluding both effects, expenses grew 2%, as a result of the greater commercial activity in Telefónica Latin America, both in the mobile segment, due to an increase in the weighting of smartphone sales, and in the fixed business, mainly pay TV, which offset the decline in equipment costs in Europe and the lower termination costs at the group level.
|
|
|
·
|
Personnel costs
totaled 7,208 million euros and fell by 15.9% with respect to 2012, mainly impacted by the exchange rate differences and the effect of hyperinflation in Venezuela (-6.2 p.p.) and changes in the consolidation perimeter (-13.6 p.p.). Excluding both effects personnel expenses increased by 4% explained by the negative impact of inflation in certain Latin American countries, despite the higher reduction reported at Telefónica Europe due to savings from workforce restructuring programs, mainly in Spain, the Czech Republic and the UK. This item also reflects non-recurrent restructuring expenses amounting to 156 million euros in 2013 versus 67 million euros in 2012.
|
The average headcount in 2013 was 129,893 employees, 3.9% lower than the average in 2012 excluding the impact of the deconsolidation of Atento.
|
|
·
|
Other expenses
amounted to 15,428 million euros, falling 8.2%, mainly affected by the impact of exchange rate differences and the effect of hyperinflation in Venezuela (-8 p.p.). In addition, it was also affected by
changes in the consolidation perimeter (+3.5 p.p.), by the above mentioned value adjustment in companies in 2012 and 2013 (-2.6 p.p.) and expenses associated to sale of non-strategic towers (-0.1 p.p.). Excluding these effects this item fell 1.1%, explained by the lower costs in Telefónica Europe, mainly in commercial expenses, systems and networks, due to the efficiency measures carried out especially in Spain, which involved simplification of processes, distribution channels and call centers redefinition, internalization of activities, savings from the restructuring plan and temporary cancelation of the corporate contribution to pension plans.
|
OIBDA
reached 19,077 million euros, showing a decline of 10.1%, impacted by:
|
|
·
|
exchange rate differences and the effect of hyperinflation in Venezuela (-7.5 p.p.);
|
|
|
·
|
the lower amount of non-strategic towers sold in 2013 compared to 2012 (-2.5 p.p.);
|
|
|
·
|
changes in the consolidation perimeter mainly caused by the disposal of Atento (-1.0 p.p.);
|
|
|
·
|
value adjustments or impairment and loss on sale of companies in 2013 and 2012:
|
|
−
|
the impact of the sale of companies mainly the sale agreements of Telefónica Ireland and Telefónica Czech Republic in 2013 (-1.3 p.p.);
|
|
−
|
the impact of value adjustments or impairment and loss on sale of companies in 2012 totaled 624 million euros, primarily from the sale of part of our stake in China Unicom and a value adjustment of Telefónica Ireland (+2.9 p.p.); and
|
|
|
·
|
the contractual change in the commercial model for selling handsets in Chile (-0.8 p.p.).
|
Excluding the aforementioned items, OIBDA for 2013 is stable versus the prior year.
OIBDA margin
was 33.4% in 2013, down 0.6 percentage points year-on-year in reported terms.
By region, Telefónica Europe contributed the most to consolidated OIBDA, accounting for 52.0% (+3.8 percentage
points
versus December 2012). Telefónica Latin America represented 49% as margins in Europe increased through the year.
Depreciation and amortization
in 2013 (9,627 million euros) registered a year-on-year drop of 7.7%, mainly due to the
exchange
rate effects and the sale of the Atento Group, Telefónica Ireland, and Telefónica Czech Republic. The depreciation and amortization charges arising from purchase price allocation processes amounted to 856 million euros during 2013 (-11.1% year-on-year).
Operating income
in 2013 totaled 9,450 million euros, decreasing 12.5% year-on-year, highly impacted by exchange rate differences and the effect of hyperinflation in Venezuela (-9.6 p.p.). Additionally the year-on-year change is affected by the lower amount of non-strategic towers sold in 2013 as compared to 2012 (-4.9 p.p.), the value adjustment of companies in 2013 and 2012 (+4.9 p.p.), sales of companies (-0.1 p.p.), changes in the consolidation perimeter (-1.5 p.p.) and by the contractual change in the commercial model for selling handsets in Chile in 2012 (-0.9 p.p.). Excluding these impacts operating income would have fallen 0.5% year-on-year.
Share of profit (loss) of investments accounted for by the equity method
was a loss of 304 million euros in 2013 compared with a loss of 1,275 million euros in 2012 and was affected by
adjustments to the value of the stake of Telco, S.p.A. in Telecom Italia, S.p.A and the contribution to results in the year, resulting in a negative impact on “Share of loss of investments accounted for by the equity method” of 267 million euros and 1,277 million euros, respectively.
Net financial expense
amounted to 2,866 million euros in 2013, 21.7% lower than in 2012, of which 111 million euros were due to net negative foreign exchange differences. Excluding this effect, net financial expenses fell 11.8%
year
-on-year, mainly due to an 11.4% reduction in the average debt. The effective cost of debt over the last twelve months, excluding exchange rate differences was 5.34%, 3 basis points below December 2012, with savings from management improvements over the gross cost of debt in euros offsetting the impact on the effective cost from the fact that most of the reduction has been in euros (with below average costs).
Corporate income tax
in 2013 stood at 1,311 million euros, on a pre-tax income of 6,280 million euros, implying an effective tax rate of 20.9%, 4.0 percentage points lower year-on-year. This is mainly due to the recognition in
2012
of the tax assessments in Spain.
Profit attributable to non-controlling interests
reduced 2013 net profit by 376 million euros and was down 20.7% year-on-
year
, mainly as a result of the lower profit attributed to minority interests in Brazil, affected by the exchange rate.
As a result of the performance of the above items,
profit for the period
in 2013 was 4,593 million euros (16.9% higher year-on-year).
Year ended December 31, 2012 compared with year ended December 31, 2011
The year 2012 was a key year in the transformation of Telefónica. Throughout the year, a number of initiatives were undertaken aimed at helping the Company begin growing again. Telefónica Latin America surpassed Telefónica Europe in revenues for the first time, continuing to be one of the group’s two main levers of growth, along with mobile data revenues. In Telefónica Europe, there has been a recovery in sales activity in certain markets owing to the success of tariffs that have been launched, especially "Movistar Fusión" in Spain, which reflect an improvement of its competitive position across different markets, even though revenues of Telefónica Europe fell 6.5% with respect to 2011.
In view of the sale of the Atento Group in the fourth quarter of 2012, the results of that business area were deconsolidated from the Telefónica Group as of the end of November 2012. This had an impact on the year-on-year comparison of Telefónica's economic results in reporting terms.
OIBDA
was also impacted by the 527 million euros write-down the Telefónica Group made against its stake in Telefónica Ireland.
Revenues
for 2012 stood at 62,356 million euros, which represented a decrease of 0.8% on the 2011 figure. This decrease was due to less favorable conditions in some markets, and the prevailing economic situation, in which competition is steeper and regulatory changes have had adverse impacts. The exchange rate differences and the effect of hyperinflation in Venezuela contributed 0.1 p.p. to change in revenues; when stripping out this impact, the fall was 0.9% in 2012.
The Company's strong diversification continues to be a key differential for the Group in the current market situation, as reflected by the revenues structure. In this regard, revenues showed solid growth in Telefónica Latin America (up 5.5% year-on-year) and accounted for 49% of consolidated revenues (up 2.9 p.p. compared to 2011), outperforming those of Telefónica Europe (48% of the Group’s total and down 6.5% year-on-year). Telefónica Spain's contribution to consolidated revenues decreased to 24%.
The decline in revenue compared to the prior year was caused by the lower average revenue per access for the Group, mainly due to lower average revenue per mobile access in Spain and the UK, and the overall fall in average revenue per fixed access in the Group, which undermined the growth in accesses. Revenues were strongly impacted by cuts to interconnection rates, which had a drag of approximately 1.1 p.p. on overall revenue growth.
In terms of services, mobile data revenue continued to be the largest growth driver in 2012 (up 12.8% year-on-year), accounting for over 34% of mobile service revenues in the period (31% in 2011). Non-SMS data revenue climbed 24.1% year-on-year, raising its share of total data revenue by 5 p.p. to 57%.
Other income
is primarily comprised of the gains on disposals of assets, which were 782 million euros in 2012 (down 5.0% year-on-year). In 2012, other income primarily reflects: i) sales of non-strategic towers, with an impact of 643 million euros on Other income (and OIBDA), primarily in Brazil, Mexico, Chile, Spain and Peru; ii) the sale of software applications (gains of 39 million euros; 18 million euros recognized in Telefónica Spain); and iii) the fourth-quarter sales of the Atento Group (gains of 61 million euros), Rumbo (gains of 27 million euros) and Hispasat (partial sale, gains of 26 million euros). In 2011, this caption mainly reflected: i) the positive impact derived from the partial reduction of the Group’s economic exposure in Portugal Telecom (184 million euros); and ii) the sale of non-strategic towers (541 million euros).
Total expenses
, which include supplies, personnel expenses and other expenses (mainly external services and taxes other than corporate income tax) stood at 43,448 million euros, down 2.9% on the 2011 figure. These expenses were affected by exchange rate differences and hyperinflation adjustments (0.3 p.p.); when stripping out this impact, expenses were down 3.2%. The year-on-year variance reported is also affected by the provision for restructuring expenses in Spain, made in the third quarter of 2011 (2,671 million euros). The year-on-year reduction in expenses is primarily explained by the absence of similar restructuring charges in 2012 and lower commercial expenditure, especially in Spain, as a result of a new commercial model in place from the end of 2011.
|
|
·
|
Supply costs
amounted to 18,074 million in 2012, down 1.0% on 2011, reflecting the lower mobile interconnection costs and lower handset consumption in Spain resulting from the new policy doing away with subsidies and the lower volume of handset upgrades.
|
|
|
·
|
Personnel expenses
were 8,569 million euros, down 22.7% on 2011. The year-on-year variance was affected by the provision for personnel restructuring in Spain, mentioned above. When stripping out the impact of this provision, which amounted to 2,671 million euros, personnel expenses were 1.9% higher than in 2011, reflecting the adjustments for inflation in certain Latin American countries.
|
The average headcount was 272,598 employees, 13,547 less than the 2011 average. The decrease mainly reflects the sale of Atento in the fourth quarter of 2012. When stripping out the Atento business, Telefónica's average headcount was 131,468 employees, 2,480 less than in 2011.
|
·
|
Other expenses
rose 9.1% year-on-year to 16,805 million euros. This increase was primarily driven by the increase in external services caused by higher customer service costs, and network and systems costs as well as the 527 million euros write-down of the Telefónica Group made against its stake in Telefónica Ireland and by the capital loss (97 million euros) generated on the sale of China Unicom shares.
|
OIBDA
stood at 21,231
million
euros, up 5.1%
from
2011. When stripping out the negative impact of exchange rate differences and the effect of hyperinflation in Venezuela (0.3 p.p.), OIBDA grew by 5.4%.
The
OIBDA margin
for
2012
was
34.0%, as a result of a year-on-year erosion of
revenues
that
was
not offset by cost savings.
In terms of geographic
segments
, Telefónica Latin America had the largest contribution to consolidated OIBDA (52.3%, down 1.6 p.p. compared to December 2011). Telefónica Europe accounts for less than 50%
.
Depreciation and amortization
rose by 2.8% year-on-year, to 10,433 million euros. This variance was primarily due to amortization of new spectrum licenses acquired in Germany, Brazil, Colombia, Mexico and Venezuela, and to the overall increase in fixed assets. Total depreciation and amortization charges derived from purchase price allocation processes stood at 962 million euros in 2012 (down 14.1% year-on-year).
Operating income
in 2012 amounted to 10,798 million euros, a reported increase of 7.3%, helped by a 5.1% increase in OIBDA and hurt partially by a 2.8% increase in depreciation and amortization.
The
share of profit (loss) of
associates in 2012 reflects a loss of 1,275 million euros (versus a loss of 635 million euros in 2011), primarily due to the write-down of Telco, S.p.A.’s investment in Telecom Italia and the recovery of all the operating synergies considered at the time of this investment, with a net loss impact of -1,355 million euros in 2012 and -662 million euros in 2011.
Net financial expense
in 2012 totaled 3,659 million euros, 24.4% more than in 2011. This increase is due to two effects: first, an increase in average cost of net debt primarily due to the increase in average net debt (up 3.3% to a total of 58,187 million euros), the rise in credit spreads and the need to enhance liquidity (with very low returns compared to the cost of the debt) as a result of the financial market crises; and, secondly, to the increase in net exchange differences caused by the decline in estimated value of the bolivar fuerte. In spite of the increase in credit costs, the Group
’
s average cost of gross financial debt held steady at 4.7%. Stripping out net exchange rate differences, such expenses implied an average cost of net debt of 5.37% in 2012.
Corporate income
tax
in 2012 amounted to 1,461 million euros, implying an effective tax rate of 24.9% over the 5,864 million euros of profit before tax, lower than statutory rates, mainly due to the recognition of tax losses in several countries.
Profit attributable to non-controlling interests
reduced net profit by 475 million euros in 2012, and primarily reflects the share of Telefónica Brasil, Telefónica Czech Republic and Telefónica Germany's profits attributable to non-controlling interests. The year-on-year variance (a decrease of 39.5%) was due to reversal in the fourth quarter of 2011 of deferred tax liabilities recognized on the Vivo purchase price allocation (1,288 million euros) as a result of the change in the tax value of certain assets acquired.
In all, the
consolidated
profit of 2012 amounted to 3,928 million euros (down 27.3% year on year).
Segment results
Some of the figures in the table below are compared at a constant exchange rate in order to analyze yearly performance excluding the effect of exchange rate variation. For certain of the financial results discussed below, comparison has been made using previous year’s average exchange rate to convert the figure and by excluding the consideration of Venezuela as a hyperinflationary economy. In these cases a comment of “excluding foreign exchange rate effect” or “excluding foreign exchange rate effect and the consideration of Venezuela as a hyperinflationary economy” (or similar wording) has been indicated.
Some figures discussed further below have been compared in local currency (LC), taking the financial magnitudes in the relevant local currency as they were registered in the corresponding periods.
|
Var 11/12
|
Var 12/13
|
|||||||||||||||||||
|
Millions of euros
|
2011
|
% Total
|
2012
|
% Total
|
2013
|
% Total
|
Reported
|
Ex fx (*)
|
Reported
|
Ex fx (*)
|
||||||||||
|
Revenues
|
62,837
|
62,356
|
57,061
|
(0.8)%
|
(0.9)%
|
(8.5)%
|
(1.0)%
|
|||||||||||||
|
T. Europe
|
32,076
|
51.0%
|
30,006
|
48.1%
|
26,840
|
47.0%
|
(6.5)%
|
(7.8)%
|
(10.6)%
|
(9.3)%
|
||||||||||
|
T. Latin America
|
28,941
|
46.1%
|
30,520
|
48.9%
|
29,193
|
51.2%
|
5.5%
|
6.7%
|
(4.3)%
|
9.6%
|
||||||||||
|
OIBDA
|
20,210
|
21,231
|
19,077
|
5.1%
|
5.4%
|
(10.1)%
|
(2.6)%
|
|||||||||||||
|
T. Europe
|
9,262
|
45.8%
|
10,228
|
48.2%
|
9,917
|
52.0%
|
10.4%
|
9.5%
|
(3.0)%
|
(2.1)%
|
||||||||||
|
T. Latin America
|
10,890
|
53.9%
|
11,103
|
52.3%
|
9,439
|
49.5%
|
2.0%
|
3.1%
|
(15.0)%
|
(1.4)%
|
||||||||||
|
OIBDA Margin
|
32.2%
|
34.0%
|
33.4%
|
|||||||||||||||||
|
T. Europe
|
28.9%
|
34.1%
|
36.9%
|
|||||||||||||||||
|
T. Latin America
|
37.6%
|
36.4%
|
32.3%
|
|||||||||||||||||
|
Operating income
|
10,064
|
10,798
|
9,450
|
7.3%
|
8.8%
|
(12.5)%
|
(2.8)%
|
|||||||||||||
|
T. Europe
|
4,181
|
41.5%
|
5,214
|
48.3%
|
5,211
|
55.1%
|
24.7%
|
23.9%
|
(0.1)%
|
0.5%
|
||||||||||
|
T. Latin America
|
6,120
|
60.8%
|
6,015
|
55.7%
|
4,805
|
50.8%
|
(1.7)%
|
0.7%
|
(20.1)%
|
(3.0)%
|
||||||||||
|
Net income
|
5,403
|
3,928
|
4,593
|
|||||||||||||||||
|
(*) Excluding exchange rate differences and the effect of hyperinflation in Venezuela.
|
||||||||||||||||||||
Revenues and OIBDA Contribution by Country
We include below some charts showing the revenues and OIBDA contribution by main countries, and segments, to total Consolidated Group revenues and OIBDA for 2011, 2012 and 2013. By way of explanation, total Group revenues and OIBDA are 100% in each year, and in each country or region the percentage represents its contribution to the total Group.
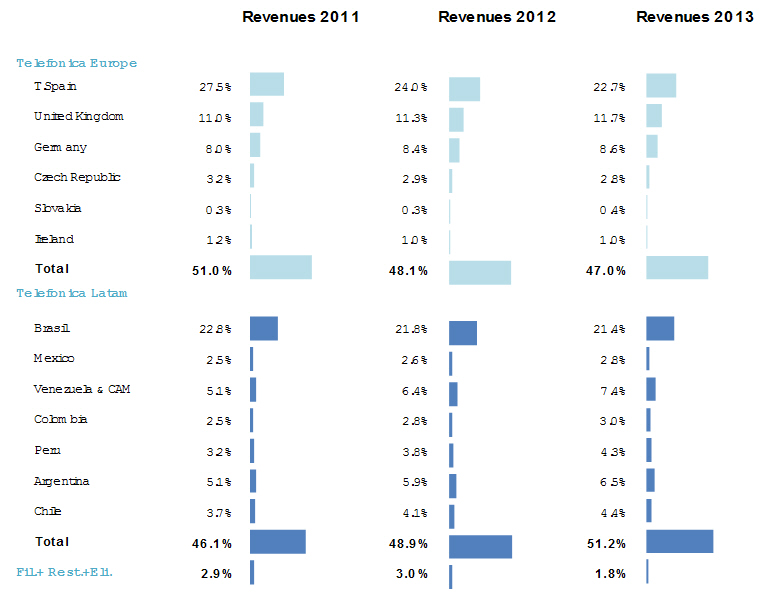
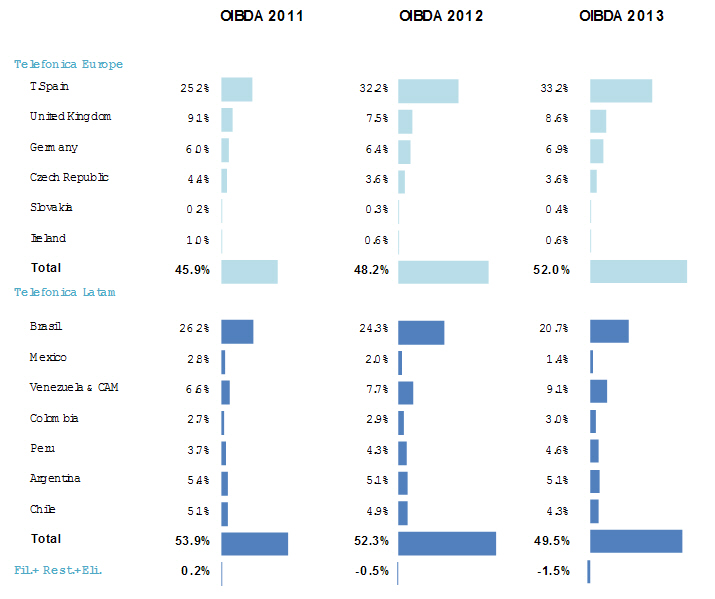
As the preceding
charts show, the Telefónica Group has high geographic diversification with Telefónica Latin America’s revenues contribution to Group revenue increasing in the last three years. Spain and Brazil are the largest
single contributors to Group revenue and OIBDA, followed by the UK, Germany, Venezuela and Central
America
, Argentina and Chile. Beginning in 2013 we present figures of Venezuela and Central America together, and figures for previous years have been revised.
Together, these countries accounted for 88% of OIBDA and 83% of Group revenue in 2013 (88% of OIBDA and 82% of
revenue
in 2012 and 84% of OIBDA and 83% of revenue in 2011, respectively), and are therefore those on which our following discussion of segment results is focused below.
Contribution to growth by country
In the charts included below, we disclose the contribution to growth by country and segment excluding the effects of exchange rate differences and the effect of hyperinflation in Venezuela. It shows the contribution to consolidated growth of revenues and OIBDA of the main countries and segments, for 2012 and 2013. For example, the negative 3.3% of Telefónica Spain in 2013 means that Telefónica Spain’s drop in revenues caused a -3.3 p.p. decrease in total consolidated revenues in 2013, and the addition of all countries’ contribution shown in the chart equals the total Group revenues decline in 2013 (-1.0% excluding the impact of exchange rate differences and the effect of hyperinflation in Venezuela).
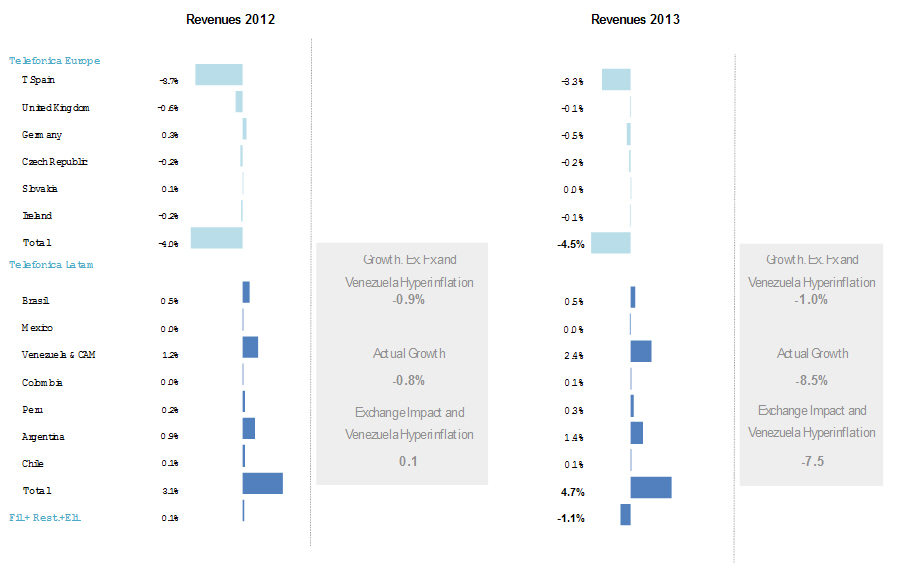
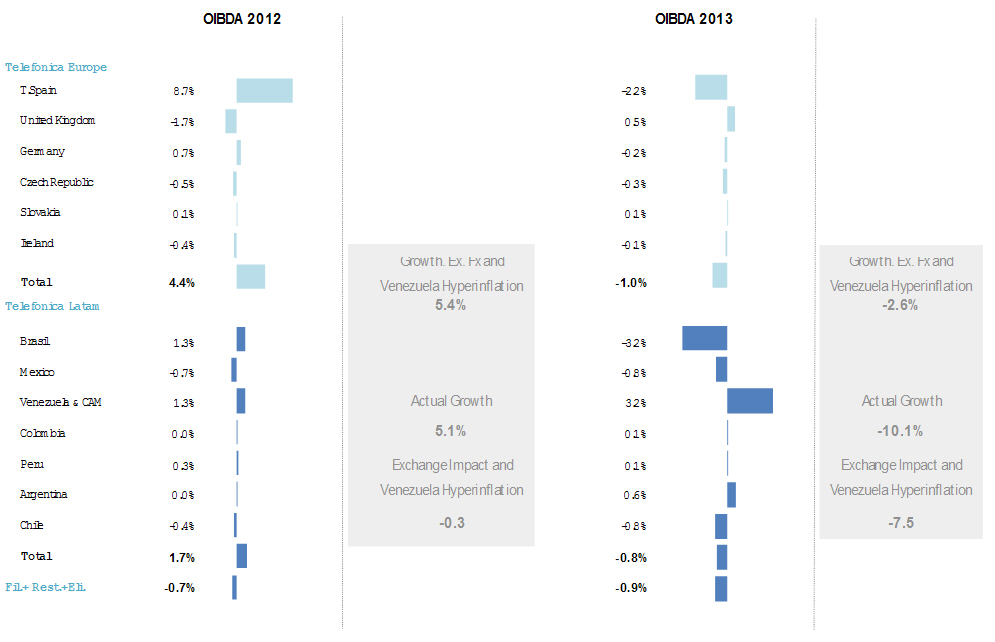
Segment Discussion
TELEFÓNICA LATIN AMERICA
The below table shows the evolution of accesses in Telefónica Latin America over the past three years:
|
Thousands of accesses
|
2011
|
2012
|
2013
|
%Var 11/12
|
%Var 12/13
|
|||||
|
Fixed telephony accesses (1)
|
23,960.7
|
24,153.3
|
24,526.3
|
0.8%
|
1.5%
|
|||||
|
Internet and data accesses
|
8,244.2
|
8,732.5
|
9,239.7
|
5.9%
|
5.8%
|
|||||
|
Narrowband
|
304.6
|
209.1
|
125.5
|
(31.4)%
|
(40.0)%
|
|||||
|
Broadband (2)
|
7,828.9
|
8,415.3
|
9,011.7
|
7.5%
|
7.1%
|
|||||
|
Other (3)
|
110.6
|
108.0
|
102.6
|
(2.3)%
|
(5.0)%
|
|||||
|
Mobile accesses
|
166,297.9
|
176,595.4
|
184,507.0
|
6.2%
|
4.5%
|
|||||
|
Prepay
|
131,087.2
|
137,141.5
|
138,076.0
|
4.6%
|
0.7%
|
|||||
|
Contract
|
35,210.7
|
39,453.9
|
46,431.0
|
12.1%
|
17.7%
|
|||||
|
Pay TV
|
2,257.7
|
2,426.8
|
2,773.6
|
7.5%
|
14.3%
|
|||||
|
Final Clients Accesses
|
200,760.5
|
211,908.0
|
221,046.7
|
5.6%
|
4.3%
|
|||||
|
Wholesale Accesses
|
50.9
|
47.0
|
41.5
|
(7.5)%
|
(11.7)%
|
|||||
|
Total Accesses
|
200,811.3
|
211,955.1
|
221,088.2
|
5.5%
|
4.3%
|
|||||
|
Terra Accesses
|
641.7
|
604.7
|
412.5
|
(5.8)%
|
(31.8)%
|
|||||
|
Total Latin America Accesses
|
201,453.0
|
212,559.8
|
221,500.7
|
5.5%
|
4.2%
|
|||||
(1) PSTN (including public use telephony) x1; ISDN basis access x1; ISDN primary access; 2/6 access x30. Includes the Group’s accesses for internal use and total fixed wireless accesses.
(2) Includes ADSL, fiber optic, cable modem and broadband circuits.
(3) Remaining retail circuits other than broadband.
The below table shows the evolution of Telefónica’s estimated mobile market share over the past three years:
|
Mobile Market Share (1)
|
|||||
|
Telefónica Latin America
|
2011
|
2012
|
2013
|
||
|
Brazil
|
29.5%
|
29.1%
|
28.6%
|
||
|
Argentina
|
29.8%
|
29.7%
|
31.4%
|
||
|
Chile
|
39.1%
|
38.8%
|
38.7%
|
||
|
Peru
|
61.4%
|
60.0%
|
59.7%
|
||
|
Colombia
|
22.4%
|
21.6%
|
24.0%
|
||
|
Venezuela
|
32.7%
|
32.9%
|
32.0%
|
||
|
Mexico
|
20.9%
|
19.2%
|
18.5%
|
||
|
Central America
|
27.9%
|
29.7%
|
31.8%
|
||
|
Ecuador
|
28.4%
|
29.3%
|
32.6%
|
||
|
Uruguay
|
38.0%
|
37.4%
|
35.8%
|
||
|
|
(1)
|
Company estimation.
|
The below table shows the evolution of Telefónca’s ADSL market share over the past three years:
|
Share of ADSL (1)
|
|||||
|
Telefónica Latin America
|
2011
|
2012
|
2013
|
||
|
Brazil
|
21.9%
|
18.8%
|
16.3%
|
||
|
Argentina
|
31.1%
|
30.9%
|
30.5%
|
||
|
Chile
|
43.0%
|
41.2%
|
40.2%
|
||
|
Peru
|
90.1%
|
90.1%
|
86.9%
|
||
|
Colombia
|
18.1%
|
18.1%
|
18.7%
|
||
|
(1) Company estimation.
|
|||||
Main 2013 trends in the mobile business
|
|
·
|
Estimated total market penetration in Latin America at the end of December 2013 was 118% (+2.9 percentage point year-on-year).
|
|
|
·
|
Mobile accesses reached 184.5 million at year end (+4.5% year-on-year growth), with notable growth in accesses in the contract segment (+17.7%) and despite the impact of the application a more restrictive criteria in the calculation of the number of customers for the prepay segment (+0.7%). Contract accesses represented 25% of total mobile accesses and totaled 46.4 million.
|
|
|
·
|
The continued growth in mobile broadband accesses is noteworthy, reaching 43.6 million a year end (increasing year-on-year 60%) leveraged on the strong demand for smartphones, whose access base grew 75% year-on-year and increased its weight by 9 percentage points over the entire mobile access base.
|
|
|
·
|
Net additions stood at 7.9 million for the year, boosted by the 60% year-on-year growth in contract accesses, with 7.0 million new accesses in 2013 (+64% year-on-year).
|
|
|
·
|
Traffic grew by 9% year-on-year, with notable year-on-year growth reported in all the countries in the region.
|
|
|
·
|
ARPU growth year-on-year was 5.7%, despite the reduction of mobile termination rates. Thus, outgoing ARPU posted year-on-year growth of 8.4%, driven by non-SMS data and the growth in voice traffic.
|
Key 2013 trends in the fixed line business
|
|
·
|
Total accesses reached 36.6 million in December 2013, growing year-on-year by 3%.
|
|
|
·
|
Traditional business accesses stood at 24.5 million, up 1.5% year-on-year, reflecting the acceleration in the capture of new accesses, with net additions of 373 thousand in the year.
|
|
|
·
|
Broadband accesses amounted to 9.0 million (year-on-year growth of 7.1%) with net additions of 596 thousand in the year. Thus, broadband accesses represented 37% of traditional business accesses, increasing 2 percentage points year-on-year.
|
|
|
·
|
Pay TV accesses stood at 2.8 million, with year-on-year growth of 14.3%, with net additions of 347 thousand in the year, despite the commercial repositioning of MMDS in Brazil, which resulted in a reduction of 71 thousand clients.
|
|
Results
|
||||||||||||||
|
Millions of euros
|
Var 11/12
|
Var 12/13
|
||||||||||||
|
Telefónica Latin America
|
2011
|
2012
|
2013
|
Reported
|
Ex fx (1)
|
Reported
|
Ex fx (1)
|
|||||||
|
Revenues
|
28,941
|
30,520
|
29,193
|
5.5%
|
6.7%
|
(4.3)%
|
9.6%
|
|||||||
|
OIBDA
|
10,890
|
11,103
|
9,439
|
2.0%
|
3.1%
|
(15.0)%
|
(1.4)%
|
|||||||
|
OIBDA Margin
|
37.6%
|
36.4%
|
32.3%
|
(1.3) p.p.
|
−
|
(4) p.p.
|
−
|
|||||||
|
Depreciation and amortization
|
(4,770)
|
(5,088)
|
(4,634)
|
6.7%
|
6.3%
|
(8.9)%
|
0.5%
|
|||||||
|
Operating Income
|
6,120
|
6,015
|
4,805
|
(1.7)%
|
0.7%
|
(20.1)%
|
(3.0)%
|
|||||||
|
(1) Excluding exchange rate differences and the effect of hyperinflation in Venezuela.
|
||||||||||||||
2013 Results
Telefónica Latin America represented 51.2% of the Group’s revenues and 49.5% of OIBDA in 2013.
The segment contributed 4.7 percentage points to the year-on-year change in the Group’s revenue, and -0.8 percentage points to the change in the Group’s OIBDA, excluding the impact of exchange rate differences and the effect of hyperinflation in Venezuela.
Telefónica Latin America’s
revenues
in 2013 amounted to 29,193 million euros in 2013, with a 4.3% decline in year-on-year growth in reported terms, mainly due to exchange rate differences and the effect of hyperinflation in Venezuela. Stripping out these factors, which reduced growth by 14 percentage points, growth would have been 9.6%. This performance reflects the positive performance of mobile service revenues, which rose by 11.8% in the year excluding the impact of exchange rate differences and the effect of hyperinflation in Venezuela (they decreased 1.5% in reported terms), due to the good performance of data revenue and despite the negative impact of changes in regulations.
This rise was driven by the explosion of data in the region, rising 37.8% in 2013 in non-SMS data revenues, excluding exchange rate differences and the effect of hyperinflation in Venezuela (16% in reported terms)
.
Voice revenues dropped 7% year-on-year in reported terms but were up 8.4% year-on-year without exchange rate differences and the impact of hyperinflation in Venezuela, due to the sharp increase in traffic and despite the negative impact of changes in regulations.
Revenues from handset sales amounted to 1,993 million euros and increased 20.0% in reported terms, despite the impact of exchange rate differences and the effect of hyperinflation in Venezuela. Stripping out these effects, growth would have been 44.5%, growing in all countries in the region as a result of the growth in smartphones.
Revenues from the fixed business fell 11.3% in reported terms, affected by exchange rate differences. Excluding this effect, revenues from the fixed business remained stable for the year (-0.1% year-on-year) as the decrease in voice revenues was offset by fixed broadband better performance.
Total expenses
, which include supplies, personnel expenses and other expenses (mainly subcontract expenses and others) stood at 20,298 million euros in 2013, declining 1.4% in reported terms, affected by:
|
|
·
|
exchange rate differences and the effect of hyperinflation in Venezuela (13.6 p.p.);
|
|
|
·
|
the sale of non-strategic towers (-0.1 p.p.); and
|
|
|
·
|
contractual changes in the commercial model for selling handsets in Chile (0.8 p.p.).
|
Excluding these effects, total expenses would have grown 11.5%. The change in total expenses is explained by:
|
|
·
|
Supply costs
increased to 8,104 million euros, rising by 5.7% year-on-year in reported terms impacted by the exchange rate differences and the effect of hyperinflation in Venezuela (-14.4 p.p.) and contractual changes in the commercial model for selling handsets in Chile (+2.2 p.p.). E
xcluding both effects, supply costs grew
17.7%. The decline of MTR expenses (net of exchange rate differences and the effect of hyperinflation in Venezuela) did not offset the growth in costs, due to the greater commercial activity in the mobile business, with a higher weight of smartphone sales, and at the fixed unit, with higher content costs associated with the sharp rise in pay TV accesses, and increased expenses associated with the provision of data services;
|
|
|
·
|
Personnel costs
stood at 2,840 million euros, growing 12.4% excluding the impact of exchange rates differences and the effect of hyperinflation in Venezuela. This year-on-year growth is mainly due to the impact of inflation in some countries in the region; and
|
|
|
·
|
Other expenses
were 9,354 million euros, declining 6.4% in reported terms, impacted by the exchange rate differences and the effect of hyperinflation in Venezuela (-12.7 p.p.) and the sale of non-strategic towers (-0.1 p.p.). E
xcluding both effects, other expenses grew
6.4%, due to the higher sales commissions and customer service expenses associated with increased commercial activity.
|
OIBDA
stood at 9,439 million in 2013, showing a reported year-on-year decline of 15%, impacted by:
|
|
·
|
exchange rate differences and the effect of hyperinflation in Venezuela (-13.5 p.p.);
|
|
|
·
|
contractual changes in the commercial model for selling handsets in Chile (-1.5 p.p.); and
|
|
|
·
|
the sale of non-strategic towers (-4.9 p.p.).
|
Excluding the aforementioned items, OIBDA growth would have been 5.3%.
The
OIBDA margin
stood at 32.3% for the full year, down 4 percentage points year-on-year in reported terms; primarily due to the negative evolution of the exchange rates and lower sales of non-strategic towers in 2013 (40 million euros compared to 583 million euros in 2012).
2012 Results
Telefónica Latin America represented 49% of consolidated revenue (up 2.9 p.p. compared to 2011) and 52.3% of consolidated OIBDA (a 1.6 p.p. decrease compared to 2011). The segment contributed 3.1 p.p. to the year-on-year variation in the Group’s revenues stripping out the impact of exchange rate differences, main differences due to Venezuela’s and Central America’s, Argentina’s and Brazil’s contribution.
Telefónica Latin America reported a 5.5% year-on-year increase in
revenue
to 30,520 million euros in 2012, despite the negative impact (-1.2 p.p.) of exchange rate differences and the effect of hyperinflation in Venezuela. These figures reflect the strong mobile service revenues generated in the year 2012 (up 11.4%), despite the negative impact of regulations.
The mobile broadband business posted a 24.1% rise in mobile data revenues compared to 2011, accounting for 29% of mobile services revenues (up 3 p.p. year-on-year). The increase in connectivity revenues underpinned growth in non-SMS data revenues (up 32.9% in the year, accounting for 57% of data revenues, up 4 p.p. year-on-year).
Revenues from handset sales increased by 17.9% to 1,661.4 million euros.
Brazil has shored up its role as the main regional market, accounting for
45%
of the region's revenues in 2012
.
Revenue in the fixed line business was hit by the drop in fixed lines, which outweighed the growth in broadband and TV, with lower ARPUs due to intense commercial activity.
Total expenses
in 2012 were 20,577 million euros, an increase of 6.8%. Exchange rate differences and the impact of hyperinflation in Venezuela had an impact on total expenses of 322 million euros. Stripping out this impact, the increase would have been 8.2%.
|
|
·
|
Supply costs
were 7,670 million euros, up 2.8%, due mainly to increased demand for terminals related to the larger share of Smartphone sale, to higher content, digital and data services costs and higher site lease costs for the deployment of towers and due to our sale and leaseback of certain towers.
|
|
|
·
|
Personnel expenses
rose 13.5% to 2,908 million euros, driven mostly by increases in certain countries in the area with high inflation.
|
|
|
·
|
Other expenses
rose 8.3% year-on-year to 9,999 million euros, driven by larger growth in commercial activity and increased spending on customer services.
|
OIBDA
was 11,103 million euros in 2012, for reported year-on-year growth of 2.0% (up 1.1 p.p. when stripping out the effect of exchange rate differences and hyperinflation in Venezuela). The OIBDA margin was 36.4% for the year, down 1.3 p.p. compared to 2011.
|
|
·
|
Both OIBDA and the OIBDA margin for 2011 and 2012 reflect the sale of non-strategic towers: 583 million euros in 2012, and 541 million euros in 2011.
|
|
|
·
|
In 2012 a number of factors (integration expenses, brand changes and reversal of provisions in Brazil, service interruptions in Argentina, retroactive impact of the new Venezuela labor law, etc.) brought OIBDA down by 42 million euros.
|
|
|
·
|
Following a contractual change in the handset sales model in Chile, as from the fourth quarter of 2012, OIBDA is affected by the new accounting treatment given for revenues and expenses formerly linked to a mobile handset sales model involving lease without charge, with a negative impact of 22 million euros in the fourth quarter of 2012.
|
BRAZIL
|
Thousands of accesses
|
2011
|
2012
|
2013
|
% Var 11/12
|
% Var 12/13
|
|||||
|
Fixed telephony accesses (1)
|
10,977.4
|
10,642.7
|
10,747.8
|
(3.0)%
|
1.0%
|
|||||
|
Internet and data accesses
|
3,942.6
|
3,964.3
|
4,102.0
|
0.6%
|
3.5%
|
|||||
|
Narrowband
|
214.5
|
137.9
|
92.1
|
(35.7)%
|
(33.2)%
|
|||||
|
Broadband (2)
|
3,648.0
|
3,748.4
|
3,936.7
|
2.8%
|
5.0%
|
|||||
|
Other (3)
|
80.0
|
78.1
|
73.2
|
(2.5)%
|
(6.2)%
|
|||||
|
Mobile accesses
|
71,553.6
|
76,137.3
|
77,240.2
|
6.4%
|
1.4%
|
|||||
|
Pre-Pay
|
55,438.1
|
57,335.1
|
53,551.9
|
3.4%
|
(6.6)%
|
|||||
|
Contract
|
16,115.5
|
18,802.2
|
23,688.3
|
16.7%
|
26.0%
|
|||||
|
Pay TV
|
698.6
|
601.2
|
640.1
|
(13.9)%
|
6.5%
|
|||||
|
Final Clients Accesses
|
87,172.1
|
91,345.4
|
92,730.0
|
4.8%
|
1.5%
|
|||||
|
Wholesale Accesses
|
28.0
|
24.4
|
18.8
|
(13.0)%
|
(22.8)%
|
|||||
|
Total Accesses
|
87,200.1
|
91,369.8
|
92,748.9
|
4.8%
|
1.5%
|
|||||
(1) PSTN (including public use telephony) x1; ISDN basis access x1; ISDN primary access; 2/6 access x30. Includes the Group’s accesses for internal use and total fixed wireless accesses.
(2) Includes ADSL, fiber optic, cable modem and broadband circuits.
(3) Remaining retail circuits other than broadband.
In 2013, Telefónica Brasil strengthened its competitive positioning in the market; reinforcing its leadership in high value segments of the mobile market through ongoing service innovation and differential coverage and network quality and in the fixed market through a renewed commercial offer and deployment of the fiber network.
In the fixed business, in addition to the fiber network in Sao Paulo, the Company also continued to develop Fixed Wireless technology, which enables fixed services to be offered in areas where the copper network has not been rolled out. With the aim of strengthening its portfolio and broadband services, the Company has also relaunched “Vivo Internet Box”, which provides mobile internet associated with a WiFi modem with a capacity of up to 40 GB. In the second half of the year, Telefónica Brasil undertook a commercial repositioning in Pay TV.
Innovative services continue to be rolled out, such as the new mobile generation network deployment of both 3G and 4G, which was launched in the second quarter and now covers 73 cities and the launch of “Multivivo”, a product which allows data and/or voice to be shared between several devices and that already had 1.4 million users at year end.
|
Wireless Business
|
8,437
|
8,573
|
8,092
|
1.6%
|
9.4%
|
(5.6)%
|
7.5%
|
|||||||
|
Service revenues
|
8,014
|
8,167
|
7,608
|
1.9%
|
9.7%
|
(6.8)%
|
6.1%
|
|||||||
|
Wireline Business
|
5,890
|
5,045
|
4,125
|
(14.4)%
|
(7.8)%
|
(18.2)%
|
(6.8)%
|
|||||||
|
OIBDA
|
5,302
|
5,161
|
3,940
|
(2.7)%
|
4.8%
|
(23.7)%
|
(13.0)%
|
|||||||
|
OIBDA Margin
|
37.0%
|
37.9%
|
32.3%
|
0.9 p.p.
|
(5.6) p.p.
|
|||||||||
|
CapEx
|
2,468
|
2,444
|
2,127
|
(1.0)%
|
6.6%
|
(13.0)%
|
(0.9)%
|
|||||||
|
OpCF (OIBDA - CapEx)
|
2,834
|
2,717
|
1,813
|
(4.1)%
|
3.2%
|
(33.3)%
|
(24.0)%
|
|||||||
2013 Results
Revenues
totaled 12,217 million euros, 10.3% less than 2012 in reported terms. Excluding the effect of exchange rate differences, revenues grew 2.2% year-on-year, mainly due to the strong performance of the mobile business (+7.5%), more than compensating the decline in fixed revenues (-6.8%). 2013 wireless business revenues amounted to 8,092 million euros, down 5.6% in reported terms, although stripping out the effect of exchange rate differences they would have grown 7.5%, boosted by handset sales revenues (+35.4%) due to the higher weight of smartphone sales and the growth of service revenues (+6.1%) due to the growth in outgoing service revenues from both the growth of the customer base and the greater weighting of data revenues partially compensated by the incoming revenues affected by the reduction in mobile termination rates.
Revenues from the fixed business amounted to 4,125 million euros, down 18.2% in reported terms, although stripping out the effect of exchange rate differences they would have decreased 6.8%, impacted by the reduction in the fixed-mobile retail tariff as well as by intense competition in the fixed broadband and Pay TV businesses.
|
Brazil - Mobile
|
||||||||||
|
2011
|
2012
|
2013
|
% Var LC 11/12
|
% Var LC 12/13
|
||||||
|
Traffic (million minutes) (1)
|
92,081
|
113,955
|
115,698
|
27.4%
|
1.5%
|
|||||
|
ARPU (EUR)
|
10.2
|
8.9
|
8.0
|
(6.4)%
|
2.3%
|
|||||
|
|
(1)
|
From the third quarter of 2013, duplicated traffic was deleted following the integration of fixed and mobile companies.
|
OIBDA
totaled 3,940 million euros in 2013, down 23.7% in reported terms, decreasing 13.0% when excluding the effect of exchange rate differences. This performance is partially explained by the sale of non-strategic towers in 2012 resulting in a gain of 445 million euros versus only 29 million euros in 2013. Net of the aforementioned factors OIBDA decreased by 5.5%, losing 2.6 percentage points of margin with respect to 2012.
The increase in revenues in local currency terms is not completely reflected in OIBDA, which was affected by personnel restructuring costs (51 million euros), as well as higher network costs and expenses related to handsets and customer service, associated with higher commercial activity. OIBDA margin stood at 32.3% in reported terms in the full year.
2012 Results
Revenues
amounted to 13,618 million euros in 2012, for year-on-year growth of 2.3% in local currency. Revenues from the mobile business came in at 8,573 million euros for the year, up 9.4% in local currency compared to 2011, where service revenues close at 9.7% in local currency compared to 2011 due to the good evolution of the outgoing revenues boosted by the average customer base growth and the growing weight in data revenues. This is partially offset by the incoming revenue fall (and consequent ARPU decrease) affected by the negative impact of the lower mobile termination rates. Additionally, our customer base in Brazil suffered a drop due to the disconnection of inactive prepay mobile customers in Brazil (1.6 million accesses in the second quarter).
The fixed business reported revenues of 5,045 million euros, down 7.8% in local currency due to lower retail fixed-mobile rates and to steep competition in the fixed broadband and pay TV businesses.
OIBDA
stood at 5,161 million euros in 2012, up 4.8% in local currency driven by mobile revenues growth, offset by fixed voice revenues drop as well as expenses growth due to higher personnel costs coming from the internalization of contractors and workforce restructuring expenses and the increase of external services costs, associated to a higher commercial activity. On the other hand, OIBDA was positively affected by the recognition of 445 million euros in other income derived from the sale of non-strategic assets, compared to 187 million euros in 2011. The overall OIBDA margin was 37.9%, a 0.9 p.p. improvement on 2011.
ARGENTINA
|
Thousands of accesses
|
2011
|
2012
|
2013
|
% Var 11/12
|
% Var 12/13
|
|||||
|
Fixed telephony accesses (1)
|
4,611.0
|
4,762.4
|
4,833.5
|
3.3%
|
1.5%
|
|||||
|
Fixed wireless
|
38.2
|
234.6
|
342.7
|
514.1%
|
46.0%
|
|||||
|
Internet and data accesses
|
1,630.7
|
1,755.5
|
1,848.5
|
7.7%
|
5.3%
|
|||||
|
Narrowband
|
35.7
|
19.3
|
12.9
|
(46.0)%
|
(32.8)%
|
|||||
|
Broadband (2)
|
1,595.1
|
1,736.3
|
1,835.5
|
8.9%
|
5.7%
|
|||||
|
Mobile accesses
|
16,766.7
|
17,604.0
|
19,954.7
|
5.0%
|
13.4%
|
|||||
|
Pre-Pay
|
10,581.3
|
11,000.0
|
12,916.6
|
4.0%
|
17.4%
|
|||||
|
Contract
|
6,185.4
|
6,604.0
|
7,038.1
|
6.8%
|
6.6%
|
|||||
|
Final Clients Accesses
|
23,008.4
|
24,121.9
|
26,636.7
|
4.8%
|
10.4%
|
|||||
|
Wholesale Accesses
|
13.9
|
14.1
|
14.0
|
1.2%
|
(0.4)%
|
|||||
|
Total Accesses
|
23,022.3
|
24,136.0
|
26,650.7
|
4.8%
|
10.4%
|
|||||
(1) PSTN (including public use telephony) x1; ISDN basis access x1; ISDN primary access; 2/6 access x30. Includes the Group’s accesses for internal use and total fixed wireless accesses.
(2) Includes ADSL, fiber optic, cable modem and broadband circuits.
In 2013 Telefónica Argentina maintained its market leadership due to its competitive position and ongoing focus on quality and innovation in its products and services.
The company launched Quam, a secondary brand to Movistar for mobile telephony services, reflecting its commitment to innovation by being the first telco to launch an offer of this type in the region. This new offer gives Telefónica access to fresh market segments with a simple proposal that combines various minute, SMS and data bundles and is aimed at ensuring that the youngest customers in the prepay segment are always connected.
|
Millions of euros
|
%
Var 11/12
|
% Var 12/13
|
||||||||||||
|
Argentina
|
2011
|
2012
|
2013
|
€
|
LC
|
€
|
LC
|
|||||||
|
Revenues
|
3,174
|
3,697
|
3,681
|
16.5%
|
18.4%
|
(0.4)%
|
23.2%
|
|||||||
|
Wireless Business
|
2,039
|
2,431
|
2,470
|
19.2%
|
21.2%
|
1.6%
|
25.8%
|
|||||||
|
Service revenues
|
1,880
|
2,200
|
2,154
|
17.0%
|
19.0%
|
(2.1)%
|
21.2%
|
|||||||
|
Wireline Business
|
1,237
|
1,390
|
1,332
|
12.3%
|
14.2%
|
(4.2)%
|
18.6%
|
|||||||
|
OIBDA
|
1,085
|
1,076
|
977
|
(0.8)%
|
0.8%
|
(9.2)%
|
12.4%
|
|||||||
|
OIBDA Margin
|
33.4%
|
28.5%
|
26.1%
|
(4.8) p.p.
|
– |
(2.5) p.p.
|
– | |||||||
|
CapEx
|
449
|
519
|
574
|
15.6%
|
17.5%
|
10.6%
|
36.9%
|
|||||||
|
OpCF (OIBDA - CapEx)
|
636
|
557
|
403
|
(12.4)%
|
(10.9)%
|
(27.6)%
|
(10.5)%
|
|||||||
2013 Results
Revenues
stood at 3,681 million euros in 2013, a decline of 0.4%, mainly as a result of exchange rate effects. Excluding exchange rate effects, revenues would have risen 23.2% year-on-year, driven by improvement in both the fixed and mobile business.
|
|
·
|
Revenues from the mobile business declined 2.1% in reported terms, negatively affected by the exchange rate. Stripping out exchange rate effects, mobile business revenues grew 21.2% year-on-year in 2013 due to the growth in the customer base and the higher level of consumption, in particular of data, which remained the main growth driver. Data revenues increased by 31% year-on-year in 2013, and now account for 48% of service revenues (+3 percentage point year-on-year). The growth of devices revenues of 36.9% in reported terms was due to the growth of commercial activity contribution. Stripping out exchange rate effects, revenues grew 69.4%.
|
|
2011
|
2012
|
2013
|
% Var LC 11/12
|
% Var LC 12/13
|
|||||
|
Traffic (million minutes)
|
18,788
|
21,201
|
22,540
|
12.8%
|
6.3%
|
||||
|
ARPU (EUR)
|
9.7
|
11.0
|
9.4
|
14.6%
|
5.9%
|
||||
|
|
·
|
Revenues from the fixed business fell 4.2% in reported terms, negatively impacted by the exchange rate. Excluding exchange rate effects, revenues increased 18.6% year-on-year, due to revenue growth of (+29.4%) in broadband and new services, on the back of strong broadband ARPU growth (+21% year-on-year in the year in local currency). As a result, broadband and new service revenues now account for 50% of fixed revenues.
|
Telefónica’s
OIBDA
in Argentina amounted to 977 million euros in the full year, a year-on-year decrease of 9.2%, negatively impacted by exchange rate effects. Excluding exchange rate effects, OIBDA grew 12.4% year-on-year due to the increase in revenues. OIBDA margin was 2.5 percentage points less than the year before, due to rising costs due to the generalized price increases, although the company continues to undertake cost containment measures to mitigate the effects of high inflation.
2012 Results
The financial results in Argentina for the year were negatively affected by compensation paid to customers in respect of a software outage in Movistar’s national network equipment, which affected service on April 2, 2012. In addition, results were also adversely affected by the heavy storm that hit the northern part of Buenos Aires on April 4, 2012.
Revenues
: Service revenues from the mobile business grew sharply in 2012 (19.0% excluding foreign exchange rate effects), reflecting higher usage levels, driven by data usage and growth in the customer base. Data revenues are the main lever for growth (33.5%, excluding exchange rate differences).
Revenues in the fixed line business rose 14.2% in local currency due to the solid growth in revenues from broadband and new services (+26.5%), reflecting the strong improvement in Internet and content revenues and revenues from data, IT and leasing of capacity.
OIBDA
at Telefónica Argentina stood at 1,076 million euros, a 0.8% rise in local currency, not fully reflecting the positive evolution of revenues due to the general rise in prices that impacted operating expenses, (mainly personnel expenses and external services due to inflation).
VENEZUELA AND CENTRAL AMERICA
Beginning in 2013, figures of Venezuela and Central America are presented together, and figures for previous years have been revised.
|
Thousands of accesses (1)
|
2011
|
2012
|
2013
|
% Var 11/12
|
% Var 12/13
|
|||||
|
Fixed telephony accesses
|
1,413.5
|
1,500.7
|
1,426.7
|
6.2%
|
(4.9)%
|
|||||
|
Fixed wireless (2)
|
1,224.3
|
1,340.5
|
1,168.7
|
9.5%
|
(12.8)%
|
|||||
|
Internet and data accesses
|
42.8
|
41.0
|
12.4
|
(4.1)%
|
(69.8)%
|
|||||
|
Narrowband
|
31.3
|
29.7
|
1.7
|
(4.9)%
|
(94.3)%
|
|||||
|
Broadband (3)
|
4.9
|
4.9
|
4.7
|
11.8%
|
(3.9)%
|
|||||
|
Other (4)
|
6.7
|
6.4
|
6.0
|
11.0%
|
(6.4)%
|
|||||
|
Mobile accesses
|
17,004.2
|
19,929.3
|
21,666.8
|
19.2%
|
8.7%
|
|||||
|
Pre-Pay
|
15,424.6
|
18,060.2
|
19,489.8
|
1.9%
|
7.9%
|
|||||
|
Contract
|
1,577.5
|
1,869.1
|
2,177.0
|
88.3%
|
16.5%
|
|||||
|
Pay TV
|
114.3
|
215.3
|
385.6
|
88.3%
|
79.1%
|
|||||
|
Final Clients Accesses
|
18,574.9
|
21,686.3
|
23,491.6
|
16.8%
|
8.3%
|
|||||
|
(1)
|
Includes Guatemala, Panama, El Salvador, Nicaragua and Costa Rica.
|
|
(2)
|
Fixed wireless accesses exclude since the first quarter of 2013, 58 thousand accesses included as fixed telephony accesses.
|
|
(3)
|
Includes ADSL, K optical fiber, cable modem and broadband circuits.
|
|
(4)
|
Retail circuits other than broadband.
|
During 2013, Telefónica continued strengthening its unique position due to its integrated services offer and the ongoing improvements in network quality and coverage, showing a positive trend both in operational and financial terms along the whole year.
Commercial activity in 2013 was focused on incentivizing the consumption of data plans and launching new offerings adapted to customer needs depending on voice, SMS and data demand.
Underlining its commitment to innovation and maintaining a greater access to technology and comfort to its customers, the Company in Venezuela began a nationwide rollout of WiFi infrastructure in the fourth quarter of 2013. The goal is to install 1,000 hotspots by 2016, with a view to placing Telefónica as the telecommunications company with the largest WiFi network in the country.
Note also that 2013 economic-financial results in reported terms were affected by the devaluation of the bolivar fuerte which was announced on February 8, 2013, by the Venezuelan government, devaluing the bolivar fuerte from 4.3 bolivares fuertes per U.S. dollar to 6.3 bolivares fuertes per U.S. dollar. In the same way, the Venezuelan government announced on January 22, 2014, a new exchange rate to be established and a general foreign exchange plan by which specific transactions will be managed by an auction system at SICAD exchange rate. That exchange rate was fixed at roughly 11.4 bolivares fuertes per U.S. dollar over the last auctions. Additionally, the Venezuela Government issued an “Organic Law on Fair Pricing” that may affect the Company’s results trend.
|
Results
|
|||||||||||||
|
Millions of euros
|
% Var 11/12
|
% Var 12/13
|
|||||||||||
|
Venezuela & Central America
|
2011
|
2012
|
2013
|
€
|
LC(*)
|
€
|
LC(*)
|
||||||
|
Revenues
|
3,230
|
4,009
|
4,228
|
24.1%
|
25.7%
|
5.5%
|
38.7%
|
||||||
|
Service revenues
|
2,949
|
3,581
|
3,738
|
21.4%
|
22.7%
|
4.4%
|
34.6%
|
||||||
|
OIBDA
|
1,342
|
1,640
|
1,739
|
22.2%
|
22.9%
|
6.0%
|
43.8%
|
||||||
|
OIBDA Margin
|
41.5%
|
40.9%
|
41.1%
|
(0.6) p.p.
|
0.2 p.p.
|
||||||||
|
CapEx
|
548
|
594
|
739
|
8.5%
|
8.3%
|
24.3%
|
75.2%
|
||||||
|
OpCF (OIBDA - CapEx)
|
794
|
1,046
|
1,000
|
31.6%
|
32.9%
|
(4.4)%
|
26.6%
|
||||||
|
(*) Excluding the effect of hyperinflation in Venezuela.
|
|||||||||||||
|
|
|||||||||||||
2013 Results
Revenues
in 2013 stood at 4,228 million euros, posting year-on-year growth of 5.5% in reported terms. Excluding exchange rate differences and the effect of hyperinflation in Venezuela, year-on-year growth is 38.7% after growing 45.5% year-on-year in Venezuela excluding exchange rate differences and the effect of hyperinflation and 7.6% year-on-year in Central America. Thus mobile services revenues grew by 4.4% in reported terms (34.6% excluding exchange rate effects and hyperinflation) boosted by the expansion of mobile data services and the sharp growth in voice traffic. In Venezuela mobile service revenues grew by 4.2% in reported terms compared to 40% excluding exchange rate differences and the effect of hyperinflation in Venezuela, while in Central America mobile service revenues increased by 10.1% year-on-year in 2013.
Data revenues accounted for 29.9% of mobile service revenues and decreased by 6.1% year-on-year in 2013 in reported terms. Stripping out the exchange rate differences and the effect of hyperinflation in Venezuela, year-on-year growth would stand at 32.7% Underpinning this performance was the sharp growth in non-SMS data revenues, which now account for 64% of data revenues (+7 percentage points year-on-year
).
|
2011
|
2012
|
2013
|
% Var LC 11/12
|
% Var LC 12/13
|
|||||
|
Traffic (million minutes)
|
14,529
|
27,536
|
32,304
|
12.9%
|
17.3%
|
||||
|
ARPU (EUR)
|
16.7
|
13.8
|
11.6
|
17.4%
|
19.4%
|
||||
OIBDA
stood at 1,739 million euros in 2013, up 6.0% year-on-year in reported terms (excluding exchange rate differences and the effect of hyperinflation in Venezuela, up 43.8% year-on-year). This increase is due to higher revenues that offset the 4.0% increase in reported costs. Excluding exchange rate differences and the effect of hyperinflation in Venezuela, costs grew by +33.6%, mainly impacted by the widespread price increases that translated into higher expenses paid in dollars for services and equipment purchases due to the negative impact of the devaluation. Thus, the OIBDA margin stood at 41.1% for the year (+1.5 percentage points year-on-year, excluding exchange rate differences and hyperinflation in Venezuela).
2012 Results
In 2012,
revenues
stood at 4,009 million euros, growing 24.1% year-on-year in reported terms. Excluding foreign exchange rate differences and the effect of hyperinflation in Venezuela, the interannual growth is 25.7%. Net of foreign exchange rate differences and hyperinflation, Venezuela and Central America increased by 28.1% and 15.8% respectively. Mobile service revenues were up 21.4% in reported terms. Excluding the foreign exchange rate differences and the effect of the hyperinflation in Venezuela, revenues would have increased 22.7% driven by the larger customer base and the increase in ARPU. In Venezuela mobile service revenues were up 22.0% in reported terms and were up 25.6% net of foreign exchange rate differences and the effect of hyperinflation in Venezuela. In Central America these revenues increased 22.0% year-on-year in reported terms and 14.2% in local currencies.
Data revenues represent 33.2% of total mobile service revenues and grew 35.8% compared to 2011, in reported terms, resulting in an interannual growth of 37.3% excluding foreign exchange rate differences and the effect of hyperinflation in Venezuela.
OIBDA
stood at 1,640 million euros in 2012, up 22.2% in reported terms and up 22.9% excluding the effect of hyperinflation in Venezuela and foreign exchange rate differences. OIBDA was affected by the sale of non-strategic towers in Central America for 4.6 million euros compared to 36.8 million euros in 2011.
CHILE
|
Thousands of accesses
|
2011
|
2012
|
2013
|
% Var 11/12
|
% Var 12/13
|
|||||
|
Fixed telephony accesses (1)
|
1,848.1
|
1,737.9
|
1,654.2
|
(6.0)%
|
(4.8)%
|
|||||
|
Internet and data accesses
|
887.4
|
940.1
|
977.5
|
5.9%
|
4.0%
|
|||||
|
Narrowband
|
5.8
|
5.5
|
5.2
|
(5.2)%
|
(5.5)%
|
|||||
|
Broadband (2)
|
878.1
|
932.0
|
969.9
|
6.1%
|
4.1%
|
|||||
|
Other (3)
|
3.5
|
2.5
|
2.4
|
(27.0)%
|
(6.5)%
|
|||||
|
Mobile accesses
|
9,548.1
|
10,040.1
|
10,490.3
|
5.2%
|
4.5%
|
|||||
|
Pre-Pay
|
6,732.7
|
7,385.0
|
7,806.5
|
9.7%
|
5.7%
|
|||||
|
Contract
|
2,815.4
|
2,655.1
|
2,683.8
|
(5.7)%
|
1.1%
|
|||||
|
Pay TV
|
390.8
|
424.0
|
503.2
|
8.5%
|
18.7%
|
|||||
|
Final Clients Accesses
|
12,674.4
|
13,142.1
|
13,625.2
|
3.7%
|
3.7%
|
|||||
|
Wholesale Accesses
|
5.2
|
4.9
|
5.0
|
(5.9)%
|
2.6%
|
|||||
|
Total Accesses
|
12,679.6
|
13,147.0
|
13,630.2
|
3.7%
|
3.7%
|
|||||
(1) PSTN (including public use telephony) x1; ISDN basis access x1; ISDN primary access; 2/6 access x30. Includes the Group’s accesses for internal use and total fixed wireless accesses.
(2) Includes ADSL, fiber optic, cable modem and broadband circuits.
(3) Remaining retail circuits (broadband).
Telefónica strengthened its leadership position in Chile in 2013 due to its innovative services and the ongoing improvement in the quality of its fixed and mobile network.
On November 15, 2013, Telefónica Chile announced the launch of nationwide LTE services, further underscoring its commitment to the rollout of telecommunications in the country.
In another noteworthy development the Company was awarded one of the three blocks of radioelectric spectrum for LTE auctioned in the 700 MHz band. This will enable a more efficient rollout of the network for the delivery of 4G services, further strengthening the Company’s position.
|
Results
|
||||||||||||||
|
Millions of euros
|
% Var 11/12
|
% Var 12/13
|
||||||||||||
|
Chile
|
2011
|
2012
|
2013
|
€
|
LC
|
€
|
LC
|
|||||||
|
Revenues
|
2,310
|
2,569
|
2,483
|
11.2%
|
3.3%
|
(3.3)%
|
1.6%
|
|||||||
|
Wireless Business
|
1,399
|
1,559
|
1,534
|
11.5%
|
3.6%
|
(1.6)%
|
3.4%
|
|||||||
|
Service revenues
|
1,283
|
1,429
|
1,385
|
11.4%
|
3.5%
|
(3.1)%
|
1.8%
|
|||||||
|
Wireline Business
|
1,037
|
1,113
|
1,049
|
7.3%
|
(0.3)%
|
(5.8)%
|
(1.0)%
|
|||||||
|
OIBDA
|
1,035
|
1,033
|
818
|
(0.2)%
|
(7.3)%
|
(20.8)%
|
(16.8)%
|
|||||||
|
OIBDA Margin
|
44.8%
|
40.2%
|
32.9%
|
(4.6) p.p.
|
– |
(7.3) p.p.
|
– | |||||||
|
CapEx
|
529
|
606
|
488
|
14.6%
|
6.5%
|
(19.5)%
|
(15.4)%
|
|||||||
|
OpCF (OIBDA - CapEx)
|
507
|
427
|
330
|
(15.7)%
|
(21.7)%
|
(22.7)%
|
(18.8)%
|
|||||||
Revenues
stood at 2,483 million euros in 2013, a decline of 3.3%, as compared to 2012 mainly as a result of exchange rate effects. Excluding exchange rate differences, revenues grew 1.6% year-on-year.
|
|
·
|
Mobile revenues fell 1.6% year-on-year to 1,534 million euros. This performance was mainly due to exchange rate effects. Excluding the impact of exchange rate differences, revenues rose by 3.4% year-on-year due to the Company’s innovation and quality strategy, which has caused an increase in high-value customers.
|
|
|
·
|
Revenues from the fixed business stood at 1,049 million euros in 2013, down 5.8% from 2012 (-1.0% in local currency), negatively affected by the exchange rate differences, as well as by the drop in voice and access revenues which fell 14.7% in reported terms (-10.4% in local currency). The decline in revenue was partially offset by broadband and new services revenues, which grew 2.8% in reported terms (+8% excluding exchange rate differences) from broadband and TV accesses as a result of the strategy rolled out to improve quality and maximize customer value. As a result, broadband and new business revenues accounted for 57% of fixed revenues in the year (+5 percentage points year-on-year).
|
|
2011
|
2012
|
2013
|
% Var LC 11/12
|
% Var LC 12/13
|
|||||
|
Traffic (million minutes)
|
12,218
|
13,064
|
13,339
|
6.9%
|
2.1%
|
||||
|
ARPU (EUR)
|
11.6
|
12.0
|
10.9
|
(3.9)%
|
(4.6)%
|
||||
OIBDA
amounted to 818 million euros in 2013, a year-on-year decline of 20.8%, negatively affected by the exchange rate, and a contractual change in the commercial model for selling handsets in Chile, which resulted in higher costs. Excluding exchange rate differences, OIBDA fell 16.8% year-on-year primarily due to the impact of the contractual change in handset sales. Excluding the impact of the contractual change in handset sales, OIBDA would have decrease 1%. Excluding non-strategic tower sales OIBDA would have grown 1.6%. The OIBDA margin stood at 32.9% in the year, a 7.3 p.p. decrease, due to the aforementioned contractual change. Excluding the contractual change in handset sales the decrease was 0.9 p.p.
2012 Results
Revenues
: Mobile revenues rose 3.6% in local currency to 1,559 million euros fuelled by growth in service revenues. Service revenues were 3.5% higher in local currency, with the growth in the customer base making up for the downtrend in ARPU in local currency caused by the drop in usage, mainly among pre-pay customers, in view of greater market competition.
Fixed line revenues remained stable with respect to 2011, amounting to 1,113 million euros, underpinned by broadband and new services revenues (52% of revenues and up 10.9% in local currency), reflecting the growth in Internet, TV, content revenues, data, IT and capacity lease revenues, which offset the 9.9% decrease in voice and access revenues (in local currency).
OIBDA
dropped 7.3% in local currency despite the revenue increase of 3.3% due to higher commercial activity in the mobile business with the start-up of portability, which results in higher growth in supplies, content and interconnection expenses plus the negative effect in other revenues from the sale of towers (32 million euros compared to
50.1 million euros in 2011). In addition, following a contractual change in the handset sales model in Chile, OIBDA is affected by the negative effect of the new accounting treatment applicable to revenues and expenses formerly linked to a mobile handset sales model involving lease without charge that was previously accounted as CapEx (negative impact of 22 million euros, all included in the last quarter of the year).
MÉXICO
|
Thousands of accesses
|
2011
|
2012
|
2013
|
% Var 11/12
|
% Var 12/13
|
||||
|
Mobile accesses
|
19,742.4
|
19,168.0
|
20,332.8
|
(2.9)%
|
6.1%
|
||||
|
Pre-Pay
|
18,149.8
|
17,668.3
|
18,863.2
|
(2.7)%
|
6.8%
|
||||
|
Contract
|
1,592.6
|
1,499.7
|
1,469.7
|
(5.8)%
|
(2.0)%
|
||||
|
Fixed wireless
|
745.3
|
1,158.9
|
1,558.9
|
55.5%
|
34.5%
|
||||
|
Total Accesses
|
20,487.7
|
20,326.9
|
21,891.7
|
(0.8)%
|
7.7%
|
||||
2013 was a key year for the Mexican telecommunications market following the approval in June of the new Telecommunications Law. Details of the changes that the regulatory reform will bring about and the execution of its implementation is expected to be set out in the first half of 2014, initiating a process of structural transformation in the sector.
Meanwhile, the Company’s focus was on the ongoing transformation of its commercial offer aiming to improve its competitive positioning with the launch of the “Movistar Ilimitado” plan during second quarter of the year (plan in the prepaid segment with off-net minute bundles, SMS, data capacity from 50 MB and unlimited on-net calls for top-ups of more than 100 pesos) and the launch of the “Prepago Doble” plan in October, which offers double the balance topped up for all top-ups. Furthermore, in December, the Company further strengthened its commercial offer with the launch of “Plan GigaMove”, a new, more competitive range of data contract plans aimed at high value customers. Depending on the plan chosen, the customer benefits from up to 3 GB of browsing, 1,500 SMS to any company, Spotify Premium, Twitter, Whatsapp, Facebook and unlimited mail. Telefónica also continues to strive to make the most efficient use of its network and in January signed a new deal with the distributor MAZ Tiempo following the agreements inked last September with the mobile virtual network operators Coppel and Virgin. An agreement was also reached in January with NII Holdings whereby Telefónica Mexico will provide Nextel with nationwide voice and data coverage services on its 3G mobile network. This deal provides Telefónica Mexico with an additional lever to strengthen its wholesale services strategy in the country.
|
Results
|
||||||||||||||
|
Millions of euros
|
% Var 11/12
|
% Var 12/13
|
||||||||||||
|
México
|
2011
|
2012
|
2013
|
€
|
LC
|
€
|
LC
|
|||||||
|
Revenues
|
1,557
|
1,596
|
1,580
|
2.5%
|
0.4%
|
(1.0)%
|
(0.8)%
|
|||||||
|
Service revenues
|
1,387
|
1,416
|
1,340
|
2.1%
|
(0.0)%
|
(5.3)%
|
(5.1)%
|
|||||||
|
OIBDA
|
572
|
432
|
266
|
(24.6)%
|
(26.1)%
|
(38.3)%
|
(38.2)%
|
|||||||
|
OIBDA Margin
|
36.7%
|
27.0%
|
16.9%
|
(9.7) p.p.
|
– |
(10.2) p.p.
|
– | |||||||
|
CapEx
|
471
|
427
|
242
|
(9.4)%
|
(11.3)%
|
(43.3)%
|
(43.2)%
|
|||||||
|
OpCF (OIBDA - CapEx)
|
101
|
5
|
24
|
(95.2)%
|
(95.3)%
|
n.s.
|
n.s.
|
|||||||
n.s.: not significant
2013 Results
Revenues
stood at 1,580 million euros in 2013, a decline of 1%, negatively impacted by 0.2% percentage points by exchange rate differences, and posting a decline of 0.8% in local currency terms. The year on year decline is primarily due to the decrease in mobile service revenues (-5.1% in local currency) caused mainly by the reduction in mobile termination rates which had a negative impact on revenue performance amounting to 29 million euros. Excluding this impact, mobile services revenue would have shown a year-on-year decrease of 3.1%. This decrease is mainly due to reduction in SMS prices and the process of replacing SMS with other alternative forms of communication driven by the steady adoption of smartphones, with this reduction partially offset by the growth in non-SMS data revenues (+15.8%).
OIBDA
in 2013 stood at 266 million euros, down 38.3% year-on-year, with an OIBDA margin of 16.9% (-10.2 p.p. year-on-year), affected by the increase in commercial activity over the year. Furthermore, 2012 included the sale of non-strategic towers for 77 million euros, whereas there were no towers sold in 2013.
2012 Results
Revenues
amounted to 1,596 million euros in 2012, for 0.4% growth year-on-year in local currency. Mobile service revenues remained stable compared to 2011 in local currency amounting to 1,416 million euros in 2012 due to an increase in data revenues, despite an estimated negative impact of 64 million euros from the lower interconnection rates approved by the regulatory authorities in the second quarter of 2011. Data revenues climbed 15.0% from 2011 to 2012, despite the 54% reduction in SMS interconnection rates in September 2012. Data revenues account for 33% of mobile service revenues (up 4 p.p. year-on-year). Non-SMS data revenues rose 61.8% year-on-year, accounting for 39% of data revenues (up 11 p.p. compared to 2011).
OIBDA
was 432 million euros in 2012 (down 26.1% year-on-year), for an OIBDA margin of 27.0%, strongly impacted by the sale of non-strategic towers in 2011, which amounted to 240 million euros as compared to 77 million euros of non-strategic tower sales in 2012. Stripping out this effect, OIBDA grew 6.5%, slightly over revenue evolution. It is important to highlight the interconnection rates reduction which negatively impacted OIBDA by 14 million euros. Such rate reduction is more than offset by a higher level of efficiency coming from the Iusacell roaming agreement and higher commercial efficiency.
PERU
|
Thousands of accesses
|
2011
|
2012
|
2013
|
% Var 11/12
|
% Var 12/13
|
||||
|
Fixed telephony accesses (1)
|
2,848.4
|
2,883.4
|
2,801.5
|
1.2%
|
(2.8)%
|
||||
|
Fixed wireless
|
444.6
|
580.3
|
313.5
|
30.5%
|
(46.0)%
|
||||
|
Internet and data accesses
|
1,120.4
|
1,317.6
|
1,437.1
|
17.6%
|
9.1%
|
||||
|
Narrowband
|
9.4
|
8.2
|
5.0
|
(12.8)%
|
(38.7)%
|
||||
|
Broadband (2)
|
1,090.6
|
1,288.3
|
1,411.1
|
18.1%
|
9.5%
|
||||
|
Other (3)
|
20.4
|
21.0
|
21.0
|
3.1%
|
−
|
||||
|
Mobile accesses
|
13,998.3
|
15,196.9
|
15,762.0
|
8.6%
|
3.7%
|
||||
|
Pre-Pay
|
11,079.6
|
11,555.3
|
11,258.7
|
4.3%
|
(2.6)%
|
||||
|
Contract
|
2,918.7
|
3,641.6
|
4,503.3
|
24.8%
|
23.7%
|
||||
|
Pay TV
|
799.0
|
901.6
|
897.1
|
12.8%
|
(0.5)%
|
||||
|
Final Clients Accesses
|
18,766.1
|
20,299.5
|
20,897.6
|
8.2%
|
2.9%
|
||||
|
Wholesale Accesses
|
0.4
|
0.4
|
0.4
|
(8.0)%
|
(8.7)%
|
||||
|
Total Accesses
|
18,766.6
|
20,299.9
|
20,898.0
|
8.2%
|
2.9%
|
||||
(1) PSTN (including public use telephony) x1; ISDN basis access x1; ISDN primary access; 2/6 access x30. Includes the Group’s accesses for internal use and total fixed wireless accesses.
(2) Includes ADSL, fiber optic, cable modem and broadband circuits.
(3) Remaining retail circuits (broadband).
In 2013, Telefónica Perú strengthened its integrated services offer, maintaining a clear focus on achieving further improvements in service quality and on simplifying plans and tariffs that enabled the Company to deliver a solid operating and financial performance.
This commitment to quality resulted in a doubling of the speed of fixed broadband while the Company also fostered the migration of customers to pay TV bundles with HD channels. In the mobile business, the restructuring of the tariff portfolio in favor of voice and data plans continued to drive smartphone adoption.
Also worth highlighting is the Company's commitment to continue expanding telecommunications in the country, with the award in the fourth quarter of 2013 of one of the two blocks of radioelectric spectrum for LTE auctioned on July 22 in the AWS band (2x20 MHz). A 20-year concession contract has been signed (120 million euros). The Company plans to roll out the 4G network to 234 district capitals (around 50% of the population) over the next five years. In keeping with this plan, Telefónica Perú launched commercial 4G services in seven districts of Lima at the end of November. At present, it is the only company in Peru providing this service.
|
Results
|
||||||||||||||
|
Millions of euros
|
% Var 11/12
|
% Var 12/13
|
||||||||||||
|
Peru
|
2011
|
2012
|
2013
|
€
|
LC
|
€
|
LC
|
|||||||
|
Revenues
|
2,030
|
2,400
|
2,454
|
18.2%
|
4.6%
|
2.3%
|
8.1%
|
|||||||
|
Wireless Business
|
1,088
|
1,314
|
1,393
|
20.8%
|
6.9%
|
6.0%
|
12.1%
|
|||||||
|
Service revenues
|
948
|
1,164
|
1,220
|
22.7%
|
8.6%
|
4.8%
|
10.8%
|
|||||||
|
Wireline Business
|
1,069
|
1,226
|
1,239
|
14.7%
|
1.5%
|
1.1%
|
6.9%
|
|||||||
|
OIBDA
|
751
|
909
|
875
|
21.0%
|
7.1%
|
(3.7)%
|
1.8%
|
|||||||
|
OIBDA Margin
|
37.0%
|
37.9%
|
35.6%
|
0.9 p.p.
|
– |
(2.2) p.p.
|
– | |||||||
|
CapEx
|
302
|
378
|
479
|
25.2%
|
10.8%
|
26.8%
|
34.1%
|
|||||||
|
OpCF (OIBDA - CapEx)
|
449
|
531
|
396
|
18.2%
|
4.6%
|
(25.5)%
|
(21.2)%
|
|||||||
2013 Results
Revenues
in 2013 stood at 2,454 million euros, increasing 2.3% year-on-year in reported terms, or 8.1% excluding exchange rate differences, driven both by the growth in the mobile business and in the fixed business. Revenues were adversely impacted by regulatory changes affecting fixed-mobile calls in 2013 and by the mobile termination rate reduction in October 2012 and 2013. Excluding these impacts, revenues would have increased by 10% year-on-year in 2013.
|
|
·
|
Mobile business revenues
amounted to 1,393 million euros, with year-on-year growth of 6%. Excluding exchange rate differences, growth would have been 12.1% year-on-year. Mobile service revenues rose 4.8% in 2013 in reported terms. Stripping out exchange rate differences growth in this item would have been 10.8% year-on-year in 2013, continuing the positive trend despite the negative impact of the abovementioned regulatory changes. Excluding these effects, growth stood at 13.4% year-on-year in 2013.
|
|
|
·
|
Data revenue was the main driver of this performance, advancing 28.4% year-on-year in reported terms. Excluding exchange rate differences year-on-year growth was 35.8%. Data accounts for 22% of service revenues (+4 percentage points year-on-year). Growth in smartphones continued, causing non-SMS data revenues to rise by a solid 64.7% year-on-year in 2013 and they accounted for 81% of mobile data revenues (+14 percentage points year-on-year).
|
|
|
·
|
Revenues from the
fixed business
stood at 1,239 million euros in 2013 and grew 1.1% year-on-year. Excluding exchange rate differences, growth would have been 6.9%, with broadband and new services acting as the main growth drivers, registering a year-on-year increase of 9.3% in reported terms, or 15.5% excluding exchange rate differences, which offset the decline in voice.
|
OIBDA
stood at 875 million euros in 2013, down 3.7% year-on-year in reported terms (excluding exchange rate differences, up 1.8% year-on-year). Excluding exchange rate differences and the sale of non-strategic towers registered in 2012, year-on-year-growth is 4.4%. This is due to the good performance of revenues which offsets higher commercial costs derived from the greater commercial activity aimed at high value customers, higher content costs, the increase in personnel costs related to the profit sharing plan (whereby employees receive a percentage of the company's net profits) and higher tax costs due to the regulatory inclusion of a 1% tax on the TV and BAF businesses' revenues. The OIBDA margin stood at 35.6% in the year (-1.3 percentage points year-on-year).
2012 Results
In 2012,
revenues
amounted to 2,400 million euros, up 4.6% year-on-year in local currency, due to growth in both the mobile and fixed businesses.
Revenues in the mobile business (up 6.9%) were driven by voice and data revenues, with a year-on-year rise of 44.8% despite adverse regulatory impacts which affected fixed-mobile calls (due to a decrease in the regulated retail rate) and the mobile interconnection rate cuts in October 2011 and 2012. On the other hand, handset revenues fall by 4.4% year-on-year. Revenues from the fixed business totaled 1,226 million euros in 2012, up 1.5% on the prior year. As in 2011, broadband and new services revenues were the primary growth drivers, with a year-on-year rise of 12.9%, offsetting a sharp decline in voice revenues.
OIBDA
stood at 909 million euros in 2012 (up 7.1% year-on-year), mainly explained by the good revenue performance, partially offset by higher commercial costs driven by the increased commercial activity relating to higher-value customers, higher taxes related to the canon for the usage of radio electric spectrum and also the personnel expenses increase related to the employee participation of the company results (employees get a percentage of net income of the company). This OIBDA growth is positively affected by the recognition in 2012 of 23 million euros gains from the sale of non-strategic towers, compared to gains of 2 million euros in the fourth quarter of 2011. Finally the OIBDA margin places at 37.9% (up 0.9 p.p. compared to 2011).
COLOMBIA
|
Thousands of accesses
|
2011
|
2012
|
2013
|
% Var 11/12
|
% Var 12/13
|
|||||
|
Fixed telephony accesses (1)
|
1,480.6
|
1,420.4
|
1,447.1
|
(4.1)%
|
1.9%
|
|||||
|
Internet and data accesses
|
620.3
|
714.0
|
862.2
|
15.1%
|
20.8%
|
|||||
|
Narrowband
|
7.9
|
8.5
|
8.5
|
7.5%
|
(0.0)%
|
|||||
|
Broadband (2)
|
612.3
|
705.4
|
853.7
|
15.2%
|
21.0%
|
|||||
|
Mobile accesses
|
11,391.1
|
11,703.6
|
12,121.7
|
2.7%
|
3.6%
|
|||||
|
Pre-Pay
|
8,626.8
|
8,675.2
|
8,818.5
|
0.6%
|
1.7%
|
|||||
|
Contract
|
2,764.2
|
3,028.4
|
3,303.2
|
9.6%
|
9.1%
|
|||||
|
Pay TV
|
255.0
|
284.8
|
347.6
|
11.7%
|
22.1%
|
|||||
|
Final Clients Accesses
|
13,746.9
|
14,122.8
|
14,778.7
|
2.7%
|
4.6%
|
|||||
|
Wholesale Accesses
|
3.3
|
3.3
|
3.3
|
−
|
0.0%
|
|||||
|
Total Accesses
|
13,750.2
|
14,126.1
|
14,782.0
|
2.7%
|
4.6%
|
|||||
(1) PSTN (including public use telephony) x1; ISDN basis access x1; ISDN primary access; 2/6 access x30. Includes the Group’s accesses for internal use and total fixed wireless accesses.
(2) Includes ADSL, fiber optic, cable modem and broadband circuits.
In 2013 Telefónica Colombia maintained the steady commercial and financial improvement seen since June 2012 following the merger between Telefónica Móviles Colombia, S.A. and Colombia Telecomunicaciones, S.A. that strengthened the Company’s position in the country’s telecommunications sector.
It is worth noting that the structural changes implemented by the Colombian regulator (“CRC”) in the first semester of 2013 continued to boost the telecommunications market through the application of asymmetric mobile termination rates between the dominant operator and the rest of the companies (including Telefónica). In order to adapt to the new regulatory backdrop and to progress with its commercial repositioning, the Company focused on higher-value customers in 2013 while strengthening the integrated marketing of services.
The Company also further underlined its commitment to the sector’s development in the fourth quarter by securing 30 MHz of spectrum in the AWS band (2x15 MHz) for the provision of LTE services at the auction on June 26 at a total cost of 109 million euros. In December it launched LTE services commercially, in the five most important cities in the country.
Telefónica Colombia managed a total of 14.8 million accesses at the end of December 2013, for year-on-year growth of 5%.
|
Millions of euros
|
% Var 11/12
|
% Var 12/13
|
||||||||||||
|
Colombia
|
2011
|
2012
|
2013
|
€
|
LC
|
€
|
LC
|
|||||||
|
Revenues
|
1,561
|
1,765
|
1,705
|
13.0%
|
1.6%
|
(3.4)%
|
3.7%
|
|||||||
|
Wireless Business
|
906
|
1,069
|
1,052
|
18.1%
|
6.1%
|
(1.6)%
|
5.7%
|
|||||||
|
Service revenues
|
841
|
994
|
969
|
18.3%
|
6.3%
|
(2.5)%
|
4.6%
|
|||||||
|
Wireline Business
|
655
|
695
|
652
|
6.1%
|
(4.7)%
|
(6.2)%
|
0.7%
|
|||||||
|
OIBDA
|
540
|
607
|
580
|
12.4%
|
1.0%
|
(4.6)%
|
2.5%
|
|||||||
|
OIBDA Margin
|
34.6%
|
34.4%
|
34.0%
|
(0.2) p.p.
|
−
|
(0.4) p.p.
|
−
|
|||||||
|
CapEx
|
405
|
352
|
457
|
(13.2)%
|
(22.0)%
|
29.9%
|
39.5%
|
|||||||
|
OpCF (OIBDA - CapEx)
|
135
|
256
|
123
|
89.2%
|
70.0%
|
(52.0)%
|
(48.5)%
|
|||||||
2013 Results
Revenues
in 2013 totaled 1,705 million euros, down 3.4% year-on-year, in large part due to exchange rate differences. Excluding exchange rate differences, revenues would have increased 3.7% year-on-year; supported by the better performance of the mobile and fixed business, and despite the impact of the reduction in mobile termination rates (excluding this effect, revenues would increase 5.2% year-on-year in 2013 in local currency).
|
|
·
|
Mobile revenues
were 1,052 million euros down 1.6% in reported terms and up 5.7% year-on-year excluding foreign exchange rate differences. Excluding the impact of the reduction in mobile termination rates, revenues would have grown by 7.1% year-on-year in local currency,
as a consequence of the higher mobile ARPU, rising 5.7% in local currency; and the higher customer base, reaching 12.1 million customers, up 4% year on year.
|
|
|
·
|
Fixed revenues
totaled 652 million euros, down 6.2% in reported terms and up 0.7% year-on-year in local currency, leveraged on the good performance of fixed broad band and Pay TV as a result of the higher customer base (up 21% and 22% year-on-year, respectively).
|
OIBDA
stood at 580 million euros in 2013, down 4.6% year-on-year in reported terms. Excluding exchange rate effects, OIBDA grew 2.5% year-on-year, reflecting the higher commercial activity, and partly offset by the benefits from the merger of the fixed and mobile units. Note that the sale of non-strategic towers for two million euros was booked in 2012.
2012 Results
Revenues
totaled 1,765 million euros in 2012 (year-on-year growth of 1.6% in local currency), due to the strong performance of the mobile business, despite lower ARPU and the reduction in mobile termination rates. The fixed business reported revenues of 695 million euros, down 4.7% in local currency due to a lower number of accesses, the increase of competition in an already highly competitive environment and the reduction in termination rates.
OIBDA
was 607 million euros at the 2012 year end, up 1.0% in local currency compared to the prior year as a result of higher revenues (up 1.6% year-on-year) and operating expenses decreasing 2.2% year-on-year, due to the efficiency measures applied by the business operator in Colombia, which were mainly reflected in lower personnel and subcontract expenses. Supply costs also fell year-on-year due to the reduction in termination rates. These were offset by the year-on-year comparison affected by recognition of gains on the sale of non-strategic towers of 2 million euros in 2012 and 25 million euros in 2011.
TELEFÓNICA EUROPE
The below table shows the evolution of accesses in Telefónica Europe over the past three years:
|
Thousands of accesses
|
2011
|
2012
|
2013
|
%Var 11/12
|
%Var 12/13
|
|||||
|
Fixed telephony accesses (1)(2)
|
16,158.5
|
15,849.3
|
14,812.2
|
(1.9)%
|
(6.5)%
|
|||||
|
Internet and data accesses
|
10,248.3
|
10,065.4
|
9,449.7
|
(1.8)%
|
(6.1)%
|
|||||
|
Narrowband
|
519.8
|
444.1
|
385.3
|
(14.6)%
|
(13.2)%
|
|||||
|
Broadband (3)
|
9,680.4
|
9,576.2
|
9,023.6
|
(1.1)%
|
(5.8)%
|
|||||
|
Other (4)
|
48.2
|
45.1
|
40.8
|
(6.5)%
|
(9.4)%
|
|||||
|
Mobile accesses
|
72,450.7
|
70,751.5
|
70,210.2
|
(2.3)%
|
(0.8)%
|
|||||
|
Prepay
|
31,159.7
|
28,680.4
|
27,480.9
|
(8.0)%
|
(4.2)%
|
|||||
|
Contract (5)
|
41,291.0
|
42,071.1
|
42,729.2
|
1.9%
|
1.6%
|
|||||
|
Pay TV
|
1,052.2
|
909.3
|
828.6
|
(13.6)%
|
(8.9)%
|
|||||
|
Final Clients Accesses
|
99,909.7
|
97,575.5
|
95,300.7
|
(2.3)%
|
(2.3)%
|
|||||
|
Wholesale Accesses
|
5,245.1
|
5,684.3
|
6,317.0
|
8.4%
|
11.1%
|
|||||
|
Total Accesses
|
105,154.8
|
103,259.8
|
101,617.7
|
(1.8)%
|
(1.6)%
|
|||||
Note: Mobile accesses of Telefónica Spain include since 2013 accesses of Tuenti and in 2012 this same criteria has been used.
(1) Basic Fix Line (including Public Use Telephony) x1, RDSI primary access, Digital Accesses 2/6x30. Includes internal use, VOIP and Naked ADSL
.
(2) During the second quarter of 2013, 209 thousand accesses were derecognized due to the asset sale of the Fixed Business in UK.
(3) During the second quarter of 2013, 511 thousand accesses were derecognized due to the asset sale of the Fixed Business in UK.
(4) Other non-broadband retail circuits.
(5) During the first quarter of 2013, 114 thousand inactive accesses were derecognized in the Czech Republic.
The below table shows the evolution of Telefónica’s estimated mobile market and ADSL share over the past three years:
|
Mobile Market Share (1)
|
|||||
|
Telefónica Europe
|
2011
|
2012
|
2013
|
||
|
Spain
|
39.6%
|
36.2%
|
33.9%
|
||
|
United Kingdom
|
26.6%
|
26.6%
|
26.5%
|
||
|
Germany
|
16.1%
|
16.7%
|
16.9%
|
||
|
Czech Republic
|
38.0%
|
38.6%
|
38.7%
|
||
|
Ireland
|
33.2%
|
33.0%
|
31.4%
|
||
|
Slovakia
|
18.3%
|
21.1%
|
23.7%
|
||
|
ADSL Market Share (1)
|
|||||
|
2011
|
2012
|
2013
|
|||
|
Spain
|
49.7%
|
48.8%
|
47.4%
|
||
|
(1) Internal estimations.
|
|||||
During 2013, Telefónica Europe's portfolio was restructured through the sale of operations in the Czech Republic, which closed in January 2014 after obtaining regulatory approval, and Ireland, pending regulatory approval, and with the announcement of the acquisition of E-Plus by Telefónica Deutschland.
Telefónica Europe comprised, at the end of 2013, the operations in Spain, United Kingdom, Germany, Czech Republic, Slovakia and Ireland.
In 2013, Telefónica Europe undertook a transformation strategy towards a more efficient business model, within a very dynamic and competitive market environment. Against this backdrop, the Company has worked to enhance its
competitiveness and accelerate its commercial activities, as well as improve efficiency (reflected in its improved OIBDA margin) and profitability, due to its on-going efforts to simplify and reduce costs.
2013 was a key year in the updating of Telefónica Europe's commercial offer, with the launch of simple and innovative tariffs, focused on the capture and growth of data both in the fixed (fiber) and mobile (4G) businesses. In this respect, the strengthening of “Movistar Fusión” as a driver of recovery in Spain, the commitment to “Refresh” to further streamline packages and to increase the dynamism of distribution channels in the United Kingdom, and the boost given by the “O2 Blue All-in” tariffs in Germany, all stand out as the basis of the growth in mobile data.
The new “O2 Refresh” tariff was launched in April and represents a unique commercial focus, offering an innovative value proposal to customers. This tariff aims to strengthen our market positioning, driving forward our strategy focused on data, while eliminating subsidies and improving the mix of distribution channels and offering our customers more flexibility "to change telephones with the same frequency that telephones change". The “O2 Blue All-in” tariffs in Germany are tariffs focused on mobile data.
The greater take up of 4G services in the United Kingdom and Germany, and the acceleration in the roll out of fiber optic and Pay TV in Spain will be the main pillars of expected growth in 2014.
Total accesses stood at 101.6 million at the end of December (-1.6% year-on-year) affected by asset disposals in Telefónica UK's fixed consumer business on May 1, 2013 (720 thousand accesses) and the disconnection of 114 thousand accesses of inactive mobile contract customers in the first quarter of 2013 in the Czech Republic.
Main 2013 trends in accesses in the mobile business
|
|
·
|
Mobile accesses totaled 70.2 million at year end, a decline of 0.8% year-on-year, with the contract segment continuing to increase its weight over the reduced total (61% of the base; +1 percentage points as compared to 2012).
|
|
|
·
|
Good commercial momentum with strong growth in mobile contract customers with a net gain in 2013 of 772 thousand accesses (excluding the disconnection of inactive customers in the Czech Republic). Total net mobile losses in 2013, excluding those disconnections in the Czech Republic, stood at 427 thousand accesses due to the loss of prepay customers.
|
|
|
·
|
Mobile broadband accesses continued on a very positive trajectory and totaled 29.2 million at the end of 2013 (+14.6% year-on-year growth) driven by the growing demand for data and the strong rise in the adoption of smartphones (42% penetration in terms of mobile internet data tariffs over total mobile customer base, at year-end; +7 percentage points, year-on-year).
|
Main 2013 trends in accesses in fixed business
|
|
·
|
Retail fixed broadband accesses stood at 9.0 million (-5.8% year-on-year) at year end, primarily impacted by the sale of the fixed business's residential assets in the UK (-511 thousand accesses). However, it should be highlighted that in 2013 an improvement was seen in net adds for the fixed broadband segment especially in the last part of the year, driven by strong growth in fiber optic in Spain.
|
|
|
·
|
Fixed telephony accesses fell by 6.5%, year-on-year, to 14.8 million at year end, affected by competitive pressures in the market, and additionally, by asset disposals in Telefónica UK's fixed consumer business in the second quarter (-209 thousand accesses).
|
|
Millions of euros
|
Var 11/12
|
Var 12/13
|
||||||||||||
|
Telefónica Europe
|
2011
|
2012
|
2013
|
Reported
|
Ex fx
|
Reported
|
Ex fx
|
|||||||
|
Revenues
|
32,074
|
30,006
|
26,840
|
(6.4)%
|
(7.8)%
|
(10.6)%
|
(9.3)%
|
|||||||
|
OIBDA
|
9,262
|
10,228
|
9,917
|
10.4%
|
9.5%
|
(3.0)%
|
(2.1)%
|
|||||||
|
OIBDA Margin
|
28.9%
|
34.1%
|
36.9%
|
5.2 p.p.
|
-
|
2.9 p.p.
|
-
|
|||||||
|
Depreciation and amortization
|
(5,081)
|
(5,014)
|
(4,706)
|
(1.3)%
|
(2.5)%
|
(6.2)%
|
(4.8)%
|
|||||||
|
Operating Income
|
4,181
|
5,214
|
5,211
|
24.7%
|
23.9%
|
(0.0%)
|
0.5%
|
|||||||
Note:
- Since January 1, 2013 Tuenti is included under the consolidation perimeter of Telefónica Spain. This company had been previously included as “Other companies and eliminations” in the Telefónica Group. The net results of T.Spain, T.Europe and “Other companies and eliminations” in the Telefónica Group have been modified accordingly for 2011 and 2012. The total consolidated net results of the Group remain unchanged as the indicated movement is an intercompany reclassification.
As of May 1,
2013
, Telefónica Europe has excluded the financial results of Telefónica UK's fixed consumer business.
2013 Results
Telefónica Europe represented 47% of the Group’s revenues and 52% of its OIBDA in 2013. Telefónica Europe's revenues fell 10.6% year-on-year and contributed -4.5 percentage points to the year-on-year performance of the Group’s revenues, excluding the impact from exchange rate differences, mainly due to the decline in Telefónica Spain’s revenues, which contributed -3.3 percentage points to the Group’s overall decline.
Telefónica Europe's
revenues
in 2013 totaled 26,840 million euros and fell 10.6% year-on-year in reported terms, and fell 9.3% excluding the impact of exchange rate differences. In addition, excluding the change to the consolidation perimeter, the decline would have been 8.6%. The year-on-year decline in revenues is explained by the regulatory impact of the decrease in mobile termination and roaming rates, as well as by the pressure on ARPU, and in accesses, especially in Spain due to the competitive environment, new tariffs launched and customers optimizing their usage.
Stripping out the impact of regulation (cut to mobile termination and roaming rates), foreign exchange rate differences and changes in the scope of consolidation, revenues would have declined 6.4% year-on-year.
Mobile data revenues accounted for 45% of all mobile service revenues in 2013 (+4 percentage points versus. 2012). Non-SMS data revenues were up 7.3% year-on-year in reported terms, driven by the rollout of generalized mobile data tariffs in the customer base. As a result, non-SMS data revenues represent 64% of total data revenues at year end 2013 (+6 percentage points, year-on-year).
Total expenses
which include supplies, personnel expenses and other expenses (mainly subcontract expenses and others) amounted to 17,799 million euros in 2013, 13.2% less than in 2012 in reported terms, -11.8% excluding exchange rate differences and the decline reflects the introduction of various efficiency programs associated with resource optimization and the simplification of the operating model. Stripping out: changes to the scope of consolidation the variance would be +1.2 p.p. higher and the value adjustments to the Czech Republic and Ireland businesses, the variance would be +1.6 p.p. higher, so that the year-on-year decline in operating expenses would be 9.3%. The breakdown by components is as follows:
|
|
·
|
Supplies
declined 14.4% year-on-year, in reported terms (-12.6% excluding exchange rate differences) to 8,413 million euros, mainly due to lower termination costs and, to a lesser extent, the Company’s new commercial strategy of eliminating subsidies in Spain;
|
|
|
·
|
Personnel expenses
amounted to 3,372 million euros reduced by 4.0% versus 2012 (-3.1% excluding exchange rate differences), as a result of the savings obtained from the workforce restructuring programs in Spain, the Czech Republic and the UK. Restructuring expenses of 62 million euros were recorded in 2013 (United Kingdom: 48 million euros and Czech Republic: 14 million euros) versus 16 million euros in 2012 (Czech Republic: 9 million euros and Ireland: 7 million euros); and
|
|
|
·
|
Other expenses
amounted to 6,014 million euros, reduced by 16.0% versus 2012 (-14.9% excluding exchange rate differences) due to lower commercial costs and the savings in IT and network costs. Stripping out changes to the scope of consolidation (+0.2 p.p.) and the value adjustments and the capital losses from the sale of the Czech Republic and Ireland businesses in 2013 and 2012 (+4.7 p.p.), the year-on-year decline in costs would be -10.8%.
|
Telefónica Europe's
OIBDA
stood at 9,917 million euros in 2013, down 3.0% year-on-year in reported terms (excluding exchange rate differences, -2.1%). The performance of OIBDA in 2013 was mainly affected by:
|
|
·
|
the higher amount of non-strategic towers sold in Spain in 2013 compared to 2012 (+0.1 p.p.); and
|
|
|
·
|
the value adjustments derived from the capital losses from the sale of the Czech Republic and Ireland businesses in 2013 and the value adjustment of Telefónica Ireland in 2012 (+3.3 p.p.).
|
Excluding these impacts and exchange rates differences, the decline in OIBDA would have been 5.2%, impacted by the pressure on revenues, especially in Spain (that includes the impact of lower interconnection prices) partially offset by the cost savings derived from the efficiency initiatives implemented by the operations.
2012 Results
Telefónica Europe represents 48% of the Group’s 2012 revenues and OIBDA. The segment revenues decreased by 6.5% in 2012, contributing -4.0 p.p. to the year-on-year variance in the Group’s revenues, excluding foreign exchange rate differences, primarily due to lower revenues in Telefónica Spain (contributing -3.7 p.p.). In addition, at 2012 year end, the Group recorded a 527 million euros write-down in the value of its stake in Telefónica Ireland, reducing Telefónica Europe’s OIBDA and in 2011, and the Group recognized personnel restructuring expenses of 2,591 million euros, reducing Telefónica Spain’s OIBDA.
Telefónica Europe posted
revenues
of 30,006 million euros in 2012, down 6.4% on the 2011 figure (down 7.8% excluding exchange rate differences). The year-on-year decrease in Telefónica Europe's revenues is primarily due to revenue trends in Telefónica Spain, which dropped 13.2% from 2011, to 14,996 million euros in 2012. This reduction in revenues mainly reflects lower accesses and ARPU in the different services, all within an adverse and highly-competitive macroeconomic environment.
|
|
·
|
At Telefónica Spain,
revenues in the fixed line business
decreased by 10.2%. This reduction was primarily due to lower revenues from traditional accesses (caused by the loss of accesses), the 16.7% decrease in voice services revenues (affected by the growing weight of flat-rate plans and traffic packages) and the 13.8% drop in retail broadband revenues (12.2% year-on-year decrease in broadband ARPU, affected by customer migration to new rates).
Revenues from the mobile business
fell 16.6% from 2011. This reduction reflects the 16.8% drop in mobile service revenues (chiefly pressured by trends in ARPU and the reduction in interconnection rates effective as from April and October, and in roaming rates, effective as from July). Telefónica Spain accounted for 50% of Europe’s revenue.
|
|
|
·
|
In the rest of Telefónica Europe’s operations, revenues rose 1% year-on-year, driven by growth in revenues in Germany, but undermined by reduction to interconnection and roaming rates.
|
|
|
·
|
The mobile strategy, based on boosting mobile broadband penetration and limited use data rates, was the main factor to promote revenue growth
.
As a result of this strategy, total data revenue increased 5.8% in 2012 and represented 41% of mobile service revenue (up 5 p.p. compared to 2011). The growth in data revenue is primarily due to the 18.6% increase in no SMS PAP revenues, which represented 58% of total data revenues in 2012.
|
Total expenses
at Telefónica Europe amounted to 20,465 million euros, down 12.7% on the previous year, affected by the recognition in 2011 of 2,591 million euros of restructuring expenses in Telefónica Spain, which affected the variance in personnel expenses. This impact represented 11 p.p. of the year-on-year decline. Excluding this effect, operating expenses would have fallen 1.8% year-on-year.
|
|
·
|
Supplies expenses
decreased 4.6% year-on-year in 2012 to 9,821 million euros, mainly driven by lower interconnection costs, and, to a lesser extent, lower supplies, due to a new commercial strategy of subsidies in Spain.
|
|
|
·
|
Personnel expenses
amounted to 3,497 million euros in the year, a decline of 45.4% compared with 2011, mainly due to the provision included in Spain mentioned above. Excluding this impact personnel expenses decreased by 8.9% year-on-year in 2012 mainly on the back of the increase of company savings related to the restructuring plan in Spain.
|
|
|
·
|
Other expenses
were 7,147 million euros and increased by 6.1% as a consequence of including the 527 million euros write-down in the value of Telefónica’s stake in Telefónica Ireland, due to the slowdown in activities in the prevailing market uncertainty. Excluding this impact, other expenses would have dropped by -1.8% reflecting the higher commercial efficiency delivered by the leaner business model.
|
OIBDA
in Telefónica Europe stood at 10,228 million euros in 2012, up 10.4% year-on-year (9.5% when stripping out exchange rate differences). The 2012 figure includes the 527 million euros write-down of the Group’s stake in Telefónica Ireland, while 2011 OIBDA reflects workforce restructuring expenses in Telefónica Spain in the amount of 2,591 million euros. OIBDA performance is also affected by pressures on revenues (including the impact of lower regulatory interconnection rates), partially offset by costs savings generated from the efficiency initiatives implemented throughout the Group.
TELEFÓNICA SPAIN
|
Thousands of accesses
|
2011
|
2012
|
2013
|
%Var 11/12
|
%Var 12/13
|
|||||
|
Fixed telephony accesses (1)
|
12,305.4
|
11,723.0
|
11,089.8
|
(4.7)%
|
(5.4)%
|
|||||
|
Naked ADSL
|
34.4
|
25.0
|
22.8
|
(27.3)%
|
(9.1)%
|
|||||
|
Internet and data accesses
|
5,710.9
|
5,779.3
|
5,899.0
|
1.2%
|
2.1%
|
|||||
|
Narrowband
|
84.4
|
54.0
|
38.5
|
(36.0)%
|
(28.7)%
|
|||||
|
Broadband (2)
|
5,608.6
|
5,709.3
|
5,846.8
|
1.8%
|
2.4%
|
|||||
|
Other (3)
|
17.9
|
16.0
|
13.7
|
(10.5)%
|
(14.2)%
|
|||||
|
Mobile accesses
|
24,174.3
|
20,608.7
|
19,002.1
|
(14.7)%
|
(7.8)%
|
|||||
|
Prepay
|
7,359.4
|
5,180.5
|
4,262.7
|
(29.6)%
|
(17.7)%
|
|||||
|
Contract
|
16,814.9
|
15,428.2
|
14,739.3
|
(8.2)%
|
(4.5)%
|
|||||
|
Pay TV
|
833.2
|
710.7
|
672.7
|
(14.7)%
|
(5.4)%
|
|||||
|
WLR (4)
|
440.6
|
481.2
|
525.8
|
9.2%
|
9.3%
|
|||||
|
Unbundled loops
|
2,881.1
|
3,262.0
|
3,787.1
|
13.2%
|
16.1%
|
|||||
|
Shared ULL
|
205.0
|
183.5
|
130.6
|
(10.5)%
|
(28.9)%
|
|||||
|
Full ULL (5)
|
2,676.1
|
3,078.5
|
3,656.5
|
15.0%
|
18.8%
|
|||||
|
Wholesale ADSL
|
709.6
|
652.3
|
676.8
|
(8.1)%
|
3.8%
|
|||||
|
Other (6)
|
0.6
|
0.5
|
0.4
|
(20.8)%
|
(23.9)%
|
|||||
|
Final Clients Accesses
|
43,023.8
|
38,821.7
|
36,663.6
|
(9.8)%
|
(5.6)%
|
|||||
|
Wholesale Accesses
|
4,031.9
|
4,396.0
|
4,990.1
|
9.0%
|
13.5%
|
|||||
|
Total Accesses
|
47,055.7
|
43,217.8
|
41,653.6
|
(8.2)%
|
(3.6)%
|
|||||
Note:
- Mobile accesses of Telefónica Spain include since 2013 accesses of Tuenti and in 2012 this same criteria has been used to reflect the figures.
(1) Basic Fix Line (including Public Use Telephony) x1, RDSI primary access, Digital Accesses 2/6x30. Includes internal use, VOIP and Naked ADSL.
(2) ADSL, satellite, fiber optic and broadband circuits.
(3) Leases of circuits.
(4) Wholesale line rental.
(5) Includes naked shared loops.
(6) Wholesale circuits.
Telefónica Spain's 2013 results confirm the slowing of the decline of its business, underpinned by the benefits of the deep transformation process undertaken by the Company, allowing it to strengthen its competitive positioning, maintain its market leadership and improve its financial and commercial performance. Revenues stabilized the pace of year-on-year decline along the year and profitability remained high, amid a very competitive backdrop in which convergence continues to lead market dynamics.
In 2013, the boost in commercial activity must be highlighted, especially in fiber and, during the last period of the year, in pay TV, reflecting the success of the revamped portfolio, which increased value for the customer, improving its offer quality, and of the Christmas campaign to attract new customers with “Movistar TV” (from December 1 to January 31 all customers subscribing to “Movistar Fusión” or an additional mobile line enjoyed the complete “Movistar TV” package free of charge until May 2014).
This improvement in commercial activity due to Christmas campaign has been also reflected in the mobile contract
segment
, mainly in the portability figures, which have shown a positive trend during the last part of the year, despite the strong competition and the strategy of subsidies elimination followed by the company.
At the end of 2013, “Movistar Fusión” reached 2.9 million customers, and more than one million additional mobile lines,
which
accounted in the consumer segment for 52% of fixed broadband and 45% of mobile contract customers). Noteworthy once again was the steady improvement in the percentage of new customers and/or customers taking new services, reflecting the positive impact of the convergent offer on the capture of new services. On the other hand, it is worth to mention that “Movistar Fusión” customers’ churn is also lower than the average for the rest of services.
Fiber customers reach 594 thousand as of December 31, 2013, almost doubling those of 2012 (17% of passed homes, amounting to 3.5 million homes). The Company's strategic focus on the acceleration of fiber rollout as the key lever to drive differentiation and growth in 2014, is reflected in its target of achieving 7.1 million households passed by the end of the year. Fiber customers have 1.5 times higher ARPU than ADSL customers and a higher level of customer satisfaction and therefore have a lower churn rate (0.5 times).
|
Millions of euros
|
|||||||||
|
Telefónica Spain
|
2011
|
2012
|
2013
|
% Var 11/12
|
% Var 12/13
|
||||
|
Revenues
|
17,277
|
14,996
|
12,959
|
(13.2)%
|
(13.6)%
|
||||
|
Wireless business
|
7,750
|
6,464
|
5,121
|
(16.6)%
|
(20.8)%
|
||||
|
Service revenues
|
6,550
|
5,453
|
4,580
|
(16.8)%
|
(16.0)%
|
||||
|
Wireline business
|
10,624
|
9,541
|
8,861
|
(10.2)%
|
(7.1)%
|
||||
|
OIBDA
|
5,079
|
6,815
|
6,340
|
34.2%
|
(7.0)%
|
||||
|
OIBDA Margin
|
29.4%
|
45.4%
|
48.9%
|
16.0 p.p.
|
3.5 p.p.
|
||||
|
CapEx
|
2,912
|
1,692
|
1,529
|
(41.9)%
|
(9.6)%
|
||||
|
OpCF (OIBDA - CapEx)
|
2,167
|
5,123
|
4,811
|
136.4%
|
(6.1)%
|
||||
Note:
Since January 1, 2013 Tuenti is included under the consolidation perimeter of Telefónica Spain. This company had been previously included as “Other companies and eliminations” in the Telefónica Group. The net results of T.Spain, T.Europe and “Other companies and eliminations” in the Telefónica Group have been modified accordingly for 2011 and 2012. The total consolidated net results of the Group remain unchanged as the indicated movement is an intercompany reclassification.
2013 Results
In 2013
revenues
stood at 12,959 million euros (-13.6% year-on-year), partly impacted by the sharp drop in revenues from handset sales (-46.4% year-on-year) due to the removal of subsidies in March 2012.
|
|
·
|
Excluding handset sales, revenues in 2013 amounted to 12,417 million euros (-11.2%). Excluding the impact of regulation (interconnection and roaming), these revenues fell 9.6% year-on-year in the year.
|
|
|
·
|
Revenues from the fixed business
fell 7.1% year-on-year in 2013, due to lower access and voice revenues, primarily driven by the loss of accesses, and lower broadband and new service revenues, reflecting the negative performance of broadband ARPU, and affected by the migration of customers to the new tariffs.
|
|
|
·
|
Mobile revenues
fell by 20.8% year-on-year in 2013. Mobile service revenue declined by 16.0% year-on-year in 2013 explained by ARPU decline.
|
|
|
·
|
Telefónica Spain revenue reduction is mainly due to ARPU reductions across services reflecting lower prices of the renewed portfolio and lower customers consumption, and also, as a consequence of declines in accesses (-4% year-on-year), as a consequence of the high competitive pressure in the market.
|
2013
ARPU
decreased 14.3% year-on-year, impacted by the 60% cut in the mobile termination rate since July 1, additional to the cuts implemented in April 2013 (-13%) and October 2012 (-8%). The drop in ARPU also reflects lower prices of the new tariff portfolio and lower customer usage. However, it is worth noting that the ARPU of individual services is less representative following the launch of “Movistar Fusión”, as it is affected by the defined allocation of convergent product revenues between the fixed and mobile businesses.
|
2011
|
2012
|
2013
|
%Var 11/12
|
%Var 12/13
|
|||||
|
Traffic (million minutes)
|
39,909
|
36,382
|
34,428
|
(8.8)%
|
(5.4)%
|
||||
|
ARPU (EUR)
|
22.9
|
20.6
|
17.7
|
(9.8)%
|
(14.3)%
|
||||
|
Prepay
|
9.3
|
8.8
|
7.3
|
(5.1)%
|
(17.8)%
|
||||
|
Contract
|
29.1
|
24.7
|
21.0
|
(15.2)%
|
(15.0)%
|
||||
|
Data ARPU
|
6.0
|
6.5
|
6.8
|
8.0%
|
4.4%
|
||||
|
% rev. non-SMS over data revenues
|
74.6%
|
85.2%
|
92.1%
|
10.6 p.p.
|
7.0 p.p.
|
OIBDA
stood at 6,340 million euros in 2013, showing a reported year-on-year decline of 7.0%. Excluding the sale of non-strategic tower for 60 million euros in 2012 and 70 million euros in 2013, the OIBDA decreased by 7.2%. The OIBDA decrease is explained by the revenue decrease, partially offset by costs reduction, especially the continued reduction in commercial costs after the handset subsidy removal policy, and other savings arising from several
efficiency
programs (such as simplification of processes, distribution channel and call centers redefinition, internalization of activities, savings from the restructuring personnel plan and temporary cancelation of the corporate contribution to pension plans).
2012 Results
In 2012,
revenues
totaled 14,996 million euros (down 13.2% year-on-year), primarily reflecting lower accesses and the lower ARPU across different services in a highly-competitive and adverse macroeconomic environment.
|
|
·
|
Revenues in the fixed line
business
amounted to 9,541 million euros in 2012, a year-on-year decrease of 10.2%. This reduction was primarily due to lower revenues from traditional accesses (down 9.3% caused by the loss of accesses), a 16.7% decrease in voice services revenues (affected by the growing weight of flat-rate plans and traffic packages) and a 13.8% drop in retail broadband revenues (a 12.2% year-on-year decrease in effective broadband ARPU, affected by customer migration to new rates).
|
|
|
·
|
Revenues from the mobile business
totaled 6,464 million euros in 2012, down 16.6% on the 2011 figure. This reduction reflects a 16.8% drop in mobile service revenues (due to negative trends in ARPU and the reduction in interconnection rates effective as from April and October, and in roaming rates, effective as from July).
|
|
|
·
|
Mobile data revenues
were down 4.6% year-on-year, despite the steady growth in non-SMS revenues (up 8.2% from 2011), accounting for 85% of total data revenues (up 10.6 p.p. year-on-year). The trends in these revenues primarily reflect the lower SMS revenues, the higher weight of fixed-rate data plans, driven in the last quarter by the "Fusion" product, and by the migration of customers with USB modems toward more affordable multi-device options. In addition, data revenues continue to be affected by the shift in the Premium SMS sales strategy in November 2011 (70% year-on-year decrease in Premium SMS revenues in 2012).
|
|
|
·
|
Mobile traffic dropped 9% from 2011 to 2012, as customers reduced their usage in line with the general contraction of household spending in an adverse macroeconomic environment.
|
Total ARPU
for 2012 was down 9.8% year-on-year.
The 2011 ARPU figure is not comparable to 2012 ARPU, as in 2012 it is affected by the disconnection of 2.0 million inactive mobile accesses in the first quarter of 2012. Therefore, in comparable terms, the year on year decrease would have been 14.9%, due to lower usage by customers, lower prices in the new rates portfolio, and reduction in interconnection rates. Voice ARPU decreased 20.0% from 2011 to 2012, while data ARPU fell 0.4%, the latter accounting for 31% of total ARPU. The growth in connectivity revenues, included in data ARPU was not sufficient to completely offset the lower SMS revenues.
OIBDA
totaled 6,815 million euros in 2012, compared to 5,079 million euros in the prior year, a 34.2% increase. OIBDA in 2011 was affected by the provision for personnel restructuring made in the third quarter of 2011 (2,591 million euros). Excluding such impact, the year-on-year decrease would be 11.1% due to the year-on-year decrease in revenues, partially offset by the sharp reduction of commercial expenses through the new model eliminating subsidies and also personnel expenses savings as a result of the workforce reduction plan approved in 2011.
UK
|
Thousands of accesses
|
2011
|
2012
|
2013
|
% Var 11/12
|
% Var 12/13
|
||||
|
Fixed telephony accesses (1) (2)
|
216.1
|
377.4
|
208.2
|
74.6%
|
(44.8)%
|
||||
|
Internet and data accesses
|
620.3
|
560.1
|
14.8
|
(9.7)%
|
(97.4)%
|
||||
|
Broadband (3)
|
620.3
|
560.1
|
14.8
|
(9.7)%
|
(97.4)%
|
||||
|
Mobile accesses
|
22,167.5
|
22,864.2
|
23,649.0
|
3.1%
|
3.4%
|
||||
|
Pre-Pay
|
11,227.3
|
10,962.9
|
10,764.7
|
(2.4)%
|
(1.8)%
|
||||
|
Contract
|
10,940.3
|
11,901.3
|
12,884.3
|
8.8%
|
8.3%
|
||||
|
Final Clients Accesses
|
23,003.9
|
23,801.7
|
23,872.0
|
3.5%
|
0.3%
|
||||
|
Wholesale Accesses
|
26.7
|
40.5
|
31.6
|
51.5%
|
(22.1)%
|
||||
|
Total Accesses
|
23,030.7
|
23,842.2
|
23,903.6
|
3.5%
|
0.3%
|
(1) Basic Fix Line (including Public Use Telephony) x1, RDSI primary access, Digital Accesses 2/6x30. Includes internal use, VOIP and Naked ADSL.
(2) In the second quarter of 2013, 209 thousand accesses disconnected after sale of fixed assets in UK.
(3) In the second quarter of 2013, 511 thousand accesses disconnected after sale of fixed assets in UK.
In 2013, Telefónica UK‘s results were positive. Contract net additions maintained a solid momentum driven by the success of the “Refresh” proposition enabling Telefónica UK to differentiate itself in a highly competitive market. The new “O2 Refresh” tariff launched on April 16 represents a unique commercial focus, offering an innovative value proposal to customers. This tariff aims to strengthen our market positioning, driving forward our strategy focused on data, while eliminating subsidies and improving the mix of distribution channels and offering our customers more flexibility "to change telephones with the same frequency that telephones change". The “Refresh” tariff could only be contracted in our direct channels (from July 14 available in the on-line channel) and only for high-end handsets. Refresh represents a unique option for our direct channels and a factor that allows for the improvement of the activations mix through our own channels with the aim of improving our commercial efficiency.
Telefónica UK continued working on the deployment of its LTE network, reaching 38% outdoor coverage at the end of 2013, keeping the focus on offering an outstanding network experience and an exclusive content proposition to 4G customers. The first 4G adopters are showing encouraging results in terms of data consumption (up to 2 times higher average data consumption than 3G customers), signaling the positive ARPU uplift opportunity of this technology.
From May 1, Telefónica UK excludes the financial results of its fixed consumer business (35 million euros in revenues and with no relevant OIBDA contribution in January-April 2013).
As a result of the commercial activity, total accesses reached 23.9 million at the end of December 2013 (+0.3% year-on-year) despite the impact from the disposal of the fixed assets (720 thousand accesses: 209 thousand in fixed telephony accesses and 511 thousand in fixed broadband accesses). Total mobile customers grew 3.4% year-on-year to 23.6 million at the end of December driven by the consistent mobile contract customer base growth. The contract mix increased 2 percentage points year-on-year to account for 54% of the mobile base. Contract net additions totaled 983 thousand in 2013 driven by solid gross additions, despite the highly competitive environment. Contract churn improved by 0.1 percentage points to 1.0% due to the management of its customer base. Smartphone penetration (as a percentage of mobile data tariffs over total mobile customers) grew 4 percentage points year-on-year and reached 49% by the end of December.
|
Millions of euros
|
% Var 11/12
|
% Var 12/13
|
||||||||||||
|
Telefónica UK
|
2011
|
2012
|
2013
|
€
|
LC
|
€
|
LC
|
|||||||
|
Revenues
|
6,926
|
7,042
|
6,692
|
1.7%
|
(5.0)%
|
(5.0)%
|
(0.5)%
|
|||||||
|
Service revenues
|
6,198
|
6,060
|
5,461
|
(2.2)%
|
(8.6)%
|
(9.9)%
|
(5.7)%
|
|||||||
|
OIBDA
|
1,836
|
1,601
|
1,637
|
(12.8)%
|
(18.5)%
|
2.2%
|
7.0%
|
|||||||
|
OIBDA Margin
|
26.5%
|
22.7%
|
24.5%
|
(3.8) p.p.
|
−
|
1.7 p.p.
|
−
|
|||||||
|
CapEx
|
732
|
748
|
1,385
|
2.2%
|
(4.5)%
|
85.3%
|
94.0%
|
|||||||
|
OpCF (OIBDA - CapEx)
|
1,104
|
854
|
252
|
(22.7)%
|
(27.8)%
|
(70.5)%
|
(69.1)%
|
|||||||
Total
revenues
stood at 6,692 million euros, down 5.0% year-on-year in reported terms (a year-on-year decline of 0.5%, excluding exchange rate differences) reflecting the already mentioned disposal of the fixed consumer business, as well as the “Refresh” (new commercial model) contribution (+5.8 percentage points to revenue growth 2013). The new commercial model translates into more revenue from handset sales (even where the number of units sold has not increased), since handset sales are fully recognized upfront, instead of the prior model in which accounting is recorded on a monthly basis.
|
|
·
|
Service revenues
in 2013 totaled 5,461 million euros and fell 9.9% year-on-year in reported terms (-5.7% excluding the impact of exchange rate differences) negatively impacted by the new commercial model. Excluding the impact of mobile termination rate cuts and roaming regulation, as well as the impact of the new commercial model, mobile service revenues would have decreased 1.3% due to the pressure on ARPU.
|
|
|
·
|
Non-SMS data revenues
grew 0.8% year-on-year (+5.5% year-on-year excluding exchange rate differences) accounting for 50% of data revenues in 2013 (+3 percentage points year-on-year). The decline of SMS volumes led data revenue to decline 1.2% year-on-year in 2013. In 2013, data revenues account for 53% of mobile service revenues, +2 percentage points higher versus the previous year.
|
|
|
·
|
ARPU
fell 12.9% (-8.8% in 2013 excluding the impact of the exchange rate differences) negatively impacted by the “Refresh” model (higher handset revenues are recorded upfront and a result in lower service revenues). Excluding the impact of regulation, ARPU decrease was 5.5% year-on-year. Voice ARPU fell 17.1% in reported terms (-13.2% excluding exchange rate differences) and fell 8.4%, excluding additionally the effect of regulations. Data ARPU fell 8.8% in reported terms (-4.5% excluding exchange rate differences). Revenues from the “Refresh” model are not recognized as mobile service revenues, and are instead recognized under the line item revenues from hardware sales, for which reason smartphone sales are not reflected in ARPU.
|
|
2011
|
2012
|
2013
|
% Var LC 11/12
|
% Var LC 12/13
|
||||||
|
Traffic (million minutes)
|
52,250
|
48,250
|
48,479
|
(7.7)%
|
0.5%
|
|||||
|
ARPU (EUR)
|
23.2
|
22.5
|
19.6
|
(9.3)%
|
(8.8)%
|
|||||
|
Prepay
|
10.3
|
9.6
|
7.7
|
(13.1)%
|
(16.0)%
|
|||||
|
Contract
|
37.1
|
35.0
|
29.9
|
(11.8)%
|
(10.4)%
|
|||||
|
Data ARPU
|
10.5
|
11.4
|
10.4
|
1.5%
|
(4.5)%
|
|||||
|
% rev. non-SMS over data revenues
|
40.5%
|
46.8%
|
50.0%
|
6.3 p.p.
|
3.2 p.p.
|
|||||
Mobile voice traffic remained
practically
stable with respect to the previous year.
Company
OIBDA
stood at 1,637 million euros, representing a year-on-year increase of 2.2% in reported terms, which would have been +7.0% excluding the impact from exchange rate differences. Year-on-year performance was positively affected by the capital gain of 83 million euros from the fixed consumer business disposal offset partially by the negative impact of restructuring expenses (48 million euros). In addition, OIBDA performance reflects the acceleration in the recording of hardware sales from the “Refresh” model, partially mitigated by the negative impact from higher upfront commercial costs of moving volumes towards direct channels.
2012 Results
Revenues
: Total revenues increased 1.7% year-on-year (or decreased 5.0% when excluding exchange rate differences) to 7,042 million euros. Mobile service revenues totaled 6,060 million euros, a year-on-year decrease of 2.2%. The impact of exchange rates differences accounted for 6.4 p.p. of the variance, so excluding the effect of exchange rate differences, service revenue would have decreased 8.6%. These results were heavily impacted by reductions in interconnection rates and the new roaming rates, which dragged revenue growth by -4 p.p. and also impacted by ARPU trends. Non-SMS data revenue rose 18.4% from 2011 to 2012, underpinned by the higher presence of smartphones and the adoption of segmented data rates. Data revenues were up 2.4% compared to 2011, representing 51% of mobile service revenues (up 6 p.p. year-on-year).
Total
ARPU
slumped 9.3% year-on-year in local currency, heavily affected by the reduction in interconnection rates, which accounted for 3 p.p. of the decrease and a 7.7% decline in traffic. Voice ARPU fell 18.3% compared to 2011 due to lower interconnection rates, the new regulations on roaming rates, and the rates reduction made to stay competitive in the market. Data ARPU grew by 1.5%, reflecting the success of limited-use data rates offers.
Mobile voice traffic was 7.7% lower than in 2011, primarily due to optimization of usage.
OIBDA
totaled 1,601 million euros in 2012, down 12.8% on the 2011 figure (down 18.5% in local currency), primarily as a result of the decreasing service revenue trends (derived from lower ARPU), partially offset by lower interconnection costs as a consequence of termination rate cuts. OIBDA drop is also affected by commercial costs increase in 2012 compared to 2011, especially in the first half of the year in response to the greater commercial activity undertaken in late 2011.
GERMANY
|
Thousands of accesses
|
2011
|
2012
|
2013
|
% Var 11/12
|
% Var 12/13
|
||||
|
Fixed telephony accesses (1)
|
2,055.1
|
2,249.0
|
2,124.9
|
9.4%
|
(5.5)%
|
||||
|
Internet and data accesses
|
2,922.3
|
2,678.9
|
2,516.1
|
(8.3)%
|
(6.1)%
|
||||
|
Narrowband
|
334.6
|
302.6
|
271.7
|
(9.6)%
|
(10.2)%
|
||||
|
Broadband
|
2,587.7
|
2,376.3
|
2,244.3
|
(8.2)%
|
(5.6)%
|
||||
|
Mobile accesses
|
18,380.1
|
19,299.9
|
19,401.0
|
5.0%
|
0.5%
|
||||
|
Pre-Pay
|
9,144.5
|
9,191.3
|
9,114.9
|
0.5%
|
(0.8)%
|
||||
|
Contract
|
9,235.7
|
10,108.5
|
10,286.1
|
9.5%
|
1.8%
|
||||
|
Pay TV (2)
|
83.3
|
57.2
|
−
|
(31.3)%
|
n.s.
|
||||
|
Final Clients Accesses
|
23,440.9
|
24,284.9
|
24,042.0
|
3.6%
|
(1.0)%
|
||||
|
Wholesale Accesses
|
1,042.4
|
1,087.9
|
1,125.0
|
4.4%
|
3.4%
|
||||
|
Total Accesses
|
24,483.2
|
25,372.8
|
25,166.9
|
3.6%
|
(0.8)%
|
||||
|
(1)
|
Basic Fix Line (including Public Use Telephony) x1, RDSI primary access, Digital Accesses 2/6x30. Includes internal use, VOIP and naked ADSL.
|
|
(2)
|
In the fourth quarter of 2013, all TV accesses were disconnected.
|
n.s.: not significant
During 2013, the German mobile market remained very dynamic and competitive, with differentiated value propositions across segments, channels and regions and increasing commercial spend.
In 2013 Telefónica Europe's portfolio was restructured and the Group announced the acquisition of E-Plus by Telefónica Deutschland.
During the year, the Company continued pushing data monetization within its innovative multibrand and data centric strategy. At the same time, the Company continued increasing the density of its mobile data networks while accelerating the deployment of LTE.
The “O2 Blue All-in” tariffs are improving the value of our customer base, where the weighting of customers who opt for higher value offers has increased. This initiative also reinforces customer loyalty and promotes the penetration of smartphones. “O2 Blue All-in” tariffs are mobile data centric tariffs. At the same time, the sale of handsets with LTE technology increased during the year.
As a consequence, the mobile contract customer base grew 1.8% year-on-year, driving mobile accesses to 19.4 million (+0.5% year-on-year). Meanwhile, the contract mix improved 1 percentage point year-on-year to 53%. Smartphone penetration reached 31% at the end of 2013 (+5 percentage points year-on-year), with an encouraging rate of adoption of LTE-enabled handsets. Total net additions amounted 101 thousand in 2013. Mobile contract net adds amounted to 178 thousand in the year. Mobile contract churn reached 1.6% in 2013 (+0.1 p.p. year-on-year). In retail broadband fixed internet accesses amounted to 2.2 million at the end of December (down 6% year-on-year), despite the broad acceptance of the new “O2 DSL All-in” portfolio and the increasing customer demand for speed.
|
Results
|
||||||||||
|
Millions of euros
|
|
|||||||||
|
Telefónica Germany
|
2011
|
2012
|
2013
|
% Var 11/12
|
% Var 12/13
|
|||||
|
Revenues
|
5,035
|
5,213
|
4,914
|
3.5%
|
(5.7)%
|
|||||
|
Wireless Business
|
3,606
|
3,845
|
3,673
|
6.6%
|
(4.5)%
|
|||||
|
Service revenues
|
2,946
|
3,152
|
2,989
|
7.0%
|
(5.2)%
|
|||||
|
Wireline Business
|
1,426
|
1,363
|
1,235
|
(4.4)%
|
(9.4)%
|
|||||
|
OIBDA
|
1,219
|
1,351
|
1,308
|
10.8%
|
(3.2)%
|
|||||
|
OIBDA Margin
|
24.2%
|
25.9%
|
26.6%
|
1.7 p.p.
|
0.7 p.p.
|
|||||
|
CapEx
|
558
|
609
|
666
|
9.2%
|
9.4%
|
|||||
|
OpCF (OIBDA - CapEx)
|
662
|
743
|
642
|
12.2%
|
(13.5)%
|
|||||
Revenues
totaled 4,914 million euros, down 5.7% year-on-year. This decline is partly attributable to the reduction in termination rates. Excluding this impact, revenues would have fallen 3.5% in 2013, with ongoing headwinds coming from customer base repositioning and the acceleration of declines in SMS revenues. Handset revenues decreased by 1.4% year-on-year in 2013 explained by the increasing share of attractive affordable handsets in the market, including selective bundle offers of selected smartphones with high value mobile data tariffs.
|
|
·
|
Mobile Service revenues
stood at 2,989 million euros, a year-over-year decrease of 5.2%. Excluding the impact of the reduction in termination rates, mobile service revenues would have fallen by 1.5% year-on-year in 2013, mainly as a result of the rise in tariff renewals in the customer base and the lower contribution of revenues from incoming SMS traffic, which were not offset by the growth in data revenues. The company continued to monetize its data revenues with an increase in non-P2P SMS data revenue of 21.7% during the year, accounting for 67% of total data revenue (+10 percentage points year-on-year). As a result, mobile data revenues in 2013 increased 3.7% year-on-year to account for 48% of mobile service revenues (+4 percentage points year-on-year).
|
|
|
·
|
Fixed telephony
revenues shrank 9.4% year-on-year, to 1,235 million euros despite the increasing adoption of VDSL. This is mainly the result of the decline in DSL customer base (mitigated by an increasing uptake of VDSL) and a further reduction of revenues from the low margin voice transit business.
|
ARPU
decreased by 7.9% year-on-year, mainly as a result of the reduction in mobile termination rates. Excluding this impact, ARPU declined 4.3% in 2013 on the back of tariff migrations, acceleration of the decrease in SMS volumes and an increasing share of discounted online channel activities, which was partly offset by the increasing demand for mobile data services.
Voice ARPU decreased by 14.9% year-on-year, mainly as a result of the regulatory. Data ARPU grew 0.7% year-on-year, as a result of the increased penetration of mobile broadband and the greater uptake of integrated tariffs by the customer base, despite the negative impact of lower SMS volumes.
|
Telefónica Germany
|
||||||||||
|
2011
|
2012
|
2013
|
% Var 11/12
|
% Var 12/13
|
||||||
|
Traffic (million minutes)
|
27,993
|
29,519
|
30,152
|
5.5%
|
2.1%
|
|||||
|
ARPU (EUR)
|
13.6
|
13.8
|
12.7
|
0.9%
|
(7.9)%
|
|||||
|
Prepay
|
5.7
|
5.5
|
5.1
|
(3.0)%
|
(6.8)%
|
|||||
|
Contract
|
21.9
|
21.5
|
19.4
|
(1.6)%
|
(9.8)%
|
|||||
|
Data ARPU
|
5.6
|
6.2
|
6.2
|
9.3%
|
0.7%
|
|||||
|
% rev. non-SMS over data revenues
|
50.4%
|
56.7%
|
66.5%
|
6.3 p.p.
|
9.8 p.p.
|
|||||
Mobile voice traffic showed year-on-year growth of 2.1%, derived from the growth in the contract customer base.
OIBDA
stood at 1,308 million euros, registering a decline of 3.2% due to the decrease in mobile service revenues and higher commercial investments and specific hardware promotions to high value tariffs which more than offset capital gains obtained from the sale of assets for the amount of 76 million euros (46 million euros of fiber assets and 30 million euros of its hosting business Telefónica Online Services).
2012 Results
Total
revenues
rose 3.5% year-on-year to 5,213 million euros, primarily due to strong mobile revenues. Mobile services revenues increased by 7.0% year-on-year in 2012, drawing from the expanded contract customer base and the success of limited-use data rates. As a result, the 30.7% year-on-year growth in non-PAP SMS data revenues continued to drive total data revenues. Mobile data revenues were up 16.1% compared to 2011, representing 44% of mobile service revenues (up 3 p.p. year-on-year).
Revenue from the fixed line service fell 4.4% from 2011 to 2012, due mainly to the decrease in fixed broadband accesses.
Total
ARPU
was up 0.9% in the year. Voice ARPU decreased 5% year-on-year; however, this decrease was offset by the strong data ARPU (up 9.3% compared to 2011), drawing from the greater share in mobile broadband and the increased adoption of integrated rates among the customer base.
Mobile voice traffic rose 5.5% over the course of the year, underpinned by growth in the contract customer base.
OIBDA
rose 10.8% to 1,351 million euros, as a consequence of growth in mobile service revenues boosted by data revenue growth, combined with cost control as total operating expenses are nearly flat year-on-year. Supplies grow driven by increase in handset costs (higher commercial activity) and mobile interconnection expenses, personnel expenses increase due to general increase in salaries, and network costs also increase, partially offset by other expenses decrease with savings in administration expenses, bad debts and advertising costs.
CZECH REPUBLIC AND SLOVAKIA
|
Thousands of accesses
|
2011
|
2012
|
2013
|
% Var 11/12
|
% Var 12/13
|
|||||
|
Telefónica Czech Republic
|
||||||||||
|
Fixed telephony accesses (1)
|
1,581.9
|
1,499.9
|
1,389.3
|
(5.2)%
|
(7.4)%
|
|||||
|
Naked ADSL
|
237.4
|
285.9
|
324.9
|
20.4%
|
13.7%
|
|||||
|
VoIP
|
52.1
|
76.7
|
86.4
|
47.2%
|
12.7%
|
|||||
|
Internet and data accesses
|
970.6
|
1,016.1
|
985.0
|
4.7%
|
(3.1)%
|
|||||
|
Narrowband
|
100.7
|
87.6
|
75.1
|
(13.1)%
|
(14.3)%
|
|||||
|
Broadband
|
839.6
|
899.4
|
882.9
|
7.1%
|
(1.8)%
|
|||||
|
Other
|
30.3
|
29.1
|
27.1
|
(4.0)%
|
(6.8)%
|
|||||
|
Mobile accesses
|
4,941.7
|
5,082.9
|
5,101.5
|
2.9%
|
0.4%
|
|||||
|
Pre-Pay
|
1,892.4
|
1,891.1
|
1,866.1
|
(0.1)%
|
(1.3)%
|
|||||
|
Contract (2)
|
3,049.3
|
3,191.7
|
3,235.4
|
4.7%
|
1.4%
|
|||||
|
Pay TV
|
135.6
|
141.4
|
156.0
|
4.3%
|
10.3%
|
|||||
|
Final Clients Accesses
|
7,629.8
|
7,740.3
|
7,631.8
|
1.4%
|
(1.4)%
|
|||||
|
Wholesale Accesses
|
144.1
|
159.9
|
170.4
|
11.0%
|
6.6%
|
|||||
|
Total Accesses
|
7,773.9
|
7,900.1
|
7,802.2
|
1.6%
|
(1.2)%
|
|||||
(1) Basic Fix Line (including Public Use Telephony) x1, RDSI primary access, Digital Accesses 2/6x30. Includes internal use, VOIP and Naked ADSL.
(2) In the first quarter of 2013 114 thousand inactive customers were disconnected.
|
Thousands of accesses
|
2011
|
2012
|
2013
|
% Var 11/12
|
% Var 12/13
|
|||||
|
Telefónica Slovakia
|
||||||||||
|
Mobile accesses
|
1,164.1
|
1,354.2
|
1,539.5
|
16.3%
|
13.7%
|
|||||
|
Pre-Pay
|
666.1
|
694.9
|
765.6
|
4.3%
|
10.2%
|
|||||
|
Contract
|
498.0
|
659.3
|
773.9
|
32.4%
|
17.4%
|
|||||
|
Total Accesses
|
1,164.1
|
1,354.2
|
1,539.5
|
16.3%
|
13.7%
|
In 2013, Telefónica Czech Republic launched the "Free" and "Vario" tariffs, a new tariff portfolio, which includes unlimited on net calls and SMS and a higher data focus, in response to customer demand for a simpler and transparent offer. Furthermore, these tariffs are supporting the company´s simplification process by completely eliminating handset subsidy.
Along 2013, Telefónica Europe's portfolio was restructured through the sale of operations in the Czech Republic, which was closed in January 2014 after obtaining regulatory approval.
Telefónica Czech Republic and Telefónica Slovakia participated in auctions of 4G spectrum in the last quarter of 2013, acquiring the frequencies needed to rollout its next generation LTE network. As a result, Telefónica Czech Republic acquired 2 blocks in the 800 MHz bandwidth and subsequently acquired 3 blocks in the 1800 MHz bandwidth and 4 blocks in the 2600 MHz bandwidth. The total amount paid for these frequencies was 108 million euros. Telefónica Slovakia acquired frequencies in the 800 MHz and 1800 MHz bandwidths, in order to permit the company to construct a high-speed and quality LTE network, for 40 million euros.
Accesses in the Czech Republic declined 1.2% year-on-year in 2013 due to the declines in fixed telephony accesses. The mobile customer base stood at 5.1 million accesses at the end of the year, up 0.4% year-on-year, driven by the rise in contract customers (1.4% despite the disconnection of 114 thousand inactive contract mobile customers in the first quarter of 2013 in Czech Republic), which now represent 63% of the total (+1 percentage points year-on-year). In Slovakia, the growth in accesses continued, especially in the contract segment due to the success of the tariffs focused on high value customers.
Smartphone penetration grew 11 p.p. year-on-year, to reach 25% at the end of 2013.
The highlights of operating performance in the fixed telephony businesses are as follows:
|
|
·
|
Retail broadband accesses amounted to 883 million, year-on-year decrease of 1.8% (net annual loss of 16.6 thousand accesses). VDSL continued its positive trend, and 362 thousand clients have already subscribed to this service, representing 39% of the xDSL customer base.
|
|
|
·
|
Pay TV accesses stood at 156 thousand at the end of 2013, a year-on-year increase of +10.3%, evidencing the success of the new O2 TV proposal leveraged on the new IPTV platform.
|
|
Millions of euros
|
% Var 11/12
|
% Var 12/13
|
||||||||||||
|
Telefónica Czech Republic
|
2011
|
2012
|
2013
|
€
|
LC
|
€
|
LC
|
|||||||
|
Revenues
|
2,130
|
2,010
|
1,818
|
(5.7)%
|
(3.7)%
|
(9.5)%
|
(6.8)%
|
|||||||
|
Wireless Business
|
1,211
|
1,159
|
1,038
|
(4.3)%
|
(2.5)%
|
(10.4)%
|
(8.0)%
|
|||||||
|
Service revenues
|
1,145
|
1,097
|
960
|
(4.2)%
|
(2.4)%
|
(12.5)%
|
(10.1)%
|
|||||||
|
Wireline Business
|
919
|
851
|
780
|
(7.4)%
|
(5.4)%
|
(8.3)%
|
(5.2)%
|
|||||||
|
OIBDA
|
931
|
832
|
754
|
(10.6)%
|
(8.7)%
|
(9.4)%
|
(6.6)%
|
|||||||
|
OIBDA Margin
|
43.7%
|
41.4%
|
41.5%
|
(2.3) p.p.
|
−
|
0.1 p.p.
|
−
|
|||||||
|
CapEx
|
229
|
248
|
218
|
8.6%
|
10.4%
|
(12.1)%
|
(9.4)%
|
|||||||
|
OpCF (OIBDA - CapEx)
|
702
|
584
|
536
|
(16.9)%
|
(15.0)%
|
(8.3)%
|
(5.5)%
|
|||||||
2013 Results
Czech Republic and Slovakia
revenues
stood at 1,818 million euros, falling 9.5% year-on-year in reported terms and 6.8% year-on-year in local currency. Mobile service revenue totaled 960 million euros (-12.5% year-on-year in reported terms and -10.1% year-on-year in local currency) mainly reflecting the weaker consumption in all segments and the cuts to the mobile termination rates (which contributed 6.5 percentage points to the year-on-year drop). Excluding these cuts, the decline in mobile service revenues was 3.6% year-on-year.
In Slovakia, mobile service revenues showed solid growth (+5.5% year-on-year) and reached 190 million euros.
Fixed telephony revenues totaled 780 million euros (-5.2% year-on-year), mainly due to the pressure on fixed ARPUs and IT revenues.
OIBDA
declined 9.4% year-on-year in reported terms and 6.6% year-on-year in local currency to 754 million euros. Revenue performance was the main reason for this decline, since efficiency measures for costs were already in place, both in commercial areas and non-commercial areas, with personnel costs (excluding restructuring costs) undergoing a significant decrease due to the reduction in the headcount. In 2013, the Company also recorded a non-recurrent gain from the compensation from T-Mobile for Telefónica´s contribution to network sharing partnership of 25 million euros.
2012 Results
Revenues
in the Czech Republic and Slovakia amounted to 2,010 million euros, for a year-on-year decrease of 3.7% in local currency. Mobile service revenues amounted to 1,097 million euros (down 2.4% year-on-year, in local currency), primarily reflecting weaker consumption across all segments and the lower mobile interconnection rates (which accounted for 3.4 p.p. of the year-on-year decline). When stripping out the impact of these rates cuts, mobile service revenues rose 1.0% from 2011 to 2012.
In Slovakia, service revenues continued to show a solid growth (+8.1% year-on-year) and reach 208 million euros.
Fixed line telephone revenues totaled 851 million euros (a 5.4% decrease from 2011), primarily due to pressures on fixed ARPU.
OIBDA
totaled 832 million euros, down 8.7% on 2011 in local currency. Pressure on revenues is the main reason for this drop, as operating costs are nearly flat year on year despite customer base growth and expansion of business activities. Efficiency measures have been implemented in both commercial and non-commercial areas of its operations, with personnel expenses declining significantly as a consequence of headcount reduction (excluding restructuring costs).
Our services and products
Mobile business
Telefónica offers a wide variety of mobile and related services and products to personal and business customers. Although they vary from country to country, our principal services and products are as follows:
|
·
|
Mobile voice services:
Our principal service in all of our markets is mobile voice telephony.
|
|
·
|
Value added services
: Customers in most of the markets have access to a range of enhanced mobile calling features, including voice mail, call hold, call waiting, call forwarding and three-way calling.
|
|
·
|
Mobile data and Internet services:
Current data services offered include Short Messaging Services, or SMS, and Multimedia Messaging Services, or MMS, which allow customers to send messages with images, photographs, sound recordings and video recordings. Customers may also receive selected information, such as news, sports scores and stock quotes. We also provide mobile broadband connectivity and Internet access. Through mobile Internet access, customers are able to send and receive e-mail, browse the Internet, download games, purchase goods and services in m-commerce transactions and use our other data and software services.
|
|
·
|
Wholesale services:
Telefónica has signed network usage agreements with several MVNOs in different countries.
|
|
·
|
Corporate services:
Telefónica provides business solutions, including mobile infrastructure in offices, private networking and portals for corporate customers that provide flexible online billing.
|
|
·
|
Roaming:
Roaming agreements allow Telefónica customers to use their mobile handsets when they are outside their service territories, including on an international basis.
|
|
·
|
Fixed wireless:
Telefónica provides fixed voice telephony services through mobile networks in Brazil, Venezuela, Argentina, Peru, Mexico, Ecuador, El Salvador, Guatemala and Nicaragua.
|
|
·
|
Trunking and paging:
Telefónica provides digital mobile services for closed user groups of clients and paging services in Spain and most operations in Latin America.
|
Fixed business
The principal services Telefónica offers in its fixed businesses in Europe and Latin America are:
|
·
|
Traditional fixed telecommunication services:
Telefónica’s principal traditional fixed telecommunication services include PSTN lines; ISDN accesses; public telephone services; local, domestic and international long-distance and fixed-to-mobile communications services; corporate communications services; supplementary value-added services (including call waiting, call forwarding, voice and text messaging, advanced voicemail services and conference-call facilities); video telephony; business oriented value-added services; intelligent network services; leasing and sale of handset equipment; and telephony information services;
|
|
·
|
Internet and broadband multimedia services:
the principal Internet and broadband multimedia services include Internet service provider service; portal and network services; retail and wholesale broadband access through ADSL, naked ADSL (broadband connection without the monthly fixed line fee); narrowband switched access to Internet for universal service, and other technologies. Telefónica also offers high-speed Internet services through fiber to the home (FTTH) in certain markets (primarily Spain, Brazil and Chile) and VDSL-based services (primarily Spain, Czech Republic and Germany). We also offer VoIP services in some markets;
|
|
·
|
Data and business-solutions services:
the data and business-solutions services principally include leased lines; virtual private network, or VPN, services; fiber optics services; the provision of hosting and application, or ASP, service, including web hosting, managed hosting, content delivery and application, and security services; outsourcing and consultancy services, including network management, or CGP; and desktop services and system integration and professional services; and
|
|
·
|
Wholesale services for telecommunication operators:
the wholesale services for telecommunication operators principally include domestic interconnection services; international wholesale services; leased lines for other operators’ network deployment; and local loop leasing under the unbundled local loop regulation framework). It also includes bit stream services, bit stream naked, wholesale line rental accesses and leased ducts for other operators’ fiber deployment.
|
Digital services
The main highlights in services developed by Telefónica Digital in 2013 are:
|
·
|
Video/TV services:
IPTV services (internet protocol), over-the-top network television services, and cable and satellite TV. In certain markets, advanced pay TV services are offered, such as high-definition TV (HDTV), Multiroom (allowing clients to watch different TV channels in different rooms) and Digital Video Recording (DVR);
|
|
·
|
M2M
that includes both M2M connectivity services and end-to-end products in different countries. Especially noteworthy is the significant success of in-house developments, as the smart M2M solution, which enables smart meter communications services;
|
|
·
|
e-Health services or telecare,
that allows tele-assistance through connectivity services to chronic patients and other eHealth services;
|
|
·
|
Financial services and other payment services:
allow customers to make transfers, payments and mobile recharges among other transactions through prepay accounts or bank accounts;
|
|
·
|
Security services
: such as “Latch” which allows consumers to remotely “switch their digital services on and off”; and
|
|
·
|
Cloud computing services,
such as the Instant Servers services, Telefónica's new global public cloud service for corporate clients. This entails high-performance virtual servers that are optimized for mobile and corporate applications (both fixed and mobile).
|
Sales and Marketing
Our sales and marketing strategy is aimed toward reinforcing our market position, generating brand awareness, promoting customer growth and achieving customer satisfaction. We use a variety of marketing initiatives and programs, including those that focus on customer value, with in-depth market segmentation; programs to promote customer loyalty; pricing initiatives aimed toward stimulating usage, including segmented packages and innovative tariff options; and initiatives that are responsive to the latest market trends, including those aimed toward boosting demand for our mobile Internet and mobile broadband offerings. In connection with these and our other sales and marketing initiatives, we market our products through a broad range of channels, including television, radio, billboards, telemarketing, direct mail
and Internet advertising. We also sponsor a variety of local cultural and sporting events in order to enhance our brand recognition.
Competition
The telecommunications industry is competitive and consumers generally have a choice of mobile and fixed line operators from which to select services. We are a global telecommunications services provider and face significant competition in most of the markets in which we operate. In Europe, our largest competitor is Vodafone and in Latin America, our largest competitor is América Móvil. Newer competitors, including handset manufacturers, MVNOs, internet companies and software providers, are also entering the market and offering integrated communications services.
We compete in our markets on the basis of the price of our services; the quality and range of features; the added value we offer with our service; additional services associated with those main services; the reliability of our network infrastructure and its technological attributes; and the desirability of our offerings, including bundled offerings of one type of service with another and, in the case of the mobile industry, in most of the markets offerings that include subsidized handsets.
To compete effectively with our competitors, we need to successfully market our products and services and to anticipate and respond to various competitive factors affecting the relevant markets, such as the introduction of new products and services, different pricing strategies and changes in consumer preferences. See “Risk Factors – Risks Relating to our Industry – We operate in highly competitive markets and the industry in which we operate is subject to rapid technological changes, which requires us to continually adapt to such changes and to upgrade our existing networks.”
Strategic Partnerships
China Unicom
Since 2005, we have had a stake in China Unicom and its predecessor company. On September 6, 2009 we entered into a strategic alliance agreement with China Unicom, which provides, among other areas for cooperation, joint procurement of infrastructure and client equipment, common development of mobile service platforms, joint provisions of service to multinational customers, roaming, research and development, sharing of best practices and technical, operational and management know-how, joint development of strategic initiatives in the area of network evolution, joint participation in international alliances and exchanges of senior management. In furtherance of this strategic alliance we entered into a subscription agreement with China Unicom, pursuant to which we increased our voting interest in the share capital of China Unicom to 8.06% and China Unicom obtained 0.87% voting interest in our share capital in October 2009.
Pursuant to the strategic alliance agreement mentioned above, China Unicom has agreed to use its best endeavors to maintain a listing of all the issued ordinary shares of China Unicom on the Hong Kong Stock Exchange. For so long as the strategic alliance agreement with us is in effect, China Unicom shall not (i) offer, issue or sell any significant number of its ordinary shares (including treasury shares), or any securities convertible into or other rights to subscribe for or purchase a significant number of China Unicom’s ordinary shares (including treasury shares), to any current major competitor of Telefónica or (ii) make any significant investment, directly or indirectly, in any current major competitor of Telefónica. We made similar undertakings.
The strategic alliance agreement between us and China Unicom terminates on September 6, 2012, subject to automatic annual renewal, subject to either party’s right to terminate on six months’ notice. Also, the strategic alliance agreement may be terminated by China Unicom if our shareholding in China Unicom drops below 5% of its issued share capital or if China Unicom’s shareholding in us drops below 0.5% of our issued share capital. In addition, the strategic alliance agreement is subject to termination in the event either party is in default and automatically terminates on a change in control of China Unicom.
On January 28, 2011, China Unicom completed its acquisition of 21,827,499 Telefónica shares.
On June 10, 2012, Telefónica, S.A. through its 100% subsidiary, Telefónica Internacional, S.A.U., and China United Network Communications Group Company Limited ("Unicom Parent") through a 100% owned subsidiary, signed an agreement for the acquisition by this last company of 1,073,777,121 shares of China Unicom -Hong Kong- Limited, owned by Telefónica, equivalent to 4.56% of the issued share capital of China Unicom.
On July 21, 2012 the aforementioned agreement was complemented by a Supplemental Agreement which determined the acquisition of the shares at a price of HK$10.02 per share, for a total amount of HK$10,759,246,752.42 (approximately 1,142 million euros). The transaction was completed on July 30, 2012 after obtaining the relevant regulatory authorizations.
As of the date of this Annual Report, Telefónica’s shareholding in China Unicom amounts to 5.01% of its capital stock. Furthermore, Mr. César Alierta, chairman of Telefónica, S.A. is a member of the Board of Directors of China Unicom while Mr. Chang Xiaobing, chairman of China Unicom, is a member of the Board of Directors of Telefónica, S.A.
Telecom Italia
Through a series of transactions from 2007 through 2009, we acquired an indirect holding of 10.49% in the voting shares of Telecom Italia (7.21% of the dividend rights) through our holdings in Telco. As of the date of this Annual Report, due to the September 2013 transaction, indirect holding in its capital stock amounts to 10.46% in the voting shares (10.28% of the dividend rights).
The Telecom Italia group is principally engaged in the communications sector and, particularly, in telephone and data services on fixed lines for final and wholesale customers, in the development of fiber optic networks for wholesale customers in the provision of broadband services and Internet services, in domestic and international mobile telecommunications (especially in Brazil), in the television sector using both analog and digital terrestrial technology and in the office products sector. Telecom Italia operates primarily in Europe, the Mediterranean basin and in South America.
For more information, please see “Item 5. Operating and Financial Review and Prospects —Operating Results—Significant Factors Affecting the Comparability of our Results of Operations in the Period Under Review” and “Item 10. Additional Information—Material Contracts.” Telco, through which we hold our stake in Telecom Italia, is included in our Consolidated Financial Statements using the equity method.
Regulation
Please see Appendix VII to our Consolidated Financial Statements.
Licenses and Concessions
Please see Appendix VII to our Consolidated Financial Statements.
Seasonality
Our main business is not significantly affected by seasonal trends.
Patents
Our business is not materially dependent upon the ownership of patents, commercial or financial contracts or new manufacturing processes.
Disclosure Pursuant to Section 219 of the Iran Threat Reduction and Syria Human Rights Act
Section 219 of the Iran Threat Reduction and Syria Human Rights Act of 2012 added Section 13(r) to the Exchange Act. Section 13(r) requires an issuer to disclose in its annual or quarterly reports filed with the SEC whether the issuer or any of its affiliates has knowingly engaged in certain activities, transactions or dealings with the Government of Iran, relating to Iran or with designated natural persons or entities involved in terrorism or the proliferation of weapons of mass destruction during the period covered by the annual or quarterly report. Disclosure is required even when the activities were conducted outside the United States by non-U.S. entities and even when such activities were conducted in compliance with applicable law.
The following information is disclosed pursuant to Section 13(r). None of these activities involved U.S. affiliates of Telefónica.
Roaming Agreements
Various of our subsidiaries have entered into roaming agreements with Iranian telecommunication companies. Pursuant to such roaming agreements our subsidiaries’ customers are able to roam in the particular Iranian network (outbound roaming) and customers of such Iranian operators are able to roam in our relevant subsidiary’s network (inbound roaming). For outbound roaming, our subsidiaries pay the relevant Iranian operator roaming fees for use of its network by our customers, and for inbound roaming the Iranian operator pays the relevant subsidiary roaming fees for use of its network by its customers.
Our subsidiaries were party to the following roaming agreements with Iranian telecommunication companies in 2013:
|
|
(1)
|
Telefónica Móviles España (“TME”), our Spanish directly wholly-owned subsidiary, has respective roaming agreements with (i) Mobile Telecommunication Company of Iran (“MTCI”), (ii) MTN Irancell (“Irancell”), and (iii) Taliya (“Taliya”).
During 2013, TME recorded the following revenues related to these roaming agreements: (i) 386,817.93 euros from MTCI, (ii) 741.69 euros from Irancell, (iii) none from Taliya.
TME also holds a Roaming Hub agreement through its 55% directly-owned subsidiary, Link2One, a.e.i.e. (“L2O”). Under this agreement, L2O provides a roaming hub service to Irancell enabling the latter to maintain a relationship with other members of the hub. Some members of the hub are also entities of the Telefónica Group. Under this roaming hub service, for 2013, L2O has billed Irancell 114,764 euros.
|
|
|
(2)
|
Telefónica Germany GmbH & Co. OHG
(“TG”), our German 76.83% indirectly-owned subsidiary, has a roaming agreement with MTCI. TG recorded 147,319.39 euros in roaming revenues under this agreement in 2013.
|
|
|
(3)
|
Telefónica Ireland Limited
(“TIR”), our Irish directly wholly-owned subsidiary, has a roaming agreement with MTCI. TIR recorded 1,558.66 euros in roaming revenues under this agreement in 2013.
|
|
|
(4)
|
Telefónica UK Ltd
(“TUK”), our English directly wholly-owned subsidiary, has a roaming agreement with Irancell. TUK recorded 840.41 euros in roaming revenues under this agreement in 2013.
|
|
|
(5)
|
Pegaso Comunicaciones y Sistemas, S.A. de C.V.
(“PCS”), our Mexican directly wholly-owned subsidiary, has a roaming agreement with Irancell. PCS recorded 62.99 U.S. dollars in roaming revenues under this agreement in 2013.
|
|
|
(6)
|
Telefónica Argentina, S.A. and Telefónica Móviles Argentina, S.A. (together TA), our Argentinean directly wholly-owned subsidiaries, have a roaming agreement with Irancell. TA recorded 65.89 U.S. dollars in roaming revenues under this agreement in 2013.
|
|
|
(7)
|
Telefónica Celular de Nicaragua, S.A. (“TCN”), our Nicaraguan 60% indirectly-owned subsidiary, has a roaming agreement with Irancell. TCN recorded 12.65 U.S. dollars in roaming revenues under this agreement in 2013.
|
The net profit recorded by our subsidiaries pursuant to these agreements did not exceed the related revenues recorded thereunder.
The purpose of all of these agreements is to provide our customers with coverage in areas where we do not own networks. For that purpose, we intend to continue maintaining these agreements.
International Carrier Agreement
Telefónica International Wholesale Services, S.L.
(“TIWS”), our Spanish indirectly wholly-owned subsidiary, has entered into an international carrier agreement with Telecom Infrastructure Company of Iran (“TICI”).
Pursuant to this agreement, both companies interconnect their networks to allow for international exchange of traffic. TIWS recorded 13,252 euros in revenues under this agreement in 2013. The net profit recorded by TIWS pursuant to this agreement did not exceed such revenues.
The purpose of this agreement is to allow exchange of international traffic. Consequently, we intend to continue maintaining this agreement.
See “—History and Development of the Company” and “—Business Overview.”
Our central headquarters for the Telefónica Group are located in “Distrito Telefónica,” in Madrid, Spain.
Fixed Networks
We own fixed networks in Spain, Latin America and Europe, having an incumbent role in Spain, Argentina (the greater Buenos Aires metropolitan area and the southern portion of the country), Brazil (São Paulo), Chile, Peru and Colombia.
Following market trends, competitive environments, evolution of technologies and new multimedia and broadband services demanded by our customers, we have upgraded our networks in recent years in the following manners:
|
·
|
progressive introduction of broadband access technologies over copper: ADSL, ADSL2+, VDSL2, etc., increasing the bandwidth capacity provided to our broadband clients several times in the last ten years;
|
|
·
|
introduction of fiber access technologies (xPON) across different deployment scenarios: fiber to the home (FTTH), fiber to the building (FTTB), fiber to the curb (FTTC), fiber to the node (FTTN), etc., increasing the access speed up to 100 Mbps;
|
|
·
|
service support based on powerful Internet Protocol/ Multiprotocol Label Switching (IP/MPLS) backbones, providing full connectivity to the rest of the network layers, such as access and control, to support services for business and customer market segments (fixed and mobile);
|
|
·
|
progressive migration of the legacy time division multiplexing (TDM) switching networks (PSTN and ISDN) to new generation network (NGN) over all-IP packet networks;
|
|
·
|
migration from legacy transport technologies, such as asynchronous transfer mode (ATM), frame relay (FR), low-rate leased lines, plesiochronous digital hierarchy (PDH) and synchronous digital hierarchy (SDH), to the new generation of optical transport ones, such as dense wavelength division multiplexing (DWDM), and coarse wavelength division multiplexing (CWDM);
|
|
·
|
introduction of IMS (Internet Multimedia Subsystem) in majority of countries to simplify the control of the network and ease the deployment of new services over the all-IP converged network;
|
|
·
|
empowerment of the intelligence of the network to better manage its use, to avoid saturations and frauds and to identify new business opportunities;
|
|
·
|
convergence of fixed and mobile networks, services and support systems from both technological and operational points of view; and
|
|
·
|
deployment of new services such as pay TV, to customers connected through broadband accesses. IPTV in Spain, Germany, Chile and Brazil; VoD in majority of OBs.
|
Mobile Networks
We operate mobile networks in Spain, the United Kingdom, Germany, Brazil, Argentina, Venezuela, Chile, Peru, Colombia, Mexico, Guatemala, Panama, El Salvador, Nicaragua, Costa Rica, Ecuador and Uruguay.
We use a number of mobile technologies in the countries in which we operate, namely: GSM and UMTS in Spain, the United Kingdom, Germany, and Latin America; and LTE in Germany, Spain, UK, Brazil, Colombia, and Chile. We continue the work of upgrading our mobile networks in line with market trends, the demand of new services from customers and the evolution of technologies. The main steps we are currently taking include:
|
·
|
introduction of broadband into mobile access using technologies such as UMTS, HSDPA, HSUPA,HSPA+ and LTE;
|
|
·
|
deployment of new services such as mobile VoD and distribution services for next generation music, video and games;
|
|
·
|
exploration of the adequacy of new technologies such as HSPA and LTE to provide mobile accesses with increased bandwidth, in particular:
|
− HSPA: we have been committed to the deployment of this technology in countries in which we have a presence and we have extended our coverage across all of our networks, expanding this to HSPA+ in the majority of the urban/suburban areas, and we have increased the capacity of the network by upgrading the network technology to the latest available releases of 3GPP standards;
− LTE: together with main vendors and sharing experience with other operators, we have extensively analyzed the opportunities that LTE will bring, as 4G mobile technology is used to complement current network technology by creating higher capacity at lower relative cost by user/traffic unit. In this regard, during 2013 we have extended the commercial operations with this technology in Germany, and started to offer commercial service in Spain, UK, Brazil, Colombia, and Chile, while we have continued extensive trials in other countries in Latin America with the objective of launching LTE services during 2014 in more countries; and
− convergence of fixed and mobile networks, services and support systems from both technological and operational points of view.
Satellite communications
The services provided using satellite platforms include television contribution signal to feed cable and IPTV head ends, DTH television, VSAT mainly for telephony and Internet access in rural areas, emergency solutions, corporate communications and international communications.
Submarine cables
We are one of the world’s largest submarine cable operators. We participate in approximately 25 international underwater cable systems (nine of which are moored in Spain) and own eleven domestic fiber optic cables.
There are submarine cable connections between Spain and Africa, America, Asia and Europe, respectively, which are jointly owned by us with other telecom operators. The SAM-1 cable, which we own, has a length of approximately 22,000 kilometers underwater and 3,000 kilometers terrestrial and links different countries such as the United States, Puerto Rico, Ecuador, Guatemala, Peru, Chile, Brazil, Argentina and Colombia.
The principal services using the capacity of submarine cables are voice circuits, Internet and dedicated circuits for international traffic and for corporations and business customers.
Not applicable.
Presentation of Financial Information
The information in this section should be read in conjunction with our Consolidated Financial Statements and the notes thereto, included elsewhere in this Annual Report. Our Consolidated Financial Statements have been prepared in accordance with IFRS as issued by the IASB.
As of January 1, 2012, the Telefónica Group’s consolidated segment results are reported in accordance with the organizational structure approved in September 2011, based on two regional business units, Telefónica Latin America and Telefónica Europe.
The Telefónica Latin America and Telefónica Europe regional business units include all businesses pertaining to wireline, wireless, cable, data, internet, television businesses and other digital services, in accordance with each location. “Other and eliminations" includes the companies belonging to the global business units Telefónica Digital and Telefónica Global Resources, the Atento business up to the date of divestment (see Note 2), other Group companies and eliminations in the consolidation process.
From January 1, 2013, Tuenti is included in the consolidation scope of T. Europe. In 2012 and 2011, it was included in “Other and eliminations”. Consequently, the results of T. Europe and "Other and eliminations" have been revised to include Tuenti for 2012 and 2011. This change does not have any impact on Telefónica’s consolidated results for 2012 and 2011.
Non-GAAP financial information
Operating income before depreciation and amortization
Operating income before depreciation and amortization, or OIBDA, is calculated by excluding depreciation and amortization expenses from our operating income in order to eliminate the impact of generally long-term capital investments that cannot be significantly influenced by our management in the short-term. Our management believes that OIBDA is meaningful for investors because it provides an analysis of our operating results and our segment profitability using the same measure used by our management. OIBDA also allows us to compare our results with those of other companies in the telecommunications sector without considering their asset structure. We use OIBDA to track our business evolution and establish operational and strategic targets. OIBDA is also a measure commonly reported and widely used by analysts, investors and other interested parties in the telecommunications industry. OIBDA is not an explicit measure of financial performance under IFRS and may not be comparable to other similarly titled measures for
other companies. OIBDA should not be considered an alternative to operating income as an indicator of our operating performance, or an alternative to cash flows from operating activities as a measure of our liquidity.
The following table provides a reconciliation of our OIBDA to operating income for the periods indicated.
|
Millions of euros
|
2011
|
2012
|
2013
|
|||
|
Operating income before depreciation and amortization
|
20,210
|
21,231
|
19,077
|
|||
|
Depreciation and amortization expense
|
(10,146)
|
(10,433)
|
(9,627)
|
|||
|
Operating income
|
10,064
|
10,798
|
9,450
|
|||
The following tables provide a reconciliation of OIBDA to operating income for us and each of our business areas for the periods indicated.
|
Millions of euros
|
Telefónica Latin America
|
Telefónica Europe
|
Other and eliminations
|
Total Group
|
||||
|
Operating income before depreciation and amortization
|
9,439
|
9,917
|
(279)
|
19,077
|
||||
|
Depreciation and amortization expense
|
(4,634)
|
(4,706)
|
(287)
|
(9,627)
|
||||
|
Operating income
|
4,805
|
5,211
|
(566)
|
9,450
|
||||
|
Millions of euros
|
Telefónica Latin America
|
Telefónica Europe
|
Other and eliminations
|
Total Group
|
||||
|
Operating income before depreciation and amortization
|
11,103
|
10,228
|
(100)
|
21,231
|
||||
|
Depreciation and amortization expense
|
(5,088)
|
(5,014)
|
(331)
|
(10,433)
|
||||
|
Operating income
|
6,015
|
5,214
|
(431)
|
10,798
|
||||
|
Millions of euros
|
Telefónica Latin America
|
Telefónica Europe
|
Other and eliminations
|
Total Group
|
||||
|
Operating income before depreciation and amortization
|
10,890
|
9,262
|
58
|
20,210
|
||||
|
Depreciation and amortization expense
|
(4,770)
|
(5,081)
|
(295)
|
(10,146)
|
||||
|
Operating income
|
6,120
|
4,181
|
(237)
|
10,064
|
||||
Net financial debt and net debt
We calculate net financial debt by deducting the positive mark-to-market value of derivatives with a maturity beyond one year from the relevant balance sheet date and other interest-bearing assets (each of which are components of non-current financial assets in our consolidated statement of financial position), current financial assets and cash and cash equivalents from the sum of (i) current and non-current interest-bearing debt (which includes the negative mark-to-market value of derivatives with a maturity beyond one year) and (ii) other payables (a component of non-current trade and other payables in our consolidated statement of financial position). We calculate net debt by adding to net financial debt those commitments related to workforce reduction. We believe that net financial debt and net debt are meaningful for investors because they provide an analysis of our solvency using the same measures used by our management. We use net financial debt and net debt to calculate internally certain solvency and leverage ratios used by management. Neither net
debt nor net financial debt as calculated by us should be considered an alternative to gross financial debt (the sum of current and non-current interest-bearing debt) as a measure of our liquidity.
The following table provides a reconciliation of our net financial debt and net debt to gross financial debt at the dates indicated:
|
Millions of euro
|
12/31/2013
|
12/31/2012
|
12/31/2011
|
|||
|
Non-current interest-bearing debt
|
51,172
|
56,608
|
55,659
|
|||
|
Current interest-bearing debt
|
9,527
|
10,245
|
10,652
|
|||
|
Gross financial debt
|
60,699
|
66,853
|
66,311
|
|||
|
Other non-current payables
|
1,145
|
1,639
|
1,583
|
|||
|
Other current payables
|
99
|
145
|
−
|
|||
|
Non-current financial assets
|
(4,468)
|
(5,605)
|
(4,830)
|
|||
|
Current financial assets
|
(2,117)
|
(1,926)
|
(2,625)
|
|||
|
Cash and cash equivalents
|
(9,977)
|
(9,847)
|
(4,135)
|
|||
|
Net financial debt
|
45,381
|
51,259
|
56,304
|
|||
|
Net commitments related to workforce reduction
|
2,270
|
2,036
|
1,810
|
|||
|
Net debt
|
47,651
|
53,295
|
58,114
|
|||
Significant Factors Affecting the Comparability of our Results of Operations in the Periods Under Review
Please see “Comparative information and main changes in the consolidation scope” in Note 2 to our Consolidated Financial Statements.
Significant Changes in Accounting Policies
Please see Note 3(n) to our Consolidated Financial Statements.
Critical Accounting Policies and Estimates
The preparation of financial statements in conformity with IFRS requires management to make estimates and assumptions that affect the amounts reflected in the Consolidated Financial Statements and accompanying notes. We base our estimates on historical experience, where applicable, and other assumptions that we believe are reasonable under the circumstances. Actual results may differ from those estimates under different assumptions or conditions.
We consider an accounting estimate to be critical if:
|
|
·
|
it requires us to make assumptions because information was not available at the time or it included matters that were highly uncertain at the time we were making our estimate; and
|
|
|
·
|
changes in the estimate or different estimates that we could have selected may have had a material impact on our financial condition, results of operations or cash flows.
|
The various policies that are important to the portrayal of our financial condition, results of operations and cash flows include:
|
|
·
|
accounting for long-lived assets, including goodwill;
|
|
|
·
|
deferred taxes;
|
|
|
·
|
provisions; and
|
|
|
·
|
revenue recognition.
|
Accounting for long-lived assets, including goodwill
Property, plant and equipment and intangible assets, other than goodwill, are recorded at acquisition cost. If such assets are acquired in a business combination, the acquisition cost is the estimated fair value of the acquired property, plant and equipment or intangible assets. Property, plant and equipment and intangible assets with definite useful lives are depreciated or amortized on a straight-line basis over their estimated useful lives.
Intangible assets with indefinite useful lives are not amortized, but are, instead, subject to an impairment test on a yearly basis and whenever there is an indication that such assets may be impaired.
Accounting for long-lived assets and intangible assets involves the use of estimates for determining: (a) the fair value at the acquisition date in the case of such assets acquired in a business combination, and (b) the useful lives of the assets over which they are to be depreciated or amortized. We believe that the estimates we make to determine an asset’s useful life are “critical accounting estimates” because they require our management to make estimates about technological evolution and competitive uses of assets.
When an impairment in the carrying amount of an asset occurs, non-scheduled write-downs are made. We perform impairment tests of identifiable intangible and long-lived assets whenever there is reason to believe that the carrying value may exceed the recoverable amount, which is the higher of the asset’s fair value less costs to sell and its value in use. Furthermore, previously recognized impairment losses may be reversed when changes in the estimates used to determine the asset’s recoverable amount indicate that an impairment loss recognized in prior periods no longer exists or may have decreased.
The determination of whether the impairment of long-lived and intangible assets is necessary involves the use of significant estimates and judgment that includes, but is not limited to, the analysis of the cause of potential impairment in value, the timing of such potential impairment and an estimate of the amount of the impairment, which requires the estimation of the future expected cash flows, discount rates and the fair value of the assets.
Specifically, management has to make certain assumptions in respect of uncertain matters, such as growth in revenues, changes in market prices, operating margins, and technology developments and obsolescence, discontinuance of services and other changes in circumstances that indicate the need to perform an impairment test. Management’s estimates about technology and its future development require significant judgment because the timing and nature of technological advances are difficult to predict.
Goodwill arises when the cost of a business combination exceeds the acquirer’s interest in the net fair value of the identifiable assets acquired and liabilities assumed at the acquisition date. Goodwill is not amortized, but is, instead, subject to an impairment test on a yearly basis and whenever there is an indication that the goodwill may be impaired.
Non-scheduled write-downs of goodwill are made when an impairment in the carrying amount of goodwill occurs. We review, on a regular basis, the performance of our cash-generating units. We compare the carrying amount of the cash-generating unit to which the goodwill has been allocated with its recoverable amount. The determination of the recoverable amount of the cash-generating unit involves extensive use of estimates and significant management judgment is involved. Methods commonly used by us for valuations include discounted cash flow methods.
A significant change in the facts and circumstances that we relied upon in making our estimates may have a material impact on our operating results and financial condition.
Deferred taxes
Management assesses the recoverability of deferred tax assets on the basis of estimates of our future taxable profit. The recoverability of deferred tax assets ultimately depends on our ability to generate sufficient taxable profit during the periods in which the deferred tax assets are utilized. In making this assessment, our management considers the scheduled reversal of deferred tax liabilities, projected taxable profit and tax planning strategies.
This assessment is carried out on the basis of internal projections, which are updated to reflect our most recent operating trends. In accordance with applicable accounting standards, a deferred tax asset must be recognized for all deductible temporary differences and for the carry-forward of unused tax credits and unused tax losses to the extent that it is probable that taxable profit will be available against which the deductible temporary difference can be utilized. Our current and deferred income taxes are impacted by events and transactions arising in the normal course of business as well as in connection with special and non-recurring items. Assessment of the appropriate amount and classification of income taxes is dependent on several factors, including estimates of the timing and realization of deferred tax assets and the timing of income tax payments. Actual collections and payments may materially differ from these estimates as a result of changes in tax laws as well as unanticipated future transactions impacting our income tax balances.
Provisions
Provisions are recorded when, at the end of the period, we have a present obligation as a result of past events, whose settlement requires an outflow of resources that is considered probable and can be measured reliably. This obligation may be legal or constructive, arising from, but not limited to, regulation, contracts, common practice or public commitments, which have created a valid expectation for third parties that we will assume certain responsibilities. The amount recorded is the best estimation performed by the management in respect of the expenditure that will be required to settle the obligations, considering all the information available at the closing date, including the advice of external experts, such as legal advisors or consultants.
If we are unable to reliably measure the obligation, no provision is recorded and information is then presented in the notes to the Consolidated Financial Statements.
Because of the inherent uncertainties in this estimation, actual expenditures may be different from the originally estimated amount recognized.
Revenue recognition
Connection fees
Revenues from connection fees originated when customers connect to our network are deferred over the average expected length of the customer relationship.
The expected customer relationship period is estimated based on recent historical experience of customer churn rates. Significant changes in our estimations may result in differences in the amount and timing of revenues recognized.
Multiple-element arrangements
Arrangements involving the delivery of bundled products or services are assessed to determine whether it is necessary to separate the arrangement into individual component deliverables, each with its own revenue recognition criteria.
Revenues relating to the bundled contracts is allocated to the different deliverables identified, based on their relative fair values (i.e., the fair value of each individual component deliverables in relation to the total fair value of the bundled deliverables), considering that amounts contingent upon delivery of undelivered items are not allocated to delivered items. Given that the handsets and airtime are price-sensitive and volatile in a competitive marketplace, the determination of fair values in the mobile phone business is quite complex.
Additionally, a significant change in the facts and circumstances upon which we based our fair value estimates may have an impact on the allocation of revenues among the different deliverables identified and, consequently, on future revenues.
Operating Environment
Our results of operations are dependent, to a large extent, on the level of demand for our services in the countries in which we operate. Demand for services in those countries is affected by the performance of their respective economies, particularly household private consumption, but also gross domestic product, or GDP, inflation, or CPI, external accounts and unemployment rates.
During the second half of 2013, global activity picked up and recent developments suggest that this process may consolidate along 2014. The Euro Area is showing signes of turning the corner from recession to recovery due to the
improvement of internal demand, which is true for all the countries but especially for Spain and the United Kingdom. In Latin America, economic growth in 2014 is expected to be broadly in line with 2013, with tighter economic policies offseting the possible benefits of a more favorable external environment. We expect this to have a positive impact on Telefónica’s services in 2014.
Operating environment by country
●
Spain
In 2013, Spanish GDP contracted by 1.2% (Spanish National Institute of Statistics estimates), compared with a positive average annual growth rate of 3.6% in the period 1998 through 2008 and a contraction on average of 1.4% in 2009-2012.
This performance was explained by a contraction of internal demand, though household consumption decreased 2.6% according to Consensus Forecast’s (an independent research firm) estimates (CFe) in 2013 compared with an annual rate of -1.9% during 2009-12 and compared with average growth of 3.6% during the period 1998 through 2008.
Investment contracted at an annual rate of 6.3% (CFe) during 2013 after a 8.8% decline on average in 2009-12, compared with average annual growth of 5.6% during the period 1998 through 2008. Inflation was 0.3% in 2013, compared with 3.0% and 2.4% in 2012 and 2011, respectively.
The current account surplus for 2013 reached 1.1% of GDP (CFe), compared with a - 1.1% of GDP in 2012 and -6.3% on average in 2008 through 2010.
The unemployment rate reached 26.0% at the end of 2013, higher than the average rates of 21.2% in 2009-12.
●
United Kingdom
In 2013, the British economy, measured in terms of GDP, grew by 1.9% compared with a growth rate of 0.3% in 2012 and 1.1% in 2011.
Fixed capital investment decreased by 2.4%, compared with an increase of 0.7% in 2012. Private consumption increased by 2.0%, compared with a 1.5% in 2012, a contraction of 0.4% in 2011 and a positive growth rate of 1.0% in 2010.
The CPI increased by 2.0% in 2013, compared with 2.7% in 2012 and 4.2% in 2011.
The unemployment rate reached 7.7% in 2013 (CFe), compared with an average annual rate of 8.0% in 2012 and 8.1% in 2011.
●
Germany
In 2013, the German economy grew 0.5%, after growing 0.7% in 2012 and 3.3% in 2011.
Lower growth in 2013, as compared to 2010 and 2011, was due to the negative contribution of the external sector to GDP growth (exports increased just 0.6% (CFe) while imports grew 1.3%). Because of this, the current account balance reached 6.9% in 2013, from 7.0% of GDP in 2012.
Inflation was 1.4% in 2013, compared with 2.0% in 2012 and 2.1% in 2011. At the end of 2013, the unemployment rate stood at 6.9%, compared with 6.8% in 2012 and 7.1% in 2011.
●
Czech Republic
The Czech economy contracted 1.3% in 2013 (CFe), after contracting 0.9% in 2012 and growing 1.8% in 2011. Private consumption contracted 0.3% in 2013 and 2.1% in 2012, after expanding 0.5% in 2011.
Inflation as measured by the CPI, was 1.4% in 2013, less than the 2.4% growth in 2012 and 2011. It is still far from Czech Central Bank objective (2%) and similar to the 1.2% level reached in 2009.
The current account had a 1.9 billion euros deficit, lower than the 3.7 billion euros deficit recorded in 2012 (4.3 billion euros deficit in 2011). Net foreign direct investment surplus was almost 1.0 billion euros in 2013. This surplus is lower than the surplus accounted in 2012 (7.4 billion euros) and then that accounted for in 2011 (3.0 billion euros).
The Czech crown depreciated against the Euro almost 10% in 2013 (due to a Central Bank FX intervention strategy that began in November 2013), compared with an appreciation of 2.8% in 2012.
●
Brazil
Brazilian GDP increased approximately 2.0% in 2013, following increases of 1.0% and 2.7% in 2012 and 2011, respectively. Investments reversed entirely the reduction of 4.0% in 2012, increasing by approximately 7.0% in 2013, according to the Brazilian Geography and Statistics Institute.
Inflation, as measured by the CPI, increased by 5.9% in 2013 (above the inflation target established by the Brazilian Central Bank of 4.5%, but within its range of tolerance), compared to 5.8% in 2012 and 6.5% in 2011. Due to increasing inflation, the basic interest rate, the Special Clearance and Escrow System rate (Selic rate), was raised from 7.25% at the end of 2012 to 10% at the end of 2013.
The current account deficit reached 81.4 billion U.S. dollars in 2013, compared to 54.2 billion U.S. dollars in 2012 and 52.5 billion U.S. dollars in 2011. This deficit observed in 2013 was partially financed by capital inflows, such as foreign direct investments, of 66.0 billion U.S. dollars, and portfolio investments, of 34.4 billion U.S. dollars. Due to other investment outflows of 20.6 billion U.S. dollars, international reserves decreased by 2.8 billion U.S. dollars in 2013, to a level of 375.8 billion U.S. dollars.
With the worsening of most domestic economic data, especially those regarding government accounts, the country risk increased. The J.P. Morgan Emerging Markets Bond Index Plus (EMBI + Brazil) reached 224 basis points at the end of 2013, down from 142 basis points at the end of 2012 and 223 basis points at the end of 2011.
As the global economic environment became more challenging, the exchange rate continued to depreciate. The Brazilian real depreciated against the U.S. dollar by 14.6% in 2013, reaching an exchange rate of 2.34 reais per 1 U.S. dollar on December 31, 2013, compared to 2.04 reais per 1 U.S. dollar on December 31, 2012 and to 1.88 reais per 1 U.S. dollar at the end of 2011.
●
Mexico
Mexico’s real GDP increased by an estimated 1.8% in 2013, compared with a 3.7% and 4.0% growth in 2012 and 2011, respectively.
Inflation, as measured by the CPI, was 4.0% at December 2013 compared with 3.6% at December 2012, above the Mexican Central Bank’s target of 3% but inside its tolerance range of 2% to 4%.
Despite the harsh economic downturn suffered in 2009, during 2013 the aggregate demand in Mexico has shown a stabilizing trend that began in 2010. Indeed, exports have increased by more than 2.2%, private consumption by almost 2.6% and investment by 1.0% compared with 2012.
The current account balance posted an expected deficit of 20.5 billion U.S. dollars in 2013, compared with 14.6 billion U.S. dollars in 2012 (1.6% and 1.2% of the GDP, respectively).
At December 31, 2013, the exchange rate relative to the U.S. dollar was 13.08 Mexican pesos to the U.S. dollar (12.87 and 13.95 at December 31, 2012 and 2011 respectively).
●
Venezuela
Venezuelan GDP increased approximately 1.1% in 2013 (CFe), following an increase of 5.6% in 2012 and an increase of 4.2% in 2011. The best results were observed in non-oil activity, which rose 1.7% during the first three quarters of 2013. In the same period, private consumption increased 4.3% (compared with an expansion of 7.0% in 2012 and an expansion of 4.0% in 2011) despite higher inflation, mainly due the expansion in public consumption.
At the end of September 2013, investment showed a 9.1% decline (growth of 24.1% in 2012 and 15.2% in 2011), public consumption grew 3.2% (growth of 6.3% in 2012 and 5.9% in 2011), exports decreased 6.1% (increase of 1.6% in 2012 and 4.7% in 2011), and imports decreased 6.0% (increase of 24.4% in 2012 and 15.4% in 2011).
In terms of inflation, the national CPI rose to 56.2% in 2013, 20.1% in 2012 and 27.6% in 2011. Venezuela continues to have the highest inflation rate in Latin America.
The unemployment rate reached 7.5% at the end of 2013, 7.8% at the end of 2012 and 8.2% at the end of 2011.
Through September 2013, the external accounts experienced a negative impact as a result of the downfall of oil prices and oil production that overcame the decrease in imports, with the current account surplus decreasing to 7.5 billion U.S. dollars in September 2013, compared with 11.0 billion U.S. dollars in 2012 and 24.4 billion U.S. dollars in 2011.
Additionally, the capital account deficit reached 7.8 billion U.S. dollars in September 2013, compared with deficits of 8.8 billion U.S. dollars in 2012 and 24.8 billion U.S. dollars in 2011. This performance diminished the Venezuelan Central Bank’s stock of international reserves to 21.4 billion U.S. dollars at the end of 2013 (Central Bank of Venezuela).
●
Chile
Chilean GDP increased by an estimated 4.0% in 2013. Economic activity slowed down after growing at annual rates around 6% in the previous three years. This slowing was mainly a result of a decrease in mining investment due to a downward sloping copper prices expected path, the already achieved earthquake reconstruction goals, tighter external financial conditions and a strong reduction of inventories.
The unemployment rate decreased from 6.5% in 2012 to 5.9% in 2013, while the labor market remained tight during the year, with wages rising at higher rates.
Inflation, measured by CPI, reached 3.0% in 2013 compared with 1.5% in 2012 and 4.4% in 2011. Inflation gained momentum as the local currency depreciated and also due to a negative climate impact (production food was affected by frost in winter), which caused temporary supply shortages of certain kinds of food. Nevertheless, inflation closed the year at the Chilean Central Bank’s target inflation rate (3%).
The Chilean Central Bank reduced its interest key rate 25 basis points twice during the year (to 4.5%) in response to less dynamic economic activity and a subdued inflation. The Monetary Policy Rate closed at 4.5% in 2013. The fiscal deficit reached 0.6% of GDP, compared to a surplus 0.6% in 2012 and 1.3% in 2011. Trade balance surplus diminished from 3.4 billion U.S. dollars in 2012 to 2.4 billion U.S. dollars in 2013 due to lower terms of trade and a decline in the demand for exports, both caused by the global slowdown.
At the end of 2013, the nominal exchange rate was 523.8 Chilean Pesos per U.S. dollar, reflecting a year-over-year Chilean Peso depreciation of 9.4%. The exchange rate performance in 2013 was mainly explained by changes in local and global economic conditions, with global conditions becoming less favorable for emerging economies.
●
Argentina
Argentina’s GDP grew by an estimated 4.7% in 2013. This data is much lower than the average annual growth rates of approximately 8.5% achieved from 2003 through 2008, and more in line with the 2009 to 2012 average of 5.3%.
The Argentine peso depreciated 32.6% relative to the U.S. dollar, closing at 6.34 Argentine pesos per U.S. dollar at the end of 2013 compared with 4.88 Argentine pesos per U.S. dollar at the end of 2012 and 4.39 Argentine pesos per U.S. dollar at the end of 2011.
The official CPI increased 11.0% in 2013 (compared with 10.8% in 2012 and 9.5% in 2011).
The expected current account deficit of 2.8 billion U.S. dollars in 2013 is the highest deficit in the last decade. The trade balance contributed significantly to this result, since exports increased 4.1%, in contrast with the 9.2% increase in imports during the year. Economic conditions affected the unemployment rate negatively, which increased to 7.4% in 2013 from 7.2% in 2012 and 6.7% in 2011.
●
Colombia
During 2013, the economy showed strong growth which remained supported by private consumption and good performance of investments (with the recovery of construction and better dynamism of civil construction works). However, exports showed a slight slowdown as a result of lower external demand and some supply shocks (e.g., a drop in coal exports) and industrial production remained weak throughout the year. Analysts forecast GDP to grow nearly 4.0% at the end of 2013 (compared with 4.2% at the end of 2012).
Employment during 2013 showed a significant recovery. The unemployment rate averaged 9.6% in 2013 compared to 10.4%, 10.8% and 11.8% in 2012, 2011 and 2010 respectively.
At the end of the third quarter of 2013, the balance of payments registered a current account deficit of 9.3 billion U.S. dollars, 3.4% of GDP year to date as of September 2013, compared with 3.3% of GDP in 2012, and 2.9% in 2011 (Colombian Central Bank). The current account deficit in 2013 continued to be funded by the surplus in the capital account through higher foreign direct investment inflows and portfolio investment. This resulted in a financial account surplus of 15.0 billion U.S. dollars (5.5% of GDP year to date as of September 2013, compared with 4.5% and 4.1% of GDP in 2012 and 2011 respectively).
Amid expectations of withdrawal of monetary stimulus by the Federal Reserve in the United States the Colombian peso depreciated 9.0% during 2013 against the U.S. dollar (closing the year at 1,926.8 Colombian pesos per one U.S. dollar). The inflation rate was 1.9% at the end of 2013, compared with 2.4% and 3.7% at the end of 2012 and 2011, respectively.
●
Peru
After three years of strong GDP growth (6.3% in 2012, 6.9% in 2011 and 8.8% in 2010), the Peruvian economy slowed down to a growth of 5.0%, under its potential growth. Strong private consumption performance (around 5.2%), and exports recovery were partially offset by significant slowdown in private investment. Primary sectors and non-primary industrial production showed a significant deceleration throughout the year, while services, commerce and construction sustained a strong pace of growth.
Consumer prices, as measured by the CPI, increased by 2.9% in 2013, within the range of the Peruvian Central Bank’s target, compared with 2.7% in 2012 and 4.7% in 2011. The Peruvian Central Bank cut its interest key rate by 25 basis points to 4.0% in November.
Despite the positive fiscal impulse, the government budget surplus was approximately 1.0% GDP in 2013, compared with a fiscal surplus of 2.1% in 2012 and 2.0% in 2011.
In the foreign exchange market, the Peruvian Nuevo Sol weakened 9.6% against the U.S. dollar in 2013, reaching 2.80 Peruvian Nuevo Sol per U.S. dollar at the end of the year, compared with an appreciation of 5.4% against the U.S. dollar in 2012, and 4.0% in 2011. Long-term capital inflows boosted international net reserves, reaching 65.7 billion U.S. dollars, compared with 64.0 billion U.S. dollars in 2012 and 48.8 billion U.S. dollars in 2011.
Country risk, measured by the J.P. Morgan Emerging Markets Bond Index (EMBIG Peru), rose 60 basis points to 177 basis points, in 2013. Long-term sovereign debt is currently investment grade rated by Fitch, Standard and Poor’s and Moody’s rating agencies.
Exchange Rate Fluctuations
We publish our Consolidated Financial Statements in euros. Because a substantial portion of our assets, liabilities, revenues and expenses are denominated in currencies other than the euro, we are exposed to fluctuations in the values of these currencies against the euro. Currency fluctuations have had and may continue to have a material impact on our financial condition, results of operations and cash flows.
We estimate that in 2013 variations in currencies decreased our cash flows and cash balance by approximately 1,468 million euros and decreased our consolidated revenues by approximately 7.5%. Currency fluctuations can also have a significant impact on our statement of financial position, particularly equity attributable to equity holders of the parent, when translating the financial statements of subsidiaries located outside the Eurozone into euro. For example, in 2013 equity attributable to equity holders of the parent decreased by 5,691 million euros due to the translation of the financial statements of our foreign subsidiaries, principally due to the depreciation of the Brazilian real, the bolivar fuerte and the Argentine peso, relative to the euro.
On January 24, 2014 the Venezuelan government announced a change in the currency exchange system. It does not impact the Consolidated Financial Statements (see Note 23 of our Consolidated Financial Statements).
We estimate that in 2012 variations in currencies decreased our cash flows and cash balance by approximately 382 million euros and increased our consolidated revenues by approximately 0.1%. Currency fluctuations can also have a significant impact on our statement of financial position, particularly equity attributable to equity holders of the parent, when translating the financial statements of subsidiaries located outside the Eurozone into euro. For example, in 2012 equity attributable to equity holders of the parent decreased by 1,278 million euros due to the translation of the financial statements of our foreign subsidiaries, principally due to the depreciation of the Brazilian real relative to the euro.
On February 8, 2013, the Venezuelan government announced its intention to devalue the bolivar fuerte from 4.3 bolivares fuertes per U.S. dollar to 6.3 bolivares fuertes per U.S. dollar, this decision affected the estimates made by the Group on the liquidation value of the net foreign currency position related to investments in Venezuela, which translates to an approximate pre-tax loss of 438 million euros on our 2012 financial results.
We estimate that in 2011 variations in currencies decreased our cash flows and cash balance by approximately 169 million euros and decreased our consolidated revenues by approximately 0.7%. In 2011 equity attributable to equity holders of the parent decreased by 897 million euros due to the translation of the financial statements of our foreign subsidiaries, principally due to the depreciation of the pound sterling and Brazilian real relative to the euro.
The table below sets forth the average exchange rates against the euro of the dollar and the key currencies that impacted our consolidated results of operations for the periods indicated. Positive percentage changes represent a decline in the value of the applicable currency relative to the euro, and negative percentage changes represent increases in the value of the applicable currency relative to the euro.
|
2011(1)
|
2012(1)
|
2013(1)
|
% change 2011 to 2012
|
% change 2012 to 2013
|
||||||
|
Average
|
Average
|
Average
|
Average
|
Average
|
||||||
|
Pound Sterling
|
0.87
|
0.81
|
0.85
|
(6.90)%
|
4.94%
|
|||||
|
U.S. Dollar
|
1.40
|
1.29
|
1.33
|
(7.86)%
|
3.10%
|
|||||
|
Brazilian Real
|
2.33
|
2.50
|
2.85
|
7.30%
|
14.00%
|
|||||
|
Argentine Peso
|
5.74
|
5.84
|
7.23
|
1.74%
|
23.80%
|
|||||
|
Peruvian Nuevo Sol
|
3.83
|
3.39
|
3.58
|
(11.49)%
|
5.60%
|
|||||
|
Chilean Peso
|
672.25
|
624.59
|
656.25
|
(7.09)%
|
5.07%
|
|||||
|
Mexican Peso
|
17.25
|
16.90
|
16.93
|
(2.03)%
|
0.18%
|
|||||
|
Bolivar fuerte (2)
|
5.56
|
5.67
|
8.69
|
1.98%
|
53.26%
|
|||||
|
Czech Crown
|
24.59
|
25.14
|
25.99
|
2.24%
|
3.38%
|
|||||
|
Colombian Peso
|
2,568.67
|
2,308.54
|
2,478.69
|
(10.13)%
|
7.37%
|
|||||
|
Guatemalan Quetzal
|
10.83
|
10.06
|
10.43
|
(7.11)%
|
3.68%
|
Source: Central treasury bank of the respective countries.
|
(1)
|
These exchange rates are used to convert the income statements of our subsidiaries from local currency to euro.
|
|
(2)
|
As Venezuela is considered a hyperinflationary country, the income statement from operations in Venezuela is accounted pursuant to the closing exchange rate of bolivar fuerte to euro.
|
We describe certain risks relating to exchange rate fluctuations in “Item 3. Key Information—Risk Factors,” and we describe our policy with respect to limiting our exposure to short-term fluctuations in exchange rates under “Item 11. Quantitative and Qualitative Disclosures About Market Risk.”
Group Results of Operations
Please see Item 4.B “Business Overview — Group Results of Operations.”
Cash Flow Analysis
The table below sets forth consolidated cash flow information for the periods indicated. Positive figures refer to cash inflows and those in parenthesis refer to cash outflows.
|
2011
|
2012
|
2013
|
||||
|
(millions of euros)
|
||||||
|
Net cash from operating activities
|
17,483
|
15,213
|
14,344
|
|||
|
Net cash used in investing activities
|
(12,497)
|
(7,877)
|
(9,900)
|
|||
|
Net cash used in financing activities
|
(4,912)
|
(1,243)
|
(2,685)
|
For a discussion of our cash flows for the years ended December 31, 2011, 2012 and 2013, please see Note 20 to our Consolidated Financial Statements.
Anticipated Uses of Funds
Our principal liquidity and capital resource requirements consist of the following:
|
·
|
costs and expenses relating to the operation of our business;
|
|
·
|
debt service requirements relating to our existing and future debt;
|
|
·
|
capital expenditures for existing and new operations;
|
|
·
|
acquisitions of new licenses or other operators or companies engaged in complementary or related businesses; and
|
|
·
|
dividend, other shareholder remuneration, and pre-retirement payments.
|
In 2014, we expect to continue transforming our networks, evolving them towards all-IP hyper-connected networks, by investing in FTTx in key markets, and by expanding our mobile networks with LTE in most of our operations, and also with 3G. We also expect to continue investing in IT as a critical factor in our transformation. We will continue to invest in digital sources to take advantage of the opportunities in the digital markets. And we may also use funds to acquire new licenses engaged in complementary or related businesses in the digital world.
We also have liquidity requirements related to the costs and expenses relating to the operation of our business, financial investments, our payment of dividends, shareholder remuneration and pre-retirement payment commitments. In 2013 we had cash expenditures of: 1,464 million euros in connection with shareholder remuneration (in connection with payment of dividends on Telefónica shares and the acquisition of Telefónica treasury shares), 789 million euros principally in connection with commitments under pre-retirement plans and 84 million euros in connection with net financial investments.
We also have liquidity requirements related to debt service requirements in connection with our existing and future debt. At December 31, 2013, we had gross financial debt of 60,699 million euros compared with 66,853 million euros at December 31, 2012. For the amortization schedule of our consolidated gross financial debt at December 31, 2013 and a further description of financing activity in 2013, see “—Anticipated Sources of Liquidity” below. Our net financial debt decreased to 45,381 million euros at December 31, 2013, compared with 51,259 million euros at December 31, 2012. The decrease in net financial debt was mainly explained by our 2013 cash flow generation before spectrum payments of 6,890 million euros, the placement of undated deeply subordinated securities in the amount of 2,466 million euros (recorded as equity instruments), the lower valuation in euros of net financial debt in foreign currencies for an amount of 1,041 million euros and other factors totaling an additional 314 million euros of debt reduction, mainly including the decrease in the present value of obligations due to fixed rate derivative transactions. In contrast, factors contributing to increased debt in 2013 include spectrum payments (1,499 million euros), the payment of labor commitments mainly associated with early retirements (789 million euros), the payment of dividends (1,588 million euros), the provision of net financial assets in bolivar fuerte (873 million euros) and financial investments (84 million euros). For a reconciliation of net financial debt to gross financial debt (the sum of current and non-current interest-bearing liabilities), see “—Presentation of Financial Information—Non-GAAP financial information—Net financial debt and net debt”.
For a discussion of our liquidity risk management policy, see Note 16 to our Consolidated Financial Statements.
Anticipated Sources of Liquidity
Cash flows from operations are our primary source of cash funding for existing operations, capital expenditures, interest obligations and principal payments. We also rely on external borrowings, including a variety of short- and medium-term financial instruments, principally bonds and debentures, and borrowings from financial institutions. Cash and cash equivalents are mainly held in euros and euro-denominated instruments. We believe that, in addition to internal generation of funds, our medium-term note program, our euro commercial paper program, our corporate domestic promissory note program and available lines of credit will provide us with substantial flexibility for our future capital requirements as existing debt is retired.
Financing
The following table shows the amortization schedule of our consolidated gross financial debt at December 31, 2013, as stated in euro. We may have exchange rate financial derivatives as instruments assigned to the underlying debt instruments. In 2013, the average cost of net debt, which we measure as net financial expense divided by our average net debt which, adjusted for exchange rate differences, was 5.34%. The table below includes the fair value of those derivatives classified as financial liabilities (negative mark-to-market) under IFRS (140 million euros classified as a current financial liability and 2,806 million euros as a non-current financial liability). The table does not include the fair value of derivatives classified as financial assets (positive mark-to-market) under IFRS (412 million euros classified as current financial assets and 2,667 million euros as non-current financial assets). For description of the liquidity risk we face, see Note 16 to our Consolidated Financial Statements, and for a description of our financial liabilities, see Note 13 to our Consolidated Financial Statements.
|
Current
|
Non-current
|
||||||||||||||||||||||||||||||
|
Maturity
|
2014
|
2015
|
2016
|
2017
|
2018
|
Subsequent years
|
Non-current total
|
Total
|
|||||||||||||||||||||||
|
Debentures and bonds
|
6,053 | 3,380 | 6,223 | 4,705 | 4,610 | 17,109 | 36,027 | 42,080 | |||||||||||||||||||||||
|
Promissory notes & commercial paper
|
1,279 | − | − | − | − | − | − | 1,279 | |||||||||||||||||||||||
|
Other marketable debt securities
|
− | − | − | − | − | 59 | 59 | 59 | |||||||||||||||||||||||
|
Total Issues
|
7,332 | 3,380 | 6,223 | 4,705 | 4,610 | 17,168 | 36,086 | 43,418 | |||||||||||||||||||||||
|
Loans and other payables
|
2,055 | 3,194 | 3,041 | 1,979 | 1,629 | 2,437 | 12,280 | 14,335 | |||||||||||||||||||||||
|
Other financial liabilities (Note 16)
|
140 | 228 | 301 | 251 | 573 | 1,453 | 2,806 | 2,946 | |||||||||||||||||||||||
|
TOTAL
|
9,527 | 6,802 | 9,565 | 6,935 | 6,812 | 21,058 | 51,172 | 60,699 | |||||||||||||||||||||||
|
|
Notes:
|
- Debentures and bonds 2014 maturities include 582 million euros of notes with an option of early repayment and no contractual obligation to be repaid.
- Estimated future interest payments as of December 31, 2013, on our interest-bearing-debt (not included above) are as follows: 2,296 million euros in 2014, 2,079 million euros in 2015, 1,865 million euros in 2016, 1,565 million euros in 2017, 1,232 million euros in 2018, and 7,534 million euros in subsequent years. With respect to floating rate debt, we estimate future interest payments as the forward rates derived from yield curves quoted for the different currencies on December 31, 2013.
During 2013, we obtained external financing in the form of borrowings of approximately 12,000 million euros. The financing activity in 2013 focused mainly on financing in advance debt maturing in 2014 and beyond, smoothing our debt maturity profile at the holding level for the following years while strengthening our liquidity position. Therefore, as of December 31, 2013, we believe we maintain an adequate liquidity position to accommodate 2014 and 2015 debt maturities.
For a description of our financing, see Note 13 to our Consolidated Financial Statements.
In 2014, through the date of this Annual Report, our debt issuances and principal financing arrangements consisted of:
|
|
·
|
On February 10, 2014, O2 Telefónica Deutschland Finanzierungs, GmbH issued seven-year notes in an aggregate principal amount of 500 million euros maturing on February 10, 2021, and with an annual interest rate of 2.375%. These notes are guaranteed by Telefónica Deutschland Holding, A.G.;
|
|
|
·
|
On February 18, 2014, Telefónica, S.A. signed a 3,000 million euros syndicated revolving credit facility maturing on February 18, 2019. This agreement entered into effect on February 25, 2014 cancelling the 3,000 million euros syndicated credit facility signed on July 28, 2010 and scheduled to mature in 2015; and
|
|
|
·
|
On March 12, 2014, Telefónica Emisiones, S.A.U. launched an issuance of two-year floating rate notes in an aggregate principal amount of 200 million euros. These notes are guaranteed by Telefónica, S.A. The settlement and closing date is schedule for execution on March 26, 2014.
|
Our borrowing requirements are not significantly affected by seasonal trends.
Availability of funds
At December 31, 2013, we have funds available, which include cash and cash equivalents and undrawn lines of credit, totaled 23,174 million euros.
For a description of our liquidity and undrawn lines of credit available at December 31, 2013, see Notes 12 and 13 to our Consolidated Financial Statements, and for a discussion of our liquidity risk management and our capital management, see Note 16 to our Consolidated Financial Statements.
Telefónica, S.A. is the parent company of the Telefónica Group and receives funding from its subsidiaries in the form of dividends and loans. Consequently, restrictions on the ability of the Group’s subsidiaries to transfer funds to Telefónica, S.A. in the form of cash dividends, loans or advances, capital repatriation and other forms would negatively affect our liquidity and thus our business.
Certain Latin American economies, such as Argentina and Venezuela, have experienced shortages in foreign currency reserves and their respective governments have adopted restrictions on the ability to transfer funds out of the country and convert local currencies into U.S. dollars. This may limit our ability to repatriate funds out of certain subsidiaries from such countries. However, regarding repatriation of funds to Spain, we have received 1,640 million euros from Latin American companies in 2013, of which 1,434 million euros was from dividends, 118 million euros was from intragroup loans (payment of interest and repayments of principal) and 88 million euros was from other items.
Credit Ratings
Our ability to use external sources of financing will depend in large part on our credit ratings. We believe that we are well-positioned to raise capital in financial markets. However, negative conditions in the financial markets or a downgrade of any of the ratings of our debt or the Kingdom of Spain’s debt by any of Fitch, Moody’s and/or Standard & Poor’s may increase the cost of our future borrowings or may make it more difficult to access the public debt markets. In connection with the credit rating agencies’ review of our debt ratings, the rating agencies may give considerable weight to general macroeconomic and political conditions (including sovereign credit rating prospects), the performance of our businesses in countries where we operate, our financial and shareholder remuneration policy, our M&A policy, our ability to integrate acquired companies and our ability to refinance debt.
In 2013, we have taken certain measures to protect our credit rating. These measures mainly include: intensive financing activity to extend the average debt maturity and accumulate liquidity; increasing retained cash by not paying out dividends in the first half-year and restating the dividend payment in November 2013; net disposals of treasury shares; agreements to sell our interests in certain Group companies (e.g. the Czech Republic and Ireland’s operators); and the issuance of undated deeply subordinated securities, which also enabled us to finance the acquisition of E-Plus, with no negative impact in our solvency.
Intragroup Loans
We lend funds to our operating subsidiaries, directly or through holding companies that head our different lines of business. At December 31, 2013, we had loans outstanding totaling 9,806 million euros (6,782 million euros at December 31, 2012) to companies in the Telefónica Group (including subsidiaries located in Latin American countries). These funds are derived from retained cash flows, loans, bonds and other sources (such as asset disposals).
Telefónica remains firmly committed to technological innovation as an essential tool for achieving competitive advantages, anticipating market trends and differentiating its products. By introducing new technologies and developing new products and business processes, we seek to become a more effective, efficient and customer-oriented Group.
Telefónica has developed an open innovation model for the management of technological innovation to boost the application of technical research in the development of new commercial products and services. Telefónica focuses on certain applied research and development (R&D) priorities that are aligned with its strategy. Open innovation initiatives driving this model include the creation of a venture capital fund and involvement in business collaboration forums, among others. The model also promotes the use of knowledge developed at technology centers, universities and start-ups, among other sources, and encourages innovation in conjunction with other agents (e.g. customers, universities, public administrations, suppliers, content providers and other companies), making them “technological partners.” Telefónica believes it cannot rely solely on acquired technology to differentiate its products from those of its competitors and to improve its market positioning. It is also important to encourage R&D initiatives in an effort to achieve this differentiation and make inroads in other innovation activities. The Group’s R&D policy is geared towards:
|
·
|
developing new products and services in order to win market share;
|
|
·
|
boosting customer loyalty;
|
|
·
|
increasing revenue;
|
|
·
|
enhancing innovation management;
|
|
·
|
improving business practices;
|
|
·
|
increasing the quality of infrastructure services to improve customer service and reduce costs;
|
|
·
|
promoting global products;
|
|
·
|
supporting open innovation; and
|
|
·
|
creating value from the technology generated.
|
In 2013, the technological innovation projects undertaken focused on sustainable innovation, process efficiency, creation of new revenue streams, customer satisfaction, consolidation of operations in new markets and technological leadership.
Technical innovation activities are a key part of Telefónica’s strategy of creating value through latest-generation network communications and services.
In 2013, projects were undertaken to promote greater access to information technology, new services focused on new internet business models, advanced user interfaces, TV distribution, multimedia content and other broadband services. These initiatives, among others, were undertaken based on our objective of rapidly identifying emerging technologies that could have a relevant impact on our businesses and pilot testing these technologies in new services, applications and platform prototypes.
Most of our R&D activities are carried out by Telefónica Investigación y Desarrollo, S.A.U. (Telefónica I+D), a wholly-owned subsidiary, which works mainly for the lines of business. In its operations, Telefónica I+D receives the assistance of other companies and universities. Telefónica I+D’s mission is centered on enhancing the Company’s competitive positioning by leveraging technological innovation and product development. Telefónica I+D undertakes experimental and applied research and new product development with the overriding goal of broadening the range of services offered and reducing operating costs.
Telefónica I+D’s technological innovation activities focus on certain areas:
Telefónica I+D’s works on new networks, primarily in collaboration with Telefónica’s Global Resources team. These activities are related with radio access technologies and fiber; network virtualization technologies, in line with the technology trend known as software defined networks (SDN); and network optimization and zero touch developments making networks more flexible and moldable and able to adapt dynamically to new digital consumer and service requirements.
R&D activities to develop new products and services are conducted as part of Telefónica Digital’s strategy. Indeed, Telefónica I+D has been the origin of many activities and products of Telefónica Digital. These activities include the following:
|
·
|
Natural P2P communication of the future, using the Internet, Web 2.0 and smartphones.
|
|
·
|
Video and multimedia services (combining text, audio, images and video) offering a user experience in all connected devices.
|
|
·
|
Advanced solutions in emerging ITC businesses such as cloud computing, security, financial services or e-health.
|
|
·
|
M2M (machine-to-machine) service management associated with energy efficiency and mobility and with the Internet of Things and their adoption in the urban and industrial scenario, and as a service creation enabler.
|
|
·
|
Making use of user communication profiles to exploit opportunities to operate different products and business models (marketing campaigns, target marketing, contextual services, churn reduction, cross-selling, etc.)
|
Telefónica I+D’s also boasts scientific work groups with a more medium- to long-term focus and aim to look into opportunities relating to new networks and services and solutions to the technological challenges that arise.
At December 31, 2013, Telefónica I+D had 689 employees (667 employees in 2012).
Total I+D expense in the Group for 2013 amounted to 1,046 million euros, down 2.4% from the 1,071 million euros incurred in 2012 (983 million euros in 2011). This expense represents 1.8%, 1.7% and 1.6% of the Group’s consolidated
revenue for 2013, 2012 and 2011, respectively. These figures were calculated using guidelines of the Organization for Economic Co-operation and Development (OECD).
In 2013, Telefónica registered 82 patents (87 patents in 2012), 70 of which were registered with the Spanish Patent and Trademark Office and (OEPM for its initials in Spanish) and 12 with the United States Patent and Trademark Office (USPTO). Of the patents pending with the OEPM, 57 European (EP) applications, and 13 international (PCT) applications.
Telefónica is an integrated diversified telecommunications group that offers a wide range of services, mainly in Europe and Latin America. Its core business is the provision of fixed and mobile telephony, broadband, internet, data, pay TV and value-added services, among others. The Group’s operations in 25 countries, managed through a regional organization geared towards certain businesses in global units, enable it to leverage the strong local positioning, as well as the advantages afforded by the scale, two features that have been reinforced by the opportunities arising from the Group’s holdings in and strategic alliances with China Unicom and Telecom Italia.
As a multinational telecommunications company that operates in regulated markets, Telefónica is subject to different laws and regulations in each of the jurisdictions in which it provides services. Telefónica expects the regulatory landscape to continue to change in Europe as a consequence of the revised regulations resulting from the implementation of the review of the common regulatory framework currently in place in the European Union. In addition, Telefónica may also face pressure from regulatory initiatives in some European countries regarding tariffs, the reform of rights of spectrum use and allocation, issues related to the quality of service, and the regulatory treatment of new broadband infrastructure deployments.
Telefónica faces intense competition in the vast majority of the markets it operates in, and is therefore subject to the effects of actions taken by its competitors. The intensity of the competition may deepen, which could have an impact on tariff structures, consumption, market share and commercial activity and negatively affect the number of customers, revenues and profitability.
However, Telefónica believes that it is in a strong competitive position in most of the markets where it operates, which it expects to help enable it to continue taking advantage of the growth opportunities that arise in these markets, such as by boosting both fixed and mobile broadband services and by furthering the development of services beyond connectivity, information technology services and related businesses. In this respect, Telefónica seeks to lead the industry by anticipating trends in the new digital environment.
Telefónica embarked on a restructuring in September 2011 with the aim of reinforcing its growth story, actively participating in the digital world and capturing the most of the opportunities afforded by its scale and industrial alliances. This new organization gave rise to two cross-cutting areas, Telefónica Digital and Telefónica Global Resources, in addition to the Telefónica Europe and Telefónica Latin America business segments. This structure was designed to bolster Telefónica’s place in the digital world, enabling it to tap any growth opportunities arising in this environment, drive innovation, strengthen the product and services portfolio and maximize the advantages afforded by its global customer bases in an increasingly connected world. In addition, the creation of a Global Resources operating unit supports the profitability and sustainability of the business by leveraging economies of scale and driving Telefónica’s transformation into a fully global company. Telefónica Europe’s and Telefónica Latin America’s objective is to shore up the results of the business and generate sustainable growth through available capacity, backed by the global corporation. During 2013, with the objective of increasing its direct contact with customers, both residential and business, and in the context of accelerating the transformation of the company into a digital telecommunications company, Telefónica created the position of Chief Marketing Officer at the global level, bringing together all the commercial areas, policies products, services, channels, handsets and prices, as those relating to advertising and brand. In addition, Telefónica Global Solutions, was integrated into Telefónica Global Resources, and addresses the growing complexity of a business market that is increasingly adopting digital solutions.
In Europe, customers remain at the core of the Group’s strategy and management priorities in the region in order to provide a high level of customer satisfaction with our services. With the objective of offering our customers the best value, we aim to boost the transformation of our network with higher investment in fiber and LTE and we will try to accelerate digital services growth. In such a competitive market such as presently prevails, we will dedicate our efforts on reinforcing our market positioning. Another objective in coming years is to improve operating efficiency, for which we are rolling out several local and regional initiatives, such as network sharing agreements, with the support of Telefónica Global Resources.
In Latin America, Telefónica’s strategy is based on a regional model that captures growth and efficiency of scale without losing sight of the local management of the client. The mobile business will continue to play a key role as a driver of regional growth and we will continue further enhancing the capacity and coverage of our networks, in order to keep and attract high-value customers, especially in the contract segment and boosting the penetration of mobile internet. Regarding the fixed telephony business, we will encourage the increase of broadband speed and expand the supply of
bundled services. Meanwhile, we will further advance efficiency, in operational and commercial terms, and attempt to achieve further synergies by implementing global, regional and local projects.
In summary, in the context of intense competition and regulatory pressure on pricing, Telefónica aims to continue strengthening its business model to make it more efficient and capture the synergies arising from the integrated approach of businesses, processes and technologies, while focusing even more on the client and staying ahead of trends in the new digital world.
We have commitments that could require us to make material payments in the future. These commitments are not included in our consolidated statement of financial position at December 31, 2013, although they are described in the notes to our Consolidated Financial Statements. For summary of our off-balance sheet commitments, see Note 21(b) and Note 16 to our Consolidated Financial Statements.
The following table describes our contractual obligations and commitments with definitive payment terms which may require significant cash outlays in the future. The amounts payable (including accrued interest payments) are as of December 31, 2013. For additional information, see our Consolidated Financial Statements.
|
Payments Due by Period
|
|||||||||||||||||||
|
Millions of euros
|
Total
|
Less than 1 year
|
1-3 years
|
3-5 years
|
More than 5 Years
|
||||||||||||||
|
Financial liabilities (1)(2)
|
60,699 | 9,527 | 16,367 | 13,747 | 21,058 | ||||||||||||||
|
Operating lease obligations (3)
|
9,335 | 1,503 | 2,375 | 1,919 | 3,538 | ||||||||||||||
|
Purchase and other contractual obligations(4)
|
5,285 | 2,272 | 1,362 | 735 | 916 | ||||||||||||||
|
Other liabilities (5)
|
3,086 | 508 | 2,578 | − | − | ||||||||||||||
|
Total
|
78,405 | 13,810 | 22,682 | 16,401 | 25,512 | ||||||||||||||
|
(1)
|
Capital (finance) lease obligations are not calculated separately and are instead included as part of our long-term debt obligations.
|
|
(2)
|
Estimated future interest payments as of December 31, 2013, on our interest-bearing-debt (not included above) are as follows: 2,296 million euros in 2014, 2,079 million euros in 2015, 1,865 million euros in 2016, 1,565 million euros in 2017, 1,232 million euros in 2018, and 7,534 million euros in subsequent years. With respect to floating rate debt, we estimate future interest payments as the forward rates derived from yield curves quoted for the different currencies on December 31, 2013. This item includes the fair value of those derivatives classified as current financial liabilities (negative mark-to-market) under IFRS (140 million euros). It does not include the fair value of derivatives classified as financial assets (positive mark-to-market) under IFRS (412 million euros classified as current financial assets and 2,667 million euros as non-current financial assets). For a more detailed description of our financial derivative transactions, see Note 16 to our Consolidated Financial Statements. For details of the composition of this item, see “Liquidity and Capital Resources– Anticipated sources of Liquidity”).
|
|
(3)
|
This item includes definitive payments (non-cancellable without penalty cost). Our operating lease obligations have in some cases extension options conditioned on the applicable law of each country. Accordingly, we have included only those amounts that represent the initial contract period. At December 31, 2013, the present value of future payments for operating leases was approximately 6,868 million euros (3,415 million euros in Latam and 2,934 million euros in Europe). For a more detailed information about payments due under this item, see Note 19 to our Consolidated Financial Statements.
|
|
(4)
|
This item includes definitive payments (non-cancellable without penalty cost) due for agreements to purchase goods (such as network equipment) and services.
|
|
(5)
|
“Other liabilities” include: (a) long-term obligations that require us to make cash payments, excluding financial debt obligations included in the table under “Financial Liabilities” above and (b) other provisions. Because of the nature of the risks covered by “Other liabilities” such as other provisions, it is not possible to determine a reliable schedule of potential payments, if any. For details of the composition of other provisions, see Note 15 to our Consolidated Financial Statements.
|
In addition, at December 31, 2013, we had short-term and long-term employee benefits provisions amounting to 763 million euros and 3,722 million euros, respectively (see Note 15 to our Consolidated Financial Statements).
For details of the composition of, and changes in, our debt, see “—Liquidity and Capital Resources—Anticipated Sources of Liquidity” and Note 13 to our Consolidated Financial Statements.
During 2013, our Board of Directors met 14 times. At March 21, 2014, our Board of Directors had met three times during 2014. At March 20, 2014, our directors, their respective positions on our Board and the year they were appointed to such positions were as follows:
|
Name
|
Age
|
First Appointed
|
Current Term Ends
|
|
Chairman
|
|||
|
Mr. César Alierta Izuel(1)
|
68
|
1997
|
2017
|
|
Vice-chairmen
|
|||
|
Mr. Isidro Fainé Casas(1)(2)
|
71
|
1994
|
2016
|
|
Mr. José María Abril Pérez (1)(3)(7)
|
62
|
2007
|
2018
|
|
Mr. Julio Linares López (5)(7)(8)
|
68
|
2005
|
2016
|
|
Members (vocales)
|
|||
|
Mr. José María Álvarez - Pallete López (1)
|
50
|
2006
|
2017
|
|
Mr. José Fernando de Almansa Moreno -Barreda(5)(6)(8)
|
65
|
2003
|
2018
|
|
Ms. Eva Castillo Sanz (6)(8)(10)
|
51
|
2008
|
2018
|
|
Mr. Carlos Colomer Casellas(1)(4)(7)(9)(10)
|
69
|
2001
|
2016
|
|
Mr. Peter Erskine(1)(7)(8)(9)
|
62
|
2006
|
2016
|
|
Mr. Santiago Fernández Valbuena
|
55
|
2012
|
2018
|
|
Mr. Alfonso Ferrari Herrero (1)(4)(5)(6)(8)(9)(10)
|
72
|
2001
|
2016
|
|
Mr. Luiz Fernando Furlán
|
67
|
2008
|
2018
|
|
Mr. Gonzalo Hinojosa Fernández de Angulo (1)(4)(5)(6)(8)(9)(10)
|
68
|
2002
|
2017
|
|
Mr. Pablo Isla Álvarez de Tejera(6)(9)
|
50
|
2002
|
2017
|
|
Mr. Antonio Massanell Lavilla(2)(4)(5)(7)(10)
|
59
|
1995
|
2016
|
|
Mr. Ignacio Moreno Martínez (3)(4)(6)(10)
|
56
|
2011
|
2017
|
|
Mr. Francisco Javier de Paz Mancho (1)(5)(6)(10)
|
55
|
2007
|
2018
|
|
Mr. Chang Xiaobing (11)
|
56
|
2011
|
2016
|
(1) Member of the Executive Commission of the Board of Directors.
(2) Nominated by Caja de Ahorros y Pensiones de Barcelona (“La Caixa”).
(3) Nominated by Banco Bilbao Vizcaya Argentaria, S.A. (“BBVA”).
(4) Member of the Audit and Control Committee of the Board of Directors.
(5) Member of the Institutional Affairs Committee.
(6) Member of the Regulation Committee.
(7) Member of the Innovation Committee.
(8) Member of the Strategy Committee.
(9) Member of the Nominating, Compensation and Corporate Governance Committee.
(10) Member of the Service Quality and Customer Service Committee.
(11) Nominated by China Unicom (Hong Kong) Limited.
Board Committees
At March 21, 2014, the committees of our Board of Directors and members thereof are as follows:
Executive Commission
Our Board of Directors has expressly delegated all of its authority and power to the Executive Commission except as prohibited by Spanish corporate law, under our Articles of Association, or under our Board Regulations. This commission is made up of fewer directors and meets more frequently than our Board of Directors. The members of the
Executive Commission are Mr. César Alierta Izuel, Mr. Isidro Fainé Casas, Mr. José María Abril Pérez, Mr. José María Álvarez-Pallete López, Mr. Carlos Colomer Casellas, Mr. Peter Erskine, Mr. Alfonso Ferrari Herrero, Mr. Gonzalo Hinojosa Fernández de Angulo, Mr. Francisco Javier de Paz Mancho and Mr. Ramiro Sánchez de Lerín García-Ovies, as secretary.
Audit and Control Committee
The Audit and Control Committee functions are regulated by our bylaws and our Board Regulations. The Audit and Control Committee has the primary objective of providing support to our Board of Directors in its supervisory and oversight functions, specifically having the following responsibilities:
|
·
|
to report, through its chairman, to our shareholders at the general shareholders’ meeting regarding matters raised therein by the shareholders relating to the functions and matters of competence of the committee;
|
|
·
|
to propose to our Board of Directors to submit to our general meeting of shareholders the appointment of our auditors referred to in Article 264 of the Spanish Corporation Law, as well as, when appropriate, the terms of their engagement, the scope of their professional assignment and the revocation, re-appointment or non-renewal of their appointment;
|
|
·
|
to supervise the effectiveness of the Company's internal control system, the internal audit and the risk management systems as well as to discuss with our auditors any significant weaknesses in the internal control system detected during the audit;
|
|
·
|
to supervise the preparation and submission of regulated financial information;
|
|
·
|
to establish and maintain the necessary relations with the auditors to receive, for review by the Committee, information on all matters that may put their independence at risk, and any other matters related to the process of auditing our accounts, as well as to receive information and maintain communication with our auditors as required by laws relating to the audit process and with respect to technical regulations on auditing. In any event, the Audit and Control Committee must receive annually written confirmation from our auditors of their independence vis-à-vis the entity or entities directly or indirectly related thereto, as well as information regarding additional services of any kind provided to such entities by our auditors, or by the persons or entities related thereto, in compliance with the current legislation; and
|
|
·
|
to issue on an annual basis, prior to the issuance of the audit report, a report stating an opinion regarding the independence of our auditors. This report must in all cases include an opinion on the provision of the additional services referred to in the immediately preceding paragraph.
|
The Audit and Control Committee meets at least once per quarter and as many times as considered necessary. During 2013, the Audit and Control Committee met ten times and, as of the date of this Annual Report, had met three times in 2014. The members of the Audit and Control Committee are Mr. Carlos Colomer Casellas (chairman), Mr. Gonzalo de Hinojosa Fernández de Angulo, Mr. Antonio Massanell Lavilla, Mr. Alfonso Ferrari Herrero and Mr. Ignacio Moreno Martínez. Our Board of Directors has determined that Mr. Antonio Masanell Lavilla meets the requirements of an “audit committee financial expert” as such term is defined by the SEC.
Nominating, Compensation and Corporate Governance Committee
The Nominating, Compensation and Corporate Governance Committee is responsible for, among other things, reporting to our Board of Directors with respect to proposals for the appointment, re-election and removal of directors, members of the Executive Committee and the other committees of our Board of Directors and top members of our management and management of our subsidiaries. In addition, the Nominating, Compensation and Corporate Governance Committee is responsible for proposing to the Board of Directors, within the framework established in the bylaws, the compensation for the directors and reviewing it periodically to ensure that it is in keeping with the tasks performed by them, as provided in Article 34 of the Board Regulations, to propose to the Board of Directors, within the framework established in the bylaws, the extent and amount of the compensation, rights and remuneration of a financial nature, of the chairman, the executive directors and the senior executive officers of Telefónica, including the basic terms of their contracts, for purposes of contractual implementation thereof and to supervise compliance with Telefónica’s internal rules of conduct and the corporate governance rules thereof in effect from time to time.
The members of the Nominating, Compensation and Corporate Governance Committee are Mr. Alfonso Ferrari Herrero (chairman), Mr. Carlos Colomer Casellas, Mr. Peter Erskine, Mr. Gonzalo Hinojosa Fernández de Angulo and Mr. Pablo Isla Álvarez de Tejera. During 2013, the Nominating, Compensation and Corporate Governance Committee met eleven times, and as of the date of this Annual Report, it had met one time in 2014.
Regulation Committee
The Regulation Committee’s main objective is to monitor the main regulatory matters which affect us. Another responsibility of the Regulation Committee is to act as a communication and information channel between our management team and our Board of Directors concerning regulatory matters. The members of the Regulation Committee are Mr. Gonzalo de Hinojosa Fernández de Angulo (chairman), Mr. José Fernando de Almansa Moreno-Barreda, Ms. Eva Castillo Sanz, Mr. Alfonso Ferrari Herrero, Mr. Pablo Isla Alvarez de Tejera, Mr. Ignacio Moreno Martínez and Mr. Francisco Javier de Paz Mancho.
During 2013, the Regulation Committee met three times, and of the date of this Annual Report, it had met one time in 2014.
Service Quality and Customer Service Committee
The Service Quality and Customer Service Committee is responsible for monitoring and reviewing the standards of quality of the main services we provide. The Service Quality and Customer Service Committee acts as an information channel between our senior management team and our Board of Directors. The members of the Service Quality and Customer Service Committee are Mr. Antonio Massanell Lavilla (chairman), Ms. Eva Castillo Sanz, Mr. Carlos Colomer Casellas, Mr. Alfonso Ferrari Herrero, Mr. Gonzalo Hinojosa Fernández de Angulo, Mr. Ignacio Moreno Martínez and Mr. Javier de Paz Mancho. During 2013 the Service Quality and Customer Service Committee met three times, and as of the date of this Annual Report, it has held no meetings in 2014.
Institutional Affairs Committee
The Institutional Affairs Committee is responsible for reviewing, reporting and proposing to the Board of Directors the principles that are to govern the Group’s Sponsorship and Patronage Policy, to monitor such policy, and to individually approve sponsorships or patronages the amount or importance of which exceed the limit set by the Board and which require its approval. The Committee is responsible for promoting the development of the Telefónica Group’s Corporate Reputation and Responsibility project and its institutional affairs. The members of the Institutional Affairs Committee are Mr. Julio Linares López (chairman), Mr. José Fernando de Almansa Moreno-Barreda, Mr. Alfonso Ferrari Herrero, Mr. Gonzalo de Hinojosa Fernández de Angulo, Mr. Antonio Massanell Lavilla and Mr. Francisco Javier de Paz Mancho. During 2013, the International Affairs Committee met six times, and as of the date of this Annual Report it had met two times in 2014.
Innovation Committee
The Innovation Committee is responsible for advising and assisting in all matters regarding innovation. Its main object is to examine, analyze and periodically monitor the Group’s innovation projects, provide guidance and help ensure the implementation and development of innovation initiatives across the Group. The members of the Innovation
Committee are Mr. Carlos Colomer Casellas (chairman), Mr. José María Abril Pérez, Mr. Antonio Massanell Lavilla, Mr. Julio Linares López and Mr. Peter Erskine. During 2013, the Innovation Committee met 11 times, and as of the date of this Annual Report, it had met one time in 2014.
Strategy Committee
Without prejudice to any other tasks that the Board of Directors may assign thereto, the primary duty of the Strategy Committee is to support the Board of Directors in the analysis and implementation of the global strategy policy of the Telefónica Group. The members of the Strategy Committee are Mr. Peter Erskine (chairman), Mr. José Fernando de Almansa Moreno-Barreda, Ms. Eva Castillo Sanz, Mr. Alfonso Ferrari Herrero, Mr. Julio Linares López and Mr. Gonzalo Hinojosa Fernández de Angulo. The Strategy Committee met ten times during 2013, and as of the date of this Annual Report, had met once in 2014.
Biographies of Directors
Mr. César Alierta Izuel serves as our executive chairman and chairman of our Board of Directors. Mr. Alierta began his career in 1970 as general manager of the capital markets division at Banco Urquijo, S.A. in Madrid, where he worked until 1985. Subsequently, he founded and served as chairman of Beta Capital Sociedad de Valores, S.A. which he combined as from 1991 with his post as chairman of the Spanish Financial Analysts’ Association (Instituto Español de Analistas Financieros). Between 1996 and 2000, he was director and chairman of Tabacalera, S.A. At that time Tabacalera, S.A. changed its name into Altadis, S.A. (following its merger with the French Group, Seita-Société Nationale D’Éxplotation Industrielle des Tabacs et Allumettes) and he became director and chairman of Altadis, S.A. He has also been a member of the board of directors of the Madrid Stock Exchange (Bolsa de Madrid), Plus Ultra Compañía de Seguros y Reaseguros, S.A. and of Iberia, S.A. On January 1997, Mr. Alierta was appointed as a director of Telefónica and on July 26, 2000, he was appointed as our executive chairman. Mr. Alierta is director of China Unicom (Hong Kong) Limited since October 15, 2008, and of International Consolidated Airlines Group (IAG) since September 2010. Mr. Alierta has been a director of Telecom Italia from November 8, 2007, to December 13, 2013. Mr. Alierta holds a law degree from the University of Zaragoza and an MBA from Columbia University (New York) and is currently a member of the Columbia Business School Board of Overseers, and chairman of the Social Board of the UNED (National Long Distance Spanish University).
Mr. Isidro Fainé Casas serves as vice-chairman of our Board of Directors. For over 40 years, Mr. Fainé has worked in several financial institutions, including amongst others: Banco Atlántico, S.A., (1964), Banco de Asunción (Paraguay) (1969), Banco Riva y García, S.A. (1973), Banca Jover, S.A. (1974), and Banco Unión, S.A. (1978). Mr. Fainé is currently chairman of Caja de Ahorros y Pensiones de Barcelona (“la Caixa”), of Caixa Bank, S.A., of Criteria Caixaholding, S.A., and of Confederación Española de Cajas de Ahorros; first vice-chairman of Abertis Infraestructuras, S.A, of Sociedad General de Aguas de Barcelona, S.A. (AGBAR), of European Savings Bank Group (ESGB) and of World Savings Bank Institute (WSBI); and first vice-chairman of Repsol S.A. He is also a member of the board of directors of Banco Portugués de Investimento, S.A. (BPI), and a non-executive director of Bank of East Asia. Mr. Fainé holds a doctorate degree in economics, a diploma in Alta Dirección (Senior Management) from IESE Business School (Instituto de Estudios Superiores de la Empresa) and an ISMP in business administration from Harvard University. He is a member of the Royal Academy of Economics and Finance (Real Academia de Ciencias Económicas y Financieras).
Mr. José María Abril Pérez serves as vice-chairman of our Board of Directors. From 1975 to 1982 he served as financial manager of Sociedad Anónima de Alimentación (SAAL). Since then, and until he joined the Banco Bilbao Vizcaya Argentaria Group (BBVA), he was financial manager of Sancel-Scott Ibérica, S.A. In 1985 he joined Banco Bilbao, S.A. as managing director of Investment Corporate Banking. From January to April 1993, he was appointed executive coordinator of Banco Español de Crédito, S.A. In 1998, he became general manager of the Industrial Group of BBV. In 1999, he was appointed member of the executive committee of the BBV Group. He has also been a member of the board of directors of Repsol, S.A., Iberia, S.A., Corporación IBV, Advancell, S.A. and vice president of Bolsas y Mercados Españoles, S.A.. In 2002 he became managing director of the Wholesale and Investment Banking Division and a member of the executive committee of BBVA, and he is now in early retirement. He holds a degree in economics from the University of Deusto (Bilbao, Spain) and he has been professor at such university for nine years.
Mr. Julio Linares López serves as vice-chairman of our Board of Directors since September 2012 and had been our chief operating officer since December 19, 2007, until September 2012. In May 1970, he joined our Research and Development Center, where he held several positions until he was appointed head of our Technology Department in 1984. In April 1990, he was appointed general manager of Telefónica Investigación y Desarrollo, S.A. In December 1994, he became deputy general manager of the Marketing and Services Development department in the commercial area and
subsequently, deputy general manager for Corporate Marketing. In July 1997, he was appointed chief executive officer of Telefónica Multimedia S.A. and chairman of Telefónica Cable and Producciones Multitemáticas, S.A. In May 1998 he was appointed general manager of Strategy and Technology in Telefónica, S.A. In January 2000, he was appointed executive chairman of Telefónica de España, S.A., a position which he held until December 2005, when he was appointed our managing director for Coordination, Business Development and Synergies. Mr. Linares was a director of Telecom Italia until December 13, 2013. He is currently member of the Social Council of the Complutense University of Madrid and member of the Board of Directors and the Executive Committee of the GSM Association and Patron of the Barcelona Mobile World Capital Foundation. Mr. Linares holds a degree in telecommunications engineering from the Polytechnic University of Madrid (Universidad Politécnica de Madrid).
Mr. José María Álvarez-Pallete López serves as a director of our Board of Directors and, since September 2012 as our chief operating officer. From September 11, 2011, to September 2012, he served as chairman of Telefónica Europe. He began his career at Arthur Young Auditors in 1987. In 1988, he joined Benito & Monjardín/Kidder, Peabody & Co., where he held various positions in the research and corporate finance departments. In 1995, he joined Valenciana de Cementos Portland, S.A. (Cemex) as head of the Investor Relations and Studies department. In 1996 he was promoted to chief financial officer of Cemex Group in Spain, and in 1998, to chief administration and financial officer of Cemex in Indonesia, headquartered in Jakarta, and he was appointed member of the Board of Cemex Asia, Ltd. In February 1999 he joined the Telefónica Group as general manager of Finance for Telefónica International, S.A. In September of the same year he was promoted to chief financial officer of Telefónica. In July 2002, he was appointed chairman and chief executive officer of Telefónica Internacional, S.A., in July 2006 general manager of Telefónica Latin America, and in March 2009, chairman of Telefónica Latin America. Mr. Álvarez-Pallete holds a degree in economics from the Complutense University of Madrid. He also studied economics at the Université Libre de Belgique and holds an International Management Program from the Pan-American Institute of Executive Business Administration (IPADE) and an advance research degree (DEA) from the department of finance and accounting of the Complutense University of Madrid.
Mr. José Fernando de Almansa Moreno-Barreda serves as a director of our Board of Directors. In December 1974 he joined the Spanish Diplomatic Corps (Cuerpo Diplomático) and served from 1976 to 1992 as secretary of the Spanish Embassy in Brussels, Cultural Counselor of the Spanish Delegation to Mexico, chief director for Eastern European Affairs, director of Atlantic Affairs in the Spanish Foreign Affairs Ministry, counselor to the Spanish Permanent Representation to NATO in Brussels, minister-counselor of the Spanish Embassy in the Soviet Union, general secretary of the National Commission for the 5th Centennial of the Discovery of the Americas and deputy general director for Eastern Europe Affairs in the Spanish Foreign Affairs Ministry. From 1993 to 2002, Mr. Fernando de Almansa was appointed chief of the royal household by His Majesty King Juan Carlos I, and is currently personal advisor to His Majesty the King. He is also a director of Telefónica Brasil S.A., Telefónica Móviles México, S.A. de C.V. and a substitute director of Grupo Financiero BBVA Bancomer, S.A. de C.V. and of BBVA Bancomer, S.A.. He holds a law degree from the University of Deusto (Bilbao, Spain).
Ms. Eva Castillo Sanz serves as a director of our Board of Directors. Ms. Castillo began her career at the Spanish broker Beta Capital Sociedad de Valores, S.A., where she worked for five years. After that, she worked for another five years for Goldman Sachs International in London in the International Equities department. In 1997 Ms. Castillo joined Merrill Lynch as head of Equity Markets for Spain and Portugal. In 1999, she was promoted to Country Manager for Spain and Portugal and in 2000 she became chief executive officer of Merrill Lynch Capital Markets Spain. After that, Ms. Castillo was appointed chief operating officer for EMEA Equity Markets. In October 2003 she was appointed head of Global Markets & Investment Banking in Spain and Portugal, as well as president of Merrill Lynch Spain. Until December 2009, she headed Global Wealth Management business operations in Europe, the Middle East and Africa, including Merrill Lynch Bank (Suisse) and the International Trust and Wealth Structuring business. She was a member of the Merrill Lynch EMEA Executive Committee, the Global Wealth Management Executive and Operating Committees. Ms. Castillo has been Chairwoman of Telefónica Europe from September 2012 to February 2014. Currently, Ms. Castillo is the president of the supervisory board of Telefónica Deutschland Holding AG, member of the board of Bankia, S.A. and member of the Patronato de la Fundación Comillas-ICAI. Ms. Castillo holds degrees in business, economics and law (ICADE – E3) from the Universidad Pontificia de Comillas of Madrid.
Mr. Carlos Colomer Casellas serves as a director of our Board of Directors. Mr. Colomer began his career in 1970 as marketing vice-chairman of Henry Colomer, S.A. In 1980, he was appointed chairman and general manager of Henry Colomer, S.A. and Haugron Cientifical, S.A. In 1986, he was also appointed president of Revlon for Europe. In 1989, he became chairman of Revlon International and in 1990, he was appointed executive vice-president and chief operating officer of Revlon Inc. in New York. In 2000, he was appointed chairman and chief executive officer of The Colomer Group. He is also chairman of Ahorro Bursátil, S.A. SICAV, Inversiones Mobiliarias Urquiola, S.A. SICAV, Haugron Holdings S.L,
and director of Abertis Infraestructuras S.A. Mr. Colomer has a degree in economics from the University of Barcelona and an MBA from IESE Business School (Instituto de Estudios Superiores de la Empresa).
Mr. Peter Erskine serves as a director of our Board of Directors. He began his career in the field of marketing and trade mark management in Polycell and in Colgate Palmolive. He worked for several years at the Mars Group, serving as vice-chairman for Europe of Mars Electronics. In 1990 he was appointed vice-president of Marketing and Sales of Unitel. From 1993 to 1998, he held a number of senior positions, including director of British Telecom (BT) Mobile and president and chief executive officer of Concert. In 1998 he became managing director of BT Cellnet. Subsequently, in 2001 he became chief executive officer and a director of the board of directors of Telefónica Europe, Plc. In 2006 he became executive chairman of Telefónica Europe, Plc (until December 31, 2007, after which he became a non-executive director) and from July 2006 until December 2007 he served as general manager of the business unit Telefónica Europe. In January 2009 he joined the Board of Ladbrokes Plc. as a non executive director, becoming chairman in May 2009. Currently, he is also member of the advisory board of Henley Management Centre and a member of the Council of Reading University. In 1973, he received a degree in psychology from Liverpool University.
Mr. Santiago Fernández Valbuena is Chief Strategy Officer (CSO) since February 2014. Member of the Board of Telefónica S.A. and Deputy Chairman of Telefônica do Brasil. He has been Chairman & CEO of Telefónica Latin America (2011-2014), Chief Finance and Strategy Officer (2010-2011) and Chief Financial and Corporate Development Officer (2002-2010). Throughout this period he was also responsible (not continuously) for Procurement, IT, HR, Internal Audit and Subsidiaries (Atento, Endemol). From 1997 to 2002 he was CEO of Fonditel, the pension fund manager for Telefónica. Since 2008 he serves as Independent Director at Ferrovial S.A. and member of its Audit Committee. Before joining Telefónica he was Managing Director at Société Générale de Valores and Head of Equities at Beta Capital in Madrid. He holds a PhD in Economics and a Masters (MS) degree from Northeastern University in Boston. He has been a Professor of Applied Economics at Complutense University in Madrid and the Universidad de Murcia and has lectured at Instituto de Empresa (IE Business School) in Madrid.
Mr. Alfonso Ferrari Herrero serves as a director of our Board of Directors. From 1968 to 1969 he was assistant to the financial manager of Hidroeléctrica del Cantábrico, S.A. From 1969 to 1985, he worked in Banco Urquijo, S.A. holding several positions as analyst, manager of Industrial Investments and as a representative in several subsidiaries of Banco Urquijo, S.A. in his capacity as member of the board of directors. From 1985 to 1996 he was a member of the board of directors and manager of Corporate Finance of Beta Capital Sociedad de Valores, S.A., of which Mr. Ferrari was a co-founder. From 1996 until 2000 served as chairman and chief operating officer of Beta Capital, S.A. Currently, he is a director of Telefónica del Perú, S.A.A. and an alternate director of Telefónica Chile, S.A. He has a doctorate in industrial engineering from the Industrial Engineers Technical School of the Polytechnic University of Madrid (Escuela Técnica Superior de Ingenieros Industriales de la Universidad Politécnica de Madrid) and holds an MBA from Harvard University.
Mr. Luiz Fernando Furlán serves as a director of our Board of Directors, and of Telefónica Brasil, S.A. Throughout his career he has been a member of the board of directors of several companies in Brazil and abroad such as Sadia, S.A., Embraco, S.A. (Brasmotor Group-Brazil) and Panamco (Pan American Beverages, Inc. – USA). He was also member of the consulting board of IBM in Latin America and of ABN Amro Bank in Brazil, as well as chairman of Brazilian Chicken Exporters Association (ABEF), Brazilian Association of Public Owned Companies (ABRASCA) and of Mercosur European Union Business Forum (MEBF). He also was vice-president of São Paulo Entrepreneurs Association (FIESP). From 2003 to 2007 he was Minister of Development, Industry and Foreign Trade of Brazil. Currently he is chairman of the board of directors of Amazonas Sustainability Foundation and member of the Global Ocean Commission. He is also member of the board of directors of BRF-Brasil Foods, S.A., and of AGCO Corporation, and member of the Advisory/Consultive Board of Panasonic (Japan), McLarty & Associates (USA), Wal-Mart Stores Inc. (USA) and Abertis Infraestructuras, S.A. He holds a degree in chemical engineering from the Industrial Engineering Faculty of São Paulo and in business administration from University of Santana (São Paulo), with specialization in financial administration from Fundação Getúlio Vargas (São Paulo).
Mr. Gonzalo Hinojosa Fernández de Angulo serves as a director of our Board of Directors and of Telefónica del Perú, S.A.A. He began his career in 1966 in Cortefiel, S.A. and served in several management positions since then. From 1976 to 1985 Mr. Hinojosa was general manager of Cortefiel, S.A. and from 1985 until 2005 he served as chief executive officer of Cortefiel Group, a post which he combined with his appointment as chairman from 1998 until 2006. From 1991 through 2002, he served as a director of Banco Central Hispano Americano, S.A. and as a director of Portland Valderribas, S.A. He has also served as a director of Altadis, S.A. (1998-2007) and of Dinamia Capital Privado, S.A., SCR. Mr. Hinojosa has a degree in industrial engineering from the Industrial Engineers Technical School of the
Polytechnic University of Madrid (Escuela Técnica Superior de Ingenieros Industriales de la Universidad Politécnica de Madrid).
Mr. Pablo Isla Álvarez de Tejera serves as a director of our Board of Directors. Mr. Isla began his career in 1989 as government attorney (abogado del estado), and he joined the Body of Government Attorneys that year, in the first position of the candidates, for the Spanish Ministry of Transportation, Tourism and Communications. In 1991 he moved to the General Management of the Legal Services of the Spanish Government (Dirección General del Servicio Jurídico del Estado). From 1992 to 1996, Mr. Isla served as general manager of the Legal Services Department of Banco Popular, S.A. In 1996, he was appointed general manager of the National Heritage Department of the Treasury Department of Spain (Ministerio de Economía y Hacienda). He also served as general secretary of Banco Popular Español, S.A. from 1998 to 2000. In July 2000, Mr. Isla was appointed chairman of the board of Grupo Altadis and co-chairman of the company. In June 2005, Mr. Isla was appointed the deputy chairman and chief executive officer of Inditex, S.A.. Since 2011, Mr. Isla has been the chairman of Inditex, S.A. Mr. Isla has a degree in law from the Complutense University of Madrid.
Mr. Antonio Massanell Lavilla serves as a director of our Board of Directors. In 1971 he joined the Caja de Ahorros y Pensiones de Barcelona (“Caixa”), where he held several posts and in 1990, he was appointed assistant manager and secretary of the Steering Committee, and from 1999 to June 2011 he served as executive general assistant manager. In the same year, he was appointed member of the board of directors of Sociedad Española de Medios de Pago, S.A. From 1992 to 1994, Mr. Massanell served as chairman of the Steering Committee of Sistema 6000 de la Confederación Española de Cajas de Ahorros, and director of Visa Spain (1995-1998), Autema (1991-2003), Colonial Real Estate (1992-2003), Baqueira Beret (1998-2006), Occidental Hotels Management, B.V. (2003-2007), e-la Caixa, S.A, Caixa Capital Risc, S.G.E.C.R, S.A and Serveis Informátics “La Caixa”, S.A. Mr. Massanell is currently general manager of Caixa Bank and non-executive director of Cecabank. He is also a member of the boards of directors of Boursorama, S.A., SAREB (Sociedad de Gestión de Activos Inmobiliarios procedentes de la Reestructuración Bancaria), Mediterránea Beach & Golf Community, S.A. He is also chairman of Barcelona Digital Centre Tecnológic (former Fundación Barcelona Digital). Mr. Antonio Massanell Lavilla holds a degree in economics from the University of Barcelona.
Mr. Ignacio Moreno Martínez serves as a director on our Board of Directors. Previous posts include head of Corporate Banking and Private Equity at Banco de Vizcaya, Banco Santander de Negocios, and Mercapital. He also served as deputy general manager of Corporate and Institutional Banking at Corporación Bancaria de España, S.A. – Argentaria, Chief executive officer of Desarrollo Urbanístico Chamartín, S.A., and chairman of Argentaria Bolsa, Sociedad de Valores. In addition, he also served as general manager of the chairman’s Office at Banco Bilbao Vizcaya Argentaria, S.A., and chairman executive officer of Vista Capital Expansión, S.A., SGECR – Private Equity. Mr. Moreno is currently chief executive officer of N+1 Private Equity and non-executive president of Metrovacesa, S.A.. Mr. Moreno holds a degree in Economics and Business Studies from the University of Bilbao, a Master’s degree in Marketing and Sales Management from the Instituto de Empresa and an MBA from INSEAD.
Mr. Francisco Javier De Paz Mancho serves as a director of our Board of Directors. From 1990 to 1993, he was general secretary of the Spanish Consumers Association (Unión de Consumidores de España, UCE). From 1993 to 1996, he served as general manager of Internal Trade of the Spanish Ministry of Tourism and Commerce. From 1994 to 1996, he was chairman of the Observatory of Trading of the Spanish Ministry of Tourism and Commerce (Observatorio de la Distribución Comercial del Ministerio de Comercio y Turismo); from 1996 to 2004, he was corporate strategy manager of the Panrico Donuts Group. From 1998 to 2004, he served as director of Mutua de Accidentes de Zaragoza (MAZ) and of the Panrico Group. From 2004 to 2006, he was director of Tunel de Cadí, S.A.C. and from 2003 to 2004, he served as chairman of the Patronal Pan y Bollería Marca (COE). From 2004 to 2007, he was chairman of the National Company MERCASA. He has also been a member of the board of directors of Altadis, S.A., and of the Economic and Social Board and its permanent commission. From July 2006, he has been a member of the Executive Committee of the Chambers Board (Consejo Superior de Cámaras). Currently, he is director of Telefónica de Argentina, S.A. and Telefónica Brasil, S.A. Mr. de Paz has a diploma in publicity and information and followed studies in law. He followed a Programa de Alta Dirección de Empresas from the IESE Business School (Instituto de Estudios Superiores de la Empresa, University of Navarra).
Mr. Chang Xiaobing serves as a director of our Board of Directors. Prior to joining China United Telecommunications Corporation, Mr. Chang served as deputy director of the Nanjing Municipal Posts and Telecommunications Bureau of Jiangsu Province, deputy director General of the Directorate General of Telecommunications of the Ministry of Posts and Telecommunications, and deputy director General and director general of the Department of Telecommunications Administration of the former Ministry of Information Industry, as well as vice
president of China Telecommunications Corporation. Mr. Chang became the chairman of China United Telecommunications Corporation in November 2004. He was appointed in December 2004 as an executive director, chairman and chief executive officer of China Unicom (Hong Kong) Limited. In December 2008, China United Telecommunications Corporation changed its company name to China United Network Communications Group Company Limited ("Unicom Group"). He serves as the chairman of Unicom Group, China United Network Communications Limited ("A Share Company") and China United Network Communications Corporation Limited ("CUCL"), respectively. Mr. Chang graduated in 1982 from the Nanjing Institute of Posts and Telecommunications with a bachelor's degree in telecommunications engineering and received a master's degree in business administration from Tsinghua University in 2001. He received a doctorate in business administration from the Hong Kong Polytechnic University in 2005.
Executive Officers/Management Team
At March 21, 2014, our executive management team consisted of the following individuals:
|
Name
|
Position
|
Appointed
|
Age
|
|||
|
Mr. César Alierta Izuel
|
Chairman of the Board of Directors and Chief Executive Officer
|
2000
|
68
|
|||
|
Mr. José María Álvarez -Pallete López
|
Chief Operating Officer
|
2012
|
50
|
|||
|
Mr. Santiago Fernández Valbuena
|
Chief Strategy Officer
|
2011
|
54
|
|||
|
Mr. Guillermo Ansaldo Lutz
|
Chief Global Resources Officer
|
2011
|
52
|
|||
|
Mr. Ramiro Sánchez de Lerín Garcia-Ovies
|
General Secretary and Secretary to the Board
|
2005
|
59
|
|||
|
Mr. Angel Vilá Boix
|
Chief Financial and Corporate Development Officer
|
2011
|
49
|
|||
|
Mr. Eduardo Navarro de Carvalho
|
Chief Commercial Digital Officer
|
2012
|
51
|
|||
|
Mr. Ignacio Cuesta
|
General Manager of Internal Audit
|
2012
|
52
|
Biographies of the Executive Officers and Senior Management
We present below the biographies of our executive officers and senior management who do not also serve on our Board of Directors.
Mr. Guillermo Ansaldo Lutz serves as Chief Global Resources Officer (CGRO) of Telefónica Global Resources operating unit since September 2011, he is also member of the Executive Committee of Telefónica. From 1989 to 2000 he worked for McKinsey & Company holding different positions in Spain and Argentina. In 1995, he was appointed partner of McKinsey & Company in Argentina. From 2000 to 2004 he was the chief executive officer of Telefónica de Argentina, S.A. and since April 2005, he held the position of chief executive officer of Telefónica de España, S.A. From December 2007 to September 2011 he was chairman and chief executive officer of Telefónica España. He holds a degree in industrial engineering from the Universidad de Buenos Aires and an MBA from The Amos Tuck School of Business Administration, Dartmouth College.
Mr. Ramiro Sánchez de Lerín García-Ovies serves as our general secretary and secretary to our Board of Directors. He is also a member of the Executive Committee. He began his career in Arthur Andersen, first working for its audit department and later for its tax department. In 1982, he became a government attorney (abogado del estado) and started working for the local tax authorities in Madrid (Delegación de Hacienda de Madrid). Afterwards he was assigned to the State Secretariat for the European Communities and later to the Foreign Affairs Ministry. He has been general secretary and secretary of the board of Elosúa, S.A., Tabacalera, S.A., Altadis, S.A. and Xfera Móviles, S.A. He has also held teaching positions in Instituto Católico de Administración y Dirección de Empresas (ICADE), Instituto de Empresa and Escuela de Hacienda Pública.
Mr. Vilá is Chief Financial and Corporate Development Officer (CF&CDO) and Member of the Executive Committee of the Telefónica Group. He joined Telefónica in 1997 as Group Controller, moving on to become CFO of Telefónica Latinoamérica. In 2000 he was appointed Group Head of Corporate Development, in charge of corporate M&A transactions.Mr. Vilá is currently Vice chairman of the Board of Directors of Telco SpA (Italy), and Board member of Telefónica Germany. He previously served on the Boards of BBVA, Endemol, Digital Plus, Atento, Telefónica Contenidos, Telefónica Czech Republic, CTC Chile, Indra SSI, Terra Lycos and the Advisory panel of Macquarie MEIF funds. He is a Patron in the Telefónica Foundation. Prior to joining Telefónica, he held positions at Citigroup, McKinsey&Co, Ferrovial
and Planeta. Mr. Vilá graduated in Industrial Engineering from Universitat Politècnica de Catalunya and holds a MBA from Columbia University (New York).
Mr. Eduardo Navarro de Carvalho is Chief Commercial Digital Officer at Telefónica S.A and member of the Executive Committee. He joined Telefónica in 1999, and since then he has been responsible for Strategy and Alliances for Telefónica Group from 2010 to February 2014, responsible for Strategy and Regulatory Affairs for Telefónica Latin America from 2005 to 2009, and for Telefónica Brasil from 1999 to 2004. Previously, he worked for 5 years as a Consultant in Mckinsey & Company, focused on Infrastructure and Telecommunications Projects in several countries and also worked as Steel Works Manager in the Group ARBED in Brazil. He is a graduate in Metallurgical Engineering from the Federal University of Minas Gerais, Brazil.
Mr. Ignacio Cuesta is the chief audit executive of the Telefónica Group since January 2013. He joined the Telefónica International financial department in January 1995 as Manager. In 1999 he joined Telefónica, S.A., working in the corporate finance department for the next ten years. In 2001, he was appointed deputy chief financial officer of Telefónica’s Corporation in charge of several areas as accounting, financial planning and taxes among others. In October 2009 he was appointed Telefónica Latin America chief financial officer, working in that role for the next three years. Previously he had worked as a financial auditor for an audit firm and as internal auditor and as Chief Consolidation Accounting Officer for the multinational Pedro Domecq. From 2004 to 2009, he was nominated member of the Standard Advisory Committee of the Spanish Institute of Accounting and Auditing and member of the Accounting Experts Group of the CNMV. He holds a degree in Economics.
Please see Note 21(f) and Annex II to our Consolidated Financial Statements for information on the compensation paid to members of our Board of Directors and Executive Officers/Senior Management Team during the year 2013.
Incentive Plans
Please see Note 19 to our Consolidated Financial Statements.
Please see “—Directors and Senior Management” above.
Please see “Headcount” in Note 18 to our Consolidated Financial Statements.
At March 21, 2014, the following members of our Board of Directors beneficially owned directly or indirectly an aggregate of 7,740,521 shares, representing approximately 0.170% of our capital stock.
|
Name or corporate name of director
|
Number of direct voting rights
|
Number of indirect voting rights
|
% of total voting rights
|
|
|
Name or corporate name of direct shareholder
|
Number of voting rights
|
|||
|
Mr. César Alierta Izuel
|
4,419,548
|
— | — |
0.097
|
|
Mr. Isidro Fainé Casas
|
508,875
|
— |
—
|
0.011
|
|
Mr. José María Abril Pérez
|
94,586
|
— |
108,386
|
0.004
|
|
Mr. Julio Linares López
|
418,946
|
— |
1,887
|
0.009
|
|
Mr. José María Álvarez-Pallete López
|
325,841
|
— |
—
|
0.007
|
|
Mr. Alfonso Ferrari Herrero
|
586,352
|
— |
19,499
|
0.013
|
|
Mr. Antonio Massanell Lavilla
|
2,346
|
— |
—
|
0.000
|
|
Mr. Carlos Colomer Casellas
|
49,360
|
— |
63,190
|
0.002
|
|
Mr. Francisco Javier de Paz Mancho
|
55,273
|
— |
—
|
0.001
|
|
Mr. Gonzalo Hinojosa Fernández de Angulo
|
87,725
|
— |
447,474
|
0.012
|
|
Mr. Ignacio Moreno Martínez
|
12,713
|
— |
—
|
0.000
|
|
Mr. José Fernando de Almansa Moreno-Barreda
|
19,449
|
— |
—
|
0.000
|
|
Mr. Luiz Fernando Furlán
|
34,035
|
— |
—
|
0.001
|
|
Ms. Eva Castillo Sanz
|
97,089
|
— |
—
|
0.002
|
|
Mr. Pablo Isla Álvarez de Tejera
|
8,816
|
— |
—
|
0.000
|
|
Mr. Peter Erskine
|
71,081
|
— |
—
|
0.002
|
|
Mr. Santiago Fernández Valbuena
|
308,050
|
— |
—
|
0.007
|
|
Mr. Chang Xiaobing
|
—
|
— |
—
|
0.000
|
At March 21, 2014, members of our executive management team (excluding members of our Board of Directors listed above) beneficially owned an aggregate of 695,989 of our shares, representing approximately 0.01% of our capital stock.
None of our directors or executive officers beneficially owned shares representing one percent or more of our share capital at March 21, 2014.
None of our directors and executive officers held options in respect of shares representing one percent or more of our share capital at March 21, 2014.
Please see “Share-based payment plans” in Note 19 to our Consolidated Financial Statements.
General
At March 21, 2014, we had 4,551,024,586 shares outstanding, each having a nominal value of 1.00 euro per share. All outstanding shares have the same rights.
At March 21, 2014, according to information provided to us or to the Spanish National Securities Commission, (la Comisión Nacional de Mercado de Valores, or the “CNMV”), beneficial owners of 3% or more of our voting stock were as follows:
|
Name of Beneficial Owner
|
Number of Shares
|
Percent
|
|
|
Banco Bilbao Vizcaya Argentaria, S.A.(1)
|
313,707,133
|
6.893%
|
|
|
Caja de Ahorros y Pensiones de Barcelona (“la Caixa”)(2)
|
246,977,147
|
5.43%
|
|
|
Blackrock, Inc.(3)
|
177,257,649
|
3.895%
|
|
|
(1)
|
Based on the information provided by Banco Bilbao Vizcaya Argentaria, S.A. as at December 31, 2013, for the 2013 Annual Report on Corporate Governance.
|
|
|
(2)
|
Based on information provided by Caja de Ahorros y Pensiones de Barcelona, “la Caixa” as at December 31, 2013, for the 2013 Annual Report on Corporate Governance. The 5.41% indirect shareholding in Telefónica is owned by Caixa Bank, S.A.
|
|
|
(3)
|
According to notification sent to the CNMV, dated February 4, 2010.
|
To the extent that our shares are represented by account in the book-entry form, we do not keep a shareholder registry and our ownership structure cannot be known precisely. Based on the information available to us there is no individual or corporation that directly or indirectly through one or more intermediaries may exercise any type of control over us. Nevertheless, we have certain shareholders whose holdings are considered material.
Ownership Limitations
There are no limitations with respect to the ownership of our assets or share capital except those related to assets derived from the application of the reciprocity principle. Article 6 of the General Telecommunications Law, or the GTL, provides for the application of the reciprocity principle under existing international treaties or agreements signed and ratified by Spain. The Spanish government, upon request, may authorize exceptions to the reciprocity principle contained in the GTL.
During 2013 and through the date of this Annual Report, none of our directors nor any member of our management team has been involved in any related party transactions with us.
Our Board of Directors’ Regulations grant the Board of Directors the exclusive power to authorize any transactions with major shareholders or with our directors. Prior to authorizing any such transaction, our Board will receive an opinion from the Nominating, Compensation and Corporate Governance Committee addressing the fairness of the transaction to our shareholders and us. Any of our directors that may have an interest in the proposed transaction must abstain from voting on the proposed transaction.
Related Party Transactions with Significant Shareholders
Two of our major shareholders are financial institutions (see “—Major Shareholders—General” above). We have entered into related party transactions with both companies within our ordinary course of business, and always on arm’s length terms. During 2013, the executed transactions were generally loans, capital markets or derivative transactions provided to us by these financial institutions and agreements for us to provide telecommunications and broadband services to such institutions.
In addition, please see Note 10 to our Consolidated Financial Statements.
Intra-Group Loans
We are the parent company of the Telefónica Group and operate through our subsidiaries and affiliated companies. We coordinate group policies, including financial policy and, in some cases, actual financial management is conducted by us. Most of the transactions we perform with other members of the Telefónica Group relate to financing transactions, including covering their needs for funds and providing interest rate and exchange rate hedges.
At December 31, 2013, as recorded in our parent company accounts, we loaned a total of 9,806 million euros (6,782 million euros at December 31, 2012) to companies of the Telefónica Group while companies of the Telefónica Group and their associates loaned us a total of 49,895 million euros (49,536 million euros at December 31, 2012), of which 6,875 million euros (5,263 million euros at December 31, 2012) was loaned to us by Telefónica Europe, B.V. and 35,930 million euros (36,677 million euros at December 31, 2012) was loaned to us by Telefónica Emisiones S.A.U., our financing subsidiaries devoted to raising funds in the capital markets, 3,635 million euros (5,774 million euros at December 31, 2012) was loaned to us by Telefónica Finanzas, S.A.U., our subsidiary in charge of financial support for Telefónica Group companies and 3,455 million euros (1,822 million euros at December 31, 2012) was loaned by us to Telfisa Global, B.V., our financing subsidiary charged with centralizing and managing the cash pooling of our subsidiaries in Latin America, Europe and the United States.
With respect to the balances with associated companies, the line item “Non-current financial assets” on the consolidated statement of financial position at December 31, 2013, includes “Loans to Associates” amounting to 1,281 million euros (852 million euros at December 31, 2012).
Not applicable.
Consolidated Financial Statements
Please see Item 18.
Legal Proceedings
Telefónica and its group companies are party to several legal proceedings which are currently in progress in the courts of law and the arbitration bodies of the various countries in which we are present.
Based on the advice of our legal counsel, we believe it is reasonable to assume that these legal proceedings will not materially affect our financial condition or solvency, regardless of the outcome.
We highlight the following unresolved legal proceedings or those underway in 2013 (see Note 17 for details of tax-related cases):
Contentious proceedings in connection with the merger between Terra Networks, S.A. and Telefónica, S.A.
On September 26, 2006, Telefónica was notified of the claim filed by former shareholders of Terra Networks, S.A. (Campoaguas, S.L., Panabeni, S.L. and others) alleging breach of contract in respect of the terms and conditions set forth in the Prospectus of the Initial Public Offering of shares of Terra Networks, S.A. dated October 29, 1999. The court
rejected this claim and ordered the plaintiffs to pay court costs by a ruling issued on September 21, 2009. The plaintiffs appealed this ruling on December 4, 2009, and Telefónica was notified of such appeal on June 16, 2010. Telefónica opposed to the appeal on January 5, 2011. On April 23, 2013, we were notified a ruling of the Madrid Regional Court dismissing in its entirety the appeal filed by the plaintiffs against the first instance ruling handed down in 2009, confirming the rulings of the decision under appeal and ordering appellants to pay court costs. The ruling became firm on May 29, 2013, with no further appeals possible.
Cancellation of the UMTS license granted to Quam GMBH in Germany
In December 2004, the German Telecommunications Market Regulator revoked the UMTS license granted in 2000 to Quam GmbH ("
Quam
"), in which Telefónica has a stake. After obtaining a suspension of the revocation order, on January 16, 2006, Quam filed a suit against the order with the German courts. This claim sought two objectives: 1) to overturn the revocation order issued by the German Telecommunications Market Regulator, and 2) if this failed, to be reimbursed for the total or partial payment of the original amount paid for the license, 8,400 million euros.
This claim was rejected by the Cologne Administrative Court. Quam appealed the decision before the Supreme Administrative Court of North Rhine-Westphalia, which also rejected its appeal.
Finally, Quam filed a new claim in third instance before the Federal Supreme Court for Administrative Cases, which was not admitted for processing.
Quam appealed this decision on August 14, 2009. On August 17, 2011, after the oral hearing, the Federal Administrative Court rejected Quam's appeal at third instance.
In October 2011, Quam filed a constitutional complaint before the German Federal Constitutional Court (Karlsruhe).
Appeal against the European Commission ruling of July 4, 2007 against Telefónica de España’s broadband pricing policy
On July 9, 2007, Telefónica was notified of the decision issued by the European Commission (the "
EC
") imposing on Telefónica and Telefónica de España, S.A.U. ("
Telefónica de España
") a fine of approximately 152 million euros for breach of the former Article 82 of the Treaty Establishing the European Community for not charging equitable prices to whole and retail broadband access services. The court ruled in favor of the EC accusing Telefónica of applying a margin squeeze between the prices it charged competitors to provide regional and national wholesale broadband services and its retail broadband prices using ADSL technology between September 2001 and December 2006.
On September 10, 2007, Telefónica and Telefónica de España, S.A.U. filed an appeal to overturn the decision before the General Court of the European Union. The Kingdom of Spain, as an interested party, also lodged an appeal to overturn the decision. Meanwhile, France Telecom and the Spanish Association of Bank Users (AUSBANC) filed requests to intervene, which the General Court admitted.
In October 2007, Telefónica, S.A. presented a guarantee for an indefinite period of time to secure the principal and interest.
A hearing was held on May 23, 2011, at which Telefónica presented its case. On March 29, 2012, the General Court ruled rejecting the appeal by Telefónica and Telefónica de España, confirming the sanction imposed by the EC. On June 13, 2012, an appeal against this ruling was lodged before the European Court of Justice.
On September 26, 2013, the Attorney General presented its conclusions to the court stating of a possible breach of the principle of non-discrimination
with
respect to the sanction and a defective application of the principle of full jurisdiction by the General Court, requesting the return of the lawsuit to the instance.
Appeal against the decision by Agencia Nacional de Telecomunicações (ANATEL) regarding the inclusion of interconnection and network usage revenues in the Fundo de Universalização de Serviços de Telecomunicações ("FUST")
Vivo Group operators, together with other cellular operators, appealed ANATEL's decision of December 16, 2005, to include interconnection and network usage revenues and expenses in the calculation of the amounts payable into the Fund for Universal Access to Telecommunications Services – a fund which pays for the obligations to provide universal service -with retroactive application from 2000. On March 13, 2006, the Brasilia Regional Federal Court granted a
precautionary measure which stopped the application of ANATEL's decision. On March 6, 2007, a ruling in favor of the wireless operators was issued, stating that it was not appropriate to include the revenues received by transfer from other operators in the taxable income for the FUST's calculation and rejecting the retroactive application of ANATEL's decision. ANATEL filed an appeal to overturn this decision with Brasilia Regional Federal Court no. 1. This appeal is pending resolution.
At the same time, Telefónica Brasil and Telefónica Empresas, S.A., together with other wireline operators through ABRAFIX (Associação Brasileira de Concessionárias de Serviço Telefonico Fixo Comutado) appealed ANATEL's decision of December 16, 2005, also obtaining the precautionary measures requested. On June 21, 2007, Federal Regional Court no. 1 ruled that it was not appropriate to include the interconnection and network usage revenues and expense in the FUST's taxable income and rejected the retroactive application of ANATEL's decision. ANATEL filed an appeal to overturn this ruling on April 29, 2008, before Brasilia Federal Regional Court no. 1.
No further action has been taken since then. The amount of the claim is quantified at 1% of the interconnection revenues.
Public civil procedure by the São Paulo government against Telefónica Brasil for alleged reiterated malfunctioning in services provided by Telefónica Brasil and request of compensation for damages to the customers affected
This proceeding was filed by the Public Ministry of the State of São Paulo for alleged reiterated malfunctioning in the services provided by Telefónica Brasil, seeking compensation for damages to the customers affected. A general claim is filed by the Public Ministry of the State of São Paulo, for 1 billion Brazilian reais (approximately 370 million euros), calculated on the company's revenue base over the last five years.
In April 2010, a ruling in first instance against the Telefónica Group was issued, there will not be a precision of its effects until there is a final ruling, and the total amount of persons affected and party in the procedure is known. At that moment, the amount of the indemnity will be established, ranging between 1 billion and 60 million reais (approximately, between 370 and 22 million euros), depending on the number of parties. On May 5, 2010, Telefónica Brasil filed an appeal before the São Paulo Court of Justice, suspending the effect of the ruling. No further action has been taken since then.
Appeal against the Decision of the European Commission dated January 23, 2013 to sanction Telefónica for the infringement of Article 101 of the Treaty on the functioning of the European Union
On January 19, 2011, the EC initiated formal proceedings to investigate whether Telefónica, S.A. and Portugal Telecom SGPS, S.A. ("
Portugal Telecom
") had infringed on European Union anti-trust laws with respect to a clause contained in the sale and purchase agreement of Portugal Telecom's ownership interest in Brasilcel, N.V., a joint venture in which both were venturers and owner of Brazilian company Vivo.
On January 23, 2013, the EC passed a ruling on the formal proceedings. The ruling imposed a fine on Telefónica of 67 million euros, as the EC ruled that Telefónica and Portugal Telecom committed an infraction as stipulated in Article 101 of the Treaty on the Functioning of the European Union (“TFUE”) for having entered into the agreement set forth in Clause Nine of the sale and purchase agreement of Portugal Telecom's ownership interest of Brasilcel, N.V.
On April 9, 2013, Telefónica filed an appeal for annulment of this ruling with the European Union General Court. On August 6, 2013, the General Court notified Telefónica of the response issued by the European Commission, in which the EC reaffirmed the main arguments of its ruling and, specially, that Clause Nine is a competition restriction. On September 30, 2013, Telefónica filed its reply. On December 18, 2013, the European Commission filed its appeal.
Tax proceedings
In December 2012, the National Court of Justice of Spain issued a ruling on the tax inspection for the years 2001 to 2004, partially in favor of the Company and accepting the tax losses incurred by the Group in relation to the transfer of certain interests in TeleSudeste, Telefónica Móviles México and Lycos as tax deductible and rejecting the other allegations of the Company. The Company filed an appeal with respect to the other allegations with the Supreme Court on December 28, 2012.
Also in 2012, tax inspections in Spain for all taxes for the years 2005 to 2007 were completed, with the Company signing consent forms for an income tax payment of 135 million euros and non-consent forms for the items which the Company contests. The tax assessment for which a non-consent form was signed did not require payment of any tax because it
only proposed a reduction in unused tax loss carryforwards. An appeal was filed with the Large Taxpayers Central Office of the Spanish State Tax Agency requesting this tax assessment be reversed, although no decision on the appeal has been issued as of the date of this Annual Report.
In July 2013, new inspections in Spain of various companies in the 24/90 tax group, of which Telefónica, S.A. is the parent were initiated. The taxes and periods subject to review are corporate income tax for the years 2008 to 2011, value-added tax or “VAT”, tax withholdings and payments on account in respect of personal income tax, tax on investment income, property tax and non-resident income tax for the second half of 2009 and the years 2010 and 2011. It is not expected that these inspections will result in the need to recognize any additional liabilities in the Telefónica Group's consolidated financial statements.
Meanwhile, Telefónica Brasil has a number of appeals underway regarding the ICMS (similar to VAT levied on telecommunications services). There is a dispute with the Brazilian tax authority over which services should be subject to settlement of this tax, the most significant being the demands of the collection of the ICMS on complementary or auxiliary services to base telecommunications service, such as value-added services or the lease of modems. To date, all the related procedures are being contested in all instances (administrative and judicial). The aggregate amount of these assessments, updated to take into account interests, fines and other items, is approximately 2,038 million euros. No provisions have been set aside for these matters, as the risk of them giving rise to liabilities is not probable. Telefónica Brasil has obtained independent expert reports supporting its position, i.e. that the aforesaid services are not subject to ICMS.
Regarding the Group’s main tax litigation in Peru, on March 20, 2013, notification was received of a first instance court decision upholding Telefónica Peru's arguments in three of the five objections filed by the authorities and appealed against in higher courts. Both the tax authorities and the Company have appealed against the decision in the court of second instance.
The assessment originally raised by the tax authorities amounted to 124 million euros comprising the tax charge, excluding interest and penalties. At the date of authorization for issue of this Annual Report, 80 million euros had been paid out (42 million euros of which was for penalties and interest paid in 2013). The Company has also obtained suspensive measures with respect to 340 million euros of the assessment within the process of appeals to the Ordinary Court. The Group and its legal advisors believe they have legal grounds to defend the Company’s interests in the appeal that is currently underway.
At the 2013 year-end, based on the final outcome of these assessments, and on the lawsuits and inspections in progress, it has not been deemed necessary to recognize additional liabilities in the Consolidated Financial statements.
For information on legal proceedings related to tax matters, see Note 17 to our Consolidated Financial Statements.
Dividend background
The table below sets forth the annual dividends declared per share and the year to which such dividends correspond. Generally, the dividend for a given year is paid in two tranches, one in the second-half of the relevant year and the other during the first half of the following year.
|
Dividends per share (euro)
|
|
|
2013
(1)
|
0.75
|
|
2012
(2)
|
−
|
|
2011
(3)
|
1.60
|
|
2010
|
1.40
|
|
2009
|
1.15
|
|
(1)
|
Company’s shareholder remuneration in 2013 consists of paying a dividend of 0.75 euros per share. A cash dividend of 0.35 euros per share was paid on November 6, 2013, charged against unrestricted reserves. The second tranche of the dividend of 0.40 euros per share will be paid in cash in the second quarter of 2014.
|
|
(2)
|
As of July 25, 2012, the Board of Directors cancelled the dividend and share buyback program corresponding to 2012 (including November 2012 and May 2013 cash and scrip payments, respectively).
|
|
(3)
|
A cash dividend of 0.77 euros per share was paid on November 7, 2011, charged against unrestricted reserves.
|
A cash dividend of 0.53 euros per share was paid on May 14, 2012, charged against unrestricted reserves. In addition, a scrip dividend of up to 0.30 euros was paid, consisting of the assignment of free allotment rights with an irrevocable purchase commitment by the Company, and a subsequent capital increase by means of the issue of new shares to fulfill said allotments.
The Board of Directors, at its meeting held on February 27, 2014, agreed, regarding the 2014 dividend, to determine the amount thereof at 0.75 euros per share, payable in two tranches:
|
|
·
|
0.35 euro per share by means of a "scrip dividend" in the fourth quarter of 2014.
|
|
|
·
|
0.40 euro per share in cash in the second quarter of 2015.
|
Payments of any future dividends will be dependent on the Group’s earnings, cash generation, solvency, liquidity, flexibility to make strategic investments, and shareholder and investor expectations at the time, all of which may be influenced by a variety of factors. See “Cautionary Statement Regarding Forward-Looking Statements.”
Treasury shares and share buyback program
We have performed, and may consider performing, transactions with treasury shares and financial instruments or contracts that confer the right to acquire treasury shares or assets whose underlying is Company shares.
Treasury share transactions will always be for legitimate purposes, including:
|
|
·
|
undertaking treasury share acquisitions approved by the Board of Directors or pursuant to General Shareholders' Meeting resolutions;
|
|
|
·
|
honoring previous legitimate commitments assumed;
|
|
|
·
|
covering requirements for shares to allocate to employees and management under stock option plans; and
|
|
|
·
|
other purposes in accordance with prevailing legislation. In the past, treasury shares purchased on the stock market were exchanged for other shares-or securities (as in the case of preferred capital securities), swapped for stakes in other companies (e.g. China Unicom or Telco S.p.A.) or acquired to reduce the number of shares in circulation (by redeeming the shares acquired), thereby improving earnings per share.
|
Treasury share transactions will not be performed in any event based on privileged information or in order to intervene in free price formation. In particular, any of the conduct referred to in Articles 83.ter.1 of the Spanish Securities Market Law and 2 of Royal Decree 1333/2005 of November 11 implementing the Spanish Securities Market Law, with regards to market abuse will be avoided.
For a description on treasury shares, see Note 12 g) to our Consolidated Financial Statements.
General
Our ordinary shares, nominal value 1.00 euro each, are currently listed on each of the Madrid, Barcelona, Bilbao and Valencia stock exchanges and are quoted through the Automated Quotation System under the symbol “TEF.” They are also listed on various foreign exchanges such as the London and Buenos Aires stock exchanges. Our ADSs are listed on the New York Stock Exchange and the Lima Stock Exchange.
The table below sets forth, for the periods indicated, the reported high and low quoted closing prices, as adjusted for all stock splits, for our shares on the Madrid Stock Exchange, which is the principal Spanish market for our shares, and our ADSs on the New York Stock Exchange:
|
Per Share
|
Per ADS
|
|||||||
|
(in euro)
|
(in dollars)(1)
|
|||||||
|
High
|
Low
|
High
|
Low
|
|||||
|
Year ended December 31, 2009
|
19.750
|
13.690
|
29.69
|
17.24
|
||||
|
Year ended December 31, 2010
|
19.820
|
14.875
|
28.55
|
17.81
|
||||
|
Year ended December 31, 2011
|
18.655
|
12.690
|
27.08
|
16.61
|
||||
|
Year ended December 31, 2012
|
13.710
|
8.630
|
17.76
|
10.25
|
||||
|
Year ended December 31, 2013
|
13.105
|
9.492
|
18.02
|
12.43
|
||||
|
Quarter ended March 31, 2012
|
13.710
|
12.300
|
17.76
|
16.31
|
||||
|
Quarter ended June 30, 2012
|
12.345
|
8.847
|
16.06
|
11.05
|
||||
|
Quarter ended September 30, 2012
|
11.580
|
8.630
|
15.02
|
10.25
|
||||
|
Quarter ended December 31, 2012
|
10.855
|
9.930
|
14.18
|
12.58
|
||||
|
Quarter ended March 31, 2013
|
11.500
|
9.492
|
14.96
|
12.43
|
||||
|
Quarter ended June 30, 2013
|
11.350
|
9.613
|
14.86
|
12.60
|
||||
|
Quarter ended September 30, 2013
|
11.545
|
9.718
|
15.59
|
12.60
|
||||
|
Quarter ended December 31, 2013
|
13.105
|
11.265
|
18.02
|
15.45
|
||||
|
Month ended September 30, 2013
|
11.545
|
10.435
|
15.59
|
13.72
|
||||
|
Month ended October 31, 2013
|
13.105
|
11.705
|
18.02
|
15.78
|
||||
|
Month ended November 30, 2013
|
12.910
|
12.090
|
16.98
|
16.09
|
||||
|
Month ended December 31, 2013
|
11.930
|
11.265
|
16.34
|
15.45
|
||||
|
Month ended January 31, 2014
|
12.515
|
11.390
|
16.90
|
14.97
|
||||
|
Month ended February 28, 2014
|
11.480
|
11.105
|
15.59
|
14.96
|
||||
|
Month ended March 31, 2014 (through March 19, 2014)
|
11.415 | 10.865 | 15.88 | 15.03 | ||||
Source: Madrid Stock Exchange Information and Bloomberg.
(1) Until January 21, 2011, each ADS represented the right to receive three ordinary shares. As of January 21, 2011, the ADS-to-ordinary share ratio was changed, so that each ADS now represents the right to receive one ordinary share. The closing prices prior to January 21, 2011 reflect the adjustment for the ratio change.
On March 19, 2014, the closing price of our shares on the Automated Quotation System of the Spanish stock exchanges was 11.17 euro per share, equal to 15.55 dollars at the Noon Buying Rate on March 14, 2014, for cable transfers in euro as certified for customs purposes by the Federal Reserve Bank of New York on that date.
Our ADSs are listed on the New York Stock Exchange under the symbol “TEF”. Citibank, N.A. is the Depositary issuing ADSs in form of certificated ADSs (American Depositary Receipts, or ADRs) or uncertificated ADSs pursuant to the deposit agreement dated as of November 13, 1996, as amended as of December 3, 1999, and as further amended as of June 23, 2000, and as of March 9, 2007, among Telefónica, the Depositary and the holders from time to time of ADSs (the “Deposit Agreement”).
At December 31, 2013, 184,990,503 of our shares were held in the form of ADSs by 800 holders of record, including Cede & Co., the nominee of Depository Trust Company (“DTC”). The number of ADSs outstanding was 216,751,480 at December 31, 2012.
Spanish Securities Market Legislation
The Spanish Securities Markets Act (Ley del Mercado de Valores , or the LMV), enacted in 1988 and further amended, regulates the primary and secondary securities markets in Spain by establishing principles for their organization and operation, rules governing the activities of persons and institutions operating in these markets and a system for their supervision. This legislation and the regulation implementing it (mainly, as far as private issuers are concerned, the Royal Decree 1310/2005, of November 4, in relation to the issuance of securities and its admission to listing in official secondary markets, and Royal Decree 1362/2007, of October 19, concerning the transparency requirements in relation to information about issuers whose securities are admitted to trading on a regulated market):
|
|
·
|
establishes an independent regulatory authority, the CNMV, to supervise the securities markets;
|
|
|
·
|
establishes the rules for surveillance, supervision and sanction provided for the representation of transferable securities by book entries or by certificate;
|
|
|
·
|
establishes a framework for the issuance of securities;
|
|
|
·
|
establishes a framework for trading activities;
|
|
|
·
|
establishes the disclosure obligations of issuers, particularly the obligation to file annual audited financial statements and to make public quarterly financial information;
|
|
|
·
|
establishes the framework for tender offers;
|
|
|
·
|
establishes the code of conduct for all market participants; and
|
|
|
·
|
regulates market abuse infringements.
|
On March 11, 2005, Royal Decree Law 5/2005 was approved, modifying the LMV in order to implement the Directive 2003/71/EC of the European Parliament and of the Council on the prospectus to be published when securities are offered to the public or admitted to trading. The Directive: (i) harmonizes the requirements for the process of approval of the prospectuses in order to grant to the issuer a single passport for such document, valid throughout the European Union; (ii) incorporates the application of the country of origin principle by which the prospectus will be approved by the Member States of the European Union where the issuer has its registered office but it also introduces as a new matter the possibility that in certain circumstances, such as issues with high minimum denominations (1,000 euros or more), the issuer may designate the relevant European Union competent authority for prospectus approval.
Subsequently, Royal Decree 1310/2005 partially developed the LMV in relation to the admission to trading of securities in the official secondary markets, the sales or subscription public offers and the prospectus required to those effects.
Royal Decree 1333/2005 developed the LMV in relation to market abuse, implementing Directive 2003/6/EC of the European Parliament and of the Council, relating insider dealing and market manipulation practices (“market abuse”).
On April 12, 2007, Law 6/2007 was approved, modifying the LMV in order to implement the Directive 2004/25/EC of the European Parliament and of the Council relating to public tender offers and the Directive 2004/109/EC relating to the transparency of issuers. Law 6/2007 intends: (i) to encourage an efficient market for corporate control, while protecting the rights of minority shareholders of listed companies and (ii) to enforce transparency in financial markets.
In relation to public tender offers, Law 6/2007 (i) establishes the cases in which a company must launch a takeover bid over the whole share capital of the relevant company; (ii) establishes that takeover bids shall be launched once a specific stake on the share capital of the company has been reached; (iii) adds new obligations for the board of directors of the target companies of the takeover bid in terms of defensive measures against the takeover bid; (iii) regulates the squeeze-out and sell-out procedure when a 90% of the share capital is held following a takeover bid. Royal Decree 1066/2007 completes the regulation currently in place for takeover bids in Spain.
Regarding transparency of issuers whose shares are accepted to trading on an official market, Law 6/2007 (i) modifies the reporting requirements of the periodic financial information of listed companies and issuers of listed securities; (ii) establishes a new disclosure regime for significant shareholders; (iii) adds new information and disclosure requirements for issuers of listed securities; (iv) establishes a civil liability procedure of the issuer and board of directors in connection with the financial information disclosed by issuers of securities; and (v) confers new supervisory powers upon the CNMV with respect to the review of accounting information.
On December 19, 2007, Law 47/2007 was approved, modifying the LMV in order to implement the Directive 2004/39/EC of the European Parliament and of the Council, on Markets in Financial Instruments (MiFID); the Directive 2006/73/EC of the European Parliament and of the Council on organizational requirements and operating conditions regarding the Market in Financial Instruments Directive, and the Directive 2006/49/EC of the European Parliament and of the Council on the capital adequacy of investment firms and credit institutions. Its principal aim is to establish a general legal framework for financial markets in the European Union, in particular with regard to financial services, as well as to ensure appropriate transparency for investors through a regular flow of the relevant information concerning security
issuers. Amongst other things, the new regime (i) establishes new multilateral trading facilities for listing shares apart from the stock markets; (ii) reinforces the measures for the protection of investors; (iii) establishes new organizational requirements for investment firms; (iv) implements new supervisory powers for CNMV, establishing cooperation mechanisms amongst national supervisory authorities.
On July 4, 2009, Law 3/2009, regarding structural modifications on Spanish Corporations (Ley 3/2009, de 3 de abril, sobre modificaciones estructurales de las sociedades mercantiles) came into force, modifying the maximum threshold established in the Spanish Corporation Act as to the number of treasury shares held by listed companies and their subsidiaries from 5% up to 10% of their total capital outstanding.
On August 1, 2011, Law 25/2001, partially reforming the Spanish Corporation Act and transposing Directive 2007/36/EC of the European Parliament and of the Council of July 11 relating to the exercise of certain rights shareholders in listed companies (Ley 25/2001, de 1 de agosto, de reforma parcial de la Ley de Sociedades de Capital y de incorporación de la Directiva 2007/36/CE, del Parlamento Europeo y del Consejo, de 11 de Julio, sobre el ejercicio de determinados derechos de los accionistas de las sociedades cotizadas) was approved.
In December 2012, Royal Decree 1698/2012, amending regulations regarding prospectus and transparency requirements due on securities issues by the transposition of Directive 2010/73/EU of the European Parliament and of the Council of November 24, 2010, by amending Directive 2003/71/EC on the prospectus to be published when securities are offered to the public or admitted to trading and Directive 2004/109/EC on the harmonization of transparency requirements in relation to information about issuers whose securities are admitted to trading on a regulated market, pursues essentially the reduction of administrative burdens related to the publication of a prospectus for the public offering of securities and admission to trading on markets within the European Union.
On March 20, 2013, ECC/461/2013 regulation was approved. This regulation establishes the content and structure of the annual report on corporate governance, the annual compensation report and other information mechanisms for public listed companies, the savings bank and other entities that issue securities admitted to trading on regulated securities markets. The aforementioned regulation was amended by Order ECC/2515/2013, of December 26, which develops article 86.2 of the LMV."
On June 12, 2013, Circular 5/2013 of the National Securities Market Commission (CNMV), was approved. This regulation establishes the templates of the annual report on corporate governance for public listed companies, savings banks and other entities that issue securities admitted to trading on regulated markets. This regulation is applicable to the annual reports on corporate governance that issuers must submit from January 1, 2014.
On June 12, 2013, Circular 4/2013, the National Securities Market Commission (CNMV), was approved. This regulation establishes the templates of the Annual Director´s compensation report for public listed companies and members of the board of directors and the supervisory board of savings banks that issue securities admitted to trading on regulated securities markets. This regulation is applicable to the compensation report for the year 2013 and will be put to a vote by the ordinary general shareholders’ meeting to be held from January 1, 2014, on a consultative basis and as a separate item on the agenda.
Securities Trading in Spain
The Spanish securities market for equity securities consists of four stock exchanges located in Madrid, Bilbao, Barcelona and Valencia and the Automated Quotation System, or Mercado Continuo. During 2009, the Automated Quotation System accounted for the majority of the total trading volume of equity securities on the Spanish stock exchanges.
Automated Quotation System
The Automated Quotation System links the four Spanish stock exchanges, providing those securities listed on it with a uniform continuous market that eliminates certain of the differences among the local exchanges. The principal features of the system are the computerized matching of buy and sell orders at the time of entry of the order. Each order is executed as soon as a matching order is entered, but can be modified or canceled until executed. The activity of the market can be continuously monitored by investors and brokers. The Automated Quotation System is operated and regulated by Sociedad de Bolsas, S.A., a corporation owned by the companies that manage the local exchanges. All trades on the Automated Quotation System must be placed through a brokerage firm, an official stock broker or a dealer
firm that is a member of a Spanish stock exchange. Beginning January 1, 2000, Spanish banks were allowed to become members of Spanish stock exchange and, therefore, can trade through the Automated Quotation System.
In a pre-opening session held from 8:30 a.m. to 9:00 a.m. each trading day, an opening price is established for each security traded on the Automated Quotation System based on a real-time auction. The regime concerning opening prices was changed by an internal rule issued by the Sociedad de Bolsas. Pursuant to such rule, each stock in the continuous market is assigned a static and a dynamic range within which its price can fluctuate. The price of a stock may rise or fall within its static range (which is published once a month and is calculated according to the stock’s average historic price volatility) above or below its opening price (which shall be the closing price of the previous session). When the stock trades outside of this range, the trading of the stock is suspended for 5 minutes, during which an auction takes place. After this auction, the price of the stock can once again rise or fall within its static range above or below its last auction price (which will be considered as the new static price before triggering another auction). Furthermore, the price of a stock cannot rise or fall by more than its dynamic price range (which is fixed and published once a month and is calculated according to the stock’s average intra-day volatility), from the last price at which it has traded. If the price variation exceeds the stock’s dynamic range, a five minute auction is triggered. Between 5:30 p.m. and 5:35 p.m. a closing price is established for each security through an auction system similar to the one held for the pre-opening early in the morning.
Trading hours for block trades are also from 9:00 a.m. to 5:30 p.m. Between 5:30 p.m. and 8:00 p.m., certain trades may occur outside the computerized matching system without prior authorization from Sociedad de Bolsas, S.A. at a price within the range of 5% above the higher of the average price and closing price for the day and 5% below the lower of the average price and closing price for the day if there are no outstanding bids or offers, respectively, on the system matching or bettering the terms of the proposed off-system transaction and, if, among other things, the trade involves more than 300,000 euros and more than 20% of the average daily trading volume of the stock during the preceding three months. These trades must also relate to individual orders from the same person or entity and be reported to the Sociedad de Bolsas, S.A. before 8:00 p.m. At any time trades may take place (with the prior authorization of the Sociedad de Bolsas, S.A.) at any price if:
|
|
·
|
the trade involves more than 1.5 million euros and more than 40% of the average daily volume of the stock during the preceding three months;
|
|
|
·
|
the transaction derives from a merger or spin-off process, or from the reorganization of a group of companies;
|
|
|
·
|
the transaction is executed for the purposes of settling a litigation or completing a complex group of contracts; or
|
|
|
·
|
Sociedad de Bolsas, S.A. finds other justifiable cause.
|
Information with respect to the computerized trades between 9:00 a.m. and 5:30 p.m. is made public immediately, and information with respect to trades outside the computerized matching system is reported to Sociedad de Bolsas, S.A. by the end of the trading day and published in the Boletín de Cotización and in the computer system by the beginning of the next trading day.
Clearance and settlement system
The Sociedad de Gestión de los Sistemas de Registro, Compensación y Liquidación de Valores S.A.U. , formerly Iberclear, was created by the Ley 44/2002 de Medidas de Reforma del Sistema Financiero , enacted on November 22, 2002, to increase the efficiency of the Spanish financial markets. Such law introduced a new article, 44-bis to the LMV which established the framework for the constitution of Sociedad de Gestión de los Sistemas de Registro, Compensación y Liquidación de Valores S.A.U.
Iberclear is regulated by the Spanish Securities Act and where appropriate by Royal Decree 505/1987 of April 3, 1987, Royal Decree 166/1992 of February 14, 1992, and by any other related regulation. This company, which is a wholly owned subsidiary of Bolsas y Mercados Españoles, Sociedad Holding de Mercados y Sistemas Financieros, S.A. (Bolsas y Mercados Españoles), has the following functions:
|
|
·
|
bookkeeping of securities represented by means of book entries admitted to trading in the stock markets or in the public debt book entry market;
|
|
|
·
|
managing the clearance and settlement system for the brokerage transactions in the stock markets and at the public debt book entry market; and
|
|
|
·
|
providing technical and operational services directly linked to the registry, clearance and settlement of securities, or any other service required by Iberclear to be integrated with any other registry, clearance, and settlement systems.
|
Iberclear will provide the CNMV, the Bank of Spain and the Ministry of Economy with the information that these entities may request regarding the registry clearance and settlement performed within the systems managed by Iberclear.
Transactions carried out on the Spanish stock exchanges are cleared and settled through Iberclear.
Only members of the system are entitled to use Iberclear, and membership is restricted to authorized broker members of the Spanish stock exchanges, the Bank of Spain (when an agreement, approved by the Spanish Ministry of Economy and Finance, is reached with Iberclear) and, with the approval of the CNMV, other brokers not members of the Spanish stock exchanges, banks, savings banks and foreign settlement and clearing systems. The clearance and settlement system and its members are responsible for maintaining records of purchases and sales under the book-entry system. Shares of listed Spanish companies are held in book-entry form. Iberclear, which manages the clearance and settlement system, maintains a registry reflecting the number of shares held by each of its member entities (each, an entidad participante) as well as the amount of such shares held on behalf of beneficial owners. Each member entity, in turn, maintains a registry of the owners of such shares. Spanish law considers the legal owner of the shares to be the member entity appearing in the records of Iberclear as holding the relevant shares in its own name or the investor appearing in the records of the member entity as holding the shares.
The settlement of any transactions must be made three business days following the date on which the transaction was carried out.
Obtaining legal title to shares of a company listed on a Spanish stock exchange requires the participation of a Spanish official stockbroker, broker-dealer or other entity authorized under Spanish law to record the transfer of shares. To evidence title to shares, at the owner’s request, the relevant member entity must issue a certificate of ownership. In the event the owner is a member entity, Iberclear is in charge of the issuance of the certificate with respect to the shares held in the member entity’s name.
Brokerage commissions are not regulated. Brokers’ fees, to the extent charged, will apply upon transfer of title of shares from the Depositary to a holder of ADRs in exchange for such ADSs, and upon any later sale of such shares by such holder. Transfers of ADSs do not require the participation of an official stockbroker. The Deposit Agreement provides that holders depositing shares with the Depositary in exchange for ADSs or withdrawing shares in exchange for ADSs will pay the fees of the official stockbroker or other person or entity authorized under Spanish law applicable both to such holder and to the Depositary.
Not applicable.
Please see “—Offer and Listing Details” above.
Not applicable.
Not applicable.
Not applicable.
Not applicable.
The following summary describes certain material considerations concerning our capital stock and briefly describes certain provisions of our bylaws and Spanish law.
Corporate Objectives
Article 5 of Title I of our bylaws sets forth our corporate purposes:
|
|
·
|
The provision and operation of all kinds of public or private telecommunications services and, for such purpose, the design, installation, maintenance, repair, improvement, acquisition, disposition, interconnection, management, administration of, and any other activity not included in the preceding enumeration with respect to, all kinds of telecommunications networks, lines, satellites, equipment, systems and technical infrastructure whether now existing or to be created in the future, including the premises in which any and all of the foregoing items are located;
|
|
|
·
|
the provision and operation of all kinds of services that are ancillary or supplemental to or result from telecommunications services;
|
|
|
·
|
the research and development, promotion and application of all kinds of component principles, equipment and systems directly or indirectly used for telecommunications;
|
|
|
·
|
manufacturing and production activities and, in general, all other forms of industrial activity in connection with telecommunications; and
|
|
|
·
|
acquisition, disposition and, in general, all other forms of commercial activity in connection with telecommunications.
|
Director Qualification
In order to be elected as a director, a person must have held a number of our shares representing a nominal value of no less than 3,000 euros for at least three years prior to his or her election. These shares may not be transferred so long as such person remains a director. This requirement does not apply to any person who, at the time of his or her appointment, has either a labor or professional relationship with the company or is expressly exempted from such requirement by a vote of at least 85% of the Board of Directors.
Interested Transactions
When a director or persons related to him or her has an interest in a transaction with us or with any of the companies of our Group, such transaction (if unrelated to the ordinary course of our business or if not performed on an arm’s length basis involving consideration that is significant to the Company and otherwise) must be presented to the Nominating, Compensation and Corporate Governance Committee. Such committee shall assess the transaction from the point of view of equal treatment of shareholders and the arm’s length basis of the transaction and shall be included in the Annual Corporate Governance Report and in the periodic information of the Company upon the terms set forth in applicable laws and regulations. The performance of such transactions requires the authorization of our Board of Directors, after the favorable report of the committee. The interested director must refrain from participating in votes that affect such transaction.
Significant Differences in Corporate Governance Practices
Corporate governance guidelines
For a description of our corporate governance practices see “Item 16G. Corporate Governance.”
Description of Our Capital Stock
Description of share capital
At March 21, 2014, our issued share capital consisted of 4,551,024,586 ordinary registered shares with a nominal value of 1.00 euro each.
Our shareholders have delegated to the Board of Directors the authority to issue up to 2,281,998,242 new shares. The Board of Directors is authorized to exclude preemptive rights, in whole or in part, pursuant to the applicable provisions of the Spanish Corporation Law. The Board’s authorization to issue new shares expires on May 18, 2016.
Meetings and voting rights
We hold our ordinary General Shareholders’ Meeting during the first six months of each fiscal year on a date fixed by the Board of Directors. Extraordinary General Shareholders’ Meetings may be called, from time to time, at the discretion of our Board of Directors or upon the request of shareholders representing 5% of our paid-in share capital. We publish notices of all ordinary and extraordinary General Shareholders’ Meetings in the Official Gazette of the Commercial Registry or in one of the more widely circulated newspaper, on the website of the National Securities Market Commission, and on our web site at least one month before the relevant meeting. Furthermore, the Board of Directors may publish notices in other media, if deemed appropriate to ensure the public and effective dissemination of the notice meeting.
Each share of Telefónica, S.A. entitles the holder to one vote. However, only registered holders of shares representing a nominal value of at least 300 euros (which currently equals at least 300 shares) are entitled to attend a General Shareholders’ Meeting. Holders of shares representing a nominal value of less than 300 euros (less than 300 shares), may aggregate their shares by proxy and select a representative that is a shareholder to attend a General Shareholders’ Meeting or delegate his or her voting rights by proxy to a shareholder who has the right to attend the shareholders’ meeting. However, under our bylaws, no shareholder may vote a number of shares exceeding 10% of our total outstanding voting capital. In determining the maximum number of votes that each shareholder may cast, only the shares that he holds are counted, not including those that correspond to other holders who have delegated by proxy, in spite of applying the limit individually to each of the represented shareholders. Moreover, in this regard, and in accordance with the Spanish Corporation Law, any restriction on voting rights will lose its effect in the case of a take-over bid, if the offeror has reached a percentage equal or superior to 70% of the total outstanding voting capital.
Any share may be voted by proxy. Proxies must be in writing and are valid only for a single meeting.
Only holders of record five days prior to the day on which a general meeting of shareholders is scheduled to be held may attend and vote at the meeting. Under the deposit agreement for our ADSs, our depositary accepts voting instructions from holders of ADSs. The depositary executes such instructions to the extent permitted by law and by the terms governing the shares. The depositary or its nominee, whichever is applicable, will be entitled to vote by proxy the shares represented by the ADSs.
Shareholders representing, in person or by proxy, at least 25% of our subscribed voting capital constitute a quorum for a general meeting of shareholders. If a quorum is not present at the first call, then the meeting can be held on second call. Regardless of the number of shareholders present at the meeting on second call, they are deemed to constitute a quorum.
Shareholders representing, in person or by proxy, at least 50% of our subscribed voting capital constitute a quorum on a first call for shareholders’ meetings at which shareholders will be voting on any of the following actions:
|
|
·
|
issuance of bonds;
|
|
|
·
|
increase or reduction of share capital;
|
|
|
·
|
any other amendment of our bylaws;
|
|
|
·
|
merger, split or spin-off of Telefónica; or
|
|
|
·
|
withdrawal or restriction of the right of pre-emptive subscription to new shares, the transfer of the business as a going concern, the transformation of the company, or the removal of a registered office abroad.
|
When a quorum is present on the first call, these special resolutions must be adopted by the affirmative vote of shareholders representing a majority of our present subscribed voting capital.
If a quorum for the meeting is not present after the first call, upon a second call for the meeting, 25% of our subscribed voting capital will constitute a quorum. When shareholders representing less than 50% of the subscribed voting capital are in attendance, these special resolutions must be adopted by a vote of two-thirds of those shareholders present.
Dividends
Shareholders vote on final dividend distributions at the shareholders’ meeting. Distributable profits are equal to:
|
|
·
|
net profits for the year; plus
|
|
|
·
|
profits carried forward from previous years; plus
|
|
|
·
|
distributable reserves; minus
|
|
|
·
|
losses carried forward from previous years; minus
|
|
|
·
|
amounts allocated to reserves as required by law or by our bylaws.
|
The amount of distributable profits is based on our unconsolidated financial statements prepared in accordance with Spanish GAAP, which differ from the Consolidated Financial Statements prepared in accordance with IFRS included elsewhere in this Annual Report.
The Board of Directors can approve interim dividend payments without a prior shareholder vote on the issue. However, under those circumstances, the dividend is limited to distributable net profits of the current year and is subject to certain legal requirements.
Unclaimed dividends revert to us five years from their date of payment.
Registration and transfers
Our shares are in registered book-entry form. Transfers executed through stock exchange systems are implemented pursuant to the stock exchange clearing and settlement procedures carried out by the Spanish clearing institution. Transfers executed outside of stock exchange systems, that is, over the counter, are implemented pursuant to the general legal regime for book-entry transfer, including registration by the Spanish clearing institution.
There are no restrictions with respect to the transfer of our shares.
Liquidation rights
Under Spanish law, upon our liquidation, the shareholders would be entitled to receive, on a pro rata basis, any assets remaining after the payment of our debts and taxes and liquidation expenses.
Material Contracts Related to Our Investment in Telecom Italia
On April 28, 2007, we, together with a group of Italian investors (the “Italian Investors”), including Assicurazioni Generali S.p.A. (“Generali”), Sintonia S.A. (“Sintonia”), Intesa Sanpaolo S.p.A. (“Intesa Sanpaolo”) and Mediobanca S.p.A. (“Mediobanca”), entered into a co-investment agreement, (the “Co-Investment Agreement”), to establish the terms and conditions for our participation in what is now Telco. Through Telco, on October 23, 2007, we and the Italian Investors purchased the entire share capital of Olimpia S.p.A., or Olimpia, which held approximately 18% of the ordinary share capital of Telecom Italia. As of the date of this Annual Report, the Italian Investors hold a total of 34% of Telco’s share capital and we hold the remaining 66%.
In addition to Telco’s participation in Telecom Italia’s ordinary share capital through its interest in Olimpia, pursuant to the Co-Investment Agreement, on October 25, 2007, Generali and Mediobanca contributed to Telco ordinary shares of Telecom Italia they held at that date. These shares in the aggregate amounted to 5.6% of Telecom Italia’s ordinary share capital and brought Telco’s direct and indirect participation in Telecom Italia’s ordinary share capital to approximately 23.6%.
On April 28, 2007, the Italian Investors also entered into a shareholders’ agreement, (the “Shareholders’ Agreement”), which establishes, among other things, the principles of corporate governance of Telco and Olimpia, respectively, the principles related to the transfer of Telco’s shares and any Olimpia shares or Telecom Italia shares directly or indirectly owned by Telco and the principles of designation, among the parties, of candidates to be included in a common list for the appointment of directors of Telecom Italia pursuant to the voting list mechanism provided for by Telecom Italia’s by-laws.
On November 19, 2007, the parties to the Shareholders’ Agreement amended the Shareholders’ Agreement as well as the bylaws of Telco to include the specific limitations imposed by ANATEL as initially posted on its website on October 23, 2007, and subsequently published on November 5, 2007, as ANATEL’s “Ato” No. 68,276 dated October 31, 2007. We refer to such agreement as the Amendment to the Shareholders’ Agreement.
Pursuant to the Shareholders’ Agreement, we entered into an option agreement (the “Option Agreement”), with Telco on November 6, 2007, which provides that, in the event that a decision to dispose, directly or indirectly, in any form or manner (including through measures with equivalent effect, such as mergers and demergers of Telco or Olimpia) or encumber Telecom Italia shares or Olimpia shares or any rights attached thereto, including but not limited to voting rights, is taken by the board of directors of Telco by a simple majority resolution according to the procedure specifically provided for by the Shareholders’ Agreement and we are a dissenting party, then we will have the right, to be exercised within 30 days of such decision being taken, to buy from Telco the Telecom Italia shares or the Olimpia shares, as the case may be, at the same price and conditions offered by the third party offering to acquire such shares of Telecom Italia or Olimpia.
On December 10, 2007, an agreement was reached to merge Olimpia into Telco, as a result of which Telco’s entire stake in the voting shares of Telecom Italia (23.6%) became a direct stake. In March 2008, Telco acquired 121.5 million additional shares of Telecom Italia, equivalent to 0.9% of its share capital, bringing its total direct interest to 24.5% of Telecom Italia’s voting shares.
On October 28, 2009, Sintonia requested, pursuant to the Shareholders Agreement, the non-proportional de-merger of Telco, with the withdrawal of its pro rata share of the assets and liabilities of Telco (comprised of Telecom Italia shares held by Telco representing approximately 2.1% of Telecom Italia’s share capital). The terms of Sintonia’s exit were approved on November 26, 2009, and the transaction closed on December 22, 2009. Upon Sintonia’s exit, Telco’s interest in Telecom Italia was reduced to 22.45% of Telecom Italia’s share capital. At the same time, our stake in Telco increased from 42.3% to 46.2%, thereby allowing us to maintain our indirect interest in Telecom Italia at 10.5% of Telecom Italia’s voting rights (7.2% of the dividend rights).
On October 28, 2009, Telco investors, other than Sintonia, entered into an agreement (the “Renewal Agreement”), through which they agreed (i) not to request the non-proportional de-merger of Telco with the withdrawal of their corresponding share of Telecom Italia shares held by Telco at that time (as was previously done by Sintonia) and (ii) to extend and modify the Shareholders Agreement for an additional term of three years until April 27, 2013 (effective as of April 28, 2010) substantially on the same terms and conditions, except to provide (a) that the right of Telco’s investors to request the non-proportional de-merger of Telco will only be exercisable in the period between October 1, 2012 and October 28, 2012, and (b) for an early withdrawal right period exercisable between April 1, 2011 and April 28, 2011. On the same date and in connection with the Renewal Agreement, separately, we entered into an Amendment Deed to the Call Option Agreement with Telco (i) to extend the term of the Option Agreement to coincide with the expiration date of the Renewal Agreement and (ii) to exempt certain transactions regarding the Telecom Italia shares, namely those related to the exercise of de-merger and early withdrawal rights pursuant to the Renewal Agreement.
In line with the commitments assumed by Telco shareholders, on December 22, 2009, the rest of Telco’s financing needs with respect to debt maturities were met with a bridge loan granted by shareholders, including ourselves, Intesa Sanpaolo and Mediobanca for approximately 902 million euros, and a bank bridge loan granted by Intesa Sanpaolo and Mediobanca for the remaining 398 million euros.
On January 11, 2010, Telco arranged a 1,300 million euros loan with Intesa Sanpaolo, Mediobanca, Société Générale, S.p.A. and Unicredito, S.p.A., maturing on May 31, 2012, part of which is secured with the Telecom Italia shares held by Telco. The lending banks have granted Telco shareholders, including ourselves, a call option on the Telecom Italia shares that they may be entitled to receive as a result of the potential execution of the pledge.
The financing from the bridge loans described above was cancelled with the proceeds of a bond issuance subscribed by Telco’s shareholders, on a pro rata basis in accordance with their interests in Telco, on February 19, 2010, for an aggregate principal amount of 1,300 million euros. Our subscription amounted to an aggregate principal amount of 600 million euros.
On October 6, 2010, Telefónica, Intesa Sanpaolo, Mediobanca, and Generali (collectively, the “Existing Shareholders”), Telco, certain companies controlled by Telefónica, Telecom Italia and certain companies controlled by Telecom Italia entered into a “compromiso” (the “Compromiso”) in order to terminate certain administrative and judicial proceedings in Argentina related to the Telco investment in Telecom Italia. The Compromiso was required in order for the Argentine authorities to approve the Telco investment in Telecom Italia and it was accepted by the competent Argentine authorities on October 13, 2010. Pursuant to a deed of amendment dated December 10, 2010 (the “2010 Amendment Deed”), the Existing Shareholders implemented the Compromiso by inserting an additional clause into the Shareholders’ Agreement (with such amendments and integrations from time to time agreed, the “Prior Shareholders’ Agreement”) related to the governance of Telco and Telecom Italia with respect to the operations of Telecom Italia, Telefónica and their respective group companies which offer telecommunications, Internet, data, radio, media and substitute services in Argentina.
On February 29, 2012, the Existing Shareholders entered into a renewal agreement (the “Second Renewal Agreement”) in which the parties agreed to terminate, effective the date of the Second Renewal Agreement, the Prior Shareholders’ Agreement and enter into a new shareholders agreement for a period of three years on the same terms and conditions set out in the original Shareholders’ Agreement dated as of April 28, 2007, between the Existing Shareholders and Sintonia S.A., as subsequently amended and supplemented in 2007, 2009, 2010 and pursuant to the 2010 Amendment Agreement, subject to the amendments and integrations set forth therein (the “New Shareholders’ Agreement”). Further, on February 29, 2012, the call option granted to Telefónica to purchase shares of Telecom Italia held by Telco pursuant to the Prior Shareholders’ Agreement was extended to February 28, 2015, pursuant to an amendment deed to the Option Agreement (the “Telefónica Option Amendment Deed”) entered into between Telefónica and Telco.
In addition, on February 29, 2012, the Existing Shareholders undertook to take actions to ensure the refinancing of Telco’s financial indebtedness through appropriate financial instruments, contractual agreements and/or corporate transactions in proportion to their respective shareholdings of Telco.
On May 31, 2012, Telefónica, Assicurazioni Generali, S.p.A. (for its own account and in the name and on behalf of the following Generali’s subsidiaries, Generali Vie, S.A. Alleanza Toro, S.p.A. Generali Italia, S.p.A. (now incorporating INA Assitalia S.p.A.) Generali Lebensversicherung AG), Intesa Sanpaolo, S.p.A., Mediobanca – Banca di Credito Finanziario, S.p.A. (together the "Shareholders") and Intesa Sanpaolo, S.p.A., Mediobanca – Banca di Credito Finanziario, S.p.A., Unicredit, S.p.A., Société Générale, HSBC Bank (together the "2012 Lenders") entered into a Pledged Shares Option Agreement (the "2012 Pledged Shares Option Agreement") providing, among other things, for the right of the Shareholders to call and acquire from the 2012 Lenders at the terms and conditions referred to therein, any Telecom Italia S.p.A. ordinary shares that would have been appropriated by the 2012 Lenders in case of enforcement of the pledge (the "2012 Share Pledge") created under and pursuant to the share pledge agreement entered into on May 31, 2012, between Telco S.p.A., as pledgor, and the 2012 Lenders, as secured creditors.
|
|
·
|
On September 24, 2013, Telefónica and the remaining shareholders of the Italian company Telco, S.p.A. (which holds a capital stake of 22.4% of the voting share capital of Telecom Italia, S.p.A.) reached an agreement by virtue of which:
|
|
|
−
|
Telefónica subscribed for and paid out a capital increase in Telco, S.p.A., through the contribution of 324 million euros in cash, receiving in return non-voting shares of Telco, S.p.A. As a result of this capital increase, the interest held by Telefónica in the voting share capital of Telco, S.p.A. remained unchanged (i.e. 46.18%), although its interest in the total share capital of Telco, S.p.A. has increased to 66%. The current governance structure at Telco, S.p.A. remained unaffected, including the obligation by Telefónica of abstaining from participating or influencing in any decisions which could affect the markets in which both, Telefónica and Telecom Italia, S.p.A., are present.
|
|
|
−
|
Subject to receiving any required anti-trust and telecommunications approvals (including in Brazil and Argentina), Telefónica will subscribe for and pay out a second capital increase in Telco, S.p.A., through the contribution of 117 million euros in cash and will receive in return non-voting shares of Telco, S.p.A. As a result of this second capital increase, the interest of Telefónica in the voting share capital of Telco, S.p.A. will remain unchanged (i.e. 46.18%), although its interest in the total share capital will be then increased to 70%.
|
|
|
−
|
Starting from January 1, 2014, subject to receiving any required anti-trust and telecommunications approvals (including in Brazil and Argentina), Telefónica may convert all or a portion of its non-voting shares in Telco, S.p.A. into voting shares in Telco, S.p.A., representing no more than 64.9% of the voting share capital of Telco, S.p.A.
|
|
|
−
|
The Italian shareholders of Telco, S.p.A. have granted Telefónica a call option to acquire all of their shares in Telco, S.p.A., whose exercise is subject to receiving any required anti-trust and telecommunications approvals (including in Brazil and Argentina). The call option may be exercised by Telefónica starting from January 1, 2014, while the Shareholders Agreement remains in effect, except (i) between June 1, 2014, and June 30, 2014, and between January 15, 2015, and February 15, 2015, and (ii) during certain periods, if the Italian shareholders of Telco, S.p.A. request the demerger of Telco, S.p.A.
|
As of the date of this Annual Report, the approvals that are necessary for the implementation of the transactions contemplated in the agreement dated September 24, 2013 and subscribed between Telefónica and the remaining shareholders of the Italian company Telco S.p.A.
have not yet been obtained.
|
|
·
|
On December 4, 2013, the Brazilian Antitrust Regulator, Conselho Administrativo de Defesa Econômica (CADE) announced, the two following decisions:
|
|
|
1.
|
To approve, with the restrictions mentioned below, the acquisition by Telefónica of the entire participation held by Portugal Telecom, SGPS S.A., and PT Móveis - Serviços de Telecomunicações, SGPS, S.A., (the “PT Companies”) in Brasilcel N.V., which controlled the Brazilian mobile company, Vivo Participações S.A.
|
It must be noted that such transaction was approved by ANATEL(Brazilian Telecommunications Regulation Authority) and the closing (which did not require CADES´s prior approval at the time), occurred immediately after such ANATEL's approval, on September 27, 2010.
The above mentioned decision has been granted by CADE conditional on:
|
|
(a)
|
The entry of a new shareholder in Vivo, sharing with Telefónica the control of Vivo in conditions identical to those that were applicable to the PT Companies when they had a participation in Brasilcel N.V., or
|
|
|
(b)
|
That Telefónica ceases to have any direct or indirect financial interest in TIM Participações S.A.
|
|
|
2.
|
To impose on Telefónica a fine of 15 million Brazilian Reais, for having allegedly breached the spirit and the goal of the agreement signed between Telefónica and CADE (as a condition to the approval of Telefónica´s original acquisition of an interest in Telecom Italia in 2007), due to the subscription of non-voting shares of Telco on a recent capital increases. This decision also requires Telefónica to divest such non-voting shares of Telco S.p.A.
|
The timing for the accomplishment of the conditions and obligations imposed by CADE on both decisions was classified by CADE as confidential and reserved information.
|
|
·
|
On December 13, 2013, Telefónica, S.A. announced, in relation to the two decisions adopted by CADE on its December 4, 2013 session, that the Company considers that the remedies imposed were unreasonable and therefore, is further analyzing the possibility of initiating the appropriate legal actions.
|
In line with such course of action, and to reinforce our strong commitment with the previous obligations undertaken by Telefónica to remain separate from Telecom Italia´s Brazilian businesses, Telefónica, S.A., highlighted in the aforementioned announcement, that Mr. César Alierta Izuel and Mr. Julio Linares López have decided to resign, with immediate effect, from their positions as Directors of Telecom Italia; and Mr. Julio Linares has decided to resign, with immediate effect, from his position in the slate submitted by Telco, S.p.A. for the potential re-election of the Board of Directors of Telecom Italia in the Shareholders Meeting of the aforementioned company, called for December 20, 2013.
For the same reasons, Telefónica, S.A., indicated that, without prejudice of any of the rights recognized in Telco, S.p.A. Shareholder`s Agreement, has decided for the time being not to avail of its right to appoint two Directors in the Board of Directors of Telecom Italia.
On November 27, 2013, the Shareholders and the 2012 Lenders entered into certain contractual arrangements pursuant to which the 2012 Share Pledge was released and the 2012 Pledged Shares Option Agreement was terminated.
On November 27, 2013, a new pledged shares option agreement (the "2013 Pledged Shares Option Agreement") was entered into between, inter alias, the Shareholders and Intesa Sanpaolo, S.p.A. and Mediobanca - Banca di Credito Finanziario S.p.A. (the "2013 Lenders") to establish the terms and conditions which would govern the Shareholders’ call option (the "2013 Call Option") to acquire from the 2013 Lenders at the terms and conditions referred to therein, any Telecom Italia S.p.A. ordinary shares (the "2013 Pledged Shares") that would have been appropriated by the 2013 Lenders in case of enforcement of the pledge (the "2013 Share Pledge") created under and pursuant to the share pledge agreement entered into on November 27, 2013 between Telco S.p.A. and 2013 Lenders as security for the obligations of Telco S.p.A. under the new facility agreement entered into between Telco S.p.A. and the 2013 Lenders on October 4, 2013 (the "New Banking Facility Agreement").
Material Contract Related to Our Investment in China Unicom
On September 6, 2009, Telefónica and China Unicom entered into a subscription agreement, (the “Subscription Agreement”), pursuant to which each party conditionally agreed to invest the equivalent of 1 billion U.S. dollars in the other party through the acquisition of shares in the other party. Moreover, both parties entered into a strategic alliance agreement which provides for, among other areas for cooperation, joint procurement of infrastructure and client
equipment, common development of mobile service platforms, joint provisions of service to multinational customers, roaming, research and development, sharing of best practices and technical, operational and management know-how, joint development of strategic initiatives in the area of network evolution, joint participation in international alliances and exchanges of senior management.
On October 21, 2009, the mutual share exchange pursuant to the Subscription Agreement was implemented through the subscription by Telefónica Internacional of 693,912,264 newly issued shares of China Unicom and a contribution in kind to China Unicom of 40,730,735 shares of Telefónica.
Following the completion of the transaction, we increased our share of China Unicom’s voting share capital from 5.38% to 8.06% and obtained the right to appoint a member to its board of directors, while China Unicom became owner of approximately 0.87% of our voting share capital at that date. Subsequently, after a capital reduction carried out by China Unicom, we reached a shareholding equivalent to 8.37% of the company’s voting share capital.
Under the Subscription Agreement, we agreed with China Unicom that for a period of one year from completion of the acquisition of the mutual share exchange, we shall not, directly or indirectly, sell, transfer or dispose of any of the China Unicom shares held, directly or indirectly, by us or any of our subsidiaries (save for the transfer of such shares to any member of the Telefónica group). China Unicom has made an analogous undertaking with respect to its participation in our share capital.
In addition, subject to Telefónica or any of its subsidiaries holding in aggregate, directly or indirectly, not less than 5% of the issued share capital of China Unicom from time to time and to the extent not prohibited under applicable law, the articles of association of China Unicom and the Hong Kong Listing Rules, we shall be entitled to nominate one representative to the Board of Directors of China Unicom.
Finally, with effect from completion, and for so long as the strategic alliance agreement is in effect, China Unicom shall not (i) offer, issue or sell any significant number of its ordinary shares (including those held in treasury by the company itself, if any), or any securities convertible into or other rights to subscribe for or purchase a significant number of China Unicom’s ordinary shares (including those held in treasury by the company itself, if any), to any of our current major competitors or (ii) make any significant investment, directly or indirectly, in any of our current major competitors. We have made similar undertakings.
The strategic alliance agreement between the parties terminates on the third anniversary and automatically renews thereafter for one year terms, subject to either party’s right to terminate on six months’ notice. Also, the strategic alliance agreement may be terminated by China Unicom if we sell our shares in China Unicom causing us to own less than 5% of the issued share capital of China Unicom or by us if China Unicom sells our shares and ceases to own at least 0.5% of our issued share capital. In addition, the strategic alliance agreement is subject to termination in the event either party is in default and automatically terminates on a change in control of China Unicom.
On January 23, 2011, Telefónica and China Unicom entered into an extension to their already existing strategic alliance agreement (the “Enhanced Strategic Alliance Agreement”) in which both companies agreed to strengthen and deepen their strategic cooperation in certain business areas and through which, upon the terms and conditions set out thereof, each party agreed to invest the equivalent of 500 million U.S. dollars in ordinary shares of the other party toward the alliance. Furthermore, we agreed to propose the appointment of a director nominated by China Unicom.
Pursuant to the Enhanced Strategic Alliance Agreement, Telefónica, through its wholly-owned subsidiary, Telefónica Internacional acquired 282,063,000 ordinary shares of China Unicom through several transactions executed in the period between January 25, 2011 and September 7, 2011, investing an aggregate amount equivalent to approximately 500 million U.S. dollars (equivalent to 358 million euros).
Additionally, on January 28, 2011, China Unicom acquired 21,827,499 Telefónica shares at the agreed price of 17.16 euros per share, giving it ownership of 1.37% of the Company’s capital (the arithmetic average of the closing price of Telefónica shares as quoted on the Madrid Stock Exchange for the thirty consecutive trading days ending on January 14, 2011), which represents a total price of 500 million U.S. dollars. In recognition of China Unicom’s stake in Telefónica, the Company nominated Mr. Chang Xiaobing, who was designated by China Unicom, to the Board of Directors at the General Shareholders’ Meeting held on May 18, 2011.
At December 31, 2011, Telefónica’s shareholding in China Unicom amounted to 9.6% of its capital stock.
Since their strategic alliance agreement signed in September 2009, Telefónica and China Unicom have made significant progress in various areas of cooperation. In this respect, we believe that this agreement will enhance this alliance and deepen cooperation between the two companies in the areas of procurement, mobile service platforms, service to multinational customers, wholesale carriers, roaming technology/R&D, international business development, cooperation and sharing of best practices.
On June 10, 2012, Telefónica, S.A. through its 100% subsidiary, Telefónica Internacional, S.A.U., and China United Network Communications Group Company Limited ("Unicom Parent") through a 100% owned subsidiary, signed an agreement for the acquisition by this last company of 1,073,777,121 shares of China Unicom -Hong Kong- Limited, owned by Telefónica, equivalent to 4.56% of the issued share capital.
On July 21, 2012, the aforementioned agreement was complemented by a Supplemental Agreement which determined the acquisition of the shares at a price of HK$10.02 per share, for a total amount of HK$10,759,246,752.42 (approximately 1,142 million euros). The transaction was completed on July 30, 2012, after obtaining the relevant regulatory authorizations.
As of the date of this Annual Report, Telefónica’s shareholding in China Unicom amounts to 5.01% of its capital stock and Mr. César Alierta, chairman of Telefónica, S.A. is a member of the Board of Directors of China Unicom.
Material Contract related to the sale of Customer Relationship Management (CRM) business, Atento.
As a result of the sale agreement of Atento by Telefónica, announced on October 12, 2012 and ratified on December 12, 2012, both companies signed a Master Service Agreement which regulates Atento’s relationship with the Telefónica Group as a service provider for a period of nine years.
By virtue of this agreement, Atento became Telefónica’s preferred Contact Center and Customer Relationship Management (CRM) service provider, stipulating annual commitments in terms of turnover which updates in line with inflation and deflation that vary from country to country, pursuant to the volume of services Atento has been providing to the entire Group.
In the case of an eventual failure to meet the annual turnover commitments that could result in compensation, which would be calculated based on the difference between the actual amount of turnover and the predetermined commitment, applying a percentage based on the Contract Center’s business margin to the final calculation.
Lastly, the Master Agreement sets forth a reciprocal arrangement, whereby Atento assumes similar commitments to subscribe its telecommunications services to Telefónica.
Agreement for the acquisition of E-Plus
Telefónica, S.A. and its German listed subsidiary Telefónica Deutschland Holding AG (hereinafter, “Telefónica Deutschland”) on July, 23, 2013 entered into an agreement (amended on August 26, 2013) with the Dutch company Koninklijke KPN NV (hereinafter, “KPN”) under which Telefónica Deutschland committed itself to acquire the shares of the German subsidiary of KPN, E-Plus Mobilfunk GmbH & Co. KG (hereinafter, “E-Plus”), receiving KPN, as consideration, 24.9% of Telefónica Deutschland and 3,700 million euros.
Telefónica committed to subsequently acquire from KPN, 4.4% of Telefónica Deutschland for a total amount of 1,300 million euros, consequently, after the aforementioned acquisition, KPN’s stake in Telefónica Deutschland will be reduced to 20.5%.
Telefónica also committed to subscribe the proportional corresponding share in the capital increase approved by Telefónica Deutschland in the Extraordinary General Meeting held on February, 11, 2014, to finance the cash consideration of the transaction.
The closing of this transaction is subject to certain conditions of which only the relevant authorization from the Competition Authority remains.
Exchange Controls and Other Limitations Affecting Security Holders
Ownership limitations
There are no limitations with respect to the ownership of our assets or share capital except those derived from the application of the reciprocity principle as described above.
Trading by us in our own shares or shares of companies under our control
Consistent with applicable Spanish laws and regulations and the authorization of our shareholders, from time to time we or our affiliates engage in transactions involving securities of members of our Group. These transactions may include purchases of shares of group members, forward contracts with respect to these shares and other similar transactions.
At December 31, 2013, we held 29,411,832 shares of treasury stock, representing 0.64627% of our capital stock. At December 31, 2012, we held 47,847,810 shares of treasury stock, representing 1.05136% of our capital stock. As a part of our shareholders’ remuneration policy, we have implemented various share buyback programs since 2003. For further description about our shareholders’ return, see “Item 8. Financial Information—Dividend Information and Share Buyback Programs.”
The Spanish Corporations Law prohibits the purchase by us and our subsidiaries of shares in the secondary market except in the following limited circumstances:
|
|
·
|
the purchase of shares must be authorized by a general meeting of our shareholders and, in the case of a purchase of shares by a subsidiary, also by a general meeting of shareholders of the subsidiary;
|
|
|
·
|
the shares so purchased have no economic or voting rights while held by us and have no voting rights while held by our subsidiaries;
|
|
|
·
|
the purchaser must create reserves equal to the purchase price of any shares that are purchased and, if a subsidiary is the acquirer, the reserve must also be recorded by the parent company; and
|
|
|
·
|
the total number of shares held by us and our subsidiaries may not exceed 10% of our total capital.
|
Any acquisition of our shares exceeding, or that causes us and our subsidiaries’ holdings to exceed, 1% of our voting rights must be reported to the CNMV.
At our annual general shareholders meeting held on June 2, 2010, our shareholders extended their prior authorization to the Board of Directors to acquire our shares for an additional 5 years from the date of such meeting. The authorization also applies to companies under our control. Pursuant to the authorization, the aggregate nominal value of our shares held by us or any of our subsidiaries cannot exceed the limit established by applicable laws (which is, as of the date of this Annual Report, 10% of our outstanding capital).
Other restrictions on acquisitions of shares
A person or group of persons that directly or indirectly exercises beneficial ownership or control of 3% or more of the voting rights, or which increases or decreases the number of shares which it owns or controls to an amount which equals or exceeds 3% 5%, 10%, 15%, 20%, 25%, 30%, 35%, 40%, 45%, 50%, 60%, 70%, 75%, 80% and 90% of such voting rights, must inform us and the CNMV of such ownership.
A person or group of persons that fails to inform any of the above entities after reaching any of the indicated thresholds may incur fines and penalties. A person or group that is a member of our Board of Directors or a member of our Executive Commission must report any acquisition or transfer of our capital stock, regardless of the amount of shares acquired or transferred.
For reporting requirements concerning acquisitions by us or our affiliates of our shares, see “—Trading by us in our own shares or shares of companies under our control” above.
Dividend and Liquidation Rights
According to Spanish law and our bylaws, dividends may only be paid out of profits or distributable reserves if the value of our net worth is not, and as a result of such distribution would not be, less than our capital stock. Pursuant to Spanish law, we are required to reserve 10% of our fiscal year net income until the amount in our legal reserve reaches 20% of our capital. Our legal reserve is currently at 20%.
Dividends payable by us to non-residents of Spain ordinarily are subject to a Spanish withholding tax. For the tax implications of dividends to U.S. Holders (as defined below), see “—Taxation.”
Upon our liquidation, our shareholders would be entitled to receive pro rata any assets remaining after the payment of our debts and taxes and expenses of such liquidation. Any change in the rights of shareholders to receive dividends and payment upon liquidation would require an amendment to our bylaws by resolution adopted by a general meeting of shareholders. If there were more than one class of shares, such amendment would also require the approval of each class of shareholders affected by the amendment.
Preemptive Rights and Increases of Share Capital
Pursuant to the Spanish Corporations Law, shareholders have preemptive rights to subscribe for any new shares and for bonds convertible into shares. Such rights may not be available under special circumstances if waived by a resolution passed at a general meeting of shareholders in accordance with Article 308 of the Spanish Corporations Law, or the Board of Directors, if authorized (Article 506 of the Spanish Corporation Law). Further, such rights, in any event, will not be available in the event of an increase in capital to meet the requirements of a convertible bond issue or a merger in which shares are issued as consideration. Such rights:
|
|
·
|
are transferable;
|
|
|
·
|
may be traded on the Automated Quotation System; and
|
|
|
·
|
may be of value to existing shareholders because new shares may be offered for subscription at prices lower than prevailing market prices.
|
Absent an exemption from registration, shares issuable upon exercise of rights must be registered under the Securities Act of 1933 in order to be offered to holders of ADRs. If we decided not to register the shares, the rights would not be distributed to holders of ADRs. Pursuant to the Deposit Agreement, however, holders of ADRs are entitled to receive their proportionate share of the proceeds, if any, from sale by the Depositary of any rights accruing to holders of ADRs.
The following is a general summary of the material Spanish and U.S. federal income tax consequences to U.S. Holders (as defined below) of the ownership and disposition of shares or ADSs. This summary is based upon Spanish and U.S. tax laws (including the U.S. Internal Revenue Code of 1986, as amended (the “Code”), final, temporary and proposed U.S. Treasury regulations, rulings, judicial decisions and administrative pronouncements), and the Convention Between the United States of America and the Kingdom of Spain for the Avoidance of Double Taxation and the Prevention of Fiscal Evasion with Respect to Taxes on Income, signed February 22, 1990, (the “Treaty”), all as of the date hereof and all of which are subject to change or changes in interpretation, possibly with retroactive effect. In addition, the summary is based in part on representations of the Depositary and assumes that each obligation provided for in or otherwise contemplated by the Deposit Agreement or any other related agreements will be performed in accordance with its terms.
As used herein, the term “U.S. Holder” means a beneficial owner of one or more shares or ADSs:
|
|
(a)
|
that is, for U.S. federal income tax purposes, one of the following:
|
|
|
i.
|
a citizen or individual resident of the United States,
|
|
|
ii.
|
a corporation (or other entity taxable as a corporation) created or organized in or under the laws of the United States or any political subdivision thereof, or
|
|
|
iii.
|
an estate or trust the income of which is subject to U.S. federal income taxation regardless of its source;
|
|
|
(b)
|
who is entitled to the benefits of the Treaty;
|
|
|
(c)
|
who holds the shares or ADSs as capital assets for U.S. federal income tax purposes;
|
|
|
(d)
|
who owns, directly, indirectly or by attribution, less than 10% of the share capital or voting stock of Telefónica; and
|
|
|
(e)
|
whose holding is not attributable to a fixed base or permanent establishment in Spain.
|
This summary does not address all of the tax considerations, including the potential application of the provisions of the Code known as the Medicare contribution tax, that may apply to holders that are subject to special tax rules, such as U.S. expatriates, insurance companies, tax-exempt organizations, certain financial institutions, persons subject to the alternative minimum tax, dealers and certain traders in securities, persons holding shares or ADSs as part of a straddle, hedging, conversion or integrated transaction, persons who acquired their shares or ADSs pursuant to the exercise of employee stock options or otherwise as compensation, partnerships or other entities classified as partnerships for U.S. federal income tax purposes or persons whose functional currency is not the U.S. dollar. Such holders may be subject to U.S. federal income tax consequences different from those set forth below.
If a partnership holds shares or ADSs, the tax treatment of a partner generally will depend upon the status of the partner and the activities of the partnership. A partner in a partnership that holds shares or ADSs is urged to consult its own tax advisor regarding the specific tax consequences of owning and disposing of the shares or ADSs.
For purposes of the Treaty and U.S. federal income tax, U.S. Holders of ADSs will generally be treated as owners of the underlying shares represented by such ADSs. Accordingly, no gain or loss will be recognized if a U.S. Holder exchanges ADSs for the underlying shares represented by those ADSs.
The U.S. Treasury has expressed concerns that parties to whom American depositary receipts are released before shares are delivered to the depositary, or intermediaries in the chain of ownership between holders and the issuer of the security underlying the American depositary receipts, may be taking actions that are inconsistent with the claiming of foreign tax credits by U.S. holders of American depositary receipts. Such actions would also be inconsistent with the claiming of the reduced rates of tax applicable to dividends received by certain non-corporate U.S. Holders. Accordingly, the availability of foreign tax credits to U.S. Holders of ADSs and the reduced tax rates for dividends received by certain non-corporate U.S. Holders of ADSs, each as described below, could be affected by actions taken by such parties or intermediaries.
This discussion assumes that Telefónica is not, and will not become, a passive foreign investment company (“PFIC”), as discussed below under “—U.S. Federal Income Tax Considerations—Passive foreign investment company rules.”
U.S. Holders of shares or ADSs should consult their own tax advisors concerning the specific Spanish and U.S. federal, state and local tax consequences of the ownership and disposition of shares or ADSs in light of their particular situations as well as any consequences arising under the laws of any other taxing jurisdiction. In particular, U.S. Holders are urged to consult their own tax advisors concerning their eligibility for benefits under the Treaty.
Spanish Tax Considerations
Taxation of dividends
Under Spanish law, dividends paid by Telefónica to U.S. Holders of ordinary shares or ADSs are subject to Spanish Non-Resident Income Tax, withheld at source, as of January 1, 2012, at a rate of 21%. For these purposes, upon distribution of the dividend, Telefónica or its paying agent will withhold an amount equal to the tax due according to the rules set forth above (i.e., applying the general withholding tax rate of 21%).
However, under the Treaty, if you are a U.S. Holder, you are entitled to a reduced withholding tax rate of 15%.
To benefit from the Treaty-reduced rate of 15%, you must provide to Telefónica through its paying agent in Spain, before the tenth day following the end of the month in which the dividends were payable, a certificate from the U.S.
Internal Revenue Service (“IRS”) stating that, to the best knowledge of the IRS, such U.S. Holders are residents of the United States within the meaning of the Treaty and entitled to its benefits.
If this certificate is not provided within this period, you may afterwards obtain a refund of the amount withheld in excess of the rate provided for in the Treaty by following the procedures described in the next section.
Spanish Refund Procedure
According to Spanish Regulations on Non-Resident Income Tax, approved by Royal Decree 1776/2004 dated July 30, 2004, as amended, a refund for the amount withheld in excess of the Treaty-reduced rate can be obtained from the relevant Spanish tax authorities. To pursue the refund claim, if you are a U.S. Holder, you are required to file:
|
|
·
|
the corresponding Spanish tax form,
|
|
|
·
|
the certificate referred to in the preceding section, and
|
|
|
·
|
evidence of the Spanish Non-Resident Income Tax that was withheld with respect to you.
|
The refund claim must be filed within four years from the date in which the withheld tax was collected by the Spanish tax authorities.
U.S. Holders are urged to consult their own tax advisors regarding refund procedures and any U.S. tax implications thereof.
Additionally, under Spanish law, the first 1,500 euros of dividends obtained by individuals who are not resident in Spain for tax purposes, and do not operate through a permanent establishment in Spain, will be exempt from taxation in certain circumstances. U.S. Holders should consult their tax advisors to determine whether this exemption is available.
Taxation of capital gains
For Spanish tax purposes, income obtained from the sale of ADSs or ordinary shares of Telefónica will be treated as capital gains. Spanish non-resident income tax is currently levied at a 21% tax rate on capital gains obtained by persons not residing in Spain for tax purposes who are not entitled to the benefit of any applicable treaty for the avoidance of double taxation.
Notwithstanding the above, capital gains derived from the transfer of shares on an official Spanish secondary stock market by any holder who is resident in a country that has entered into a treaty for the avoidance of double taxation with an “exchange of information” clause (the Treaty contains such a clause) will be exempt from taxation in Spain. If you are a U.S. Holder, under the Treaty capital gains arising from the disposition of ordinary shares or ADSs will not be taxed in Spain. You will be required to establish that you are entitled to the exemption from tax under the Treaty by providing to the relevant Spanish tax authorities a certificate of residence issued by the IRS stating that to the best knowledge of the IRS, you are a U.S. resident within the meaning of the Treaty.
Spanish wealth tax
Individual U.S. Holders who hold shares or ADSs located in Spain are subject to the Spanish Wealth Tax (Impuesto sobre el Patrimonio) (Spanish Law 19/1991), which imposes tax on property located in Spain on the last day of any year.
The Spanish tax authorities may take the view that all shares of Spanish corporations and all ADSs representing such shares are located in Spain for Spanish tax purposes. If such a view were to prevail, non-residents of Spain who held shares or ADSs on the last day of any year would be subject to the Spanish wealth tax for such year on the average market value of such shares or ADSs during the last quarter of such year.
Non-residents of Spain who held shares, ADSs, or other assets or rights located in Spain according to Spanish wealth tax law, on the last day of the year whose combined value exceeds 700,000 euros would be subject to the Spanish wealth tax on that excess amount at marginal rates varying between 0.2% and 2.5%, and would be obliged to file the corresponding wealth tax return.
Inheritance and gift tax
Transfers of shares or ADSs on death and by gift to individuals are subject to Spanish inheritance and gift taxes (Impuesto sobre Sucesiones y Donaciones), respectively, if the transferee is a resident of Spain for tax purposes, or if the shares or ADSs are located in Spain at the time of death, regardless of the residence of the heir or beneficiary. In this regard, the Spanish tax authorities may determine that all shares of Spanish corporations and all ADSs representing such shares are located in Spain for Spanish tax purposes. The state applicable tax rate, after applying relevant personal, family and wealth factors, generally ranges between 7.65% and 81.6% for individuals.
Gifts granted to corporations non-resident in Spain are subject to Spanish Non-Resident Income Tax at a 21% tax rate on the fair market value of the shares as a capital gain. If the donee is a United States resident corporation, the exclusions available under the Treaty described in the section “—Taxation of Capital Gains” above will be applicable.
Expenses of Transfer
Transfers of shares or ADSs will be exempt from any transfer tax (Impuesto sobre Transmisiones Patrimoniales) or VAT. Additionally, no stamp tax will be levied on such transfers.
U.S. Federal Income Tax Considerations
Taxation of dividends
Distributions received by a U.S. Holder on shares or ADSs, including the amount of any Spanish taxes withheld, other than certain pro rata distributions of shares to all shareholders (including ADS holders), will constitute foreign-source dividend income to the extent paid out of Telefónica’s current or accumulated earnings and profits (as determined for U.S. federal income tax purposes). Because Telefónica does not maintain calculations of its earnings and profits under U.S. federal income tax principles, it is expected that distributions generally will be reported to U.S. Holders as dividends. The amount of dividend income paid in euro that a U.S. Holder will be required to include in income will equal the U.S. dollar value of the distributed euro, calculated by reference to the exchange rate in effect on the date the payment is received by the Depositary (in the case of ADSs) or by the U.S. Holder (in the case of shares), regardless of whether the payment is converted into U.S. dollars on the date of receipt. If the dividend is converted to U.S. dollars on the date of receipt, a U.S. Holder will generally not be required to recognize foreign currency gain or loss in respect of the dividend income. A U.S. Holder may have foreign currency gain or loss if the dividend is converted into U.S. dollars after the date of its receipt. Gain or loss that a U.S. Holder realizes on a sale or other disposition of euro will be U.S.-source ordinary income or loss. Corporate U.S. Holders will not be entitled to claim the dividends-received deduction with respect to dividends paid by Telefónica. Subject to applicable limitations and the discussion above regarding concerns expressed by the U.S. Treasury, dividends received by certain non-corporate U.S. Holders will be taxable at rates applicable to long-term capital gains. Non-corporate U.S. Holders should consult their own tax advisors to determine whether they are subject to any special rules that limit their ability to be taxed at these favorable rates.
Spanish income taxes withheld from dividends on shares or ADSs at a rate not exceeding the rate provided in the Treaty will be creditable against a U.S. Holder’s U.S. federal income tax liability, subject to applicable restrictions and limitations that may vary depending upon the U.S. Holder’s circumstances and the discussion above regarding concerns expressed by the U.S. Treasury. Spanish taxes withheld in excess of the rate applicable under the Treaty will not be eligible for credit against a U.S. Holder’s federal income tax liability. See “Spanish Tax Considerations—Taxation of dividends” above for a discussion of how to obtain the applicable treaty rate. Instead of claiming a credit, a U.S. Holder may elect to deduct foreign taxes (including the Spanish taxes) in computing its taxable income, subject to generally applicable limitations. An election to deduct foreign taxes (instead of claiming foreign tax credits) applies to all taxes paid or accrued in the taxable year to foreign countries and possessions of the United States. The limitations on foreign taxes eligible for credit are calculated separately with respect to specific classes of income. The rules governing foreign tax credits are complex. Therefore, U.S. Holders should consult their own tax advisors regarding the availability of foreign tax credits in their particular circumstances.
Taxation upon sale or other disposition of shares or ADSs
A U.S. Holder will generally recognize U.S.-source capital gain or loss on the sale or other disposition of shares or ADSs. Any such gain or loss will be long-term capital gain or loss if the U.S. Holder has held such shares or ADSs for more than one year. The amount of the U.S. Holder’s gain or loss will be equal to the difference between such U.S. Holder’s tax basis in the shares or ADSs sold or otherwise disposed of and the amount realized on the sale or other disposition, as determined in U.S. dollars.
As discussed under “Spanish Tax Considerations—Taxation of capital gains” above, gain realized by a U.S. Holder on the sale or other disposition of shares or ADSs will be exempt from Spanish tax on capital gains under the Treaty. If a U.S. Holder is eligible for the exemption from Spanish tax on capital gains but does not follow appropriate procedures for obtaining the exemption, such holder will not be entitled to credit the amount of Spanish tax on capital gains paid against its U.S. federal income tax liability. U.S. Holders should consult their own tax advisors regarding the potential Spanish tax consequences of a sale or other disposition of shares or ADSs and the procedures available for an exemption from such tax.
Passive foreign investment company rules
Telefónica believes that it was not a PFIC for U.S. federal income tax purposes for its 2013 taxable year. However, because PFIC status depends upon the composition of a company’s income and assets and the market value of its assets (including, among others, less than 25% owned equity investments) from time to time, there can be no assurance that Telefónica will not be considered a PFIC for any taxable year. If Telefónica were treated as a PFIC for any taxable year during which a U.S. Holder owned a share or ADS, certain adverse tax consequences could apply to the U.S. Holder.
If Telefónica were treated as a PFIC for any taxable year during which a U.S. Holder owned a share or ADS, gain recognized by a U.S. Holder on a sale or other disposition of such share or ADS would be allocated ratably over the U.S. Holder’s holding period for the share or ADS. The amounts allocated to the taxable year of the sale or other disposition and to any year before Telefónica became a PFIC would be taxed as ordinary income. The amount allocated to each other taxable year would be subject to tax at the highest rate in effect for individuals or corporations, as appropriate, and an interest charge would be imposed on the resulting tax liability. The same treatment would apply to any distribution in respect of shares or ADSs to the extent it exceeds 125% of the average of the annual distributions on shares or ADSs received by the U.S. Holder during the preceding three years or the U.S. Holder’s holding period, whichever is shorter. Certain elections may be available that would result in alternative treatments (such as mark-to-market treatment) of the shares or ADSs.
In addition, if Telefónica were treated as a PFIC in a taxable year in which it pays a dividend or in the prior taxable year, the favorable dividend rates discussed above with respect to dividends paid to certain non-corporate U.S. Holders would not apply.
If we are a PFIC for any taxable year during which a U.S. Holder owned our shares or ADSs, the U.S. Holder will generally be required to file IRS Form 8621 with its annual U.S. federal income tax return, subject to certain exceptions.
Information reporting and backup withholding
Payments of dividends and sales proceeds that are made within the United States or through certain U.S.-related financial intermediaries generally are subject to information reporting and may be subject to backup withholding unless the U.S. Holder is a corporation or other exempt recipient or, in the case of backup withholding, the U.S. Holder provides a correct taxpayer identification number and certifies that it is not subject to backup withholding. The amount of any backup withholding from a payment to a U.S. Holder will be allowed as a credit against the U.S. Holder’s U.S. federal income tax liability and may entitle such U.S. Holder to a refund, provided that the required information is timely furnished to the IRS.
Certain U.S. Holders who are individuals and certain specified entities, may be required to report information relating to stock of a non-U.S. person, subject to certain exceptions (including an exception for stock held through a U.S. financial institution). U.S. Holders are urged to consult their tax advisers regarding the effect, if any, of this legislation on their ownership and disposition of shares or ADSs.
Not Applicable.
Not Applicable.
Where You Can Find More Information
We file Annual Reports on Form 20-F and furnish periodic reports on Form 6-K to the SEC. You may read and copy any of these reports at the SEC’s public reference room in Washington, D.C. Please call the SEC at 1-800-SEC-0330 for further information on the public reference rooms. Our SEC filings are also available to the public from commercial document retrieval services. Some of our SEC filings are also available at the website maintained by the SEC at “http://www.sec.gov.”
Our ADSs are listed on the New York Stock Exchange under the symbol “TEF.” You may inspect any periodic reports and other information filed with or furnished to the SEC by us at the offices of the New York Stock Exchange, 20 Broad Street, New York, New York 10005.
As a foreign private issuer, we are exempt from the rules under the Exchange Act which prescribe the furnishing and content of proxy statements, and our officers, directors and principal shareholders are exempt from the reporting and “short-swing” profit recovery provisions contained in Section 16 of the Exchange Act.
We are subject to the informational requirements of the Spanish securities commission and the Spanish stock exchanges, and we file reports and other information relating to our business, financial condition and other matters with the Spanish securities commission and the Spanish stock exchanges. You may read such reports, statements and other information, including the annual and biannual financial statements, at the public reference facilities maintained in Madrid and Barcelona. Some of our Spanish securities commission filings are also available at the website maintained by the CNMV at http://www.cnmv.es.
We have appointed Citibank, N.A. to act as Depositary for the Telefónica ADSs. Citibank will, as provided in the Deposit Agreement, arrange for the mailing of summaries in English of such reports and communications to all record holders of the ADSs of Telefónica. Any record holder of Telefónica ADSs may read such reports and communications or summaries thereof at Citibank’s office located at 388 Greenwich Street, 14th Floor, New York, New York 10013.
Not applicable.
We are exposed to various financial market risks as a result of: (i) our ordinary business activity, (ii) debt incurred to finance our business, (iii) our investments in companies, and (iv) other financial instruments related to the above commitments.
The main market risks affecting us are as follows:
|
|
a)
|
Exchange rate risk
|
|
|
Exchange rate risk arises primarily from (i) our international presence, through our investments and businesses in countries that use currencies other than the euro (primarily in Latin America, but also in the United Kingdom and the Czech Republic), and (ii) debt denominated in currencies other than that of the country where the business is conducted or the home country of the company incurring such debt.
|
|
|
b)
|
Interest rate risk
|
|
|
Interest rate risk arises primarily from changes in interest rates affecting (i) financial expenses on floating rate debt (or short-term debt likely to be renewed), due to changes in interest rates and (ii) the value of long-term liabilities at fixed interest rates.
|
|
|
c)
|
Share price risk
|
|
|
Share price risk arises primarily from changes in the value of our equity investments that may be bought, sold or otherwise involved in transactions, from changes in the value of derivatives associated with such investments, from changes in the value of our treasury shares and from equity derivatives.
|
We are also exposed to liquidity risk if a mismatch arises between our financing needs (including operating and financial expense, investment, debt redemptions and dividend commitments) and our sources of finance (including revenues, divestments, credit lines from financial institutions and capital market transactions). The cost of financing could also be affected by movements in credit spreads (over benchmark rates) demanded by lenders.
Finally, we are exposed to “country risk” (which overlaps with market and liquidity risks). This refers to the possible decline in the value of assets, cash flows generated or cash flows returned to the parent company as a result of political, economic or social instability in the countries where we operate, especially in Latin America.
We seek to actively manage these risks through the use of derivatives (primarily on exchange rates, interest rates and share prices) and by incurring debt in local currencies, where appropriate, with a view to stabilizing cash flows, our income statement and, to a lesser extent, part of the value of our investments. In this way, we attempt to protect our solvency, facilitate financial planning and take advantage of investment opportunities.
We manage our exchange rate risk and interest rate risk in terms of net debt and net financial debt as calculated by us. We believe that these parameters are more appropriate to understanding our debt position. Net debt and net financial debt take into account the impact of our cash balance and cash equivalents including derivatives positions with a positive value linked to liabilities. Neither net debt nor net financial debt as calculated by us should be considered an alternative to gross financial debt (the sum of current and non-current interest-bearing debt) as a measure of our liquidity. For a more detailed description on reconciliation of net debt and net financial debt to gross financial debt, see “Item 5. Operating and Financial Review and Prospects—Presentation of Financial Information—Non-GAAP financial information—Net financial debt and net debt.”
For a more detailed description on quantitative and qualitative disclosures about market risks see Note 16 to our Consolidated Financial Statements.
The Depositary of our ADR program is Citibank, N.A., and the address of its principal executive office is 388 Greenwich Street, 14th Floor, New York, New York 10013.
Our ADSs are listed on the New York Stock Exchange under the symbol “TEF.”
Until January 21, 2011, each ADS represented the right to receive three ordinary shares of capital stock of 1.00 euros nominal value each, of Telefónica, S.A. Citibank, in its capacity as Depositary, effected a ratio change on the Telefónica, S.A.’s ADR program so that each ADS now represents the right to receive one ordinary share. The effective date of the ratio change was January 21, 2011. The Depositary issues ADSs in the form of certificated ADSs (American Depositary Receipts, or ADRs) or uncertificated ADSs pursuant to the Deposit Agreement.
Under the terms of the Deposit Agreement, as of the date of this Annual Report, an ADS holder may have to pay to the Depositary the services fees specified in the table below:
|
Category
|
Depositary Actions
|
Associated Fee / By Whom Paid
|
||
|
(a) Depositing or substituting the underlying shares
|
Issuance of ADSs upon the deposit of shares
|
Up to 5.00 dollars for each 100 ADSs (or portion thereof) evidenced by the new ADSs delivered (charged to person depositing the shares or receiving the ADSs)(1)
|
|
(b) Receiving or distributing dividends
|
Distribution of cash dividends or other cash distributions; distribution of share dividends or other free share distributions; distribution of securities other than ADSs or rights to purchase additional ADSs
|
Up to 5.00 dollars for each 100 ADSs (or portion thereof) held (in the case of cash distributions, deducted from the relevant distribution; in the case of all other distributions, billed to the relevant holder)(2)
|
||
|
(c) Selling or exercising rights
|
Distribution or sale of securities
|
Up to 5.00 dollars for each 100 ADSs (or portion thereof) held (billed to the relevant holder)
|
||
|
(d) Withdrawing an underlying security
|
Acceptance of ADSs surrendered for withdrawal of deposited securities
|
Up to 5.00 dollars for each 100 ADSs (or portion thereof) evidenced by the ADSs surrendered (charged to person surrendering or to person to whom withdrawn securities are being delivered)(1)
|
||
|
(e) Transferring, splitting or grouping receipts
|
Transfers
|
Up to 1.50 dollars per ADS so presented (charged to person presenting certificate for transfer)
|
||
|
(f) General depositary services, particularly those charged on an annual basis
|
Other services performed by the Depositary in administering the ADSs
|
Up to 5.00 dollars for each 100 ADSs (or portion thereof) held on the applicable record date (billed to person holding ADSs on applicable record date established by the Depositary)(2)
|
||
|
(g) Expenses of the Depositary
|
Certain fees and expenses incurred by the depositary bank and certain taxes and governmental charges in connection with:
·
compliance with foreign exchange control regulations or any law or regulation relating to foreign investment;
·
the Depositary or its custodian’s compliance with applicable law, rule or regulation;
·
stock transfer or other taxes and other governmental charges;
·
cable, telex, facsimile transmission/delivery;
·
expenses of the Depositary in connection with the conversion of foreign currency into U.S. dollars (which are paid out of such foreign currency);
·
any other charge payable by Depositary or its agents.
|
Expenses payable at the sole discretion of the Depositary (billed or deducted from cash distributions to person holding ADSs on applicable record date established by the Depositary)
|
||
|
(1) In the case of ADSs issued by the Depositary into DTC or presented to the Depositary via DTC, the ADS issuance and cancellation fees will be payable to the Depositary by DTC Participant(s) receiving the ADSs from the Depositary or the DTC Participant(s) surrendering the ADSs to the Depositary for cancellation, as the case may be, on behalf of the beneficial owner(s) and will be charged by the DTC Participant(s) to the account(s) of the applicable beneficial owner(s) in accordance with the procedures and practices of the DTC participant(s) as in effect at the time.
(2) For ADSs held through DTC, the Depositary fees for distributions other than cash and the Depositary service fee are charged by the Depositary to the DTC Participants in accordance with the procedures and practices prescribed by DTC from time to time and the DTC Participants in turn charge the amount of such fees to the beneficial owners for whom they hold ADSs.
|
||||
The Depositary has agreed to reimburse or pay on behalf of Telefónica, S.A., certain reasonable expenses related to our ADS program and incurred by us in connection with the program (such as NYSE listing fees, legal and accounting fees incurred with preparation of Form 20-F and ongoing SEC compliance and listing requirements, distribution of proxy materials, investor relations expenses, etc.). The Depositary has covered all such expenses incurred by us during 2013 for an amount of 7.4 million dollars. The amounts the Depositary reimbursed or paid are not perforce related to the fees collected by the depositary from ADS holders.
As part of its service to us, the Depositary has agreed to waive certain expenses for the standard costs associated with the administration of our ADS program for the year ended December 31, 2013.
None.
Not applicable.
Disclosure Controls and Procedures
Our Chief Executive Officer and our Chief Financial Officer, after evaluating the effectiveness of our disclosure controls and procedures (as defined in Rule 13a-15(e) under the Exchange Act) as of the end of the period covered by this Form 20-F, have concluded that, as of such date, our disclosure controls and procedures were effective.
Management’s Annual Report on Internal Control over Financial Reporting
The management of Telefónica is responsible for establishing and maintaining adequate internal control over financial reporting as defined in Rule 13a–15(f) under the Exchange Act. Telefónica’s internal control system is designed to provide reasonable assurance as to the reliability of financial reporting and the preparation of the published financial statements under generally accepted accounting principles.
Any internal control system, no matter how well designed, has inherent limitations, including the possibility of human error and the circumvention or overriding of the controls and procedures, which may not prevent or detect misstatements.
Telefónica management assessed the effectiveness of Telefónica’s internal control over financial reporting as of December 31, 2013. In making this assessment, it used the criteria set forth by the Committee of Sponsoring Organizations of the Treadway Commission (COSO 1992 framework) in Internal Control – Integrated Framework. Based on its assessment and those criteria, Telefónica management believes that at December 31, 2013, Telefónica’s internal control over financial reporting is effective.
Report of the Independent Registered Public Accounting Firm
Telefónica’s independent registered public accounting firm, Ernst & Young, S.L., has issued a report on the effectiveness of the company’s internal control over financial reporting. The report is included on page F-2.
Changes in Internal Control Over Financial Reporting
There were no changes in our internal control over financial reporting during the period covered by this Annual Report that have materially affected, or are reasonably likely to materially affect, our internal control over financial reporting.
Our Board of Directors has determined that Mr. Antonio Massanell Lavilla meets the requirements of an “audit committee financial expert” as such term is defined by the SEC.
In December 2006, we adopted a code of business conduct and ethics, the Telefónica Business Principles, which apply to all Telefónica Group employees. In March 2008, we decided to modify such Business Principles in order to gather in them all components of the code of ethics definition in Section 406 of Sarbanes-Oxley Act, and consequently our code of ethics for senior officers was replaced by the Telefónica Business Principles. These Principles were further modified on October 8, 2010, in order to include a new principle of privacy and data protection. -A copy of the Telefónica Business Principles is filed as an Exhibit to this Annual Report. For more information, please see “Item 16G. Corporate Governance Code of Ethics.”
Please see Note 21(d) to our Consolidated Financial Statements.
The Audit and Control Committee’s Pre-Approval Policies and Procedures
The engagement of any service rendered by our external auditor or any of its affiliates must always have the prior approval of our Audit and Control Committee. Such Committee has developed a Pre-approval Policy regarding the engagement of professional services by our external auditor, in accordance with the Spanish Audit Law and the Sarbanes-Oxley Act. This Policy establishes the obligation to obtain prior approval from our Audit and Control Committee for any service to be rendered by our external auditor to Telefónica or any of its subsidiaries.
This Policy sets forth restrictions on engaging our external auditor for the performance of non-audit services, according to which the engagement of our external auditor for the provision of such services is only permitted when there is no other firm available to provide the needed services at a comparable cost and with a similar level of quality. Moreover, this Policy prohibits the engagement of our external auditor for the provision of certain type of services that would be considered as “prohibited services.”
In addition, the Audit and Control Committee oversees the total amount of fees paid to our external auditor for the provision of non-audit services in order to assure that such fees do not exceed a certain percentage of the total amount of fees paid for the provision of audit services.
Not applicable.
The number of shares of treasury stock at December 31, 2013, amounted to 29,411,832 (47,847,810 at December 31, 2012). These treasury shares are directly owned by Telefónica, S.A.
|
Period of Fiscal Year
|
Total Number of Shares Purchased
|
Average Price Paid per Share (euro)
|
Total Number of Shares (or Units) Purchased as Part of Publicly Announced Plans or Programs(1)
|
|||
|
January 1 to January 31
|
8,954,160
|
10
.
59
|
185
,
094
|
|||
|
February 1 to February 28
|
29,723,321
|
10
.
02
|
204
,
854
|
|||
|
March 1 to March 31
|
7,614,316
|
10
.
92
|
181
,
762
|
|||
|
April 1 to April 30
|
900,000
|
10
.
94
|
185
,
563
|
|||
|
May 1 to May 31
|
14
,
575,000
|
10
.
90
|
181
,
479
|
|||
|
June 1 to June 30
|
5,250
,000
|
9
.
83
|
192
,
337
|
|||
|
July 1 to July 31
|
8,209
,
736
|
9
.
90
|
2
00,
976
|
|||
|
August 1 to August 31
|
11,879,426
|
10
.
73
|
174
,
649
|
|||
|
September 1 to September 30
|
4,606,151
|
11
.
15
|
170
,
305
|
|||
|
October 1 to October 31
|
3,628,588
|
12
.
65
|
151
,
537
|
|||
|
November 1 to November 30
|
7,907,686
|
12
.
41
|
150
,
997
|
|||
|
December 1 to December 31
|
9,906,165
|
11
.
54
|
31
,
857
|
|||
|
Total
|
113,154,549
|
10.73
|
2,011
,
410
|
|
|
(1)
|
Under employee share plans a maximum of 2,011,410 shares could be assigned to employees participating in voluntary plans. See—Note 19 to our Consolidated Financial Statements.
|
For a more detailed description of our plans or programs, see “Item 8. Financial Information—Dividend Information and Shareholders’ Return” and Note 19 to our Consolidated Financial Statements.
During the years ended December 31, 2012 and 2013 and through the date of this Annual Report, the principal independent accountant engaged to audit our financial statements, Ernst & Young, S.L., has not resigned, indicated that it has declined to stand for re-election after the completion of its current audit or been dismissed. For each of the years ended December 31, 2012 and 2013, Ernst & Young, S.L. has not expressed reliance on another accountant or accounting firm in its report on our audited annual accounts for such periods.
Significant Differences in Corporate Governance Practices
Corporate governance guidelines
In Spain, companies with securities listed on a Spanish stock exchange are expected to follow the Conthe Code published in May 2006, which contains corporate governance and shareholder disclosure recommendations. It combines and substitutes the former Spanish Corporate Governance Codes: the Olivencia Code of Good Governance and the Aldama Report. Spanish listed companies are required by law to publish an Annual Report on Corporate Governance and a Report on the Compensation Policy of the Board of Directors. Additionally, Spanish listed companies are required to publish their corporate governance information on their websites. We base our corporate governance procedures on the recommendations of the Conthe Code. As part of our corporate governance procedures, we have adopted regulations for our Board of Directors that govern, among other things, director qualification standards, responsibilities, compensation, access to management information, the Board of Directors’ purpose and each of our Board Committee’s purpose and responsibilities. Moreover, we have a Regulation of the General Shareholders’ Meeting that aims to reinforce its transparency, providing shareholders with a framework guaranteeing and facilitating exercise of their rights. The Annual Report on Corporate Governance published by us provides a detailed explanation of our corporate governance procedures and explains the role and duties of our Board of Directors and Board Committees. Our Annual Report on Corporate Governance and the Report on the Compensation Policy of the Board of Directors of Telefónica, S.A. are available on our website at www.telefonica.com. None of the information contained on our website is incorporated in this Annual Report.
Committees
We have had an Audit and Control Committee since 1997. Our Audit and Control Committee is composed of five non-executive directors, all of whom are deemed Rule 10A-3 independent by our Board of Directors. The functions, composition and competencies of this Committee are regulated by the Bylaws and the Board of Directors’ Regulations and are similar to those required by the New York Stock Exchange. The Audit and Control Committee shall consist of not less than three directors appointed by our Board of Directors. All Committee members shall be external directors. When appointing such members, our Board of Directors shall take into account the appointees’ knowledge and experience in matters of accounting, auditing and risk management.
We have had a Nominating, Compensation and Corporate Governance Committee since 1997, which is composed of five external directors. The functions, composition and competencies of this Committee are regulated by the Bylaws and the Board of Directors’ Regulations and are very similar to those required by the NYSE. The Nominating, Compensation and Corporate Governance Committee shall consist of not less than three directors appointed by the Board of Directors. All members of the Committee must be external directors and the majority thereof must be independent. The chairman of the Nominating, Compensation and Corporate Governance Committee, who shall in all events be an independent director, shall be appointed from among its members.
Additionally we have a Regulation Committee, a Service Quality and Customer Service Committee, an Institutional Affairs Committee, an Innovation Committee and a Strategy Committee. The functions, composition and competencies are regulated by the Board of Directors’ Regulations.
Independence of the Board
As of the date of this Annual Report, we have 18 directors, out of which eight have been deemed independent by our Board of Directors attending to the director’s classification contained in the Conthe Corporate Governance Code. A significant majority of our current directors, 15, are non-executive directors. We, in accordance with the Conthe Code, assess the independence of our directors. Among other things, independent directors: (i) shall not be, past employees or executive directors of any of the Group companies, unless three or five years have elapsed , respectively, (ii) shall not receive any payment or other form of compensation from us or our group on top of their directors’ fees, unless the amount involved is not significant, (iii) shall not be partners, now or on the past three years, in the external auditor or in the firm responsible for the audit report, (iv) shall not be executive directors or senior officers of another company where one of our executive directors or senior officers is an external director, (v) shall not have material business dealings with us or any other company in our group, (vi) shall not be spouses, nor partners maintaining an analogous affective relationship, nor close relative of any of our executive directors or senior officers and (vii) shall not stand in any of the situations listed in (i), (v) or (vi) above in relation to a significant shareholder or a shareholder with board representation.
The classification of each director shall be explained by the Board of Directors to the shareholders at the General Shareholders’ Meeting at which the appointment thereof must be made or ratified. Furthermore, such classification shall be reviewed annually by our Board of Directors after verification by the Nominating, Compensation and Corporate Governance Committee, and reported in the Annual Corporate Governance Report.
Internal Audit Function
We have an Internal Audit Department responsible for internal audit matters and for ensuring the efficiency of the internal audit control process of our different units. This Internal Audit Department reports directly to the Audit and Control Committee, thus supporting the adequate performance of all its functions.
Non-Executive Director Meetings
Pursuant to the NYSE listing standards, non-executive directors of U.S.-listed companies must meet on a regular basis without management present and the company must disclose a method for any interested parties to communicate directly with the non-executive directors. As a group, our non-executive directors do not meet formally without management present. Nevertheless, the Audit and Control Committee, the Nominating, Compensation and Corporate Governance Committee, the Institutional Affairs Committee, the Service Quality and Customer Service Committee, Regulation Committee, Strategy Committee and the Innovation Committee is composed exclusively of non-executive directors, thus giving each of these committees, the chance to analyze and discuss any matter related to our management, within its respective area of responsibility.
In addition, since May 2013, we have a lead independent director with the title “Coordinating Independent Director”, who our By-laws grant the right to have a say on key elements of governance structure that most companies in Spain and around the world, reserve to the Board of Directors.
According to our By-laws (Art. 32) the independent director who is “Coordinating Independent Director”, will:
a) Coordinate the work of the External Directors and echo the concerns of such Directors.
b) Request the Chairman of the Board of Directors to call a meeting of the Board when appropriate in accordance with the rules of corporate governance.
c) Request the inclusion of certain matters in the agenda of the meetings of the Board of Directors.
d) Oversee the evaluation by the Board of Directors of the Chairman thereof.
Whistleblowing
We have procedures in place that allow any employee to anonymously and confidentially report instances of fraud, alterations of financial information or specific risks to Telefónica and its subsidiaries.
Code of Ethics
The NYSE listing standards require U.S. companies to adopt a code of business conduct and ethics for directors, officers and employees, and promptly disclose any waivers of the code for directors or executive officers. In 2004 we adopted, as required by the Sarbanes-Oxley Act, a code of ethics that applied to our principal executive officer, principal financial officer and to our senior financial officers. In December 2006, we adopted a code of business conduct and ethics, the “Telefónica Business Principles,” which apply to all Telefónica Group employees. In March 2008, we decided
to modify such Business Principles in order to incorporate within them all components of the code of ethics definition in Section 406 of Sarbanes Oxley Act, and consequently our code of ethics for senior officers was replaced by such Business Principles. These Principles were further modified on October 8, 2010 in order to include a new principle of privacy and data protection.
We also have an Internal Code of Conduct for securities markets issues to prevent insider trading misconduct and to control possible conflicts of interest. In addition, the Regulations of the Board of Directors set out in detail our directors’ main obligations relating to conflicts of interest concerning business opportunities, misappropriation of our assets, confidentiality and non-competition.
We have responded to Item 18 in lieu of responding to this Item.
Please see pages F-4 through F-151.
|
Exhibit Number
|
Description
|
|
1.1
|
Amended and Restated bylaws (English translation)
|
|
4.1
|
Shareholders’ Agreement dated as of April 28, 2007 among Telefónica, S.A., Assicurazioni Generali S.p.A., Sintonia S.A., Intesa Sanpaolo S.p.A., Mediobanca S.p.A.**
|
|
4.2
|
Co-investment Agreement dated as of April 28, 2007 among Telefónica, S.A., Assicurazioni Generali S.p.A., Sintonia S.A., Intesa Sanpaolo S.p.A., Mediobanca S.p.A.**
|
|
4.3
|
Call Option Agreement, dated November 6, 2007, between Telefónica, S.A. and Telco***
|
|
4.4
|
Amendment to the Shareholders’ Agreement and Bylaws, dated November 19, 2007 among Telefónica, S.A., Generali, Sintonia S.A., Intesa Sanpaolo S.p.A. and Mediobanca S.p.A.***
|
|
4.5
|
Renewal Agreement, dated October 28, 2009, by and among Telefónica, S.A., Assicurazioni Generali S.p.A. (on its own behalf and on behalf of its subsidiaries Generali Vie S.A., Alleanza Toro S.p.A., INA Assitalia S.p.A., Generali Lebensversicherung A.G.), Intesa Sanpaolo S.p.A. and Mediobanca S.p.A. ****
|
|
4.6
|
Amendment Deed to the Call Option, dated October 28, 2009, by and between Telefónica, S.A. and Telco S.p.A. ****
|
|
4.7
|
Subscription Agreement, dated September 6, 2009 between Telefónica, S.A. and China Unicom (Hong Kong) Limited*****
|
|
4.8
|
Enhanced Strategic Alliance Agreement dated January 23, 2011 between Telefónica, S.A. and China Unicom (Hong Kong) Limited ******
|
|
4.9
|
Amendment Deed, dated December 10, 2010, by and among Telefónica, S.A., Assicurazioni Generali S.p.A. (on its own behalf and on behalf of its subsidiaries Generali Vie S.A., Alleanza Toro S.p.A., INA Assitalia S.p.A. and Generali Lebensversicherung AG), Intesa Sanpaolo S.p.A. and Mediobanca S.p.A. ********
|
|
4.10
|
Second Renewal Agreement, dated February 29, 2012, by and among Telefónica, S.A., Assicurazioni Generali S.p.A. (on its own behalf and on behalf of its subsidiaries Generali Vie S.A., Alleanza Toro S.p.A., INA Assitalia S.p.A. and Generali Lebensversicherung AG), Intesa Sanpaolo S.p.A. and Mediobanca S.p.A. ********
|
|
4.11
|
Amendment Deed to Call Option Agreement, dated February 29, 2012, between Telefónica and Telco ********
|
|
4.12
|
Share Purchase Agreement for the Sale and Purchase of Shares in China Unicom (Hong Kong) Limited, dated June 10, 2012 and Supplemental Agreement, dated July 21, 2012, between Telefónica Internacional S.A.U. and a 100% owned subsidiary of China United Network Communications Group Company Limited *********
|
|
4.13
|
Agreement for the Sale and Purchase of Customer Relationship Management business, Atento, dated October 12, 2012 **********
|
| 4.14 | Share Purchase Agreement entered into between Koninkljke KPNN N.V., Telefónica S.A. and Telefonica Deutchsland Holding AG, dated July 23, 2013. (1) |
|
4.15
|
First Amendment Agreement to the Share Puchase Agreement entered into between Koninkljke KPNN N.V., Telefónica S.A. and Telefonica Deutchsland Holding AG, dated July 23, 2013.; dated August 26, 2013. |
|
8.1
|
Subsidiaries of Telefónica (see Note 1 to the Consolidated Financial Statements and Appendix VI thereto)
|
|
11.1
|
Code of Ethics (“Telefónica Business Principles”) *******
|
|
12.1
|
Certification of César Alierta Izuel, Chief Executive Officer of Telefónica, pursuant to Section 302 of the Sarbanes-Oxley Act of 2002
|
|
12.2
|
Certification of Miguel Escrig Meliá, Chief Financial Officer of Telefónica, pursuant to Section 302 of the Sarbanes-Oxley Act of 2002
|
|
13.1
|
Certification pursuant to 18 U.S.C. Section 1350, as adopted pursuant to Section 906 of the Sarbanes-Oxley Act of 2002
|
| 15.1 | Consent of Independent Registered Public Accounting Firm |
|
*
|
Incorporated by reference to Telefónica’s Annual Report on Form 20-F for the fiscal year ended December 31, 2009.
|
|
**
|
Incorporated by reference to Telefónica’s Annual Report on Form 20-F for the fiscal year ended December 31, 2006.
|
|
***
|
Incorporated by reference to Telefónica’s Schedule 13D/A filed on November 26, 2007.
|
|
****
|
Incorporated by reference to Telefónica’s Schedule 13D/A filed on November 23, 2009.
|
|
*****
|
Incorporated by reference to Telefónica’s Schedule 13D/A filed on September 17, 2009.
|
|
******
|
Incorporated by reference to Telefónica’s Schedule 13D filed on February 8, 2011.
|
|
*******
|
Incorporated by reference to Telefónica’s Annual Report on Form 20-F for the fiscal year ended December 31, 2010.
|
|
********
|
Incorporated by reference to Telefónica’s Schedule 13 D/A filed on March 12, 2012.
|
|
*********
|
Incorporated by reference to Telefónica’s Schedule 13 D/A filed on June 13, 2012 and Schedule 13 D/A filed on August 1, 2012.
|
|
**********
|
Incorporated by reference to Telefónica’s Annual Report on Form 20-F for the fiscal year ended December 31, 2013.
|
|
(1)
|
Confidential treatment has been requested with respect to certain portions of this agreement. Confidential portions have been redacted and separately filed with the SEC.
|
We agree to furnish to the SEC upon request, copies of the instruments defining the rights of the holders of our long-term debt and of our subsidiaries’ long-term debt.
SIGNATURES
The registrant hereby certifies that it meets all of the requirements for filing on Form 20-F and has duly caused and authorized the undersigned to sign this Annual Report on its behalf.
|
TELEFÓNICA, S.A.
|
|||
|
By:
|
/s/ César Alierta Izuel
|
||
|
Name:
|
César Alierta Izuel
|
||
|
Title:
|
Chief Executive Officer
|
||
|
TELEFÓNICA, S.A.
|
|||
|
By:
|
/s/ Miguel Escrig Meliá
|
||
|
Name:
|
Miguel Escrig Meliá
|
||
|
Title:
|
Chief Financial Officer
|
||
Date: March 21, 2014
2013
Consolidated Financial Statements (Consolidated Annual Accounts)
Telefónica, S.A. and subsidiaries composing the Telefónica Group.
REPORT OF INDEPENDENT REGISTERED PUBLIC ACCOUNTING FIRM
The Board of Directors and Shareholders of
Telefónica, S.A.
We have audited Telefónica, S.A.’s internal control over financial reporting as of December 31, 2013, based on criteria established in Internal Control—Integrated Framework issued by the Committee of Sponsoring Organizations of the Treadway Commission (1992 framework) (the COSO criteria). Telefónica, S.A.’s management is responsible for maintaining effective internal control over financial reporting, and for its assessment of the effectiveness of internal control over financial reporting included in the accompanying Annual Report on Internal Control over Financial Reporting. Our responsibility is to express an opinion on Telefónica, S.A.’s internal control over financial reporting based on our audit.
We conducted our audit in accordance with the standards of the Public Company Accounting Oversight Board (United States). Those standards require that we plan and perform the audit to obtain reasonable assurance about whether effective internal control over financial reporting was maintained in all material respects. Our audit included obtaining an understanding of internal control over financial reporting, assessing the risk that a material weakness exists, testing and evaluating the design and operating effectiveness of internal control based on the assessed risk, and performing such other procedures as we considered necessary in the circumstances. We believe that our audit provides a reasonable basis for our opinion.
A company’s internal control over financial reporting is a process designed to provide reasonable assurance regarding the reliability of financial reporting and the preparation of financial statements for external purposes in accordance with generally accepted accounting principles. A company’s internal control over financial reporting includes those policies and procedures that (1) pertain to the maintenance of records that, in reasonable detail, accurately and fairly reflect the transactions and dispositions of the assets of the company; (2) provide reasonable assurance that transactions are recorded as necessary to permit preparation of financial statements in accordance with generally accepted accounting principles, and that receipts and expenditures of the company are being made only in accordance with authorizations of management and directors of the company; and (3) provide reasonable assurance regarding prevention or timely detection of unauthorized acquisition, use, or disposition of the company’s assets that could have a material effect on the financial statements.
Because of its inherent limitations, internal control over financial reporting may not prevent or detect misstatements. Also, projections of any evaluation of effectiveness to future periods are subject to the risk that controls may become inadequate because of changes in conditions, or that the degree of compliance with the policies or procedures may deteriorate.
In our opinion, Telefónica, S.A. maintained, in all material respects, effective internal control over financial reporting as of December 31, 2013, based on the COSO criteria.
We also have audited, in accordance with the standards of the Public Company Accounting Oversight Board (United States), the consolidated statements of financial position of Telefónica, S.A. and subsidiaries as of December 31, 2013 and 2012, and the related consolidated statements of income, comprehensive income, changes in equity, and cash flows for each of the three years in the period ended December 31, 2013 and our report dated March 21, 2014 expressed an unqualified opinion thereon.
ERNST & YOUNG, S.L.
/s/ Ignacio Viota del Corte
Ignacio Viota del Corte
Madrid, Spain
March 21, 2014
REPORT OF INDEPENDENT REGISTERED PUBLIC ACCOUNTING FIRM
The Board of Directors and Shareholders of
Telefónica, S.A.
We have audited the accompanying consolidated statements of financial position of Telefónica, S.A. and subsidiaries as of December 31, 2013 and 2012, and the related consolidated statements of income, comprehensive income, changes in equity, and cash flows for each of the three years in the period ended December 31, 2013. These consolidated financial statements are the responsibility of Telefónica, S.A.’s Directors. Our responsibility is to express an opinion on these financial statements based on our audits.
We conducted our audits in accordance with the standards of the Public Company Accounting Oversight Board (United States). Those standards require that we plan and perform the audit to obtain reasonable assurance about whether the financial statements are free of material misstatement. An audit includes examining, on a test basis, evidence supporting the amounts and disclosures in the financial statements. An audit also includes assessing the accounting principles used and significant estimates made by management, as well as evaluating the overall financial statement presentation. We believe that our audits provide a reasonable basis for our opinion.
In our opinion, the financial statements referred to above present fairly, in all material respects, the consolidated financial position of Telefónica, S.A. and subsidiaries as of December 31, 2013 and 2012, and the consolidated results of their operations and their cash flows for each of the three years in the period ended December 31, 2013, in conformity with International Financial Reporting Standards as issued by the International Accounting Standards Board.
We also have audited, in accordance with the standards of the Public Company Accounting Oversight Board (United States), Telefónica S.A.’s internal control over financial reporting as of December 31, 2013, based on criteria established in Internal Control-Integrated Framework issued by the Committee of Sponsoring Organizations of the Treadway Commission (1992 framework) and our report dated March 21, 2014 expressed an unqualified opinion thereon.
ERNST & YOUNG, S.L.
/s/ Ignacio Viota del Corte
Ignacio Viota del Corte
Madrid, Spain
March 21, 2014
|
Millions of euros
|
NOTE
|
2013
|
2012
|
|||
|
ASSETS
|
||||||
|
A) NON-CURRENT ASSETS
|
89,597
|
104,177
|
||||
|
Intangible assets
|
(Note 6)
|
18,548
|
22,078
|
|||
|
Goodwill
|
(Note 7)
|
23,434
|
27,963
|
|||
|
Property, plant and equipment
|
(Note 8)
|
31,040
|
35,021
|
|||
|
Investments accounted for by the equity method
|
(Note 9)
|
2,424
|
2,468
|
|||
|
Non-current financial assets
|
(Note 13)
|
7,775
|
9,339
|
|||
|
Deferred tax assets
|
(Note 17)
|
6,376
|
7,308
|
|||
|
B) CURRENT ASSETS
|
29,265
|
25,596
|
||||
|
Inventories
|
985
|
1,188
|
||||
|
Trade and other receivables
|
(Note 11)
|
9,640
|
10,711
|
|||
|
Current financial assets
|
(Note 13)
|
2,117
|
1,872
|
|||
|
Tax receivables
|
(Note 17)
|
1,664
|
1,828
|
|||
|
Cash and cash equivalents
|
(Note 13)
|
9,977
|
9,847
|
|||
|
Non-current assets held for sale
|
(Note 2)
|
4,882
|
150
|
|||
|
TOTAL ASSETS (A+B)
|
118,862
|
129,773
|
||||
|
NOTE
|
2013
|
2012
|
||||
|
EQUITY AND LIABILITIES
|
||||||
|
A) EQUITY
|
27,482
|
27,661
|
||||
|
Equity attributable to equity holders of the parent and other holders of equity instruments
|
(Note 12)
|
21,185
|
20,461
|
|||
|
Equity attributable to non-controlling interests
|
(Note 12)
|
6,297
|
7,200
|
|||
|
B) NON-CURRENT LIABILITIES
|
62,236
|
70,601
|
||||
|
Non-current interest-bearing debt
|
(Note 13)
|
51,172
|
56,608
|
|||
|
Non-current trade and other payables
|
(Note 14)
|
1,701
|
2,141
|
|||
|
Deferred tax liabilities
|
(Note 17)
|
3,063
|
4,788
|
|||
|
Non-current provisions
|
(Note 15)
|
6,300
|
7,064
|
|||
|
C) CURRENT LIABILITIES
|
29,144
|
31,511
|
||||
|
Current interest-bearing debt
|
(Note 13)
|
9,527
|
10,245
|
|||
|
Current trade and other payables
|
(Note 14)
|
15,221
|
17,089
|
|||
|
Current tax payables
|
(Note 17)
|
2,203
|
2,522
|
|||
|
Current provisions
|
(Note 15)
|
1,271
|
1,651
|
|||
|
Liabilities associated with non-current assets held for sale
|
(Note 2)
|
922
|
4
|
|||
|
TOTAL EQUITY AND LIABILITIES (A+B+C)
|
118,862
|
129,773
|
||||
|
The accompanying Notes 1 to 23 and Appendices I to VII are an integral part of these consolidated statements of financial position.
|
||||||
|
Millions of euros
|
NOTES
|
2013
|
2012
|
2011
|
||||
|
INCOME STATEMENTS
|
||||||||
|
Revenues
|
(Note 18)
|
57,061
|
62,356
|
62,837
|
||||
|
Other income
|
(Note 18)
|
1,693
|
2,323
|
2,107
|
||||
|
Supplies
|
(17,041)
|
(18,074)
|
(18,256)
|
|||||
|
Personnel expenses
|
(7,208)
|
(8,569)
|
(11,080)
|
|||||
|
Other expenses
|
(Note 18)
|
(15,428)
|
(16,805)
|
(15,398)
|
||||
|
Depreciation and amortization
|
(Note 18)
|
(9,627)
|
(10,433)
|
(10,146)
|
||||
|
OPERATING INCOME
|
9,450
|
10,798
|
10,064
|
|||||
|
Share of loss of investments accounted for by the equity method
|
(Note 9)
|
(304)
|
(1,275)
|
(635)
|
||||
|
Finance income
|
933
|
963
|
827
|
|||||
|
Exchange gains
|
3,323
|
2,382
|
2,795
|
|||||
|
Finance costs
|
(3,629)
|
(4,025)
|
(3,609)
|
|||||
|
Exchange losses
|
(3,493)
|
(2,979)
|
(2,954)
|
|||||
|
Net financial expense
|
(Note 16)
|
(2,866)
|
(3,659)
|
(2,941)
|
||||
|
PROFIT BEFORE TAX
|
6,280
|
5,864
|
6,488
|
|||||
|
Corporate income tax
|
(Note 17)
|
(1,311)
|
(1,461)
|
(301)
|
||||
|
PROFIT FOR THE YEAR
|
4,969
|
4,403
|
6,187
|
|||||
|
Non-controlling interests
|
(Note 12)
|
(376)
|
(475)
|
(784)
|
||||
|
PROFIT FOR THE YEAR ATTRIBUTABLE TO EQUITY HOLDERS OF THE PARENT
|
4,593
|
3,928
|
5,403
|
|||||
|
Basic and diluted earnings per share attributable to equity holders of the parent (euros)
|
(Note 18)
|
1.01
|
0.87
|
1.18
|
||||
|
The accompanying Notes 1 to 23 and Appendices I to VII are an integral part of these consolidated income statements.
|
||||||||
|
2013
|
2012
|
2011
|
||||
|
Millions of euros
|
||||||
|
Profit for the year
|
4,969
|
4,403
|
6,187
|
|||
|
Other comprehensive income (loss)
|
||||||
|
Gains (losses) on measurement of available-for-sale investments
|
32
|
(49)
|
(13)
|
|||
|
Income tax impact
|
(10)
|
4
|
4
|
|||
|
Reclassification of losses included in the income statement
|
51
|
46
|
3
|
|||
|
Income tax impact
|
(15)
|
(3)
|
(1)
|
|||
|
58
|
(2)
|
(7)
|
||||
|
Gains (losses) on hedges
|
831
|
(1,414)
|
(921)
|
|||
|
Income tax impact
|
(247)
|
376
|
280
|
|||
|
Reclassification of losses included in the income statement (Note 16)
|
121
|
173
|
210
|
|||
|
Income tax impact
|
(36)
|
(5)
|
(63)
|
|||
|
669
|
(870)
|
(494)
|
||||
|
Share of (loss) income recognized directly in equity of associates and others
|
(29)
|
(27)
|
58
|
|||
|
Income tax impact
|
4
|
9
|
(9)
|
|||
|
Reclassification of losses included in the income statement
|
1
|
4
|
−
|
|||
|
Income tax impact
|
−
|
−
|
−
|
|||
|
(24)
|
(14)
|
49
|
||||
|
Translation differences
|
(6,454)
|
(1,862)
|
(1,265)
|
|||
|
Total other comprehensive loss recognized in the period (Items that may be reclassified subsequently to profit or loss)
|
(5,751)
|
(2,748)
|
(1,717)
|
|||
|
Actuarial gains (losses) and impact of limit on assets for defined benefit pension plans
|
(49)
|
(154)
|
(85)
|
|||
|
Income tax impact
|
1
|
39
|
28
|
|||
|
(48)
|
(115)
|
(57)
|
||||
|
Total other comprehensive loss recognized in the period (Items that will not be reclassified subsequently to profit or loss)
|
(48)
|
(115)
|
(57)
|
|||
|
Total comprehensive (loss) income recognized in the year
|
(830)
|
1,540
|
4,413
|
|||
|
Attributable to:
|
||||||
|
Equity holders of the parent and other holders of equity instruments
|
(434)
|
1,652
|
4,002
|
|||
|
Non-controlling interests
|
(396)
|
(112)
|
411
|
|||
|
(830)
|
1,540
|
4,413
|
||||
|
The accompanying Notes 1 to 23 and Appendices I to VII are an integral part of these consolidated statements of comprehensive income.
|
||||||
|
Attributable to equity holders of the parent and other holders of equity instruments
|
Non-controlling interests (Note 12)
|
Total equity
|
||||||||||||||||||||||||
|
Millions of euros
|
Share capital
|
Share premium
|
Treasury Shares
|
Other equity instruments
|
Legal reserve
|
Retained earnings
|
Available-for-sale investments
|
Hedges
|
Equity of associates and others
|
Translation differences
|
Total
|
|||||||||||||||
|
Financial position at December 31, 2012
|
4,551
|
460
|
(788)
|
−
|
984
|
19,569
|
36
|
(715)
|
(7)
|
(3,629)
|
20,461
|
7,200
|
27,661
|
|||||||||||||
|
Profit for the year
|
−
|
−
|
−
|
−
|
−
|
4,593
|
−
|
−
|
−
|
−
|
4,593
|
376
|
4,969
|
|||||||||||||
|
Other comprehensive income (loss)
|
−
|
−
|
−
|
−
|
−
|
(48)
|
58
|
678
|
(24)
|
(5,691)
|
(5,027)
|
(772)
|
(5,799)
|
|||||||||||||
|
Total comprehensive income (loss)
|
−
|
−
|
−
|
−
|
−
|
4,545
|
58
|
678
|
(24)
|
(5,691)
|
(434)
|
(396)
|
(830)
|
|||||||||||||
|
Dividends paid (Note 12)
|
−
|
−
|
−
|
−
|
−
|
(1,588)
|
−
|
−
|
−
|
−
|
(1,588)
|
(739)
|
(2,327)
|
|||||||||||||
|
Net movement in treasury shares (Note 12)
|
−
|
−
|
244
|
−
|
−
|
(92)
|
−
|
−
|
−
|
−
|
152
|
−
|
152
|
|||||||||||||
|
Acquisitions and disposals of non-controlling interests and business combinations (Note 5)
|
−
|
−
|
−
|
−
|
−
|
66
|
−
|
−
|
−
|
45
|
111
|
238
|
349
|
|||||||||||||
|
Undated Deeply Subordinated Securities (Note 12)
|
−
|
−
|
−
|
2,466
|
−
|
−
|
−
|
−
|
−
|
−
|
2,466
|
−
|
2,466
|
|||||||||||||
|
Other movements
|
−
|
−
|
−
|
−
|
−
|
17
|
−
|
−
|
−
|
−
|
17
|
(6)
|
11
|
|||||||||||||
|
Financial position at December 31, 2013
|
4,551
|
460
|
(544)
|
2,466
|
984
|
22,517
|
94
|
(37)
|
(31)
|
(9,275)
|
21,185
|
6,297
|
27,482
|
|||||||||||||
|
Financial position at December 31, 2011
|
4,564
|
460
|
(1,782)
|
−
|
984
|
19,374
|
38
|
154
|
7
|
(2,163)
|
21,636
|
5,747
|
27,383
|
|||||||||||||
|
Profit for the year
|
−
|
−
|
−
|
−
|
−
|
3,928
|
−
|
−
|
−
|
−
|
3,928
|
475
|
4,403
|
|||||||||||||
|
Other comprehensive income (loss)
|
−
|
−
|
−
|
−
|
−
|
(112)
|
(2)
|
(870)
|
(14)
|
(1,278)
|
(2,276)
|
(587)
|
(2,863)
|
|||||||||||||
|
Total comprehensive income (loss)
|
−
|
−
|
−
|
−
|
−
|
3,816
|
(2)
|
(870)
|
(14)
|
(1,278)
|
1,652
|
(112)
|
1,540
|
|||||||||||||
|
Dividends paid (Note 12)
|
71
|
−
|
−
|
−
|
−
|
(2,907)
|
−
|
−
|
−
|
−
|
(2,836)
|
(442)
|
(3,278)
|
|||||||||||||
|
Net movement in treasury shares
|
−
|
−
|
(327)
|
−
|
−
|
(299)
|
−
|
−
|
−
|
−
|
(626)
|
−
|
(626)
|
|||||||||||||
|
Acquisitions and disposals of non-controlling interests and business combinations (Note 5)
|
−
|
−
|
−
|
−
|
−
|
1,170
|
−
|
1
|
−
|
(188)
|
983
|
1,800
|
2,783
|
|||||||||||||
|
Capital reduction
|
(84)
|
−
|
1,321
|
−
|
−
|
(1,237)
|
−
|
−
|
−
|
−
|
−
|
−
|
−
|
|||||||||||||
|
Other movements
|
−
|
−
|
−
|
−
|
−
|
(348)
|
−
|
−
|
−
|
−
|
(348)
|
207
|
(141)
|
|||||||||||||
|
Financial position at December 31, 2012
|
4,551
|
460
|
(788)
|
−
|
984
|
19,569
|
36
|
(715)
|
(7)
|
(3,629)
|
20,461
|
7,200
|
27,661
|
|||||||||||||
|
Financial position at December 31, 2010
|
4,564
|
460
|
(1,376)
|
−
|
984
|
20,112
|
45
|
648
|
(42)
|
(943)
|
24,452
|
7,232
|
31,684
|
|||||||||||||
|
Profit for the year
|
−
|
−
|
−
|
−
|
−
|
5,403
|
−
|
−
|
−
|
−
|
5,403
|
784
|
6,187
|
|||||||||||||
|
Other comprehensive income (loss)
|
−
|
−
|
−
|
−
|
−
|
(52)
|
(7)
|
(494)
|
49
|
(897)
|
(1,401)
|
(373)
|
(1,774)
|
|||||||||||||
|
Total comprehensive income (loss)
|
−
|
−
|
−
|
−
|
−
|
5,351
|
(7)
|
(494)
|
49
|
(897)
|
4,002
|
411
|
4,413
|
|||||||||||||
|
Dividends paid (Note 12)
|
−
|
−
|
−
|
−
|
−
|
(6,852)
|
−
|
−
|
−
|
−
|
(6,852)
|
(876)
|
(7,728)
|
|||||||||||||
|
Net movement in treasury shares
|
−
|
−
|
(777)
|
−
|
−
|
−
|
−
|
−
|
−
|
−
|
(777)
|
−
|
(777)
|
|||||||||||||
|
Acquisitions and disposals of non-controlling interests (Note 5)
|
−
|
−
|
−
|
−
|
−
|
984
|
−
|
−
|
−
|
(323)
|
661
|
(1,200)
|
(539)
|
|||||||||||||
|
Other movements
|
−
|
−
|
371
|
−
|
−
|
(221)
|
−
|
−
|
−
|
−
|
150
|
180
|
330
|
|||||||||||||
|
Financial position at December 31, 2011
|
4,564
|
460
|
(1,782)
|
−
|
984
|
19,374
|
38
|
154
|
7
|
(2,163)
|
21,636
|
5,747
|
27,383
|
|||||||||||||
|
The accompanying Notes 1 to 23 and Appendices I to VII are an integral part of these consolidated statements of changes in equity.
|
||||||||||||||||||||||||||
|
Millions of euros
|
NOTES
|
2013
|
2012
|
2011
|
||||
|
Cash flows from operating activities
|
||||||||
|
Cash received from customers
|
69,149
|
75,962
|
77,222
|
|||||
|
Cash paid to suppliers and employees
|
(50,584)
|
(55,858)
|
(55,769)
|
|||||
|
Dividends received
|
49
|
85
|
82
|
|||||
|
Net interest and other financial expenses paid
|
(2,464)
|
(2,952)
|
(2,093)
|
|||||
|
Taxes paid
|
(1,806)
|
(2,024)
|
(1,959)
|
|||||
|
Net cash from operating activities
|
(Note 20)
|
14,344
|
15,213
|
17,483
|
||||
|
Cash flows from investing activities
|
||||||||
|
Proceeds on disposals of property, plant and equipment and intangible assets
|
561
|
939
|
811
|
|||||
|
Payments on investments in property, plant and equipment and intangible assets
|
(9,674)
|
(9,481)
|
(9,085)
|
|||||
|
Proceeds on disposals of companies, net of cash and cash equivalents disposed
|
260
|
1,823
|
4
|
|||||
|
Payments on investments in companies, net of cash and cash equivalents acquired
|
(398)
|
(37)
|
(2,948)
|
|||||
|
Proceeds on financial investments not included under cash equivalents
|
50
|
30
|
23
|
|||||
|
Payments on financial investments not included under cash equivalents
|
(386)
|
(834)
|
(669)
|
|||||
|
Payments on placements of cash surpluses not included under cash equivalents
|
(314)
|
(318)
|
(646)
|
|||||
|
Government grants received
|
1
|
1
|
13
|
|||||
|
Net cash used in investing activities
|
(Note 20)
|
(9,900)
|
(7,877)
|
(12,497)
|
||||
|
Cash flows from financing activities
|
||||||||
|
Dividends paid
|
(Note 12)
|
(2,182)
|
(3,273)
|
(7,567)
|
||||
|
Transactions with equity holders
|
65
|
656
|
(399)
|
|||||
|
Operations with other equity holders
|
(Note 12)
|
2,466
|
−
|
−
|
||||
|
Proceeds on issue of debentures and bonds
|
(Note 13)
|
5,634
|
8,090
|
4,582
|
||||
|
Proceeds on loans, borrowings and promissory notes
|
3,231
|
6,002
|
4,387
|
|||||
|
Cancellation of debentures and bonds
|
(Note 13)
|
(5,667)
|
(4,317)
|
(3,235)
|
||||
|
Repayments of loans, borrowings and promissory notes
|
(6,232)
|
(8,401)
|
(2,680)
|
|||||
|
Net cash used in financing activities
|
(Note 20)
|
(2,685)
|
(1,243)
|
(4,912)
|
||||
|
Effect of changes in exchange rates
|
(1,468)
|
(382)
|
(169)
|
|||||
|
Effect of changes in consolidation methods
|
(161)
|
1
|
10
|
|||||
|
Net increase (decrease) in cash and cash equivalents during the year
|
130
|
5,712
|
(85)
|
|||||
|
CASH AND CASH EQUIVALENTS AT JANUARY 1
|
9,847
|
4,135
|
4,220
|
|||||
|
CASH AND CASH EQUIVALENTS AT DECEMBER 31
|
(Note 13)
|
9,977
|
9,847
|
4,135
|
||||
|
RECONCILIATION OF CASH AND CASH EQUIVALENTS WITH THE STATEMENT OF FINANCIAL POSITION
|
||||||||
|
BALANCE AT JANUARY 1
|
9,847
|
4,135
|
4,220
|
|||||
|
Cash on hand and at banks
|
7,973
|
3,411
|
3,226
|
|||||
|
Other cash equivalents
|
1,874
|
724
|
994
|
|||||
|
BALANCE AT DECEMBER 31
|
(Note 13)
|
9,977
|
9,847
|
4,135
|
||||
|
Cash on hand and at banks
|
7,834
|
7,973
|
3,411
|
|||||
|
Other cash equivalents
|
2,143
|
1,874
|
724
|
|||||
|
The accompanying Notes 1 to 23 and Appendices I to VII are an integral part of these consolidated statements of cash flows.
|
||||||||
Telefónica, S.A. and subsidiaries composing the Telefónica Group
Notes to the consolidated financial statements (consolidated annual accounts) for the year ended December 31, 2013
Telefónica, S.A. and its subsidiaries and investees (“Telefónica”, “the Company”, the “Telefónica Group” or "the Group”) make up an integrated and diversified telecommunications group operating mainly in Europe and Latin America. The Group’s activity is centered around services of fixed and mobile telephony, broadband, internet, data traffic, pay TV and other digital services.
The parent company of the Group is Telefónica, S.A., a public limited company incorporated on April 19, 1924, for an indefinite period. Its registered office is at calle Gran Vía 28, Madrid (Spain).
Appendix VI lists the main companies composing the Telefónica Group, their corporate purpose, country, functional currency, share capital, the Group’s effective shareholding and their method of consolidation.
The website www.telefonica.com provides more information about the organizational structure of the Group, the sectors in which it operates and the products it offers.
As a multinational telecommunications company which operates in regulated markets, the Group is subject to different laws and regulations in each of the jurisdictions in which it operates, pursuant to which permits, concessions or licenses must be obtained in certain circumstances to provide the various services.
In addition, certain wireline and wireless telephony services are provided under regulated rate and price systems.
The accompanying consolidated financial statements were prepared from the accounting records of Telefónica, S.A. and of each of the companies comprising the Telefónica Group, whose separate financial statements were prepared in accordance with the generally accepted accounting principles prevailing in the various countries in which they are located, and for purposes of these consolidated financial statements are presented in accordance with the International Financial Reporting Standards (IFRS) as issued by the International Accounting Standards Board (IASB), which for the purposes of the Telefónica Group are not different from those adopted by the European Union, to give a true and fair view of the consolidated equity and financial position at December 31, 2013, and of the consolidated results of operations, changes in consolidated equity and the consolidated cash flows obtained and used in the year then ended. The figures in these consolidated financial statements are expressed in millions of euros, unless otherwise indicated, and therefore may be rounded. The euro is the Group’s reporting currency.
The accompanying consolidated financial statements for the year ended December 31, 2013 were approved by the Company’s Board of Directors at its meeting on February 26, 2014 for submission for approval at the General Shareholders’ Meeting, which is expected to occur without modification.
Note 3 contains a detailed description of the most significant accounting policies used to prepare these consolidated financial statements.
For comparative purposes, the accompanying consolidated financial statements for 2013 include the figures for 2012, and in the consolidated income statement, the consolidated statement of comprehensive income, the consolidated statement of changes in equity and the consolidated statement of cash flows, and the notes thereto for the year then ended, they also include those of 2011.
Materiality criteria
These consolidated financial statements do not include any information or disclosures that, not requiring presentation due to their qualitative significance, have been determined as immaterial or of no relevance pursuant to the concepts of
materiality
or
relevance
defined in the IFRS conceptual framework, insofar as the Telefónica Group accounts, taken as a whole, are concerned.
Comparative information and main changes in the consolidation scope
For comparative purposes, the accompanying consolidated financial statements for 2013 include in the consolidated income statement, the consolidated statement of comprehensive income, the consolidated statement of changes in equity and the consolidated statement of cash flows, and the notes thereto for the years then ended, the figures for 2012 and 2011.
The main events and changes in the consolidation scope affecting comparability of the consolidated information for 2013 and 2012 (see Appendix I for a more detailed explanation of the changes in consolidation scope) are as follows:
2013
a) Devaluation of the Venezuelan bolivar
On February 8, 2013, the Venezuelan bolivars was devalued from 4.3 bolivars per U.S. dollar to 6.3 bolivar per U.S. dollar.
The exchange rate of 6.3 bolivar per U.S. dollar has been used in the conversion of the financial information of Venezuelan subsidiaries for the whole year 2013. The principal impacts of the devaluation of the Venezuelan bolivar have been the following:
|
·
|
The decrease of the Telefónica Group’s net assets in Venezuela as a result of the conversion to euros at the devalued exchange rate with a balancing entry in Group equity of approximately 1,000 million euros, based on the net assets as at December 31, 2012.
|
|
·
|
Increase in the net financial debt resulting from the application of the new exchange rate to the net asset value in bolivar of approximately 873 million euros, as per the balance as at December 31, 2012.
|
b) Sale of 40% of Telefónica’s subsidiaries in Guatemala, El Salvador, Nicaragua and Panama
In April 2013 Telefónica reached an agreement with Corporación Multi Inversiones to sell 40% of Telefónica’s stake in its subsidiaries in Guatemala, El Salvador, Nicaragua and Panama, through Telefónica Centroamérica Inversiones, S.L. (see Note 5).
Following the fulfillment of the conditions to which the closing of the sale was subject, the closing of the transaction was on August 2, 2013. The value of the sale amounted to 500 million U.S. dollars (equivalent to 377 million euros on the date of execution of the sale), plus payment of an additional variable amount of up to 72 million U.S. dollars, according to the evolution and operational performance of the transferred assets.
The Telefónica Group maintains control of these companies, and therefore the transaction had no impact on the consolidated income statement at its completion, as it is a transaction with non-controlling interests. The impact of this transaction in the consolidated equity was a 111 million euros increase in “Equity attributable to equity holders of the parent and other holders of equity instruments”, and a 283 million euros increase in “Equity attributable to non-controlling interests”.
c) Agreement for sale of ownership interest in Telefónica Czech Republic, a.s.
On November 5, 2013, Telefónica reached an agreement to sell 65.9% of Telefónica Czech Republic, a.s. to PPF Group N.V.I. for an equivalent of approximately 2,467 million euros in cash at the date of the agreement. Telefónica will retain a 4.9% equity stake (see Note 21.b).
The transaction was completed on January 28, 2014, after obtaining the relevant regulatory authorizations (see Note 23).
As a result of the transaction, a loss was recognized for the 176 million-euro adjustment to the value of the assets assigned to Telefónica Czech Republic, under "Other expenses" in the consolidated income statement for 2013 (see Note 18).
Consolidated assets and liabilities subject to this transaction have been classified under “Non-current assets held for sale” and “Liabilities associated with non-current assets held for sale”, respectively, in the consolidated statement of financial position at December 31, 2013. Their composition is as follows:
|
Millions of euros
|
12/31/2013
|
|
Non-current assets
|
3,436
|
|
Current assets
|
412
|
|
Non-current liabilities
|
280
|
|
Current liabilities
|
436
|
d) Agreement for sale of ownership interest in Telefónica Ireland, Ltd.
In June 2013 Telefónica reached an agreement with Hutchison Whampoa Group for the sale of Telefónica’s 100% participation in Telefónica Ireland, Ltd. for 850 million euros, including an initial cash consideration of 780 million euros to be paid at the closing of the transaction, and an additional deferred payment of 70 million euros to be settled based on the completion of agreed financial objectives.
At the date of preparation of these consolidated financial statements the transaction is subject, among other conditions, to the relevant competition approvals.
Consolidated assets and liabilities subject to this transaction have been classified under “Non-current assets held for sale” and “Liabilities associated with non-current assets held for sale”, respectively, in the consolidated statement of financial position at December 31, 2013.
|
Millions of euros
|
12/31/2013
|
|
Non-current assets
|
836
|
|
Current assets
|
191
|
|
Non-current liabilities
|
35
|
|
Current liabilities
|
171
|
e) Reduction of the value of the shareholding in Telecom Italia, S.p.A. (2013-2012)
In 2013 and 2012 adjustments to the value of the stake of Telco, S.p.A. in Telecom Italia, S.p.A. were made, which coupled with the contribution to results in the year, resulted in a negative impact on “Share of loss of investments accounted for by the equity method” of 267 million euros and 1,277 million euros, respectively (186 million euros and 894 million euros of impact to consolidated net profit, respectively, after tax).
Subsequent to the adjustment made, the value of the stake held in Telecom Italia, S.p.A. through Telco, S.p.A. is equivalent to 1 euro per share (1.2 euros per share at December 31, 2012).
2012
a) Restructuring of the wireline and wireless businesses in Colombia
As a result of the agreements reached in 2012 to restructure the wireline and wireless businesses in Colombia the following commitments were adopted:
|
·
|
The merger of Colombia Telecomunicaciones, S.A. ESP and Telefónica Móviles Colombia, S.A.
|
|
·
|
The assumption by the Colombian National Government (the “Colombian government”) of 48% of the payment obligations not yet due of Colombia Telecomunicaciones, S.A. ESP to the Patrimonio Autónomo Receptor de Activos de la Empresa Nacional de Telecomunicaciones (PARAPAT).
|
|
·
|
The extension by six years, to 2028, of the payment obligations not yet due of Colombia Telecomunicaciones, S.A. ESP to the PARAPAT.
|
Upon completion of the merger between Colombia Telecomunicaciones, S.A. ESP and Telefónica Móviles Colombia, S.A. Telefónica obtained a 70% shareholding in the resulting company and the Colombian government obtained the remaining 30%.
As a result of compliance with the described agreements, the debt of the Telefónica Group decreased by an amount equivalent to 1,499 million euros.
The impacts of the transaction were recognized as an increase to “Equity attributable to equity holders of the parent and other holders of equity instruments" and a decrease to "Equity attributable to non-controlling interests" in the amounts of 1,611 million euros and 116 million euros, respectively.
The commitments assumed in the operation are described in Note 21.b.
b) Public offering of shares in Telefónica Deutschland Holding, A.G.
On October 29, 2012, the public offering of shares in the subsidiary Telefónica Deutschland Holding, A.G. was completed by the placement of 258,750,000 shares, corresponding to 23.17% of total capital of Telefónica Deutschland Holding, A.G.
The transaction totaled 1,449 million euros, and resulted in a 628 million euros decrease in “Retained earnings”. In addition, “Equity attributable to non-controlling interests” rose 2,043 million euros after taking into account transaction costs.
c) Sale of the investment in the CRM Atento business
On December 12, 2012, the Telefónica Group completed the sale of its Atento Customer Relationship Management (CRM) business to a group of companies controlled by Bain Capital.
The transaction was valued at 1,051 million euros, including a 110 million euros vendor loan and certain deferred payments also amounting to 110 million euros.
The transaction had the positive effect of reducing the Telefónica Group’s debt level by 812 million euros at the close of the transaction.
Gains obtained on the divestment amounted to 61 million euros and were recognized under “Other income” in the 2012 consolidated income statement.
d) Reduction in the investment in China Unicom
In July 2012, 1,073,777,121 shares in China Unicom (Hong Kong) Limited (China Unicom), equivalent to 4.56% of total capital in that company, were sold at a price of 10,748 million Hong Kong dollars (approximately 1,142 million euros) from the sale. The transaction resulted in a loss of 97 million euros, recognized under “Other expenses” in the consolidated income statement for 2012.
Under this agreement, the Telefónica Group retains 5.01% of China Unicom, which gives it a seat on the company’s Board of Directors.
As stated in Note 2, the Group’s consolidated financial statements have been prepared in accordance with IFRSs and interpretations issued by the International Accounting Standards Board (IASB) and the IFRS Interpretations Committee (IFRIC) as endorsed by the European Commission for use in the European Union (IFRSs – EU).
Accordingly, only the most significant accounting policies used in preparing the accompanying consolidated financial statements, in light of the nature of the Group’s activities, are set out below, as well as the accounting policies applied where IFRSs permit a policy choice, and those that are specific to the sector in which the Group operates.
a) Hyperinflationary economies
Venezuela is considered as a hyperinflationary economy since 2011. The inflation rates used to prepare the restated financial information are those published by the Central Bank of Venezuela. On an annual basis, these rates are 56.2% and 20.1% for 2013 and 2012, respectively.
b) Translation methodology
The income statements and statements of cash flows of the Group’s foreign subsidiaries (except Venezuela) were translated into euros at the average exchange rates for the year.
c) Goodwill
After initial recognition, goodwill is carried at cost, less any accumulated impairment losses. Goodwill is recognized as an asset denominated in the currency of the company acquired and is tested for impairment annually or more frequently if there are certain events or changes indicating the possibility that the carrying amount may not be fully recoverable. The potential impairment loss is determined by assessing the recoverable amount of the cash generating unit (or group of cash generating units) to which the goodwill is allocated from the acquisition date.
d) Intangible assets
Intangible assets are carried at acquisition or production cost, less any accumulated amortization or any accumulated impairment losses.
Intangible assets are amortized on a straight-line basis according to the following:
|
·
|
Expenditures incurred in developing new products to be available for sale or use within the Group’s own network, and whose future economic viability is reasonably certain (“Development costs”), are amortized on a straight-line basis over the period during which the related development project is expected to generate economic benefits, upon its completion.
|
|
·
|
Licenses granted to the Telefónica Group by various public authorities to provide telecommunications services and the value allocated to licenses held by certain companies at the time they were included in the Telefónica Group (“Service concession arrangements and licenses”) are amortized on a straight-line basis over the duration of related licenses from the moment commercial operation begins.
|
|
·
|
The allocation of acquisition costs attributable to customers acquired in business combinations, as well as the acquisition value of this type of assets in a third-party transaction for consideration (“Customer base”) are amortized on a straight-line basis over the estimated period of the customer relationship.
|
|
·
|
Software is amortized on a straight-line basis over its useful life, generally estimated to be between three and five years.
|
e) Property, plant and equipment
Property, plant and equipment is carried at cost less any accumulated depreciation and any accumulated impairment in value.
Cost includes, among others, direct labor used in installation and the allocable portion of the indirect costs required for the related asset. The latter two items are recorded as revenues under the concept “Own work capitalized” of the line item “Other income”.
Interest and other financial expenses incurred and directly attributable to the acquisition or construction of qualifying assets are capitalized. Qualifying assets for the Telefónica Group are those assets that require a period of at least 18 months to bring the assets to the condition necessary for their intended use or sale.
The Group’s subsidiaries depreciate their property, plant and equipment, from the time they can be placed in service, amortizing the cost of the assets, net of their residual values on a straight-line basis over the assets’ estimated useful lives, which are calculated in accordance with technical studies that are revised periodically in light of technological advances and the rate of dismantling, as follows:
|
Years of estimated
useful life
|
|
|
Buildings
|
25 – 40
|
|
Plant and machinery
|
10 – 15
|
|
Telephone installations, networks and subscriber equipment
|
5 – 20
|
|
Furniture, tools and other items
|
2 – 10
|
f) Impairment of non-current assets
Non-current assets, including goodwill and intangible assets are assessed at each reporting date for indicators of impairment. Wherever such indicators exist, or in the case of assets which are subject to an annual impairment test, recoverable amount is estimated. An asset’s recoverable amount is the higher of fair value less costs to sell and value in use. In assessing value in use, the estimated future cash flows deriving from the use of the asset or its cash generating unit, as applicable, are discounted to their present value using a discount rate that reflects current market assessments of the time value of money and the risks specific to the asset.
The Group bases the calculation of impairment on the business plans of the various cash generating units to which the assets are allocated. The projected cash flows, based on strategic business plans, cover a period of five years. Starting with the sixth year, an expected constant growth rate is applied.
g) Lease agreements
The determination of whether an arrangement is, or contains a lease is based on the substance of the agreement and requires an assessment of whether the fulfilment of the arrangement is dependent on the use of a specific asset and the agreement conveys a right to the use of the asset.
Leases where the lessor does not transfer substantially all the risks and benefits of ownership of the asset are classified as operating leases.
Leases are classified as finance leases when the terms of the lease transfer substantially all the risks and rewards incidental to ownership of the leased item to the Group.
h) Investment in associates and joint arrangements
The Group assesses whether it has significant influence not only on the basis of its ownership percentage but also on the existence of qualitative factors such representation on the board of directors of the investee, its participation in decision-making processes, interchange of managerial personnel and access to technical information.
The Group assesses rights and obligations agreed to by the parties to a joint arrangement and, when relevant, other facts and circumstances in order to determine whether the joint arrangement in which it is involved is a joint venture or a joint operation.
i) Financial assets and liabilities
Financial investments
All regular way purchases and sales of financial assets are recognized in the statement of financial position on the trade date, i.e. the date that the Company commits to purchase or sell the asset.
Financial assets which the Group intends to hold for an indefinite period of time and could be sold at any time in response to needs for liquidity requirements or in response to changes in market conditions are classified as available-for-sale. These investments are presented as non-current assets, unless it is probable and feasible that they will be sold within 12 months.
Derivative financial instruments and hedge accounting
When the Group chooses not to apply hedge accounting criteria, gains or losses resulting from changes in the fair value of derivatives are taken directly to the income statement. In this respect, transactions used to reduce the exchange rate risk of income contributed by foreign subsidiaries are not treated as hedging transactions.
j) Inventories
Materials stored for use in investment projects and inventories for consumption and replacement are valued at the lower of weighted average cost and net realizable value.
k) Pensions and other employee obligations
Provisions required to cover the accrued liability for defined-benefit pension plans are determined using “the projected unit credit” actuarial valuation method. The calculation is based on demographic and financial assumptions determined at a country level, and in consideration of the macroeconomic environment. The discount rates are determined based on high quality market yield curves. Plan assets are measured at fair value.
Provisions for post-employment benefits (e.g. early retirement or other) are calculated individually based on the terms agreed with the employees. In some cases, these may require actuarial valuations based on both demographic and financial assumptions.
l) Revenue and expenses
The Telefónica Group revenues are derived principally from providing the following telecommunications services: traffic, connection fees, regular (normally monthly) network usage fees, interconnection, network and equipment leasing, handset sales and other services such as pay TV and value-added services (text or data messages, among others) or maintenance. Products and services may be sold separately or bundled in promotional packages.
Revenues from calls carried on Telefónica’s networks (traffic) entail an initial call establishment fee plus a variable call rate, based on call length, distance and type of service .Both wireline and wireless traffic is recognized as revenue as service is provided. For prepaid calls, the amount of unused traffic generates a deferred revenue presented in “Trade and other payables” on the statement of financial position. Prepaid cards generally expire within 12 months and any deferred revenue from prepaid traffic is recognized directly in the income statement when the card expires as the Group has no obligation to provide service after expiry date.
Revenues from traffic sales and services at a fixed rate over a specified period of time (flat rate) are recognized on a straight-line basis over the term covered by the rate paid by the customer.
Connection fees arising when customers connect to the Group’s network are deferred and recognized in the income statement throughout the average estimated customer relationship period, which varies by type of service. All related costs, except those related to network expansion, as well as administrative expenses and overhead, are recognized in the income statement as incurred.
Installation fees are taken to the income statement on a straight-line basis over the related period. Equipment leases and other services are taken to profit or loss as they are consumed.
Interconnection revenues from wireline-wireless and wireless-wireline calls and other customer services are recognized in the period in which the calls are made.
Revenues from handset and equipment sales are recognized once the sale is considered complete, i.e., generally when delivered to the end customer.
Bundled packages, which include multiple elements, are sold in the wireline, wireless and internet businesses. They are assessed to determine whether it is necessary to separate the separately identifiable elements and apply the corresponding revenue recognition policy to each element. Total package revenue is allocated among the identified elements based on their respective fair values (i.e. the fair value of each element relative to the total fair value of the package).
As connection or initial activation fees, or upfront non-refundable fees, are not separately identifiable elements in these types of packages, any revenues received from the customer for these items are allocated to the remaining elements. Additionally, when allocating the package revenue to the elements, amounts contingent upon delivery of undelivered elements are not allocated to delivered elements.
All expenses related to bundled promotional packages are recognized in the income statement as incurred.
m) Use of estimates
The key assumptions concerning the future and other relevant sources of uncertainty in estimates at the reporting date that could have a significant impact on the consolidated financial statements within the next financial year are discussed below.
A significant change in the facts and circumstances on which these estimates and related judgments are based could have a material impact on the Group’s results and financial position. Accordingly, sensitivity analyses are disclosed for the most relevant situations (see notes 7 and 15).
Property, plant and equipment, intangible assets and goodwill
The accounting treatment of investments in property, plant and equipment and intangible assets entails the use of estimates to determine the useful life for depreciation and amortization purposes and to assess fair value at their acquisition dates for assets acquired in business combinations.
Determining useful life requires making estimates in connection with future technological developments and alternative uses for assets. There is a significant element of judgment involved in making technological development assumptions, since the timing and scope of future technological advances are difficult to predict.
The decision to recognize an impairment loss involves developing estimates that include, among others, an analysis of the causes of the potential impairment, as well as its timing and expected amount. Furthermore, additional factors, such as technological obsolescence, the suspension of certain services and other circumstantial changes, which highlight the need to evaluate a possible impairment, are taken into account.
The Telefónica Group evaluates its cash-generating units’ performance regularly to identify potential goodwill impairments. Determining the recoverable amount of the cash-generating units to which goodwill is allocated also entails the use of assumptions and estimates and requires a significant element of judgment.
Deferred income taxes
The Group assesses the recoverability of deferred tax assets based on estimates of future earnings. Such recoverability ultimately depends on the Group’s ability to generate taxable earnings over the period for which the deferred tax assets remain deductible. This analysis is based on the estimated schedule for reversing deferred tax liabilities, as well as estimates of taxable earnings, which are sourced from internal projections that are continuously updated to reflect the latest trends.
The recognition of tax assets and liabilities depends on a series of factors, including estimates as to the timing and realization of deferred tax assets and the projected tax payment schedule. Actual Group company income tax receipts and payments could differ from the estimates made by the Group as a result of changes in tax legislation or unforeseen transactions that could affect tax balances.
Provisions
The amount of the provision is determined based on the best estimate of the outflow of resources required to settle the obligation, bearing in mind all available information at the statement of financial position date, including the opinions of independent experts such as legal counsel or consultants.
Given the uncertainties inherent in the estimates used to determine the amount of provisions, actual outflows of resources may differ from the amounts recognized originally on the basis of the estimates.
Revenue recognition
Connection fees
Connection fees generated when customers connect to the Group’s network, are deferred and recognized as revenue over the average estimated customer relationship period.
The estimate of the average customer relationship period is based on the recent history of customer churn. Potential changes in estimates could lead to changes in both the amount and timing of the future recognition of revenues.
Bundled offers
Bundled offers that combine different elements are assessed to determine whether it is necessary to separate the different identifiable components and apply the corresponding revenue recognition policy to each element. Total package revenue is allocated among the identified elements based on their respective fair values.
Determining fair values for each identified element requires estimates that are complex due to the nature of the business.
A change in estimates of fair values could affect the apportionment of revenue among the elements and, as a result, the date of recognition of revenues.
n) New IFRS and interpretations of the IFRS Interpretations Committee (IFRIC)
The accounting policies applied in the preparation of the consolidated financial statements for the year ended December 31, 2013, are consistent with those used in the preparation of the Group’s consolidated financial statements for the year ended December 31, 2012, except for the application of new standards, amendments to standards and interpretations published by the IASB and the IFRIC, and adopted by the European Union, effective as of January 1, 2013, noted below:
|
·
|
IFRS 10 Consolidated Financial Statements
|
IFRS 10 establishes a single control model that applies to all entities including special purpose entities. The changes introduced by IFRS 10 will increase the number of indicators to be considered by management in order to determine which entities are controlled and therefore are required to be consolidated by a parent.
The adoption of these criteria has not resulted in changes in the consolidation scope for the Group.
|
·
|
IFRS 11 Joint Arrangements
|
IFRS 11 establishes principles for the financial reporting of parties to joint arrangements. It defines joint control as the contractually agreed sharing of control of an arrangement, which exists only when decisions about the relevant activities require the unanimous consent of the parties sharing control, and removes the option to account for jointly controlled entities using proportionate consolidation. Instead, joint arrangements that meet the definition of a joint venture must be accounted for using the equity method, while joint arrangements that meet the definition of joint operations are accounted for by integrating assets and liabilities, and the related revenues and expenses, in proportion to the joint operator’s interest in the arrangement. This new standard has been applied retrospectively for joint arrangements held at the date of initial application. Pursuant to the adoption of this standard, the consolidation method for certain joint arrangements has changed. However, such changes have had no significant impact on the Group’s financial position or results.
|
·
|
IFRS 12 Disclosure of Interests in Other Entities
|
IFRS 12 includes disclosures relating to an entity’s interests in subsidiaries, joint arrangements, associates and unconsolidated structured entities. A number of new disclosures are also required. Pursuant to the adoption of this standard, additional disclosures concerning non-controlling interests have been included in the Group’s consolidated financial statements (see Note 12).
|
·
|
IFRS 13 Fair Value Measurement
|
IFRS 13 defines fair value, sets out a framework for measuring fair value and requires disclosures about fair value measurement. Pursuant to the adoption of this standard, new disclosures concerning the measurement of financial instruments have been included in the Group’s consolidated financial statements.
|
·
|
IAS 19 Employee Benefits (Revised)
|
Revised IAS 19 prescribes the accounting and disclosure by employers for employee benefits. The amendments include fundamental changes such as the concept of expected returns on plan assets, which should be equal to the discount rate used to measure the corresponding liability. The amendments also include clarifications and re-wording. The application of this revised standard has had no significant impact on the Group’s financial position or results.
|
·
|
IAS 28 Investments in Associates and Joint Ventures
|
IAS 28 prescribes the accounting for investments in associates and sets out the requirements for the application of the equity method when accounting for investments in associates and joint ventures. The standard defines significant influence, defines the equity method and is to be applied by all entities that are investors in a joint venture or that hold significant influence over an investee. The application of this revised standard has had significant no impact on the Group’s financial position or results.
|
·
|
Amendments to IAS 1 Presentation of Items of Other Comprehensive Income
|
The amendments improve the consistency and clarity of the presentation of items of other comprehensive income (OCI), requiring for entities to group items presented in OCI on the basis of whether they are potentially reclassifiable (“recycled”) to profit or loss at a future point in time. The amendments do not change the option to present items of OCI either before tax or net of tax. However, if the items are presented before tax then the amendments require entities to show separately the tax related to each of the two groups of OCI items (those that might be “recycled” and those that will never be “recycled”). Pursuant to the application of these amendments, the presentation of items in the statement of other comprehensive income, included in the Group’s consolidated financial statements, has been modified.
|
·
|
Amendments to IFRS 7 Disclosures – Offsetting Financial Assets and Financial Liabilities
|
The amendments require entities to disclose information so that users of financial statements are able to assess the effect or potential effect of netting arrangements and similar agreements on the entity’s financial position. The new disclosures are required for all recognized financial instruments that are set off in accordance with IAS 32 Financial Instruments: Presentation. The disclosures also apply to recognized financial instruments that are subject to an enforceable master netting arrangement or similar agreement, irrespective of whether they are set off in accordance with IAS 32. The adoption of these amendments has had no impact on the disclosures included in the Group’s consolidated financial statements.
|
·
|
Annual improvements to IFRSs 2009 – 2011 Cycle (May 2012)
|
The annual improvements project provides a vehicle for making non-urgent but necessary amendments to IFRSs, with the aim of removing inconsistencies and clarifying wording. These improvements have had no impact on the results or financial position of the Group.
New standards and IFRIC interpretations issued but not effective as of December 31, 2013
At the date of authorization for issue of the accompanying consolidated financial statements, the following IFRS, amendments and IFRIC interpretations had been issued by the IASB, but their application was not mandatory:
|
Standards and amendments
|
Mandatory application:
annual periods beginning on or after
|
|||
|
IFRS 9
|
Financial instruments
|
To be determined
|
||
|
Amendments to IFRS 7
|
Disclosures - Transition to IFRS 9
|
To be determined
|
||
|
Amendments to IFRS 10, IFRS 12 and IAS 27
|
Investment entities
|
January 1, 2014
|
||
|
Amendments to IAS 32
|
Offsetting of financial assets and liabilities
|
January 1, 2014
|
||
|
Amendments to IAS 36
|
Recoverable Amount Disclosures for Non-Financial Assets
|
January 1, 2014
|
||
|
Amendments to IAS 39
|
Novation of Derivatives and Continuation of Hedge Accounting
|
January 1, 2014
|
||
|
Amendments to IAS 19
|
Defined Benefit Plans: Employee Contributions
|
July 1, 2014
|
||
|
Improvements to IFRS 2010-2012
|
July 1, 2014
|
|||
|
Improvements to IFRS 2011-2013
|
July 1, 2014
|
|||
|
Interpretations
|
Mandatory application:
annual periods beginning on or after
|
|||
|
IFRIC 21
|
Levies
|
January 1, 2014
|
||
The Group is currently assessing the impact of the application of these standards, amendments and interpretations. Based on the analyses made to date, the Group estimates that their adoption will not have a significant impact on the consolidated financial statements in the initial period of application. However, the changes introduced by IFRS 9 will affect financial instruments and transactions with financial assets carried out on or after the effective date of this standard.
As of January 1, 2012, the Telefónica Group’s consolidated segment results have been reported in accordance with the organizational structure approved in September 2011, based on two regional business units, Telefónica Latin America and Telefónica Europe.
The Telefónica Group’s integrated, regional management model means that the legal structure of the companies is not relevant for the presentation of Group financial information. The operating results of each business unit are therefore presented independently, regardless of their legal structure.
The Telefónica Latin America and Telefónica Europe regional business units includes all businesses pertaining to wireline, wireless, cable, data, internet, television businesses and other digital services, in accordance with each location. “Other and eliminations" includes the companies belonging to the global business units Telefónica Digital and Telefónica Global Resources, the Atento business up to the date of divestment (see Note 2), other Group companies and eliminations in the consolidation process.
From January 1, 2013, Tuenti has been included in the consolidation scope of T. Europe. In 2012 and 2011, it was included in “Other and eliminations”. Consequently, the results of T. Europe and "Other and eliminations" have been revised to include Tuenti for 2012 and 2011. This change does not have any impact on Telefónica’s consolidated results for 2012 and 2011.
Segment reporting takes into account the impact of the purchase price allocation (PPA) to assets acquired and the liabilities assumed from the companies included in each segment. The assets and liabilities presented in each segment are those managed by the heads of each segment, irrespective of their legal structure.
The Group manages borrowing activities and taxes centrally. Therefore, it does not disclose the related assets, liabilities, revenue and expenses by reportable segments.
In order to present the information by region, revenue and expenses arising from intra-group invoicing for the use of the trademark and management services have been eliminated from the operating results of each Group region, while centrally-managed projects have been incorporated at a regional level. These adjustments have no impact on the Group’s consolidated results.
Inter-segment transactions are carried out at market prices.
Telefónica uses operating income before depreciation and amortization (OIBDA) to track the performance of the business and to establish operating and strategic targets. OIBDA is calculated by excluding depreciation and amortization from operating income to eliminate the impact of investments in fixed assets that cannot be directly controlled by management in the short term. Therefore, it is considered to be more important for investors as it provides a gauge of segment operating performance and profitability using the same measures utilized by management. This metric also allows for comparisons with other companies in the telecommunications sector without consideration of their asset structure.
OIBDA is a commonly reported measure and is widely used among analysts, investors and other interested parties in the telecommunications industry, although not a measure explicitly defined in IFRS, and therefore, may not be comparable to similar indicators used by other companies. OIBDA should not be considered as an alternative to operating income as a measurement of our consolidated operating results or as an alternative to consolidated cash flows from operating activities as a measurement of our liquidity.
Key segment information is as follows:
|
Millions of euros
|
Telefónica Latin
America
|
Telefónica
Europe
|
Other and
eliminations
|
Total Group
|
||||
|
External revenues
|
29,054
|
26,666
|
1,341
|
57,061
|
||||
|
Inter-segment revenues
|
139
|
174
|
(313)
|
−
|
||||
|
Other operating income and expenses
|
(19,754)
|
(16,923)
|
(1,307)
|
(37,984)
|
||||
|
OIBDA
|
9,439
|
9,917
|
(279)
|
19,077
|
||||
|
Depreciation and amortization
|
(4,634)
|
(4,706)
|
(287)
|
(9,627)
|
||||
|
Operating income
|
4,805
|
5,211
|
(566)
|
9,450
|
||||
|
Capital expenditures
|
5,252
|
3,872
|
271
|
9,395
|
||||
|
Investments accounted for by the equity method
|
5
|
14
|
2,405
|
2,424
|
||||
|
Fixed assets
|
36,725
|
34,138
|
2,159
|
73,022
|
||||
|
Total allocated assets
|
55,811
|
48,986
|
14,065
|
118,862
|
||||
|
Total allocated liabilities
|
28,186
|
20,418
|
42,776
|
91,380
|
||||
|
Millions of euros
|
Telefónica Latin
America
|
Telefónica
Europe
|
Other and
eliminations
|
Total Group
|
||||
|
External revenues
|
30,393
|
29,835
|
2,128
|
62,356
|
||||
|
Inter-segment revenues
|
127
|
171
|
(298)
|
−
|
||||
|
Other operating income and expenses
|
(19,417)
|
(19,778)
|
(1,930)
|
(41,125)
|
||||
|
OIBDA
|
11,103
|
10,228
|
(100)
|
21,231
|
||||
|
Depreciation and amortization
|
(5,088)
|
(5,014)
|
(331)
|
(10,433)
|
||||
|
Operating income
|
6,015
|
5,214
|
(431)
|
10,798
|
||||
|
Capital expenditures
|
5,455
|
3,513
|
490
|
9,458
|
||||
|
Investments accounted for by the equity method
|
3
|
2
|
2,463
|
2,468
|
||||
|
Fixed assets
|
42,062
|
40,695
|
2,305
|
85,062
|
||||
|
Total allocated assets
|
64,321
|
51,723
|
13,729
|
129,773
|
||||
|
Total allocated liabilities
|
29,019
|
20,660
|
52,433
|
102,112
|
||||
|
2011
|
|||||||
|
Millions of euros
|
Telefónica Latin
America
|
Telefónica
Europe
|
Other and
eliminations
|
Total Group
|
|||
|
External revenues
|
28,830
|
31,895
|
2,112
|
62,837
|
|||
|
Inter-segment revenues
|
111
|
179
|
(290)
|
−
|
|||
|
Other operating income and expenses
|
(18,051)
|
(22,812)
|
(1,764)
|
(42,627)
|
|||
|
OIBDA
|
10,890
|
9,262
|
58
|
20,210
|
|||
|
Depreciation and amortization
|
(4,770)
|
(5,081)
|
(295)
|
(10,146)
|
|||
|
Operating income
|
6,120
|
4,181
|
(237)
|
10,064
|
|||
|
Capital expenditures
|
5,260
|
4,513
|
451
|
10,224
|
|||
|
Investments accounted for by the equity method
|
3
|
1
|
5,061
|
5,065
|
|||
|
Fixed assets
|
43,694
|
28,739
|
16,201
|
88,634
|
|||
|
Total allocated assets
|
62,401
|
41,699
|
25,523
|
129,623
|
|||
|
Total allocated liabilities
|
27,127
|
21,929
|
53,184
|
102,240
|
|||
The composition of segment revenues, detailed by the main countries in which the Group operates, is as follows:
|
2013
|
2012
|
2011
|
||||||||||||||||||||||
|
Country
|
Fixed
|
Mobile
|
Other and elims.
|
Total
|
Fixed
|
Mobile
|
Other and elims.
|
Total
|
Fixed
|
Mobile
|
Other and elims.
|
Total
|
||||||||||||
|
Latin America
|
29,193
|
30,520
|
28,941
|
|||||||||||||||||||||
|
Brazil
|
4,125
|
8,092
|
−
|
12,217
|
5,045
|
8,573
|
−
|
13,618
|
5,890
|
8,436
|
−
|
14,326
|
||||||||||||
|
Argentina
|
1,332
|
2,470
|
(121)
|
3,681
|
1,390
|
2,431
|
(124)
|
3,697
|
1,237
|
2,039
|
(102)
|
3,174
|
||||||||||||
|
Chile
|
1,049
|
1,534
|
(100)
|
2,483
|
1,113
|
1,559
|
(103)
|
2,569
|
1,037
|
1,399
|
(126)
|
2,310
|
||||||||||||
|
Peru
|
1,239
|
1,393
|
(178)
|
2,454
|
1,226
|
1,314
|
(140)
|
2,400
|
1,069
|
1,088
|
(127)
|
2,030
|
||||||||||||
|
Colombia
|
652
|
1,053
|
−
|
1,705
|
695
|
1,070
|
−
|
1,765
|
655
|
906
|
−
|
1,561
|
||||||||||||
|
Mexico
|
N/A
|
1,580
|
N/A
|
1,580
|
N/A
|
1,596
|
N/A
|
1,596
|
N/A
|
1,557
|
N/A
|
1,557
|
||||||||||||
|
Venezuela and Central America
|
N/A
|
4,228
|
N/A
|
4,228
|
N/A
|
4,009
|
N/A
|
4,009
|
N/A
|
3,230
|
N/A
|
3,230
|
||||||||||||
|
Remaining operators and segment eliminations
|
845
|
866
|
753
|
|||||||||||||||||||||
|
Europe
|
26,840
|
30,006
|
32,074
|
|||||||||||||||||||||
|
Spain
|
8,861
|
5,121
|
(1,023)
|
12,959
|
9,541
|
6,464
|
(1,009)
|
14,996
|
10,624
|
7,750
|
(1,097)
|
17,277
|
||||||||||||
|
UK
|
188
|
6,504
|
−
|
6,692
|
242
|
6,800
|
−
|
7,042
|
164
|
6,762
|
−
|
6,926
|
||||||||||||
|
Germany
|
1,235
|
3,673
|
6
|
4,914
|
1,363
|
3,845
|
5
|
5,213
|
1,426
|
3,609
|
−
|
5,035
|
||||||||||||
|
Czech Republic
|
780
|
1,038
|
−
|
1,818
|
851
|
1,159
|
−
|
2,010
|
913
|
1,217
|
−
|
2,130
|
||||||||||||
|
Ireland
|
20
|
532
|
4
|
556
|
17
|
605
|
7
|
629
|
12
|
711
|
−
|
723
|
||||||||||||
|
Remaining operators and segment eliminations
|
(99)
|
116
|
(17)
|
|||||||||||||||||||||
|
Other and inter-segment eliminations
|
1,028
|
1,830
|
1,822
|
|||||||||||||||||||||
|
Total Group
|
57,061
|
62,356
|
62,837
|
|||||||||||||||||||||
Business combinations
In 2013, 2012 and 2011, no business combinations were carried out that were significant for the Group. The main changes in consolidation scope are detailed in Appendix I.
Transactions with non-controlling interests
2013
Sale of 40% of the stake in Telefónica’s subsidiaries in Guatemala, El Salvador, Nicaragua and Panama
The Group sold in 2013 40% of the stake in the subsidiaries in Guatemala, El Salvador, Nicaragua and Panama (see Note 2). The sale was implemented through the creation of a new company, Telefónica Centroamérica Inversiones, S.L., to which Telefónica contributed all of its stakes in these companies in exchange for a 60% interest in the new company. The Telefónica Group maintains control of Telefónica Centroamérica Inversiones, S.L., so it is fully consolidated in the Telefónica Group.
2012
Restructuring of the wireline and wireless businesses in Colombia
In 2012, Telefónica Móviles Colombia, S.A. (a wholly-owned subsidiary of the Telefónica Group), the Colombian National Government and Colombia Telecomunicaciones, S.A. ESP (a company 52% owned by the Telefónica Group and 48% by the Colombian government) signed an agreement to restructure their wireline and wireless businesses in Colombia, which culminated in the merger the two companies. Telefónica obtained 70% shareholding in the resulting company and the Colombian government obtained the remaining 30% shareholding (see Note 2).
Public offering of shares in Telefónica Deutschland Holding, A.G.
On October 29, 2012, the public offering of shares in the subsidiary Telefónica Deutschland Holding A.G. was finalized, corresponding to 23.17% of the capital of that company (see Note 2).
2011
Acquisition of non-controlling interests of Vivo Participações
In 2011 the tender offer for the voting shares of Vivo Participaçoes, S.A. (“Vivo Participaçoes”) held by non-controlling interests, was approved, and Telefónica acquired an additional 2.7% of the Brazilian company’s capital stock for 539 million euros, for a total stake of 62.3%. After required approvals, all shares of Vivo Participações that were not owned by Telesp were exchanged for Telesp shares, at a rate of 1.55 new Telesp shares for each Vivo share, whereby Vivo Participações became a wholly owned subsidiary of Telesp. Once the shares were exchanged, the Telefónica Group became the owner of 73.9% of Telesp. The impact of this transaction on equity attributable to non-controlling interests was a decrease of 661 million euros.
The measurement of non-controlling interests resulting from these transactions considers their share of the subsidiary’s net assets, including goodwill.
The composition of and movements in net intangible assets in 2013 and 2012 are as follows:
|
Balance at 12/31/2012
|
Additions
|
Amortization
|
Disposals
|
Transfers and others
|
Translation differences and hyperinflation adjustments
|
Balance at
12/31/2013
|
||||||||
|
Service concession arrangements and licenses
|
13,545
|
1,223
|
(1,116)
|
−
|
(406)
|
(1,212)
|
12,034
|
|||||||
|
Software
|
3,529
|
717
|
(1,701)
|
(8)
|
709
|
(202)
|
3,044
|
|||||||
|
Customer base
|
1,932
|
1
|
(415)
|
−
|
(360)
|
(136)
|
1,022
|
|||||||
|
Other intangible assets
|
1,839
|
66
|
(216)
|
(8)
|
(86)
|
(108)
|
1,487
|
|||||||
|
Intangible assets in process
|
1,233
|
302
|
−
|
(2)
|
(561)
|
(11)
|
961
|
|||||||
|
Net intangible assets
|
22,078
|
2,309
|
(3,448)
|
(18)
|
(704)
|
(1,669)
|
18,548
|
|||||||
|
Balance at 12/31/2011
|
Additions
|
Amortization
|
Disposals
|
Transfers and others
|
Translation differences and hyperinflation adjustments
|
Inclusion of companies
|
Exclusion of companies
|
Balance at 12/31/2012
|
||||||||||
|
Service concession arrangements and licenses
|
14,764
|
420
|
(1,110)
|
−
|
25
|
(554)
|
−
|
−
|
13,545
|
|||||||||
|
Software
|
3,732
|
806
|
(1,690)
|
(9)
|
743
|
(27)
|
−
|
(26)
|
3,529
|
|||||||||
|
Customer base
|
2,502
|
−
|
(452)
|
(113)
|
23
|
(31)
|
3
|
−
|
1,932
|
|||||||||
|
Other intangible assets
|
2,125
|
65
|
(250)
|
(22)
|
10
|
(37)
|
3
|
(55)
|
1,839
|
|||||||||
|
Intangible assets in process
|
941
|
605
|
−
|
(2)
|
(307)
|
(4)
|
−
|
−
|
1,233
|
|||||||||
|
Net intangible assets
|
24,064
|
1,896
|
(3,502)
|
(146)
|
494
|
(653)
|
6
|
(81)
|
22,078
|
|||||||||
The gross cost, accumulated amortization and impairment losses of intangible assets at December 31, 2013 and 2012 are as follows:
|
Millions of euros
|
Gross cost
|
Accumulated
amortization
|
Impairment losses
|
Net intangible assets
|
||||
|
Service concession arrangements and licenses
|
19,763
|
(7,729)
|
−
|
12,034
|
||||
|
Software
|
14,320
|
(11,259)
|
(17)
|
3,044
|
||||
|
Customer base
|
4,257
|
(3,235)
|
−
|
1,022
|
||||
|
Other intangible assets
|
3,433
|
(1,938)
|
(8)
|
1,487
|
||||
|
Intangible assets in process
|
962
|
−
|
(1)
|
961
|
||||
|
Net intangible assets
|
42,735
|
(24,161)
|
(26)
|
18,548
|
||||
|
Millions of euros
|
Gross cost
|
Accumulated
amortization
|
Impairment losses
|
Net intangible assets
|
||||
|
Service concession arrangements and licenses
|
21,212
|
(7,667)
|
−
|
13,545
|
||||
|
Software
|
15,486
|
(11,935)
|
(22)
|
3,529
|
||||
|
Customer base
|
6,221
|
(4,289)
|
−
|
1,932
|
||||
|
Other intangible assets
|
3,964
|
(2,125)
|
−
|
1,839
|
||||
|
Intangible assets in process
|
1,233
|
−
|
−
|
1,233
|
||||
|
Net intangible assets
|
48,116
|
(26,016)
|
(22)
|
22,078
|
||||
The net balance of “Transfers and others” for 2013 primarily includes the reclassification to “Non-current assets held for sale” of the intangible assets of Telefónica Ireland and Telefónica Czech Republic (see Note 2).
"Additions" in 2013 include Telefónica UK Ltd’s acquisition of two 10 MHz blocks in the 800 MHz spectrum band for 719 million euros.
"Additions" in 2012 include the acquisition of LTE spectrum licenses in Brazil for 420 million euros (40 MHz FDD in the 2.5 GHz frequency band). A license to use spectrum in the 800 MHz, 900 MHz and 1,800 MHz bands in Ireland was also acquired for 127 million euros.
The spectrum licenses in the 800 MHz and 900 MHz acquired by Telefónica Móviles España in 2011 for 793 million euros are recognized under “Intangible assets in process” as they will be available from 2014 and 2015 respectively.
“Disposals” in 2012 include the intangible assets related to the Irish market customer portfolio, amounting to 113 million euros.
Details of the principal concessions and licenses with which the Group operates are provided in Appendix VII.
“Other intangible assets” includes the amounts allocated to trademarks acquired in business combinations, of 1,951 million euros and 2,478 million euros at December 31, 2013 and 2012 respectively (1,071 million euros and 1,561 million euros, respectively, net of the related accumulated amortization).
The impact of the monetary adjustments due to hyperinflation in Venezuela is included under “Translation differences and hyperinflation adjustments”.
The movement in this heading assigned to each Group segment was the following:
|
Millions of euros
|
Balance at
12/31/12
|
Acquisitions
|
Transfers
|
Translation differences and hyperinflation adjustments
|
Balance at
12/31/13
|
|||||
|
Telefónica Latin America
|
14,265
|
−
|
−
|
(2,125)
|
12,140
|
|||||
|
Telefónica Europe
|
13,392
|
−
|
(2,047)
|
(286)
|
11,059
|
|||||
|
Other
|
306
|
2
|
(42)
|
(31)
|
235
|
|||||
|
Total
|
27,963
|
2
|
(2,089)
|
(2,442)
|
23,434
|
|||||
|
Millions of euros
|
Balance at
12/31/11
|
Acquisitions
|
Disposals
|
Valuation adjustment
|
Translation differences and hyperinflation adjustments
|
Balance at
12/31/12
|
||||||
|
Telefónica Latin America
|
14,955
|
−
|
−
|
−
|
(690)
|
14,265
|
||||||
|
Telefónica Europe
|
13,695
|
2
|
(52)
|
(414)
|
161
|
13,392
|
||||||
|
Other
|
457
|
10
|
(139)
|
−
|
(22)
|
306
|
||||||
|
Total
|
29,107
|
12
|
(191)
|
(414)
|
(551)
|
27,963
|
||||||
The column “Transfers” in 2013 mainly includes the reclassification to “Non-current assets held for sale” of the goodwill allocated to Telefónica Ireland and Telefónica Czech Republic (see Note 2).
A goodwill valuation adjustment of 414 million euros related to Telefónica’s operations in Ireland was recognized in 2012. Disposals in 2012 included a derecognition of goodwill due to the sale of the Atento business, for 139 million euros.
In order to test for impairment, goodwill has been allocated to the different cash-generating units (CGUs), which are grouped into the following reportable operating segments:
|
12/31/13
|
12/31/12
|
||
|
Telefónica Latin America
|
12,140
|
14,265
|
|
|
Brazil
|
8,392
|
10,056
|
|
|
Chile
|
996
|
1,137
|
|
|
Peru
|
738
|
846
|
|
|
Mexico
|
554
|
584
|
|
|
Other
|
1,460
|
1,642
|
|
|
Telefónica Europe
|
11,059
|
13,392
|
|
|
Spain
|
3,332
|
3,289
|
|
|
United Kingdom
|
4,948
|
5,055
|
|
|
Germany
|
2,779
|
2,779
|
|
|
Czech Republic
|
-
|
2,172
|
|
|
Ireland
|
-
|
97
|
|
|
Other
|
235
|
306
|
|
|
TOTAL
|
23,434
|
27,963
|
The strategic plans of the various cash-generating units (CGU) to which goodwill is allocated are used to perform the impairment test at year-end. The process of preparing the CGUs’ strategic plans takes into consideration the current condition of each CGU’s market, analyzing the macroeconomic, competitive, regulatory and technological climate together with each CGU’s position in this context and the growth opportunities given the market projections and their competitive positioning. A growth target is then defined for each CGU in terms of market share, which is a critical factor when forecasting future revenues. The operating resources and fixed asset investments that need to be assigned in order to reach the growth target are estimated following a basic premise of boosting operating efficiency, with a view to increase operating cash flow over the life of the plan. In this process, the Group has also assessed the level of fulfillment of the strategic plans in the past.
Main assumptions used in calculating value in use
Value in use is calculated for the various CGUs based on the approved business plans and taking into account certain variables such as the OIBDA margin and the CapEx ratio for non-current assets, expressed as a percentage of revenue, and discount and perpetuity growth rates. Following is a description of the principal variables considered for each CGU with significant goodwill (Brazil, Spain, Germany and United Kingdom).
OIBDA margin and long-term CapEx
The values obtained as described in the preceding paragraphs are compared with available data of our competitors in the geographical markets in which the Group operates. This analysis has identified that the OIBDA margin determined for the operations in Spain, Germany and United Kingdom is in line with the average for European peers, which stands at approximately 33%. With respect to the ratio of CapEx over revenues, over the term of the strategic plan, the Group’s European operators invest at a percentage of revenue that lies at the bottom end of the range for peers in the region. The average OIBDA margin for Brazil is in line with the average for peers in emerging markets of approximately 36%. Over the term of the strategic plan, the Group’s operator in Brazil invests a similar percentage as the average for its peers, within the estimated range for these operators.
Discount rate
The discount rate, applied to measure free cash flow, is the weighted average cost of capital (WACC), determined by the weighted average cost of equity and debt according the finance structure established for each CGU.
This rate is calculated using the capital asset pricing model (CAPM), which takes into account the asset’s systemic risk, and the impact of risks on cash flows not generated internally, such as country risk, business-specific credit risk, currency risk and price risk specific to the financial asset. The data used in these calculations are obtained from independent and renowned external information sources.
The discount rates applied to the cash flow projections in 2013 and 2012 are as follows:
|
Discount rate in local currency
|
2013
|
2012
|
|
Spain
|
6.3%
|
7.7%
|
|
Brazil
|
11.6%
|
10.8%
|
|
United Kingdom
|
6.1%
|
6.1%
|
|
Germany
|
5.3%
|
5.8%
|
The main variation relates to Spain, where the reduction in the political risk premium has contributed to the decline in the discount rate.
Meanwhile, the change in the Brazil rate is due to the increase in the cost of debt and in the political risk premium.
Perpetuity growth rate
In all cases, impairment tests are performed using the projected cash flows estimated according to the strategic plans over a five-year period. Cash flow projections as from the sixth year are calculated using an expected constant growth rate, taking as the perpetuity growth rate consensus estimates among analysts for each business and country, based on the maturity of the industry depending on technology and the degree of development of each country. Each indicator is compared to the forecasted long-term GDP growth of each country and growth data from external sources, adjusted for any specific characteristics of the business.
The perpetuity growth rates applied to the cash flow projections in 2013 and 2012 are as follows:
|
Perpetuity growth rate
in local currency
|
2013
|
2012
|
|
Spain
|
0.8%
|
0.7%
|
|
Brazil
|
5.0%
|
4.7%
|
|
United Kingdom
|
1.0%
|
1.0%
|
|
Germany
|
1.1%
|
1.1%
|
In the case of Brazil, although the perpetuity growth rate in nominal terms is above 3%, it is in line with the Brazilian Central Bank’s medium-term inflation target (4.5%, within a range of +-2p.p.) and is below the analyst consensus forecasted near-term inflation rates of the Strategic Plan (approximately 5%-6%). Stripping out the difference in inflation between Brazil and the Eurozone, the equivalent rate in euros would be below 3% in both years.
Sensitivity to changes in assumptions
The Group carries out a sensitivity analysis of the impairment test by considering reasonable changes in the main assumptions used in such test, assuming the following increases or decreases, expressed in percentage points (p.p.):
Financial variables:
- Discount rate (-1 p.p. / +1 p.p.)
- Perpetuity growth rates (+0.25 p.p. / -0.25 p.p.)
Operating variables:
- OIBDA Margin (+3 p.p. / -3 p.p.)
- Ratio of CapEx/Revenues (+1.5 p.p. / -1.5 p.p.)
The sensitivity analysis performed at year-end 2013 indicates that there are no significant risks arising from reasonably possible variances in the financial and the operating variables individually considered. In other words, Management considers that within the above ranges, reasonably wide, no impairment losses would be recognized over the CGUs’ carrying amounts.
The composition of and movement in the items comprising net “Property, plant and equipment” in 2013 and 2012 were the following:
|
Balance at 12/31/12
|
Additions
|
Depreciation
|
Disposals
|
Transfers and others
|
Translation differences and hyperinflation adjustments
|
Exclusion of companies
|
Balance at 12/31/13
|
|||||||||
|
Land and buildings
|
6,049
|
51
|
(598)
|
(50)
|
119
|
(337)
|
−
|
5,234
|
||||||||
|
Plant and machinery
|
23,213
|
1,565
|
(4,860)
|
(67)
|
3,059
|
(1,663)
|
(1)
|
21,246
|
||||||||
|
Furniture, tools and other items
|
2,007
|
174
|
(721)
|
(27)
|
13
|
(114)
|
(4)
|
1,328
|
||||||||
|
PP&E in progress
|
3,752
|
5,296
|
−
|
(8)
|
(5,426)
|
(382)
|
−
|
3,232
|
||||||||
|
Net PP&E
|
35,021
|
7,086
|
(6,179)
|
(152)
|
(2,235)
|
(2,496)
|
(5)
|
31,040
|
|
Balance at 12/31/11
|
Additions
|
Depreciation
|
Disposals
|
Transfers and others
|
Translation differences and hyperinflation adjustments
|
Inclusion of companies
|
Exclusion of companies
|
Balance at 12/31/12
|
||||||||||
|
Land and buildings
|
5,993
|
79
|
(604)
|
(89)
|
639
|
38
|
−
|
(7)
|
6,049
|
|||||||||
|
Plant and machinery
|
23,708
|
1,763
|
(5,593)
|
(92)
|
3,680
|
(248)
|
1
|
(6)
|
23,213
|
|||||||||
|
Furniture, tools and other items
|
1,810
|
321
|
(734)
|
(19)
|
806
|
(39)
|
−
|
(138)
|
2,007
|
|||||||||
|
PP&E in progress
|
3,952
|
5,399
|
−
|
(10)
|
(5,561)
|
(18)
|
−
|
(10)
|
3,752
|
|||||||||
|
Net PP&E
|
35,463
|
7,562
|
(6,931)
|
(210)
|
(436)
|
(267)
|
1
|
(161)
|
35,021
|
|||||||||
The gross cost, accumulated depreciation and impairment losses of property, plant and equipment at December 31, 2013 and 2012 are as follows:
|
Millions of euros
|
Gross cost
|
Accumulated depreciation
|
Impairment losses
|
Net PP&E
|
||||
|
Land and buildings
|
11,633
|
(6,398)
|
(1)
|
5,234
|
||||
|
Plant and machinery
|
90,723
|
(69,420)
|
(57)
|
21,246
|
||||
|
Furniture, tools and other items
|
6,487
|
(5,148)
|
(11)
|
1,328
|
||||
|
PP&E in progress
|
3,255
|
−
|
(23)
|
3,232
|
||||
|
Net PP&E
|
112,098
|
(80,966)
|
(92)
|
31,040
|
||||
|
Millions of euros
|
Gross cost
|
Accumulated depreciation
|
Impairment losses
|
Net PP&E
|
||||
|
Land and buildings
|
13,099
|
(7,047)
|
(3)
|
6,049
|
||||
|
Plant and machinery
|
101,862
|
(78,578)
|
(71)
|
23,213
|
||||
|
Furniture, tools and other items
|
7,398
|
(5,387)
|
(4)
|
2,007
|
||||
|
PP&E in progress
|
3,776
|
−
|
(24)
|
3,752
|
||||
|
Net PP&E
|
126,135
|
(91,012)
|
(102)
|
35,021
|
||||
“Additions” for 2013 and 2012, totaling 7,086 million euros and 7,562 million euros, respectively, reflect the Group’s investment efforts made during the year.
Investment by Telefónica Europe in 2013 and 2012 amounted to 2,491 million euros and 2,664 million euros, respectively. Investment in 2013 mainly focused on further roll-out of fiber optic across the fixed network in Spain, increasing the number of fiber optic-connected homes and customers. Development of the LTE mobile networks in Germany, the United
Kingdom and Spain was ramped up to increase deployment and coverage, while investments continued to be made to boost the capacity of third-generation mobile networks.
Telefónica Latin America’s investments in 2013 and 2012 amounted to 4,421 million euros and 4,568 million euros, respectively. In 2013, investments in the mobile business centered primarily on expansion of the coverage, quality and density of 3G networks, as well as the roll-out of LTE (Brazil, Colombia, Chile and Peru), the development of platforms to underpin new value-added services, and the optimization of infrastructure and systems developments focusing on self-management. In the fixed line business, funds continued to be earmarked for rolling out UBB through speed upgrades in ADSL, fiber (FTTx) and VDSL in Brazil, Argentina and Chile, and the installation of fixed-mobile convergence systems (Brazil, Colombia, Chile and Peru).
“Disposals” mainly include the impact of the disposal by the Group of non-strategic assets (see Note 18)
The column “Transfers and others” in 2013 mainly includes the reclassification to “Non-current assets held for sale” of the property, plant and equipment of Telefónica Ireland and Telefónica Czech Republic (see Note 2).
The impact of the monetary adjustments due to hyperinflation in Venezuela is included under “Translation differences and hyperinflation adjustments”.
Telefónica Group companies have purchased insurance policies to reasonably cover the possible risks to which their property, plant and equipment used in operations are subject, with suitable limits and coverage. In addition, as part of its commercial activities and network roll-out, the Group maintains several property acquisition commitments. The timing of scheduled payments in this regard is disclosed in Note 18.
Property, plant and equipment deriving from finance leases amounted to 463 million euros at December 31, 2013 (536 million euros at December 31, 2012). The most significant finance leases are disclosed in Note 22.
The breakdown of amounts related to associates and joint ventures recognized in the consolidated statements of financial position and income statements is as follows:
|
12/31/13
|
12/31/12
|
|||
|
Investments accounted for by the equity method
|
2,424
|
2,468
|
||
|
Loans to associates and joint ventures (Note 13)
|
1,281
|
852
|
||
|
Receivables from associates and joint ventures for current operations
|
85
|
107
|
||
|
Financial debt, associates and joint ventures
|
20
|
−
|
||
|
Payables to associates and joint ventures
|
578
|
511
|
||
|
2013
|
2012
|
|||
|
Share of (loss) of investments accounted for by the equity method
|
(304)
|
(1,275)
|
||
|
Revenue from operations with associates and joint ventures
|
524
|
535
|
||
|
Expenses from operations with associates and joint ventures
|
552
|
634
|
||
|
Financial income with associates and joint ventures
|
38
|
32
|
||
|
Financial expenses with associates and joint ventures
|
10
|
4
|
||
The Group has entered into factoring agreements in 2013 through the associate Telefónica Factoring España, S.A. amounting to 386 million euros.
The breakdown of the main investments accounted for by the equity method and key financial highlights for the last 12-month periods available at the time of preparation of the consolidated financial statements for 2013 and 2012 are as follows:
|
Millions of euros
|
||||||||||||||
|
COMPANY
|
% holding
|
Total assets
|
Total liabilities
|
Operating income
|
Profit (loss) for the year
|
Carrying amount
|
Market value
|
|||||||
|
Telco, S.p.A. (Italy) (Note 21.b)
|
66.00%
|
3,001
|
2,416
|
−
|
(474)
|
390
|
N/A
|
|||||||
|
DTS Distribuidora de Televisión Digital, S.A. (Spain)
|
22.00%
|
1,381
|
528
|
1,166
|
(74)
|
434
|
N/A
|
|||||||
|
China Unicom (Hong Kong) Limited
|
5.01%
|
61,320
|
35,389
|
34,775
|
1,227
|
1,539
|
1,293
|
|||||||
|
Other
|
61
|
|||||||||||||
|
TOTAL
|
2,424
|
|||||||||||||
|
Millions of euros
|
||||||||||||||
|
COMPANY
|
% holding
|
Total assets
|
Total liabilities
|
Operating income
|
Profit (loss) for the year
|
Carrying amount
|
Market value
|
|||||||
|
Telco, S.p.A. (Italy)
|
46.18%
|
3,608
|
2,687
|
−
|
(1,729)
|
425
|
N/A
|
|||||||
|
DTS Distribuidora de Televisión Digital, S.A. (Spain)
|
22.00%
|
1,472
|
545
|
1,068
|
52
|
457
|
N/A
|
|||||||
|
China Unicom (Hong Kong) Limited
|
5.01%
|
56,772
|
31,487
|
29,578
|
668
|
1,547
|
1,434
|
|||||||
|
Other
|
39
|
|||||||||||||
|
TOTAL
|
2,468
|
|||||||||||||
The detail of the movement in investments in associates in 2013 and 2012 was the following:
|
Millions of euros
|
|
|
Balance at 12/31/11
|
5,065
|
|
Additions
|
277
|
|
Disposals
|
(1,439)
|
|
Translation differences
|
12
|
|
Income (loss)
|
(1,275)
|
|
Dividends
|
(57)
|
|
Transfers and other
|
(115)
|
|
Balance at 12/31/12
|
2,468
|
|
Additions
|
363
|
|
Disposals
|
(2)
|
|
Translation differences
|
(94)
|
|
Income (loss)
|
(304)
|
|
Dividends
|
(28)
|
|
Transfers and other
|
21
|
|
Balance at 12/31/13
|
2,424
|
As part of the Telco, S.p.A. refinancing in 2012 (see Note 13.a), Telefónica made a contribution to equity of this company for 277 million euros.
In 2013 Telefónica and the remaining shareholders of Telco, S.p.A. reached an agreement by virtue of which Telefónica increased its stake in Telco, S.p.A. by investing 324 million euros in cash (see Note 21.b).
In 2013 and 2012 adjustments to the value of the stake of Telco, S.p.A. in Telecom Italia, S.p.A. were made, which coupled with the contribution to results in the year, resulted in a negative impact on “Share of loss of investments accounted for by the equity method” of 267 million euros and 1,277 million euros, respectively (see Note 2).
“Disposals” for 2012 primarily relate to the reduction in the investment in China Unicom (see Note 2).
Significant shareholders
A summary of significant transactions between the Telefónica Group and the companies of Banco Bilbao Vizcaya Argentaria, S.A. (BBVA) and those of Caja de Ahorros y Pensiones de Barcelona (“la Caixa”), significant shareholders of the Company with stakes in Telefónica, S.A. of 6.89% and 5.43%, respectively, at December 31, 2013, is as follows:
All of these transactions were carried out at market prices.
|
2013
|
BBVA
|
la Caixa
|
|
|
Finance costs
|
45
|
2
|
|
|
Receipt of services
|
19
|
57
|
|
|
Other expenses
|
1
|
−
|
|
|
Total costs
|
65
|
59
|
|
|
Finance income
|
35
|
8
|
|
|
Dividends received
(1)
|
14
|
N/A
|
|
|
Services rendered
|
68
|
78
|
|
|
Sale of goods
|
5
|
3
|
|
|
Other income
|
62
|
−
|
|
|
Total revenue
|
184
|
89
|
|
|
Finance arrangements: loans and capital contributions (borrower)
|
360
|
214
|
|
|
Guarantees
|
452
|
134
|
|
|
Commitments
|
32
|
69
|
|
|
Commitments/guarantees canceled
|
69
|
−
|
|
|
Finance arrangements: loans and capital contributions (lender)
|
1,626
|
1,671
|
|
|
Financial lease contracts
|
5
|
−
|
|
|
Cancellation of credits and lease contracts
|
13
|
−
|
|
|
Dividends
|
108
|
89
|
|
|
Other operations (factoring operations)
|
210
|
−
|
|
|
Derivative transactions
(2)
(nominal value)
|
13,352
|
1,200
|
|
(1)
|
At December 31, 2013, Telefónica holds a 0.76% stake in the share capital of Banco Bilbao Vizcaya Argentaria, S.A. (see Note 13.a)
|
|
(2)
|
See Derivatives Policy of the Group in Note 16.
|
|
2012
|
BBVA
|
la Caixa
|
|
|
Finance costs
|
112
|
17
|
|
|
Receipt of services
|
42
|
59
|
|
|
Other expenses
|
1
|
1
|
|
|
Total costs
|
155
|
77
|
|
|
Finance income
|
26
|
2
|
|
|
Dividends received
|
16
|
N/A
|
|
|
Services rendered
|
218
|
39
|
|
|
Sale of goods
|
7
|
6
|
|
|
Other income
|
4
|
−
|
|
|
Total revenue
|
271
|
47
|
|
|
Finance arrangements: loans and capital contributions (borrower)
|
545
|
385
|
|
|
Guarantees
|
471
|
149
|
|
|
Commitments
|
25
|
49
|
|
|
Financial lease contracts
|
660
|
618
|
|
|
Dividends
|
286
|
135
|
|
|
Other operations (factoring operations)
|
356
|
−
|
|
|
Derivative transactions (nominal value)
|
12,911
|
2,661
|
|
The most significant balances and transactions with associates and joint ventures are detailed in Note 9.
During the financial year to which these accompanying consolidated financial statements refer, the Directors and senior executives did not perform any transactions with Telefónica, S.A. or any Telefónica Group company other than those in the Group’s normal trading activity and business.
Compensation and other benefits paid to members of the Board of Directors and senior executives, as well as the detail of the equity interests and positions or duties held by the directors in companies engaging in an activity that is identical, similar or complementary to that of the Company are detailed in Note 21 and Appendix II of these consolidated financial statements.
Certain members of Telefónica, S.A.’s Board of Directors are also board members of Abertis Infraestructuras, S.A., parent of Abertis (Note 21.g). In 2013 Telefónica reached an agreement with Abertis through its subsidiary Abertis Tower, S.A. by way of which Telefónica Móviles España, S.A.U. has transferred 690 mobile phone towers to Abertis, generating a gain of 70 million euros. An agreement has also been signed through which Abertis Tower, S.A. leases certain space in the aforesaid infrastructures for Telefónica Móviles España, S.A.U. to install its communications equipment.
In addition, on December 28, 2012, Telefónica de Contenidos, S.A.U. (wholly owned by Telefónica, S.A.), formalized the transfer to Abertis (through Abertis Telecom, S.A.) of 23,343 shares in Hispasat, S.A. for a total price of 68 million euros (see Appendix I).
The breakdown of this consolidated statement of financial position heading at December 31, 2013 and 2012 is as follows:
|
Balance at 12/31/2013
|
Balance at 12/31/2012
|
||
|
Trade receivables billed
|
8,184
|
9,326
|
|
|
Trade receivables unbilled
|
2,258
|
2,673
|
|
|
Impairment for trade receivables
|
(2,598)
|
(3,196)
|
|
|
Receivables from associates and joint ventures
|
85
|
107
|
|
|
Other receivables
|
571
|
792
|
|
|
Short-term prepayments
|
1,140
|
1,009
|
|
|
Total
|
9,640
|
10,711
|
Public-sector net trade receivables at December 31, 2013 and 2012 amounted to 577 million euros and 598 million euros, respectively.
The movement in impairment of trade receivables in 2013 and 2012 is as follows:
|
Millions of euros
|
|
|
Impairment provision at December 31, 2011
|
3,135
|
|
Allowances
|
778
|
|
Amounts applied
|
(711)
|
|
Exclusion of companies
|
(7)
|
|
Translation differences
|
1
|
|
Impairment provision at December 31, 2012
|
3,196
|
|
Allowances
|
674
|
|
Amounts applied
|
(809)
|
|
Translation differences and other
|
(463)
|
|
Impairment provision at December 31, 2013
|
2,598
|
The balance of trade receivables billed net of impairment losses at December 31, 2013, amounted to 5,586 million euros (6,130 million euros at December 31, 2012), of which 3,056 million euros were not yet due (3,566 million euros at December 31, 2012).
Net amounts of 354 million euros and 159 million euros are over 360 days due at December 31, 2013 and 2012, respectively. They are mainly with the public sector.
a) Share capital and share premium
At December 31, 2013, Telefónica, S.A.’s share capital amounted to 4,551,024,586 euros and consisted of 4,551,024,586 fully paid ordinary shares of a single series, per value of 1 euro, all recorded by the book-entry system and traded on the Spanish electronic trading system (“Continuous Market”), where they form part of the “Ibex 35” Index, on the four Spanish Stock Exchanges (Madrid, Barcelona, Valencia and Bilbao) and listed on the New York, London, Buenos Aires and Lima Stock Exchanges.
On May 25, 2012, the deed of capital reduction through the cancellation of 84,209,363 treasury shares previously acquired by Telefónica, S.A. was executed. As a result, article 5 of the Corporate Bylaws relating to the amount of share capital was amended accordingly to show 4,479,787,122 euros. At the same time, a reserve was recorded for the cancelled shares described in the section on “Retained earnings”.
On June 8, 2012, a share capital increase of 71,237,464 euros was executed, during which 71,237,464 ordinary shares with a par value of 1 euro each were issued, with a charge to reserves, as part of the scrip dividend shareholder remuneration deal. Share capital amounts to 4,551,024,586 euros subsequent to this increase.
With respect to authorizations given regarding share capital, on May 18, 2011, authorization was given at the Annual Shareholders’ Meeting of Telefónica, S.A. for the Board of Directors, at its discretion and in accordance with the Company’s needs, to increase the Company’s capital, once or several times, within a maximum period of five years from that date, up to a maximum increase of 2,281,998,242.50 euros, equivalent to half of Telefónica, S.A.’s share capital at that date, by issuing and placing new shares, of any type permitted by the Law, with a fixed or variable premium, and, in all cases, in exchange for cash, expressly considering the possibility that the new shares may not be fully subscribed. The Board of Directors was also empowered to exclude, partially or fully, pre-emptive subscription rights under the terms of Section 506 of the Spanish Enterprises Act.
In addition, on June 2, 2010, shareholders voted to authorize the acquisition by the Board of Directors of Telefónica, S.A. treasury shares, up to the limits and pursuant to the terms and conditions established at the Shareholders’ Meeting, within a maximum period of five years from that date. However, it specified that in no circumstances could the par value of the shares acquired, added to that of the treasury shares already held by Telefónica, S.A. and by any of its controlled subsidiaries, exceed the maximum legal percentage at any time (currently 10% of Telefónica, S.A.’s share capital).
In addition, at the May 31, 2013, Shareholders’ Meeting, authorization was given for the Board of Directors to issue fixed-income securities and preferred shares at one or several times within a maximum period of five years from that date. These securities may be in the form of debentures, bonds, promissory notes or any other kind of fixed-income security, plain or, in the case of debentures and bonds, convertible into shares of the Company and/or exchangeable for shares of any of the Group companies. They may also be preferred shares. The total maximum amount of the securities issuable agreed under this authorization is 25,000 million euros or the equivalent in another currency. For promissory notes, the outstanding balance of promissory notes issued under this authorization will be calculated for purposes of the aforementioned limit. As at December 31, 2013, the Board of Directors had not exercised these powers, being approved the programs to issue corporate promissory notes for 2014 in January.
Proposed distribution of profit attributable to equity holders of the parent
Telefónica, S.A. generated 664 million euros of profit in 2013.
Accordingly, the Company’s Board of Directors will submit the following proposed distribution of 2013 profit for approval at the Shareholders’ Meeting:
|
Millions of euros
|
|
|
Goodwill reserve
|
2
|
|
Voluntary reserves
|
662
|
|
Total
|
664
|
b) Dividends
Dividends paid in 2013
At its meeting of May 31, 2013, Telefónica, S.A.’s Board of Directors resolved to pay a dividend with a charge to unrestricted reserves of a fixed gross 0.35 euros per outstanding share carrying dividend rights. This dividend was paid in full on November 6, 2013, and the total amount paid was 1,588 million euros.
Dividends paid in 2012 and capital increase
Approval was given at the General Shareholders’ Meeting of May 14, 2012, to pay a gross 0.53 euros dividend per share outstanding with a charge to unrestricted reserves. The dividend was paid on May 18, 2012, and the total amount paid was 2,346 million euros.
In addition, approval was given to pay a scrip dividend consisting of the assignment of free allotment rights with an irrevocable purchase obligation on the Company, and a subsequent capital increase by means of the issue of new shares to fulfill said allotments.
At the close of the trading period for these rights, the holders of 37.68% of the Company’s shares had accepted the Company’s irrevocable commitment to buy. These rights were repurchased and cancelled by the Company for the amount of 490 million euros.
Therefore, holders of 62.32% of free subscription rights were entitled to receive new Telefónica shares. However, Telefónica, S.A. waived the subscription of new shares corresponding to treasury shares, so the final number of shares issued in the bonus issue was 71,237,464 shares with a nominal value of 1 euro each.
Dividends paid in 2011
At its meeting of April 12, 2011, Telefónica, S.A.’s Board of Directors resolved to pay an interim dividend against 2011 profit of a fixed gross 0.75 euros per outstanding share carrying dividend rights. This dividend was paid in full on May 6, 2011, and the total amount paid was 3,394 million euros.
In addition, approval was given at the General Shareholders’ Meeting on May 18, 2011, to pay a gross 0.77 dividend per share outstanding carrying dividend rights with a charge to unrestricted reserves. This dividend was paid in full on November 7, 2011, and the total amount paid was 3,458 million euros.
c) Other equity instruments
On September 18, 2013, Telefónica Europe, B.V. issued undated deeply subordinated reset rate guaranteed securities in an aggregate principal amount of 1,750 million euros. This issue entails two tranches: one of them subject to a call option exercisable by Telefónica Europe, B.V. starting on the fifth anniversary of the issuance date in an aggregate principal amount of 1,125 million euros (the “Five-Year Non-Call Securities”), and the other subject to a call option exercisable by Telefónica Europe, B.V. starting on the eighth anniversary of the issuance date in an aggregate principal amount of 625 million euros (the “Eight-Year Non-Call Securities”). In both tranches there is an early redemption option for the issuer.
The Five-Year Non-Call Securities will accrue a fixed coupon at a rate of 6.5% annually as from the issuance date (inclusive) up to September 18, 2018. From September 18, 2018 (inclusive) onwards, the Five-Year Non-Call Securities will accrue a fixed coupon equal to the applicable 5 year swap rate plus a margin of: (i) 5.038% per year as from September 18, 2018 up to September 18, 2023 (not inclusive); (ii) 5.288% per year as from September 18, 2023 up to September 18, 2038 (not inclusive); and (iii) 6.038% per year as from September 18, 2038 (inclusive).
The Eight-Year Non-Call Securities will accrue a fixed coupon at a rate of 7.625% annually as from the issuance date (inclusive) up to September 18, 2021. From September 18, 2021 (inclusive) onwards, the Eight-Year Non-Call Securities will accrue a fixed coupon equal to the applicable 8 year swap rate plus a margin of: (i) 5.586% per year as from September 18, 2021 up to September 18, 2023 (not inclusive); (ii) 5.836% per year as from September 18, 2023 up to September 18, 2041 (not inclusive); and (iii) 6.586% per year as from September 18, 2041 (inclusive).
On November 26, 2013, Telefónica Europe, B.V. issued undated deeply subordinated reset rate guaranteed securities, with the subordinated guarantee of Telefónica, S.A., for an aggregate principal amount of 600 million sterling pounds (equivalent to 716 million euros at the closing date) and subject to a call option exercisable by Telefónica Europe, B.V. starting on the seventh anniversary of the issuance date. The securities will accrue a coupon at a rate of 6.75% annually as from the issuance date (inclusive) up to November 26, 2020. From November 26, 2020 (inclusive), the securities will accrue a fixed coupon equal to the applicable five years swap rate resettable every five years plus a margin of: (i) 4.458% per year as from November 26, 2020, up to November 26, 2025 (not inclusive); (ii) 4.708% per year as from November 26, 2025, up to November 26, 2040 (not inclusive); and (iii) 5.458% per year as from November 26, 2040 (inclusive).
In all cases, the issuer has an option to defer the payment of coupons, holders of these securities cannot call for payment.
As the repayment of principal and the payment of coupons depend solely on Telefónica’s decision, these subordinated perpetual instruments are equity instruments and are presented under “Other equity instruments” in the accompanying consolidated statement of changes in equity.
d)
Legal reserve
According to the consolidated text of the Corporate Enterprises Act, companies must transfer 10% of profit for the year to a legal reserve until this reserve reaches at least 20% of share capital. The legal reserve can be used to increase capital by the amount exceeding 10% of the increased share capital amount. Except for this purpose, until the legal reserve exceeds the limit of 20% of share capital, it can only be used to offset losses, if there are no other reserves available. At December 31, 2013, the Company had duly set aside this reserve, amounting to 984 million euros.
e) Retained earnings
These reserves include undistributed profits of companies comprising the consolidated Group less interim dividends paid against profit for the year, actuarial gains and losses and the impact of the asset ceiling on defined-benefit plans.
In addition, these reserves include revaluation reserves and reserve for cancelled share capital. These reserves are regulated by some restrictions for their distribution.
Revaluation reserves
The balance of “Revaluation reserves” arose as a result of the revaluation made pursuant to Royal Decree-Law 7/1996 dated June 7 and may be used, free of tax, to offset any losses incurred in the future and to increase capital. Also it may be allocated to unrestricted reserves, provided that the capital gain has been realized.
The capital gain will be deemed to have been realized in respect of the portion on which the depreciation has been recorded for accounting purposes or when the revalued assets have been transferred or derecognized. In this respect, an amount of 7 million euros was reclassified to “Retained earnings" in 2013 (10 million euros in 2012 and 15 million euros in 2011), corresponding to revaluation reserves subsequently considered unrestricted. At December, 31 2013, this reserve amounts 109 million euros.
Reserve for cancelled share capital
In accordance with Section 335.c) of the Corporate Enterprises Act and to render null and void the right of opposition provided for in Section 334 of the same Act, whenever the Company decreases capital it records a reserve for cancelled share capital for an amount equal to the par value of the cancelled shares, which can only be used if the same
requirements as those applicable to the reduction of share capital are met. In 2012, a reserve for cancelled share capital amounting to 84 million euros was recorded, the same amount as the capital reduction made in the year. The cumulative amount of the reserve for cancelled share capital at December 31, 2013 and 2012 was 582 million euros.
f) Translation differences
The breakdown of the accumulated contribution of translation differences at December 31 is as follows:
|
2013
|
2012
|
2011
|
||||
|
Telefónica Latin America
|
(7,152)
|
(2,116)
|
(558)
|
|||
|
Telefónica Europe
|
(2,144)
|
(1,666)
|
(1,973)
|
|||
|
Other adjustments and intra-group eliminations
|
21
|
153
|
368
|
|||
|
Total Telefónica Group
|
(9,275)
|
(3,629)
|
(2,163)
|
|||
The translation differences movement in 2013 is mainly due to the depreciation of the Latin American currencies, mainly the Brazilian real whose impact amounts to 3,292 million euros.
g) Treasury share instruments
At December 31, 2013, 2012 and 2011, Telefónica Group companies held the following shares in the Telefónica, S.A. parent company:
|
Euros per share
|
||||||||||
|
Number of shares
|
Acquisition price
|
Trading price
|
Market value*
|
%
|
||||||
|
Treasury shares at 12/31/13
|
29,411,832
|
11.69
|
11.84
|
348
|
0.64627%
|
|||||
|
Treasury shares at 12/31/12
|
47,847,810
|
10.57
|
10.19
|
488
|
1.05136%
|
|||||
|
Treasury shares at 12/31/11
|
84,209,364
|
15.68
|
13.39
|
1,127
|
1.84508%
|
|||||
|
(*) Millions of euros
|
||||||||||
Telefónica, S.A. directly owns all treasury shares in the Group at December 31, 2013.
In 2013, 2012 and 2011 the following transactions involving treasury shares were carried out:
|
Number of shares
|
|
|
Treasury shares at 12/31/10
|
55,204,942
|
|
Acquisitions
|
55,979,952
|
|
Disposals
|
(24,075,341)
|
|
Employee share option plan
|
(2,900,189)
|
|
Treasury shares at 12/31/11
|
84,209,364
|
|
Acquisitions
|
126,489,372
|
|
Disposals
|
(76,569,957)
|
|
Employee share option plan
|
(2,071,606)
|
|
Capital reduction
|
(84,209,363)
|
|
Treasury shares at 12/31/12
|
47,847,810
|
|
Acquisitions
|
113,154,549
|
|
Disposals
|
(131,590,527)
|
|
Treasury shares at 12/31/13
|
29,411,832
|
The amount paid to acquire treasury shares in 2013 was 1,216 million euros (1,346 million euros and 822 million euros in 2012 and 2011, respectively).
Treasury shares disposed of in 2013, 2012 and 2011 amounted to 1,423 million euros, 801 million euros and 445 million euros, respectively. The main sales of treasury shares in 2013 are as follows:
|
·
|
An agreement was reached with qualified and professional investors on March 26, 2013, whereby the Company disposed of all the treasury shares it held (90,067,896 shares) at a price of 10.80 euros per share.
|
|
·
|
On September 24, 2013 Telefónica, S.A. acquired from the remaining shareholders of Telco, S.p.A. 23.8% of the non-convertible bonds issued by Telco, S.p.A. (Note 13.a). The payment of this transaction consisted of the transmission of 39,021,411 treasury shares of the Company.
|
On May 25, 2012, pursuant to the resolutions adopted in the General Shareholders’ Meeting of May 14, 2012, capital was reduced by redeeming 84,209,363 treasury shares, thereby reducing this caption by 1,321 million euros.
In November 2012, Telefónica submitted an offer to purchase and cancel the preference shares that it had indirectly issued in 2002 through its subsidiary Telefónica Finance USA, LLC totaling 2,000 million euros. The offer involved acquiring these shares at their par value, subject unconditionally and irrevocably to the simultaneous reinvestment in Telefónica, S.A. shares and the subscription of newly issued plain-vanilla bonds, in the following percentage:
|
a)
|
40% of the amount in treasury shares of Telefónica, S.A.
|
|
b)
|
60%
of the amount shall be used to subscribe a bond issue with a face value of 600 euros, issued at par.
|
97% of the holders of the preference shares accepted the offer, and therefore 76,365,929 treasury shares with a carrying amount of 815 million euros (exchange value of 776 million euros) were handed over, which are included under “Disposals” in 2012.
In addition to these disposals, on July 27, 2012, 2,071,606 shares were delivered to Group employees when the first phase of the Global Employee Share Plan (“the GESP”) matured. The second phase of the GESP started in December 2012.
At December 31, 2013, Telefónica held 134 million call options on treasury shares subject to physical delivery at a fixed price (178 and 190 million options on treasury shares at December 31, 2012 and 2011, respectively), which are presented as a reduction in equity under the caption “Treasury shares”. They are valued at the amount of premium paid, and upon maturity if the call options are exercised the premium is reclassified as treasury shares together with the price paid. If they are not exercised upon maturity their value is recognized directly in equity.
The Company also has a derivative financial instrument on 30 million Telefónica shares, subject to net settlement, recognized under “Current interest-bearing debt” of the accompanying consolidated statement of financial position (derivative over 28 million shares in 2012 recognized under “Current financial assets”; and derivative over 26 million shares in 2011 recognized under “Current interest-bearing debt”).
h) Equity attributable to non-controlling interests
“Equity attributable to non-controlling interests” represents the share of non-controlling interests in the equity and income or loss for the year of fully consolidated Group companies. The movements in this heading of the 2013, 2012 and 2011 consolidated statement of financial position are as follows:
|
Balance at 12/31/12
|
Sales of non-controlling interests and inclusion of companies
|
Profit/(loss) for the year
|
Change in translation differences
|
Acquisitions of non-controlling interests and exclusion of companies
|
Dividends paid
|
Other movements
|
Balance at 12/31/13
|
|||||||||
|
Telefónica Czech Republic, a.s.
|
813
|
−
|
63
|
(64)
|
(46)
|
(100)
|
−
|
666
|
||||||||
|
Telefónica Brasil, S.A.
|
4,373
|
−
|
335
|
(694)
|
−
|
(522)
|
(1)
|
3,491
|
||||||||
|
Telefónica Deutschland Holding, A.G.
|
2,084
|
−
|
(1)
|
(1)
|
−
|
(117)
|
(3)
|
1,962
|
||||||||
|
Colombia Telecomunicaciones, S.A., ESP
|
(139)
|
−
|
(37)
|
21
|
−
|
−
|
(10)
|
(165)
|
||||||||
|
Telefónica Centroamericana Inversiones, S.L.
|
−
|
283
|
11
|
(12)
|
−
|
−
|
1
|
283
|
||||||||
|
Other
|
69
|
1
|
5
|
(13)
|
−
|
−
|
(2)
|
60
|
||||||||
|
Total
|
7,200
|
284
|
376
|
(763)
|
(46)
|
(739)
|
(15)
|
6,297
|
||||||||
|
Millions of euros
|
Balance at 12/31/11
|
Sales of non-controlling interests and inclusion of companies
|
Profit/(loss) for the year
|
Change in translation differences
|
Acquisitions of non-controlling interests and exclusion of companies
|
Dividends paid
|
Other movements
|
Balance at 12/31/12
|
||||||||
|
Telefónica Czech Republic, a.s.
|
940
|
−
|
66
|
27
|
(113)
|
(107)
|
−
|
813
|
||||||||
|
Telefónica Brasil, S.A.
|
4,745
|
−
|
454
|
(478)
|
(12)
|
(331)
|
(5)
|
4,373
|
||||||||
|
Telefónica Deutschland Holding, A.G.
|
−
|
2,043
|
41
|
−
|
−
|
−
|
−
|
2,084
|
||||||||
|
Colombia Telecomunicaciones, S.A., ESP
|
−
|
−
|
(93)
|
(138)
|
(116)
|
−
|
208
|
(139)
|
||||||||
|
Other
|
62
|
−
|
7
|
5
|
(2)
|
(4)
|
1
|
69
|
||||||||
|
Total
|
5,747
|
2,043
|
475
|
(584)
|
(243)
|
(442)
|
204
|
7,200
|
||||||||
|
Balance at 12/31/10
|
Sales of non-controlling interests and inclusion of companies
|
Profit/(loss) for the year
|
Change in translation differences
|
Acquisitions of non-controlling interests and exclusion of companies
|
Dividends paid
|
Other movements
|
Balance at 12/31/11
|
|||||||||
|
Telefónica Czech Republic, a.s.
|
1,033
|
−
|
95
|
(25)
|
−
|
(161)
|
(2)
|
940
|
||||||||
|
Telefónica Brasil, S.A.
|
6,136
|
−
|
864
|
(345)
|
(539)
|
(710)
|
(661)
|
4,745
|
||||||||
|
Colombia Telecomunicaciones, S.A., ESP
|
−
|
−
|
(175)
|
−
|
−
|
−
|
175
|
−
|
||||||||
|
Other
|
63
|
−
|
−
|
2
|
−
|
(5)
|
2
|
62
|
||||||||
|
Total
|
7,232
|
−
|
784
|
(368)
|
(539)
|
(876)
|
(486)
|
5,747
|
||||||||
Revenues, OIBDA and capital expenditures for the main companies of the Telefónica Group with non-controlling interests are as follows:
|
Millions of euros
|
|||||||||||
|
Telefónica Brasil
|
2013
|
2012
|
2011
|
||||||||
|
Revenues
|
12,217 | 13,618 | 14,326 | ||||||||
|
OIBDA
|
3,940 | 5,161 | 5,302 | ||||||||
|
Capital expenditure
|
2,127 | 2,444 | 2,468 | ||||||||
|
Millions of euros
|
|||||||||||
|
Telefónica Germany
(1)
|
2013
|
2012
|
2011
|
||||||||
|
Revenues
|
4,914 | 5,213 | 5,035 | ||||||||
|
OIBDA
|
1,308 | 1,351 | 1,219 | ||||||||
|
Capital expenditure
|
666 | 609 | 558 | ||||||||
(1)
Telefónica Germany is the operating company of the Telefónica Group in Germany, subsidiary of Telefónica Deutschland Holding, A.G. (Appendix VI).
The main items of the statement of financial position of these companies are as follows:
|
Millions of euros
|
|||||||
|
Telefónica Brasil
|
12/31/2013
|
12/31/2012
|
|||||
|
Non-current assets
|
16,592 | 20,044 | |||||
|
Current assets
|
4,933 | 6,012 | |||||
|
Non-current liabilities
|
3,986 | 4,463 | |||||
|
Current liabilities
|
4,262 | 5,021 | |||||
|
Millions of euros
|
|||||||
|
Telefónica Germany
|
12/31/2013
|
12/31/2012
|
|||||
|
Non-current assets
|
7,168 | 7,652 | |||||
|
Current assets
|
1,854 | 1,417 | |||||
|
Non-current liabilities
|
1,452 | 1,092 | |||||
|
Current liabilities
|
1,571 | 1,548 | |||||
2013
In 2013, “Disposal of investments and inclusion of companies” reflects the effect of the sale of 40% of the investment through Telefónica Centroamérica Inversiones, S.L. in Guatemala, El Salvador, Nicaragua and Panama, with an impact of 283 million euros (see Note 2).
2012
In 2012, “Disposal of investments and inclusion of companies” reflects the effect of the public offering of shares in Telefónica Deutschland Holding, A.G. This share offering, which totaled 23.17% of capital, entailed non-controlling interests of 2,043 million euros. The heading also includes the impact of the corporate reorganization agreement in the fixed and mobile businesses in Colombia, with an impact of 116 million euros (see Note 2).
2011
The movement in 2011 includes the exchange of Telesp shares for Vivo Participações shares, which resulted in a net decrease of 661 million euros, included under “Other movements” (see Note 5).
“Acquisitions of non-controlling interests and exclusion of companies” includes the impact of the tender offer for the voting shares of Vivo Participaçoes, S.A. held by non-controlling interests representing, approximately, 3.8% of its capital stock. After its execution, Telefónica acquired an additional 2.7% of the Brazilian company’s capital stock for 539 million euros.
“Other movements” includes the impact of the agreement signed with the holders of non-controlling interests in Colombia Telecomunicaciones, S.A., ESP.
1.- Financial assets
The breakdown of financial assets of the Telefónica Group at December 31, 2013 and 2012 is as follows:
|
Fair value through profit or loss
|
Measurement hierarchy
|
||||||||||||||||||||||||||||||||||||||||||
|
Millions of euros
|
Held for trading
|
Fair value option
|
Available-for-sale
|
Hedges
|
Level 1 (Quoted prices)
|
Level 2 (Other directly observable market inputs)
|
Level 3 (Inputs not based on observable market data)
|
Held-to-maturity investments
|
Rest of financial assets at amortized cost
|
Total carrying amount
|
Total fair value
|
||||||||||||||||||||||||||||||||
|
Non-current financial assets
|
1,462 | 356 | 1,101 | 1,205 | 746 | 3,378 | − | 36 | 3,615 | 7,775 | 7,775 | ||||||||||||||||||||||||||||||||
|
Investments
|
− | − | 550 | − | 433 | 117 | − | − | − | 550 | 550 | ||||||||||||||||||||||||||||||||
|
Long-term credits
|
− | 356 | 551 | − | 171 | 736 | − | 7 | 2,562 | 3,476 | 3,127 | ||||||||||||||||||||||||||||||||
|
Deposits and guarantees
|
− | − | − | − | − | − | − | 29 | 1,403 | 1,432 | 1,431 | ||||||||||||||||||||||||||||||||
|
Derivative instruments
|
1,462 | − | − | 1,205 | 142 | 2,525 | − | − | − | 2,667 | 2,667 | ||||||||||||||||||||||||||||||||
|
Impairment losses
|
− | − | − | − | − | − | − | − | (350) | (350) | − | ||||||||||||||||||||||||||||||||
|
Current financial assets
|
548 | 146 | 54 | 125 | 327 | 546 | − | 727 | 10,494 | 12,094 | 12,094 | ||||||||||||||||||||||||||||||||
|
Financial investments
|
548 | 146 | 54 | 125 | 327 | 546 | − | 727 | 517 | 2,117 | 2,117 | ||||||||||||||||||||||||||||||||
|
Cash and cash equivalents
|
− | − | − | − | − | − | − | − | 9,977 | 9,977 | 9,977 | ||||||||||||||||||||||||||||||||
|
Total financial assets
|
2,010 | 502 | 1,155 | 1,330 | 1,073 | 3,924 | − | 763 | 14,109 | 19,869 | 19,869 | ||||||||||||||||||||||||||||||||
|
Fair value through profit or loss
|
Measurement hierarchy
|
||||||||||||||||||||||||||||||||||||||||||
|
Millions of euros
|
Held for trading
|
Fair value option
|
Available-for-sale
|
Hedges
|
Level 1 (Quoted prices)
|
Level 2 (Other directly observable market inputs)
|
Level 3 (Inputs not based on observable market data)
|
Held-to-maturity investments
|
Rest of financial assets at amortized cost
|
Total carrying amount
|
Total fair value
|
||||||||||||||||||||||||||||||||
|
Non-current financial assets
|
2,072 | 424 | 1,093 | 2,145 | 791 | 4,943 | − | 164 | 3,441 | 9,339 | 8,961 | ||||||||||||||||||||||||||||||||
|
Investments
|
− | − | 586 | − | 498 | 79 | 9 | − | − | 586 | 586 | ||||||||||||||||||||||||||||||||
|
Long-term credits
|
− | 424 | 516 | 4 | 231 | 713 | − | 68 | 1,928 | 2,940 | 2,468 | ||||||||||||||||||||||||||||||||
|
Deposits and guarantees
|
− | − | − | − | − | − | − | 96 | 1,890 | 1,986 | 1,694 | ||||||||||||||||||||||||||||||||
|
Derivative instruments
|
2,072 | − | − | 2,141 | 62 | 4,151 | − | − | − | 4,213 | 4,213 | ||||||||||||||||||||||||||||||||
|
Impairment losses
|
− | − | (9) | − | − | − | (9) | − | (377) | (386) | − | ||||||||||||||||||||||||||||||||
|
Current financial assets
|
462 | 133 | 61 | 89 | 313 | 415 | 17 | 720 | 10,254 | 11,719 | 11,647 | ||||||||||||||||||||||||||||||||
|
Financial investments
|
462 | 133 | 61 | 89 | 313 | 415 | 17 | 720 | 407 | 1,872 | 1,800 | ||||||||||||||||||||||||||||||||
|
Cash and cash equivalents
|
− | − | − | − | − | − | − | − | 9,847 | 9,847 | 9,847 | ||||||||||||||||||||||||||||||||
|
Total financial assets
|
2,534 | 557 | 1,154 | 2,234 | 1,104 | 5,358 | 17 | 884 | 13,695 | 21,058 | 20,608 | ||||||||||||||||||||||||||||||||
The calculation of the fair values of the Telefónica Group’s debt instruments required an estimate, for each currency and counterparty, of a credit spread curve using the prices of the Group’s bonds and credit derivatives.
Derivatives are measured using the valuation techniques and models normally used in the market, based on money-market curves and volatility prices available in the market.
|
|
a) Non-current financial assets
|
The movement in items composing “Non-current financial assets” in 2013 and 2012 is as follows:
|
Investments
|
Long-term credits
|
Deposits and guarantees
|
Derivative financial assets
|
Impairment losses
|
Total
|
|||||||
|
Balance at 12/31/11
|
680
|
2,228
|
1,875
|
4,294
|
(399)
|
8,678
|
||||||
|
Acquisitions
|
91
|
982
|
454
|
395
|
12
|
1,934
|
||||||
|
Disposals
|
(139)
|
(667)
|
(185)
|
(24)
|
−
|
(1,015)
|
||||||
|
Exclusion of companies
|
−
|
70
|
(38)
|
−
|
4
|
36
|
||||||
|
Translation differences
|
2
|
(33)
|
(173)
|
39
|
(4)
|
(169)
|
||||||
|
Fair value adjustments
|
(48)
|
6
|
17
|
(172)
|
1
|
(196)
|
||||||
|
Transfers
|
−
|
354
|
36
|
(319)
|
−
|
71
|
||||||
|
Balance at 12/31/12
|
586
|
2,940
|
1,986
|
4,213
|
(386)
|
9,339
|
||||||
|
Acquisitions
|
10
|
1,269
|
158
|
188
|
(4)
|
1,621
|
||||||
|
Disposals
|
(106)
|
(462)
|
(61)
|
−
|
1
|
(628)
|
||||||
|
Translation differences
|
(12)
|
(111)
|
(285)
|
73
|
29
|
(306)
|
||||||
|
Fair value adjustments
|
80
|
(85)
|
38
|
(1,459)
|
−
|
(1,426)
|
||||||
|
Transfers
|
(8)
|
(75)
|
(404)
|
(348)
|
10
|
(825)
|
||||||
|
Balance at 12/31/13
|
550
|
3,476
|
1,432
|
2,667
|
(350)
|
7,775
|
||||||
“Investments” includes the fair value of investments in companies where Telefónica does not exercise significant control and for which there is no specific disposal plan for the short term (see Note 3.i).
Among these is the Telefónica Group’s shareholding in Banco Bilbao Vizcaya Argentaria, S.A. (BBVA) of 383 million euros (317 million euros at December 31, 2012), representing 0.76% of its share capital at December 31, 2013.
Disposals in 2013 mainly include the full divestment of the stakes in Portugal Telecom.
At year-end the Group assessed the securities in its portfolio of listed available-for-sale assets individually for impairment. The analysis did not uncover the need to recognize any significant impairment losses.
“Long-term credits” includes the investment of the net level premium reserves of the Group’s insurance companies, primarily in fixed-income securities, amounting to 929 million euros and 1,055 million euros at December 31, 2013 and 2012, respectively, and long-term prepayments of 153 million euros and 154 million euros at December 31, 2013 and 2012, respectively.
In 2012, Telco, S.p.A. shareholders signed an agreement to refinance the company involving a 1,750 million-euro bond issue, subscribed by the shareholders as per their percentage shareholdings, and a capital increase of 600 million euros. For Telefónica, this agreement involved the subscription of a bond valued at 208 million euros (further to the existing bond of 600 million euros) and a contribution of capital amounting to 277 million euros (see Note 9).
In 2013, Telefónica acquired 23.8% of the non-convertible bonds of Telco, S.p.A. from this company’s other shareholders, through the transfer of 39,021,411 treasury shares (see Note 12.g). This transaction is recognized under “Long-term credits” for 417 million euros. At December 31, 2013, Telefónica, S.A. had subscribed Telco, S.p.A. bonds totaling 1,225 million euros (808 million euros at December 31, 2012).
Additionally, “Acquisitions” in 2013 included a bond convertible into Telecom Italia, S.p.A. shares, amounting 103 million euros.
b) Current financial assets
This heading includes the following items:
|
·
|
Short-term investments in financial instruments recognized at fair value to cover commitments undertaken by the Group’s insurance companies, amounting to 430 million euros at December 31, 2013 (391 million euros at December 31, 2012).
|
|
·
|
Derivative financial assets with a short-term maturity or not used to hedge non-current items in the consolidated statement of financial position, which amounted to 412 million euros in 2013 (316 million euros in 2012).
|
|
·
|
Short-term deposits and guarantees amounting to 175 million euros at December 31, 2013 (95 million euros at December 31, 2012).
|
|
·
|
Current investments of cash surpluses which, given their characteristics, have not been classified as “Cash and cash equivalents.”
|
Current financial assets that are highly liquid and have maturity periods of three months or less from the date contracted , and present an insignificant risk of value changes, are recorded under “Cash and cash equivalents” on the accompanying consolidated statement of financial position.
2.- Financial liabilities
The breakdown of financial liabilities at December 31, 2013 and the corresponding maturities schedule is as follows:
|
Current
|
Non-current
|
|||||||||||||||
|
Maturity
|
2014 (*)
|
2015
|
2016
|
2017
|
2018
|
Subsequent years
|
Non-current total
|
Total
|
||||||||
|
Debentures and bonds
|
6,053
|
3,380
|
6,223
|
4,705
|
4,610
|
17,109
|
36,027
|
42,080
|
||||||||
|
Promissory notes & commercial paper
|
1,279
|
−
|
−
|
−
|
−
|
−
|
−
|
1,279
|
||||||||
|
Other marketable debt securities
|
−
|
−
|
−
|
−
|
−
|
59
|
59
|
59
|
||||||||
|
Total Issues
|
7,332
|
3,380
|
6,223
|
4,705
|
4,610
|
17,168
|
36,086
|
43,418
|
||||||||
|
Loans and other payables
|
2,055
|
3,194
|
3,041
|
1,979
|
1,629
|
2,437
|
12,280
|
14,335
|
||||||||
|
Other financial liabilities (Note 16)
|
140
|
228
|
301
|
251
|
573
|
1,453
|
2,806
|
2,946
|
||||||||
|
TOTAL
|
9,527
|
6,802
|
9,565
|
6,935
|
6,812
|
21,058
|
51,172
|
60,699
|
||||||||
|
(*) Debentures and bonds 2014 maturities include 582 million euros of notes with an option of early repayment and no contractual obligation to be repaid.
|
||||||||||||||||
The estimate of future payments for interest on these financial liabilities at December 31, 2013, is as follows: 2,296 million euros in 2014, 2,079 million euros in 2015, 1,865 million euros in 2016, 1,565 million euros in 2017, 1,232 million euros in 2018 and 7,534 million euros in years after 2018. For floating rate financing, the Group mainly estimates future interest using the forward curve of the various currencies at December 31, 2013.
The amounts shown in this table take into account the fair value of derivatives classified as financial liabilities (i.e., those with a negative mark-to-market) and exclude the fair value of derivatives classified as current financial assets, for 412 million euros, and those classified as non-current, for 2,667 million euros (i.e., those with a positive mark-to-market).
The composition of these financial liabilities, by category, at December 31, 2013 and 2012 is as follows:
|
Fair value through profit or loss
|
Measurement hierarchy
|
||||||||||||||||||||||||||||||||||
|
Millions of euros
|
Held for trading
|
Fair value option
|
Hedges
|
Level 1 (Quoted prices)
|
Level 2 (Other directly observable market inputs)
|
Level 3 (Inputs not based on observable market data)
|
Liabilities at amortized cost
|
Total carrying amount
|
Total fair value
|
||||||||||||||||||||||||||
|
Issues
|
− | − | − | − | − | − | 43,418 | 43,418 | 46,120 | ||||||||||||||||||||||||||
|
Loans and other payables
|
1,315 | − | 1,631 | 111 | 2,835 | − | 14,335 | 17,281 | 17,401 | ||||||||||||||||||||||||||
|
Total financial liabilities
|
1,315 | − | 1,631 | 111 | 2,835 | − | 57,753 | 60,699 | 63,521 | ||||||||||||||||||||||||||
|
Fair value through profit or loss
|
Measurement hierarchy
|
||||||||||||||||||||||||||||||||||
|
Millions of euros
|
Held for trading
|
Fair value option
|
Hedges
|
Level 1 (Quoted prices)
|
Level 2 (Other directly observable market inputs)
|
Level 3 (Inputs not based on observable market data)
|
Liabilities at amortized cost
|
Total carrying amount
|
Total fair value
|
||||||||||||||||||||||||||
|
Issues
|
− | − | − | − | − | − | 45,329 | 45,329 | 49,956 | ||||||||||||||||||||||||||
|
Loans and other payables
|
1,774 | − | 1,615 | 113 | 3,276 | − | 18,135 | 21,524 | 21,874 | ||||||||||||||||||||||||||
|
Total financial liabilities
|
1,774 | − | 1,615 | 113 | 3,276 | − | 63,464 | 66,853 | 71,830 | ||||||||||||||||||||||||||
The calculation of the fair values of the Telefónica Group’s debt instruments required an estimate, for each currency and subsidiary, of the credit spread curve using the prices of the Group’s bonds and credit derivatives.
At December 31, 2013, some of the financing arranged by Telefónica Group companies in Latin America (Brazil, Colombia and Chile), which amount to approximately 5% of the Telefónica Group’s gross debt was subject to compliance with certain financial covenants. To date, these covenants are being met. Due to the absence of cross-defaults, breach of the covenants would not affect the debt at a Telefónica, S.A. level.
Part of the amount owed by the Telefónica Group includes restatements to amortized cost at December 31, 2013 and 2012 as a result of fair value interest rate and exchange rate hedges.
a) Issues
The movement in issues of debentures, bonds and other marketable debt securities in 2013 and 2012 is as follows:
|
Debenture issues
|
Short-term promissory notes and commercial paper
|
Other non-Current Marketable debt securities
|
Total
|
|||||
|
Balance at 12/31/11
|
38,421
|
1,833
|
1,985
|
42,239
|
||||
|
New issues
|
8,090
|
284
|
−
|
8,374
|
||||
|
Redemptions, conversions and exchanges
|
(2,376)
|
(996)
|
(1,941)
|
(5,313)
|
||||
|
Revaluation and other movements
|
7
|
7
|
15
|
29
|
||||
|
Balance at 12/31/12
|
44,142
|
1,128
|
59
|
45,329
|
||||
|
New issues
|
5,634
|
195
|
−
|
5,829
|
||||
|
Redemptions, conversions and exchanges
|
(5,667)
|
(45)
|
−
|
(5,712)
|
||||
|
Revaluation and other movements
|
(2,029)
|
1
|
−
|
(2,028)
|
||||
|
Balance at 12/31/13
|
42,080
|
1,279
|
59
|
43,418
|
||||
Bonds
At December 31, 2013, the nominal amount of outstanding debentures and bonds issues was 41,036 million euros (42,411 million euros at December, 31, 2012). Appendix III presents the characteristics of all outstanding debentures and bond issues at year-end 2013, as well as the significant issues made in the year.
During 2013, Telefónica, S.A. has repurchased bonds issued by Telefónica Emisiones, S.A.U. and Telefónica Europe, B.V. up to 98 million euros (353 million euros accumulated at the end of 2013).
Telefónica, S.A. has a full and unconditional guarantee on issues made by Telefónica Emisiones, S.A.U., Telefónica Finanzas México, S.A. de C.V. and Telefónica Europe, B.V., all of which are, directly or indirectly, wholly-owned subsidiaries of Telefónica, S.A.
Short-term promissory notes and commercial paper
The main programs for issuance of promissory notes and commercial paper are the following:
|
·
|
At December 31, 2013, Telefónica Europe, B.V., had a program for issuance of commercial paper, guaranteed by Telefónica, S.A., for up to 3,000 million euros. The outstanding balance of commercial paper issued under this program at December 31, 2013, was 920 million euros, issued at an average interest rate of 0.42% for 2013 (768 million issued in 2012 at an average rate of 0.78%).
|
|
·
|
At December 31, 2013, Telefónica, S.A. had a corporate promissory note program for 500 million euros, which can be increased to 2,000 million euros, with an outstanding balance at that date of 359 million euros (331 million euros at December 31, 2012).
|
On October 31, 2012, an offer to purchase the preferred securities of Telefónica Finance USA, LLC. was launched. Holders accepting such offer would receive, concurrently and in connection with, Telefónica’s ordinary shares and they would subscribe new debt securities of Telefónica. As a result of this offer, on November 29, 2012, the Group purchased 1,941,235 preferred securities (representing 97.06% of total). The remaining 58,765 preferred securities are reflected in this caption (at December 31, 2013, the outstanding balance was 59 million euros). The securities accrue interest at Euribor at 3 months, plus a 4% spread (effective annual rate) payable quarterly.
b) Interest-bearing debt
The average interest rate on outstanding loans and other payables at December 31, 2013, was 3.43% (4.04% in 2012). This percentage does not include the impact of hedges arranged by the Group.
The main financing transactions included under “Interest-bearing debt” outstanding at December 31, 2013 and 2012 and their nominal amounts are provided in Appendix V.
Interest-bearing debt arranged or repaid in 2013 mainly includes the following:
|
·
|
On February 22, 2013, Telefónica, S.A. refinanced 1,400 million euros of tranche A2 (originally amounting to 2,000 million euros and scheduled to mature on July 28, 2014) of an 8,000 million euros syndicated loan, originally dated on July 28, 2010. This refinancing was divided in two tranches: a syndicated credit facility amounting to 700 million euros maturing in 2017 (tranche A2A) and another syndicated credit facility amounting to 700 million euros maturing in 2018 (tranche A2B). Both tranches will be available from July 28, 2014.
|
|
·
|
On February 22, 2013, Telefónica, S.A. signed a financing agreement for 1,001 million US dollars (approximately 726 million euros) with an outstanding balance at December 31, 2013, amounted to 463 million US dollars (approximately 336 million euros) which matures on 2023.
|
|
·
|
On July 28, 2013, tranche A1 of Telefónica, S.A. syndicated loan agreement arranged on July 28, 2010, fell due. At December 31, 2012, the outstanding balance was 1,000 million euros and was repaid during 2013.
|
|
·
|
On August 1, 2013, Telefónica, S.A. entered into a long-term credit facility for an aggregate amount of 734 million US dollars (approximately 532 million euros) at a fixed rate with the guarantee of the Finnish Export Credits Guarantee Board (Finnvera) which matures in 2023. No amounts had been drawn down on this credit facility at December 31, 2013.
|
|
·
|
On August 26, 2013, Telefónica Brasil, S.A. canceled 879 million Brazilian reais (approximately 272 million euros) of the loan signed with BNDES on September 20, 2011 with an outstanding balance at December 31, 2013, amounted to 2,060 million Brazilian reais (approximately 638 million euros).
|
|
·
|
On December 13, 2013, the Tranche E of the syndicated loan facility arranged by Telefónica Europe, B.V. on October 31, 2005 matured as scheduled. The outstanding balance upon maturity was 100 million pounds sterling (approximately 120 million euros). On the same date, there was a merge of the following syndicated loan facilities: i) Tranche E1 for 756 million euros available as from March 2, 2012, and maturing on March 2, 2017; and ii) Tranche E2 for 1,469 million pounds sterling (this syndicated loan facility was redenominated into euros on December 13, 2013) available as from December 13, 2013 and maturing on March 2, 2017. As a result, there is a new tranche E2 for 2,523 million euros. At December 31, 2013, the outstanding balance of this new tranche was 100 million pounds sterling (approximately 120 million euros).
|
During 2013, Telefónica, S.A. has reduced the principal amount outstanding under tranche B of its 8,000 million euros syndicated credit facility dated July 28, 2010, by 3,000 million euros. At December 31, 2013, this tranche B was fully available.
During 2013, Telefónica Europe, B.V. drew down an aggregate principal amount of 844 million US dollars (approximately 612 million euros) of the financing agreement signed on August 28, 2012, with the China Development Bank (CDB) and Industrial and Commercial Bank of China (IDBC) for 1,200 million US dollars. At December 31, 2013, the outstanding nominal principal on this financing agreement was 844 million US dollars (approximately 612 million euros).
At December 31, 2013, the Telefónica Group had total unused credit facilities from various sources amounting to approximately 13,197 million euros (approximately 11,597 million euros at December 31, 2012).
Loans by currency
The breakdown of “Loans and other payables” by currency at December 31, 2013 and 2012, along with the equivalent value of foreign-currency loans in euros, is as follows:
|
Outstanding balance (in millions)
|
|||||||||||||||
|
Currency
|
Euros
|
||||||||||||||
|
Currency
|
12/31/13
|
12/31/12
|
12/31/13
|
12/31/12
|
|||||||||||
|
Euro
|
7,918 | 11,681 | 7,918 | 11,681 | |||||||||||
|
US dollar
|
3,622 | 2,432 | 2,626 | 1,843 | |||||||||||
|
Brazilian Real
|
3,667 | 3,524 | 1,135 | 1,307 | |||||||||||
|
Colombian Peso
|
5,377,545 | 5,736,856 | 2,024 | 2,459 | |||||||||||
|
Pounds Sterling
|
189 | 172 | 227 | 211 | |||||||||||
|
Other currencies
|
405 | 634 | |||||||||||||
|
Total Group
|
14,335 | 18,135 | |||||||||||||
The composition of “Trade and other payables” is as follows:
|
12/31/2013
|
12/31/2012
|
||||||||||||||
|
Non-current
|
Current
|
Non-current
|
Current
|
||||||||||||
|
Trade payables
|
− | 8,144 | − | 8,719 | |||||||||||
|
Other payables
|
1,324 | 5,146 | 1,749 | 6,319 | |||||||||||
|
Deferred revenue
|
377 | 1,353 | 392 | 1,540 | |||||||||||
|
Payable to associates and joint ventures
|
− | 578 | − | 511 | |||||||||||
|
Total
|
1,701 | 15,221 | 2,141 | 17,089 | |||||||||||
“Deferred revenue” principally includes the amount of deferred revenue from sales of prepaid cards, from handsets transferred to the distributor and activation fees not yet recognized in the income statement.
At December 31, 2013, non-current “Other payables” mainly comprise the deferred portion of the payment for acquiring, the spectrum use license in Mexico in 2010, for an equivalent of 856 million euros (911 million euros at December 31, 2012).
The detail of current “Other payables” at December 31, 2013 and 2012 is as follows:
|
Balance at 12/31/2013
|
Balance at 12/31/2012
|
||||||
|
Dividends payable by Group companies
|
228 | 183 | |||||
|
Payables to suppliers of property, plant and equipment
|
3,248 | 3,994 | |||||
|
Accrued employee benefits
|
745 | 719 | |||||
|
Advances received on orders
|
126 | 72 | |||||
|
Other non-financial non-trade payables
|
799 | 1,351 | |||||
|
Total
|
5,146 | 6,319 | |||||
Information on deferred payments to suppliers of Spanish companies (Third additional provision, "Information requirement" of Law 15/2010 of July 5)
The Telefónica Group’s Spanish companies have adapted their internal processes and payment schedules to the provisions of Law 15/2010, establishing measures against late payment in commercial transactions. Engagement conditions with commercial suppliers in 2013 included payment periods of up to 60 days (75 days in 2012), as established in said law.
For efficiency purposes and in line with general business practice, the Telefónica Group’s companies in Spain have defined payment schedules with suppliers, whereby payments are made on set days. For the main companies, payments are made three times a month. Invoices falling due between two payment days are settled on the following payment date in the schedule.
Payments to Spanish suppliers in 2013 and 2012 surpassing the established legal limit were the result of circumstances or incidents beyond the payment policies, mainly the closing of agreements with suppliers over the delivery of goods or the rendering of services, or occasional processing issues.
Information of payments to commercial suppliers that exceed the maximum period established in Law 15/2010 is as follows:
|
2013
|
2012
|
||||||||||||||
|
Millions of euros
|
Amount
|
%
|
Amount
|
%
|
|||||||||||
|
Payments within allowable period
|
5,897 | 94.0 | 7,633 | 95.1 | |||||||||||
|
Other
|
375 | 6.0 | 395 | 4.9 | |||||||||||
|
Total payments to commercial suppliers
|
6,272 | 100.0 | 8,028 | 100.0 | |||||||||||
|
Weighted average days past due
|
35 | 35 | |||||||||||||
|
Deferrals at year-end that exceed the limit
(*)
|
17 | 28 | |||||||||||||
(*)
At the date of authorization for issue of these consolidated financial statements, the Group had made the outstanding payments, except in exceptional cases where an agreement with suppliers was being negotiated.
The amounts of provisions in 2013 and 2012 are as follows:
|
12/31/2013
|
12/31/2012
|
||||||||||||||||||||||
|
Millions of euros
|
Current
|
Non-current
|
Total
|
Current
|
Non-current
|
Total
|
|||||||||||||||||
|
Employee benefits:
|
763 | 3,722 | 4,485 | 913 | 4,410 | 5,323 | |||||||||||||||||
|
Termination plans
|
703 | 2,762 | 3,465 | 861 | 3,290 | 4,151 | |||||||||||||||||
|
Post-employment defined benefit plans
|
− | 799 | 799 | − | 894 | 894 | |||||||||||||||||
|
Other benefits
|
60 | 161 | 221 | 52 | 226 | 278 | |||||||||||||||||
|
Other provisions
|
508 | 2,578 | 3,086 | 738 | 2,654 | 3,392 | |||||||||||||||||
|
Total
|
1,271 | 6,300 | 7,571 | 1,651 | 7,064 | 8,715 | |||||||||||||||||
Termination plans
In the last few years, the Telefónica Group carried out early retirement plans in order to adapt its cost structure to the prevailing environment in the markets where it operates, making certain strategic decisions relating to its size and organization.
Concerning the 2003-2007 labor force reduction plan in Telefónica de España, S.A.U., concluded with 13,870 employees taking part, provisions recorded at December 31, 2013 and 2012 amounted to 701 and 1,037 million euros, respectively.
Concerning the 2011-2013 labor force reduction plan in Telefónica de España, S.A.U., concluded with 6,830 employees taking part, provisions recorded at December 31, 2013 and 2012 amounted to 2,366 and 2,614 million euros, respectively. The estimated cost for the program was recognized in 2011, in the amount of 2,671 million euros. This amount was included under “Personnel expenses” in the consolidated income statement.
Furthermore, the Group had recorded provisions totaling 398 million euros (500 million euros at December 31, 2012) for other planned adjustments to the workforce.
The companies bound by these commitments calculated provisions required at 2013 and 2012 year-end using actuarial assumptions pursuant to current legislation, including the PERM/F- 2000 C mortality tables and a variable interest rate based on high quality market yield curves.
The movement in provisions for post-employment plans in 2013 and 2012 is as follows:
|
Total
|
|
|
Provisions for post-employment plans at 12/31/11
|
4,698
|
|
Additions
|
36
|
|
Retirements/amount applied
|
(841)
|
|
Transfers
|
31
|
|
Exclusion of companies
|
(1)
|
|
Translation differences and accretion
|
228
|
|
Provisions for post-employment plans at 12/31/12
|
4,151
|
|
Additions
|
68
|
|
Retirements/amount applied
|
(688)
|
|
Transfers
|
(4)
|
|
Translation differences and accretion
|
(62)
|
|
Provisions for post-employment plans at 12/31/13
|
3,465
|
The discount rate used for these provisions at December 31, 2013, was 1.68%, with an average length of the plans of 3.2 years.
Post-employment defined benefit plans
The Group has a number of defined-benefit plans in the countries where it operates. The following tables present the main data of these plans:
|
Millions of euros
|
Spain
|
UK
|
Brazil
|
Other
|
Total
|
|||||
|
Obligation
|
567
|
1,251
|
211
|
195
|
2,224
|
|||||
|
Assets
|
−
|
(1,236)
|
(146)
|
(97)
|
(1,479)
|
|||||
|
Net provision before asset ceiling
|
567
|
15
|
65
|
98
|
745
|
|||||
|
Asset ceiling
|
−
|
−
|
45
|
3
|
48
|
|||||
|
Net provision
|
567
|
15
|
116
|
101
|
799
|
|||||
|
Net assets
|
−
|
−
|
6
|
−
|
6
|
|||||
|
Millions of euros
|
Spain
|
UK
|
Brazil
|
Other
|
Total
|
|||||
|
Obligation
|
654
|
1,139
|
298
|
166
|
2,257
|
|||||
|
Assets
|
−
|
(1,191)
|
(225)
|
(82)
|
(1,498)
|
|||||
|
Net provision before asset ceiling
|
654
|
(52)
|
73
|
84
|
759
|
|||||
|
Asset ceiling
|
−
|
−
|
54
|
−
|
54
|
|||||
|
Net provision
|
654
|
9
|
145
|
86
|
894
|
|||||
|
Net assets
|
−
|
61
|
18
|
2
|
81
|
|||||
The movement in the present value of obligations in 2013 and 2012 is as follows:
|
Spain
|
UK
|
Brazil
|
Other
|
Total
|
||||||
|
Present value of obligation at 12/31/11
|
654
|
976
|
298
|
73
|
2,001
|
|||||
|
Translation differences
|
−
|
23
|
(31)
|
(1)
|
(9)
|
|||||
|
Current service cost
|
3
|
25
|
4
|
56
|
88
|
|||||
|
Past service cost
|
−
|
3
|
−
|
29
|
32
|
|||||
|
Interest cost
|
15
|
49
|
25
|
6
|
95
|
|||||
|
Actuarial losses and gains
|
37
|
174
|
15
|
23
|
249
|
|||||
|
Benefits paid
|
(55)
|
(18)
|
(13)
|
(16)
|
(102)
|
|||||
|
Plan curtailments
|
−
|
(93)
|
−
|
(4)
|
(97)
|
|||||
|
Present value of obligation at 12/31/12
|
654
|
1,139
|
298
|
166
|
2,257
|
|||||
|
Translation differences
|
−
|
(21)
|
(43)
|
(39)
|
(103)
|
|||||
|
Current service cost
|
2
|
4
|
3
|
47
|
56
|
|||||
|
Past service cost
|
−
|
(4)
|
−
|
−
|
(4)
|
|||||
|
Interest cost
|
12
|
49
|
24
|
9
|
94
|
|||||
|
Actuarial losses and gains
|
(49)
|
106
|
(58)
|
29
|
28
|
|||||
|
Benefits paid
|
(52)
|
(22)
|
(13)
|
(17)
|
(104)
|
|||||
|
Plan curtailments
|
−
|
−
|
−
|
−
|
−
|
|||||
|
Present value of obligation at 12/31/13
|
567
|
1,251
|
211
|
195
|
2,224
|
Movements in the fair value of plan assets in 2013 and 2012 are as follows:
|
UK
|
Brazil
|
Other
|
Total
|
|||||
|
Fair value of plan assets at 12/31/11
|
971
|
235
|
86
|
1,292
|
||||
|
Translation differences
|
23
|
(22)
|
−
|
1
|
||||
|
Expected return on plan assets
|
53
|
25
|
4
|
82
|
||||
|
Actuarial losses and gains
|
81
|
(4)
|
(6)
|
71
|
||||
|
Company contributions
|
81
|
2
|
−
|
83
|
||||
|
Benefits paid
|
(18)
|
(11)
|
(2)
|
(31)
|
||||
|
Fair value of plan assets at 12/31/12
|
1,191
|
225
|
82
|
1,498
|
||||
|
Translation differences
|
(27)
|
(32)
|
−
|
(59)
|
||||
|
Expected return on plan assets
|
54
|
18
|
2
|
74
|
||||
|
Actuarial losses and gains
|
(19)
|
(57)
|
−
|
(76)
|
||||
|
Company contributions
|
59
|
3
|
14
|
76
|
||||
|
Benefits paid
|
(22)
|
(11)
|
(1)
|
(34)
|
||||
|
Fair value of plan assets at 12/31/13
|
1,236
|
146
|
97
|
1,479
|
The Group’s principal defined-benefit plans are:
ITP (Spain)
Telefónica Spain reached an agreement with its employees whereby it recognized supplementary pension payments for employees who had retired as of June 30, 1992, equal to the difference between the pension payable by the social security system and that which would be paid to them by ITP (Institución Telefónica de Previsión). Once the aforementioned supplementary pension payments had been quantified, they became fixed, lifelong and non-updateable and 60% of the payments are transferable to the surviving spouse, recognized as such as of June 30, 1992 and to underage children.
The amount for this provision totaled 334 million euros at December 31, 2013 (395 million euros at December 31, 2012).
Survival (Spain)
Serving employees who did not join the defined pension plan are still entitled to receive survivorship benefits at the age of 65.
The amount for this provision totaled 233 million euros at December 31, 2013 (259 million euros at December 31, 2012).
These plans do not have associated assets that qualify as “plan assets” under IAS 19. The discount rate used for these provisions at December 31, 2013, was 2.68%, with an average length of the plans of 8 years.
The main actuarial assumptions used in valuing these plans are as follows:
|
Survival
|
ITP
|
|||||||
|
12/31/2013
|
12/31/2012
|
12/31/2013
|
12/31/2012
|
|||||
|
Discount rate
|
0.683%-3.286%
|
0.091%-2.297%
|
0.683%-3.286%
|
0.091%-2.297%
|
||||
|
Expected rate of salary increase
|
0.00%
|
2.50%
|
−
|
−
|
||||
|
Mortality tables
|
PERM/F-2000C - OM77
|
PERM/F-2000C - OM77
|
90% PERM 2000C/98% PERF 2000 C
|
90% PERM 2000C/98% PERF 2000 C
|
||||
The table below shows the sensitivity of the value of termination and post-employment obligations of Telefónica Group companies in Spain to changes in the discount rate:
|
+100 bp
|
-100 bp
|
|||||
|
Impact on value
|
Impact on income statement
|
Impact on value
|
Impact on income statement
|
|||
|
169
|
120
|
-148
|
-101
|
|||
|
Variations of less than -100bp are considered for terms of less than five years to prevent negative rates.
|
||||||
A 100bp increase in the discount rate would reduce the value of the liabilities by 169 million euros and have a positive impact on income statement of 120 million euros before tax. However, a 100bp decrease in the discount rate would increase the value of the liabilities by 148 million euros and have a negative impact on income statement of 101 million euros before tax.
The Telefónica Group actively manages this position and has arranged a derivatives portfolio to minimize the impact of changes in the discount rate (see Note 16).
Telefónica UK Pension Plan
The Telefónica UK Pension Plan provides pension benefits to the various companies of the Telefónica Group in UK coming from the O2 Group. The Plan is comprised of defined contribution and defined benefit sections. The defined benefit sections were closed to future accrual with effect from February 28, 2013. The companies continued to provide retirement benefits through the defined contribution sections of the Plan.
The number of beneficiaries of these plans at December 31, 2013 and 2012 are 4,572 and 4,575 respectively. At December 31, 2013, the weighted average duration of the Plan was 23 years.
The main actuarial assumptions used in valuing the Plan are as follows:
|
12/31/2013
|
12/31/2012
|
||
|
Nominal rate of salary increase
|
4.20%
|
4.20%
|
|
|
Nominal rate of pension payment increase
|
3.25%
|
3.10%
|
|
|
Discount rate
|
4.50%
|
4.60%
|
|
|
Expected inflation
|
3.40%
|
3.20%
|
|
|
Mortality tables
|
S1NA_L, CMI 2013 1%
|
Pna00mc0.5 underpin
|
Fair value of Plan assets is as follows:
|
Millions of euros
|
12/31/2013
|
12/31/2012
|
|
|
Shares
|
259
|
243
|
|
|
Bonds
|
977
|
942
|
|
|
Cash equivalents
|
-
|
6
|
|
|
Total
|
1,236
|
1,191
|
Telefónica Brasil pension plans
Telefónica Brasil and its subsidiaries had various pension plan, medical insurance and life insurance obligations with employees.
The main actuarial assumptions used in valuing these plans are as follows:
|
12/31/2013
|
12/31/2012
|
||
|
Discount rate
|
10.77%
|
8.90%
|
|
|
Nominal rate of salary increase
|
6.18%
|
6.18%
|
|
|
Expected inflation
|
4.50%
|
4.50%
|
|
|
Cost of health insurance
|
7.64%
|
7.64%
|
|
|
Mortality tables
|
AT 2000 M/F
|
AT 2000 M/F
|
In addition, Telefónica Brasil, along with other companies resulting from the privatization of Telebrás (Telecomunicações Brasileiras, S.A.) in 1998, adhered to PBS-A, a non-contribution defined benefit plan managed by Fundação Sistel de Seguridade Social, whose beneficiaries are employees that retired prior to January 31, 2000. At December 31, 2013, net plan assets amounted to 918 million Brazilian reais, equivalent to 284 million euros (760 million Brazilian reais at December 31, 2012, equivalent to 282 million euros). This plan does not have an impact on the consolidated statement of financial position, given that recovery of the assets is not foreseeable.
The valuations used to determine the value of obligations and plan assets, where appropriate, were performed as of December 31, 2013, by external and internal actuaries. The projected unit credit method was used in all cases.
Other provisions
The movement in “Other provisions” in 2013 and 2012 is as follows:
|
Millions of euros
|
||
|
Other provisions at December 31, 2011
|
2,869
|
|
|
Additions
|
1,098
|
|
|
Retirements/amount applied
|
(451)
|
|
|
Transfers
|
62
|
|
|
Translation differences
|
(186)
|
|
|
Other provisions at December 31, 2012
|
3,392
|
|
|
Additions
|
968
|
|
Retirements/amount applied
|
(735)
|
|
Transfers
|
(83)
|
|
Translation differences
|
(456)
|
|
Other provisions at December 31, 2013
|
3,086
|
“Other provisions” includes the amount recorded in relation to the fine imposed on Telefónica de España, S.A.U. by the EU anti-trust authorities (see Note 21.a). The provision for this matter amounts to 205 million euros, including accrued interest, as of December 31, 2013 (196 million euros at December 31, 2012).
Also included are the provisions for dismantling of assets recognized by Group companies in the amount of 483 million euros (460 million euros at the 2012 year end).
At December 31, 2013, Telefónica Brazil has the following provisions to cover the risks to which it is exposed:
|
·
|
Provisions for disputes regarding federal, state and municipal taxes totaling approximately 735 million euros (724 million euros at December 31, 2012).
|
|
·
|
Provisions for labor-related contingencies of approximately 307 million euros (266 million euros at December 31, 2012), which basically relate to claims filed by former and outsourced employees.
|
|
·
|
Civil claims by private consumers and consumer associations regarding services rendered, and other legal proceedings related with normal operations. Certain administrative proceedings are also in progress concerning disputes about obligations established in sector regulations. The amount accrued for these matters totals approximately 303 million euros (280 million euros at December 31, 2012).
|
Given the nature of the risks covered by these provisions, it is not possible to determine a reliable schedule of potential payments, if any.
The Telefónica Group is exposed to various financial market risks as a result of: (i) its ordinary business activity, (ii) debt incurred to finance its business, (iii) its investments in companies, and (iv) other financial instruments related to the above commitments.
The main market risks affecting Group companies are as follows:
Exchange rate risk
Exchange rate risk arises primarily from: (i) Telefónica’s international presence, through its investments and businesses in countries that use currencies other than the euro (primarily in Latin America, but also in the United Kingdom and the Czech Republic), and (ii) debt denominated in currencies other than that of the country where the business is conducted or the home country of the company incurring such debt.
Interest rate risk
Interest rate risk arises primarily in connection with changes in interest rates affecting: (i) financial expenses on floating rate debt (or short-term debt likely to be renewed), due to changes in interest rates and (ii) the value of long-term liabilities at fixed interest rates.
Share price risk
Share price risk arises primarily from changes in the value of the equity investments (that may be bought, sold or otherwise involved in transactions), from changes in the value of derivatives associated with such investments, from changes in the value of treasury shares and from equity derivatives.
Other risks
The Telefónica Group is also exposed to liquidity risk if a mismatch arises between its financing needs (including operating and financial expense, investment, debt redemptions and dividend commitments) and its sources of finance (including revenues, divestments, credit lines from financial institutions and capital market transactions). The cost of finance could also be affected by movements in the credit spreads (over benchmark rates) demanded by lenders.
Finally, the Telefónica Group is exposed to country risk (which overlaps with market and liquidity risks). This refers to the possible decline in the value of assets, cash flows generated or cash flows returned to the parent company as a result of political, economic or social instability in the countries where the Telefónica Group operates, especially in Latin America.
Risk management
The Telefónica Group actively manages these risks through the use of derivatives (primarily on exchange rates, interest rates and share prices) and by incurring debt in local currencies, where appropriate, with a view to stabilizing cash flows, the income statement and investments. In this way, it attempts to protect the Telefónica Group’s solvency, facilitate financial planning and take advantage of investment opportunities.
The Telefónica Group manages its exchange rate risk and interest rate risk in terms of net debt and net financial debt as calculated by them. The Telefónica Group believes that these parameters are more appropriate to understanding its debt position. Net debt and net financial debt take into account the impact of the Group’s cash balance and cash equivalents including derivatives positions with a positive value linked to liabilities. Neither net debt nor net financial debt as calculated by the Telefónica Group should be considered an alternative to gross financial debt (the sum of current and non-current interest-bearing debt) as a measure of liquidity.
For a more detailed description on reconciliation of net debt and net financial debt to gross financial debt, see Note 2.
Exhchange rate risk
The fundamental objective of the exchange rate risk management policy is that, in event of depreciation in foreign currencies relative to the euro, any potential losses in the value of the cash flows generated by the businesses in such currencies, caused by depreciation in exchange rates of a foreign currency relative to the euro, are offset (to some extent) by savings from the reduction in the euro value of debt denominated in such currencies. The degree of exchange rate hedging employed varies depending on the type of investment.
At December 31, 2013, net debt in Latin American currencies was equivalent to approximately 4,326 million euros. However, the Latin American currencies in which this debt is denominated is not distributed in proportion to the cash flows generated in each currency. The future effectiveness of the strategy described above as a hedge of exchange rate risks therefore depends on which currencies depreciate relative to the euro.
The Telefónica Group aims to protect itself against declines in Latin American currencies relative to the euro affecting asset values through the use of dollar-denominated debt, incurred either in Spain (where such debt is associated with an investment as long as it is considered to be an effective hedge) or in the country itself, where the market for local currency financing or hedges may be inadequate or non-existent. At December 31, 2013, the Telefónica Group’s net debt denominated in dollars was equivalent to 1,326 million euros.
At December 31, 2013, pound sterling-denominated net debt was approximately 2.31 times the value of the 2013 operating income before depreciation and amortization (OIBDA) from the Telefónica Europe business unit in the United Kingdom. The Telefónica Group’s aim is to maintain a similar proportion of pound sterling-denominated net debt to OIBDA as the Telefónica Group’s net debt to OIBDA ratio, on a consolidated basis, to reduce its sensitivity to changes in the pound sterling to euro exchange rate. Pound sterling-denominated net debt at December 31, 2013, was equivalent to 3,342 million euros, greater than the 2,629 million euros at December 31, 2012.
Until the sale agreement of Telefónica Czech Republic (see Note 21.b), the risk-management objective to protect the investment in the Czech Republic was similar to that described for the investment in the UK, where the amount of Czech crown-denominated debt is proportional to the OIBDA of the “Telefónica Europe” business unit in the Czech Republic. Czech crown-denominated net debt at December 31, 2013, was 2.65 times OIBDA in Czech crown (2.10 times in 2012) on a consolidated basis and 3.85 times (2.97 times in 2012) on a proportional basis. An explanation for why this value is notably higher than the target of 2 times OIBDA is that once the sale of that company had been negotiated and agreed, the management target was changed to take into consideration the new position of the asset in the Group’s portfolio. It was therefore decided to hedge the collection in Czech crown from this sale.
The Telefónica Group also manages exchange rate risk by seeking to minimize the negative impact of any remaining exchange rate exposure on the income statement, regardless of whether there are open positions. Such open position exposure can arise for any of three reasons: (i) a thin market for local derivatives or difficulty in sourcing local currency finance which makes it impossible to arrange a low-cost hedge (as in Argentina and Venezuela), (ii) financing through intra-group loans, where the accounting treatment of exchange rate risk is different from that for financing through capital contributions, and (iii) as the result of a deliberate policy decision, to avoid the high cost of hedges that are not warranted by expectations or high risk of depreciation.
The following table illustrates the sensitivity of foreign currency gains and losses and of equity to changes in exchange rates, where: (i) in calculating the impact on the income statement, the exchange rate position affecting the income statement at the end of 2014 was considered constant during 2013; (ii) in calculating the impact on equity, only monetary items have been considered, namely debt and derivatives such as hedges of net investment and loans and credits to subsidiaries considered as part of the net investment, whose breakdown is considered constant in 2014 and identical to that existing at the end of 2013. In both cases, Latin American currencies are assumed to depreciate against the dollar and the rest of the currencies against the euro by 10%.
|
Millions of euros
|
||||||
|
Currency
|
Change
|
Impact on the consolidated income statement
|
Impact on consolidated equity
|
|||
|
All currencies vs EUR
|
10%
|
42
|
(245)
|
|||
|
USD vs EUR
|
10%
|
(1)
|
14
|
|||
|
European currencies vs EUR
|
10%
|
1
|
(460)
|
|||
|
Latin American currencies vs USD
|
10%
|
42
|
201
|
|||
|
All currencies vs EUR
|
(10)%
|
(42)
|
245
|
|
USD vs EUR
|
(10)%
|
1
|
(14)
|
|||
|
European currencies vs EUR
|
(10)%
|
(1)
|
460
|
|||
|
Latin American currencies vs USD
|
(10)%
|
(42)
|
(201)
|
The Group’s monetary position in Venezuela at December 31, 2013, is a net debtor position of 1,716 million Venezuelan bolivar (equivalent to approximately 198 million euros). It had an average debtor position in 2013, leading to a higher financial expense in the amount of 59 million euros for the effect of inflation.
Interest rate risk
The Telefónica Group’s financial expenses are exposed to changes in interest rates. In 2013, the rates applied to the largest amount of short-term debt were mainly based on the Euribor, the Czech crown Pribor, the Brazilian SELIC, the US dollar and pound sterling Libor, and the Colombian UVR. In nominal terms, at December 31, 2013, 71% of Telefónica’s net debt (or 68% of long-term net debt) was pegged to fixed interest rates for a period greater than one year, compared to 74% of net debt (73% of long-term net debt) in 2012. Of the remaining 29% (net debt at floating rates or at fixed rates maturing in under one year), 11 percentage points had interest rates collared in a period over one year (or 3% of long-term debt), while at December 31, 2012 this was the case for 10 percentage points of net debt at floating rates or with fixed rates maturing within one year (3% of long-term net debt).
In addition, early retirement liabilities were discounted to present value over the year, based on the curve for instruments with very high credit quality. The increase in interest rates has decreased the market value of these liabilities. However, this decrease was nearly completely offset by the decrease in the value of the hedges on these positions.
Net financial expense totaled 2,866 million euros in 2013, of which 111 million related to exchange losses (without considering the effect of monetary adjustments). Stripping out this effect, net financial expense fell by 11.8% year on year, primarily due to the 11.4% decrease in average debt. Stripping out the effect of exchange differences, the effective cost of debt of the last twelve months is t 5.34%, 3 b.p. below the prior year, as the impact to the effective cost of debt derived from the fact that the majority of the average debt reduction is in euros (at less than average costs) was compensated by savings made on the gross cost of debt in euros through better management.
To illustrate the sensitivity of financial expenses to variability in short-term interest rates, a 100 basis points increase in interest rates in all currencies in which Telefónica has financial positions at December 31, 2013, has been assumed, and a 100 basis points decrease in interest rates in all currencies except those currencies with low interest rates, in order to avoid negative rates (euro, pound sterling and the US dollar) and a constant position equivalent to that prevailing at the end of 2013.
To illustrate the sensitivity of equity to variability in interest rates, a 100 basis point increase in interest rates in all currencies and terms of the curve, in which Telefónica holds financial positions at December 31, 2013 was assumed, as well as a 100 basis point decrease in all currencies and terms (except those below 1% in order to avoid negative rates). Cash flow hedge positions were also considered as they are fundamentally the only positions where changes in market value due to interest-rate fluctuations are recognized in equity.
|
Millions of euros
|
|||
|
Change in basis points (bp)
|
Impact on consolidated income statement
|
Impact on consolidated equity
|
|
|
+100bp
|
(118)
|
741
|
|
|
-100bp
|
55
|
(632)
|
|
Share price risk
The Telefónica Group is exposed to changes in the value of equity investments that may be bought, sold or otherwise involved in transactions, from changes in the value of derivatives associated with such investments, from treasury shares and from equity derivatives.
According to the Telefónica, S.A. share option plan, Performance & Investment Plan (PIP) (see Note 19) the shares to be delivered to employees under such plan may be either the parent company treasury shares, acquired by them or any of its Group companies; or newly-issued shares. The possibility of delivering shares to beneficiaries of the plan in the future, in accordance with relative total shareholders’ return, implies a risk since there could be an obligation to hand over a maximum number of shares at the end of each phase, whose acquisition (in the event of acquisition in the market) in the future could imply a higher cash outflow than required on the start date of each phase if the share price is above the corresponding price on the phase start date. In the event that new shares are issued for delivery to the beneficiaries of the plan, there would be a dilutive effect for ordinary shareholders as a result of the higher number of shares delivered under such plan outstanding.
To reduce the risk associated with variations in share price under these plans, Telefónica has acquired instruments that replicate the risk profile of some of these plans as explained in Note 19.
In 2012, the second Global Employee Share Plan was launched, in accordance with approval given at the 2011 Ordinary General Shareholders’ Meeting.
In addition, the Group may use part of the treasury shares of Telefónica, S.A. held at December 31, 2013, to cover shares deliverable under the PIP or the Global Employee Share Plan. The net asset value of the treasury shares could increase or decrease depending on variations in Telefónica, S.A.’s share price.
Liquidity risk
The Telefónica Group seeks to match the schedule for its debt maturity payments to its capacity to generate cash flows to meet these maturities, while allowing for some flexibility. In practice, this has been translated into two key principles:
|
1.
|
The Telefónica Group’s average maturity of net financial debt is intended to stay above 6 years, or be restored above that threshold in a reasonable period of time if it eventually falls below it. This principle is considered as a guideline when managing debt and access to credit markets, but not a rigid requirement. When calculating the average maturity for the net financial debt and part of the undrawn credit lines can be considered as offsetting the shorter debt maturities, and extension options on some financing facilities may be considered as exercised, for calculation purposes.
|
|
2.
|
The Telefónica Group must be able to pay all commitments over the next 12 months without accessing new borrowing or tapping the capital markets (although drawing upon firm credit lines arranged with banks), assuming budget projections are met. Throughout 2013, due to the financial market crisis, the Group decided to apply a substantially greater hedging policy for these commitments.
|
At December 31, 2013, the average maturity of net financial debt (45,381 million euros) was 6.79 years.
At December 31, 2013, gross financial debt scheduled to mature in 2014 amounted to approximately 9,214 million euros (which includes: (i) the net position of derivative financial instruments and certain current payables and (ii) 582 million euros of notes with an option of early repayment option and no contractual obligation to be repaid). These maturities are lower than the amount of funds available, calculated as the sum of: a) current financial assets and cash at December 31, 2013 (11,682 million euros excluding derivative financial instruments), b) annual cash generation projected for 2014; and c) undrawn credit facilities arranged with banks whose original maturity is over one year (an aggregate of more than 11,831 million euros at December 31, 2013), providing flexibility to the Telefónica Group with regard to accessing capital or credit markets in the next 12 months. For a further description of the Telefónica Group’s liquidity and capital resources in 2013, see Note 13.2 Financial Liabilities and Appendix V.
Country risk
The Telefónica Group managed or mitigated country risk by pursuing two lines of action (in addition to its normal business practices):
|
1.
|
Partly matching assets to liabilities (those not guaranteed by the parent company) in the Telefónica Group’s Latin American companies such that any potential asset impairment would be accompanied by a reduction in liabilities; and,
|
|
2.
|
Repatriating funds generated in Latin America that are not required for the pursuit of new, profitable business development opportunities in the region.
|
Regarding the first point, at December 31, 2013, the Telefónica Group’s Latin American companies had net financial debt not guaranteed by the parent company of 2,499 million euros, which represents 5.5% of consolidated net financial debt.
Regarding the repatriation of funds to Spain, 1,640 million euros from Latin America companies have been received in 2013, of which 1,434 million euros were from dividends, 118 million euros were from intra-group loans (payments of interest and repayments of principal) and 88 million euros were for other items.
In this regard, it is worth noting that since February 2003, Venezuela has had an exchange control mechanism in place, managed by the Currency Administration Commission (CADIVI). The body has issued a number of regulations (“providencias”) governing the modalities of currency sales in Venezuela at official exchange rates. Foreign companies which are duly registered as foreign investors are entitled to request approval to acquire currencies at the official exchange rate by the CADIVI, in line with regulation number 029, article 2, section c) "Remittance of earnings, profits, income, interest and dividends from international investment." Telefónica Venezolana, C.A. (formerly Telcel, C.A.), a Telefónica Group subsidiary in Venezuela, obtained the aforementioned requested approval on 295 million Venezuelan bolivars in 2006, 473 million Venezuelan bolivars in 2007 and 785 million Venezuelan Bolivars in 2008. At December 31, 2013, payment of two dividends agreed by the company in the amount of 5,882 million Venezuelan bolivars is pending approval by the CADIVI.
Credit risk
The Telefónica Group trades in derivatives with creditworthy counterparties. Therefore, Telefónica, S.A. generally trades with credit entities whose “senior debt” ratings are of at least “A”. In Spain, where most of the Group’s derivatives portfolio is held, there are netting agreements with financial institutions, with debtor or creditor positions offset in case of bankruptcy, limiting the risk to the net position. In addition, since Lehman went bankrupt, the credit ratings of rating agencies have proved to be less effective as a credit risk management tool. Therefore, the 5-year CDS (Credit Default Swap) of credit institutions has been added. This way, the CDS of all the counterparties with which Telefónica, S.A. operates is monitored at all times in order to assess the maximum allowable CDS for operating at any given time. Transactions are generally only carried out with counterparties whose CDS is below the threshold.
For other subsidiaries, particularly those in Latin America, assuming a stable sovereign rating provides a ceiling which is below “A”, trades are with local financial entities whose rating by local standards is considered to be of high creditworthiness.
Meanwhile, with credit risk arising from cash and cash equivalents, the Telefónica Group places its cash surpluses in high quality and highly liquid money-market assets. These placements are regulated by a general framework, revised annually. Counterparties are chosen according to criteria of liquidity, solvency and diversification based on the conditions of the market and countries where the Group operates. The general framework sets: (i) the maximum amounts to be invested by counterparty based on its rating (long-term debt rating); (ii) the maximum tenor of the investment, set at 180 days; and (iii) the instruments in which the surpluses may be invested (money-market instruments).
The Telefónica Group considers credit risk management as a key element to achieve its sustainable business and customer base growth targets in a manner that is consistent with Telefónica Corporate Risk Management Policy.
This management approach relies on the continuous monitoring of the risk assumed and the resources necessary to optimize the risk-reward balance to grant the adequate separation between the risk ownership areas and risk management areas. Customer-financing products and those debtors that could cause a material impact on the Group’s consolidated financial statements are subject to specific management practices to mitigate exposure to credit risk, according to the segment and risk profile of the customer.
Uniform policies, procedures, delegation of authority and management practices are established in all Group companies, taking into account benchmark risk management techniques but adapted to the local characteristics of each market. This commercial credit risk management model is embedded into the Group’s decision-making processes, both from a strategic and, especially, day-to-day operating perspective, where credit risk assessment guides the product and services available for the different customer profiles.
The Telefónica Group’s maximum exposure to credit risk is initially represented by the carrying amounts of the financial assets (Notes 11 and 13) and the guarantees given by the Telefónica Group.
Several Telefónica Group companies provide operating guarantees granted by external counterparties, which are offered during their normal commercial activity, in bids for licenses, permits and concessions, and spectrum acquisitions. At December 31, 2013, these guarantees amounted to approximately 3,964 million euros.
Capital management
Telefónica’s corporate finance department, which is in charge of Telefónica’s capital management, takes into consideration several factors when determining Telefónica’s capital structure, with the aim of ensuring sustainability of the business and maximizing the value to shareholders.
Telefónica monitors its cost of capital with a goal of optimizing its capital structure. In order to do this, Telefónica monitors the financial markets and updates to standard industry approaches for calculating weighted average cost of capital, or WACC. Telefónica also uses a net financial debt ratio below 2.35x OIBDA in the medium term (excluding items of a non-recurring or exceptional nature), enabling to obtain and maintain the desired credit rating over the medium term, and with which the Telefónica Group can match the potential cash flow generation with the alternative uses that could arise at all times.
These general principles are refined by other considerations and the application of specific variables, such as country risk in the broadest sense, or the volatility in cash flow generation, when determining the Telefónica Group’s financial structure.
Derivatives policy
At December 31, 2013, the nominal value of outstanding derivatives with external counterparties amounted to 164,487 million equivalent, a 11% increase from December 31, 2012 (147,724 million euros equivalent). This figure is inflated by the use in some cases of several levels of derivatives applied to the nominal value of a single underlying liability. For example, a foreign currency loan can be hedged into floating rate, and then each interest rate period can be fixed using a fixed rate hedge, or FRA (forward rate agreement). Even using such techniques to reduce the position, it is still necessary to take extreme care in the use of derivatives to avoid potential problems arising through error or a failure to understand the real position and its associated risks.
Telefónica’s derivatives policy emphasizes the following points:
1) Derivatives based on a clearly identified underlying.
Acceptable underlyings include assets and liabilities, profits, revenues and cash flows in either a company’s functional currency or another currency. These flows can be contractual (debt and interest payments, settlement of foreign currency payables, etc.), reasonably certain or foreseeable (PP&E purchases, future debt issues, commercial paper programs, etc.). The acceptability of an underlying asset in the above cases does not depend on whether it complies with accounting rules requirements for hedge accounting, as is required in the case of certain intragroup transactions, for instance. Parent company investments in subsidiaries with functional currencies other than the euro also qualify as acceptable underlying assets.
Economic hedges, which are hedges with a designated underlying asset and which in certain circumstances offset fluctuations in the underlying asset value, do not always meet the requirements and effectiveness tests laid down by accounting standards for treatment as hedges. The decision to maintain positions that cease to qualify as effective or fail to meet other requirements will depend on the marginal impact on the income statement and how far this might compromise the goal of a stable income statement. In any event, the variations are recognized in the income statement.
2) Matching of the underlying to one side of the derivative.
This matching basically applies to foreign currency debt and derivatives hedging foreign currency payments by Telefónica Group subsidiaries. The aim is to eliminate the risk arising from changes in foreign currency interest rates. Nonetheless, even when the aim is to achieve perfect hedging for all cash flows, the lack of liquidity in certain markets, especially in Latin American currencies, has meant that historically there have been mismatches between the terms of the hedges and those of the debts they are meant to hedge. The Telefónica Group intends to reduce these mismatches, provided that doing so does not involve disproportionate costs. In this regard, if adjustment does prove too costly, the financial timing of the underlying asset in foreign currency will be modified in order to minimize interest rate risk in foreign currency.
In certain cases, the timing of the underlying as defined for derivative purposes may not be exactly the same as the timing of the contractual underlying.
3) Matching the company contracting the derivative and the company that owns the underlying.
Generally, the aim is to ensure that the hedging derivative and the hedged asset or liability belong to the same company. Sometimes, however, the holding companies (Telefónica, S.A. and Telefónica Internacional, S.A.) have arranged hedges on behalf of a subsidiary that owns the underlying asset. The main reasons for separating the hedge and the underlying asset were possible differences in the legal validity of local and international hedges (as a result of unforeseen legal changes) and the different credit ratings of the counterparties (of the Telefónica Group companies as well as those of the banks).
4) Ability to measure the derivative’s fair value using the valuation systems available to the Telefónica Group.
The Telefónica Group uses a number of tools to measure and manage risks in derivatives and debt. The main ones are Kondor+, licensed by Reuters, which is widely used by financial institutions, and MBRM specialist financial calculator libraries.
5) Sale of options only when there is an underlying exposure.
Telefónica considers the sale of options when: i) there is an underlying exposure (on the consolidated statement of financial position or associated with a highly probable cash outflow) that would offset the potential loss for the year if the counterparty exercised the option, or ii) the option is part of a structure in which another derivative offsets any loss. The sale of options is also permitted in option structures where, at the moment they are taken out, the net premium is either positive or zero.
For instance, it would be possible to sell short-term options on interest rate swaps that entitle the counterparty to receive a certain fixed interest rate, below the level prevailing at the time the option was sold. This would mean that if rates fell and the counterparty exercised its option, the Group would swap part of its debt from floating rate to a lower fixed rate, having received a premium.
6) Hedge accounting.
The main risks that may qualify for hedge accounting are as follows:
|
·
|
Variations in market interest rates (either money-market rates, credit spreads or both) that affect the value of the underlying asset or the measurement of the cash flows;
|
|
·
|
Variations in exchange rates that change the value of the underlying asset in the company’s functional currency and affect the measurement of the cash flow in the functional currency;
|
|
·
|
Variations in the volatility of any financial variable, asset or liability that affect either the valuation or the measurement of cash flows on debt or investments with embedded options, whether or not these options are separable; and
|
|
·
|
Variations in the valuation of any financial asset, particularly shares of companies included in the portfolio of “Available-for-sale financial assets”.
|
Regarding the underlying:
|
·
|
Hedges can cover all or part of the value of the underlying;
|
|
·
|
The risk to be hedged can be for the whole period of the transaction or for only part of the period; and
|
|
·
|
The underlying may be a highly probable future transaction, or a contractual underlying (loan, foreign currency payment, investment, financial asset, etc.) or a combination of both that defines an underlying with a longer term.
|
This may on occasion mean that the hedging instruments have longer terms than the related contractual underlying. This happens when the Group enters into long-term swaps, caps or collars to protect ourselves against interest rate rises that may raise the financial expense of its promissory notes, commercial paper and some floating rate loans which mature
earlier than their hedges. These floating rate financing programs are highly likely to be renewed and Telefónica commits to this by defining the underlying asset in a more general way as a floating rate financing program whose term coincides with the maturity of the hedge.
Hedges can be of three types:
|
·
|
Fair value hedges.
|
|
·
|
Cash flow hedges. Such hedges can be set at any value of the risk to be hedged (interest rates, exchange rates, etc.) or for a defined range (interest rates between 2% and 4%, above 4%, etc.). In this last case, the hedging instrument used is options and only the intrinsic value of the option is recognized as an effective hedge.
|
|
·
|
Hedges of net investment in consolidated foreign subsidiaries. Generally such hedges are arranged by the parent company and the other Telefónica holding companies. Wherever possible, these hedges are implemented through real debt in foreign currency. Often, however, this is not always possible as many Latin American currencies are non-convertible, making it impossible for non-resident companies to issue local currency debt. It may also be that the debt market in the currency concerned is too thin to accommodate the required hedge (for example, the Czech crown and pounds sterling), or that an acquisition is made in cash with no need for market financing. In these circumstances derivatives, either forwards or cross-currency swaps are used to hedge the net investment.
|
Hedges can comprise a combination of different derivatives.
Management of accounting hedges is not static, and the hedging relationship may change before maturity. Hedging relationships may change to allow appropriate management that serves the Group’s stated principles of stabilizing cash flows, stabilizing net financial income/expense and protecting share capital. The designation of hedges may therefore be cancelled, before maturity, because of a change in the underlying, a change in perceived risk on the underlying or a change in market view. Derivatives included in these hedges may be reassigned to new hedges where they meet the effectiveness test and the new hedge is well documented. To gauge the efficiency of transactions defined as accounting hedges, the Group analyzes the extent to which the changes in the fair value or in the cash flows attributable to the hedged item would offset the changes in fair value or cash flows attributable to the hedged risk using a linear regression model both prospectively and retrospectively.
The main guiding principles for risk management are laid down by Telefónica’s Finance Department and implemented by company financial officers (who are responsible for balancing the interests of each company and those of the Telefónica Group). The Corporate Finance Department may allow exceptions to this policy where these can be justified, normally when the market is too thin for the volume of transactions required or on clearly limited and small risks. New companies joining the Telefónica Group as a result of mergers or acquisitions may also need time to adapt.
The breakdown of the financial results recognized in 2013, 2012 and 2011 is as follows:
|
2013
|
2012
|
2011
|
||||
|
Interest income
|
613
|
557
|
586
|
|||
|
Dividends received
|
11
|
28
|
42
|
|||
|
Other financial income
|
203
|
276
|
181
|
|||
|
Subtotal
|
827
|
861
|
809
|
|||
|
Changes in fair value of financial assets at fair value through profit or loss
|
(427)
|
648
|
573
|
|||
|
Changes in fair value of financial liabilities at fair value through profit or loss
|
388
|
(550)
|
(808)
|
|||
|
Transfer from equity to profit and loss from cash flow hedges
|
(121)
|
(173)
|
(210)
|
|||
|
Transfer from equity to profit and loss from available-for-sale assets and others
|
(52)
|
(50)
|
(3)
|
|
Gain/(loss) on fair value hedges
|
(935)
|
198
|
908
|
|||
|
(Loss)/gain on adjustment to items hedged by fair value hedges
|
961
|
(145)
|
(747)
|
|||
|
Subtotal
|
(186)
|
(72)
|
(287)
|
|||
|
Interest expenses
|
(2,898)
|
(3,094)
|
(2,671)
|
|||
|
Ineffective portion of cash flow hedges
|
−
|
1
|
1
|
|||
|
Accretion of provisions and other liabilities
|
(201)
|
(469)
|
(106)
|
|||
|
Other financial expenses
|
(238)
|
(289)
|
(528)
|
|||
|
Subtotal
|
(3,337)
|
(3,851)
|
(3,304)
|
|||
|
Net finance costs excluding foreign exchange differences and hyperinflationary adjustments
|
(2,696)
|
(3,062)
|
(2,782)
|
|||
The breakdown of Telefónica’s derivatives at December 31, 2013, their fair value at year-end and the expected maturity schedule is as set forth in the table below:
|
Millions of euros
|
Fair value
(**)
|
Notional amount MATURITIES (*)
|
||||||||||
|
Derivatives
|
2014
|
2015
|
2016
|
Subsequent years
|
Total
|
|||||||
|
Interest rate hedges
|
456
|
(4,266)
|
1,934
|
845
|
(2,079)
|
(3,566)
|
||||||
|
Cash flow hedges
|
758
|
(3,462)
|
2,099
|
(96)
|
8,143
|
6,684
|
||||||
|
Fair value hedges
|
(302)
|
(804)
|
(165)
|
941
|
(10,222)
|
(10,250)
|
||||||
|
Exchange rate hedges
|
355
|
(467)
|
1,551
|
3,128
|
4,709
|
8,921
|
||||||
|
Cash flow hedges
|
357
|
(330)
|
1,551
|
3,128
|
4,709
|
9,058
|
||||||
|
Fair value hedges
|
(2)
|
(137)
|
− | − |
−
|
(137)
|
||||||
|
Interest and exchange rate hedges
|
(233)
|
(468)
|
(321)
|
465
|
1,923
|
1,599
|
||||||
|
Cash flow hedges
|
(58)
|
(383)
|
(200)
|
566
|
2,779
|
2,762
|
||||||
|
Fair value hedges
|
(175)
|
(85)
|
(121)
|
(101)
|
(856)
|
(1,163)
|
||||||
|
Hedge of net investment
|
(277)
|
(1,992)
|
(162)
|
(1,151)
|
(60)
|
(3,365)
|
||||||
|
Derivatives not designated as hedges
|
(434)
|
1,918
|
(63)
|
(710)
|
(1,928)
|
(783)
|
||||||
|
Interest rate
|
(359)
|
2,353
|
(141)
|
(710)
|
(1,941)
|
(439)
|
||||||
|
Exchange rate
|
(75)
|
(435)
|
78
|
−
|
13
|
(344)
|
||||||
|
Interest and exchange rate
|
−
|
|||||||||||
|
(*) For interest rate hedges, the positive amount is in terms of fixed payment. For foreign currency hedges, a positive amount means payment in functional vs. foreign currency.
|
||||||||||||
|
(**) Positive amounts indicate payables.
|
||||||||||||
The breakdown of Telefónica’s derivatives at December 31, 2012, their fair value at year-end and the expected maturity schedule are as set forth in the table below:
|
Millions of euros
|
Fair value
(**)
|
Notional amount MATURITIES (*)
|
||||||||||
|
Derivatives
|
2013
|
2014
|
2015
|
Subsequent years
|
Total
|
|||||||
|
Interest rate hedges
|
367
|
(1,241)
|
(844)
|
2,552
|
3,306
|
3,773
|
||||||
|
Cash flow hedges
|
1,405
|
(1,048)
|
(353)
|
2,547
|
8,222
|
9,368
|
||||||
|
Fair value hedges
|
(1,038)
|
(193)
|
(491)
|
5
|
(4,916)
|
(5,595)
|
||||||
|
Exchange rate hedges
|
(443)
|
792
|
(158)
|
1,558
|
6,344
|
8,536
|
||||||
|
Cash flow hedges
|
(441)
|
1,057
|
(158)
|
1,558
|
6,344
|
8,801
|
||||||
|
Fair value hedges
|
(2)
|
(265)
|
− | − | − |
(265)
|
||||||
|
Interest and exchange rate hedges
|
(389)
|
(8)
|
38
|
27
|
2,468
|
2,525
|
||||||
|
Cash flow hedges
|
(248)
|
(53)
|
89
|
90
|
2,478
|
2,604
|
||||||
|
Fair value hedges
|
(141)
|
45
|
(51)
|
(63)
|
(10)
|
(79)
|
||||||
|
Hedge of net investment
|
(140)
|
(1,330)
|
(280)
|
(162)
|
(1,211)
|
3,180
|
||||||
|
Derivatives not designated as hedges
|
(534)
|
11,366
|
(13)
|
(467)
|
(1,406)
|
9,480
|
||||||
|
Interest rate
|
(384)
|
8,796
|
(13)
|
(545)
|
(2,133)
|
6,105
|
||||||
|
Exchange rate
|
(150)
|
2,570
|
−
|
78
|
727
|
3,375
|
||||||
|
Interest and exchange rate
|
−
|
|||||||||||
|
(*) For interest rate hedges, the positive amount is in terms of fixed payment. For foreign currency hedges, a positive amount means payment in functional vs. foreign currency.
|
||||||||||||
|
(**) Positive amounts indicate payables.
|
||||||||||||
A list of derivative products entered into at December 31, 2013 is provided in Appendix IV.
Consolidated tax group
Pursuant to a Ministerial Order dated December 27, 1989, Telefónica, S.A. files consolidated tax returns for certain Group companies. The consolidated tax group comprised 51 companies in 2013 (52 companies in 2012).
Deferred taxes
The movements in deferred taxes in 2013 and 2012 are as follows:
|
Deferred tax assets
|
Deferred tax liabilities
|
||
|
Balance at December 31, 2012
|
7,308
|
4,788
|
|
|
Additions
|
1,662
|
614
|
|
|
Disposals
|
(1,007)
|
(691)
|
|
|
Transfers
|
(1,442)
|
(1,516)
|
|
|
Translation differences and hyperinflation adjustments
|
(156)
|
(149)
|
|
|
Company movements and others
|
11
|
17
|
|
|
Balance at December 31, 2013
|
6,376
|
3,063
|
|
|
Deferred tax assets
|
Deferred tax liabilities
|
||
|
Balance at December 31, 2011
|
6,417
|
4,739
|
|
|
Additions
|
2,147
|
807
|
|
|
Disposals
|
(1,051)
|
(388)
|
|
|
Transfers
|
(48)
|
(268)
|
|
|
Translation differences and hyperinflation adjustments
|
(131)
|
(94)
|
|
|
Company movements and others
|
(26)
|
(8)
|
|
|
Balance at December 31, 2012
|
7,308
|
4,788
|
|
“Additions” of deferred tax assets in 2013 mainly includes the positive impact of the recognition of tax credits at several Group companies in Spain, Germany, and Brazil of 547 million euros, and the capitalization of 146 million euros of tax credits, mainly for R+D in Spain.
Meanwhile, “Disposals” of deferred tax assets mainly include the impact of the Group’s labor force reduction plans recorded in prior years.
Transfers during 2013 mainly relate to the offsetting of deferred tax assets and liabilities as a result of the merger of Telefónica companies in Brazil completed in 2013.
“Additions” of deferred tax assets in 2012 mainly included the positive impact of the tax inspection in Spain of 458 million euros, the recognition of tax credits and temporary differences at several Group companies in Germany of 246 million euros, and the tax effect of the adjustment of the value of the investment in Telco, S.p.A. of 383 million euros (108 million euros en 2013).
The net movements in deferred tax assets and liabilities, recognized directly in equity in 2013 amount to 38 million euros of “additions” and 225 million euros of “disposals” (359 million euros of “additions” and 37 million euros of “disposals” in 2012).
Expected realization of deferred tax assets and liabilities
In the majority of cases, realization of the Group’s deferred tax assets and liabilities depends on the future activities carried out by the different companies, on tax regulations in the different countries in which these companies operate, and
on the strategic decisions affecting the companies. Under the assumptions made, the estimated realization of deferred tax assets and liabilities recognized in the consolidated statement of financial position at December 31, 2013, is as follows:
|
Total
|
Less than 1 year
|
More than 1 year
|
||||
|
Deferred tax assets
|
6,376
|
1,283
|
5,093
|
|||
|
Deferred tax liabilities
|
3,063
|
634
|
2,429
|
|||
Deferred tax assets
Deferred tax assets in the accompanying consolidated statements of financial position include the tax loss carryforwards, unused tax credits recognized and deductible temporary differences recognized at the end of the reporting period.
Tax credits for loss carryforwards
The tax group had unused tax loss carryforwards at December 31, 2013, amounting to 10,174 million euros. These losses must be applied within 18 years, according to the following estimated schedule.
|
Total
|
Less than 1 year
|
More than 1 year
|
||||
|
Tax loss carryforwards
|
1
0,
174
|
342
|
9,832
|
In 2012, subsequent to the inspection by the tax authorities, the tax group in Spain reevaluated its tax credits based on the business plans of the companies in the tax group and the best estimate of taxable income, over a period of time that is in line with the state of the various markets in which they operate. As a result, a reduction of 458 million euros in “Corporate income tax" was recognized in 2012.
In 2013, the tax group’s tax credits were reevaluated using the same criteria as in the prior year, resulting in a reduction in “Corporate income tax" of 190 million euros.
Accordingly, total tax loss carry forwards in Spain in the statement of financial position at December 31, 2013 amount to 1,203 million euros.
The various Group companies in the rest of Europe have recognized 456 million euros of unrecognized tax credits, mainly from the tax loss carryforwards of the Telefónica companies in Germany. Total unrecognized tax credits of these companies amount to 6,408 million euros. These tax credits do not expire.
Recognized tax credits in the consolidated statement of financial arising from the Latin American subsidiaries at December 31, 2013, amounted to 97 million euros. Total unrecognized tax credits in Latin America amount to 615 million euros.
Deductions
The tax group has recognized 244 million euros of unused tax deductions in the consolidated statement of financial position at December 31, 2013 generated primarily from export activity, double taxation and donations to non-profit organizations.
Temporary differences
The sources of deferred tax assets and liabilities from temporary differences recognized at December 31, 2013 and 2012 are as follows:
|
12/31/2013
|
12/31/2012
|
||
|
Goodwill and intangible assets
|
1,239
|
1,172
|
|
|
Property, plant and equipment
|
651
|
395
|
|
|
Personnel commitments
|
1,238
|
1,412
|
|
|
Provisions
|
1,017
|
1,173
|
|
|
Investments in subsidiaries, associates and joint ventures
|
869
|
536
|
|
|
Other
|
1,238
|
1,568
|
|
|
Total deferred tax assets
|
6,252
|
6,256
|
|
12/31/2013
|
12/31/2012
|
||
|
Goodwill and intangible assets
|
1,659
|
2,538
|
|
|
Property, plant and equipment
|
1,304
|
1,212
|
|
|
Provisions
|
15
|
403
|
|
|
Investments in subsidiaries, associates and joint ventures
|
1,323
|
1,085
|
|
|
Other
|
638
|
601
|
|
|
Total deferred tax liabilities
|
4,939
|
5,839
|
Deferred tax assets and liabilities are offset if a legally enforceable right exists to set off current tax assets against current tax liabilities and the deferred taxes relate to the same taxable entity and the same taxation authority. At December 31, 2013, deferred tax assets and liabilities amounting to 1,876 million euros were offset (1,051 million euros at December 31, 2012).
The heading for "Other, mainly includes the difference between the accounting and tax values created by the value of financial derivatives at year end (see Note 16).
Tax payables and receivables
Current tax payables and receivables at December 31, 2013 and 2012 are as follows:
|
Balance at 12/31/2013
|
Balance at 12/31/2012
|
||
|
Taxes payable:
|
|||
|
Tax withholdings
|
103
|
102
|
|
|
Indirect taxes
|
896
|
1,110
|
|
|
Social security
|
152
|
188
|
|
|
Current income taxes payable
|
575
|
698
|
|
|
Other
|
477
|
424
|
|
|
Total
|
2,203
|
2,522
|
|
|
Balance at 12/31/2013
|
Balance at 12/31/2012
|
||
|
Tax receivables:
|
|||
|
Indirect tax
|
620
|
848
|
|
|
Current income taxes receivable
|
870
|
811
|
|
|
Other
|
174
|
169
|
|
|
Total
|
1,664
|
1,828
|
|
Reconciliation of book profit before taxes to taxable income
The reconciliation between book profit before tax and the income tax expense for 2013, 2012 and 2011 is as follows:
|
2013
|
2012
|
2011
|
||||
|
Accounting profit before tax
|
6,280
|
5,864
|
6,488
|
|||
|
Tax expense at prevailing statutory rate
|
1,935
|
1,903
|
1,927
|
|||
|
Permanent differences
|
(124)
|
307
|
(22)
|
|||
|
Changes in deferred tax charge due to changes in tax rate
|
(21)
|
(27)
|
(26)
|
|||
|
Capitalization of tax deduction and tax relief
|
(146)
|
(81)
|
(97)
|
|||
|
Use / Capitalization of loss carryforwards
|
(547)
|
(404)
|
(200)
|
|||
|
Increase / (Decrease) in tax expense arising from temporary differences
|
95
|
(297)
|
(1,344)
|
|||
|
Other
|
119
|
60
|
63
|
|||
|
Income tax expense
|
1,311
|
1,461
|
301
|
|||
|
Breakdown of current/deferred tax expense
|
||||||
|
Current tax expense
|
2,221
|
1,726
|
1,557
|
|||
|
Deferred tax benefit
|
(910)
|
(265)
|
(1,256)
|
|||
|
Total income tax expense
|
1,311
|
1,461
|
301
|
|||
Tax inspections and tax-related lawsuits
In December 2012, the National Court of Justice of Spain issued a ruling on the tax inspection for the years 2001 to 2004, partially in favor of the Company and accepting the tax losses incurred by the Group in relation to the transfer of certain interests in TeleSudeste, Telefónica Móviles México and Lycos as tax deductible and rejecting the other allegations of the Company. The Company filed an appeal with respect to the other allegations with the Supreme Court on December 28, 2012.
Also in 2012, tax inspections in Spain for all taxes for the years 2005 to 2007 were completed, with the Company signing consent forms for an income tax payment of 135 million euros and non-consent forms for the items which the Company contests. The tax assessment for which a non-consent form was signed did not require payment of any tax because it
only proposed a reduction in unused tax loss carryforwards. An appeal was filed with the Large Taxpayers Central Office of the Spanish State Tax Agency requesting this tax assessment be reversed, although no decision on the appeal has been issued as of the date of this Annual Report.
In July 2013, new inspections in Spain of various companies in the 24/90 tax group, of which Telefónica, S.A. is the parent were initiated. The taxes and periods subject to review are corporate income tax for the years 2008 to 2011, value-added tax or “VAT”, tax withholdings and payments on account in respect of personal income tax, tax on investment income, property tax and non-resident income tax for the second half of 2009 and the years 2010 and 2011. It is not expected that these inspections will result in the need to recognize any additional liabilities in the Telefónica Group's consolidated financial statements.
Meanwhile, Telefónica Brasil has a number of appeals underway regarding the ICMS (similar to VAT levied on telecommunications services). There is a dispute with the Brazilian tax authority over which services should be subject to settlement of this tax, the most significant being the demands of the collection of the ICMS on complementary or auxiliary services to base telecommunications service, such as value-added services or the lease of modems. To date, all the related procedures are being contested in all instances (administrative and judicial). The aggregate amount of these assessments, updated to take into account interests, fines and other items, is approximately 2,038 million euros. No provisions have been set aside for these matters, as the risk of them giving rise to liabilities is not probable. Telefónica Brasil has obtained independent expert reports supporting its position, i.e. that the aforesaid services are not subject to ICMS.
Regarding the Group’s main tax litigation in Peru, on March 20, 2013, notification was received of a first instance court decision upholding Telefónica Peru's arguments in three of the five objections filed by the authorities and appealed against in higher courts. Both the tax authorities and the Company have appealed against the decision in the court of second instance.
The assessment originally raised by the tax authorities amounted to 124 million euros comprising the tax charge, excluding interest and penalties. At the date of authorization for issue of this Annual Report, 80 million euros had been paid out (42 million euros of which was for penalties and interest paid in 2013). The Company has also obtained suspensive measures with respect to 340 million euros of the assessment within the process of appeals to the Ordinary Court. The Group and its legal advisors believe they have legal grounds to defend the Company’s interests in the appeal that is currently underway.
At the 2013 year-end, based on the final outcome of these assessments, and on the lawsuits and inspections in progress, it has not been deemed necessary to recognize additional liabilities in the Consolidated Financial statements.
Years open for inspection
The years open for review by the tax inspection authorities for the main applicable taxes vary from one consolidated company to another, based on each country’s tax legislation, taking into account their respective statute-of-limitations periods. In Spain, as a result of the tax audit completed in 2012, the main companies of the tax group are open to inspection of corporation tax from 2008 and all other applicable taxes from 2009.
In the other countries in which the Telefónica Group has a significant presence, the years open for inspection by the relevant authorities are generally as follows:
|
·
|
The last seven years in Argentina
|
|
·
|
The last five years in Brazil, Mexico, Uruguay, Colombia and the Netherlands
|
|
·
|
The last four years in Venezuela, Nicaragua, Peru, Guatemala and Costa Rica
|
|
·
|
The last three years in Chile, Ecuador, El Salvador, the United States and Panama
|
|
·
|
In Europe, the main companies have open to inspection the last eight years in the United Kingdom, the last ten years in Germany, and the last four years in the Czech Republic.
|
The tax audit of the open years is not expected to give rise to additional material liabilities for the Group.
Revenues
The breakdown of “Revenues” is as follows:
|
2013
|
2012
|
2011
|
|||||||||
|
Rendering of services
|
52,386 | 57,810 | 58,415 | ||||||||
|
Net sales
|
4,675 | 4,546 | 4,422 | ||||||||
|
Total
|
57,061 | 62,356 | 62,837 | ||||||||
Other income
The breakdown of “Other income” is as follows:
|
2013
|
2012
|
2011
|
|||||||||
|
Own work capitalized
|
794 | 822 | 739 | ||||||||
|
Gain on disposal of companies
|
63 | 123 | 184 | ||||||||
|
Gain on disposal of other assets
|
336 | 802 | 677 | ||||||||
|
Government grants
|
42 | 51 | 62 | ||||||||
|
Other operating income
|
458 | 525 | 445 | ||||||||
|
Total
|
1,693 | 2,323 | 2,107 | ||||||||
“
Gain on disposal of other assets” includes gains from the sale of telephone towers of 113 million euros, 620 million euros and 564 million euros in 2013, 2012 and 2011, respectively.
Other expenses
The breakdown of “Other expenses” in 2013, 2012 and 2011 is as follows:
|
2013
|
2012
|
2011
|
|||||||||
|
Leases
|
947 | 1,159 | 1,033 | ||||||||
|
Advertising
|
1,290 | 1,528 | 1,457 | ||||||||
|
Other external services
|
10,590 | 10,800 | 10,529 | ||||||||
|
Taxes other than income tax
|
1,335 | 1,436 | 1,328 | ||||||||
|
Change in trade provisions
|
701 | 777 | 818 | ||||||||
|
Losses on disposal of fixed assets and changes in provisions for fixed assets
|
277 | 706 | 43 | ||||||||
|
Other operating expenses
|
288 | 399 | 190 | ||||||||
|
Total
|
15,428 | 16,805 | 15,398 | ||||||||
In 2013, “Losses on disposal of fixed assets and changes in provisions for fixed assets” mainly includes the value adjustment on assets allocated to Telefónica Czech Republic amounting to 176 million euros (see Note 2). This heading in 2012 mainly included the impact of the write-offs of the customer portfolio allocated to the business in Ireland for 113 million euros (Note 6) and the related allocated goodwill for 414 million euros (Note 7).
Estimated payment schedule
The estimated payment schedule in millions of euros for the next few years on operating leases and purchase and other contractual commitments (non-cancellable without penalty cost) are as follows:
|
Total
|
Less than 1 year
|
1 to 3 years
|
3 to 5 years
|
Over 5 years
|
|||||||||||||||
|
T. Latin America
|
5,339 | 749 | 1,326 | 1,193 | 2,071 | ||||||||||||||
|
T. Europe
|
3,388 | 626 | 880 | 614 | 1,268 | ||||||||||||||
|
Others
|
608 | 128 | 169 | 112 | 199 | ||||||||||||||
|
Operating lease obligations
|
9,335 | 1,503 | 2,375 | 1,919 | 3,538 | ||||||||||||||
|
Purchase and other contractual obligations
|
5,285 | 2,272 | 1,362 | 735 | 916 | ||||||||||||||
At December 31, 2013, the present value of future payments for Telefónica Group operating leases was approximately 6,868 million euros (3,415 million euros in T. Latin America and 2,934 million in T. Europe).
The main finance lease transactions are described in Note 22.
Headcount
The table below presents the breakdown of the Telefónica Group’s average number of employees in 2013, 2012 and 2011, together with total headcount at December 31 each year. The employees shown for each subgroup include the Telefónica Group companies with similar activities in accordance with the segment reporting (see Note 4).
|
2013
|
2012
|
2011
|
|||||||||||||||||||||
|
Average
|
Year-end
|
Average
|
Year-end
|
Average
|
Year-end
|
||||||||||||||||||
|
Telefónica Europe
|
52,584 | 49,761 | 56,681 | 55,321 | 60,796 | 58,927 | |||||||||||||||||
|
Telefónica Latin America
|
57,688 | 57,027 | 58,681 | 58,282 | 59,024 | 59,962 | |||||||||||||||||
|
Other companies
|
19,621 | 19,942 | 157,236 | 19,583 | 166,325 | 172,138 | |||||||||||||||||
|
Total
|
129,893 | 126,730 | 272,598 | 133,186 | 286,145 | 291,027 | |||||||||||||||||
Employees corresponding to the Atento business are included in the average headcount until the date of the sale in December 2012 (see Note 2). The average number of employees in 2012 corresponding to the Atento companies sold was 137,454.
Of the final headcount at December 31, 2013, approximately 38.2% are women (37.9% at December 31, 2012).
Depreciation and amortization
The breakdown of “Depreciation and amortization” on the consolidated income statement is as follows:
|
2013
|
2012
|
2011
|
|||||||||
|
Depreciation of property, plant and equipment
|
6,179 | 6,931 | 6,670 | ||||||||
|
Amortization of intangible assets
|
3,448 | 3,502 | 3,476 | ||||||||
|
Total
|
9,627 | 10,433 | 10,146 | ||||||||
Earnings per share
Basic earnings per share amounts are calculated by dividing the profit for the year attributable to equity holders of the parent, adjusted for the net coupon corresponding to “Other equity instruments”, by the weighted average number of ordinary shares outstanding during the year.
There are no dilutive effects inherent in converting potential ordinary shares issued, therefore diluted earnings per share amounts are calculated by dividing net profit for the year attributable to ordinary equity holders of the parent, adjusted as described in the preceding paragraph, by the weighted average number of ordinary shares outstanding during the year plus the weighted average number of ordinary shares that would be issued on the conversion of all the dilutive potential ordinary shares into ordinary shares.
F-81
Both basic and diluted earnings per share attributable to equity holders of the parent are calculated based on the following data:
|
2013
|
2012
|
2011
|
|||||||||
|
Profit attributable to ordinary equity holders of the parent from continuing operations
|
4,593 | 3,928 | 5,403 | ||||||||
|
Adjustment for the net coupon corresponding to other equity instruments
|
(27) | N/A | N/A | ||||||||
|
Total profit attributable to equity holders of the parent for basic earnings
|
4,566 | 3,928 | 5,403 | ||||||||
|
Adjustment for dilutive effects of the conversion of potential ordinary shares
|
− | − | − | ||||||||
|
Total profit attributable to equity holders of the parent for diluted earnings
|
4,566 | 3,928 | 5,403 | ||||||||
|
Number of shares
|
2013
|
2012
|
2011
|
||||||||
|
Weighted average number of ordinary shares (excluding treasury shares) for basic earnings per share
|
4,519,717 | 4,495,914 | 4,583,974 | ||||||||
|
Telefónica, S.A. share option plan
|
4,816 | 1,998 | 1,702 | ||||||||
|
Weighted average number of ordinary shares (excluding treasury shares) outstanding for diluted earnings per share
|
4,524,533 | 4,497,912 | 4,585,676 | ||||||||
The denominators used in the calculation of both basic and diluted earnings per share have been adjusted to reflect any transactions that changed the number of shares outstanding without a corresponding change in equity as if they had taken place at the start of the first period under consideration. This is the case of the bonus share issue held in 2012 to pay the scrip dividend (see Note 12).
There have been no transactions involving existing or potential ordinary shares between the end of the year and the date of preparation of the consolidated financial statements.
Basic and diluted earnings per share attributable to equity holders of the parent are as follows:
|
2013
|
2012
|
2011(*) | |||||||||
|
Basic earnings per share
|
1.01 | 0.87 | 1.18 | ||||||||
|
Diluted earnings per share
|
1.01 | 0.87 | 1.18 | ||||||||
|
(*) revised data
|
|||||||||||
The main share-based payment plans at year end 2013 are as follows:
a) Telefónica, S.A. share plan: “Performance Share Plan” (PSP)
At the General Shareholders’ Meeting of Telefónica, S.A. on June 21, 2006, its shareholders approved the introduction of a long-term incentive plan for managers and senior executives of Telefónica, S.A. and other Telefónica Group companies. Under this plan, selected participants who met the qualifying requirements were given a certain number of Telefónica, S.A. shares as a form of variable compensation.
The term of the plan is seven years divided into five phases.
The fourth phase expired on June 30, 2012. The maximum number of shares assigned to this phase of the plan was 6,356,597 shares assigned on July 1, 2009, with a fair value of 8.41 euros per share. Delivery of shares was not required at the end of the phase according to the general conditions of the plan; therefore, managers did not receive any shares.
The fifth and last phase of this share plan expired on June 30, 2013, with no shares being awarded, according to the general conditions of the plan. The maximum number of shares assigned to this phase of the plan was as follows:
|
No. of shares assigned
|
Unit fair value
|
End date
|
||||
|
5th phase July 1, 2010
|
5,025,657
|
9.08
|
June 30, 2013
|
This plan is equity-settled via the delivery of shares to the participants. Accordingly, a balancing entry for the 4 million euros, 24 million euros and 41 million euros of employee benefits expenses recorded in 2013, 2012 and 2011, respectively, was made in shareholders’ equity.
In addition to the PSP, during the period 2011-2013 there were three other share-based payment plans linked to the share price, whose impact on the consolidated financial statements of the Group is not significant considered individually or in the aggregate. For informational purposes, these plans are the following:
|
Plan
|
Beneficiaries
|
End date
|
||
|
Performance Cash Plan
|
Managers of Telefónica Europe
|
2013
|
||
|
Global Employee Share Plan
|
Employees of Telefónica worldwide, with certain exceptions
|
2012
|
||
|
Global Employee Share Plan II
|
Employees of Telefónica worldwide, with certain exceptions
|
2014
|
b) Long-term incentive plan based on Telefónica, S.A. shares: "Performance and Investment Plan" (PIP)
At the General Shareholders’ Meeting held on May 18, 2011, a new long-term share-based incentive plan called “Performance and Investment Plan” was approved for Telefónica Group directors and executive officers. This plan will take effect following completion of the Performance Share Plan.
Under this plan, a certain number of shares of Telefónica, S.A. will be delivered to plan participants selected by the Company who decide to participate on compliance with stated requirements and conditions.
The plan lasts five years and is divided into three independent phases.
The first, second and third allocations of shares under this plan were made on July 1, 2011, July 1, 2012, and July 1, 2013. The maximum number of shares assigned (including the amount of co-investment) under the plan and the number of shares outstanding at December 31, 2013, is as follows:
|
Phase
|
No. of shares assigned
|
Outstanding shares at 12/31/13
|
Unit fair value
|
End date
|
||||
|
1
st
phase July 1, 2011
|
5,545,628
|
4,097,609
|
8.28
|
June 30, 2014
|
||||
|
2
nd
phase July 1, 2012
|
7,347,282
|
6,500,977
|
5.87
|
June 30, 2015
|
||||
|
3
rd
phase July 1, 2013
|
7,020,473
|
7,004,547
|
6.40
|
June 30, 2016
|
With respect to the first phase of this plan, Telefónica, S.A. acquired an instrument from a financial institution with the same features of the plan.
This plan is equity-settled via the delivery of shares to the participants. Accordingly, a balancing entry for the 39 million euros, 22 million euros and 8 million euros of employee benefits expenses recorded in 2013, 2012 and 2011, respectively, was made in equity.
Net cash from operating activities
In 2013, the Telefónica Group obtained operating cash flow (operating revenue less payments to suppliers for expenses and employee benefits expenses) totaling 18,565 million euros, 7.7% less than the 20,104 million euros generated in 2012. This decrease has been negatively affected by the exchange rate evolution.
Net cash flow from operating activities decreased from 15,213 million euros in 2012 to 14,344 million euros in 2013, down 5.7%, after a decrease of 13.0% from 2011 (17,483 million euros) to 2012.
The main items included in the net flow from operations are the following:
|
·
|
Cash received from customers decreased by 9.0% to 69,149 million euros (from 75,962 million euros in 2012). The decrease is mainly due to the exchange rate impact, and also to the decrease in the sale of handsets, as a consequence of the elimination of the subsidy and the reduction of the interconnection tariff in Europe, offset by the revenues increase in Latin America and the proactive policy of short term assets management reducing customer financing.
|
|
·
|
Cash payments to suppliers and employees in 2013 amounted to 50,584 million euros, down 9.4% from the 55,858 million euros recorded in 2012. Excluding the exchange rate effect, there is a decrease of 1.9% in payments to suppliers, driven by the new commercial model of cost reductions in Europe and the containment of short term liabilities of the Group, that have offset the increase in commercial activity in Latin America.
|
|
·
|
Cash payments to employees in 2013 (3,960 million euros) decreased by 19.51% from 2012 (4,920 million euros) due to the lower costs associated with the change in average headcount due to the sale of the Atento Group.
|
|
·
|
Cash flows arising from payments of interest and other finance costs and from dividends stood at 2,415 million euros in 2013, down 452 million from 2012. The 15.8% decrease in payments is primarily the result of the 11.4% reduction in the average debt and other non-recurring items.
|
|
·
|
Tax payments amount to 1,806 million euros in 2013, 10.8% lower than those made in 2012 (2,024 million euros). The main reason for this decrease is the reduction in profit, since the non-recurring payments in 2012 of 246 million euros arising from the settlement of tax assessments raised on inspection and court decisions affecting the consolidated tax Group and the return of 284 million euros in 2013 are offset by higher payments on account in Spain in 2013 due to the latest legislative amendments.
|
In 2012, the Telefónica Group obtained operating cash flow (operating revenue less payments to suppliers for expenses and employee benefits expenses) of 20,104 million euros, a decrease of 6.3% from the 21,453 million euros generated in 2011.
The main items included in the net flow from operations are the following:
|
·
|
Cash received from customers decreased by 1.63% to 75,962 million euros in 2012 (from 77,222 million euros in 2011). This decrease was primarily due to the adverse macroeconomic situation in Spain, as well as to the reduction in rates to respond to stiff market competition in the region.
|
|
·
|
Cash payments to suppliers and employees in 2012 amounted to 55,858 million euros, up 0.16% from the 55,769 million euros recorded in 2011. Payments to suppliers were in line with those of 2011, due to containment and management of current liabilities which offset the higher payments in order to comply with the Spanish Law on Arrears, as well as to the savings secured through the efficient sales policies.
|
|
·
|
Cash payments to employees in 2012 as compared to 2011 followed the trend resulting from costs associated with the change in average headcount.
|
|
·
|
Cash flows arising from payments of interest and other finance costs and from dividends stood at 2,867 million euros in 2012, up 856 million from 2011. Of these, approximately 308 million euros relate to non-recurring items
|
(interest payments as part of reorganization of Colombian companies, tax payments in Spain and Peru, and arrangement commissions on financing transactions). The remaining amount was primarily due to higher average debt in 2012 and the increase in costs due to the downward trends in financial markets.
|
·
|
Tax payments amounted to 2,024 million euros in 2012, up 3.3% compared to the 1,959 million euros recorded in 2011. This increase was primarily because of payments on account of income tax made in Spain in 2012, in the amount of 247 million euros, and payments derived from settlement of additional tax assessments raised on inspection and court decisions affecting the consolidated tax Group (246 million euros).
|
Net cash used in investing activities
Net cash used in investing activities increased by 25.7% in 2013 to 9,900 million euros from 7,877 million euros in 2012, mainly due to the decrease in the proceeds on disposal of companies, net of cash and cash equivalents, and the decrease in the amount of payments made on financial investments not included under cash equivalents.
|
·
|
Payments on investments in property, plant and equipment and intangible assets totaled 9,674 million euros in 2013, 2.0% higher than 2012 (9,481 million euros). This increase is due to higher purchases of spectrum licenses in Brazil and the United Kingdom, amounting to 531 and 669 million euros, respectively.
|
|
·
|
Proceeds on disposals of property, plant and equipment and intangible assets amounted to 561 million euros in 2013, a decrease of 40.3% mainly due to a reduction in the disposal of non-strategic assets (205 million euros).
|
|
·
|
During the year, proceeds on disposals of companies, net of cash and cash equivalents, amounted to 260 million euros. The most significant divestment was the sale of Hispasat, which entailed a net collection of 123 million euros.
|
|
·
|
During 2013, the payment on investments in companies, net of cash and cash equivalent acquired amounted to 398 million euros, mainly due to the share capital increase in Telco, S.p.A. (324 million euros, see Note 9).
|
|
·
|
Payments on financial investments not included under cash equivalents totaled 386 million euros for 2013, and mainly reflected the acquisition of a Telecom Italia bond for 103 million euros, as well as legal deposits, financial investments by Telefónica insurance companies and options on equity instruments.
|
|
·
|
In 2013, net cash flows in respect of cash surpluses not included under cash equivalents amounted to 314 million euros, in line with the 318 million euros recorded in 2012. Net investments in 2011 amounted to 646 million euros.
|
Net cash used in investing activities decreased by 37.0% in 2012 to 7,877 million euros from 12,497 million euros in 2011, primarily due to the decrease in payments on investments in companies, net of cash and cash equivalents, and the rise in proceeds on disposals of companies.
|
·
|
Payments on investments in property, plant and equipment and intangible assets totaled 9,481 million euros in 2012, 4.4% higher than in 2011 (9,085 million euros). This increase was due to the rise in acquisitions of property, plant and equipment and intangible assets during the period, especially the purchases of spectrum licenses in Spain and Ireland (396 million euros and 126 million euros, respectively).
|
|
·
|
Proceeds on disposals of property, plant and equipment and intangible assets amounted to 939 million euros in 2012, an increase of 15.8% from the 811 million euros recorded in 2011. These proceeds primarily relate to the disposal of non-strategic assets (841 million euros). In 2011, this item amounted to 693 million euros.
|
|
·
|
During the year, proceeds on disposals of companies, net of cash and cash equivalents, amounted to 1,823 million euros. The main divestments were the sale of 4.56% of China Unicom, which entailed a net collection of 1,132 million euros, the sale of Atento, which brought in net proceeds of 602 million euros, and the sale of Rumbo for 24 million euros.
|
|
·
|
Payments on financial investments not included under cash equivalents totaled 834 million euros for 2012, and mainly reflected the investment in Telco, S.p.A. for 277 million euros, as well as legal deposits, financial investments by Telefónica insurance companies and options on equity instruments.
|
Net cash used in financing activities
In 2013, net cash used in financing activities amounted to 2,685 million euros, increasing with respect to the previous year (1,243 million euros in 2012), primarily due to the decrease of the proceeds coming from loans, borrowings and promissory notes, as a consequence of a higher activity in the financial markets in previous periods.
|
·
|
Transactions with shareholders amounted to 65 million euros in 2013 (656 million in 2012).This difference mainly reflects the sale of 40% of the assets in Guatemala, Nicaragua, El Salvador and Panama that brought in net proceeds of 377 million euros (see Note 2), partially offset by the shares acquired from non-controlling interests mainly by Telefónica Czech Republic (61 million euros), and net payments for transactions with Telefónica, S.A. treasury shares.
|
|
·
|
The proceeds on operations with other equity holders amounted to 2,466 million euros in 2013, and include the amount related to the two issuances of undated deeply subordinated securities of 1,750 and 716 million euros, respectively (see Note 12).
|
|
·
|
In 2013, proceeds from new issues on bonds totaled 5,634 million euros, 30.4% lower than the 2012 proceeds (8,090 million euros), mainly made under the London Stock Exchange’s EMTN program (3,432 equivalent euros) of Telefónica Emisiones. The cancellation of debentures and bonds amounted to 5,667 million euros, a 31.3% increase compared to 2012, related to the maturity of bonds.
|
|
·
|
In 2013, repayment of loans, borrowings and promissory notes amounted to 6,232 million euros (8,041 million euros in 2012) and are mainly related to the maturity of Tranche A1 of the syndicated loan signed by Telefónica, S.A. on July 28, 2010 (1,000 million euros), and also to the reduction of the outstanding principal of Tranche B of the same syndicated loan by 3,000 million euros.
|
In 2012, net cash used in financing activities decreased by 74.69% to 1,243 million euros (4,912 million euros in 2011), primarily due to the lower outflow of cash for dividend payments following the change in shareholder remuneration policy, whereby optional bonus shares were made available and the dividend scheduled for November 2012 was cancelled.
|
·
|
Transactions with shareholders amounted to 656 million euros received in 2012, up from payments of 399 million euros in 2011. This difference mainly reflects the public share offer of Telefónica Germany that brought in net proceeds of 1,429 million euros. In addition, shares acquired from non-controlling interests mainly by Telefónica Czech Republic, entailed a total payment of 99 million euros. Net payments for transactions with Telefónica, S.A. treasury shares stood at 590 million euros.
|
|
·
|
In 2012, proceeds from new issues on bonds totaled 8,090 million euros, 76.6% higher than the 2011 proceeds (4,582 million euros), primarily reflecting new issues made under the London Stock Exchange’s EMTN program. Other transactions include payment of 1,942 million euros for the partial redemption of Telefónica Finance USA, LLC preference shares as part of the redemption of debentures and bonds, as well as proceeds of 1,165 million euros derived from Telefónica, S.A.’s bond issue as part of the same operation.
|
|
·
|
In 2012, proceeds from new issues was offset by repayment of loans, credit facilities and promissory notes, entailing payments of 8,401 million euros, increasing by more than three times than the payments made in 2011 (2,680 million euros), mainly due to the refinancing of tranche D of Telefónica Europe’s syndicated loan, as well as the increase in the loan granted to Telco, S.p.A. for 208 million euros.
|
a) Litigation and arbitration
Telefónica and its group companies are party to several legal proceedings which are currently in progress in the courts of law and the arbitration bodies of the various countries in which we are present.
Based on the advice of our legal counsel it is reasonable to assume that these legal proceedings will not materially affect our financial condition or solvency, regardless the unfavorable outcome in any of them.
The contingencies arising from the litigation and commitments described below were evaluated (see Note 3.m) when the consolidated financial statements for the year ended December 31, 2013 were prepared. The provisions recorded in respect of the commitments taken as a whole are not material.
The following unresolved legal proceedings or those underway in 2013 are highlighted (see Note 17 for details of tax-related cases):
Contentious proceedings in connection with the merger between Terra Networks, S.A. and Telefónica
On September 26, 2006, Telefónica was notified of the claim filed by former shareholders of Terra Networks, S.A. (Campoaguas, S.L., Panabeni, S.L. and others) alleging breach of contract in respect of the terms and conditions set forth in the Prospectus of the Initial Public Offering of shares of Terra Networks, S.A. dated October 29, 1999. The court rejected this claim and ordered the plaintiffs to pay court costs by a ruling issued on September 21, 2009. The plaintiffs appealed this ruling on December 4, 2009, and Telefónica was notified of such appeal on June 16, 2010. Telefónica opposed to the appeal on January 5, 2011. On April 23, 2013, we were notified a ruling of the Madrid Regional Court dismissing in its entirety the appeal filed by the plaintiffs against the first instance ruling handed down in 2009, confirming the rulings of the decision under appeal and ordering appellants to pay court costs. The ruling became firm on May 29, 2013, with no further appeals possible.
Cancellation of the UMTS licence granted to Quam GMBH in Germany
In December 2004, the German Telecommunications Market Regulator revoked the UMTS licence granted in 2000 to Quam GmbH ("Quam"), in which Telefónica has a stake. After obtaining a suspension of the revocation order, on 16 January 2006, Quam filed a suit against the order with the German courts. This claim sought two objectives: 1) to overturn the revocation order issued by the German Telecommunications Market Regulator, and 2) if this failed, to be reimbursed for the total or partial payment of the original amount paid for the licence, 8,400 million euros.
This claim was rejected by the Cologne Administrative Court. Quam appealed the decision before the Supreme Administrative Court of North Rhine-Westphalia, which also rejected its appeal.
Finally, Quam filed a new claim in third instance before the Federal Supreme Court for Administrative Cases, which was not admitted for processing.
Quam appealed this decision on August 14, 2009. On August 17, 2011, after the oral hearing, the Federal Administrative Court rejected Quam’s appeal at third instance.
In October 2011, Quam filed a constitutional complaint before the German Federal Constitutional Court (Karlsruhe).
Appeal against the European Commission Ruling of July 4, 2007 against Telefónica de España’s broadband pricing policy
On July 9, 2007, Telefónica was notified of the Decision issued by the European Commission (the "EC") imposing on Telefónica and Telefónica de España, S.A.U. ("Telefónica de España") a fine of approximately 152 million euros for breach of the former Article 82 of the Treaty Establishing the European Community for not charging equitable prices to whole and retail broadband access services. The court ruled in favor of the EC accusing Telefónica of applying a margin squeeze between the prices it charged competitors to provide regional and national wholesale broadband services and its retail broadband prices using ADSL technology between September 2001 and December 2006.
On September 10, 2007, Telefónica and Telefónica de España, S.A.U. filed an appeal to overturn the decision before the General Court of the European Union. The Kingdom of Spain, as an interested party, also lodged an appeal to overturn the decision. Meanwhile, France Telecom and the Spanish Association of Bank Users (AUSBANC) filed requests to intervene, which the General Court admitted.
In October 2007, Telefónica, S.A. presented a guarantee for an indefinite period of time to secure the principal and interest.
A hearing was held on May 23, 2011, at which Telefónica presented its case. On March 29, 2012, the General Court ruled rejecting the appeal by Telefónica and Telefónica de España, confirming the sanction imposed by the EC. On June 13, 2012, an appeal against this ruling was lodged before the European Court of Justice.
On September 26, 2013, the Attorney General presented its conclusions to the Court stating of a possible breach of the principle of non-discrimination with respect to the sanction and a defective application of the principle of full jurisdiction by the General Court, requesting the return of the lawsuit to the instance.
Appeal against the Decision by Agencia Nacional de Telecomunicações (ANATEL) regarding the inclusion of interconnection and network usage revenues in the Fundo de Universalização de Serviços de Telecomunicações ("FUST")
Vivo Group operators, together with other cellular operators, appealed ANATEL’s Decision of December 16, 2005, to include interconnection and network usage revenues and expenses in the calculation of the amounts payable into the Fund for Universal Access to Telecommunications Services – a fund which pays for the obligations to provide universal service - with retroactive application from 2000. On March 13, 2006, the Brasilia Regional Federal Court granted a precautionary measure which stopped the application of ANATEL’s Decision. On March 6, 2007, a ruling in favor of the wireless operators was issued, stating that it was not appropriate to include the revenues received by transfer from other operators in the taxable income for the FUST’s calculation and rejecting the retroactive application of ANATEL’s Decision. ANATEL filed an appeal to overturn this decision with Brasilia Regional Federal Court no. 1. This appeal is pending resolution.
At the same time, Telefónica Brazil and Telefónica Empresas, S.A., together with other wireline operators through ABRAFIX (Associação Brasileira de Concessionárias de Serviço Telefonico Fixo Comutado) appealed ANATEL’s Decision of December 16, 2005, also obtaining the precautionary measures requested. On June 21, 2007, Federal Regional Court no. 1 ruled that it was not appropriate to include the interconnection and network usage revenues and expense in the FUST’s taxable income and rejected the retroactive application of ANATEL’s decision. ANATEL filed an appeal to overturn this ruling on April 29, 2008, before Brasilia Federal Regional Court no. 1.
No further action has been taken since then. The amount of the claim is quantified at 1% of the interconnection revenues.
Public civil procedure by the São Paulo government against Telefónica Brazil for alleged reiterated malfunctioning in services provided by Telefónica Brazil
This proceeding was filed by the Public Ministry of the State of São Paulo for alleged reiterated malfunctioning in the services provided by Telefónica Brazil, seeking compensation for damages to the customers affected. A general claim is filed by the Public Ministry of the State of São Paulo, for 1,000 million Brazilian reais (approximately 370 million euros), calculated on the company’s revenue base over the last five years.
In April 2010, a ruling in first instance against the Telefónica Group was issued, there will not be a precision of its effects until there is a final ruling, and the total amount of persons affected and party in the procedure is known. At that moment, the amount of the indemnity will be established, ranging between 1,000 million reais and 60 million reais (approximately, between 370 million euros and 22 million euros), depending on the number of parties. On May 5, 2010, Telefónica Brazil filed an appeal before the São Paulo Court of Justice, suspending the effect of the ruling. No further action has been taken since then.
Appeal against the Decision of the European Commission dated January 23, 2013 to sanction Telefónica for the infringement of Article 101 of the Treaty on the functioning of the European Union
On January 19, 2011, the EC initiated formal proceedings to investigate whether Telefónica, S.A. and Portugal Telecom SGPS, S.A. ("Portugal Telecom") had infringed on European Union anti-trust laws with respect to a clause contained in
the sale and purchase agreement of Portugal Telecom’s ownership interest in Brasilcel, N.V., a joint venture in which both were venturers and owner of Brazilian company Vivo.
On January 23, 2013, the EC passed a ruling on the formal proceedings. The ruling imposed a fine on Telefónica of 67 million euros, as the EC ruled that Telefónica and Portugal Telecom committed an infraction as stipulated in Article 101 of the Treaty on the Functioning of the European Union (“TFUE”) for having entered into the agreement set forth in Clause Nine of the sale and purchase agreement of Portugal Telecom’s ownership interest of Brasilcel, N.V.
On April 9, 2013, Telefónica filed an appeal for annulment of this ruling with the European Union General Court. On August 6, 2013, the General Court notified Telefónica of the response issued by the European Commission, in which the EC reaffirmed the main arguments of its ruling and, specially, that Clause Nine is a competition restriction. On September 30, 2013, Telefónica filed its reply. On December 18, 2013, the European Commission filed its appeal.
b) Commitments
Telefónica Internacional, S.A.U. as strategic partner of Colombia Telecomunicaciones, S.A. ESP
Pursuant to amendment nº 1 of the Framework Investment Agreement executed on March 30, 2012, after the closing of the merger between Colombia Telecomunicaciones, S.A. ESP and Telefónica Móviles Colombia, S.A., the Colombian Government may, at any time, offer to Telefónica all or part of the shares it holds in the company, the latter being obliged to acquire them, (directly or via one of its subsidiaries) provided that any of the following circumstances becomes applicable: (i) Colombia Telecomunicaciones, S.A. ESP fails to meet its payment obligations under the terms of the ”Contrato de Explotación”, of two accumulated bi-monthly installments of the consideration fees; (ii) the increase in EBITDA is less than 5.75% in the measurement periods, and provided that during the twelve (12) months following the ordinary shareholders’meetings during which the measurement was made, at least one of the following occurs: 1) Colombia Telecomunicaciones S.A. ESP makes capital investments (CapEx) exceeding 12.5% of its revenues for services; 2) Colombia Telecomunicaciones S.A. ESP has paid a brand fee or any other type of payment to the Strategic Partner for the use of its brands; or 3) orders and/or pays dividends with the favorable vote of the Strategic Partner.
From January 1, 2013, the Colombian Government can require Telefónica to vote in favor of the register of the shares of Colombia Telecomunicaciones, S.A. ESP in the National Securities and Issuer’s Registry and in the Colombia Stock Exchange.
In addition, if Telefónica decides to dispose or transfer of all or part of its shareholding in Colombia Telecomunicaciones, S.A. ESP to third parties, Telefónica commits that(i) the acquirer or transferee will be obliged to adhere to the Framework Investment Agreement; and (ii) that the acquirer or transferee will be obliged to present an offer to purchase all of the shares in Colombia Telecomunicaciones, S.A. ESP held by the Colombian Government at the same price and under the same terms and conditions negotiated with Telefónica, through the legally-established procedure for disposal of shares held by public entities.
Lastly, the Colombian Government will be entitled to subscribe or acquire, at no cost or compensation, a number of shares necessary to bring its aggregate holding in Colombia Telecomunicaciones S.A. ESP up to 3%, depending on the compound growth in EBITDA between 2011 and 2014, the impact of this commitment not being relevant to the consolidated financial statements of the Company.
Atento
As a result of the sale agreement of Atento by Telefónica, announced on October 12, 2012 and ratified on December 12, 2012, both companies have signed a Master Service Agreement which regulates Atento’s relationship with the Telefónica Group as a service provider for a period of nine years.
By virtue of this Agreement, Atento become Telefónica’s preferred Contact Centre and Customer Relationship Management (CRM) service provider, stipulating annual commitments in terms of turnover which updates in line with inflation and deflation that vary from country to country, pursuant to the volume of services Atento has been providing to the entire Group.
In the case of an eventual failure to meet the annual turnover commitments that could result in a compensation, which would be calculated based on the difference between the actual amount of turnover and the predetermined commitment, applying a percentage based on the Contract Centre’s business margin to the final calculation.
Lastly, the Master Agreement sets forth a reciprocal arrangement, whereby Atento assumes similar commitments to subscribe its telecommunications services to Telefónica.
Final and binding agreement with Telekom Deutschland AG in December 2013
Having signed a respective "memorandum of understanding" on May 2, 2013, Telefónica Deutschland and Telekom Deutschland GmbH have entered into a final and binding agreement on December 20, 2013, with regard to fixed-line services. Such agreement foresees the transition from Telefónica Deutschland’s Asymmetrical Digital Subscriber Line ("ADSL") infrastructure to the advanced network infrastructure of Telekom Deutschland (the so-called "next generation access platform" or NGA platform) and shall enable Telefónica Deutschland to offer its customers high-speed internet products with data transfer rates of up to 100Mbit/s.
In June 2013, the Federal Cartel Office (Bundeskartellamt) has confirmed that the cooperation is not subject to merger control clearance, however, it announced in December 2013 that it would perform a general analysis of impacts to competition, which is expected to be finalized within the first half of 2014. In the proceeding for the regulatory clearance of the envisaged cooperation the Federal Network Agency (Bundesnetzagentur) has published a draft decision on December 17, 2013, by which the proceeding shall be terminated without any remedies. The draft decision has been publicly consulted in Germany and notified to the European Commission. The start of the cooperation is subject to the final decision of the Federal Network Agency once the notification procedure with the European Commission has been finalized. This is expected within the first half of 2014. The completion of the transition to Telekom Deutschland’s NGA platform is expected for 2019.
Agreement for the sale of the stake in Telefónica Ireland, Ltd.
On June 24, 2013, Telefónica reached an agreement with Hutchison Whampoa Group, for the total divestment of the Telefónica Group in the share capital of Telefónica Ireland, Ltd.
The agreed value of the sale equaled 850 million euros, including an initial cash consideration of 780 million euros at closing of the transaction, and an additional deferred payment of 70 million euros based on the completion of agreed financial objectives.
The transaction is subject, among other conditions, to the relevant competition approvals.
Agreement for the acquisition of E-Plus
Telefónica, S.A. and its German listed subsidiary Telefónica Deutschland Holding AG (hereinafter, “Telefónica Deutschland”) on July 23, entered into an agreement (amended on August 26, 2013) with the Dutch company Koninklijke KPN N.V. (hereinafter, “KPN”) under which Telefónica Deutschland committed itself to acquire the shares of the German subsidiary of KPN, E-Plus Mobilfunk GmbH & Co. KG (hereinafter, “E-Plus”), receiving KPN, as consideration, 24.9% of Telefónica Deutschland and 3,700 million euros.
Telefónica committed to subsequently acquire from KPN, 4.4% of Telefónica Deutschland for a total amount of 1,300 million euros, consequently, after the aforementioned acquisition, KPN’s stake in Telefónica Deutschland will be reduced to 20.5%.
Telefónica also committed to subscribe the proportional corresponding share in the capital increase approved by Telefónica Deutschland in the Extraordinary General Meeting held on February 11, 2014, to finance the cash consideration of the transaction.
The closing of this transaction is subject to certain conditions of which only the relevant authorization from the Competition Authority remains.
Agreement with the shareholders of Telco, S.p.A.
|
§
|
On September 24, 2013, Telefónica and the remaining shareholders of the Italian company Telco, S.p.A. (which holds a capital stake of 22.4% of the voting share capital of Telecom Italia, S.p.A.) reached an Agreement by virtue of which:
|
|
-
|
Telefónica subscribed for and paid out a capital increase in Telco, S.p.A., through the contribution of 324 million euros in cash, receiving in return non-voting shares of Telco, S.p.A. As a result of this capital increase, the interest held by Telefónica in the voting share capital of Telco, S.p.A. remained unchanged (i.e. 46.18%), although
its interest in the total share capital of Telco, S.p.A. has increased to 66%. The current governance structure at Telco, S.p.A. remained unaffected, including the obligation by Telefónica of abstaining from participating or influencing in any decisions which could affect the markets in which both, Telefónica and Telecom Italia, S.p.A., are present.
|
|
-
|
Subject to receiving any required anti-trust and telecommunications approvals (including in Brazil and Argentina), Telefónica will subscribe for and pay out a second capital increase in Telco, S.p.A., through the contribution of 117 million euros in cash and will receive in return non-voting shares of Telco, S.p.A. As a result of this second capital increase, the interest of Telefónica in the voting share capital of Telco, S.p.A. will remain unchanged (i.e. 46.18%), although its interest in the total share capital will be then increased to 70%.
|
|
-
|
Starting from January 1, 2014, subject to receiving any required anti-trust and telecommunications approvals (including in Brazil and Argentina), Telefónica may convert all or a portion of its non-voting shares in Telco, S.p.A. into voting shares in Telco, S.p.A., representing no more than 64.9% of the voting share capital of Telco, S.p.A.
|
|
-
|
The Italian shareholders of Telco, S.p.A. have granted Telefónica a call option to acquire all of their shares in Telco, S.p.A., whose exercise is subject to receiving any required anti-trust and telecommunications approvals (including in Brazil and Argentina). The call option may be exercised by Telefónica starting from January 1, 2014, while the Shareholders Agreement remains in effect, except (i) between June 1, 2014, and June 30, 2014, and between January 15, 2015, and February 15, 2015, and (ii) during certain periods, if the Italian shareholders of Telco, S.p.A. request the demerger of Telco, S.p.A.
|
At of the date of the preparation of these consolidated financial statements the approvals that are necessary for the implementation of the transactions contemplated in the Agreement dated September 24, 2013, and subscribed between Telefónica and the remaining shareholders of the Italian company Telco S.p.A.
have not been obtained yet.
|
§
|
On December 4, 2013, the Brazilian Antitrust Regulator, Conselho Administrativo de Defesa Econômica (CADE) announced, the two following decisions:
|
|
1.
|
To approve, with the restrictions mentioned below, the acquisition by Telefónica of the entire participation held by Portugal Telecom, SGPS S.A., and PT Móveis - Serviços de Telecomunicações, SGPS, S.A., (the “PT Companies”) in Brasilcel N.V., which controlled the Brazilian mobile company, Vivo Participações S.A.
|
It must be noted that such transaction was approved by ANATEL (Brazilian Telecommunications Regulation Authority) and the closing (which did not require CADES´s prior approval at the time), occurred immediately after such ANATEL´s approval, on September 27, 2010.
The above mentioned decision has been granted by CADE conditional on:
|
(a)
|
The entry of a new shareholder in Vivo, sharing with Telefónica the control of Vivo in conditions identical to those that were applicable to the PT Companies when they had a participation in Brasilcel N.V., or
|
|
(b)
|
That Telefónica ceases to have any direct or indirect financial interest in TIM Participações S.A.
|
|
2.
|
To impose on Telefónica a fine of 15 million Brazilian Reais, for having allegedly breached the spirit and the goal of the agreement signed between Telefónica and CADE (as a condition to the approval of Telefónica´s original acquisition of an interest in Telecom Italia in 2007), due to the subscription of non-voting shares of Telco on a recent capital increases. This decision also requires Telefónica to divest such non-voting shares of Telco S.p.A.
|
The timing for the accomplishment of the conditions and obligations imposed by CADE on both decisions was classified by CADE as confidential and reserved information.
|
§
|
On December 13, 2013, Telefónica, S.A. announced, in relation to the two Decisions adopted by CADE on its December 4, 2013, session, that the company considers that the remedies imposed were unreasonable and therefore, is further analyzing the possibility of initiating the appropriate legal actions.
|
In line with such course of action, and to reinforce our strong commitment with the previous obligations undertaken by Telefónica to remain separate from Telecom Italia´s Brazilian businesses, Telefónica, S.A., highlighted in the aforementioned announcement, that Mr. César Alierta Izuel and Mr. Julio Linares López have decided to resign, with immediate effect, from their positions as Directors of Telecom Italia; and Mr. Julio Linares has decided to resign, with
immediate effect, from his position in the slate submitted by Telco, S.p.A. for the potential re-election of the Board of Directors of Telecom Italia in the Shareholders Meeting of the aforementioned company, called for December 20, 2013.
For the same reasons, Telefónica, S.A., indicated that, without prejudice of any of the rights recognized in Telco, S.p.A. Shareholder`s Agreement, has decided for the time being not to avail of its right to appoint two Directors in the Board of Directors of Telecom Italia.
Agreement for the sale of a stake in Telefónica Czech Republic, a.s.
On November 5, 2013, Telefónica reached an agreement with PPF Group N.V. (hereinafter PPF) to sell 65.9% of Telefónica Czech Republic, a.s. (hereinafter Telefónica Czech Republic) for an amount of, approximately, 306 Czech Crowns per share in cash (approximately 2,467 million euros at the date of the agreement).
The agreement stated that aforementioned consideration was to be paid in two tranches:
|
(i)
|
2,063 million euros in cash up front at closing of the transaction; and
|
|
(ii)
|
404 million euros in cash as deferred payments over a 4 year period.
|
Additionally, Telefónica received an amount of 260 million euros corresponding to the distribution to shareholders approved by the General Shareholders Meeting of Telefónica Czech Republic, paid on November 11, 2013.
As a result of this transaction, Telefónica will hold a 4.9% equity stake in Telefónica Czech Republic. In addition, Telefónica will remain as a Company’s industrial and commercial partner for 4 years:
|
·
|
Telefónica Czech Republic will be renamed but will continue using the O2 brand for up to four years.
|
|
·
|
The Company will become part of Telefónica’s Business Partners Program.
|
In connection with this transaction, PPF will launch a Mandatory Tender Offer. Telefónica will maintain its 4.9% but may dispose of the shares upon completion, subject to certain restrictions.
Furthermore, the agreement establishes a put/call option structure in relation to the Telefónica Czech Republic shares which Telefónica holds after 4 years. In addition, the agreement includes tag along/drags along clauses.
The transaction was completed on January 28, 2014, after obtaining the relevant regulatory authorization.
Telefónica has an integrated Green ICT and Environment strategy with three common goals. The first concerns environmental risk management, the second the promoting of internal eco-efficiency, and the third the unlocking of business opportunities to offer end-to-end telecommunications services that support a low-carbon economy.
The Group has an Environmental Policy covering all its companies, as well as a Global Environmental Management System to ensure compliance with local environmental laws and continuously improve management processes. The Climate Change and Energy Efficiency Corporate Office is also responsible for rolling out processes to boost energy efficiency and shrink the Group’s carbon footprint.
d) Auditors’ fees
The expenses accrued in respect of the fees for services rendered to the various member firms of the EY international organization (previously Ernst & Young), of which Ernst & Young, S.L. (the auditors of the Telefónica Group) forms part, amounted to 22.72 million euros and 25.84 million euros in 2013 and 2012, respectively.
The detail of these amounts is as follows:
|
Millions of euros
|
2013
|
2012
|
|||||
|
Audit services (1)
|
21.25 | 23.84 | |||||
|
Audit-related services (2)
|
1.47 | 2.00 | |||||
|
TOTAL
|
22.72 | 25.84 | |||||
|
(1) Audit services: services included under this heading are mainly the audit of the annual and reviews of interim financial statements, work to comply with the requirements of the Sarbanes-Oxley Act (Section 404) and the review of the 20-F report to be filed with the US Securities and Exchange Commission (SEC).
|
|||||||
|
(2) Audit-related services: This heading mainly includes services related to the review of the information required by regulatory authorities, agreed financial reporting procedures not requested by legal or regulatory bodies and the review of corporate responsibility reports.
|
|||||||
EY has not rendered tax services or any other service other than those mentioned above to Telefónica Group companies.
The expenses accrued in respect of the fees for services rendered to other auditors in 2013 and 2012 amounted to 43.86 million euros and 40.68 million euros, respectively, as follows:
|
Millions of euros
|
2013
|
2012
|
|||||
|
Audit services
|
1.11 | 1.04 | |||||
|
Audit-related services
|
0.36 | 1.73 | |||||
|
Tax services
|
7.59 | 5.47 | |||||
|
All other services (consulting, advisory, etc.)
|
34.80 | 32.44 | |||||
|
TOTAL
|
43.86 | 40.68 | |||||
e) Trade and other guarantees
The Company is required to issue trade guarantees and deposits for concession and spectrum tender bids (see Note 16) and in the ordinary course of its business. No significant additional liabilities in the accompanying consolidated financial statements are expected to arise from guarantees and deposits issued.
f) Directors’ and Senior Executives’ compensation and other benefits
Board of Directors’ compensation
The compensation of Telefónica members of the Board of Directors is governed by Article 35 of the Bylaws, which states that the compensation amount that the Company may pay to all of its Directors as remuneration and attendance fees shall be fixed by the shareholders at the General Shareholders’ Meeting. The Board of Directors shall determine the exact amount to be paid within such limit and the distribution thereof among the directors. This compensation, as established in said article of the Bylaws, is compatible with other professional or employment compensation accruing to the Directors by reason of any executive or advisory duties that they perform for the Company, other than the supervision and collective decision-making duties inherent in their capacity as Directors.
Accordingly, the shareholders, at the Annual General Shareholders Meeting held on April 11, 2003, set the maximum gross annual amount to be paid to the Board of Directors at 6 million euros, including a fixed payment and fees for attending meetings of the Board of Director’s Advisory or Control Committees. Total compensation paid to Telefónica’s Directors for discharging their duties in 2013 amounted to 3,516,669 euros in fixed compensation and attendance fees.
The compensation of Telefónica, S.A. directors in their capacity as members of the Board of Directors, the Executive Commission and/or the Advisory and Control Committees consists of a fixed amount payable monthly, and fees for
attending the meetings of the Board’s Advisory or Control Committees. Executive Directors other than the Chairman do not receive any amounts for their directorships, but only the corresponding amounts for discharging their executive duties as stipulated in their respective contracts.
It is hereby stated that the Company’s Board of Directors, at its meeting of July 25, 2012, agreed to a 20% reduction of the amounts that the Board members receive for discharging their duties.
The tables below presents the fixed amounts established in 2013 for membership to Telefónica’s Board of Directors, Executive Commission and Advisory or Control Committees and the attendance fees of the Advisory or Control Committees.
Compensation of members of the Board of Directors and Board Committees
|
Amounts in euros
|
||||||
|
Position
|
Board of Directors
|
Executive Committee
|
Advisory or Control Committees (*)
|
|||
|
Chairman
|
240,000
|
80,000
|
22,400
|
|||
|
Vice Chairman
|
200,000
|
80,000
|
−
|
|||
|
Executive
|
−
|
−
|
−
|
|||
|
Proprietary
|
120,000
|
80,000
|
11,200
|
|||
|
Independent
|
120,000
|
80,000
|
11,200
|
|||
|
Other external
|
120,000
|
80,000
|
11,200
|
(*) In addition, the amounts paid for attendance to each of the Advisory or Control Committee’s meetings is 1,000 euros.
Individual breakdown
Appendix II provides a detail by individual, by compensation item, of the compensation and benefits paid by Telefónica, S.A. and other companies of the Telefónica Group to members of the Company’s Board of Directors in 2013.
g) Equity investments and positions held and duties performed in companies engaging in an activity that is identical, similar or complementary to that of the Company
Pursuant to Section 229 of the consolidated Corporate Enterprises Act, introduced by Royal Legislative Decree 1/2010 of July 2, details are given below of (i) the direct and indirect interests held by members of the Board of Directors of Telefónica, S.A., and by persons related thereto as set out in Section 231 of the consolidated Corporate Enterprises Act and (ii) the positions or duties carried out by those individuals, both of the foregoing in respect to companies with the same, analogous, or similar corporate purpose as that of Telefónica, S.A.
|
Name
|
Activity performed
|
Company
|
Position or functions
|
Stake (%) (*)
|
||||
|
Mr. Isidro Fainé Casas
|
Telecommunications
|
Abertis Infraestructuras, S.A.
|
Vice Chairman 1º
|
< 0.01%
|
||||
|
Mr. Isidro Fainé Casas
|
Telecommunications
|
Telecom Italia, S.p.A.
|
--
|
< 0.01% (**)
|
||||
|
Mr. Carlos Colomer Casellas
|
Telecommunications
|
Abertis Infraestructuras, S.A.
|
Director
|
--
|
||||
|
Mr. Luiz Fernando Furlán
|
Telecommunications
|
Abertis Infraestructuras, S.A.
|
Advisory Board Member
|
--
|
(*) Shareholding of less than 0.01% of share capital indicated by “<0.01%”.
(**) Shareholding of the total number of ordinary shares.
Information on Board member Chang Xiaobing, Executive Chairman of China Unicom (Hong Kong) Limited, is not included in this section given that:
|
·
|
In accordance with Article 33 of the Company’s Bylaws, whereby “(...) the following shall not be deemed to be in a situation of effective competition with the Company, even if they have the same or a similar or complementary
corporate purpose: (...) companies with which Telefónica, S.A. maintains a strategic alliance", Mr. Xiaobing’s interests are not in conflict with those of Telefónica, S.A.
|
|
·
|
Mr. Xiaobing holds no stakes in the capital of the companies in which he is a Board member (Section 229 of the Corporate Enterprises Act).
|
In addition, for information purposes, details are provided below on the positions or duties performed by members of the Board of Directors of Telefónica, S.A. in those companies whose activity is identical, similar or complementary to the corporate purpose of the Company, of any Telefónica Group company, or of any company in which Telefónica, S.A. or any of its Group companies holds a significant interest whereby it is entitled to board representation in those companies or in Telefónica, S.A.
|
Name
|
Company
|
Position or functions
|
||
|
Mr. César Alierta Izuel
|
China Unicom (Hong Kong) Limited
|
Director
|
||
|
Mr. Alfonso Ferrari Herrero
|
Telefónica Chile, S.A.
|
Acting Director
|
||
|
Telefónica del Perú, S.A.A.
|
Director
|
|||
|
Mr. Francisco Javier de Paz Mancho
|
Telefónica Brasil, S.A.
|
Director
|
||
|
Telefónica de Argentina, S.A.
|
Director
|
|||
|
Mr. José Fernando de Almansa Moreno-Barreda
|
Telefónica Brasil, S.A.
|
Director
|
||
|
Telefónica Móviles México, S.A. de C.V.
|
Director
|
|||
|
Mr. Gonzalo Hinojosa Fernández de Angulo
|
Telefónica del Perú, S.A.A.
|
Director
|
||
|
Mr. Luiz Fernando Furlán
|
Telefónica Brasil, S.A.
|
Director
|
||
|
Ms. María Eva Castillo Sanz
|
Telefónica Czech Republic, a.s.
|
Chairwoman of Supervisory Board (1)
|
||
|
Telefónica Europe, Plc.
|
Chairwoman
|
|||
|
Telefónica Deutschland Holding, A.G.
|
Chairwoman of Supervisory Board
|
|||
|
Tuenti Technologies, S.L.
|
Chairwoman
|
|||
|
Mr. Santiago Fernández Valbuena
|
Telefónica Internacional, S.A.
|
Chairman
|
||
|
Telefónica América, S.A.
|
Chairman
|
|||
|
Telefónica Brasil, S.A.
|
Vice Chairman
|
|||
|
Telefónica Móviles México, S.A. de C.V.
|
Vice Chairman
|
|||
|
Colombia Telecomunicaciones, S.A., E.S.P.
|
Director
|
|||
|
Telefónica Chile, S.A.
|
Acting Director
|
|||
|
Telefónica Capital, S.A.
|
Sole Director
|
|||
|
Mr. Chang Xiaobing
|
China United Network Communications Group Company Limited
|
Chairman
|
||
|
China United Network Communications Corporation Limited
|
Chairman
|
|||
|
China Unicom (Hong Kong) Limited
|
Executive Chairman
|
|||
|
China United Network Communication Limited
|
Chairman
|
|
(1)
|
On January 29, 2014, Ms. Eva Castillo Sanz resigned from the position of Chairwoman of the Supervisory Board of Telefónica Czech Republic, a.s.
|
a) Finance lease agreement at Colombia Telecomunicaciones, S.A., ESP.
The Group, through its subsidiary Colombia Telecomunicaciones, S.A., ESP, has a finance lease agreement with PARAPAT, the consortium which owns the telecommunications assets and manages the pension funds for the entities which were predecessors to Colombia Telecomunicaciones, S.A., E.S.P., and which regulated the operation of assets, goods and rights relating with the provision of telecommunications services by the company, in exchange for financial consideration.
This agreement includes the transfer of these assets and rights to Colombia Telecomunicaciones, S.A., ESP once the last installment of the consideration has been paid in line with the payment schedule:
|
Present value
|
Revaluation
|
Pending payment
|
|||||||||
|
Within one year
|
104 | 6 | 110 | ||||||||
|
From one to five years
|
538 | 203 | 741 | ||||||||
|
More than five years
|
809 | 1,603 | 2,412 | ||||||||
|
Total
|
1,451 | 1,812 | 3,263 | ||||||||
The net amount of property, plant and equipment recorded under the terms of this lease was 310 million euros at December 31, 2013.
b) Other finance leases
The payment schedule of finance leases of the Telefónica Group, excluding Colombia Telecomunicaciones, S.A. ESP., is as follows:
|
Present value
|
Revaluation
|
Pending payment
|
|||||||||
|
Within one year
|
138 | 2 | 140 | ||||||||
|
From one to five years
|
106 | 22 | 128 | ||||||||
|
More than five years
|
113 | 319 | 432 | ||||||||
|
Total
|
357 | 343 | 700 | ||||||||
At December 31, 2013, net assets under these leases amounting to 153 million euros were recognized under property, plant and equipment.
The following events regarding the Telefónica Group took place between December 31, 2013 and the date of authorization for issue of the accompanying consolidated financial statements:
Financing
On January 31, 2014, Telefónica Emisiones, S.A.U. redeemed 296 million sterling pounds (equivalent to 355 million euros) of its notes, issued on December 28, 2006. The notes were guaranteed by Telefónica, S.A.
On February 3, 2014, Telefónica Emisiones, S.A.U. redeemed 2,000 million euros of its notes, issued on February 3, 2009. The notes were guaranteed by Telefónica, S.A.
On February 7, 2014, Telefónica Emisiones, S.A.U. redeemed 1,500 million euros of its notes, issued on February 7, 2007. The notes were guaranteed by Telefónica, S.A.
On February 7, 2014, Telefónica, S.A. made an early repayment for 923 million euros of its syndicated loan (Tranche D2) dated March 2, 2012 (originally scheduled to mature on December 14, 2015).
On February 7, 2014, Telefónica Europe, B.V. made an early repayment for 801 million euros of its syndicated loan (Tranche D1) dated March 2, 2012 (originally scheduled to mature on December 14, 2015).
On February 10, 2014, O2 Telefónica Deutschland Finanzierungs, GmbH issued seven-year notes in an aggregate principal amount of 500 million euros maturing on February 10, 2021, and with an annual interest rate of 2.375%. These notes are guaranteed by Telefónica Deutschland Holding, A.G.
On February 18, 2014, Telefónica, S.A. signed a 3,000 million euros syndicated revolving credit facility maturing on February 18, 2019. This agreement would enter into effect on February 25, 2014, cancelling the 3,000 million euros syndicated credit facility signed on July 28, 2010 (originally scheduled to mature in 2015).
Sale of Telefónica Czech Republic
On January 28, 2014 after obtaining the relevant regulatory approval the sale of Telefónica Czech Republic was completed. Subsequent to the sale, Telefónica holds a 4.9% stake in Telefónica Czech Republic, a.s.
New exchange rate regime in Venezuela
On January 24, 2014, Exchange Agreement No. 25 came into force, which regulates the sale of foreign currency in the Republic of Venezuela for certain sectors and items. This Agreement does not amend the exchange rate of 6.30 bolivar per US dollar, which has applied since Exchange Agreement No. 14 was approved on February 8, 2013, except for: (i) cash for travelling abroad and remittances to individuals domiciled abroad; (ii) payment of operations inherent to national civil aviation and the international air transportation public service; (iii) operations inherent to the insurance activity; (iv) leasing and service agreements, agreements for the import of intangible assets, payments of rental contracts for networks, and payments corresponding to the telecommunications sector; and (v) foreign investments and payments of royalties, use and exploitation of patents, trademarks and franchises, as well as technology import and technical assistance agreements.
Requests for the liquidation in US dollars of the aforementioned concepts will be settled, at the foreign exchange rate resulting from the allocations conducted through the Complementary System for Administration of Foreign Currency (SICAD). The SICAD allocation as of January 15, 2014, resulted in an exchange rate of 11.36 bolivar per US dollar. Nonetheless, the said Agreement stipulates that the liquidation of foreign currency operations requested before the Central Bank of Venezuela before Exchange Agreement No. 25 came into force, will be settled at the exchange rate established in the February 8, 2013, Exchange Agreement, i.e. at a rate of 6.30 bolivar per US dollar.
The change to the currency exchange system introduced in the aforesaid Agreement will take effect in the Telefónica Group’s consolidated financial statements from the moment it comes into force, on January 24, 2014. It is therefore a subsequent event that does not impact the consolidated financial statements, as the previous exchange rate of 6.30 bolivar per US dollar was in force at 2013 year end and up to January 24, 2014, for all foreign currency transactions.
The main aspects to be considered in 2014 are as follows. In order to estimate the impacts in euros, the rate used is the exchange rate resulting from the SICAD allocation as of January 15, 2014, amounting to 11.36 bolivar per US dollar, which will vary throughout 2014.
|
·
|
The decrease of the Telefónica Group’s net assets in Venezuela as a result of the conversion to euros at the new exchange rate with a balancing entry in Group equity of approximately 1,800 million euros, based on the net assets as at December 31, 2013.
|
|
·
|
As part of the decrease mentioned in the preceding paragraph, the value in euros of the net financial assets denominated in bolivar will decrease by approximately 1,200 million euros, as per the balance as of December 31, 2013.
|
On the other hand, it should be noted that Exchange regulations in Venezuela are in constant evolution. Thus, on February 20, 2014, the Government of Venezuela announced a complementary currency system identified as "SICAD 2", in addition to those already in existence, which will revoke the Act of Illicit Exchange (“Ley de Ilícitos Cambiarios”) and will create an alternate market with bands of exchange rates, which will be regulated by the Central Bank of Venezuela. However, as of the date of authorization for issue of these consolidated financial statements, the system described in such announcement or the corresponding measures have not yet been formalized.
Organizational Restructuring of the Telefónica Group
On February 26, 2014, the Board of Directors of Telefónica, S.A. approved the implementation of a new organizational structure completely focused on clients and which incorporates the digital offering as the main focus for commercial policies. The structure gives greater visibility to local operators, bringing them closer to the corporate decision-making centre, simplifying the global structure and strengthening the transverse areas to improve flexibility and agility in decision making.
Within this framework, Telefónica has created the role of the Chief Commercial Digital Officer, who will be responsible for fostering revenue growth. On the cost side, the Company has strengthened the role of the Chief Global Resources Officer. Both Officers will report directly to the Chief Operating Officer (COO), as well as the local operators in Spain, Brazil, Germany and the United Kingdom, in addition to the Latin American unit, now without Brazil.
The new model integrates the activities carried out to date by Telefónica Digital, Telefónica Europe and Telefónica Latin America into the Global Corporate Centre, thus simplifying the organization.
Appendix I: Changes in the consolidation scope
The following changes took place in the consolidation scope in 2013:
Telefónica Europe
In June 2013, Telefónica reached an agreement to sell its entire stake in the share capital of Telefónica Ireland, Ltd. Completion of the transaction is subject, among other conditions, to obtaining the pertinent authorizations from the competition authorities (see Note 2). On November 5, 2013, Telefónica also signed an agreement to sell 65.9% of the share capital of Telefónica Czech Republic, a.s. to PPF Group N.V.I. (see Note 21.b). The transaction was completed on January 28, 2014, once the pertinent regulatory authorization was obtained (see Note 23).
Both companies continued to be included in the consolidations scope of the Telefónica Group in 2013, although the consolidated assets and liabilities included in the sales were recognized under “Non-current assets held for sale” and “Liabilities associated with non-current assets held for sale”, respectively, in the consolidated statement of financial position at December 31, 2013 (see Note 2).
In October, Telefónica Remesas, S.A. was liquidated and removed from the consolidation scope.
The sale of T. Germany Online Services GmbH was recognized on October 31, 2013, which generated a gain of 30 million euros. This company, which had been fully consolidated, was removed from the consolidation scope.
In November 2013, T. Móviles España, S.A.U. acquired the remaining shares it did not previously hold in Tuenti Technologies, S.L., thereby obtaining a 100% stake. The Group continues to consolidate this company using the full consolidation method.
Telefónica Latin America
On August 2, 2013 Telefónica completed the sale of 40% of its subsidiaries in Guatemala, El Salvador, Nicaragua and Panama to Corporación Multi Inversiones (see Note 2). The sale was executed by means of the creation of a new company, Telefónica Centroamérica Inversiones, S.L., to which Telefónica contributed its stakes in the subsidiaries in Guatemala, Panama, El Salvador and Nicaragua in exchange for a 60% stake in this company (Note 5). The Group consolidates this company using the full consolidation method.
Other companies
In April, Telefónica de Contenidos, S.A.U. completed the sale of its remaining stake in Hispasat, S.A., i.e. 19,359 shares, to Eutelsat Services & Beteiligungen, GmbH for a total of 56 million euros.
On September 24, 2013, Telefónica and the other shareholders of the Italian company Telco, S.p.A. reached an agreement whereby Telefónica, S.A. subscribed and paid out a share capital increase in Telco, S.p.A., through a cash contribution of 324 million euros, in exchange for shares with voting rights in Telco, S.p.A. As a result of this capital increase, the interest held by Telefónica in the voting share capital of Telco, S.p.A. remains unchanged, although its interest in the total share capital of Telco, S.p.A. grew to 66% (see Note 2). Telco, S.p.A. is still included in the consolidation scope using the equity method.
In September, the company Ecosistema Virtual Para la Promoción del Comercio, S.L. was incorporated, in which Telefónica Digital España, S.L. holds a 33% interest. The other shareholders are, with equal stakes, Banco Santander, S.A. and Caixa Card 1 Establecimiento Financiero de Crédito, S.A.U.
In 2013, the companies Telefónica On the Spot Soluciones Digitales, S.A. de C.V. (México) and Telefónica On The Spot Services Soluciones Digitales Perú, S.A.C. were incorporated, which are wholly-owned by Telefónica On the Spot Services.
In 2013, the companies Telefónica Learning Services Chile SpA, Telefónica Learning Services Chile Capacitación Ltda., Telefónica Learning Services Colombia SAS, Telefónica Learning Services Perú, SAC and Telefónica Serviços de Ensino, Ltda. (Brasil) were incorporated, which are solely owned by Telefónica Learning Services.
In 2013, Telefónica Global Solutions Pánama, S.A. (wholly-owned by TIWS América, S.A.) and Telefónica Global Solutions, Singapore PTE. LTD. (wholly-owned by TIWS II, S.L.) were incorporated.
In 2013, the company Estrella Soluciones Prácticas, S.A. was incorporated through the spin-off of Telefónica Móviles Soluciones y Aplicaciones, S.A. The sale of Estrella Soluciones Prácticas, S.A. to Amdocs Chile SpA was formalized in December, whereby it was removed from the consolidation scope.
The following changes took place in the consolidation scope in 2012:
Telefónica Latin America
On April 23, 2012, the Panamanian company Telefónica Centroamérica, S.A. was incorporated with authorized capital of 50,000 US dollars. Telefónica Centroamérica, S.A. is equally owned by Telefónica Móviles El Salvador, S.A. de C.V., Telefónica Móviles Guatemala, S.A. Telefónica Móviles Panamá, S.A., Telefónica Celular de Nicaragua, S.A. and Telefónica de Costa Rica, S.A. (20% interest each), and was included in the Telefónica Group using the full consolidation method.
In June 2012, Telefónica Móviles Chile, S.A. and Inversiones Telefónica Móviles Holding, S.A., the shareholders of Telefónica Móviles Chile Inversiones, S.A., agreed to change the company’s name to Wayra Chile Tecnología e Innovación Limitada. The Telefónica Group continues to consolidate this company using the full consolidation method.
The merger of Telefónica Móviles Colombia, S.A. and Colombia Telecomunicaciones, S.A. ESP was completed on June 29, 2012. Following the merger, the Telefónica Group holds (directly and indirectly) a 70% interest in Colombia Telecomunicaciones, S.A. ESP. This company continues to be fully consolidated within the Telefónica Group.
On July 18, 2012, the subsidiary TEM Puerto Rico Inc. was wound up, effective as of December 31, 2011. This company, which was fully consolidated in the Telefónica Group, was removed from the consolidation scope.
In October and November 2012, respectively, Telefónica América, S.A. and Telefónica Latinoamérica Holding, S.L. were incorporated in Spain. Both companies are owned by Telefónica Internacional, S.A. (50% interest) and Telefónica, S.A. (50% interest). On December 13, 2012, Telefónica, S.A. and Telefónica Internacional, S.A.U. carried out a capital increase in Telefónica Latinoamérica Holding, S.L. Telefónica, S.A. subscribed to this increase by contributing shares of Latin America Cellular Holdings, B.V., while Telefónica Internacional, S.A.U. subscribed through a monetary contribution. Following the capital increase, Telefónica, S.A. holds a 94.59% stake in Telefónica Latinoamérica Holding, S.L., and Telefónica Internacional, S.A.U. holds a 5.41% interest. Both Telefónica América, S.A. and Telefónica Latinoamérica Holding, S.L. are fully consolidated within the Telefónica Group.
In November 2012, Telefónica Chile Holdings B.V. was incorporated in the Netherlands, by sole shareholder Telefónica, S.A. The new company fully consolidated within the Telefónica Group.
Telefónica Europe
On July 25, 2012, Acens Technologies, S.L. approved the merger by absorption of Interdomain, S.A., with the absorbed company being wound up but not liquidated and the en bloc transfer of all its assets and liabilities to Acens Technologies, S.L. Interdomain.
In July 2012, Telefónica Czech Republic, a.s. acquired 100% of Bonerix Czech Republic s.r.o. The company was included in the Telefónica Group’s consolidation scope using the full consolidation method.
Also in July 2012, Telefónica O2 Business Solutions, spol. s r.o. was absorbed by Telefónica Czech Republic, a.s.
Through a public offering carried out in October 2012, Telefónica, S.A. sold a 23.17% interest in Telefónica Deutschland Holding, A.G., for 1,449 million euros. Following the sale, the investment continues to be fully consolidated in the Telefónica Group.
Telefónica UK, Ltd. and Vodafone UK, Ltd. incorporated a joint venture in November 2012 called Cornerstone Telecommunications Infrastructure Limited, with a 50% interest held by each of these companies. Both Telefónica UK and Vodafone UK contributed to the joint venture the basic network infrastructure they already shared.
Other companies
In March 2012, the company Wayra Brasil Aceleradora de Projetos Ltda. was incorporated in Brazil. This company was included in the Telefónica Group’s consolidation scope using the full consolidation method.
In March 2012, Media Networks Brasil Soluçoes Digitais Ltda. was incorporated. This company h included in the Telefónica Group’s consolidation scope using the full consolidation method.
Also in March 2012, the Peruvian company Media Networks Latin America, S.A.C., a subsidiary of Telefónica Internacional, S.A.U., incorporated the Brazilian company Media Networks Brasil Soluçoes Digitais Ltda. This company was included in the Telefónica Group’s consolidation scope using the full consolidation method.
Telefónica Digital Venture Capital, S.L.U. was incorporated in March 2012 with initial share capital of 3,000 euros, subscribed and fully paid by Telefónica Digital Holdings, S.L.U. The company was fully consolidated in the Telefónica Group.
On June 10, 2012, Telefónica, S.A. through its subsidiary Telefónica Internacional, S.A.U., and China United Network Communications Group Company Limited, through a wholly-owned subsidiary, signed the definitive agreement for the purchase by the latter of 1,073,777,121 shares in China Unicom (Hong Kong) Limited owned by Telefónica, equivalent to 4.56% of that company’s total capital.
The company, in which Telefónica holds a 5.01% interest after the sale, continues to be accounted for in the Telefónica Group using the equity method.
In June 2012, the company Telefónica Gestión Integral de Edificios y Servicios, S.L. was created through the partial spin-off of Telefónica Servicios Integrales de Distribución, S.A.U. and the spin-off of the activity branch of Telefónica Gestión de Servicios Compartidos España, S.A. The new company was fully consolidated in the Telefónica Group.
In October 2012, the Telefónica Group sold its 50% stake in Red Universal de Marketing y Bookings Online, S.A. This company, which was proportionately consolidated in the Telefónica Group, was removed from the scope of consolidation.
On October 22, 2012, Jajah Inc. acquired 100% of Tokbox Inc. for 12 million dollars. This company was included in the Telefónica Group’s consolidation scope using the full consolidation method.
In December 2012, the Group completed the sale of the Atento business to a group of companies controlled by Bain Capital. The companies comprising this business, which were previously included in the Telefónica Group using the full consolidation method, were removed from the consolidation scope (Note 2).
On December 28, 2012, Telefónica de Contenidos, S.A.U. formalized the transfer to Abertis Telecom, S.A. of 23,343 shares in Hispasat, S.A. for a total cash price of 68 million euros.
In December 2012, Telefónica Digital España, S.L.U. acquired a 50.0002% interest in the Brazilian company Axismed – Gestao Preventiva da Saúde, S.A. for 10.9 million Brazilian reais. This company was included in the Telefónica Group’s consolidation scope using the full consolidation method.
The Peruvian company TGestiona Logística, S.A.C. was incorporated through the en bloc spin-off of assets and liabilities from the logistics business line of Telefónica Gestión de Servicios Compartidos Perú, S.A.C. In December 2012, this company was fully consolidated as part of the Telefónica Group.
Appendix II Board of Director’s Compensation
TELEFÓNICA, S.A.
(Euros)
|
Director
|
Wage / Compen-sation
1
|
Fixed payment
2
|
Attendance fees
3
|
Short term variable compen-sation
4
|
Fixed payments Board Committees
5
|
Other
items
6
|
Total
|
||||||||||||||||||||
|
Mr. César Alierta Izuel
|
2 , 230 , 800 | 240 ,000 | - | 3 , 497 , 448 | 80 ,000 | 204 , 655 | 6 , 252 , 903 | ||||||||||||||||||||
|
Mr. Isidro Fainé Casas
|
- | 200 ,000 | - | - | 80 ,000 | 8 ,000 | 288 ,000 | ||||||||||||||||||||
|
Mr. José María Abril Pérez
|
- | 200 ,000 | 8 ,000 | - | 95 , 867 | - | 303 , 867 | ||||||||||||||||||||
|
Mr. Julio Linares López
|
- | 200 ,000 | 7 ,000 | - | 19 , 600 | - | 226 , 600 | ||||||||||||||||||||
|
Mr. José María Alvarez-Pallete López
|
1 , 923 , 100 | - | - | 1 , 626 , 713 | - | 128 , 330 | 3 , 678 , 143 | ||||||||||||||||||||
|
Mr. Fernando de Almansa Moreno-Barreda
|
- | 120 ,000 | 17 ,000 | - | 38 , 267 | 8 ,000 | 183 , 267 | ||||||||||||||||||||
|
Ms. Eva Castillo Sanz
|
1 , 264 ,000 | - | - | 323 , 647 | - | 49 , 741 | 1 , 637 , 388 | ||||||||||||||||||||
|
Mr. Carlos Colomer Casellas
|
- | 120 ,000 | 25 ,000 | - | 139 , 733 | 8 ,000 | 292 , 733 | ||||||||||||||||||||
|
Mr. Peter Erskine
|
- | 120 ,000 | 29 ,000 | - | 124 , 800 | - | 273 , 800 | ||||||||||||||||||||
|
Mr. Santiago Fernández Valbuena
|
- | - | - | - | - | - | - | ||||||||||||||||||||
|
Mr. Alfonso Ferrari Herrero
|
- | 120 ,000 | 44 ,000 | - | 163 , 067 | 8 ,000 | 335 , 067 | ||||||||||||||||||||
|
Mr. Luiz Fernando Furlán
|
- | 120 ,000 | - | - | 4 , 667 | - | 124 , 667 | ||||||||||||||||||||
|
Mr. Gonzalo Hinojosa Fernández de Angulo
|
- | 120 ,000 | 44 ,000 | - | 159 , 334 | 8 ,000 | 331 , 334 | ||||||||||||||||||||
|
Mr. Pablo Isla Álvarez de Tejera
|
- | 120 ,000 | 9 ,000 | - | 35 , 467 | - | 164 , 467 | ||||||||||||||||||||
|
Mr. Antonio Massanell Lavilla
|
- | 120 ,000 | 17 ,000 | - | 56 ,000 | 8 ,000 | 201 ,000 | ||||||||||||||||||||
|
Mr. Ignacio Moreno Martínez
|
- | 120 ,000 | 9 ,000 | - | 19 , 600 | - | 148 , 600 | ||||||||||||||||||||
|
Mr. Javier de Paz Mancho
|
- | 120 ,000 | 13 ,000 | - | 118 , 267 | - | 251 , 267 | ||||||||||||||||||||
|
Mr. Chang Xia
obing
|
- | 120 ,000 | - | - | - | - | 120 ,000 | ||||||||||||||||||||
1
Wage
: Non-variable compensation accrued by the Director for discharging executive duties.
2
Fixed Payment:
Cash compensation with a predefined payment frequency, accruable or not over time and accrued by the Director for membership to the Board of Directors, irrespective of affective attendance by the Director at Board Meetings.
3
Attendance fees
: Amounts payable for attendance to meetings of the Advisory or Control Committees, and the various Regional Advisory Committees in Spain (Valencia, Andalusia and Catalonia)
4
Short-term variable compensation
: Variable amount linked to the performance or achievement of individual or group objectives (quantitative or qualitative) for a period equal to or up to a year, corresponding to 2012 and paid in 2013. It is stated
Ms. Eva Castillo Sanz was appointed Chairwoman of Telefónica Europe on September 17, 2012, date of commencement, therefore, of her executive duties within Telefónica Group.
Concerning the bonus referred to 2013, to be paid during 2014, the Executive Directors will perceive the following amounts: Mr. César Alierta Izuel 3,050,000 euros, Mr. José María Álvarez-Pallete López 2,900,000 euros and Mrs. Eva Castillo Sanz 1,463,712 euros.
5
Fixed Payment Board Committees
: Cash compensation with a predefined payment frequency, accruable or not over time and accrued by the Director for membership to the Executive Committee or Advisory or Control Committees of Telefónica, S.A., irrespective of effective attendance to meetings of said Committees.
6
Other items
: Includes, inter alia
,
amounts paid for membership of the Regional Advisory Committees in Spain (Valencia, Andalusia and Catalonia) and other “in- kind compensation” (such as general medical insurance and dental coverage), paid by Telefónica, S.A.
In addition, to detail the amounts included in the preceding table, the following table presents the specific compensation paid to Directors of Telefónica for membership of the various Advisory or Control Committees in 2013, including both fixed payments and fees for attending meetings:
TELEFÓNICA, S.A. ADVISORY OR CONTROL COMMITEES
(Euros)
|
Director
|
Audit and Control
|
Nomination, Compensation and Corporate Governance
|
Human Resources, Reputation and Corporate Responsibility
1
|
Regulation
|
Service Quality and Customer Service
|
International Affaires
1
|
Innovation
|
Strategy
|
Institu-tional Affaires
1
|
TOTAL
2013
|
|||||||||||||||||||||||||||||
|
Mr. César Alierta Izuel
|
-- | -- | -- | -- | -- | -- | -- | -- | -- | -- | |||||||||||||||||||||||||||||
|
Mr. Isidro Fainé Casas
|
− | − | − | − | − | − | − | -- | -- | -- | |||||||||||||||||||||||||||||
|
Mr. José María Abril Pérez
|
-- | -- | -- | -- | -- | 5 , 667 | 18 , 200 | -- | -- | 23 , 867 | |||||||||||||||||||||||||||||
|
Mr. Julio Linares López
|
-- | -- | -- | -- | -- | -- | -- | 9 , 533 | 17 , 067 | 26 , 600 | |||||||||||||||||||||||||||||
|
Mr. José María Álvarez-Pallete López
|
-- | -- | -- | -- | -- | -- | -- | -- | -- | -- | |||||||||||||||||||||||||||||
|
Mr. José Fernando de Almansa Moreno-Barreda
|
-- | -- | -- | 14 , 200 | -- | 10 , 334 | -- | 20 , 200 | 10 , 533 | 55 , 267 | |||||||||||||||||||||||||||||
|
Ms. Eva Castillo Sanz
|
-- | -- | -- | -- | -- | -- | -- | -- | -- | -- | |||||||||||||||||||||||||||||
|
Mr. Carlos Colomer Casellas
|
19 , 933 | 18 , 200 | -- | -- | 13 , 200 | -- | 33 , 400 | -- | -- | 84 , 733 | |||||||||||||||||||||||||||||
|
Mr. Peter Erskine
|
-- | 22 , 200 | -- | -- | -- | -- | 20 , 200 | 31 , 400 | -- | 73 , 800 | |||||||||||||||||||||||||||||
|
Mr. Santiago Fernández Valbuena
|
-- | -- | -- | -- | -- | -- | -- | -- | -- | -- | |||||||||||||||||||||||||||||
|
Mr. Alfonso Ferrari Herrero
|
21 , 200 | 33 , 400 | 6 , 667 | 14 , 200 | 14 , 200 | 5 , 667 | -- | 20 , 200 | 11 , 533 | 127 , 067 | |||||||||||||||||||||||||||||
|
Mr. Luiz Fernando Furlán
|
-- | -- | -- | -- | -- | 4 , 667 | -- | -- | -- | 4 , 667 | |||||||||||||||||||||||||||||
|
Mr. Gonzalo Hinojosa Fernández de Angulo
|
24 , 933 | 22 , 200 | 6 , 667 | 17 , 933 | 13 , 200 | 5 , 667 | -- | 21 , 200 | 11 , 533 | 123 , 334 | |||||||||||||||||||||||||||||
|
Mr. Pablo Isla Álvarez de Tejera
|
-- | 20 , 200 | 4 , 667 | 14 , 933 | 4 , 667 | -- | -- | -- | -- | 44 , 467 | |||||||||||||||||||||||||||||
|
Mr. Antonio Massanell Lavilla
|
19 , 200 | -- | 4 , 667 | -- | 25 , 400 | -- | 15 , 200 | -- | 8 , 533 | 73 ,000 | |||||||||||||||||||||||||||||
|
Mr. Ignacio Moreno Martínez
|
10 , 533 | -- | -- | 9 , 533 | 8 , 533 | -- | -- | -- | -- | 28 , 600 | |||||||||||||||||||||||||||||
|
Mr. Francisco Javier de Paz Mancho
|
-- | -- | 11 , 333 | 14 , 200 | 8 , 533 | 5 , 667 | -- | -- | 11 , 533 | 51 , 267 | |||||||||||||||||||||||||||||
|
Mr. Chang Xiaobing
|
-- | -- | -- | -- | -- | -- | -- | -- | -- | -- | |||||||||||||||||||||||||||||
1 The Human Resources, Reputation and Corporate Responsibility Committee and International Affairs Committee were disbanded on May 31, 2013. The Institutional Affairs Committee was established on the same date.
On the other hand, the following table presents an individual breakdown of the amounts received from other Telefónica Group companies other than Telefónica, S.A., by Company’s Directors for discharging executive duties or for membership of the companies’ governing bodies and/or Advisory Boards of such companies:
OTHER TELEFÓNICA GROUP COMPANIES
(Euros)
|
Director
|
Wage / Compen-sation
1
|
Fixed payment
2
|
Attendance fees
3
|
Short term variable compen-sation
4
|
Fixed payments Board Committees
5
|
Other items
6
|
Total
|
||||||||||||||||||||
|
Mr. César Alierta Izuel
|
-- | -- | -- | -- | -- | -- | -- | ||||||||||||||||||||
|
Mr. Isidro Fainé Casas
|
-- | -- | -- | -- | -- | -- | -- | ||||||||||||||||||||
|
Mr. José María Abril Pérez
|
-- | -- | -- | -- | -- | -- | -- | ||||||||||||||||||||
|
Mr. Julio Linares López
|
-- | -- | -- | -- | -- | 300 ,000 | 300 ,000 | ||||||||||||||||||||
|
Mr. José María Álvarez-Pallete López
|
-- | -- | -- | -- | -- | -- | -- | ||||||||||||||||||||
|
Mr. José Fernando de Almansa Moreno-Barreda
|
-- | 163 , 427 | -- | -- | -- | 120 ,000 | 283 , 427 | ||||||||||||||||||||
|
Ms. Eva Castillo Sanz
|
-- | 38 , 353 | -- | -- | -- | -- | 38 , 353 | ||||||||||||||||||||
|
Mr. Carlos Colomer Casellas
|
-- | -- | -- | -- | -- | 70 ,000 | 70 ,000 | ||||||||||||||||||||
|
Mr. Peter Erskine
|
-- | -- | -- | -- | -- | 74 , 202 | 74 , 202 | ||||||||||||||||||||
|
Mr. Santiago Fernández Valbuena
|
1 , 287 , 446 | -- | -- | 1 , 360 , 418 | -- | 198 , 267 | 2 , 846 , 131 | ||||||||||||||||||||
|
Mr. Alfonso Ferrari Herrero
|
-- | 75 , 531 | -- | -- | -- | 120 ,000 | 195 , 531 | ||||||||||||||||||||
|
Mr. Luiz Fernando Furlán
|
-- | 95 , 324 | -- | -- | -- | 160 ,000 | 255 , 324 | ||||||||||||||||||||
|
Mr. Gonzalo Hinojosa Fernández de Angulo
|
-- | 21 , 876 | -- | -- | -- | 90 ,000 | 111 , 876 | ||||||||||||||||||||
|
Mr. Pablo Isla Álvarez de Tejera
|
-- | -- | -- | -- | -- | -- | -- | ||||||||||||||||||||
|
Mr. Antonio Massanell Lavilla
|
-- | -- | -- | -- | -- | 60 ,000 | 60 ,000 | ||||||||||||||||||||
|
Mr. Ignacio Moreno Martínez
|
-- | -- | -- | -- | -- | -- | -- | ||||||||||||||||||||
|
Mr. Francisco Javier de Paz Mancho
|
-- | 128 , 248 | -- | -- | -- | 120 ,000 | 248 , 248 | ||||||||||||||||||||
|
Mr. Chang Xiaobing
|
-- | -- | -- | -- | -- | -- | -- | ||||||||||||||||||||
1
Wage
:
Non-variable compensation accrued by the Director for discharging executive duties
of any Telefónica Group company.
2
Fixed Payment:
Cash compensation with a predefined payment frequency, accruable or not over time and accrued by the Director for membership to the Board of Directors, irrespective of affective attendance by the Director at Board Meetings
of any Telefónica Group company.
3
Attendance fees
: Amounts payable for attendance to meetings of the Board of Directors or similar bodies of any Telefónica Group company.
4
Short-term variable compensation (bonus)
: Variable amount linked to the performance or achievement of individual or group objectives (quantitative or qualitative) and commensurate with other compensation or any other reference in euros for a period of up to a year
referred to 2012 and paid during 2013 by any Telefónica Group Company. Concerning the bonus referred to 2013, the amount that will perceive the Executive Director Mr. Santiago Fernández Valbuena is 1,441,424 euros.
5
Fixed Payment Board Committees
: Cash compensation with a predefined payment frequency, accruable or not over time and accrued by the Director for membership to the Executive Committee or Advisory or Control Committees of Telefónica, S.A., irrespective of effective attendance to meetings of said Committees.
6
Other items
: Includes,
inter alia,
amounts paid for membership of Regional and Business Advisory Committees (Europe, Latam and Digital) and
other “in- kind compensation” (such as general medical insurance and dental coverage), paid by any Telefónica Group Company.
Furthermore, as explained in the Compensation policy section, Executive Directors receive a series of employee benefits. The following table presents a breakdown of contributions made in 2013 by the Company to long-term savings schemes (Pension Plans and Pension Plan for Senior Executives):
LONG-TERM SAVINGS SCHEMES
(Euros)
|
Director
|
Contributions 2013 by the Company
|
|
Mr. César Alierta Izuel
|
1,023,193
|
|
Mr. José María Álvarez-Pallete López
|
550,436
|
|
Ms. Eva Castillo Sanz
|
393,796
|
|
Mr. Santiago Fernández Valbuena
|
142,559
|
The following table presents a breakdown of the long-term savings schemes, comprising contributions to Pension Plans and the Pension Plan:
(Euros)
|
Director
|
Contributions to Pension Plans
|
Contributions to Benefits Plan
1
|
||
|
Mr. César Alierta Izuel
|
8,402
|
1,014,791
|
||
|
Mr. José María Álvarez-Pallete López
|
9,468
|
540,968
|
||
|
Ms. Eva Castillo Sanz
|
8,402
|
385,394
|
||
|
Mr. Santiago Fernández Valbuena
|
115,031
|
27,528
|
1 Contributions to the Pension Plan for Executives set up in 2006, funded exclusively by the Company to complement the existing Pension Plan. It entails defined contributions equivalent to a certain percentage of the Director´s fixed remuneration in accordance with their professional category within the Telefónica Group´s organization.
Life insurance premiums paid in 2013 are as follow:
LIFE INSURANCE PREMIUMS
(Euros)
|
Director
|
Life insurance premiums
|
|
Mr. César Alierta Izuel
|
103,858
|
|
Mr. José María Álvarez-Pallete López
|
39,842
|
|
Ms. Eva Castillo Sanz
|
19,802
|
|
Mr. Santiago Fernández Valbuena
|
3,028
|
Regarding share-based payment plans (those exclusively for Executive Directors), there were two long-term variable compensation plans in place in 2013:
The “Performance Share Plan” (“PSP”) approved at the General Shareholders’ Meeting of June 21, 2006, whose fifth and final phase began in 2010 and ended in July 2013.
It is hereby stated that regarding the fifth phase of this Plan (2010-2013), the general terms for the delivery of shares were not met. Therefore, no shares were delivered to Executive Directors.
The so-called “Performance & Investment Plan“ (“PIP”) approved at the General Shareholders’ Meeting of May 18, 2011, whose first phase began in 2011 and will end in July 2014, second phase began in 2012 and will end in July 2015, and third phase began in 2013 and will end in July 2016. It is hereby stated that the number of shares assigned and the maximum possible number of shares to be received by the Directors of Telefónica for discharging executive duties in each phase, if the co-investment requirement established in the Plan and the maximum target TSR established for each phase are met, are as follows:
First phase / 2011-2014
|
Directors
|
Theoretical shares assigned
|
Maximum number of shares*
|
|
|
Mr. César Alierta Izuel
|
249,917
|
390,496
|
|
|
Mr. Julio Linares López
|
149,950
|
234,298
|
|
Mr. José María Álvarez-Pallete López
|
79,519
|
124,249
|
|
|
Mr. Santiago Fernández Valbuena
|
79,519
|
124,249
|
*
Maximum possible number of shares to be received if the co-investment requirement and maximum target TSR are met.
Second phase / 2012-2015
|
Directors
|
Theoretical shares assigned
|
Maximum number of shares*
|
|
|
Mr. César Alierta Izuel
|
324,417
|
506,901
|
|
|
Mr. Julio Linares López(1)
|
13,878
|
21,686
|
|
|
Mr. José María Álvarez-Pallete López
|
188,131
|
293,955
|
|
|
Ms. Eva Castillo Sanz
|
95,864
|
149,787
|
|
|
Mr. Santiago Fernández Valbuena
|
103,223
|
161,287
|
|
(1) The number of shares assigned to Mr. Linares was calculated in proportion to the time he discharged executive duties as Chief Operating Officer –COO- (from July 1, 2012 to September 17, 2012) during the second phase of the Plan.
|
|
* Maximum possible number of shares to be received if the “co-investment” requirement and maximum target TSR are met.
|
Third phase / 2013-2016
|
Directors
|
Theoretical shares assigned
|
Maximum number of shares*
|
|
|
Mr. César Alierta Izuel
|
324,000
|
506,250
|
|
|
Mr. José María Álvarez-Pallete López
|
192,000
|
300,000
|
|
|
Ms. Eva Castillo Sanz
|
104,000
|
162,500
|
|
|
Mr. Santiago Fernández Valbuena
|
104,000
|
162,500
|
|
|
* Maximum possible number of shares to be received if the “co-investment” requirement and maximum target TSR are met.
|
|||
In addition, to reinforce Telefónica’ s status as a global employer, with a common remuneration culture throughout the Company, to encourage all Group employees to take an equity interest, and to motivate employees and boost their loyalty, at the Company’s General Shareholders’ Meeting of June 23, 2009, shareholders approved the introduction of a Telefónica, S.A. share incentive plan, the "Global Employee Share Plan" ("GESP") for all employees of the Group worldwide (including executives and Executives Directors).
Under this plan, employees that meet the qualifying requirements are offered the possibility of acquiring Telefónica, S.A. shares, for a period of up to 12 months (the acquisition period), with this company assuming the obligation of giving participants a certain number of shares free of charge. The maximum sum each employee can assign to this plan is 1,200 euros, while the minimum is 300 euros. Employees who remain at the Telefónica Group and retain their shares for an additional year after the acquisition period (the consolidation period) will be entitled to receive one free share per share acquired and retained until the end of the consolidation period.
During the first phase of this Plan (2010-2012), Directors participating, as they discharged executive duties in the Group, acquired a total of 604 shares (including free shares received under the general terms and conditions of the Plan).
Later, for the second phase of the Plan (2012-2014), approved at the General Shareholders’ Meeting of May 18, 2011, the Executive Directors that decides to take part contributing the maximum (i.e. 100 euros a month, over 12 months), had acquired a total of 328 shares.
It should be noted that the external Directors do not receive and did not receive in 2013 any compensation in the form of pensions or life insurance, nor do they participate in the share-based payment plans linked to Telefónica’ s share price.
In addition, the Company does not grant and did not grant in 2013 any advances, loans or credits to the Directors, or to its top executives, thus complying with the requirements of the U.S.A. Sarbanes-Oxley Act, which is applicable to Telefónica as a listed company in that market.
Senior executives’ compensation
Meanwhile, the Executives considered as Senior Executives
(1)
of the Company in 2013, excluding those that are also members of the Board of Directors, received a total, in 2013, of 9,709,715 euros.
In addition, the contributions by the Telefónica Group in 2013 with respect to the Benefits Plan for Senior Executives described in Note on “Revenue and Expenses” for these Executives amounted to 1,179,905 euros. Contribution to the Pension Plan amounted to 411,287 euros and compensation in kind (including life and other insurance premiums such us general medical and dental insurance) to 118,031 euros.
Also, it is hereby stated that regarding the fifth phase of the “Performance Share Plan” (“PSP”) (2010-2013), the general terms for the delivery of shares were not met. Therefore, no shares were delivered to the Executives.
Regarding the above mentioned “Performance and Investment Plan” (“PIP”) approved at the General Shareholders’ Meeting of May 18, 2011, a total of 422,344 shares were assigned to the Executives considered Senior Executives of the Company in the first phase (2011-2014), 623,589 shares in the second phase (2012-2015), and 650,000 shares in the third phase (2013-2016).
Finally, regarding the first phase of the “Global Employee Share Plan” (“GESP”) (2010-2012), Executives participating acquired a total of 872 shares (including free shares received under the general terms and conditions of the Plan). Regarding the second phase of the “Global Employee Share Plan” (“GESP”) (2012-2014), the Executives taking part and contributing the maximum (i.e. 100 euros a month, over 12 months), have acquire a total of 443 shares.
|
(1)
|
For these purposes, Senior Executives are understood to be individuals who perform senior management functions reporting directly to the management bodies, or their executive committees or CEOs, including the person in charge of the internal audit.
|
Appendix III: Debentures and bonds
The detail and key features of outstanding debentures and bonds at December 31, 2013, are as follows (in millions of euros):
|
Maturity (nominal)
|
||||||||||||||||||
|
Debentures and bonds
|
Currency
|
% Interest rate
|
2014
|
2015
|
2016
|
2017
|
2018
|
Subsequent years
|
Total
|
|||||||||
|
CAIXA 07/21/29 ZERO COUPON
|
EUR
|
6.386%
|
−
|
−
|
−
|
−
|
−
|
74
|
74
|
|||||||||
|
ABN 15Y BOND
|
EUR
|
1.0225 x GBSW10Y
|
−
|
50
|
−
|
−
|
−
|
−
|
50
|
|||||||||
|
CHANGEABLE BOND
|
EUR
|
4.184%
|
582
|
−
|
−
|
−
|
−
|
−
|
582
|
|||||||||
|
Telefónica, S.A.
|
582
|
50
|
−
|
−
|
−
|
74
|
706
|
|||||||||||
|
T. EUROPE BV SEP_00 GLOBAL D
|
USD
|
8.250%
|
−
|
−
|
−
|
−
|
−
|
906
|
906
|
|||||||||
|
TEBV FEB_03 EMTN FIXED TRANCHE B
|
EUR
|
5.875%
|
−
|
−
|
−
|
−
|
−
|
500
|
500
|
|||||||||
|
Telefónica Europe, B.V.
|
−
|
−
|
−
|
−
|
−
|
1,406
|
1,406
|
|||||||||||
|
EMTN O2 EUR
|
EUR
|
4.375%
|
−
|
−
|
1,750
|
−
|
−
|
−
|
1,750
|
|||||||||
|
EMTN O2 GBP
|
GBP
|
5.375%
|
−
|
−
|
−
|
−
|
900
|
−
|
900
|
|||||||||
|
EMTN O2 GBP
|
GBP
|
5.375%
|
−
|
−
|
−
|
−
|
−
|
600
|
600
|
|||||||||
|
TELEF EMISIONES JUN 06 TRANCHE C
|
USD
|
6.421%
|
−
|
−
|
906
|
−
|
−
|
−
|
906
|
|||||||||
|
TELEF EMISIONES JUN 06 TRANCHE D
|
USD
|
7.045%
|
−
|
−
|
−
|
−
|
−
|
1,450
|
1,450
|
|||||||||
|
TELEF EMISIONES DECEMBER 06
|
GBP
|
5.888%
|
355
|
−
|
−
|
−
|
−
|
−
|
355
|
|||||||||
|
TELEF EMISIONES JANUARY 07 A
|
EUR
|
1 x EURIBOR6M + 0.83000%
|
−
|
−
|
−
|
−
|
−
|
55
|
55
|
|||||||||
|
TELEF EMISIONES JANUARY 07 B
|
EUR
|
1 x EURIBOR3M + 0.70000%
|
−
|
−
|
−
|
−
|
24
|
−
|
24
|
|||||||||
|
TELEF EMISIONES FEBRUARY 07
|
EUR
|
4.674%
|
1,500
|
−
|
−
|
−
|
−
|
−
|
1,500
|
|||||||||
|
TELEF EMISIONES JUNE C 07
|
CZK
|
4.623%
|
95
|
−
|
−
|
−
|
−
|
−
|
95
|
|||||||||
|
TELEF EMISIONES JULY C 07
|
USD
|
6.221%
|
−
|
−
|
−
|
508
|
−
|
−
|
508
|
|||||||||
|
TELEF EMISIONES FEBRUARY 09
|
EUR
|
5.431%
|
2,000
|
−
|
−
|
−
|
−
|
−
|
2,000
|
|||||||||
|
TELEF EMISIONES APRIL 2016
|
EUR
|
5.496%
|
−
|
−
|
1,000
|
−
|
−
|
−
|
1,000
|
|||||||||
|
TELEF EMISIONES JUNE 2015
|
EUR
|
1 x EURIBOR3M + 1.825%
|
−
|
400
|
−
|
−
|
−
|
−
|
400
|
|||||||||
|
TELEF EMISIONES APRIL 3, 2016
|
EUR
|
5.496%
|
−
|
−
|
500
|
−
|
−
|
−
|
500
|
|||||||||
|
TELEF EMISIONES JULY 6, 2015
|
USD
|
4.949%
|
−
|
906
|
−
|
−
|
−
|
−
|
906
|
|||||||||
|
TELEF EMISIONES JULY 15, 2019
|
USD
|
5.877%
|
−
|
−
|
−
|
−
|
−
|
725
|
725
|
|||||||||
|
TELEF EMISIONES NOVEMBER 11, 2019
|
EUR
|
4.693%
|
−
|
−
|
−
|
−
|
−
|
1,750
|
1,750
|
|||||||||
|
EMTN GBP 12/09/2022 650 GBP
|
GBP
|
5.289%
|
−
|
−
|
−
|
−
|
−
|
780
|
780
|
|||||||||
|
TELEF EMISIONES DECEMBER 09
|
EUR
|
1 x EURIBOR3M + 0.70000%
|
100
|
−
|
−
|
−
|
−
|
−
|
100
|
|||||||||
|
TELE EMISIONES MARCH 10
|
EUR
|
3.406%
|
−
|
993
|
−
|
−
|
−
|
−
|
993
|
|||||||||
|
TELEF EMISIONES APRIL 2, 2010
|
USD
|
3.729%
|
−
|
653
|
−
|
−
|
−
|
−
|
653
|
|||||||||
|
TELEF EMISIONES APRIL 3, 2010
|
USD
|
5.134%
|
−
|
−
|
−
|
−
|
−
|
1,015
|
1,015
|
|||||||||
|
TELEF EMISIONES SEPTEMBER 10
|
EUR
|
3.661%
|
−
|
−
|
−
|
1,000
|
−
|
−
|
1,000
|
|||||||||
|
EMTN GBP 10/08/2029 400 GBP
|
GBP
|
5.445%
|
−
|
−
|
−
|
−
|
−
|
480
|
480
|
|||||||||
|
TELEF EMISIONES FEBRUARY 2011
|
EUR
|
4.750%
|
−
|
−
|
−
|
1,200
|
−
|
−
|
1,200
|
|||||||||
|
TELEF EMISIONES FEBRUARY 2011
|
USD
|
3.992%
|
−
|
−
|
906
|
−
|
−
|
−
|
906
|
|||||||||
|
TELEF EMISIONES FEBRUARY 2011
|
USD
|
5.462%
|
−
|
−
|
−
|
−
|
−
|
1,088
|
1,088
|
|||||||||
|
TELEF EMISIONES MARCH 2011
|
EUR
|
4.750%
|
−
|
−
|
−
|
100
|
−
|
−
|
100
|
|||||||||
|
TELEF EMISIONES NOVEMBER 2011
|
EUR
|
4.967%
|
−
|
−
|
802
|
−
|
−
|
−
|
802
|
|||||||||
|
TELEF EMISIONES NOVEMBER 2011
|
JPY
|
2.829%
|
−
|
−
|
49
|
−
|
−
|
−
|
49
|
|||||||||
|
TELEF. EMISIONES FEBRUARY 2012
|
EUR
|
4.750%
|
−
|
−
|
−
|
120
|
−
|
−
|
120
|
|||||||||
|
TELEF. EMISIONES FEBRUARY 2012
|
EUR
|
4.797%
|
−
|
−
|
−
|
−
|
1,500
|
−
|
1,500
|
|||||||||
|
TELEF. EMISIONES FEBRUARY 2012
|
GBP
|
5.597%
|
−
|
−
|
−
|
−
|
−
|
840
|
840
|
|||||||||
|
TELEF. EMISIONES MARCH 2012
|
CZK
|
3.934%
|
−
|
−
|
−
|
45
|
−
|
−
|
45
|
|||||||||
|
TELEF. EMISIONES JUNE 2013
|
JPY
|
4.250%
|
−
|
−
|
−
|
−
|
69
|
−
|
69
|
|||||||||
|
TELEF. EMISIONES SEPTEMBER 2012
|
EUR
|
5.811%
|
−
|
−
|
−
|
1,000
|
−
|
−
|
1,000
|
|||||||||
|
TELEF. EMISIONES OCTOBER 2012
|
EUR
|
4.710%
|
−
|
−
|
−
|
−
|
−
|
1,200
|
1,200
|
|||||||||
|
TELEF. EMISIONES DECEMBER 2012
|
CHF
|
2.718%
|
−
|
−
|
−
|
−
|
204
|
−
|
204
|
|||||||||
|
TELEF. EMISIONES DECEMBER 2012
|
CHF
|
3.450%
|
−
|
−
|
−
|
−
|
−
|
121
|
121
|
|||||||||
|
TELEF EMISIONES JANUARY 2013
|
EUR
|
3.987%
|
−
|
−
|
−
|
−
|
−
|
1,500
|
1,500
|
|||||||||
|
TELEF. EMISIONES MARCH 2013
|
EUR
|
3.961%
|
−
|
−
|
−
|
−
|
−
|
1,000
|
1,000
|
|||||||||
|
TELEF EMISIONES APRIL 2013
|
USD
|
3.192%
|
−
|
−
|
−
|
−
|
906
|
−
|
906
|
|||||||||
|
TELEF EMISIONES APRIL 2013
|
USD
|
4.570%
|
−
|
−
|
−
|
−
|
−
|
544
|
544
|
|||||||||
|
TELEF EMISIONES MAY 2013
|
EUR
|
2.736%
|
−
|
−
|
−
|
−
|
−
|
750
|
750
|
|||||||||
|
TELEF EMISIONES OCTOBER 2013
|
CHF
|
2.595%
|
−
|
−
|
−
|
−
|
−
|
183
|
183
|
|||||||||
|
Telefónica Emisiones, S.A.U.
|
4,050
|
2,952
|
5,913
|
3,973
|
3,603
|
14,081
|
34,572
|
|||||||||||
|
Total Telefónica, S.A. and its instrumental companies
|
4,632
|
3,002
|
5,913
|
3,973
|
3,603
|
15,561
|
36,684
|
|||||||||||
|
Foreign operators
|
||||||||||||||||||
|
Maturity
|
||||||||||||||||||
|
Debentures and bonds
|
Currency
|
% Interest rate
|
2014
|
2015
|
2016
|
2017
|
2018
|
Subsequent years
|
Total
|
|||||||||
|
Series F
|
UF
|
6.000%
|
3
|
2
|
1
|
−
|
−
|
−
|
6
|
|||||||||
|
Series L
|
UF
|
3.500%
|
161
|
−
|
−
|
−
|
−
|
−
|
161
|
|||||||||
|
Series N
|
CLP
|
6.050%
|
28
|
−
|
−
|
−
|
−
|
−
|
28
|
|||||||||
|
USD Bond
|
USD
|
3.875%
|
−
|
−
|
−
|
−
|
−
|
363
|
363
|
|||||||||
|
Telefónica Chile, S.A.
|
192
|
2
|
1
|
−
|
−
|
363
|
558
|
|||||||||||
|
Bond A
|
CLP
|
5.600%
|
44
|
−
|
−
|
−
|
−
|
−
|
44
|
|||||||||
|
Bond C
|
CLP
|
6.300%
|
−
|
−
|
92
|
−
|
−
|
−
|
92
|
|||||||||
|
Bond D
|
UF
|
3.600%
|
−
|
−
|
64
|
−
|
−
|
−
|
64
|
|||||||||
|
Bond F
|
UF
|
3.600%
|
−
|
−
|
−
|
−
|
−
|
97
|
97
|
|||||||||
|
USD Bond
|
USD
|
2.875%
|
−
|
218
|
−
|
−
|
−
|
−
|
218
|
|||||||||
|
Telefónica Móviles Chile, S.A.
|
44
|
218
|
156
|
−
|
−
|
97
|
515
|
|||||||||||
|
T. Finanzas Mex emision 0710 FIJ
|
MXN
|
8.070%
|
−
|
−
|
−
|
−
|
−
|
111
|
111
|
|||||||||
|
T. Finanzas Mex emision 0710 VAR
|
MXN
|
TIIE28 + 55 bps
|
222
|
−
|
−
|
−
|
−
|
−
|
222
|
|||||||||
|
Telefónica Finanzas México, S.A.
|
222
|
−
|
−
|
−
|
−
|
111
|
333
|
|||||||||||
|
T. Peru 5th Program (31th Series A)
|
N. SOL
|
7.500%
|
−
|
−
|
5
|
−
|
−
|
−
|
5
|
|||||||||
|
T. Peru 4th Program (45th Series A)
|
USD
|
6.688%
|
−
|
−
|
16
|
−
|
−
|
−
|
16
|
|||||||||
|
Senior Notes T. Perú
|
N. SOL
|
8.000%
|
65
|
65
|
33
|
−
|
−
|
−
|
163
|
|||||||||
|
T. Peru 5th Program (33rd Series A)
|
N. SOL
|
6.813%
|
−
|
−
|
−
|
16
|
−
|
−
|
16
|
|||||||||
|
T. Peru 5th Program (29th Series A)
|
N. SOL
|
6.188%
|
−
|
−
|
15
|
−
|
−
|
−
|
15
|
|||||||||
|
PROG1EM1D
|
N. SOL
|
8.075%
|
−
|
−
|
−
|
31
|
−
|
−
|
31
|
|||||||||
|
T. Peru 4th Program (19th Series A)
|
N. SOL
|
VAC + 3.6250%
|
−
|
−
|
−
|
−
|
−
|
18
|
18
|
|||||||||
|
T. Peru 4th Program (36th Series A)
|
N. SOL
|
VAC + 3.6875%
|
−
|
−
|
−
|
47
|
−
|
−
|
47
|
|||||||||
|
T. Peru 4th Program (12th Series A)
|
N. SOL
|
VAC + 3.6875%
|
−
|
−
|
−
|
−
|
−
|
19
|
19
|
|||||||||
|
T. Peru 4th Program (36th Series B)
|
N. SOL
|
VAC + 3.3750%
|
−
|
−
|
−
|
−
|
16
|
−
|
16
|
|||||||||
|
T. Peru 4th Program (19th Series B)
|
N. SOL
|
VAC + 2.8750%
|
−
|
−
|
−
|
−
|
−
|
15
|
15
|
|||||||||
|
T. Peru 4th Program (37th Series A)
|
N. SOL
|
VAC + 3.1250%
|
−
|
−
|
−
|
−
|
−
|
15
|
15
|
|||||||||
|
T. Peru 4th Program (19th Series C)
|
N. SOL
|
VAC + 3.1875%
|
−
|
−
|
−
|
−
|
−
|
6
|
6
|
|||||||||
|
T. Peru 5th Program (22nd Series Aa)
|
N. SOL
|
VAC + 3.5000%
|
−
|
−
|
−
|
7
|
−
|
−
|
7
|
|||||||||
|
T. Peru 5th Program (22nd Series Ab)
|
N. SOL
|
VAC + 3.5000%
|
−
|
−
|
−
|
−
|
−
|
4
|
4
|
|||||||||
|
T. Peru 5th Program (22nd Series Ac)
|
N. SOL
|
VAC + 3.5000%
|
−
|
−
|
−
|
−
|
−
|
7
|
7
|
|||||||||
|
Telefónica del Perú, S.A.
|
65
|
65
|
69
|
101
|
16
|
84
|
400
|
|||||||||||
|
T. Peru 1st Program (18th Series A)
|
N. SOL
|
6.313%
|
10
|
−
|
−
|
−
|
−
|
−
|
10
|
|||||||||
|
T. Peru 1st Program (18th Series B)
|
N. SOL
|
6.375%
|
16
|
−
|
−
|
−
|
−
|
−
|
16
|
|||||||||
|
T. Peru 2nd Program (11th Series A)
|
N. SOL
|
7.750%
|
−
|
−
|
−
|
18
|
−
|
−
|
18
|
|||||||||
|
T. Peru 2nd Program (9th Series A)
|
N. SOL
|
6.813%
|
−
|
−
|
16
|
−
|
−
|
−
|
16
|
|||||||||
|
T. Peru 2nd Program (9th Series B)
|
N. SOL
|
6.375%
|
−
|
−
|
13
|
−
|
−
|
−
|
13
|
|||||||||
|
T. Peru 2nd Program (11th Series B)
|
N. SOL
|
7.375%
|
−
|
−
|
−
|
−
|
16
|
−
|
16
|
|||||||||
|
T. Peru 2nd Program (27th Series A)
|
N. SOL
|
5.531%
|
−
|
−
|
−
|
−
|
13
|
−
|
13
|
|||||||||
|
Telefónica Móviles Perú, S.A.
|
26
|
−
|
29
|
18
|
29
|
−
|
102
|
|||||||||||
|
Nonconvertible bonds
|
BRL
|
1.06 x CDI
|
29
|
−
|
−
|
−
|
−
|
−
|
29
|
|||||||||
|
Nonconvertible bonds
|
BRL
|
1.068 x CDI
|
−
|
198
|
−
|
−
|
−
|
−
|
198
|
|||||||||
|
Nonconvertible bonds
|
BRL
|
1.0 XCDI + 0.75%
|
−
|
−
|
−
|
619
|
−
|
−
|
619
|
|||||||||
|
Nonconvertible bonds
|
BRL
|
1.0 XCDI + 0.68%
|
−
|
−
|
−
|
−
|
402
|
−
|
402
|
|||||||||
|
Nonconvertible bonds
|
BRL
|
IPCA + 7%
|
28
|
−
|
−
|
−
|
−
|
−
|
28
|
|||||||||
|
Convertible bonds (Telemig) I
|
BRL
|
IPCA + 0.5%
|
−
|
−
|
−
|
−
|
2
|
2
|
4
|
|||||||||
|
Convertible bonds (Telemig) II
|
BRL
|
IPCA + 0.5%
|
−
|
−
|
−
|
−
|
2
|
5
|
7
|
|||||||||
|
Convertible bonds (Telemig) III
|
BRL
|
IPCA + 0.5%
|
−
|
−
|
−
|
−
|
3
|
10
|
13
|
|||||||||
|
T. Brasil
|
57
|
198
|
−
|
619
|
409
|
17
|
1,300
|
|||||||||||
|
BOND R144-A
|
USD
|
5.375%
|
−
|
−
|
−
|
−
|
−
|
544
|
544
|
|||||||||
|
Colombia Telecomunicaciones, S.A, ESP
|
−
|
−
|
−
|
−
|
−
|
544
|
544
|
|||||||||||
|
Bond
|
EUR
|
1.875%
|
−
|
−
|
−
|
−
|
600
|
−
|
600
|
|||||||||
|
O2 Telefónica Deutschland Finanzierungs, GmbH
|
−
|
−
|
−
|
−
|
600
|
−
|
600
|
|||||||||||
|
Total issues other operators
|
606
|
483
|
255
|
738
|
1,054
|
1,216
|
4,352
|
|||||||||||
|
Total outstanding debentures and bonds
|
5,238
|
3,485
|
6,168
|
4,711
|
4,657
|
16,777
|
41,036
|
|||||||||||
The main debentures and bonds issued by the Group in 2013 are as follows:
|
Nominal (millions)
|
||||||||||||
|
Item
|
Date
|
Maturity Date
|
Currency
|
Euros (1)
|
Currency of issuance
|
Coupon
|
||||||
|
Telefónica Emisiones, S.A.U.
|
||||||||||||
|
EMTN Bonds
|
01/22/13
|
01/23/23
|
1,500
|
1,500
|
EUR
|
3.9870%
|
||||||
|
03/27/13
|
03/26/21 (2)
|
1,000
|
1,000
|
EUR
|
3.9610%
|
|||||||
|
05/29/13
|
05/29/19
|
750
|
750
|
EUR
|
2.7360%
|
|||||||
|
10/23/13
|
10/23/20
|
225
|
183
|
CHF
|
2.5950%
|
|||||||
|
SHELF Bonds
|
04/29/13
|
04/27/18
|
1,250
|
906
|
USD
|
3.1920%
|
||||||
|
04/29/13
|
04/27/23
|
750
|
544
|
USD
|
4.5700%
|
|||||||
|
Telefónica Brasil, S.A.
|
||||||||||||
|
Debentures
|
04/30/13
|
04/25/18
|
1,300
|
402
|
BRL
|
CDI + 0.68%
|
||||||
|
Debentures (repactuaçao)
|
10/15/13
|
10/15/15
|
640
|
198
|
BRL
|
106.8% CDI
|
||||||
|
Telefónica Móviles Chile, S.A.
|
||||||||||||
|
Bonds
|
10/16/13
|
10/04/23
|
3
|
97
|
UFC
|
UF + 3.75%
|
||||||
|
O2 Telefónica Deutschland Finanzierungs, GmbH
|
||||||||||||
|
Bonds
|
11/22/13
|
11/22/18
|
600
|
600
|
EUR
|
1.8750%
|
||||||
|
(1)
Exchange rate as at December 31, 2013.
|
||||||||||||
|
(2)
Issue linked to an exchange of two Telefónica Emisiones’ euro bonds with maturity in 2015 and 2016 amounting to 605 million euros.
|
||||||||||||
F-112
Appendix IV: Financial instruments
The detail of the type of financial instruments arranged by the Group (notional amount) by currency and interest rates at December 31, 2013, is as follows:
|
Fair value
|
||||||||||||||||||||
|
Millions of Euros
|
2014
|
2015
|
2016
|
2017
|
2018
|
Subsequent years
|
Total
|
Underlying debt
|
Associated derivatives
|
TOTAL
|
||||||||||
|
EURO
|
(1,588)
|
3,829
|
8,893
|
4,968
|
4,630
|
13,212
|
33,944
|
24,136
|
10,645
|
34,781
|
||||||||||
|
Floating rate
|
(2,226)
|
499
|
3,861
|
917
|
1,551
|
1,770
|
6,372
|
3,579
|
2,960
|
6,539
|
||||||||||
|
Spread - Ref Euribor
|
1.81%
|
10.57%
|
0.74%
|
0.74%
|
0.96%
|
0.93%
|
1.2%
|
−
|
−
|
−
|
||||||||||
|
Fixed rate
|
638
|
3,330
|
5,032
|
3,601
|
3,079
|
10,642
|
26,322
|
19,307
|
7,685
|
26,992
|
||||||||||
|
Interest rate
|
6.09%
|
2.58%
|
5.09%
|
4.93%
|
4.40%
|
4.06%
|
4%
|
−
|
−
|
−
|
||||||||||
|
Rate cap
|
−
|
−
|
−
|
450
|
−
|
800
|
1,250
|
1,250
|
−
|
1,250
|
||||||||||
|
OTHER EUROPEAN CURRENCIES
|
||||||||||||||||||||
|
Instruments in CZK
|
1,248
|
150
|
356
|
46
|
−
|
−
|
1,800
|
131
|
1,694
|
1,825
|
||||||||||
|
Floating rate
|
20
|
150
|
−
|
−
|
−
|
−
|
170
|
20
|
151
|
171
|
||||||||||
|
Spread
|
−
|
−
|
−
|
−
|
−
|
−
|
−
|
−
|
−
|
−
|
||||||||||
|
Fixed rate
|
1,228
|
−
|
356
|
46
|
−
|
−
|
1,630
|
111
|
1,543
|
1,654
|
||||||||||
|
Interest rate
|
0.97%
|
−
|
1.99%
|
3.93%
|
−
|
−
|
−
|
−
|
−
|
−
|
||||||||||
|
Rate cap
|
−
|
−
|
−
|
−
|
−
|
−
|
−
|
−
|
−
|
−
|
||||||||||
|
Instruments in GBP
|
(365)
|
18
|
486
|
220
|
900
|
1,977
|
3,236
|
3,906
|
(586)
|
3,320
|
||||||||||
|
Floating rate
|
415
|
(66)
|
33
|
186
|
630
|
1,144
|
2,342
|
−
|
2,359
|
2,359
|
||||||||||
|
Spread
|
−
|
−
|
13.71%
|
−
|
−
|
−
|
0.19%
|
−
|
−
|
−
|
||||||||||
|
Fixed rate
|
(780)
|
84
|
453
|
34
|
270
|
713
|
774
|
3,786
|
(2,945)
|
841
|
||||||||||
|
Interest rate
|
2.45%
|
0.43%
|
4.95%
|
(2.28)%
|
14.37%
|
12.53%
|
17.72%
|
−
|
−
|
−
|
||||||||||
|
Rate cap
|
−
|
−
|
−
|
−
|
−
|
120
|
120
|
120
|
−
|
120
|
||||||||||
|
Instruments in CHF
|
−
|
−
|
−
|
−
|
−
|
−
|
−
|
575
|
(575)
|
−
|
||||||||||
|
Floating rate
|
−
|
−
|
−
|
−
|
−
|
−
|
−
|
−
|
(6)
|
(6)
|
||||||||||
|
Spread
|
−
|
−
|
−
|
−
|
−
|
−
|
−
|
−
|
−
|
−
|
||||||||||
|
Fixed rate
|
−
|
−
|
−
|
−
|
−
|
−
|
−
|
575
|
(569)
|
6
|
||||||||||
|
Interest rate
|
−
|
−
|
−
|
−
|
−
|
−
|
−
|
−
|
−
|
−
|
||||||||||
|
Rate cap
|
−
|
−
|
−
|
−
|
−
|
−
|
−
|
−
|
−
|
−
|
||||||||||
|
AMERICA
|
||||||||||||||||||||
|
Instruments in USD
|
(163)
|
(12)
|
(1,379)
|
(304)
|
(198)
|
3,509
|
1,453
|
16,096
|
(14,776)
|
1,320
|
||||||||||
|
Floating rate
|
(562)
|
(210)
|
(1,174)
|
(411)
|
(32)
|
3,230
|
841
|
3,040
|
(2,387)
|
653
|
||||||||||
|
Spread
|
0.24%
|
0.77%
|
(0.23)%
|
(0.84)%
|
(6.37)%
|
0.74%
|
3.45%
|
−
|
−
|
−
|
||||||||||
|
Fixed rate
|
399
|
190
|
(213)
|
99
|
(172)
|
279
|
582
|
13,026
|
(12,389)
|
637
|
||||||||||
|
Interest rate
|
4.95%
|
12.79%
|
(14.50)%
|
11.33%
|
294.14%
|
45.76%
|
29.16%
|
−
|
−
|
−
|
||||||||||
|
Rate cap
|
−
|
8
|
8
|
8
|
6
|
−
|
30
|
30
|
−
|
30
|
||||||||||
|
Instruments in UYU
|
(236)
|
1
|
1
|
−
|
−
|
−
|
(234)
|
1
|
(224)
|
(223)
|
||||||||||
|
Floating rate
|
−
|
−
|
−
|
−
|
−
|
−
|
−
|
−
|
−
|
−
|
||||||||||
|
Spread
|
−
|
−
|
−
|
−
|
−
|
−
|
−
|
−
|
−
|
−
|
||||||||||
|
Fixed rate
|
(236)
|
1
|
1
|
−
|
−
|
−
|
(234)
|
1
|
(224)
|
(223)
|
||||||||||
|
Interest rate
|
−
|
−
|
−
|
−
|
−
|
−
|
−
|
−
|
−
|
−
|
||||||||||
|
Rate cap
|
−
|
−
|
−
|
−
|
−
|
−
|
−
|
−
|
−
|
−
|
||||||||||
|
Instruments in ARS
|
156
|
4
|
3
|
3
|
−
|
2
|
168
|
10
|
145
|
155
|
||||||||||
|
Floating rate
|
−
|
−
|
−
|
−
|
−
|
−
|
−
|
−
|
−
|
−
|
||||||||||
|
Spread
|
−
|
−
|
−
|
−
|
−
|
−
|
−
|
−
|
−
|
−
|
||||||||||
|
Fixed rate
|
156
|
4
|
3
|
3
|
−
|
2
|
168
|
10
|
145
|
155
|
||||||||||
|
Interest rate
|
46.35%
|
9.09%
|
9.90%
|
9.90%
|
−
|
−
|
44%
|
−
|
−
|
−
|
||||||||||
|
Rate cap
|
−
|
−
|
−
|
−
|
−
|
−
|
−
|
−
|
−
|
−
|
||||||||||
|
Instruments in BRL
|
(1,427)
|
469
|
277
|
804
|
535
|
216
|
874
|
(67)
|
910
|
843
|
||||||||||
|
Floating rate
|
(1,845)
|
313
|
69
|
688
|
469
|
60
|
(246)
|
(750)
|
459
|
(291)
|
||||||||||
|
Spread
|
−
|
−
|
−
|
−
|
−
|
−
|
−
|
−
|
−
|
−
|
||||||||||
|
Fixed rate
|
418
|
156
|
208
|
116
|
66
|
156
|
1,120
|
683
|
451
|
1,134
|
||||||||||
|
Interest rate
|
−
|
−
|
−
|
−
|
−
|
−
|
−
|
−
|
−
|
−
|
||||||||||
|
Rate cap
|
−
|
−
|
−
|
−
|
−
|
−
|
−
|
−
|
−
|
−
|
||||||||||
|
Instruments in CLP
|
(232)
|
262
|
266
|
66
|
(1)
|
428
|
789
|
(244)
|
1,034
|
790
|
||||||||||
|
Floating rate
|
142
|
220
|
175
|
66
|
(89)
|
428
|
942
|
43.00
|
919
|
962
|
||||||||||
|
Spread
|
0.61%
|
1.09%
|
2.20%
|
−
|
−
|
(0.29)%
|
0.62%
|
−
|
−
|
−
|
||||||||||
|
Fixed rate
|
(374)
|
42
|
91
|
−
|
88
|
−
|
(153)
|
(287.00)
|
115
|
(172)
|
||||||||||
|
Interest rate
|
3.62%
|
5.24%
|
4.82%
|
−
|
5.05%
|
0.00%
|
1.64%
|
−
|
−
|
−
|
||||||||||
|
Rate cap
|
−
|
−
|
−
|
−
|
−
|
−
|
−
|
−
|
−
|
−
|
||||||||||
|
Instruments in UFC
|
(3)
|
2
|
1
|
−
|
−
|
−
|
−
|
338
|
(346)
|
(8)
|
||||||||||
|
Floating rate
|
−
|
−
|
−
|
−
|
−
|
−
|
−
|
−
|
−
|
−
|
||||||||||
|
Spread
|
−
|
−
|
−
|
−
|
−
|
−
|
−
|
−
|
−
|
−
|
||||||||||
|
Fixed rate
|
(3)
|
2
|
1
|
−
|
−
|
−
|
−
|
338
|
(346)
|
(8)
|
||||||||||
|
Interest rate
|
2.14%
|
6.00%
|
6.00%
|
−
|
−
|
−
|
70%
|
−
|
−
|
−
|
||||||||||
|
Rate cap
|
−
|
−
|
−
|
−
|
−
|
−
|
−
|
−
|
−
|
−
|
||||||||||
|
Instruments in PEN
|
252
|
105
|
117
|
79
|
22
|
25
|
600
|
246
|
319
|
565
|
||||||||||
|
Floating rate
|
−
|
−
|
−
|
−
|
−
|
−
|
−
|
−
|
−
|
−
|
||||||||||
|
Spread
|
−
|
−
|
−
|
−
|
−
|
−
|
−
|
−
|
−
|
−
|
||||||||||
|
Fixed rate
|
252
|
105
|
117
|
79
|
22
|
25
|
600
|
246
|
319
|
565
|
||||||||||
|
Interest rate
|
7.36%
|
7.23%
|
7.31%
|
7.44%
|
7.17%
|
6.67%
|
−
|
−
|
−
|
−
|
||||||||||
|
Rate cap
|
−
|
−
|
−
|
−
|
−
|
−
|
−
|
−
|
−
|
−
|
||||||||||
|
Instruments in VAC
|
−
|
−
|
−
|
54
|
16
|
84
|
154
|
154
|
−
|
154
|
||||||||||
|
Floating rate
|
−
|
−
|
−
|
54
|
16
|
84
|
154
|
154
|
−
|
154
|
||||||||||
|
Spread
|
−
|
−
|
−
|
3.66%
|
3.38%
|
3.37%
|
3.47%
|
−
|
−
|
−
|
||||||||||
|
Fixed rate
|
−
|
−
|
−
|
−
|
−
|
−
|
−
|
−
|
−
|
−
|
||||||||||
|
Interest rate
|
−
|
−
|
−
|
−
|
−
|
−
|
−
|
−
|
−
|
−
|
||||||||||
|
Rate cap
|
−
|
−
|
−
|
−
|
−
|
−
|
−
|
−
|
−
|
−
|
||||||||||
|
Instruments in COP
|
574
|
44
|
136
|
444
|
172
|
1,501
|
2,871
|
1,843
|
1,095
|
2,938
|
||||||||||
|
Floating rate
|
12
|
33
|
125
|
155
|
166
|
1,498
|
1,989
|
1,955
|
39
|
1,994
|
||||||||||
|
Spread
|
3.98%
|
4.17%
|
4.17%
|
4.51%
|
4.70%
|
−
|
−
|
−
|
−
|
−
|
||||||||||
|
Fixed rate
|
562
|
11
|
11
|
289
|
6
|
3
|
882
|
(112)
|
1,056
|
944
|
||||||||||
|
Interest rate
|
3.79%
|
5.22%
|
5.22%
|
4.63%
|
5.30%
|
5.30%
|
−
|
−
|
−
|
−
|
||||||||||
|
Rate cap
|
−
|
−
|
−
|
−
|
−
|
−
|
−
|
−
|
−
|
−
|
||||||||||
|
Instruments in VEB
|
(2,703)
|
(20)
|
(5)
|
−
|
−
|
−
|
(2,728)
|
(2,726)
|
−
|
(2,726)
|
||||||||||
|
Floating rate
|
−
|
−
|
−
|
−
|
−
|
−
|
−
|
−
|
−
|
−
|
||||||||||
|
Spread
|
−
|
−
|
−
|
−
|
−
|
−
|
−
|
−
|
−
|
−
|
||||||||||
|
Fixed rate
|
(2,703)
|
(20)
|
(5)
|
−
|
−
|
−
|
(2,728)
|
(2,726)
|
−
|
(2,726)
|
||||||||||
|
Interest rate
|
2.29%
|
12.58%
|
18.00%
|
−
|
−
|
−
|
−
|
−
|
−
|
−
|
||||||||||
|
Rate cap
|
−
|
−
|
−
|
−
|
−
|
−
|
−
|
−
|
−
|
−
|
|
Instruments in UDI
|
17
|
20
|
14
|
8
|
11
|
(69)
|
1
|
917
|
(753)
|
164
|
||||||||||
|
Floating rate
|
17
|
20
|
14
|
8
|
11
|
(69)
|
1
|
917
|
(753)
|
164
|
||||||||||
|
Spread
|
22.28%
|
19.46%
|
25.64%
|
39.22%
|
31.84%
|
(39.07)%
|
3165%
|
−
|
−
|
−
|
||||||||||
|
Fixed rate
|
−
|
−
|
−
|
−
|
−
|
−
|
−
|
−
|
−
|
−
|
||||||||||
|
Interest rate
|
−
|
−
|
−
|
−
|
−
|
−
|
−
|
−
|
−
|
−
|
||||||||||
|
Rate cap
|
−
|
−
|
−
|
−
|
−
|
−
|
−
|
−
|
−
|
−
|
||||||||||
|
Instruments in MXN
|
189
|
55
|
55
|
55
|
55
|
679
|
1,088
|
74
|
1,422
|
1,496
|
||||||||||
|
Floating rate
|
5
|
−
|
−
|
−
|
−
|
−
|
5
|
(147)
|
150
|
3
|
||||||||||
|
Spread
|
2.42%
|
−
|
−
|
−
|
−
|
−
|
2.37%
|
−
|
−
|
−
|
||||||||||
|
Fixed rate
|
184
|
55
|
55
|
55
|
55
|
679
|
1,083
|
221
|
1,272
|
1,493
|
||||||||||
|
Interest rate
|
14.85%
|
3.70%
|
3.70%
|
3.70%
|
3.70%
|
4.19%
|
5.91%
|
−
|
−
|
−
|
||||||||||
|
Rate cap
|
−
|
−
|
−
|
−
|
−
|
−
|
−
|
−
|
−
|
−
|
||||||||||
|
Instruments in GTQ
|
(4)
|
−
|
−
|
−
|
−
|
−
|
(4)
|
(4)
|
−
|
(4)
|
||||||||||
|
Floating rate
|
(4)
|
−
|
−
|
−
|
−
|
−
|
(4)
|
(4)
|
−
|
(4)
|
||||||||||
|
Spread
|
0.01%
|
−
|
−
|
−
|
−
|
−
|
0.01%
|
−
|
−
|
−
|
||||||||||
|
Fixed rate
|
−
|
−
|
−
|
−
|
−
|
−
|
−
|
−
|
−
|
−
|
||||||||||
|
Interest rate
|
−
|
−
|
−
|
−
|
−
|
−
|
−
|
−
|
−
|
−
|
||||||||||
|
Rate cap
|
−
|
−
|
−
|
−
|
−
|
−
|
−
|
−
|
−
|
−
|
||||||||||
|
Instruments in NIO
|
(9)
|
−
|
−
|
−
|
−
|
−
|
(9)
|
(9)
|
−
|
(9)
|
||||||||||
|
Floating rate
|
(9)
|
−
|
−
|
−
|
−
|
−
|
(9)
|
(9)
|
−
|
(9)
|
||||||||||
|
Spread
|
0.01%
|
−
|
−
|
−
|
−
|
−
|
0.01%
|
−
|
−
|
−
|
||||||||||
|
Fixed rate
|
−
|
−
|
−
|
−
|
−
|
−
|
−
|
−
|
−
|
−
|
||||||||||
|
Interest rate
|
−
|
−
|
−
|
−
|
−
|
−
|
−
|
−
|
−
|
−
|
||||||||||
|
Rate cap
|
−
|
−
|
−
|
−
|
−
|
−
|
−
|
−
|
−
|
−
|
||||||||||
|
ASIA
|
||||||||||||||||||||
|
Instruments in JPY
|
(3)
|
−
|
−
|
−
|
−
|
−
|
(3)
|
136
|
(137)
|
(1)
|
||||||||||
|
Floating rate
|
−
|
−
|
−
|
−
|
−
|
−
|
−
|
−
|
(2)
|
(2)
|
||||||||||
|
Spread
|
−
|
−
|
−
|
−
|
−
|
−
|
−
|
−
|
−
|
−
|
||||||||||
|
Fixed rate
|
(3)
|
−
|
−
|
−
|
−
|
−
|
(3)
|
136
|
(135)
|
1
|
||||||||||
|
Interest rate
|
−
|
−
|
−
|
−
|
−
|
−
|
−
|
−
|
−
|
−
|
||||||||||
|
Rate cap
|
−
|
−
|
−
|
−
|
−
|
−
|
−
|
−
|
−
|
−
|
||||||||||
|
TOTAL
|
−
|
−
|
−
|
−
|
−
|
−
|
44,000
|
45,513
|
(133)
|
45,380
|
||||||||||
|
Floating rate
|
12,557
|
8,798
|
3,889
|
12,687
|
||||||||||||||||
|
Fixed rate
|
30,043
|
35,315
|
(4,022)
|
31,293
|
||||||||||||||||
|
Rate cap
|
1,400
|
1,400
|
−
|
1,400
|
||||||||||||||||
|
Currency options
|
−
|
−
|
165
|
165
|
||||||||||||||||
The table below is an extract of the previous table that shows the sensitivity to interest rates originated by our position on interest rate swaps categorized into instruments entered into for trading purposes and instruments entered into for purposes other than trading at December 31, 2013:
|
Millions of euros
|
Maturity
|
|||||||||||||||
|
Trading purposes
|
2014
|
2015
|
2016
|
2017
|
2018
|
Subsequent years
|
Total
|
Fair value
|
||||||||
|
EUR
|
(304)
|
|||||||||||||||
|
Fixed to fixed
|
−
|
−
|
−
|
−
|
−
|
−
|
−
|
2
|
||||||||
|
Receiving leg
|
(35)
|
(20)
|
−
|
−
|
(40)
|
−
|
(95)
|
(186)
|
||||||||
|
Average interest rate
|
−
|
−
|
−
|
−
|
−
|
−
|
−
|
−
|
||||||||
|
Paying leg
|
35
|
20
|
−
|
−
|
40
|
−
|
95
|
188
|
||||||||
|
Average spread
|
1.12%
|
1.63%
|
−
|
−
|
0.84%
|
−
|
1.11%
|
−
|
||||||||
|
Fixed to floating
|
−
|
−
|
−
|
(33)
|
−
|
−
|
(33)
|
(660)
|
||||||||
|
Receiving leg
|
(2,526)
|
(2,510)
|
(4,805)
|
(4,677)
|
(2,634)
|
(7,636)
|
(24,788)
|
(10,429)
|
||||||||
|
Average interest rate
|
1.41%
|
1.10%
|
0.29%
|
1.46%
|
1.56%
|
2.64%
|
1.57%
|
−
|
||||||||
|
Paying leg
|
2,526
|
2,510
|
4,805
|
4,644
|
2,634
|
7,636
|
24,755
|
9,769
|
||||||||
|
Average spread
|
0.99%
|
0.37%
|
1.93%
|
0.24%
|
0.54%
|
−
|
0.62%
|
−
|
||||||||
|
Floating to fixed
|
−
|
−
|
−
|
−
|
−
|
−
|
−
|
355
|
||||||||
|
Receiving leg
|
(6,595)
|
(82)
|
(4,721)
|
(2,756)
|
(915)
|
(5,798)
|
(20,867)
|
(13,413)
|
||||||||
|
Average interest rate
|
0.44%
|
−
|
1.68%
|
−
|
−
|
−
|
0.52%
|
−
|
||||||||
|
Paying leg
|
6,595
|
82
|
4,721
|
2,756
|
915
|
5,798
|
20,867
|
13,768
|
||||||||
|
Average spread
|
0.47%
|
0.60%
|
1.16%
|
1.75%
|
2.18%
|
2.23%
|
1.36%
|
−
|
||||||||
|
Floating to floating
|
−
|
−
|
−
|
−
|
−
|
−
|
−
|
(1)
|
||||||||
|
Receiving leg
|
−
|
(50)
|
−
|
−
|
−
|
−
|
(50)
|
(51)
|
||||||||
|
Average spread
|
−
|
−
|
−
|
−
|
−
|
−
|
−
|
−
|
||||||||
|
Paying leg
|
−
|
50
|
−
|
−
|
−
|
−
|
50
|
50
|
||||||||
|
Average interest rate
|
−
|
0.28%
|
−
|
−
|
−
|
−
|
0.28%
|
−
|
||||||||
|
USD
|
54
|
|||||||||||||||
|
Fixed to fixed
|
−
|
−
|
−
|
−
|
−
|
−
|
−
|
(12)
|
||||||||
|
Receiving leg
|
(36)
|
(129)
|
(151)
|
(504)
|
(172)
|
(218)
|
(1,210)
|
(1,222)
|
||||||||
|
Average interest rate
|
1.04%
|
0.87%
|
1.82%
|
1.89%
|
2.09%
|
1.77%
|
1.76%
|
−
|
||||||||
|
Paying leg
|
36
|
129
|
151
|
504
|
172
|
218
|
1,210
|
1,210
|
||||||||
|
Average spread
|
−
|
−
|
−
|
−
|
−
|
−
|
−
|
−
|
||||||||
|
Floating to fixed
|
−
|
−
|
−
|
−
|
−
|
−
|
−
|
66
|
||||||||
|
Receiving leg
|
(94)
|
(113)
|
(18)
|
(751)
|
(305)
|
(218)
|
(1,499)
|
(1,499)
|
||||||||
|
Average interest rate
|
−
|
−
|
−
|
−
|
−
|
−
|
−
|
−
|
||||||||
|
Paying leg
|
94
|
113
|
18
|
751
|
305
|
218
|
1,499
|
1,565
|
||||||||
|
Average spread
|
0.92%
|
2.25%
|
1.07%
|
3.06%
|
3.16%
|
1.93%
|
2.70%
|
−
|
||||||||
|
GBP
|
−
|
|||||||||||||||
|
Fixed to floating
|
−
|
−
|
−
|
−
|
−
|
−
|
−
|
5
|
||||||||
|
Receiving leg
|
(300)
|
(48)
|
(372)
|
(198)
|
(420)
|
(270)
|
(1,608)
|
(1,127)
|
||||||||
|
Average interest rate
|
0.31%
|
1.46%
|
1.38%
|
1.52%
|
1.79%
|
2.38%
|
1.47%
|
−
|
||||||||
|
Paying leg
|
300
|
48
|
372
|
198
|
420
|
270
|
1,608
|
1,132
|
||||||||
|
Average spread
|
1.27%
|
−
|
−
|
−
|
−
|
−
|
0.24%
|
−
|
||||||||
|
Floating to fixed
|
−
|
−
|
−
|
−
|
−
|
−
|
−
|
(5)
|
||||||||
|
Receiving leg
|
(605)
|
(114)
|
(340)
|
(132)
|
(90)
|
(263)
|
(1,544)
|
(1,547)
|
||||||||
|
Average spread
|
−
|
−
|
−
|
−
|
−
|
−
|
−
|
−
|
||||||||
|
Paying leg
|
605
|
114
|
340
|
132
|
90
|
263
|
1,544
|
1,542
|
||||||||
|
Average interest rate
|
0.86%
|
0.93%
|
1.01%
|
1.08%
|
2.07%
|
2.50%
|
1.27%
|
−
|
||||||||
|
CZK
|
1
|
|||||||||||||||
|
Floating to fixed
|
−
|
−
|
−
|
−
|
−
|
−
|
−
|
1
|
||||||||
|
Receiving leg
|
−
|
−
|
−
|
(46)
|
−
|
−
|
(46)
|
(46)
|
||||||||
|
Average spread
|
−
|
−
|
−
|
−
|
−
|
−
|
−
|
−
|
||||||||
|
Paying leg
|
−
|
−
|
−
|
46
|
−
|
−
|
46
|
47
|
||||||||
|
Average interest rate
|
−
|
−
|
−
|
1.25%
|
−
|
−
|
1.25%
|
−
|
|
Millions of euros
|
Maturity
|
|||||||||||||||
|
Non trading purposes
|
2014
|
2015
|
2016
|
2017
|
2018
|
Subsequent years
|
Total
|
Fair value
|
||||||||
|
EUR
|
1,107
|
|||||||||||||||
|
Fixed to floating
|
−
|
−
|
−
|
−
|
−
|
−
|
−
|
(647)
|
||||||||
|
Receiving leg
|
(2,815)
|
(1,005)
|
(3,093)
|
(2,426)
|
(2,606)
|
(5,695)
|
(17,640)
|
(18,245)
|
||||||||
|
Average interest rate
|
3.26%
|
2.32%
|
2.80%
|
1.94%
|
1.36%
|
1.91%
|
2.23%
|
−
|
||||||||
|
Paying leg
|
2,815
|
1,005
|
3,093
|
2,426
|
2,606
|
5,695
|
17,640
|
17,598
|
||||||||
|
Average spread
|
0.01%
|
0.03%
|
0.01%
|
0.01%
|
0.01%
|
0.00%
|
0.01%
|
−
|
||||||||
|
Floating to fixed
|
−
|
−
|
−
|
−
|
−
|
−
|
−
|
1,754
|
||||||||
|
Receiving leg
|
(4,022)
|
(6,368)
|
(3,120)
|
(2,882)
|
(3,820)
|
(10,560)
|
(30,772)
|
(22,717)
|
||||||||
|
Average interest rate
|
1.24%
|
0.32%
|
−
|
−
|
0.11%
|
−
|
0.24%
|
−
|
||||||||
|
Paying leg
|
4,022
|
6,368
|
3,120
|
2,882
|
3,820
|
10,560
|
30,772
|
24,471
|
||||||||
|
Average spread
|
0.44%
|
2.69%
|
3.16%
|
2.35%
|
2.39%
|
2.94%
|
2.46%
|
−
|
||||||||
|
USD
|
(883)
|
|||||||||||||||
|
Fixed to floating
|
−
|
−
|
−
|
−
|
−
|
−
|
−
|
(888)
|
||||||||
|
Receiving leg
|
(575)
|
(2,304)
|
(5,007)
|
(730)
|
(1,129)
|
(6,395)
|
(16,140)
|
(12,306)
|
||||||||
|
Average interest rate
|
0.47%
|
2.51%
|
3.16%
|
4.62%
|
1.13%
|
3.53%
|
3.04%
|
−
|
||||||||
|
Paying leg
|
575
|
2,304
|
5,007
|
730
|
1,129
|
6,395
|
16,140
|
11,418
|
||||||||
|
Average spread
|
1.53%
|
0.42%
|
1.64%
|
−
|
−
|
−
|
0.63%
|
−
|
||||||||
|
Floating to fixed
|
−
|
−
|
−
|
−
|
−
|
−
|
−
|
5
|
||||||||
|
Receiving leg
|
(27)
|
(27)
|
(26)
|
−
|
−
|
−
|
(80)
|
(80)
|
||||||||
|
Average interest rate
|
−
|
−
|
−
|
−
|
−
|
−
|
−
|
−
|
||||||||
|
Paying leg
|
27
|
27
|
26
|
−
|
−
|
−
|
80
|
85
|
||||||||
|
Average spread
|
4.34%
|
4.34%
|
4.34%
|
−
|
−
|
−
|
4.34%
|
−
|
||||||||
|
MXN
|
(9)
|
|||||||||||||||
|
Fixed to floating
|
−
|
−
|
−
|
−
|
−
|
−
|
−
|
(19)
|
||||||||
|
Receiving leg
|
−
|
−
|
−
|
−
|
−
|
(111)
|
(111)
|
(134)
|
||||||||
|
Average interest rate
|
−
|
−
|
−
|
−
|
−
|
8.07%
|
8.07%
|
−
|
||||||||
|
Paying leg
|
−
|
−
|
−
|
−
|
−
|
111
|
111
|
115
|
||||||||
|
Average spread
|
−
|
−
|
−
|
−
|
−
|
0.61%
|
0.61%
|
−
|
||||||||
|
Floating to fixed
|
−
|
−
|
−
|
−
|
−
|
−
|
−
|
10
|
||||||||
|
Receiving leg
|
(222)
|
−
|
−
|
−
|
−
|
(110)
|
(332)
|
(338)
|
||||||||
|
Average interest rate
|
0.55%
|
−
|
−
|
−
|
−
|
0.61%
|
0.57%
|
−
|
||||||||
|
Paying leg
|
222
|
−
|
−
|
−
|
−
|
110
|
332
|
348
|
||||||||
|
Average spread
|
5.55%
|
−
|
−
|
−
|
−
|
6.62%
|
5.90%
|
−
|
||||||||
|
GBP
|
(39)
|
|||||||||||||||
|
Fixed to floating
|
−
|
−
|
−
|
−
|
−
|
−
|
−
|
(74)
|
||||||||
|
Receiving leg
|
(600)
|
−
|
−
|
−
|
(900)
|
(2,098)
|
(3,598)
|
(3,676)
|
||||||||
|
Average interest rate
|
5.25%
|
−
|
−
|
−
|
1.42%
|
2.99%
|
2.97%
|
−
|
||||||||
|
Paying leg
|
600
|
−
|
−
|
−
|
900
|
2,098
|
3,598
|
3,602
|
||||||||
|
Average spread
|
−
|
−
|
−
|
−
|
−
|
−
|
−
|
−
|
||||||||
|
Floating to fixed
|
−
|
−
|
−
|
−
|
−
|
−
|
−
|
35
|
||||||||
|
Receiving leg
|
(600)
|
−
|
(485)
|
−
|
(600)
|
−
|
(1,685)
|
(495)
|
||||||||
|
Average spread
|
1.48%
|
−
|
−
|
−
|
−
|
−
|
0.53%
|
−
|
||||||||
|
Paying leg
|
600
|
−
|
485
|
−
|
600
|
−
|
1,685
|
530
|
||||||||
|
Average interest rate
|
−
|
−
|
4.96%
|
−
|
1.48%
|
−
|
−
|
−
|
|
JPY
|
(3)
|
|||||||||||||||
|
Fixed to floating
|
−
|
−
|
−
|
−
|
−
|
−
|
−
|
(3)
|
||||||||
|
Receiving leg
|
−
|
−
|
(48)
|
−
|
(70)
|
−
|
(118)
|
(121)
|
||||||||
|
Average interest rate
|
−
|
−
|
2.82%
|
−
|
0.32%
|
−
|
1.34%
|
−
|
||||||||
|
Paying leg
|
−
|
−
|
48
|
−
|
70
|
−
|
118
|
118
|
||||||||
|
Average spread
|
−
|
−
|
−
|
−
|
−
|
−
|
−
|
−
|
||||||||
|
CLP
|
2
|
|||||||||||||||
|
Fixed to floating
|
−
|
−
|
−
|
−
|
−
|
−
|
−
|
1
|
||||||||
|
Receiving leg
|
(64)
|
−
|
(159)
|
−
|
−
|
−
|
(223)
|
(234)
|
||||||||
|
Average interest rate
|
5.22%
|
−
|
6.51%
|
−
|
−
|
−
|
6.14%
|
−
|
||||||||
|
Paying leg
|
64
|
−
|
159
|
−
|
−
|
−
|
223
|
235
|
||||||||
|
Average spread
|
0.67%
|
−
|
1.66%
|
−
|
−
|
−
|
1.38%
|
−
|
||||||||
|
Floating to fixed
|
−
|
−
|
−
|
−
|
−
|
−
|
−
|
1
|
||||||||
|
Receiving leg
|
(42)
|
(42)
|
(91)
|
−
|
(88)
|
−
|
(263)
|
(182)
|
||||||||
|
Average interest rate
|
5.24%
|
−
|
−
|
−
|
−
|
−
|
0.84%
|
−
|
||||||||
|
Paying leg
|
42
|
42
|
91
|
−
|
88
|
−
|
263
|
183
|
||||||||
|
Average spread
|
−
|
5.24%
|
4.82%
|
−
|
−
|
−
|
2.51%
|
−
|
||||||||
|
CHF
|
14
|
|||||||||||||||
|
Fixed to floating
|
−
|
−
|
−
|
−
|
−
|
−
|
−
|
14
|
||||||||
|
Receiving leg
|
−
|
−
|
−
|
−
|
(203)
|
(306)
|
(509)
|
(495)
|
||||||||
|
Average interest rate
|
−
|
−
|
−
|
−
|
0.28%
|
0.87%
|
0.63%
|
−
|
||||||||
|
Paying leg
|
−
|
−
|
−
|
−
|
203
|
306
|
509
|
509
|
||||||||
|
Average spread
|
−
|
−
|
−
|
−
|
−
|
−
|
−
|
−
|
||||||||
|
CZK
|
(1)
|
|||||||||||||||
|
Fixed to floating
|
−
|
−
|
−
|
−
|
−
|
−
|
−
|
(1)
|
||||||||
|
Receiving leg
|
−
|
−
|
−
|
(46)
|
−
|
−
|
(46)
|
(47)
|
||||||||
|
Average interest rate
|
−
|
−
|
−
|
1.60%
|
−
|
−
|
1.60%
|
−
|
||||||||
|
Paying leg
|
−
|
−
|
−
|
46
|
−
|
−
|
46
|
46
|
||||||||
|
Average spread
|
−
|
−
|
−
|
−
|
−
|
−
|
−
|
−
|
||||||||
|
BRL
|
22
|
|||||||||||||||
|
Fixed to floating
|
−
|
−
|
−
|
−
|
−
|
−
|
−
|
22
|
||||||||
|
Receiving leg
|
(18)
|
(43)
|
(43)
|
(43)
|
(43)
|
(26)
|
(216)
|
(216)
|
||||||||
|
Average interest rate
|
9.64%
|
9.64%
|
9.64%
|
9.64%
|
9.64%
|
9.64%
|
9.64%
|
−
|
||||||||
|
Paying leg
|
18
|
43
|
43
|
43
|
43
|
26
|
216
|
238
|
||||||||
|
Average spread
|
−
|
−
|
−
|
−
|
−
|
−
|
−
|
−
|
||||||||
|
COP
|
2
|
|||||||||||||||
|
Fixed to floating
|
−
|
−
|
−
|
−
|
−
|
−
|
−
|
2
|
||||||||
|
Receiving leg
|
−
|
−
|
(2)
|
(9)
|
(9)
|
(15)
|
(35)
|
(37)
|
||||||||
|
Average interest rate
|
−
|
−
|
7.21%
|
7.90%
|
7.90%
|
7.99%
|
7.90%
|
−
|
||||||||
|
Paying leg
|
−
|
−
|
2
|
9
|
9
|
15
|
35
|
39
|
||||||||
|
Average spread
|
−
|
−
|
3.33%
|
3.53%
|
3.53%
|
3.56%
|
3.53%
|
−
|
Foreign exchange and interest rate options, by maturity, are as follows:
|
Maturities
|
|||||||||||||||||||||||
|
Millions of euros
|
2014
|
2015
|
2016
|
2017
|
2018
|
Subsequent years
|
|||||||||||||||||
|
Currency Puts (EURUSD, EURGBP)
|
|||||||||||||||||||||||
|
Notional amount of options bought
|
− | 87 | − | 1,423 | 136 | − | |||||||||||||||||
|
Strike
|
− | 1.54 | − | 1.36 | 1.57 | − | |||||||||||||||||
|
Notional amount of options sold
|
− | − | − | 1,545 | − | − | |||||||||||||||||
|
Strike
|
− | − | − | 1.27 | − | − | |||||||||||||||||
|
Interest rate options
|
Maturities
|
||||||||||||||||||||||
|
Millions of euros
|
2014
|
2015
|
2016
|
2017
|
2018
|
Subsequent years
|
|||||||||||||||||
|
Collars
|
|||||||||||||||||||||||
|
Notional amount of options bought
|
− | − | 480 | − | 800 | 899 | |||||||||||||||||
|
Strike Cap
|
− | − | 4.30 | − | 4.35 | 4.92 | |||||||||||||||||
|
Strike Floor
|
− | − | 3.00 | − | 3.05 | 4.15 | |||||||||||||||||
|
Caps
|
|||||||||||||||||||||||
|
Notional amount of options bought
|
− | − | − | − | − | − | |||||||||||||||||
|
Strike
|
− | − | − | − | − | − | |||||||||||||||||
|
Notional amount of options sold
|
− | − | 30 | − | − | 899 | |||||||||||||||||
|
Strike
|
− | − | 5.75 | − | − | 5.53 | |||||||||||||||||
|
Floors
|
|||||||||||||||||||||||
|
Notional amount of options bought
|
− | − | − | − | − | 899 | |||||||||||||||||
|
Strike
|
− | − | − | − | − | 1.17 | |||||||||||||||||
|
Notional amount of options sold
|
− | − | − | − | − | − | |||||||||||||||||
|
Strike
|
− | − | − | − | − | − | |||||||||||||||||
Cash flows receivable or payable on derivative financial instruments to be settled via the swap of nominals, categorized by currency of collection/payment, along with contractual maturities are as follows:
|
2014
|
2015
|
2016
|
2017
|
2018
|
Subsequent years
|
Total
|
||||||||||
|
Currency swaps
|
||||||||||||||||
|
Receive
|
ARS
|
−
|
−
|
−
|
−
|
−
|
−
|
−
|
||||||||
|
Pay
|
ARS
|
−
|
−
|
−
|
−
|
−
|
−
|
−
|
||||||||
|
Receive
|
BRL
|
72
|
−
|
−
|
−
|
−
|
−
|
72
|
||||||||
|
Pay
|
BRL
|
(370)
|
(168)
|
(147)
|
(72)
|
(25)
|
(15)
|
(797)
|
||||||||
|
Receive
|
CLP
|
−
|
261
|
107
|
66
|
−
|
428
|
862
|
||||||||
|
Pay
|
CLP
|
(197)
|
(523)
|
(215)
|
(132)
|
−
|
(1,183)
|
(2,250)
|
||||||||
|
Receive
|
COP
|
−
|
−
|
−
|
−
|
−
|
−
|
−
|
||||||||
|
Pay
|
COP
|
(35)
|
(11)
|
(11)
|
(288)
|
(6)
|
(510)
|
(861)
|
||||||||
|
Receive
|
CZK
|
−
|
−
|
−
|
−
|
−
|
−
|
−
|
||||||||
|
Pay
|
CZK
|
(214)
|
(150)
|
(356)
|
−
|
−
|
−
|
(720)
|
||||||||
|
Receive
|
EUR
|
921
|
547
|
1,238
|
60
|
−
|
95
|
2,861
|
||||||||
|
Pay
|
EUR
|
(99)
|
(3,279)
|
(4,713)
|
(1,309)
|
(2,800)
|
(10,808)
|
(23,008)
|
||||||||
|
Receive
|
GBP
|
−
|
−
|
−
|
−
|
−
|
1,679
|
1,679
|
||||||||
|
Pay
|
GBP
|
−
|
−
|
(485)
|
−
|
−
|
−
|
(485)
|
||||||||
|
Receive
|
JPY
|
2
|
−
|
48
|
−
|
138
|
−
|
188
|
||||||||
|
Pay
|
JPY
|
−
|
−
|
−
|
−
|
−
|
−
|
−
|
||||||||
|
Receive
|
MAD
|
−
|
−
|
−
|
−
|
−
|
−
|
−
|
||||||||
|
Pay
|
MAD
|
−
|
−
|
−
|
−
|
−
|
−
|
−
|
||||||||
|
Receive
|
MXN
|
−
|
−
|
−
|
−
|
−
|
−
|
−
|
||||||||
|
Pay
|
MXN
|
(54)
|
(54)
|
(54)
|
(54)
|
(54)
|
(569)
|
(839)
|
||||||||
|
Receive
|
PEN
|
−
|
−
|
−
|
−
|
−
|
−
|
−
|
||||||||
|
Pay
|
PEN
|
(14)
|
(14)
|
(32)
|
(14)
|
(6)
|
(1)
|
(81)
|
||||||||
|
Receive
|
UFC
|
161
|
−
|
129
|
−
|
−
|
193
|
483
|
||||||||
|
Pay
|
UFC
|
−
|
−
|
(64)
|
−
|
−
|
(97)
|
(161)
|
||||||||
|
Receive
|
USD
|
433
|
4,099
|
4,588
|
1,769
|
2,116
|
9,919
|
22,924
|
||||||||
|
Pay
|
USD
|
(567)
|
(645)
|
(134)
|
(71)
|
−
|
(455)
|
(1,872)
|
||||||||
|
Receive
|
UDI
|
59
|
61
|
61
|
60
|
60
|
631
|
932
|
||||||||
|
Pay
|
UDI
|
−
|
−
|
−
|
−
|
−
|
−
|
−
|
||||||||
|
Receive
|
CHF
|
−
|
−
|
−
|
−
|
−
|
612
|
612
|
||||||||
|
Pay
|
CHF
|
−
|
−
|
−
|
−
|
407
|
−
|
407
|
||||||||
|
TOTAL
|
98
|
124
|
(40)
|
15
|
(170)
|
(81)
|
(54)
|
|||||||||
|
Millions of euros
|
2014
|
2015
|
2016
|
2017
|
2018
|
Subsequent years
|
Total
|
|||||||||
|
Forwards
|
||||||||||||||||
|
Receive
|
ARS
|
−
|
−
|
−
|
−
|
−
|
−
|
−
|
||||||||
|
Pay
|
ARS
|
(268)
|
−
|
−
|
−
|
−
|
−
|
(268)
|
||||||||
|
Receive
|
BRL
|
6
|
−
|
−
|
−
|
−
|
−
|
6
|
||||||||
|
Pay
|
BRL
|
(162)
|
−
|
−
|
−
|
−
|
−
|
(162)
|
||||||||
|
Receive
|
CLP
|
171
|
−
|
−
|
−
|
−
|
−
|
171
|
||||||||
|
Pay
|
CLP
|
(87)
|
−
|
−
|
−
|
−
|
−
|
(87)
|
||||||||
|
Receive
|
COP
|
15
|
−
|
−
|
−
|
−
|
−
|
15
|
||||||||
|
Pay
|
COP
|
(587)
|
−
|
−
|
−
|
−
|
−
|
(587)
|
||||||||
|
Receive
|
CZK
|
−
|
−
|
−
|
−
|
−
|
−
|
−
|
||||||||
|
Pay
|
CZK
|
(988)
|
−
|
−
|
−
|
−
|
−
|
(988)
|
||||||||
|
Receive
|
EUR
|
7,470
|
−
|
−
|
−
|
−
|
−
|
7,470
|
||||||||
|
Pay
|
EUR
|
(5,272)
|
−
|
−
|
−
|
−
|
−
|
(5,272)
|
||||||||
|
Receive
|
GBP
|
3,729
|
−
|
−
|
−
|
−
|
−
|
3,729
|
||||||||
|
Pay
|
GBP
|
(3,534)
|
−
|
−
|
−
|
−
|
−
|
(3,534)
|
||||||||
|
Receive
|
MXN
|
5
|
−
|
−
|
−
|
−
|
−
|
5
|
||||||||
|
Pay
|
MXN
|
(732)
|
−
|
−
|
−
|
−
|
−
|
(732)
|
||||||||
|
Receive
|
PEN
|
3
|
−
|
−
|
−
|
−
|
−
|
3
|
||||||||
|
Pay
|
PEN
|
(297)
|
−
|
−
|
−
|
−
|
−
|
(297)
|
||||||||
|
Receive
|
UFC
|
6
|
−
|
−
|
−
|
−
|
−
|
6
|
||||||||
|
Pay
|
UFC
|
−
|
−
|
−
|
−
|
−
|
−
|
−
|
||||||||
|
Receive
|
USD
|
2,926
|
−
|
−
|
−
|
−
|
−
|
2,926
|
||||||||
|
Pay
|
USD
|
(2,607)
|
−
|
−
|
−
|
−
|
−
|
(2,607)
|
||||||||
|
Receive
|
UYU
|
227
|
227
|
|||||||||||||
|
Pay
|
UYU
|
−
|
−
|
−
|
−
|
−
|
−
|
−
|
||||||||
|
TOTAL
|
24
|
−
|
−
|
−
|
−
|
−
|
24
|
|||||||||
Appendix V: Interest-bearing debt
The main financing transactions at December 31, 2013 and 2012 and their nominal amounts are as follows:
|
Outstanding principal balance
|
||||||||||||
|
(millions of euros)
|
||||||||||||
|
Descriptive name summary
|
Contractual limit amount (millions)
|
Currency
|
12/31/13
|
12/31/12
|
Arrangement date
|
Maturity date
|
||||||
|
Telefónica, S.A
|
||||||||||||
|
Syndicated loan**
|
700
|
EUR
|
700
|
700
|
04/21/2006
|
04/21/2017
|
||||||
|
Syndicated loan Tranche A1
|
-
|
EUR
|
-
|
1,000
|
07/28/2010
|
07/28/2013
|
||||||
|
Syndicated loan Tranche A2*
|
2,000
|
EUR
|
2,000
|
2,000
|
07/28/2010
|
07/28/2014
|
||||||
|
Syndicated loan Tranche A3
|
2,000
|
EUR
|
2,000
|
2,000
|
07/28/2010
|
07/28/2016
|
||||||
|
Syndicated loan Tranche B
|
3,000
|
EUR
|
-
|
3,000
|
07/28/2010
|
07/28/2015
|
||||||
|
Syndicated loan Tranche D2
|
923
|
EUR
|
923
|
923
|
03/02/2012
|
12/14/2015
|
||||||
|
Vendor Financing **
|
1,001
|
USD
|
336
|
-
|
02/22/2013
|
01/31/2023
|
||||||
|
Syndicated loan Tranche A2A (FSF)*
|
700
|
EUR
|
-
|
-
|
02/22/2013
|
02/22/2017
|
||||||
|
Syndicated loan Tranche A2B (FSF)*
|
700
|
EUR
|
-
|
-
|
02/22/2013
|
02/22/2018
|
||||||
|
ECAs structured facility**
|
734
|
USD
|
-
|
-
|
08/01/2013
|
08/01/2023
|
||||||
|
Telefónica Finanzas, S.A.
|
||||||||||||
|
EIB - Mobile financing
|
375
|
EUR
|
375
|
375
|
12/03/2007
|
01/30/2015
|
||||||
|
Telefónica Europe, B.V.
|
||||||||||||
|
Syndicated loan Tranche D1
|
801
|
EUR
|
801
|
801
|
03/02/2012
|
12/14/2015
|
||||||
|
Vendor Financing**
|
375
|
USD
|
272
|
284
|
01/05/2012
|
01/31/2022
|
||||||
|
Vendor Financing**
|
1,200
|
USD
|
612
|
−
|
08/28/2012
|
10/31/2023
|
||||||
|
Brazil
|
||||||||||||
|
EIB Financing**
|
365
|
USD
|
265
|
277
|
10/31/2007
|
03/02/2015
|
||||||
|
BNDES C3 bilateral loan**
|
2,152
|
BRL
|
638
|
668
|
10/14/2011
|
07/15/2019
|
||||||
|
* 1,400 million euros under Tranche A2 were refinanced with forward start facilities dated 02/22/2013 (available from 07/28/2014).
|
||||||||||||
|
** Facilities with amortization schedule.
|
||||||||||||
Appendix VI: Main companies comprising the Telefónica Group
The table below lists the main companies comprising the Telefónica Group at December 31, 2013 and the main investments consolidated using the equity method.
Included for each company are the company name, corporate purpose, country, functional currency, share capital (in million of functional currency units), the Telefónica Group’s effective shareholding and the company or companies through which the Group holds a stake.
Parent Company:
Telefónica S.A.
|
Name and corporate purpose
|
Country
|
Currency
|
Capital
|
%Telefónica Group
|
Holding company
|
|||||
|
Telefónica Europe
|
||||||||||
|
Telefónica de España, S.A.U.
|
||||||||||
|
Telecommunications service provider
|
Spain
|
EUR
|
1,024
|
100%
|
Telefónica, S.A.
|
|||||
|
Telefónica Móviles España, S.A.U.
|
||||||||||
|
Wireless communications services provider
|
Spain
|
EUR
|
423
|
100%
|
Telefónica, S.A.
|
|||||
|
Acens Technologies, S.L.
|
||||||||||
|
Holding, housing and telecommunications solutions service provider
|
Spain
|
EUR
|
23
|
100%
|
Telefónica de España, S.A.U.
|
|||||
|
Teleinformática y Comunicaciones, S.A.U. (TELYCO)
|
||||||||||
|
Promotion, marketing and distribution of telephone and telematic equipment and services
|
Spain
|
EUR
|
8
|
100%
|
Telefónica de España, S.A.U.
|
|||||
|
Telefónica Serv. de Informática y Com. de España, S.A.U.
|
||||||||||
|
Telecommunications systems, networks and infrastructure engineering
|
Spain
|
EUR
|
2
|
100%
|
Telefónica de España, S.A.U.
|
|||||
|
Iberbanda, S.A.
Broadband telecommunications operator
|
Spain
|
EUR
|
2
|
100%
|
Telefónica de España, S.A.U.
|
|||||
|
Telefónica Telecomunicaciones Públicas, S.A.U.
Installation of public telephones
|
Spain
|
EUR
|
1
|
100%
|
Telefónica de España, S.A.U.
|
|||||
|
Telefónica Soluciones de Outsourcing, S.A.
|
Telefónica Soluc. de Informática
|
|||||||||
|
Promotion and networks management
|
Spain
|
EUR
|
1
|
100%
|
y Com. de España, S.A.U
|
|||||
|
Telefónica Servicios Integrales de Distribución,S.A.U.
|
Telefónica de España
|
|||||||||
|
Distribution service provider
|
Spain
|
EUR
|
2
|
100%
|
S.A.U.
|
|||||
|
Tuenti Technologies S.L.
|
Telefónica Móviles España
|
|||||||||
|
Private Social Platform
|
Spain
|
EUR
|
-
|
100%
|
S.A.U.
|
|||||
|
Telefónica Europe plc
|
||||||||||
|
Holding company
|
UK
|
GBP
|
9
|
100%
|
Telefónica, S.A.
|
|||||
|
MmO2 plc
|
||||||||||
|
Holding company
|
UK
|
GBP
|
20
|
99.99%
|
Telefónica Europe plc
|
|||||
|
O2 Holding Ltd
|
||||||||||
|
Holding Company
|
UK
|
GBP
|
12
|
100%
|
MmO2 plc
|
|||||
|
Telefónica UK Ltd
|
O2 Networks Ltd. (80.00%)
|
|||||||||
|
Wireless communications
|
UK
|
GBP
|
17
|
100%
|
O2 Cedar Ltd. (20.00%)
|
|||||
|
O2 (Europe) Ltd.
|
||||||||||
|
Holding company
|
UK
|
EUR
|
1,239
|
100%
|
Telefónica, S.A.
|
|
Name and corporate purpose
|
Country
|
Currency
|
Capital
|
%Telefónica Group
|
Holding company
|
|||||
|
Telefónica Deutschland Holding A.G.
|
Telefónica Germany
|
|||||||||
|
Holding company
|
Germany
|
EUR
|
1,117
|
76.83%
|
Holding Limited
|
|||||
|
Telefónica Germany GmbH & Co. OHG
Wireless communications services operator
|
Germany
|
EUR
|
51
|
76.83%
|
Telefónica Deutschland Holding A.G (76.82%)
Telefónica Germany Management GmbH A.G(0.01%)
|
|||||
|
O2 Telefónica Deutschland Finanzierung ,
|
||||||||||
|
Gmbh
|
||||||||||
|
Financing of Telefónica Deutschaland and hisrelated companies
|
Germany
|
EUR
|
-
|
100%
|
Telefónica Germany GmbH & Co. OHG
|
|||||
|
Cornerstone Telecommunications Infrastructure Ltd
|
O2 Network Ltd 40%
|
|||||||||
|
Network sharing
|
UK
|
GBP
|
-
|
50%
|
O2 Cedar Ltd 10%
|
|||||
|
Telefónica Latinoamérica
|
||||||||||
|
Telefónica Internacional, S.A.U.
|
||||||||||
|
Investment in the telecommunications industry abroad
|
Spain
|
EUR
|
2,839
|
100%
|
Telefónica, S.A.
|
|||||
| Telefónica International Holding, B.V. Holding company |
Netherlands
|
EUR
|
-
|
100%
|
Telefónica Internacional, S.A.U.
|
|||||
|
Telefónica Latinoamérica Holding, S.L.
|
Telefónica, S.A. (94.59%)
Telefónica Internacional,
|
|||||||||
|
Holding company
|
Spain
|
EUR
|
185
|
100%
|
S.A.U. (5,41%)
|
|||||
|
Telefónica, S.A. (50.00%)
|
||||||||||
|
Telefónica América, S.A.
Holding company
|
Spain
|
EUR
|
-
|
100%
|
Telefónica Internacional, S.A.U. (50,00%)
|
|||||
|
Latin American Cellular Holdings, B.V.
Holding company
|
Spain
|
EUR
|
-
|
100%
|
Telefónica Latinoamérica Holding, S.L
|
|||||
|
Telefónica Datacorp, S.A.U.
Holding company
|
Spain
|
EUR
|
700
|
100%
|
Telefónica, S.A.
|
|||||
|
Telefónica Internacional, S.A.U. (29.43%)
|
||||||||||
|
Telefónica, S.A. (24.74%)
|
||||||||||
|
Telefónica Brasil, S.A.
Wireline telephony operator in Sao Paulo
|
Brazil
|
BRL
|
37,798
|
73.96%
|
Sao Paulo Telecomunicaçoes Participaçoes, Ltda. (19.73%)
Telefónica Chile, S.A. (0.06%)
|
|||||
|
Telefónica Holding de Argentina, S.A. (47.22%)
|
||||||||||
|
Compañía Internacional
de Telecomunicaciones, S.A.
Holding company
|
Argentina
|
ARS
|
562
|
100
%
|
Telefónica Móviles Argentina Holding, S.A. (42.77%)
Telefónica International Holding, B.V. (10,01%)
|
|||||
|
Compañía Internacional de Telecomunicaciones, S.A. (51.49%)
|
||||||||||
|
Telefónica Móviles Argentina, S.A. (29.56%)
|
||||||||||
|
Telefónica Internacional, S.A. (16.20%)
|
||||||||||
|
Telefónica, S.A. (1.80%)
|
||||||||||
|
Telefónica de Argentina, S.A.
Telecommunications service provider
|
Argentina
|
ARS
|
624
|
100%
|
Telefónica International Holding, B.V. (0.95%)
|
|
Name and corporate purpose
|
Country
|
Currency
|
Capital
|
%Telefónica Group
|
Holding company
|
|||||
|
Telefónica, S.A. (75%)
|
||||||||||
|
Telefónica Móviles Argentina Holding, S.A.
Holding company
|
Argentina
|
ARS
|
1,198
|
100%
|
Telefónica Internacional, S.A.U. (25%)
|
|||||
|
Telefónica Venezolana, C.A.
Wireless communications operator
|
Venezuela
|
VEF
|
2.752
|
100%
|
Latin America Cellular Holdings, B.V. (97.04%)
Comtel Comunicaciones Telefónicas, S.A. (2.87%)
Telefónica, S.A. (0.09%)
|
|
Telefónica Móviles Chile, S.A.
Wireless communications services operator
|
Chile
|
CLP
|
589,403
|
99.99%
|
TEM Inversiones Chile Ltda.
|
|||||
|
Telefónica Chile, S.A.
|
Inversiones Telefónica Internacional Holding Ltda. (53.00%)
|
|||||||||
|
Local and international long distance telephony services provider
|
Chile
|
CLP
|
578,078
|
97.89%
|
Telefónica Internacional de Chile, S.A. (44.89%)
|
|||||
|
Telefónica del Perú, S.A.A.
|
Telefónica Latinoamérica Holding, S.L. (50.18%)
|
|||||||||
|
Local, domestic and international long distance telephone service provider
|
Peru
|
PEN
|
2,962
|
98.49%
|
Latin American Cellular Holdings, B.V. (48.31%)
|
|||||
|
Telefónica Móviles Perú, S.A.C.
Wireless communications services provider
|
Peru
|
PEN
|
625
|
98.49%
|
Telefónica del Perú, S.A.A.
|
|||||
|
Colombia Telecomunicaciones, S.A. ESP
Communications services operator
|
Colombia
|
COP
|
1,454,871
|
70%
|
Telefónica Internacional, S.A.U. (32.54%)
Olympic, Ltda. (18.95%)
Telefónica, S.A. (18.51%)
|
|||||
|
Telefónica Móviles México, S.A. de C.V. (MÉXICO)
Holding company
|
Mexico
|
MXN
|
71,425
|
100%
|
Telefónica, S.A.
|
|||||
|
Pegaso Comunicaciones y Sistemas, S.A. de C.V.
Wireless telephone and communications services
|
Mexico
|
MXN
|
28,686
|
100%
|
Telefónica Móviles México, S.A. de C.V.
|
|||||
|
Telefónica Móviles del Uruguay, S.A.
Wireless communications and services
operator
|
Uruguay
|
UYU
|
350
|
100%
|
Latin America Cellular Holdings, B.V. (68.00%)
Telefónica, S.A. (32.00%)
|
|||||
|
Telefónica Móviles Panamá, S.A.
Wireless telephony services
|
Panama
|
USD
|
24
|
100%
|
Telefónica Centroamérica Inversiones S.L.
|
|||||
|
Telefónica Móviles El Salvador, S.A. de C.V.
|
||||||||||
|
Provision of wireless and international long distance communications services
|
El Salvador
|
USD
|
187
|
60%
|
TES Holding, S.A. de C.V.
|
|||||
|
Telefónica Móviles Guatemala, S.A.
|
TCG Holdings, S.A. (39,59%)
|
|||||||||
|
Wireless, wireline and radio paging communications services provider
|
Guatemala
|
GTQ
|
2,701
|
60%
|
Guatemala Cellular Holdings, B.V. (20,41%)
|
|||||
|
Telefonía Celular de Nicaragua, S.A.
Wireless telephony services
|
Nicaragua
|
NIO
|
247
|
60%
|
Telefónica Centroamérica Inversiones S.L.
|
|||||
|
Otecel, S.A.
Wireless communications services provider
|
Ecuador
|
USD
|
183
|
100%
|
Ecuador Cellular Holdings, B.V
|
|||||
|
Telefónica de Costa Rica TC, S.A.
|
||||||||||
|
Wireless communications
|
Costa Rica
|
CRC
|
165,257
|
100%
|
Telefónica, S.A.
|
|||||
|
Telefónica Holding Atticus, B.V.
Holding company
|
Netherlands
|
EUR
|
-
|
100%
|
Telefónica Internacional, S.A.U.
|
|
Name and corporate purpose
|
Country
|
Currency
|
Capital
|
%Telefónica Group
|
Holding company
|
|||||
|
Other Companies
|
||||||||||
|
Telefónica International Wholesale Services II, S.L.
|
||||||||||
|
International services provider
|
Spain
|
EUR
|
- |
100%
|
Telefónica, S.A.
|
|||||
|
Telefónica, S.A. (92.51%)
|
||||||||||
|
Telefónica International Wholesale Services , S.L International services provider
|
Spain
|
EUR
|
230
|
100%
|
Telefónica Datacorp, S.A.U. (7.49%)
|
|||||
|
Telefónica International Wholesale Services America, S.A.
Provision of high bandwidth communications services
|
Uruguay
|
USD
|
591
|
100%
|
Telefónica, S.A. (73,14%)
Telefónica International Wholesale Services, S.L. (26,86%)
|
|||||
|
Telefónica International Wholesale Services USA, Inc.
Provision of high bandwidth communications services
|
US
|
USD
|
58
|
100%
|
T. International Wholesale Services America, S.A.
|
|||||
|
Telefónica Digital España, S.L.
Holding company
|
Spain
|
EUR
|
13
|
100%
|
Telefónica Digital Holding, S.L
|
|||||
|
Telefónica Digital Inc
IP telephony platform
|
US
|
USD
|
-
|
100%
|
Telefónica Europe plc
|
|||||
|
Wayra Investigacion y Desarrollo, S.L.
Talent identification and development in ICT.
|
Spain
|
EUR
|
2
|
100%
|
Telefónica Digital Holdings, S.L.
|
|
Wayra Chile Tecnología e Innovación Limitada
|
||||||||||
|
Technological innovation-based business project development
|
Chile
|
CLP
|
20,833
|
100%
|
Wayra Investigacion y Desarrollo, S.L.
|
|||||
|
Wayra Brasil Aceleradora de Projetos Ltda.
|
||||||||||
|
Technological innovation-based business project development
|
Brazil
|
BRL
|
9
|
100%
|
Wayra Investigación y Desarrollo S.A.U.
|
|||||
|
WY Telecom, S.A. de C.V.
Talent identification and development in ICT.
|
Mexico
|
MXN
|
57
|
100%
|
Wayra Investigacion y Desarrollo, S.L.
|
|||||
|
Telefónica Móviles Argentina, S.A. (90%)
|
||||||||||
|
Wayra Argentina, S.A.
Talent identification and development in ICT.
|
Argentina
|
ARS
|
20
|
100%
|
Telefónica Móviles Argentina Holding, B.V. (10%)
|
|||||
|
Wayra Colombia, S.A.S.
Technological innovation-based business project development
|
Colombia
|
COP
|
500
|
100%
|
Wayra Investigacion y Desarrollo, S.L.
|
|||||
|
Proyecto Wayra, C.A.
Commercial, industrial and mercantile activities
|
Venezuela
|
VEF
|
17
|
100%
|
Telefónica Venezolana, C.A.
|
|||||
|
Wayra Perú Aceleradora de Proyectos, S.A.C.
Technological innovation-based business project development
|
Peru
|
PEN
|
8
|
99.99%
|
Wayra Investigación y Desarrollo
|
|||||
|
Wayra UK Ltd
|
||||||||||
|
Technological innovation-based business project development
|
UK
|
GBP
|
-
|
100%
|
Telefónica UK Ltd
|
|||||
|
Wayra Ireland Ltd
|
||||||||||
|
Technological innovation-based business project development
|
Ireland
|
EUR
|
-
|
100%
|
O2 Holding Ltd
|
|||||
|
Terra Network Brasil, S.A
ISP, portal and real-time financial information services
|
Brasil
|
BRL
|
1,046
|
100%
|
Sao Paulo Telecomunicaçoes
Participaçoes, Ltda
|
|||||
|
Terra Networks México, S.A. de C.V.
ISP, portal and real-time financial information services
|
Mexico
|
MXN
|
774
|
99.99%
|
Terra Networks Mexico Holding, S.A. de C.V.
|
|
Name and corporate purpose
|
Country
|
Currency
|
Capital
|
%Telefónica Group
|
Holding company
|
|||||
|
Terra Networks Perú, S.A.
ISP and portal
|
Peru
|
PEN
|
10
|
99.99%
|
Telefónica Internacional, S.A.U.
|
|||||
|
Terra Networks Argentina, S.A.
ISP and portal
|
Argentina
|
ARS
|
7
|
100%
|
Telefónica Internacional, S.A.U. (99.99%)
|
|||||
|
Telfisa Global, B.V.
|
||||||||||
|
Integrated cash management, consulting and financial support for Group companies
|
Netherlands
|
EUR
|
-
|
100%
|
Telefónica, S.A.
|
|||||
|
Telefónica Global Activities Holding, B.V.
Holding company
|
Netherlands
|
EUR
|
-
|
100%
|
Telfisa Global, B.V.
|
|||||
|
Telefónica Global Services, GmbH
Purchasing services
|
Germany
|
EUR
|
-
|
100%
|
Group 3G UMTS Holding Gmb,B.V.
|
|||||
|
Telefónica Global Roaming, GmbH
Optimization of network traffic
|
Germany
|
EUR
|
-
|
100%
|
Telefónica Global Services, GmbH
|
|||||
|
Group 3G UMTS Holding GmbH
Holding company
|
Germany
|
EUR
|
250
|
100%
|
Telefónica Global Activities Holdings B.V
|
|||||
|
Telefónica Compras Electrónicas, S.L.
Development and provision of information society services
|
Spain
|
EUR
|
-
|
100%
|
Telefónica Global Services, GmbH
|
|||||
|
Telefónica de Contenidos, S.A.U.
|
||||||||||
|
Organization and operation of multimedia
service-related business
|
Spain
|
EUR
|
1,865
|
100%
|
Telefónica, S.A.
|
|||||
|
Telefónica Studios S.L.
Audiovisual Productions
|
Spain
|
EUR
|
6
|
100%
|
Telefónica de Contenidos, S.A.U.
|
|||||
|
Televisión Federal S.A.- TELEFE
Provision and operation TV and radio broadcasting -services
|
Argentina
|
ARS
|
135
|
100%
|
Atlántida Comunicaciones S.A. (79.02%)
Enfisur S.A. (20.98%)
|
|||||
|
Atlántida Comunicaciones, S.A.
Media
|
Argentina
|
ARS
|
33
|
100%
|
Telefónica Media Argentina S.A. (93.02%)
Telefónica Holding de Argentina, S.A. (6.98%)
|
|||||
|
Telefónica Servicios Audiovisuales, S.A.U.
Provision of all type of audiovisual telecommunications services
|
Spain
|
EUR
|
6
|
100%
|
Telefónica de Contenidos, S.A.U.
|
|||||
|
Telefónica On The Spot Service
S.A.U
Provision of telemarketing services
|
Spain
|
EUR
|
1
|
100%
|
Telefónica de Contenidos, S.A.U.
|
|||||
|
Telefónica Broadcast Services, S.L.U.
DSNG – based transmission and operation services
|
Spain
|
EUR
|
-
|
100%
|
Telefónica Servicios Audiovisuales, S.A.U.
|
|||||
|
Telefónica Learning Services, S.L.
Vertical e-learning portal
|
Spain
|
EUR
|
1
|
100%
|
Telefónica Digital España, S.L.
|
|||||
|
Compañía Inversiones y Teleservicios S.A.U.
Holding company
|
Spain
|
EUR
|
24
|
100%
|
Telefónica, S.A.
|
|||||
|
Vocem 2013 Teleservicios, S.A.
Prestación de servicios de call-centers
|
Venezuela
|
VEF
|
112
|
100%
|
Compañía Inversiones y Teleservicios S.A.U.
|
|||||
|
Telfin Ireland Ltd.
Intragroup financing
|
Ireland
|
EUR
|
-
|
100%
|
Telefónica, S.A.
|
|||||
|
Telefónica Ingeniería de Seguridad, S.A.U.
Security services and systems
|
Spain
|
EUR
|
7
|
100%
|
Telefónica, S.A.
|
|||||
|
Telefónica Engenharia de Segurança do Brasil, Ltda.
Security services and systems
|
Brazil
|
BRL
|
35
|
99.99%
|
Telefónica Ingeniería de Seguridad, S.A.
|
|||||
|
Telefónica Capital, S.A.U.
Finance company
|
Spain
|
EUR
|
7
|
100%
|
Telefónica, S.A.
|
|||||
|
Lotca Servicios Integrales, S.L.
Aircraft ownership and operation
|
Spain
|
EUR
|
17
|
100%
|
Telefónica, S.A.
|
|||||
|
Fonditel Pensiones, Entidad Gestora de Fondos de Pensiones, S.A.
Administration of pension funds
|
Spain
|
EUR
|
16
|
70.00%
|
Telefónica Capital, S.A.
|
|
Name and corporate purpose
|
Country
|
Currency
|
Capital
|
%Telefónica Group
|
Holding company
|
|||||
|
Fonditel Gestión, Soc. Gestora de Instituciones de Inversión Colectiva, S.A.
Administration and representation of collective investment schemes
|
Spain
|
EUR
|
2
|
100%
|
Telefónica Capital, S.A.
|
|||||
|
Telefónica Investigación y Desarrollo, S.A.U.
Telecommunications research activities and proyects
|
Spain
|
EUR
|
6
|
100%
|
Telefónica, S.A.
|
|||||
|
Media Neworks México Soluciones Digitales S.A
|
||||||||||
|
Telecommunications research activities and proyects
|
Mexico
|
MXN
|
3
|
100%
|
Nedia NetworksLatm America S.A.C.
|
|||||
|
Telefónica Luxembourg Holding, S.à.r.L.
Holding company
|
Luxembourg
|
EUR
|
3
|
100%
|
Telefónica, S.A.
|
|||||
|
Casiopea Reaseguradora, S.A.
Reinsurance
|
Luxembourg
|
EUR
|
4
|
100%
|
Telefónica Luxembourg Holding, S.à.r.L.
|
|||||
|
Telefónica Insurance, S.A.
Direct insurance transactions
|
Luxembourg
|
EUR
|
8
|
100%
|
Telefónica Luxembourg Holding, S.à.r.L.
|
|||||
|
Seguros de Vida y Pensiones Antares, S.A.
Life insurance, pensions and health insurance
|
Spain
|
EUR
|
51
|
100%
|
Telefónica, S.A.
|
|||||
|
Telefónica Finanzas, S.A.U. (TELFISA)
Integrated cash management, consulting and financial support for Group companies
|
Spain
|
EUR
|
3
|
100%
|
Telefónica, S.A.
|
|||||
|
Pléyade Peninsular, Correduría de Seguros y Reaseguros del Grupo Telefónica, S.A.
Distribution, promotion or preparation of insurance contracts
|
Spain
|
EUR
|
-
|
100%
|
Telefónica Finanzas S.A.U.(TELFISA) (83,33)
Telefónica, S.A. (16.67%)
|
|||||
|
Fisatel Mexico, S.A. de C.V.
Integrated cash management, consulting and financial support for Group companies
|
Mexico
|
MXN
|
1,005
|
100%
|
Telefónica, S.A.
|
|||||
|
Telefónica Europe, B.V.
Fund raising in capital markets
|
Netherlands
|
EUR
|
-
|
100%
|
Telefónica, S.A.
|
|||||
|
Telefónica Finance USA, L.L.C.
Financial intermediation
|
US
|
EUR
|
59
|
100%
|
Telefónica Europe, B.V.
|
|||||
|
Telefónica Emisiones, S.A.U.
Financial debt instrument issuer
|
Spain
|
EUR
|
-
|
100%
|
Telefónica, S.A.
|
|||||
|
Telefónica Global Technology, S.A.U.
Global management and operation of IT systems
|
Spain
|
EUR
|
16
|
100%
|
Telefónica, S.A.
|
|||||
|
Aliança Atlântica Holding B.V.
Holding company
|
Netherlands
|
EUR
|
40
|
93.99%
|
Telefónica S.A. (46,995%)
Telefónica Brasil, S.A. (46,995%)
|
|||||
|
Telefónica Gestión de Servicios Compartidos España, S.A.
|
||||||||||
|
Management and administrative services rendered
|
Spain
|
EUR
|
8
|
100%
|
Telefónica, S.A.
|
|||||
|
Telefónica Gestión de Servicios Compartidos Argentina, S.A.
Management and administrative services rendered
|
Argentina
|
ARS
|
-
|
99.99%
|
Telefónica Gestión de Servicios compartidos España, S.A.(95%)
Telefónica, S.A. (4.99%)
|
|||||
|
Telefónica Gestión de Servicios Compartidos de Chile, S.A.
|
||||||||||
|
Management and administrative services rendered
|
Chile
|
CLP
|
1,019
|
97.89%
|
Telefónica Chile, S.A
|
|||||
|
Telefónica Gestión de Servicios Compartidos Perú, S.A.C.
Management and administrative services rendered
|
Peru
|
PEN
|
1
|
100%
|
T. Gestión de Servicios Compartidos España, S.A. (99.48%)
Telefónica del Perú, S.A.A. (0,52%)
|
|||||
|
Telefónica Transportes e Logística Ltda.
Logístics services rendered
|
Brazil
|
BRL
|
-
|
99.33%
|
Telefónica Gestión de Servicios Compartidos España, S.A.
|
|
Name and corporate purpose
|
Country
|
Currency
|
Capital
|
%Telefónica Group
|
Holding company
|
|||||
|
Telefónica Serviços Empresariais do BRASIL, Ltda
Management and administrative services rendered
|
Brazil
|
BRL
|
12
|
99.99%
|
Telefónica Gestión de Servicios Compartidos España, S.A.
|
|||||
|
Telefónica Gestión de Servicios Compartidos México, S.A. de C.V.
Management and administrative services rendered
|
Mexico
|
MXN
|
50
|
100%
|
Telefónica Gestión de Servicios Compartidos España, S.A.
|
|||||
|
TGestiona Logística, S.A.C.
Logistics
|
Peru
|
PEN
|
15
|
100%
|
Telefónica Gestión de Servicios Compartidos España, S.A. (99.48%)
Telefónica del Perú, S.A.A. (0.52%)
|
|
Telefónica Gestión Integral de Edificios y Servicios, S.L.
|
||||||||||
|
Management and administrative services rendered
|
Spain
|
EUR
|
-
|
100%
|
Taetel, S.L.
|
|||||
|
Tempotel, Empresa de Trabajo Temporal, S.A.
Temporary employment agency
|
Spain
|
EUR
|
-
|
100%
|
Taetel, S.L.
|
|||||
|
Companies held for sale (note2)
|
||||||||||
|
Telefónca O2 Ireland Limited
Wireless telephony services
|
Ireland
|
EUR
|
98
|
100%
|
O2 (Netherlands) Holding B.V (97,06%)
Klimaine Ltd (2,94%)
|
|||||
|
Telefónica Czech Republic a.s.
Wireless telephony services
|
Czech Republic
|
CZK
|
27,461
|
70.83%
|
Telefónica S.A.
|
|||||
|
Telefónica Slovakia s.r.o.
Wireless telephony services
|
Slovakia Republic
|
EUR
|
103
|
70.83%
|
Telefónica Czech Republic a.s.
|
|||||
|
Companies accounted for using the equity method
|
||||||||||
|
Tesco Mobile
Wireless telephony services
|
UK
|
GBP
|
-
|
50.00%
|
O2 Communication Ltd.
|
|||||
|
Telefónica Factoring España, S.A.
Factoring services provider
|
Spain
|
EUR
|
5
|
50.00%
|
Telefónica, S.A.
|
|||||
|
Telefónica, S.A. (40.00%)
|
||||||||||
|
Telefónica Factoring Do Brasil, Ltd.
Factoring services provider
|
Brazil
|
BRL
|
5
|
50.00%
|
Telefónica Factoring España, S.A. (10.00%)
|
|||||
|
Telefónica Factoring México, S.A. de C.V., SOFOM
Factoring services provider
|
Mexico
|
MXN
|
33
|
Telefónica, S.A. (40.5%)
Telefónica Factoring
España, S.A. (9,5%)
|
||||||
|
Telefónica, S.A. (40.5%)
|
||||||||||
|
Telefónica Factoring Perú, S.A.C.
Factoring services provider
|
Peru
|
PEN
|
6
|
50.00%
|
Telefónica Factoring España, S.A. (9.5%)
|
|||||
|
Telefónica, S.A. (40,5%)
|
||||||||||
|
Telefónica Factoring Colombia, S.A.
Factoring services provider
|
Colombia
|
COP
|
4,000
|
50.00%
|
Telefónica Factoring España, S.A. (9.5%)
|
|||||
|
Telco, S.p.A. (*)
Holding company
|
Italy
|
EUR
|
1,785
|
66%
|
Telefónica, S.A.
|
|||||
|
DTS Distribuidora de Televisión Digital, S.A.
Broadcasting, satellite TV signal transmission and linkage services
|
Spain
|
EUR
|
126
|
22.00%
|
Telefónica de Contenidos, S.A.U.
|
|||||
|
China Unicom (Hong Kong) Ltd.
Telecommunications service operator
|
China
|
RMB
|
2,325
|
5.01%
|
Telefónica Internacional, S.A.U.
|
(*) The associate company Telco, S.p.A. holds a stake in Telecom Italia, S.p.A. representing 15.58% of the dividend rights and 22.66% of voting rights.
Regulations
As a digital telecommunications operator, the Telefónica Group is subject to sector-specific telecommunications regulations, general competition law and a variety of other regulations, including privacy and security, which can have a direct and material effect on the Group’s business areas. The extent to which regulations apply to the Telefónica Group depends largely on the nature of our activities in a particular country, with traditional fixed telephony services and fixed broadband usually subject to stricter regulations.
In order to provide services and operate its networks, and to use spectrum, the Telefónica Group must obtain general authorizations, concessions and/or licenses from the pertinent authorities in each country in which the Group operates (hereinafter referred to as the national regulatory authority, NRAs). The Group is also required to obtain radio frequency licenses for its mobile operations.
The following section describes the regulatory frameworks and the latest legislative developments in the relevant regions and countries in which the Group has significant interests. Many of the regulatory developments described herein involve ongoing proceedings or consideration of potential legislation that have not reached a conclusion. Accordingly, it is difficult to accurately quantify the effect on the Group’s operations of these developments in such instances.
Electronic Communication Regulation in the European Union
The European Union’s legal framework for electronic communications services was developed with the aim of promoting competition and improving the harmonized functioning of the European market for electronic communications networks and services. The European Union’s legal framework was last modified in 2009, in response to market and technological and changes in the industry.
Rules promulgated pursuant to the European Union’s Legal framework define user’s rights and focus on access to networks, interconnection, privacy, data security, and protection and preservation of universal access, among other things. Recent EU measures have supplemented the EU framework with regulations focused on international roaming, spectrum, next generation fixed networks and call termination rates for fixed and mobile networks.
In each Member State a national regulatory authority, or NRAs, is responsible for enforcing national telecommunications laws incorporating the EU framework. NRAs are subject to the supervision of the European Commission, which formally and informally influences their decisions in order to ensure harmonized application of the EU framework throughout the European Union. In particular, the European Commission has identified certain markets that are susceptible of ex-ante regulation. These markets have to be analyzed by NRAs in order to see whether there are participants with significant market power (SMP). In these instances, NRAs are instructed to impose at least one obligation relating to price control, transparency, non-discrimination, accounting separation or access obligations on market participants with SMP. Companies may challenge the decisions of their national regulatory authorities before their domestic courts. Such legal proceedings may lead to a decision by the European Court of Justice or ECJ, which is the ultimate authority on the correct application of EU legislation.
EU competition law
The European Union’s competition rules have the force of law in all EU Member States and are, therefore applicable to the Telefónica Group’s operations in those countries.
The Treaty of Rome prohibits "concerted practices" and all agreements between entities that may affect trade between Member States and which restrict or are intended to restrict, competition within the internal market. The Treaty also prohibits any abuse of a dominant competitive position within the common market of the EU, or any substantial part of it, that may affect trade between Member States.
The EU Merger Regulation requires that all mergers, acquisitions, and joint ventures involving participants meeting certain turnover thresholds be submitted to the EU Commission for review, rather than to the national competition authorities. Under the amended EU Merger Regulation, market concentrations will be prohibited if they significantly impede effective competition in the EU common market. The European Commission and the office of the European Competition Commissioner are granted the authority to apply the EU competition framework.
Similar competition rules are set forth in each EU Member State, with the corresponding national competition authorities overseeing compliance with these regulations. All the European countries in which the Telefónica Group operates and referred to below are Member States of the European Union.
Recent developments
The regulatory debate in the European Union is focused on the completion of the
European Digital Single Market
by 2015 with a special atention on the harmonization of regulatory conditions across the EU, in particular about spectrum, the roll-out of ultra-high speed networks, the elimination of intra-EU roaming charges and net neutrality, all issues particularly important for the development of the European digital services markets and Information Society.
This effort was materialized in the European Commission’s September 2013 adoption of the “Connected Continent” Regulation proposal package, which covers the above mentioned issues and is expected to be approved during 2014. The outcome of this process is still largely uncertain.
Of special importance to the provision of digital services, this package covers
Net Neutrality
focusing mainly on the prohibition of blocking, throttling and non-discrimination of Internet traffic (except for a number of justified objective reasons), as well as on the transparency of retail broadband offers. The intention is to ensure that users are well informed about the traffic management practices of operators, so they can take this information into account when they choose their fixed or mobile broadband offer. Again the outcome of this discussion continues to be largely unknown.
Also, as part of this effort, the European Commission adopted in 2013 a new
Recommendation intended to create a more favorable environment in Europe for fibre investment
. This Recommendation provides more pricing flexibility for fibre pricing at retail and wholesale (by departing from the cost-orientation pricing), at the expense of stricter measures on the replicability of fiber based access services. In addition, the Commission is now bound to ensure copper price stability (around 9 euros on average for ULL on real terms).
Additionally, the European Commission proposed legislative measures to
reduce the cost of NGA roll-outs
including sharing of ducts from utilities and smother permitting processes this year. These proposals are expected to be approved by the EU legislator in 2014.
Also, during 2013, the European Union adopted its
cyber security strategy
, comprising a number of measures, among which is a new proposed Directive on Network Security. The intention is to guarantee a reliable and trusted Information Society across the EU, where Internet providers are also subject to security requirements. This Directive is expected to be finally adopted in the EU during 2014. Again at this stage, the outcome is largely uncertain.
In January 2012, the European Commission proposed to replace Directive 95/46/EC on the protection of personal data by a
General Data Protection Regulation
that would apply to those providers who processes personal data of European citizens. The draft Regulation has been approved by the Committee on Civil Liberties, Justice and Home Affairs of the European Parliament (LIBE) in October 2013, prior to a vote in the European Parliament. The approval of that Regulation will have an impact on Telefónica’s privacy obligations related to its activities as a telecommunications operator and as a provider of digital services. The Regulation aims to provide European citizens with a high level of protection of their privacy, and it will affect the ability and methods to process and use the personal data of its customers. The outcome of this debate is currently uncertain.
The European Union is also discussing a future Directive for
Payment Services
that might have influence on the type of financial obligations that could affect to services provided by companies such as Telefónica, in the area of premium rate services or mobile wallets.
In June 2012, the Commission approved the
International Roaming Regulation
(Roaming III), which replaces previous Roaming regulations (Roaming I and II). This regulation may, however, change again depending on the outcome of the Legislative process related to the Digital Single Market package adopted in 2013 whose proposal is that roaming prices set around home prices (“Roam like at home” proposal). This new Roaming III Regulation contains, for the first time, structural measures to impulse competition in the market for international roaming, so that, from July 1, 2014, customers could, if they wish, sign a roaming agreement with another operator apart from their domestic mobile services without changing the phone number, terminal or SIM card to change countries. The proposal also would entitle mobile operators to use other operators’ networks in other Member States at regulated wholesale prices, thereby encouraging more operators to compete on the roaming market. To cover the period until such structural measures are fully effective and competition pushes prices down, the proposal gradually reduces the limits of retail and wholesale prices for voice, text (SMS) and data. Price cuts have to be implemented by operators on July 1, 2014.
| Retail prices | Wholesale prices | |||||||||
|
July 1, 2013
|
July 1, 2014
|
July 1, 2013 | July 1, 2014 | |||||||
|
Data (€cent/MB)
|
45
|
20
|
Data (€cent/MB) | 15 | 5 | |||||
|
Voice - calls made (€cent/min)
|
24
|
19
|
Voice (€cent/min) | 10 | 5 | |||||
|
Voice - calls received (€cent/min)
|
7
|
5
|
SMS (€cent/text) | 2 | 2 | |||||
| SMS (€cent/text) | 8 | 6 |
On February 14, 2012, the European Parliament and the Council adopted Decision 243/2012/EU which settles a
multiannual program policy spectrum for
the following four years. The Radio Spectrum Policy Program, amongst others, will identify 1200MHz spectrum for wireless data traffic, explore new approaches in spectrum licensing, identify long term spectrum needs and finally will look for additional harmonized bands for mobile broadband.
Finally, in its
Digital Agenda
, the EU has set some objectives for broadband development: of the speed up to 30 Mbps for all European citizens by 2020 and 50% of European households connected to 100Mbps by 2020.
Telefónica Europe
Spain
General regulatory framework
The legal framework for the regulation of the telecommunications sector in Spain is governed by the General Telecommunications Law (32/2003) and several Royal Decrees. This law has been modified by Royal Decree law 13/2011 of March 30, which transposes directives regarding the gas, and the electric interior markets, and regarding electronic communications. The Royal Decree adopts measures in order to correct deviations caused by the mismatch between revenues and expenses of the electric and gas sector. A telecommunications bill is currently under discussion in the Spanish Parliament. The bill reduces administrative burdens to boost networks deployments.
The Market and Competition National Commission, or CNMC, created by the Law 3/2013, has assumed in 2013 its role as telecommunications and audiovisual service regulator in Spain. This new organism is also the competition authority in Spain and the national regulatory authority for transport, postal services and energy.
Market analysis
Following the most relevant markets in which Telefónica is deemed to have SMP.
Fixed markets
Retail access to the fixed-location public telephone network, retail market for calls in a fixed location, and retail market for rental lines
In this market, the National regulatory authority had made a third round of market analysis, applying a final resolution dated on December 13, 2012, concluding that Telefónica de España is an SMP in retail access to fixed-location public telephone network services, for clients with an identification number not associated to a specific business plan, such as a reference market which can be regulated ex ante. As an operator with SMP, Telefónica de España is subject to certain specific obligations and restrictions.
Wholesale fixed call origination market
In December 2008, the National regulatory authority concluded that Telefónica de España is an operator with SMP in this market and requested that Telefónica de España offer wholesale service to assist other operators in offering IP telephony services and provide transparent information of migration to Next Generation Networks centrals, which involves the provision of a wide range of information to competitors about network evolution.
Fixed call termination market on individual networks
As an operator with SMP in fixed call termination market on individual networks, Telefónica de España is required to submit an “Interconnection Reference Offer” (OIR) outlining the terms and conditions under which it will interconnect with other operators.
Mobile market
Mobile voice call termination
In May 2012, the ANR adopted a measure establishing the wholesale price at 0.109 euros/minute, as from July 2013. The CNMC has not yet approved a new resolution on wholesale market mobile voice call termination.
Wholesale (physical) to network infrastructure access
In January 2009, the National regulatory authority concluded that Telefónica de España is an operator with SMP in the wholesale (physical) network infrastructures access market, and imposed the following obligations: access to full and shared unbundled access to copper loops, sub-loops and ducts, cost oriented tariffs and accounting separation, transparency and non-discrimination obligations including an “Unbundling Reference Offer” and a “Ducts Reference Offer.” In February 2009, the National regulatory authority imposed similar obligations with respect to vertical access to buildings.
Wholesale prices for local loop unbundling were increased from 8.32 to 8.60 €/month by the National regulatory authority, in July 2013.
Wholesale broadband access
In January 2009, the CNMC concluded that Telefónica de España has significant market power in the wholesale broadband access market and is therefore required to provide other operators with wholesale broadband access services up to 30 Mbps in copper and fiber infrastructures. The NRA also required Telefónica de España to publish a wholesale broadband access reference offer, provide cost-oriented rates and accounting separation, to avoid discrimination in network access, and to report broadband retail changes in services prior to offering them in the market.
On November 16, 2010, the National regulatory authority approved a new wholesale broadband offer (known as the new broadband Ethernet service or NEBA) which will allow alternative operators to provide retail services to consumers more independently from Telefónica retail offers. Until the NEBA service is available, Telefónica will offer its FTTH retail services for resale through third parties.
In May 2013, the National regulatory authority proposed a reduction in wholesale broadband prices, although the European Commission considered the proposal incompatible with European law, due to the methodology used to determine the prices. Taking into account the European Commission’s comments, the CNMC has adopted a decision on bitstream prices on January 30, 2014, reducing the prices 18%.
In addition, the National regulatory authority launched, at the end of July 2013, a public pre-consultation regarding the market analysis on wholesale network infrastructure access and wholesale broadband access. The CNMC is expected to carry out a consultation and to decide on regulatory obligations for these markets in 2014. New regulation will apply to NGN networks for at least three years.
Universal service obligations
The General Telecommunications Law aims to ensure that all Spanish citizens have access to certain basic telecommunications services, regardless of their geographic location, with a minimum quality level and at accessible prices.
Telefónica de España, SAU was designated the operator responsible for the provision of the connection to the public electronic communications network, with the possibility of establishing broadband data connection with a descending speed no less than 1Mbit per second, and the provision of the public telephone service available from a fixed location and the operator responsible for the preparation and delivery of public telephone directories to the telephone subscribers. Telefónica Telecomunicaciones Públicas, SAU was designated as the operator responsible for the provision of a sufficient supply of public payphones.
Contribution to RTVE funding mechanism
In August 2009, the Radio and Television Corporation Finance Law “(Ley de Financiación de la Corporación de Radio y Television Española)” was approved establishing that: (i) telecommunication operators, which operate nationwide or at least in more than one region, have to make a fixed annual provision of 0. 9% of the invoiced operating income of the year (excluding the revenues of the wholesale reference market), and, (ii) on the other hand, the concessionaire companies and providers of TV services which operate nationwide or at least in more than one region should make an annual contribution fixed as follows; (a) 3% on the gross revenue of the year for open concessionaire companies or TV services providers, and (b) 1.5% on the gross revenue of the year for concessionaire companies to provide pay TV services.
In Spain, self-settlement of the contributions made has been appealed by Telefónica España and Telefónica Móviles España as well as, the Royal Decree 1004/2010, which approves the Regulation developing the abovementioned law. In the European level there were two ongoing processes with regards to this issue. In July 2013, the EC withdrew its appeal before the Luxembourg Court, shortly after it ruled on a similar tax legislation in France, where the Luxembourg Court ruled that the tax imposed by France on telecommunications companies was compatible with European regulation. With this decision, the tax measure will remain unchanged unless the Spanish Supreme Court understands the contrary.
Besides this, the European Commission initiated a state aid investigation and concluded that such funding mechanism did not constitute illegal state aid. Against this decision, “Telefónica de España” and “Telefónica Móviles España,” filed an appeal before the European Court of Justice. This appeal is still pending resolution.
Collaboration agreements
On July, 2013, Telefónica de España signed an agreement with Vodafone España S.A.U and France Telecom S.A.U for the use of fiber infrastructure in buildings. This agreement, together with the agreement signed with Jazz Telecom S.A.U on 2012, aimed the deployment of fiber networks in Spain. Once, an operator has reached a concrete building would be able to use the infrastructures deployed previously by other operators.
United Kingdom
General regulatory framework
The EU Regulatory Framework was implemented in the United Kingdom by the Communications Act in 2003. The Act designates the Office of Communications, or Ofcom, as the NRA responsible for the regulation of electronic communications networks and services. The Act was amended in 2011 following changes to the Common Regulatory Framework.
Market reviews
Following a market review, mobile termination rates for the four national mobile communications operators (Vodafone, Telefónica UK, Everything Everywhere and H3G) are subject to controls based on the pure long-run incremental cost (pure LRIC) approach. The present mobile wholesale termination rate is 0.848ppm and will be reduced to 0.845ppm from April 1, 2014. UK regulator has proposed to raise the annual fee for the use of spectrum in the bands 900MHz and 1800 MHz.
Germany
General regulatory framework
The European Union legislative framework was implemented in Germany at the end of June 2004, by the Telecommunications Act (Telekommunikationsgesetz). The national regulatory authority responsible for regulation of electronic communication networks and services is the Bundesnetzagentur, or BNetzA. Following the adaptation of the 2009 EU Telecom Package, the Telecom Act was repeatedly amended and the last modifications entered into force in August 2013. Transition periods existed for some of them. Worth mentioning are the rules, concerning the free-of-charge-waiting-loop and some of the rules concerning the change of the provider.
Licenses
BNETZA is currently holding a procedure regarding the future of the GSM licenses and has already published a draft decision which subsequently was subject to a public consultation. This foresees an auction of the GSM spectrum (900 MHz and 1800 MHz) together with an auction of spectrum in new bands at 700 MHz as well as at 1500 MHz and further includes a spectrum reservation of 2x5 MHz (900 MHz) for the current GSM Licensees (including but not limited to Telefónica Germany). Drawing that reserve leads to a coverage obligation of 99% of the population. Depending on the outcome of the planned merger between Telefónica Germany and E-Plus, BNetzA might find in necessary to modify the final decision.
Market reviews
Since 2006, Telefónica Germany has subsequently challenged decisions adopted by the German regulator (BNETZA) on mobile termination rates. Some appeals are pending at the Constitutional Court.
Regarding the concrete decisions establishing MTR, on July 19, 2012, BNetzA issued a decision on mobile termination rates for the period from December 1, 2012, to November 30, 2014, confirming its preliminary decision. According to this resolution, these rates decreased to 0.0179 euros/minute as of 1 December, 2013. BNetzA based its calculation on its new internally-developed cost model, which partly implements the European Commission’s recommendation on regulating fixed and mobile termination rates in the EU. The European Commission has been notified of the preliminary as well as of the final decision and the respective regulatory orders and issued a serious doubts letter. The European Commission may initiate further infringement proceedings against Germany as the regulation of mobile termination rates was deemed to be not fully compliant with the EC’s Recommendation on regulating fixed and mobile termination rates in the EU. On December 19, 2012, Telefónica Germany filed a lawsuit against the preliminary decision, in an attempt to
secure higher mobile termination rates. With the same purpose Telefónica Germany has made claims against the final decision on August 19, 2013, regarding MTR.
On August 13, 2013 BNetzA issued the final resolution on Telekom’s fixed termination rates (FTRs), applicable from December 2012 to November 2013. Local FTRs were reduced by approximately 20%. At the end of November 2013 BNetzA issued a regulatory order for all alternative fixed network operators (ANOs) including Telefónica Germany. In addition to the obligations of the former regulatory order, the ANOs now have to file a proposal for their local FTRs and BNetzA has to approve such FTRs. The local FTR will be set at the same level as the Telekom FTR. BNetzA issued a preliminary approval for Telefónica Germany´s FTR at the end of February 2014. Telefónica Germany’s rates were approved for the time period from November 20, 2013, until November 30, 2014. Before the final approval, the decision will be notified to the EU Commission.
Relevant cooperation agreements
Since 2012, Deutsche Telekom offers a wholesale bitstream access model (“VDSL contingent model”), which in 2013/4 has been developed further to include newly built VDSL and vectoring accesses. Telefónica Germany was closely involved in the development of this model. In this sense, Deutsche Telekom and Telefónica Germany signed a contract regarding the model on December, 6, 2012. The VDSL contingent model is subject to the approval of BNetzA following the current notification proceeding with the European Union.
In addition, Telefónica Germany and Deutsche Telekom have entered into a final and binding agreement on December 20, 2013, with regard to fixed-line broadband services. Such agreement foresees the transition from Telefónica Germany’s "ADSL" infrastructure to the advanced network infrastructure of Deutsche Telekom (the so-called "next generation access platform" or NGA platform) which will enable Telefónica Germany to offer its customers high-speed internet products with data transfer rates of up to 100Mbit/s. The completion of the transition to Deutsche Telekom’s NGA platform is expected for 2019. (Further details are provided in Note 21. Section b) of this of this Consolidated Financial Statements.)
Czech Republic
General regulatory framework
The EU Regulatory Framework was implemented in the Czech Republic in 2005 by the
Electronic Communications Act. The revision of the EU Regulatory Framework was transposed into the Czech legislation as of January 2012. The NRA responsible for the regulation of electronic communications networks and services is the Český Telekomunikační Úřad (Czech Telecommunication Office or CTO).
Governmental responsibility for the area of electronic communications lies with the Ministry of Industry and Trade.
Market reviews
Telefónica Czech Republic has been designated as an SMP entity in seven of the eight relevant markets:
Ireland
General regulatory framework
The EU Regulatory framework has been in place in Ireland since 2002 with ComReg the designated independent regulator. The 2009 directives have been already transposed.
Market reviews
The key market review for Telefónica in Ireland is the wholesale termination market for mobile voice. ComReg issued their latest decision in December 2012 introducing LRIC pricing and MTRs planned to reduce to 1 cent by July 2013. This decision was successfully challenged by Vodafone and an interim average MTR of 2.60c was set to apply from July 1, 2013. ComReg are developing a cost model based on LRIC pricing which is expected to be published in July 2014.
Slovakia
General regulatory framework
Market reviews
In July 2013, the TUSR adopted a price decision based on pure LRIC model that decreased mobile termination rates from EUR 0.0318/min to EUR 0.01226 EUR/min.
Telefónica Latin America
Brazil
General legislative framework
The delivery of telecommunications services in Brazil is subject to regulation under the regulatory framework provided in the General Telecommunications Law enacted in July 1997. The National Agency for Telecommunications, (Agência Nacional de Telecomunicações or ANATEL), is the principal regulatory authority for the Brazilian telecommunications sector. In April 2013, ANATEL implemented a new Internal Rule (Resolução 612) which reorganized all technical departments of the Agency. The reformulation aimed to establish a new converged structure.
Licenses
In Brazil, concessions are awarded for providing services under the public system, while authorizations are granted for providing private system services. The only service provided under both systems is the Commuted Fixed Telephony Service (CFTS). All other services are provided under the private system.
In the state of São Paulo, Telefónica Brazil provides local and national long-distance CFTS under the public regime, by Concession agreement, and provides international and long-distance CFTS and broadband services under the private system, by authorizations. In the remaining states of Brazil, Vivo Telefónica Brazil provides local, and long-distance and international CFTS service, personal mobile service, and broadband multimedia communication services (which includes the provision of fixed broadband connections) and Pay TV services, all under the private regime.
The Concession agreement will be in force until 2015 and the authorizations are issued for an undetermined period.
Radiofrequencies authorizations, for its turn, are granted for a limited period of time (maximum of 15 years, renewable once). The most important radiofrequencies authorizations held by Telefónica are those associated with the exploitation of mobile services and are described in the licenses section.
In 2013 Telefónica Brasil requested the amendment of its Terms of Authorization for the “L” band in order to relocate the blocks of radiofrequencies. Currently, the “L” band is located in the 3G radiofrequencies (1.9/2.1GHz). Bid notice for the “L” band provided for such relocation and the request ensured a more efficient use of the spectrum for Telefónica do Brazil.
In 2012, Telefónica was awarded a block of the 2500 MHz “X” band (20+20 MHz), including the 450 MHz band in certain states. As part of the spectrum auction, Telefónica Brazil had to compensate the former licensees of this bandwidth, who used it for multichannel multipoint distribution services. The other operators also obtaining spectrum must, in turn, compensate Telefónica Brazil. Part of these compensation requirements is being legally contested.
After receiving the ANATEL study on the occupation of the 700 MHz frequency, published in early Jan/2013, the Brazilian Ministry of Communications, issued Ordinance No. 14, with guidelines for accelerated access to the Brazilian System of Digital Terrestrial Television - SBTVD-T and to broaden the availability of the radio frequency spectrum for meeting the goals set forth by the National Broadband Plan - PNBL. The ordinance also establishes that the ANATEL develop a proposal to regulate use of the band. After a public consultation, Resolution No. 625/2013 was adopted. This Resolution approves the allocation of the 700 MHz band to the fixed and mobile services of telephony and broadband. However, the completion of the allocation process requires the migration of the TV channels that currently occupy the band and that ANATEL concludes studies regarding spectrum interference between mobile and TV services.
Interconnection, tariffs and prices
Interconnection among public networks is mandatory in Brazil. Parties can freely negotiate the terms and conditions about technical points, economic discounts and rights/obligations, of the interconnection agreements. For Interconnection rates for fixed network operator identified as operator with Significant Market Power (Res. 588/2012) the maximum rate is established by ANATEL; the rates for the use of mobile operators networks (Res. 438/2006), may be agreed between the parties, however, if the parties fail to reach a consensus, particularly regarding charges to fixed operators (Res. 576/2011) ANATEL imposes the rates to be used. In general, operators shall maintain public offers of interconnection conditions.
Recent regulatory developments
On November 8, 2012, ANATEL published the General Plan of Competition Goals (PGMC), which, in general, provides ex-ante obligations for telecommunications providers that identify SMP operators in the various relevant markets identified as critical for the development of competition in the telecommunications industry. The ex-ante obligations include measures of price transparency and market conditions and specific rules for composition of conflicts between agents, such as: (i) mandatory submission and approval of offerings of reference in the wholesale market and warranty service requests from other players that correspond to 20% of the physical network of the SMP companies, (ii) transparency measures as the creation of a Data Base and Wholesale Supervisor Entity, (iii) specifically for providers acting in the mobile termination market (interconnection): full billing between undertakings with SMP, and Bill & Keep decreasing between SMP and non-SMP (80/20% between 2013 and 2014, 60/40% in 2015 and full billing from 2016). The Telefónica Group, including VIVO, has been identified as an operator with SPM in the following markets: (i) fixed network infrastructure access for data transmission in copper pairs or coaxial cables at speeds up to 10 Mbps in the region of São Paulo, (ii) wholesale fixed network infrastructure to transport local and long distance transmission at speeds up to 34 Mbps in the region of São Paulo, (iii) passive towers, ducts and trenches infrastructure throughout Brazil; (iv) call termination on mobile network in Brazil, and (v) national roaming market throughout Brazil.
ANATEL also approved Resolution 614 in May 2013, which set the new regulations for the provision of Multimedia Services (which includes the provision of internet broadband services). The new resolution establishes that broadband internet services may be rendered regardless of the existence of an Internet Service Provider (the previous regulation required the user to contract two services: the connection itself and the ISP). It is expected that such provision will make Telefónica´s ADSL services more competitive.
The PGMC established that the mobile termination rates (VU-M) shall observe the following scheme: the reference VU-M value applicable to a provider belonging to a Group declared with SMP within the mobile termination market shall be based on the model of incremental costs. Such model of incremental costs shall be implemented from February 24, 2016. Previously, the reference VU-M value applicable to such providers shall be as follows:
|
·
|
From February 24, 2014: up to 75% of the VU-M value in force on December 31, 2013.
|
|
·
|
From February 24, 2015: up to 50% of the VU-M value in force on December 31, 2013.
|
In this regard, in December 2013, ANATEL published its Resolution
7,272 establishing the new VU-M values for 2014 and 2015 applicable to providers with SMP. These are the values applicable to VIVO (in Brazilian
reais
):
|
·
|
2014:
|
|
o
|
Region I: 0.25126
|
|
o
|
Region II: 0.23987
|
|
o
|
Region III: 0.22164
|
|
·
|
2015:
|
|
o
|
Region I: 0.16751
|
|
o
|
Region II: 0.15911
|
|
o
|
Region III: 0.14766
|
Pursuant to applicable laws, reductions of VU-M must be reflected in VC1 (retail price paid by users for local fixed-mobile calls) and VC2 and VC3 (retail price paid by users for national long distance fixed-mobile calls). Accordingly and as a consequence of the new V-UM in Resolution
7,272, on February 24, 2014, ANATEL published its Resolution 1,742 establishing the new
VCs for 2014: approximately 0.07781 Brazilian
reais
less than the previous VC1s in Region III (as Telefónica only offers local fixed telephony services in that region); and approximately 0.11434 Brazilian
reais
less than the previous VC2 and VC3.
Resolution 623, issued in October 2013, reformulated the Telecommunication Users Council, broadening its scope from fixed voice services to all telecommunications services. From now on, operators shall implement Telecommunication Users Councils in all regions. Requests, complaints and other measures proposed by users’ representatives shall be considered by operators. ANATEL will monitor the councils’ activities across the country.
In December 2013, ANATEL issued Resolution 629 which establishes terms and conditions to execute Conduct Adjustment Terms (Termo de Ajustamento de Condutas) aimed at suspending administrative proceedings in course, if license holders assume certain obligations to fully comply with regulations and provide compensations and awards to users.
Competition law
Brazilian competition regulation is based on Law No. 12.529 of November 30, 2011. The Administrative Council for Economic Defense, or CADE, is the agency in charge of enforcing the competition rules.
The new antitrust law establishes a pre-merger notification regime for concentration transactions, with new turnover thresholds (one participant with gross revenue of BLR750 million in Brazil and other participant with gross revenue of BRL75 million in Brazil) and maximum time length for merger review procedure (240 days, extendable to 330 days).
Mexico
General regulatory framework
The provision of all telecommunication services in Mexico is governed by the Constitution, Federal Telecommunication Law and various service-specific regulations. The Constitution was amended in June 2013 on telecommunications matters; the Federal Telecommunications Institute (IFT) is created as an autonomous body responsible for the regulation, promotion and supervision of the use, development and exploitation of radio spectrum, networks and the provision of broadcasting services and telecommunications. By virtue of the Constitution amendment, the Federal Communication Institute will be in charge of regulating the dominant operators or with SMP. Due to these constitutional amendments, the enactment and publication of a secondary legislation on telecommunications is required, which should occur in the first quarter of 2014.
Licenses
Derived from a corporate restructuring carried out in Mexico, authorized by the Federal Institute for Telecommunications, dated on December 30, 2013, Baja Celular Mexicana, SA de CV, Cellular Phones, Inc. de CV, Telefónica Celular del Norte, SA de C.V. Movitel and Northwest, Inc. de C.V. have ceded in favor of Pegaso PCS, SA de C.V. (Pegaso PCS) the rights and obligations of the concession titles.
Likewise, on January 31, 2014, the merger between Pegaso Comunicaciones y Sistemas, S.A. de C.V. and Pegaso PCS was formalized, subsisting the latter. Once the merger takes effect, Pegaso PCS will acquire the ownership of the rights and obligations of the concession titles of Pegasus Communications y Sistemas.
Prices and tariffs
Tariffs charged to customers are not regulated. They are set by mobile operating companies and must be registered with COFETEL.
Interconnection
Mexican telecommunications regulations obligate all telecommunications network concessionaires to execute interconnection agreements. Interconnection rates and conditions may be negotiated by the parties. However, should the parties fail to agree, COFETEL must fix the unresolved issues, including tariffs.
Throughout 2011, COFETEL issued several resolutions as a result of different interconnection disputes submitted by several operators. In such resolutions, COFETEL determined a mobile termination charge (“MTC”) for Telefónica México, as well as for other mobile operators, of 0.3912 Mexican pesos per minute, billed per second without rounding (leading to a 61% cut to previous rates).
Telefónica México has appealed on an administrative basis such resolutions from COFETEL. Such appeals are still pending to be resolved. To date, Cofetel has not resolved the applicable rate for 2012 or for 2013 or 2014. Moreover, the declaration of dominant operators in the telecoms market is expected to lead to asymmetric regulatory measures. The Company’s competitive position may benefit to a greater or lesser extent depending on the scope of these measures. Furthermore, on June 21, 2012, CIADI
Secretary-General declared admissible the international arbitration presented by Telefónica, S.A. against the Mexican United States. Telefónica, S.A. formulated their lawsuit memorial, on September 20, 2013, by virtue of which claim for damages incurred as a consequence of the resolutions, issued by different Mexican regulatory and administrative bodies, of mobile termination rates.
Foreign ownership/restrictions on transfer of ownership
Since the amendments to the Constitution published in June 2013 foreign investment (FDI) up to one hundred percent in telecommunications is allowed.
Competition law
The Federal Economic Competition Law enacted in 1992 and amended on May 10, 2011.
Venezuela
Prices and tariffs
Under Venezuelan regulations, the free-pricing system for telecommunication services remains the same, except for basic telephony services (Local, LDN and LDI) and services rendered under universal service obligations; however, the regulatory entity may, considering CONATEL’s opinion, alter prices for telecommunication services for “public interest reasons.” The amendment does not define the term “public interest reasons.” Nevertheless, the Enabling Act (Ley Habilitante) in Venezuela also confers full powers to the President to implement price controls.
CONATEL published an Order whereby reference values are set for the Determination of Interconnection Charges for use of Mobile Telephony Services. The aim of this regulation is the establishment of reference values and criteria for determining interconnection charges in mobile phone use on the basis of a model of long run incremental costs with breakdown of the network elements by CONATEL, who should intervene setting such charges solely in those cases where there are conflicts between operators relating such charges, and they failed to reach consensus within the period specified in the interconnection legislation. Mobile termination rates in relation to national operator have been reduced approximately 6% compared to the previous rates.
Competition law
Venezuelan law governing competition is the Promotion and Protection of Free Competition Act 1992. The Office of the Superintendent for the Promotion and Protection of Free Competition is the agency empowered to apply the Competition Act.
Chile
General regulatory framework
The General Telecommunications Law No. 18,168 of 1982, as amended, establishes the legal framework for the provision of telecommunications services in Chile. The main regulatory authority in Chile is the Under-Secretary of Telecommunications, or SUBTEL.
On June 11, 2012, Law No. 20,599 was published. It regulates the installation of antennas stations and transmitters of telecommunication services. During 2013, the cost of compliance with the Antenna Law, in Chilean pesos, was of Opex of approximately $5,092,000,000 (7,091,922 euros) and CapEx of $5,057,000,000 (7,043,175 euros), using the exchange rate as of January 15, 2014.
In November 2013, Law No. 20,704 was published by virtue of which national long distance service was eliminated. This measure has to be implemented on August 2014. From that date, communications that were formerly national long distance communications and that were separately charged by the carrier will be considered local communications and will form part of the service or commercial plan provided by the local phone company to its clients. The dialing of local numbers will be modified upon the date of the national long distance service elimination.
An emergency alert system was enabled for mobile networks (2G, 3G) to inform the population in cases of disaster. The system using 4G technology will be implemented on March 2014.
On February 13, 2014, the new Regulation on Telecommunications Services, which will come into force on June 13, 2014, except certain specific obligations that must be met by the service providers prior to that date, was published. This Regulation replaces the existing to date and regulate a number of new services as Internet, Pay TV, etc. The regulation could be challenged if it is considered needed to defend the Company’s interest.
Licenses
On March 28, 2013, was published the decree by virtue of which SUBTEL granted to Telefónica Móviles Chile S.A. a public service concession for fixed and/or mobile data transmission in the 2545 MHz - 2565 MHz and 2665 MHz - 2685 MHz bands (4G technology). On November 2013, TMCH initiated the partial commercialization of 4G services, and in March 2014 the total of the commercialization will have to be implemented. 2.6 GHz concession obliges TMCH to provide a wholesale service to OMV, for what the latter had to published a completely Facilities Offer (including prices), available in non-discriminatory terms.
In October 2013, Subtel published in the Official Journal a public tender for granting public service concessions for transmitting data on 713-748 MHz and 768-803 MHz frequency bands. Three blocks of frequencies at a national level will be assigned: two blocks of 2x10 MHz and one block of 2x15 MHz. In addition of providing the data transmission service, additional obligations are set, like provide wholesale services to OMV, provide national roaming wholesale services, provide data transmission wholesale service, provide services to determined routes, locations and municipal and supported schools. Offers have to be issued by interested parties by January, 2014. In the event of a tie in the proposals, the tender will be resolved by a bid (best offer in financial terms).
Prices and tariffs
Maximum tariffs for telephony services are set every five years by the Ministry of Transport and Telecommunications and the Ministry of Economy. In addition, the Competition Tribunal may subject any telephony service to price regulation, except for mobile telephone services to the public that are expressly exempted.
The Competition Tribunal ruled in January 2009 that only some local telephone services were to be subject to tariff regulation (line connections, monthly fixed charges, variable traffics charges, and public payphone services are excluded). Accordingly, it was determined that every local telephone company, within its service zones, would be regulated with respect to tariff levels and structure. In addition, Telefónica Chile, in its capacity as a “SMP operator” (except in regions where other companies are the SMP operators), is regulated on a non-price basis, with requirements that it not engage in discriminatory pricing and that it give previous notice of plans and packages.
Interconnection
Interconnection is obligatory for all license holders with the same type of public telecommunications services and between telephony public services and intermediate services that provide long distance services. The same requirement applies to holders of those intermediate service licenses, who are required to interconnect their networks to the local telephone network.
A “calling party pays” tariff structure was implemented on February 23, 1999. Under this tariff structure, local telephone companies pay mobile telephone companies an access charge for calls placed from fixed networks to mobile networks. Local telephone companies may pass this interconnection charge on to their customers. Every five years, SUBTEL sets the applicable tariffs for services provided through the interconnected networks.
The Tariff Decree for the period 2014-2019, for
mobile telephony networks
was adopted by SUBTEL on January 16, 2014, and is enforceable since January 25, 2014. The new prices imply a reduction of 73.4% as regards the previous ones.
On November 8, 2013, the fixed operation submitted its Tariff Study. On March 8, 2014, the Ministries should submit its Report of Objections and Counterproposal to the Tariff Study, in which it is likely that they will propose different tariffs. The new tariff decree will come in force on May 9, 2014.
Competition law
The principal regulation concerning competition in Chile is Decree No. 211 of 1973, whose current text was established in Decree Nº 1 of 2005 (Ministry of Economía, Fomento y Reconstrucción). The Competition Tribunal deals with infringements of competition law.
Through General Instruction No 2 (“IG2”) of December 18, 2012, the Competition Tribunal imposed that mobile phone companies cannot commercialize plans with a different price for the on-net and off-net calls, as of the effective date of the mobile Tariff Decree over access charges (January 25, 2014). In addition, fixed and mobile service packages with discounts are authorized as of the in-service date of the LTE concession (March 28, 2014).
The TuVes company, which provides PayTV services brought an appeal against IG2 before the Supreme Court, which issued a judgment on December 17, 2013, by virtue of which fixed-mobile convergent offers with a multiservice discount cannot be commercialized permanently. This affected our commercial offer focused on convergent products (Fusion and others), and as a result, possible commercial and operational solutions are being analyzed.
Argentina
General regulatory framework
The basic legal framework for the provision of telecommunications services in Argentina is set forth in the National Telecommunications Law (No. 19,798) of 1972 and in the specific regulations governing each type of telecommunications service. Decree 764/00 established the new and current regulatory framework rules for a free market, and includes interconnection, license, universal service and spectrum rules.
The following regulatory authorities oversee the Argentine telecommunications industry:
the National Communications Commission, or CNC, supervises compliance with licenses and regulations, and approves changes to mandatory goal and service requirements; and
the Secretariat of Communications, or SECOM, grants new licenses, regulates the bidding and selection processes for radio-spectrum authorizations, and approves the related bidding terms and conditions.
On October 21, 2003, Law No. 25,790 became effective, extending the term for the renegotiation of concession or licensing agreements with public utilities until December 31, 2004, which was subsequently extended until December 31, 2011. As an investor in Argentina through Telefónica de Argentina, we commenced arbitration proceedings against the Republic of Argentina based on the Reciprocal Protection of Investments Treaty between Spain and Argentina for damages suffered by us because of the measures adopted by the Argentine government in connection with the renegotiation of certain concession and licensing agreements. On August 21, 2009, the parties requested the Tribunal, in accordance with Rule 43 of the ICSID Arbitration Rules, declare a resolution of the termination of the proceedings. The agreement of the parties envisages the possibility of a new request for arbitration under the ICSID Convention being submitted by Telefónica
Prices and tariffs
Additionally, Decree No. 764/00 established that providers of telephone services may freely set rates and/or prices for their service which shall be applied on a non-discriminatory basis. However, until the Secretary of Communications determines that there is effective competition for telecommunications services, the “dominant” providers in the relevant areas (which include Telefónica de Argentina) must respect the maximum tariffs established in the general tariff structure.
Also, the guidelines set forth in article 26 of Decree No. 1185/90 continue in effect for operators with significant market power. These guidelines establish information obligations with which operators must comply with respect to tariffs and which flow toward both clients and the national regulator. This Decree also establishes the powers the regulator has to revise or revoke such tariffs.
Furthermore, on October 15, 2012, became effective the resolution SC 45/2012 of the Secretary of Communications, which provides that the mobile phone companies should only bill to its clients the minutes since the call to be serviced by the receiver or his message box.
Tariffs charged to customers for mobile services are currently not regulated in Argentina.
Interconnection
The rules for national interconnection set forth that interconnection agreements are to be freely negotiated between the relevant service providers, on a non-discriminatory basis. The regulations also establish the obligation for dominant and significant market operators to unbundle their local loops and to allow competitors to use them on a reasonable basis.
Competition law
Law 25,156, on Protection of Competition prohibits any acts or behaviors contrary to the law. The National Commission for the Defense of Competition is the authority entrusted with application of the law.
Colombia
General regulatory framework
In Colombia, telecommunications are a public service, subject to state regulation and oversight. Law 1341/09 (“Technologies of Information and Communications Law”) reformed the legal framework, establishing the general regime for information and communication technologies. Under this law, providers of network and telecommunications services in Colombia must register with the Information and Communication Technologies Minister. In addition, operators must obtain a concession from the National Television Authority (previously a Commission) in order to provide television services. The Colombian telecommunications regulator is the Comisión de Regulación de Comunicaciones or CRC.
Licenses
Regarding the licenses for the provision of mobile voice services awarded in 1994, and their amendment agreements, by virtue of which allow the usage of spectrum over the 850 MHz (25 MHz) and the 1900 MHZ (15 MHZ) bands, given for a 10 years period and extended in 2004 for another equal period, the company decided to opt to the general habilitation regime, modifying registry before the Ministry. Company requested the renewal of the licenses and permits for the use of spectrum according to the article 68 of law 1341 2009, and the Decree 2044 of 2013, in which the Ministry determined the requirements and formalities in order to be able to obtain the renewal and some criteria for establish the renewal conditions. To date, the renewal requested is still pending and the Ministry have not issued the specific conditions for the renewal.
Regarding the reversion of assets the Company and the Colombian Government had been acting within the contractual relationship, in the understanding that such reversion only applies to the scarce resource that was assigned (the spectrum), on the basis of with the legal framework issued by the national Congress, integrated by laws 422 1998 and 1341 2009.
Notwithstanding, the Constitutional Court declared possible in a conditional way article 4 of the 422 1998 Law and article 68 of 1341 2009 Law, related to the reversion of assets by Sentence C-555 of 2013, to interpret that concessional contracts subscribed before the entry into force of these legislation, shall respect “the reversion” clause 33 concluded “at the expiration of the concession term, the elements and assets directly affected by it will become National property, without imposing any compensation obligation”.
Constitutional Court Ruling C-555 was issued in February 2014. According to Court´s Opinion, reversion might entail wireless telecommunications spectrum band, as well as other assets and network related to the rendering of the service as laid down in sections 14 and 15 of Decree 1900 of 1990 and other applicable law in effect at the time of the entering into the contracts, especially those that were taking into consideration for setting the financial equilibrium of those contracts; or, if such reversion is not possible, its economic equivalence.
Upon termination of the Agreements, Telefónica and the Ministry, during the liquidation procedure, shall reach an agreement as to the scope and extension of such reversion.
In the 4G auction process, the Company obtained 30 MHz of spectrum in the 1710 to 1755 MHz band and 2110 to 2115 MHz band, resource that was assigned by the Resolution 2625 (2013), confirmed by Resolution 4142 on October 25, 2013, for a 10 years period.
Interconnection
Mobile and fixed operators in Colombia have the right to interconnect to other operators’ networks. Before the intervention of regulatory authorities, operators must attempt direct negotiations. Interconnection must assure compliance with the
objectives of non-discriminatory treatment, transparency, prices based on costs plus a reasonable profit and promotion of competition. Asymmetric termination rates are regulated by CRC Resolutions 1763 and 3136 of 2011 and 3534 of 2012. Additionally, CRC Resolution 3101 of 2011 adopted a unique interconnection regime, which promotes competition and guarantees access to networks and networks elements to other providers of telecommunications, content and apps.
During 2013, the CRC issued national Roaming price regulation, extending the application of the objective value set for mobile termination rates to this service and imposing a value of $ COP 25.63 per Mbyte for 2013, $ COP 19.36 for 2014 and $ COP 13.09 for 2015.
In 2011, The Regulator issued a progressive reduction on mobile termination charges from April 2012 to 2015 and imposed the use of asymmetric mobile termination rates to Comcel (Claro) the dominant operator.
Prices and tariffs
The Technologies of Information and Communications Law, provides for free pricing for voice and Internet access services. Therefore, mobile tariffs charged to customers are not regulated, although they may not be discriminatory. Nevertheless, fixed-to-mobile tariffs are subject to a price cap. Rates are fixed by mobile operating companies and must be registered with the Comisión de Regulación de Telecomunicaciones. The regulator set a price cap depending to the changes on mobile terminations rates, being the reason why during 2013 it was $ COP 124.87.
Regulation in quality and users’ protection
During 2013 the Commission established rules to protect users in matters such as international roaming services, and ordered providers to automatically compensate users, as of January 2014, for the blocking, suspension or disconnection of fixed services. For mobile services, the Commission ordered the automatic compensation (via minutes) for dropped calls.
Television services
The Company pays the National Television Authority a periodic consideration for the license obtained in 2007 to offer television services, initially set as 10% of the gross revenues of the company for television services, reduced to 7% in 2010. Since 2012, it is based on a fixed value of $ COP 1,874.32 per user, updated yearly to the consumer gross price index (IPC) and the number of registered users.
Competition law
The Colombian Competition Law is incorporated in the Law No. 155/59, Decree No 2153/92 and Law 1340/09 on Restrictive Trade Practices. The Superintendent of Industry and Commerce is the Colombian competition authority.
Peru
General regulatory framework
The provision of telecommunications services in Peru is governed by the Telecommunications Law and related regulations.
In July 2012 the Peruvian Congress approved the Law of Promotion of the Broad Band and Construction of the National Fiber Optic Backbone, Law N° 29904. This Law declares of public necessity: (i) the construction of the National Fiber Optic Backbone which will be entitled to the government to make possible the connectivity by the broad band, and; ii) the access and use of the infrastructure associated with the public services of energy and hydrocarbon to facilitate the display of the telecommunication network for the provision of the broad band. In addition, Law N° 29904 implies that operators of electric, transport and hydrocarbon infrastructure projects will have to install fiber optic that will be entitled to the State and will be given in concession to other telecommunication operators. Also establishes that a percentage of the capacity of the National Fiber Optic Backbone will be reserved for the Government to satisfy its necessities.
In November 2013, secondary legislation of the abovementioned law Nº 29904 was approved; furthermore, on December 23, 2013, “Consorcio TV Azteca – Tendai” was awarded with the National Fiber Optic Backbone project.
Licenses
In December 2013, Telefónica del Perú S.A.A. submitted to the Transport and Communications Ministry an application to renew its concessions to provide nationwide fixed telecommunications services, for five more years. The aforementioned proceeding is still pending.
Telefónica Móviles S.A. has five mobile services concessions. Three of them (two are intended to provide mobile service in Lima and Callao and the other for the rest of the country) were renewed in March 2013 for an additional 18 years and 10 months. The last mobile concession was awarded to Telefónica in October 2013.
Although the cable distribution broadcasting service concessions have expired, they are still valid while the renew proceedings are still pending.
Prices and tariffs
Tariffs for fixed telephony services must be approved by the National Regulatory Authority, the Organization for Supervision of Private Investment in Telecommunications, or OSIPTEL, in accordance with a price cap formula based on a productivity factor. Rates charged by mobile providers to their customers have been subject to a free tariff regime supervised by OSIPTEL. Tariffs must be reported to OSIPTEL prior to implementation.
On October 17, 2013 OSIPTEL fixed in S/0.0025 per second (S/0.1478 per minute) the maximum rate applicable to local calls made from Telefónica del Perú S.A.A’s fixed telephones to mobile networks for personal and trunked communications. This new rate is in force since October 30, 2013.
Interconnection
Mobile service providers are required, upon request, to interconnect with other concession holders. According to the principles of neutrality and non-discrimination contemplated in the Telecommunications Law, the conditions agreed upon in any interconnection agreement will apply to third parties in the event that those conditions are more beneficial than terms and conditions agreed upon separately.
Competition
The general competition framework in Peru is based on the Legislative Decree N° 1034. This law it is applied, in the telecommunication sector, by OSIPTEL.
Law N° 30083 was approved in September 2013, which seeks to strengthen competition in the public mobile market service by introducing mobile virtual network operators (MVNOs) and mobile rural infrastructure operators (MRIO). Mobile network operators must allow MVNOs access (when requested) to their elements and network services for a fee and should provide – through the MRIO network, upon request - public mobile services in rural areas as long as they do not own infrastructure deployed at these locations. Mobile network operators may have no legal or economic ties with MVNO accessing their network. Therefore, in principle, no Telefónica Group company could operate as a MVNO within its own network. Mobile network operators must offer MVNOs their wholesale services on terms no less favorable or discriminatory. The publication of the regulation of this Law is pending.
Main concessions and licenses held by the Telefónica Group
|
EUROPE
|
Band
|
Spectrum Award
|
Termination date
|
|
SPAIN
|
800 MHz
|
(2 x 10 MHz)
|
December 31, 2030
|
|
900 MHz
|
(2 x 9.8 MHz)
|
February 4, 2015. December 31, 2030 (awarded 2X1MHz)
|
|
|
900 MHz
|
(2 X 9,8 MHz)
|
December 31, 2030
|
|
|
900 MHz
|
(E- GSM) (2X4 MHz)
|
December 31, 2030
|
|
|
DCS-1800
|
(2 x 20 MHz)
|
December 31, 2030
|
|
|
2.1 GHz
|
(2 x 15 MHz + 5 MHz)
|
April 18, 2020 (April 18, 2030)
|
|
|
2.6 GHz
|
(2 x 20 MHz)
|
December 31, 2030
|
|
|
UNITED KINGDOM
|
900 MHz
|
(2 x 17.4 MHz)
|
Indefinite period
|
|
1800 MHz
|
(2 x 5.8 MHz)
|
Indefinite period
|
|
|
2100 MHz
|
(2 x 10 MHz + 5 MHz)
|
Indefinite period
|
|
|
800 MHz
|
(2 x 10 MHz)
|
Indefinite period
|
|
|
* Since 2011, 900 MHz and 1800 MHz bands can be used to deploy UMTS.
|
|||
|
GERMANY
|
1800 MHz
|
(2 x 17.4 MHz)
|
December 31, 2016
|
|
900 MHz
|
(2 X 5 MHz)
|
December 31, 2016
|
|
|
2100 MHz
|
(2 x 9.9 MHz)
|
December 31, 2020
|
|
|
800 MHz
|
(2x10 MHz)
|
December 31, 2025
|
|
|
2.6 GHz
|
(2x 20 MHz + 10 MHz)
|
December 31, 2025
|
|
|
2.0 GHz
|
(2 X 5 MHz + 20MHz)
|
December 31, 2025
|
|
|
* Refarming is possible subject to a prior request and possible market distortion investigation.
|
|||
|
IRELAND
|
1800 MHz
|
(2 x 14.4 MHz)
|
2015
|
|
2100 MHz
|
(2 x 15 MHz + 5 MHz)
|
2022
|
|
|
800 MHz
|
(2 x 10 MHz)
|
2013-2015
|
|
|
800 MHz
|
(2 x 10 MHz)
|
2015-2030
|
|
|
900 MHz
|
(2 x 10 MHz)
|
2013-2015
|
|
|
900 MHz
|
(2 x 10 MHz)
|
2015-2030
|
|
|
1800 MHz
|
(2 x 15 MHz)
|
2015-2030
|
|
|
CZECH REPUBLIC
|
900 MHz/1800 MHz
|
(2 X 12,4 MHz)/ (2 X 14 MHz)
|
February 7, 2016
|
|||||
|
2100 MHz
|
(2 X 19,8 MHz)
|
January 1, 2022
|
||||||
|
450 MHz
|
(2 x 4,44 MHz)
|
February 7, 2018
|
||||||
|
800 MHz
|
(2 x 10 MHz)
|
June 30, 2029
|
||||||
|
1800 MHz
|
(2 x 3 MHz)
|
June 30, 2029
|
||||||
|
2600 MHz
|
(2 x 20 MHz)
|
June 30, 2029
|
||||||
|
SLOVAKIA
|
900 MHz/ 1800 MHz/ 2100 MHz
|
(2 X 10,2 MHz) / (2 X 15 MHz) / (2 X 20 MHz + 5 MHz)
|
September, 2026
|
|||||
|
800 MHz
|
(2 x 10 MHz)
|
December 31, 2028
|
||||||
|
1800 MHz
|
(2 x 0,6 MHz)
|
September 7, 2026
|
||||||
|
LATIN AMERICA
|
Band/Services
|
Termination period
|
||||||
|
MEXICO
|
850 MHz
|
2025
|
||||||
|
9 concessions/1900 MHz
|
2018 + 20 YEARS
|
|||||||
|
4 concessions/1900 MHz
|
2025 + 20 YEARS
|
|||||||
|
8 concessions/1900 MHz
|
2030
|
|||||||
|
6 concessions/1.7-2.16 MHz (AWS)
|
2030
|
|||||||
|
Other concessions/licenses: Public telecommunications network to offer national and international long-distance service, fixed and public telephone services throughout the country, public telecommunications network to offer pay TV and satellite data transmission services, public telecommunications network to provide satellite data transmission services, transmission and reception rights in respect of frequency bands or signals associated with foreign satellites.
|
||||||||
|
VENEZUELA
|
800 MHz
|
November 28, 2022
|
||||||
|
Private network services
|
December 15, 2025
|
|||||||
|
Nationwide wireless fixed access
|
August 24, 2026
|
|||||||
|
Local, national long-distance and international long-distance telephone services
|
December 15, 2025
|
|||||||
|
1900 MHz
|
November 28, 2022 + 10 years
|
|||||||
|
Push to talk licenses
|
December 15, 2025
|
|||||||
|
1900 MHz (20 MHz)
|
November 28, 2022 + 15 years
|
|||||||
|
CHILE
|
(Several) 800 MHz
|
Indefinite period
|
||||||
|
(3 national concessions) 1900 MHz
|
November 2002 + 30 years
|
|||||||
|
(1 concession) 2.5/2.6 GHz
|
March 28, 2043
|
|||||||
|
In addition, Telefónica de Chile holds licenses for local public telephony services, public data transmission services, VoIP services, long distance services and license to install and operate a national fiber optics network. Telefónica de Chile holds different licenses to provide limited television services.
Finally, TIWS Chile holds a license to operate and install underwater fiber optic submarine cable and land fiber optic cable transmission.
|
||||||||
|
ARGENTINA
|
Telefónica de Argentina holds licenses, all of which have been granted for an unlimited period, allowing it to provide fixed telephony services, international telecommunications services, local services in the northern and southern regions; long-distance, international telecommunications services and data transmission in the northern region; and Internet and international data transmission access services.
Telefónica Móviles de Argentina’s licenses for providing mobile services include PCS licenses and the corresponding authorizations for using spectrum in different regions, as well as licenses for trunk services or closed groups of users, in different cities.
|
|||||||
|
COLOMBIA
|
850 MHz
(25 MHz)
|
Renewal proceeding
|
||||||
|
1900 MHz (15 MHz)
|
Renewal proceeding
|
|||||||
|
1900 MHz (15 MHz)
|
2021
|
|||||||
|
1.7 GHz paired with 2.1 GHz (30 MHz)
|
2023
|
|||||||
|
On November 8, 2011, Colombia Telecomunicaciones adhered to the general habilitation scheme contained in Law 1341/2009, and, consequently, is allowed since that date to provide any networks and telecommunications services, such as long distance carrier services, ad value services, national carrier services, and mobile services.
In addition, the Company holds a concession to provide satellite television service (DBS) and direct-to-home television (DTH).
|
||||||||
|
PERÚ
|
Mobile Telephone
|
800 MHz
|
Lima and Callao
|
March 26, 2030
|
||||
|
1900 MHz, B Band
|
Lima and Callao
|
April 28, 2030
|
||||||
|
800 MHZ.
|
National level, except Lima and Callao
|
December 13, 2030
|
||||||
|
1900 MHz, B Band
|
National level, except Lima and Callao
|
June 1, 2018
|
||||||
|
Personal Communications Services (PCS)
|
1,700 MHz Band, blocks A
(20+20 MHz)
|
National
|
October 10, 2033
|
|||||
|
Telefónica del Perú, S.A.A. provides nationwide fixed telecommunications services according to two concessions granted on May 16, 1994 by the Ministry of Transport and Communications. The concessions were initially granted for 20 years, and may be partially renewed for additional five-year periods up to a maximum of 20 years. To date, three partial renewals extending the concession to November 27, 2027 have been approved. In December 2013, Telefónica del Peru S.A.A. submitted to the Transport and Communications Ministry an application to renew its concessions for five more years. The aforementioned proceeding is still pending.
|
||||||||
|
ECUADOR
|
Otecel renewed the mobile telephone services concession under which it provides advanced mobile services (850 MHz B1 y B1´and 1900 MHz D y D´), including 3G services. The concession expires in November 2023 and may be renewed for an additional 15-years period.
In addition, Otecel holds a fixed and mobile carrier services concession expiring in 2017. This concession may be renewed for an additional 15-year period. The different licenses for providing added-value mobile services and Internet access services expire in 2021. This license was renewed until June 2, 2021 and may be extended for another 10 years.
|
|||||||
|
CENTRAL AMERICA
|
||||
|
COSTA RICA
|
Telecommunication services (6)
|
10.6 MHz/850 MHz
|
2026 (7)
|
|
|
30 MHz/1800 MHz
|
||||
|
20 MHz/2100 MHz
|
||||
|
EL SALVADOR
|
Telecommunication services (1)
|
25 MHz/850 MHz
|
Band B
|
2018(2)
|
|
30 MHz/1900 MHz
|
Band C
|
2021
|
||
|
GUATEMALA
|
Telecommunication services (1)
|
80 MHz/1900 MHz
|
Bands B, C, E and F
|
2033(8)
|
|
NICARAGUA
|
Mobile telecommunication services
|
25 MHz/850 MHz
|
Band A
|
2023(3)
|
|
60 MHz /1900
|
Bands B, D, E and F
|
2023(3)
|
||
|
36 MHz /700
|
2023(3)
|
|||
|
PANAMA
|
GSM/UMTS
|
25 MHz /850
|
Band A
|
2016(4)
|
|
10 MHz/1900 MHz
|
Band F
|
|||
|
URUGUAY
|
Mobile telephone
|
12.5+12.5 MHz
|
800 MHz
|
2024(5)
|
|
5+5 MHz
|
1900Mhz
|
2022 (5)
|
||
|
5+5 MHz
|
1900Mhz
|
2024 (5)
|
||
|
2x5Mhz
|
1900Mhz
|
2033(9)
|
||
(1) In accordance with the Telecommunications Law all of these concessions were granted to provide any type of telecommunication services.
(2) Concessions for the use of spectrum are granted for a period of 20 years and may be renewed for additional 20 year periods once the procedures established by the Telecommunications Law are fulfilled.
(3) Telefonía Celular de Nicaragua, S.A. (TCN) obtained a concession in 1992 for a period of 10 years to use the 25 MHz spectrum in band A of 850 MHz in order to provide mobile telecommunication services. This concession was renewed for a period of 10 years from August 2013 until July 2023. The regulatory agency awarded TCN additional spectrum of 60 MHz in bands B, D, E and F of 1900. The concession may be renewed for an additional 10-year periods via negotiation with TELCOR two years in advance of the expiry of the current concession, subject to compliance by the operator with certain conditions.
(4) The concession is valid for 20 years and expires in 2016. It is renewable for an additional period in accordance with the concession contract. The Government of Panama granted the right to use 10 MHz (5+5) in the 1900 MHz until 2016, which can be renewed for a further period. In January 2013 the company has file a request for the renewal of the concession. Its terms have to be agreed with the government of Panama.
(5) The expiry date depends upon the spectrum awarded: 800 MHz band (12.5 MHz + 12.5 MHz) – 20 years from July 2004; 1900 MHz band (5 MHz + 5 MHz) – 20 years from December 2002; and 1900 MHz band (5 MHz + 5 MHz) – 20 years from July 2004.
(6) Except for traditional basic telephone services through copper networks.
(7) The concession may be renewed for a period that added to the initial period and previous renewals does not exceed 25 years from the start date.
(8) The Guatemala Congress modified the Telecommunications Law, increasing the use period to 20 years for radio, television and telephone frequency. These modifications entered into force on December 6, 2012. Operators were granted a 90-day period to request a change in usage certificate from the regulatory agency. Upon expiry of the period, an extension for a similar period may be requested. Telefónica Guatemala extended the term of the usage certificate until 2033.
(9) On March 13, 2013 URSEC (communications regulator) made a spectrum auction, which comprised spectrum of the followings bands: 900MHz, 1900MHz, AWS (1.7/2.1GHz) and AWS EXT. Telefónica acquired four paired 2x5MHz blocks of spectrum in the 1900MHz band, for U$S 32 million. Authorizations will last for 20 years.
|
BRASIL
|
||||||||||||||
|
Operations Area
|
Termination date
|
|||||||||||||
|
Region 1
|
450 MHz
|
800
MHz
|
900
MHz
|
1800
MHz
|
1900
MHz
|
2100 MHz
|
2,5
GHz
|
|||||||
|
Rio de Janeiro
|
--
|
Band A - 29/11/20
|
Extension 1 - 30/04/23
|
Extension 9 e 10 - 30/04/23
|
Band L - 30/04/23
|
Band J - 30/04/23
|
Band X - 18/10/27
|
|||||||
|
Espírito Santo
|
--
|
Band A - 30/11/23
|
Extension 1 - 30/04/23
|
Extension 9 e 10 - 30/04/23
|
Band L - 30/04/23
|
Band J - 30/04/23
|
Band X - 18/10/27
|
|||||||
|
Amazonas, Roraima, Amapá, Pará e Maranhão
|
--
|
Banda B - 29/11/28
|
Extension 2 - 30/04/23
|
Extension 7, 9 e 10 - 30/04/23
|
Band J - 30/04/23
|
Band X - 18/10/27
|
||||||||
|
Minas Gerais (exceto Triângulo Mineiro)
|
450 - 18/10/27
|
Band A - 29/04/23
|
Extension 2 - 30/04/23
|
Extension 11 a 14 - 30/04/23
|
Band L - 30/04/23
|
Band J - 30/04/23
|
Band X - 18/10/27
|
|||||||
|
Minas Gerais (Triângulo Mineiro)
|
450 - 18/10/27
|
--
|
Band E - 28/04/20
|
Band E –
28/04/20
|
Band L - 30/04/23
|
Band J - 30/04/23
|
Band X - 18/10/27
|
|||||||
|
Bahia
|
--
|
Band A - 29/06/23
|
Extension 1 - 30/04/23
|
Extension 9 e 10 - 30/04/23
|
Band L - 30/04/23
|
Band J - 30/04/23
|
Band X - 18/10/27
|
|||||||
|
Sergipe
|
450 - 18/10/27
|
Band A - 15/12/23
|
Extension 1 - 30/04/23
|
Extension 9 e 10 - 30/04/23
|
Band L - 30/04/23
|
Band J - 30/04/23
|
Band X - 18/10/27
|
|||||||
|
Alagoas, Ceará, Paraíba, Pernambuco, Piauí e Rio Grande do Norte
|
450 - 18/10/27
|
--
|
--
|
Band E –
30/04/23
Extensión 9 e 10 - 30/04/23
|
Band L - 07/12/22
|
Band J - 30/04/23
|
Band X - 18/10/27
|
|||||||
|
Region 2
|
||||||||||||||
|
Paraná (Exceto Setor 20) e Santa Catarina
|
Band B - 08/04/28
|
Extension 1 - 30/04/23
|
Banda M - 30/04/23
|
Band L - 30/04/23
|
Band J - 30/04/23
|
Band X - 18/10/27
|
||||||||
|
PR Setor 20 - Londrina e Tamarana
|
Band B - 08/04/28
|
Banda M - 30/04/23
Extensión 10 - 30/04/23
|
Band J - 30/04/23
|
Band X - 18/10/27
|
||||||||||
|
Rio Grande do Sul (Exceto Setor 30)
|
Band A - 17/12/22
|
Extension 1 - 30/04/23
|
Banda M - 30/04/23
|
Band L - 30/04/23
|
Band J - 30/04/23
|
Band X - 18/10/27
|
||||||||
|
Rio Grande do Sul - Setor 30 (Pelotas, Morro Redondo, Capão do Leão e Turuçu)
|
Band D e M - 30/04/23
|
Band L - 07/12/22
|
Band J - 30/04/23
|
Band X - 18/10/27
|
||||||||||
|
Distrito Federal
|
Band A - 24/07/21
|
Extension 1 - 30/04/23
|
Band M - 30/04/23
|
Band L - 30/04/23
|
Band J - 30/04/23
|
Band X - 18/10/27
|
||||||||
|
Goiás e Tocantins
|
Band A - 29/10/23
|
Extension 1 - 30/04/23
|
Banda M - 30/04/23
|
Band L - 30/04/23
|
Band J - 30/04/23
|
Band X - 18/10/27
|
||||||||
|
Goiás (Setor 25)
|
Banda M - 30/04/23
Extension 7 a 10 - 30/04/23
|
Band L - 07/12/22
|
Band J - 30/04/23
|
Band X - 18/10/27
|
||||||||||
|
Mato Grosso
|
Band A - 30/03/24
|
Extension 1 - 30/04/23
|
Banda M - 30/04/23
|
Banda L - 30/04/23
|
Banda J - 30/04/23
|
Banda X - 18/10/27
|
||||||||
|
Mato Grosso do Sul - Exceto Setor 22
|
Band A - 28/09/24
|
Extension 1 - 30/04/23
|
Banda M - 30/04/23
|
Band L - 30/04/23
|
Band J - 30/04/23
|
Band X - 18/10/27
|
||||||||
|
Mato Grosso do Sul (Setor 22 - Município de Paranaíba)
|
Band M - 30/04/23
Extension 7, 9 e 10 - 30/04/23
|
Band L - 07/12/22
|
Band J - 30/04/23
|
Band X - 18/10/27
|
||||||||||
|
Rondônia
|
Band A - 21/07/24
|
Extension 1 - 30/04/23
|
Banda M - 30/04/23
|
Band L - 30/04/23
|
Band J - 30/04/23
|
Band X - 18/10/27
|
||||||||
|
Acre
|
Band A - 15/07/24
|
Extension 1 - 30/04/23
|
Band M - 30/04/23
|
Band L - 30/04/23
|
Band J - 30/04/23
|
Band X - 18/10/27
|
||||||||
|
Region 3
|
||||||||||||||
|
São Paulo
|
(4)
|
Band A - 05/08/23
|
Extension 9 e 10 - 30/04/23
|
Band L - 30/04/23
|
Band J - 30/04/23
|
Band X - 18/10/27
|
||||||||
|
São Paulo (Ribeirão Preto, Guatapará e Bonfim Paulista)
|
(4)
|
Band A - 20/01/24
|
Extension 5, 9 e 10 - 30/04/23
|
Band L - 30/04/23
|
Band J - 30/04/23
|
Band X - 18/10/27
|
||||||||
|
São Paulo (área de Franca e Región)
|
(4)
|
Band A - 05/08/23
|
Extension 5, 9 e 10 - 30/04/23
|
Band L - 30/04/23
|
Band J - 30/04/23
|
Band X - 18/10/27
|
||||||||
|
São Paulo (Setor 33)
|
Extension 9 e 10 - 30/04/23
|
Band L - 07/12/22
|
Band J - 30/04/23
|
Band X - 18/10/27
|
(1) All Authorization Terms of the Bands A and B have already been renewed for 15 years. Therefore, it is not expected another renovation (until completed 30 years of the authorization).
(2) - The Authorization Terms of Band L, which were tied to Band A or B, were renovated at the same time of these bands.
(3) - The Band’s "L" that were realigned to the J band shall be the same date for renewal of the latter (price calculation realignment is referred at this point).
(4) - At São Paulo, only cities with CN 13-19, VIVO holds the license for 450 MHz which expire on 18/10/27.
(5) - Paraná - Sector 20 PGO - Cities of Londrina and Tamarana.
(6) - Mato Grosso do Sul - PGO Sector 22 - City of Parnaíba.
(7) - Goiás - Sector 25 PGO - Cities of Buriti Alegre, Cachoeira Dourada Inaciolândia, Itumbiara, Paranaiguara and San Simon.
(8) - São Paulo - Sector 33 PGO - Altinópolis, Aramina, Batatais, Brodowski, Buritizal, Cajuru, the Coconut Cassia, Colombia, France, Guaira, Guara, Ipuã, Ituverava, Jardinópolis, Miguelópolis, Morro Agudo, Nuporanga, Orlândia, Ribeirão Chain, Sales de Oliveira, Santa Cruz Hope, Joy and Santo Antonio Sao Joaquim da Barra
.
F-151
TABLE OF CONTENTS
Part IItem 1. Identity Of Directors, Senior Management and AdvisorsItem 2. Offer Statistics and Expected TimetableItem 3. Key InformationItem 4. Information on The CompanyItem 4A. Unresolved Staff CommentsItem 5. Operating and Financial Review and ProspectsItem 6. Directors, Senior Management and EmployeesItem 7. Major Shareholders and Related Party TransactionsItem 8. Financial InformationItem 9. The Offering and ListingItem 10. Additional InformationItem 11. Quantitative and Qualitative Disclosures About Market RiskItem 12. Description Of Securities Other Than Equity SecuritiesPart IIItem 13. Defaults, Dividend Arrearages and DelinquenciesItem 14. Material Modifications To The Rights Of Security Holders and Use Of ProceedsItem 15. Controls and ProceduresItem 16. [reserved]Item 16A. Audit Committee Financial ExpertItem 16B. Code Of EthicsItem 16C. Principal Accountant Fees and ServicesItem 16D. Exemptions From The Listing Standards For Audit CommitteesItem 16E. Purchases Of Equity Securities By The Issuer and Affiliated PurchasersItem 16F. Change in Registrant S Certifying AccountantItem 16G. Corporate GovernancePart IIIItem 17. Financial StatementsItem 18. Financial StatementsItem 19. ExhibitsNote 1. Background and General InformationNote 2. Basis Of Presentation Of The Consolidated Financial StatementsNote 3. Accounting PoliciesNote 4. Segment InformationNote 5: Business Combinations and Acquisitions Of Non-controlling InterestsNote 6. Intangible AssetsNote 7. GoodwillNote 8. Property, Plant and EquipmentNote 9. Associates and Joint VenturesNote 10. Related PartiesNote 11. Trade and Other ReceivablesNote 12. EquityNote 13. Financial Assets and LiabilitiesNote 14. Trade and Other PayablesNote 15. ProvisionsNote 16. Derivative Financial Instruments and Risk Management PoliciesNote 17. Income Tax MattersNote 18. Revenue and ExpensesNote 19. Share-based Payment PlansNote 20. Cash Flow AnalysisNote 21. Other InformationNote 22. Finance LeasesNote 23. Events After The Reporting PeriodItem Date Maturity Date Currency Euros (1) Currency Of Issuance Coupon