As filed with the Securities and Exchange Commission on February 21, 2019
UNITED STATES
SECURITIES AND EXCHANGE COMMISSION
____________________________________
Washington, D.C. 20549
____________________________________
FORM
20-F
(Mark One)
|
o
|
REGISTRATION STATEMENT PURSUANT TO SECTION 12(b) OR (g) OF THE SECURITIES
EXCHANGE ACT OF 1934
|
OR
|
x
|
ANNUAL REPORT PURSUANT TO SECTION 13 OR 15(d) OF THE SECURITIES EXCHANGE
ACT OF 1934
For the fiscal year ended December 31, 2018
|
OR
|
o
|
TRANSITION REPORT PURSUANT TO SECTION 13 OR 15(d) OF THE SECURITIES EXCHANGE
ACT OF 1934
|
OR
|
o
|
SHELL COMPANY REPORT PURSUANT TO SECTION 13 OR 15(d) OF THE SECURITIES
EXCHANGE ACT OF 1934
|
Commission file number: 001-09531
TELEFÓNICA, S.A.
(Exact name of Registrant as specified in its charter)
KINGDOM OF SPAIN
(Jurisdiction of incorporation or organization)
Distrito Telefónica, Ronda de la Comunicación, s/n
28050 Madrid, Spain
(Address of principal executive offices)
Consuelo Barbé Capdevila, Securities Market and Corporate Governance Legal Department
Distrito Telefónica, Ronda de la Comunicación, s/n, 28050 Madrid, Spain
Tel. +34 91 482 3733, Fax. +34 91 482 3817, e-mail: amv@telefonica.com
Pablo Eguiron Vidarte, Head of Investor Relations
Distrito Telefónica, Ronda de la Comunicación, s/n, 28050 Madrid, Spain
Tel. +34 91 482 8700, Fax. +34 91 482 8600, e-mail: ir@telefonica.com
(Name, Telephone, E-mail and/or Facsimile number and Address of Company Contact Person)
____________________________________
Securities registered or to be registered pursuant to Section 12(b) of the Act:
|
Title of each class
|
Name of each exchange on which registered
|
|
|
Ordinary Shares, nominal value 1.00 euro per share*
American Depositary Shares, each representing one
Ordinary Share
|
New York Stock Exchange
New York Stock Exchange
|
|
|
Guarantees** by Telefónica, S.A. of the
$1,000,000,000 Fixed Rate Notes Due 2019; $1,400,000,000 Fixed Rate Guaranteed Senior Notes Due 2020; $1,500,000,000 Fixed Rate Guaranteed Senior Notes Due 2021; $750,000,000 Fixed Rate Guaranteed Senior Notes Due 2023; $1,500,000,000 Fixed Rate Senior Notes Due 2027; $2,000,000,000 Fixed Rate Guaranteed Senior Notes Due 2036; $750,000,000 Fixed Rate Senior Notes Due 2038; $2,500,000,000 Fixed Rate Senior Notes Due 2047 and $1,250,000,000 Fixed Rate Senior Notes Due 2048; each of Telefónica Emisiones, S.A.U., and of the $1,250,000,000 Fixed Rate Guaranteed Senior Notes Due 2030 of Telefónica Europe, B.V.
|
New York Stock Exchange
|
|
*
|
Not for trading, but only in connection with the listing of American Depositary Shares, pursuant to the requirements of the New York Stock Exchange.
|
|
**
|
Not for trading, but only in connection with the listing of the $1,000,000,000 Fixed Rate Notes Due 2019; $1,400,000,000 Fixed Rate Guaranteed Senior Notes Due 2020; $1,500,000,000 Fixed Rate Guaranteed Senior Notes Due 2021; $750,000,000 Fixed Rate Guaranteed Senior Notes Due 2023; $1,500,000,000 Fixed Rate Senior Notes Due 2027; $2,000,000,000 Fixed Rate Guaranteed Senior Notes Due 2036; $750,000,000 Fixed Rate Senior Notes Due 2038; $2,500,000,000 Fixed Rate Senior Notes Due 2047 and $1,250,000,000 Fixed Rate Senior Notes Due 2048; each of Telefónica Emisiones, S.A.U., and the $1,250,000,000 Fixed Rate Guaranteed Senior Notes Due 2030 of Telefónica Europe, B.V. (each a wholly-owned subsidiary of Telefónica, S.A.)
|
____________________________________
Securities registered or to be registered pursuant to Section 12(g) of the Act:
None
____________________________________
Securities for which there is a reporting obligation pursuant to Section 15(d) of the Act:
None
____________________________________
The number of outstanding shares of each class of capital stock of Telefónica, S.A. at December 31, 2018 was:
Ordinary Shares, nominal value 1.00 euro per share:
5,192,131,686
Indicate by check mark if the registrant is a well-known seasoned issuer, as defined in Rule 405 of the Securities Act.
|
Yes
x
|
No
o
|
If this report is an annual or transition report, indicate by check mark if the registrant is not required to file reports pursuant to Section 13 or 15(d) of the Securities Exchange Act of 1934.
|
Yes
o
|
No
x
|
Indicate by check mark whether the registrant (1) has filed all reports required to be filed by Section 13 or 15(d) of the Securities Exchange Act of 1934 during the preceding 12 months (or for such shorter period that the registrant was required to file such reports), and (2) has been subject to such filing requirements for the past 90 days.
|
Yes
x
|
No
o
|
Indicate by check mark whether the registrant has submitted electronically every Interactive Data File required to be submitted pursuant to Rule 405 of Regulation S-T (Section 232.405 of this chapter) during the preceding 12 months (or for such shorter period that the registrant was required to submit such files).
|
Yes
x
|
No
o
|
Indicate by check mark whether the registrant is a large accelerated filer, an accelerated filer, a non-accelerated filer or an emerging growth company. See the definitions of “large accelerated filer”, “accelerated filer” and “emerging growth company” in Rule 12b-2 of the Exchange Act (Check one):
|
Large Accelerated Filer
x
|
Accelerated Filer
o
|
Non-accelerated Filer
o
|
Emerging growth company
o
|
If an emerging growth company that prepares its financial statements in accordance with U.S. GAAP, indicate by check mark if the registrant has elected not to use the extended transition period for complying with any new or revised financial accounting standards provided pursuant to Section 13 (a) of the Exchange Act.
o
The term “new or revised financial accounting standard” refers to any update issued by the Financial Accounting Standards Board to its Accounting Standards Codification after April 5, 2012
Indicate by check mark which basis of accounting the registrant has used to prepare the financial statements included in this filing:
|
o
|
U.S. GAAP
|
|
x
|
International Financial Reporting Standards as issued by the International Accounting Standards Board
|
|
o
|
Other
|
If “Other” has been checked in response to the previous question, indicate by check mark which financial statement item the registrant has elected to follow.
|
o
Item 17
|
o
Item 18
|
|
Yes
o
|
No
x
|
|
TABLE OF CONTENTS
|
|
4
5
6
CAUTIONARY STATEMENT REGARDING FORWARD-LOOKING STATEMENTS
This Annual Report contains statements that constitute forward-looking statements within the meaning of Section 27A of the Securities Act of 1933, as amended (the “Securities Act”), Section 21E of the Securities Exchange Act of 1934 (the “Exchange Act”), as amended, and the safe harbor provisions of the Private Securities Litigation Reform Act of 1995. The forward-looking statements in this Annual Report can be identified, in some instances, by the use of words such as “will,” “shall,” “target,” “expect,” “aim,” “hope,” “anticipate,” “should,” “may,” “might,” “assume,” “estimate,” “plan,” “intend,” “believe” and similar language or other formulations of a similar meaning or, in each case, the negative formulations thereof. Other forward-looking statements can be identified in the context in which the statements are made or by the forward-looking nature of discussions of strategy, plans or intentions. These statements appear in a number of places in this Annual Report including, without limitation, certain statements made in “Item 3. Key Information—Risk Factors,” “Item 4. Information on the Company,” “Item 5. Operating and Financial Review and Prospects” and “Item 11. Quantitative and Qualitative Disclosures About Market Risk” and include statements regarding our intent, belief or current expectations with respect to, among other things:
|
•
|
the effect on our results of operations of competition in telecommunications markets;
|
|
•
|
trends affecting our business financial condition, results of operations or cash flows;
|
|
•
|
ongoing or future acquisitions, investments or divestments;
|
|
•
|
our capital expenditures plan;
|
|
•
|
our estimated availability of funds;
|
|
•
|
our ability to repay debt with estimated future cash flows;
|
|
•
|
our shareholder remuneration policies;
|
|
•
|
supervision and regulation of the telecommunications sectors where we have significant operations;
|
|
•
|
our strategic partnerships;
|
|
•
|
the potential for growth and competition in current and anticipated areas of our business; and
|
|
•
|
the outcome of pending or future litigation or other legal proceedings.
|
Such forward-looking statements are not guarantees of future performance and involve numerous risks and uncertainties, and actual results may differ materially from those anticipated in the forward-looking statements as a result of various factors. The risks and uncertainties involved in our businesses that could affect the matters referred to in such forward-looking statements include but are not limited to:
|
•
|
changes in general economic, business or political conditions in the domestic or international markets in which we operate or have material investments that may affect demand for our services or our cost structure, including as a result of the outcome of Brexit or increasing trade tensions in certain parts of the world;
|
|
•
|
exposure to currency exchange rates, interest rates or credit risk, including in relation to our treasury investments or in some of our financial transactions;
|
|
•
|
existing or worsening conditions in the international financial markets;
|
|
•
|
the impact of new accounting standards or current, pending or future legislation and regulation in countries where we operate, as well as any failure to renew or obtain the necessary licenses, authorizations and concessions to carry out our operations and the impact of limitations in spectrum capacity;
|
|
•
|
compliance with anti-corruption laws and regulations and economic sanctions programs;
|
|
•
|
our inability to anticipate or adapt in a timely manner to changing customer demands and/or new ethical or social standards;
|
|
•
|
changes in our competitive position, including as a result of the evolution of competition and market consolidation in the markets where we operate;
|
7
|
•
|
our inability to anticipate and adapt to the rapid technological changes that characterize the sector in which we operate, or to select the right investments to make;
|
|
•
|
failure of suppliers to provide necessary equipment and services on a timely basis and otherwise meeting our performance expectations;
|
|
•
|
the impact of unanticipated network interruptions;
|
|
•
|
the impact of cyber-security actions;
|
|
•
|
the impact of impairment charges on our goodwill and assets as a result of changes in the regulatory, business, economic or political environment or other factors;
|
|
•
|
potential liability resulting from our Internet access and hosting services arising from illegal or illicit use of the Internet, including the inappropriate dissemination or modification of consumer data;
|
|
•
|
sustainability and environmental risks, including climate change;
|
|
•
|
the effect of reports suggesting that electromagnetic fields may cause health problems; and
|
|
•
|
the outcome of pending or future litigation or other legal proceedings.
|
Readers are cautioned not to place undue reliance on those forward-looking statements, which speak only as of the date of this Annual Report. We do not undertake any obligation to update any forward-looking statements that may be made to reflect events or circumstances after the date of this Annual Report including, without limitation, changes in our business or acquisition strategy or planned capital expenditures, or to reflect the occurrence of unanticipated events.
8
CERTAIN TERMS AND CONVENTIONS
Our ordinary shares, nominal value 1.00 euro per share, are currently listed on each of the Madrid, Barcelona, Bilbao and Valencia stock exchanges (collectively, the “
Spanish Stock Exchanges
”) and are quoted through the Automated Quotation System under the symbol “TEF.” They are also listed on the London and Buenos Aires stock exchanges. American Depositary Shares (“
ADSs
”), each representing the right to receive one ordinary share, are listed on the New York Stock Exchange and on the Lima Stock Exchange. ADSs are evidenced by American Depositary Receipts (“
ADRs
”) issued under a Deposit Agreement with Citibank, N.A., as Depositary.
As used herein, “
Telefónica,
” the “
Telefónica Group,
” the “
Group
”, the “
Company
” and terms such as “
we,
” “
us
” and “
our
” mean Telefónica, S.A. and its consolidated subsidiaries, unless the context requires otherwise.
As used herein, “
Atento
” means Atento Holding, Inversiones y Teleservicios, S.A. and its consolidated subsidiaries, unless the context requires otherwise.
Below are definitions of certain technical terms used in this Annual Report:
"
Access
" refers to a connection to any of the telecommunications services offered by Telefónica. A single fixed customer may contract for multiple services, and Telefónica believes that it is more useful to count the number of accesses a customer has contracted for, than to merely count the number of its customers. For example, a customer that has fixed line telephony service and broadband service is counted as two accesses rather than as one customer.
"
ARPU
" is the average revenues per access per month. ARPU is calculated by dividing total gross service revenues (excluding inbound roaming revenues) from sales to customers for the preceding 12 months (or another given period) by the weighted average number of accesses for the same period, and then dividing by 12 (or the number of months in such other given period).
"
Bundles
" refer to combination products that combine fixed services (wirelines, broadbands and television) and mobile services.
"
Churn
" is the percentage of disconnections over the average customer base in a given period.
"
Cloud computing
" is the delivery of computing as a service rather than a product, whereby shared resources, software and information are provided to computers and other devices as a utility over a network (typically the Internet).
"
Commercial activity
" includes the addition of new lines, replacement of handsets and migrations.
"
Convergent
" refers to the offer of more than a single service for a single price.
"
Data ARPU
" is the average data revenues per access per month. Data ARPU is calculated by dividing total data revenues (from sources such as Short Message Service ("
SMS
"), Multimedia Messaging Services ("
MMS
"), other mobile data services such as mobile connectivity and mobile Internet, premium messaging, downloading ringtones and logos, mobile mail and wireless application protocol ("
WAP
") connectivity from sales to customers) for a given period by the weighted average number of accesses for the same period, and then dividing by the relevant number of months in such period.
"
Data revenues
" include revenues from SMS, MMS, other mobile data services such as mobile connectivity and mobile Internet, premium messaging, downloading ringtones and logos, mobile mail and WAP connectivity from sales to customers.
"
Data traffic
" includes all traffic from Internet access, messaging (SMS, MMS) and connectivity services that is transported by the networks owned by Telefónica.
"
Fixed telephony accesses
" includes public switched telephone network (PSTN) lines (including public use telephony), and integrated services digital network (ISDN) lines and circuits. For the purpose of calculating Telefónica's number of fixed line accesses, Telefónica multiplies its lines in service as follows: PSTN (x1); basic ISDN (x1); and primary ISDN (x30, x20 or x10).
"
Fixed termination rates" or "FTRs"
is an established fixed network tariff that applies when a customer makes a call to someone in a network operated by another operator.
"Fiber to Home"
or "
FTTH
" is the installation and use of optical fiber from a central point directly to individual buildings such as residences, apartment buildings and businesses to provide high-speed Internet access.
9
"
FTTx
" is a generic term for any broadband network architecture that uses optical fiber to replace all or part of the metal local loop.
"
Gross adds
" means the gross increase in the customer base measured in terms of accesses in a period.
"
HDTV
" or "
high definition TV
" has at least twice the resolution of standard definition television (SDTV), allowing it to show much more detail than an analog television or digital versatile disc (DVD).
"
Interconnection revenues
" means revenues received from other operators which use Telefónica's networks to connect to or finish their calls and SMS or to connect to their customers.
"
Internet and data accesses / Fixed Broadband (FBB)
" include broadband accesses (including retail asymmetrical digital subscriber line ("ADSL") very high bit-rate digital subscriber line ("VDSL"), satellite, fiber optic and circuits over 2 Mbps), narrowband accesses (Internet service through the PSTN lines) and the remaining non-broadband final customer circuits. Internet and data accesses also include "Naked ADSL", which allows customers to subscribe for a broadband connection without a monthly fixed line fee.
"
IPTV
" (Internet Protocol Television) refers to distribution systems for television subscription signals or video using broadband connections over the IP protocol.
"
IT
", or information technology, is the acquisition, processing, storage and dissemination of vocal, pictorial, textual and numerical information by a microelectronics-based combination of computing and telecommunications.
"
Local loop
" means the physical circuit connecting the network termination point at the subscriber's premises to the main distribution frame or equivalent facility in the fixed public telephone network.
"
LTE
" means Long Term Evolution, a 4G mobile access technology.
"
M2M
", or machine to machine, refers to technologies that allow both mobile and wired systems to communicate with other devices of the same ability.
"
Market share
" is the percentage ratio of the number of final accesses or operator revenues over the existing total market in an operating area.
"
Mobile accesses
" includes accesses to the mobile network for voice and/or data services (including connectivity). Mobile accesses are categorized into contract and pre-pay accesses.
"
Mobile broadband
" includes Mobile Internet (Internet access from devices also used to make voice calls such as smartphones), and Mobile Connectivity (Internet access from devices that complement fixed broadband, such as PC Cards/dongles, which enable large amounts of data to be downloaded on the move).
"
MTR
" means mobile termination rate, which is the charge per minute or SMS paid by a telecommunications network operator when a customer makes a call to another network operator.
"
MVNO
" means mobile virtual network operator, which is a mobile operator that is not entitled to use spectrum for the provision of mobile services. Consequently, an MVNO must subscribe to an access agreement with a mobile network operator in order to provide mobile access to their customers. An MVNO pays a determined tariff to such mobile network operator for using the infrastructure to facilitate coverage to their customers.
"
Net adds
" means the number of new accesses in a certain period.
"
Non SMS data revenues
" means data revenues excluding SMS revenues.
"
OTT services
" or "
over the top services
" means services provided through the Internet (such as television and video streaming).
"
P2P SMS
" means person to person short messaging service (usually sent by mobile customers).
"
Pay TV
" includes cable TV, direct to home satellite TV, or DTH, and Internet Protocol TV, or IPTV.
"
p.p.
" means percentage points.
"
Revenues
" means net sales and revenues from rendering of services.
10
"
Service revenues
" means revenues less revenues from handset sales. Service revenues are mainly related to telecommunications services, especially voice revenues and data revenues (SMS and data traffic download and upload revenues) consumed by Telefónica's customers.
"
SIM
" means subscriber identity module, a removable intelligent card used in mobile handsets, USB modems, etc. to identify the user in the network.
"Ultra-Broad Band"
or
"UBB"
is the fiber-to-the-premise broadband which is capable of giving minimum downlink speed of 100 mbps and minimum uplink speed of 50 mbps.
"
Unbundled local loop
", or "
ULL
" includes accesses to both ends of the copper local loop leased to other operators to provide voice and digital subscriber line (“
DSL
”) services (fully unbundled loop or “
fully ULL
”) or only DSL services (shared unbundled loop or "
shared ULL
").
"
Voice Traffic
" means voice minutes used by Telefónica's customers over a given period, both outbound and inbound.
"
VoIP
" means voice over Internet protocol.
"
Wholesale accesses
" means accesses Telefónica provides to its competitors, who then sell services over such accesses to their residential and corporate clients.
"
Wholesale ADSL
" means accesses of broadband or fiber that Telefónica provides to its competitors, who then sell services over such accesses to their residential and corporate clients.
"
YoY
" or "
y-o-y
" means year-on-year.
11
PRESENTATION OF CERTAIN FINANCIAL INFORMATION
In this Annual Report, references to “U.S. dollars,” “dollars” or “$,” are to United States dollars, references to “pounds sterling,” “sterling” or “£” are to British pounds sterling, references to “reals” refer to Brazilian reals and references to “euro”, “euros” or “€” are to the single currency of the participating member states in the Third Stage of the European Economic and Monetary Union pursuant to the treaty establishing the European Community, as amended from time to time.
Our consolidated financial statements as of December 31, 2018 and 2017, and for the years ended December 31, 2018, 2017 and 2016 included elsewhere in this Annual Report, including the notes thereto (the “
Consolidated Financial Statements
”), are prepared in conformity with International Financial Reporting Standards (“
IFRS
”) as issued by the International Accounting Standards Board (“
IASB
”).
12
A. Directors and Senior Management
Not applicable.
B. Advisers
Not applicable.
C. Auditors
Not applicable.
Not applicable.
A. Selected Financial Data
The following table presents certain selected consolidated financial data. It is to be read in conjunction with “Item 5. Operating and Financial Review and Prospects”, “Item 4. Information on the Company—Business Overview” and the Consolidated Financial Statements. The consolidated income statements and the consolidated statements of cash flow data for the years ended December 31, 2016, 2017 and 2018 and the consolidated statements of financial position data as of December 31, 2017 and 2018 set forth below are derived from, and are qualified in their entirety by reference to the Consolidated Financial Statements.
The selected consolidated financial data as of December 31, 2016, 2015 and 2014 and for the years ended December 31, 2015 and 2014 may differ from previously reported financial information as of such dates and for such periods in our respective annual reports on Form 20-F for certain prior years, mainly as a result of the retrospective revisions referred to below:
•
The consolidated income statement and the consolidated statements of cash flow data for the year ended December 31, 2015 set forth below was retrospectively amended in 2016 to show the reclassification of the results attributable to our operations in the United Kingdom as continuing operations. As such, the information set forth below is not derived from Telefónica, S.A.’s consolidated financial statements presented for the year ended December 31, 2015, which are not included nor incorporated by reference in this Annual Report.
•
The consolidated statement of financial position data as of December 31, 2014 set forth below was retrospectively amended in 2016 to show the finalization of the purchase price allocation for the acquisition of E-Plus and as such, is not derived from Telefónica, S.A.’s consolidated financial statements presented for the year ended December 31, 2014, which are not included nor incorporated by reference in this Annual Report.
Our Consolidated Financial Statements have been prepared in accordance with IFRS as issued by the IASB.
13
The basis of presentation is described in detail in Note 2 to our Consolidated Financial Statements.
|
Millions of euros
|
2014
|
|
2015
|
|
2016
|
|
2017
|
|
2018
|
|
|
Revenues
|
50,377
|
|
54,916
|
|
52,036
|
|
52,008
|
|
48,693
|
|
|
Other income
|
1,707
|
|
2,011
|
|
1,763
|
|
1,489
|
|
1,622
|
|
|
Supplies
|
(15,182
|
)
|
(16,547
|
)
|
(15,242
|
)
|
(15,022
|
)
|
(14,013
|
)
|
|
Personnel expenses
|
(7,098
|
)
|
(10,349
|
)
|
(8,098
|
)
|
(6,862
|
)
|
(6,332
|
)
|
|
Other expenses
|
(14,289
|
)
|
(16,802
|
)
|
(15,341
|
)
|
(15,426
|
)
|
(14,399
|
)
|
|
Depreciation and amortization
|
(8,548
|
)
|
(9,704
|
)
|
(9,649
|
)
|
(9,396
|
)
|
(9,049
|
)
|
|
OPERATING INCOME
|
6,967
|
|
3,525
|
|
5,469
|
|
6,791
|
|
6,522
|
|
|
Share of (loss) income of investments accounted for by the equity method
|
(510
|
)
|
(10
|
)
|
(5
|
)
|
5
|
|
4
|
|
|
Net finance expense
|
(2,519
|
)
|
(2,341
|
)
|
(2,706
|
)
|
(2,290
|
)
|
(1,232
|
)
|
|
Net exchange differences
|
(303
|
)
|
(268
|
)
|
487
|
|
91
|
|
277
|
|
|
Net financial expense
|
(2,822
|
)
|
(2,609
|
)
|
(2,219
|
)
|
(2,199
|
)
|
(955
|
)
|
|
PROFIT BEFORE TAX
|
3,635
|
|
906
|
|
3,245
|
|
4,597
|
|
5,571
|
|
|
Corporate income tax
|
(383
|
)
|
(155
|
)
|
(846
|
)
|
(1,219
|
)
|
(1,621
|
)
|
|
PROFIT FOR THE YEAR
|
3,252
|
|
751
|
|
2,399
|
|
3,378
|
|
3,950
|
|
|
Attributable to equity holders of the Parent
|
3,001
|
|
616
|
|
2,369
|
|
3,132
|
|
3,331
|
|
|
Attributable to non-controlling interests
|
251
|
|
135
|
|
30
|
|
246
|
|
619
|
|
|
Weighted average number of shares-Basic (thousands)(1)
|
4,850,311
|
|
5,070,588
|
|
5,060,519
|
|
5,110,188
|
|
5,126,575
|
|
|
Basic and diluted earnings per share attributable to equity holders of the parent (euro)(1)
|
0.58
|
|
0.07
|
|
0.42
|
|
0.56
|
|
0.57
|
|
|
Basic and diluted earnings per ADS (euro)(1)
|
0.58
|
|
0.07
|
|
0.42
|
|
0.56
|
|
0.57
|
|
|
Weighted average number of ADS-Basic (thousands)(1)
|
4,850,311
|
|
5,070,588
|
|
5,060,519
|
|
5,110,188
|
|
5,126,575
|
|
|
Dividends per ordinary share (cash and scrip) (euro)
|
0.75
|
|
0.75
|
|
0.75
|
|
0.40
|
|
0.40
|
|
|
Dividends per ordinary share (cash and scrip) ($) (2)
|
0.98
|
|
0.83
|
|
0.82
|
|
0.46
|
|
0.46
|
|
|
Consolidated Statement of Financial Position Data
|
|
|
|
|
|
|
|
|
|
|
|
Cash and cash equivalents
|
6,529
|
|
2,615
|
|
3,736
|
|
5,192
|
|
5,692
|
|
|
Property, plant and equipment
|
33,156
|
|
33,910
|
|
36,393
|
|
34,225
|
|
33,295
|
|
|
Total assets
|
122,348
|
|
120,329
|
|
123,641
|
|
115,066
|
|
114,047
|
|
|
Non-current liabilities
|
62,318
|
|
60,509
|
|
59,805
|
|
59,382
|
|
57,418
|
|
|
Equity
|
30,321
|
|
25,436
|
|
28,385
|
|
26,618
|
|
26,980
|
|
|
Capital stock
|
4,657
|
|
4,975
|
|
5,038
|
|
5,192
|
|
5,192
|
|
|
Consolidated Cash Flow Data
|
|
|
|
|
|
|
|
|
|
|
|
Net cash provided by operating activities
|
12,193
|
|
13,615
|
|
13,338
|
|
13,796
|
|
13,423
|
|
|
Net cash used in investing activities
|
(9,968
|
)
|
(12,917
|
)
|
(8,208
|
)
|
(10,245
|
)
|
(8,685
|
)
|
|
Net cash used in financing activities
|
(4,041
|
)
|
(3,612
|
)
|
(4,220
|
)
|
(1,752
|
)
|
(3,880
|
)
|
|
(1)
|
The per share and per ADS computations for all periods presented have been reported using the weighted average number of shares and ADSs, respectively, outstanding for each period, and have been adjusted to reflect the stock dividends which occurred during the periods presented, as if these had occurred at the beginning of the earliest period presented and have also been adjusted for mandatorily convertible notes issued in 2014. In accordance with IAS 33 (“Earnings per share”), the weighted average number of ordinary shares and ADSs outstanding for each of the periods covered has been restated to reflect the issuance of shares pursuant to Telefónica’s scrip dividend in December 2014, December 2015 and December 2016. As a consequence, basic and diluted earnings per share have also been restated from 2014 to 2015.
|
|
(2)
|
Quantities in U.S. dollars are calculated in accordance with the conversion rate published by the Depositary (Citibank, N.A.) in connection with each dividend payment.
|
14
Not applicable.
C. Reasons for the Offer and Use of Proceeds
Not applicable.
D. Risk Factors
The Telefónica Group’s business is affected by a series of intrinsic risk factors that affect exclusively the Group, as well as a series of external factors that are common to businesses of the same sector. The main risks and uncertainties facing Telefónica which could affect its business, financial position, reputation, corporate image and brand and its results of operations are set out below and must be considered jointly with the information set out in the Consolidated Financial Statements:
Worsening of the economic and political environment could negatively affect Telefónica’s business.
Telefónica's international presence enables the diversification of its activities across countries and regions, but it exposes Telefónica to diverse legislation, as well as to the political and economic environments of the countries in which it operates. Any adverse developments or even uncertainties in this regard, including exchange-rate or sovereign-risk fluctuations, may adversely affect Telefónica's business, financial position, cash flows and results of operations and/or the performance of some or all of the Group's financial indicators.
Economic conditions may adversely affect the level of demand of existing and prospective customers, as they may no longer deem critical the services offered by the Group.
In Europe, the macro-financial outlook showed a slight deterioration during the second half of 2018, influenced by external factors such as the weaker and maturing global economic cycle, the recent tightening of financial conditions, the greater uncertainty associated with the trade tensions between China and the United States and the risks that such tensions pose on economic growth and global stability. On the regional front, the political uncertainty in Europe has diminished in part after the results of the general elections in some European countries, but it still persists in various countries, including Italy, given the lack of political commitment with a reformist agenda. Economic activity and financial stability in Europe could also be affected by the monetary normalization that the European Central Bank is expected to continue implementing and by how Greece continues to manage its ongoing banking and economic restructuring process, after the country’ recent exit from its bailout program.
Furthermore, the planned exit of the United Kingdom from the European Union ("EU") following the outcome of the referendum held in June 2016 is expected to result in economic adjustments regardless of the nature of the new trade and investment relationships between the United Kingdom and the rest of Europe in the future. As of the date of this Annual Report, there is significant uncertainty regarding the Brexit negotiations and required parliamentary approvals, both in terms of timing (the process can be subject to delays) and the final outcome, with multiple options still being possible, including a no deal Brexit. In the meantime, uncertainty surrounding Brexit could have a negative impact on investment, economic activity and employment. It could also lead to financial market volatility, which could limit or restrict access to capital markets.
This situation could worsen depending on the final terms of Brexit, which could increase regulatory and legal complexities, including those relating to tax, trade and security. Such changes could be costly and potentially disruptive to business relationships in these markets, including those of Telefónica, its suppliers and its customers.
The elections to the European Parliament in May 2019 could also lead to political uncertainty, as they could result in a rebalancing of political groupings and significant changes in goals for the European project in the medium term, as well as in changes in key positions of the main European institutions during 2019.
In Spain, another possible source of uncertainty is Catalonia's political situation and its impact on the Spanish economy. Although recent developments have contributed to reduce such uncertainty, if political tensions re-emerge or intensify, there could be a negative impact both on financing conditions and on the Spanish macroeconomic scenario, given the demanding sovereign bond maturity calendar and the high dependence of the Spanish economy on the international investors and economic outlook. There is also some uncertainty regarding the economic policy mix to be implemented in 2019 as a result of the current high parliamentary fragmentation. In 2018, the Telefónica Group obtained 26.1% of its revenues in Spain (24.3% in 2017), 15.0% in Germany (14.0% in 2017) and 13.9% in the United Kingdom (12.6% in 2017).
In Latin America, exchange rate risk is particularly noteworthy. Certain external factors contributing to this risk are the uncertainty derived from the monetary normalization process in the United States, increasing global trade
15
tensions, the continuing low commodity prices in certain cases and doubts about growth and financial imbalances in China. Certain internal factors contributing to this risk are the high fiscal and external deficits in major Latin American countries and the low liquidity in certain exchange markets, together with low productivity growth, which hinder a more accelerated progress in economic development and the rebalancing of still existing mismatches.
In Argentina, the government is focused on resolving the country's macroeconomic and financial imbalances and on recovering international confidence, particularly after the agreement reached with the International Monetary Fund to provide financial support in the medium term. Even though the measures taken by the government are expected to have positive effects in the medium term, both the macroeconomic and exchange rate risks remain high in the short term. The major challenges the economy is facing, both internally (with an ongoing sharp reduction of public deficit in an environment of economic recession and high inflation) and externally (with significant financing needs in the medium term), make the Argentine economy vulnerable to episodes of volatility in the financial markets. Moreover, the presidential elections due to take place in 2019 pose additional risks, as they could result in a change in the current economic policy stance with very limited economic policy levers.
In Brazil, after the presidential elections resulted in a change of government, the effectiveness of such government in implementing the announced and needed reforms that would improve the potential growth of the economy and drive the fiscal accounts towards sustainability remains to be seen. On the other hand, while signs of stabilization have emerged and the economy has started to show positive growth figures, the pace of the recovery is still gradual. Despite the decreasing external financing needs, internal financing needs remain high, and financing conditions remain challenging, as the country sovereign credit rating remains below investment grade.
Mexico has a high commercial and financial exposure to the United States, which could generate uncertainty. Domestically, there is also uncertainty surrounding the new government's political agenda, despite having a relatively stable economic outlook. Both the political management by the new government of the structural achievements made in recent years and the final approval of the Agreement between the United States, Mexico and Canada (USMCA) are expected to have a material impact on the economy. While the signing of USMCA has significantly reduced uncertainty, it has not eliminated it, as the agreement still needs to be ratified by the respective national legislative chambers. Any higher than expected increase in interest rates in the United States and/or a possible re
‑
negotiation of trade agreements between the abovementioned countries could result in higher restrictions on imports into the United States, which, together with political uncertainty surrounding such matters, could negatively impact economic activity and exchange rates in Mexico. The relative weight of Mexico in the consolidated revenues of the Telefónica Group was 2.4% in 2018.
Chile, Colombia and Peru have been able to stabilize their economies with growth rates close to their potential growth led by domestic demand, while recent adjustments and political decisions have addressed certain fiscal and external account issues. Nevertheless, these economies are exposed not only to changes in the global economy given their vulnerability to abrupt movements in commodity prices, but also to unexpected changes in financial conditions.
In Ecuador, a decrease in domestic political uncertainty has allowed for an improvement in economic activity through exports, but risks persist, mainly on the fiscal front. The country's financing needs are still high, which, together with low international reserves, keep the country in a vulnerable position against volatility shocks.
In 2018, Telefónica Brazil represented 20.8% of the Telefónica Group's revenues (23.1% in 2017). In 2018, Telefónica Hispam Norte and Telefónica Hispam Sur represented 8.4% and 13.7% of the Telefónica Group's revenues, respectively (8.3% and 15.8%, respectively, in 2017). In 2018, 4.3% of Telefónica Group’s revenues came from Chile, 4.3% from Peru and 4.8% from Argentina. In 2018, 28.2% of the Group's revenues were generated in countries that do not have investment grade status (in order of their contribution to the Group's revenues: Brazil, Argentina, Ecuador, Costa Rica, Nicaragua, Guatemala, El Salvador and Venezuela) and other countries are only one notch away from losing this status.
"Country risk" factors include, among others, the following:
|
•
|
unexpected adverse changes in regulation or administrative policies, including changes that modify the terms and conditions of licenses and concessions and their renewal (or delay their approval);
|
|
•
|
abrupt exchange-rate movements;
|
|
•
|
high inflation rates;
|
|
•
|
expropriation or nationalization of assets, adverse tax decisions, or other forms of state intervention;
|
|
•
|
economic and financial downturns, political instability and civil disturbances; and
|
16
|
•
|
maximum limits on profit margins imposed in order to limit the prices of goods and services through the analysis of cost structures (for example, in Venezuela, a maximum profit margin has been introduced that is set annually by the Superintendence for Defense of Socioeconomic Rights).
|
Any of the foregoing may adversely affect the business, financial position, results of operations and/or cash flows of the Group.
The Group's financial condition and results of operations may be adversely affected if it does not effectively manage its exposure to foreign currency exchange rates or interest rates.
In nominal terms, as of December 31, 2018, 73.6% of the Group's net financial debt plus commitments was pegged to fixed interest rates for a period greater than one year. As of the same date, 18.7% of the Group's net financial debt plus commitments was denominated in a currency other than the euro.
To illustrate the sensitivity of financial expenses to variations in short-term interest rates as of December 31, 2018: (i) a 100 basis points increase in interest rates in all currencies in which Telefónica had a financial position at that date would have led to an increase in financial expenses of 102 million euros, (ii) whereas a 100 basis points decrease in interest rates in all currencies (even if negative rates are reached), would have led to a reduction in financial expenses of 88 million euros. These calculations were made assuming a constant currency and balance position equivalent to the position at that date and taking into account the derivative financial instruments arranged by the Group.
According to the Group's calculations, the impact on results and specifically on net exchange differences due to a 10% depreciation of Latin American currencies against the U.S. dollar and a 10% depreciation of the rest of the currencies against the euro would result in exchange losses of 1 million euros for the year ended December 31, 2018, primarily due to the weakening of the Venezuelan bolivar and, to a lesser extent, the Argentine peso. These calculations have been made assuming a constant currency position with an impact on profit or loss as of December 31, 2018, taking into account derivative instruments in place.
During 2018, Telefónica Brazil represented 27.7% (25.9% in 2017), Telefónica United Kingdom represented 12.0% (10.1% in 2017), Telefónica Hispam Norte represented 5.1% (7.8% in 2017) and Telefónica Hispam Sur represented 11.0% (14.1% in 2017) of the operating income before depreciation and amortization ("
OIBDA
") of the Telefónica Group.
The Telefónica Group uses a variety of strategies to manage this risk, among others the use of financial derivatives, which themselves are also exposed to risk, including counterparty risk. However, the Group's risk management strategies may not achieve the desired effect, which could adversely affect the Group's business, financial condition, results of operations and/or cash flows.
The evolution of exchange rates negatively impacted the Group's 2018 results, decreasing the year-on-year growth of the Group's consolidated revenues and OIBDA by an estimated 8.8 percentage points and 10.3 percentage points, respectively, mainly due to the depreciation of the Brazilian real and the Argentine peso (3.2 percentage points and 4.7 percentage points, respectively in 2017, mainly due to the depreciation of the Argentine peso, the Venezuelan Bolivar and the pound sterling) . Furthermore, translation differences had a negative impact on the Group's equity of 2,043 million euros as of December 31, 2018, whereas they had a negative impact on the Group's equity of 4,279 million euros as of December 31, 2017.
If the Group does not effectively manage its exposure to foreign currency exchange rates or interest rates, it may adversely affect its business, financial position, results of operations and/or cash flows.
Existing or worsening conditions in the financial markets may limit the Group’s ability to finance, and consequently, the ability to carry out its business plan.
The operation, expansion and improvement of the Telefónica Group's networks, the development and distribution of the Telefónica Group's services and products, the implementation of Telefónica's strategic plan and new technologies, the renewal of licenses or the expansion of the Telefónica Group's business in countries where it operates, may require a substantial amount of financing.
A decrease in the liquidity of Telefónica, or a difficulty in refinancing maturing debt or raising new funds as debt or equity could force Telefónica to use resources allocated to investments or other commitments to pay its financial debt, which could have a negative effect on the Group's business, financial condition, results of operations and/or cash flows.
17
Funding could be more difficult and costly in the event of a deterioration of conditions in the international or local financial markets due, for example, to monetary policies set by central banks, including increases in interest rates and/or balance sheet reductions, increasing global political and commercial uncertainty and oil price instability, or if there is an eventual deterioration in the solvency or operating performance of Telefónica.
As of December 31, 2018, the Group's net financial debt amounted to 41,785 million euros (44,230 million euros as of December 31, 2017) and the Group's gross financial debt amounted to 54,702 million euros (55,746 million euros as of December 31, 2017). As of December 31, 2018, the average maturity of the debt was 8.98 years (8.08 years as of December 31, 2017).
As of December 31, 2018, the Group's gross financial debt scheduled to mature in 2019 amounted to 9,368 million euros and gross financial debt scheduled to mature in 2020 amounted to 6,417 million euros.
In accordance with its liquidity policy, Telefónica has covered its gross debt maturities for the next 12 months with cash and credit lines available at December 31, 2018. As of December 31, 2018, the Telefónica Group had undrawn committed credit facilities arranged with banks for an amount of 12,219 million euros (11,887 million euros of which were due to expire in more than 12 months). Telefónica's liquidity could be affected if market conditions make it difficult to renew existing undrawn credit lines. As of December 31, 2018, 2.7% of the aggregate undrawn amount under credit lines was scheduled to expire prior to December 31, 2019.
In addition, given the interrelation between economic growth and financial stability, the materialization of any of the economic, political and exchange rate risks referred to above could lead to a negative impact on the availability and cost of Telefónica's financing and its liquidity strategy. This in turn could have a negative effect on the Group's business, financial condition, results of operations and/or cash flows.
Adoption of new accounting standards could affect the Group's reported results and financial position.
Accounting standard-setting bodies and other authorities may periodically change accounting regulations that govern the preparation of the Group's consolidated financial statements. Those changes could have a significant impact on the way the Group accounts for certain matters and presents its financial position and its results of operations. In some instances, a modified standard or a new requirement with retroactive effect must be implemented, which requires the Group to restate previous financial statements.
In particular, Telefónica is required to adopt the new accounting standard IFRS 16 Leases ("IFRS 16") effective from January 1, 2019.
This standard requires significant changes that will affect the accounting treatment for all lease contracts where Telefónica acts as lessee, other than certain short-term leases and leases of low-value assets. The Group estimates that the first-time adoption of IFRS 16 will have a material impact on the Group's financial statements and may make comparisons between periods less meaningful. It will also likely materially affect the amounts used to calculate certain financial metrics reported by the Group or used by analysts and investors to analyze the Group.
Note 3 to the Consolidated Financial Statements includes information on the main impacts expected from the first-time adoption of the new requirements.
The Group operates in a highly regulated industry which requires government concessions for the provision of a large part of its services and the use of spectrum, which is a scarce and costly resource.
The telecommunications sector is subject to laws and sector-specific regulations in the majority of the countries where the Group operates. Additionally, many of the services the Group provides require the granting of a license, concession or official approval, which usually requires certain obligations and investments to be made, such as those relating to the acquisition of spectrum capacity. Among the main legal risks are those related to spectrum regulation and licenses/concessions, rates, universal service regulation, regulated wholesale services over fiber networks, privacy, functional separation of businesses and network neutrality. The fact that the Group's business is highly regulated both affects its revenues and imposes costs on its operations.
As the Group provides most of its services under licenses, authorizations or concessions, it is vulnerable to administrative bodies' decisions, such as economic fines for serious breaches in the provision of services and, potentially, revocation or failure to renew these licenses, authorizations or concessions, or the granting of new licenses to competitors for the provision of services in a specific market. The spectrum to which most of the licenses and administrative concessions refer to is used for the provision of mobile services on 2G, 3G and 4G technologies. The complementarity between the different frequency bands successively assigned to an operator in a geographic market
18
enables greater flexibility and efficiency in both the deployment of the network and the provision of services to final customers over the capacities resulting from such network.
Any challenges or amendments to the terms of licenses, authorizations or concessions granted to the Group and necessary for the provision of its services or the Group's failure to obtain sufficient or appropriate spectrum capacity in the jurisdictions discussed below or any others in which it operates, or its inability to assume the related costs, could have an adverse impact on its ability to launch and provide new services and on its ability to maintain the quality of existing services, which may adversely affect the Group's business, financial condition, results of operations and/or cash flows.
Additional information on the key regulatory issues and concessions and licenses held by the Telefónica Group can be found in Appendix VI of the Consolidated Financial Statements.
Additionally, the Telefónica Group could be affected by regulatory actions of the antitrust authorities. These authorities could prohibit certain actions, such as new acquisitions or specific practices, create obligations or impose heavy fines. Any such measures implemented by the antitrust authorities could result in economic and/or reputational loss for the Group, in addition to a loss of market share and/or harm to the future growth of certain businesses.
Regulation of spectrum and access to new government licenses/concessions of spectrum
In Europe, the Directive (EU) 2018/1972 of the European Parliament and of the Council establishing the European Electronic Communications Code (“
EECC
”), was approved on December 11, 2018. The aim of the EECC is fostering investment in new high-capacity networks (principally fiber networks and the fifth generation of mobile telecommunications, or 5G) and create a ‘level playing field’ between telecommunications companies and over-the-top providers ("OTTs"). Member States have a period of two years (until December 21, 2020) to transpose said Directive into their national legislation. Certain provisions included in the EECC are so extensive and complex that their final impact on operators, such as Telefónica, will largely depend on how they are interpreted by regulatory authorities in each Member State. The EECC will continue to oblige national regulatory authorities to analyze telecommunications markets and determine whether any operators dominate the market. Such operators will continue to be designated as having significant market power ("SMP") and face additional obligations in that territory. In the case of new fiber networks, such SMP obligations could be relaxed if co-investment agreements bear fruit among SMP and non-SMP networks operators.
Furthermore, in Europe, spectrum auctions are expected to take place in the coming years, requiring potential cash outflows to obtain additional spectrum or to meet the coverage requirements associated with some of these licenses.
In Spain, the auction of the 3.6 GHz band was carried out during July 2018, and Telefónica was awarded 50 MHz. The Ministry of Economy and Business Affairs has published the roadmap to clear spectrum in the 700 MHz band from its current use (digital television), in line with the calendar approved by the European Commission ("EC") and with the 5G National Plan adopted in December 2017. The plan foresees the completion of the release of the 700 MHz band before June 30, 2020 and the Ministry has indicated its intention to hold the auction in 2020.
In the United Kingdom, the Office of Communications ("Ofcom"), the national telecommunications regulatory authority, conducted a spectrum auction for the 2.3 GHz and 3.4 GHz bands in March and April 2018. Telefónica United Kingdom won all of the 2.3 GHz spectrum available (40 MHz) and an additional 40 MHz of the 3.4 GHz spectrum band (out of the 150 MHz available), in both cases under 20-year renewable licenses. In December 2018, Ofcom launched a public consultation regarding the coverage obligations and auction design relating to the 700 MHz/3.6GHz bands, which are expected to be auctioned in the first quarter of 2020.
In Germany, on May 14, 2018 the Regulatory Agency for Electricity, Gas, Telecommunications, Post and Railway ("BNetzA") published Decisions I and II on the method to award frequencies nationwide, in the 2GHz band and a large part of the 3.6 GHz band. In addition, under the same decisions, BNetzA allocated 100 MHz in the 3.6 GHz band and also frequencies in the 26 GHz band, both for local/regional assignments upon application.
Subsequently, on November 26, 2018, BNetzA published Decisions III and IV establishing the conditions for frequency usage and auction rules on the above-mentioned 2 GHz and 3.6 GHz bands (Auction Rules). The rules include obligations for better coverage in both urban and rural areas, as well as along transport routes and other conditions, such as the obligation to negotiate on national roaming and network sharing. The above four decisions have been challenged in Court by Telefónica Deutschland Group. Nevertheless, Telefónica Deutschland Group
19
submitted its application to the auction by January 25, 2019. The auction is scheduled to begin in the first quarter of 2019.
All of the bands mentioned above are considered to be technologically neutral, which means that they could potentially be used in the future for 5G services.
In Latin America, spectrum auctions are expected to take place in the coming years, potentially requiring cash outflows to obtain additional spectrum or to meet the coverage requirements or other obligations associated with these licenses. Specifically, the procedures that will take place in 2019 in jurisdictions that are relevant for the Group are:
|
•
|
Argentina: the government issued on January 21, 2018 a decree (Decreto de Necesidad y Urgencia) that contemplates the possibility of auctioning the spectrum previously reserved for ARSAT (a public company). The spectrum that was reserved for ARSAT includes 20 MHz in the 700 MHz band (national), 50 MHz in the AWS band (national) and 20 MHz in the 1900 MHz band (regional).
|
|
•
|
Brazil: In September 2018, the Brazilian regulator, Anatel, launched a first consultation to award spectrum in the 2.3GHz TDD (time-division duplexing) band and spectrum in the 3.5GHz TDD band. A consultation on the auction of the remaining spectrum in the 700 MHz band is expected to take place in the first half of 2019. Anatel’s 5G commission has also identified 1500 MHz which could be auctioned. An auction to award spectrum in any of these bands could take place in 2019 or 2020.
|
|
•
|
Colombia: The consultation processes launched in 2017 and early 2018 on the conditions of the 700 MHz spectrum auction were suspended following the change of government that took place in August 2018. The new government has submitted to Congress a draft bill with regards to information and communication technologies. Among the measures included in the draft bill, there is an extension of the duration of spectrum licenses. The approval process of the draft bill may have an impact on the timing of the auction. This draft bill is expected to be discussed in the first quarter of 2019.
|
|
•
|
Peru: In October 2018, the Ministry of Transport and Communications approved a new regulation for the reorganization of frequency bands, known as "refarming". This could result in a spectrum award process in 2019 or 2020.
|
It is possible that some of the abovementioned spectrum tender procedures will not be completed, or even initiated within the proposed time frames. In addition, in the cases where Telefónica has submitted comments to the proposed conditions of auctions or allocation procedures, there is no certainty as to whether and to what extent such comments will be considered by the relevant regulator. In addition, Telefónica may decide to abstain from a particular process once it reviews the viability of each spectrum acquisition opportunity.
In addition to the spectrum tender procedures referred to above, it may be the case that certain administrations which have not yet announced their intention to release new spectrum may do so during 2019 and thereafter. The above does not include processes announced through general statements by administrations, which involve bands not key to Telefónica's needs. Furthermore, Telefónica may also seek to acquire spectrum on the secondary market where opportunities might arise.
Risks relating to concessions and licenses previously granted
In Spain, pursuant to the license for the 800 MHz spectrum band, there are a series of obligations that Telefónica is subject to with the aim of reaching coverage that allows access, with a speed of at least 30 Mb per second, to at least 90% of the inhabitants in population units of less than 5,000 inhabitants. The approval of the final terms and conditions to implement this coverage obligation was published in November 2018. Telefónica is undergoing a constant process of deployment and densification of Long Term Evolution ("LTE") solutions over the 800 MHz band that will be the base for compliance with such obligation.
20
Telefónica owns two concessions in the 2.1 GHz and 3.5 GHz spectrum, both awarded in 2000, which expire in April 2020 but may be extended for an additional ten years.
In the state of São Paulo, Telefónica Brazil provides local and national long-distance Fixed Switched Telephony Services ("
STFC
") under the so-called public regime, through a concession agreement, which is expected to remain in force until 2025. At December 31, 2018, the estimated residual value of the assets assigned to the provision of STFC was 8,622 million Brazilian reals (approximately 1,943 million euros under the exchange rate applicable on such date) (8,763 million Brazilian reals as of December 31, 2017, approximately 2,209 million euros under the exchange rate applicable on such date), which comprised switching and transmission equipment and public use terminals, external network equipment, energy, system and operational support equipment. In principle, such assets were considered to be reversible assets, and were thus supposed to revert to the federal government at the end of the concession agreement. However, the implementation of a bill amending the regulatory framework in Brazil which establishes, among other things, that such assets would no longer be reversible under a new license regime in exchange for investment commitments, is currently pending. The bill was approved at both legislative houses, but was challenged before the Federal Supreme Court due to an alleged procedural defect. The outcome of this lawsuit is uncertain, although the Senate's board may overcome it by sending the bill for voting in the Plenary. In the event that the bill is finally approved, ANATEL would be entitled to adopt the relevant administrative decisions for the amendment of the respective licenses with the consequent amendment of the future obligations imposed on STFC providers
.
As of the date of this Annual Report, there is no certainty that the proposed change in the regulatory framework will be completed, or that it will be completed in fully satisfactory terms for Telefónica Brazil. Only after this bill or a similar law is adopted (enabling the exchange of reversion obligations for investment commitments) could ANATEL impose the investment obligations referred to above.
As of the date of this Annual Report, it is not possible to estimate the hypothetical investment obligations that ANATEL could impose on the concessionaires, including Telefónica Brazil, in exchange for eliminating their obligation to revert assets used for the provision of the STFC services.
In Colombia, the ITC issued resolution 597 on March 27, 2014 to renew 850 MHz/1900 MHz band licenses for ten additional years. Under the scope of such resolution, Colombia Telecomunicaciones, S.A. ("
ColTel
") (67.5% of which is owned, directly and indirectly, by Telefónica and 32.5% of which is owned by the government of Colombia), renewed its license to exploit such spectrum to provide telecommunication services.
The concession agreements from 1994, which were renewed in 2004 and under which the mobile telephone services were provided until November 28, 2013, contained a reversion clause for the underlying assets. However, Law 422 of 1998 and Law 1341 of 2009 provided that upon expiration of a concession agreement for telecommunication services, only the spectrum reverts to the State. That was the understanding under which all the operators, including the authorities, operated between 1998 and 2013. In 2013, however, when analyzing an appeal on the constitutionality of said laws, the Constitutional Court confirmed the constitutionality of the laws but ruled that it could not be concluded that those laws modified with retroactive effect the reversion clause of the concession agreements of 1994. On February 16, 2016, the ITC started an arbitration proceeding against ColTel and other defendants in accordance with the terms of the relevant concession agreement of 1994, in order to clarify the validity and scope of such reversion clause. The arbitration award was rendered on July 25, 2017 and was not favorable to ColTel and its co-defendants.
The arbitration tribunal ordered ColTel to pay 1,651,012 million Colombian pesos. On August 29, 2017, the shareholders' meeting of ColTel approved a capital increase in a total amount of 1,651,012 million Colombian pesos (470 million euros at the exchange rate as of such date) to pay the amount imposed by the arbitration award. The Telefónica Group and the Colombian government subscribed the capital increase pro rata to their respective shareholding in ColTel. Telefónica's decision to participate in the capital increase does not constitute, and should not be understood as, an acceptance of the arbitration award. Telefónica reserves all of its legal rights and the exercise by Telefónica or ColTel of any applicable legal action, national or international. Both ColTel and Telefónica have started legal actions. On August 18, 2017, ColTel filed an appeal to challenge the arbitration award at Colombia's highest court of administrative litigation (Consejo de Estado), which was dismissed on May 24, 2018. In addition, on December 18, 2017, ColTel also filed a constitutional action (acción de tutela) with the Constitutional Court seeking to protect its constitutional rights
,
jeopardized by the arbitration award. On March 15, 2018, the constitutional action was denied and ColTel filed an appeal against this ruling on April 18, 2018, which was dismissed on May 24, 2018. On November 27, 2018 a recusal motion was filed at the Constitutional Court, which is pending resolution.
In addition, pursuant to the relevant bilateral treaty, Telefónica notified Colombia of its intention to file a claim in the International Center for Settlement of Investment Disputes ("
ICSID
"). After the expiration of the required 90-day
21
notice period, on February 1, 2018, Telefónica submitted the arbitration request to the ICSID and, on February 20, 2018, the General Secretary of ICSID registered the request for the institution of arbitration proceedings. The request for arbitration is ongoing and the arbitral tribunal is in the process of being appointed.
In Peru, Telefónica has concessions for the provision of fixed-line services until November 2027. In December 2013, Telefónica filed a partial renewal request for these concessions for five more years. On November 26, 2018, the Ministry of Transportation and Communications (Ministerio de Transportes y Comunicaciones) notified the denial of such renewals. Telefónica has filedan appeal for reconsideration. On February 5, 2019 the Ministry dismissed the mentioned appeal and Telefónica is considering to challenge the decision. In December 2014, June 2016 and May 2017 Telefónica filed renewal requests for an additional 20 years in relation to a concession for the provision of local carrier services, one of the concessions to provide mobile services in certain provinces, and one concession to provide fixed-line services, respectively. In addition, in April 2016, Telefónica filed a renewal request in relation to the 1900 MHz frequency spectrum for the Provincias (all of Peru except for Lima and Callao), which license expired in 2018.
As of the date of this Annual Report, the decision of the Ministry of Transport and Communications (Ministerio de Transportes y Comunicaciones) in these proceedings is still pending and, according to the legislation, the underlying concessions remain in force as long as the proceedings are pending.
In Chile, Telefónica Móviles Chile, S.A. and other two telecommunications operators were awarded spectrum in the 700 MHz band in March 2014, with Telefónica Móviles Chile being awarded 2x10 MHz. While services are being provided on such spectrum, a consumer organization filed a claim before the Tribunal for the Defense of Free Competition (the "
TDFC
") against Telefónica Móviles Chile, S.A. and the other two operators, regarding the allocation of spectrum in the 700 MHz band and challenging the outcome of the spectrum allocation. The TDFC rejected this claim on consecutive occasions but, on June 25, 2018, the Supreme Court issued a final judgment stating that the assignment of spectrum in the 700 MHz band to the mobile operators constituted anticompetitive behavior as it awarded spectrum blocks without respecting the 60 MHz spectrum cap set by the Supreme Court in a ruling from 2009.
The Supreme Court ruled that the incumbent operators have to relinquish the same amount of spectrum that they acquired in the 700 MHz band auction. However, the ruling of the Supreme Court allows the operators to choose the band from which the spectrum that exceeds the fixed cap (60 MHz) is to be relinquished and no deadline has been set to complete such relinquishment. As of the date of this Annual Report, Telefónica Móviles Chile has not relinquished any of the required spectrum, since the proceeding has been temporally suspended by a resolution issued by the Constitutional Court on January 29, 2019.
The Supreme Court ruling also states that if the sector-specific authority ("
Subtel
") considers it necessary to review the maximum spectrum cap, it should put in place a consultation process before the TDFC. Subtel must otherwise initiate the necessary procedures to adapt the set cap to the fixed parameters of 60 MHz for each participating operator in the aforementioned radio spectrum. On October 3, 2018, Subtel submitted its proposal on the review of the maximum spectrum cap to the TDFC.
Additionally, Subtel submitted to the TDFC a proposal of “complementary conditions” with a general scope which would be applicable to all bands, as well as another proposal of “special conditions” to be considered in future auctions. The TDFC set a deadline of December 28, 2018 for interested parties to provide their comments. The process initiated by the TDFC is expected to last several months.
In addition, the Supreme Court rejected the appeal filed by Telefónica Móviles Chile
,
S.A. against the resolution of the TDFC that ordered immediate compliance with the spectrum relinquishment obligations, without waiting for the result of the spectrum cap consultation.However, on January 29, 2019, the Constitutional Court temporarily suspended the obligation to immediately comply with such spectrum relinquishment obligations until the remedy of inapplicability that has been filed by Telefónica is resolved.
Additionally, regarding the 3.5 GHz band, Subtel issued a decision on June 21, 2018 regarding the 3.4-3.8 GHz spectrum band, which, among other things, has suspended the granting of authorizations, the modification of concessions and the reception of network rollouts in connection with this spectrum band. Its purpose is to carry out an in-depth study on the efficiency of the usage of this band for 5G and ensuring the efficient usage of this band in light of international best practices and the need for efficient spectrum management. The decision had a limited impact on Telefónica's operations as Telefónica Chile, S.A. only has 50 MHz of spectrum assigned in that band in Regions XI and XII (representing less than 2% of the population) and that spectrum is currently not in use. On October 3, 2018, Subtel modified the above mentioned resolution and resolved to release part of this spectrum to enable operators to provide wireless fixed services. Of the 50 MHz awarded to Telefónica Chile, S.A., 30 MHz were released and may only
22
be used for mobile services, which is a required change for 5G provision, once future auctions on 3400-3800 MHz range are firmly awarded. The remainder of the spectrum may not currently be used for any service.
On November 20, 2018, Telefónica Chile, S.A. requested the TDFC to initiate a consultation process to determine whether the decision of Subtel regarding the 3.5 GHz band violates competition law. The deadline for third parties to provide background information expired on February 18, 2019.
In Mexico, in August 2018, Telefónica participated in the auction of the 2500-2690 MHz band and was awarded 2x20 MHz of spectrum. The rules and the procedure of the auction were challenged by an operator and Telefónica has responded to the allegations made. Telefónica's regional holdings in the 1900 MHz band (approximately 44% of the total 1900 MHz band) expired in October 2018. Telefónica has requested the renewal of this concession. The Instituto Federal de Telecomunicaciones (“IFT”) is expected to decide on the renewal request during the first quarter of 2019. Telefónica may continue to use this spectrum while the IFT decision is pending.
In 2018, the Group's consolidated investment in spectrum acquisitions and renewals amounted to 868 million euros (538 million euros in 2017).
Regulation of wholesale services
The EC's proposal in respect of the regulatory framework for wholesale services intends, among other measures, to incorporate a costing methodology to fix a European upper limit for the call-termination prices for landline phones/mobile phones (FTRs/MTRs) applicable in the EU. According to this proposal, the decreases in wholesale mobile termination rates ("
MTRs
") in Europe have been noteworthy. It should be noted that since termination fees in mobile and fixed communications have decreased substantially in recent years, future decreases are expected to become smaller so that the negative impact on turnover is expected to be less significant than in the past.
In the United Kingdom, on June 1, 2018, the price of MTRs fell to 0.489 pence per minute. From April 1, 2019, they will be priced at 0.479 pence per minute, with a further reduction based on inflation (consumer prices index ("CPI") minus 3.7% from April 1, 2020).
In Spain, in January 2018 the Spanish National Regulatory and Competition Authority (Comisión Nacional de los Mercados y la Competencia or "
CNMC
") approved a decision setting the new MTRs for all mobile operators, which will result in a progressive reduction of 40% from January 2018 levels (0.0109 euros per minute). The approved MTRs are as follows: from the date the decision became effective until December 31, 2018 0.0070 euros per minute; from January 1, 2019 until December 31, 2019 0.0067 euros per minute; and as from January 1, 2020 0.0064 euros per minute. The CNMC launched a public consultation in November 2018 regarding fixed termination rates (“
FTRs
”), which proposed a progressive reduction in prices of 34% from November 2018 levels. The proposed prices are as follows: from the date the decision becomes effective until December 31, 2019 0.0640 euros per minute; from January 1, 2020 until December 31, 2020 0.0591 euros per minute and as from January 1, 2021 0.0543 euros per minute. A final decision is expected to be adopted in the first quarter of 2019.
In Germany, on December 1, 2018 the price of the MTR fell from 1.07 euro cents per minute to 0.95 euro cents per minute. This price will be in force until November 30, 2019. MTRs for subsequent periods will be decided in 2019.
In Brazil, Resolution 639/2014 established that MTRs will be subject to successive yearly reductions from 2016 until 2019, when the definitive cost-oriented-model fees are expected to be in force. In addition, through Act No. 6211/2014, ANATEL published the reference prices to be applied by operators with significant market power ("
SMP
"). In 2018, through Act No. 9919/2018, ANATEL published the reference prices to be applied by SMP operators from 2020 until 2023. In addition to the planned implementation of the cost-oriented-model, the Plano Geral de Metas de Competição ("
PGMC
"), amended by Resolution 649/2015, among other changes, updated the partial "bill and keep" model for MTRs, aiming to fix an imbalanced remuneration pattern between SMP operators and other companies operating in the relevant market. This measure was intended to adapt the networks to the reductions of MTRs and promote a gradual adaptation to the enforcement of the cost-oriented fees in early 2019. However, the new PGMC that was published in July 2018, among other changes, extended the "bill and keep" model, which was expected to expire in February 2019, until the next revision of the PGMC in four years.
In Mexico, on November 13, 2018, the IFT announced that the MTRs applicable to the so-called Prevailing Economic Agent ("
PEA
") for 2019 shall be 0.028313 pesos per minute while the MTRs applicable to the operators other than the PEA shall be 0.112623 pesos per minute. Both this decision and the decision that established the MTRs applicable to 2018 were challenged by Telefónica.
23
In Peru, on December 21, 2018, the regulator, OSIPTEL, published the new MTRs. The new MTRs applicable to all operators of mobile public services was fixed at 0.00302 dollars per minute rated at the second, which entails a 54% decrease from the previous rate (0.0066.1 dollars per minute rated at the second). The new rates have been in effect since January 1, 2019 and will remain in effect until a new MTR value is defined by the regulator.
In Argentina, on August 17, 2018, the Ente Nacional de Comunicaciones ("
Enacom
") published the provisional termination and local origination charges for mobile communications services provided by networks until the final charges are decided pursuant to a cost model. Enacom set a tariff of 0.0108 dollars per minute and the measurement unit for valuation is per second. During the summer of 2018, Enacom launched a public consultation on the cost models for mobile communications services. On November 22, 2018, Enacom set the provisional termination charge in fixed networks at 0.0045 dollars per minute, the tariff for local transit services at 0.0010 dollars per minute, and the tariff for long distance transportation services at 0.0027 dollars per minute. In each case the measurement unit for valuation is per second.
In Chile, regarding mobile termination rates, on February 5, 2019, Subtel notified TMCH of a new proposal on tariff decree, which will be applicable for the next five years. The average tariff which will apply until 2024 is 1.8 Chilean pesos per minute (0.0024 euros, without VAT, based on the exchange rate as of February 6, 2019, to be charged on a per second basis). The new tariff decree is in effect since January 26, 2019. New tariffs on fixed operations will come into force in May 2019.
In Colombia, in December 2018, the regulator (Comisión de Regulación de Comunicaciones) published two consultations. The first initiative would reduce the FTRs from 0.01 to 0.003 dollars in 2019, which would be beneficial to ColTel as it is a net payer of FTRs. As of 2020, FTRs between fixed networks would be completely eliminated. The second initiative, on one hand seeks to substitute the national roaming charges in incoming calls charged to operators using national roaming, for mobile termination rates, which would negatively impact the revenues of ColTel; and, on the other hand, modifies the formula that defines the maximum regulated rate for network provision charged to MVNOs, from the minimum ARPU reported by MVNOs to the average ARPU from the past four (4) quarters.
As a result of the foregoing actions, the prices for certain wholesale services may be reduced, which may materially adversely affect the Group's business, financial condition, results of operations and/or cash flows. During 2018, the negative impact of these wholesale regulations (mainly MTRs, FTRs and roaming) is estimated to have resulted in the deduction of approximately 1.1 percentage points from the organic growth of the Group's revenues.
(As calculated as set forth in “Item 4. Information on the Company—Business Overview”).
Regulation of universal service obligations
Universal service obligations ("
USO
") refers to the obligations imposed on telecommunication operators which are aimed at granting access to all consumers in a country to a minimum set of services offered at reasonable and fair prices in order to avoid social exclusion.
As stated above, Directive (EU) 2018/1972, of December 11, 2018, which approves the EECC, updates USO provisions in Europe, removing the mandatory inclusion of the legacy outdated services (payphone boxes, directories and information services) and focusing on the provision of affordable broadband services. The EECC provides Member States with full flexibility in relation to the financing required for the provision of these services, allowing Member States to choose between public or industry funding. This ample room for discretion, together with the possibility that the affordability obligations could end up being too onerous, might result in higher costs for the industry.
In Spain, Telefónica is the operator responsible for the provision of universal service elements with respect to fixed network access with a broadband bandwidth of at least 1 Mb per second (until December 2019). On December 28, 2018, the government approved (by Royal Decree 1517/2018) the modification of the USO framework, eliminating the obligation to provide telephone directories to users (which had been assigned from January 1, 2017 to Telefónica), but maintaining Telefónica’s designation as the operator responsible for the provision of public payphones until December 31, 2019, date on which it is expected that such obligation will be removed
.
In Brazil, the General Plan of Univerzalization Targets (PGMU IV) of Fixed Switched Telephony Services (the "General Plan") that was due to have been published in 2016 was finally published on December 21, 2018 (Presidential Decree n. 9.619/2018) after a long period of discussion.
The General Plan lessens the USO framework in three ways: (i) there is a material decrease in the maintenance obligations with respect to Public Use Terminals; (ii) there is a material reduction of the obligations to meet requests
24
for installation of individual accesses within seven days; and (iii) the extinction of the obligations to install and maintain Multifacilities Service Stations.
However, the General Plan imposes a new obligation with respect to "fixed wireless access systems with support for broadband connection" through the implementation of a base radio station in 310 pre-determined localities in the State of São Paulo.
The imposition on the Telefónica Group of additional or more onerous USO in the jurisdictions where it operates could have a material adverse effect on its business, financial condition, results of operations and/or cash flows.
Regulation of fiber networks
In Spain, on March 6, 2018, the CNMC approved a final decision on the economic replicability methodology (or ERT in its acronym in English) to be used to assess the maximum wholesale access price which Telefónica can charge other operators for accessing the optical fiber network in regulated areas (NEBA Local and NEBA services). According to this methodology, from April 2018, Telefónica is to apply a wholesale access price (NEBA) of 17.57 euros per month, with this price being updated twice a year in order to assess whether Telefónica's retail offers (broadband flagship products) are economically replicable with such wholesale NEBA price. In July 2018, the CNMC approved a final decision on the methodology to assess if Telefónica's retail offers for the business sector can be replicated by other operators.
This and any other similar obligations and restrictions which may be imposed in the future in the various jurisdictions where the Telefónica Group operates could raise costs and limit Telefónica's flexibility in providing the aforementioned services, which could materially adversely affect Telefónica's business, financial condition, results of operations and/or cash flows.
Regulations on privacy
In Europe, the General Data Protection Regulation ("
GDPR"
) of April 27, 2016, has been directly applicable in all Member States since May 25, 2018 and implementing measures have been introduced by Member States, including Spain, Germany and the United Kingdom.
In Spain, on December 5, 2018 the Personal Data Protection and Digital Rights Act was approved. This Act implements GDPR in Spain, addressing several particularities concerning data blocking for judicial purposes or specific matters on databases for advertising purposes or data relating to deceased people. Equally, it implements procedural mechanisms within the framework of legal investigations concerning potential infringements of the GDPR.
In addition, on January 10, 2017, the EC presented its proposal for a regulation on privacy and electronic communications ("
ePrivacy Regulation
"), which will replace the current Directive 2002/58/EC. The proposal implies an extra layer of regulation on top of the GDPR and also introduces administrative fines of up to 4% of an undertaking's annual global turnover for breaching new regulations. In this area, a strict data protection and privacy regulation may result in limitations on the ability to offer innovative digital services such as big data services. The future ePrivacy Regulation is not expected to be adopted before the end of 2019.
The Privacy Shield, approved by the EC on July 12, 2016 to lay out the framework for the international transfer of personal data from the EU to the US, was challenged before the EU's General Court by civil-society groups. One of the appeals was not admitted and the admission of a second appeal is still pending as of the date of this Annual Report. The results of the second annual revision of the Privacy Shield by the Commission were published on December 19, 2018. The report concludes that the United States continues to guarantee an adequate level of protection of transferred personal data under the Privacy Shield and that the measures adopted by US authorities to implement the recommendations made by the Commission in the 2017 report have improved the functioning of the framework.
In Brazil, the Personal Data Protection Act (Act 13709/2018) was approved on August 14, 2018. This Act entails further obligations and restrictions for operators in relation to the collection of personal data and its processing and is based on the GDPR. The text was approved in the Chamber of Deputies and the Senate but the President vetoed the creation of the Authority for the Protection of Personal Data and of the National Council for the Protection of Personal Data and Privacy, after considering them to be unconstitutional. On December 27, 2018 the President of Brazil signed provisional measure 869/2018 that created the National Data Protection Authority (ANPD) and postponed to August 2020 the entry into force of the new Personal Data Protection Act. The approval of provisional measure 869/2018 by the National Congress and its conversion into law is still pending.
25
In Chile and Argentina, two bills aligned with the GDPR are in process to pass into law.
Any obligations and restrictions arising from privacy regulations could raise costs and limit Telefónica's ability to provide certain services, which could materially adversely affect Telefónica's business, financial condition, results of operations and/or cash flows.
Regulation of network neutrality
Under the principle of network neutrality applicable to the Internet access services realm, network operators are not permitted to establish technical or commercial restrictions regarding the terminals that can be connected or the services, or applications and contents that can be accessed or distributed through the Internet by the end user. It also refers to the non-discriminatory behavior (e.g. non-anticompetitive) to be adopted by operators regarding the different types of Internet traffic circulating through their networks.
Net neutrality regulation is being implemented all across Europe and in most of the Latin America countries where Telefónica is operating.
In Mexico, it is expected that IFT will issue guidelines during 2019.
Any changes to regulation as it is established in the various jurisdictions where the Telefónica Group operates, could limit the commercial flexibility and might have an impact on its business, financial condition, results of operations and/or cash flows of the Group.
The Telefónica Group is exposed to risks in relation to compliance with anti-corruption laws and regulations and economic sanctions programs.
The Telefónica Group is required to comply with the laws and regulations of various jurisdictions where it conducts operations. In particular, the Group's international operations are subject to various anti-corruption laws, including the US Foreign Corrupt Practices Act of 1977 and the United Kingdom Bribery Act of 2010, and economic sanctions programs, including those administered by the United Nations, the European Union and the United States, including the US Treasury Department's Office of Foreign Assets Control. The anti-corruption laws generally prohibit providing anything of value to government officials for the purposes of obtaining or retaining business or securing any improper business advantage. As part of the Telefónica Group's business, it may deal with entities, the employees of which are considered government officials. In addition, economic sanctions programs restrict the Group's business dealings with certain sanctioned countries, individuals and entities.
Although the Group has internal policies and procedures designed to ensure compliance with applicable anti-corruption laws and sanctions regulations, there can be no assurance that such policies and procedures will be sufficient or that the Group's employees, directors, officers, partners, agents and service providers will not take actions in violation of the Group's policies and procedures (or, otherwise in violation of the relevant anti-corruption laws and sanctions regulations) for which the Group or they may be ultimately held responsible. Violations of anti-corruption laws and sanctions regulations could lead to financial penalties, exclusion from government contracts, damage to the Group's reputation and result in other consequences, that could have a material adverse effect on the Group's business, results of operations and financial condition.
As of the date of this Annual Report, Telefónica is currently conducting internal investigations covering various countries regarding possible violations of applicable anti-corruption laws. Telefónica continues to cooperate with governmental authorities and continues with the ongoing investigations. Although it is not possible at this time to predict the scope or duration of these matters or their likely outcome, Telefónica believes that, considering the size of the Group, any potential penalty as a result of the resolution of these investigations would not materially affect the Group's financial condition.
Telefónica may not anticipate or adapt in a timely manner to changing customer demands and/or new ethical or social standards, which could adversely affect Telefónica’s business and reputation.
To maintain and improve its position in the market vis-à-vis its competitors
,
it is vital that Telefónica has the ability to anticipate and adapt to the evolving needs and demands of its customers, and that it avoids commercial actions that may generate a negative perception of the Group or the products and services it offers, or that may have or be perceived to have a negative impact on society. In addition to harming Telefónica’s reputation, such actions could also result in fines and other sanctions.
26
There is growing social and regulatory demand for companies to behave in a socially responsible manner. In addition, the risks associated with potential damage to a brand’s reputation have become more relevant, especially due to the impact that the publication of news through social networks can have.
If Telefónica were not able to anticipate or adapt to the evolving needs and demands of its customers or avoid inappropriate actions, its reputation could be adversely affected or it could otherwise have an adverse effect on the business, financial condition, results of operations and/or cash flows of the Group
.
Telefónica’s competitive position in some markets could be affected by the evolution of competition and market consolidation.
The Telefónica Group operates in highly competitive markets and it is possible that the Group may not be able to market its products and services effectively or respond successfully to the different commercial actions carried out by its competitors. The Group may also fail to meet its growth plans or to retain its customers, any of which may result in the decrease of the Group’s profits and revenue margins
.
In addition, increased market concentration, including as a result of mergers and acquisitions, or alliances and collaboration agreements among other industry players, could adversely affect the competitive position of Telefónica, as well as the efficiency of its operations and its business continuity.
The entry of new competitors into markets where Telefónica is a leader
,
in addition to changes in market dynamics which have led to aggressive data offers and broadband deployments by the Group’s competitors and mergers of operators in certain markets, have adversely affected the competitive position of Telefónica, negatively impacting the evolution of revenues and its share of customers
.
If Telefónica is not able to face the challenges posed by its competitors, the business, financial condition, results of operations and/or cash flows of the Group could be negatively affected.
Telefónica operates in a sector characterized by rapid technological changes and it may not be able to anticipate and adapt to such changes or select the right investments to make.
The pace of innovation and Telefónica's ability to keep up with its competitors is a critical issue in a sector so affected by technology such as telecommunications.
While automation and other digital processes may lead to significant cost and efficiency gains, there are also significant risks associated with such transformation processes
.
New products and technologies are constantly emerging that can render products and services offered by the Telefónica Group obsolete, as well as its technology. In addition, the explosion of the digital market and the entrance of new players in the communications market, such as MNVOs, Internet companies or device manufacturers, could imply the loss of value of certain assets, affect the generation of income, or otherwise cause Telefónica to have to update its business model. This forces Telefónica to invest in the development of new products, technology and services in order to compete effectively with current or future competitors, which may result in the decrease of the Group's profits and revenue margins. Additionally, this investment may not lead to the development or commercialization of successful products or services. In this respect, margins from traditional voice and data business are shrinking, while new sources of revenues are derived from mobile Internet and connectivity services that are being launched. Examples of these services include IPTV services, IoT services, financial, security and cloud services.
Research and development costs amounted to 947 million euros in 2018, representing an increase of 9.8% from 862 million euros in 2017 (906 million euros in 2016). These expenses represented 1.9%, 1.7% and 1.7% of the Group's consolidated revenues in 2018, 2017 and 2016, respectively. These figures have been calculated using the guidelines established in the Organization for Economic Cooperation and Development ("
OECD
") manual.
One of the technologies currently being developed by telecommunications operators, including Telefónica (in Spain and Latin America), is the new FTTx type networks, which allow to offer broadband accesses over fiber optics with high performance, such as 600MB Internet connections or high definition television services. However, the deployment of such networks, in which the copper of the access loop is totally or partially replaced by optical fiber, implies high levels of investments. As of December 31, 2018, in Spain, fiber coverage reached 21.3 million premises. There is a growing demand for the services that these new networks can offer to the end customer. However, the high level of investments required by these networks results in the need to continuously consider the expected return on investment, and no assurance can be given that these investments will be profitable.
27
In addition, the ability of the Telefónica Group's IT systems (operational and backup) to adequately support and evolve to respond to Telefónica's operating requirements is a key factor in the commercial development, customer satisfaction and business efficiency of the Telefónica Group. Any failure by the Telefónica Group to develop or implement IT systems that adequately support and respond to the Group's evolving operating requirements could have an adverse effect on the Group's business, financial condition, results of operations and/or cash flows.
If Telefónica were not able to anticipate and adapt to the technological changes and trends in the sector, or to properly select the investments to be made, this could negatively affect the Group’s business, financial condition, results of operations and/or cash flows.
Telefónica depends on its suppliers.
The existence of critical suppliers in the supply chain, especially in areas such as network infrastructure, information systems or handsets with a high concentration in a small number of suppliers, poses risks that may affect Telefónica’s operations, and may cause legal contingencies or damages to its image in the event that a participant in the supply chain engages in practices that do not meet acceptable standards or that otherwise fail to meet Telefónica’s performance expectations. This may include delays in the completion of projects or deliveries, poor
-
quality execution, cost deviations and inappropriate practices.
As of December 31, 2018, the Telefónica Group depended on two handset suppliers and ten network infrastructure suppliers, which, together, accounted for 71% and 80%, respectively, of the total contracted handsets as of such date. One of the handset suppliers represented 42% of all contracted handsets as of such date.
These suppliers may, among other things, extend delivery times, raise prices and limit supply due to their own stock shortfalls and business requirements or for other reasons. In addition, the suppliers on which Telefónica relies may also be subject to litigation with respect to technology on which Telefónica depends, including litigation involving claims of patent infringement. Such claims are frequently made in the communications industry.
If suppliers cannot supply their products to the Telefónica Group within the agreed deadline or such products and services do not meet the Group’s requirements, this could hinder the deployment and expansion plans of the network, which in certain cases could affect Telefónica's compliance with the terms and conditions of the licenses under which it operates, or otherwise adversely affect the business and operating results of the Telefónica Group.
In addition, the possible adoption of new protectionist measures in certain parts of the world, including as a result of trade tensions between the United States and China, may have an adverse impact on certain of Telefónica’s suppliers and other significant players in the industry.
The imposition of trade restrictions could result in higher costs and lower margins, and could adversely affect the Group’s business, financial condition, results of operations and/or cash flows
.
Unanticipated network interruptions can lead to quality loss or the interruption of the service.
Unforeseen network interruptions due to system failures, including those due to natural disasters caused by natural or meteorological events or phenomena, network failures, hardware or software failures, theft of network elements or cyber-attacks that affect the quality of, or cause interruption to, the provision of the services of the Telefónica Group, could cause customer dissatisfaction, a reduction in revenues and traffic, the realization of expensive repairs, the imposition of sanctions or other measures by regulatory bodies, and damage to the image and reputation of the Telefónica Group or could otherwise have an adverse effect on the business, financial condition, results of operations and/or cash flows of the Group.
Information technology is key to the Group’s business and it could be subject to cybersecurity risks.
The Group operates in an environment increasingly prone to cyber-threats
.
Consequently, it is necessary for the Group to continue to advance its capacity to identify and detect technical threats and vulnerabilities and improve its ability to react to incidents. This includes the need to strengthen security controls in the supply chain as well as to place increased focus on security measures adopted by partners of the Group and other third parties.
Telecommunications companies worldwide face increasing cybersecurity threats as businesses have become increasingly dependent on telecommunications and computer networks and have adopted cloud computing technologies. Cybersecurity threats may include gaining unauthorized access to Telefónica's systems or inserting computer viruses or malicious software in its systems to misappropriate consumer data and other sensitive information, corrupt Telefónica's data or disrupt its operations. Unauthorized access may also be gained through traditional means
28
such as the theft of laptop computers, data devices and mobile phones and intelligence gathering by employees with access. Further, the Group's employees or other persons may have unauthorized or authorized access to the Group's systems and/or take actions that affect the Group's networks in an inconsistent manner with the Group's policies or otherwise adversely affect the Group or its ability to adequately process internal information.
Telefónica attempts to mitigate these risks through a number of measures, including backup, log review, vulnerabilities checks, network segregation measures and protective systems such as firewalls, intrusion detection or prevention systems, virus scanners and other physical and logical security measures. However, the application of these measures may not always be effective. The Telefónica Group has insurance policies in place which could cover, subject to the policies terms, conditions, exclusions, limits and sublimits of indemnity, and deductibles applying, certain losses arising out of this type of incidents. To date the insurance policies in place have covered some incidents of this sort, yet due to the potential severity and uncertainty of the mentioned events, these policies may not be sufficient to cover all possible monetary losses arising out of an individual event.
Possible regulatory, business, economic or political changes and other factors could lead to asset impairment.
The Telefónica Group reviews on an annual basis, or more frequently when the circumstances require it, the value of assets and cash-generating units, to assess whether their carrying values can be supported by the future expected cash flows, including, in some cases synergies allowed for in acquisition costs. Potential changes in the regulatory, business, economic or political environment may result in the need to introduce changes to estimates made and to recognize impairments in goodwill, intangible assets, property, plant and equipment or financial assets. Although the recognition of impairments of these assets results in a non-cash charge on the income statement, it could adversely affect the results of the Telefónica Group's operations. In this respect, the Telefónica Group has experienced impairments on certain of its investments, affecting its results of operations in the year in which they were experienced. In 2018, impairment losses in the value of goodwill, have been recognized amounting to 350 million euros, related to Telefónica's operations in Mexico. No impairments were recognized in 2017. In 2016, impairment losses, in the value of goodwill, were recognized amounting to 215 million euros, related to Telefónica’s operations in Venezuela (124 million euros) and in Mexico (91 million euros). In addition, Telefónica may not be able to realize deferred tax assets on its statement of financial position to offset future taxable income. The recoverability of deferred tax assets depends on the Group’s ability to generate taxable income over the period for which the deferred tax assets remain deductible. If Telefónica believes it is unable to utilize its deferred tax assets during the applicable period, it may be required to record an impairment against them resulting in a non-cash charge on the income statement. In 2018, Telefónica Móviles México derecognized deferred tax assets amounting to 327 million euros.
Further details on intangible assets and goodwill are provided in Notes 6 and 7 to the Consolidated Financial Statements.
The Telefónica Group’s networks carry and store large volumes of confidential, personal and corporate data, and its Internet access and hosting services may lead to claims for illegal or illicit use of the Internet.
The Telefónica Group's networks carry and store large volumes of confidential, personal and business data, through both voice and data traffic. The Telefónica Group stores increasing quantities and types of customer data in both business and consumer segments. Despite its best efforts to prevent it, the Telefónica Group may be found liable for any loss, transfer, or inappropriate modification of the customer data or general public data stored on its servers or transmitted through its networks, any of which could involve many people and have an impact on the Group's reputation, or lead to legal claims and liabilities that are difficult to measure in advance.
In addition, the Telefónica Group's Internet access and hosting servers could lead to claims for illegal or unlawful use of the Internet. Telefónica, like other telecommunications providers, may be held liable for any loss, transfer or inappropriate modification of the customer data stored on its servers or carried by its networks.
In most countries in which the Telefónica Group operates, the provision of its Internet access and hosting services (including the operation of websites with shelf-generated content) are regulated under a limited liability regime applicable to the content that it makes available to the public as a technical service provider, particularly content protected by copyright or similar laws. However, regulatory changes have been introduced imposing additional obligations on access providers (such as blocking access to a website) as part of the struggle against some illegal or illicit uses of the Internet, notably in Europe.
Any of the foregoing could have an adverse effect on the business, financial position, results of operations and/or cash flows of the Group.
29
Telefónica and Telefónica Group companies are party to lawsuits, antitrust, tax claims and other legal proceedings.
Telefónica and Telefónica Group companies are party to lawsuits, tax claims, antitrust and other legal proceedings in the ordinary course of their businesses, the financial outcome of which is unpredictable. An adverse outcome or settlement in these or other proceedings could result in significant costs and may have a material adverse effect on the Group's business, financial condition, results of operations, reputation and/or cash flows. In particular, the Telefónica Group is party to certain judicial tax proceedings in Peru concerning the clearance of certain previous years' income tax, in respect of which a contentious-administrative appeal is currently pending and to certain tax and regulatory proceedings in Brazil, primarily relating to the ICMS (a Brazilian tax on telecommunication services) and the corporate tax. Further details on these matters are provided in Notes 22 and 26 to the Consolidated Financial Statements. Additional details on provisions for litigation, tax sanctions and claims can be found in Note 21 to the Consolidated Financial Statements.
The telecommunications industry could be affected by factors related to sustainability and the environment. It could also be affected by the possible effects that electromagnetic fields could have on health.
Telefónica’s operations and assets (including its towers and submarine cables) are located in many areas that are subject to natural disasters and severe weather, and which may be adversely affected in the future by climate change. Climate-related factors, such as heat waves, drought, sea levels, storms or flooding, could lead to unanticipated network interruptions and costly repairs, and negatively impact the demand for Telefónica’s services in affected areas. Furthermore, if the Group’s insurance did not fully cover business interruptions or losses resulting from these events, any of the foregoing could have an adverse effect on the business, financial position, results of operations and/or cash flows of the Group.
In addition, government restrictions, standards, or regulations intended to reduce greenhouse gas emissions or potential climate change impacts are likely to result in increased energy, transportation, or raw material and other supply costs. Moreover, local, national or international policy responses to climate change, such as carbon pricing or levies, emission caps or subsidy withdrawals may also lead to the stranding or financial impairment of certain of the Group’s assets. Furthermore, the Group may face increased reputational pressure if its activities are perceived to be inconsistent with addressing climate change.
While the Group has taken several steps to increase its resilience to climate change and to limit its carbon footprint, there is no certainty as to whether such steps will be effective or sufficient.
The telecommunications industry could also be affected by the possible effects that electromagnetic fields emitted by mobile devices and base stations could have on health, as well as by concerns relating to such matters. These concerns have led some governments and administrations to take measures that have compromised the deployment of the necessary infrastructures to ensure quality of service, and have affected the criteria for the deployment of new networks and the development of digital services such as smart meters.
There is consensus among several groups of experts and public health agencies, including the World Health Organization, who state that, to date, there have been no proven risks of exposure to low radio-frequency signals from mobile communications. The scientific community continues to investigate this issue, especially with regard to mobile devices.
Concerns about electromagnetic fields may discourage the use of mobile telephony and new digital services, and may lead government authorities to impose significant restrictions on the location and operation of antennas or cells and the use of radio frequencies by mobile phones, as well as the deployment of smart meters and other products that use mobile technology. This could lead to the impossibility of expanding or improving the Group’s mobile network.
Any of the foregoing could have an adverse effect on the business, financial position, results of operations and/or cash flows of the Group.
30
A. History and Development of the Company
Overview
Telefónica, S.A., is a corporation duly organized and existing under the laws of the Kingdom of Spain, incorporated on April 19, 1924. We:
|
•
|
are a diversified telecommunications group which provides a comprehensive range of services through one of the world’s largest and most modern telecommunications networks;
|
•
are focused on providing telecommunications services; and
•
operate principally in Europe and Latin America.
The following significant events occurred in 2018:
•
On January 22, 2018, Telefónica Emisiones, S.A.U., a wholly-owned subsidiary of Telefónica, issued notes guaranteed by Telefónica, S.A. in an aggregate principal amount of 1,000 million euros. The notes are due on January 22, 2027, pay an annual coupon of 1.447% and were issued at par (100%).
•
On January 31, 2018, the Board of Directors of Telefónica resolved to adopt a new organizational structure in order to make the Group more agile, simple and focused on management, customer service, growth, efficiency and profitability. The main changes were:
|
•
|
The areas of General Counsel, and Public Affairs and Regulation were unified;
|
|
•
|
A new Executive Chairman was appointed for Telefónica España, who was also appointed as a member of the Executive Committee of Telefónica, S.A.;
|
|
•
|
Telefónica Hispanoamérica was split into two new units: (i) Telefónica Hispam Sur (encompassing operations in Argentina, Chile, Peru and Uruguay); and (ii) Telefónica Hispam Norte (encompassing operations in Colombia, México, Central America, Ecuador and Venezuela); and
|
|
•
|
The area of People (Human Resources) was enhanced and now reports directly to the Executive Chairman. This area is led by Ms. Marta Machicot, who also joined the Executive Committee.
|
•
On January 31, 2018, the Board of Directors of Telefónica appointed Mr. Jordi Gual Solé as a member of the Board of Directors, as a Proprietary Director, replacing Mr. Antonio Massanell Lavilla who had voluntarily resigned from the Board on December 21, 2017. Mr. Gual was also appointed as a member of the Regulation and Institutional Affairs Committee and of the Strategy and Innovation Committee.
•
On February 22, 2018, Telefónica filed with the United States Securities and Exchange Commission (the "SEC") its annual report on Form 20-F for the year ended December 31, 2017.
•
On March 6, 2018, Telefónica Emisiones, S.A.U. issued notes guaranteed by Telefónica in an aggregate principal amount of 2,000 million dollars under its SEC shelf program. The issue was split into two tranches. The first tranche, with an aggregate principal amount of 750 million dollars and due on March 6, 2038, carries a coupon of 4.665%, payable semi-annually, and was issued at par. The second tranche, with an aggregate principal amount of 1,250 million dollars and due on March 6, 2048, carries a coupon of 4.895%, payable semi-annually, and was also issued at par.
•
On March 15, 2018, Telefónica entered into a syndicated facility agreement (the "Facility Agreement") with several domestic and international financial entities for a maximum aggregate amount of 5,500 million euros, which unifies and replaces two existing revolving credit facilities: a revolving credit facility of 3,000 million euros with maturity in February 2021, and a credit facility of 2,500 million euros with maturity in February 2022. This Facility Agreement is composed of a five-year single tranche revolving credit facility in an aggregate amount of up to 5,500 million euros, with the option of two annual extensions, at the request of Telefónica, for a maximum maturity of seven years.
•
On March 22, 2018, Telefónica Europe B.V. issued two series of undated deeply subordinated guaranteed fixed rate reset securities, with the subordinated guarantee of Telefónica: 5.7 year non-call securities (exercisable from December 4, 2023) with an aggregate nominal amount of 1,250 million euros and 8.5 year non-call securities (exercisable from September 22, 2026) with an aggregate nominal amount of 1,000 million euros.
31
•
On April 5, 2018, as a result of its participation in the principal stage of the spectrum auction conducted in the United Kingdom, Telefónica UK Limited ("
O2 UK
") was granted four blocks of 10 MHz in the 2.3 GHz spectrum band and eight blocks of 5 MHz in the 3.4 GHz band. The investment commitment for these new frequencies by O2 UK is 523,616,000 pounds (approximately 600 million euros).
•
On April 25, 2018, the Board of Directors of Telefónica took formal note and record of the voluntary resignation as Director of Telefónica by Ms. Eva Castillo Sanz, and as a result, of her resignation as member of the Service Quality and Customer Service Committee, Regulation and Institutional Affairs Committee, and Strategy and Innovation Committee, and Ms. María Luisa García Blanco was appointed as an Independent Director, occupying the vacancy resulting from Ms. Eva Castillo Sanz's resignation.
•
On May 30, 2018, the Board of Directors of Telefónica appointed Independent Director Mr. Peter Löscher as a member of the Service Quality and Customer Service Committee; and Independent Director Ms. María Luisa García Blanco as a member of the Service Quality and Customer Service Committee and of the Regulation and Institutional Affairs Committee. Additionally, Mr. Peter Löscher was appointed Chairman of the Service Quality and Customer Service Committee.
•
On June 8, 2018, the Annual General Shareholders' Meeting of Telefónica was held at second call with the attendance, present or represented, of shareholders holding shares representing 53.42% of the share capital of Telefónica. All the resolutions submitted were approved at the meeting.
Furthermore, Telefónica announced that the Annual General Shareholders' Meeting had agreed a dividend distribution in cash to be charged to unrestricted reserves, by means of a payment of a fixed gross amount of 0.40 euros during 2018, payable in two tranches, for each existing Telefónica share and carrying entitlement to this distribution on the following dates: the first payment in cash of a gross amount of 0.20 euros per share on June 15, 2018; the second payment in cash of a gross amount of 0.20 euros per share on December 20, 2018.
•
On June 25, 2018, Telefónica announced that it had been declared the winner of the tender to acquire the rights to broadcast all the paid Campeonato Nacional de Liga de Primera División (the Spanish soccer premier league) matches in the Spanish residential market for the 2019-2022 cycle (packages 4 and 5). The award was made at an identical price for each of the three seasons (980 million euros), which represents a slight reduction in relation to the last season of the 2016-2019 cycle.
•
On June 28, 2018, Telefónica reached an agreement with Mediaproduccion, S.L.U. ("
Mediapro
") pursuant to which Telefónica acquired the exploitation rights by means of pay television of matches from the "UEFA Champions League" and "UEFA Europa League" competitions in the Spanish residential market for three seasons (2018-2021). These matches can be offered in thematic channels of Telefónica for sale to private or residential clients. The license granted to Telefónica has been given on an exclusive basis with the exception of certain matches from the "UEFA Europa League" that Mediapro has reserved for its broadcast on free-to-air television along with highlight programs of both competitions. The price agreed per season amounts to 360 million euros. Pursuant to this agreement, Telefónica may sublicense its rights to other operators interested in this content. The agreement signed with Mediapro also stipulates the revenue share of advertising incomes related to the new channel or channels that Telefónica intends to launch.
•
On July 27, 2018, Telefónica transferred to a subsidiary of the Pontegadea Group 16.65% of the share capital of Telefónica's subsidiary Pontel Participaciones, S.L. ("
Pontel
"), which owns 60% of the share capital of Telxius Telecom, S.A. ("
Telxius
"), for an amount of 378.8 million euros. This participation of 16.65% in the capital stock of Pontel is equivalent, in economic terms, to an indirect participation of 9.99% in the share capital of Telxius.
•
On September 11, 2018, Telefónica Emisiones, S.A.U. issued notes guaranteed by Telefónica in an aggregate principal amount of 1,000 million euros. These notes mature on September 11, 2025, carry an annual coupon of 1.495% and were issued at par (100%).
•
On November 8, 2018, Telefónica reached an agreement with Grupo Catalana Occidente for the sale of 100% of Antares, its insurance company in Spain, for a total amount of 161 million euros. Antares offers health, life, accident and life savings insurance to more than 200,000 insured individuals in Spain. The transaction is expected to generate capital gains of around 90 million euros for Telefónica and a reduction in net financial debt of close to 30 million euros.
32
Business areas
On January 31, 2018, the Board of Directors of Telefónica resolved to adopt a new organizational structure in order to make the Group more agile, simple and focused on management, customer service, growth, efficiency and profitability.
The previous organizational structure, which was approved by the Board of Directors of Telefónica, S.A. on February 26, 2014 was made up of the following segments: Telefónica Spain, Telefónica United Kingdom, Telefónica Germany, Telefónica Brazil and Telefónica Hispanoamérica (formed by the Group’s operators in Argentina, Chile, Peru, Colombia, Mexico, Venezuela, Central America, Ecuador and Uruguay).
Following the Board of Directors' resolution on January 31, 2018,
Telefónica Hispanoamérica was split into two new segments in order to more effectively manage the different market situations: Telefónica Hispam Norte, encompassing the operations in Colombia, Mexico, Central America, Ecuador and Venezuela, and Telefónica Hispam Sur, encompassing operations in Argentina, Chile, Peru and Uruguay.
Due to the implementation of the new organizational structure referred to above, the comparative results of the segments of the Group for 2017 and 2016 and the comparative segmentation of assets, liabilities and investments accounted for by the equity method as of December 31, 2017 have been restated to reflect this new organization. These changes in the segments have had no impact on the consolidated results of the Group.
Restated numbers are identified as "revised data" in the tables included in this Annual Report.
The segments referred to above include the information related to the fixed, wireless, cable, data, Internet and television businesses and other digital services provided in each country.
Information relating to other Group companies not specifically included in these segments (see the section "Other companies" of Appendix I
of the Consolidated Financial Statements)
is reported under "Other companies and eliminations", which includes Telxius, holding companies, companies whose main purpose is to provide cross-sectional services to Group companies and other companies
.
Telxius' results are fully reported under "Other companies and eliminations" since January 1, 2017, reflecting the integration within Telxius of the mobile telecommunications towers transferred from the Telefónica Spain, Telefónica Germany, Telefónica Brazil and the old Telefónica Hispanoamérica segments and the international submarine fiber optic cable (which had already been previously reported under "Other companies and eliminations"). The 2016 comparative segment results have been revised accordingly in Telefónica's consolidated financial statements for the year ended December 31, 2017. Based on the different dates on which assets were contributed to Telxius by each operating segment, this affected the results of Telefónica Spain (since January 1, 2016), Telefónica Germany (since May 1, 2016), Telefónica Brazil (since April 1, 2016) and the old Telefónica Hispanoamérica segment (Telefónica Peru since April 1, 2016 and Telefónica Chile since May 1, 2016, both of which are currently part of Telefónica Hispam Sur). The results of the segments do not include the intra-group capital gains resulting from the transfer of towers to Telxius.
In addition, from 2017 Telefónica Spain includes the companies Telefónica Studios and Telefónica Servicios Audiovisuales (which were previously reported under “Other companies and eliminations”), and Telefónica Spain and Telefónica Hispanoamérica include the results of the data center business in Spain and Chile, respectively (which were previously reported under “Other companies and eliminations”). As a consequence, the 2016 comparative segment results have been revised accordingly in Telefónica's consolidated financial statements for the year ended December 31, 2017.
The Group centrally manages borrowing activities, mainly through Telefónica, S.A. and other companies included in "Other companies" (see Note 17, Appendix III and Appendix V
of the Consolidated Financial Statements
), so most of the Group's financial assets and liabilities are reported under "Other companies and eliminations". In addition, Telefónica, S.A. is the head of the Telefónica tax group in Spain
(see Note
22
to the Consolidated Financial Statements).
Therefore, a significant part of the deferred tax assets and liabilities is included under “Other companies and eliminations”. For these reasons, the results of the segments are disclosed up to operating income.
Revenue and expenses arising from intra-group invoicing for the use of the trademark and management services were eliminated from the operating results of each Group segment. These adjustments had no impact on the Group’s consolidated results. In addition, segment reporting considers the impact of the purchase price allocation to the assets acquired and the liabilities assumed by the companies included in each segment. The assets and liabilities presented in each segment are those managed by the heads of each segment, regardless of their legal structure.
33
The following chart shows the organizational structure of the principal subsidiaries of the Telefónica Group at December 31, 2018, including their jurisdictions of incorporation and our ownership interest. For further detail, see Exhibit 8.1 to this Annual Report.
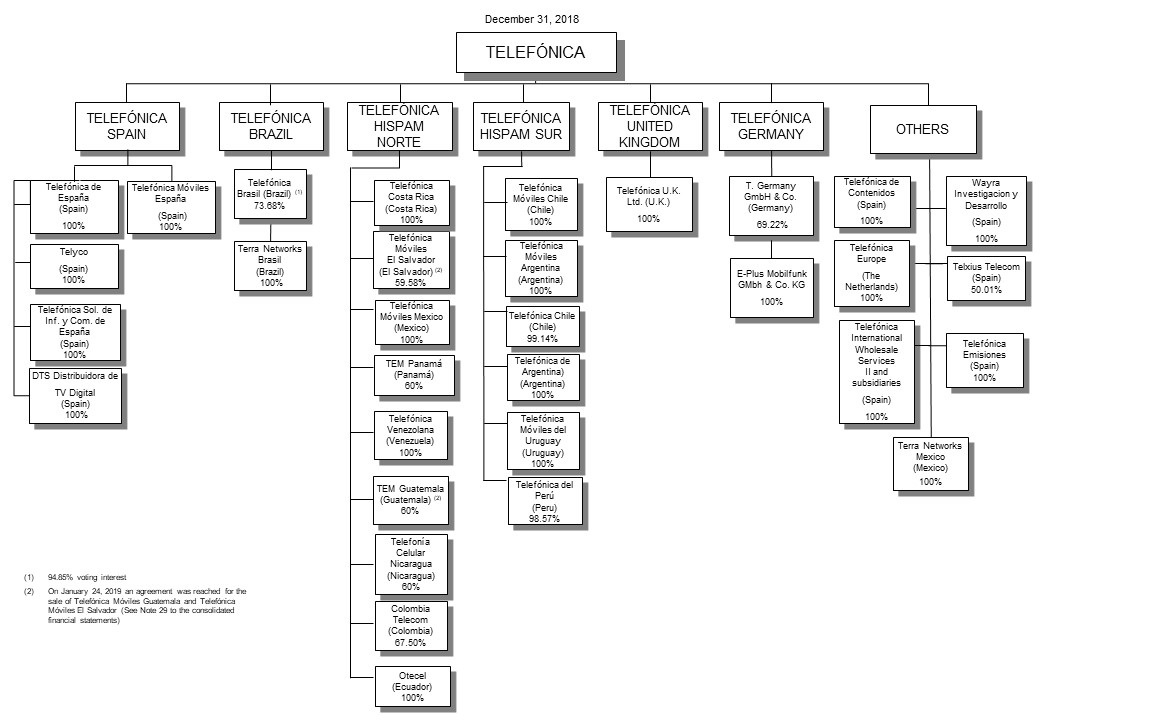
34
Telefónica, S.A., the parent company of the Telefónica Group, operates as a holding company with the following objectives:
|
•
|
coordinate the Group’s activities;
|
|
•
|
allocate resources efficiently among the Group;
|
|
•
|
provide managerial guidelines for the Group;
|
|
•
|
manage the Group’s portfolio of businesses;
|
|
•
|
foster cohesion within the Group; and
|
|
•
|
foster synergies among the Group’s subsidiaries.
|
Our principal executive offices are located at Distrito Telefónica, Ronda de la Comunicación, s/n, 28050 Madrid, Spain, and our registered offices are located at Gran Vía, 28, 28013 Madrid, Spain. Our telephone number is +34 900 111 004.
Capital Expenditures
Our principal capital expenditures during the three years ended December 31, 2018, consisted of additions to property, plant and equipment and additions to intangible assets, including spectrum. In 2018, 2017 and 2016, we made capital expenditures of
8,119 million
euros, 8,697 million euros and 8,928 million euros, respectively.
Year ended December 31, 2018
Capital expenditures in 2018 decreased
6.6%
compared to 2017. Capital expenditures in 2018 included the cost of spectrum mainly in United Kingdom, Mexico, Spain and Argentina, amounting to 868 million euros.
Investment by Telefónica Spain amounted to
1,719 million
euros and was primarily focused on rapid fiber optic rollout, exceeding 21 million premises passed by year-end 2018, investments in LTE network, with a 96% population coverage, and transport network transformation. Investment by Telefónica United Kingdom in 2018 amounted to
1,464 million
euros and was mainly focused on enhancing the LTE navigation experience, achieving 99% population coverage by year-end 2018, and also pursuing the improvement of network capacity and quality of customer experience. Investment by Telefónica Germany in 2018 amounted to
966 million
euros and was focused on extension of LTE coverage, achieving a population coverage of 88% by year-end 2018. Investment by Telefónica Brazil in 2018 amounted to
1,910 million
euros and was mainly dedicated to extend the coverage and capacity of LTE mobile networks, the deployment and connection of fiber network in the fixed business as well as network integration and simplification of processes and systems. Investment by Telefónica Hispam Norte in 2018 amounted to
668 million
euros and was mainly focused on improving the coverage and capacity of LTE networks and ultra-broadband fixed capabilities (fiber / HFC) in Colombia and processes and systems simplification and digitalization in the region. Investment by Telefónica Hispam Sur in 2018 amounted to
1,116 million
euros and was mainly focused on improving the coverage and capacity of LTE networks and ultra-broadband fixed capabilities (fiber / HFC).
Year ended December 31, 2017
Capital expenditures in 2017 decreased 2.6% compared to 2016. Capital expenditures in 2017 included the cost of spectrum mainly in Colombia, Uruguay and Costa Rica, amounting to 538 million euros.
Investment by Telefónica Spain amounted to 1,683 million euros and was primarily focused on rapid fiber optic rollout, exceeding 19 million premises passed by year-end 2017, together with investments in the LTE network, with a 97% population coverage, and transport network modernization. Investment by Telefónica United Kingdom in 2017 amounted to 827 million euros and was mainly focused on increasing LTE coverage, achieving 99% population coverage by year-end 2017, and also pursuing the improvement of network capacity and quality of customer experience. Investment by Telefónica Germany in 2017 amounted to 951 million euros and was focused on network integration in order to enhance customer experience and to capture integration synergies and further LTE network rollout achieving a population coverage of 82% by year-end 2017. Investment by Telefónica Brazil in 2017 amounted to 2,225 million euros and was mainly dedicated to extend the coverage and capacity of 4G and 3G mobile networks, the deployment and connection of fiber network in the fixed business as well as network integration and simplification of processes and systems. Investment by Telefónica Hispam Norte in 2017 amounted to 1,264 million euros and was mainly focused
35
on the coverage and capacity of 4G and 3G networks and the simplification and digitalization of processes and systems. Investment by Telefónica Hispam Sur in 2017 amounted to 1,414 million euros and was mainly focused on improving the rollout of ultra-broadband fixed capabilities (fiber / HFC), the coverage and capacity of 4G and 3G networks, and the simplification and digitalization of processes and systems.
Year ended December 31, 2016
Capital expenditures in 2016 decreased 14.7% compared to 2015. Capital expenditures in 2016 included the cost of spectrum mainly in Peru and Brazil, amounting to 345 million euros.
Investment by Telefónica Spain amounted to 1,852 million euros and was primarily focused on rapid fiber optic rollout, together with investments in the LTE network, reaching a 96% population coverage, and transport network modernization. Investment by Telefónica United Kingdom in 2016 amounted to 931 million euros and was mainly focused on increasing LTE coverage, achieving 95% population coverage by year-end 2016 and also, pursuing the improvement of network capacity. Investment by Telefónica Germany in 2016 amounted to 1,107 million euros, with LTE rollout being the company's main focus, achieving a coverage of 79% by year-end 2016, and network consolidation activities, aimed at allowing to enhance customer experience and to capture integration synergies. Investment by Telefónica Brazil in 2016 amounted to 2,137 million euros and was mainly dedicated to extend the coverage and capacity of 4G and 3G mobile networks, as well as improving network quality, and the deployment and connection of fiber network in the fixed business. Investment by Telefónica Hispam Norte in 2016 amounted to 878 million euros and was mainly focused on improving the coverage and capacity of 3G and the digitalization of processes and systems. Investment by Telefónica Hispam Sur in 2016 amounted to 1,737 million euros and was mainly focused on the coverage and capacity of 4G and 3G networks, the rollout of ultra-broadband fixed capabilities (fiber / HFC) and the quality enhancement in broadband and TV services.
Financial Investments and Divestitures
There were no significant financial investments in 2018. Our principal financial divestitures in 2018 were: (i) the transfer to a subsidiary of the Pontegadea Group of 16.65% of the share capital of Pontel (which owns 60% of Telxius), equivalent to a 9.99% economic interest in the share capital of Telxius, for an amount of 378.8 million euros; (ii) the agreement of sale entered into with Grupo Catalana Occidente for 100% in the share capital of Antares for a total amount of 161 million euros.
Our principal financial investments in 2017 were: (i) the swap agreement with KPN pursuant to which we agreed to deliver 72.0 million Telefónica shares held in treasury in exchange for 178.5 million shares in our subsidiary Telefónica Deutschland held by KPN, representing 6.0% of the share capital of Telefónica Deutschland, and (ii) our pro-rata participation in the two capital increases completed by ColTel in 2017. Our principal financial divesture in 2017 was the sale of 40% of the share capital of Telxius for 1,275 million euros to KKR. Telefónica retained control over Telxius. We also divested Telefónica treasury shares as a result of the swap agreement referred to above.
There were no significant financial investments in 2016. Our principal financial divesture in 2016 was the sale of Telefé, which was completed on November 11, 2016, for 345 million U.S. dollars (approximately 322 million euros) and the sale on July 10, 2016 of 361,794,559 shares of China Unicom (Hong Kong) Limited (“China Unicom”), representing 1.51% of the share capital of the company, at a price of 7.80 Hong Kong dollars per share for a total amount of 2,822 million Hong Kong dollars, approximately 322 million euros.
Active portfolio management is part of Telefónica’s strategy and therefore it may undertake transactions involving its or its subsidiaries' shares, including transactions similar to those undertaken in the 2016-2018 period or otherwise, at any time. See "—Recent Developments" below for information on certain divestitures undertaken in 2019.
Public Takeover Offers
Not applicable.
Recent Developments
The principal events that have occurred since December 31, 2018, are set forth below:
|
•
|
On
January 23, 2019
, Telefónica announced that Telefónica UK Limited had agreed non-binding heads of terms with Vodafone Limited to strengthen their existing network sharing partnership in the United Kingdom. The parties plan to extend the term of their existing network sharing partnership and include 5G capacity at joint radio network sites, and to upgrade transmission networks to support 5G technology. They also intend
|
36
to devolve more activities to their joint venture company, Cornerstone Telecommunications Infrastructure Limited (CTIL), which manages passive tower infrastructure
.
|
•
|
On January 23, 2019, Telefónica announced that it was notified of a resolution issued by the Spanish Central Economic-Administrative Tax Court (Tribunal Económico-Administrativo Central) partially upholding the claims filed against the assessments relating to the 2008-2011 Corporate Income Tax Audit. Final execution on this resolution will most likely lead to a tax refund related to overpayments made by the company in those tax years. This resolution is not final. At this point in time, it is not possible to quantify the exact amount of the expected refunds since, as pointed out by the Central Economic-Administrative Court’s resolution, the final amount shall only be settled once the resolution is duly executed by the Spanish Tax Authorities.
|
|
•
|
On
January 24, 2019
, Telefonica Centroamérica Inversiones, S.L. (
60%
of which is owned, directly and indirectly, by Telefonica and
40%
of which is owned by Corporación Multi Inversiones), reached an agreement with América Móvil, S.A.B. of C.V. for the sale of the entire share capital of Telefónica Móviles Guatemala, S.A. and
99.3%
of Telefónica Móviles El Salvador, S.A. de C.V. The closing of the Telefónica El Salvador sale is subject to applicable regulatory conditions while the sale of Telefónica Móviles Guatemala was completed on such date.
|
The aggregate consideration for both companies (enterprise value) is
648
million US dollars (approximately
570
million euros at the exchange rate on the date of the agreement,
293
million of which correspond to Telefónica Móviles Guatemala and
277
million of which correspond to Telefónica Móviles El Salvador).
|
•
|
On
February 5, 2019
, Telefónica Emisiones, S.A.U. issued under its
Guaranteed Euro Program for the Issuance of Debt Instruments
("EMTN Program") notes in the Euro market guaranteed by Telefónica, S.A., amounting to
1,000
million euros. These notes are due on
February 5, 2024
, pay an annual coupon of
1.069%
and were issued at par (
100%
). The net proceeds of the notes are to be allocated towards projects aiming to improve energy efficiency in the network transformation from copper to fiber optic in Spain.
|
|
•
|
On February 8, 2019, Telefónica announced that, within the framework of its portfolio management policy, based on a strategy of value creation and strategic positioning, it is studying the potential sale of some of its Data Centers, which may result in one or several transactions, related to either all or some of those assets.
|
|
•
|
On February 14, 2019, once the pertinent regulatory approvals were obtained, Telefónica transferred to Grupo Catalana Occidente
100%
of Antares’ share capital for a total amount of
161
million euros. On the closing of the sale, Telefónica and Grupo Catalana Occidente executed an agreement pursuant to which Grupo Catalana Occidente will continue to manage the insurance policies of the Telefónica Group on an exclusive basis for the next
10
years.
|
|
•
|
On February 20, 2019, Telefónica reached an agreement with Millicom International Cellular, S.A. for the sale of the entire share capital of Telefónica de Costa Rica TC, S.A., and for the sale by Telefónica's subsidiary Telefonica Centroamérica Inversiones, S.L. (60% of which is owned, directly and indirectly, by Telefónica and 40% of which is owned by Corporación Multi Inversiones) of the entire share capital of Telefónica Móviles Panamá, S.A. and Telefónica Celular de Nicaragua, S.A. The closing of the sale of these three companies is subject to the applicable regulatory conditions and will take place for each transaction once those conditions are satisfied.
|
The aggregate amount of the transaction (enterprise value) for the three companies is 1,650 million dollars (approximately 1,455 million euros at the current exchange rate, 503 million of which correspond to Telefónica Costa Rica, 573 million to Telefónica Panama and 379 million to Telefónica Nicaragua).
For more information related to our significant financing transactions in 2019, see “Item 5. Operating and Financial Review and Prospects—Liquidity and Capital Resources—Anticipated Sources of Liquidity”.
Public Information
The SEC maintains an Internet site (www.sec.gov) that contains reports and other information regarding issuers that file electronically with the SEC, including Telefónica. See "Item 10. Additional Information—Documents on Display". Additional information on the Group is also available on our website at www.telefonica.com. The information contained on such websites does not form part of this Annual Report on Form 20-F.
37
B. Business Overview
Telefónica is one of the world’s leading communications service providers. Our objective is to create, protect and promote fixed and mobile connections for our customers helping them to take control over their digital lifestyle. Therefore, we primarily offer our customers the connectivity they need to interact and live in the markets where we operate through simple products and services while protecting their data and managing it in a responsible way. We rely on modern technology to create a better and more inclusive society. We aim at offering our customers the possibility to reach the digital world regardless of their location, economical status, level of digital knowledge and capacities.
The organizational structure approved by the Board of Directors of Telefónica, S.A. on January 31, 2018 is made up of the following segments: Telefónica Spain, Telefónica United Kingdom, Telefónica Germany, Telefónica Brazil, Telefónica Hispam Norte (formed by the Group’s operators in Colombia, Mexico, Venezuela, Central America and Ecuador) and Telefónica Hispam Sur (formed by the Group’s operators in Argentina, Chile, Peru and Uruguay). These segments include the information related to the fixed, wireless, cable, data, Internet and television businesses and other digital services provided in each country. Information relating to other Group companies not specifically included in these segments is reported under “Other companies and eliminations”. Telxius' results are fully reported under "Other companies and eliminations" since January 1, 2017, reflecting the integration within Telxius of the mobile telecommunications towers transferred from Telefónica Spain, Telefónica Germany, Telefónica Brazil and Telefónica Hispam Sur (Telefónica Peru and Telefónica Chile) segments and the international submarine fiber optic cable (which had already been previously reported under "Other companies and eliminations").
The Telefónica Group’s strategy aims to:
Enhance value through:
|
•
|
Offering good connectivity, for which our infrastructure management and our continuous investment in network and platforms are key.
|
|
•
|
Good connectivity is the enabler for all digital services. Telefónica provides a wide range of services over connectivity through a fixed and mobile bundled offer which includes video and digital services. We offer our customers additional data in order to amplify services through unique, simple and clear offers.
|
With the following enablers:
|
•
|
End-to-end digitalization: seeking the reduction of our legacy investments to increase virtualization, the reduction of physical servers, data centers and applications, the digitalization of IT systems and processes and the digitalization of front and back office, in order to be able to offer a true digital experience to our customers.
|
|
•
|
Big data and innovation to add value to our customers and return the control over data to our customers.
|
|
•
|
Continued focus on capital allocation in our legacy investments and the simplification of processes in order to continue investing.
|
|
•
|
Digital trust: as we manage ever more personal information about our customers, their trust in us is key. Telefónica seeks a relationship of trust with its customers, and therefore we invest in network security. Telefónica is developing tools to protect information in end user devices and communications, fixed and mobile, networks, as well as to protect customers' digital identity.
|
38
2018
highlights
2018 was characterized by positive growth in OIBDA Margin and operating cash flow (OIBDA-CapEx excluding acquisitions of spectrum), up by 0.9 percentage points and by 3.6% respectively year-on-year in reported terms. Furthermore, the Company continued its transformation process with 50.5 million premises passed ready to use FTTx. Additionally, the LTE coverage reached 76.0% as of December 31, 2018 (+3.6 percentage points year-on-year). The capex over revenues ratio reached 16.7%. The Company closed the year with a total of 356.2 million accesses (down 0.5% year-on-year), mainly as a result of the decrease in prepay and fixed voice. In line with our strategic focus to grow in high-value customers, post-pay customers grew by 6.8% year-on-year, reaching 123.8 million customers, while UBB customers reached 13.2 million customers at December 31, 2018, representing a 20.5% increase year-on-year.
In 2018,
revenues
totaled 48,693 million euros, down 6.4% compared to 2017 in reported terms (+2.4% in organic terms).
OIBDA
totaled 15,571 million euros in 2018, down 3.8% in reported terms as compared to 2017. In organic terms, OIBDA was up 3.5%, mainly due to the positive evolution in Telefónica Brazil, Telefónica United Kingdom and Telefónica Hispam Sur, which offset the lower OIBDA in Telefónica Spain, Telefónica Hispam Norte and Telefónica Germany. In 2018, operating income was 6,522 million euros, down by 4.0% as compared to 2017 in reported terms (+6.3% in organic terms), which included depreciation and amortization of 9,049 million euros, down by 3.7% as compared to 2017 in reported terms.
See “—2018/2017 Consolidated results—Adjustments made to calculate organic variations” for an explanation on how organic variations are calculated.
Telefónica’s total accesses reached 356.2 million as of December 31, 2018, decreasing by 0.5% year-on-year, mainly as a result of the reduction of the prepay base in Telefónica Brazil (-14.2% year-on-year) and Telefónica Hispam Sur (-7.5% year-on-year) due to the strong market competition and, to a lesser extent, in Telefónica Germany (-6.1% year-on-year), as a result of the adoption of the requirement that identification be provided by customers for pre-paid SIM cards since July 2017. During 2018, the relative weight of high value services continued to increase, as reflected in the sustained growth of post-pay (smartphones and LTE), fiber and Pay TV accesses.
The below table shows the evolution of accesses over the past two years as of December 31 of such years:
|
ACCESSES
|
|
|||||
|
Thousands of accesses
|
2017
|
|
2018
|
|
%Reported
YoY |
|
|
Fixed telephony accesses (1)
|
36,898.6
|
|
34,941.4
|
|
(5.3
|
%)
|
|
Internet and data accesses (2)
|
21,864.6
|
|
22,087.5
|
|
1.0
|
%
|
|
Broadband (3)
|
21,417.5
|
|
21,645.2
|
|
1.1
|
%
|
|
FTTx/Cable
|
10,961.6
|
|
13,213.1
|
|
20.5
|
%
|
|
Mobile accesses
|
271,766.9
|
|
270,814.9
|
|
(0.4
|
%)
|
|
Prepay
|
155,868.5
|
|
147,062.0
|
|
(5.6
|
%)
|
|
Contract
|
115,898.4
|
|
123,752.9
|
|
6.8
|
%
|
|
M2M
|
16,137.2
|
|
19,483.0
|
|
20.7
|
%
|
|
Pay TV
|
8,467.7
|
|
8,875.4
|
|
4.8
|
%
|
|
Final Clients Accesses
|
338,997.9
|
|
336,719.3
|
|
(0.7
|
%)
|
|
Wholesale Accesses
|
19,124.9
|
|
19,520.0
|
|
2.1
|
%
|
|
Fixed wholesale accesses
|
4,460.2
|
|
3,951.5
|
|
(11.4
|
%)
|
|
Mobile wholesale accesses (4)
|
14,664.7
|
|
15,568.5
|
|
6.2
|
%
|
|
Total Accesses
|
358,122.8
|
|
356,239.4
|
|
(0.5
|
%)
|
(1) Includes "fixed wireless" and Voice over IP accesses.
(2) Also referred to as fixed broadband accesses.
(3) Includes DSL, satellite, optic fiber, cable modem and broadband circuits.
(4) Mobile wholesale accesses information has been included in total accesses since the first quarter 2018. 2017 figures have been revised accordingly for comparative purposes
.
39
The below table shows the evolution of accesses by segment:
|
|
YoY variation
|
% Over Total Accesses
|
|
|
Accesses 2018
|
2017
|
2018
|
|
|
Telefónica Spain
|
1.4%
|
11.4%
|
11.7%
|
|
Telefónica United Kingdom
|
1.5%
|
9.1%
|
9.3%
|
|
Telefónica Germany
|
(1.1%)
|
13.3%
|
13.2%
|
|
Telefónica Brazil
|
(2.7%)
|
27.3%
|
26.8%
|
|
Telefónica Hispam Norte
|
1.4%
|
20.3%
|
20.6%
|
|
Telefónica Hispam Sur
|
(2.6%)
|
16.3%
|
16.0%
|
|
Other companies
|
8.8%
|
2.3%
|
2.5%
|
Mobile accesses
totaled 270.8 million at December 31, 2018, down 0.4% compared to December 31, 2017. Lower prepay accesses (-5.6% year-on-year) more than offset the increase in mobile contract accesses, which grew by 6.8% year-on-year and continued increasing their weight over total mobile accesses reaching 45.7% (+3.1 percentage points year-on-year).
Smartphone accesses
grew by 5.7% year-on-year, totaling 167.7 million accesses and representing 67.5% of total mobile accesses (+4.5 percentage points year-on-year), reflecting the Company’s strategic focus on its data services growth.
Fixed broadband accesses
stood at 21.6 million at December 31, 2018, up 1.1% year-on-year. Fiber accesses stood at 13.2 million at December 31, 2018 compared to 11.0 million in 2017, growing 20.5% year-on-year.
Pay TV accesses
totaled 8.9 million at December 31, 2018, growing 4.8% year-on-year, due to the growth in Telefónica Spain (6.3% year-on-year) and Telefónica Peru (+11.8% year-on-year).
The table below shows the evolution of our estimated access market share for mobile and fixed broadband for the past two years.
|
Competitive Position Evolution
|
|
|
|
|
Mobile Market Share (1)
|
|
|
Telefónica
|
2017
|
2018
|
|
Spain
|
29.3%
|
29.7%
|
|
United Kingdom
|
26.3%
|
26.3%
|
|
Germany
|
36.9%
|
36.7%
|
|
Brazil
|
31.7%
|
31.9%
|
|
Argentina
|
32.8%
|
31.4%
|
|
Chile
|
32.2%
|
29.7%
|
|
Peru
|
36.8%
|
34.6%
|
|
Colombia
|
24.4%
|
24.6%
|
|
Venezuela
|
39.1%
|
40.9%
|
|
Mexico
|
22.0%
|
21.6%
|
|
Central America
|
28.4%
|
26.7%
|
|
Ecuador
|
30.0%
|
29.8%
|
|
Uruguay
|
34.2%
|
35.9%
|
(1) Internal estimates in both years.
40
|
|
FBB Market Share (1)
|
|
|
Telefónica
|
2017
|
2018
|
|
Spain
|
40.6%
|
40.4%
|
|
Brazil
|
26.5%
|
24.4%
|
|
Argentina
|
24.1%
|
22.0%
|
|
Chile
|
34.6%
|
32.9%
|
|
Peru
|
73.9%
|
71.6%
|
|
Colombia
|
15.3%
|
18.2%
|
(1) Internal estimates in both years.
41
2018/2017 Consolidated results
In this section, we discuss changes in the Group’s consolidated income statements for the years ended December 31, 2018 and 2017. Changes in the Group’s consolidated income statements for the years ended December 31, 2017 and 2016 are discussed in a separate section further below.
|
|
Year ended December 31
|
Variation
|
||||||||||
|
Consolidated Results
|
2017
|
2018
|
2018 vs 2017
|
|||||||||
|
Millions of euros
|
Total
|
% of revenues
|
Total
|
% of
revenues
|
Total
|
%
|
||||||
|
Revenues
|
52,008
|
|
100.0
|
%
|
48,693
|
|
100.0
|
%
|
(3,315
|
)
|
(6.4
|
%)
|
|
Other income
|
1,489
|
|
2.9
|
%
|
1,622
|
|
3.3
|
%
|
133
|
|
8.9
|
%
|
|
Supplies
|
(15,022
|
)
|
(28.9
|
%)
|
(14,013
|
)
|
(28.8
|
%)
|
1,009
|
|
(6.7
|
%)
|
|
Personnel expenses
|
(6,862
|
)
|
(13.2
|
%)
|
(6,332
|
)
|
(13.0
|
%)
|
530
|
|
(7.7
|
%)
|
|
Other expenses
|
(15,426
|
)
|
(29.7
|
%)
|
(14,399
|
)
|
(29.6
|
%)
|
1,027
|
|
(6.7
|
%)
|
|
OPERATING INCOME BEFORE DEPRECIATION AND AMORTIZATION (OIBDA)
|
16,187
|
|
31.1
|
%
|
15,571
|
|
32.0
|
%
|
(616
|
)
|
(3.8
|
%)
|
|
OIBDA Margin
|
31.1 %
|
|
32.0 %
|
|
0.9 p.p.
|
|
||||||
|
Depreciation and amortization
|
(9,396
|
)
|
(18.1
|
%)
|
(9,049
|
)
|
(18.6
|
%)
|
347
|
|
(3.7
|
%)
|
|
OPERATING INCOME
|
6,791
|
|
13.1
|
%
|
6,522
|
|
13.4
|
%
|
(269
|
)
|
(4.0
|
%)
|
|
Share of (loss) income of investments accounted for by the equity method
|
5
|
|
0.0
|
%
|
4
|
|
0.0
|
%
|
(1
|
)
|
(10.4
|
%)
|
|
Net financial expense
|
(2,199
|
)
|
(4.2
|
%)
|
(955
|
)
|
(2.0
|
%)
|
1,244
|
|
(56.6
|
%)
|
|
PROFIT BEFORE TAX
|
4,597
|
|
8.8
|
%
|
5,571
|
|
11.4
|
%
|
974
|
|
21.2
|
%
|
|
Corporate income tax
|
(1,219
|
)
|
(2.3
|
%)
|
(1,621
|
)
|
(3.3
|
%)
|
(402
|
)
|
33.0
|
%
|
|
PROFIT FOR THE YEAR
|
3,378
|
|
6.5
|
%
|
3,950
|
|
8.1
|
%
|
572
|
|
17.0
|
%
|
|
Attributable to equity holders of the Parent
|
3,132
|
|
6.0
|
%
|
3,331
|
|
6.8
|
%
|
199
|
|
6.4
|
%
|
|
Attributable to non-controlling interests
|
246
|
|
0.5
|
%
|
619
|
|
1.3
|
%
|
373
|
|
n.m.
|
|
n.m.: not meaningful
Adjustments made to calculate organic variations
Year-on-year percentage changes referred to in this document as “organic” or presented in “organic terms” intend to present year-on-year variations on a comparable basis, by considering a constant perimeter of consolidation and constant average foreign exchange rates and by making certain other adjustments which are described herein. “Organic" variations should not be viewed in isolation or as an alternative to reported variations.
For purposes of this report, 2018/2017 “organic” variation is defined as the reported variation as adjusted to exclude the impacts detailed below:
|
•
|
Foreign exchange effects and hyperinflation adjustments in Argentina:
we have excluded the impact of changes in exchange rates by assuming constant average foreign exchange rates year-on-year (using average foreign exchange rates of 2017 for both years), except for Venezuela (in respect of which 2017 and 2018 results were converted at the closing synthetic exchange rate for each period).
|
Foreign exchange rates had a negative impact on our reported 2018 results, mainly due to the depreciation versus the euro of various Latin American currencies (in particular the Brazilian real and the Argentine peso).
The impact of hyperinflation adjustments in Argentina has been excluded by reversing such adjustments.
Foreign exchange effects and hyperinflation in Argentina decreased revenue growth by 8.8 percentage points and OIBDA growth by 10.3 percentage points in 2018 as compared with 2017.
|
•
|
Changes in the scope of consolidation:
we have excluded the impact of changes in our consolidation perimeter in 2018 and 2017. The main changes in our consolidation perimeter in such years related to the
|
42
inclusion of the Colombian companies Telebucaramanga, Metrotel and Optecom in our consolidation perimeter since October 2017. No significant changes took place in the scope of consolidation of the Group in 2018.
To exclude the impact of the mentioned perimeter changes in the calculation of organic variations, the 2017 comparative figures include the results of Telebucaramanga, Metrotel and Optecom for the whole year.
|
•
|
Restructuring costs:
we have excluded the impact in 2018 and 2017 of restructuring costs, mainly those related to the first Collective Agreement of Related Companies in Spain (Individual Suspension Plan), restructuring processes relating to Telefónica Germany, Telefónica Brazil, Telefónica Hispam Norte and Telefónica Hispam Sur, and the Group’s simplification program in global areas.
|
The distribution by segment of the restructuring costs, in terms of their impact on OIBDA, is as follows:
|
Millions of euros
|
2017
|
|
2018
|
|
|
Telefónica Spain
|
165
|
|
297
|
|
|
Telefónica Brazil
|
—
|
|
46
|
|
|
Telefónica Germany
|
82
|
|
84
|
|
|
Telefónica Hispam Norte
|
24
|
|
18
|
|
|
Telefónica Hispam Sur
|
79
|
|
50
|
|
|
Other companies
|
(10
|
)
|
(34
|
)
|
|
Total restructuring costs
|
340
|
|
461
|
|
|
•
|
Results of tower sales:
the results attributable to the sale of towers in 2018 and 2017 have been excluded.
|
In 2018, the impact on OIBDA from the sale of towers totaled 51 million euros, which was related mainly to Telefónica Hispam Norte.
In 2017, the impact on OIBDA from the sale of towers totaled 7 million euros and the sales were also related mainly to Telefónica Hispam Norte.
|
•
|
Spectrum acquisition:
we have excluded from Capex the impact of spectrum acquisitions in 2018 and 2017.
|
In 2018, these acquisitions totaled 868 million euros, 588 million euros corresponding to Telefónica United Kingdom, 135 million euros corresponding to Telefónica México, 122 million euros corresponding to Telefónica Spain, 21 million euros corresponding to Telefónica Hispam Sur and 2 million euros corresponding to Telefónica Brazil.
In 2017, these acquisitions totaled 538 million euros, 470 million euros corresponding to Telefónica Colombia, 4 million euros corresponding to Telefónica México, 36 million euros corresponding to Telefónica Central America (21 million euros in Costa Rica and 15 million euros in El Salvador), 27 million euros corresponding to Telefónica Uruguay and 1 million euros corresponding to Telefónica Germany.
|
•
|
Gains or losses on the sale of companies:
the gains obtained or losses incurred from the sale of companies have been excluded from calculations of organic variations.
|
In 2018, the 21 million euros in profit obtained from the sale of Telefónica Digital Ltd. and the loss of 3 million euros incurred in the sale of Centro de Asistencia Telefónica, S.A. have been excluded. In 2017 no results have been recorded related to sales of companies.
|
•
|
Impairment of goodwill:
the impairment losses on goodwill are excluded from calculations of organic variations.
|
In 2018, the impairment of the goodwill allocated to Telefónica Móviles México, amounting to 350 million euros has been excluded. In 2017, no goodwill impairments were recorded.
|
•
|
Judicial decision related to the exclusion of ICMS from the tax basis of PIS/COFINS:
the organic variations exclude the positive impact of the judicial decisions of the Brazilian Supreme Court recognizing
|
43
the right to deduct the state tax on goods and services (ICMS) from the calculation of the basis of the Social Integration Program-PIS (Programa de Integração Social) and the Financing of Social Security-COFINS (Contribuição para Financiamento da Seguridade Social). Telefônica Brasil has presented the tax authorities a refund request for the payments of PIS/COFINS affected by the decisions, together with the corresponding default interest. The positive impact in 2018 (789 million euros in the OIBDA of Telefónica Brazil) has been excluded from the calculation of organic variations.
|
•
|
IFRS 15 "Revenue from Contracts with Customers" ("IFRS 15") impact:
the organic variations exclude the impact of the adoption of IFRS 15 in 2018, which had a negative impact in revenues amounting to 35 million euros and a positive impact in OIBDA amounting to 76 million euros.
|
|
•
|
Other adjustments:
in 2018, the impact of the provision relating to certain labor and tax contingencies in Telefónica Brazil (amounting to 215 million euros) has been excluded. In 2017, the impact of the provision relating to certain regulatory contingencies in Telefónica Brazil (amounting to 50 million euros) and in other Group companies (amounting to 57 million euros), as well as the provisions recorded in Telefónica Spain to optimize the distribution network (in the amount of 13 million euros) have been excluded. In addition, the positive impact of tariff increases in Telefónica Venezuela in the last quarter of 2017 has been excluded (6 million euros in revenues and 2 million euros in OIBDA).
|
The table below shows 2018/2017 variations in reported and organic terms (the latter, calculated in accordance with the adjustments referred to above) of certain line items of the consolidated income statement and capital expenditures ("CapEx") and OIBDA-CapEx
:
|
|
YoY variation
|
|||
|
TELEFÓNICA 2018
|
% Reported
YoY
|
|
% Organic
YoY
|
|
|
Revenues
|
(6.4
|
%)
|
2.4
|
%
|
|
Other income
|
8.9
|
%
|
11.7
|
%
|
|
Supplies
|
(6.7
|
%)
|
4.7
|
%
|
|
Personnel expenses
|
(7.7
|
%)
|
0.7
|
%
|
|
Other expenses
|
(6.7
|
%)
|
0.7
|
%
|
|
OIBDA
|
(3.8
|
%)
|
3.5
|
%
|
|
Operating income
|
(4.0
|
%)
|
6.3
|
%
|
|
CapEx
|
(6.6
|
%)
|
(1.3
|
%)
|
|
OpCF (OIBDA-CapEx)
|
(0.5
|
%)
|
8.0
|
%
|
The table below shows the contribution to reported growth of each item considered to calculate the organic variations, as explained above. For each line item, the contribution to reported growth, expressed in percentage points, is the result of dividing the amount of each impact (on a net basis when the impact affects both years) by the consolidated reported figure for the previous year.
44
|
|
Contribution to reported growth (percentage points)
|
|||||||||||||||||
|
TELEFÓNICA 2018
|
Exchange rate effect and hyperinflation
|
Perimeter change
|
Restructuring costs
|
|
Towers sales
|
|
Spectrum acquisition
|
|
Capital gains/losses on sale of companies
|
|
Impairments
|
|
Judicial decision PIS/COFINS
|
IFRS 15 impact
|
|
Other adjustments
|
|
|
|
Revenues
|
(8.8)
|
0.1
|
—
|
|
—
|
|
—
|
|
—
|
|
—
|
|
—
|
|
(0.1)
|
|
(0.0)
|
|
|
Other income
|
(7.2)
|
0.2
|
—
|
|
3.2
|
|
—
|
|
1.4
|
|
—
|
|
—
|
|
(0.4)
|
|
—
|
|
|
Supplies
|
(5.8)
|
(0.0)
|
—
|
|
—
|
|
—
|
|
—
|
|
—
|
|
—
|
|
(5.6)
|
|
—
|
|
|
Personnel expenses
|
(10.3)
|
0.1
|
1.6
|
|
—
|
|
—
|
|
—
|
|
—
|
|
—
|
|
(0.0)
|
|
0.2
|
|
|
Other expenses
|
(9.3)
|
0.1
|
0.2
|
|
0.0
|
|
—
|
|
—
|
|
2.3
|
|
(6.1)
|
|
4.7
|
|
0.8
|
|
|
OIBDA
|
(10.3)
|
0.1
|
(0.9)
|
|
0.3
|
|
—
|
|
0.1
|
|
(2.2)
|
|
5.8
|
|
0.5
|
|
(0.9)
|
|
|
Operating income
|
(17.3)
|
(0.0)
|
(2.1)
|
|
0.7
|
|
—
|
|
0.3
|
|
(5.2)
|
|
13.9
|
|
1.1
|
|
(2.0)
|
|
|
CapEx
|
(9.8)
|
0.2
|
—
|
|
—
|
|
4.1
|
|
—
|
|
—
|
|
—
|
|
—
|
|
—
|
|
|
OpCF (OIBDA-CapEx)
|
(10.8)
|
(0.0)
|
(1.9)
|
|
0.6
|
|
(4.8)
|
|
0.2
|
|
(4.7)
|
|
12.6
|
|
1.0
|
|
(1.9)
|
|
Results discussion
Revenues
totaled 48,693 million euros in 2018, decreasing 6.4% as compared to 2017 in reported terms, impacted by the negative evolution in foreign exchange rates and hyperinflation in Argentina (-8.8 percentage points). In organic terms (for additional information on organic variations, see "—Adjustments made to calculate organic variations" above), revenues increased by 2.4% driven by the higher service revenues (+1.0% year-on-year) and the good performance of handset revenues (+18.8% year-on-year). The structure of revenues reflects Telefónica’s business diversification. The segment with the largest contribution to our revenues is Telefónica Spain, representing 26.1% (+1.8 percentage points compared to 2017), followed by Telefónica Brazil representing 20.8% (down 2.3 percentage points compared to 2017), Telefónica Germany representing 15.0% (+1.0 percentage points compared to 2017), Telefónica United Kingdom representing 13.9% (+1.4 percentage points compared to 2017),Telefónica Hispam Sur representing 13.7% (-2.1 percentage points compared to 2017) and Telefónica Hispam Norte representing 8.4% (stable year-on-year).
Mobile business revenues
totaled 30,792 million euros in 2018 (of which 25,684 million euros corresponded to service revenues and 5,108 million euros corresponded to handset revenues), down 6.2% year-on-year in reported terms. This decrease was mainly due to the impact of changes in foreign exchange rates and hyperinflation in Argentina (-9.1 percentage points). The adoption of IFRS 15 had a negative impact of 0.1 percentage points. In organic terms, revenues from the mobile business grew by 3.9% due to higher revenues in Telefónica Hispam Sur, Telefónica Spain, Telefónica United Kingdom and Telefónica Brazil despite the adverse impact of regulatory restrictions in some operators of the group, mainly those related to MTRs.
Mobile service revenues
, which include mobile data revenues, totaled 25,684 million euros in 2018, down 10.4% year-on-year in reported terms mainly due to the impact of changes in foreign exchange rates and hyperinflation in Argentina (which contributed 9.2 percentage points to the decrease) and the adoption of IFRS 15 (which contributed 2.0 percentage points to the decrease). Excluding these impacts, mobile service revenues grew by 1.7% as a result of higher data consumption.
Fixed revenues
totaled 16,734 million euros in 2018, down 8.7% year-on-year in reported terms mainly due to the impact of changes in foreign exchange rates and hyperinflation in Argentina (which contributed 8.6 percentage points to the decrease). Excluding this impact and the impact of the adoption of IFRS 15 (+0.2 percentage points), fixed revenues decreased by 0.8%, affected mainly by the evolution of Telefónica Brazil where the increase in fiber revenues did not fully offset the decrease in revenues in the traditional business.
Other income
totaled 1,622 million euros in 2018, up 8.9% year-on-year in reported terms, and mainly included own work capitalized in our fixed assets, profit from the sale of other assets (in particular, the profit from the sale of Telefónica Digital Ltd amounting to 21 million euros in 2018 and the profit from the sales of towers, which amounted to 51 million euros in 2018, compared to 7 million euros in 2017).
Total expenses,
which include supply costs, personnel costs and other expenses (principally external services and taxes) but do not include amortization and depreciation expenses, were 34,744 million euros in 2018, down 6.9% year-on-year in reported terms. This decrease was mainly attributable to the impact of changes in foreign
45
exchange rates and hyperinflation in Argentina (-8.1 percentage points). In organic terms, total expenses increased by 2.3% due to higher supplies. These costs are explained in greater detail below:
|
•
|
Supplies
amounted to 14,013 million euros in 2018, down 6.7% year-on-year in reported terms mainly as a result of the impact of foreign exchange rates and hyperinflation in Argentina (-5.8 percentage points) and the impact of the adoption of IFRS 15 (-5.6 percentage points). In organic terms, supplies expenses increased by 4.7% year-on-year, mainly due to the intense competition in the European markets, where the Group incurred higher handset costs and the impact of RLaH (Roaming Like at Home) regulation in Europe (which is in effect since June 15, 2017), which resulted in higher traffic. These higher costs more than offset the reduction in interconnection costs in several countries in Latin America.
|
|
•
|
Personnel expenses
amounted to 6,332 million euros in 2018, down 7.7% year-on-year in reported terms mainly as a result of the impact of changes in foreign exchange rates and hyperinflation in Argentina (-10.3 percentage points). In organic terms, personnel costs were in line with 2017 (+0.7% year-on-year), as savings in Telefónica Spain and Telefónica Germany were offset by the increase in personnel expenses in some countries in Latin America as a result of inflation.
|
The
average headcount
was 121,853 employees in 2018, down 2.8% as compared to 2017.
|
•
|
Other expenses
amounted to 14,399 million euros in 2018, down 6.7% year-on-year in reported terms. This decrease was mainly attributable to the impact of foreign exchange rates and hyperinflation in Argentina (-9.3 percentage points) and to the impact of the judicial decision related to the exclusion of ICMS from the tax basis of PIS/COFINS (-6.1 percentage points), offset in part by the increase in expenses resulting from the adoption of IFRS 15, the impairment of goodwill in Telefónica Hispam Norte (relating to Telefónica Móviles México) and higher provisions for labor and tax contingencies in Brazil. In organic terms, other expenses increased by 0.7% year-on-year.
|
OIBDA was 15,571 million euros in 2018, down 3.8% in reported terms, mainly due to the negative impact of foreign exchange rates and hyperinflation in Argentina (-10.3 percentage points), the impairment in 2018 of the goodwill allocated to Telefónica Móviles México amounting to 350 million euros (-2.2 percentage points), the higher restructuring costs incurred in 2018 compared to 2017 (-0.9 percentage points) and certain provisions relating to labor and tax contingencies in Brazil totaling 215 million euros (-0.9 percentage points)
,
which more than offset the positive impact of the judicial decision of the Brazilian Supreme Court that the ICMS should not be included on the tax basis of the PIS/COFINS (+5.8 percentage points) and the increased sale of towers (+0.3 percentage points).
In organic terms, OIBDA grew by 3.5% mainly due to the positive evolution of revenues and the continuous effort to contain costs.
OIBDA margin
stood at 32.0% in 2018, up 0.9 percentage points compared to 2017 in reported terms.
By segments, the main contributors to the Group's OIBDA were: Telefónica Spain with 30.6% (in line with 2017) and Telefónica Brazil with 27.7% (+1.8 percentage points compared to 2017), followed by Telefónica United Kingdom with 12.0% (+1.9 percentage points compared to 2017), Telefónica Germany with 11.8% (+0.5 percentage points compared to 2017), Telefónica Hispam Sur with 11.0% (-3.0 percentage points compared to 2017 due to the evolution in Peru and Argentina), and Telefónica Hispam Norte with 5.1% (-2.7 percentage points compared to 2017).
Depreciation and amortization
amounted to
9,049
million euros in 2018, down
3.7%
year-on-year in reported terms, mainly due to the impact of foreign exchange rates and hyperinflation in Argentina (-5.1 percentage points) and higher amortization in Telefónica Germany and Telefónica Brazil.
Operating income (OI)
in 2018 totaled
6,522
million euros, down
4.0%
in reported terms (up 6.3% in organic terms) as compared to 2017.
The
share of income (loss) of investments accounted for by the equity method
for 2018 was a gain of 4 million euros (compared to a gain of 5 million euros in 2017).
Net financial results
amounted to
955
million euros in 2018,
1,244
million lower than the previous year, mainly due to the non-recurring effect of interests associated with favorable rulings in court in Brazil and, to a lesser extent, savings due to the reduction of the debt and its cost.
46
Corporate income tax
amounted to
1,621
million euros in 2018. Considering a profit before taxes of
5,571
million euros, the effective tax rate stood at
29.1%
, compared to an effective tax rate of
26.5%
in 2017. This increase was mainly the result of the cancellation of tax credits in Mexico in 2018 and the higher proportion of deferred taxes in 2017.
As a result,
profit for the year attributable to equity holders of the parent
for 2018 was
3,331
million euros (
3,132
million euros in 2017).
Profit attributable to non-controlling interest
was
619
million euros,
373
million euros higher than in 2017, mainly due to the increase in the profit attributable to minority interests at Telefónica Brazil, Telefónica Germany, and at Telxius (after the sale of 40% of the share capital of such company in the last quarter of 2017 and a further 9.99% sale in the third quarter of 2018).
2018/2017 Segment results
TELEFÓNICA SPAIN
The below table shows the evolution of accesses in Telefónica Spain over the past two years as of December 31 of such years:
|
ACCESSES
|
|
|||||
|
Thousands of accesses
|
2017
|
|
2018
|
|
%Reported
YoY
|
|
|
Fixed telephony accesses (1)
|
9,304.7
|
|
9,029.1
|
|
(3.0
|
%)
|
|
Internet and data accesses (2)
|
6,039.6
|
|
6,129.6
|
|
1.5
|
%
|
|
Broadband
|
6,020.3
|
|
6,113.5
|
|
1.5
|
%
|
|
FTTH
|
3,423.7
|
|
3,940.6
|
|
15.1
|
%
|
|
Mobile accesses
|
17,576.5
|
|
18,384.4
|
|
4.6
|
%
|
|
Prepay
|
1,793.4
|
|
1,440.1
|
|
(19.7
|
%)
|
|
Contract
|
15,783.1
|
|
16,944.3
|
|
7.4
|
%
|
|
M2M
|
2,015.6
|
|
2,333.2
|
|
15.8
|
%
|
|
Pay TV
|
3,847.6
|
|
4,091.3
|
|
6.3
|
%
|
|
Final Clients Accesses
|
36,768.5
|
|
37,634.4
|
|
2.4
|
%
|
|
Wholesale Accesses
|
4,221.1
|
|
3,912.9
|
|
(7.3
|
%)
|
|
Total Accesses
|
40,989.6
|
|
41,547.3
|
|
1.4
|
%
|
(1) Includes "fixed wireless" and Voice over IP accesses.
(2) Also referred to as fixed broadband accesses.
In 2018, commercial activity continued to leverage on the differentiated assets of the Company, principally through the convergent offer (which means the offer of more than a single service for a single price) “Movistar Fusión+” and through the "Más por Más” strategy. The Company continued to modify the above mentioned offer and to adapt it to incremental customer demand, mainly through: i) an increase in data to all mobile lines offered in "Movistar Fusión"; and ii) the doubling of fiber speed, from 50 Mb to 100 Mb in low speed bundles, and from 300 Mb to 600 Mb in high speed bundles. In addition, in June 2018, a new operator of the Group was created in Spain, O2, to respond to a customer segment that demands only voice services and which requires a simple offer with a premium service. The new operator targets this premium service segment with a simple offer which consists of two tariffs: mobile and fiber-mobile. Additionally, in late October 2018, Telefónica launched a new “Movistar Fusión” portfolio, which seeks, on one hand, to simplify and reduce the number of offers available to customers, which decreased from ten to six, and, on the other hand, to facilitate access to what is among the most requested content by our customers, namely, football (soccer). Finally, in December 2018, the Company added Netflix to its offer, and created new packages with more GBs and an additional mobile line.
Telefónica Spain had 41.5 million accesses as of December 31, 2018 (+1.4% compared to December 31, 2017), changing the downward trend of previous years, mainly as a result of the increase in higher value accesses: mobile contract accesses, fiber accesses and TV accesses.
The consumer convergent offer
had a customer base of 4.6 million customers with 4.7 million additional wireless lines associated with such customer base as of December 31, 2018, increasing by 4.2% and 27.0% year-on-year,
47
respectively, and contributing 87.6% of the fixed retail broadband customer base (+2.1 percentage points year-on-year) and 83.9% of the wireless contract customer base (+4.5 percentage points year-on-year). There was significant growth in the penetration of the high value services of the convergent offer, with 39.5% of the customer base already using 600 Mb ultra-fast broadband (+1.1 percentage points year-on-year) and 80.4% of the customer base having Pay TV as of December 31, 2018 (+4.8 percentage points year-on-year), as well as growth in mobile lines (each main Fusión package had 2.0 mobile lines on average compared to 1.8 in 2017). In 2018, the consumer "Movistar Fusión" convergent offer churn stood at 1.5%, the same as last year despite the high commercial competition in the market during the year.
Fixed accesses
decreased 3.0% year-on-year, with a net loss of 276 thousand accesses in 2018.
Retail broadband accesses
increased by 93.2 thousand accesses in 2018, totaling 6.1 million accesses (+1.5% year-on-year) due to the increase in gross adds (+13.8% year-on-year) and churn stability (1.7%, +0.02 percentage points year-on-year).
Fiber accesses
showed a good evolution in terms of net adds, reaching 3.9 million customers at December 31, 2018 (up 15.1% compared to December 31, 2017), representing 64.5% of broad band accesses (+7.6 percentage points year-on-year), with 516.9 thousand new accesses in 2018. Ultra-speed fiber accesses with 600 Mb (with higher ARPU) reached 2.4 million accesses (60.2% of total fiber accesses). At December 31, 2018 the fiber deployment reached 21.3 million premises, 2.1 million more than at December 31, 2017, and continues to be the largest in Europe.
Total
mobile accesses
stood at 18.4 million as of December 31, 2018, increasing by 4.6% compared to December 31, 2017, as a result of the increase in contract accesses, which more than offset the decrease in prepay accesses (-19.7% year-on-year), reflecting the success of the convergent offer and the positive evolution of the prepay to postpay migration in the third and fourth quarters of 2018. The contract access base accelerated its growth during 2018, growing by 7.4% year-on-year. Smartphone penetration as of December 31, 2018 stood at 80.5% of the mobile voice base (+4.1 percentage points year-on-year) and significantly boosted data traffic growth to 68.1% year-on-year due to the higher number of customers with superior data packages.
LTE network rollout continued to progress well, and coverage reached approximately 97.7% of the population (based on the calculation criteria used by competitors
(pursuant to which all inhabitants of the cities that have some LTE coverage are considered)) at December 31, 2018, increasing by 0.7 percentage points compared to 2017. The LTE customer base reached 8.8 million customers as of December 31, 2018, +15.1% compared to December 31, 2017 with penetration of 55.1% (+5.7 percentage points year-on-year) over the total mobile base.
Pay TV accesses
reached 4.1 million at the end of 2018, growing by 6.3% compared to December 31, 2017 driven by the inclusion of TV services in all “Fusión” portfolio convergent packages since July 2017 and the good performance of such packages in 2018.
Wholesale accesses
stood at 3.9 million at the end of 2018, decreasing by 7.3% year-on-year. However, the net adds of NEBA (New Ethernet Broad Band Service for Wholesale) and fiber accesses increased to 1.5 million accesses, representing 38.9% of the total wholesale accesses (+18.8 percentage points year-on-year), reflecting the positive evolution of the network due to the use of superior technologies.
The table below shows Telefónica Spain’s results over the past two years:
48
|
Millions of euros
|
||||||||
|
TELEFÓNICA SPAIN
|
2017
|
|
2018
|
|
% Reported
YoY
|
|
% Organic
YoY (3)
|
|
|
Revenues
|
12,653
|
|
12,706
|
|
0.4
|
%
|
0.4
|
%
|
|
Consumer (1)
|
6,602
|
|
6,689
|
|
1.3
|
%
|
1.3
|
%
|
|
Fusion
|
4,470
|
|
4,795
|
|
7.3
|
%
|
7.3
|
%
|
|
Out of Fusion
|
2,132
|
|
1,894
|
|
(11.2
|
%)
|
(11.2
|
%)
|
|
Corporate
|
3,401
|
|
3,462
|
|
1.8
|
%
|
1.8
|
%
|
|
Communications
|
2,631
|
|
2,602
|
|
(1.1
|
%)
|
(1.1
|
%)
|
|
IT
|
770
|
|
860
|
|
11.6
|
%
|
11.6
|
%
|
|
Others (2)
|
2,271
|
|
2,169
|
|
(4.5
|
%)
|
(4.6
|
%)
|
|
Other income
|
410
|
|
389
|
|
(5.2
|
%)
|
(5.2
|
%)
|
|
Supplies
|
(3,481
|
)
|
(3,663
|
)
|
5.2
|
%
|
5.2
|
%
|
|
Personnel expenses
|
(2,212
|
)
|
(2,248
|
)
|
1.6
|
%
|
(4.7
|
%)
|
|
Other expenses
|
(2,418
|
)
|
(2,421
|
)
|
0.1
|
%
|
0.6
|
%
|
|
OIBDA
|
4,952
|
|
4,763
|
|
(3.8
|
%)
|
(1.3
|
%)
|
|
OIBDA margin
|
39.1
|
%
|
37.5
|
%
|
(1.6 p.p.)
|
|
(0.7 p.p.)
|
|
|
Depreciation and amortization
|
(1,688
|
)
|
(1,650
|
)
|
(2.3
|
%)
|
(2.3
|
%)
|
|
Operating income (OI)
|
3,264
|
|
3,113
|
|
(4.6
|
%)
|
(0.8
|
%)
|
|
CapEx
|
1,683
|
|
1,719
|
|
2.1
|
%
|
(5.1
|
%)
|
|
OpCF (OIBDA-CapEx)
|
3,269
|
|
3,044
|
|
(6.9
|
)%
|
0.6
|
%
|
(1) Consumer revenues also include freelance revenues.
(2) Other includes wholesale, subsidiaries and other revenues.
(3) See adjustments made to calculate organic variation below.
Adjustments made to calculate organic variations
As explained above, year-on-year percentage changes referred to in this document as “organic” or presented in “organic terms” intend to present year-on-year variations on a comparable basis.
With respect to Telefónica Spain, we have made the following adjustments in order to calculate 2018/2017 variations in organic terms:
|
•
|
Restructuring costs:
the impact of certain restructuring costs related to the Individual Suspension Plan amounting to 297 million euros and 165 million euros in 2018 and 2017, respectively, have been excluded.
|
|
•
|
Spectrum acquisition:
we have excluded the impact of spectrum acquisitions in 2018, which totaled 122 million euros. During 2017 no acquisitions were made.
|
|
•
|
Optimization of the distribution network:
the impact of the provisions recorded totaling 13 million euros in 2017 was excluded.
|
|
•
|
IFRS 15 impact:
the organic variations exclude the impact of the adoption of IFRS 15 in 2018.
|
|
•
|
Gains or losses on the sale of companies:
the loss of 3 million euros incurred on the sale of Centro de Asistencia Telefónica, S.A. in 2018 has been excluded.
|
49
The table below shows 2018/2017 variations in reported and organic terms (the latter, calculated in accordance with the adjustments referred to above) of certain line items of the income statement and other measures, and the contribution of each item for which we have adjusted to our reported growth:
|
YoY variation
|
Contribution to reported growth (percentage points)
|
|||||||||||||
|
TELEFÓNICA SPAIN
2018 |
% Reported
YoY
|
|
% Organic
YoY
|
|
Restructuring costs
|
|
Spectrum acquisition
|
|
Spain distribution network
|
|
IFRS 15 impact
|
|
Capital gains/losses on sale of companies
|
|
|
Revenues
|
0.4
|
%
|
0.4
|
%
|
—
|
|
—
|
|
—
|
|
(0.0)
|
|
—
|
|
|
Other income
|
(5.2
|
%)
|
(5.2
|
%)
|
—
|
|
—
|
|
—
|
|
—
|
|
—
|
|
|
Supplies
|
5.2
|
%
|
5.2
|
%
|
—
|
|
—
|
|
—
|
|
—
|
|
—
|
|
|
Personnel expenses
|
1.6
|
%
|
(4.7
|
%)
|
6.0
|
|
—
|
|
—
|
|
—
|
|
—
|
|
|
Other expenses
|
0.1
|
%
|
0.6
|
%
|
—
|
|
—
|
|
(0.5
|
)
|
(0.1
|
)
|
0.1
|
|
|
OIBDA
|
(3.8
|
%)
|
(1.3
|
%)
|
(2.7
|
)
|
—
|
|
0.3
|
|
(0.0)
|
|
(0.1
|
)
|
|
CapEx
|
2.1
|
%
|
(5.1
|
%)
|
—
|
|
7.2
|
|
—
|
|
—
|
|
—
|
|
|
OpCF (OIBDA-CapEx)
|
(6.9
|
%)
|
0.6
|
%
|
(4.0
|
)
|
(3.7
|
)
|
0.4
|
|
(0.0)
|
|
(0.1
|
)
|
Results discussion
Revenues in Telefónica Spain in 2018 were 12,706 million euros, growing by 0.4% year-on-year in reported terms mainly as a result of the increase in service revenues (+0.4% year-on-year, or +0.3% excluding the impact of the adoption of IFRS 15) and handset revenues (+1.8% year-on-year, or +3.4% excluding the impact of the adoption of IFRS 15).
Given the high penetration level of convergent offers (i.e., a bundled offer of several services for a single price), the revenue breakdown by service is considered to be increasingly less relevant. For this reason, Telefónica Spain has established the below revenue breakdown that management believes is more meaningful.
|
•
|
Consumer revenues (6,689 million euros in 2018) grew by 1.3% year-on-year in reported terms mainly driven by the growth in ARPU and in the number of customers, as well as a significant improvement in the customers' mix. There was significant growth in the revenues relating to convergent offers during 2018 (which totaled 4,795 million euros, +7.3% year-on-year in reported terms) which more than offset the drop in revenues not relating to convergent offers.
|
|
•
|
Corporate revenues (3,462 million euros in 2018) increased by 1.8% year-on-year in reported terms, changing the trend from prior years mainly due to the good evolution of IT revenues, which grew by 11.6% year-on year in reported terms and more than offset the decrease in communications revenues (-1.1% year-on-year).
|
|
•
|
Other revenues, which include wholesale, subsidiaries and other revenues (2,169 million euros in 2018) decreased by 4.5% year-on-year in reported terms, due mainly to the decrease in wholesale revenues from MVNOs (as a result of the migration of Yoigo/Pepephone from Telefónica's network to Orange’s network) and to the effect of price regulatory changes applicable throughout 2018, mainly the decrease of mobile interconnection rates.
|
Convergent ARPU
rose to 88.7 euros in 2018, up 4.3% year-on-year in reported terms, boosted by the demand of higher value packages and tariff revisions (as a result of the implementation of the "Más por Más" strategy, pursuant to which there was an increase in contract tariffs in exchange for more data), as well as the improvement in the customers' mix stimulated by the renovation of our portfolio including additional mobile lines, additional contents as well as an improvement in functionalities in the convergent offers.
OIBDA
amounted to 4,763 million euros in 2018, down 3.8% year-on-year in reported terms. In 2018, OIBDA was negatively affected by the provision of 297 million euros recorded in connection with the ‘Individual Suspension Plan’ implemented by the Group in 2016, and subsequently extended to 2017 and 2018, and our payment commitments thereunder. The related impact on OIBDA in 2017 was 165 million euros.
For additional information, see “Item 6. Directors, Senior Management and Employees—Employees”.
50
In organic terms, OIBDA decreased 1.3% year-on-year, mainly due to the lower wholesale revenues and the higher supply costs, partially offset by the decrease in personnel expenses and the increase in consumer and business revenues. The increase in supplies (+5.2% year-on-year in both organic and reported terms) was mainly attributable to the higher content costs and IT equipment purchases. Personnel expenses decreased by 4.7% year-on-year in organic terms driven by the savings generated by the ‘Individual Suspension Plan’ (118 million euros).
OIBDA margin
was 37.5% in 2018 in reported terms, down by 1.6 percentage points in reported terms as compared to 2017.
TELEFÓNICA UNITED KINGDOM
The table below shows the evolution of accesses in Telefónica United Kingdom over the past two years as of December 31 of such years:
|
ACCESSES
|
||||||
|
Thousands of accesses
|
2017
|
|
2018
|
|
%Reported
YoY
|
|
|
Fixed telephony accesses (1)
|
283.9
|
|
306.9
|
|
8.1
|
%
|
|
Internet and data accesses (2)
|
25.3
|
|
28.1
|
|
11.2
|
%
|
|
Broadband
|
25.3
|
|
28.1
|
|
11.2
|
%
|
|
Mobile accesses
|
25,003.9
|
|
25,044.1
|
|
0.2
|
%
|
|
Prepay
|
9,203.7
|
|
8,742.6
|
|
(5.0
|
%)
|
|
Contract (3)
|
15,800.2
|
|
16,301.4
|
|
3.2
|
%
|
|
M2M
|
3,358.9
|
|
3,578.0
|
|
6.5
|
%
|
|
Final Clients Accesses
|
25,313.1
|
|
25,379.1
|
|
0.3
|
%
|
|
Wholesale Accesses
|
7,162.0
|
|
7,599.2
|
|
6.1
|
%
|
|
Mobile wholesale accesses (4)
|
7,162.0
|
|
7,599.2
|
|
6.1
|
%
|
|
Total Accesses
|
32,475.1
|
|
32,978.3
|
|
1.5
|
%
|
(1) Includes "fixed wireless" and Voice over IP accesses.
(2) Also referred to as fixed broadband accesses.
(3) Includes the disconnection of 228 thousand inactive contract accesses in the first quarter 2017.
(4) Mobile wholesale accesses information has been included in total accesses since the first quarter 2018. 2017 figures have been revised accordingly for comparative purposes
.
In 2018, despite the competitive environment, Telefónica United Kingdom remained as the main telecommunications operator in United Kingdom, a position underpinned by the strength of the O2 brand, custom loyalty and successful commercial propositions such as the “Custom Plan”, which provides customers with flexibility and choice by allowing them to customize their plans by choosing the contract terms (up to 36 months), the amount of payment upfront and the data plan. Such propositions have allowed the Company to achieve continuous customer growth in a competitive market.
Total accesses
grew by 1.5% year-on-year, standing at 33.0 million by the end of December 2018.
Mobile net additions
reached 40 thousand accesses in 2018, driven by
contract
mobile accesses
, which grew
by 3.2% year-on-year to 16.3 million and increased their proportion over the total mobile accesses to 65.1%.
Prepay accesses
decreased by 5.0% year-on-year to 8.7 million by the end of December 2018 due to disconnections of inactive customer accesses and market dynamics, including prepay to postpay migration. Smartphone penetration over the total mobile base rose 2.4 percentage points year-on-year up to 79.0%. The base of LTE customers base reached 13.5 million at the end of 2018 with a 4.7% year-on-year growth and 62.9% penetration over the mobile base.
51
The table below shows the evolution of Telefónica United Kingdom's results over the past two years:
|
Millions of euros
|
||||||||
|
TELEFÓNICA UNITED KINGDOM
|
2017
|
|
2018
|
|
% Reported YoY
|
|
% Organic YoY (1)
|
|
|
Revenues
|
6,540
|
|
6,790
|
|
3.8
|
%
|
5.4
|
%
|
|
Mobile service revenues
|
5,050
|
|
4,837
|
|
(4.2
|
%)
|
2.8
|
%
|
|
Other income
|
135
|
|
158
|
|
16.7
|
%
|
17.9
|
%
|
|
Supplies
|
(3,125
|
)
|
(2,359
|
)
|
(24.5
|
%)
|
3.5
|
%
|
|
Personnel expenses
|
(442
|
)
|
(445
|
)
|
0.6
|
%
|
1.7
|
%
|
|
Other expenses
|
(1,469
|
)
|
(2,279
|
)
|
55.2
|
%
|
4.8
|
%
|
|
OIBDA
|
1,639
|
|
1,865
|
|
13.8
|
%
|
11.8
|
%
|
|
OIBDA margin
|
25.1
|
%
|
27.5
|
%
|
2.4 p.p.
|
|
1.5 p.p.
|
|
|
Depreciation and amortization
|
(1,047
|
)
|
(943
|
)
|
(9.9
|
%)
|
(9.0
|
%)
|
|
Operating income (OI)
|
592
|
|
922
|
|
55.7
|
%
|
48.4
|
%
|
|
CapEx
|
827
|
|
1,464
|
|
77.2
|
%
|
7.1
|
%
|
|
OpCF (OIBDA-CapEx)
|
812
|
|
400
|
|
(50.7
|
%)
|
16.5
|
%
|
(1) See adjustments made to calculate organic variation below.
Adjustments made to calculate organic variations
As explained above, year-on-year percentage changes referred to in this document as “organic” or presented in “organic terms” intend to present year-on-year variations on a comparable basis.
With respect to Telefónica United Kingdom, we have made the following adjustments in order to calculate 2018/2017 variations in organic terms:
|
•
|
Exchange rate effect:
we have excluded the impact of changes in exchange rates by assuming constant average foreign exchange rates year-on-year. In particular, we have used the average foreign exchange rate of 2017 for both years.
|
|
•
|
Restructuring costs:
we have excluded the impact in 2018 and 2017 of restructuring costs, amounting to 48 thousand euros and 314 thousand euros, respectively.
|
|
•
|
IFRS 15 impact:
the organic variations exclude the impact of the adoption of IFRS 15 in 2018.
|
|
•
|
Spectrum acquisition:
we have excluded the impact of spectrum acquisitions in 2018, which totaled 588 million euros. During 2017 no acquisitions were made.
|
The table below shows 2018/2017 variations in reported and organic terms (the latter, calculated in accordance with the adjustments referred to above) of certain line items of the income statement and other measures, and the contribution of each item for which we have adjusted to our reported growth:
52
|
|
YoY variation
|
Contribution to reported growth (percentage points)
|
|||||||||
|
TELEFÓNICA UNITED KINGDOM
2018 |
% Reported YoY
|
|
% Organic YoY
|
|
Exchange rate effect
|
Restructuring costs
|
|
IFRS 15 impact
|
|
Spectrum acquisition
|
|
|
|
|||||||||||
|
Revenues
|
3.8
|
%
|
5.4
|
%
|
(1.0)
|
—
|
|
(0.6)
|
|
—
|
|
|
Other income
|
16.7
|
%
|
17.9
|
%
|
(1.2)
|
—
|
|
—
|
|
—
|
|
|
Supplies
|
(24.5
|
%)
|
3.5
|
%
|
(1.0)
|
—
|
|
(27.0)
|
|
—
|
|
|
Personnel expenses
|
0.6
|
%
|
1.7
|
%
|
(1.0)
|
(0.1)
|
|
—
|
|
—
|
|
|
Other expenses
|
55.2
|
%
|
4.8
|
%
|
(1.0)
|
—
|
|
51.5
|
|
—
|
|
|
OIBDA
|
13.8
|
%
|
11.8
|
%
|
(1.1)
|
(0.0)
|
|
3.1
|
|
—
|
|
|
CapEx
|
77.2
|
%
|
7.1
|
%
|
(1.1)
|
—
|
|
—
|
|
71.1
|
|
|
OpCF (OIBDA-CapEx)
|
(50.7
|
%)
|
16.5
|
%
|
(1.1)
|
0.0
|
|
6.3
|
|
(72.4)
|
|
Results discussion
Total
revenues
increased by 3.8% year-on-year in reported terms to 6,790 million euros in 2018, in spite of the depreciation of the pound sterling (which detracted 1.0 percentage points from the increase) and the impact of the adoption of IFRS15 (which detracted 0.6 percentage points from the increase). In organic terms, total revenues grew by 5.4% driven by higher handset revenues (driven by the higher value smartphone sales) and higher mobile service revenues and M2M program revenues.
|
•
|
Mobile service revenues
totaled 4,837 million euros in 2018, decreasing by 4.2% in reported terms mainly due to the adoption of IFRS 15 (which detracted 6.1 percentage points from the year-on-year variation) and the depreciation of the pound sterling (which detracted 1.0 percentage points from the year-on-year variation). Excluding these impacts, mobile service revenues increased by 2.8% driven by the growth of in-bundle tariffs which are indexed to inflation.
|
Mobile
ARPU
fell by 5.4% year-on-year in reported terms mainly due to the adoption of IFRS 15 and the depreciation of the pound sterling. In organic terms, ARPU increased by 2.0% as a consequence of the positive commercial strategies, such as the offering of flexible tariffs through “custom plans” and the effect of inflation on airtime rates since April 2018.
|
TELEFÓNICA UNITED KINGDOM
|
2017
|
|
2018
|
|
%YoY
|
|
%Organic YoY
|
|
|
Voice Traffic (millions of minutes)
|
94,723
|
|
93,772
|
|
(1.0
|
%)
|
(1.0
|
%)
|
|
ARPU (EUR)
|
15.9
|
|
15.1
|
|
(5.4
|
%)
|
2.0
|
%
|
|
Prepay
|
6.9
|
|
7.1
|
|
2.7
|
%
|
3.8
|
%
|
|
Contract (1)
|
26.8
|
|
24.6
|
|
(8.3
|
%)
|
0.3
|
%
|
|
Data ARPU (EUR)
|
9.7
|
|
9.2
|
|
(4.8
|
%)
|
2.3
|
%
|
|
% non-SMS over data revenues
|
65.5
|
%
|
66.6
|
%
|
1.1 p.p.
|
|
1.2 p.p.
|
|
(1) Excludes M2M.
OIBDA
totaled 1,865 million euros in 2018, increasing by 13.8% in reported terms
,
despite the depreciation of the pound sterling (which detracted 1.1 percentage points from the increase)
.
The adoption of IFRS 15 contributed 3.1 percentage points of the year-on-year growth. In organic terms, OIBDA increased 11.8% year-on-year mainly driven by the higher mobile service revenues and savings in the cost base.
OIBDA margin
stood at 27.5% in 2018, growing 2.4 percentage points in reported terms compared to 2017.
53
TELEFÓNICA GERMANY
The below table shows the evolution of accesses in Telefónica Germany over the past two years as of December 31 of such years:
|
ACCESSES
|
|
|||||
|
Thousands of accesses
|
2017
|
|
2018
|
|
%Reported
YoY
|
|
|
Fixed telephony accesses (1)
|
1,979.6
|
|
1,996.0
|
|
0.8
|
%
|
|
Internet and data accesses (2)
|
2,281.5
|
|
2,274.7
|
|
(0.3
|
%)
|
|
Broadband
|
2,072.2
|
|
2,079.8
|
|
0.4
|
%
|
|
VDSL
|
1,151.6
|
|
1,441.3
|
|
25.2
|
%
|
|
Mobile accesses
|
43,154.7
|
|
42,818.8
|
|
(0.8
|
%)
|
|
Prepay
|
21,880.9
|
|
20,542.9
|
|
(6.1
|
%)
|
|
Contract
|
21,273.8
|
|
22,275.9
|
|
4.7
|
%
|
|
M2M
|
1,027.0
|
|
1,187.9
|
|
15.7
|
%
|
|
Final Clients Accesses
|
47,415.8
|
|
47,089.5
|
|
(0.7
|
%)
|
|
Wholesale Accesses
|
188.1
|
|
0.0
|
|
(100.0
|
%)
|
|
Total Accesses
|
47,603.9
|
|
47,089.5
|
|
(1.1
|
%)
|
(1) Includes "fixed wireless" and Voice over IP accesses.
(2) Also referred to as fixed broadband accesses.
Telefónica Germany continued to show a strong operational momentum. In a dynamic market environment, the company remained focused on profitable growth by stimulating data usage, leveraging the well-received O
2
Free tariff portfolio and the unique O
2
Connect option to share high-speed data volumes on up to 10 devices. During 2018 Telefónica Germany largely finalized its network integration, with significant quality improvements, delivering the first milestone of its “Mobile Customer and Digital Champion” strategy.
The
total access
base fell 1.1% year-on-year and stood at 47.1 million at the end of 2018, mainly driven by the decrease in the prepay mobile base.
The
contract mobile access
base grew 4.7% year-on-year and reached 22.3 million accesses, increasing the share over the total mobile base up to 52.0%. Net adds reached 1.0 million accesses on the back of the O
2
Free tariff portfolio and solid contribution of partners (second brands), which represented 60% of gross adds in 2018. Smartphone penetration reached 66.0% of the total mobile access base, up 5.1 percentage points year-on-year driven by the continued growth of LTE customers (+17.0% year-on-year reaching 18.4 million customers at the end of 2018). LTE penetration reached 44.3% of the total mobile access base.
The
prepay mobile access
base decreased 6.1% year-on-year to 20.5 million due to the lower demand after the implementation of certain regulatory changes introduced in 2017 (mainly the need for a legitimation check in connection with SIM cards). Prepay posted a net loss of 1.3 million accesses in 2018.
The
retail broadband access base
increased by 7.6 thousand accesses in 2018, experiencing strong demand for VDSL, with net adds of 289.7 thousand accesses in 2018 (accesses went up 25.2% year-on-year). The planned wholesale DSL customer migration (which was required for the planned shutdown of Telefónica Germany’s legacy infrastructure) was completed at the end of September 2018. This migration is the result of Telefónica Germany’s decision, in 2013, to stop investing in its own ADSL-based infrastructure and enter into a wholesale partnership (Kontingentmodell) with Deutsche Telekom AG.
The table below shows the evolution of Telefónica Germany’s results over the past two years:
54
|
Millions of euros
|
|||||||||
|
TELEFÓNICA GERMANY
|
2017
|
|
2018
|
|
% Reported YoY
|
|
% Organic YoY (1)
|
|
|
|
Revenues
|
7,296
|
|
7,320
|
|
0.3
|
%
|
(0.1
|
%)
|
|
|
Mobile Business
|
6,415
|
|
6,539
|
|
1.9
|
%
|
1.5
|
%
|
|
|
Mobile service revenues
|
5,287
|
|
5,267
|
|
(0.4
|
%)
|
(0.8
|
%)
|
|
|
Fixed Business
|
862
|
|
767
|
|
(11.0
|
%)
|
(12.4
|
%)
|
|
|
Other income
|
159
|
|
177
|
|
11.0
|
%
|
11.0
|
%
|
|
|
Supplies
|
(2,396
|
)
|
(2,459
|
)
|
2.7
|
%
|
2.7
|
%
|
|
|
Personnel expenses
|
(642
|
)
|
(610
|
)
|
(5.0
|
%)
|
(1.1
|
%)
|
|
|
Other expenses
|
(2,596
|
)
|
(2,594
|
)
|
(0.1
|
%)
|
(1.0
|
%)
|
|
|
OIBDA
|
1,821
|
|
1,834
|
|
0.7
|
%
|
(1.0
|
%)
|
|
|
OIBDA margin
|
25.0
|
%
|
25.1
|
%
|
0.1 p.p.
|
|
(0.2 p.p.)
|
|
|
|
Depreciation and amortization
|
(1,954
|
)
|
(2,071
|
)
|
6.0
|
%
|
6.0
|
%
|
|
|
Operating income (OI)
|
(133
|
)
|
(237
|
)
|
79.0
|
%
|
n.m.
|
|
|
|
CapEx
|
951
|
|
966
|
|
1.6
|
%
|
1.7
|
%
|
|
|
OpCF (OIBDA-CapEx)
|
870
|
|
868
|
|
(0.3
|
%)
|
(3.7
|
%)
|
|
n.m.: not meaningful.
(1) See adjustments made to calculate organic variation below.
Adjustments made to calculate organic variations
As explained above, year-on-year percentage changes referred to in this document as “organic” or presented in “organic terms” intend to present year-on-year variations on a comparable basis.
With respect to Telefónica Germany, we have made the following adjustments in order to calculate 2018/2017 variations in organic terms:
|
•
|
Restructuring costs:
we have excluded the impact of restructuring costs associated with simplification processes implemented in Germany. Restructuring costs totaled 84 million euros and 82 million euros in 2018 and 2017, respectively.
|
|
•
|
Spectrum acquisition:
the organic variations exclude the impact of spectrum acquisitions, which in 2017 amounted to 1 million euros. During 2018, no acquisitions were made.
|
|
•
|
IFRS 15 impact:
the organic variations exclude the impact of the adoption of IFRS 15 in 2018.
|
The table below shows 2018/2017 variations in reported and organic terms (the latter, calculated in accordance with the adjustments referred to above) of certain line items of the income statement measures and CapEX and the contribution of each item for which we have adjusted to our reported growth:
|
|
YoY variation
|
Contribution to reported growth (percentage points)
|
||||||||
|
TELEFÓNICA GERMANY
2018 |
%Reported YoY
|
|
%Organic YoY
|
|
Restructuring costs
|
|
Spectrum acquisition
|
|
IFRS 15
|
|
|
Revenues
|
0.3
|
%
|
(0.1
|
%)
|
—
|
|
—
|
|
0.4
|
|
|
Other income
|
11.0
|
%
|
11.0
|
%
|
—
|
|
—
|
|
||
|
Supplies
|
2.7
|
%
|
2.7
|
%
|
—
|
|
—
|
|
—
|
|
|
Personnel expenses
|
(5.0
|
%)
|
(1.1
|
%)
|
(4.0
|
)
|
—
|
|
—
|
|
|
Other expenses
|
(0.1
|
%)
|
(1.0
|
%)
|
1.1
|
|
—
|
|
(0.2
|
)
|
|
OIBDA
|
0.7
|
%
|
(1.0
|
%)
|
(0.1
|
)
|
—
|
|
1.9
|
|
|
CapEx
|
1.6
|
%
|
1.7
|
%
|
—
|
|
(0.1
|
)
|
—
|
|
|
OpCF (OIBDA-CapEx)
|
(0.3
|
%)
|
(3.7
|
%)
|
(0.3
|
)
|
0.1
|
|
4.0
|
|
55
Results discussion
Total
revenues
were 7,320 million euros in 2018
,
increasing 0.3% year-on-year in reported terms mainly as a result of the adoption of IFRS 15. In organic terms, total revenues decreased by 0.1% due mainly to the lower service revenues.
Mobile service revenues
totaled 5,267 million euros in 2018, decreasing 0.4% year-on-year in reported terms despite the positive impact of IFRS 15 (which contributed +0.4 percentage points in the year-on-year evolution). Excluding this impact, mobile service revenues decreased by 0.8% reflecting the impact of RLaH (Roaming Like at Home) regulation in Europe (which is in effect since June 15, 2017), the ongoing customer base rotation
,
as well as the increasing contribution of partners (second brands, with lower ARPU) to the detriment of our own brands. Data revenues decreased by 2.1% year-on-year in reported terms and accounted for 55.5% of mobile service revenues in 2018. Non-P2P SMS data revenues amounted to 2,482 million euros (increasing 3.5% year-on-year), and accounted for 84.9% of the total data revenues (+4.6 percentage points year-on-year).
Fixed revenues
were 767 million euros in 2018, down 11.0% year-on-year in reported terms despite the positive impact of IFRS 15 (which contributed +1.4 percentage points in the year-on-year evolution). Excluding this impact, fixed revenues decreased by 12.4% mainly as a result of the completion of the wholesale DSL customer migration (in connection with the ADSL infrastructure dismantling) referred to above, while the retail business performed positively in the period.
Mobile ARPU
was 10.0 euros in 2018 (+3.1% year-on-year), while contract ARPU stood at 14.9 euros (-4.0% year-on-year), as a result of the higher share of second brands, which have a lower ARPU. Data ARPU was 5.7 euros (+2.0% year-on-year).
|
TELEFÓNICA GERMANY
|
2017
|
|
2018
|
|
%YoY
|
|
|
Voice Traffic (millions of minutes)
|
98,084
|
|
96,905
|
|
(1.2
|
%)
|
|
ARPU (EUR)
|
9.7
|
|
10.0
|
|
3.1
|
%
|
|
Prepay
|
5.2
|
|
5.8
|
|
11.1
|
%
|
|
Contract (1)
|
15.5
|
|
14.9
|
|
(4.0
|
%)
|
|
Data ARPU (EUR)
|
5.6
|
|
5.7
|
|
2.0
|
%
|
|
% non-SMS over data revenues
|
80.3
|
%
|
84.9
|
%
|
4.6 p.p.
|
|
(1) Excludes M2M.
OIBDA
totaled 1,834 million euros in 2018 (+0.7% year-on-year in reported terms), and was positively affected by the adoption of IFRS 15 (which contributed +1.9 percentage points in the year-on-year evolution). In organic terms, OIBDA decreased 1.0% year-on-year mainly due to the lower integration synergies (as a consequence of the integration of activities after the acquisition of E-Plus in 2014) than those recorded in 2017 and the adverse impact of changes in regulation (mainly European roaming regulation).
The
OIBDA margin
stood at 25.1% in reported terms in 2018, up 0.1 percentage points compared to 2017.
TELEFÓNICA BRAZIL
The below table shows the evolution of accesses in Telefónica Brazil over the past two years as of December 31 of such years:
56
|
ACCESSES
|
|
|||||
|
Thousands of accesses
|
2017
|
|
2018
|
|
%Reported
YoY
|
|
|
Fixed telephony accesses (1)
|
13,837.3
|
|
13,004.6
|
|
(6.0
|
%)
|
|
Internet and data accesses (2)
|
7,534.5
|
|
7,564.7
|
|
0.4
|
%
|
|
Broadband
|
7,466.1
|
|
7,485.2
|
|
0.3
|
%
|
|
FTTx/Cable
|
4,541.0
|
|
4,991.1
|
|
9.9
|
%
|
|
Mobile accesses
|
74,931.3
|
|
73,151.3
|
|
(2.4
|
%)
|
|
Prepay
|
38,168.1
|
|
32,754.4
|
|
(14.2
|
%)
|
|
Contract
|
36,763.2
|
|
40,396.9
|
|
9.9
|
%
|
|
M2M
|
6,312.5
|
|
8,203.3
|
|
30.0
|
%
|
|
Pay TV
|
1,587.7
|
|
1,566.6
|
|
(1.3
|
%)
|
|
Final Clients Accesses
|
97,890.8
|
|
95,287.2
|
|
(2.7
|
%)
|
|
Wholesale Accesses
|
14.3
|
|
14.8
|
|
4.2
|
%
|
|
Total Accesses
|
97,905.1
|
|
95,302.0
|
|
(2.7
|
%)
|
(2) Also referred to as fixed broadband accesses.
In 2018, Telefónica Brazil maintained its leadership in the higher value mobile segment, which permitted the operator to capture consistent revenue growth in that segment. In the fixed business, there was continued focus on fiber, which allowed the operator to capture high-value clients in the Pay TV business. This allowed Telefónica Brazil to offset in part the downturn in the traditional fixed business.
Revenues decreased year-on-year due to the exchange rates effect. Excluding such impact, revenues were positively supported by the expansion of value offers mainly due to the acceleration of mobile data consumption and the good evolution of fiber and IPTV customers. Additionally, OIBDA evolution was positively affected by the adoption of cost control measures and gains resulting from the digitalization process undertaken by Telefónica Brazil, which allowed the Group to offset the negative impact of the complex political situation throughout the year, which resulted in adverse macroeconomic circumstances, and the deterioration of the traditional fixed business.
Telefónica Brazil reached 95.3 million
accesses
as of December 31, 2018, down 2.7% as compared to December 31, 2017, mainly as a result of the decrease in the prepay customer base (which was adversely affected by political uncertainty and macroeconomic deterioration) and in the fixed telephony accesses base (which continued to be adversely affected by the migration to mobile
,
which was further supported by the existence of multiple voice offers in the market). However, there was an improvement in the high-value customer mix, supported by the higher weight of postpaid, UBB and IPTV products.
In the
mobile business
, the strategic focus remained on gaining and retaining high-value customers, having a market share of 40.5% in the contract segment as of December 31, 2018 (source: ANATEL). Telefónica Brazil maintained its market leadership in terms of total accesses with a market share of 31.9% as of December 31, 2018 (source: ANATEL). The growth in the contract accesses (+9.9% year-on-year) substantially compensated the decrease in prepay accesses (-14.2% year-on-year). Commercial offers focused on data plans allow data to be accumulated, shared or duplicated, and such plans are focused on the use of social networks and music and video apps. These plans also offer value-added services (as opposed to voice services), with unlimited off-net minutes plans and international roaming plans. High-value offers also focus on family plans comprising OTT services (such as Netflix and VIVO Music).
In the
fixed business
, Telefónica Brazil maintained its strategic focus on fiber deployment, with 19.8 million premises passed with FTTx at December 31, 2018 and 5.0 million homes connected, growing by 9.9% year-on-year. This growth helped to offset the negative evolution of ADSL accesses. Retail broadband customers totaled 7.5 million customers in 2018, up 0.3% year-on-year. Fixed telephony accesses decreased by 6.0% year-on-year due to the fixed-mobile migration. Pay TV customers stood at 1.6 million, decreasing 1.3% year-on-year due to a more selective commercial activity directed to capture IPTV clients, which increased 52.1% year-on-year, representing 37% of the total Pay TV accesses.
57
The table below shows the evolution of Telefónica Brazil’s results over the past two years:
|
Millions of euros
|
|
|
|
|
|
|
|||
|
TELEFÓNICA BRAZIL
|
2017
|
|
2018
|
|
% Reported YoY
|
|
% Organic YoY (1)
|
|
|
|
Revenues
|
12,019
|
|
10,126
|
|
(15.8
|
%)
|
0.3
|
%
|
|
|
Mobile Business
|
7,360
|
|
6,372
|
|
(13.4
|
%)
|
3.3
|
%
|
|
|
Mobile service revenues
|
7,062
|
|
5,924
|
|
(16.1
|
%)
|
1.1
|
%
|
|
|
Fixed Business
|
4,659
|
|
3,754
|
|
(19.4
|
%)
|
(4.5
|
%)
|
|
|
Other income
|
358
|
|
312
|
|
(13.0
|
%)
|
3.9
|
%
|
|
|
Supplies
|
(2,268
|
)
|
(2,039
|
)
|
(10.1
|
%)
|
7.0
|
%
|
|
|
Personnel expenses
|
(1,196
|
)
|
(1,080
|
)
|
(9.7
|
%)
|
1.8
|
%
|
|
|
Other expenses
|
(4,722
|
)
|
(3,008
|
)
|
(36.3
|
%)
|
(8.0
|
%)
|
|
|
OIBDA
|
4,191
|
|
4,311
|
|
2.9
|
%
|
5.6
|
%
|
|
|
OIBDA margin
|
34.9
|
%
|
42.6
|
%
|
7.7 p.p.
|
|
1.9 p.p.
|
|
|
|
Depreciation and amortization
|
(2,228
|
)
|
(1,990
|
)
|
(10.6
|
%)
|
6.7
|
%
|
|
|
Operating income (OI)
|
1,963
|
|
2,321
|
|
18.2
|
%
|
4.4
|
%
|
|
|
CapEx
|
2,225
|
|
1,910
|
|
(14.1
|
%)
|
2.4
|
%
|
|
|
OpCF (OIBDA-CapEx)
|
1,966
|
|
2,401
|
|
22.1
|
%
|
9.1
|
%
|
|
Adjustments made to calculate organic variations
As explained above, year-on-year percentage changes referred to in this document as “organic” or presented in “organic terms” intend to present year-on-year variations on a comparable basis.
With respect to Telefónica Brazil, we have made the following adjustments in order to calculate 2018/2017 variations in organic terms:
|
•
|
Exchange rate effect:
we have excluded the impact of changes in exchange rates by assuming constant average foreign exchange rates year-on-year. In particular, we have used the average foreign exchange rate of 2017 for both years.
|
|
•
|
Changes in the scope of consolidation:
Terra Networks Brasil was included in the consolidation perimeter of Telefónica Brazil in July 2017. To exclude the impact of this perimeter change in the calculation of organic variations, the 2017 comparative figures include the results of Terra Networks Brasil for the whole year, with an impact on OIBDA of 14 million euros.
|
|
•
|
Restructuring costs
: we have excluded the impact of restructuring costs associated with the simplification processes implemented in Telefónica Brazil. In 2018, these restructuring costs totaled 46 million euros. There were no such restructuring costs during 2017.
|
|
•
|
Contingencies:
the impact of the provisions relating to certain contingencies recorded in 2018 and 2017 has been excluded in Telefónica Brazil (215 and 50 million euros, respectively).
|
|
•
|
Results of tower sales:
the results attributable to the sale of towers have been excluded (89 thousand euros in 2018 and 107 thousand euros in 2017).
|
|
•
|
Judicial decision related to the exclusion of ICMS from the tax basis of PIS/COFINS:
the organic variations exclude the positive impact in 2018 (789 million euros in the OIBDA of Telefónica Brazil) of the judicial decision of the Brazilian Supreme Court that the ICMS (an indirect tax) should not be included on the tax basis of the PIS/COFINS tax.
|
|
•
|
Spectrum acquisition:
the impact of spectrum acquisitions has been excluded (2 million euros in 2018). During 2017 no acquisitions were made.
|
|
•
|
IFRS 15 impact:
the organic variations exclude the impact of the adoption of IFRS 15 in 2018.
|
58
The table below shows 2018/2017 variations in reported and organic terms (the latter, calculated in accordance with the adjustments referred to above) of certain line items of the income statement and other measures, and the contribution of each item for which we have adjusted to our reported growth:
|
|
YoY variation
|
Contribution to reported growth (percentage points)
|
|||||||||||||||||
|
TELEFÓNICA BRAZIL 2018
|
% Reported YoY
|
|
% Organic YoY
|
|
Exchange rate effect
|
Perimeter change
|
|
Restruc-turing costs
|
|
Contingen-cies
|
|
Towers Sales
|
|
Judicial decision PIS/COFINS
|
|
Spectrum acquisition
|
|
IFRS 15 impact
|
|
|
Revenues
|
(15.8
|
%)
|
0.3
|
%
|
(16.3)
|
0.3
|
|
—
|
|
—
|
|
—
|
|
—
|
|
—
|
|
0.0
|
|
|
Other income
|
(13.0
|
%)
|
3.9
|
%
|
16.9
|
0.0
|
|
—
|
|
—
|
|
0.0
|
|
—
|
|
—
|
|
—
|
|
|
Supplies
|
(10.1
|
%)
|
7.0
|
%
|
(17.4)
|
0.3
|
|
—
|
|
—
|
|
—
|
|
—
|
|
—
|
|
—
|
|
|
Personnel expenses
|
(9.7
|
%)
|
1.8
|
%
|
(17.6)
|
0.7
|
|
4.6
|
|
0.9
|
|
—
|
|
—
|
|
—
|
|
(0.2)
|
|
|
Other expenses
|
(36.3
|
%)
|
(8.0
|
%)
|
(12.4)
|
0.1
|
|
—
|
|
4.2
|
|
—
|
|
(19.9)
|
|
—
|
|
(0.3)
|
|
|
OIBDA
|
2.9
|
%
|
5.6
|
%
|
(19.9)
|
0.3
|
|
(1.3)
|
|
(4.9)
|
|
(0.0)
|
|
22.5
|
|
—
|
|
0.5
|
|
|
CapEx
|
(14.1
|
%)
|
2.4
|
%
|
(16.7)
|
—
|
|
—
|
|
—
|
|
—
|
|
—
|
|
0.1
|
|
—
|
|
|
OpCF (OIBDA-CapEx)
|
22.1
|
%
|
9.1
|
%
|
(23.5)
|
0.7
|
|
(2.8)
|
|
(10.5)
|
|
(0.0)
|
|
47.9
|
|
(0.1)
|
|
1.0
|
|
Results discussion
Revenues
totaled 10,126 million euros in 2018, down by 15.8% in reported terms, mainly due to the depreciation of the Brazilian real (negatively impacting the evolution by 16.3 percentage points). The consolidation of Terra Networks Brasil for the whole year (compared to six months, since July 2017, in 2017) in Telefónica Brazil's results contributed 0.3 percentage points to the year-on-year variation. In organic terms, revenues grew by 0.3% year-on-year, principally due to the good evolution of the mobile business (+3.3% year-on-year), despite the interconnection tariff reductions required to be implemented by law since February 25, 2018, in the mobile business tariff (-45.0%), fixed-mobile tariff (-13.1%), fixed-local tariff (-31.7%) and fixed-interurban tariff (-50.6%). Fixed revenues were also adversely impacted by regulatory restrictions and decreased by 4.5% in organic terms.
|
•
|
Revenues from the mobile business
totaled 6,372 million euros in 2018, down by 13.4% in reported terms due mainly to the depreciation of the Brazilian real (which negatively impacted the evolution by 16.7 percentage points). Excluding this impact, revenues from the mobile business increased by 3.3% due to the positive evolution of service revenues (+1.1% year-on-year in organic terms) mainly as a result of the bigger contract customer base and the higher data and connectivity revenues penetration, which offset the decrease in interconnection tariffs and the fall in prepay revenues resulting from the drop in accesses due to the macroeconomic deterioration. Handset revenues were up by 50.3% in reported terms, due to a boost in this business line and increased demand for accessories associated with higher value customers, especially smartphones.
|
|
•
|
Fixed telephony revenues
totaled 3,754 million euros in 2018, down by 19.4% in reported terms due mainly to the depreciation of the Brazilian real (which negatively impacted the evolution by 15.6 percentage points). The consolidation of Terra Networks Brasil for the whole year (compared to six months, since July 2017, in 2017) in Telefónica Brazil’s results contributed 0.8 percentage points to the year-on-year variation. Excluding these effects, fixed telephony revenues decreased by 4.5% mainly as a result of the fall in voice traffic
,
due to the ongoing mobile-fixed migration, and the reduction of the fixed-mobile and fixed-fixed tariffs required to be implemented by law since February 25, 2018. The resulting decrease in revenues more than offset the increase in broadband and new services revenues, which were up by 5.8% year-on-year in organic terms supported by the increase in fiber revenues.
|
The mobile
ARPU
decreased by 16.7% year-on-year in reported terms due mainly to the depreciation of the Brazilian real. In organic terms, the mobile ARPU increased by 0.4% year-on-year as a consequence of the higher data ARPU which offset the negative impact of the interconnection tariff reduction.
59
|
TELEFÓNICA BRAZIL
|
2017
|
|
2018
|
|
%YoY
|
|
%Local Currency
YoY
|
|
|
Voice Traffic (millions of minutes)
|
333,752
|
|
300,087
|
|
(10.1
|
%)
|
(10.1
|
%)
|
|
ARPU (EUR)
|
7.7
|
|
6.4
|
|
(16.7
|
%)
|
0.4
|
%
|
|
Prepay
|
3.7
|
|
2.8
|
|
(24.1
|
%)
|
(9.4
|
%)
|
|
Contract (1)
|
14.4
|
|
11.9
|
|
(17.3
|
%)
|
(0.1
|
%)
|
|
Data ARPU (EUR)
|
5.4
|
|
4.9
|
|
(10.4
|
%)
|
8.4
|
%
|
|
% non-SMS over data revenues
|
92.2
|
%
|
94.2
|
%
|
2.0 p.p.
|
|
2.0 p.p.
|
|
OIBDA
stood at 4,311 million euros in 2018, increasing 2.9% in reported terms as compared to 2017. OIBDA was significantly affected by the judicial decision of the Brazilian Supreme Court that the ICMS should not be included on the tax basis of the PIS/COFINS tax (which resulted in a contribution of 789 million euros to OIBDA and 22.5 percentage points of the year-on-year variation), which more than offset the impact of the depreciation of the Brazilian real (which detracted 19.9 percentage points from the year-on-year variation), the provisions recorded in connection with certain tax and labor contingencies (-4.9 percentage points) and the personnel restructuring plan (-1.3 percentage points). OIBDA was also positively affected by the consolidation of Terra Networks Brasil (+0.3 percentage points).
In organic terms, OIBDA increased 5.6% year-on-year due to postpaid, fiber and IPTV revenues’ growth, the adoption of cost control measures, gains resulting from the digitalization process undertaken by Telefónica Brazil, and the lower call center costs. Personnel expenses totaled 1,080 million euros in 2018, down by 9.7% in reported terms mainly as a result of the depreciation of the Brazilian real. In organic terms, personnel expenses increased by 1.8% year-on-year, below inflation, due to the collective agreement signed in 2017. Supply costs totaled 2,039 million euros in 2018, decreasing 10.1% in reported terms mainly due to the depreciation of the Brazilian real. In organic terms, supply costs increased by 7.0% due to higher equipment and handset costs which more than offset the positive impact of the reduction in interconnection rates, lower content costs and lower top ups.
Other expenses totaled 3,008 million euros in 2018, down by 36.3% in reported terms (down by 8.0% in organic terms) as compared to 2017.
The
OIBDA margin
stood at 42.6% in reported terms in 2018, up 7.7 percentage points compared to 2017.
TELEFÓNICA HISPAM NORTE
The below table shows the evolution of accesses in Telefónica Hispam Norte over the past two years as of December 31 of such years:
|
ACCESSES
|
|
|
|
|||
|
Thousands of accesses
|
2017 (*)
|
|
2018
|
|
%Reported
YoY
|
|
|
Fixed telephony accesses (1)
|
3,554.7
|
|
3,169.8
|
|
(10.8
|
)%
|
|
Internet and data accesses (2)
|
1,229.2
|
|
1,337.1
|
|
8.8
|
%
|
|
Broadband
|
1,199.9
|
|
1,305.6
|
|
8.8
|
%
|
|
FTTx/Cable
|
126.8
|
|
303.7
|
|
139.5
|
%
|
|
Mobile accesses
|
66,788.6
|
|
68,041.1
|
|
1.9
|
%
|
|
Prepay
|
57,190.7
|
|
58,010.4
|
|
1.4
|
%
|
|
Contract
|
9,597.9
|
|
10,030.7
|
|
4.5
|
%
|
|
M2M
|
1,686.7
|
|
1,922.8
|
|
14.0
|
%
|
|
Pay TV
|
982.1
|
|
1,007.6
|
|
2.6
|
%
|
|
Final Clients Accesses
|
72,554.6
|
|
73,555.6
|
|
1.4
|
%
|
|
Total Accesses
|
72,565.4
|
|
73,556.1
|
|
1.4
|
%
|
(*) Revised data.
(1) Includes "fixed wireless" and Voice over IP accesses.
(2) Also referred to as fixed broadband accesses.
The table above includes accesses for Guatemala (3.2 million and 2.8 million total accesses as of December 31, 2017 and 2018, respectively) and El Salvador (2.0 million and 2.1 million total accesses as of December 31, 2017 and 2018,
60
respectively). On January 24, 2019, Telefónica reached an agreement for the sale of Telefónica Móviles Guatemala, S.A. and Telefónica Móviles el Salvador, S.A. de C.V. The closing of the Telefónica El Salvador sale is subject to applicable regulatory conditions while the sale of Telefónica Móviles Guatemala was completed on such date. The table also includes accesses for Costa Rica (2.2 million and 2.2 million total accesses as of December 31, 2017 and 2018, respectively), Panama (1.6 million and 1.6 million total accesses as of December 31, 2017 and 2018, respectively) and Nicaragua (4.4 million and 4.0 million total accesses as of December 31, 2017 and 2018, respectively). On February 20, 2019, Telefónica reached an agreement for the sale of Telefónica de Costa Rica TC, S.A., and for the sale by Telefónica's subsidiary Telefónica Centroamérica Inversiones, S.L. (60% of which is owned, directly or indirectly, by Telefónica and 40% of which is owned, directly or indirectly, by Corporación Multi Inversiones) of the entire share capital of Telefónica Móviles Panamá, S.A. and Telefónica Celular de Nicaragua, S.A. The closing of the sale of these three companies is subject to the applicable regulatory conditions and will take place for each transaction once those conditions are satisfied. For additional information, see “-History and Development of the Company-Recent Developments”.
Total accesses
reached 73.6 million at December 31, 2018 (+1.4% year-on-year).
Mobile accesses
increased by 1.9% year-on-year to 68.0 million customers.
|
•
|
Contract
accesses increased 4.5% year-on-year, due to the good performance in almost all the countries in the region as a result in part of the Group’s continued focus on attracting high-value customers. Contract accesses grew in Mexico (+8.0%), Central America (+15.1%), Colombia (+2.7%) and Venezuela (+0.3%). Only Ecuador experienced a decrease in contract accesses (-1.6%).
|
|
•
|
Prepay
accesses increased 1.4% year-on-year, with positive net adds of 820 thousand accesses at December 31, 2018, mainly as a result of the evolution in Colombia (+1.0 million accesses) and Mexico (+1.1 million accesses), which was partially offset by Central America (-791 thousand accesses) and Venezuela (-637 thousand accesses).
|
|
•
|
The smartphone
customer base increased 7.6% year-on-year, reaching 32.0 million accesses (+2.3 million compared to December 31, 2017) with a mobile access penetration of 47.6% (+2.4 percentage points year-on-year), mainly due to Colombia (+15.2%), Central America (+22.5%) and Venezuela (+5.7%), which offset the evolution of Mexico (-1.9%). In addition, accesses with 4G handsets increased by 43.2%, reaching 19.5 million accesses at December 31, 2018.
|
Fixed accesses
stood at 3.2 million at December 31, 2018 (-10.8% year-on-year) with negative net adds of 385 thousand customers due to the erosion of the traditional fixed business.
Fixed broadband
accesses reached 1.3 million at December 31, 2018 (+8.8% year-on-year), mainly due to Mexico and Ecuador’s launch of the "Movistar al hogar" offer and a slight increase in FBB accesses in Colombia (+0.9%). The penetration of FBB accesses over fixed accesses stood at 41.2% (+7.4 percentage points year-on-year), as a result of the focus on UBB deployment mainly in Colombia, reaching 1.1 million real estate units and 304 thousand connected accesses at year-end 2018 (177 thousand of them connected in 2018). The penetration of UBB accesses over fixed broadband accesses stood at 23.3% (+12.7 percentage points year-on-year).
Pay TV
accesses stood at 1.0 million
,
increasing +2.6% year-on-year, as a result of positive net adds in Colombia (+18 thousand accesses) and Central America (+24 thousand accesses) which offset net negative adds in Venezuela (-16.5 thousand accesses). “Movistar Play”, a TV service rendered through the Internet, was launched in Colombia, Central America and Ecuador and accounted for 455 thousand accesses as of December 31, 2018.
The table below shows the evolution of Telefónica Hispam Norte results over the past two years:
61
|
Millions of euros
|
|
|
|
|
|
|
|||
|
TELEFÓNICA HISPAM NORTE
|
2017 (*)
|
|
2018
|
|
% Reported YoY
|
|
% Organic YoY (1)
|
|
|
|
Revenues
|
4,331
|
|
4,075
|
|
(5.9
|
%)
|
(1.2
|
%)
|
|
|
Mobile Business
|
3,595
|
|
3,343
|
|
(7.0
|
%)
|
(1.5
|
%)
|
|
|
Mobile service revenues
|
3,089
|
|
2,744
|
|
(11.2
|
%)
|
(5.0
|
%)
|
|
|
Fixed Business
|
736
|
|
732
|
|
(0.6
|
%)
|
(0.2
|
%)
|
|
|
Other income
|
114
|
|
229
|
|
100.4
|
%
|
69.1
|
%
|
|
|
Supplies
|
(1,385
|
)
|
(1,349
|
)
|
(2.6
|
%)
|
3.2
|
%
|
|
|
Personnel expenses
|
(375
|
)
|
(352
|
)
|
(6.1
|
%)
|
(2.1
|
%)
|
|
|
Other expenses
|
(1,422
|
)
|
(1,810
|
)
|
27.3
|
%
|
7.1
|
%
|
|
|
OIBDA
|
1,263
|
|
793
|
|
(37.2
|
%)
|
(8.7
|
%)
|
|
|
OIBDA margin
|
29.2
|
%
|
19.5
|
%
|
(9.7 p.p.)
|
|
(2.3 p.p.)
|
|
|
|
Depreciation and amortization
|
(992
|
)
|
(967
|
)
|
(2.5
|
%)
|
1.0
|
%
|
|
|
Operating income (OI)
|
271
|
|
(174
|
)
|
c.s.
|
|
(42.9
|
%)
|
|
|
CapEx
|
1,264
|
|
668
|
|
(47.1
|
%)
|
(26.8
|
%)
|
|
|
OpCF (OIBDA-CapEx)
|
—
|
|
125
|
|
n.m.
|
|
17.9
|
%
|
|
c.s.: change of sign.
n.m.: not meaningful
(*) Revised data.
(1) See adjustments made to calculate organic variation below.
Adjustments made to calculate organic variations
As explained above, year-on-year percentage changes referred to in this document as “organic” or presented in “organic terms” intend to present year-on-year variations on a comparable basis.
With respect to Telefónica Hispam Norte, we have made the following adjustments in order to calculate 2018/2017 variations in organic terms:
|
•
|
Exchange rate effects:
we have excluded the impact of changes in exchange rates by assuming constant average foreign exchange rates year-on-year (using the average foreign exchange rate of 2017 for both years), except for Venezuela (in respect of which 2017 and 2018 results were converted at the closing synthetic exchange rate for each period).
|
|
•
|
Restructuring costs:
we have excluded the impact of restructuring costs in 2018 and 2017, amounting to 18 and 24 million euros impact in OIBDA, respectively.
|
|
•
|
Results of tower sales:
the results attributable to the sale of towers have been excluded (51 million euros in 2018 and 7 million euros in 2017).
|
|
•
|
Spectrum acquisition:
the impact of spectrum acquisitions has been excluded in 2018 (135 million euros, mainly in Mexico) and 2017 (510 million euros, mainly in Colombia).
|
|
•
|
IFRS 15 impact:
the organic variations exclude the impact of the adoption of IFRS 15 in 2018.
|
|
•
|
Goodwill impairments:
impairment losses from goodwill in consolidation are excluded to calculate organic variations. In 2018, the impairment loss on the goodwill assigned to Telefónica Móviles Mexico amounting to 350 million euros was excluded. In 2017, no goodwill impairments were recorded.
|
|
•
|
Changes in the scope of consolidation:
we have excluded the impact of changes in our consolidation perimeter in 2018 and 2017. The main changes in our consolidation perimeter in such years related to the inclusion of the Colombian companies Telebucaramanga, Metrotel and Optecom in our consolidation perimeter since October 2017. No significant changes took place in the scope of consolidation of the Group in 2018.
|
To exclude the impact of the mentioned perimeter changes in the calculation of organic variations, the 2017 comparative figures include the results of Telebucaramanga, Metrotel and Optecom for the whole year.
62
|
•
|
Other adjustments:
the positive result of Telefónica Venezuela's tariff increases in the last quarter of 2017 is excluded (6 million euros in revenues and 2 million euros in OIBDA in 2017).
|
The table below shows 2018/2017 variations in reported and organic terms (the latter, calculated in accordance with the adjustments referred to above) of certain line items of the income statement and other measures, and the contribution of each item for which we have adjusted to our reported growth:
|
|
YoY variation
|
Contribution to reported growth (percentage points)
|
||||||||||||||||||
|
TELEFÓNICA HISPAM NORTE 2018
|
% Reported YoY
|
|
% Organic YoY
|
|
Exchange rate effect
|
|
Restructuring costs
|
|
Towers sales
|
|
Spectrum acquisition
|
|
IFRS 15 impact
|
|
Impairments
|
|
Perimeter change
|
|
Other adjustments
|
|
|
Revenues
|
(5.9
|
%)
|
(1.2
|
%)
|
(5.4
|
)
|
—
|
|
—
|
|
—
|
|
(0.1
|
)
|
—
|
|
0.8
|
|
(0.1
|
)
|
|
Other income
|
100.4
|
%
|
69.1
|
%
|
(11.0
|
)
|
—
|
|
42.2
|
|
—
|
|
—
|
|
—
|
|
2.6
|
|
—
|
|
|
Supplies
|
(2.6
|
%)
|
3.2
|
%
|
(5.7
|
)
|
—
|
|
—
|
|
—
|
|
0.3
|
|
—
|
|
(0.4
|
)
|
—
|
|
|
Personnel expenses
|
(6.1
|
%)
|
(2.1
|
%)
|
(5.2
|
)
|
(1.4
|
)
|
—
|
|
—
|
|
—
|
|
—
|
|
2.4
|
|
—
|
|
|
Other expenses
|
27.3
|
%
|
7.1
|
%
|
(5.9
|
)
|
—
|
|
0.1
|
|
—
|
|
0.1
|
|
24.4
|
|
1.4
|
|
—
|
|
|
OIBDA
|
(37.2
|
%)
|
(8.7
|
%)
|
(5.0
|
)
|
0.4
|
|
3.7
|
|
—
|
|
(0.7
|
)
|
(27.7
|
)
|
1.2
|
|
(0.1
|
)
|
|
CapEx
|
(47.1
|
%)
|
(26.8
|
%)
|
(3.1
|
)
|
—
|
|
—
|
|
(28.9
|
)
|
—
|
|
—
|
|
1.3
|
|
—
|
|
|
OpCF (OIBDA-CapEx)
|
n.m.
|
|
17.9
|
%
|
n.m.
|
|
n.m.
|
|
n.m.
|
|
n.m.
|
|
n.m.
|
|
n.m.
|
|
n.m.
|
|
n.m.
|
|
n.m.: not meaningful.
Results discussion
Revenues
amounted to 4,075 million euros in 2018, decreasing 5.9% year-on-year in reported terms. This decrease was mainly driven by the foreign exchange effect, which contributed 5.4 percentage points of the decrease, and the adoption of IFRS 15, which contributed 0.1 percentage points of the decrease. In organic terms, revenues decreased by 1.2% year-on-year, driven mainly by the interconnection tariff reductions in Mexico, which more than offset the increase in mobile handset sales and the positive evolution of residential postpaid, fixed broadband, new services and TV revenues.
Mobile service revenues
reached 2,744 million euros in 2018, decreasing 11.2% year-on-year in reported terms. This decrease was mainly driven by the foreign exchange effect, which contributed 5.2 percentage points to the decrease, and the adoption of IFRS 15, which contributed 1.0 percentage points of the decrease. Excluding these impacts, these revenues decreased by 5.0%. Mobile service revenues performance by country was as follows:
|
•
|
In Colombia, mobile service revenues reached 759 million euros in 2018, decreasing by 1.1% year-on-year in reported terms, driven by the foreign exchange effect, which contributed 4.8 percentage points to the decrease, and the adoption of IFRS 15, which contributed 0.7 percentage points to the decrease. Excluding these impacts, these revenues increased by 4.4% due to the positive evolution of prepay revenues, mobile IT services, mobile interconnection and national roaming which more than offset the drop in MVNOs revenues.
|
|
•
|
In Mexico, mobile service revenues reached 889 million euros in 2018, decreasing by 19.3% year-on-year in reported terms. This decrease was mainly attributable to the foreign exchange effect, which contributed 5.4 percentage points of the decrease, and the adoption of IFRS 15, which contributed 1.1 percentage points of the decrease. Excluding these impacts, these revenues decreased by 12.8%, principally due to the reduction of interconnection tariffs from 19.1 to 11.3 cents per minute (incoming) and the decrease in prepay revenues, affected by the decrease in top ups.
|
|
•
|
Data revenues
in the segment reached 1,564 million euros in 2018, decreasing by 6.8% year-on-year in reported terms. This decrease was mainly driven by the foreign exchange effect, which contributed 5.4 percentage points of the decrease, and the adoption of IFRS 15, which contributed 0.3 percentage points of the decrease. Excluding these impacts, data revenues decreased by 1.1%, as the decrease in data revenues in Mexico more than offset the growth of these revenues in other countries in the region.
|
|
•
|
Fixed business revenues
reached 732 million euros in 2018, decreasing by 0.6% year-on-year in reported terms. Excluding foreign exchange effects, which contributed 2.3 percentage points of the decrease, and the adoption
|
63
of IFRS 15, which contributed 2.9 percentage points of the decrease, these revenues decreased by 0.2% year-on-year, as the decline in accesses and voice revenues in Colombia more than offset the growth in TV and fixed broadband revenues.
OIBDA
reached 793 million euros in 2018, decreasing 37.2% year-on-year in reported terms, mainly as a result of the impairment of goodwill in Mexico, which contributed 27.7 percentage points of the decrease, foreign exchange effects, which contributed 5.0 percentage points of the decrease, and the adoption of IFRS 15, which contributed 0.7 percentage points of the decrease. In organic terms, OIBDA decreased by 8.7%, due to lower revenues and higher handsets, network and IT expenses. The higher expenses were mainly attributable to:
|
•
|
higher supply costs due to higher handsets costs driven by the increase of commercial activity in Mexico and Ecuador while interconnection costs remained stable, and
|
|
•
|
higher network expenses, due to the expansion of the fixed networks principally in Colombia and mobile networks both in Colombia and Central America.
|
T
he increases in expenses referred to above more than offset the decrease in personnel expenses mainly in Ecuador and Venezuela. Personnel expenses increased in Colombia and Central America.
Below is additional information by country:
|
•
|
Colombia: OIBDA amounted to 556 million euros in 2018, increasing 15.4% year-on-year in reported terms, despite the exchange rate evolution (which decreased growth by 5.6 percentage points). The adoption of IFRS 15 increased growth by 0.3 percentage points. Excluding these impacts, OIBDA increased by 20.7% due to the good performance of service revenues and the capital gains derived from the sale of buildings and towers.
|
|
•
|
Mexico: OIBDA amounted to 150 million euros in 2018, decreasing 50.4% year-on-year in reported terms, affected in part by the exchange rate effect (which contributed 3.3 percentage points to the decrease) and the adoption of IFRS 15 (which contributed 1.3 percentage points to the decrease). Excluding these impacts, OIBDA decreased by 45.7% as a result of the reduction of the interconnection margin, the payment of higher spectrum fees in October 2018 and the negative evolution of prepay revenues.
|
OIBDA margin
reached 19.5% in 2018, and decreased by 9.7 percentage points year-on-year in reported terms, mainly impacted by the lower margin in Mexico.
TELEFÓNICA HISPAM SUR
The below table shows the evolution of accesses in Telefónica Hispam Sur over the past two years as of December 31 of such years:
|
ACCESSES
|
|
|
|
|||
|
Thousands of accesses
|
2017 (*)
|
|
2018
|
|
%Reported
YoY
|
|
|
Fixed telephony accesses (1)
|
7,938.5
|
|
7,435.2
|
|
(6.3
|
%)
|
|
Internet and data accesses (2)
|
4,656.1
|
|
4,669.7
|
|
0.3
|
%
|
|
Broadband
|
4,535.4
|
|
4,549.5
|
|
0.3
|
%
|
|
FTTx/Cable
|
1,656.2
|
|
2,490.8
|
|
50.4
|
%
|
|
Mobile accesses
|
43,775.1
|
|
42,575.1
|
|
(2.7
|
%)
|
|
Prepay
|
27,631.8
|
|
25,571.6
|
|
(7.5
|
%)
|
|
Contract
|
16,143.3
|
|
17,003.5
|
|
5.3
|
%
|
|
M2M
|
1,199.8
|
|
1,457.7
|
|
21.5
|
%
|
|
Pay TV
|
2,050.3
|
|
2,209.9
|
|
7.8
|
%
|
|
Final Clients Accesses
|
58,419.9
|
|
56,889.9
|
|
(2.6
|
%)
|
|
Total Accesses
|
58,445.9
|
|
56,913.1
|
|
(2.6
|
%)
|
(*) Revised data.
(1) Includes "fixed wireless" and Voice over IP accesses.
64
(2) Also referred to as fixed broadband accesses.
Total accesses
reached 56.9 million at December 31, 2018 (-2.6% year-on-year).
Mobile accesses
fell by 2.7% year-on-year to 42.6 million customers in 2018, mainly due to a lower prepaid customer base.
|
•
|
Contract
accesses increased 5.3% year-on-year, with growth in all countries in the region, as a result in part of the Group’s continued focus on attracting high-value customers. Contract accesses grew in Chile (+12.5%), Argentina (+2.9%), Peru (+4.8%) and Uruguay (+1.7%).
|
|
•
|
Prepay
accesses decreased 7.5% year-on-year, with negative net adds of 2.1 million accesses at December 31, 2018, mainly as a result of the evolution in Chile (-892 thousand accesses) and Argentina (-810 thousand accesses), with Uruguay and Peru also reducing their accesses to a lesser extent. This evolution was mainly the result of intense market competition and the Group's continued focus on attracting high-value customers.
|
|
•
|
The
smartphone
customer base decreased 1.3% year-on-year at December 31, 2018, reaching 21.4 million accesses (-280 thousand compared to December 31, 2017) with a mobile access penetration of 51.3% (+0.6 percentage points year-on-year). The decrease was mainly attributable to the evolution in Peru (-4.5% year-on-year) and Argentina (-1.9% year-on-year), which more than offset the growth in Chile (+7.5% year-on-year) and Uruguay (+3.1% year-on-year). In addition, accesses with 4G handsets increased 27.5% year-on-year, reaching 16.0 million accesses by December 31, 2018.
|
Fixed accesses
stood at 7.4 million at December 31, 2018 (-6.3% year-on-year) with negative net adds of 503 thousand customers, due to the erosion of the traditional fixed business.
Fixed broadband
accesses reached 4.5 million at December 31, 2018 (+0.3% year-on-year), mainly as a result of the positive results in Peru (+10.1% year-on-year), which more than offset the decreases in accesses in Argentina (-9.1% year-on-year) and Chile (-1.1% year-on-year), as both operators focused on fiber (high-value customers), which negatively affected the growth in the copper business. The penetration of FBB accesses over fixed accesses stood at 61.2% (+4.0 percentage points year-on-year), as a result of the focus on UBB deployment in the region, reaching 8.3 million real estate units and 2.5 million connected accesses (+50.4% year-on-year). The penetration of UBB accesses over fixed broadband accesses stood at 54.7% (+18.2 percentage points year-on-year).
Pay TV accesses
stood at 2.2 million (+7.8% year-on-year) with net adds of 160 thousand accesses mainly due to positive results in Peru (+11.8% year-on-year). “Movistar Play”, a TV service rendered through the Internet, was launched in the region and accounted for 490 thousand accesses as of December 31, 2018.
The table below shows the evolution of Telefónica Hispam Sur results over the past two years:
65
|
Millions of euros
|
|
|
|
|
|
|
|||
|
TELEFÓNICA HISPAM SUR
|
2017 (*)
|
|
2018
|
|
% Reported YoY
|
|
% Organic YoY (1)
|
|
|
|
Revenues
|
8,218
|
|
6,677
|
|
(18.8
|
%)
|
9.6
|
%
|
|
|
Mobile Business
|
4,993
|
|
3,965
|
|
(20.6
|
%)
|
9.8
|
%
|
|
|
Mobile service revenues
|
4,319
|
|
3,115
|
|
(27.9
|
%)
|
5.9
|
%
|
|
|
Fixed Business
|
3,225
|
|
2,712
|
|
(15.9
|
%)
|
9.3
|
%
|
|
|
Other income
|
160
|
|
148
|
|
(7.5
|
%)
|
21.7
|
%
|
|
|
Supplies
|
(2,288
|
)
|
(2,051)
|
|
(10.4
|
%)
|
9.2
|
%
|
|
|
Personnel expenses
|
(1,269
|
)
|
(943)
|
|
(25.7
|
%)
|
12.6
|
%
|
|
|
Other expenses
|
(2,546
|
)
|
(2,112)
|
|
(17.1
|
%)
|
10.7
|
%
|
|
|
OIBDA
|
2,275
|
|
1,719
|
|
(24.4
|
%)
|
8.1
|
%
|
|
|
OIBDA margin
|
27.7
|
%
|
25.7
|
%
|
(1.9 p.p.)
|
|
(0.4 p.p.)
|
|
|
|
Depreciation and amortization
|
(1,198
|
)
|
(1,167)
|
|
(2.6
|
%)
|
0.6
|
%
|
|
|
Operating income (OI)
|
1,077
|
|
552
|
|
(48.7
|
%)
|
15.9
|
%
|
|
|
CapEx
|
1,414
|
|
1,116
|
|
(21.1
|
%)
|
8.0
|
%
|
|
|
OpCF (OIBDA-CapEx)
|
860
|
|
603
|
|
(29.9
|
%)
|
8.3
|
%
|
|
(1) See adjustments made to calculate organic variation below.
Adjustments made to calculate organic variations
As explained above, year-on-year percentage changes referred to in this document as “organic” or presented in “organic terms” intend to present year-on-year variations on a comparable basis.
With respect to Telefónica Hispam Sur, we have made the following adjustments in order to calculate 2018/2017 variations in organic terms:
|
•
|
Exchange rate effects and hyperinflation adjustments in Argentina:
we have excluded the impact of changes in exchange rates by assuming constant average foreign exchange rates year-on-year (using the average foreign exchange rates of 2017 for both years). In 2018, we have also excluded the impact of hyperinflation adjustments in Argentina.
|
|
•
|
Restructuring costs:
we have excluded the impact of restructuring costs in 2018 and 2017, amounting to a 50 and 79 million euros impact in OIBDA, respectively.
|
|
•
|
Spectrum acquisition:
the impact of spectrum acquisitions has been excluded in 2018 (21 million euros in Argentina) and 2017 (27 million euros in Uruguay).
|
|
•
|
IFRS 15 impact:
the organic variations exclude the impact of the adoption of IFRS 15 in 2018.
|
The table below shows 2018/2017 variations in reported and organic terms (the latter, calculated in accordance with the adjustments referred to above) of certain line items of the income statement and other measures, and the contribution of each item for which we have adjusted to our reported growth:
66
|
|
YoY variation
|
Contribution to reported growth (percentage points)
|
||||||||||
|
TELEFÓNICA HISPAM SUR 2018
|
% Reported YoY
|
|
% Organic YoY
|
|
Exchange rate effect and hyperinflation
|
|
Restructuring costs
|
|
Spectrum acquisition
|
|
IFRS 15 impact
|
|
|
Revenues
|
(18.8
|
%)
|
9.6
|
%
|
(28.0
|
)
|
—
|
|
—
|
|
(0.4
|
)
|
|
Other income
|
(7.5
|
%)
|
21.7
|
%
|
(25.4
|
)
|
—
|
|
—
|
|
(3.8
|
)
|
|
Supplies
|
(10.4
|
%)
|
9.2
|
%
|
(19.5
|
)
|
—
|
|
—
|
|
(0.0)
|
|
|
Personnel expenses
|
(25.7
|
%)
|
12.6
|
%
|
(36.0
|
)
|
(1.5
|
)
|
—
|
|
—
|
|
|
Other expenses
|
(17.1
|
%)
|
10.7
|
%
|
(27.3
|
)
|
—
|
|
—
|
|
(0.5
|
)
|
|
OIBDA
|
(24.4
|
%)
|
8.1
|
%
|
(32.6
|
)
|
0.9
|
|
—
|
|
(1.1
|
)
|
|
CapEx
|
(21.1
|
%)
|
8.0
|
%
|
(29.8
|
)
|
—
|
|
0.8
|
|
—
|
|
|
OpCF (OIBDA-CapEx)
|
(29.9
|
%)
|
8.3
|
%
|
(37.2
|
)
|
2.2
|
|
(1.3
|
)
|
(2.9
|
)
|
Results discussion
Revenues
amounted to 6,677 million euros in 2018, decreasing 18.8% year-on-year in reported terms. This decrease was mainly driven by the foreign exchange rate effect and hyperinflation in Argentina, which contributed 28.0 percentage points to the decrease, and the adoption of IFRS 15, which contributed 0.4 percentage points to the decrease. In organic terms, revenues grew 9.6% year-on-year, driven by the positive performance of both mobile and fixed revenues and the increase in handset sales, in spite of interconnection tariff reductions.
|
•
|
Mobile service revenues
reached 3,115 million euros in 2018, decreasing 27.9% year-on-year in reported terms. This decrease was mainly driven by the foreign exchange rate effect and hyperinflation in Argentina, which contributed 29.2 percentage points to the decrease, and the adoption of IFRS 15, which contributed 4.5 percentage points to the decrease. Excluding these effects, mobile service revenues grew by 5.9%. Mobile service revenues performance by country was as follows:
|
|
•
|
In Argentina, mobile service revenues reached 1,270 million euros in 2018, decreasing by 35.4% year-on-year in reported terms. This decrease was mainly due to the foreign exchange effect and hyperinflation, which contributed 49.8 percentage points to the decrease, and the adoption of IFRS 15, which contributed 9.1 percentage points to the decrease. Excluding these effects, these revenues grew by 23.5% due to the adjustment in tariffs in order to reflect the increase in inflation, a bigger customer base in postpaid and higher handsets revenues.
|
|
•
|
In Chile, mobile service revenues reached 905 million euros in 2018, decreasing by 15.3% year-on-year in reported terms, due mainly to the adoption of IFRS 15, which contributed 6.7 percentage points to the decrease, and the foreign exchange effect, which contributed 3.1 percentage points to the decrease. Excluding these impacts, these revenues decreased by 5.5%, as a result of increased commercial competition.
|
|
•
|
In Peru, mobile service revenues reached 748 million euros in 2018, decreasing by 30.2% year-on-year in reported terms mainly due to the adoption of IFRS 15, which contributed 11.2 percentage points to the decrease, and to the foreign exchange effect, which contributed 4.5 percentage points to the decrease. Excluding these impacts, these revenues decreased by 14.6% as a result of the smaller customer base, and increased competition in the market due to the entry of new competitors, which also had an adverse impact on ARPU.
|
|
•
|
Data revenues
in the segment reached 1,800 million euros in 2018, decreasing by 26.3% year-on-year in reported terms, due to the foreign exchange effect and hyperinflation in Argentina, which contributed 42.3 percentage points to the decrease, and the adoption of IFRS 15, which contributed 1.4 percentage points to the decrease. Excluding these effects, these revenues grew by 17.5% year-on-year mainly driven by higher data revenues in Argentina, which more than offset the decrease in Peru and Chile.
|
|
•
|
Fixed business revenues
reached 2,712 million euros in 2018, decreasing by 15.9% year-on-year in reported terms. Excluding foreign exchange effects and hyperinflation in Argentina (-24.9 percentage points), and the adoption of IFRS 15 (-0.3 percentage points), these revenues grew by 9.3% year-on-year due to higher fixed
|
67
broadband revenues and accesses and voice revenues in Argentina due to tariff adjustments, higher speed offers and the increase in high-value customers.
OIBDA
reached 1,719 million euros in 2018, decreasing 24.4% year-on-year in reported terms, mainly as a result of the foreign exchange effect and hyperinflation in Argentina, which contributed 32.6 percentage points to the decrease, and the adoption of IFRS 15, which contributed 1.1 percentage points to the decrease. In organic terms, OIBDA increased by 8.1%, due to the increase in revenues which more than offset the increase in handset, network and IT expenses. The increase in expenses was mainly attributable to:
|
•
|
higher supply costs due to higher handsets costs driven by the increase in commercial activity, partially offset by the lower interconnection costs in all countries in the region, except Argentina and Chile;
|
|
•
|
higher personnel expenses driven by the increased inflation in some countries of the region, which were partially offset by the savings resulting from the restructuring plans carried out during 2018 in Chile; and
|
|
•
|
higher network expenses, mainly in Peru and Argentina, due to the expansion of the fixed and mobile networks, as well as a result of inflation and the depreciation of Latin American currencies against the U.S. dollar.
|
Below is additional information by country:
|
•
|
Argentina: OIBDA amounted to 669 million euros in 2018, decreasing by 31.1% in reported terms. The exchange rate effect and hyperinflation (-71.2 percentage points) and the adoption of IFRS 15 (-0.2 percentage points) contributed significantly to this decrease. Excluding these effects, OIBDA grew by 40.3% year-on-year, thanks to the positive performance of revenues, which offset the effect of higher expenses as a result of inflation. Customer service expenses also increased as a result of changes in IT systems aimed at providing a better service and unifying the brand name. Personnel expenses increased as a result of inflation.
|
|
•
|
Chile: OIBDA amounted to 617 million euros in 2018, decreasing 2.1% year-on-year in reported terms due to the exchange rate evolution (which contributed 3.5 percentage points to the decrease) and the adoption of IFRS 15 (which contributed 3.6 percentage points to the decrease). Excluding these effects, OIBDA increased by 5.0%, due to efficiency efforts carried out throughout the year which resulted in a decrease in costs that more than offset the decrease in revenues.
|
|
•
|
Peru: OIBDA amounted to 350 million euros in 2018, decreasing 40.5% in reported terms. Excluding the impact of the exchange rate effect (which contributed 3.3 percentage points to the decrease) and the adoption of IFRS 15 (which contributed 0.1 percentage points to the decrease), OIBDA decreased by 37.1%, as a result of the decrease in revenues and the higher commercial expenses incurred with the objective of turning around last year’s commercial trend. The increased commercial activity in 2018 resulted in an increase in the customer base.
|
OIBDA margin
reached 25.7% in 2018, decreasing by 1.9 percentage points year-on-year in reported terms, mainly impacted by the lower margin in Peru.
68
2017
Highlights
2017 was characterized by positive growth in OIBDA and operating cash flow (OIBDA-CapEx), up by 7.1% and by 21.0% respectively year-on-year in reported terms. Furthermore, the Company continued its transformation process with 44.4 million premises passed ready to use FTTx, additionally, the LTE coverage reached 72% as of December 31, 2017 (+10.5 percentage points year-on-year), as a result of which the CapEx over revenues ratio remained at 16.7%. The Company closed the year with a total of 343 million accesses (down 1.9% year-on-year), explained by the decrease in prepay and fixed voice. In line with our strategic focus to grow in high-value customers, post-pay customers grew by 4.6% year-on-year, reaching 116 million customers, while UBB customers reached 11 million customers at December 31, 2017, representing a 20% increase year-on-year.
In 2017,
revenues
totaled 52,008 million euros, down 0.1% compared to 2016 in reported terms (+3.4% in organic terms).
OIBDA
totaled 16,187 million euros in 2017, up 7.1% in reported terms. In organic terms, OIBDA was up 5.3%, mainly due to the positive evolution of all regions and offsetting the lower service revenues in Spain. In 2017, operating income was 6,791 million euros, up by 24.2% as compared to 2016 in reported terms (+14.1% in organic terms), which included depreciation and amortization of 9,396 million euros, down by 2.6% as compared to 2016 in reported terms.
Telefónica's
total accesses
totaled 343.5 million as of December 31, 2017, decreasing by 1.9% year-on-year, mainly as a result of the reduction of the prepay base in Telefónica Hispam Norte, Telefónica Hispam Sur and Telefónica Germany. By service, commercial activity related to high value customers increased, resulting in a growth of the contract mobile segment (smartphones and LTE), fiber and Pay TV. Accesses in Telefónica Hispam Sur decreased by 5.8% year-on-year (representing 17.0% of the Group’s total accesses as of December 31, 2017), accesses in Telefónica Germany decreased by 3.5% (representing 13.9% of the Group's total accesses as of December 31, 2017) and accesses in Telefónica Hispam Norte decreased by 1.7% year-on-year (representing 21.1% of the Group's total accesses as of December 31, 2017).
The below table shows the evolution of accesses for 2016 and 2017 as of December 31 of such years:
|
ACCESSES
|
|
|||||
|
Thousands of accesses
|
2016
|
|
2017
|
|
%Reported
YoY |
|
|
Fixed telephony accesses (1)
|
38,280.1
|
|
36,898.6
|
|
(3.6
|
%)
|
|
Internet and data accesses (2)
|
21,652.1
|
|
21,864.6
|
|
1.0
|
%
|
|
Broadband (3)
|
21,194.9
|
|
21,417.5
|
|
1.1
|
%
|
|
FTTx/Cable
|
9,137.6
|
|
10,961.6
|
|
20.0
|
%
|
|
Mobile accesses
|
276,450.0
|
|
271,766.9
|
|
(1.7
|
%)
|
|
Prepay
|
165,663.2
|
|
155,868.5
|
|
(5.9
|
%)
|
|
Contract
|
110,786.8
|
|
115,898.4
|
|
4.6
|
%
|
|
M2M
|
14,002.0
|
|
16,137.2
|
|
15.2
|
%
|
|
Pay TV
|
8,289.0
|
|
8,467.7
|
|
2.2
|
%
|
|
Final Clients Accesses
|
344,671.1
|
|
338,997.9
|
|
(1.6
|
%)
|
|
Wholesale Accesses
|
5,300.9
|
|
4,460.2
|
|
(15.9
|
%)
|
|
Total Accesses
|
349,972.1
|
|
343,458.1
|
|
(1.9
|
%)
|
(2) Also referred to as fixed broadband accesses.
(3) Includes DSL, satellite, optic fiber, cable modem and broadband circuits.
69
The below table shows the evolution of accesses by segment:
|
|
YoY variation
|
% Over Total Accesses
|
|
|
Accesses 2017
|
2016
|
2017
|
|
|
Telefónica Spain
|
(0.6%)
|
11.8%
|
11.9%
|
|
Telefónica United Kingdom
|
(1.7%)
|
7.4%
|
7.4%
|
|
Telefónica Germany
|
(3.5%)
|
14.1%
|
13.9%
|
|
Telefónica Brazil
|
0.7%
|
27.8%
|
28.5%
|
|
Telefónica Hispam Norte
|
(1.7%)
|
21.1%
|
21.1%
|
|
Telefónica Hispam Sur
|
(5.8%)
|
17.7%
|
17.0%
|
|
Other companies
|
28.9%
|
0.1%
|
0.2%
|
Mobile accesses
totaled 271.8 million at December 31, 2017, down 1.7% compared to December 31, 2016. The decrease in prepay accesses (-5.9% year-on-year) more than offset the increase in accesses in mobile contract (+4.6% year-on-year), which continued to increase their weight over total mobile accesses reaching 42.6% (+2.6 percentage points year-on-year).
Smartphone
accesses
grew (up 7.9% year-on-year), totaling 158.7 million accesses and reaching a penetration rate over total accesses of 63.0% (+5.9 percentage points year-on-year), reflecting the Company’s strategic focus on the growth of its data services.
Fixed broadband accesses
stood at 21.4 million at December 31, 2017, up 1.1% year-on-year. Fiber accesses stood at 11.0 million at December 31, 2017 compared to 9.1 million in 2016.
Pay TV accesses
totaled 8.5 million as of December 31, 2017, growing 2.2% year-on-year, due to the growth in Telefónica Spain (+5.2% year-on-year), that expanded its TV offer to the whole Fusión base and in Telefónica Hispam Sur (+5.9% year-on-year) where all countries offering this service grew.
The table below shows the evolution of our estimated access market share for mobile and fixed broadband during 2016 and 2017.
|
Competitive Position Evolution
|
|
|
|
|
Mobile Market Share (1)
|
|
|
Telefónica
|
2016
|
2017
|
|
Spain
|
29.7%
|
29.3%
|
|
United Kingdom
|
26.9%
|
26.3%
|
|
Germany
|
37.9%
|
36.9%
|
|
Brazil
|
30.2%
|
31.7%
|
|
Argentina
|
33.3%
|
32.8%
|
|
Chile
|
32.6%
|
32.2%
|
|
Peru
|
44.0%
|
36.8%
|
|
Colombia
|
23.4%
|
24.4%
|
|
Venezuela
|
37.8%
|
39.1%
|
|
Mexico
|
24.2%
|
22.0%
|
|
Central America
|
29.9%
|
28.4%
|
|
Ecuador
|
30.7%
|
30.0%
|
|
Uruguay
|
33.0%
|
34.2%
|
70
|
|
FBB Market Share (1)
|
|
|
Telefónica
|
2016
|
2017
|
|
Spain
|
42.5%
|
40.6%
|
|
Brazil
|
27.9%
|
26.5%
|
|
Argentina
|
28.4%
|
24.1%
|
|
Chile
|
36.5%
|
34.6%
|
|
Peru
|
78.7%
|
73.9%
|
|
Colombia
|
16.3%
|
15.3%
|
2017/2016 Consolidated results
In this section, we discuss changes in the Group’s consolidated income statements for 2017 and 2016.
|
|
Year ended December 31,
|
|
|
Variation
|
||||||||
|
Consolidated Results
|
2016
|
2017
|
2017 vs 2016
|
|||||||||
|
Millions of euros
|
Total
|
|
% of revenues
|
|
Total
|
|
% of revenues
|
|
Total
|
|
%
|
|
|
Revenues
|
52,036
|
|
100.0
|
%
|
52,008
|
|
100.0
|
%
|
(28
|
)
|
(0.1
|
%)
|
|
Other income
|
1,763
|
|
3.4
|
%
|
1,489
|
|
2.9
|
%
|
(274
|
)
|
(15.5
|
%)
|
|
Supplies
|
(15,242
|
)
|
(29.3
|
%)
|
(15,022
|
)
|
(28.9
|
%)
|
220
|
|
(1.4
|
%)
|
|
Personnel expenses
|
(8,098
|
)
|
(15.6
|
%)
|
(6,862
|
)
|
(13.2
|
%)
|
1,236
|
|
(15.3
|
%)
|
|
Other expenses
|
(15,341
|
)
|
(29.5
|
%)
|
(15,426
|
)
|
(29.7
|
%)
|
(85
|
)
|
0.5
|
%
|
|
OPERATING INCOME BEFORE DEPRECIATION AND AMORTIZATION (OIBDA)
|
15,118
|
|
29.1
|
%
|
16,187
|
|
31.1
|
%
|
1,069
|
|
7.1
|
%
|
|
OIBDA Margin
|
29.1
|
%
|
31.1
|
%
|
2.1 p.p.
|
|
||||||
|
Depreciation and amortization
|
(9,649
|
)
|
(18.5
|
%)
|
(9,396
|
)
|
(18.1
|
%)
|
253
|
|
(2.6
|
%)
|
|
OPERATING INCOME
|
5,469
|
|
10.5
|
%
|
6,791
|
|
13.1
|
%
|
1,322
|
|
24.2
|
%
|
|
Share of (loss) income of investments accounted for by the equity method
|
(5
|
)
|
0.0
|
%
|
5
|
|
0.0
|
%
|
10
|
|
c.s.
|
|
|
Net financial expense
|
(2,219
|
)
|
(4.3
|
%)
|
(2,199
|
)
|
(4.2
|
%)
|
20
|
|
(0.9
|
%)
|
|
PROFIT BEFORE TAX
|
3,245
|
|
6.2
|
%
|
4,597
|
|
8.8
|
%
|
1,352
|
|
41.6
|
%
|
|
Corporate income tax
|
(846
|
)
|
(1.6
|
%)
|
(1,219
|
)
|
(2.3
|
%)
|
(373
|
)
|
44.1
|
%
|
|
PROFIT FOR THE YEAR
|
2,399
|
|
4.6
|
%
|
3,378
|
|
6.5
|
%
|
979
|
|
40.8
|
%
|
|
Attributable to equity holders of the Parent
|
2,369
|
|
4.6
|
%
|
3,132
|
|
6.0
|
%
|
763
|
|
32.2
|
%
|
|
Attributable to non-controlling interests
|
30
|
|
0.1
|
%
|
246
|
|
0.5
|
%
|
216
|
|
n.m.
|
|
c.s.: change of sign
n.m.: not meaningful
Adjustments made to calculate organic variations
Year-on-year percentage changes referred to in this document as “organic” or presented in “organic terms” intend to present year-on-year variations on a comparable basis, by considering a constant perimeter of consolidation and constant average foreign exchange rates and by making certain other adjustments which are described herein. “Organic" variations should not be viewed in isolation or as an alternative to reported variations.
For purposes of this report, 2017/2016 “organic” variation is defined as the reported variation as adjusted to exclude the impacts detailed below:
|
•
|
Foreign exchange effects and hyperinflation adjustments in Venezuela:
we have excluded the impact of changes in exchange rates by assuming constant average foreign exchange rates year-on-year. In particular, we have used the average foreign exchange rates of 2016 for both years.
|
71
Foreign exchange rates had a negative impact on our reported 2017 results, mainly due to the depreciation versus the euro of various Latin American currencies (in particular the Venezuela bolivar and the Argentine peso) and the pound sterling.
The impact of hyperinflation adjustments in Venezuela has been excluded by reversing such adjustments.
Foreign exchange effects and hyperinflation in Venezuela decreased revenue growth by 3.2 percentage points and OIBDA growth by 4.7 percentage points.
|
•
|
Changes in the scope of consolidation:
we have excluded the impact of changes in our consolidation perimeter in 2017 and 2016. The main changes in our consolidation perimeter in such years related to the sale of Telefé and the sale of Telecomunicaciones Personalizadas in the last quarter of 2016, and the inclusion of the Colombian companies Telebucaramanga, Metrotel and Optecom in our consolidation perimeter since October 2017.
|
To exclude the impact of the mentioned perimeter changes in the calculation of organic variations, the 2016 comparative figures exclude the consolidated results of Telefé and Telecomunicaciones Personalizadas, and in 2017 we exclude the results of Telebucaramanga, Metrotel and Optecom.
|
•
|
Restructuring costs:
we have excluded the impact in 2017 and 2016 of restructuring costs, mainly those related to the first Collective Agreement of Related Companies in Spain (Individual Suspension Plan), restructuring processes relating to Telefónica Germany, Telefónica Hispam Norte and Telefónica Hispam Sur, and the Group’s simplification program in global areas.
|
The distribution by segment of the restructuring costs was as follows (impacts on OIBDA):
|
Millions of euros
|
2016
|
|
2017
|
|
|
Telefónica Spain
|
837
|
|
165
|
|
|
Telefónica Brazil
|
40
|
|
-
|
|
|
Telefónica Germany
|
89
|
|
82
|
|
|
Telefónica United Kingdom
|
37
|
|
-
|
|
|
Telefónica Hispam Norte
|
18
|
|
24
|
|
|
Telefónica Hispam Sur
|
66
|
|
79
|
|
|
Other companies
|
293
|
|
(10
|
)
|
|
Total restructuring costs
|
1,380
|
|
340
|
|
|
•
|
Results of tower sales:
the results attributable to the sale of towers in 2017 and 2016 have been excluded.
|
In 2017, the impact on OIBDA from the sale of towers totaled 7 million euros, mainly in Telefónica Hispam Norte.
In 2016, the impact on OIBDA from the sale of towers totaled 1 million euros, mainly in Telefónica Hispam Norte.
|
•
|
Spectrum acquisition:
we have excluded the impact of spectrum acquisitions in 2017 and 2016.
|
In 2017, these acquisitions totaled 538 million euros, 470 million euros corresponding to Telefónica Colombia, 4 million euros corresponding to Telefónica México, 36 million euros corresponding to Telefónica Central America (21 million euros in Costa Rica and 15 million euros in El Salvador), 27 million euros corresponding to Telefónica Uruguay and 1 million euros corresponding to Telefónica Germany.
In 2016, these acquisitions totaled 345 million euros, 284 million euros corresponding to Telefónica Peru, 48 million euros corresponding to Telefónica Brazil, 7 million euros corresponding to Telefónica Spain and 6 million euros corresponding to Telefónica Germany.
|
•
|
Gains or losses on the sale of companies:
the gains obtained or losses incurred from the sale of companies have been excluded from calculations of organic variations.
|
In 2017 no results were recorded related to sales of companies. In 2016, the 199 million euros in profit obtained from the sale of Telefé and the 29 million euros obtained from the sale of Telecomunicaciones Personalizadas were excluded. Similarly, the loss of 16 million euros incurred in the sale of Vocem was also excluded.
72
|
•
|
Impairment of goodwill:
the impairment losses on goodwill are excluded in calculations of organic variations.
|
In 2017, no goodwill impairments were recorded. The comparative base for 2016 excludes the impairment of the goodwill allocated to Telefónica Venezolana and Telefónica Móviles México, amounting to 124 million euros and 91 million euros, respectively.
|
•
|
Other adjustments:
the impact of the provision of certain regulatory contingencies is excluded in 2017, amounting to 50 million euros in Telefónica Brazil and 57 million euros in other companies, as well as the provisions recorded in Telefónica Spain to optimize the distribution network in the amount of 13 million euros in 2017 and 18 million euros in 2016. Also the positive result of Telefónica Venezuela tariff increases in the last quarter of 2017 is excluded (6 million euros in revenues and 2 million euros in OIBDA).
|
The table below shows 2017/2016 variations in reported and organic terms (the latter, calculated in accordance with the adjustments referred to above) of certain line items of the consolidated income statement and CapEx and OIBDA-CapEx
:
|
|
YoY variation
|
|||
|
TELEFÓNICA 2017
|
% Reported YoY
|
|
% Organic
YoY |
|
|
Revenues
|
(0.1
|
%)
|
3.4
|
%
|
|
Other income
|
(15.5
|
%)
|
(3.6
|
%)
|
|
Supplies
|
(1.4
|
%)
|
0.6
|
%
|
|
Personnel expenses
|
(15.3
|
%)
|
3.0
|
%
|
|
Other expenses
|
0.5
|
%
|
3.7
|
%
|
|
OIBDA
|
7.1
|
%
|
5.3
|
%
|
|
Operating income
|
24.2
|
%
|
14.1
|
%
|
|
CapEx
|
(2.6
|
%)
|
(1.2
|
%)
|
|
OpCF (OIBDA-CapEx)
|
21.0
|
%
|
12.2
|
%
|
The table below shows the contribution to reported growth of each item considered to calculate the organic variations, as explained above. For each line item, the contribution to reported growth, expressed in percentage points, is the result of dividing the amount of each impact (on a net basis when the impact affects both years) by the consolidated reported figure for the previous year.
|
|
Contribution to reported growth (percentage points)
|
|||||||||||||||
|
TELEFÓNICA 2017
|
Exchange rate effect and hyperinflation
|
|
Perimeter change
|
|
Restructuring costs
|
|
Towers sales
|
|
Spectrum acquisition
|
|
Capital gains/losses on sale of companies
|
|
Impairments
|
|
Other adjustments
|
|
|
Revenues
|
(3.2
|
)
|
(0.3
|
)
|
—
|
|
—
|
|
—
|
|
—
|
|
—
|
|
—
|
|
|
Other income
|
0.1
|
|
—
|
|
—
|
|
0.4
|
|
—
|
|
(12.9
|
)
|
—
|
|
—
|
|
|
Supplies
|
(1.8
|
)
|
(0.2
|
)
|
—
|
|
—
|
|
—
|
|
—
|
|
—
|
|
—
|
|
|
Personnel expenses
|
(4.3
|
)
|
(0.8
|
)
|
(12.7
|
)
|
—
|
|
—
|
|
—
|
|
—
|
|
—
|
|
|
Other expenses
|
(4.5
|
)
|
(0.1
|
)
|
—
|
|
—
|
|
—
|
|
(0.1
|
)
|
(1.4
|
)
|
3.2
|
|
|
OIBDA
|
(4.7
|
)
|
(0.2
|
)
|
6.8
|
|
—
|
|
—
|
|
(1.4
|
)
|
1.4
|
|
(0.6
|
)
|
|
Operating Income
|
(10.7
|
)
|
(0.5
|
)
|
18.9
|
|
0.1
|
|
—
|
|
(3.9
|
)
|
3.9
|
|
(1.8
|
)
|
|
CapEx
|
(3.6
|
)
|
—
|
|
—
|
|
—
|
|
2.2
|
|
—
|
|
—
|
|
—
|
|
|
OpCF (OIBDA-CapEx)
|
(6.4
|
)
|
(0.4
|
)
|
16.7
|
|
0.1
|
|
(3.1
|
)
|
(3.4
|
)
|
3.5
|
|
(1.6
|
)
|
Results discussion
Revenues
totaled 52,008 million euros in 2017, decreasing 0.1% compared to 2016 in reported terms, impacted by the negative evolution in foreign exchange rates and hyperinflation in Venezuela (-3.2 percentage points year-on-year)
73
and the changes in the consolidating perimeter (-0.3 percentage points year-on-year), which offset the higher revenues of Telefónica Hispam Norte, Telefónica Hispam Sur, Telefónica Brazil and Telefónica United Kingdom. In organic terms (for additional information on organic variations, see "Adjustments made to calculate organic variations"), revenues increased by 3.4%. The
structure of revenues
reflects Telefónica’s business diversification. The segment with the largest contribution to our revenues was Telefónica Spain, representing 24.3% (-0.3 percentage points compared to 2016), followed by Telefónica Brazil, representing 23.1% (+1.8 percentage points compared to 2016), and Telefónica Hispam Sur, representing 15.8% (+0.7 percentage points compared to 2016).
Since January 1, 2017 Mobile Service Revenues (mainly data revenue) and Fixed revenues were revised due to different allocation criteria. For comparative purposes, these numbers for 2016 are reported using the same criteria. This change does not affect the total Mobile Business Revenues figures reported for 2016.
Mobile business revenues
totaled 32,827 million euros in 2017 (of which 28,677 million euros corresponded to service revenues and 4,150 million euros corresponded to handset revenues), up 1.2% year-on-year in reported terms as a result of the higher revenues of Telefónica Hispam Sur, Telefónica Brazil and Telefónica United Kingdom, which were partially offset by the negative impact of the evolution in foreign exchange rates and hyperinflation in Venezuela (-4.1 percentage points year-on-year). In organic terms, mobile business revenues grew by 5.3% despite the regulatory impacts affecting interconnection revenues in some operators of the Group.
Mobile service revenues,
which include mobile data revenues, totaled 28,677 million euros in 2017, up 0.9% year-on-year in reported terms mainly explained by higher data consumption. Excluding the impact of changes in foreign exchange rates and hyperinflation in Venezuela the growth was 5.1%.
Mobile data revenues
totaled 16,942 million euros in 2017, up 11.5% in reported terms mainly due to higher consumption of data by our customers. Excluding the impact of changes in foreign exchange rates and hyperinflation in Venezuela (-5.4 percentage points year-on-year), the growth of mobile data revenues was 16.8% as a result of the popularization of the use of data with the growth of commercial plans including data-inclusive prepay plans. Mobile data revenues accounted for 59.1% of mobile service revenues in 2017, up 5.6 percentage points compared to 2016 in reported terms.
Fixed revenues
totaled
18,331 million euros in 2017, up 1.8% year-on-year in reported terms, despite the negative impact of changes in foreign exchange rates and hyperinflation in Venezuela (-0.1 percentage points year-on-year). Excluding such impact, fixed revenues increased by 1.9% mainly as a result of higher broadband connection revenues and Pay TV revenues due to the commercial actions carried out by the Company in order to increase our value proposition by giving even more speed to our customers.
Other income
totaled 1,489 million euros in 2017, which mainly included own work capitalized in our fixed assets and the profit from the sale of other assets.
In 2016, other income also included the profit obtained from the sale of Telefé (199 million euros) and Telecomunicaciones Personalizadas (29 million euros).
Total expenses
, which include supply costs, personnel costs and other expenses (principally external services and taxes) but do not include amortization and depreciation expenses, amounted to 37,310 million euros in 2017, down 3.5% year-on-year in reported terms. This decrease was mainly attributable to the impact of changes in foreign exchange rates and hyperinflation in Venezuela (-3.4 percentage points year-on-year) and to lower restructuring costs in 2017 (-2.7 percentage points year-on-year). These costs are explained in detail below:
|
•
|
Supplies
amounted to 15,022 million euros in 2017, down 1.4% year-on-year in reported terms mainly as a result of the impact of foreign exchange rates and hyperinflation in Venezuela (-1.8 percentage points). In organic terms, supplies expenses increased by 0.6% year-on-year, mainly due to higher handset costs.
|
|
•
|
Personnel expenses
amounted to 6,862 million euros in 2017, down 15.3% year-on-year in reported terms. This decrease was mainly attributable to lower restructuring costs in 2017 (303 million euros in 2017 versus 1,336 million euros in 2016). In organic terms, personnel costs increased 3.0% year-on-year mainly due to inflationary pressure in some Latin American countries.
|
The average headcount was 125,371 employees in 2017, down 5.1% compared to 2016.
|
•
|
Other expenses
amounted to 15,426 million euros in 2017, up 0.5% year-on-year in reported terms, mainly as a result of inflationary pressure in some Latin American countries and the depreciation of certain Latin American currencies against the U.S. dollar, which offset the impact of foreign exchange rates and hyperinflation
|
74
in Venezuela (-4.5 percentage points). There were also increases in network costs, as a result of the growth in data traffic, and higher systems costs, due to the transformation process of our systems which require us to have both systems cohabitating, as we are still decommissioning some IT systems. In organic terms, other expenses increased by 3.7% year-on-year.
OIBDA
was 16,187 million euros in 2017, up 7.1% in reported terms, mainly due to the lower restructuring costs in 2017 compared to 2016 (+6.8 percentage points), partially offset by the impact of foreign exchange rates and hyperinflation in Venezuela (-4.7 percentage points). In organic terms, OIBDA grew by 5.3% mainly due to the positive evolution of service revenues and the continuous effort to contain costs.
OIBDA margin
stood at 31.1% in 2017, up 2.1 percentage points compared to 2016 in reported terms.
By segments, the main contributors to Group OIBDA were: Telefónica Spain with 30.6% (+1.5 percentage points compared to 2016), Telefónica Brazil with 25.9% (+1.4 percentage points compared to 2016) and Telefónica Hispam Sur with 14.1% (reducing its contribution by 1.6 percentage points compared to 2016 due to the lower contribution of Peru and Chile).
Depreciation and amortization
amounted to 9,396 million euros in 2017, down 2.6% year-on-year in reported terms, mainly due to the impact of foreign exchange rates and hyperinflation in Venezuela (-1.3 percentage points) and lower amortization in Telefónica Spain and Telefónica Germany.
Operating income (OI)
in 2017 totaled 6,791 million euros, up 24.2% in reported terms (14.1% in organic terms).
The
share of income (loss) of investments accounted for by the equity method
for 2017 was a gain of 5 million euros (compared to a loss of 5 million euros in 2016).
Net financial results
amounted to a loss of 2,199 million euros in 2017, 0.9% lower than the previous year, due to a lower cost of debt in European and Latin American currencies, which was partially offset by a lower impact associated to Venezuela and by not generating this year the savings from 2016 in FX hedging linked to Telefónica United Kingdom.
Corporate income tax
amounted to 1,219 million euros in 2017. Considering a profit before taxes of 4,597 million euros, the effective tax rate stood at 26.5%, in line with the previous year (26.1%).
As a result,
profit for the year attributable to equity holders of the parent
for 2017 was 3,132 million euros (2,369 million euros in 2016).
Profit attributable to non-controlling interests
was 246 million euros, 216 million euros higher than in 2016, mainly due to the increase in the profit attributable to minority interests at Telefónica Brazil and Telefónica Colombia and lower loss attributable to Telefónica Germany.
2017/2016 Segment results
TELEFÓNICA SPAIN
The below table shows the evolution of accesses in Telefónica Spain for 2016 and 2017 as of December 31 of such years:
75
|
ACCESSES
|
|
|||||
|
Thousands of accesses
|
2016
|
|
2017
|
|
%Reported
YoY
|
|
|
Fixed telephony accesses (1)
|
9,720.2
|
|
9,304.7
|
|
(4.3
|
%)
|
|
Internet and data accesses (2)
|
6,094.5
|
|
6,039.6
|
|
(0.9
|
%)
|
|
Broadband
|
6,067.3
|
|
6,020.3
|
|
(0.8
|
%)
|
|
FTTH
|
2,998.3
|
|
3,423.7
|
|
14.2
|
%
|
|
Mobile accesses
|
17,237.7
|
|
17,576.5
|
|
2.0
|
%
|
|
Prepay
|
2,329.3
|
|
1,793.4
|
|
(23.0
|
%)
|
|
Contract
|
14,908.4
|
|
15,783.1
|
|
5.9
|
%
|
|
M2M
|
2,006.3
|
|
2,015.6
|
|
0.5
|
%
|
|
Pay TV
|
3,657.0
|
|
3,847.6
|
|
5.2
|
%
|
|
Final Clients Accesses
|
36,709.4
|
|
36,768.5
|
|
0.2
|
%
|
|
Wholesale Accesses
|
4,525.5
|
|
4,221.1
|
|
(6.7
|
%)
|
|
Total Accesses
|
41,234.9
|
|
40,989.6
|
|
(0.6
|
%)
|
(1) Includes "fixed wireless" and Voice over IP accesses.
(2) Also referred to as fixed broadband accesses.
In 2017 the commercial activity continued to leverage the differentiated assets of the Company, mainly through the convergent offer (which means the offer of more than a single service for a single price) “Movistar Fusión+” and the "Más por Más” strategy. The Company continued to evolve the above mentioned offer and to adapt it to incremental customer demand mainly through the rise of data in all mobile lines included in the Fusión portfolio. In addition, in July 2017 the portfolio was increased with the launching of two new options for “Fusión +” (“Fusión Series” and “Fusión #0”) which include TV services and its functionalities in all the convergent portfolio.
In 2017 Consumer “Fusión” churn rose up to 1.5% (+0.2 percentage points year-on-year), reflecting increased commercial competition in the market during the year. Broadband accesses decreased by 47 thousand year-on-year and fixed telephony accesses net loss, reached 416 thousand customers. On the other hand, high-value accesses such as fiber accesses, increased by 425 thousand and mobile contract accesses increased by 875 thousand, showing the success of the convergent strategy (which means the offer of more than a single service for a single price) that from 2017 includes a second mobile line in all “Fusión” tariffs additional to the main line that was already included in the package.
Telefónica Spain had 41.0 million
accesses
at the end of December 2017, down 0.6% year-on-year, explained by the decrease in prepay mobile accesses, fixed telephony accesses as well as copper wholesale accesses. Retail accesses increased by 0.2% year-on-year.
Consumer
“
Movistar Fusión
”, with a customer base of 4.4 million with 3.7 million additional mobile add-ons to the original offer as of December 31, 2017, maintained a solid year-on-year growth (+2.1% and +45.2% respectively compared to December 31, 2016) and contributed 85.5% of the fixed retail broadband customer base (+2.2 percentage points year-on-year) and 79.3% of the wireless contract customer base (+6.2 percentage points year-on-year). There was significant growth in the penetration of the high-value services of “Movistar Fusión”, with 38.4% of the customer base already using 300 Mb ultra-fast broadband (+1.7 percentage points year-on-year) and 75.6% of the customer base having Pay TV as of December 31, 2017 (+7.7 percentage points year-on-year), as well as growth in mobile lines (each main Fusión package had 1.8 mobile lines in average compared to 1.6 in 2016).
Retail broadband accesses
decreased 47 thousand accesses in 2017, totaling 6 million accesses (-0.8% year-on-year).
Fiber accesses
showed a good evolution in terms of net adds, reaching 3.4 million customers at December 31, 2017 (up 14.2% compared to December 31, 2016), representing 56.9% of broad band accesses (+7.5 percentage points year-on-year), with 425 thousand new accesses in 2017. Ultra-speed fiber accesses with 300 Mb (with additional ARPU of 10-12 euros, including VAT) reached 2.2 million accesses (64.5% of total fiber accesses). At December 31, 2017 the fiber deployment reached 19.2 million premises, 2.1 million more than at December 31, 2016, and continues to be the largest in Europe.
76
Total
mobile accesses
stood at 17.6 million, up 2.0% compared with year-end 2016 as a result of the increase in contract accesses and despite the decrease in prepay accesses, reflecting the success of the convergent strategy and the good evolution of the mobile number portability in the last quarter of the year, boosted by the improvement of the portability offer. The contract access base accelerated its growth during 2017, growing by 5.9% year-on-year. Smartphone penetration stood at 76.4% of the mobile voice base (+5.6 percentage points compared to year-end 2016) and significantly boosted data traffic which grew by 110.8% year-on-year in 2017 due to the higher number of customers with the renewed portfolio containing superior data packages.
LTE network rollout continued to progress and coverage reached approximately 97% (criteria based on competitors' calculation by summing up all inhabitants of the cities with some LTE coverage) of the population at December 31, 2017, up 0.7 percentage points compared to December 31, 2016. As a result, the LTE customer base was over 7.6 million customers at December 31, 2017, while penetration reached 49.4% (+9.5 percentage points year-on-year) over the total mobile base.
Pay TV accesses
reached 3.8 million at the end of 2017, growing by 5.2% compared to December 31, 2016 driven by the inclusion of TV services in all “Fusión” portfolio convergent packages since July 2017.
Wholesale accesses
stood at 4.2 million
at the end of 2017, decreasing by 6.7% year-on-year, however NEBA (New Ethernet Broad Band Service for Wholesale) Fiber accesses net adds increased to 850 thousand accesses, representing 20.1% of total wholesale accesses (+12.9 percentage points year-on-year) and reflecting the positive evolution of the network due to the use of superior technologies.
The table below shows Telefónica Spain’s results for 2016 and 2017:
|
Millions of euros
|
|
|
|
|
|
|
|
|
|
TELEFÓNICA SPAIN
|
2016
|
|
2017
|
|
%Reported
YoY
|
|
%Organic
YoY (3)
|
|
|
Revenues
|
12,815
|
|
12,653
|
|
(1.3
|
%)
|
(1.2
|
%)
|
|
Consumer (1)
|
6,536
|
|
6,602
|
|
1.0
|
%
|
1.0
|
%
|
|
Fusión
|
4,096
|
|
4,470
|
|
9.1
|
%
|
9.1
|
%
|
|
Out of Fusión
|
2,440
|
|
2,132
|
|
(12.6
|
%)
|
(12.6
|
%)
|
|
Corporate
|
3,445
|
|
3,401
|
|
(1.3
|
%)
|
(1.3
|
%)
|
|
Communications
|
2,721
|
|
2,631
|
|
(3.3
|
%)
|
(3.3
|
%)
|
|
IT
|
724
|
|
770
|
|
6.4
|
%
|
6.4
|
%
|
|
Others (2)
|
2,337
|
|
2,271
|
|
(2.8
|
%)
|
(2.5
|
%)
|
|
Other income
|
474
|
|
410
|
|
(13.5
|
%)
|
(8.0
|
%)
|
|
Supplies
|
(3,406
|
)
|
(3,481
|
)
|
2.2
|
%
|
2.2
|
%
|
|
Personnel expenses
|
(3,022
|
)
|
(2,212
|
)
|
(26.8
|
%)
|
(6.3
|
%)
|
|
Other expenses
|
(2,458
|
)
|
(2,418
|
)
|
(1.6
|
%)
|
(1.4
|
%)
|
|
OIBDA
|
4,403
|
|
4,952
|
|
12.5
|
%
|
(1.8
|
%)
|
|
OIBDA Margin
|
34.4
|
%
|
39.1
|
%
|
4.8 p.p.
|
|
(0.2 p.p.)
|
|
|
Depreciation and amortization
|
(1,827
|
)
|
(1,688
|
)
|
(7.6
|
%)
|
(7.6
|
%)
|
|
Operating income (OI)
|
2,576
|
|
3,264
|
|
26.7
|
%
|
1.3
|
%
|
|
CapEx
|
1,852
|
|
1,683
|
|
(9.1
|
%)
|
(8.8
|
%)
|
|
OpCF (OIBDA-CapEx)
|
2,551
|
|
3,269
|
|
28.2
|
%
|
2.0
|
%
|
(1) Consumer revenues also include freelance revenues.
(2) Other includes wholesale, subsidiaries and other revenues.
(3) See adjustments made to calculate organic variation below.
Adjustments made to calculate organic variations
As explained above, year-on-year percentage changes referred to in this document as “organic” or presented in “organic terms” intend to present year-on-year variations on a comparable basis.
With respect to Telefónica Spain, we have made the following adjustments in order to calculate 2017/2016 variations in organic terms:
77
|
•
|
Changes in the scope of consolidation:
the main change in 2017 as compared with the previous year related to the sale of Telecomunicaciones Personalizadas in the last quarter of 2016.
|
|
•
|
Restructuring costs:
the impact of certain restructuring costs related to the Individual Suspension Plan and other plans in Spain amounting to 165 million and 837 million euros in 2017 and 2016, respectively, were excluded.
|
|
•
|
Spectrum acquisition:
we have excluded the impact of spectrum acquisitions in 2016, which totaled 7 million euros. During 2017 no acquisitions were made.
|
|
•
|
Gains or losses on the sale of companies:
in the comparative base of 2016, the gain obtained from the sale of Telecomunicaciones Personalizadas for 29 million euros was excluded.
|
|
•
|
Optimization of the distribution network:
the impact of the provisions recorded totaling 13 and 18 million euros in 2017 and 2016, respectively, were excluded.
|
The table below shows 2017/2016 variations in reported and organic terms (the latter, calculated in accordance with the adjustments referred to above) of certain line items of the income statement and other measures, and the contribution of each item for which we have adjusted to our reported growth:
|
|
YoY variation
|
Contribution to reported growth (percentage points)
|
||||||||||||
|
TELEFÓNICA SPAIN
2017 |
%Reported
YoY
|
|
%Organic
YoY
|
|
Perimeter change
|
|
Restructuring costs
|
|
Spectrum acquisition
|
|
Capital Gains/losses on sale of companies
|
|
Spain distribution network
|
|
|
Revenues
|
(1.3
|
%)
|
(1.2
|
%)
|
(0.1
|
)
|
—
|
|
—
|
|
—
|
|
—
|
|
|
Other income
|
(13.5
|
%)
|
(8.0
|
%)
|
—
|
|
—
|
|
—
|
|
(6.0
|
)
|
—
|
|
|
Supplies
|
2.2
|
%
|
2.2
|
%
|
—
|
|
—
|
|
—
|
|
—
|
|
—
|
|
|
Personnel expenses
|
(26.8
|
%)
|
(6.3
|
%)
|
—
|
|
(22.3
|
)
|
—
|
|
—
|
|
—
|
|
|
Other expenses
|
(1.6
|
%)
|
(1.4
|
%)
|
—
|
|
—
|
|
—
|
|
—
|
|
(0.2
|
)
|
|
OIBDA
|
12.5
|
%
|
(1.8
|
%)
|
(0.1
|
)
|
15.3
|
|
—
|
|
(0.7
|
)
|
0.1
|
|
|
CapEx
|
(9.1
|
%)
|
(8.8
|
%)
|
—
|
|
—
|
|
(0.4
|
)
|
—
|
|
—
|
|
|
OpCF (OIBDA-CapEx)
|
28.2
|
%
|
2.0
|
%
|
(0.2
|
)
|
26.4
|
|
0.3
|
|
(1.1
|
)
|
0.2
|
|
Results discussion
Revenues in Telefónica Spain in 2017 were 12,653 million euros, down 1.3% year-on-year in reported terms mainly as a result of the decrease in handset revenues. In organic terms (excluding Telecomunicaciones Personalizadas from the consolidation perimeter), revenues were down 1.2% year-on-year.
Given the high penetration level of convergent offers (which means the offer of more than a single service for a single price), the revenue breakdown by service is considered to be increasingly less relevant. For this reason, Telefónica Spain has established a revenue breakdown that management believes is more meaningful.
|
•
|
Consumer revenues
(6,602 million euros in 2017) grew by 1.0% year-on-year in reported terms mainly driven by the growth in ARPU and in the number of customers as well as a significant improvement in the customers' mix. It is worth highlighting the strong growth in "Fusión" revenues during 2017 (4,470 million euros, +9.1% year-on-year in reported terms) which more than offset the drop in "non-Fusión" revenues.
|
|
•
|
Business revenues
(3,401 million euros in 2017) decreased by 1.3% year-on-year in reported terms, mainly due to a better evolution in the communications revenues trend and higher IT revenues.
|
|
•
|
Other revenues
, which include wholesale, subsidiaries and other revenues (2,271 million euros in 2017) decreased by 2.8% year-on-year in reported terms, due mainly to lower wholesale revenues from TV and MVNOs and, to a lesser extent, to the effect of price regulatory changes applicable throughout 2017 (affecting NEBA (New Ethernet Broad Band Service for Wholesale), ORLA (leased lines reference offer including Ethernet interfaces), etc.).
|
78
Fusión ARPU
rose to 85.1 euros in 2017, up 5.8% year-on-year in reported terms, boosted by the demand of higher value packages and the tariff revisions, as well as the improvement in the customers' mix stimulated by the renovation of our portfolio including additional mobile lines, additional contents as well as an improvement in functionalities in the convergent offers.
OIBDA
amounted to 4,952 million euros in 2017, up 12.5% year-on-year in reported terms. In 2016, OIBDA was adversely affected by the provisions recorded in connection with the restructuring costs resulting from the extension to 2018 of the ‘Individual Suspension Plan’ and other restructuring plans (837 million euros) and the restructuring of the distribution channel (18 million euros). In 2017, OIBDA included lower provisions related mainly to the ‘Individual Suspension Plan’ as a result of its increased acceptance (165 million euros), which we expect will result in further cost savings, and the restructuring of the distribution channel (13 million euros).
In organic terms, OIBDA decreased 1.8% year-on-year, mainly due to the lower wholesale revenues and higher content costs, partially offset by the decrease in personnel expenses. Personnel expenses decreased 6.3% year-on-year in organic terms driven by the savings generated by the ‘Individual Suspension Plan’ (158 million euros). On the other hand, the increase in supplies (+2.2% in reported terms) which were impacted by higher content costs and IT equipment purchases, were partially offset by the other expenses, which dropped 1.6% in reported terms principally due to lower commercial costs.
OIBDA margin
was 39.1% in 2017 in reported terms, down 4.8 percentage points year-on-year in reported terms.
TELEFÓNICA UNITED KINGDOM
The table below shows the evolution of accesses in Telefónica United Kingdom for 2016 and 2017 as of December 31 of such years:
|
ACCESSES
|
|
|||||
|
Thousands of accesses
|
2016
|
|
2017
|
|
%Reported YoY
|
|
|
Fixed telephony accesses (1)
|
272.6
|
|
283.9
|
|
4.1
|
%
|
|
Internet and data accesses (2)
|
23.7
|
|
25.3
|
|
6.6
|
%
|
|
Broadband
|
23.7
|
|
25.3
|
|
6.6
|
%
|
|
Mobile accesses
|
25,462.7
|
|
25,003.9
|
|
(1.8
|
%)
|
|
Prepay
|
9,701.4
|
|
9,203.7
|
|
(5.1
|
%)
|
|
Contract
|
15,761.3
|
|
15,800.2
|
|
0.2
|
%
|
|
M2M
|
3,266.9
|
|
3,358.9
|
|
2.8
|
%
|
|
Final Clients Accesses
|
25,759.0
|
|
25,313.1
|
|
(1.7
|
%)
|
|
Total Accesses
|
25,759.0
|
|
25,313.1
|
|
(1.7
|
%)
|
(1) Includes "fixed wireless" and Voice over IP accesses.
(2) Also referred to as fixed broadband accesses.
In 2017, Telefónica United Kingdom maintained a competitive position which has been underpinned by the strength of the O2 brand, new and innovative commercial propositions and customer experience. These factors have allowed the Company to maintain customer loyalty and continue to keep growing in high-value customers in a competitive market.
The
total access
base went down by 1.7% year-on-year and stood at 25.3 million at December 31, 2017, mainly driven by a 1.8% decline in the mobile customer base.
The
contract mobile
customer
base grew 0.2% year-on-year and stood at 15.8 million accesses, with a broadly stable 63.2% share over the total mobile base. Mobile accesses decreased by 459 thousand customers, driven by higher volatility in the prepay customer base (which decreased 5.1% year-on-year to 9.2 million at December 31, 2017) and 228 thousand inactive disconnections in postpay. Smartphone penetration reached 76.5% of the total mobile accesses base, up 8.1 percentage points year-on-year. LTE customers, increased by 6.6% year-on-year reaching 12.9 million at December 31, 2017. LTE penetration reached 59.6% of the total mobile access base.
79
The table below shows the evolution of Telefónica United Kingdom's results for 2016 and 2017:
|
Millions of euros
|
|
|
|
|
|
|
|
|
|
TELEFÓNICA UNITED KINGDOM
|
2016
|
|
2017
|
|
%Reported
YoY
|
|
%Organic
YoY (1)
|
|
|
Revenues
|
6,861
|
|
6,540
|
|
(4.7
|
%)
|
2.2
|
%
|
|
Mobile service revenues (2)
|
5,363
|
|
5,050
|
|
(5.8
|
%)
|
1.0
|
%
|
|
Other income
|
148
|
|
135
|
|
(9.0
|
%)
|
(2.4
|
%)
|
|
Supplies
|
(3,226
|
)
|
(3,125
|
)
|
(3.1
|
%)
|
3.9
|
%
|
|
Personnel expenses
|
(528
|
)
|
(442
|
)
|
(16.2
|
%)
|
(3.4
|
%)
|
|
Other expenses
|
(1,546
|
)
|
(1,469
|
)
|
(5.0
|
%)
|
1.9
|
%
|
|
OIBDA
|
1,709
|
|
1,639
|
|
(4.1
|
%)
|
0.7
|
%
|
|
OIBDA Margin
|
24.9
|
%
|
25.1
|
%
|
0.1 p.p.
|
|
(0.4 p.p.)
|
|
|
Depreciation and amortization
|
(1,090
|
)
|
(1,047
|
)
|
(4.0
|
%)
|
3.0
|
%
|
|
Operating Income (OI)
|
619
|
|
592
|
|
(4.3
|
%)
|
(3.1
|
%)
|
|
CapEx
|
931
|
|
827
|
|
(11.2
|
%)
|
(4.8
|
%)
|
|
OpCF (OIBDA-CapEx)
|
778
|
|
812
|
|
4.4
|
%
|
6.9
|
%
|
(1) See adjustments made to calculate organic variation below.
(2) Mobile service revenues include revenues from MVNOs since January 1, 2017, which were previously accounted as "Handset revenues and others"; these criteria are applied across Telefónica Group. For comparative purposes, mobile services and handset revenues for 2016 are reported using the same criteria.
Adjustments made to calculate organic variations
As explained above, year-on-year percentage changes referred to in this document as “organic” or presented in “organic terms” intend to present year-on-year variations on a comparable basis.
With respect to Telefónica United Kingdom, we have made the following adjustments in order to calculate 2017/2016 variations in organic terms:
|
•
|
Exchange rate effect:
we have excluded the impact of changes in exchange rates by assuming constant average foreign exchange rates year-on-year. In particular, we have used the average foreign exchange rates of 2016 for both years.
|
|
•
|
Restructuring costs:
we have excluded the impact in 2017 and 2016 of restructuring costs, amounting to 314 thousand euros and 37 million euros, respectively.
|
The table below shows 2017/2016 variations in reported and organic terms (the latter, calculated in accordance with the adjustments referred to above) of certain line items of the income statement and other measures, and the contribution of each item for which we have adjusted to our reported growth:
|
|
YoY variation
|
Contribution to reported growth (percentage points)
|
||||||
|
TELEFÓNICA UNITED KINGDOM
|
% Reported YoY
|
|
% Organic YoY
|
|
Exchange rate effect
|
|
Restructuring costs
|
|
|
2017
|
||||||||
|
Revenues
|
(4.7
|
%)
|
2.2
|
%
|
(6.9
|
)
|
—
|
|
|
Other income
|
(9.0
|
%)
|
(2.4
|
%)
|
(6.6
|
)
|
—
|
|
|
Supplies
|
(3.1
|
%)
|
3.9
|
%
|
(7.0
|
)
|
—
|
|
|
Personnel expenses
|
(16.2
|
%)
|
(3.4
|
%)
|
(6.1
|
)
|
(7.0
|
)
|
|
Other expenses
|
(5.0
|
%)
|
1.9
|
%
|
(6.9
|
)
|
—
|
|
|
OIBDA
|
(4.1
|
%)
|
0.7
|
%
|
(7.0
|
)
|
2.2
|
|
|
CapEx
|
(11.2
|
%)
|
(4.8
|
%)
|
(6.4
|
)
|
—
|
|
|
OpCF (OIBDA-CapEx)
|
4.4
|
%
|
6.9
|
%
|
(7.6
|
)
|
4.8
|
|
Results discussion
80
Total
revenues
were 6,540 million euros in 2017, down by 4.7% year-on-year in reported terms mainly due to the depreciation of the pound sterling (which accounted for 6.9 percentage points of the year-on-year decrease). In organic terms, revenues increased by 2.2% year-on-year due mainly to higher mobile service revenues and the handset revenues growth as well as revenues linked to M2M programs.
|
•
|
Mobile service revenues
totaled 5,050 million euros in 2017, down by 5.8% year-on-year in reported terms due mainly to the depreciation of the pound sterling (which accounted for 6.8 percentage points of the year-on-year decrease). Excluding this impact, mobile service revenues grew by 1.0% due to the increase in "In-Bundle" tariffs (which are linked to the RPI (Retail Price Index)) and the higher data consumption that offset the significant negative impact from changes in the European roaming regulation that became effective on June 15, 2017.
|
Mobile
ARPU
decreased by 6.5% year-on-year in reported terms due mainly to the depreciation of the pound sterling. In organic terms,
ARPU
increased by 0.3% with a data ARPU growth of 1.1% year-on-year, despite the significant negative impact from changes in the European roaming regulation, due to the growth of high-speed network penetration that led to the increased adoption of high end tariffs by our customers.
|
TELEFÓNICA UNITED KINGDOM
|
2016
|
|
2017
|
|
%YoY
|
|
%Organic
YoY
|
|
|
Voice Traffic (millions of minutes)
|
93,306
|
|
94,723
|
|
1.5
|
%
|
1.5
|
%
|
|
ARPU (EUR)
|
17.0
|
|
15.9
|
|
(6.5
|
%)
|
0.3
|
%
|
|
Prepay
|
7.5
|
|
6.9
|
|
(7.0
|
%)
|
0.3
|
%
|
|
Contract (1)
|
28.8
|
|
26.8
|
|
(6.8
|
%)
|
0.2
|
%
|
|
Data ARPU (EUR)
|
10.3
|
|
9.7
|
|
(5.8
|
%)
|
1.1
|
%
|
|
% non-SMS over data revenues (2)
|
64.2
|
%
|
65.5
|
%
|
1.3 p.p.
|
|
1.3 p.p.
|
|
(1) Excludes M2M.
(2) Mobile data revenues have been revised, for comparative purposes mobile data revenues for 2016 are reported using the same criteria.
OIBDA
totaled 1,639 million euros in 2017, down by 4.1% year-on-year in reported terms, mainly as a result of the depreciation of the pound sterling. In organic terms, OIBDA increased by 0.7% year-on-year mainly as a result of higher mobile service revenues (+1.0% year-on-year in organic terms) despite the significant negative impact from the new European roaming regulation (RLAH "Roaming Like at Home") and the costs growth, associated with 4G network deployment needed to support the higher data traffic demand.
The
OIBDA
margin
stood at 25.1% in reported terms in 2017, with an increase of 0.1 percentage points compared to 2016.
TELEFÓNICA GERMANY
81
The below table shows the evolution of accesses in Telefónica Germany for 2016 and 2017 as of December 31 of such years:
|
ACCESSES
|
|
|||||
|
Thousands of accesses
|
2016
|
|
2017
|
|
% Reported YoY
|
|
|
Fixed telephony accesses (1)
|
2,010.3
|
|
1,979.6
|
|
(1.5
|
%)
|
|
Internet and data accesses (2)
|
2,324.5
|
|
2,281.5
|
|
(1.9
|
%)
|
|
Broadband
|
2,104.0
|
|
2,072.2
|
|
(1.5
|
%)
|
|
FTTx
|
805.5
|
|
1,151.6
|
|
43.0
|
%
|
|
Mobile accesses
|
44,320.7
|
|
43,154.7
|
|
(2.6
|
%)
|
|
Prepay
|
23,784.0
|
|
21,880.9
|
|
(8.0
|
%)
|
|
Contract
|
20,536.6
|
|
21,273.8
|
|
3.6
|
%
|
|
M2M
|
787.8
|
|
1,027.0
|
|
30.4
|
%
|
|
Final Clients Accesses
|
48,655.5
|
|
47,415.8
|
|
(2.5
|
%)
|
|
Wholesale Accesses
|
691.0
|
|
188.1
|
|
(72.8
|
%)
|
|
Total Accesses
|
49,346.4
|
|
47,603.9
|
|
(3.5
|
%)
|
(1) Includes "fixed wireless" and Voice over IP accesses.
(2) Also referred to as fixed broadband accesses.
During 2017 Telefónica Germany maintained solid operational momentum in a dynamic competitive environment increasingly focused on the monetization opportunity driven by large data packages. Data usage showed significant year-on-year growth, supported by the good reception from new and existing customers of the O2 Free 15th anniversary promotions and the new O2 Free portfolio.
The
total access
base decreased 3.5% year-on-year and stood at 47.6 million at December 31, 2017, mainly driven by a 2.6% decrease in the mobile base (which fell to 43.2 million).
The
contract
mobile customer base grew 3.6% year-on-year and reached 21.3 million accesses, with a broadly stable 49.3% share over the total mobile base. Net adds reached 0.7 million contract accesses due to the solid contribution of partners (second brands) and increasing demand for tariffs with large data volumes. Smartphone penetration reached 60.9% of the total mobile access base, up 1.4 percentage points year-on-year driven by the continued growth of LTE customers (+31% year-on-year reaching 15.8 million at December 31, 2017) which reflects the continuous demand by customers for high speed mobile data access. LTE penetration reached 37.4% of the total mobile access base.
The
prepay
mobile access base decreased 8.0% year-on-year to 21.9 million. The prepay segment lost 1.9 million accesses in 2017 mainly due to a technical base adjustment of 1.2 million inactive users driven by IT-harmonization after systems integration and the implementation of regulatory changes (mainly, the need for a legitimation check for prepay SIM-cards as well as requirements applicable to European travelers).
The retail broadband net additions were negative in 2017 with 31.8 thousand accesses. VDSL accesses grew driven by strong demand with 346 thousand net additions in 2017 (+19.9% year-on-year), while the wholesale DSL customer base continued to fall according to the planned dismantling of the old legacy infrastructure.
The table below shows the evolution of Telefónica Germany’s results for 2016 and 2017:
82
|
Millions of euros
|
|
|
|
|
|
|
|
|
|
TELEFÓNICA GERMANY
|
2016
|
|
2017
|
|
%Reported
YoY
|
|
%Organic
YoY (1)
|
|
|
Revenues
|
7,503
|
|
7,296
|
|
(2.8
|
%)
|
(2.8
|
%)
|
|
Mobile Business
|
6,498
|
|
6,415
|
|
(1.3
|
%)
|
(1.3
|
%)
|
|
Mobile service revenues
|
5,437
|
|
5,287
|
|
(2.8
|
%)
|
(2.8
|
%)
|
|
Fixed Business
|
981
|
|
862
|
|
(12.2
|
%)
|
(12.2
|
%)
|
|
Other income
|
146
|
|
159
|
|
9.2
|
%
|
9.2
|
%
|
|
Supplies
|
(2,452
|
)
|
(2,396
|
)
|
(2.3
|
%)
|
(2.6
|
%)
|
|
Personnel expenses
|
(646
|
)
|
(642
|
)
|
(0.6
|
%)
|
(0.3
|
%)
|
|
Other expenses
|
(2,780
|
)
|
(2,596
|
)
|
(6.6
|
%)
|
(6.6
|
%)
|
|
OIBDA
|
1,771
|
|
1,821
|
|
2.8
|
%
|
2.9
|
%
|
|
OIBDA Margin
|
23.6
|
%
|
25.0
|
%
|
1.4 p.p.
|
|
1.4 p.p.
|
|
|
Depreciation and amortization
|
(2,200
|
)
|
(1,954
|
)
|
(11.2
|
%)
|
(10.9
|
%)
|
|
Operating Income (OI)
|
(429
|
)
|
(133
|
)
|
(69.1
|
%)
|
(85.3
|
%)
|
|
CapEx
|
1,107
|
|
951
|
|
(14.2
|
%)
|
(13.7
|
%)
|
|
OpCF (OIBDA-CapEx)
|
664
|
|
870
|
|
31.1
|
%
|
27.4
|
%
|
(1) See adjustments made to calculate organic variation below.
Adjustments made to calculate organic variations
As explained above, year-on-year percentage changes referred to in this document as “organic” or presented in “organic terms” intend to present year-on-year variations on a comparable basis.
With respect to Telefónica Germany, we have made the following adjustments in order to calculate 2017/2016 variations in organic terms:
|
•
|
Restructuring costs:
we have excluded the impact of restructuring costs associated with simplification processes implemented in Germany. In 2017, restructuring costs had an 82 million euros impact on OIBDA. In 2016, restructuring costs had an 89 million euros impact on OIBDA.
|
|
•
|
Spectrum acquisition:
the CapEx organic variation exclude spectrum acquisition, which in 2017 amounted to 1 million euros (6 million euros in 2016).
|
|
•
|
Changes in the scope of consolidation
: in 2016, we have excluded the results of four months of the tower business transferred to Telxius on May 1, 2016, which had a 12 million euros impact on OIBDA (11 million euros on OpCF).
|
The table below shows 2017/2016 variations in reported and organic terms (the latter, calculated in accordance with the adjustments referred to above) of certain line items of the income statement measures and CapEX and the contribution of each item for which we have adjusted to our reported growth:
|
|
YoY variation
|
Contribution to reported growth (percentage points)
|
||||||||
|
TELEFÓNICA GERMANY 2017
|
%Reported YoY
|
|
%Organic YoY
|
|
Restructuring costs
|
|
Spectrum acquisition
|
|
Perimeter change
|
|
|
Revenues
|
(2.8
|
%)
|
(2.8
|
%)
|
—
|
|
—
|
|
—
|
|
|
Other income
|
9.2
|
%
|
9.2
|
%
|
—
|
|
—
|
|
—
|
|
|
Supplies
|
(2.3
|
%)
|
(2.6
|
%)
|
—
|
|
—
|
|
0.3
|
|
|
Personnel expenses
|
(0.6
|
%)
|
(0.3
|
%)
|
(0.3
|
)
|
—
|
|
—
|
|
|
Other expenses
|
(6.6
|
%)
|
(6.6
|
%)
|
(0.2
|
)
|
—
|
|
0.1
|
|
|
OIBDA
|
2.8
|
%
|
2.9
|
%
|
0.4
|
|
—
|
|
(0.7
|
)
|
|
CapEx
|
(14.2
|
%)
|
(13.7
|
%)
|
—
|
|
(0.5
|
)
|
(0.1
|
)
|
|
OpCF (OIBDA-CapEx)
|
31.1
|
%
|
27.4
|
%
|
1.1
|
|
0.8
|
|
(1.7
|
)
|
83
Results discussion
Total
revenues
were 7,296 million euros in 2017 down 2.8% year-on-year in reported terms due mainly to the lower service revenues.
Mobile
service revenues
totaled 5,287 million euros in 2017, decreasing 2.8% year-on-year in reported terms due to the negative impact of regulatory developments (termination rate cuts and European roaming regulation), OTT trends, the higher share of wholesale revenues and the ongoing legacy base rotation. Telefónica Germany continued to focus on data revenues, which decreased by 0.2% and accounted for 56% of mobile service revenues in 2017. Non-P2P SMS data revenues amounted to 2,398 million euros (increasing +5.0% year-on-year) and accounted for 80.3% of the total data revenues (+4.0 percentage points year-on-year).
Fixed revenues
were 862 million euros in 2017 (down 12.2% year-on-year), as a result of the lower year-on-year customer base in retail DSL and the planned phasing-out of the wholesale DSL business.
Mobile ARPU
was 9.7 euros in 2017 (down 5.7% year-on-year), while contract ARPU stood at 15.5 euros (down 6.0% year-on-year), as a result of the regulatory developments, high pricing pressure in a competitive market, a higher share of wholesale customers in the customer base and the consequent change in the weight of retail to wholesale. Data ARPU was 5.6 euros (down 2.8% year-on-year).
|
TELEFÓNICA GERMANY
|
2016
|
|
2017
|
|
%YoY
|
|
|
Voice Traffic (millions of minutes)
|
113,896
|
|
98,084
|
|
(13.9
|
%)
|
|
ARPU (EUR)
|
10.3
|
|
9.7
|
|
(5.7
|
%)
|
|
Prepay
|
5.7
|
|
5.2
|
|
(8.5
|
%)
|
|
Contract (1)
|
16.5
|
|
15.5
|
|
(6.0
|
%)
|
|
Data ARPU (EUR)
|
5.7
|
|
5.6
|
|
(2.8
|
%)
|
|
% non-SMS over data revenues (2)
|
76.3
|
%
|
80.3
|
%
|
4.0 p.p.
|
|
(1) Excludes M2M.
(2) Mobile data revenues have been revised, for comparative purposes mobile data revenues for 2016 are reported using the same criteria.
OIBDA
totaled 1,821 million euros in 2017, increasing 2.8% year-on-year in reported terms. In organic terms, OIBDA grew by 2.9% year-on-year, driven by the integration synergies captured (as a consequence of the integration of activities after the E-Plus acquisition in 2014) and the capital gains on the sale of assets, which offset the decrease in service revenues as a result of the impact of regulation and the continued commercial investments to drive O2 brand positioning.
The
OIBDA margin
stood at 25.0% in reported terms for 2017, up 1.4 percentage points compared to 2016.
TELEFÓNICA BRAZIL
The below table shows the evolution of accesses in Telefónica Brazil for 2016 and 2017 as of December 31 of such years:
84
|
ACCESSES
|
|
|||||
|
Thousands of accesses
|
2016
|
|
2017
|
|
%Reported YoY
|
|
|
Fixed telephony accesses (1)
|
14,338.4
|
|
13,837.3
|
|
(3.5
|
%)
|
|
Internet and data accesses (2)
|
7,383.2
|
|
7,534.5
|
|
2.0
|
%
|
|
Broadband
|
7,311.0
|
|
7,466.1
|
|
2.1
|
%
|
|
FTTx/Cable
|
4,145.8
|
|
4,541.0
|
|
9.5
|
%
|
|
Mobile accesses
|
73,769.8
|
|
74,931.3
|
|
1.6
|
%
|
|
Prepay
|
40,387.2
|
|
38,168.1
|
|
(5.5
|
%)
|
|
Contract
|
33,382.6
|
|
36,763.2
|
|
10.1
|
%
|
|
M2M
|
5,005.1
|
|
6,312.5
|
|
26.1
|
%
|
|
Pay TV
|
1,712.7
|
|
1,587.7
|
|
(7.3
|
%)
|
|
Final Clients Accesses
|
97,204.2
|
|
97,890.8
|
|
0.7
|
%
|
|
Wholesale Accesses
|
17.9
|
|
14.3
|
|
(20.4
|
%)
|
|
Total Accesses
|
97,222.2
|
|
97,905.1
|
|
0.7
|
%
|
(1) Includes "fixed wireless" and Voice over IP accesses.
(2) Also referred to as fixed broadband accesses.
Telefónica Brazil closed the year 2017 improving its competitive position in the mobile market. In the mobile business, leadership was maintained in the higher value segments, which permitted the operator to capture mobile market revenue growth in 2017. In the fixed business, the transformation towards value-added clients resulted in the increase in fiber in broadband and in IPTV in the Pay TV business.
Revenues and OIBDA evolution was positively supported by the acceleration of mobile adoption and the good evolution of fiber and IPTV. Additionally, Telefónica Brazil carried out cost control measures and generated benefits from the synergies with GVT that offset the negative impacts of adverse political conditions in Brazil, the aggressiveness of competitors and the worsening of the traditional fixed business.
However, results in 2017 were adversely affected by the interconnection tariff reduction in the mobile business (-45.6%), in the retail fixed-mobile tariff (-17.7%), in the fixed-local tariff (-35.3%) and in the fixed-interurban tariff (-50.9%) since February 25, 2017.
Telefónica Brazil reached 97.9 million
accesses
at December 31, 2017, up 0.7% compared with December 31, 2016.
In the
mobile business
, the strategic focus remained on gaining and retaining high value customers, reaching a market share of 41.8% in the contract segment as of December 31, 2017 (source: Anatel), preserving the leadership. Telefónica Brazil maintained its market leadership in terms of total accesses with a market share of 31.7% as of December 31, 2017 (source: Anatel), driven in part by the contract clients growth (10.1% year-on-year), which offset the fall in prepay clients (-5.5% year-on-year). The improvement in contract accesses was the consequence of the offering of more attractive plans, the applications and certain special roaming plans for pure contract clients.
In its
fixed business
, Telefónica Brazil maintained its strategic focus on fiber deployment, with 18.4 million premises passed with fiber at December 31, 2017 and 4.5 million homes connected. Traditional accesses decreased 3.5% due to the fixed-mobile migration. Retail broadband accesses totaled 7.5 million accesses at the end of 2017, increasing 2.1% year-on-year. Among them, 61% accesses were connected with FTTx. Pay TV customers reached 1.6 million as of December 31, 2017, down 7.3% year-on-year due to the discontinuation of the DTH business and a commercial strategy based on value clients of IPTV. IPTV accesses increased in relevance representing 24% of total Pay TV accesses.
85
The table below shows the evolution of Telefónica Brazil’s results for 2016 and 2017:
|
Millions of euros
|
|
|
|
|
|
|
|
|
|
TELEFÓNICA BRAZIL
|
2016
|
|
2017
|
|
%Reported
YoY
|
|
%Organic
YoY (1)
|
|
|
Revenues
|
11,090
|
|
12,019
|
|
8.4
|
%
|
1.4
|
%
|
|
Mobile Business
|
6,663
|
|
7,360
|
|
10.5
|
%
|
3.7
|
%
|
|
Mobile service revenues
|
6,351
|
|
7,062
|
|
11.2
|
%
|
4.4
|
%
|
|
Fixed Business
|
4,427
|
|
4,659
|
|
5.2
|
%
|
(2.1
|
%)
|
|
Other income
|
348
|
|
358
|
|
2.9
|
%
|
(3.6
|
%)
|
|
Supplies
|
(2,260
|
)
|
(2,268
|
)
|
0.4
|
%
|
(6.2
|
%)
|
|
Personnel expenses
|
(1,165
|
)
|
(1,196
|
)
|
2.6
|
%
|
(1.2
|
%)
|
|
Other expenses
|
(4,311
|
)
|
(4,722
|
)
|
9.5
|
%
|
1.7
|
%
|
|
OIBDA
|
3,702
|
|
4,191
|
|
13.2
|
%
|
6.0
|
%
|
|
OIBDA Margin
|
33.4
|
%
|
34.9
|
%
|
1.5 p.p.
|
|
1.5 p.p.
|
|
|
Depreciation and amortization
|
(2,036
|
)
|
(2,228
|
)
|
9.4
|
%
|
2.6
|
%
|
|
Operating Income (OI)
|
1,666
|
|
1,963
|
|
17.9
|
%
|
10.0
|
%
|
|
CapEx
|
2,137
|
|
2,225
|
|
4.1
|
%
|
(0.1
|
%)
|
|
OpCF (OIBDA-CapEx)
|
1,566
|
|
1,966
|
|
25.5
|
%
|
13.6
|
%
|
(1) See adjustments made to calculate organic variation below.
Adjustments made to calculate organic variations
As explained above, year-on-year percentage changes referred to in this document as “organic” or presented in “organic terms” intend to present year-on-year variations on a comparable basis.
With respect to Telefónica Brazil, we have made the following adjustments in order to calculate 2017/2016 variations in organic terms:
|
•
|
Exchange rate effect:
we have excluded the impact of changes in exchange rates by assuming constant average foreign exchange rates year-on-year. In particular, we have used the average foreign exchange rates of 2016 for both years.
|
|
•
|
Changes in the scope of consolidation:
the 2016 comparative figures for organic changes included the six months impact of the consolidation of Terra Networks Brazil in this segment which had an impact of 14 million euros on OIBDA and 13 million euros on OpCF for 2016, and excluded the results of three months of the tower business transferred to Telxius on April 1, 2016, which had an impact of 4 million euros on OIBDA and OpCF.
|
|
•
|
Restructuring costs
: we have excluded the impact of restructuring costs associated with the simplification processes implemented in Telefónica Brazil. In 2016, these restructuring costs totaled 40 million euros. There were no such restructuring costs during 2017.
|
|
•
|
Results of tower sales:
the results attributable to the sale of towers have been excluded (107 thousand euros in 2017 and 100 thousand euros in 2016).
|
|
•
|
Spectrum acquisition:
the impact of spectrum acquisitions has been excluded (48 million euros in 2016).
|
|
•
|
Contingencies:
the impact of the provision of certain regulatory contingencies in 2017 was excluded in Telefónica Brazil (50 million euros).
|
86
The table below shows 2017/2016 variations in reported and organic terms (the latter, calculated in accordance with the adjustments referred to above) of certain line items of the income statement and other measures, and the contribution of each item for which we have adjusted to our reported growth:
|
|
YoY variation
|
Contribution to reported growth (percentage points)
|
||||||||||||||
|
TELEFÓNICA BRAZIL
2017
|
%Reported
YoY
|
|
%Organic
YoY
|
|
Exchange rate effect
|
|
Perimeter change
|
|
Restructuring costs
|
|
Towers sales
|
|
Spectrum acquisition
|
|
Contingen-cies
|
|
|
Revenues
|
8.4
|
%
|
1.4
|
%
|
6.7
|
|
0.3
|
|
—
|
|
—
|
|
—
|
|
—
|
|
|
Other income
|
2.9
|
%
|
(3.6
|
%)
|
(6.4
|
)
|
(0.1
|
)
|
—
|
|
—
|
|
—
|
|
—
|
|
|
Supplies
|
0.4
|
%
|
(6.2
|
%)
|
6.2
|
|
0.4
|
|
—
|
|
—
|
|
—
|
|
—
|
|
|
Personnel expenses
|
2.6
|
%
|
(1.2
|
%)
|
6.4
|
|
0.8
|
|
(3.5
|
)
|
—
|
|
—
|
|
—
|
|
|
Other expenses
|
9.5
|
%
|
1.7
|
%
|
6.8
|
|
—
|
|
—
|
|
—
|
|
—
|
|
1.1
|
|
|
OIBDA
|
13.2
|
%
|
6.0
|
%
|
7.0
|
|
0.3
|
|
1.1
|
|
—
|
|
—
|
|
(1.3
|
)
|
|
CapEx
|
4.1
|
%
|
(0.1
|
%)
|
6.5
|
|
0.1
|
|
—
|
|
—
|
|
(2.3
|
)
|
—
|
|
|
OpCF (OIBDA-CapEx)
|
25.5
|
%
|
13.6
|
%
|
7.8
|
|
0.6
|
|
2.6
|
|
—
|
|
3.1
|
|
(3.0
|
)
|
Results discussion
Revenues
totaled 12,019 million euros in 2017, up 8.4% in reported terms, due mainly to the appreciation of the Brazilian real (which accounted for +6.7 percentage points of the evolution) and the changes in the consolidation perimeter (+0.3 percentage points). In organic terms, the year-on-year increase was 1.4%, principally due to the good evolution in the mobile business (+3.7% year-on-year) despite the negative impact from the decrease of the regulated tariffs.
|
•
|
Revenues from the mobile business
totaled 7,360 million euros in 2017, up 10.5% in reported terms due mainly to the appreciation of the Brazilian real (which accounted for 6.9 percentage points of the evolution). In organic terms, revenues from the mobile business increased by 3.7% due to the positive evolution of service revenues (+4.4% year-on-year) as a result of the higher weight of the contract clients, who generally use more data and other services over connectivity, that offset the decrease in interconnection tariffs and the decline in prepay revenues associated with a smaller customer base. Additionally, handset revenues slowed down by 4.5% in reported terms due to a lower commercial activity, which was focused on higher value clients.
|
|
•
|
Fixed telephony revenues
totaled 4,659 million euros, up 5.2% in reported terms due mainly to the appreciation of the Brazilian real (which accounted for 6.5 percentage points of the evolution) and the impact of the consolidation of Terra Networks Brasil (0.8 percentage points), which offset the regulatory impact of the decrease in the fixed-mobile and fixed-fixed tariffs and the decrease in voice traffic. In organic terms, revenues were down by 2.1%, mainly due to the regulatory impact of such tariff decreases and the decrease in voice traffic, which more than offset the increase in broadband and new services revenues, which were up by 8.3% year-on-year in organic terms supported by the increase in fiber revenues, from high-value customers.
|
The
mobile ARPU
increased 7.8% year-on-year in reported terms due mainly to the better quality of the customer base and the expansion of data revenues as well as the appreciation of the Brazilian real. In organic terms, it increased 2.6% year-on-year as a consequence of the higher data ARPU which more than offset the negative impact of the reduction in the mobile termination rates.
87
|
TELEFÓNICA BRAZIL
|
2016
|
|
2017
|
|
%YoY
|
|
%Local Currency
YoY
|
|
|
Voice Traffic (millions of minutes)
|
373,074
|
|
333,752
|
|
(10.5
|
%)
|
(10.5
|
%)
|
|
ARPU (EUR)
|
7.1
|
|
7.7
|
|
7.8
|
%
|
2.6
|
%
|
|
Prepay
|
3.4
|
|
3.7
|
|
11.1
|
%
|
(3.4
|
%)
|
|
Contract (1)
|
12.9
|
|
14.4
|
|
11.2
|
%
|
1.5
|
%
|
|
Data ARPU (EUR)
|
3.5
|
|
5.4
|
|
55.0
|
%
|
32.4
|
%
|
|
% non-SMS over data revenues (2)
|
89.3
|
%
|
92.2
|
%
|
2.9 p.p.
|
|
3.0 p.p.
|
|
(1) Excludes M2M.
(2) Mobile data revenues have been revised, for comparative purposes mobile data revenues for 2016 are reported using the same criteria.
OIBDA
stood at 4,191 million euros in 2017, up 13.2% in reported terms. This evolution was affected by the appreciation of the Brazilian real (+7.0 percentage points) and the changes in the consolidation perimeter (+0.3 percentage points). In organic terms, the year-on-year increase was 6.0% due to the contract and fiber revenues improvement, as well as cost efficiencies and higher synergies from the consolidation of GVT in 2015. Personnel expenses totaled 1,196 million euros in 2017, up 2.6% in reported terms mainly as the result of the appreciation of the Brazilian real. In organic terms, personnel expenses decreased by 1.2% year-on-year as a result of the restructuring plans implemented in 2016. In addition, supplies costs fell (-6.2% in organic terms) thanks to the positive impact of the interconnection tariff reduction and synergies from the consolidation of GVT achieved mainly in content costs.
The
OIBDA margin
stood at 34.9% in reported terms for 2017, up 1.5 percentage points in reported and organic terms compared to 2016.
TELEFÓNICA HISPAM NORTE
The below table shows the evolution of accesses in Telefónica Hispam Norte for 2016 and 2017 as of December 31 of such years:
|
ACCESSES
|
|
|||||
|
Thousands of accesses
|
2016 (*)
|
|
2017 (*)
|
|
%Reported YoY
|
|
|
Fixed telephony accesses (1) (2)
|
3,639.3
|
|
3,554.7
|
|
(2.3
|
%)
|
|
Internet and data accesses (2) (3)
|
993.4
|
|
1,229.2
|
|
23.7
|
%
|
|
Broadband
|
968.0
|
|
1,199.9
|
|
24.0
|
%
|
|
FTTx/Cable
|
27.1
|
|
126.8
|
|
368.7
|
%
|
|
Mobile accesses
|
68,200.9
|
|
66,788.6
|
|
(2.1
|
%)
|
|
Prepay
|
59,085.9
|
|
57,190.7
|
|
(3.2
|
%)
|
|
Contract
|
9,115.0
|
|
9,597.9
|
|
5.3
|
%
|
|
M2M
|
1,514.2
|
|
1,686.7
|
|
11.4
|
%
|
|
Pay TV
|
983.7
|
|
982.1
|
|
(0.2
|
%)
|
|
Final Clients Accesses
|
73,817.3
|
|
72,554.6
|
|
(1.7
|
%)
|
|
Total Accesses
|
73,857.6
|
|
72,565.4
|
|
(1.7
|
%)
|
(*) Revised data.
(1) Includes "fixed wireless" and Voice over IP accesses.
(2) Following the pre-payment of the debt derived from the operating agreement with PARAPAT in Colombia and after taking over its subsidiaries Telebucaramanga, Metrotel and Optecom, the consolidated results are included in the fixed business from 1 October 2017.
(3) Also referred to as fixed broadband accesses.
The table above includes accesses for Guatemala (3.3 million and 3.2 million total accesses as of December 31, 2016 and 2017, respectively) and El Salvador (2.4 million and 2.0 million total accesses as of December 31, 2016 and 2017, respectively). On January 24, 2019, Telefónica completed the sale of its operations in Guatemala. In addition, the sale of Telefónica’s operations in El Salvador is currently pending. The table also includes accesses for Costa Rica (2.0 million and 2.2 million total accesses as of December 31, 2016 and 2017, respectively), Panama (1.6 million and 1.6
88
million total accesses as of December 31, 2016 and 2017, respectively) and Nicaragua (4.2 million and 4.4 million total accesses as of December 31, 2016 and 2017, respectively). On February 20, 2019, Telefónica reached an agreement for the sale of Telefónica de Costa Rica TC, S.A., and for the sale by Telefónica's subsidiary Telefónica Centroamérica Inversiones, S.L. (60% of which is owned, directly or indirectly, by Telefónica and 40% of which is owned, directly or indirectly, by Corporación Multi Inversiones) of the entire share capital of Telefónica Móviles Panamá, S.A. and Telefónica Celular de Nicaragua, S.A. The closing of the sale of these three companies is subject to the applicable regulatory conditions and will take place for each transaction once those conditions are satisfied. For additional information, see “-History and Development of the Company-Recent Developments”.
Total
accesses
reached 72.6 million at December 31, 2017 (-1.7% year-on-year).
Mobile accesses
fell by 2.1% year-on-year to 66.8 million customers, due to a lower prepay customer base.
|
•
|
Contract
accesses increased 5.3% year-on-year, mainly due to good performances in Mexico (+13.0%), Central America (+13.9%) and Colombia (+4.0%) which offset declines in Venezuela (-2.1%) and Ecuador (-2.0%).
|
|
•
|
Prepay
accesses decreased 3.2% year-on-year, with negative net adds of 1.9 million accesses at December 31, 2017, mainly as a result of the evolution in Mexico (-1.7 million accesses) and Venezuela (-0.5 million accesses), which was partially offset by Colombia (+0.7 million accesses). Lower accesses were mainly the result of intense market competition and the Group's continued focus on attracting high-value customers.
|
|
•
|
The
smartphone
customer base increased 4.0% year-on-year at December 31, 2017, reaching 29.7 million accesses (+1.1 million compared to December 31, 2016) with a mobile access penetration of 44% (+2.6 percentage points year-on-year), growing in all countries of the region except Mexico (-3.2%) and Venezuela (-3.0%). In addition, accesses with 4G handsets increased 87%, reaching 13.6 million accesses by the end of 2017.
|
Fixed accesses
stood at 3.6 million at December 31, 2017 (-2.3% year-on-year) with negative net adds of 0.1 million customers, due to the erosion of the traditional fixed business, which more than offset the inclusion of 0.3 million accesses in Colombia of Tele-Bucaramanga and MetroTel in 2017.
Fixed broad band
accesses reached 1.2 million at December 31, 2017 (+24.0% year-on-year), mainly due to the inclusion of 236 thousand accesses in Colombia of Tele-Bucaramanga and MetroTel. The penetration of FBB accesses over fixed accesses stood at 31% (+7.2 percentage points year-on-year), focusing on UBB deployment in the region, reaching 0.7 million real estate units and 0.1 million connected accesses, almost all of them connected in 2017. The penetration of UBB accesses over fixed broadband accesses stood at 11% (+8 percentage points year-on-year).
Pay TV
accesses stood at 1 million, remaining mainly unchanged compared with the prior year, with positive results in Colombia (+12 thousand accesses) and Central America (+9 thousand accesses) which were offset by Venezuela (-23 thousand accesses).
The table below shows the evolution of Telefónica Hispam Norte’s results for 2016 and 2017:
89
|
Millions of euros
|
|
|
|
|
|
|
|
|
|
TELEFÓNICA HISPAM NORTE
|
2016 (*)
|
|
2017 (*)
|
|
%Reported
YoY
|
|
%Organic
YoY (1)
|
|
|
Revenues
|
4,711
|
|
4,331
|
|
(8.1
|
%)
|
25.4
|
%
|
|
Mobile Business
|
3,881
|
|
3,595
|
|
(7.4
|
%)
|
28.0
|
%
|
|
Mobile service revenues
|
3,488
|
|
3,089
|
|
(11.4
|
%)
|
26.8
|
%
|
|
Fixed Business
|
831
|
|
736
|
|
(11.4
|
%)
|
13.8
|
%
|
|
Other income
|
128
|
|
114
|
|
(10.9
|
%)
|
(13.2
|
%)
|
|
Supplies
|
(1,527
|
)
|
(1,385
|
)
|
(9.3
|
%)
|
1.4
|
%
|
|
Personnel expenses
|
(431
|
)
|
(375
|
)
|
(13.0
|
%)
|
55.5
|
%
|
|
Other expenses
|
(1,768
|
)
|
(1,422
|
)
|
(19.5
|
%)
|
15.5
|
%
|
|
OIBDA
|
1,113
|
|
1,263
|
|
13.5
|
%
|
51.7
|
%
|
|
OIBDA Margin
|
23.6
|
%
|
29.2
|
%
|
5.5 p.p.
|
|
6.0 p.p.
|
|
|
Depreciation and amortization
|
(1,112
|
)
|
(992
|
)
|
(10.8
|
%)
|
4.0
|
%
|
|
Operating Income (OI)
|
1
|
|
271
|
|
n.m.
|
|
n.m.
|
|
|
CapEx
|
878
|
|
1,264
|
|
43.9
|
%
|
22.9
|
%
|
|
OpCF (OIBDA-CapEx)
|
235
|
|
(1
|
)
|
n.m.
|
|
n.m.
|
|
n.m.: not meaningful
(*) Revised data.
(1) See adjustments made to calculate organic variation below.
Adjustments made to calculate organic variations
As explained above, year-on-year percentage changes referred to in this document as “organic” or presented in “organic terms” intend to present year-on-year variations on a comparable basis.
With respect to Telefónica Hispam Norte, we have made the following adjustments in order to calculate 2017/2016 variations in organic terms:
|
•
|
Exchange rate effects and hyperinflation adjustments in Venezuela:
we have excluded the impact of changes in exchange rates by assuming constant average foreign exchange rates year-on-year. In particular, we have used the average foreign exchange rates of 2016 for both years. We have also excluded the impact of hyperinflation adjustments in Venezuela, by reversing such adjustments.
|
|
•
|
Changes in the scope of consolidation:
the results of the Colombian companies Telebucaramanga, Metrotel and Optecom (which were acquired in October 2017 and had a 4 million euros impact on OIBDA before restructuring costs) have been excluded.
|
|
•
|
Restructuring costs:
we have excluded the impact of restructuring costs in 2017 and 2016, amounting to 24 and 18 million euros impact in OIBDA, respectively.
|
|
•
|
Results of tower sales:
the results attributable to the sale of towers have been excluded (7 million euros in 2017 and 478 thousand euros in 2016).
|
|
•
|
Spectrum acquisition:
the impact of spectrum acquisitions amounting to 510 million euros has been excluded in 2017 (470 million euros in Colombia).
|
|
•
|
Goodwill impairments:
impairment losses from goodwill in consolidation are excluded to calculate organic variations. In 2016, the impairment loss on the goodwill assigned to Telefónica Venezolana and Telefónica Móviles Mexico amounting to 124 and 91 million euros, respectively, was excluded.
|
|
•
|
Other adjustments:
the positive result of Telefónica Venezuela tariff increases in the last quarter of 2017 was excluded (6 million euros in revenues and 2 million euros in OIBDA).
|
90
The table below shows 2017/2016 variations in reported and organic terms (the latter, calculated in accordance with the adjustments referred to above) of certain line items of the income statement and other measures, and the contribution of each item for which we have adjusted to our reported growth:
|
|
YoY variation
|
Contribution to reported growth (percentage points)
|
||||||||||||||||
|
TELEFÓNICA HISPAM NORTE
2017
|
%Reported
YoY
|
|
%Organic
YoY
|
|
Exchange rate effect and hyperinflation
|
|
Restructu-ring costs
|
|
Towers sales
|
|
Spectrum acquisition
|
|
Impair-ments
|
|
Perimeter change
|
|
Other adjustments
|
|
|
Revenues
|
(8.1
|
%)
|
25.4
|
%
|
(33.3
|
)
|
--
|
|
--
|
|
--
|
|
--
|
|
0.5
|
|
0.1
|
|
|
Other income
|
(10.9
|
%)
|
(13.2
|
%)
|
(3.9
|
)
|
--
|
|
5.2
|
|
--
|
|
--
|
|
0.8
|
|
--
|
|
|
Supplies
|
(9.3
|
%)
|
1.4
|
%
|
(11.3
|
)
|
--
|
|
--
|
|
--
|
|
--
|
|
0.6
|
|
--
|
|
|
Personnel expenses
|
(13.0
|
%)
|
55.5
|
%
|
(66.2
|
)
|
1.7
|
|
--
|
|
--
|
|
--
|
|
0.9
|
|
--
|
|
|
Other expenses
|
(19.5
|
%)
|
15.5
|
%
|
(42.7
|
)
|
--
|
|
--
|
|
--
|
|
(12.2
|
)
|
0.4
|
|
21.9
|
|
|
OIBDA
|
13.5
|
%
|
51.7
|
%
|
(66.9
|
)
|
(0.6
|
)
|
0.6
|
|
--
|
|
19.3
|
|
0.3
|
|
0.2
|
|
|
CapEx
|
43.9
|
%
|
22.9
|
%
|
(37.6
|
)
|
--
|
|
--
|
|
58.2
|
|
--
|
|
0.9
|
|
--
|
|
|
OpCF (OIBDA-CapEx)
|
c.s.
|
|
n.m.
|
|
(176.4
|
)
|
(2.8
|
)
|
2.6
|
|
(217.5
|
)
|
91.4
|
|
(1.6
|
)
|
0.8
|
|
c.s.: change of sign
n.m.: not meaningful
Results discussion
Revenues
amounted to 4,331 million euros in 2017, decreasing 8.1% year-on-year in reported terms. This decrease was mainly driven by the foreign exchange effect and the hyperinflation in Venezuela which decreased growth by 33.3 percentage points. In organic terms, revenues would have grown by 25.4% year-on-year, driven by the good performance of data revenues, both mobile and fixed revenues, and the increase in TV revenues and handset sales revenues, in spite of interconnection tariff reductions.
|
•
|
Mobile service revenues
reached 3,089 million euros in 2017, decreasing 11.4% year-on-year in reported terms. This decrease was mainly driven by the foreign exchange effect and the hyperinflation in Venezuela which decreased growth by 38.3 percentage points. Excluding this effect, these revenues would have grown by 26.8%. Mobile service revenues performance by country was as follows:
|
|
•
|
In Mexico, mobile service revenues reached 1,102 million euros in 2017, decreasing by 11.6% year-on-year in reported terms. This decrease was attributable in part to the foreign exchange effect, which decreased growth by 2.8 percentage points. Excluding this effect, these revenues decreased by 8.8%, principally as a result of the performance of the prepay revenues which were affected by the 7.1% decrease in the customer base, which more than offset the positive impact of the interconnection agreements entered into during the first half of 2016 (37 million euros).
|
|
•
|
In Colombia, mobile service revenues reached 768 million euros in 2017, increasing by 3.4% year-on-year in reported terms, affected by the foreign exchange effect which accounted for 1.4 percentage points of the increase. In local currency, these revenues increased by 2.0% due to higher interconnection tariffs and improvements in our offers, directed to high-value customers.
|
|
•
|
Data revenues
in the segment reached 1,678 million euros in 2017, increasing by 7.6% year-on-year in reported terms, due to the higher data revenues in all countries of the region. This increase was significantly offset by the foreign exchange effect and the impact of hyperinflation adjustments in Venezuela (which detracted 69.7 percentage points of the increase). Excluding this effect, the data revenues would have been up by 77.4 % year-on-year.
|
|
•
|
Fixed business revenues
reached 736 million euros in 2017, decreasing by 11.4% year-on-year in reported terms. Excluding foreign exchange effects and the impact of hyperinflation adjustments in Venezuela (-25.2 percentage points) and the changes in the scope of consolidation of the Colombian companies of Telebucaramanga, Metrotel and Optecom (+2.7 percentage points), these revenues would have grown by 13.8% year-on-year due to higher TV and fixed broadband revenues, offsetting the decline in accesses and voice revenues.
|
OIBDA
reached 1,263 million euros in 2017, increasing 13.5% year-on-year in reported terms, mainly as a result of the absence of impairment losses from goodwill such as those recorded in 2016 (+19.3 percentage points), which
91
more than offset the impact of foreign exchange effects and hyperinflation adjustments in Venezuela (which decreased growth by 66.9 percentage points) and restructuring costs incurred by the Group (which decreased growth by 0.6 percentage points). In organic terms, OIBDA increased 51.7%, due to higher revenues in spite of higher interconnection, network and IT expenses. The higher expenses were mainly attributable to:
|
•
|
higher supply costs due to higher fixed equipment purchases in Mexico and Central America and higher mobile handsets purchases in the region except for Central America, which more than offset the lower interconnection costs in the region;
|
|
•
|
higher personnel expenses driven by the increase of inflation in some countries of the region, which could not be offset by the savings resulting from the restructuring plans carried out during the previous year. Restructuring plans carried out in 2017, in respect of which we incurred 24 million euros, affected mainly Mexico, Colombia and Central America; and
|
|
•
|
higher network expenses, mainly in Mexico, Colombia and Central America due to the expansion of the fixed and mobile networks, as well as the depreciation of Latin American currencies against the U.S. dollar.
|
Below, is additional information by country:
|
•
|
Mexico: OIBDA amounted to 302 million euros in 2017, decreasing 2.2% in reported terms, affected by the exchange rate effect which reduced growth in 3.1 percentage points. In local currency, OIBDA increased by 0.9% reflecting the positive evolution of prepay revenues as well as the positive impact of interconnection agreements entered into in the first quarter of 2016 and the cost efficiencies achieved. Moreover, personnel expenses increased in 2017 as a result of the restructuring plans of the Group.
|
|
•
|
Colombia: OIBDA amounted to 482 million euros in 2017, increasing 3.7% in reported terms, due in part to the exchange rate evolution that accounted for 1.4 percentage points of the increase. In local currency, OIBDA increased by 2.3% due to the good performance of revenues as well as lower supplies associated with lower interconnection tariffs and efficiencies in other expenses. Personnel expenses in 2017 increased as a result of the restructuring plans of the Group.
|
OIBDA margin
reached 29.2% in 2017 and increased by 5.5 percentage points year-on-year in reported terms. Excluding the foreign exchange effects and the impact of hyperinflation adjustments in Venezuela, OIBDA margin would have increased by 6.0 percentage points, due principally to the higher margin in all the operating businesses in the region.
TELEFÓNICA HISPAM SUR
The below table shows the evolution of accesses in Telefónica Hispam Sur for 2016 and 2017 as of December 31 of such years:
|
ACCESSES
|
|
|||||
|
Thousands of accesses
|
2016 (*)
|
|
2017 (*)
|
|
%Reported YoY
|
|
|
Fixed telephony accesses (1)
|
8,299.3
|
|
7,938.5
|
|
(4.3
|
%)
|
|
Internet and data accesses (2)
|
4,714.5
|
|
4,656.1
|
|
(1.2
|
%)
|
|
Broadband
|
4,602.7
|
|
4,535.4
|
|
(1.5
|
%)
|
|
FTTx/Cable
|
1,082.1
|
|
1,656.2
|
|
53.1
|
%
|
|
Mobile accesses
|
47,083.7
|
|
43,775.1
|
|
(7.0
|
%)
|
|
Prepay
|
30,375.3
|
|
27,631.8
|
|
(9.0
|
%)
|
|
Contract
|
16,708.3
|
|
16,143.3
|
|
(3.4
|
%)
|
|
M2M
|
1,047.2
|
|
1,199.8
|
|
14.6
|
%
|
|
Pay TV
|
1,935.6
|
|
2,050.3
|
|
5.9
|
%
|
|
Final Clients Accesses
|
62,033.0
|
|
58,419.9
|
|
(5.8
|
%)
|
|
Total Accesses
|
62,059.1
|
|
58,445.9
|
|
(5.8
|
%)
|
(*) Revised data.
92
(1) Includes "fixed wireless" and Voice over IP accesses.
(2) Also referred to as fixed broadband accesses.
Total
accesses
reached 58.4 million at December 31, 2017 (-5.8% year-on-year).
Mobile accesses
fell by 7.0% year-on-year to 43.8 million customers, mainly due to a lower prepay customer base.
|
•
|
Contract
accesses decreased 3.4% year-on-year, mainly due to Peru's negative evolution (-17.5%), where we faced a complicated competitive environment, which more than offset the good performances in Chile (+13.0%), Argentina (+4.9%) and Uruguay (+1.1%).
|
|
•
|
Prepay
accesses decreased 9.0% year-on-year, with negative net adds of 2.7 million accesses at December 31, 2017, mainly as a result of the evolution in Argentina (-1.9 million accesses) and Peru (-0.8 million accesses), and to a significantly lesser extent, Chile and Uruguay. Lower accesses were mainly the result of intense market competition and the Group's continued focus on attracting high-value customers.
|
|
•
|
The
smartphone
customer base increased 23.2% year-on-year at December 31, 2017, reaching 21.7 million accesses (+4.1 million compared to December 31, 2016) with a mobile access penetration of 49% (+12.1 percentage points year-on-year), growing in all countries. In addition, accesses with 4G handsets increased 68%, reaching 13.8 million accesses by the end of 2017.
|
Fixed accesses
stood at 7.9 million at December 31, 2017 (-4.3% year-on-year) with negative net adds of 0.4 million customers, due to the erosion of the traditional fixed business.
Fixed broad band
accesses reached 4.5 million at December 31, 2017 (-1.5% year-on-year), mainly due to the decrease in accesses in Argentina (-10.1%), as the Group focused on fiber (high-value customers), which affected the growth in the copper business. This decrease more than offset the good results in Peru (+6.2%) and Chile (+1.7%). The penetration of FBB accesses over fixed accesses stood at 57% (+1.7 percentage points year-on-year), focusing on UBB deployment in the region, reaching 6.1 million real estate units and 1.7 million connected accesses (+53.1% year-on-year). The penetration of UBB accesses over fixed broadband accesses stood at 37% (+13 percentage points year-on-year).
Pay TV
accesses stood at 2 million (+5.9% year-on-year) registering net adds of 0.1 million accesses with positive results in the two countries in the region that offer this service: Peru (+7.2%) and Chile (+3.6%).
The table below shows the evolution of Telefónica Hispam Sur’s results for 2016 and 2017:
|
Millions of euros
|
|
|
|
|
|
|
|
|
|
TELEFÓNICA HISPAM SUR
|
2016 (*)
|
|
2017 (*)
|
|
%Reported
YoY
|
|
%Organic
YoY (1)
|
|
|
Revenues
|
7,870
|
|
8,218
|
|
4.4
|
%
|
9.4
|
%
|
|
Mobile Business
|
4,697
|
|
4,993
|
|
6.3
|
%
|
11.9
|
%
|
|
Mobile service revenues
|
4,140
|
|
4,319
|
|
4.3
|
%
|
9.8
|
%
|
|
Fixed Business
|
3,173
|
|
3,225
|
|
1.6
|
%
|
5.7
|
%
|
|
Other income
|
146
|
|
160
|
|
9.5
|
%
|
23.8
|
%
|
|
Supplies
|
(2,194
|
)
|
(2,288
|
)
|
4.3
|
%
|
6.8
|
%
|
|
Personnel expenses
|
(1,156
|
)
|
(1,269
|
)
|
9.7
|
%
|
18.0
|
%
|
|
Other expenses
|
(2,306
|
)
|
(2,546
|
)
|
10.4
|
%
|
15.7
|
%
|
|
OIBDA
|
2,360
|
|
2,275
|
|
(3.6
|
)%
|
2.4
|
%
|
|
OIBDA Margin
|
30.0
|
%
|
27.7
|
%
|
(2.3 p.p.)
|
|
(1.9 p.p.)
|
|
|
Depreciation and amortization
|
(1,075
|
)
|
(1,198
|
)
|
11.4
|
%
|
14.2
|
%
|
|
Operating Income (OI)
|
1,285
|
|
1,077
|
|
(16.2
|
)%
|
(7.0
|
)%
|
|
CapEx
|
1,737
|
|
1,414
|
|
(18.6
|
)%
|
0.2
|
%
|
|
OpCF (OIBDA-CapEx)
|
623
|
|
861
|
|
38.0
|
%
|
5.9
|
%
|
(1) See adjustments made to calculate organic variation below.
93
Adjustments made to calculate organic variations
As explained above, year-on-year percentage changes referred to in this document as “organic” or presented in “organic terms” intend to present year-on-year variations on a comparable basis.
With respect to Telefónica Hispam Sur, we have made the following adjustments in order to calculate 2017/2016 variations in organic terms:
|
•
|
Exchange rate effects:
we have excluded the impact of changes in exchange rates by assuming constant average foreign exchange rates year-on-year. In particular, we have used the average foreign exchange rates of 2016 for both years.
|
|
•
|
Changes in the scope of consolidation:
the results in 2016 of the towers business transferred to Telxius (on April 1, 2016 by Telefónica Peru and on May 1, 2016 by Telefónica Chile), which had a 3 million euros impact on OIBDA and a 2 million euros impact on OpCF, have been excluded.
|
|
•
|
Restructuring costs:
we have excluded the impact of restructuring costs in 2017 and 2016, which had a 79 million euros and 66 million euros impact on OIBDA, respectively.
|
|
•
|
Spectrum acquisition:
the impact of spectrum acquisitions has been excluded in 2017 (27 million euros, corresponding to Uruguay) and 2016 (284 million euros, corresponding to Peru).
|
|
•
|
Capital gains and losses on sales of companies:
gains and losses obtained from the sale of companies are excluded to calculate organic variations. In 2016, the profit from the sale of Telefé in Argentina for 15 million euros was excluded.
|
The table below shows 2017/2016 variations in reported and organic terms (the latter, calculated in accordance with the adjustments referred to above) of certain line items of the income statement and other measures, and the contribution of each item for which we have adjusted to our reported growth:
|
|
YoY variation
|
Contribution to reported growth (percentage points)
|
||||||||||||
|
TELEFÓNICA HISPAM SUR
2017
|
%Reported
YoY
|
|
%Organic
YoY
|
|
Exchange rate effect
|
|
Restructuring costs
|
|
Spectrum acquisition
|
|
Capital gains/losses on sale of companies
|
|
Perimeter change
|
|
|
Revenues
|
4.4
|
%
|
9.4
|
%
|
(4.9
|
)
|
--
|
|
--
|
|
--
|
|
--
|
|
|
Other income
|
9.5
|
%
|
23.8
|
%
|
(2.0
|
)
|
--
|
|
--
|
|
(10.0
|
)
|
--
|
|
|
Supplies
|
4.3
|
%
|
6.8
|
%
|
(2.7
|
)
|
--
|
|
--
|
|
--
|
|
0.1
|
|
|
Personnel expenses
|
9.7
|
%
|
18.0
|
%
|
(8.9
|
)
|
1.6
|
|
--
|
|
--
|
|
--
|
|
|
Other expenses
|
10.4
|
%
|
15.7
|
%
|
(5.3
|
)
|
--
|
|
--
|
|
--
|
|
--
|
|
|
OIBDA
|
(3.6
|
)%
|
2.4
|
%
|
(4.6
|
)
|
(0.8
|
)
|
--
|
|
(0.6
|
)
|
(0.1
|
)
|
|
CapEx
|
(18.6
|
)%
|
0.2
|
%
|
(3.9
|
)
|
--
|
|
(14.8
|
)
|
--
|
|
0,0
|
|
|
OpCF (OIBDA-CapEx)
|
38.0
|
%
|
5.9
|
%
|
(6.6
|
)
|
(3.0
|
)
|
41.3
|
|
(2.3
|
)
|
(0.4
|
)
|
Results discussion
Revenues
amounted to 8,218 million euros in 2017, increasing 4.4% year-on-year in reported terms. This increase was mainly driven by the good performance of data revenues, both mobile and fixed revenues, and the increase in handset sales revenues, which more than offset the foreign exchange effects (which decreased growth by 4.9 percentage points) and interconnection tariff reductions. In organic terms, revenues grew by 9.4% year-on-year.
|
•
|
Mobile service revenues
reached 4,319 million euros in 2017, increasing 4.3% year-on-year in reported terms, due mainly to the good performance of Argentina. Excluding foreign exchange effects, which decreased growth by 5.4 percentage points, these revenues grew by 9.8%. Mobile service revenues performance in the main countries comprising this segment was as follows:
|
|
•
|
In Argentina, mobile service revenues reached 1,966 million euros in 2017, increasing by 20.8% year-on-year in reported terms. This increase was due mainly to upward adjustment in tariffs, higher consumption in postpaid, a bigger customer base with top-ups and a higher top-up volume in prepay,
|
94
which more than offset the foreign exchange effect (which decreased growth by 16.6 percentage points). Excluding this effect, these revenues grew by 37.4%.
|
•
|
In Chile, mobile service revenues reached 1,069 million euros in 2017, decreasing by 3.0% year-on-year in reported terms, due mainly to the lower outgoing mobile revenues, which were affected by extremely aggressive competition, and lower FBB revenues, also as a result of increased competition that affected ARPU growth and our customer base (which was negatively impacted by churn level). These factors more than offset the positive impact of the foreign exchange effect. In local currency, these revenues decreased by 5.1%.
|
|
•
|
In Peru, mobile service revenues reached 1,072 million euros in 2017, decreasing by 11.1% year-on-year in reported terms. The decrease in revenues was mainly due to lower prepay and postpaid revenues as a consequence of higher competitiveness in the market with the launching of voice and data unlimited plans, the offering of high subsidies and portability with discounts of 50%. These actions resulted in net losses of customers and lower ARPU levels. These factors more than offset the positive impact of the foreign exchange effect. In local currency, these revenues decreased by 12.5%.
|
|
•
|
Data revenues
in the segment reached 2,442 million euros in 2017, increasing by 12.9% year-on-year in reported terms, due to the higher data revenues in Argentina. This increase was significantly offset by the foreign exchange effects (which detracted 6.3 percentage points of the increase). Excluding this effect, the data revenues increased by 19.2 % year-on-year.
|
|
•
|
Fixed business revenues
reached 3,225 million euros in 2017, increasing by 1.6% year-on-year in reported terms. Excluding foreign exchange effects (-4.0 percentage points), these revenues grew by 5.7% year-on-year due to higher TV and fixed broadband revenues, which more than offset the decline in accesses and voice revenues. Argentina in particular, experienced strong momentum in the fixed business with strong growth of broadband revenues due to the adjustment of tariffs, improved speed and a better quality of the access base.
|
OIBDA
reached 2,275 million euros in 2017, decreasing 3.6% year-on-year in reported terms, mainly as a result of the impact of foreign exchange effects (which decreased growth by 4.6 percentage points) and restructuring costs made by the Group (which decreased growth by 0.8 percentage points). In organic terms, OIBDA increased 2.4%, due to higher revenues in spite of higher interconnection, network and IT expenses. The higher expenses were attributable to:
|
•
|
higher supply costs due to increased fixed equipment purchases in Chile, as a result of the Group’s engagement in connection with the 2017 Chilean general election (pursuant to which Telefónica provided the necessary equipment and maintenance services in connection therewith), and higher interconnection expenses in Argentina and Peru;
|
|
•
|
higher personnel expenses driven by the increase of inflation in some countries of the region, which could not be offset by the savings resulting from the restructuring plans carried out during the previous year. Restructuring plans carried out in 2017, amounting to 78 million euros, affected mainly Argentina, Peru and Chile; and
|
|
•
|
higher network expenses, mainly in Argentina due to the expansion of the fixed and mobile networks, higher IT expenses in Argentina, Chile and Peru, and the impact of inflation and depreciation of Latin American currencies against the U.S. dollar.
|
Below, is additional information by country:
|
•
|
Argentina: OIBDA amounted to 971 million euros in 2017, increasing 21.8% in reported terms. The exchange rate effect reduced growth by 16.7 percentage points. In local currency, the year-on-year variation was 38.5%, due to the good performance of revenues, which more than offset the effect of higher expenses as a result of inflation. Personnel expenses also increased as a result of the ongoing restructuring plans of the Group and interconnection expenses increased due to tariff increases.
|
|
•
|
Chile: OIBDA amounted to 630 million euros in 2017, decreasing 10.5% in reported terms. Excluding the exchange rate effect (that reduced variation in 2.0 percentage points), OIBDA decreased by 12.4% as a result of the reduction in revenues mentioned above. In addition, there were higher personnel expenses in 2017 as a result of the restructuring plans of the Group.
|
|
•
|
Peru: OIBDA amounted to 588 million euros in 2017, decreasing 24.5% in reported terms (with the exchange rate evolution having a positive impact of 1.2 percentage points). In local currency, OIBDA
|
95
decreased by 25.7%, affected by the service revenue reduction. In addition, there were higher personnel expenses in 2017 as a result of the restructuring plans of the company.
OIBDA margin
reached 27.7% in 2017, and decreased by 2.3 percentage points year-on-year in reported terms. Excluding the foreign exchange effects, OIBDA margin decreased by 1.9 percentage points, due to the evolution in Peru (-5.8 percentage points) and Chile (-3.7 percentage points).
Our services and products
New digital technologies are the main driving force of social and economic transformation today. This premise is the basis upon which we build our vision: we want to provide access to digital life, using the best technology and without leaving anyone behind.
Connectivity is our ally in reducing the digital divide and, due to our fixed and mobile network infrastructure and the services we develop around it, we can aid progress in the communities in which we operate.
To move towards this vision, at Telefónica we work on three basic fronts:
1) Providing access to technology through digital inclusion, in other words, by means of network rollout and an accessible and affordable offer for all sectors of the population.
2) Developing innovative services that add value to our connectivity and which we develop through innovation: Big Data, the Internet of Things (IoT), eHealth, digital education and eFinances.
3) Incorporating sustainability principles across all of our product development processes.
Mobile business
Telefónica offers a wide variety of mobile and related services and products to personal and business customers. Although they vary from country to country, Telefónica’s principal services and products are as follows:
|
•
|
Mobile voice services:
Telefónica’s principal service in all of its markets is mobile voice telephony.
|
|
•
|
Value added services:
Customers in most of the markets have access to a range of enhanced mobile calling features, including voice mail, call on hold, call waiting, call forwarding and three-way calling.
|
|
•
|
Mobile data and Internet services:
Current data services offered include Short Messaging Services, or SMS, and Multimedia Messaging Services, or MMS, which allow customers to send messages with images, photographs, sound recordings and video recordings. Customers may also receive selected information, such as news, sports scores and stock quotes. Telefónica also provides mobile broadband connectivity and Internet access. Through mobile Internet access, customers are able to send and receive e-mail, browse the Internet, download games, purchase goods and services in m-commerce transactions and use Telefónica’s other data and software services.
|
|
•
|
Wholesale services:
Telefónica has signed network usage agreements with several MVNOs in different countries.
|
|
•
|
Corporate services:
Telefónica provides business solutions, including mobile infrastructure in offices, private networking and portals for corporate customers that provide flexible online billing.
|
|
•
|
Roaming:
Roaming agreements allow Telefónica customers to use their mobile handsets when they are outside their service territories, including on an international basis.
|
|
•
|
Fixed wireless:
Telefónica provides fixed voice telephony services through mobile networks in Brazil, Venezuela, Argentina, Peru, Mexico, Ecuador, El Salvador and Nicaragua. Until January 24, 2019, Telefónica also provided these services in Guatemala. In addition, the completion of the sale of our operations in El Salvador and Nicaragua is currently pending. For additional information, see "— History and Development of the Company — Recent Developments".
|
|
•
|
Trunking and paging:
Telefónica provides digital mobile services for closed user groups of clients and paging services in Spain and most of the regions in which it operates in Latin America.
|
96
Fixed-line telephony business
The principal services Telefónica offers in its fixed businesses in Europe and Latin America are:
|
•
|
Traditional fixed telecommunication services:
Telefónica’s principal traditional fixed telecommunication services include PSTN lines; ISDN accesses; public telephone services; local, domestic and international long-distance and fixed-to-mobile communications services; corporate communications services; supplementary value added services (including call waiting, call forwarding, voice and text messaging, advanced voicemail services and conference-call facilities); video telephony; business oriented value-added services; intelligent network services; leasing and sale of handset equipment; and telephony information services.
|
|
•
|
Internet and broadband multimedia services:
the principal Internet and broadband multimedia services include Internet provider service; portal and network services; retail and wholesale broadband access through ADSL, narrowband switched access and other technologies. Telefónica also offers high-speed Internet services through fiber to the home (FTTH) in certain markets (primarily Spain, Brazil and Chile) and VDSL-based services (primarily Spain and Germany). Telefónica also offers VoIP services in some markets.
|
|
•
|
Data and business-solutions services:
the data and business-solutions services principally include leased lines; virtual private network, or VPN, services; fiber optics services; the provision of hosting and application, including web hosting, managed hosting, content delivery and application, and security services; outsourcing and consultancy services, including network management, or CGP; and desktop services and system integration and professional services.
|
|
•
|
Wholesale services for telecommunication operators:
the wholesale services for telecommunication operators principally include domestic interconnection services; international wholesale services; leased lines for other operators; and local loop leasing under the unbundled local loop regulation framework. It also includes bit stream services, wholesale line rental accesses and leased ducts for other operators' fiber deployment.
|
Digital services
The main highlights in services developed by Telefónica Digital are:
|
•
|
Video/TV services:
IPTV services (Internet protocol), over-the-top network television services, and cable and satellite TV. In some markets, advanced pay TV services are also offered, such as high-definition TV (HDTV), Multiroom (allowing clients to watch different TV channels in different rooms), Digital Video Recording (DVR), Multiscreen (all contents in everywhere), CatchUp contents, third party contents and Cloud Video Services (such as Last 7 days, Restart TV and Cloud DVR). In addition, Telefónica offers accessible content in Spain with subtitles, audio description and sign language functionalities through the Movistar+ 5s service, the aim of which is to contribute toward the inclusion of disabled people across the country.
|
|
•
|
IoT (Internet of Things):
Telefónica's Global IoT portfolio includes:
|
|
•
|
Smart Connectivity:
connectivity services for machines, mainly handled through the Kite platform (former Smart m2m platform).
|
|
•
|
Smart Services:
end-to-end solutions that include "device + connectivity + application". These B2B solutions are mainly aimed at i) the mobility management of vehicles, assets and/or people, ii) the support of the retail and industrial sectors and iii) the efficient management of energy consumption.
|
|
•
|
Consumer IoT:
products focused on the B2C segment, including end-to-end services around the person (e.g. connected cars, trackers).
|
|
•
|
Financial services and other payment services:
These services allow customers to make money transfers, payments and mobile recharges, among other transactions, through prepay accounts or bank accounts.
|
|
•
|
Security services:
Telefónica Global Security portfolio includes:
|
|
•
|
Electronic Security: services designed to guard the security and integrity of a customer's physical assets, mostly corporate assets (such as nodes and communications networks in malls, corporate and representative buildings, etc.).
|
97
|
•
|
Information Security: tools protecting information in end-user devices and communications, fixed and mobile, networks, as well as protecting customers' digital identity. These services include the in-house services developed by 11Paths.
|
|
•
|
Cloud computing services:
Telefónica offers private, public and hybrid cloud services designed to allow any size of business to manage its IT infrastructure more effectively, supporting it at every stage of the IT life cycle. In particular, we have a complete value proposition which comprises of our: (i) Virtual Data Center service, based on Vmware, which facilitates the migration to cloud of existing applications; (ii) Open Cloud service, based on Open Stack, which enables the development of cloud applications with low latency; and (ii) hyperscalers (AWS and Azure) which offer Public Cloud services in a reselling model.
|
With regards to cloud-based applications, our solutions are designed to enable businesses to improve their digital presence, create marketing campaigns, enhance customer relationships and to boost the efficiency and productivity of their employees (in conjunction with products such as Office 365, Cloud Drive and Unified Comms).
Our Cloud computing services are integrated with Telefonica's corporate secure communications services.
|
•
|
Advertising:
A portfolio of marketing channels that third party brands can use to acquire and engage with customers. Traditional channels such as SMS/MMS messaging may be used alongside with new channels like programmatic display and sponsored connectivity. All of which leverage on our customer data in order to send messages to the correct target as well as to generate post-campaign brand analysis.
|
|
•
|
Big Data:
Includes products and services designed to enable companies and governments to make AI-powered data-driven decisions. Our Big Data offer comprises of three main categories: (i) "business insights", which provides information for decision-making based on analysis from advanced analytical products developed on top of data generated in our network and systems; (ii) "consulting and analytics", which includes specialist professional services focused on data strategy, data science, data architecture and data engineering; and (iii) "tools and infrastructure", which provides advanced technology for data management, storage and exploitation.
|
|
•
|
Digital Telco Experience:
Includes “Novum”, the global solution that aims to provide an E2E digital (end to end) experience to our customers. Its main features include account Management, eCare, Cloudphone and Aura interaction.
|
|
•
|
Aura:
Aura is Telefónica's new cognitive intelligence-based customer relationship model designed to build trust and enable new forms of engagement and interactivity with our customers in real time through a simple voice interface, the aim of which is to: (i) make our customers' lives easier; (ii) enrich our customers' experience with the use of personalization, contextual information and cognitive intelligence for predictive use cases, (iii) empower our customers through increasing transparency and control over their data; and (iv) to enable our customers to discover relevant Group or third-party services.
|
Aura may be used to resolve billing queries, consult and manage balances, top ups, and data usage, provides information to the customer on “understanding my bundle” and “make the most of my TV”, enables issue management, and facilitates other services in relation to communications, home connectivity and smart home.
Aura resolves queries from telco domains and is in the process of being expanded to non-telco domains.
Aura is currently available in Argentina, Brazil, Chile, Germany, Spain and in the United Kingdom
.
|
•
|
Movistar Home ("MH"):
Telefónica launched Movistar Home in Spain on October 18, 2018, a new device designed around the functionality of Aura and targeted at our Movistar and Pay TV customers. Movistar Home is designed to strengthen Telefónica’s position by enabling highly-converged services and experiences that differentiate us from our competitors. Movistar Home aims to provide our customers an enhanced TV experience on IPTV, increased landline functionality (which enables videoconferencing), our smart home package and games in addition to third-party services.
|
Sales and Marketing
Our sales and marketing strategy is aimed toward reinforcing our market position, generating brand awareness, promoting customer growth and achieving customer satisfaction. We use a variety of marketing initiatives and programs, including those that focus on customer value, with in-depth market segmentation; programs to promote customer loyalty; pricing initiatives aimed toward stimulating usage, including segmented packages and innovative tariff options;
98
and initiatives that are responsive to the latest market trends, including those aimed toward boosting demand for our mobile Internet and mobile broadband offerings. In connection with these and our other sales and marketing initiatives, we market our products through a broad range of channels, including television, radio, billboards, telemarketing, direct mail and Internet advertising. We also sponsor a variety of local cultural and sporting events in order to enhance our brand recognition.
Competition
The telecommunications industry is competitive and consumers generally have a choice of mobile and fixed line operators from which to select services. We are a global telecommunications services provider and face significant competition in most of the markets in which we operate. In Europe, our largest competitor is Vodafone and in Latin America, our largest competitor is América Móvil. Newer competitors, including handset manufacturers, MVNOs, Internet companies and software providers, are also entering the market and offering integrated communications services.
We compete in our markets on the basis of the price of our services; the quality and range of features; the added value we offer with our service; additional services associated with those main services; the reliability of our network infrastructure and its technological attributes; and the desirability of our offerings, including bundled offerings of one type of service with another and, in the case of the mobile industry, in most of the markets offerings that include subsidized handsets.
To compete effectively with our competitors, we need to successfully market our products and services and to anticipate and respond to various competitive factors affecting the relevant markets, such as the introduction of new products and services, different pricing strategies and changes in consumer preferences.
Strategic Partnerships
China Unicom
Since 2005 we have a stake in China Unicom and its predecessor company. On September 6, 2009, we entered into a strategic alliance agreement with China Unicom, which provided, among other things, for cooperation, joint procurement of infrastructure and client equipment, common development of mobile service platforms, joint provisions of service to multinational customers, roaming, research and development, sharing of best practices and technical, operational and management know-how, joint development of strategic initiatives in the area of network evolution, joint participation in international alliances and exchanges of senior management. In furtherance of this strategic alliance, we entered into a subscription agreement with China Unicom, pursuant to which we increased our voting interest in the share capital of China Unicom to 8.06% and China Unicom obtained a 0.87% voting interest in our share capital in October 2009.
On January 23, 2011, we entered into an agreement to enhance the strategic alliance with China Unicom, under which we each agreed to strengthen and deepen our strategic alliance in certain business areas, and committed to investing the equivalent of 500 million US dollars in ordinary shares of the other party. Such investments took place along 2011. In recognition of China Unicom's stake in our share capital, we committed to propose, in accordance with the prevailing legislation and our bylaws, the appointment of a member of our Board of Directors nominated by China Unicom.
China Unicom completed the acquisition of Telefónica shares on January 28, 2011, giving it ownership of 1.37% of the Company’s capital.
The Telefónica Group purchased China Unicom shares during 2011 to the amount of 358 million euros. At December 31, 2011, the Telefónica Group held a 9.57% stake in the company.
On June 10, 2012, Telefónica´s wholly-owned subsidiary Telefónica Internacional, S.A.U. and a subsidiary of China United Network Communications Group Company Limited entered into an agreement for the acquisition by the latter of 1,073,777,121 shares of China Unicom owned by Telefónica, equivalent to 4.56% of its share capital.
On July 21, 2012, such agreement was complemented by a supplemental agreement for the acquisition of additional shares by China United Network Communications Group Company Limited. The transaction was completed on July 30, 2012.
In the following years, Telefónica has continued to sell down its stake in China Unicom.
99
As of December 31, 2018 we held a 0.59% stake in the share capital of China Unicom and China Unicom held a 1.24% stake in our share capital. Mr. César Alierta, former chairman of Telefónica, is a member of the Board of Directors of China Unicom while Mr. Wang Xiaochu, Chairman and Chief Executive Officer of China Unicom, continues to be a member of our Board of Directors.
Telefónica maintains its commitment to the strategic partnership with China Unicom, strengthened through cooperation in digital areas such as the big data joint venture between both companies, which is now a market leader of telco location-based big data services in the urban planning sector in China.
Regulation
Please see Appendix VI to our Consolidated Financial Statements.
Licenses and Concessions
Please see Appendix VI to our Consolidated Financial Statements.
Seasonality
Our business is not significantly affected by seasonal trends.
Patents
Our business is not materially dependent upon the ownership of patents, commercial or financial contracts or new manufacturing processes.
Security Strategy and Framework
The digital ecosystem has facilitated the access of companies and users to a large amount of information, multiplying the ease and speed at which this information can be transmitted between different networks, companies and countries. This volume of data implies an important advancement opportunity for society, but also a significant responsibility for companies that, like Telefónica, manage considerable amounts of personal, anonymous or aggregate information. In addition to threats to the integrity and privacy of data, Telefónica may face network interruptions which could affect the quality of, or cause interruption to, the provision of its services. See “Item 3. Key Information—Risk Factors—The Telefónica Group’s networks carry and store large volumes of confidential, personal and corporate data, and its Internet access and hosting services may lead to claims for illegal or illicit use of the Internet”, “—Unanticipated network interruptions can lead to quality loss or the interruption of the service”, “—Information technology is key to the Group’s business and it could be subject to cybersecurity risks”.
In order to address these risks, the Group has adopted various lines of action which are led by its Security and Intelligence area. The head of Security and Intelligence is the Global Director of Security and Intelligence, who is responsible for establishing the global security strategy, leading on matters relating to the regulatory security framework and management and administration of global security initiatives. For purposes of government and coordination, we have a Global Security Committee presided by the Global Director of Security and Intelligence, in which the heads of our business areas (including Compliance, Auditing, Legal, Technology and Operations and Human Resources) and the Security Directors of each country participate, in addition to local Security Subcommittees, that collaborate in the definition of global strategic initiatives and guidelines and implement them in each country. We also have a Security Advisory Council that shares the best practices of the industry in digital security and which counts what we consider to be leading third parties among its members. Finally, we have a Digital Security Committee that establishes our risk posture in respect of the main threats we face, and monitors the key strategic and operational aspects of digital security.
We have two main line of actions:
|
1.
|
Operational security, business continuity and value chain security
: Some of the initiatives adopted are the following:
|
|
•
|
Business continuity
: Business continuity groups have been created, continuity plans have been standardized and we have implemented tools to improve disaster recovery in order to provide a global vision of the risks we face and the management thereof.
|
|
•
|
Crisis management
: During 2018, various crisis management procedures were reviewed, reinforced and tested through simulations in the areas of physical security and digital security, with the active participation of all areas of the Group and the direct involvement of the different management levels.
|
100
|
•
|
Security in the supply chain
: The integral security of products and services is necessarily supported by the strengthening of security controls in the complete cycle of the supply chain, specifically in the security of Telefónica Group suppliers. For this purpose, during 2018 we have designed security controls to be applied at all different stages of the procurement process of products, equipment and services, working in an integrated manner among the areas of security, financial control, procurement, technology and operations to ensure that suppliers and partners comply with the security controls required by Telefónica’s own regulations, any other regulatory requirements and best practices in the industry.
|
|
2.
|
Digital security:
Our initiatives in digital security are aimed at maintaining the confidentiality, integrity and availability of the services and data of the Group. We both proactively analyze vulnerabilities and manage security incidents. Some of the initiatives adopted are the following:
|
|
•
|
Network security
: The role of Telefónica as a telecommunications operator makes it essential to strengthen the security controls of fixed and mobile communications networks and infrastructures, as well as the associated service platforms (e.g. video, IoT). In this sense, the aforementioned security processes are applied in a holistic manner to manage the risks associated with attacks and the exploitation of vulnerabilities in networks and protocols within the Group, with our main technological partners and with international organizations (e.g. GSMA), to limit any potential impacts. Examples of our network security initiatives include initiatives on 4G/LTE, SS7, BGP and other critical enabling technologies.
|
|
•
|
Cybersecurity, vulnerability management and gaps
: We are proactive with regards to cybersecurity, vulnerability management and gaps. We have a network of Incident Response Centers (CSIRT) at a global level, that works in a coordinated way to identify and analyze the risks of potential cyberthreats, monitor serious vulnerabilities in our most critical technological assets, establish relationships with other national and international CSIRTs / Computer Emergency Response Teams (CERTs) from both the public and private sectors, detect potential security incidents that may affect the technological assets of the Group and respond to and manage any security incidents that may affect the Group. We have public mailboxes, both globally and locally, available to any user and designed for the reporting of any vulnerability or threat that could affect Telefónica’s technological infrastructure. We also operate a vulnerability detection (bug-bounty) program with select leading companies within the industry.
|
When the impact or consequences of an incident or vulnerability threaten the continuity of one or several critical processes or services or the reputation of the Group, we have a Business Continuity Plan and a Global Crisis Management System. This system aims to ensure our preparedness to manage such incidents or vulnerabilities by facilitating the coordination, communication and collaboration of all the areas involved to help ensure operational normality is restored in the shortest possible time and with the least possible impact.
During 2018 all the security incidents that occurred -none of which were considered to be material by the Group- were managed pursuant to our existing protocols for responding to incidents, and with the appropriate communication to regulatory bodies in cases where personal data was involved.
Lessons learned from incidents constitute a fundamental part of a feedback process designed to facilitate security improvement projects, with regards to processes, capabilities and technological platforms.
The awareness of employees, collaborators and suppliers in the security area is of great relevance for the Telefónica Group. During 2018 we made revisions to training frameworks for employees, with the implementation of a global digital security course, the establishment of a phishing simulation exercise framework and the carrying out of a security awareness survey among our employees. In addition, specific training programs were initiated for special focus groups and managers (such as in software development areas, infrastructure production and operation units, and in security areas themselves).
Finally, we maintain, both locally and globally, various insurance programs in order to mitigate the impact of a potential incident. In particular, we have coverage for cybersecurity risks that cause loss of income, loss of customers, extra costs or digital asset recovery expenses, and coverage for errors and technological omissions in the case of potential claims against us for damages caused to customers and third parties. These insurance policies are subject to certain loss limits, deductions and exclusions and we can provide no assurance that all losses related to a cybersecurity incident will be covered under our policies.
Disclosure Pursuant to Section 219 of the Iran Threat Reduction and Syria Human Rights Act
101
Section 219 of the Iran Threat Reduction and Syria Human Rights Act of 2012 added Section 13(r) to the Exchange Act. Section 13(r) requires an issuer to disclose in its annual or quarterly reports filed with the SEC whether the issuer or any of its affiliates has knowingly engaged in certain activities, transactions or dealings with the Government of Iran, relating to Iran or with designated natural persons or entities involved in terrorism or the proliferation of weapons of mass destruction during the period covered by the annual or quarterly report. Disclosure is required even when the activities were conducted outside the United States by non-U.S. entities and even when such activities were conducted in compliance with applicable law.
The following information is disclosed pursuant to Section 13(r). None of these activities involved U.S. affiliates of Telefónica.
Roaming Agreements with Iranian Operators
Some of our subsidiaries have entered into roaming agreements with Iranian telecommunication companies. Pursuant to such roaming agreements our subsidiaries’ customers are able to roam in the particular Iranian network (outbound roaming) and customers of such Iranian operators are able to roam in our relevant subsidiary’s network (inbound roaming). For outbound roaming, our subsidiaries pay the relevant Iranian operator roaming fees for use of its network by our customers, and for inbound roaming the Iranian operator pays the relevant subsidiary roaming fees for use of the respective network by its customers.
Our subsidiaries were party to the following roaming agreements with Iranian telecommunication companies in 2018:
|
(1)
|
Telefónica Móviles España S.A.
(“
TME
”), our Spanish directly wholly-owned subsidiary, has respective roaming agreements with (i) Mobile Telecommunication Company of Iran (“
MTCI
”), (ii) MTN Irancell (“
Irancell
”), (iii) Taliya (“
Taliya
”), and (iv) Telecommunication Kish Co (“
TKC
”). During 2018 TME recorded the following revenues related to these roaming agreements: (i) 98,58
0
.28 euros from MTCI, (ii) 561.17 euros from Irancell, (iii) no revenues from Taliya, and (iv) no revenues from TKC.
|
TME also holds a roaming hub through its 55% directly-owned subsidiary, Link2One, a.e.i.e. (“
L2O
”). Under the related agreement, L2O provides a roaming hub service to Irancell enabling the latter to maintain a relationship with other members of the hub. Some members of the hub are also entities of the Telefónica Group. During 2018 L2O recorded revenues of 18,000.00 euros from Irancell.
|
(2)
|
Telefónica Germany GmbH & Co. OHG (“
TG
”
)
,
our German 69.22% indirectly-owned subsidiary, has respective roaming agreements with (i) MTCI and (ii) Irancell. During 2018 TG recorded the following revenues related to these roaming agreements; (i) no revenues from MTCI and (ii) 4,543.71 euros from Irancell.
|
|
(3)
|
Telefónica
UK Ltd
(“
TUK
”), our English directly wholly-owned subsidiary, has respective roaming agreements with (i) Taliya and (ii) Irancell. During 2018 TUK recorded (i) no revenues from Taliya and (ii) 1,420.17 euros from Irancell.
|
|
(4)
|
Telefónica Argentina, S.A.
and
Telefónica Móviles Argentina, S.A
. (together “
TA
”), our Argentinean directly and indirectly wholly-owned subsidiaries, have a roaming agreement with Irancell. During 2018 TA recorded 6.51 euros in roaming revenues under this agreement.
|
|
(5)
|
Telefônica Brasil S.A.
(“
TB
”), our Brazilian 73.58% indirectly-owned subsidiary, has a roaming agreement with Irancell. During 2018 TB recorded 12.00 dollars in roaming revenues and had 979.88 dollars (before taxes and 1,068 dollars after taxes) of expenses payable to Irancell under this agreement.
|
|
(6)
|
Pegaso PCS S.A. de C.V.
(“
PCS
”), our Mexican directly wholly-owned subsidiary, has a roaming agreement with Irancell. During 2018 PCS recorded 8.80 euros in roaming revenues under this agreement.
|
|
(7)
|
Telefónica del Perú, S.A.A.
(“
TdP
”), our Peruvian 98.57% indirectly-owned subsidiary, has a roaming agreement with Irancell. During 2018 TdP recorded 0.08 euros in roaming revenues under this agreement.
|
|
(8)
|
Colombia Telecomunicaciones ESP. S.A.
(“
ColTel
”), our Colombian 67.50% directly and indirectly-owned subsidiary, holds a roaming hub through L2O. L2O, in turn, provides a roaming hub service to Irancell enabling the latter to maintain a relationship with other members of the hub. During 2018 ColTel recorded 1.62 euros in roaming revenues under this roaming hub service.
|
102
|
(9)
|
Telefonía Celular de Nicaragua S.A. (“
TN
”)
our Nicaraguan 60% indirectly-owned subsidiary, has an indirect relationship with Irancell via the Telefonica Link2One Roaming hub. During 2018 TN recorded 0.85 euros in roaming revenues under this agreement.
|
|
(10)
|
Telefonica Móviles del Uruguay S.A. (“
TMU
”)
our Uruguayan directly wholly-owned subsidiary, has an indirect relationship with Irancell via the Telefonica Link2One Roaming hub. During 2018 TMU recorded 0.09 euros in roaming revenues under this agreement.
|
The net profit recorded by our subsidiaries pursuant to these agreements did not exceed the related revenues recorded thereunder.
The purpose of all of these agreements is to provide our customers with coverage in areas where we do not own networks. For this purpose, we intend to continue maintaining these agreements except in respect of the activities related to L2O.
International Carrier Agreement with Iran
Telefónica de España had an international carrier agreement with Telecommunication Company of Iran that was terminated in September 2018.
Pursuant to this agreement, both companies interconnected their networks to allow international exchange of telephone traffic. Telefónica de España recorded 1,653.77 euros in revenues under this agreement in 2018 until it was terminated. The net profit recorded by Telefónica de España pursuant to this agreement did not exceed such revenues.
103
C. Organizational Structure
See “—History and Development of the Company” and “—Business Overview”.
104
D. Property, Plant and Equipment
Our central headquarters for the Telefónica Group are located in “Distrito Telefónica,” in Madrid, Spain.
Telefonica’s operations and assets (including its towers and submarine cables) are located in many areas that
are subject to natural disasters and severe weather, and which may be adversely affected in the future by climate change. See “Item 3. Key Information—Risk Factors—The telecommunications industry could be affected by factors related to sustainability and the environment".
Fixed Networks
We own fixed networks in Spain, Latin America and Europe, having an incumbent role in Spain, Argentina (the greater Buenos Aires metropolitan area and the southern portion of the country), Brazil (São Paulo), Chile, Peru and Colombia.
Following market trends, competitive environments, evolution of technologies and new multimedia and broadband services demanded by our customers, we have upgraded our networks in recent years through the following:
|
•
|
progressive introduction of broadband access technologies over copper: ADSL, ADSL2+, VDSL2, etc., increasing the bandwidth capacity provided to our broadband clients several times in the last fifteen years;
|
|
•
|
introduction of fiber access technologies (xPON) across different deployment scenarios: fiber to the home (FTTH), fiber to the building (FTTB), fiber to the curb (FTTC), fiber to the node (FTTN), etc., increasing the access speed up to 600 Mbps;
|
|
•
|
service support based on powerful Internet Protocol/ Multiprotocol Label Switching (IP/MPLS) backbones, providing full connectivity to the rest of the network layers, such as access and control, to support services for business and customer market segments (fixed and mobile);
|
|
•
|
migration of the legacy time division multiplexing (TDM) switching networks (PSTN and ISDN) to new generation network (NGN) over all-IP packet networks;
|
|
•
|
migration from legacy transport technologies, such as asynchronous transfer mode (ATM), frame relay (FR), low-rate leased lines, plesiochronous digital hierarchy (PDH) and synchronous digital hierarchy (SDH), to the new generation of optical transport ones, such as dense wavelength division multiplexing (DWDM), coarse wavelength division multiplexing (CWDM) and new generation-synchronous digital hierarchy (NG-SDH);
|
|
•
|
introduction of IMS (Internet Multimedia Subsystem) to simplify the control of the network and ease the deployment of new services over the all-IP converged network;
|
|
•
|
empowerment of the intelligence of the network to better manage its use, to avoid saturations and frauds and to identify new business opportunities;
|
|
•
|
convergence of fixed and mobile networks, services and support systems from both technological and operational points of view; and
|
|
•
|
deployment of new services such as Pay TV, to customers connected through broadband accesses in Spain, Chile, Argentina and Brazil.
|
Mobile Networks
We operate mobile networks in Spain, the United Kingdom, Germany, Brazil, Argentina, Venezuela, Chile, Peru, Colombia, Mexico, Panama, El Salvador, Nicaragua, Costa Rica, Ecuador and Uruguay. Until January 24, 2019, Telefónica also provided these services in Guatemala. In addition, the completion of the sale of our operations in El Salvador, Costa Rica, Panama and Nicaragua is currently pending. For additional information, see "—History and Development of the Company—Recent Developments”.
We use a number of mobile technologies in the countries in which we operate, namely: GSM, UMTS and LTE, the latter being already deployed in all of our operations. We continue the work of upgrading our mobile networks in line with market trends, the demand of new services from customers and the evolution of technologies. The main steps we are currently taking include:
105
|
•
|
evolution of broadband in mobile access using the latest LTE standards (LTE-A, MIMO and carrier aggregation) to improve network capacity and user experience;
|
|
•
|
deployment of new services such as mobile television (OTT) and distribution services for next generation music, video and games;
|
|
•
|
exploration of the adequacy of new technologies such as 4.5G / 5G to provide mobile accesses with increased bandwidth;
|
|
•
|
exploration of the adequacy of new technologies such as HSPA and LTE to provide mobile accesses with increased bandwidth. Together with the main vendors and sharing experience with other operators, we are exploring the opportunities that the new 5G standards can offer by providing higher capacity at a lower relative cost by user/traffic unit; and
|
|
•
|
convergence of fixed and mobile networks, services and support systems from both technological and operational points of view.
|
Satellite communications
The services provided using satellite platforms include television contribution signal to feed cable and IPTV head ends, DTH television, VSAT mainly for mobile telephony and Internet access in rural areas, emergency solutions, corporate communications and international communications.
Submarine cables
We are one of the world’s largest submarine cable operators. We participate in approximately 25 international underwater cable systems (nine of which are moored in Spain) and own eleven domestic fiber optic cables.
There are submarine cable connections between Spain and Africa, America, Asia and Europe, respectively, which are jointly owned by us with other telecom operators. The SAM-1 cable, which we own, has a length of approximately 22,000 kilometers underwater and 3,000 kilometers terrestrial and links different countries such as the United States, Puerto Rico, Ecuador, Guatemala, Peru, Chile, Brazil, Argentina and Colombia.
Extensions of the submarine cable network have been deployed to help meet the capacity demand in the future. The BRUSA cable links Brazil and the United States, while the Marea cable links the United States and Europe through Spain. Both cables began operations in 2018.
The principal services using the capacity of submarine cables are voice circuits, Internet and dedicated circuits for international traffic and for corporations and business customers.
On February 10, 2016, Telefónica announced the creation of Telxius, a company which brings together certain infrastructure assets of the Group, which enables the management of the Telefónica Group’s infrastructure on a global scale with a more specialized and focused approach, with the aim of increasing the services provided to other operators, improving the return on capital invested and allowing Telxius to participate more actively in the growth opportunities that exist in the industry, including the possibility of incorporating third party assets. As of the date of this Annual Report, the Group owns 50.01% of the share capital of Telxius.
106
Not applicable.
A. Operating Results
Presentation of Financial Information
The information in this section should be read in conjunction with our Consolidated Financial Statements, included elsewhere in this Annual Report. Our Consolidated Financial Statements have been prepared in accordance with IFRS as issued by the IASB.
On January 31, 2018, the Board of Directors of Telefónica resolved to adopt a new organizational structure in order to make the Group more agile, simple and focused on management, customer service, growth, efficiency and profitability.
The previous organizational structure, which was approved by the Board of Directors of Telefónica, S.A. on February 26, 2014 was made up of the following segments: Telefónica Spain, Telefónica United Kingdom, Telefónica Germany, Telefónica Brazil and Telefónica Hispanoamérica (formed by the Group’s operators in Argentina, Chile, Peru, Colombia, Mexico, Venezuela, Central America, Ecuador and Uruguay).
Following the Board of Directors' resolution on January 31, 2018,
Telefónica Hispanoamérica was split into two new segments in order to more effectively manage the different market situations: Telefónica Hispam Norte, encompassing the operations in Colombia, Mexico, Central America, Ecuador and Venezuela, and Telefónica Hispam Sur, encompassing operations in Argentina, Chile, Peru and Uruguay.
Due to the implementation of the new organizational structure referred to above, the comparative results of the segments of the Group for 2017 and 2016 and the comparative segmentation of assets, liabilities and investments accounted for by the equity method as of December 31, 2017 have been restated to reflect this new organization. These changes in the segments have had no impact on the consolidated results of the Group.
Restated numbers are identified as "revised data" in the tables included in this Annual Report.
The segments referred to above include the information related to the fixed, wireless, cable, data, Internet and television businesses and other digital services provided in each country.
Information relating to other Group companies not specifically included in these segments (see the section "Other companies" of Appendix I
of the Consolidated Financial Statements)
is reported under "Other companies and eliminations", which includes Telxius, holding companies, companies whose main purpose is to provide cross-sectional services to Group companies and other companies
.
Telxius' results are fully reported under "Other companies and eliminations" since January 1, 2017, reflecting the integration within Telxius of the mobile telecommunications towers transferred from the Telefónica Spain, Telefónica Germany, Telefónica Brazil and the old Telefónica Hispanoamérica segments and the international submarine fiber optic cable (which had already been previously reported under "Other companies and eliminations"). The 2016 comparative segment results have been revised accordingly in Telefónica's consolidated financial statements for the year ended December 31, 2017. Based on the different dates on which assets were contributed to Telxius by each operating segment, this affected the results of Telefónica Spain (since January 1, 2016), Telefónica Germany (since May 1, 2016), Telefónica Brazil (since April 1, 2016) and the old Telefónica Hispanoamérica segment (Telefónica Peru since April 1, 2016 and Telefónica Chile since May 1, 2016, both of which are currently part of Telefónica Hispam Sur). The results of the segments do not include the intra-group capital gains resulting from the transfer of towers to Telxius.
In addition, from 2017 Telefónica Spain includes the companies Telefónica Studios and Telefónica Servicios Audiovisuales (which were previously reported under “Other companies and eliminations”), and Telefónica Spain and Telefónica Hispanoamérica include the results of the data center business in Spain and Chile, respectively (which were previously reported under “Other companies and eliminations”). As a consequence, the 2016 comparative segment results have been revised accordingly in Telefónica's consolidated financial statements for the year ended December 31, 2017.
107
Non-GAAP financial information
In addition to the measures expressly defined in the IFRS, the Group also uses a series of other measures for decision-making because they provide additional information useful to assess the Group’s performance, solvency and liquidity. These measures should not be viewed in isolation or as a substitute for the measures presented according to the IFRS.
The non-GAAP financial measures included in this Annual Report are operating income before depreciation and amortization, net financial debt, net financial debt plus commitments and free cash flow.
Operating income before depreciation and amortization
Operating income before depreciation and amortization (OIBDA) is calculated by excluding solely depreciation and amortization from operating income. OIBDA is used to track the performance of the business and to establish operating and strategic targets of Telefónica Group companies. OIBDA is a commonly reported measure and is widely used among analysts, investors and other stakeholders in the telecommunications industry. However, it is not a measure expressly defined in the IFRS and therefore it may not be comparable to similar indicators used by other companies. OIBDA should not be considered as a substitute for operating income.
The following table provides a reconciliation of our OIBDA to operating income for the periods indicated.
|
Year ended December 31,
|
||||||
|
Millions of euros
|
2016
|
|
2017
|
|
2018
|
|
|
Operating income before depreciation and amortization
|
15,118
|
|
16,187
|
|
15,571
|
|
|
Depreciation and amortization
|
(9,649
|
)
|
(9,396
|
)
|
(9,049
|
)
|
|
Operating income
|
5,469
|
|
6,791
|
|
6,522
|
|
The following tables provide a reconciliation of OIBDA to operating income for the Group and for each of the Group’s segments for the periods indicated. The tables relating to 2016 and 2017 have been revised to reflect our current business segmentation which includes Telefónica Hispam Norte and Telefónica Hispam Sur.
|
2016 (revised data)
|
||||||||||||||||
|
Millions of euros
|
Telefónica Spain
|
|
Telefónica United Kingdom
|
|
Telefónica Germany
|
|
Telefónica Brazil
|
|
Telefónica
Hispam Norte |
|
Telefónica
Hispam Sur |
|
Other companies and eliminations
|
|
Total Group
|
|
|
Operating income before depreciation and amortization
|
4,403
|
|
1,709
|
|
1,771
|
|
3,702
|
|
1,113
|
|
2,360
|
|
60
|
|
15,118
|
|
|
Depreciation and amortization
|
(1,827
|
)
|
(1,090
|
)
|
(2,200
|
)
|
(2,036
|
)
|
(1,112
|
)
|
(1,075
|
)
|
(309
|
)
|
(9,649
|
)
|
|
Operating income
|
2,576
|
|
619
|
|
(429
|
)
|
1,666
|
|
1
|
|
1,285
|
|
(249
|
)
|
5,469
|
|
108
|
2017
|
||||||||||||||||
|
Millions of euros
|
Telefónica Spain
|
|
Telefónica United Kingdom
|
|
Telefónica Germany
|
|
Telefónica Brazil
|
|
Telefónica
Hispam Norte
|
|
Telefónica
Hispam Sur |
|
Other companies and eliminations
|
|
Total Group
|
|
|
Operating income before depreciation and amortization
|
4,952
|
|
1,639
|
|
1,821
|
|
4,191
|
|
1,263
|
|
2,275
|
|
46
|
|
16,187
|
|
|
Depreciation and amortization
|
(1,688
|
)
|
(1,047
|
)
|
(1,954
|
)
|
(2,228
|
)
|
(992
|
)
|
(1,198
|
)
|
(289
|
)
|
(9,396
|
)
|
|
Operating income
|
3,264
|
|
592
|
|
(133
|
)
|
1,963
|
|
271
|
|
1,077
|
|
(243
|
)
|
6,791
|
|
|
2018
|
||||||||||||||||
|
Millions of euros
|
Telefónica Spain
|
|
Telefónica United Kingdom
|
|
Telefónica Germany
|
|
Telefónica Brazil
|
|
Telefónica
Hispam Norte |
|
Telefónica
Hispam Sur |
|
Other companies and eliminations
|
|
Total Group
|
|
|
Operating income before depreciation and amortization
|
4,763
|
|
1,865
|
|
1,834
|
|
4,311
|
|
793
|
|
1,719
|
|
286
|
|
15,571
|
|
|
Depreciation and amortization
|
(1,650
|
)
|
(943
|
)
|
(2,071
|
)
|
(1,990
|
)
|
(967
|
)
|
(1,167
|
)
|
(261
|
)
|
(9,049
|
)
|
|
Operating income
|
3,113
|
|
922
|
|
(237
|
)
|
2,321
|
|
(174
|
)
|
552
|
|
25
|
|
6,522
|
|
Net financial debt and net financial debt plus commitments
As calculated by the Group net financial debt includes:
|
i.
|
current and non-current financial liabilities in our consolidated statement of financial position (including liability derivatives), and
|
|
ii.
|
other current and non-current liabilities included in “Payables and other non-current liabilities” and "Payables and other current liabilities" (mainly corresponding to payables for deferred payment of radio spectrum that have a financial component).
|
From these liabilities, the following are subtracted:
|
i.
|
cash and cash equivalents,
|
|
ii.
|
Other current financial assets (which include short-term derivatives),
|
|
iii.
|
the positive mark-to-market value of derivatives with a maturity beyond one year, and
|
|
iv.
|
other interest-bearing assets (components of “Receivables and other current assets”, “Tax receivables” and “Financial assets and other non-current assets” in our consolidated statement of financial position).
|
The accounts included in the net financial debt calculation recorded in "Payables and other non-current liabilities" or "Financial assets and other non-current assets" have a maturity beyond one year and a financial component. In "Receivables and other current assets" we include the customer financing of handset sales classified as short term, and "Financial assets and other non-current assets" includes derivatives, installments for the long-term sales of handsets to customers and other long-term financial assets.
We calculate net financial debt plus commitments by adding gross commitments related to employee benefits to net financial debt, and deducting the value of long-term assets associated with those commitments and the tax benefits arising from the future payments thereof. Gross commitments related to employee benefits are current and non-current provisions recorded for certain employee benefits such as termination plans, post-employment defined benefit plans and other benefits.
109
We believe that net financial debt and net financial debt plus commitments are meaningful for investors and analysts because they provide an analysis of our solvency using the same measures used by our management. Nevertheless, neither net financial debt nor net financial debt plus commitments as calculated by us should be considered as a substitute for gross financial debt as presented in the consolidated statement of financial position.
The following table presents a reconciliation of net financial debt and net financial debt plus commitments as of December 31, 2018 and 2017 to the Telefónica Group’s gross financial debt as indicated in the consolidated statement of financial position.
|
Millions of euros
|
12/31/2017
|
|
12/31/2018
|
|
|
Non-current financial liabilities
|
46,332
|
|
45,334
|
|
|
Current financial liabilities
|
9,414
|
|
9,368
|
|
|
Gross financial debt
|
55,746
|
|
54,702
|
|
|
Cash and cash equivalents
|
(5,192
|
)
|
(5,692
|
)
|
|
Other current financial assets
|
(2,154
|
)
|
(2,209
|
)
|
|
Cash and other current financial assets included in “Non-current assets classified as held for sale” (see Note 28 to the Consolidated Financial Statements)
|
—
|
|
(165
|
)
|
|
Positive mark-to-market value of long-term derivative instruments
|
(2,812
|
)
|
(2,776
|
)
|
|
Other liabilities included in "Payables and other non-current liabilities"
|
708
|
|
800
|
|
|
Other liabilities included in "Payables and other current liabilities"
|
111
|
|
111
|
|
|
Other assets included in "Financial assets and other non-current assets"
|
(1,516
|
)
|
(1,593
|
)
|
|
Other assets included in "Receivables and other current assets"
|
(661
|
)
|
(867
|
)
|
|
Other current assets included in "Tax receivables"
|
—
|
|
(568
|
)
|
|
Financial liabilities included in “Liabilities associated with non-current assets classified as held for sale” (see Note 28 to the Consolidated Financial Statements)
|
—
|
|
42
|
|
|
Net financial debt
|
44,230
|
|
41,785
|
|
|
Gross commitments related to employee benefits
|
6,578
|
|
5,940
|
|
|
Value of associated long-term assets
|
(749
|
)
|
(704
|
)
|
|
Tax benefits
|
(1,533
|
)
|
(1,390
|
)
|
|
Net commitments related to employee benefits
|
4,296
|
|
3,846
|
|
|
Net financial debt plus commitments (*)
|
48,526
|
|
45,631
|
|
|
(*) Includes assets and liabilities considered to be "net financial debt plus commitments" for Antares (see Note 21), Guatemala and El Salvador, which are classified as non-current assets held for sale and liabilities for non-current assets held for sale.
|
||||
Free Cash Flow
The Group’s free cash flow is calculated starting from “Net cash flow provided by operating activities” as indicated in the consolidated statement of cash flows; deducting (Payments on investments)/Proceeds from the sale of investments in property, plant and equipment and intangible assets, net, adding the cash received from government grants and deducting dividends paid to minority interests. The cash used to pay for commitments related to employee benefits (included in the Net cash flow provided by operating activities) is added back since it represents the payments of principal of the debt incurred with those employees.
We believe that free cash flow is a meaningful measure for investors and analysts because it provides an analysis of the cash flow available to protect solvency levels and to remunerate the parent company’s shareholders and other equity holders (which is why free cash flows do not consider payments to minority interests). The same measure is used internally by our management. Nevertheless, free cash flow as calculated by us should not be considered as a substitute for the various cash flows presented in the consolidated statements of cash flows.
110
The following table presents the reconciliation between the Telefónica Group’s Net cash flow provided by operating activities as indicated in the consolidated statement of cash flows and the free cash flow for 2018, 2017 and 2016:
|
Millions of euros
|
2016
|
|
2017
|
|
2018
|
|
|
Net cash flow provided by operating activities
|
13,338
|
|
13,796
|
|
13,423
|
|
|
(Payments on investments)/Proceeds from the sale of investments in property, plant and equipment and intangible assets, net
|
(9,187
|
)
|
(8,992
|
)
|
(8,585
|
)
|
|
Government grants received
|
—
|
|
2
|
|
37
|
|
|
Dividends paid to minority interests
|
(511
|
)
|
(555
|
)
|
(746
|
)
|
|
Payments related to cancellation of commitments
|
738
|
|
696
|
|
775
|
|
|
Free Cash Flow
|
4,378
|
|
4,947
|
|
4,904
|
|
111
Significant Factors Affecting the Comparability of Our Results of Operations in the Periods under Review
In 2018 two final decisions in favor of Telefónica Brazil were passed, which recognized the right to deduct the state tax on goods and services (ICMS) from the calculation of the basis of the Social Integration Program-PIS (Programa de Integração Social) and the Financing of Social Security-COFINS (Contribuição para Financiamento da Seguridade Social). Telefônica Brasil has presented the tax authorities a refund request for the payments of PIS/COFINS affected by the decisions, together with the corresponding default interest. The amount requested was recorded by the Group under “Credits and other financial assets” (see Note 11 for more information on the impact of these court decisions). Please see “Comparative information and main changes in the consolidation scope” in Note 2 to our Consolidated Financial Statements for further information on additional significant factors affecting the comparability of our results of operations in the periods under review, including the adoption of IFRS 15 and IFRS 9. See also “-Exchange Rate Fluctuations”.
Significant Changes in Accounting Policies
Please see Notes 2 and 3(n) to our Consolidated Financial Statements.
Critical Accounting Policies and Estimates
The preparation of financial statements in conformity with IFRS requires management to make estimates and assumptions that affect the amounts reflected in the Consolidated Financial Statements. We base our estimates on historical experience, where applicable, and other assumptions that we believe are reasonable under the circumstances. Actual results may differ from those estimates under different assumptions or conditions.
We consider an accounting estimate to be critical if:
|
•
|
it requires us to make assumptions because information was not available at the time or it included matters that were highly uncertain at the time we were making our estimate; and
|
|
•
|
changes in the estimate or different estimates that we could have selected may have had a material impact on our financial condition, results of operations or cash flows.
|
The various policies that are important to the portrayal of our financial condition, results of operations and cash flows include:
|
•
|
accounting for long-lived assets, including goodwill;
|
|
•
|
deferred taxes;
|
|
•
|
provisions;
|
|
•
|
revenue recognition; and
|
|
•
|
exchange rate and inflation rate used to remeasure Venezuelan bolivar denominated items; presentation of equity effects of hyperinflation.
|
Property, plant and equipment, intangible assets and goodwill
Property, plant and equipment and intangible assets, other than goodwill, are recorded at acquisition cost. If such assets are acquired in a business combination, the acquisition cost is the estimated fair value of the acquired property, plant and equipment or intangible assets. Property, plant and equipment and intangible assets with definite useful lives are depreciated or amortized on a straight-line basis over their estimated useful lives.
Intangible assets with indefinite useful lives are not amortized, but are, instead, subject to an impairment test on a yearly basis and whenever there is an indication that such assets may be impaired.
Accounting for long-lived assets and intangible assets involves the use of estimates for determining: (a) the fair value at the acquisition date in the case of such assets acquired in a business combination, and (b) the useful lives of the assets over which they are to be depreciated or amortized. We believe that the estimates we make to determine an asset’s useful life are “critical accounting estimates” because they require our management to make estimates about technological evolution and competitive uses of assets.
112
When an impairment in the carrying amount of an asset occurs, non-scheduled write-downs are made. We perform impairment tests of identifiable intangible and long-lived assets whenever there is reason to believe that the carrying value may exceed the recoverable amount, which is the higher of the asset’s fair value less costs to sell and its value in use. Furthermore, previously recognized impairment losses may be reversed when changes in the estimates used to determine the asset’s recoverable amount indicate that an impairment loss recognized in prior periods no longer exists or may have decreased.
The determination of whether the impairment of long-lived and intangible assets is necessary involves the use of significant estimates and judgment that includes, but is not limited to, the analysis of the cause of potential impairment in value, the timing of such potential impairment and an estimate of the amount of the impairment, which requires the estimation of the future expected cash flows, discount rates and the fair value of the assets.
Specifically, management has to make certain assumptions in respect of uncertain matters, such as growth in revenues, changes in market prices, operating margins, and technology developments and obsolescence, discontinuance of services and other changes in circumstances that indicate the need to perform an impairment test. Management’s estimates about technology and its future development require significant judgment because the timing and nature of technological advances are difficult to predict.
Goodwill arises when the cost of a business combination exceeds the acquirer’s interest in the net fair value of the identifiable assets acquired and liabilities assumed at the acquisition date. Goodwill is not amortized, but is, instead, subject to an impairment test on a yearly basis and whenever there is an indication that the goodwill may be impaired.
Non-scheduled write-downs of goodwill are made when an impairment in the carrying amount of goodwill occurs. We review, on a regular basis, the performance of our cash-generating units. We compare the carrying amount of the cash-generating unit to which the goodwill has been allocated with its recoverable amount. The determination of the recoverable amount of the cash-generating unit involves extensive use of estimates and significant management judgment is involved. Methods commonly used by us for valuations include discounted cash flow methods. As of December 31, 2018 goodwill related to Telefónica’s operations in Argentina had the highest risk of impairment in the event of changes in the assumptions used. See Note 7 to the Consolidated Financial Statements.
A significant change in the facts and circumstances that we relied upon in making our estimates may have a material impact on our operating results and financial condition.
Deferred income taxes
The Group assesses the recoverability of deferred tax assets based on estimates of future earnings, and of all the available options to achieve an outcome, it considers the most efficient one in tax terms within the legal framework the Group is subject to. Such recoverability ultimately depends on the Group’s ability to generate taxable earnings over the period for which the deferred tax assets remain deductible. This analysis is based on the estimated schedule for reversing deferred tax liabilities, as well as estimates of taxable earnings, which are sourced from internal projections that are continuously updated to reflect the latest trends.
The recognition of tax assets and liabilities depends on a series of factors, including estimates as to the timing and realization of deferred tax assets and the projected tax payment schedule. Actual Group company income tax receipts and payments could differ from the estimates made by the Group as a result of changes in tax legislation, the outcome of underway tax proceedings or unforeseen future transactions that could affect tax balances.
Provisions
Provisions are recorded when, at the end of the period, we have a present obligation as a result of past events, whose settlement requires an outflow of resources that is considered probable and can be measured reliably. This obligation may be legal or constructive, arising from, but not limited to, regulation, contracts, common practice or public commitments, which have created a valid expectation for third parties that we will assume certain responsibilities. The amount recorded is the best estimation performed by the management in respect of the expenditure that will be required to settle the obligations, considering all the information available at the closing date, including the advice of external experts, such as legal advisors or consultants.
If we are unable to reliably measure the obligation, no provision is recorded and information is then presented in the notes to the Consolidated Financial Statements.
Because of the inherent uncertainties in this estimation, actual expenditures may be different from the originally estimated amount recognized.
113
Significant management criteria was involved in the recording of provision relating to tax and regulatory contingencies in Brazil. See Notes 21, 22 and 26 to the Consolidated Financial Statements.
Revenue recognition
Bundled offers
Arrangements involving the delivery of bundled products or services are assessed to determine whether it is necessary to separate the arrangement into individual component deliverables, each with its own revenue recognition criteria.
Revenue relating to the bundled contracts is allocated to the different deliverables identified, based on their relative standalone selling prices.
Given that the handsets and airtime are price-sensitive and volatile in a competitive marketplace, the determination of standalone selling prices in the mobile phone business is quite complex.
Additionally, a significant change in the facts and circumstances upon which we based our estimates on standalone selling prices may have an impact on the allocation of revenues among the different deliverables identified and, consequently, on future revenues.
Exchange rate and inflation rates used to translate the financial statements of our Venezuelan subsidiaries; presentation of equity effects of hyperinflation
We review, on a regular basis, the economic conditions in Venezuela and the specific circumstances of our Venezuelan operations. In light of the worsening of the economic and political crisis in Venezuela and in the absence of official rates that are representative of conditions in such country at December 31, 2018, the Group maintains its policy to estimate an exchange rate that considers the progression of inflation in Venezuela and attempts to reflect the economic and financial position of the Group’s Venezuelan operations within its consolidated financial statements in a more accurate way.
Assessment of the exchange rate that better reflects the economics of Telefónica’s business activities in Venezuela relies on several factors and is performed considering all the information available at the closing date, and entails the use of assumptions and estimates and significant management judgment.
Due to inherent uncertainties in the estimates required to determine the appropriate exchange rate for the conversion of Venezuelan bolivar-denominated financial statements, actual cash flows denominated in such currency may differ from the amounts currently recognized on the basis of our estimates, as a result of changes in currency laws or changes in exchange mechanisms or published exchange rates that may have an impact on the conversion rate used for our Venezuelan subsidiaries’ financial statements, affecting the net monetary position of assets (liabilities) denominated in Venezuelan bolivar.
Furthermore, Venezuela is considered as a hyperinflationary economy since 2009. Telefónica recognizes the effects of inflation by restating the financial information of its Venezuelan operation using the “Indice Nacional de Precios al Consumidor de Venezuela” issued by the Central Bank of Venezuela, or the best estimate in case the final index is not available. For additional information, see “—Exchange Rate Fluctuations”.
Significant management judgment is required to determine the appropriate inflation rate where the official rate is not available. The estimates and underlying assumptions are based on careful consideration of factors that are considered to be relevant and rely on all the information available at the closing date. Actual results may differ from these estimates as a result of changes in circumstances and assumptions about future developments in Venezuela due to evolving market conditions, uncertainty about currency and operating restrictions or other circumstances arising beyond the control of the Company.
For a discussion of the contribution of Telefónica Venezuela to certain items of the consolidated income statement, cash flows statement and statement of financial position of the Telefónica Group for 2018, please see Note 2 to our Consolidated Financial Statements.
In addition to this, in 2018 the Group revisited its presentation policy for the equity effects of hyperinflation. To present more relevant and reliable information, the Group has included in a single line item within equity all effects derived from hyperinflation, i.e.: (i) the restatement for inflation of the financial statements of the Group companies
114
operating in hyperinflationary economies, and (ii) the effects of translating their respective financial statements into euros using the exchange rate at the end of the period. These effects are now shown in "Retained earnings" rather than presenting them under "Translation differences" within "Other comprehensive income". The Group has adopted this presentation policy retrospectively for all periods presented (for further detail please see Note 2 to our Consolidated Financial Statements). Had the Group selected a different approach to measure the equity effects of hyperinflation, the amount of hyperinflation effects on "Retained earnings" and "Other comprehensive income" would be different. Net equity would remain unchanged in any case.
Operating Environment
Our results of operations are dependent, to a large extent, on the level of demand for our services in the countries in which we operate. Demand for services in those countries is affected by the performance of their respective economies, particularly household private consumption, but also gross domestic product, or GDP, inflation, or CPI, external accounts and unemployment rates.
In January 2019, the International Monetary Fund (IMF) reported that global activity growth had slightly decelerated to 3.7% in 2018 from 3.8% in 2017, but was still above average growth of 3.5% in 2012-16. Although growth in the euro zone has lost steam, decelerating from 2.4% in 2017 to 1.8% in 2018, it remained at its average pace since 2014 and remained positive for the sixth year in a row, still supported by robust internal demand (+1.9 percentage points contribution on average since 2014), especially in Spain. According to the European Commission’s autumn 2018 forecast, internal demand is expected to remain the main pillar of growth, despite the considerable uncertainties resulting from Brexit, the uncertain political situation in some EU member states and other global risks, like the increase in trade tensions in certain regions, the tightening of the U.S. Federal Reserve’s monetary policy and growth deceleration in China.
In Latin America, following its rebound in 2017 (with growth of 1.3% year-on-year, compared to an average growth of 0.3% in 2014-16), the economic growth levelled off to 1.2% in 2018. Nonetheless, the IMF expects the recovery to carry on above 2% in the coming years, although the growth rates are expected to be significantly lower than those achieved before the global financial crisis (the average growth rate in 2004-08 was 5.1%). A recovery in commodity prices, especially oil and copper, is expected to provide some relief to the external accounts balances and contribute to activity growth in the region. However, a faster monetary normalization in the United States, as well as doubts about growth and imbalances in China, could have an impact on inward external flows, making financing conditions in Latin American countries more stringent, which would affect household private consumption negatively.
Operating environment by country
Spain
In 2018, Spanish GDP expanded by 2.5% (according to Funcas consensus forecast), growing below a 3.0% rate for the first time since 2014, but still growing at a notably higher pace than in 2014 (1.4%), following the average annual contraction of 1.8% in 2009-2013.
This performance was mainly attributable to the resilient domestic demand, which contribution to 2018 GDP growth was in line with its average of 3 percentage points since 2015. Household consumption growth remained stable at 2.4% in 2018 (Funcas consensus forecast), in line with the average growth in 2014-2017 and reverting the average negative growth rates of 2.2% per year during 2008-2013.
Investment also showed positive growth in 2018 for the fifth consecutive year in a row, growing at a rate of 5.6% (Funcas consensus forecast), compared to an average 4.8% growth in 2014-17 and the 7.4% annual decline experienced on average in 2008-2013. Inflation was 1.7% in 2018, slightly decelerating from 2.0% in 2017, but well above its 2014-2016 negative average of -0.3%.
For the sixth year in a row, the current account showed a surplus in 2018 representing 1.2% of GDP (Funcas Consensus Forecast), below its 2013-2017 average of 1.6% of GDP.
The unemployment rate continued its downward trend in 2018 after the 26.1% peak reached in 2013. The unemployment rate was 15.3% on average in 2018 (Funcas consensus forecast), down by almost 2.0 percentage points since 2017.
United Kingdom
115
In 2018, the British economy, measured in terms of GDP, grew 1.3% (HM Treasury consensus forecast) compared with an average growth rate of 1.8% in 2016-17 and 2.4% in 2013-15. Household consumption was the main source of economic growth, increasing by 1.6% (HM Treasury consensus forecast) in 2018, but at a pace below 2% for the first time since 2013, on the back of a slower reduction in unemployment rate to 4.1% (HM Treasury consensus forecast), from 4.4% in 2017, 5.3% in 2015 and a peak of 8.1% in 2011, and higher uncertainty as result of Brexit.
On the other hand, fixed capital investment growth stalled at 0.1% in 2018 (HM Treasury consensus forecast), compared to an average growth of 3.0% in 2015-17. This sudden stop was likely due to the increasing political and economic uncertainty surrounding Brexit, which is likely weighing on firms’ investment decisions.
Inflation (CPI) slightly decelerated to 2.5% in 2018 from 2.7% in 2017, as compared to an average of 0.7% in 2014-2016. Driven by the marked depreciation of the pound sterling by 25% between 2015 and 2017, inflation pressures are easing on the back of currency stabilization around 0.89 £ per euro in 2018 on average.
Germany
In 2018, the German economy grew by 1.5%, markedly decelerating from its average pace of 2.1% between 2014 and 2017. While German exports’ share in GDP remained above 50% in 2018, the biggest European economy has been hit by global trade tensions and uncertainties, leading to a negative contribution of external demand of -0.3 percentage points in 2018 GDP growth, after having contributed +0.2 percentage points in 2017 GDP growth. Nonetheless, investment kept growing at a healthy pace of 3% in 2018. The main factor behind the German deceleration was the decrease in private consumption, which grew by 1.0% in 2018 compared to an average of 1.8% in 2014-17, due to an increase in the savings ratio.
Inflation recovery is slowly taking place, with the inflation rate reaching 1.9% in 2018, its fastest pace since 2012, after reaching 1.7% in 2017 and an average of 0.4% in 2014-16. The unemployment rate has decreased by 0.4 percentage points on average per year since 2012. The International Labor Office (ILO) unemployment rate was estimated by the Bundesbank to have reached a new historical low of 3.4% in 2018 from the peak of 7.6% in 2009.
Brazil
Brazilian GDP increased approximately 1.3% in 2018 according to Consensus Economic Forecasts (“CFe”), continuing the gradual recovery path initiated in 2017, when GDP grew 1.1%. Investments increased by 3.4% (CFe) in 2018, after a decrease of 2.5% in 2017. Household consumption increased by 1.9% in 2018 (CFe), after a 1.4% increase in 2017.
Inflation, as measured by the IPCA, was 3.7% in 2018 (below the target of 4.5% but within the central bank’s tolerance range of 3%-6%), compared to 2.9% in 2017 and 6.3% in 2016. Due to the low level of inflation, the basic interest rate, the Special Clearance and Escrow System rate (Selic rate), was lowered from 7.0% at the end of 2017 to 6.5% at the end of 2018.
The current account deficit reached 14.5 billion U.S. dollars in 2018, compared to 7.2 billion U.S. dollars in 2017 and 23.5 billion U.S. dollars in 2016. In 2018, this deficit was financed by capital inflows, such as foreign direct investments, which reached 88.3 billion U.S. dollars, while portfolio investments resulted in an outflow of 8.4 billion U.S. dollars. International reserves increased by 5.0 billion U.S. dollars in 2018, to a level of 387.0 billion U.S. dollars.
The country-risk increased. Factors such as the less favorable external scenario and political uncertainties during the elections period contributed to the increase. The J.P. Morgan Emerging Markets Bond Index Plus (EMBI + Brazil) reached 270 basis points at the end of 2018, from 240 basis points at the end of 2017 and 328 basis points at the end of 2016. Due to these factors, the Brazilian reals depreciated in 2018. In particular, it depreciated 17.1% against the U.S. dollar, reaching an exchange rate of 3.87 reals per U.S. dollar on December 31, 2018, compared to 3.31 reals per U.S. dollar on December 31, 2017 and to 3.26 reals per U.S. dollar on December 31, 2016.
Mexico
Mexico’s real GDP increased by an estimated 2.1% in 2018 (CFe) and 2017, compared with 2.9% growth in 2016. During 2018, private consumption increased by 2.7% (CFe), after growing by 3.0% in 2017, and investment mildly rebounded by 1.7% (CFe), following a decrease of 1.5% in 2017. Political uncertainty surrounding the new administration and Mexico’s relationship with the United States have taken its toll on investment and exports (with the United States representing 82% of Mexican good exports in 2017).
116
Merchandise exports growth decelerated from 9.6% in 2017 to 8.6% in 2018 (CFe). The current account deficit remained however stable at 1.7% of GDP in 2018 (CFe).
CPI inflation decelerated from 6.0% in 2017 to 4.9% in 2018. Despite this deceleration, it still surpassed the Mexican Central Bank’s tolerance range of 2% to 4%. Easing of inflation took place on the back of the stabilization of energy prices and a lesser depreciation of the Mexican peso compared to 2017. On December 31, 2018, the exchange rate was 20.0 Mexican pesos per U.S. dollar (19.7 and 20.6 Mexican pesos per U.S. dollar at December 31, 2017 and 2016, respectively).
Venezuela
Since 2015, the Central Bank of Venezuela stopped publishing statistical information on GDP, balance of payments and inflation. However, the expectations about the worsening of economic conditions have been confirmed by analysts’ forecasts. Ecoanalítica (a local consulting firm) estimates that GDP contracted by 25.9% in 2018. The Plan of Recovery, Growth, and Economic Prosperity announced by the Government in the third quarter of 2018 did not have a positive impact on economic activity and GDP maintained its negative trend. The plan included a series of measures focusing on different economic areas, like the increase in the minimum wage by 5,900%, zero fiscal deficit (mainly through tax increases), and the establishment of the Petro as the unit of account to determine the minimum wage. In addition, a new price system called "Plan 50" was established.
Salary increases (six in 2018) have not fulfilled their objective of recovering purchasing capacity, since inflation has accelerated significantly. Ecoanalítica estimates that salaries have already lost 86.5% of their purchasing capacity since the salary hike of September 1, 2018.
Private consumption, investments and public consumption are estimated to have fallen by 19.6%, 43.7% and 22.0%, respectively, in 2018. Additionally, exports are estimated to have declined by 26.7% in 2018 and imports are estimated to have contracted by 7.6% according to Ecoanalítica estimations.
The hyperinflationary process continues. According to Ecoanalítica, prices are estimated to have increased 2,106,600% year-on-year in 2018, at a much higher pace than in 2017 when the inflation rate reached 2,874%.
Oil activity was significantly affected by the absence of investment in refineries, with the reduction of the operative drills to 27 at the end of 2018, which represented a 50% decrease when compared with the active units at the end of 2017, as well as the lack of maintenance of oil infrastructure. According to the OPEC, the Venezuelan crude production was 1.1 Mbd in December 2018, 500 Mbd less than in December 2017 and 886 Mbd less than in December 2016.
The unemployment rate was estimated to have averaged 14.9% in 2018, compared to the 9.4% unemployment rate estimated for 2017.
Chile
Chilean GDP expanded at an estimated rate of 4.0% (CFe) in 2018, gaining momentum compared to the last four years in which the annual growth rate averaged 1.7%. The Chilean economy improved on the back of higher private spending in both consumption and investment, suitable monetary and financial conditions and increasing confidence and optimism among private agents. The unemployment rate rose to 6.9% (CFe) compared with 6.6% and 6.5% in 2017 and 2016, respectively, as the labor force increased faster than employment. Wages rose below historical averages. Inflation, measured by CPI, reached 2.5% in 2018, increasing by 0.3 percentage points with respect to 2017 (2.2%), but remaining below the Central Bank’s inflation target of 3%.
The Chilean Central Bank started reducing monetary stimulus by raising the policy interest rate from 2.50% to 2.75% in the last quarter of 2018. Government spending growth moderated compared to previous years, as the fiscal authority is embarked on a policy of deficit reduction. The fiscal balance reached an estimated 2.0% (CFe) of GDP, compared to 2.8% of GDP in 2017. Trade balance surplus accounted for 6.6 billion U.S. dollars (CFe) in 2018, compared to 7.9 billion U.S. dollars in 2017 and 5.4 billion U.S. dollars in 2016. The current account deficit reached 7.4 billion U.S. dollars or 2.5% of GDP (CFe) in 2018, compared to 1.4% and 1.5% of GDP in 2017 and 2016, respectively.
The nominal exchange rate at the end of 2018 was 696 Chilean pesos per U.S. dollar, reflecting a year-over-year Chilean peso depreciation of 13.1%. Along the period, it fluctuated mainly in response to external factors such as US monetary policy, the fall in copper prices as a result of concerns over increasing trade tensions and the increasing volatility on financial markets. In addition, the Chilean peso was hit by other events such as the general elections in Brazil and Mexico as well as the financial turmoil in Argentina and Turkey. It must be highlighted that, in the first quarter
117
of 2018, the exchange rate fell to a three-year minimum of 587 Chilean pesos per U.S. dollar; however, since May, the Chilean peso weakened continuously as a result of the factors referred to above.
Argentina
Argentina’s GDP decreased by an estimated 2.4% in 2018 (CFe) due to the “sudden stop” crisis in the middle of the year, which effect was amplified by the negative impact that a severe drought had on the 2018 cereal harvest.
This figure contrasts sharply with the 2.9% growth recorded in 2017 and the average annual growth rate of approximately 7.5% achieved from 2005 through 2008.
The Argentine peso depreciated by 101.4% relative to the U.S. dollar, closing at 37.81 Argentine pesos per U.S. dollar at the end of 2018, compared with 18.77 Argentine pesos per U.S. dollar at the end of 2017 and 15.85 Argentine pesos per U.S. dollar at the end of 2016.
The National CPI increased by 47.6% in 2018 compared with 24.8% in 2017 and 41.0% in 2016.
The estimated current account deficit in 2018 was 21.9 billion U.S. dollar (CFe), representing 4.6% of GDP. While this imbalance is believed to have started to decrease during the second half of 2018, given the magnitude of the deficit, capital inflows would be required to finance it.
The central government primary fiscal deficit is also high, reaching 2.4% of GDP at year-end 2018 (CFe). Interest payments reached 2.8% of GDP, which together with the primary deficit, represented a total deficit of 5.4% of GDP. The “sudden stop” crisis, together with high financing needs both from internal and external sources, resulted in the need of Argentina’s Government to seek assistance from the IMF, which in September 2018 granted the Central Government a Stand-by Agreement for up to 57,000 million U.S. dollars.
Colombia
Colombian GDP is estimated to have grown 2.6% in 2018 (CFe), above the 1.8% and 2.0% growth rates recorded in 2017 and 2016, respectively. This growth was attributable to a good performance of both household consumption (2.7% CFe) and public consumption (4.2% CFe).
Despite economic recovery, unemployment rate stayed at 9.4% (CFe), in line with previous years (9.4% in 2017 and 9.3% in 2016).
The inflation rate was 3.2% year-on-year at the end of 2018, 0.9 percentage points lower than in 2017. The deceleration of inflation was mainly due to the declining impact of the 2016 tax reform and the effect of price indexation amidst an scenario of disinflationary pressures since 2016.
The Colombian peso remained stable on average against the U.S. dollar in 2018. During the first nine months, there was a slight appreciation thanks to the increase in oil prices, but it depreciated in the fourth quarter as a result of the subsequent fall in oil prices. The exchange rate at the end of 2018 was 3,212 Colombian pesos per U.S. dollar. This depreciation was mainly attributable to the fall in oil prices, as well as higher external volatility and the normalization of the U.S. Federal Reserve's monetary policy.
The Central Bank of Colombia reduced interest rates by 50 basis points from 4.75% to 4.25%, slightly below its neutral level at the beginning of the year, and left the rate unchanged until the end of 2018. The low economic growth and the limited inflation allowed this policy.
Current account deficit is estimated to have reached 10.4 billion U.S. dollars (CFe) in 2018, 3.1% in terms of GDP, which is lower than in 2017 (3.3%) and 2016 (4.3%). The growth of imports, thanks to domestic demand recovery did not allow a greater correction of the current account deficit.
Peru
Peruvian GDP expanded by 3.9% in 2018 (CFe), in contrast to the 2.5% growth in 2017. This was mainly explained by the improvement of domestic demand after overcoming the impacts of El Niño Costero phenomenon in 2017. Private consumption has been sustained by increasing wages and consumer credit. Likewise, the increase in commodities prices had a positive impact on private investment, with a notable improvement of mining investment.
Consumer prices, as measured by the CPI, increased by 2.2% in 2018, within the Central Bank’s target of 1%-3%, compared with 1.4% in 2017 and 3.2% in 2016.
118
The Peruvian Central Bank cut its interest key rate by 50 basis points from 3.25% in 2017 to 2.75% in 2018. This cut is consistent with the stimulus that is still required to consolidate the recovery of the economy. In addition, the Peruvian Central Bank emphasized that it will maintain an expansionary policy until inflation converges to the center of its target range and GDP is close to its potential level.
The government budget deficit decreased to 2.4% of GDP (CFe) in 2018 from 3.1% of GDP at the end of 2017. This was mainly explained by the increase in tax income.
The Peruvian Nuevo Sol depreciated by 4.0% against the U.S. dollar in 2018, reaching 3.34 Peruvian Nuevo Sol per U.S. dollar at the end of the year, compared with an appreciation of 3.6% in 2017 and 1.7% in 2016.
The trade surplus reached 7.0 billion U.S. dollars in 2018 (slightly higher than the 6.3 billion U.S. dollars surplus in 2017) and lower financial capital inflows led to a decrease of the international net reserves (3.5 billion U.S. dollars), reaching 60.1 billion U.S. dollars in 2018 compared to 63.6 billion U.S. dollars in 2017 and 61.7 billion U.S. dollars in 2016.
Country risk, measured by the J.P. Morgan Emerging Markets Bond Index (EMBIG Peru), increased 32 basis points to 168 basis points in 2018 as compared to 2017. As of the date of this Annual Report, the long-term sovereign debt rating is investment grade by Fitch, Standard and Poor’s and Moody’s rating agencies.
Exchange Rate Fluctuations
We publish our Consolidated Financial Statements in euros. Because a substantial portion of our assets, liabilities, revenues and expenses are denominated in currencies other than the euro, we are exposed to fluctuations in the values of these currencies against the euro. Currency fluctuations have had and may continue to have a material impact on our financial condition, results of operations and cash flows.
We estimate that in 2018 variations in currencies and hyperinflation in Argentina decreased year-on-year growth in our consolidated revenues by approximately
8.8
percentage points. Currency fluctuations can also have a significant impact on our statement of financial position, particularly equity attributable to equity holders of the parent, and on our statement of cash flows, when translating the financial statements of subsidiaries located outside the Eurozone into euro. In 2018 equity attributable to equity holders of the parent decreased by
2,044
million euros and cash and cash equivalents decreased by approximately
244 million
euros due to the translation of the financial statements of our foreign subsidiaries, principally due to the depreciation of the Brazilian real and Argentine peso relative to the euro.
We estimate that in 2017 variations in currencies and hyperinflation in Venezuela decreased year-on-year growth in our consolidated revenues by approximately
3.2
percentage points. In 2017 equity attributable to equity holders of the parent decreased by 4,279 million euros and cash and cash equivalents decreased by approximately
341 million
euros due to the translation of the financial statements of our foreign subsidiaries, principally due to the depreciation of the Brazilian real, Argentine peso and pound sterling relative to the euro.
We estimate that in 2016 variations in currencies and hyperinflation in Venezuela decreased year-on-year growth in our consolidated revenues by approximately 8.0 percentage points. In 2016 equity attributable to equity holders of the parent increased by 2,073 million euros and cash and cash equivalents increased by approximately 185 million euros due to the translation of the financial statements of our foreign subsidiaries, principally due to the appreciation of the Brazilian real, Chilean peso and the Colombian peso, partially offset, by the depreciation of the pound sterling, Argentine peso and Mexican peso relative to the euro.
Venezuela is considered as a hyperinflationary economy since 2009. The inflation rates used to prepare the financial information included herein are based on the National Consumer Price Index of Venezuela (Indice Nacional de Precios al Consumidor de Venezuela) published by the Central Bank of Venezuela, or where a definitive index is not available, the best estimation. On an annual basis, these rates are 2,106,600.6%, 2,874.1% and 511.1% for 2018, 2017 and 2016, respectively. The exchange rates used to convert items denominated in Venezuelan bolivar, once adjusted for inflation, in the Consolidated Financial Statements are the closing rates as of December 31, 2018, 2017 and 2016, which were 7,608.4 bolivar soberano per U.S. dollar (synthetic exchange rate), 36,115.28 bolivar fuerte per U.S. dollar (synthetic exchange rate) and 674 bolivar fuerte per U.S. dollar (by reference to DICOM), respectively. The bolivar fuerte was devalued in August 2018 and a new currency, the bolivar soberano, was adopted. On November 30, 2018, it was announced that the remaining denominations of the bolivar fuerte would be withdrawn from circulation and cease to be of legal tender on December 5, 2018.
Argentina is considered as a hyperinflationary economy since July 2018. The inflation rates used to prepare the financial information included herein are based on the National Consumer Price Index of Argentina (Indice de Precios
119
al Consumidor con Cobertura Nacional de Argentina) published by the Central Bank of Argentina, or where a definitive index is not available, the best estimation. On an annual basis, this rate was 48.1% for 2018. The exchange rate used to convert items denominated in Argentine peso, once adjusted for inflation, in the Consolidated Financial Statements are the closing rates as of December 31, 2018, which was 37.8 Argentine pesos per U.S. dollar.
The table below sets forth the average exchange rates against the euro of the U.S. dollar and the key currencies that impacted our consolidated results of operations for the periods indicated. Positive percentage changes represent a decline in the value of the applicable currency relative to the euro, and negative percentage changes represent increases in the value of the applicable currency relative to the euro.
|
|
2016 (1)
|
|
2017 (1)
|
|
2018 (1)
|
|
% change 2016 to 2017
|
|
% change 2017 to 2018
|
|
|
|
Average
|
|
Average
|
|
Average
|
|
Average
|
|
Average
|
|
|
Pound Sterling
|
0.82
|
|
0.88
|
|
0.88
|
|
7.71
|
%
|
0.53
|
%
|
|
U.S. Dollar
|
1.11
|
|
1.13
|
|
1.18
|
|
1.80
|
%
|
4.42
|
%
|
|
Brazilian Real
|
3.83
|
|
3.59
|
|
4.29
|
|
(6.34
|
%)
|
19.56
|
%
|
|
Argentine Peso (2)
|
16.31
|
|
18.56
|
|
43.30
|
|
13.77
|
%
|
n.m.
|
|
|
Peruvian Nuevo Sol
|
3.73
|
|
3.67
|
|
3.88
|
|
(1.69
|
%)
|
5.67
|
%
|
|
Chilean Peso
|
747.50
|
|
731.28
|
|
756.46
|
|
(2.17
|
%)
|
3.44
|
%
|
|
Mexican Peso
|
20.63
|
|
21.29
|
|
22.69
|
|
3.20
|
%
|
6.57
|
%
|
|
Venezuelan Bolívar Fuerte
|
710.23
|
|
43,290.04
|
|
—
|
|
n.m.
|
|
n.m.
|
|
|
Venezuelan Bolívar Soberano (2)
|
—
|
|
—
|
|
8,710.80
|
|
n.m.
|
|
n.m.
|
|
|
Colombian Peso
|
3,369.06
|
|
3,324.37
|
|
3,485.23
|
|
(1.33
|
%)
|
4.84
|
%
|
|
Guatemalan Quetzal
|
8.41
|
|
8.29
|
|
8.87
|
|
(1.38
|
%)
|
7.03
|
%
|
Source: Central treasury bank of the respective countries, except with respect to the Venezuelan bolivar fuerte, Venezuelan bolivar soberano and, with respect to 2018, the Argentine peso.
(1) These exchange rates are used to convert the income statements of our subsidiaries from local currency to euro.
(2) As Venezuela and, with respect to 2018 only, Argentina are considered to be hyperinflationary economies, the income statement from operations in each such country is accounted for pursuant to the closing exchange rate of the relevant local currency to euro.
We describe certain risks related to exchange rate fluctuations in “Item 3. Key Information—Risk Factors,” and we describe our policy with respect to limiting our exposure to short-term fluctuations in exchange rates under “Item 11. Quantitative and Qualitative Disclosures About Market Risk.”
Group Results of Operations
Please see “Item 4. Information on the Company — Business Overview — Financial Results.”
B. Liquidity and Capital Resources
Cash Flow Analysis
The table below sets forth consolidated cash flow information for the years indicated. Positive figures refer to cash inflows and those in parentheses refer to cash outflows.
|
|
2016
|
2017
|
|
2018
|
|
|
(millions of euros)
|
|
|
|
|
|
|
Net cash from operating activities
|
13,338
|
13,796
|
|
13,423
|
|
|
Net cash used in investing activities
|
(8,208)
|
(10,245
|
)
|
(8,685
|
)
|
|
Net cash used in financing activities
|
(4,220)
|
(1,752
|
)
|
(3,880
|
)
|
120
For a discussion of our cash flows for the years ended December 31, 2016, 2017 and 2018, please see Note 25 to our Consolidated Financial Statements.
Anticipated Uses of Funds
Our principal liquidity and capital resource requirements consist of the following:
|
•
|
costs and expenses relating to the operation of our business;
|
|
•
|
debt service requirements relating to our existing and future debt;
|
|
•
|
capital expenditures for existing and new operations;
|
|
•
|
acquisitions of new licenses or other operators or companies engaged in complementary or related businesses; and
|
|
•
|
dividends, other shareholder remuneration, and pre-retirement payments.
|
In 2019, we expect to continue transforming our networks, evolving them towards all-IP hyper-connected networks, by investing in FTTx in key markets, and by expanding our mobile networks with LTE in most of our operations. We also expect to continue investing in TV and digital services to take advantage of the opportunities in the digital markets. We may also use funds to acquire new licenses engaged in complementary or related businesses in the digital world.
We also have liquidity requirements related to the costs and expenses relating to the operation of our business, financial investments, our payment of dividends, shareholder remuneration and pre-retirement payment commitments.
We also have liquidity constraints related to debt service requirements in connection with our existing and future debt. At December 31, 2018, we had gross financial debt of 54,702 million euros compared with 55,746 million euros at December 31, 2017. For the amortization schedule of our consolidated gross financial debt at December 31, 2018 and a further description of financing activity in 2018, see “—Anticipated Sources of Liquidity” below. Our net financial debt decreased by 2,445 million euros to 41,785 million euros at December 31, 2018, compared with 44,230 million euros at December 31, 2017. The main factors contributing to the decrease in net financial debt in 2018 include the following: (i) our 2018 free cash flow generation of 4,904 million euros; (ii) net financial divestments of 392 million euros; and (iii) other factors for a net amount of 532 million euros (including the aforementioned favorable court ruling in Brazil, the extension of payment terms with suppliers or the factoring firm, and the lower value in euros of net debt in foreign currencies); which more than offset the impact of (i) our remuneration to shareholders (including dividends, issuance of capital instruments, purchase of treasury stock and payment of coupons on undated deeply subordinated securities) amounting to 2,608 million euros; and (ii) the payment of labor-related commitments (775 million euros), mainly related to early retirements.
For a reconciliation of net financial debt to gross financial debt, see “—Presentation of Financial Information—Non-GAAP financial information—Net financial debt and net financial debt plus commitments”.
For a discussion of our liquidity risk management policy, see Note 17 to our Consolidated Financial Statements.
Anticipated Sources of Liquidity
Cash flows from operations are our primary source of cash funding for existing operations, capital expenditures, investments, licenses, interest obligations and principal payments. We also rely on external financing, including a variety of short, medium- and long-term financial instruments, principally bonds and debentures, undated deeply subordinated securities and borrowings from financial institutions. Cash and cash equivalents are mainly held in euros and euro-denominated instruments.
In recent years, we raised funds by issuing equity instruments, principally undated deeply subordinated securities, mandatory convertible notes and debt securities.
Financing
The following table shows the amortization schedule of our consolidated gross financial debt at December 31, 2018 as stated in euro, excluding estimated future interest payments. We may have exchange rate financial derivatives as instruments assigned to the underlying debt instruments. The table below includes the fair value of derivatives classified as financial liabilities (i.e., those with a negative mark-to-market) and excludes the fair value of derivatives classified as current financial assets (
922
million euros), and those classified as non-current (
2,776
million euros) (i.e.,
121
those with a positive mark-to-market). For description of the liquidity risk we face, see Note 17 to our Consolidated Financial Statements, and for a description of our financial liabilities, see Note 16 to our Consolidated Financial Statements.
|
Millions of euros
|
||||||||||||||||
|
|
Current
|
Non-current
|
|
|
||||||||||||
|
Maturity
|
2019
|
|
2020
|
|
2021
|
|
2022
|
|
2023
|
|
Subsequent years
|
|
Non-current total
|
|
Total
|
|
|
Debentures and bonds
|
4,234
|
|
5,161
|
|
4,821
|
|
4,958
|
|
2,316
|
|
19,686
|
|
36,942
|
|
41,176
|
|
|
Promissory notes & commercial paper
|
1,979
|
|
113
|
|
—
|
|
—
|
|
117
|
|
245
|
|
475
|
|
2,454
|
|
|
Total Issues
|
6,213
|
|
5,274
|
|
4,821
|
|
4,958
|
|
2,433
|
|
19,931
|
|
37,417
|
|
43,630
|
|
|
Loans and other payables
|
2,925
|
|
515
|
|
876
|
|
525
|
|
849
|
|
2,865
|
|
5,630
|
|
8,555
|
|
|
Derivative instruments
|
230
|
|
628
|
|
300
|
|
224
|
|
138
|
|
997
|
|
2,287
|
|
2,517
|
|
|
Total
|
9,368
|
|
6,417
|
|
5,997
|
|
5,707
|
|
3,420
|
|
23,793
|
|
45,334
|
|
54,702
|
|
Notes:
-
Estimated future interest payments as of December 31, 2018 on our interest-bearing debt (not included above) are as follows: 1,624 million euros in 2019, 1,399 million euros in 2020, 1,171 million euros in 2021, 1,021 million euros in 2022, 836 million euros in 2023 and 8,320 million euros in subsequent years. With respect to floating rate debt, we estimate future interest payments as the forward rates derived from yield curves quoted for the different currencies on December 31, 2018.
During 2018, we obtained financing totaling approximately 12,494 million euros (excluding the refinancing of euro commercial paper and short term banking loans) and focused on maintaining a solid liquidity position, as well as refinancing and extending the debt maturities (in an environment of low interest rates).
For a description of our financing, see Note 16 to our Consolidated Financial Statements.
On February 5, 2019, Telefónica Emisiones, S.A.U. issued, under its EMTN Program, notes in the Euro market guaranteed by Telefónica, S.A., amounting to 1,000 million euros. These notes are due on February 5, 2024, pay an annual coupon of 1.069% and were issued at par (100%). The net proceeds of the notes are to be allocated towards projects aiming to improve energy efficiency in the network transformation from copper to fiber optic in Spain.
Our borrowing requirements are not significantly affected by seasonal trends.
Availability of funds
At December 31, 2018, we had funds available (including cash and cash equivalents, undrawn lines of credit and current financial assets) totaling 20,119 million euros. This amount included: undrawn lines of credit for an amount of 12,219 million euros (11,887 million euros expiring in more than 12 months); cash and cash equivalents and current financial assets.
We believe that, in addition to internal generation of funds, our working capital, our medium-term note program, our euro commercial paper program, our corporate domestic promissory note program and available lines of credit will allow us to meet our future capital requirements, including (according to our liquidity policy) gross debt maturities in the next 12 months.
For a description of our liquidity and undrawn lines of credit available at December 31, 2018, see Notes 15 and 16 to our Consolidated Financial Statements, and for a discussion of our liquidity risk management and our capital management, see Note 17 to our Consolidated Financial Statements.
Telefónica, S.A. is the parent company of the Telefónica Group and receives funding from its subsidiaries in the form of dividends and loans. Consequently, restrictions on the ability of the Group’s subsidiaries to transfer funds to Telefónica, S.A. in the form of cash dividends, loans or advances, capital repatriation and other forms would negatively affect our liquidity and thus our business.
Certain Latin American economies, such as currently Venezuela, or Argentina in the past, have experienced shortages in foreign currency reserves and their respective governments have adopted restrictions on the ability to transfer funds out of the country and convert local currencies into U.S. dollars. This may limit our ability to repatriate funds out of certain subsidiaries from such countries. Regarding net repatriation of funds to Spain, in 2018 we received
122
on a net basis 778 million euros from our Latin American subsidiaries, of which 823 million euros related to dividends received, which were partly offset by an outflow of 46 million euros due mainly to the capital increases of certain Group companies.
Credit Ratings
Our ability to use external sources of financing will depend in large part on our credit ratings. We believe that we are well-positioned to raise capital in financial markets. However, negative conditions in the financial markets or a downgrade of any of the ratings of our debt or the Kingdom of Spain’s debt by any of Fitch, Moody’s and/or Standard & Poor’s may increase the cost of our future borrowings or may make it more difficult to access the public debt markets. In connection with the credit rating agencies’ review of our debt ratings, the rating agencies may give considerable weight to general macroeconomic and political conditions (including sovereign credit rating prospects), the performance of our businesses in countries where we operate, our financial and shareholder remuneration policy, our M&A policy, our ability to integrate acquired companies and our ability to refinance debt.
At December 31, 2018, Telefónica, S.A.’s long-term issuer default rating is "BBB stable outlook" from Fitch, “Baa3 stable outlook" from Moody's and "BBB stable outlook" from Standard & Poor's. During 2018, there have not been any changes in the credit ratings by the three agencies. The last changes in the credit ratings took place in 2016 when Moody’s downgraded the rating to “Baa3 stable” from “Baa2 negative” on November 7, 2016, Fitch downgraded the rating to “BBB stable” from “BBB+ stable” on September 5, 2016 and Standard and Poor’s revised the outlook to “stable” from “positive” on May 17, 2016.
The European Commission's decision to block the proposed sale of O2 U.K. to Hutchison's Three U.K. in 2016 had an impact on Telefónica's credit ratings and outlooks by Moody’s and Standard and Poor’s, as they considered such decision would delay the Company’s deleveraging process. During 2018, we have taken certain measures designed to protect our credit rating. These measures mainly include: an intensive financing activity, taking advantage of low refinancing rates to extend average debt life, together with the maintenance of an appropriate level of liquidity and an active portfolio management through the completion of the 16.65% divestment of the share capital of Pontel Participaciones, S.L., which owns 60% of the share capital of Telxius.
Intragroup Loans
We lend funds to our operating subsidiaries, directly or through holding companies that head our different lines of business. At December 31, 2018, we had loans outstanding totaling
5,976
million euros (4,881 million euros at December 31, 2017) to companies in the Telefónica Group (including subsidiaries located in Latin American countries). These funds are derived from retained cash flows, loans, bonds, issuances of undated deeply subordinated securities and other sources (such as asset disposals). For additional information, see "Item 7. Major Shareholders and Related Party Transactions—Related Party Transactions—Intra-Group Loans".
C. Research and Development, Patents and Licenses, etc.
Telefónica remains committed to technological innovation as a fundamental tool for being one of the main actors in the new digital universe, with the capacity to help to create a more sustainable world while achieving competitive advantages and distinctive products. By introducing new technologies and developing business solutions and processes, we aim to become a more effective, efficient and customer-oriented Group.
Telefónica bases its innovation strategy on the balance between two main models:
|
•
|
Promoting our internal research, development and innovation (R&D&i) capabilities, for which we have developed our own innovation model, which allows us to promote the application of technical research in developing commercial products and services using the knowledge developed in research centers, technological institutes and universities, among other sources; and
|
|
•
|
Promoting the creation of open innovation ecosystems, in which the
“Wayra”
initiative stands out as a global program designed to connect entrepreneurs, start-ups, investors, venture capital funds and public and private organizations around the world to promote innovation in collaboration with other actors.
|
In parallel with these two models, Telefónica seeks to promote the development of sustainable solutions that generate a positive impact on the environment and on the economic, social and technological progress of the regions in which we operate. To this effect, in addition to the investment made in promoting sustainable innovation projects and in the activities that are developed to improve the accessibility of our solutions to all groups, Telefónica has a subsidiary which is focused on the development of disruptive technologies.
123
Telefónica believes that competitive advantage cannot be based solely on acquired technology, and so has considered the promotion of internal innovation, research and development activities as a strategic axis, in an effort to achieve this differentiation and move forward in other activities which support the sustainability of our business.
To this effect, the Telefónica Group’s internal innovation policy focuses on contributing solutions that support Telefónica’s commitment to developing a responsible business under the criteria of economic, social and environmental sustainability, by:
|
•
|
Developing new products and services that enable growth and competition in an increasingly global environment, while being adapted to the diversity and local needs of each market;
|
|
•
|
Increasing the revenues related to new products by creating value from the technology generated;
|
|
•
|
Increasing our customers' loyalty and satisfaction;
|
|
•
|
Increasing the revenues, profits and value of the Company;
|
|
•
|
Increasing the quality of our infrastructure and services, as well as our relationship with our technology providers and solutions; and
|
|
•
|
Improving business processes and operations with the aim of optimizing resources, increasing efficiency and reducing environmental impact.
|
During 2018, we carried out numerous technological innovation projects focused on sustainability, process efficiency, the creation of new sources of revenue, customer satisfaction, the consolidation of our presence in new markets and technological leadership.
We also continued the development of innovation projects to promote an increase in the access to information technology in rural areas or areas of difficult access (Proyecto Internet para todos), new connectivity technologies, solutions and applications focused on Internet business models, advanced user interfaces, distribution of TV and multimedia contents and other value added services, taking advantage of the potential of the telecommunications infrastructures deployed. These projects, among others, were undertaken based on our objective to quickly identify emerging technologies that may have a relevant impact on our business, and to test these technologies on pilots related to new platform services, applications and prototypes.
A significant part of the innovation activities and projects of research, development and innovations are carried out by the Innovation department of Telefónica, which receives support from other companies and universities in the execution of its functions. Its mission is focused on improving our competitiveness through technological innovation and product development. Additionally, it is also responsible for experimental and applied research and for the development of products to increase our range of services and reduce operating costs.
The technological innovation activities of Telefónica are focused on three main areas:
|
1.
|
The development of new networks. These activities are related to new radio and fiber optic access technologies (technologies on the virtualization of network functions, in line with the technological trend known as SDN or defined networks via software) and projects related to network optimization
,
which enable us to have a much more flexible and adaptable network that is dynamically adaptable to the new requirements of digital services and customers. Another area of innovation is the development of Edge Computing technologies that enable network resources to be used to provide services to customers through computer and storage infrastructure that is closer to them, allowing faster communication between applications and servers by leveraging the existing telecommunications infrastructure. This category also encompasses all innovation activities with a purpose of efficiently deploying the network in remote and difficult-to-access areas to bring services that offer connectivity to the entire population. This project provides connectivity to rural populations through innovative technologies including yet not limited to integration with satellites, flight networks, microcells and network virtualization functions.
|
|
2.
|
The development of new products and services which are carried out within the framework of the digital services strategy. The following items stand out among these activities:
|
|
◦
|
Interpersonal communication of the future with natural access, taking advantage of the possibilities of the Internet and smartphones, including the personal assistant Aura;
|
124
|
◦
|
Services related to Big Data offered to businesses and public administrations through the new B2B units, such as the LUCA unit, and in-house, which implement the concept of Telefónica's 'Fourth Platform'. This is a global data platform which lies above the networks, IT and products platforms
,
whose vision is to return to the customer the value associated with the data it generates;
|
|
◦
|
Video and multimedia services (combining text, audio, images and video) with a user experience on all connected devices;
|
|
◦
|
Advanced solutions in emerging ICT businesses, such as
cloud computing
or cybersecurity;
|
|
◦
|
Management of Internet of Things (IoT) services, related to enriched mobility, energy efficiency and smart retail;
|
|
3.
|
Experimental and applied research: with a medium and long-term outlook, Telefónica also has specialized groups whose mission is to investigate the possibilities of new networks and services and to solve the technological, social and environmental challenges that arise.
|
In 2018, the activity of the Telefónica Alpha Innovation continued. Telefónica Alpha Innovation was conceived to focus on innovating products and developing disruptive technologies that address the main challenges affecting the planet and society.
The total research and development ("R&D") expense in the Group for 2018 amounted to 947 million euros, 9.8% more than the 862 million euros incurred in 2017 (906 million euros in 2016). These expenses represented 1.9%, 1.7% and 1.7% of the Group’s consolidated revenues for 2018, 2017 and 2016, respectively. These figures were calculated using guidelines of the Organization for Economic Co-operation and Development ("OECD") manual.
During 2018, Telefónica registered 22 new patent applications, two through the Chilean office (INAPI) and 20 through the Spanish patent and trademark office (OEPM), 19 of which were European applications and one was a Spanish one. Moreover, three industrial designs with European scope were registered through the Oficina de Propiedad Intelectual de la Unión Europea (EUIPO).
Regarding the development of open innovation in Telefónica, the company has the Open Future unit, which includes an open, global program designed to connect entrepreneurs, startups, investors, and public and private organizations from around the world.
The main objective of Open Future is to detect, develop and enhance the talent and technological entrepreneurship in the local ecosystem of the 10 countries in which it is present and in all its phases, for that which drives and accelerates the growth of ideas, projects, initiatives and companies. The integral character of Telefónica Open Future enables innovation to be developed in different stages. It is structured around six initiatives, the objectives of which are as follows:
|
•
|
Drive
(Think Big and Talentum Startups).
|
|
•
|
Accelerate
(Crowdworking and Wayra).
|
|
•
|
Invest
(Telefónica Ventures and the Amérigo Funds).
|
Telefónica Open Future ended 2018 as one of the main investors in the Spanish area of open innovation, positioning itself as one of the major funds in Europe and Latin America in venture capital investment, thus positioning Telefónica as one of the most supportive of innovation, as also recognized by the Startup Europe Partnership, a European Union platform, appraising the company as the second largest European company to support innovation.
D. Trend Information
In 2018, Telefónica made progress towards long-term sustainable and profitable growth in OIBDA, continuing to increase efficiencies and capturing synergies thanks to the integrated vision of the businesses, processes and technologies. This allowed us to maintain a strong investment effort in order to be able to offer our customers good connectivity. In recent years, the Company has taken several steps designed to transform its business transformation, including the following:
|
•
|
First, Telefónica utilizes a business model based on data-oriented offers, bundled services, including converged fixed and mobile services, as well as digital capabilities as part of the global transformation focused on
|
125
responding to the change in our customers' consumer habits. An essential part of our effort has been the strong investment made in recent years in fiber and LTE networks.
|
•
|
Second, changing consumer habits has resulted in decreasing demand for voice services and increasing demand for data, due to video downloads and Internet connectivity through smartphones. This new trend has allowed us since 2015 to offset the drop in voice revenues (excluding the decline related to falls in interconnection tariffs) with higher data and connectivity services, resulting in a positive trend in average revenue per access in the majority of our markets.
|
|
•
|
Third, Telefónica launched in 2014 a simplification plan focused on increasing growth and capturing synergies across the board. The plan, which continues to be implemented, includes measures such as commercial offer simplification, IT network and global process modernization (through higher investments in IT and commercial systems as well as call center costs reduction) and improving sales channels with a more efficient back office. These measures have allowed us to free resources to improve the network. In 2014 we began to prepare our digitalization initiative, and in 2017 we designed a plan to achieve our digitalization objectives. The achievement of these objectives is expected to allow us to improve the services provided to our customers and capture cost savings.
|
On the other hand, various factors have contributed to the fact that Telefónica has experienced a downward trend in some key financial performance indicators during the 2016-2018 period.
|
•
|
First, since 2016 currencies such as the Brazilian real, the Venezuelan bolivar and the Argentine peso have continuously depreciated. The Company’s consolidated results have also been adversely affected by the devaluation of the pound sterling.
|
|
•
|
Second, the high inflation in certain countries such as Argentina and Venezuela affected cost growth in numerous markets where Telefónica is present which was not fully offset by increases in tariffs.
|
|
•
|
Third, Telefonica's business is highly regulated, which affects its revenues and imposes costs on its operations. For example, regulation sets the fixed rates that Telefónica may charge for calls received from other companies’ networks and regulators have progressively reduced these rates in recent years. The RLaH (Roaming Like At Home) regulation in Europe, which is in effect since June 15, 2017, has affected Telefonica's European operations mainly in Germany and United Kingdom. The new regulatory environment has resulted in higher costs which we have not been able to fully offset with increases in tariffs.
|
|
•
|
Fourth, in recent years Telefónica has experienced intense competition in the markets where it operates, resulting in more bundled offers and making it difficult to monetize value added services.
|
|
•
|
Fifth, in the last three years, within the above mentioned simplification process, Telefónica has redefined its processes, and readapted its resource necessities, partially with respect to personnel, which has resulted in the recording of various provisions, especially in Spain and Brazil, which have affected results in 2017 and 2018.
|
The positive result of our strategy, which focuses on sustainable and profitable growth, is reflected in an upward trend in certain of our key market indicators since 2016, such as the operating cash flow excluding spectrum acquisitions (OIBDA-Capex excluding spectrum acquisitions) and profit for the year. Operating cash flow excluding spectrum acquisitions continued its growth and was up 3.6% in 2018 as compared to 2017 and up 22.8% in 2017 as compared to 2016 in reported terms. Profit for the year increased by 17.0% in 2018 as compared to 2017, although this was driven in part to a release of provisions. Finally, the Capex over revenues ratio was 16.7% in 2018, in line with that of 2017.
E. Off-Balance Sheet Arrangements
We have commitments that could require us to make material payments in the future. These commitments are not included in our consolidated statement of financial position at December 31, 2018 although they are described in the notes to our Consolidated Financial Statements. For summary of our off-balance sheet commitments, see Note 26(b) and Note 17 to our Consolidated Financial Statements.
F. Tabular Disclosure of Contractual Obligations
126
The following table describes our contractual obligations and commitments with definitive payment terms which may require significant cash outlays in the future. The amounts payable (including accrued interest payments) are as of December 31, 2018. For additional information, see our Consolidated Financial Statements.
|
|
Payments Due by Period
|
|||||||||
|
Millions of euros
|
Total
|
|
Less than 1 year
|
|
1-3 years
|
|
3-5 years
|
|
More than 5 years
|
|
|
Financial liabilities (1)(2)
|
54,702
|
|
9,368
|
|
12,414
|
|
9,127
|
|
23,793
|
|
|
Operating lease obligations (3)
|
7,885
|
|
1,649
|
|
2,637
|
|
1,676
|
|
1,923
|
|
|
Purchase and other contractual obligations(4)
|
12,881
|
|
4,864
|
|
4,990
|
|
1,801
|
|
1,226
|
|
|
Other liabilities (5)
|
3,138
|
|
901
|
|
2,237
|
|
—
|
|
—
|
|
|
Total
|
78,606
|
|
16,782
|
|
22,278
|
|
12,604
|
|
26,942
|
|
|
(1)
|
Capital (finance) lease obligations are not calculated separately and are instead included as part of our long-term debt obligations.
|
|
(2)
|
Estimated future interest payments as of December 31, 2018 on our interest-bearing debt (not included above) are as follows: 1,624 million euros in 2019, 1,399 million euros in 2020, 1,171 million euros in 2021, 1,021 million euros in 2022, 836 million euros in 2023 and 8,320 million euros in subsequent years. With respect to floating rate debt, we estimate future interest payments as the forward rates derived from yield curves quoted for the different currencies on December 31, 2018.
This item includes the fair value of derivatives classified as financial liabilities (i.e., those with a negative mark-to-market) and excludes the fair value of derivatives classified as current financial assets (
922
million euros), and those classified as non-current (
2,776
million euros) (i.e., those with a positive mark-to-market). For a more detailed description of our financial derivative transactions, see Note 17 to our Consolidated Financial Statements. For details of the composition of this item, see “—Liquidity and Capital Resources– Anticipated Sources of Liquidity”).
|
|
(3)
|
This item includes definitive payments (non-cancellable without penalty cost). Our operating lease obligations have in some cases extension options conditioned on the applicable law of each country. Accordingly, we have included only those amounts that represent the initial contract period. At December 31, 2018, the present value of future payments for operating leases was approximately
7,229
million euros (
1,962
million euros in Telefónica Brazil,
2,153
million euros in Telefónica Germany,
1,083
million euros in Telefónica Hispam Norte,
410
million euros in Telefónica Hispam Sur,
545
million euros in Telefónica Spain,
594
million euros in Telefónica United Kingdom and
482
million euros in other companies). For a more detailed information about payments due under this item, see Note 23 to our Consolidated Financial Statements.
|
|
(4)
|
This item includes definitive payments (non-cancellable without penalty cost) due for agreements to purchase goods (such as network equipment) and services.
|
|
(5)
|
“Other liabilities” include: (a) long-term obligations that require us to make cash payments, excluding financial debt obligations included in the table under “Financial Liabilities” above and (b) other provisions. Because of the nature of the risks covered by “Other liabilities” such as other provisions, it is not possible to determine a reliable schedule of potential payments, if any. For details of the composition of other provisions, see Note 21 to our Consolidated Financial Statements.
|
In addition, at December 31, 2018, we had short-term and long-term employee benefits provisions amounting to
886
million euros and
4,499
million euros, respectively, not included in the table above (see Note 21 to our Consolidated Financial Statements).
For details of the composition of, and changes in, our debt, see “—Liquidity and Capital Resources—Anticipated Sources of Liquidity” and Note 13 to our Consolidated Financial Statements.
A. Directors and Senior Management
During 2018, our Board of Directors met 12 times. As of February 21, 2019, our Board of Directors had met two times during 2019. As of February 21, 2019, our directors, their respective positions on our Board and the year they were first appointed were as follows:
127
|
Name
|
Age
|
|
First Appointed
|
Current Term Ends
|
|
Chairman
|
|
|
|
|
|
Mr. José María Álvarez-Pallete López (1)
|
55
|
|
2006
|
2021
|
|
Vice-Chairmen
|
|
|
|
|
|
Mr. Isidro Fainé Casas (1)(2)
|
76
|
|
1994
|
2020
|
|
Mr. José María Abril Pérez (1)(3)(6)
|
66
|
|
2007
|
2022
|
|
Members
|
||||
|
Mr. Ángel Vilá Boix (1)
|
54
|
|
2017
|
2022
|
|
Mr. Juan Ignacio Cirac Sasturain (6)
|
53
|
|
2016
|
2020
|
|
Mr. José Javier Echenique Landiríbar (1)(4)(7)
|
67
|
|
2016
|
2020
|
|
Mr. Peter Erskine (1)(6)(7)
|
67
|
|
2006
|
2020
|
|
Ms. Sabina Fluxà Thienemann (7)
|
38
|
|
2016
|
2020
|
|
Mr. Luiz Fernando Furlán (7)
|
72
|
|
2008
|
2022
|
|
Ms. Carmen García de Andrés (4)(8)
|
56
|
|
2017
|
2021
|
|
Ms. María Luisa García Blanco (5)(8)
|
53
|
|
2018
|
2022
|
|
Mr. Jordi Gual Solé (2)(5)(6)
|
61
|
|
2018
|
2022
|
|
Mr. Peter Löscher (6)(8)
|
61
|
|
2016
|
2020
|
|
Mr. Ignacio Moreno Martínez (3)(4)(5)(8)
|
61
|
|
2011
|
2021
|
|
Mr. Francisco Javier de Paz Mancho (1)(4)(5)(7)
|
60
|
|
2007
|
2022
|
|
Mr. Francisco José Riberas de Mera
|
54
|
|
2017
|
2021
|
|
Mr. Wang Xiaochu (9)
|
60
|
|
2015
|
2020
|
(1) Member of the Executive Commission of the Board of Directors.
(2) Name or company name of the shareholder represented or that has proposed their appointment: CaixaBank, S.A.
(3) Name or company name of the shareholder represented or that has proposed their appointment: Banco Bilbao Vizcaya Argentaria, S.A.
(4) Member of the Audit and Control Committee.
(5) Member of the Regulation and Institutional Affairs Committee.
(6) Member of the Strategy and Innovation Committee.
(7) Member of the Nominating, Compensation and Corporate Governance Committee.
(8) Member of the Service Quality and Customer Service Committee.
(9) Name or company name of the shareholder represented or that has proposed their appointment: China Unicom (Hong Kong) Limited.
Board Committees
At February 21, 2019, the Committees of our Board of Directors and members thereof are as follows:
Executive Commission
Our Board of Directors has expressly delegated all of its authority and power to the Executive Commission except as prohibited by the Spanish Corporation Act, under our Articles of Association, or under our Board Regulations. This Commission is made up of fewer directors and meets more frequently than our Board of Directors. The members of the Executive Commission are Mr. José María Álvarez-Pallete López (Chairman), Mr. Isidro Fainé Casas, Mr. José María Abril Pérez, Mr. Ángel Vilá Boix, Mr. José Javier Echenique Landiríbar, Mr. Peter Erskine, Mr. Francisco Javier de Paz Mancho and Mr. Pablo de Carvajal González, as Secretary. During 2018, the Executive Commission met eighteen times and, as of the date of this Annual Report, had met three times in 2019.
Audit and Control Committee
The Audit and Control Committee functions are regulated by our bylaws, our Board Regulations and the Audit and Control Committee Regulations. The Audit and Control Committee has the primary objective of providing support to our Board of Directors in its supervisory and oversight functions, specifically having the following responsibilities:
|
•
|
To report to the shareholders at the General Shareholders’ Meeting regarding matters raised therein for which it is responsible.
|
128
|
•
|
To submit to the Board of Directors proposals for the selection, appointment, re-election and replacement of the external auditor, as well as the terms and conditions of the contract therewith, and regularly obtain from such external auditor information regarding the audit plan and the implementation thereof, in addition to the preservation of its independence in the performance of its duties.
|
|
•
|
To supervise the effectiveness of the Company’s internal control system, the internal audit and the systems for the management of risks, including tax risks, as well as to discuss with the external auditor the significant weaknesses in the internal control system detected during the audit.
|
|
•
|
To supervise the process of preparation and submission of regulated financial information.
|
|
•
|
To establish and maintain appropriate relations with the external auditor in order to receive, for review by the Committee, information on all matters that could jeopardize the independence thereof, as well as any other matters related to the audit procedure, and such other communications as may be provided for in auditing legislation and in technical auditing regulations. In any event, the Audit and Control Committee must receive annually written confirmation from the external auditor of its independence vis-á-vis the entity or entities directly or indirectly related thereto, as well as information regarding additional services of any kind provided to such entities by the external auditor, or by the persons or entities related thereto, pursuant to the legislation in force.
|
|
•
|
To issue on an annual basis, prior to the issuance of the audit report, a report stating an opinion regarding the independence of the external auditor. This report must in all cases include an opinion on the provision of the additional services referred to in the preceding paragraph.
|
|
•
|
To report to the Board of Directors in advance on all matters contemplated by law, the bylaws and the Regulations of the Board of Directors.
|
|
•
|
Any other powers granted to it under the Regulations of the Board of Directors.
|
The Audit and Control Committee meets at least once per quarter and as many times as considered necessary. During 2018, the Audit and Control Committee met thirteen times and, as of the date of this Annual Report, had met three times in 2019. The members of the Audit and Control Committee are Mr. José Javier Echenique Landiríbar (Chairman), Ms. Carmen García de Andrés, Mr. Ignacio Moreno Martínez and Mr. Francisco Javier de Paz Mancho. Our Board of Directors has determined that Mr. José Javier Echenique Landiríbar and Mr. Ignacio Moreno Martínez meet the requirements of an “audit committee financial expert” as such term is defined by the SEC.
Nominating, Compensation and Corporate Governance Committee
The Nominating, Compensation and Corporate Governance Committee is responsible for, among other things, reporting to our Board of Directors with respect to proposals for the appointment, re-election and removal of directors, members of the Executive Commission and the other committees of our Board of Directors and top members of our management and management of our subsidiaries. In addition, the Nominating, Compensation and Corporate Governance Committee is responsible for proposing to the Board of Directors, within the framework established in the bylaws, the compensation for the directors and reviewing it periodically to ensure that it is in keeping with the tasks performed by them, as provided in Article 35 of the Board Regulations, to propose to the Board of Directors, within the framework established in the bylaws, the extent and amount of the compensation, rights and remuneration of a financial nature, of the chairman, the executive directors and the senior executive officers of Telefónica, including the basic terms of their contracts, for purposes of contractual implementation thereof and to supervise compliance with the corporate governance rules in effect from time to time.
The members of the Nominating, Compensation and Corporate Governance Committee are Mr. Francisco Javier de Paz Mancho (Chairman), Mr. José Javier Echenique Landiríbar, Mr. Peter Erskine, Ms. Sabina Fluxà Thienemann and Mr. Luiz Fernando Furlán. During 2018, the Nominating, Compensation and Corporate Governance Committee met eleven times, and as of the date of this Annual Report, it had met two times in 2019.
Regulation and Institutional Affairs Committee
The Regulation and Institutional Affairs Committee was created in 2016 by merging the Regulation Committee and the Institutional Affairs Committee. The main objective of the Regulation and Institutional Affairs Committee is to monitor the main regulatory matters which affect us. Additionally, the Regulation and Institutional Affairs Committee acts as a communication and information channel between our management team and our Board of Directors concerning regulatory matters. Another responsibility is to review, report and propose to the Board of Directors the principles that are to govern the Group’s Sponsorship and Patronage Policy, to monitor such policy, and to individually
129
approve sponsorships or patronages the amount or importance of which exceed the limit set by the Board and which require its approval. The Committee is also responsible for promoting the development of the Telefónica Group’s Corporate Reputation and Responsibility project and its institutional affairs.
The members of the Regulation and Institutional Affairs Committee are Mr. Ignacio Moreno Martínez (Chairman), Ms. María Luisa García Blanco, Mr. Jordi Gual Solé and Mr. Francisco Javier de Paz Mancho. During 2018, the Regulation and Institutional Affairs Committee met eleven times, and as of the date of this Annual Report the Committee has met two times in 2019.
Service Quality and Customer Service Committee
The Service Quality and Customer Service Committee is responsible for monitoring and reviewing the standards of quality of the main services we provide. The Service Quality and Customer Service Committee evaluates the level of quality of the services we provide to our customers. The members of the Service Quality and Customer Service Committee are Mr. Peter Löscher (Chairman), Ms. Carmen García de Andrés, Ms. María Luisa García Blanco and Mr. Ignacio Moreno Martínez. During 2018 the Service Quality and Customer Service Committee met four times and as of the date of this Annual Report has met once in 2019.
Strategy and Innovation Committee
In 2016, the Strategy Committee and the Innovation Committee merged into a new Committee, the so-called Strategy and Innovation Committee. Without prejudice to any other tasks that the Board of Directors may assign thereto, the primary duty of this new Committee is to support the Board of Directors in the analysis and implementation of the global strategy policy of the Telefónica Group. The Strategy and Innovation Committee is also responsible for advising and assisting in all matters regarding innovation. Its main object is to examine, analyze and periodically monitor the Group’s innovation projects, provide guidance and help ensure the implementation and development of innovation initiatives across the Group. The members of the Strategy and Innovation Committee are Mr. Peter Erskine (Chairman), Mr. José María Abril Pérez, Mr. Juan Ignacio Cirac Sasturain, Mr. Jordi Gual Solé and Mr. Peter Löscher. The Strategy and Innovation Committee met ten times during 2018, and as of the date of this Annual Report, it met two times in 2019.
Biographies of Directors
Mr. José María Álvarez-Pallete López serves as the Chairman of our Board of Directors and Chief Executive Officer of the Company. He is currently a trustee of the Telefónica Foundation and he has served, from September 11, 2011, to September 2012, as Chairman of Telefónica Europe. He began his career at Arthur Young Auditors in 1987. In 1988, he joined Benito & Monjardín/Kidder, Peabody & Co., where he held various positions in the research and corporate finance departments. In 1991, he held the “Associate” training course in New York and participated in investment projects of the GE Group in Spain. In 1995, he joined Compañía Valenciana de Cementos Portland, S.A. (Cemex) as head of the Investor Relations and Analysis department. In 1996, he was promoted to Chief Financial Officer of Cemex Group in Spain, and in 1998, to Chief Administration and Financial Officer of Cemex in Indonesia, headquartered in Jakarta, and he was appointed member of the Board of Cemex Asia, Ltd. In February 1999 he joined the Telefónica Group as General Manager of Finance for Telefónica International, S.A. In September of the same year he was promoted to Chief Financial Officer of Telefónica. In July 2002, he was appointed Chairman and Chief Executive Officer of Telefónica Internacional, S.A.; in July 2006 General Manager of Telefónica Latin America, and in March 2009, Chairman of Telefónica Latin America. He has been the Chairman of Telefónica Europa since September 2011 and a member of Telefónica, S.A.'s Board of Directors since July 2006. Since September 2012 and until April 2016, Mr. Álvarez- Pallete served as Chief Operating Officer. In 2016 he was appointed Chief Executive Officer of the Company. He has also been Chairman of the Board of Directors of Telefónica Internacional S.A.U. and of the Supervisory Board of Brasilcel, N.V and Cesky Telecom and Vice-Chairman of the Board of Directors of Telesp, S.A. and Telefónica Móviles México, S.A. He was member of the Board of Directors of the following companies: Telecomunicaçoes de Sao Paulo; Telefónica Datacorp, S.A.; Telefónica del Perú, S.A.A.; Colombia Telecomunicaciones, ESP; Telefónica Móviles México; Telefónica Larga Distancia de Puerto Rico, S.A.; Admira Media; Inmobiliaria Telefónica; TPI; Telefónica Móviles; Telefónica Holding Argentina; Telefónica de España; Telefónica O2 Europe; Portugal Telecom and China Netcom. He was Alternate Director of the following companies: Telefónica Chile, S.A.; Telefónica Móviles Colombia, S.A.; Telefónica de Argentina, S.A.; and Telefónica Móviles Chile. He has also been Chairman of Antares, Fonditel, Telfisa and Telefónica North América, and Vice-Chairman of Telefónica del Perú. He has been awarded as ‘CFO Europe Best Practices’ at Mergers & Acquisitions in 2000, and in 2003 as Member of Merit of the Carlos III Foundation of the Iberian-American Forum. In July 2007, Mr. Álvarez-Pallete was appointed as "Gold Master in Executive Leadership" and in 2011, he received the Personality of the Year in Economics Award granted by “El Economista”. In December 2013, he received
130
the Excellence 2013 Award and Fast Company magazine named him one of the 100 most creative Personalities in Business during 2014. In 2016, he was named the "Best CEO" in Spain by Forbes. Mr. Álvarez-Pallete holds a degree in Economics from the Complutense University in Madrid. He also studied Economics at the Université Libre i Belgique and holds an International Management Program degree from the Pan-American Institute of Executive Business Administration (IPADE) and a Diplome of Advanced Studies (DEA) from the Department of Financial Economics and Accounting of the Complutense University of Madrid.
Mr. Isidro Fainé Casas serves as Vice-Chairman of our Board of Directors. For over 40 years, Mr. Fainé has worked in several financial institutions, including amongst others: Banco Atlántico, S.A., (1964), Banco de Asunción (Paraguay) (1969), Banca Riva y García, S.A. (1973), Banca Jover, S.A. (1974), and Banco Unión, S.A. (1978). In 1982, he joined ”la Caixa” as Deputy Executive General Manager, subsequently taking on various positions of responsibility. In April 1991, he was appointed Deputy Executive Managing Director and in 1999 rose to General Manager of the bank, before becoming Chairman from June 2007 to June 2014. He was also a member of the Board of Directors of CaixaBank since 2000, presiding from 2009 until his resignation in 2016. Mr. Fainé is currently Chairman of the Board of Trustees of the Fundación Bancaria Caixa d’Estalvis i Pensions de Barcelona “la Caixa”, of Criteria Caixa, S.A.U., and of the Spanish Confederation of Savings Banks (CECA). He is also Chairman of the European Savings Banks Group (ESGB). Additionally, he is Deputy Chairman of the World Savings Banks Institute (WSBI). Furthermore, he is a member of the Boards of Directors of the Bank of East Asia and of the Suez Environment Company. He is currently the Chairman of the Spanish Confederation of Executives (CEDE), the Spanish Chapter of the Club of Rome and the Círculo Financiero. In 2018, he was appointed Honorary Chairman of Naturgy Energy Group, S.A. Mr. Fainé holds a Doctorate degree in Economics, a Diploma in Senior Management from IESE Business School and an ISMP certificate in Business Administration from Harvard University. He is a member of the Royal Academy of Economics and Finance and of the Royal Academy of Doctorate Holders.
Mr. José María Abril Pérez serves as Vice-Chairman of our Board of Directors. From 1975 to 1982 he served as Financial Manager of Sociedad Anónima de Alimentación (SAAL). Since then, and until he joined the Banco Bilbao Vizcaya Argentaria Group (BBVA), he was Financial Manager of Sancel-Scott Ibérica, S.A. In 1985 he joined Banco Bilbao, S.A. as Managing Director of Investment Corporate Banking. From January to April 1993, he was appointed Executive Coordinator of Banco Español de Crédito, S.A. In 1998, he became General Manager of the Industrial Group of BBV. In 1999, he was appointed member of the Executive Committee of the BBV Group. He has also been a member of the Board of Directors of Repsol, S.A., Iberia, S.A., Corporación IBV, and Vice-Chairman of Bolsas y Mercados Españoles, S.A. In 2002 he became Managing Director of the Wholesale and Investment Banking Division and a member of the Executive Committee of Banco Bilbao Vizcaya Argentaria, S.A. He holds a degree in Economics from the University of Deusto (Bilbao, Spain) and he was professor of this University for nine years.
Mr. Ángel Vilá Boix serves as the Chief Operating Officer (COO) and as a Director of our Board of Directors. Previously, he served as the Chief Strategy and Finance Officer. Mr. Vilá joined Telefónica in 1997. He held positions of Group Controller, CFO of Telefónica Internacional, S.A.U.Group Head of Corporate Development and Chief Financial and Corporate Development Officer. In 2015, he was appointed Chief Strategy and Finance Officer. In his tenure, Ángel Vilá has executed landmark corporate transactions such as the acquisitions of O2, Vivo, EPlus, GVT, Telco/TI or the Telefónica Germany IPO. Prior to joining Telefónica, he held positions at Citigroup, McKinsey&Co, Ferrovial and Planeta. In the financial sector, he has served in the Board of directors of Banco Bilbao Vizcaya Argentaria (BBVA) and on the Advisory Panel of Macquarie MEIF Infrastructure funds. In the TMT sector, he was Chairman of Telefónica Contenidos, Vice-Chairman of Telco Spa (Italy) and Board member of Endemol, Digital+, Atento, Telefónica Czech, CTC Chile, Indra SSI and Terra Lycos. Institutional Investor nominated Ángel Vilá as the Best CFO in European Telecoms in 2015. He was also honored with the Thomson Reuters Extel Pan-European Awards as No.1 CFO in Spain both in 2013 and 2014, as well as No.1 CFO for Telecommunications in Europe in 2014. He currently is a Trustee of the Telefónica Foundation. Mr. Ángel Vilá holds an MBA from Columbia Business School where he studied with a Fulbright La Caixa fellowship. He was distinguished in the Beta Gamma Sigma Honor Society and the Dean’s List. Prior to Columbia University, he graduated in Industrial Engineering from Universitat Politècnica de Catalunya in Barcelona.
Mr. Juan Ignacio Cirac Sasturain serves as a Director of our Board of Directors. Mr. Cirac began his career as full professor at the Applied Physics Department of Castilla La Mancha University, after which he became a research associate at the Joint Institute for Laboratory Astrophysics of the University of Colorado (1993-1994). In 1996, he was tutoring at Institut für Theoretische Physik of Leopold Franzens Univesität Innsbruck, until 2001, when Mr. Cirac became Director of the Theory Division of Max-Planck Institut für Quantenoptik and a member of the Max Planck Society. Since 2002, he held the title of Honorarporfessor at Technical University of Munich and during 2014 and 2015 Mr. Cirac was the Managing Director if the Technical University of Munich. Since 2016, Mr. Cirac is a speaker of the International Max-Planck Research School Quantum Science and Technology. Among other activities, he is a member of the Advisory
131
Board of the Institute for the Interdisciplinary Information Sciences at Tsinghua University, and a member of the Advisory Board of the Russian Quantum Center since 2012. Mr. Cirac is also a member of the Advisory Board of Annalen der Physik, as well as of the Review Panel, QSIT, of the Swiss National Science Foundation. He has received several awards, such as the Hamburg Prize for Theoretical Physics, the Medal of Honor of Fundación García Cabrerizo or the Wolf Prize in Physics. He holds degree in Theoretical Physics from Universidad Complutense de Madrid as well as a Ph.D. in Physics from this university. He is specialized in Theoretical Quantum Optics, Quantum Information, Atomic Physics, and Quantum Many-Body Physics.
Mr. José Javier Echenique Landiríbar serves as a Director of our Board of Directors. Mr. Echenique has been a Board Member and General Director of Allianz-Ercos as well as a General Director of BBVA Group, where he was responsible for wholesale business like Global Investment Banking or Global Corporate Banking among others. He has also been Member of the Board of Directors of Telefónica Móviles, S.A. and Telefónica Móviles México. Mr. Echenique was President of Banco Guipuzcoano as well as Board of Sevillana de Electricidad, S.A., Acesa and Hidroeléctrica del Cantábrico, Corporation IBV and Metrovacesa. Furthermore, he has served as a member of the Board of Repsol, S.A., Corporación Patricio Echeverría, Grupo BBVA Seguros, Grupo Edhardt, Uralita, Grupo Porres (Mexico) and Abertis Infraestructuras, S.A. Mr. Echenique is currently Vice-President of the Board of Directos of Banco Sabadell, S.A. He is also a Board Member of ACS Actividades de Construcción y Servicios, S.A., ACS Servicios, Comunicaciones y Energía, S.L. Grupo Empresarial ENCE, S.A., Telefónica Móviles México, S.A. de C.V, and Telefónica Audiovisual Digital, S.L.U. He is also Trustee of the Novia Salcedo Foundation, a Board member of the Deusto Business School and a member of the Círculo de Empresarios Vascos. He holds degrees in Economics and Actuarial Sciences from Basque Country University (UPV), where he was a professor of Social Security’s Quantitative Techniques of the Economic Sciences School of Bilbao for several years.
Mr. Peter Erskine serves as a Director of our Board of Directors. He began his career in the field of marketing in Polycell and in Colgate Palmolive. He worked for several years at the Mars Group, serving as Vice-Chairman for Europe of Mars Electronics. In 1990, he was appointed Vice-Chairman of Marketing and Sales of Unitel. From 1993 to 1998, he held a number of senior positions, including Director of British Telecom (BT) Mobile and President and Chief Executive Officer of Concert. In 1998, he became Managing Director of BT Cellnet. Subsequently, in 2001, he became Chief Executive Officer and a Director of the Board of Directors of Telefónica Europe, Plc. In 2006, he became Executive Chairman of Telefónica Europe, Plc (until December 31, 2007, after which he became a Non-Executive Director) and from July 2006 until December 2007, he served as General Manager of the business unit Telefónica Europe. In January 2009, he joined the Board of Ladbrokes Plc. as a Non-Executive Director until December 2015, becoming Chairman in May 2009. He stood down from the Board in December 2015, having taken a lead role in the merger of Ladbrokes PLC with Gala Coral Group. Currently, he is Chairman of the Henley Business School Strategy Board, a member of the Council of Reading University and also serves as a member of the University’s Strategy and Finance Committee. Since May 2016, he serves as a member of the Supervisory Board of Telefónica Deutschland Holding AG. In 1973, he received a degree in Psychology from Liverpool University and he holds an Honorary Doctorate from the University of Reading.
Ms. Sabina Fluxà Thienemann serves as a Director of our Board of Directors. Ms. Fluxà has also completed a High Business Management Program at IESE. In January 2005, she joined Iberostar Group, where she is currently the Vice-Chairman and CEO. She is also Regional Advisory Board member of BBVA and a member of the Board of Directors of APD Illes Baleares, as well as the Sponsor of the Iberostar Foundation. She has received from ESADE a degree in Business Management and Administration and an MBA.
Mr. Luiz Fernando Furlán serves as a Director of our Board of Directors. He is currently a member of the Board of Directors of Telefônica Brasil, S.A. and BRF, S.A. (Brazil). Throughout his career, he has been a member of the Board of Directors of several companies in Brazil and abroad such as Chairman of Sadia, S.A., Co-Chairman of BRF-Brasil Foods, S.A., member of the Board of Directors of AGCO Corporation (USA), member of the Advisory/ Consultive Board of Panasonic (Japan) and Wal-Mart (USA) and a member of the Advisory/Consultive Board of Abertis Infraestructuras, S.A. (Spain). From 2003 to 2007 he was Minister of Development, Industry and Foreign Trade of Brazil. He holds a degree in Chemical Engineering from the Industrial Engineering Faculty of São Paulo and in Business Administration from the University of Santana (São Paulo), with specialization in financial administration from Fundação Getúlio Vargas (São Paulo).
Ms. Carmen García de Andrés serves as a Director of our Board of Directors. Ms. García joined PricewaterhouseCoopers (Coopers & Lybrand Legacy) in 1985, where she held several positions. Thereafter, she held various leadership positions at Ladwell -Abogados y Asesores Fiscales as well as at PwC. She has been representative of the Spanish brand at the International Specialist Group in Indirect Taxation for more than six years. Between 2004 and 2007, she was the Managing Partner of the Gran Consumo, Distribución, Industria y Servicios Group of Madrid
132
with more than 30 experts in legal and taxation areas, and responsible for the Diversity Program, Women in PwC between 2005 and 2007. She has been member since 2006 of the Trust of Tomillo Foundation, and in March 2008 became the Managing Director of this non-profit institution and its Executive Chairwoman in 2014. She currently serves as Chairwoman of the Tomillo Foundation and as a member of its Trust, member of the Trust of the Young Business Spain Foundation, Treasurer of the Asociación Española de Fundaciones (AEF), member of the Trust of Rais and Xavier de Salas Foundations, as well as a member of the Board of Directors of the collective initiative "Juntos por el empleo de los más desfavorecidos". She holds a degree in Economic and Business Sciences from the Comillas Pontifical University, ICADE.
Ms. María Luisa García Blanco serves as a Director of our Board of Directors. Ms. García began her career in 1992 as a state attorney (abogado del estado). In 2002, she was appointed Deputy Director-General of Constitutional Law and Human Rights and state attorney-Head of the Constitutional Law and Human Rights Department as well as Agent of the Kingdom of Spain before the European Court of Human Rights. As Agent of the Kingdom of Spain she managed and coordinated the Spanish delegation composed of representatives from various Spanish Ministries and represented the Kingdom of Spain before various UN Committees in nonjudicial proceedings and individual claims and before the European Court of Human Rights (TEDH) in individual claims. As state attorney serving at the Constitutional Court, she has been involved in constitutional law proceedings such us claims for unconstitutionality and jurisdictional conflicts, appeals for protection of constitutional rights and other issues of unconstitutionality. Among other activities, she has been the Secretary of the Board of Directors of Sociedad Estatal de Infraestructuras Agrarias del Norte (SEIASA DEL NORTE) and, from 1999 to 2010, of its Audit and Control Committee. From 2010 to 2013, she served as a Director of Sociedad Estatal de Infraestructuras Agrarias (SEIASA). She served as a Director of Sociedad Estatal de Aguas de la Cuenca del Norte (ACUANORTE) between 2010 and 2013, and of Sociedad Estatal de Aguas de las Cuencas de España (AcuaEs) between 2012 and 2013. Furthermore, she has been involved in coordination and cooperation activities for the promotion and defense of human rights in Uruguay (2006), Colombia (2007 and 2008), Chile (2009) and Guatemala (2010). Additionally, in 2006 she was awarded with the Cross of Honor of the Order of St. Raymond of Penyafort. In October 2013 she left her position as state attorney and she is currently a partner at the law firm Salama García Blanco, SLP, which focuses on administrative, constitutional law, civil and commercial litigation, and arbitration matters, and provides legal advice to credit institutions. In 2014, she was appointed as Corresponding Member of the Royal Academy of Jurisprudence and Legislation. She holds a law degree from the University of Cordoba (Spain).
Mr. Jordi Gual Solé serves as a Director of our Board of Directors. Mr. Gual joined “la Caixa” group in 2005 and has served as Chairman of CaixaBank since 2016. Previously, he was the Head of Strategic Planning and Studies for CaixaBank and Director General of Planning and Strategic Development for CriteriaCaixa. He has also served as economics advisor to the European Commission’s Directorate-General for Economic and Financial Affairs and as a visiting professor at the University of California, Berkeley. Currently he is a member of the Supervisory Board of Erste Group Bank, a member of the Market Monitoring Group of the Institute of International Finance (IIF), Chairman of FEDEA, Vice-President of the Círculo de Economía and of the Cotect Foundation, and he serves on the boards of the CEDE Foundation, Institución Cultural del CIC and Real Instituto Elcano. In 1999 he received the Research Award of the European Investment Bank. He graduated with honors in 1979 in Economics and Business from University of Barcelona. He holds a PhD in Economics from the University of California, Berkeley, and he is a professor of economics at the IESE Business School and a Research Fellow at the Centre for Economic Policy Research (CEPR) in London.
Mr. Peter Löscher serves as a Director of our Board of Directors. Mr. Löscher was the President of Global Human Health and a member of the Executive Board of Merck & Co., CEO of GE Healthcare Bio – Sciences and a member of GE’s Corporate Executive Council. He was also COO and a member of the Board of Amersham Plc. He held a senior leadership position in Aventis and Hoeschst. From 2014 to 2016, he was the CEO of Renova Management AG. In the past, he was also a member of the Supervisory Board of Deutsche Bank AG and Chairman and CEO of Siemens AG, among others. Currently, Mr. Löscher is Chairman of the Supervisory Board of OMV Aktiengesellschaft, and of Sulzer AG, and a member of the Board of Directors of TBG AG, Switzerland. He is also Honorary Professor at Tongi University Shangai and he holds the Grand Decoration of Honor in Gold of the Republic of Austria, the Order of Friendship of the Russian Federation and is a Knight Commander of the Order of Civil Merit of Spain. Mr. Löscher studied Economics at Vienna University of Economics, where he also received his MBA, and Business at the Chinese University of Hong Kong. He completed the Advanced Management Program (AMP) at Harvard Business School and an Honorary Doctorate of Engineering from Michigan State University and is a Doctor Honoris Causa of Slovak University of Engineering in Bratislava.
Mr. Ignacio Moreno Martínez serves as a Director of our Board of Directors. Previous positions include head of Corporate Banking and Private Equity at Banco de Vizcaya, Banco Santander de Negocios, and Mercapital. He also served as Deputy General Manager of Corporate and Institutional Banking at Corporación Bancaria de España, S.A.
133
– Argentaria, Chief Executive Officer of Desarrollo Urbanístico Chamartín, S.A., and Chairman of Argentaria Bolsa, Sociedad de Valores. In addition, he served as General Manager of the Chairman’s Office at Banco Bilbao Vizcaya Argentaria, S.A., Chairman Executive Officer of Vista Capital Expansión, S.A., SGECR – Private Equity and Chairman Executive Officer of N+1 Private Equity. Mr. Moreno is currently Chairman of Metrovacesa, S.A. and member of the Board of Roadis Transportation Holding, S.L.U. He is also Senior Advisor of BC Partners for Spain. Mr. Moreno holds a degree in Economics and Business Studies from the University of Bilbao, and a Master’s degree in Marketing and Sales Management from the Instituto de Empresa and an MBA from INSEAD.
Mr. Francisco Javier De Paz Mancho serves as a Director of our Board of Directors. From 1984 to 1993 he was the General Secretary of Juventudes Socialistas and a member of the PSOE Executive. From 1990 to 1993, he was general secretary of the Spanish Consumers Association (Unión de Consumidores de España, UCE). From 1993 to 1996, he served as General Manager of Internal Trade of the Spanish Ministry of Tourism and Commerce and Director of Tabacalera, S.A. From 1994 to 1996, he was Chairman of the Observatory of Trading of the Spanish Ministry of Tourism and Commerce (Observatorio de la Distribución Comercial del Ministerio de Comercio y Turismo); from 1996 to 2004, he was Corporate Strategy Manager of the Panrico Donuts Group and Deputy Chairman. From 1998 to 2004, he served as Director of Mutua de Accidentes de Zaragoza (MAZ). From 2004 to 2006, he was Director of Tunel de Cadí, S.A.C. and from 2003 to 2004, he served as Chairman of the Patronal Pan y Bollería Marca (COE). From 2004 to 2007, he was Chairman of the National Company MERCASA. He has also been a member of the Board of Directors of Altadis, S.A., and of the Economic and Social Board and its Permanent Commission. From July 2006 to November 2014, he has been a member of the Executive Committee of the Chambers Board (Consejo Superior de Cámaras) and from 2008 to 2012 he has been the Chairman of Atento Inversiones y Teleservicios, S.A.U. Currently, he is Director of Telefónica Móviles de Argentina, S.A., Telefônica Brasil, S.A. and Telefónica Móviles México, S.A. de C.V. He is also Chairman of Telefónica Ingeniería de Seguridad, S.A.U. Mr. de Paz has a diploma in Publicity and Information and undertook studies in Law. He completed a Programa de Alta Dirección de Empresas from the IESE Business School (Instituto de Estudios Superiores de la Empresa, University of Navarra).
Mr. Francisco José Riberas Mera serves as a Director of our Board of Directors. He started his professional career at the Gonvarri Group, where he became Director of Corporate Development and Chief Executive Officer. Mr. Riberas has been the Chief Executive Officer of Gestamp since its incorporation. He was appointed to the Board of Directors of Aceralia Corporación Siderúrgica in 1998, in the context of its privatization process until it was integrated into the Arcelor Group. Currently, Mr. Riberas is the Executive Chairman of Gestamp Automoción. He also serves as a member of the management team of certain companies of the Gestamp Group and the ACEK Group, including companies belonging to Gonvarri Group, Acek Renewables Energy and Inmobiliaria Acek Group. He also serves as a member of the Board of Directors of Telefónica, CIE Automotive, Global Dominion Access and Sideacero. Furthermore, he is Chairman of the Instituto de la Empresa Familiar and collaborates with the Endeavor foundation, among others. Mr. Riberas holds a Degree in Law (1987) and in Economics and Business Administration (1988) from Comillas Pontifical University (ICADE E-3).
Mr. Wang Xiaochu serves as a Director of our Board of Directors. Mr. Wang served as Deputy Director General and Director General of the Hangzhou Telecommunications Bureau in Zhejiang province; Director General of the Tianjin Posts and Telecommunications Administration; Chairman and Chief Executive Officer of China Mobile (Hong Kong) Limited; Vice-President of China Mobile Communications Corporation; an Executive Director, Chairman and Chief Executive Officer of China Telecom Corporation Limited; President and Chairman of China Telecommunications Corporation; and Chairman and Non-executive Director of China Communications Services Corporation Limited. Furthermore, Mr. Wang serves as the Chairman of China United Network Communications Group Company Limited, and as an Executive Director, Chairman and Chief Executive Officer of China Unicom (Hong Kong) Limited. He is a professor level senior engineer, graduated from Beijing Institute of Posts and Telecommunications in 1989 and he received a doctorate degree in Business Administration from the Hong Kong Polytechnic University in 2005.
Executive Officers/Management Team
At February 21, 2019, our executive management team consisted of the following individuals:
134
|
Name
|
Position
|
Appointed
|
Age
|
|
|
Mr. José María Álvarez-Pallete López
|
Chairman of the Board of Directors and Chief Executive Officer
|
2016
|
55
|
|
|
Mr. Ángel Vilá Boix
|
Chief Operating Officer
|
2017
|
54
|
|
|
Mr. Guillermo Ansaldo Lutz
|
Chief Global Resources Officer
|
2011
|
57
|
|
|
Mr. Pablo de Carvajal González
|
General Secretary, Secretary of the Board of Directors and Director Global of Regulation
|
2018
|
55
|
|
|
Ms. Laura Abasolo García de Baquedano
|
Chief Finance and Control Officer
|
2017
|
46
|
|
|
Mr. Mariano de Beer
|
Chief Commercial and Digital Officer
|
2017
|
48
|
|
|
Mr. Eduardo Navarro de Carvalho
|
Chief Comms, Corporate Affairs, Brand and Sustainability Officer
|
2019
|
56
|
|
|
Mr. Juan Francisco Gallego Arrechea
|
General Manager of Internal Audit
|
2016
|
52
|
|
Biographies of the Executive Officers and Senior Management
We present below the biographies of our executive officers and senior management who do not also serve on our Board of Directors.
Mr. Guillermo Ansaldo Lutz serves as Chief Global Resources Officer (CGRO) of the Telefónica Global Resources operating unit since September 2011. He is also member of the Executive Committee of Telefónica. From 1989 to 2000, he worked for McKinsey & Company holding different positions in Spain and Argentina. In 1995, he was appointed a partner of McKinsey & Company in Argentina. From 2000 to 2004 he was the Chief Executive Officer of Telefónica de Argentina, S.A. and since April 2005, he has held the position of Chief Executive Officer of Telefónica de España, S.A. From December 2007 to September 2011, he was the Chairman and Chief Executive Officer of Telefónica de España, S.A. He holds a degree in Industrial Engineering from the Universidad de Buenos Aires and an MBA from The Amos Tuck School of Business Administration, Dartmouth College.
Mr. Pablo de Carvajal González serves as the General Secretary, Secretary of the Board of Directors of Telefónica and Director Global of Regulation. He is also a member of the Executive Committee of Telefónica. From 1988 to 1989, he worked as legal counsel for La Unión y el Fénix Español, Compañía de Seguros y Reaseguros, S.A. In April 1991, he was appointed state attorney (
abogado del Estado
) until December 1999, when he became legal counsel of Jazz Telecom, S.A. In March 2000, he became secretary of the Board and head of the legal department of Yacom Internet Factory, S.A. Since June 1, 2001, he has been the General Secretary and Secretary of the Board of Directors of Telefónica de España, S.A. and, since April 2013, also Director of Regulation. He holds a law degree the Universidad Complutense de Madrid and a Master's degree in European law from the Free University of Brussels.
Ms. Laura Abasolo García de Baquedano is the Chief Finance and Control Officer of Telefónica, S.A. She started her professional career at Goldman Sachs International, in the area of Investment Banking in Europe. She joined Telefónica in 1999 as the Management Control Officer at Terra Networks, S.A., where she was also a member of the Executive Committee. In July 2005, she assumed the role of Management Control Officer at Telefónica, S.A. and in December 2007, she became Planning, Budgets and Management Control Officer. In March 2014, she joined the Executive Committee of Telefónica, S.A. and became responsible for the Simplification Office. In 2016, she became responsible for the Consolidation and Accounting Policies, and Tax divisions of the company. She holds a Degree in Economics and Business Administration by the Commercial University of Deusto and MBA in International Businesses by the Norwegian School of Economics and Business Administration.
Mr. Mariano de Beer is the Chief Commercial and Digital Officer of Telefónica S.A. In this role, he is responsible for driving revenue growth globally, developing a holistic view for the consumer and enterprise segments, curating the commercial offer and evolving the channels to ensure the best commercial experience for Telefónica customers. He is in charge of innovation within the group. Mr. De Beer is member of the Telefónica Group Executive Committee. During the past years, he has held the position of President of Microsoft Brazil and most recently President of Microsoft Latam – New Markets, after a solid, successful career in the telecommunications industry. Mariano joined Telefónica's team in Brazil in 1998 from McKinsey & Co., where he held a variety of positions within the company, mainly in the Residential and SME segments. In 2006, he joined the Senior Management Committee of Telefónica International as Director of SME for Latin America, until 2008, when he returned to Brazil as CEO of Telefónica and subsequently
135
Chairman of the Vivo Corporate Unit. After leaving Telefónica and before joining Microsoft, he worked in the RBS Brazilian conglomerate, where he led the Education Unit of the group as CEO, with the mission of expanding and strengthening the Education Project of RBS. Mariano graduated from UADE in Argentina, obtained an MBA from Georgetown University and he has completed Executive Programs at INSEAD, IESE and Stanford University School of Business.
Mr. Eduardo Navarro de Carvalho is the Chief Comms, Corporate Affairs, Brand and Sustainability Officer of Telefónica, S.A. He began his career as an engineer in the Brazilian operation of ARBED, a steel and iron producer. Before joining the Telefónica Group, he was a consultant at McKinsey & Co., where he led Telecommunications and Infrastructure projects in Latin America, Europe and Africa. Eduardo joined Telefónica in 1999, as Vice-President of Corporate Strategy and Regulatory Affairs for Telefónica Brazil. Before assuming his current position, Eduardo was President and CEO of Telefônica Brasil | Vivo; before that Eduardo held key global positions in the Telefónica Group, including Chief Commercial Digital Officer (CCDO) and Director of Strategy and Business Development. He was also Director of Strategic Planning and Regulatory Affairs for Telefónica Internacional. Eduardo holds a Metallurgical Engineering degree from the Federal University of Minas Gerais, Brazil.
Mr. Juan Francisco Gallego Arrechea is the General Manager of Internal Audit of the Telefónica Group since 2016. He began his career in Arthur Andersen, where he specialized in audit and financial consulting for business groups. In June 2000, he joined the Telefónica Group working as the Chairman of Consolidation and Accounting Policies and serving, from 2009, as Chief Accounting Officer. Mr. Gallego is a speaker and member of work teams in several master programs, conferences and courses on the matter of audit, consolidation and accounting practices held by regulators, private institutions and universities. He obtained a degree in Economic Science at Universidad Complutense in Madrid.
B. Compensation
Please see Note 26(g) and Appendix II to our Consolidated Financial Statements for information on the compensation paid to members of our Board of Directors and Executive Officers/Senior Management Team during the year 2018.
Incentive Plans
Please see Note 24 to our Consolidated Financial Statements.
C. Board Practices
Please see “—Directors and Senior Management” above.
D. Employees
Please see “Headcount” in Note 23 to our Consolidated Financial Statements.
In 2015, Telefónica de España, S.A.U., Telefónica Móviles España, S.A.U. and Telefónica Soluciones de Informática y Comunicaciones de España, S.A.U. signed the first Collective Agreement of Related Companies (CEV). This agreement contemplated, among other elements, a plan of measures for individual suspension of the employment relationship in 2016 and 2017 (the Individual Suspension Plan). In December 2016, the CEV was extended until 2018, by virtue of the provisions of this same agreement. In 2016, the expense relating to the forecast payments to meet the commitments resulting from the extension of this program was recognized. A total of 789 million euros were recorded for the Individual Suspension Plan in 2016 (see Note 15 to our Consolidated Financial Statements).
The provision was updated as of December 31, 2017 according to the then-current degree of adherence to the plan, which resulted in an expense of 165 million euros in the consolidated income statement of 2017.
The provision was further updated as of December 31, 2018 according to the current degree of adherence to the plan, which resulted in an expense of 297 million euros in the consolidated income statement of 2018.
E. Share Ownership
At February 21, 2019, the following members of our Board of Directors beneficially owned directly or indirectly an aggregate of 5,793,066 shares, representing approximately 0.111% of our capital stock.
136
|
Name or corporate name of director
|
Number of direct voting rights
|
|
Number of indirect voting rights
|
|
% of total
voting rights
|
|
|
Mr. José María Álvarez-Pallete López
|
1,351,958
|
|
—
|
|
0.026
|
|
|
Mr. Isidro Fainé Casas
|
595,382
|
|
—
|
|
0.012
|
|
|
Mr. José María Abril Pérez
|
245,446
|
|
238,996
|
|
0.009
|
|
|
Mr. Ángel Vilá Boix
|
357,016
|
|
—
|
|
0.007
|
|
|
Mr. Juan Ignacio Cirac Sasturain
|
—
|
|
—
|
|
—
|
|
|
Mr. José Javier Echenique Landiríbar
|
74,350
|
|
50,712
|
|
0.002
|
|
|
Mr. Peter Erskine
|
42,733
|
|
—
|
|
0.001
|
|
|
Ms. Sabina Fluxà Thienemann
|
—
|
|
—
|
|
—
|
|
|
Mr. Luiz Fernando Furlán
|
38,423
|
|
—
|
|
0.001
|
|
|
Ms. Carmen García de Andrés
|
704
|
|
—
|
|
—
|
|
|
Ms. María Luisa García Blanco
|
20,000
|
|
—
|
|
—
|
|
|
Mr. Jordi Gual González
|
—
|
|
—
|
|
—
|
|
|
Mr. Peter Löscher
|
145,000
|
|
—
|
|
0.003
|
|
|
Mr. Ignacio Moreno Martínez
|
18,311
|
|
—
|
|
—
|
|
|
Mr. Francisco Javier de Paz Mancho
|
64,862
|
|
—
|
|
0.001
|
|
|
Mr. Francisco José Riberas Mera
|
—
|
|
2,549,173
|
|
0.049
|
|
|
Mr. Wang Xiaochu
|
—
|
|
—
|
|
—
|
|
At February 21, 2019, members of our executive management team (excluding members of our Board of Directors listed above) beneficially owned an aggregate of 625,675 of our shares, representing approximately 0.012% of our capital stock.
None of our directors or executive officers beneficially owned shares representing one percent or more of our share capital at February 21, 2019.
None of our directors and executive officers held options in respect of shares representing one percent or more of our share capital at February 21, 2019.
Please see Note 24 to our Consolidated Financial Statements for information on our share-based payment plans.
A. Major Shareholders
General
At February 21, 2019, we had 5,192,131,686 shares outstanding, each having a nominal value of 1.00 euro per share. All outstanding shares have the same rights.
At February 21, 2019, according to information provided to us or to the Spanish National Securities Commission (
Comisión Nacional de Mercado de Valores
or the “
CNMV
”), beneficial owners of 3% or more of our voting stock were as follows:
|
Name of Beneficial Owner
|
% of shares carrying voting rights
|
% of voting rights through financial instruments
|
% of total voting rights
|
||
|
|
Direct
|
Indirect
|
Direct
|
Indirect
|
|
|
Banco Bilbao Vizcaya Argentaria, S.A.(1)
|
5.26
|
0.01
|
0.00
|
0.00
|
5.28%
|
|
CaixaBank, S.A.(2)
|
5.00
|
0.01
|
0.00
|
0.00
|
5.01%
|
|
BlackRock, Inc.(3)
|
0.00
|
4.85
|
0.00
|
0.22
|
5.08%
|
|
(1)
|
Based on the information provided by Banco Bilbao Vizcaya Argentaria, S.A. as at December 31, 2018 for the 2018 Annual Report on Corporate Governance.
|
137
|
(2)
|
Based on information provided by CaixaBank, S.A. as at December 31, 2018 for the 2018 Annual Report on Corporate Governance. The indirect shareholding is held by Vidacaixa, S.A. de Seguros y Reaseguros which owns 342,072 shares.
|
|
(3)
|
On February 1, 2019, BlackRock, Inc. notified the CNMV that its shareholding in Telefónica's share capital was 5.077%. On February 6, 2019 BlackRock, Inc. filed a 13G/A form in the SEC notifying that its shareholding in Telefónica's share capital was 5.4%.
|
To the extent that our shares are represented by account in the book-entry form, we do not keep a shareholder registry and our ownership structure cannot be known precisely. Based on the information available to us there is no individual or corporation that directly or indirectly through one or more intermediaries may exercise any type of control over us. Nevertheless, we have certain shareholders whose holdings are considered material.
Ownership Limitations
There are no limitations with respect to the ownership of our assets or share capital except those related to assets derived from the application of the reciprocity principle. Article 6 of the General Telecommunications Law, or the GTL, provides for the application of the reciprocity principle under existing international treaties or agreements signed and ratified by Spain. The Spanish government, upon request, may authorize exceptions to the reciprocity principle contained in the GTL.
B. Related Party Transactions
During 2016, 2017 and 2018 and through the date of this Annual Report, the Directors and senior executives did not enter into any transaction with Telefónica, S.A. or any Telefónica Group company other than those in the Group’s normal trading activity and business.
Our Board of Directors’ Regulations grant the Board of Directors the exclusive power to authorize any transactions with major shareholders or with our directors. Prior to authorizing any such transaction, our Board will receive an opinion from the Audit and Control Committee addressing the fairness of the transaction to our shareholders and us. Any of our directors that may have an interest in the proposed transaction must abstain from voting on the proposed transaction.
Please see Note 10 to our Consolidated Financial Statements for further information.
Related Party Transactions with Significant Shareholders
Two of our major shareholders are financial institutions (see “—Major Shareholders—General” above). We have entered into related party transactions with both companies within our ordinary course of business, and always on arm’s-length terms. During 2018 and through the date of this Annual Report, the executed transactions were generally loans, capital markets or derivative transactions provided to us by these financial institutions and agreements for us to provide telecommunications and broadband services to such institutions.
Please see Note 10 to our Consolidated Financial Statements for further information.
Intra-Group Loans
We are the parent company of the Telefónica Group and operate through our subsidiaries and affiliated companies. We coordinate group policies, including financial policy and, in some cases, actual financial management is conducted by us. Most of the transactions we perform with other members of the Telefónica Group relate to financing transactions, including covering their needs for funds and providing interest rate and exchange rate hedges.
At December 31, 2018, as recorded in our parent company accounts, we loaned a total of
5,976
million euros (4,881 million euros at December 31, 2017) to companies of the Telefónica Group while companies of the Telefónica Group and their associates loaned us a total of
56,466
million euros (
54,179
million euros at December 31, 2017), of which
12,094
million euros (11,477 million euros at December 31, 2017) was loaned to us by Telefónica Europe, B.V. and
35,039
million euros (34,855 million euros at December 31, 2017) was loaned to us by Telefónica Emisiones S.A.U., our financing subsidiaries devoted to raising funds in the capital markets,
8,748
million euros (
7,269
million euros at December 31, 2017) was loaned by us to Telfisa Global, B.V., our financing subsidiary charged with centralizing and managing the cash pooling of our subsidiaries in Latin America, Europe and the United States and
585
million euros (
578
million euros at December 31, 2017) was loaned to us by Telefónica Participaciones, S.A.U.
138
With respect to the balances with associated companies, the line "Non-current financial assets" on the consolidated statement of financial position, includes "Loans to Associates" amounting to nil at December 31, 2018 (16 million euros at December 31, 2017).
C. Interests of Experts and Counsel
Not applicable.
Consolidated Financial Statements
Please see Item 23.
(a) Legal Proceedings
Telefónica and its Group companies are party to several legal proceedings which are currently in progress in the courts of law and the arbitration bodies of the various countries in which we are present.
Based on the advice of our legal counsel we believe it is reasonable to assume that these legal proceedings will not materially affect the financial condition or solvency of the Telefónica Group.
The following unresolved legal proceedings or those underway in 2018 are highlighted (see Note 22 to the Consolidated Financial Statements for details of tax-related cases).
Appeal against the decision by Agencia Nacional de Telecomunicações (“ANATEL”) regarding the inclusion of interconnection and network usage revenues in the Fundo de Universalização de Serviços de Telecomunicações (“FUST”)
Vivo Group operators (currently Telefônica de Brasil), together with other cellular operators, appealed ANATEL’s decision of December 16, 2005, to include interconnection and network usage revenues and expenses in the calculation of the amounts payable into the FUST (Fundo de Universalização de Serviços de Telecomunicações) –a fund which pays for the obligations to provide Universal Service– with retroactive application from 2000. On March 13, 2006, Regional Federal Court no. 1. granted a precautionary measure which stopped the application of ANATEL’s decision. On March 6, 2007, a ruling in favor of the wireless operators was issued, stating that it was not appropriate to include the revenues received by transfer from other operators in the taxable income for the FUST’s calculation and rejecting the retroactive application of ANATEL’s decision. On January 26, 2016, ANATEL filed an appeal to overturn this decision with Brasilia Regional Federal Court no. 1, which was also dismissed. On May 10, 2017 ANATEL appealed to the higher courts on the merits of the case.
At the same time, Telefônica Brasil and Telefónica Empresas, S.A., together with other wireline operators through ABRAFIX (Associação Brasileira de Concessionárias de Serviço Telefonico Fixo Comutado) appealed ANATEL’s decision of December 16, 2005, also obtaining the precautionary measures requested. On June 21, 2007, Federal Regional Court no. 1 ruled that it was not appropriate to include the interconnection and network usage revenues in the FUST’s taxable income and rejected the retroactive application of ANATEL’s decision. ANATEL filed an appeal to overturn this ruling on April 29, 2008, before Brasilia Federal Regional Court no. 1, which was dismissed on May 10, 2016. ANATEL filed an appeal against this dismissal.
The fixed operators filed an appeal to clarify that revenues obtained through interconnection and dedicated line operation should not be included in the calculation of the amounts payable to the FUST. In addition, the court was also requested to rule on two grounds which had not been analyzed in the initial decision: (i) that the FUST has become obsolete, among other reasons, by the advance of mobile telephony; and (ii) that amounts collected are not applied to the purpose for which the FUST was created, since only a very low percentage of the revenues collected by the FUST is used to finance fixed telephony. Although the petition for clarification was dismissed on August 23, 2016, the court noted that the FUST should not be funded with revenues from interconnection and dedicated line operation. ABRAFIX appealed to the higher courts on these two elements that had not been analyzed. ANATEL appealed all the holdings of the ruling to the higher courts.
The amount of the claim is quantified at 1% of the interconnection revenues.
Appeal against the Decision of the European Commission dated January 23, 2013, to sanction Telefónica for the infringement of Article 101 of the Treaty on the functioning of the European Union
139
On January 19, 2011, the European Commission initiated formal proceedings to investigate whether Telefónica, S.A. (Telefónica) and Portugal Telecom SGPS, S.A. (Portugal Telecom) had infringed European Union anti-trust laws with respect to a clause contained in the sale and purchase agreement of Portugal Telecom’s ownership interest in Brasilcel, N.V., a joint venture in which both were venturers and which was the owner of the Brazilian company Vivo.
On January 23, 2013, the European Commission passed a ruling on the formal proceedings. The ruling imposed a fine on Telefónica of 67 million euros, as the European Commission ruled that Telefónica and Portugal Telecom committed an infraction of Article 101 of the Treaty on the Functioning of the European Union for having entered into the agreement set forth in Clause Nine of the sale and purchase agreement of Portugal Telecom’s ownership interest of Brasilcel, N.V.
On April 9, 2013, Telefónica filed an appeal for annulment of this ruling with the European Union General Court. On August 6, 2013, the European Union General Court notified Telefónica of the response issued by the European Commission, in which the European Commission reaffirmed the main arguments of its ruling and, specially, that Clause Nine includes a competition restriction.
On September 30, 2013, Telefónica filed its reply. On December 18, 2013, the European Commission filed its appeal.
A hearing was held on May 19, 2015, at the European Union General Court.
On June 28, 2016, the European Union General Court ruled. Although it declares the existence of an infringement of competition law, it annuls Article 2 of the contested Decision and requires the European Commission to reassess the amount of the fine imposed. The General Court considers that the European Commission has not neutralized the allegations and evidences provided by Telefónica on services in which there was not potential competition or were outside the scope of Clause Nine.
Telefónica understands that there are grounds for believing that the ruling does not suit at law; consequently, it filed an appeal to the Court of Justice of the European Union, on September 11, 2016.
On November 23, 2016, the European Commission filed its response against the Telefónica´s appeal. On January 30, 2017, Telefónica filed its response. On March 9, 2017, the European Commission filed its rejoinder.
On December 13, 2017, the General Court dismissed the appeal filed by Telefónica. The
European Commission must issue a new resolution in accordance with the judgment of the General Court of June 2016, which urged the Commission to recalculate the amount of the fine.
Claim of consumers association "FACUA" against Telefónica de España, S.A.U in connection with the increase of the price of Movistar Fusión
On September 5, 2016, notification was given to Telefónica de España of a claim filed against it by the consumers association ("FACUA"). Through such claim, the association exercises an action to protect consumers' and users' collective interests stipulated in articles 11 of the Civil Procedure Act (
Ley de Enjuiciamiento Civil
) and 24.1 of the Consumer and Users Protection Act (
Ley General de Defensa de los Consumidores y Usuarios
) on the basis of alleged disloyalty towards the consumers, arising from the raising of the prices of the product "Movistar Fusión" from May 5, 2015, by an amount of 5 euros per month. The claim contains a declaratory statement stating that disloyalty arises from misleading advertising regarding the price rise, and a prohibitory injunction requesting that Telefónica de España be ordered not to apply such price rise and to prohibit its future application to all customers who became customers of Movistar Fusión prior to May 5, 2015. It contains, besides, a third statement, requesting Telefónica de España to be condemned to repay the excess amounts collected as a result of the rise in prices to those customers who have chosen to maintain the service contracted, together with accrued interest on such amount.
The claim was filed for an undetermined amount, given the impossibility of determining
a priori
the total amount of the claim. On October 28, 2016, Telefónica de España filed its response.
On April 5, 2017, the Court ruled in favor of Telefónica de España, upholding the objection of unsuitable action and ordering the dismissal of the action. FACUA appealed that ruling.
On September 21, 2018, the Court of Appeals dismissed the appeal filed by FACUA, confirming the first instance resolution in favor of Telefónica.
140
Decision by the High Court regarding the acquisition by Telefónica of shares in Český Telecom by way of tender offer
Venten Management Limited ("Venten") and Lexburg Enterprises Limited ("Lexburg"), were minority shareholders of CESKY TELECOM. In September 2005 both companies sold their shares to Telefónica in a mandatory tender offer. Subsequently Venten and Lexburg, in 2006 and 2009, respectively, filed actions against Telefónica claiming a higher price than the price for which they sold their shares in the mandatory tender offer.
On August 5, 2016, the hearing before the High Court in Prague took place in order to decide the appeal against the second decision of the Municipal Court, which had been favorable to Telefónica's position (as was also the case with the first decision of the Municipal Court). At the end of the hearing, the High Court announced the Second Appellate Decision by which it reversed the second decision of the Municipal Court and ordered Telefónica to pay 644 million Czech koruna (approximately 23 million euros) to Venten and 227 million Czech koruna (approximately 8 million euros) to Lexburg, in each case plus interest.
On December 28, 2016, the decision was notified to Telefónica. Telefónica filed an extraordinary appeal, requesting the suspension of the effects of the decision.
In March 2017, Telefónica was notified of the decision of the Supreme Court, which ordered the suspension of the effects of the unfavorable decision to Telefónica issued by the High Court.
Venten and Lexburg filed with the Supreme Court a motion to partially abolish the suspension of enforceability of the Decision of the High Court in Prague. On January 17, 2018, Telefónica filed its response seeking dismissal of such motion for lack of legal basis.
On February 14, 2019, notification was given to Telefónica of the resolution of the Supreme Court which, based on the extraordinary appeal filed by Telefonica, abolished the decision of the High Court in Prague dated August 5, 2016 and remanded the case back to the High Court.
Claim by Entel against Telefónica de Argentina, S.A.
In 1999, Entel (the National Telecommunications Company of Argentina before its privatization) sued Telefónica de Argentina, S.A. ("TASA"), who was the licensee of the telecom service after the privatization process, seeking detailed and documented accounting and reimbursement of the amounts that it received from and on behalf of Entel after assuming the telecom service as a licensee, and of the amounts deducted as commissions.
In general terms, the items in dispute were the amounts that TASA charged on behalf of Entel soon after having taken possession as a licensee of the telecom service (i.e.; the consumptions charges for telecom services from prior customers of Entel, either billed or unbilled, but pending payment at the time of the privatization). Entel also challenged the commissions that TASA discounted to Entel in exchange for the service of collection of fees on behalf of Entel. Additionally, Entel also claimed several credits received by TASA, which allegedly belonged to Entel and had not been transferred to TASA in the privatization process.
TASA replied arguing the inadmissibility of the accountability request, since such liquidations had previously been submitted to the Entel Liquidating Commission without being timely challenged.
In 2010, the Court of First Instance ruled in favor of Entel and held TASA accountable to Entel.
After exhausting all legal appeals available, TASA submitted the requested accounting to Entel, which was challenged by the national government on behalf of the liquidated Entel.
Several accounting drafts and cross-claims between the parties followed, with the intervention of a court-appointed expert accountant. After several court decisions, the intervening judge rejected TASA's objections to the accounting presented by the national government and adopted the calculations made by Entel and the court-appointed expert.
Although this judicial decision was appealed, TASA's appeal was dismissed by the Court of Appeals in October 2017, confirming, to a large extent, the accounting of Entel and the court-appointed expert, but also ordering Entel to recalculate interests. Specifically, the resolution of the Court accepted certain concepts that TASA had questioned and the application of a "judicial" interest rate (average passive rate), which implies a daily capitalization component, in detriment of the rate set forth in the privatization specifications which set a simple annual interest of 8% (which had even been used by the court-appointed expert and Entel in their calculations).
141
On February 22, 2018, Entel submitted the new principal and interest calculations required by the judge, claiming an amount of 1,689 million Argentine pesos (approximately 39 million euros).
The resolution of the Court of Appeals exhausted the ordinary remedies available. TASA filed an extraordinary appeal, which was rejected in November 2017. TASA has submitted an exceptional appeal before the Argentine Supreme Court, although this appeal does not suspend the potential execution by Entel of prior rulings against TASA.
Appeal against the resolution of ANATEL to sanction Telefônica Brasil for breaches of the Fixed Telephony Regulation
In May 2018, Telefónica filed a judicial action for annulment against a resolution issued by ANATEL (National Telecommunications Agency of Brazil) in March 2018 concluding the PADO (“Processo Administrativo para Apuração de Descumprimento de Obrigações” or Administrative Process for Determination of Non-compliance with Obligations) investigating alleged infractions of the Fixed Telephony Regulation by Telefônica Brasil.
This PADO investigation had been suspended during the negotiations of the TAC (“Termo de Ajustamento de Conduta” or Conduct Adjustment Term) between Telefónica and ANATEL relating to this and certain other PADO investigations. Since the negotiations concluded without agreement, the suspended PADO sanctioning procedures were reactivated and finalized.
In its resolution of March 2018, ANATEL considered that Telefônica Brasil committed several infractions, in particular those related to the inadequate notice of suspension of services to defaulting users, the terms of reactivation of services after payment of outstanding amounts by defaulting users and the disagreement with the terms of refunds claimed by users of the services.
The fine imposed by ANATEL and appealed by Telefônica Brasil is approximately 211 million reals (approximately 48 million euros)
,
which amounted to approximately 482 million reals after currency value updates and accrued interests as of December 31, 2018 (approximately 109 million euros).
Telefônica Brasil has appealed the fine imposed by ANATEL based, fundamentally, on the following arguments: (i) ANATEL should have considered a smaller universe of users to determine the fine and (ii) the calculation of the fine is disproportionate and based on insufficient grounds.
Telefônica Brasil has not yet paid the fine, although Telefônica Brasil has guaranteed its payment through a guarantee insurance submitted to the court.
The procedure is in the first instance and a date has not yet been set for the conciliation hearing.
(b) Tax Proceedings
Inspections in the tax group in Spain
In 2012, tax inspections for all taxes for the years 2005 to 2007 were completed, with the Company signing off a corporate income tax assessment of
135
million euros, which was paid in 2012, whilst disputing other adjustments with which it disagreed. Although the settlement agreement for the disputed tax assessment did not give rise to any tax payment, since the adjustments proposed were offset by unused tax loss carryforwards, the Company filed an appeal with the Central Economic-Administrative Court against these adjustments in May 2015, regarding the tax treatment of the “juros sobre el capital propio” (interest on own capital) as dividends.
In July 2015 tax inspections for all taxes for the years 2008 to 2011 were completed, with the Company signing off certain corporate income tax assessments and disputing others. This resulted in 2015 in an expense amounting to
206
million euros. However, this did not require any tax payment, as the adjustments arising from the inspection were offset by unused tax loss carryforwards, at the corresponding tax rate for each period.
Although the settlement agreement for the disputed tax assessment did not give rise to any tax payment, in July 2015 the Company filed an appeal with the Central Economic-Administrative Court against the adjustments it disputes, regarding the tax treatment of the “juros sobre el capital propio” (interest on own capital) as dividends, and the criteria to use tax loss carryforwards in the years subject to settlement.
In June 2017 the Company received an order of the Audiencia Nacional extending the effects of its ruling from February 27, 2014 from another tax payer to the individual legal status of Telefónica, in connection with the “Juros sobre el capital propio” (interest on own capital). As a consequence of the aforementioned, the Audiencia Nacional
142
voided the corporate income tax assessment for the years 2005 to 2007 and 2008 to 2011 related to “Juros sobre el capital propio” settled by the tax authorities.
With respect to the use of tax loss carryforwards in the years subject to settlement during the inspection 2008 to 2011, still under litigation, in November 2017 the Company brought a judicial appeal to the Audiencia Nacional, against the alleged dismissal of the claim in the absence of a reply from the authorities. On January 22, 2019, Telefónica was notified of a resolution issued by the Central Economic-Administrative Court which partially upheld the claims made by Telefónica in connection with the tax inspections for the years 2008 to 2011. Telefónica intends to appeal this resolution (which is pending execution) in respect of such matters that were not resolved in favor of Telefónica.
At 2018 year end, it is not expected that there is any need to recognize additional liabilities for the outcome of this litigation.
Telefónica Brazil
State taxes
The Telefónica Group is involved in a range of tax litigation in Brazil over direct and indirect taxes (including those relating to GVT). This includes a number of appeals relating to ICMS tax (a tax similar to VAT, levied on telecommunications services). There is a dispute with the Brazilian tax authorities over which services should be subject to settlement of this tax.
To date the most significant issues have focused on the requirement to collect ICMS on penalties charged to customers for non-compliance, Internet advertising services, and complementary or additional services to the basic telecommunications services such as value-added services, modem rental, and the application of this tax on the basic fee (
assinatura básica
). In the case of the latter (assinatura básica), a case is still pending before the Supreme Court including Oi, which could affect other companies of the telecommunications sector.
All related procedures are being contested in all instances (administrative and court proceedings). The aggregate amount of the relevant proceedings, updated to take into account interest, fines and other items, is approximately
16,295
million Brazilian reals (approximately
3,672
million euros, see Note 21 to the Consolidated Financial Statements). Telefónica Brazil has obtained independent expert reports supporting its position, i.e. that the aforesaid services are not subject to ICMS.
Federal taxes
Regarding the income tax (federal tax) the tax authorities proposed adjustments in relation to the tax amortization in the period from 2011 to 2014 of the goodwill generated by Telefônica Brasil's acquisition and merger with Vivo. The tax inspections were conducted from 2016 to 2018 and the accumulated amount at December 31, 2018 was
8,654
million Brazilian reals (approximately
1,950
million euros). These proceedings are at the administrative stage and no provisions have been made since the potential risk associated with them has been classified as "not probable" and Telefónica Brazil has received independent expert reports that support this view.
Telefónica del Perú
With regard to tax matters in Peru, litigation continues over corporate income tax for 2000 and 2001, payments on account in respect of the year 2000, recoverable balances for 1998 and 1999, and the interest and penalties that should apply to these.
In August 2015, the court of second instance handed down a ruling partially upholding the position of Telefónica del Perú, ruling in its favor on three of the five objections filed by the tax authorities and appealed against to the courts, relating, inter alia, to corporate income tax for 2000-2001 (among others). This dispute accounts for more than
75%
of the total amount under litigation, with the objections relating to insolvency provisions, interest on borrowing and leases of space for public telephones. Both the tax authorities and the company have filed appeals against the decision in higher courts.
The settlements carried out by SUNAT for 2000 and 2001 are in the final stage of the legal process (under review by the Supreme Court) and a ruling has not yet been released.
In connection with these proceedings in Peru, the Group and its legal advisors consider that the Group’s position continues to be based on robust legal arguments.
In January 2019, Telefónica was notified that the Supreme Court has handed down a ruling partially upholding its position in relation to certain matters relating to 1998. In particular, on one hand, it has made a final ruling in favor
143
of Telefónica in matters relating to the lease of space for public telephones, and on the other, it has resolved the matter relating to insolvency provisions by annulling the ruling of the court of second instance and returning the case to the court of first instance for it to pass judgment on the matter again.
In parallel to the aforementioned court proceedings, the tax authorities proceeded to collect corporate income tax due for the years 2000-2001 and payments on account of corporate income tax in respect of the year 2000. There were successive reductions to the sums claimed in the two cases following appeals filed by Telefónica del Perú against the settlements and due to the precautionary measures imposed. The company paid out
286
million Peruvian soles (approximately,
80
million euros) in 2012 and 2013 pending the final rulings.
In the context of these execution processes, in June 2015 the tax authorities issued Compliance Resolutions demanding payment of
1,521
million Peruvian soles (approximately
431 million
euros). An appeal was filed against this with the Tax Court, and the adoption of precautionary suspension measures duly requested from the legal authorities (as a definitive court ruling on these cases is currently pending). No ruling was made in relation to these appeals in 2018, whilst in January 2018 the Tax Court suspended payment until the final ruling of the Supreme Court.
Given the sentences and rulings handed down in June and August 2015, the Group recognized a provision in the consolidated financial statements,
that at December 31, 2018 amounted to
1,697
million Peruvian soles (approximately
439 million euros). See Note 21 to the Consolidated Financial Statements.
Tax deductibility of financial goodwill in Spain
The tax regulations added article 12.5 to the Corporate Income Tax Law, which came into force on January 1, 2002. The article regulated the deductibility of tax amortization of financial goodwill arising from the acquisition of non-Spanish companies, which could be amortized over 20 years at
5%
per annum. Following the entry into force of the Laws 9/2011 of August 19, 2011 and 16/2013 of October 29, 2013, the amount of goodwill amortization deductible for tax purposes under article 12.5 for the years 2011 to 2015 was reduced from
5%
to
1%
. The effect is temporary because the
4%
not amortized during five years (
20%
in total) will be recovered extending the deduction period from the initial
20
years to
25
years.
The Telefónica Group, under this regulation, has been amortizing for tax purposes the financial goodwill from its investments, both direct and indirect, in O2, BellSouth and Coltel (prior to December 21, 2007) and Vivo (acquired in 2010). The positive accumulated effect in the corresponding settlements of corporate income tax from 2004 to the closing of December 31, 2018, was
1,389 million
euros.
In relation to this tax incentive, the European Commission (EC) has in recent years commenced three proceedings against the Spanish State as it deems that this tax benefit could constitute an example of state aid. Although the EC itself acknowledged the validity of its first two decisions for those investors that invested in European companies (for operations carried out before December 21, 2007 in the first decision, and before May 21, 2011 for investments in other countries in the second decision), in its third decision from October 15, 2014 it calls into question the applicability of the principle of legitimate expectations in the application of the incentive for indirect acquisitions, whatever the date of acquisition may have been.
As of the date of
this Annual Report
the three decisions continue to be subject to a final ruling. The first two were annulled by two judgments of the General Court of the European Union, which were appealed by the EC before the Court of Justice of the European Union and sent again to the General Court by the Judgment dated December 21, 2016, to reassess the tax incentive. In its ruling of November 15, 2018, the General Court confirmed the applicability of the legitimate expectations principle, but considered the "goodwill amortization" as state aid not compatible with the common market. This ruling has been appealed before the Court of Justice of the European Union.
Furthermore, there are doubts in the Spanish courts regarding the classification of the incentive as a deduction and if this deduction would remain in the case of a subsequent transfer of the relevant stake.
The Group has continued provisioning the amount of the goodwill amortized for tax purposes, corresponding mainly to the purchase of Vivo, for a total of
283
million euros at December 31, 2018 (
215 million
euros at Decembe
r 31, 2017).
Years open for inspection
Years open for inspection in the Group companies
144
The years open for review by the tax inspection authorities for the main applicable taxes vary from one consolidated company to another, based on each country’s tax legislation, taking into account their respective statute-of-limitations periods. In Spain the taxes from 2013 onwards are open to inspection.
In the other countries in which the Telefónica Group has a significant presence, the years open for inspection by the relevant authorities are generally as follows:
|
•
|
The last fourteen years in Germany.
|
|
•
|
The last nine years in United Kingdom.
|
|
•
|
The last seven years in Argentina.
|
|
•
|
The last five years in Brazil, Mexico, Uruguay and the Netherlands.
|
|
•
|
The last six years in Colombia (except in respect of years in which there were tax losses that are then used to offset tax charges, in which case the period is extended to 12 years).
|
|
•
|
The last four years in Peru, Guatemala, Nicaragua and Costa Rica.
|
|
•
|
From 2015 onwards. Since 2016, the statute of limitation is six years in Venezuela.
|
|
•
|
The last three years in Chile, Ecuador, El Salvador, the United States and Panama.
|
The tax inspection of the open years is not expected to give rise to additional material liabilities for the Group.
(c) Other Proceedings
As of the date of this Annual Report, Telefónica is currently conducting internal investigations covering various countries regarding possible violations of applicable anti-corruption laws. Telefónica continues to cooperate with governmental authorities and continues with the ongoing investigations. Although it is not possible at this time to predict the scope or duration of these matters or their likely outcome, Telefónica believes that, considering the size of the Group, any potential penalty as a result of the resolution of these investigations would not materially affect the Group's financial condition.
145
Dividend information and shareholders’ return
Dividend background
The table below sets forth the annual dividends declared per share and the year to which such dividends correspond. Generally, the dividend for a given year is paid in two tranches, one in the second-half of the relevant year and the other during the first half of the following year.
|
Year ended December 31,
|
Dividends per share (euro)
|
|
|
2018 (1)
|
0.40
|
|
|
2017 (2)
|
0.40
|
|
|
2016 (3)
|
0.55
|
|
|
2015 (4)
|
0.75
|
|
|
2014 (5)
|
0.75
|
|
(1) Company’s shareholder remuneration in 2018 consists of paying a dividend of 0.40 euros per share. A cash dividend of 0.20 euros was paid on December 20, 2018. The second tranche of the dividend of 0.20 euros per share will be paid in cash in the second quarter of 2019.
|
(2)
|
Company’s shareholder remuneration in 2017 consists of paying a dividend of 0.40 euros per share. A cash dividend of 0.20 euros was paid on December 14, 2017. The second tranche of the dividend of 0.20 euros per share was paid in cash on June 15, 2018.
|
|
(3)
|
A scrip dividend of up to 0.35 euros was paid in November 2016, consisting of the assignment of free allotment rights with an irrevocable purchase commitment by the Company, and a subsequent capital increase by means of the issue of new shares to fulfill said allotments. A cash dividend of 0.20 euros per share charged to unrestricted reserves was paid on June16, 2017.
|
(4) A scrip dividend of up to 0.35 euros was paid in November 2015, consisting of the assignment of free allotment rights with an irrevocable purchase commitment by the Company, and a subsequent capital increase by means of the issue of new shares to fulfill said allotments. A cash dividend of 0.40 euros per share charged to unrestricted reserves was paid on May 19, 2016.
|
(5)
|
A scrip dividend of up to 0.35 euros was paid in November 2014, consisting of the assignment of free allotment rights with an irrevocable purchase commitment by the Company, and a subsequent capital increase by means of the issue of new shares to fulfill said allotments. A cash dividend of 0.40 euros per share from 2015 net income was paid on May 12, 2015.
|
Payments of any future dividends will be dependent on the Group’s earnings, cash generation, solvency, liquidity, flexibility to make strategic investments, and shareholder and investor expectations at the time, all of which may be influenced by a variety of factors. See “Cautionary Statement Regarding Forward-Looking Statements.”
Treasury shares and share buyback program
We have performed, and may consider performing, transactions with treasury shares and financial instruments or contracts that confer the right to acquire treasury shares or assets whose underlying is Company shares.
Treasury share transactions will always be for legitimate purposes, including:
|
•
|
undertaking treasury share acquisitions approved by the Board of Directors or pursuant to General Shareholders’ Meeting resolutions;
|
|
•
|
honoring previous legitimate commitments assumed;
|
|
•
|
covering requirements for shares to allocate to employees and management under stock option plans; and
|
|
•
|
other purposes in accordance with prevailing legislation. In the past, treasury shares purchased on the stock market were exchanged for other shares or securities (as in the case of preferred capital securities), swapped for stakes in other companies (e.g. China Unicom, Telco, S.p.A., or Telefônica Brasil in 2015) or acquired to reduce the number of shares in circulation (by redeeming the shares acquired), thereby improving earnings per share.
|
For a description on treasury shares, see Note 15 (h) to our Consolidated Financial Statements.
A. Offer and Listing Details
146
General
Our ordinary shares, nominal value 1.00 euro each, are currently listed on each of the Madrid, Barcelona, Bilbao and Valencia stock exchanges and are quoted through the Automated Quotation System under the symbol “TEF.” They are also listed on the London and Buenos Aires stock exchanges under the symbol "TDE" and "TEF", respectively. Our ADSs are listed on the New York Stock Exchange and the Lima Stock Exchange under the symbol "TEF".
Citibank, N.A. is the Depositary issuing ADSs in form of certificated ADSs (American Depositary Receipts, or ADRs) or uncertificated ADSs pursuant to the deposit agreement dated as of November 13, 1996, as amended as of December 3, 1999 and as further amended as of June 23, 2000, and as of March 9, 2007, among Telefónica, the Depositary and the holders from time to time of ADSs (the “
Deposit Agreement
”).
At December 31, 2018, 111,467,821 of our shares were held in the form of ADSs by 606 holders of record, including Cede & Co., the nominee of Depository Trust Company (
“DTC”
). The number of ADSs outstanding was 111,043,154 at December 31, 2017.
Our ordinary shares are quoted on the Spanish Stock Exchanges in euro. Currency fluctuations may affect the dollar equivalent of the euro price of our shares listed on the Spanish Stock Exchanges and, as a result, the market price of our ADSs, which are listed on the New York Stock Exchange (in addition to the Lima Stock Exchange). Currency fluctuations may also affect the dollar amounts received by holders of ADSs on conversion by the Depositary of any cash dividends paid in euro on the underlying shares.
Spanish Securities Market Legislation
The Spanish Securities Markets Act (Ley del Mercado de Valores, or the “
LMV
”), enacted in 1988 and further amended, regulates the primary and secondary securities markets in Spain by establishing principles for their organization and operation, rules governing the activities of persons and institutions operating in these markets and a system for their supervision. This legislation and the regulation implementing it (mainly, as far as private issuers are concerned, the Royal Legislative Decree 4/2015, of October 23, approving the restated text of the LMV, the Royal Decree 1310/2005, of November 4, in relation to the issuance of securities and its admission to listing in official secondary markets, and Royal Decree 1362/2007, of October 19, concerning the transparency requirements in relation to information about issuers whose securities are admitted to trading on a regulated market):
|
•
|
establishes an independent regulatory authority, the CNMV, to supervise the securities markets;
|
|
•
|
establishes the rules for surveillance, supervision and sanction provided for the representation of transferable securities by book entries or by certificate;
|
|
•
|
establishes a framework for the issuance of securities;
|
|
•
|
establishes a framework for trading activities;
|
|
•
|
establishes the disclosure obligations of issuers, particularly the obligation to file annual audited financial statements and to make public quarterly financial information;
|
|
•
|
establishes the framework for tender offers;
|
|
•
|
establishes the code of conduct for all market participants; and
|
|
•
|
regulates market abuse infringements.
|
On March 11, 2005, Royal Decree-Law 5/2005 was approved, modifying the LMV in order to implement the Directive 2003/71/EC of the European Parliament and of the Council on the prospectus to be published when securities are offered to the public or admitted to trading. The Directive: (i) harmonizes the requirements for the process of approval of the prospectuses in order to grant to the issuer a single passport for such document, valid throughout the European Union; (ii) incorporates the application of the country of origin principle by which the prospectus will be approved by the Member States of the European Union where the issuer has its registered office but it also introduces the possibility that in certain circumstances, such as issues with high minimum denominations (1,000 euros or more), the issuer may designate the relevant European Union competent authority for prospectus approval.
Subsequently, Royal Decree 1310/2005, further amended by Royal Decree 878/2015, partially developed the LMV in relation to the admission to trading of securities in the official secondary markets, the sales or subscription public offers and the prospectus required to those effects.
147
Royal Decree 1333/2005, further amended by Royal Decree 364/2007, developed the LMV in relation to market abuse, implementing Directive 2003/6/EC of the European Parliament and of the Council, relating insider dealing and market manipulation practices (“market abuse”).
On April 12, 2007, Law 6/2007 was approved, modifying the LMV in order to implement the Directive 2004/25/EC of the European Parliament and of the Council relating to public tender offers and the Directive 2004/109/EC relating to the transparency of issuers. Law 6/2007 intends: (i) to encourage an efficient market for corporate control, while protecting the rights of minority shareholders of listed companies and (ii) to enforce transparency in financial markets.
In relation to public tender offers, Law 6/2007 (i) establishes the cases in which a company must launch a takeover bid over the whole share capital of the relevant company; (ii) establishes that takeover bids shall be launched once a specific stake on the share capital of the company has been reached; (iii) adds new obligations for the board of directors of the target companies of the takeover bid in terms of defensive measures against the takeover bid; and (iv) regulates the squeeze-out and sell-out procedure when a 90% of the share capital is held following a takeover bid. Royal Decree 1066/2007, as amended, completes the regulation currently in place for takeover bids in Spain.
Regarding transparency of issuers whose shares are accepted to trading on an official market, Law 6/2007 (i) modifies the reporting requirements of the periodic financial information of listed companies and issuers of listed securities; (ii) establishes a new disclosure regime for significant shareholders; (iii) adds new information and disclosure requirements for issuers of listed securities; (iv) establishes a civil liability procedure of the issuer and board of directors in connection with the financial information disclosed by issuers of securities; and (v) confers new supervisory powers upon the CNMV with respect to the review of accounting information.
On December 19, 2007, Law 47/2007 was approved, modifying the LMV in order to implement the Directive 2004/39/EC of the European Parliament and of the Council, on Markets in Financial Instruments (MiFID); the Directive 2006/73/EC of the European Parliament and of the Council on organizational requirements and operating conditions regarding the Market in Financial Instruments Directive, and the Directive 2006/49/EC of the European Parliament and of the Council on the capital adequacy of investment firms and credit institutions. Its principal aim is to establish a general legal framework for financial markets in the European Union, in particular with regard to financial services, as well as to ensure appropriate transparency for investors through a regular flow of the relevant information concerning security issuers. Amongst other things, the new regime (i) establishes new multilateral trading facilities for listing shares apart from the stock markets; (ii) reinforces the measures for the protection of investors; (iii) establishes new organizational requirements for investment firms; (iv) implements new supervisory powers for CNMV, establishing cooperation mechanisms amongst national supervisory authorities.
On July 4, 2009, Law 3/2009, regarding structural modifications on Spanish corporations (Ley 3/2009, de 3 de abril, sobre modificaciones estructurales de las sociedades mercantiles) came into force, modifying the maximum threshold established in the Spanish Corporation Act as to the number of treasury shares held by listed companies and their subsidiaries from 5% up to 10% of their total capital outstanding.
On August 1, 2011, Law 25/2011, partially reforming the Spanish Corporation Act and transposing Directive 2007/36/EC of the European Parliament and of the Council of July 11 relating to the exercise of certain rights shareholders in listed companies (Ley 25/2011, de 1 de agosto, de reforma parcial de la Ley de Sociedades de Capital y de incorporación de la Directiva 2007/36/CE, del Parlamento Europeo y del Consejo, de 11 de Julio, sobre el ejercicio de determinados derechos de los accionistas de las sociedades cotizadas) was approved.
In December 2012, Royal Decree 1698/2012, amending regulations regarding prospectus and transparency requirements due on securities issues by the transposition of Directive 2010/73/EU of the European Parliament and of the Council of November 24, 2010, by amending Directive 2003/71/EC on the prospectus to be published when securities are offered to the public or admitted to trading and Directive 2004/109/EC on the harmonization of transparency requirements in relation to information about issuers whose securities are admitted to trading on a regulated market, pursues essentially the reduction of administrative burdens related to the publication of a prospectus for the public offering of securities and admission to trading on markets within the European Union.
On March 20, 2013, ECC/461/2013 regulation was approved. This regulation establishes the content and structure of the annual report on corporate governance, the annual compensation report and other information mechanisms for public listed companies, the savings banks and other entities that issue securities admitted to trading on regulated securities markets. The aforementioned regulation was amended by Order ECC/2515/2013, of December 26, which develops article 86.2 of the LMV and by Order ECC/2575/2015, of November 30.
148
On June 12, 2013, Circular 5/2013 of the National Securities Market Commission (CNMV) was approved. This regulation establishes the templates of the annual report on corporate governance for public listed companies, savings banks and other entities that issue securities admitted to trading on regulated markets. This regulation is applicable to annual reports on corporate governance to be submitted from January 1, 2014 onwards.
On June 12, 2014, Directive 2014/65/EU of the European Parliament and of the Council of May 15, 2014 on markets in financial instruments and amending Directive 2002/92/EC and Directive 2011/61/EU ("
MIFID II
"), and Regulation (EU) 600/2014 of the European Parliament and Council of May 15, 2014 on markets in financial instruments and amending Regulation (EU) 648/2012 (MiFIR).
On December 3, 2014, Law 31/2014, amending the Spanish Corporation Act was enacted. The new law introduces changes in matters related to general shareholders’ meetings, and shareholders rights. It also, modifies the legal status of members of the Board of Directors, including their compensation, practices and composition, and sets forth new rules on the composition of Board Committees. Law 31/2014 entered into force on December 24, 2014, although certain specific provisions affecting listed companies will not be effective until after the first general shareholders’ meeting held by such companies in 2015, in which companies will have to amend their bylaws to bring them in line with the new provisions of Law 31/2014.
On April 16, 2014, Regulation (UE) nº 596/2014 (Market Abuse Regulation) of European Parliament and of the Council on market abuse was approved. The regulation repeals Directive 2003/6/EC of the European Parliament and of the Council and Commission Directives 2003/124/EC, 2003/125/EC and 2004/72/EC. This Regulation has been directly applicable in all European Union Member States since July 3, 2016.
On June 23, 2015, Circular 3/2015 of the CNMV established the information and technical and legal specifications that must be published on public listed companies, savings banks and other entities’ websites, in order to duly comply with the principle of transparency.
On October 2, 2015, Royal Decree 878/2015 was approved with the aim of reaching a greater level of efficiency and safety in the Spanish Automated Quotation System as well as contributing to the development towards an integrated European financial services market. This Royal Decree was enacted to fully implement the provisions of Directive 2013/50/UE of the European Parliament and of the Council, which amended Directive 2004/109/EC of the European Parliament and of the Council on harmonization of transparency requirements for issuers of listed securities, into Spanish legislation.
On October 23, 2015, Royal Legislative Decree 4/2015 was approved to consolidate and unify in a single text the legislative instruments that govern the activities of individuals and institutions in the Spanish securities markets.
On December 22, 2015, Circular 8/2015 of the CNMV published new forms establishing the notification templates for directors, executives and close relatives to communicate their significant shareholdings and for issuers to communicate transactions relating to own shares, with the aim of complying with the obligations introduced by Royal Decree 1362/2007, Royal Decree 878/2015 and Market Abuse Regulation. Individuals bound by such Circular must use the new forms from April 1, 2016.
On July 20, 2017, Regulation (EU) 2017/1129 of the European Parliament and of the Council of June 14, 2017, on the prospectus to be published when securities are offered to the public or admitted to trading on a regulated market (the "
Prospectus Regulation
"), entered into force and became directly applicable in all European Union Member States on a rolling basis, with full application from July 21, 2019. The Prospectus Regulation replaces the previous EU Directive 2003/71/EC (the Prospectus Directive). The Prospectus Regulation aims at harmonizing the disclosure regime by removing asymmetries of information and, ultimately, at increasing transparency in the markets. The Prospectus Regulation regulates the content of the prospectuses and contains a list of exemptions from the obligation to produce a prospectus in certain cases. Additional new legislation developing the Prospectus Regulation is yet to be drafted.
On November 24, 2017, a Royal Decree-Law was approved, implementing in Spain Directive 2014/95/EU of the European Parliament and of the Council of October 22, 2014 as regards disclosure of non-financial and diversity information by certain large undertakings and groups. Such Royal Decree-Law requires certain companies to include in their management report a non-financial statement containing certain additional information relating to environmental, social and employee matters, respect for human rights, anti-corruption and bribery matters.
On January 3, 2018, MiFID II became effective in all European Union Member States.
149
On June 12, 2018, Circular 2/2018 of the CNMV published new templates for the Annual Corporate Governance Report for listed companies, savings banks and other entities that issue securities admitted to trading on regulated markets, and for the annual report on compensation of directors of listed companies and of the members of the Board of Directors and of the control commission of the savings banks that issue securities admitted to trading on regulated markets.
On June 28, 2018, Circular 3/2018 of the CNMV on periodic reporting by issuers of securities admitted to trading on regulated markets, regarding half-yearly financial reports, interim management statements and, where applicable, quarterly financial reports, was approved. The aim of this Circular is to adapt the content of the templates of said reports to the changes in national and international accounting standards, mainly the entry into force of IFRS 9 Financial Instruments and IFRS 15 Revenue from Contracts with Customers.
On November 23, 2018, Royal Decree-Law 19/2018 on payment services and other urgent financial measures was approved and modified the LMV in order to adapt it to the Market Abuse Regulation.
On December 28, 2018, Law 11/2018 was approved, modifying the Spanish Commercial Code, the revised text of the Spanish Companies Act approved by Royal Legislative Decree 1/2010, of July 2 , and Law 22/2015, of July 20, on Audit of Accounts, on non-financial information and diversity. Its main objective is to fully incorporate in Spain EU Directive 2014/95/EU of the European Parliament and of the Council, of October 22, 2014 amending Directive 2013/34/EU as regards disclosure of non-financial and diversity information by certain large undertakings and groups.
Securities Trading in Spain
The Spanish securities market for equity securities consists of four stock exchanges located in Madrid, Bilbao, Barcelona and Valencia and the Automated Quotation System, or
Mercado Continuo
. During 2018, the Automated Quotation System accounted for the majority of the total trading volume of equity securities on the Spanish Stock Exchanges.
Automated Quotation System
The Automated Quotation System links the Spanish Stock Exchanges, providing those securities listed on it with a uniform continuous market that eliminates certain of the differences among the local exchanges. The principal features of the system are the computerized matching of buy and sell orders at the time of entry of the order. Each order is executed as soon as a matching order is entered, but can be modified or canceled until executed. The activity of the market can be continuously monitored by investors and brokers. The Automated Quotation System is operated and regulated by Sociedad de Bolsas, S.A., a corporation owned by the companies that manage the local exchanges. All trades on the Automated Quotation System must be placed through a brokerage firm, an official stock broker or a dealer firm that is a member of a Spanish Stock Exchange. Beginning January 1, 2000, Spanish banks were allowed to become members of the Spanish Stock Exchanges and, therefore, can trade through the Automated Quotation System.
In a pre-opening session held from 8:30 a.m. to 9:00 a.m. each trading day, an opening price is established for each security traded on the Automated Quotation System based on a real-time auction. The regime concerning opening prices was changed by an internal rule issued by the Sociedad de Bolsas. Pursuant to such rule, each stock in the continuous market is assigned a static and a dynamic range within which its price can fluctuate. The price of a stock may rise or fall within its static range (which is published once a month and is calculated according to the stock’s average historic price volatility) above or below its opening price (which shall be the closing price of the previous session). When the stock trades outside of this range, the trading of the stock is suspended for five minutes, during which time an auction takes place. After this auction, the price of the stock can once again rise or fall within its static range above or below its last auction price (which will be considered as the new static price before triggering another auction). Furthermore, the price of a stock cannot rise or fall by more than its dynamic price range (which is fixed and published once a month and is calculated according to the stock’s average intra-day volatility), from the last price at which it has traded. If the price variation exceeds the stock’s dynamic range, a five-minute auction is triggered. Between 5:30 p.m. and 5:35 p.m. a closing price is established for each security through an auction system similar to the one held for the pre-opening early in the morning.
Trading hours for block trades are also from 9:00 a.m. to 5:30 p.m. Between 5:30 p.m. and 8:00 p.m., certain trades may occur outside the computerized matching system without prior authorization from Sociedad de Bolsas, S.A. at a price within the range of 5% above the higher of the average price and closing price for the day and 5% below the lower of the average price and closing price for the day if there are no outstanding bids or offers, respectively, on the system matching or bettering the terms of the proposed off-system transaction and, if, among other things, the
150
trade involves more than 300,000 euros and more than 20% of the average daily trading volume of the stock during the preceding three months. These trades must also relate to individual orders from the same person or entity and be reported to the Sociedad de Bolsas, S.A. before 8:00 p.m. At any time, trades may take place (with the prior authorization of the Sociedad de Bolsas, S.A.) at any price if:
|
•
|
the trade involves more than 1.5 million euros and more than 40% of the average daily volume of the stock during the preceding three months;
|
|
•
|
the transaction derives from a merger or spin-off process, or from the reorganization of a group of companies;
|
|
•
|
the transaction is executed for the purposes of settling a litigation or completing a complex group of contracts; or
|
|
•
|
Sociedad de Bolsas, S.A. finds other justifiable cause.
|
Information with respect to the computerized trades between 9:00 a.m. and 5:30 p.m. is made public immediately, and information with respect to trades outside the computerized matching system is reported to Sociedad de Bolsas, S.A. by the end of the trading day and published in the Boletín de Cotización and in the computer system by the beginning of the next trading day.
Clearance and settlement system
The Sociedad de Gestión de los Sistemas de Registro, Compensación y Liquidación de Valores S.A.U., (whose commercial name is Iberclear), was created by the Ley 44/2002 de Medidas de Reforma del Sistema Financiero, enacted on November 22, 2002 to increase the efficiency of the Spanish financial markets. Such law introduced a new article, 44-bis to the LMV which established the framework for the constitution of Sociedad de Gestión de los Sistemas de Registro, Compensación y Liquidación de Valores S.A.U.
Iberclear is regulated by the Spanish Securities Act and where appropriate by Royal Decree 505/1987 of April 3, 1987, Royal Decree 166/1992 of February 14, 1992, and by any other related regulation. This company, which is a wholly owned subsidiary of Bolsas y Mercados Españoles, Sociedad Holding de Mercados y Sistemas Financieros, S.A. (Bolsas y Mercados Españoles), has the following functions:
|
•
|
Keeping accounting records in the form of book entries of securities traded in Securities Markets or in public debt markets, and securities traded in other secondary official markets or multilateral trading facilities, at the request of their governing bodies.
|
|
•
|
Keeping accounting records of other securities not listed for trading in secondary official markets, regulated markets or multilateral trading facilities, at the request of their governing bodies.
|
|
•
|
To manage settlement and, if necessary, clearing of securities and cash deriving from transactions executed on securities.
|
|
•
|
To render technical and operating services directly related to those of registration, clearing and settlement of securities and any others required for Iberclear to collaborate and coordinate its actions with other areas and systems of registration, clearing and settlement of securities, for which it may have to be authorized under the Rules of Central Securities Depositories.
|
|
•
|
Any other duties assigned by the Spanish Government, subject to prior reports from the CNMV and, if applicable, the Bank of Spain.
|
Iberclear will provide the CNMV, the Bank of Spain and the Ministry of Economy with the information that these entities may request regarding the registry clearance and settlement performed within the systems managed by Iberclear.
Transactions carried out on the Spanish Stock Exchanges are cleared and settled through Iberclear.
Only members of the system are entitled to use Iberclear, and membership is restricted to authorized broker members of the Spanish Stock Exchanges, the Bank of Spain (when an agreement, approved by the Spanish Ministry of Economy and Finance, is reached with Iberclear) and, with the approval of the CNMV, other brokers not members of the Spanish Stock Exchanges, banks, savings banks and foreign settlement and clearing systems. The clearance and settlement system and its members are responsible for maintaining records of purchases and sales under the book-entry system. Shares of listed Spanish companies are held in book-entry form. Iberclear, which manages the
151
clearance and settlement system, maintains a registry reflecting the number of shares held by each of its member entities (each, an entidad participante) as well as the amount of such shares held on behalf of beneficial owners. Each member entity, in turn, maintains a registry of the owners of such shares. Spanish law considers the legal owner of the shares to be the member entity appearing in the records of Iberclear as holding the relevant shares in its own name or the investor appearing in the records of the member entity as holding the shares.
The settlement of any transactions must be made two business days following the date on which the transaction was carried out.
Obtaining legal title to shares of a company listed on a Spanish Stock Exchange requires the participation of a Spanish official stockbroker, broker-dealer or other entity authorized under Spanish law to record the transfer of shares. To evidence title to shares, at the owner’s request, the relevant member entity must issue a certificate of ownership. In the event the owner is a member entity, Iberclear is in charge of the issuance of the certificate with respect to the shares held in the member entity’s name.
Brokerage commissions are not regulated. Brokers’ fees, to the extent charged, will apply upon transfer of title of shares from the Depositary to a holder of ADRs in exchange for such ADSs, and upon any later sale of such shares by such holder. Transfers of ADSs do not require the participation of an official stockbroker. The Deposit Agreement provides that holders depositing shares with the Depositary in exchange for ADSs or withdrawing shares in exchange for ADSs will pay the fees of the official stockbroker or other person or entity authorized under Spanish law applicable both to such holder and to the Depositary.
In 2015, due to changes introduced into the applicable legislation, Bolsas y Mercados Españoles developed a Clearing and Settlement Reform in Spain, implemented throughout 2016 and 2017 in two main phases:
|
•
|
on April 27, 2016, when a new Central Counterparty (CCP) was implemented and the new platform for equity settlement was introduced; and
|
|
•
|
on September 18, 2017, when the Fixed Income settlement system was introduced to the new platform and the TARGET2-Securities (TS2) was implemented.
|
This reform involved the following three fundamental modifications, having impact on several operating practices.
A new Central Counterparty was incorporated, the so-called BME Clearing, whose intervention takes place between the contract and settlement date, assuming the risk of the counterparty and, where applicable, conducting the clearing transactions and simplifying the settlement.
Another modification was the application in all kinds of securities of a new system of recording, clearing and settlement. This sole system eliminates the need to use register references by introducing a register based on balances, where Iberclear and each member entity manages its respective records.
The third modification refers to the integration of the Central de Anotaciones de Deuda (CADE) and the Servicio de Compensación y Liquidación de Valores (SLCV) system into a unique platform.
The Spanish equity market is structured around three infrastructures, which are the following: the Spanish Stock Exchange Interconnection System (SIBE) trading platform, BME Clearing and Iberclear (the Central Securities Depository).
As consequence of the above, several modifications have occurred such as: (i) financial entities can be members of the new infrastructures; (ii) Stock Exchange members have to contract with a General Clearing member of the CCP; (iii) CCP members have to contract with an Iberclear Settlement Participant; (iv) CCP formulates the netting of transactions prior to settlement instructions; (v) the existence of Individual Accounts in the CCP and the Central Securities Deposit; (vi) the maximization of settle transaction in case of delay of delivery of securities by Iberclear; (vii) Collective Deposit change into the CCP guarantee system; or (viii) the introduction of the Post Trading Interface communication system.
Furthermore, changes are also applicable to the Trading Member systems in relation with trading, post trading and control procedures, in order to adapt to the new regime.
B. Plan of Distribution
Not applicable.
152
C. Markets
Please see “—Offer and Listing Details” above.
D. Selling Shareholders
Not applicable.
E. Dilution
Not applicable.
F. Expenses of the Issue
Not applicable.
A. Share Capital
Not applicable.
B. Memorandum and Articles of Association
The following summary describes certain material considerations concerning our capital stock and briefly describes certain provisions of our bylaws and Spanish law.
Corporate Objectives
Article 5 of Title I of our bylaws sets forth our corporate purposes:
|
•
|
The provision and operation of all kinds of public or private telecommunications services and, for such purpose, the design, installation, maintenance, repair, improvement, acquisition, disposition, interconnection, management, administration of, and any other activity not included in the preceding enumeration with respect to, all kinds of telecommunications networks, lines, satellites, equipment, systems and technical infrastructure whether now existing or to be created in the future, including the premises in which any and all of the foregoing items are located;
|
|
•
|
the provision and operation of all kinds of services that are ancillary or supplemental to or result from telecommunications services;
|
|
•
|
the research and development, promotion and application of all kinds of component principles, equipment and systems directly or indirectly used for telecommunications;
|
|
•
|
manufacturing and production activities and, in general, all other forms of industrial activity in connection with telecommunications; and
|
|
•
|
the acquisition, disposition and, in general, all other forms of commercial activity in connection with telecommunications.
|
Director Qualification
In order to be elected as a director, a person must have held a number of our shares representing a nominal value of no less than 3,000 euros for at least three years prior to his or her election. These shares may not be transferred so long as such person remains a director. This requirement does not apply to any person who, at the time of his or her appointment, has either a labor or professional relationship with the company or is expressly exempted from such requirement by a vote of at least 85% of the Board of Directors.
Interested Transactions
When a director or persons related to him or her has an interest in a transaction with us or with any of the companies of our Group, such transaction (if unrelated to the ordinary course of our business or if not performed on an arm’s-length basis involving consideration that is significant to the Company and otherwise) must be presented to the Nominating, Compensation and Corporate Governance Committee. Such committee shall assess the transaction from
153
the point of view of equal treatment of shareholders and the arm’s-length basis of the transaction and shall be included in the Annual Corporate Governance Report and in the periodic information of the Company upon the terms set forth in applicable laws and regulations. The performance of such transactions requires the authorization of our Board of Directors, after the favorable report of the committee. The interested director must refrain from participating in votes that affect such transaction.
Significant Differences in Corporate Governance Practices
Corporate governance guidelines
For a description of our corporate governance practices see “Item 16G. Corporate Governance.”
Description of Our Capital Stock
Description of share capital
At February 21, 2019, our issued share capital consisted of 5,192,131,686 ordinary registered shares with a nominal value of 1.00 euro each.
Our shareholders delegated to the Board of Directors the authority to issue up to 2,469,208,757 new shares (equal to half of Telefónica’s share capital on June 12, 2015, the date of the authorization). The Board of Directors is authorized to exclude preemptive rights, in whole or in part, pursuant to the applicable provisions of the Spanish Corporation Act. The Board’s authorization to issue new shares expires on June 12, 2020.
Meetings and voting rights
We hold our ordinary general shareholders’ meeting during the first six months of each fiscal year on a date fixed by the Board of Directors. Extraordinary general shareholders’ meetings may be called, from time to time, at the discretion of our Board of Directors or upon the request of shareholders representing at least 3% of our paid-in share capital. The minimum percentage required to exercise this right was lowered from 5% to 3% by Law 31/2014.
We publish notices of all ordinary and extraordinary general shareholders’ meetings in the Official Gazette of the Commercial Registry or in one of the more widely circulated newspapers in Spain, on the website of the Spanish Securities and Exchange Commission (
Comisión Nacional del Mercado de Valores
(the “
CNMV
”)), and on our web site in due time pursuant to the Spanish Corporation Act, being on a general basis at least one month before the relevant meeting. Furthermore, the Board of Directors may publish notices in other media, if deemed appropriate to ensure the public and effective dissemination of the notice meeting.
Each share of Telefónica, S.A. entitles the holder to one vote. However, only registered holders of at least 300 shares are entitled to attend a general shareholders’ meeting. Holders of a lesser number of shares may grant a proxy in respect thereof to a shareholder having the right to attend, as well as group together with other shareholders in the same situation until reaching the required number of shares, following which a proxy must be granted by the shareholders so grouped together to one of such shareholders. The grouping must be carried out specifically for each General Shareholders’ Meeting and be recorded in writing.
However, under our bylaws, the maximum number of votes that a shareholder may cast is capped at 10% of our total outstanding voting capital. In determining the maximum number of votes that each shareholder may cast, only the shares held by such shareholder are counted, disregarding those that correspond to other shareholders who have appointed such shareholder as his or her proxy, in spite of applying the limit individually to each of the represented shareholders. This cap will also apply to the maximum number of votes that may be collectively or individually cast by two or more shareholder companies belonging to the same group of entities, as well as to the maximum number of votes that may be cast by an individual or corporate shareholder and the entity or entities that are shareholders themselves and which are directly or indirectly controlled by that individual or corporate shareholder. Moreover, in accordance with the Spanish Corporation Act, such cap would become ineffective where the bidder reaches, as a consequence of a tender offer, a percentage equal to or greater than 70% of the share capital carrying voting rights, unless the bidder (or those acting in concert with the bidder) is not subject to equivalent neutralization measures or has not adopted them.
In addition, according to Article 34 of Spanish Royal Decree-Law 6/2000 of June 23 on urgent measures to improve competition in the goods and services markets, individuals and legal entities directly and indirectly holding more than 3% of the total share capital or voting rights of two or more principal operator companies in Spain in, among other markets, the fixed-line and mobile-line telephony markets, may not exercise their voting rights in excess of 3% of the
154
total in more than one company, except with the prior authorization of the Spanish National Markets and Competition Commission (
Comisión Nacional de los Mercados y la Competencia
(the “
CNMC
”)). Principal operators are defined as one of the five operators with the largest market share in the corresponding market (“
Principal Operators
”). In addition, no individual or legal entity is allowed to appoint, directly or indirectly, members of the management body of more than one Principal Operator in, among others, the fixed-line or mobile-line telephony markets, except with the prior authorization of the CNMC. Additionally, individuals or legal entities considered Principal Operators are not allowed to exercise more than 3% of the voting rights of another Principal Operator nor to appoint, directly or indirectly, members of the management body of any Principal Operator, except, in both cases, with the prior authorization of the CNMC. Telefónica is considered a Principal Operator for the purposes of Article 34 of Royal Decree-Law 6/2000 of June 23 in the Spanish fixed-line and mobile-line telephony markets.
Any share may be voted by proxy. The proxies may be granted in writing or electronically and are valid only for a single meeting, unless the proxy-holder is the granting shareholder’s spouse, ascendant or descendant, or holds a general power of attorney granted in a public instrument with powers to manage all of the assets held by the shareholder granting the proxy in Spain. Under the Deposit Agreement relating to our ADSs, the Depositary accepts voting instructions from holders of ADSs. The Depositary executes such instructions to the extent permitted by law and by the terms governing the shares and ADSs. The Depositary or its nominee, as the case may be, will be entitled to vote by proxy the shares underlying the relevant ADSs.
Only holders of record five days prior to the day on which a general meeting of shareholders is scheduled to be held may attend and vote at the meeting.
According to the Spanish Corporation Act, as amended by Law 31/2014, the general shareholders’ meeting will be quorate on first call if the shareholders present, in person or by proxy, hold at least 25% of the subscribed share capital carrying voting rights. On second call, the meeting will be quorate regardless of the capital in attendance.
However, if the agenda of the meeting includes resolutions on the amendment of the bylaws, including an increase or reduction of share capital, the transformation, merger, split-off, the en bloc assignment of assets and liabilities, the migration of the registered office abroad, the issuance of debentures or the exclusion or limitation of preemptive rights, the required quorum on first call must be met by the attendance of shareholders representing at least 50% of the subscribed share capital carrying voting rights (each a “Special Resolution”). On second call, the attendance of 25% of the subscribed share capital carrying voting rights will suffice.
As a general rule, resolutions at the general shareholder’s meeting will be passed by a simple majority of votes cast at such meeting (i.e., provided that the votes "for" outnumber the votes "against" the relevant resolution).
In contrast, in order to approve any Special Resolution, if the capital present or represented at the general shareholders’ meeting exceeds 50% of the subscribed share capital carrying voting rights, the favorable vote of the absolute majority (that is, if the votes in favor exceed 50% of the votes corresponding to capital present and represented at the shareholders’ meeting) will be required. If, on second call, shareholders representing 25% or more of the subscribed share capital carrying voting rights are present or represented but fail to reach the 50% threshold, the favorable vote of at least two-thirds of the share capital present or represented at the meeting will be required.
Preemptive Rights
Pursuant to the Spanish Corporation Act, shareholders have preemptive rights to subscribe for any new shares in capital increases with issuances of new shares with a charge to monetary contributions and in issuances of debentures convertible into shares. Such rights may be excluded (partially or totally) under special circumstances by virtue of a resolution passed at a general shareholders’ meeting in accordance with Articles 308, 504 and 506 of the Spanish Corporation Act, or by the Board of Directors, if previously authorized at a general shareholders’ meeting in accordance with Article 506 of the Spanish Corporation Act (for capital increases) and Articles 417 and 511 (for issuances of debentures convertible into shares). Such preemptive rights will not be available in the event of an increase in capital to meet the requirements of a convertible bond issue or a merger or demerger of another entity into Telefónica or of all or part of the assets split from another company, in which shares are issued as consideration or, in general, when the increase is carried out as consideration in exchange for non-cash contributions. Such rights are transferable, may be traded on the Automated Quotation System and may be of value to existing shareholders because new shares may be offered for subscription at prices lower than prevailing market prices.
Form and Transfer
155
Ordinary shares are in book-entry form and are indivisible. Joint holders must nominate one person to exercise their rights as shareholders, though joint holders are jointly and severally liable for all obligations arising from their status as shareholders. Sociedad de Gestión de los Sistemas de Registro, Compensación y Liquidación de Valores, S.A. Unipersonal (“
Iberclear
”), which manages the clearance and settlement system of the Spanish Stock Exchanges, maintains the central registry of ordinary shares reflecting the number of ordinary shares held by each of its participant entities (
entidades participantes
) as well as the number of such shares held by registered legal owners. Each participant entity in turn maintains a register of the owners of such shares.
Transfers of Telefónica’s ordinary shares quoted on the Spanish Stock Exchanges must be made by book-entry registry or delivery of evidence of title to the buyer through, or with the participation of, a member of the Spanish Stock Exchanges that is an authorized broker or dealer. Transfers of Telefónica’s ordinary shares may also be subject to certain fees and expenses.
Reporting Requirements
According to Royal Decree 1362/2007 of October 19 on the disclosure of significant stakes in listed companies (“
Royal Decree 1362/2007
”), recently modified by Royal Decree 878/2015, of October 2, the acquisition or disposition of shares of Telefónica must be reported within four trading days of the acquisition or disposition to Telefónica and the CNMV, where:
|
•
|
in the case of an acquisition, the acquisition results in that person or group holding a number of voting rights in Telefónica that reaches or surpasses 3% (or 5%, 10%, 15%, 20%, 25%, 30%, 35%, 40%, 45%, 50%, 60%, 70%, 75%, 80% or 90%) of Telefónica’s total number of voting rights; or
|
|
•
|
in the case of a disposal, the disposition reduces the number of voting rights held by a person or group below a threshold of 3% (or 5%, 10%, 15%, 20%, 25%, 30%, 35%, 40%, 45%, 50%, 60%, 70%, 75%, 80% or 90%) of Telefónica’s total number of voting rights.
|
Royal Decree 878/2015 established a new approach for calculating whether these thresholds are reached, surpassed or fell short which requires adding the voting rights corresponding to shares and financial instruments. Royal Decree 878/2015 also expands the definition of financial instruments which should be reported, including financial instruments having a similar economic effect as the shares of a company, whether the instruments are cash or physically settled, including convertible securities, options, forwards, futures, swaps, CFDs or any other type of instrument which grants the holder the right to acquire shares or a right to receive an equivalent cash settlement amount. Additionally, Royal Decree 878/2015 amends the calculation rules of the voting rights attributable to a financial instrument which, among other changes, shall now be calculated on a daily basis.
The reporting requirements referred to above apply not only to the acquisition or transfer of shares, but also when, without an acquisition or transfer of shares, the proportion of voting rights of an individual or legal entity reaches, exceeds or falls below the threshold that triggers the obligation to report as a consequence of a change in the total number of voting rights of Telefónica on the basis of the information reported to the CNMV and disclosed by it, in accordance with the Royal Decree.
Regardless of the actual ownership of the shares, any individual or legal entity with a right to acquire, transfer or exercise voting rights granted by the shares, and any individual or legal entity who owns, acquires or transfers, whether directly or indirectly, other securities or financial instruments which grant a right to acquire shares carrying voting rights (such as transferable securities, options, futures, swaps, forwards and other derivative contracts), will also have an obligation to notify the company and the CNMV of the holding of a significant stake in accordance with the above-mentioned regulations.
Stricter disclosure obligations apply if the person obligated to disclose has residency in a country considered a tax haven by the Spanish authorities, a zero-taxation country or territory or a country or territory that does not share information with the Spanish authorities, in which cases the initial threshold for disclosure is reduced to 1% (and successive multiples of 1%).
Our directors must report to us and the CNMV the percentage and number of voting rights in Telefónica held by them at the time of becoming or ceasing to be a member of the Board of Directors. Furthermore, all members of the Board must report any change in the percentage of voting rights they hold, as a result of any acquisition or disposition of our shares or voting rights, or financial instruments which carry a right to acquire or dispose of shares which have voting rights attached, including any stock-based compensation that they may receive pursuant to any of our compensation plans. Members of our senior management must also report any stock-based compensation that they
156
may receive pursuant to any of our compensation plans or any subsequent amendment to such plans. Royal Decree 1362/2007 (as amended) refers to the definition given by Royal Decree 1333/2005 of November 11, which develops the Spanish Securities Market Act, regarding market abuse, which defines senior management (
directivos
) as those “high-level employees in positions of responsibility with regular access to insider information (
información privilegiada
) related, directly or indirectly, to the issuer and that, furthermore, are empowered to adopt management decisions affecting the future development and business perspectives of the issuer."
In addition, pursuant to Royal Decree 1333/2005 of November 11 (as amended), any member of our Board and our senior management, or any parties closely related to any of them, as such terms are defined therein, must report to the CNMV any transactions carried out with respect to our shares or derivatives or other financial instruments relating to our shares. The notification of the transaction must include particulars of, among others, the type of transaction, the date of the transaction and the market in which the transactions were carried out, the number of shares traded and the price paid.
These disclosure obligations are primarily regulated by Royal Decree 1362/2007 (as amended) and, since July 3, 2016, by the Regulation (EU) No 596/2014 of the European Parliament and of the Council of April 16, 2014 on market abuse (market abuse regulation) and repealing Directive 2003/6/EC of the European Parliament and of the Council and Commission Directives 2003/124/EC, 2003/125/EC and 2004/72/EC, both establish a detailed set of rules on this legal framework (including,
inter alia
, rules determining the persons subject to disclosure obligations, the different types of situations triggering disclosure and corresponding exceptions, specific attribution and aggregation rules, the deadlines to notify the transactions, triggering disclosure obligations and incorporation of notices submitted to the CNMV’s public registry).
Disclosure of Net Short Positions
In accordance with Regulation (EU) No. 236/2012 of the European Parliament and of the European Council of March 14, 2012 on short selling and certain aspects of credit default swaps (as further supplemented by several delegated regulations regulating technical aspects necessary for its effective enforceability and to ensure compliance with its provisions), net short positions on shares listed on the Spanish Stock Exchanges equal to, or in excess of, 0.2% of the relevant issuer’s share capital and any increases or reductions thereof by 0.1% are required to be disclosed to the CNMV by no later than the first trading day following the transaction. If the net short position reaches 0.5%, and also at every 0.1% above that, the CNMV will disclose the net short position to the public.
Notification is mandatory even if the same position has been already notified to the CNMV in compliance with reporting requirements previously in force in Spain.
The information to be disclosed is set out in Table 1 of Annex I of Delegated Regulation 826/2012, according to the format approved as Annex II of this Regulation. The information will be published, where appropriate, on a web page operated or supervised by the corresponding authority.
Moreover, pursuant to Regulation (EU) No. 236/2012, where the CNMV considers that (i) there are adverse events or developments that constitute a serious threat to financial stability or to market confidence (serious financial, monetary or budgetary problems, which may lead to financial instability, unusual volatility causing significant downward spirals in any financial instrument, etc.); and (ii) the measure is necessary and will not be disproportionately detrimental to the efficiency of financial markets in view of the advantages sought, it may, following consultation with the European Securities and Market Authority (“ESMA”), take any one or more of the following measures:
|
•
|
impose additional notification obligations by either (a) reducing the thresholds for the notification of net short positions in relation to one or several specific financial instruments; and/or (b) requesting the parties involved in the lending of a specific financial instrument to notify any change in the fees requested for such lending; and
|
|
•
|
restrict short selling activity by either prohibiting or imposing conditions on short selling.
|
In addition, according to Regulation (EU) No. 236/2012, where the price of a financial instrument has fallen significantly during a single day in relation to the closing price on the previous trading day (10% or more in the case of a liquid share), the CNMV may prohibit or restrict short selling of financial instruments for a period not exceeding the end of the trading day following the trading day on which the fall in price occurs.
Finally, Regulation (EU) No. 236/2012 also vests powers to ESMA in order to take measures similar to the ones described above in exceptional circumstances, when the purpose of these measures is to deal with a threat affecting
157
several EU member states and the competent authorities of these member states have not taken adequate measures to address it.
Shareholder Agreements
Article 531
et seq.
of the Spanish Corporation Act require parties to disclose those shareholders’ agreements in respect of Spanish listed companies that affect the exercise of voting rights at a general shareholders’ meeting or contain restrictions or conditions on the transferability of shares or bonds that are convertible or exchangeable into shares. If any shareholders enter into such agreements with respect to Telefónica’s shares, they must disclose the execution, amendment or extension of such agreements to Telefónica and the CNMV (together with the relevant clauses of said agreements) and file such agreements with the appropriate Commercial Registry. Failure to comply with these disclosure obligations renders any such shareholders’ agreement unenforceable and constitutes a violation of the Spanish Securities Market Act.
Acquisition of Own Shares
Pursuant to Spanish corporate law, we may only repurchase our own shares within certain limits and in compliance with the following requirements:
|
•
|
the repurchase must be authorized by the general shareholders’ meeting by a resolution establishing the maximum number of shares to be acquired, the minimum and maximum acquisition price and the duration of the authorization, which may not exceed five years from the date of the resolution; and
|
|
•
|
the repurchase, including any shares already held by us or a person acting on our behalf, must not bring our net worth below the aggregate amount of our share capital and legal reserves.
|
For these purposes, net worth means the amount resulting from the application of the criteria used to draw up the financial statements, subtracting the amount of profits directly imputed to that net worth, and adding the amount of share capital subscribed but not called and the share capital par and issue premiums recorded in our accounts as liabilities. In addition:
|
•
|
the aggregate par value of the shares directly or indirectly repurchased, together with the aggregate par value of the shares already held by us and our subsidiaries, must not exceed 10% of our share capital; and
|
|
•
|
the shares repurchased must be fully paid and must be free of ancillary contributions (
prestaciones accesorias
).
|
Voting rights attached to treasury shares will be suspended and economic rights (
e.g.
, the right to receive dividends and other distributions and liquidation rights), except the right to receive bonus shares, will accrue proportionately to all of our shareholders. Treasury shares are counted for the purpose of establishing the quorum for shareholders’ meetings and majority voting requirements to pass resolutions at shareholders’ meetings.
Regulation (EU) No. 596/2014 of April 16, repealing, among others, Directive 2003/6/EC of the European Parliament and the European Council of January 28, on insider dealing and market manipulation establishes rules in order to ensure the integrity of European Community financial markets and to enhance investor confidence in those markets. This regulation maintains an exemption from the market manipulation rules regarding share buyback programs by companies listed on a stock exchange in an EU Member State. Commission Regulation (EC) No. 2273/2003, of December 22, implemented the aforementioned directive with regard to exemptions for buyback programs. Article 5 of this regulation states that in order to benefit from the exemption, a buyback program must comply with certain requirements established under such regulation and the sole purpose of the buyback program must be to reduce the share capital of an issuer (in value or in number of shares) or to meet obligations arising from either of the following:
|
•
|
debt financial instruments exchangeable into equity instruments; or
|
|
•
|
employee share option programs or other allocations of shares to employees of the issuer or an associated company.
|
In addition, on December 19, 2007, the CNMV issued Circular 3/2007 setting out the requirements to be met by liquidity contracts entered into by issuers with financial institutions for the management of its treasury shares to constitute an accepted market practice and, therefore, be able to rely on a safe harbor for the purposes of market abuse regulations.
If an acquisition or series of acquisitions of shares of Telefónica reaches or exceeds or causes Telefónica’s and its affiliates’ holdings to reach or exceed 1% of Telefónica’s voting shares, Telefónica must notify its final holding of
158
treasury stock to the CNMV. If such threshold is reached as a result of a series of acquisitions, such reporting obligation will only arise after the closing of the acquisition which, taken together with all acquisitions made since the last of any such notifications, causes the Telefónica’s and its affiliates holdings to exceed, 1% of Telefónica’s voting shares. Sales and other dispositions of Telefónica’s treasury stock will not be deducted in the calculation of such threshold. This requirement also applies if the stock is acquired by a majority-owned subsidiary of Telefónica.
Moreover, pursuant to Spanish corporate law, the audited financial statements of a company must include a reference regarding any treasury shares.
At December 31, 2018, we held
65,496,120
shares of treasury stock, representing
1.26145%
of our capital stock. At December 31, 2017, we held
65,687,859
shares of treasury stock, representing
1.26514%
of our capital stock.
As a part of our shareholders’ remuneration policy, we have implemented various share buyback programs since 2003. For further description about our shareholders’ return, see “Item 8. Financial Information—Dividend Information and Share Buyback Programs.”
At our annual general shareholders' meeting held on June 8, 2018, our shareholders extended their prior authorization to the Board of Directors to acquire our shares for an additional five years from the date of such meeting. The authorization also applies to companies under our control. Pursuant to the authorization, the aggregate nominal value of our shares held by us or any of our subsidiaries cannot exceed the limit established by applicable laws (which is, as of the date of this Annual Report, 10% of our outstanding capital).
Change of Control Provisions
Certain antitrust regulations may delay, defer or prevent a change of control of Telefónica or any of its subsidiaries in the event of a merger, acquisition or corporate restructuring. In Spain, the application of both Spanish and European antitrust regulations requires that prior notice of domestic or cross-border merger transactions be given in order to obtain a “non-opposition” ruling from antitrust authorities.
Tender Offers
Tender offers are governed in Spain by the Spanish Securities Markets Act (as amended by Law 6/2007 of April 12) and Royal Decree 1066/2007, of July 27, which have implemented Directive 2004/25/EC of the European Parliament and of the European Council of April 21. Tender offers in Spain may qualify as either mandatory or voluntary offers.
Mandatory public tender offers must be launched for all the shares of the target company or other securities that might directly or indirectly give the right to subscription thereto or acquisition thereof (including convertible and exchangeable bonds) at an equitable price and not subject to any conditions when any person acquires control of a Spanish company listed on the Spanish Stock Exchanges, whether such control is obtained:
|
•
|
by means of the acquisition of shares or other securities that directly or indirectly give voting rights in such company;
|
|
•
|
through agreements with shareholders or other holders of said securities; or
|
|
•
|
as a result of other situations of equivalent effect as provided in the regulations (i.e., indirect control acquired through mergers, share capital decreases, target’s treasury stock variations or securities exchange or conversion, etc.).
|
A person is deemed to have obtained the control of a target company, individually or jointly with concerted parties, whenever:
|
•
|
it acquires, directly or indirectly, a percentage of voting rights equal to or greater than 30%; or
|
|
•
|
it has acquired a percentage of less than 30% of the voting rights and appoints, in the 24 months following the date of acquisition of said percentage, a number of directors that, together with those already appointed, if any, represent more than one-half of the members of the target company’s board of directors. Regulations also set forth certain situations where directors are deemed to have been appointed by the bidder or persons acting in concert therewith unless evidence to the contrary is provided.
|
Notwithstanding the above, Spanish regulations establish certain exceptional situations where control is obtained but no mandatory tender offer is required, including, among others:
159
|
•
|
subject to the CNMV’s approval,
|
|
–
|
acquisitions or other transactions resulting from the conversion or capitalization of credits into shares of listed companies, the financial feasibility of which is subject to serious and imminent danger, even if the company is not undergoing bankruptcy proceedings, provided that such transactions are intended to ensure the company’s financial recovery in the long term; or
|
|
–
|
in the event of a merger, provided that those acquiring control did not vote in favor of the merger at the relevant general shareholders’ meeting of the offeree company and provided also that it can be shown that the primary purpose of the transaction is not the takeover but an industrial or corporate purpose; and
|
|
•
|
when control has been obtained after a voluntary bid for all of the securities, if either the bid has been made at an equitable price or has been accepted by holders of securities representing at least 50% of the voting rights to which the bid was directed.
|
For the purposes of calculating the percentages of voting rights acquired, the regulations establish the following rules:
|
•
|
percentages of voting rights corresponding to (i) companies belonging to the same group of the bidder; (ii) members of the board of directors of the bidder or of companies of its group; (iii) persons acting for the account of or in concert with the bidder (a concert party shall be deemed to exist when two or more persons collaborate under an agreement, be it express or implied, oral or written, in order to obtain control of the offeree company); (iv) voting rights exercised freely and over an extended period by the bidder under proxy granted by the actual holders or owners of such rights in the absence of specific instructions with respect thereto; and (v) shares held by a nominee, such nominee being understood as a third party whom the bidder totally or partially covers against the risks inherent in acquisitions or transfers of the shares or the possession thereof, will be deemed to be held by the bidder (including the voting rights attaching to shares that constitute the underlying asset or the subject matter of financial contracts or swaps when such contracts or swaps cover, in whole or in part, against the risks inherent in ownership of the securities and have, as a result, an effect similar to that of holding shares through a nominee);
|
|
•
|
both the voting rights arising from the ownership of shares and those enjoyed under a usufruct or pledge or upon any other title of a contractual nature will be counted towards establishing the number of voting rights held;
|
|
•
|
the percentage of voting rights shall be calculated based on the entire number of shares carrying voting rights, even if the exercise of such rights has been suspended; voting rights attached to treasury shares shall be excluded; and non-voting shares shall be taken into consideration only when they carry voting rights pursuant to applicable law; and
|
|
•
|
acquisitions of securities or other financial instruments giving the right to the subscription, conversion, exchange or acquisition of shares which carry voting rights will not result in the obligation to launch a tender offer either until such subscription, conversion, exchange or acquisition occurs.
|
Notwithstanding the foregoing, upon the terms established in the regulations, the CNMV will conditionally dispense with the obligation to launch a mandatory bid when another person or entity, individually or jointly in concert, directly or indirectly holds an equal or greater voting percentage than the potential bidder in the target company.
The price of the mandatory tender offer is deemed equitable when it is at least equal to the highest price paid or agreed by the bidder or by any person acting in concert therewith for the same securities during the 12 months prior to the announcement of the tender offer. When the mandatory tender offer must be made without the bidder having previously acquired the shares over the above-mentioned 12-month period, the equitable price shall not be less than the price calculated in accordance with other rules set forth in the regulations. In any case, the CNMV may change the price so calculated in certain circumstances (extraordinary events affecting the price, evidence of market manipulation, etc.).
Mandatory offers must be launched within one month from the acquisition of the control of the target company.
Voluntary tender offers may be launched when a mandatory offer is not required. Voluntary offers are subject to the same rules established for mandatory offers except for the following:
160
|
•
|
they may be subject to certain conditions (such as amendments to the bylaws or adoption of certain resolutions by the target company, acceptance of the offer by a minimum number of securities, approval of the offer by the shareholders’ meeting of the bidder and any other deemed by the CNMV to be in accordance with law), provided that such conditions can be met before the end of the acceptance period of the offer; and
|
|
•
|
they may be launched at any price, regardless of whether it is lower than the above-mentioned “equitable price”. However, if they are not launched at an equitable price and if the tender offer shares representing at least 50% of the voting rights are tendered in the offer (excluding voting rights already held by the bidder and those belonging to shareholders who entered into an agreement with the bidder regarding the tender offer), the bidder may become obliged to launch a mandatory tender offer.
|
In any case, by virtue of an amendment to the Spanish Securities Market Act operated by Law 1/2012, of June 22, the price in a voluntary tender offer must be the higher of (i) the equitable price and (ii) the price resulting from an independent valuation report, and must at least consist of cash as an alternative if certain circumstances have occurred during the two years prior to the announcement of the offer (basically, the trading price for the shares being affected by price manipulation practices, market or share prices being affected by natural disasters,
force majeure
, or other exceptional events, or the target company being subject to expropriation or confiscation resulting in a significant impairment of the company’s real value).
Spanish regulations on tender offers set forth further provisions, including:
|
•
|
subject to shareholder approval within 18 months from the date of announcement of the tender offer, the board of directors of a target company will be exempt from the rule prohibiting frustrating action against a foreign bidder whose board of directors is not subject to an equivalent passivity rule;
|
|
•
|
defensive measures included in a listed company’s bylaws and transfer and voting restrictions included in agreements among a listed company’s shareholders will remain in place whenever the company is the target of a tender offer, unless the shareholders resolve otherwise (in which case any shareholders whose rights are diluted or otherwise adversely affected will be entitled to compensation at the target company’s expense); and
|
|
•
|
squeeze-out and sell-out rights will apply provided that following a tender offer for all the target’s share capital, the bidder holds securities representing at least 90% of the target company’s voting capital and the tender offer has been accepted by the holders of securities representing at least 90% of the voting rights other than those held by or attributable to the bidder previously to the offer.
|
Payment of Taxes
Holders of ordinary shares will be responsible for any taxes or other governmental charges payable on their ordinary shares, including any taxes payable on transfer. The paying agent or the transfer agent, as the case may be, may, and upon instruction from Telefónica, will:
|
•
|
refuse to effect any registration of transfer of such ordinary shares or any split-up or combination thereof until such payment is made; or
|
|
•
|
withhold or deduct from any distributions on such ordinary shares or sell for the account of the holder thereof any part or all of such ordinary shares (after attempting by reasonable means to notify such holder prior to such sale), and apply, after deduction for its reasonable expenses incurred in connection therewith, the net proceeds of any such sale to payment of such tax or other governmental charge. The holder of such ordinary shares will remain liable for any deficiency.
|
Dividends
Shareholders vote on final dividend distributions at the shareholders’ meeting. Distributable profits are equal to:
|
•
|
net profits for the year; plus
|
|
•
|
profits carried forward from previous years; plus
|
|
•
|
distributable reserves; minus
|
|
•
|
losses carried forward from previous years; minus
|
|
•
|
amounts allocated to reserves as required by law or by our bylaws.
|
161
The amount of distributable profits is based on our unconsolidated financial statements prepared in accordance with Spanish GAAP, which differ from the Consolidated Financial Statements prepared in accordance with IFRS included elsewhere in this Annual Report.
The Board of Directors can approve interim dividend payments without a prior shareholder vote on the issue. However, under those circumstances, the dividend is limited to distributable net profits of the current year and is subject to certain legal requirements.
Unclaimed dividends revert to us five years from their date of payment.
Registration and transfers
Our shares are in registered book-entry form. Transfers executed through stock exchange systems are implemented pursuant to the stock exchange clearing and settlement procedures carried out by the Spanish clearing institution. Transfers executed outside of stock exchange systems, that is, over the counter, are implemented pursuant to the general legal regime for book-entry transfer, including registration by the Spanish clearing institution.
There are no restrictions with respect to the transfer of our shares.
Liquidation rights
Under Spanish law, upon our liquidation, the shareholders would be entitled to receive, on a pro rata basis, any assets remaining after the payment of our debts and taxes and liquidation expenses.
C. Material Contracts
Agreement related to the Sale of Customer Relationship Management (“CRM”) Business, Atento
As a result of the sale agreement of Atento by Telefónica, announced on October 12, 2012, and ratified on December 12, 2012, both companies signed a Master Service Agreement which regulates Atento’s relationship with the Telefónica Group as a service provider for a period of nine years and which was amended on May 16, 2014, on November 8, 2016 and on May 11, 2018. This period was extended only for Spain and Brazil in November 2016, for two additional years until 2023.
By virtue of this agreement, Atento became Telefónica’s preferred Contact Center and Customer Relationship Management (“
CRM
”) service provider, stipulating annual commitments in terms of turnover which is updated based on inflation and deflation that vary from country to country, pursuant to the volume of services Atento has been providing to the entire Group. Effective January 1, 2017, the minimum volume commitments that Telefónica must comply with have significantly decreased for Brazil.
Failure to meet the annual turnover commitments in principle results in the obligation to the counterparty, to pay additional amounts, which would be calculated based on the difference between the actual amount of turnover and the predetermined commitment, applying a percentage based on the Contact Center’s business margin to the final calculation.
Notwithstanding the above, as a consequence of the amendment signed with the Atento Group on May 11, 2018, starting on January 1, 2018 the payment obligation for failure to meet the annual turnover commitment will be calculated for each year of the agreement but will only be liquidated upon termination of the agreement. Such payment will only be due if the balance is in favor of Atento after adding certain amounts agreed between the parties and deducting an annual percentage of the Atento Group’s sales to the Telefónica Group.
The Master Agreement sets forth a reciprocal arrangement, whereby Atento assumes similar commitments to subscribe its telecommunications services to Telefónica.
Agreement for the sale of a minority stake in Telxius Telecom, S.A.U. (“Telxius”)
On February 20, 2017 Telefónica reached an agreement for the sale of up to 40% of the total share capital of Telxius to Taurus Bidco S.à.r.l. (hereinafter, ”
KKR
”) an entity managed by Kohlberg Kravis Roberts & Co. L.P., for a total amount of 1,275 million euros (12.75 euros per share).
162
The aforementioned agreement included (i) a purchase agreement for the sale of 62 million shares of Telxius (representing 24.8% of its share capital) for a price of 790.5 million euros; as well as (ii) options over 38 million shares of Telxius (representing 15.2% of its share capital) for a price of at least 484.5 million euros. These options corresponded to a call option exercisable by KKR and to a put option exercisable by Telefónica upon maturity of the call option. The closing was subject to obtaining the corresponding regulatory approvals.
On October 24, 2017, after obtaining the relevant regulatory approvals, Telefónica transferred to KKR 62 million shares of Telxius (representing 24.8% of its share capital) to KKR in exchange for 790.5 million euros (12.75 euros per share). Following the execution of the sale, a shareholders' agreement among Telefónica, KKR and Telxius became effective on the same date, which regulates the relationships between Telefónica and KKR as shareholders of Telxius.
On November 13, 2017, KKR exercised the call option over 38 million shares of Telxius (representing 15.2% of its share capital) foreseen in the agreement, and on December 7, 2017, Telefónica, transferred to KKR such 38 million shares of Telxius (representing 15.2% of its share capital) in exchange for 484.5 million euros (12.75 euros per share).
Pursuant to these transactions, KKR acquired 40% of the share capital of Telxius in exchange for an aggregate amount of 1,275 million euros (12.75 euros per share) and Telefónica retained the control over Telxius.
Agreement for the sale of a minority stake in Pontel Participaciones, S.L.
On July 27, 2018
,
Telefónica transferred to a company of the Pontegadea Group ("
Pontegadea
") 16.65% of the share capital of Pontel Participaciones, S.L. ("
Pontel
") (a subsidiary of Telefónica), which in turn owns 60% of the share capital of Telxius, for a total consideration of 378.8 million euros, which implies a price of 15.2 euros per share of Telxius.
The direct participation of 16.65% in the share capital of Pontel is equivalent, in economic terms, to an indirect participation of 9.99% in the share capital of Telxius.
Additionally, on the same date, Telefónica, Pontegadea and Pontel entered into a shareholders’ agreement that regulates the relationship of Telefónica and Pontegadea as shareholders of Pontel, consistent with the shareholders’ agreement among Telefónica, KKR and Telxius.
This transaction did not have a material impact on the consolidated results of the Telefónica Group as it consists of the sale of a minority interest in Pontel, with Telefónica retaining control over Pontel and Telxius.
Swap Agreement between Telefónica and Koninklijke KPN NV (KPN)
On March 13, 2017 Telefónica entered into a swap agreement with KPN to deliver 72.0 million of its treasury shares (representing 1.43% of its share capital), in exchange for 178.5 million shares of its subsidiary Telefónica Deutschland Holding AG, representing 6.0% of the share capital of the latter. The swap was executed on March 14, 2017. Under the agreement, KPN committed, among other obligations, to comply with certain restrictions which, in case of sale of the aforementioned Telefónica shares, would ensure an orderly sale of such shares.
As a result of this agreement, Telefónica increased from 63.2% to 69.2% its shareholding in Telefónica Deutschland Holding AG at that time.
Football (soccer) License Agreements between Telefónica (through its affiliate Telefónica Audiovisual Digital, S.L.U.) and La Liga/Mediapro
On June 25, 2018, Telefónica was provisionally awarded with the broadcasting rights for all football (soccer) matches of the Spanish First Division Football League National Championship in the residential subscribers market for exploitation on pay television for the 2019-2022 cycle (packages 4 and 5 of the auction called by the Professional Football League). The definitive agreements were signed on July 5.
The award was granted for a total amount of 2,940 million euros, at an identical price of 980 million euros for each of the three seasons, which represents a slight decrease compared to the last season of the previous cycle. Telefónica, as the operator of these broadcasting rights for the 2019-2022 cycle, will have the right to decide, design and develop the broadcasting contents, which will carry the Movistar hallmark for the 2019-2020 season.
Additionally, on June 28, 2018, Telefónica and Mediaproducción, S.L.U. ("Mediapro"), reached an agreement whereby Telefónica acquired the pay television rights of football (soccer) matches of the "UEFA Champions League" and "UEFA Europa League" competitions corresponding to the three seasons 2018/19, 2019/20 and 2020/21. Such
163
matches may be included in thematic channels produced by Telefónica and be sold to private or residential clients. Telefónica will have the right to exploit such license on an exclusive basis with the exception of certain matches of the "UEFA Europa League" competition that Mediapro has reserved for its free-to-air television broadcast along with highlights programs covering both competitions. The total consideration agreed for the three seasons was 1,080 million euros (360 million euros for each of the three seasons). Telefónica may sublicense the related thematic channels to other operators interested in this content. Mediapro will have the right to receive a share of advertising revenues from the new channels that Telefónica intends to launch. These channels will carry the Movistar hallmark. The aforementioned license was subject to UEFA’s approval, which was granted in August 2018.
On December 21, 2018, Telefónica was provisionally awarded with the broadcasting rights for all football (soccer) matches of the Spanish Second Division Football League National Championship in the residential subscribers market for exploitation on pay television for the 2019-2022 cycle (package 6 of the auction called by the Professional Football League). No other bids were submitted for such package during the first round of the auction called by the Professional Football League. The award was granted for a total amount of 105 million euros (i.e., 35 million euros for each of the three seasons).
Sale of Telefónica Guatemala
On January 24, 2019, Telefónica Centroamérica Inversiones, S.L. (a subsidiary of Telefónica, 60% of which is owned, directly or indirectly, by Telefónica and 40% of which is owned, directly or indirectly, by Corporación Multi Inversiones, S.A.) reached an agreement with América Móvil, S.A.B de C.V. for the sale of 100% of Telefónica Móviles Guatemala, S.A., a company providing fixed and mobile communications services in Guatemala, for an amount (enterprise value) of 333 million dollars, approximately 293 million euros as of the date of the agreement.
The closing of the transaction took place on the same day, January 24, 2019.
Agreement for the sale of Telefónica El Salvador
On January 24, 2019, Telefónica Centroamérica Inversiones, S.L. (a subsidiary of Telefónica, 60% of which is owned, directly or indirectly, by Telefónica and 40% of which is owned, directly or indirectly, by Corporación Multi Inversiones, S.A.) reached an agreement with América Móvil, S.A.B de C.V. for the sale of 99.3% of Telefónica Móviles El Salvador, S.A., a company providing fixed and mobile communications services in El Salvador, for an amount (enterprise value) of 315 million dollars, 277 million euros as of the date of the agreement.
The closing of the transaction is subject to the pertinent regulatory approvals. As of the date of the issuance of this Annual Report, such conditions have not been met.
Agreement for the sale of Telefónica Panamá
On February 20, 2019, Telefónica Centroamérica Inversiones, S.L. (a subsidiary of Telefónica, 60% of which is owned, directly or indirectly, by Telefónica and 40% of which is owned, directly or indirectly, by Corporación Multi Inversiones, S.A.) reached an agreement with Millicom International Cellular, S.A. for the sale of 100% of Telefónica Móviles Panamá, S.A., a company that provides fixed and mobile communication services in Panamá, for an amount (enterprise value) of 650 million dollars, approximately 573 million euros at the exchange rate as of the date of the agreement.
The closing of the transaction is subject to the pertinent regulatory conditions and will take place once such conditions are satisfied. As of the date of the issuance of this Annual Report, such conditions have not been met.
Agreement for the sale of Telefónica Nicaragua
On February 20, 2019, Telefónica Centroamérica Inversiones, S.L. (a subsidiary of Telefónica, 60% of which is owned, directly or indirectly, by Telefónica and 40% of which is owned, directly or indirectly, by Corporación Multi Inversiones, S.A.) reached an agreement with Millicom International Cellular, S.A. for the sale of 100% of Telefónica Celular de Nicaragua, S.A., a company that provides fixed and mobile communication services in Nicaragua, for an amount (enterprise value) of 430 million dollars, approximately 379 million euros at the exchange rate as of the date of the agreement.
The closing of the transaction is subject to the pertinent regulatory conditions and will take place once such conditions are satisfied. As of the date of the issuance of this Annual Report, such conditions have not been met.
164
Agreement for the sale of Telefónica Costa Rica
On February 20, 2019, Telefónica, S.A. reached an agreement with Millicom International Cellular, S.A. for the sale of 100% of Telefónica de Costa Rica TC, S.A., a company that provides fixed and mobile communication services in Costa Rica, for an amount (enterprise value) of 570 million dollars, approximately 503 million euros at the exchange rate as of the date of the agreement.
The closing of the transaction is subject to the pertinent regulatory conditions and will take place once such conditions are satisfied. As of the date of the issuance of this Annual Report, such conditions have not been met.
D. Exchange Controls
Exchange Controls and Other Limitations Affecting Security Holders
Ownership limitations
There are no limitations with respect to the ownership of our assets or share capital except those derived from the application of the reciprocity principle as described above.
Trading by us in our own shares or shares of companies under our control
For information on the requirements applicable to the trading by us in our own shares or shares of companies under our control, see “—Memorandum and Articles of Association- Description of Our Capital Stock—Acquisition of own shares” above.
Other restrictions on acquisitions of shares
For information on reporting requirements and other restrictions “applicable to the acquisition of our shares see “—Memorandum and Articles of Association
—
Description of Our Capital Stock-Reporting requirements” and “—Trading by us in our own shares or shares of companies under our control” above.
Dividend and Liquidation Rights
According to Spanish law and our bylaws, dividends may only be paid out of profits or distributable reserves if the value of our net worth is not, and as a result of such distribution would not be, less than our capital stock. Pursuant to Spanish law, we are required to reserve 10% of our fiscal year net income until the amount in our legal reserve reaches 20% of our capital. Our legal reserve is currently at 20%.
Dividends payable by us to non-residents of Spain ordinarily are subject to a Spanish withholding tax. For the tax implications of dividends to U.S. Holders (as defined below), see “—Taxation.”
Upon our liquidation, our shareholders would be entitled to receive pro rata any assets remaining after the payment of our debts and taxes and expenses of such liquidation. Any change in the rights of shareholders to receive dividends and payment upon liquidation would require an amendment to our bylaws by resolution adopted by a general meeting of shareholders. If there were more than one class of shares, such amendment would also require the approval of each class of shareholders affected by the amendment.
Preemptive Rights and Increases of Share Capital
Pursuant to the Spanish Corporations Law, shareholders have preemptive rights to subscribe for any new shares and for bonds convertible into shares. Such rights may not be available under special circumstances if waived by a resolution passed at a general meeting of shareholders in accordance with Article 308 of the Spanish Corporations Law, or the Board of Directors, if authorized (Article 506 of the Spanish Corporation Act). Further, such rights, in any event, will not be available in the event of an increase in capital to meet the requirements of a convertible bond issue or a merger in which shares are issued as consideration. Such rights:
|
•
|
are transferable;
|
|
•
|
may be traded on the Automated Quotation System; and
|
165
|
•
|
may be of value to existing shareholders because new shares may be offered for subscription at prices lower than prevailing market prices.
|
Absent an exemption from registration, shares issuable upon exercise of rights must be registered under the Securities Act in order to be offered to holders of ADRs. If we decided not to register the shares, the rights would not be distributed to holders of ADRs. Pursuant to the Deposit Agreement, however, holders of ADRs are entitled to receive their proportionate share of the proceeds, if any, from sale by the Depositary of any rights accruing to holders of ADRs.
E. Taxation
The following is a general summary of the material Spanish and U.S. federal income tax consequences to U.S. Holders described below of the ownership and disposition of shares or ADSs. This summary is based upon Spanish and U.S. tax laws (including the U.S. Internal Revenue Code of 1986, as amended (the “
Code
”), final, temporary and proposed U.S. Treasury regulations, rulings, judicial decisions and administrative pronouncements), and the Convention Between the United States of America and the Kingdom of Spain for the Avoidance of Double Taxation and the Prevention of Fiscal Evasion with Respect to Taxes on Income, signed February 22, 1990 (the “
Treaty
”), all as of the date hereof and all of which are subject to change or changes in interpretation, possibly with retroactive effect. In addition, the summary is based in part on representations of the Depositary and assumes that each obligation provided for in or otherwise contemplated by the Deposit Agreement or any other related agreements will be performed in accordance with its terms.
As used herein, the term “U.S. Holder” means a beneficial owner of one or more shares or ADSs:
|
•
|
that is, for U.S. federal income tax purposes, one of the following:
|
|
(a)
|
a citizen or individual resident of the United States;
|
|
(b)
|
a corporation (or other entity taxable as a corporation) created or organized in or under the laws of the United States or any state therein or the District of Columbia; or
|
|
(c)
|
an estate or trust the income of which is subject to U.S. federal income taxation regardless of its source;
|
|
•
|
who is entitled to the benefits of the Treaty;
|
|
•
|
who holds the shares or ADSs as capital assets for U.S. federal income tax purposes;
|
|
•
|
who owns, directly, indirectly or by attribution, less than 10% of the share capital or voting stock of Telefónica; and
|
|
•
|
whose holding is not attributable to a fixed base or permanent establishment in Spain.
|
This summary does not address all of the tax considerations, including the potential application of the provisions of the Code known as the Medicare contribution tax, that may apply to holders that are subject to special tax rules, such as certain U.S. expatriates, insurance companies, tax-exempt organizations, certain financial institutions, persons subject to the alternative minimum tax, dealers and certain traders in securities, persons holding shares or ADSs as part of a straddle, hedging, conversion or integrated transaction, persons who acquired their shares or ADSs pursuant to the exercise of employee stock options or otherwise as compensation, persons owning shares or ADSs in connection with a trade or business outside of the U.S., partnerships or other entities classified as partnerships for U.S. federal income tax purposes or persons whose functional currency is not the U.S. dollar. Such holders may be subject to U.S. federal income tax consequences different from those set forth below.
If a partnership holds shares or ADSs, the tax treatment of a partner generally will depend upon the status of the partner and the activities of the partnership. A partner in a partnership that holds shares or ADSs is urged to consult its own tax advisor regarding the specific tax consequences of owning and disposing of the shares or ADSs.
For purposes of the Treaty and U.S. federal income tax, U.S. Holders of ADSs will generally be treated as owners of the underlying shares represented by such ADSs. Accordingly, no gain or loss will be recognized if a U.S. Holder exchanges ADSs for the underlying shares represented by those ADSs.
166
The U.S. Treasury has expressed concerns that parties to whom American depositary receipts are released before shares are delivered to the depositary, or intermediaries in the chain of ownership between holders and the issuer of the security underlying the American depositary receipts, may be taking actions that are inconsistent with the claiming of foreign tax credits by U.S. holders of American depositary receipts. Such actions would also be inconsistent with the claiming of the reduced rates of tax applicable to dividends received by certain non-corporate U.S. Holders. Accordingly, the availability of foreign tax credits to U.S. Holders of ADSs and the reduced tax rates for dividends received by certain non-corporate U.S. Holders of ADSs, each as described below, could be affected by actions taken by such parties or intermediaries.
This discussion assumes that Telefónica is not, and will not become, a passive foreign investment company (“
PFIC
”), as discussed below under “—U.S. Federal Income Tax Considerations—Passive foreign investment company rules.”
U.S. Holders of shares or ADSs should consult their own tax advisors concerning the specific Spanish and U.S. federal, state and local tax consequences of the ownership and disposition of shares or ADSs in light of their particular situations as well as any consequences arising under the laws of any other taxing jurisdiction. In particular, U.S. Holders are urged to consult their own tax advisors concerning their eligibility for benefits under the Treaty.
Spanish Tax Considerations
Taxation of dividends
Under Spanish law, dividends paid by Telefónica to U.S. Holders of ordinary shares or ADSs are subject to Spanish Non-Resident Income Tax, withheld at source, at a rate of 19%. For these purposes, upon distribution of the dividend, Telefónica or its paying agent will withhold an amount equal to the tax due according to the rules set forth above.
However, under the Treaty, if you are a U.S. Holder, you are entitled to a reduced withholding tax rate of 15%.
To benefit from the Treaty-reduced rate of 15%, you must provide to Telefónica through its paying agent in Spain, before the tenth day following the end of the month in which the dividends were payable, a certificate from the U.S. Internal Revenue Service (“
IRS
”) stating that, to the best knowledge of the IRS, such U.S. Holders are residents of the United States within the meaning of the Treaty and entitled to its benefits.
If this certificate is not provided within this period, you may afterwards apply for a refund of the amount withheld in excess of the rate provided for in the Treaty by following the procedures described in the next section.
Spanish Refund Procedure
According to Spanish Regulations on Non-Resident Income Tax, approved by Royal Decree 1776/2004 dated July 30, 2004, as amended, a refund for the amount withheld in excess of the Treaty-reduced rate can be obtained from the relevant Spanish tax authorities. To pursue the refund claim, if you are a U.S. Holder, you are required to file:
–
the corresponding Spanish tax form;
–
the certificate referred to in the preceding section; and
–
evidence of the Spanish Non-Resident Income Tax that was withheld with respect to you.
The refund claim must be filed within four years from the date in which the withheld tax was collected by the Spanish tax authorities.
U.S. Holders are urged to consult their own tax advisors regarding refund procedures and any U.S. tax implications thereof.
Taxation of capital gains
For Spanish tax purposes, income obtained from the sale of shares or ADSs of Telefónica will be treated as capital gains. Spanish non-resident income tax is levied at a rate of 19% on capital gains obtained by persons not residing in Spain for tax purposes who are not entitled to the benefit of any applicable treaty for the avoidance of double taxation.
Notwithstanding the above, capital gains derived from the transfer of shares on an official Spanish secondary stock market by any holder who is resident in a country that has entered into a treaty for the avoidance of double taxation with an “exchange of information” clause (the Treaty contains such a clause) will be exempt from taxation in Spain. If you are a U.S. Holder, under the Treaty capital gains arising from the disposition of shares or ADSs will not
167
be taxed in Spain. You will be required to establish that you are entitled to the exemption from tax under the Treaty by providing to the relevant Spanish tax authorities a certificate of residence issued by the IRS stating that to the best knowledge of the IRS, you are a U.S. resident within the meaning of the Treaty.
Spanish wealth tax
Individual U.S. Holders who hold shares or ADSs located in Spain are subject to the Spanish Wealth Tax (Impuesto sobre el Patrimonio) (Spanish Law 19/1991), which imposes tax on property located in Spain on the last day of any year. As of January 1, 2017 a 100% tax allowance has been approved by Royal Legislative Decree 13/2011 dated September, 16, 2011 to any resident or non resident taxpayer.
Inheritance and gift tax
Transfers of shares or ADSs on death and by gift to individuals are subject to Spanish inheritance and gift taxes (Impuesto sobre Sucesiones y Donaciones), respectively, if the transferee is a resident of Spain for tax purposes, or if the shares or ADSs are located in Spain at the time of death, regardless of the residence of the heir or beneficiary. In this regard, the Spanish tax authorities may determine that all shares of Spanish corporations and all ADSs representing such shares are located in Spain for Spanish tax purposes. The applicable tax rate, after applying relevant personal, family and wealth factors, generally ranges between 7.65% and 81.6% for individuals.
Gifts granted to corporations that are not resident in Spain are subject to Spanish Non-Resident Income Tax at a rate of 19% on the fair market value of the shares as a capital gain. If the donee is a United States resident corporation, the exclusions available under the Treaty described in the section “—Taxation of Capital Gains” above will be applicable.
Expenses of Transfer
Transfers of shares or ADSs will be exempt from any transfer tax (Impuesto sobre Transmisiones Patrimoniales) or value added tax. Additionally, no stamp tax will be levied on such transfers.
U.S. Federal Income Tax Considerations
Taxation of dividends
Distributions received by a U.S. Holder on shares or ADSs, including the amount of any Spanish taxes withheld therefrom, other than certain pro rata distributions of shares to all shareholders (including ADS holders), will constitute foreign-source dividend income to the extent paid out of Telefónica’s current or accumulated earnings and profits (as determined for U.S. federal income tax purposes). Because Telefónica does not maintain calculations of its earnings and profits under U.S. federal income tax principles, it is expected that distributions generally will be reported to U.S. Holders as dividends. The amount of dividend income paid in euros that a U.S. Holder will be required to include in income will equal the U.S. dollar value of the distributed euros, calculated by reference to the exchange rate in effect on the date the payment is received by the Depositary (in the case of ADSs) or by the U.S. Holder (in the case of shares), regardless of whether the payment is converted into U.S. dollars on the date of receipt. If the dividend is converted into U.S. dollars on the date of receipt, a U.S. Holder will generally not be required to recognize foreign currency gain or loss in respect of the dividend income. A U.S. Holder may have foreign currency gain or loss if the dividend is converted into U.S. dollars after the date of its receipt. Gain or loss that a U.S. Holder realizes on a sale or other disposition of euros will be U.S.-source ordinary income or loss. Corporate U.S. Holders will not be entitled to claim the dividends-received deduction with respect to dividends paid by Telefónica. Subject to applicable limitations and the discussion above regarding concerns expressed by the U.S. Treasury, dividends received by certain non-corporate U.S. Holders will be taxable at rates applicable to long-term capital gains. Non-corporate U.S. Holders should consult their own tax advisors to determine whether they are subject to any special rules that limit their ability to be taxed at these favorable rates.
Spanish income taxes withheld from dividends on shares or ADSs at a rate not exceeding the rate provided in the Treaty will be creditable against a U.S. Holder’s U.S. federal income tax liability, subject to applicable restrictions and limitations that may vary depending upon the U.S. Holder’s circumstances and the discussion above regarding concerns expressed by the U.S. Treasury. Spanish taxes withheld in excess of the rate applicable under the Treaty will not be eligible for credit against a U.S. Holder’s federal income tax liability. See “Spanish Tax Considerations—Taxation of dividends” above for a discussion of how to obtain the applicable Treaty rate. Instead of claiming a credit, a U.S. Holder may elect to deduct foreign taxes (including the Spanish taxes) in computing its taxable income, subject to generally applicable limitations. An election to deduct foreign taxes (instead of claiming foreign tax credits) applies to all taxes paid or accrued in the taxable year to foreign countries and possessions of the United States. The limitations
168
on foreign taxes eligible for credit are calculated separately with respect to specific classes of income. The rules governing foreign tax credits are complex. Therefore, U.S. Holders should consult their own tax advisors regarding the availability of foreign tax credits in their particular circumstances.
Taxation upon sale or other disposition of shares or ADSs
A U.S. Holder will generally recognize U.S. source capital gain or loss on the sale or other disposition of shares or ADSs. Any such gain or loss will be long-term capital gain or loss if the U.S. Holder has held such shares or ADSs for more than one year. The amount of the U.S. Holder’s gain or loss will be equal to the difference between such U.S. Holder’s tax basis in the shares or ADSs sold or otherwise disposed of and the amount realized on the sale or other disposition, as determined in U.S. dollars.
As discussed under “Spanish Tax Considerations—Taxation of capital gains” above, gain realized by a U.S. Holder on the sale or other disposition of shares or ADSs will be exempt from Spanish tax on capital gains under the Treaty. If a U.S. Holder is eligible for the exemption from Spanish tax on capital gains but does not follow appropriate procedures for obtaining the exemption, such holder will not be entitled to credit the amount of Spanish tax on capital gains paid against its U.S. federal income tax liability. U.S. Holders should consult their own tax advisors regarding the potential Spanish tax consequences of a sale or other disposition of shares or ADSs and the procedures available for an exemption from such tax.
Passive foreign investment company rules
Telefónica believes that it was not a PFIC for U.S. federal income tax purposes for its 2018 taxable year. However, because PFIC status depends upon the composition of a company’s income and assets and the market value of its assets (including, among others, less than 25% owned equity investments) from time to time, there can be no assurance that Telefónica will not be considered a PFIC for any taxable year. If Telefónica were treated as a PFIC for any taxable year during which a U.S. Holder owned a share or ADS, certain adverse tax consequences could apply to the U.S. Holder.
In general, if Telefónica were treated as a PFIC for any taxable year during which a U.S. Holder owned a share or ADS, gain recognized by a U.S. Holder on a sale or other disposition of such share or ADS would be allocated ratably over the U.S. Holder’s holding period for the share or ADS. The amounts allocated to the taxable year of the sale or other disposition and to any year before Telefónica became a PFIC would be taxed as ordinary income. The amount allocated to each other taxable year would be subject to tax at the highest rate in effect for individuals or corporations, as appropriate, and an interest charge would be imposed on the resulting tax liability. The same treatment would apply to any distribution in respect of shares or ADSs to the extent it exceeds 125% of the average of the annual distributions on shares or ADSs received by the U.S. Holder during the preceding three years or the U.S. Holder’s holding period, whichever is shorter. Certain elections may be available that would result in alternative treatments (such as mark-to-market treatment) of the shares or ADSs.
In addition, if Telefónica were treated as a PFIC in a taxable year in which it pays a dividend or in the prior taxable year, the favorable dividend rates discussed above with respect to dividends paid to certain non-corporate U.S. Holders would not apply.
If Telefónica were a PFIC for any taxable year during which a U.S. Holder owned our shares or ADSs, the U.S. Holder will generally be required to file IRS Form 8621 with its annual U.S. federal income tax return.
Information reporting and backup withholding
Payments of dividends and sales proceeds that are made within the United States or through certain U.S.-related financial intermediaries generally are subject to information reporting and may be subject to backup withholding unless the U.S. Holder is a corporation or other exempt recipient or, in the case of backup withholding, the U.S. Holder provides a correct taxpayer identification number and certifies that it is not subject to backup withholding. The amount of any backup withholding from a payment to a U.S. Holder will be allowed as a credit against the U.S. Holder’s U.S. federal income tax liability and may entitle such U.S. Holder to a refund, provided that the required information is timely furnished to the IRS.
Certain U.S. Holders who are individuals and certain specified entities may be required to report information relating to stock of a non-U.S. person, subject to certain exceptions (including an exception for stock held through a U.S. financial institution). U.S. Holders are urged to consult their tax advisors regarding the application, if any, of this legislation to their ownership of shares or ADSs.
169
F. Dividends and Paying Agents
Not Applicable.
G. Statements by Experts
Not Applicable.
H. Documents on Display
Where You Can Find More Information
We file Annual Reports on Form 20-F and furnish periodic reports on Form 6-K to the SEC. You may read and copy any of these reports at the SEC’s public reference room in Washington, D.C. Please call the SEC at 1-800-SEC-0330 for further information. Our SEC filings are also available to the public from commercial document retrieval services. Some of our SEC filings are also available at the website maintained by the SEC at “http://www.sec.gov.” Except as otherwise expressly indicated herein, any such information does not form part of this annual report on Form 20-F.
Our ADSs are listed on the New York Stock Exchange under the symbol “TEF.” You may inspect any periodic reports and other information filed with or furnished to the SEC by us at the offices of the New York Stock Exchange, 20 Broad Street, New York, New York 10005.
As a foreign private issuer, we are exempt from the rules under the Exchange Act which prescribe the furnishing and content of proxy statements, and our officers, directors and principal shareholders are exempt from the reporting and “short-swing” profit recovery provisions contained in Section 16 of the Exchange Act.
We are subject to the informational requirements of the Spanish securities commission and the Spanish Stock Exchanges, and we file reports and other information relating to our business, financial condition and other matters with the Spanish securities commission and the Spanish Stock Exchanges. You may read such reports, statements and other information, including the annual and biannual financial statements, at the public reference facilities maintained in Madrid and Barcelona. Some of our Spanish securities commission filings are also available at the website maintained by the CNMV at http://www.cnmv.es.
We have appointed Citibank, N.A. to act as Depositary for the Telefónica ADSs. Citibank will, as provided in the Deposit Agreement, arrange for the mailing of summaries in English of such reports and communications to all record holders of the ADSs of Telefónica. Any record holder of Telefónica ADSs may read such reports and communications or summaries thereof at Citibank’s office located at 388 Greenwich Street, 14th Floor, New York, New York 10013.
I. Subsidiary Information
Not applicable.
We are exposed to various financial market risks as a result of: (i) our ordinary business activity, (ii) debt incurred to finance our business, (iii) our investments in companies, and (iv) other financial instruments related to the above commitments.
The main market risks affecting Group companies are as follows:
|
•
|
Exchange rate risk
: arises primarily from: (i) Telefónica’s international presence, through its investments and businesses in countries that use currencies other than the euro (primarily in Latin America, but also in the United Kingdom), (ii) debt denominated in currencies other than that of the country where the business is conducted or the home country of the company incurring such debt ,and (iii) for those trade receivables or payables in foreign currency related to the company with the transaction registered.
|
|
•
|
Interest rate risk
: arises primarily in connection with changes in interest rates affecting: (i) financial expenses on floating rate debt (or short-term debt likely to be renewed), due to changes in interest rates and (ii) the value of long-term liabilities at fixed interest rates.
|
170
|
•
|
Share price risk
: arises primarily from changes in the value of the equity investments (that may be bought, sold or otherwise involved in transactions), from changes in the value of derivatives associated with such investments, from changes in the value of treasury shares and from changes in the value of equity derivatives.
|
|
•
|
Liquidity risk
: the Telefónica Group is also exposed to liquidity risk if a mismatch arises between its financing needs (including operating and financial expenses, investment, debt redemptions and dividend commitments) and its sources of finance (including revenues, divestments, credit lines from financial institutions and capital market transactions). The cost of finance could also be affected by movements in the credit spreads (over benchmark rates) demanded by lenders.
|
|
•
|
Country risk
: refers to the possible decline in the value of assets, cash flows generated or cash flows returned to the parent company as a result of political, economic or social instability in the countries where the Telefónica Group operates, especially in Latin America.
|
|
•
|
Credit risk
: appears when a counterparty fails to meet or delays its payment obligations in accordance with the agreed terms, driving an impairment in an asset due to: (i) solvency issues, or (ii) no intention to pay.
|
We seek to actively manage these risks through the use of derivatives (primarily on exchange rates, interest rates and share prices) and by incurring debt in local currencies, where appropriate, with a view to stabilizing cash flows, our income statement and, to a lesser extent, part of the value of our investments. In this way, we attempt to protect our solvency, facilitate financial planning and take advantage of investment opportunities.
We manage our exchange rate risk and interest rate risk in terms of net financial debt and net financial debt plus commitments as calculated by us. We believe that these parameters are more appropriate to understanding our debt position. Net financial debt and net financial debt plus commitments take into account the impact of our cash balance and cash equivalents including derivatives positions with a positive value linked to liabilities. Neither net financial debt nor net financial debt plus commitments as calculated by us should be considered as a substitute for gross financial debt (the sum of current and non-current interest-bearing debt) as a measure of our leverage. For a more detailed description on reconciliation of net debt and net financial debt to gross financial debt, see “Item 5. Operating and Financial Review and Prospects—Presentation of Financial Information—Non-GAAP financial information—Net financial debt and net financial debt plus commitments.”
For a more detailed description on quantitative and qualitative disclosures about market risks see Note 17 to our Consolidated Financial Statements.
A. American Depositary Shares
The Depositary of our ADR program is Citibank, N.A., and the address of its principal executive office is 388 Greenwich Street, 14th Floor, New York, New York 10013.
Our ADSs are listed on the New York Stock Exchange under the symbol “TEF.” Each ADS represents the right to receive one ordinary share of capital stock of 1.00 euros nominal value each, of Telefónica, S.A. The Depositary issues ADSs in the form of certificated ADSs (American Depositary Receipts, or ADRs) or uncertificated ADSs pursuant to the Deposit Agreement.
Under the terms of the Deposit Agreement, as of the date of this Annual Report, an ADS holder may have to pay to the Depositary the services fees specified in the table below:
171
|
Category
|
Depositary Actions
|
Associated Fee / Paid By Whom
|
|
(a) Depositing or substituting the underlying shares
|
Issuance of ADSs upon the deposit of shares
|
Up to 5.00 dollars for each 100 ADSs (or portion thereof) evidenced by the new ADSs delivered (charged to person depositing the shares or receiving the ADSs)(1)
|
|
(b) Receiving or distributing dividends
|
Distribution of cash dividends or other cash distributions; distribution of share dividends or other free share distributions; distribution of securities other than ADSs or rights to purchase additional ADSs
|
Up to 5.00 dollars for each 100 ADSs (or portion thereof) held (in the case of cash distributions, deducted from the relevant distribution; in the case of all other distributions, billed to the relevant holder)(2)
|
|
(c) Selling or exercising rights
|
Distribution or sale of securities
|
Up to 5.00 dollars for each 100 ADSs (or portion thereof) held (billed to the relevant holder)
|
|
(d) Withdrawing an underlying security
|
Acceptance of ADSs surrendered for withdrawal of deposited securities
|
Up to 5.00 dollars for each 100 ADSs (or portion thereof) evidenced by the ADSs surrendered (charged to person surrendering or to person to whom withdrawn securities are being delivered)(1)
|
|
(e) Transferring, splitting or grouping receipts
|
Transfers
|
Up to 1.50 dollars per ADS so presented (charged to person presenting certificate for transfer)
|
|
(f) General depositary services, particularly those charged on an annual basis
|
Other services performed by the Depositary in administering the ADSs
|
Up to 5.00 dollars for each 100 ADSs (or portion thereof) held on the applicable record date (billed to person holding ADSs on applicable record date established by the Depositary)(2)
|
172
|
(g) Expenses of the Depositary
|
Certain fees and expenses incurred by the depositary bank and certain taxes and governmental charges in connection with:
·
compliance with foreign exchange control regulations or any law or regulation relating to foreign investment;
·
the Depositary or its custodian’s compliance with applicable law, rule or regulation;
·
stock transfer or other taxes and other governmental charges;
·
cable, telex, facsimile transmission/delivery;
·
expenses of the Depositary in connection with the conversion of foreign currency into U.S. dollars (which are paid out of such foreign currency);
·
any other charge payable by Depositary or its agents.
|
Expenses payable at the sole discretion of the Depositary (billed or deducted from cash distributions to person holding ADSs on applicable record date established by the Depositary)
|
(1) In the case of ADSs issued by the Depositary into DTC or presented to the Depositary via DTC, the ADS issuance and cancellation fees will be payable to the Depositary by DTC Participant(s) receiving the ADSs from the Depositary or the DTC Participant(s) surrendering the ADSs to the Depositary for cancellation, as the case may be, on behalf of the beneficial owner(s) and will be charged by the DTC Participant(s) to the account(s) of the applicable beneficial owner(s) in accordance with the procedures and practices of the DTC participant(s) as in effect at the time.
(2) For ADSs held through DTC, the Depositary fees for distributions other than cash and the Depositary service fee are charged by the Depositary to the DTC Participants in accordance with the procedures and practices prescribed by DTC from time to time and the DTC Participants in turn charge the amount of such fees to the beneficial owners for whom they hold ADSs.
The Depositary has agreed to reimburse or pay on behalf of Telefónica, S.A., certain reasonable expenses related to our ADS program and incurred by us in connection with the program (such as NYSE listing fees, legal and accounting fees incurred in connection with the preparation of Form 20-F and ongoing SEC compliance and listing requirements, distribution of proxy materials, investor relations expenses, etc.). The Depositary has covered all such expenses incurred by us during 2018 for an amount of 4.6 million dollars. The amounts the Depositary reimbursed or paid are not perforce related to the fees collected by the depositary from ADS holders.
As part of its service to us, the Depositary has agreed to waive certain expenses for the standard costs associated with the administration of our ADS program for the year ended December 31, 2018.
173
None.
Not applicable.
Management’s Evaluation over Disclosure Controls and Procedures
Our Chief Executive Officer and our Chief Financial and Control Officer, after evaluating the effectiveness of our disclosure controls and procedures (as defined in Rule 13a-15(e) under the Exchange Act) as of the end of the period covered by this Form 20-F, have concluded that, as of such date, our disclosure controls and procedures were effective.
There are, as described below, inherent limitations to the effectiveness of any control system, including disclosure controls and procedures. Accordingly, even effective disclosure controls and procedures can provide only reasonable assurance of achieving their control objectives
.
Management’s Annual Report on Internal Control over Financial Reporting
The management of Telefónica is responsible for establishing and maintaining adequate internal control over financial reporting as defined in Rule 13a-15(f) under the Exchange Act. Telefónica’s internal control system is designed to provide reasonable assurance as to the reliability of financial reporting and the preparation of the published financial statements under generally accepted accounting principles. For Telefónica, generally accepted accounting principles refer to IFRS as issued by the IASB.
Telefónica ’s internal control over financial reporting includes those policies and procedures that:
(1) Pertain to the maintenance of records that, in reasonable detail, accurately and fairly reflect the transactions and dispositions of our assets;
(2) Provide reasonable assurance that transactions are recorded as necessary to permit preparation of financial statements in accordance with IFRS, and that receipts and expenditures of the Group are being made only in accordance with authorizations of management and directors; and
(3) Provide reasonable assurance regarding prevention or timely detection of unauthorized acquisition, use, or disposition of Telefónica’s assets that could have a material effect on the financial statements.
Any internal control system, no matter how well designed, has inherent limitations, including the possibility of human error and the circumvention or overriding of controls and procedures, which may not prevent or detect misstatements.
Telefónica management assessed the effectiveness of Telefónica’s internal control over financial reporting as of December 31, 2018. In making this assessment, it used the criteria set forth by the Committee of Sponsoring Organizations of the Treadway Commission ("COSO" 2013 framework) in Internal Control - Integrated Framework. Based on its assessment and those criteria, Telefónica management believes that at December 31, 2018, Telefónica’s internal control over financial reporting was effective based on those criteria.
Report of the Independent Registered Public Accounting Firm
Telefónica’s independent registered public accounting firm, PricewaterhouseCoopers Auditores, S.L., has issued a report on the consolidated financial statements as of and for the year ended December 31, 2018 and on the effectiveness of the company’s internal control over financial reporting. The report is included on page F-2.
Changes in Internal Control Over Financial Reporting
174
There were no changes in our internal control over financial reporting during the period covered by this Annual Report that have materially affected, or are reasonably likely to materially affect, our internal control over financial reporting.
Our Board of Directors has determined that Mr. José Javier Echenique Landiríbar and Mr. Ignacio Moreno Martínez meet the requirements of an “audit committee financial expert” as such term is defined by the SEC.
Telefónica is governed by a code of business conduct and ethics called the Telefónica Business Principles. The Business Principles are binding on all employees globally, including senior officers, in their daily operations and on the Company in its relations with its stakeholders. All employees have an obligation to complete the Responsible Business Principles Course once every two years. In 2018, 91% of Telefónica’s workforce completed the Responsible Business Principles Course
.
The standards set forth in the Telefónica Business Principles cover ethical issues such as honesty and trust, respect for the law, integrity and the respect of human rights, transparency of information, fiscal transparency, fair competition, political neutrality, as well as how these ethical principles should be implemented in our relationships with our stakeholders: employees, customers, shareholders, suppliers and the communities we work in. Issues covered, amongst other, are professional development, diversity, labour rights, compensation, health and safety, communications and advertising, corporate governance, risk management, protection to shareholders, anti-corruption, conflicts of interest, environmental protection, privacy and data protection, commitment to the societies in which operate and responsible management of the supply chain, etc.
The Telefónica Business Principles are available and open to consultation for employees on the Telefónica Intranet site as well as for the general public on the Telefónica external website (
https://www.telefonica.com/en/web/about_telefonica/strategy/business-principles
).
For more information, please see “Item 16G. Corporate Governance—Code of Ethics.”
Please see Note 26(e) to our Consolidated Financial Statements.
The Audit and Control Committee’s Pre-Approval Policies and Procedures
The engagement of any service rendered by our external auditor or any of its affiliates must always have the prior approval of our Audit and Control Committee. Such Committee has developed a Pre-approval Policy regarding the engagement of professional services by our external auditor, in accordance with the Spanish Audit Law and the Sarbanes-Oxley Act. This Policy establishes the obligation to obtain prior approval from our Audit and Control Committee for any service to be rendered by our external auditor to Telefónica or any of its subsidiaries.
This Policy sets forth restrictions on engaging our external auditor for the performance of non-audit services, according to which the engagement of our external auditor for the provision of such services is only permitted when there is no other firm available to provide the needed services at a comparable cost and with a similar level of quality. Moreover, this Policy prohibits the engagement of our external auditor for the provision of certain type of services that would be considered as “prohibited services.”
In addition, the Audit and Control Committee oversees the total amount of fees paid to our external auditor for the provision of non-audit services in order to assure that such fees do not exceed a certain percentage of the total amount of fees paid for the provision of audit services.
Not applicable.
175
At December 31, 2018, we held
65,496,120
shares of treasury stock, representing
1.26145%
of our capital stock. At December 31, 2017, we held
65,687,859
shares of treasury stock, representing
1.26514%
of our capital stock.
These treasury shares are directly owned by Telefónica, S.A.
No purchases of shares or other registered equity securities of Telefónica were made during 2018 on behalf of the Company or any affiliated purchaser.
For a more detailed description of our plans or programs, see “Item 8. Financial Information—Dividend Information and Shareholders’ Return” and Note 24 to our Consolidated Financial Statements.
Not applicable.
Corporate governance guidelines
In Spain, companies with securities listed on a Spanish Stock Exchange are expected to follow the Good Governance Code of Listed Companies (the “
Code
”) published in February 2015, which contains corporate governance and shareholder disclosure recommendations. Spanish listed companies are required by law to publish an Annual Report on Corporate Governance and a Report on the Compensation Policy of the Board of Directors. Additionally, Spanish listed companies are required to publish their corporate governance information on their websites. We base our corporate governance procedures on the recommendations of the Code. As part of our corporate governance procedures, we have adopted regulations for our Board of Directors that govern, among other things, director qualification standards, responsibilities, compensation, access to management information, the Board of Directors’ purpose and each of our Board Committee’s purpose and responsibilities. Moreover, we have a Regulation of the General Shareholders’ Meeting that aims to reinforce its transparency, providing shareholders with a framework guaranteeing and facilitating exercise of their rights. Additionally, we also have regulations for the Audit and Control Committee. The Annual Report on Corporate Governance published by us provides a detailed explanation of our corporate governance procedures and explains the role and duties of our Board of Directors and Board Committees. Our Annual Report on Corporate Governance and the Report on the Compensation Policy of the Board of Directors of Telefónica, S.A. are available on our website at
www.telefonica.com
. None of the information contained on our website is incorporated in this Annual Report.
Committees
We have an Executive Commission. The Board of Directors delegates all its powers to an Executive Commission, except those that cannot be delegated by law, by our bylaws, or by the Regulations of the Board of Directors.The Executive Commission provides for greater efficiency and effectiveness in the execution of tasks, since it meets more often than the Board of Directors. The Executive Commission shall report to the Board in a timely manner on the matters dealt with and the decisions adopted at the meetings thereof, with a copy of the minutes of such meetings made available to the members of the Board (according to Article 21.C of the Regulations of the Board of Directors). The Executive Commission shall consist of the Chairman of the Board of Directors, once appointed as a member of the Executive Commission, and not less than three or more than ten Directors, appointed by the Board of Directors. The Board of Directors shall seek to have External Directors constitute a majority over the Executive Directors.
We have had an Audit and Control Committee since 1997. Our Audit and Control Committee is composed of four non-executive directors, all of whom are deemed Rule 10A-3 independent by our Board of Directors. The functions, composition and competencies of this Committee are regulated by the Board of Directors’ Regulations and the Regulations of the Audit and Control Committee and are similar to those required by the New York Stock Exchange. The Audit and Control Committee shall consist of not less than three directors appointed by our Board of Directors. All Committee members shall be external directors. When appointing such members, our Board of Directors shall take into account the appointees’ knowledge and experience in matters of accounting, auditing and risk management.
We have had a Nominating, Compensation and Corporate Governance Committee since 1997, which is composed of five external directors. The functions, composition and competencies of this Committee are regulated by the Board of Directors’ Regulations and are very similar to those required by the NYSE. The Nominating, Compensation and Corporate Governance Committee shall consist of not less than three directors appointed by the Board of Directors.
176
All members of the Committee must be external directors and the majority thereof must be independent. The chairman of the Nominating, Compensation and Corporate Governance Committee, who shall in all events be an independent director, shall be appointed from among its members.
Additionally we have a Regulation and Institutional Affairs Committee, a Service Quality and Customer Service Committee, and a Strategy and Innovation Committee. The functions, composition and competencies are regulated by the Board of Directors’ Regulations.
Independence of the Board
As of the date of this Annual Report, we have 17 directors, out of which nine have been deemed independent by our Board of Directors attending to the director’s classification contained in Spanish Corporations Act (
Ley de Sociedades de Capital
). All our directors, with the exception of Mr. Álvarez-Pallete López (our Chairman and Chief Executive Officer) and Mr. Vilá Boix (our Chief Operating Officer), are non-executive directors. We, in accordance with the Spanish Corporations Act, assess the independence of our directors. Among other things, independent directors: (i) shall not be, past employees or executive directors of any of the Group companies, unless three or five years have elapsed , respectively, (ii) shall not receive any payment or other form of compensation from us or our group on top of their directors’ fees, unless the amount involved is not significant, (iii) shall not be partners, now or on the past three years, in the external auditor or in the firm responsible for the audit report, (iv) shall not be executive directors or senior officers of another company where one of our executive directors or senior officers is an external director, (v) shall not have material business dealings with us or any other company in our group, (vi) shall not be spouses, nor partners maintaining an analogous affective relationship, nor close relative of any of our executive directors or senior officers and (vii) shall not stand in any of the situations listed in (i), (v) or (vi) above in relation to a significant shareholder or a shareholder with board representation.
The classification of each director shall be explained by the Board of Directors to the shareholders at the General Shareholders’ Meeting at which the appointment thereof must be made or ratified. Furthermore, such classification shall be reviewed annually by our Board of Directors after verification by the Nominating, Compensation and Corporate Governance Committee, and reported in the Annual Corporate Governance Report.
Internal Audit Function
We have an Internal Audit Department responsible for internal audit matters and for ensuring the efficiency of the internal audit control process of our different units. This Internal Audit Department reports directly to the Audit and Control Committee, thus supporting the adequate performance of all its functions.
Non-Executive Director Meetings
Pursuant to the NYSE listing standards, non-executive directors of U.S.-listed companies must meet on a regular basis without management present and the company must disclose a method for any interested parties to communicate directly with the non-executive directors. As a group, our non-executive directors do not meet formally without management present. Nevertheless, each of the Audit and Control Committee, the Nominating, Compensation and Corporate Governance Committee, the Regulation and Institutional Affairs Committee, the Service Quality and Customer Service Committee, and the Strategy and Innovation Committee is composed exclusively of non-executive directors, thus giving each of these committees, the chance to analyze and discuss any matter related to our management, within its respective area of responsibility.
In addition, since May 2013, we have a lead independent director who acts as “Coordinating Independent Director”, to whom our bylaws grant the right to have a say on key elements of governance structure, which most companies in Spain and around the world reserve to the Board of Directors.
According to our bylaws (Art. 32) the independent director who acts as “Coordinating Independent Director”, shall carry out the following duties and tasks:
a) Coordinate the work of the External Directors that the Company has appointed, in defense of the interests of all the shareholders of the Company, and echo the concerns of such Directors.
b) Request the Chairman of the Board of Directors to call meetings of the Board where appropriate in accordance with the rules of corporate governance.
177
c) Request, consequently, the inclusion of certain matters in the agenda of the meetings of the Board of Directors.
d) Oversee the evaluation by the Board of Directors of the Chairman thereof.
Whistleblowing
We have procedures in place that allow any employee to anonymously and confidentially report instances of fraud, alterations of financial information or specific risks to Telefónica and its subsidiaries.
Code of Ethics
The NYSE listing standards require U.S. companies to adopt a code of business conduct and ethics for directors, officers and employees, which at minimum must address certain specified topics, and promptly disclose any waivers of the code for directors or executive officers. In 2004 we adopted, as required by the Sarbanes-Oxley Act, a code of ethics that applied to our principal executive officer, principal financial officer and to our senior financial officers. In December 2006, we adopted a code of business conduct and ethics, the “Telefónica Business Principles”, which apply to all Telefónica Group employees. In March 2008, we decided to modify such Business Principles in order to incorporate within them all components of the code of ethics definition in Section 406 of Sarbanes Oxley Act, and consequently our code of ethics for senior officers was replaced by such Business Principles. These Business Principles were further modified in 2016 and 2017 in order to include, among others, several new principles related to privacy and data protection, security, responsible communication practices as well as to reinforce other principles including the anti-corruption principle.
We also have an internal code of conduct for securities markets issues to prevent insider trading misconduct and to control possible conflicts of interest. In addition, the Regulations of the Board of Directors set out in detail our directors’ main obligations relating to conflicts of interest concerning business opportunities, misappropriation of our assets, confidentiality and non-competition.
178
We have responded to Item 18 in lieu of responding to this Item.
Please see pages F-5 through F-186.
|
Exhibit Number
|
Description
|
|
Amended and Restated bylaws (English translation)*
|
|
|
Agreement for the Sale and Purchase of Customer Relationship Management business, Atento, dated October 11, 2012 **
|
|
|
2014 Long-Term Incentive Plan Terms ***
|
|
|
2018 Long-Term Incentive Plan Terms
|
|
|
Subsidiaries of Telefónica (see Note 1 to the Consolidated Financial Statements and Appendix I thereto)
|
|
|
Certification of José María Álvarez-Pallete López, Chairman and Chief Executive Officer of Telefónica, pursuant to Section 302 of the Sarbanes-Oxley Act of 2002
|
|
|
Certification of Laura Abasolo García de Baquedano, Chief Finance and Control Officer of Telefónica, pursuant to Section 302 of the Sarbanes-Oxley Act of 2002
|
|
|
Certification pursuant to 18 U.S.C. Section 1350, as adopted pursuant to Section 906 of the Sarbanes-Oxley Act of 2002
|
|
|
Consent of PricewaterhouseCoopers Auditores, S.L.
|
|
|
Consent of Ernst & Young, S.L.
|
|
|
101
|
Interactive Data File
|
|
*
|
Incorporated by reference to Telefónica’s Annual Report on Form 20-F for the fiscal year ended December 31, 2017.
|
|
|
**
|
Incorporated by reference to Telefónica’s Annual Report on Form 20-F for the fiscal year ended December 31, 2012.
|
|
|
***
|
Incorporated by reference to Telefónica’s Annual Report on Form 20-F for the fiscal year ended December 31, 2014.
|
|
We agree to furnish to the SEC upon request, copies of the instruments defining the rights of the holders of our long-term debt and of our subsidiaries’ long-term debt.
179
SIGNATURES
The registrant hereby certifies that it meets all of the requirements for filing on Form 20-F and has duly caused and authorized the undersigned to sign this Annual Report on its behalf.
|
|
TELEFÓNICA, S.A.
|
|
|
|
|
|
|
|
|
|
|
|
|
|
|
|
By:
|
/s/ José María Álvarez-Pallete López
|
|
|
|
Name: José María Álvarez-Pallete López
|
|
|
|
Title: Chairman and Chief Executive Officer
|
|
|
|
|
|
|
|
|
|
|
|
|
|
|
TELEFÓNICA, S.A.
|
|
|
|
|
|
|
|
|
|
|
|
|
|
|
|
By:
|
/s/ Laura Abasolo García de Baquedano
|
|
|
|
Name: Laura Abasolo García de Baquedano
|
|
|
|
Title: Chief Finance and Control Officer
|
Date: February 21, 2019
180
Consolidated Financial Statements
(Consolidated Annual Accounts)
Telefónica, S.A. and subsidiaries composing the Telefónica Group.
F-1
REPORT OF INDEPENDENT REGISTERED PUBLIC ACCOUNTING FIRM
To the Board of Directors and Shareholders of Telefónica, S.A.
Opinions on the Financial Statements and Internal Control over Financial Reporting
We have audited the accompanying consolidated statements of financial position of Telefónica, S.A. and its subsidiaries (the “Company”) as of December 31, 2018 and 2017, and the related consolidated income statements, consolidated statements of comprehensive income, consolidated statements of changes in equity, and consolidated statements of cash flows for each of the two years in the period ended December 31, 2018, including the related notes (collectively referred to as the “consolidated financial statements”). We also have audited the Company’s internal control over financial reporting as of December 31, 2018, based on criteria established in
Internal Control - Integrated Framework
(2013) issued by the Committee of Sponsoring Organizations of the Treadway Commission (COSO).
In our opinion, the consolidated financial statements referred to above present fairly, in all material respects, the financial position of the Company as of December 31, 2018 and 2017, and the results of its operations and its cash flows for each of the two years in the period ended December 31, 2018 in conformity with International Financial Reporting Standards as issued by the International Accounting Standards Board. Also in our opinion, the Company maintained, in all material respects, effective internal control over financial reporting as of December 31, 2018, based on criteria established in
Internal Control - Integrated Framework
(2013) issued by the COSO.
We also have audited the adjustments to the 2016 consolidated financial statements to (i) retrospectively reflect the change in presentation of the segment information, as described in Note 4, and (ii) retrospectively apply the change in accounting for translation differences and hyperinflation adjustments related to its Venezuelan operations, as described in Note 2. In our opinion, such adjustments are appropriate and have been properly applied. We were not engaged to audit, review, or apply any procedures to the 2016 consolidated financial statements of the Company other than with respect to the adjustments and, accordingly, we do not express an opinion or any other form of assurance on the 2016 consolidated financial statements taken as a whole.
Change in Accounting Principle
As discussed in Note 2 to the consolidated financial statements, in 2018 the Company changed the manner in which it presents translation differences and hyperinflation adjustments related to its Venezuelan operations.
Basis for Opinions
The Company's management is responsible for these consolidated financial statements, for maintaining effective internal control over financial reporting, and for its assessment of the effectiveness of internal control over financial reporting, included in Management’s Annual Report on Internal Control over Financial Reporting appearing under Item 15. Our responsibility is to express opinions on the Company’s consolidated financial statements and on the Company's internal control over financial reporting based on our audits. We are a public accounting firm registered with the Public Company Accounting Oversight Board (United States) (PCAOB) and are required to be independent with respect to the Company in accordance with the U.S. federal securities laws and the applicable rules and regulations of the Securities and Exchange Commission and the PCAOB.
We conducted our audits in accordance with the standards of the PCAOB. Those standards require that we plan and perform the audits to obtain reasonable assurance about whether the consolidated financial statements are free of material misstatement, whether due to error or fraud, and whether effective internal control over financial reporting was maintained in all material respects.
Our audits of the consolidated financial statements included performing procedures to assess the risks of material misstatement of the consolidated financial statements, whether due to error or fraud, and performing procedures that respond to those risks. Such procedures included examining, on a test basis, evidence regarding the amounts and disclosures in the consolidated financial statements. Our audits also included evaluating the accounting principles used and significant estimates made by management, as well as evaluating the overall presentation of the consolidated financial statements. Our audit of internal control over financial reporting included obtaining an understanding of internal control over financial reporting, assessing the risk that a material weakness exists, and testing and evaluating the design and operating effectiveness of internal control based
F-2
on the assessed risk. Our audits also included performing such other procedures as we considered necessary in the circumstances. We believe that our audits provide a reasonable basis for our opinions.
Definition and Limitations of Internal Control over Financial Reporting
A company’s internal control over financial reporting is a process designed to provide reasonable assurance regarding the reliability of financial reporting and the preparation of financial statements for external purposes in accordance with generally accepted accounting principles. A company’s internal control over financial reporting includes those policies and procedures that (i) pertain to the maintenance of records that, in reasonable detail, accurately and fairly reflect the transactions and dispositions of the assets of the company; (ii) provide reasonable assurance that transactions are recorded as necessary to permit preparation of financial statements in accordance with generally accepted accounting principles, and that receipts and expenditures of the company are being made only in accordance with authorizations of management and directors of the company; and (iii) provide reasonable assurance regarding prevention or timely detection of unauthorized acquisition, use, or disposition of the company’s assets that could have a material effect on the financial statements.
Because of its inherent limitations, internal control over financial reporting may not prevent or detect misstatements. Also, projections of any evaluation of effectiveness to future periods are subject to the risk that controls may become inadequate because of changes in conditions, or that the degree of compliance with the policies or procedures may deteriorate.
/s/ PricewaterhouseCoopers Auditores, S.L.
Madrid, Spain
February 21, 2019
We have served as the Company’s auditor since 2017.
F-3
REPORT OF INDEPENDENT REGISTERED PUBLIC ACCOUNTING FIRM
The Board of Directors and Shareholders of
Telefónica, S.A.
We have audited the consolidated statements of income, comprehensive income, changes in equity, and cash flows of Telefónica, S.A. and subsidiaries for the year ended December 31, 2016, before the adjustments to (i) retrospectively reflect the changes in presentation of segment information, as described in note 4 and (ii) retrospectively apply the change in accounting for translation differences and hyperinflation adjustments related to its Venezuelan operations, as described in note 2 to the consolidated financial statements, (the “2016 unadjusted consolidated financial statements” are not presented herein). These consolidated financial statements are the responsibility of Telefónica, S.A.’s Directors. Our responsibility is to express an opinion on these financial statements based on our audit.
We conducted our audit in accordance with the standards of the Public Company Accounting Oversight Board (United States). Those standards require that we plan and perform the audit to obtain reasonable assurance about whether the financial statements are free of material misstatement. An audit includes examining, on a test basis, evidence supporting the amounts and disclosures in the financial statements. An audit also includes assessing the accounting principles used and significant estimates made by management, as well as evaluating the overall financial statement presentation. We believe that our audit provides a reasonable basis for our opinion.
In our opinion, the 2016 unadjusted consolidated financial statements present fairly, in all material respects, the consolidated results of the operations and cash flows of Telefónica, S.A. and subsidiaries for the year ended December 31, 2016, in conformity with International Financial Reporting Standards as issued by the International Accounting Standards Board.
We were not engaged to audit, review, or apply any procedures to the adjustments to (i) retrospectively reflect the changes in presentation of segment information, as described in note 4 and (ii) retrospectively apply the change in accounting for translation differences and hyperinflation adjustments related to its Venezuelan operations, as described in note 2 to the consolidated financial statements and, accordingly, we do not express an opinion or any other form of assurance about whether such retrospective adjustments are appropriate and have been properly applied. Those retrospective adjustments were audited by other auditors.
ERNST & YOUNG, S.L.
/s/ Alicia Martínez Durán
Alicia Martínez Durán
Madrid, Spain
February 23, 2017
F-4
|
|
|
|
|
|
|
|
Millions of euros
|
Notes
|
2018
|
|
2017
|
|
|
ASSETS
|
|
|
|
|
|
|
A) NON-CURRENT ASSETS
|
|
90,707
|
|
95,135
|
|
|
Intangible assets
|
(Note 6)
|
16,856
|
|
18,005
|
|
|
Goodwill
|
(Note 7)
|
25,748
|
|
26,841
|
|
|
Property, plant and equipment
|
(Note 8)
|
33,295
|
|
34,225
|
|
|
Investments accounted for by the equity method
|
(Note 9)
|
68
|
|
77
|
|
|
Financial assets and other non-current assets
|
(Note 11)
|
7,109
|
|
8,167
|
|
|
Deferred tax assets
|
(Note 22)
|
7,631
|
|
7,820
|
|
|
B) CURRENT ASSETS
|
|
23,340
|
|
19,931
|
|
|
Inventories
|
|
1,692
|
|
1,117
|
|
|
Receivables and other current assets
|
(Note 12)
|
10,579
|
|
10,093
|
|
|
Tax receivables
|
(Note 22)
|
1,676
|
|
1,375
|
|
|
Other current financial assets
|
(Note 13)
|
2,209
|
|
2,154
|
|
|
Cash and cash equivalents
|
(Note 14)
|
5,692
|
|
5,192
|
|
|
Non-current assets classified as held for sale
|
(Note 28)
|
1,492
|
|
—
|
|
|
TOTAL ASSETS (A+B)
|
|
114,047
|
|
115,066
|
|
|
|
Notes
|
2018
|
|
2017
|
|
|
EQUITY AND LIABILITIES
|
|
|
|
|
|
|
A) EQUITY
|
|
26,980
|
|
26,618
|
|
|
Equity attributable to equity holders of the parent and other holders of equity instruments
|
(Note 15)
|
17,947
|
|
16,920
|
|
|
Equity attributable to non-controlling interests
|
(Note 15)
|
9,033
|
|
9,698
|
|
|
B) NON-CURRENT LIABILITIES
|
|
57,418
|
|
59,382
|
|
|
Non-current financial liabilities
|
(Note 16)
|
45,334
|
|
46,332
|
|
|
Payables and other non-current liabilities
|
(Note 18)
|
1,890
|
|
1,687
|
|
|
Deferred tax liabilities
|
(Note 22)
|
2,674
|
|
2,145
|
|
|
Non-current provisions
|
(Note 21)
|
7,520
|
|
9,218
|
|
|
C) CURRENT LIABILITIES
|
|
29,649
|
|
29,066
|
|
|
Current financial liabilities
|
(Note 16)
|
9,368
|
|
9,414
|
|
|
Payables and other-current liabilities
|
(Note 19)
|
15,485
|
|
15,095
|
|
|
Current tax payables
|
(Note 22)
|
2,047
|
|
2,341
|
|
|
Current provisions
|
(Note 21)
|
1,912
|
|
2,216
|
|
|
Liabilities associated with non-current assets classified as held for sale
|
(Note 28)
|
837
|
|
—
|
|
|
TOTAL EQUITY AND LIABILITIES (A+B+C)
|
|
114,047
|
|
115,066
|
|
The accompanying notes and appendices are an integral part of these consolidated statements of financial position.
F-5
|
Consolidated income statements
|
|
|
|
|
|
|
|
|
Millions of euros
|
Notes
|
2018
|
|
2017
|
|
2016
|
|
|
Revenues
|
(Note 23)
|
48,693
|
|
52,008
|
|
52,036
|
|
|
Other income
|
(Note 23)
|
1,622
|
|
1,489
|
|
1,763
|
|
|
Supplies
|
|
(14,013
|
)
|
(15,022
|
)
|
(15,242
|
)
|
|
Personnel expenses
|
(Note 23)
|
(6,332
|
)
|
(6,862
|
)
|
(8,098
|
)
|
|
Other expenses
|
(Note 23)
|
(14,399
|
)
|
(15,426
|
)
|
(15,341
|
)
|
|
Depreciation and amortization
|
(Note 23)
|
(9,049
|
)
|
(9,396
|
)
|
(9,649
|
)
|
|
OPERATING INCOME
|
|
6,522
|
|
6,791
|
|
5,469
|
|
|
Share of income (loss) of investments accounted for by the equity method
|
(Note 9)
|
4
|
|
5
|
|
(5
|
)
|
|
Finance income
|
|
1,458
|
|
1,073
|
|
1,770
|
|
|
Exchange gains
|
|
3,389
|
|
3,958
|
|
5,489
|
|
|
Finance costs
|
|
(2,690
|
)
|
(3,363
|
)
|
(4,476
|
)
|
|
Exchange losses
|
|
(3,112
|
)
|
(3,867
|
)
|
(5,002
|
)
|
|
Net financial expense
|
(Note 17)
|
(955
|
)
|
(2,199
|
)
|
(2,219
|
)
|
|
PROFIT BEFORE TAX
|
|
5,571
|
|
4,597
|
|
3,245
|
|
|
Corporate income tax
|
(Note 22)
|
(1,621
|
)
|
(1,219
|
)
|
(846
|
)
|
|
PROFIT FOR THE YEAR
|
|
3,950
|
|
3,378
|
|
2,399
|
|
|
Attributable to equity holders of the Parent
|
|
3,331
|
|
3,132
|
|
2,369
|
|
|
Attributable to non-controlling interests
|
(Note 15)
|
619
|
|
246
|
|
30
|
|
|
Basic and diluted earnings per share attributable to equity holders of the parent (euros)
|
(Note 23)
|
0.57
|
|
0.56
|
|
0.42
|
|
The accompanying notes and appendices are an integral part of these consolidated income statements.
F-6
|
|
2018
|
|
2017
|
|
2016
|
|
|
Millions of euros
|
|
|
|
|||
|
Profit for the year
|
3,950
|
|
3,378
|
|
2,399
|
|
|
Other comprehensive (loss) income
|
(2,390
|
)
|
(4,820
|
)
|
3,363
|
|
|
Gains (losses) from financial assets measured at Fair value through other
comprehensive income
|
9
|
|
26
|
|
(77
|
)
|
|
Income tax impact
|
(3
|
)
|
6
|
|
22
|
|
|
Reclassification of (gains) losses included in the income statement (Note 17)
|
—
|
|
33
|
|
136
|
|
|
Income tax impact
|
—
|
|
—
|
|
(19
|
)
|
|
|
6
|
|
65
|
|
62
|
|
|
Gains (losses) on hedges
|
935
|
|
62
|
|
498
|
|
|
Income tax impact
|
(243
|
)
|
6
|
|
(120
|
)
|
|
Reclassification of (gains) losses included in the income statement (Note 17)
|
(706
|
)
|
162
|
|
54
|
|
|
Income tax impact
|
181
|
|
(40
|
)
|
(14
|
)
|
|
|
167
|
|
190
|
|
418
|
|
|
Gains (losses) on hedges costs
|
51
|
|
—
|
|
—
|
|
|
Income tax impact
|
(13
|
)
|
—
|
|
—
|
|
|
Reclassification of (gains) losses included in the income statement (Note 17)
|
(2
|
)
|
—
|
|
—
|
|
|
Income tax impact
|
1
|
|
—
|
|
—
|
|
|
37
|
|
—
|
|
—
|
|
|
|
Share of (losses) gains recognized directly in equity of associates and others
|
(34
|
)
|
8
|
|
(8
|
)
|
|
Income tax impact
|
1
|
|
(2
|
)
|
3
|
|
|
Reclassification of (gains) losses included in the income statement
|
—
|
|
—
|
|
—
|
|
|
Income tax impact
|
—
|
|
—
|
|
—
|
|
|
|
(33
|
)
|
6
|
|
(5
|
)
|
|
Translation differences (Note 15)
|
(2,602
|
)
|
(5,094
|
)
|
3,176
|
|
|
Total other comprehensive (loss) income recognized for the year (Items that may be reclassified subsequently to profit or loss)
|
(2,425
|
)
|
(4,833
|
)
|
3,651
|
|
|
Actuarial gains (losses) and impact of limit on assets for defined benefit pension plans
|
203
|
|
14
|
|
(378
|
)
|
|
Income tax impact
|
(24
|
)
|
(1
|
)
|
90
|
|
|
|
179
|
|
13
|
|
(288
|
)
|
|
(Losses) gains from financial assets measured at fair value through comprehensive income
|
(133
|
)
|
—
|
|
—
|
|
|
Income tax impact
|
(11
|
)
|
—
|
|
—
|
|
|
(144
|
)
|
—
|
|
—
|
|
|
|
Total other comprehensive income (loss) recognized for the year (Items that will not be reclassified subsequently to profit or loss)
|
35
|
|
13
|
|
(288
|
)
|
|
Total comprehensive income (loss) recognized for the year
|
1,560
|
|
(1,442
|
)
|
5,762
|
|
|
Attributable to:
|
|
|
|
|
|
|
|
Equity holders of the parent and other holders of equity instruments
|
1,513
|
|
(858
|
)
|
4,654
|
|
|
Non-controlling interests
|
47
|
|
(584
|
)
|
1,108
|
|
|
|
1,560
|
|
(1,442
|
)
|
5,762
|
|
The accompanying notes and appendices are an integral part of these consolidated statements of comprehensive income.
F-7
|
CONSOLIDATED STATEMENTS OF CHANGES IN EQUITY
|
Attributable to equity holders of the parent and other holders of equity instruments
|
Non-contro-lling interests (Note 15)
|
|
Total equity
|
|
|||||||||||||||||||||
|
Millions of euros
|
Share capital
|
|
Share premium
|
|
Treasury Shares
|
|
Other equity instru-ments
|
|
Legal reser-ve
|
|
Retained earnings
|
|
Fair value
finan-cial
assets
|
|
Hedges
|
|
Equity of associa-tes and others
|
|
Transla-tion differen-ces
|
|
Total
|
|
||||
|
Financial position at December 31, 2017 (*)
|
5,192
|
|
4,538
|
|
(688
|
)
|
7,518
|
|
987
|
|
14,732
|
|
74
|
|
384
|
|
37
|
|
(15,854
|
)
|
16,920
|
|
9,698
|
|
26,618
|
|
|
Adjustment on initial application of new reporting (Note 15)
|
—
|
|
—
|
|
—
|
|
—
|
|
—
|
|
817
|
|
(305
|
)
|
—
|
|
—
|
|
—
|
|
512
|
|
66
|
|
578
|
|
|
Initial impact of hyperinflation in Argentina
|
—
|
|
—
|
|
—
|
|
—
|
|
—
|
|
(1,114
|
)
|
—
|
|
—
|
|
—
|
|
3,147
|
|
2,033
|
|
—
|
|
2,033
|
|
|
Financial position at January 1, 2018
|
5,192
|
|
4,538
|
|
(688
|
)
|
7,518
|
|
987
|
|
14,435
|
|
(231
|
)
|
384
|
|
37
|
|
(12,707
|
)
|
19,465
|
|
9,764
|
|
29,229
|
|
|
Profit for the year
|
—
|
|
—
|
|
—
|
|
—
|
|
—
|
|
3,331
|
|
—
|
|
—
|
|
—
|
|
—
|
|
3,331
|
|
619
|
|
3,950
|
|
|
Other comprehensive income (loss) for the year
|
—
|
|
—
|
|
—
|
|
—
|
|
—
|
|
181
|
|
(138
|
)
|
176
|
|
7
|
|
(2,044
|
)
|
(1,818
|
)
|
(572
|
)
|
(2,390
|
)
|
|
Total comprehensive income (loss) for the year
|
—
|
|
—
|
|
—
|
|
—
|
|
—
|
|
3,512
|
|
(138
|
)
|
176
|
|
7
|
|
(2,044
|
)
|
1,513
|
|
47
|
|
1,560
|
|
|
Dividends and distribution of profit (Note 15)
|
—
|
|
—
|
|
—
|
|
—
|
|
51
|
|
(2,102
|
)
|
—
|
|
—
|
|
—
|
|
—
|
|
(2,051
|
)
|
(906
|
)
|
(2,957
|
)
|
|
Net movement in treasury shares
|
—
|
|
—
|
|
2
|
|
—
|
|
—
|
|
(1
|
)
|
—
|
|
—
|
|
—
|
|
—
|
|
1
|
|
—
|
|
1
|
|
|
Acquisitions and disposals of non-controlling interests and business combinations (Note 5)
|
—
|
|
—
|
|
—
|
|
—
|
|
—
|
|
232
|
|
—
|
|
—
|
|
—
|
|
—
|
|
232
|
|
139
|
|
371
|
|
|
Undated deeply subordinated securities and notes mandatorily convertible (Note 15)
|
—
|
|
—
|
|
—
|
|
(22
|
)
|
—
|
|
(392
|
)
|
—
|
|
—
|
|
—
|
|
—
|
|
(414
|
)
|
(12
|
)
|
(426
|
)
|
|
Translation effect of financial statements in hyperinflation economies
|
—
|
|
—
|
|
—
|
|
—
|
|
—
|
|
(799
|
)
|
—
|
|
—
|
|
—
|
|
—
|
|
(799
|
)
|
—
|
|
(799
|
)
|
|
Other movements
|
—
|
|
—
|
|
—
|
|
—
|
|
—
|
|
—
|
|
—
|
|
—
|
|
—
|
|
—
|
|
—
|
|
1
|
|
1
|
|
|
Financial position at December 31, 2018
|
5,192
|
|
4,538
|
|
(686
|
)
|
7,496
|
|
1,038
|
|
14,885
|
|
(369
|
)
|
560
|
|
44
|
|
(14,751
|
)
|
17,947
|
|
9,033
|
|
26,980
|
|
(*) The opening balances of "Retained Earnings" and "Translation Differences" have been modified to reflect the change in accounting policy described in Note 2.
The accompanying notes and appendices are an integral part of these consolidated statements of changes in equity.
F-8
|
|
Attributable to equity holders of the parent and other holders of equity instruments
|
Non-contro-lling interests (Note 15)
|
|
Total equity
|
|
|||||||||||||||||||||
|
Millions of euros
|
Share capital
|
|
Share premium
|
|
Treasury Shares
|
|
Other equity instru-ments
|
|
Legal reser-ve
|
|
Retained earnings
|
|
Available-for-sale investments
|
|
Hedges
|
|
Equity of associa-tes and others
|
|
Transla-tion differen-ces
|
|
Total
|
|
|
|
|
|
|
Financial position at December 31, 2016 (*)
|
5,038
|
|
3,227
|
|
(1,480
|
)
|
7,803
|
|
985
|
|
13,928
|
|
9
|
|
191
|
|
31
|
|
(11,575
|
)
|
18,157
|
|
10,228
|
|
28,385
|
|
|
Profit for the year
|
—
|
|
—
|
|
—
|
|
—
|
|
—
|
|
3,132
|
|
—
|
|
—
|
|
—
|
|
—
|
|
3,132
|
|
246
|
|
3,378
|
|
|
Other comprehensive income (loss) for the year
|
—
|
|
—
|
|
—
|
|
—
|
|
—
|
|
16
|
|
65
|
|
193
|
|
6
|
|
(4,270
|
)
|
(3,990
|
)
|
(830
|
)
|
(4,820
|
)
|
|
Total comprehensive income (loss) for the year
|
—
|
|
—
|
|
—
|
|
—
|
|
—
|
|
3,148
|
|
65
|
|
193
|
|
6
|
|
(4,270
|
)
|
(858
|
)
|
(584
|
)
|
(1,442
|
)
|
|
Dividends and distribution of profit (Note 15)
|
—
|
|
—
|
|
—
|
|
—
|
|
2
|
|
(2,021
|
)
|
—
|
|
—
|
|
—
|
|
—
|
|
(2,019
|
)
|
(583
|
)
|
(2,602
|
)
|
|
Net movement in treasury shares
|
—
|
|
—
|
|
35
|
|
—
|
|
—
|
|
—
|
|
—
|
|
—
|
|
—
|
|
—
|
|
35
|
|
—
|
|
35
|
|
|
Acquisitions and disposals of non-controlling interests and business combinations
|
—
|
|
—
|
|
754
|
|
—
|
|
—
|
|
449
|
|
—
|
|
—
|
|
—
|
|
(9
|
)
|
1,194
|
|
649
|
|
1,843
|
|
|
Undated deeply subordinated securities and notes mandatorily convertible (Note 15)
|
154
|
|
1,311
|
|
—
|
|
(285
|
)
|
—
|
|
(443
|
)
|
—
|
|
—
|
|
—
|
|
—
|
|
737
|
|
(12
|
)
|
725
|
|
|
Translation effect of financial statements in hyperinflation economies
|
—
|
|
—
|
|
—
|
|
—
|
|
—
|
|
(328
|
)
|
—
|
|
—
|
|
—
|
|
—
|
|
(328
|
)
|
—
|
|
(328
|
)
|
|
Other movements
|
—
|
|
—
|
|
3
|
|
—
|
|
—
|
|
(1
|
)
|
—
|
|
—
|
|
—
|
|
—
|
|
2
|
|
—
|
|
2
|
|
|
Financial position at December 31, 2017
|
5,192
|
|
4,538
|
|
(688
|
)
|
7,518
|
|
987
|
|
14,732
|
|
74
|
|
384
|
|
37
|
|
(15,854
|
)
|
16,920
|
|
9,698
|
|
26,618
|
|
|
Financial position at December 31, 2015
|
4,975
|
|
3,227
|
|
(1,656
|
)
|
6,803
|
|
984
|
|
18,475
|
|
(53
|
)
|
(231
|
)
|
36
|
|
(16,789
|
)
|
15,771
|
|
9,665
|
|
25,436
|
|
|
Change in accounting policy for the presentation of hyperinflation effects in equity (Note 2)
|
—
|
|
—
|
|
—
|
|
—
|
|
—
|
|
(3,141
|
)
|
—
|
|
—
|
|
—
|
|
3,141
|
|
—
|
|
—
|
|
—
|
|
|
Financial position at January 1, 2016
|
4,975
|
|
3,227
|
|
(1,656
|
)
|
6,803
|
|
984
|
|
15,334
|
|
(53
|
)
|
(231
|
)
|
36
|
|
(13,648
|
)
|
15,771
|
|
9,665
|
|
25,436
|
|
|
Profit for the year
|
—
|
|
—
|
|
—
|
|
—
|
|
—
|
|
2,369
|
|
—
|
|
—
|
|
—
|
|
—
|
|
2,369
|
|
30
|
|
2,399
|
|
|
Other comprehensive income (loss) for the year
|
—
|
|
—
|
|
—
|
|
—
|
|
—
|
|
(267
|
)
|
62
|
|
422
|
|
(5
|
)
|
2,073
|
|
2,285
|
|
1,078
|
|
3,363
|
|
|
Total comprehensive income (loss) for the year
|
—
|
|
—
|
|
—
|
|
—
|
|
—
|
|
2,102
|
|
62
|
|
422
|
|
(5
|
)
|
2,073
|
|
4,654
|
|
1,108
|
|
5,762
|
|
|
Dividends and distribution of profit (Note 15)
|
137
|
|
—
|
|
—
|
|
—
|
|
1
|
|
(2,544
|
)
|
—
|
|
—
|
|
—
|
|
—
|
|
(2,406
|
)
|
(524
|
)
|
(2,930
|
)
|
|
Net movement in treasury shares
|
—
|
|
—
|
|
(637
|
)
|
—
|
|
—
|
|
—
|
|
—
|
|
—
|
|
—
|
|
—
|
|
(637
|
)
|
—
|
|
(637
|
)
|
|
Acquisitions and disposals of non-controlling interests and business combinations (Note 5)
|
—
|
|
—
|
|
—
|
|
—
|
|
—
|
|
—
|
|
—
|
|
—
|
|
—
|
|
—
|
|
—
|
|
(7
|
)
|
(7
|
)
|
|
Capital reduction (Note 15)
|
(74
|
)
|
—
|
|
813
|
|
—
|
|
—
|
|
(739
|
)
|
—
|
|
—
|
|
—
|
|
—
|
|
—
|
|
—
|
|
—
|
|
|
Undated deeply subordinated securities (Note 15)
|
—
|
|
—
|
|
—
|
|
1,000
|
|
−
|
|
(255
|
)
|
−
|
|
−
|
|
−
|
|
−
|
|
745
|
|
(14
|
)
|
731
|
|
|
Translation effect of financial statements in hyperinflation economies
|
—
|
|
—
|
|
—
|
|
—
|
|
—
|
|
(24
|
)
|
—
|
|
—
|
|
—
|
|
—
|
|
(24
|
)
|
—
|
|
(24
|
)
|
|
Other movements
|
—
|
|
—
|
|
—
|
|
—
|
|
—
|
|
54
|
|
—
|
|
—
|
|
—
|
|
—
|
|
54
|
|
—
|
|
54
|
|
|
Financial position at December 31, 2016
|
5,038
|
|
3,227
|
|
(1,480
|
)
|
7,803
|
|
985
|
|
13,928
|
|
9
|
|
191
|
|
31
|
|
(11,575
|
)
|
18,157
|
|
10,228
|
|
28,385
|
|
(*) The opening balances of "Retained Earnings" and "Translation Differences" have been modified to reflect the change in accounting policy described in Note 2.
The accompanying notes and appendices are an integral part of these consolidated statements of changes in equity.
F-9
|
|
|
|
|
|
|||
|
Millions of euros
|
Notes
|
2018
|
|
2017
|
|
2016
|
|
|
Cash received from operations
|
(Note 25)
|
58,815
|
|
63,456
|
|
63,514
|
|
|
Cash paid from operations
|
(Note 25)
|
(42,891
|
)
|
(46,929
|
)
|
(47,384
|
)
|
|
Net payments of interest and other financial expenses net of dividends received
|
(Note 25)
|
(1,636
|
)
|
(1,726
|
)
|
(2,143
|
)
|
|
Taxes paid
|
(Note 25)
|
(865
|
)
|
(1,005
|
)
|
(649
|
)
|
|
Net cash flow provided by operating activities
|
(Note 25)
|
13,423
|
|
13,796
|
|
13,338
|
|
|
(Payments on investments)/proceeds from the sale in property, plant and equipment and intangible assets, net
|
(Note 25)
|
(8,585
|
)
|
(8,992
|
)
|
(9,187
|
)
|
|
Proceeds on disposals of companies, net of cash and cash equivalents disposed
|
(Note 25)
|
29
|
|
40
|
|
767
|
|
|
Payments on investments in companies, net of cash and cash equivalents acquired
|
(Note 25)
|
(3
|
)
|
(128
|
)
|
(54
|
)
|
|
Proceeds on financial investments not included under cash equivalents
|
(Note 25)
|
1,004
|
|
296
|
|
489
|
|
|
Payments on financial investments not included under cash equivalents
|
(Note 25)
|
(965
|
)
|
(1,106
|
)
|
(265
|
)
|
|
(Payments)/proceeds on placements of cash surpluses not included under cash equivalents
|
|
(202
|
)
|
(357
|
)
|
42
|
|
|
Government grants received
|
|
37
|
|
2
|
|
—
|
|
|
Net cash flow used in investing activities
|
(Note 25)
|
(8,685
|
)
|
(10,245
|
)
|
(8,208
|
)
|
|
Dividends paid
|
(Note 25)
|
(2,794
|
)
|
(2,459
|
)
|
(2,906
|
)
|
|
Proceeds from share capital increase
|
(Note 25)
|
—
|
|
2
|
|
—
|
|
|
Proceeds/(payments) of treasury shares and other operations with shareholders and with minority interests
|
(Note 25)
|
379
|
|
1,269
|
|
(660
|
)
|
|
Operations with other equity holders
|
(Note 25)
|
(561
|
)
|
646
|
|
656
|
|
|
Proceeds on issue of debentures and bonds and other debts
|
(Note 25)
|
4,289
|
|
8,390
|
|
5,693
|
|
|
Proceeds on loans, borrowings and promissory notes
|
(Note 25)
|
3,973
|
|
4,844
|
|
10,332
|
|
|
Repayments of debentures and bonds and other debts
|
(Note 25)
|
(4,654
|
)
|
(6,687
|
)
|
(6,873
|
)
|
|
Repayments of loans, borrowings and promissory notes
|
(Note 25)
|
(4,040
|
)
|
(6,711
|
)
|
(8,506
|
)
|
|
Financed operating payments and investments in property, plant and equipment and intangible assets payments
|
(Note 25)
|
(472
|
)
|
(1,046
|
)
|
(1,956
|
)
|
|
Net cash used in financing activities
|
(Note 25)
|
(3,880
|
)
|
(1,752
|
)
|
(4,220
|
)
|
|
Effect of changes in exchange rates
|
|
(244
|
)
|
(341
|
)
|
185
|
|
|
Cash reclassified to assets held for sale
|
(Note 28)
|
(111
|
)
|
—
|
|
—
|
|
|
Effect of changes in consolidation methods and others
|
|
(3
|
)
|
(2
|
)
|
26
|
|
|
Net increase (decrease) in cash and cash equivalents during the year
|
|
500
|
|
1,456
|
|
1,121
|
|
|
CASH AND CASH EQUIVALENTS AT JANUARY 1
|
(Note 14)
|
5,192
|
|
3,736
|
|
2,615
|
|
|
CASH AND CASH EQUIVALENTS AT DECEMBER 31
|
(Note 14)
|
5,692
|
|
5,192
|
|
3,736
|
|
|
RECONCILIATION OF CASH AND CASH EQUIVALENTS WITH THE STATEMENTS OF FINANCIAL POSITION
|
|
|
|
|
|
|
|
|
BALANCE AT JANUARY 1
|
(Note 14)
|
5,192
|
|
3,736
|
|
2,615
|
|
|
Cash on hand and at banks
|
|
3,990
|
|
2,077
|
|
1,278
|
|
|
Other cash equivalents
|
|
1,202
|
|
1,659
|
|
1,337
|
|
|
BALANCE AT DECEMBER 31
|
(Note 14)
|
5,692
|
|
5,192
|
|
3,736
|
|
|
Cash on hand and at banks
|
|
4,886
|
|
3,990
|
|
2,077
|
|
|
Other cash equivalents
|
|
806
|
|
1,202
|
|
1,659
|
|
The accompanying notes and appendices are an integral part of these consolidated statements of cash flows.
F-10
Telefónica, S.A. and subsidiaries composing the Telefónica Group
Notes to the consolidated financial statements (consolidated annual accounts) for the year ended December 31, 2018
Telefónica, S.A. and its subsidiaries and investees (hereinafter also referred to as “Telefónica”, “the Company”, “the Telefónica Group” or "the Group”) make up an integrated and diversified telecommunications group operating mainly in Europe and Latin America. The Group’s activity is centered around services of fixed and wireless telephony, broadband, Internet, data traffic, Pay TV and other digital services.
The parent company of the Group is Telefónica, S.A., a public limited company incorporated on April 19, 1924 for an indefinite period. Its registered office is at calle Gran Vía 28, Madrid (Spain).
Appendix I lists the main companies composing the Telefónica Group, their corporate purpose, country, functional currency, share capital, the Group’s effective shareholding and their method of consolidation.
As a multinational telecommunications company which operates in regulated markets, the Group is subject to different laws and regulations in each of the jurisdictions in which it operates, pursuant to which permits, concessions or licenses must be obtained in certain circumstances to provide the various services. In addition, certain fixed and wireless telephony services are provided under regulated rate and price systems. Key regulatory issues, and concessions and licenses held by the Telefónica Group are detailed in Appendix VI.
F-11
The accompanying consolidated financial statements were prepared from the accounting records of Telefónica, S.A. and each of the companies comprising the Telefónica Group, whose separate financial statements were prepared in accordance with the generally accepted accounting principles applicable in the various countries in which they are located, and for purposes of these consolidated financial statements are presented in accordance with the International Financial Reporting Standards (IFRS) as issued by the International Accounting Standards Board (IASB). These consolidated financial statements give a true and fair view of the consolidated equity and financial position at
December 31, 2018
, and of the consolidated results of operations, changes in consolidated equity and the consolidated cash flows obtained and used in the year then ended, which for the purposes of the Telefónica Group are not different from those adopted by the European Union.
The euro is the Group’s reporting currency. The figures in these consolidated financial statements are expressed in millions of euros, unless indicated otherwise, and may therefore be rounded.
The accompanying consolidated financial statements for the year ended
December 31, 2018
were approved by the Company’s Board of Directors at its meeting on February 20, 2019 for submission for approval at the General Shareholders’ Meeting, which is expected to occur without modification.
Note 3 contains a detailed description of the most significant accounting policies used to prepare these consolidated financial statements.
Materiality criteria
These consolidated financial statements do not include certain information or disclosures that, not requiring presentation due to their qualitative significance, were deemed to be immaterial or of no relevance pursuant to the concepts of
materiality
or
relevance
defined in the IFRS conceptual framework, insofar as the Telefónica Group’s consolidated financial statements, taken as a whole, are concerned.
Comparative information and main changes in the consolidation scope
For comparative purposes, the accompanying consolidated financial statement for 2018 include the figures for 2017, and in the consolidated income statement, the consolidated statement of comprehensive income, the consolidated statement of changes in equity and the consolidated statement of cash flows, and the notes thereto for the year then ended, they also include those of 2016.
The main events and changes in the consolidation scope affecting comparability of the consolidated information for
2018
and
2017
(see Appendix I for a detailed description of the consolidation scope and the changes during the year) are as listed below.
Impact of adopting new accounting standards in 2018
On January 1, 2018 the new IFRS 9 Financial Instruments and IFRS 15 Revenue from Contracts with Customers became effective, resulting in changes in the accounting policies applied in prior periods.
IFRS 15 Revenues from Contracts with Customers
IFRS 15 sets out the requirements for recognizing revenue from contracts with customers. The Group has adopted IFRS 15 using one of the two transition methods allowed: the modified retrospective method, with the cumulative effect from initial application recognized as an adjustment to the opening balance of retained earnings at the date of initial application January 1, 2018, with a corresponding impact in "Non-controlling interests" (see Note 15). Accordingly, the 2017 and 2016 information presented for comparative purposes has not been restated - i.e. it is prepared and presented in accordance with the accounting standards effective at that moment: under IAS 18 Revenue, IAS 11 Construction Contracts and related interpretations.
Under the provisions in IFRS 15, it is possible to elect to apply certain practical expedients to reduce complexity in the application of the new requirements. The main practical expedients applied by the Group are:
•
Completed contracts: not to apply the standard retrospectively to contracts that are completed contracts at January 1, 2018.
F-12
•
Portfolio approach: the Group will apply the requirements of the standard to groups of contracts with similar characteristics (residential customers and small and medium-sized entities, where standard offers are marketed), since, for the cluster identified, the effects do not differ significantly from an application on a contract by contract basis.
The details of the new significant accounting policies and the nature of the main changes to previous accounting policies in relation to revenue recognition under the new model in IFRS 15 are set out in Note 3. The most significant impacts relate to the first-time recognition of contract assets, that, under IFRS 15, lead to the earlier recognition of revenue from the sale of goods, and the capitalization and deferral of the incremental costs of obtaining contracts, that under IFRS 15, result in the later recognition of customer acquisition costs.
The impacts of adopting IFRS 15 on the Group’s financial statements for the year ended December 31, 2018 are set out below:
|
Millions of euros
|
12/31/2018
|
|
12/31/2018
|
|
12/31/2018
|
|
|
ASSETS
|
IFRS 15
|
IAS 18
|
IFRS 15 impact
|
|||
|
A) NON-CURRENT ASSETS
|
90,707
|
|
90,448
|
|
259
|
|
|
Intangible assets
|
16,856
|
|
16,856
|
|
—
|
|
|
Goodwill
|
25,748
|
|
25,748
|
|
—
|
|
|
Property, plant and equipment
|
33,295
|
|
33,295
|
|
—
|
|
|
Investments accounted for by the equity method
|
68
|
|
68
|
|
—
|
|
|
Financial assets and other non-current assets
|
7,109
|
|
6,823
|
|
286
|
|
|
Deferred tax assets
|
7,631
|
|
7,658
|
|
(27
|
)
|
|
B) CURRENT ASSETS
|
23,340
|
|
22,540
|
|
800
|
|
|
Inventories
|
1,692
|
|
1,692
|
|
—
|
|
|
Receivables and other current assets
|
10,579
|
|
9,789
|
|
790
|
|
|
Tax receivables
|
1,676
|
|
1,666
|
|
10
|
|
|
Other current financial assets
|
2,209
|
|
2,209
|
|
—
|
|
|
Cash and cash equivalents
|
5,692
|
|
5,692
|
|
—
|
|
|
Non-current assets classified as held for sale
|
1,492
|
|
1,492
|
|
—
|
|
|
TOTAL ASSETS (A+B)
|
114,047
|
|
112,988
|
|
1,059
|
|
F-13
|
12/31/2018
|
|
12/31/2018
|
|
12/31/2018
|
|
|
|
EQUITY AND LIABILITIES
|
IFRS 15
|
IAS 18
|
IFRS 15 Impact
|
|||
|
A) EQUITY
|
26,980
|
|
26,193
|
|
787
|
|
|
Equity attributable to equity holders of the parent and other holders of equity instruments
|
17,947
|
|
17,262
|
|
685
|
|
|
Equity attributable to non-controlling interests
|
9,033
|
|
8,931
|
|
102
|
|
|
B) NON-CURRENT LIABILITIES
|
57,418
|
|
57,267
|
|
151
|
|
|
Non-current financial liabilities
|
45,334
|
|
45,334
|
|
—
|
|
|
Payables and other non-current liabilities
|
1,890
|
|
1,903
|
|
(13
|
)
|
|
Deferred tax liabilities
|
2,674
|
|
2,510
|
|
164
|
|
|
Non-current provisions
|
7,520
|
|
7,520
|
|
—
|
|
|
C) CURRENT LIABILITIES
|
29,649
|
|
29,528
|
|
121
|
|
|
Current financial liabilities
|
9,368
|
|
9,368
|
|
—
|
|
|
Payables and other-current liabilities
|
15,485
|
|
15,460
|
|
25
|
|
|
Current tax payables
|
2,047
|
|
1,951
|
|
96
|
|
|
Current provisions
|
1,912
|
|
1,912
|
|
—
|
|
|
Liabilities associated with non-current assets classified as held for sale
|
837
|
|
837
|
|
—
|
|
|
TOTAL EQUITY AND LIABILITIES (A+B+C)
|
114,047
|
|
112,988
|
|
1,059
|
|
|
Millions of euros
|
2018
|
2018
|
2018
|
|||
|
INCOME STATEMENTS
|
IFRS 15
|
IAS 18
|
IFRS 15 Impact
|
|||
|
Revenues
|
48,693
|
|
48,728
|
|
(35
|
)
|
|
Depreciation and amortization
|
(9,049
|
)
|
(9,049
|
)
|
—
|
|
|
OPERATING INCOME
|
6,522
|
|
6,446
|
|
76
|
|
|
Share of profit (loss) of investments accounted for by the equity method
|
4
|
|
4
|
|
—
|
|
|
Net financial expense
|
(955
|
)
|
(944
|
)
|
(11
|
)
|
|
PROFIT BEFORE TAX
|
5,571
|
|
5,506
|
|
65
|
|
|
Corporate income tax
|
(1,621
|
)
|
(1,609
|
)
|
(12
|
)
|
|
PROFIT FOR THE PERIOD
|
3,950
|
|
3,897
|
|
53
|
|
|
Attributable to equity holders of the Parent
|
3,331
|
|
3,291
|
|
40
|
|
|
Attributable to non-controlling interests
|
619
|
|
606
|
|
13
|
|
|
Basic and diluted earnings per share attributable to equity holders of the parent (euros)
|
0.57
|
|
0.56
|
|
0.01
|
|
IFRS 9 Financial Instruments
IFRS 9 sets out a new accounting framework for the recognition, classification, measurement and derecognition of financial instruments, impairment losses on financial assets and hedge accounting. The details of the new significant accounting policies and the nature of the main changes to previous accounting policies in relation to financial instruments under the new standard IFRS 9 are set out in Note 3.
Pursuant to the transition provisions in IFRS 9, the Group has elected the exemption not to restate comparative periods to be presented in the year of initial application (i.e. 2017 and 2016 information presented for comparative purposes is prepared and presented in accordance with the accounting standards effective at that moment: under IAS 39 Financial Instruments: Recognition and Measurement, and related interpretations). The difference in the carrying amounts of
F-14
financial assets and financial liabilities resulting from the adoption of the new requirements is recognized in "retained earnings" as of January 1, 2018 (see Note 15).
The main impact of adopting IFRS 9 on the Group’s financial statements resulted in an increase amounting to
221
million euros over the bad debt provision balance and fair value adjustments on customer receivables. In addition to this, financial assets have changed to the new measurement categories under IFRS 9 (see Note 14).
Translation of Telefónica Venezolana’s financial statements
Venezuela has been considered a hyperinflationary economy since 2009. We regularly review the economic conditions in Venezuela and the specific circumstances of our Venezuelan operations. Assessment of the exchange rate that better reflects the economics of Telefónica’s business activities in Venezuela relies on several factors and is performed considering all the information available at each closing date. On August 20, 2018 Venezuela introduced the Bolivar Soberano (VES), which replaced the Bolívar Fuerte (VEF) removing five zeros (1 VES = 100,000 VEF).
In light of the economic environment and in the absence of official rates that are representative of the situation in Venezuela, in 2018 the Group maintained its policy for estimating an exchange rate to match the progression of inflation in Venezuela and attempts to reflect the economic and financial position of the Group’s Venezuelan operations within its consolidated financial statements more accurately (hereinafter, synthetic exchange rate). Thus, the exchange rate used to translate the financial statements of the Venezuelan subsidiaries as of December 31, 2018 amounts to
7,608
VES/USD (
36,115
VEF/USD as of December 31, 2017). The inflation rates applied by the Group to Venezuela for 2018 was
2,106,600%
(
2,874.1%
for 2017).
The official reference exchange rate at December 31, 2018 was
638
VES/USD.
The following table presents the figures of Telefónica Venezolana in certain items of the consolidated income statement, the consolidated statement of cash flows and the consolidated statement of financial position of the Telefónica Group for 2018, applying the synthetic exchange rate:
|
Millions of euros
|
2018
|
2017
|
||
|
Revenues
|
18
|
|
106
|
|
|
Operating income before depreciation and amortization (OIBDA)
|
3
|
|
34
|
|
|
Depreciation and amortization
|
(67
|
)
|
(103
|
)
|
|
Financial result
(1)
|
216
|
|
81
|
|
|
Profit before tax
|
152
|
|
9
|
|
|
Income tax
(2)
|
(186
|
)
|
(138
|
)
|
|
Result for the period
|
(34
|
)
|
(129
|
)
|
|
Net cash flow provided by operating activities
|
7
|
|
35
|
|
|
Capital expenditures (CapEx)
|
2
|
|
9
|
|
|
Non-current assets
|
238
|
|
295
|
|
(1) The financial result due to the hyperinflation adjustment to the net monetary position and from the exchange differences arising from foreign currency items held by Telefónica Venezolana (see Note 17) amounted to
219
million euros in 2018 (
84 million
euros in 2017).
(2) Deferred tax recognized for the inflation adjustments of the net assets, which are not deductible according to the present tax regime in Venezuela.
Change in accounting policy for the presentation of hyperinflation effects in equity
F-15
As a result of the consideration of Argentina as a hyperinflationary economy since July 2018 with retrospective effect to January 1 of that year, the Group has revisited its presentation policy for the equity effects of the hyperinflation situation that currently affects the Argentine and Venezuelan (since 2009) economies.
In order to present more relevant and reliable information, the Group includes in a single line item all the equity effects derived from hyperinflation, i.e.: (a) the restatement for inflation of the financial statements of the Group companies operating in hyperinflationary economies, and (b) the effects of translating their respective financial statements into euros using the exchange rate at the end of the period. The Group has decided to show these effects within reserves rather than presenting them under Translation Differences within Other Comprehensive Income, since it considers that this presentation criterion provides more reliable information for several reasons. In a market that operates according to the fundamentals of economic theory, the evolution of the currency exchange rate should offset changes in the purchasing power of the local currency derived from inflation. However, in hyperinflationary economies this is not always the case. For example, in the case of Venezuela, these effects are not offset because the official rates are not representative of the evolution of the country's inflation rates (reason why the Group estimates a synthetic exchange rate that contributes to a faithful presentation of the economic and financial situation of its Venezuelan operations, as explained above). In addition, these equity movements are not generated by the companies’ activities, but arise from an accounting restatement, marked in turn by the evolution of the aforementioned economic metrics that are alien to the companies' performance.
This change in the presentation criteria implies a reclassification from Translation Differences to Retained Earnings, and therefore the consolidated net equity remains unchanged. In accordance with IAS 8, financial information from previous years presented for comparative purposes has been restated so that the information is comparable. Consequently, the Translation Differences line item no longer includes the accumulated effects arising from hyperinflation in Venezuela, which have been reclassified for an amount of
3,141
million euros,
3,165
million euros and
3,493
million euros, at 1 January 2016, 31 December 2016 and 31 December 2017, respectively.
As this change in accounting policy is a reclassification within equity, the basic and diluted earnings per share figures are not affected in any of the periods presented.
Hyper-inflation in Argentina
In the recent years, the Argentine economy has shown high rates of inflation. Therefore, the Group has periodically assessed the quantitative and qualitative indicators of inflation in the country. Although inflation data has not been consistent in recent years and several indexes have coexisted, inflation in Argentina increased significantly in the second quarter of 2018 and data indicates that the
three
-year
cumulative inflation recently exceeded
100%
, which is the quantitative reference established by IAS 29 Financial Reporting in Hyperinflatioary Economies. As a result, Argentina is considered a hyperinflationary economy in 2018 and the Group applies hyper-inflation accounting to its companies whose functional currency is the Argentine peso for financial information for periods ended after July 1, 2018.
The main implications are as follows:
|
•
|
Adjustment of the historical cost of non-monetary assets and liabilities and equity items from their date of acquisition, or the date of inclusion in the consolidated statement of financial position, to the end of the year, in order to reflect changes in the currency’s purchasing power caused by inflation.
|
|
•
|
The gain or loss on the net monetary position caused by the impact of inflation in the year is included in the income statement.
|
|
•
|
Items in the income statement and in the statement of cash flows are adjusted by the inflation index since their origination, with a balancing entry in financial results within the statement of income and a reconciling item in the statement of cash flows, respectively.
|
|
•
|
All items in the financial statements of the Argentine companies are translated at the closing exchange rate, which at December 31, 2018 was
43.30
Argentine pesos per euro.
|
|
•
|
Figures for financial years prior to 2018 are not restated.
|
The main impacts in the consolidated financial statements of the Telefónica Group for the year 2018 of the aforementioned adjustments, are shown below:
F-16
|
Millions of euros
|
Impact of the application of hyperinflation adjustments in 2018
|
|
|
Revenues
|
(313
|
)
|
|
Operating income before depreciation and amortization (OIBDA)
|
(148
|
)
|
|
Depreciation and amortization
|
(160
|
)
|
|
Net result
|
(306
|
)
|
|
Capital expenditures (CapEx)
|
(70
|
)
|
|
Total equity
|
1,750
|
|
|
Non-current assets
|
2,012
|
|
Pursuant to the accounting policy described in the previous section, all the equity effects derived from hyperinflationary presented in Retained Earnings. As of 1 January 2018 the total impact in net equity amounts to
2,033
million euros, which includes the transferral of
3,147
million euros of translation differences arisen prior to the consideration of the economy as hyperinflationary, as a consequence of the full retrospective application of IAS 29.
Capital increase in Coltel, termination of the operating agreement with the PARAPAT and arbitration award
Colombia Telecomunicaciones, S.A. E.S.P. (Coltel) is a company in which Telefónica holds
67.5%
and the Colombian Government the remaining
32.5%
(see Note 26.c).
On August 29, 2017, the shareholders' meeting of Coltel approved:
|
•
|
a capital increase for an aggregate amount of
4,800,966 million
Colombian pesos (capital and premium),
1,384 million
euros at the exchange rate of the relevant transaction date, so that Coltel would voluntarily pre-pay the entire amount of Coltel's debt derived from the operating agreement dated August 13, 2003 with Patrimonio Autónomo Receptor de Activos de la Empresa Nacional de Telecomunicaciones (PARAPAT).
|
The Telefónica Group and the Colombian Government subscribed to the PARAPAT-Capital Increase pro rata to their respective shareholding in Coltel (see Note 15.i). The Telefónica Group disbursed
3,240,652 million
Colombian pesos,
934 million
euros at the exchange rate of the relevant transaction date. The Colombian Government assumed
32.5%
of Coltel's payment obligations with PARAPAT.
The PARAPAT Capital Increase was subscribed to on September 26, 2017 and, on September 27, 2017, Coltel pre-paid all its debt with PARAPAT, whereby acquiring ownership of PARAPAT-related assets.
As part of the early termination of the operating agreement with PARAPAT, Coltel acquired control (see Note 5) of the companies Empresa de Telecomunicaciones de Telebucaramanga S.A. ESP (Telebucaramanga), Metropolitana de Telecomunicaciones S.A. ESP (Metrotel) and Operaciones Tecnológicas y Comerciales S.A.S. (Optecom), for a combined total of
509,975 million
Colombian pesos (approximately
147 million
euros at the date of the transaction).
|
•
|
a capital increase for an aggregate amount of
1,651,012 million
Colombian pesos (capital and premium),
470 million
euros at the exchange rate on that date.
|
The proceeds from the Arbitration Award-Capital Increase were used to pay the entire amount set forth in the arbitration award issued in the arbitration proceedings initiated by the ITC in connection with its intention to revert certain assets earmarked for the provisions of mobile voice services under former concessions (see Note 6 and Appendix VI).
The Telefónica Group and the Colombian Government subscribed the Arbitration Award-Capital Increase pro rata to their respective shareholding in Coltel. The Telefónica Group disbursed
1,114,433 million
Colombian pesos,
317 million
euros at the exchange rate on the relevant transaction date. The Colombian Government assumed and consequently offset a portion of Coltel's debt.
Individual Suspension Plan
F-17
In 2015 Telefónica de España, S.A.U., Telefónica Móviles España, S.A.U. and Telefónica Soluciones de Informática y Comunicaciones de España, S.A.U. signed the 1st Collective Bargaining Agreement of Related Companies (CEV), wholly backed by the largest labor unions. One element contemplated in this agreement, was a plan of measures for individual suspension of the employment relationship in 2016 and 2017, applying principles of voluntariness, universality, non-discrimination and social responsibility.
The provision was updated in 2018 and 2017 according to the degree of adhesion to the Plan, which, together with the updated termination plans, entailed an expense of
297
and
165
million euros in the 2018 and 2017 consolidated income statement, respectively
(see Note 21).
Court proceedings in favor of Telefónica Brasil which recognizes the right to exclude ICMS (VAT) from the basis of calculation of the contributions to PIS and COFINS
In 2018 two final decisions in favor of Telefónica Brazil were passed, which recognized the right to deduct the state tax on goods and services (ICMS) from the calculation basis of the Social Integration Program-PIS (Programa de Integração Social) and the Financing of Social Security-COFINS (Contribuição para Financiamento da Seguridade Social).
Once the values were determined, Telefónica Brazil presented to the tax authorities a refund request for the payments of PIS/COFINS affected by the judicial decision, together with the corresponding default interest. The total amount amounted to
6,240
million Brazilian reals (around
1,454
million euros at an average exchange rate of 2018). The impact on the consolidated income statement amounted to
3,386
million Brazilian reals (
789
million euros), reducing the “Taxes” item under “Other expenses” (Note 23), and
2,854
million Brazilian reals (
665
million euros) under “Finance Income” (Note 17).
The outstanding credit at December 31, 2018 (Note 11) amounted to
4,915
million Brazilian reals (
1,107
million euros at the closing exchange rate for 2018).
Sale of non-controlling interests in Telxius
On July 27, 2018 Telefónica transferred to a company of the Pontegadea Group ("Pontegadea")
16.65%
of the share capital of the Telefónica´s subsidiary Pontel Participaciones, S.L. ("Pontel") that owns
60%
of the share capital of the company Telxius Telecom, S.A. ("Telxius"), for an amount of
378.8
million euros, which entailed a price of
15.2
euros per share of Telxius. This participation of
16.65%
in the capital stock of Pontel is equivalent, in economic terms, to an indirect participation of
9.99%
in the share capital of Telxius. The impact of this transaction in the equity attributable to equity holders of the parent amounted to
232
million euros, being the impact to non-controlling interest of
139
million euros.
On October 24, 2017, Telefónica transferred
62
million shares of Telxius (representing
24.8%
per cent of its share capital) to Taurus Bidco S.à.r.l. (hereinafter, KKR, an entity managed by Kohlberg Kravis Roberts & Co. L.P.) in exchange for
790.5
million euros.
On November 13, 2017, KKR exercised a call option on
38
million shares of Telxius (representing
15.2%
of its share capital) in exchange for
484.5
million euros (see Note 5).
Following the closing of this sale of
15.2%
of the share capital of Telxius, in December 2017, together with the
24.8%
of the share capital acquired in October, the total stake of KKR is
40%
of the share capital of Telxius in exchange for an aggregate amount of
1,275
million euros (see Note 25). These transactions had no impact on the consolidated results of the Telefónica Group, since they comprised the sale of minority interests and Telefónica retained control over Telxius. The impact of these transactions in equity attributable to equity holders of the parent was an increase of
570
million euros in retained earnings and a decrease of
9
million euros in translation differences. In addition, there was an increase in equity attributable to non-controlling interests amounting to
690
million euros (see Note 15).
F-18
As stated in Note 2, the Group’s consolidated financial statements have been prepared in accordance with IFRSs and interpretations issued by the International Accounting Standards Board (IASB).
Accordingly, only the most significant accounting policies used in preparing the accompanying consolidated financial statements, in light of the nature of the Group’s activities, are set out below, as well as the accounting policies applied where IFRSs permit a policy choice, and those that are specific to the sector in which the Group operates.
a) Hyperinflationary economies
Venezuela is considered as a hyperinflationary economy since 2009. The inflation rates used to prepare the financial information are the “Indice Nacional de Precios al Consumidor de Venezuela”, published by the Central Bank of Venezuela, or the best estimate in case the final index is not available. On an annual basis, these rates are
2,106,600%
,
2,874.1%
and
511.1%
for
2018
,
2017
and
2016
, respectively.
The exchange rate used to translate inflation-adjusted bolivar-denominated items is the exchange rate as of the closing date of each reporting period, amounting to
7,608
bolivars per U.S. dollar (synthetic exchange rate, see Note 2),
36,115.28
bolivars per U.S. dollar (synthetic exchange rate) and
673.762
bolivars per U.S. dollar (DICOM) as of
December 31, 2018
,
2017
and
2016
, respectively.
For the first time in 2018 Argentina is considered a hyperinflationary economy (see Note 2). In order to restate its financial statements, the Company uses the the series of indices defined by resolution JG No. 539/18 issued by the Federación Argentina de Consejos Profesionales de Ciencias Económicas (FACPCE), based on the National Consumer Price Index (IPC) published by the Instituto Nacional de Estadística y Censos (INDEC) of the Argentine Republic and the Wholesale Internal Price Index (IPIM) published by FACPCE. The cumulative index at 31 December 2018 is
184.85%
, while on an annual basis the index for 2018 is
48%
.
The exchange rate used to translate inflation-adjusted items denominated in Argentine pesos in the 2018 financial statements is the closing exchange rate as of December 31, which was
43.30
pesos per euro.
b) Translation methodology
The income statements and statements of cash flows of the Group’s foreign subsidiaries (except Venezuela and Argentina) were translated into euros at the average exchange rates for the year, as a rate that approximates the exchange rates at the dates of the transactions.
c) Goodwill
After initial recognition, goodwill is carried at cost, less any accumulated impairment losses. Goodwill is recognized as an asset denominated in the currency of the company acquired and is tested for impairment annually or more frequently, if there are certain events or changes indicating the possibility that the carrying amount may not be fully recoverable. The potential impairment loss is determined by assessing the recoverable amount of the cash generating unit (or group of cash generating units) to which the goodwill is allocated from the acquisition date.
d) Intangible assets
Intangible assets are carried at acquisition or production cost, less any accumulated amortization or any accumulated impairment losses.
Intangible assets are amortized on a straight-line basis according to the following:
|
•
|
Licenses granted to the Telefónica Group by various public authorities to provide telecommunications services and the value allocated to licenses held by certain companies at the time they were included in the Telefónica Group (“Service concession arrangements and licenses”) are amortized on a straight-line basis over the duration of related licenses from the moment commercial operation begins.
|
|
•
|
The allocation of acquisition costs attributable to customers acquired in business combinations, as well as the acquisition value of this type of assets in a third-party transaction for consideration (“Customer base”) are amortized on a straight-line basis over the estimated period of the customer relationship. The term length is
|
F-19
between
5
to
14
years, based on the customer segment (residential, business, etc.) and the business model (prepaid, postpaid, etc.).
|
•
|
Software is amortized on a straight-line basis over its useful life, generally estimated to be between
two
and
five years
.
|
e) Property, plant and equipment
Property, plant and equipment is carried at cost less any accumulated depreciation and any accumulated impairment in value.
Cost includes, among others, direct labor used in installation and the allocable portion of the indirect costs required for the related asset. The latter two items are recorded as revenue under the concept “Own work capitalized” of the line item “Other income”.
Interest and other financial expenses incurred and directly attributable to the acquisition or construction of qualifying assets are capitalized. Qualifying assets for the Telefónica Group are those assets that require a period of at least
18
months to bring the assets to the condition necessary for their intended use or sale.
The Group’s subsidiaries depreciate their property, plant and equipment, from the time they can be placed in service, amortizing the cost of the assets, net of their residual values on a straight-line basis over the assets’ estimated useful lives, which are calculated in accordance with technical studies that are revised periodically in light of technological advances and the rate of dismantling, as follows:
|
Years of estimated
useful life |
|
|
Buildings
|
25 – 40
|
|
Plant and machinery
|
10 – 15
|
|
Telephone installations, networks and subscriber equipment
|
5 – 20
|
|
Furniture, tools and other items
|
2 – 10
|
f) Impairment of non-current assets
Non-current assets, including goodwill and intangible assets are assessed at each reporting date for indicators of impairment. Whenever such indicators exist, or in the case of assets which are subject to an annual impairment test, the recoverable amount is estimated. An asset’s recoverable amount is the higher of fair value less costs to sell and value in use. In assessing value in use, the estimated future post-tax cash flows deriving from the use of the asset or its cash generating unit, as applicable, are discounted to their present value using a post-tax discount rate that reflects current market assessments of the time value of money and the risks specific to the asset, whenever the result obtained is the same that would be obtained by discounting pre-tax cash flows at a pre-tax discount rate.
The Group bases the calculation of impairment on the approved business plans of the various cash generating units to which the assets are allocated. The projected cash flows, based on the approved strategic business plans, cover a period of five years. Starting with the sixth year, an expected constant growth rate is applied
.
g) Lease agreements
The determination of whether an arrangement is, or contains a lease is based on the substance of the agreement and requires an assessment of whether the fulfillment of the arrangement is dependent on the use of a specific asset and the agreement conveys a right to the use of the asset.
Leases where the lessor does not transfer substantially all the risks and benefits of ownership of the asset are classified as operating leases.
Leases are classified as finance leases when the terms of the lease transfer substantially all the risks and rewards incidental to ownership of the leased item to the Group.
h) Investment in associates and joint arrangements
F-20
The Group assesses whether it has significant influence not only on the basis of its ownership percentage but also on the existence of qualitative factors such as representation on the board of directors of the investee, its participation in decision-making processes, interchange of managerial personnel and access to technical information.
The Group assesses rights and obligations agreed to by the parties to a joint arrangement and, when relevant, other facts and circumstances in order to determine whether the joint arrangement in which it is involved is a joint venture or a joint operation.
i) Financial assets and liabilities
Financial Assets
All regular way purchases and sales of financial assets are recognized in the statement of financial position on the trade date, i.e. the date that the Company commits to purchase or sell the asset.
The Group applies an impairment model for financial assets based on expected credit losses, using a simplified method for certain short- and long-term assets (commercial receivables, lease receivables and contractual assets). Under this simplified approach, credit impairment is recognized by reference to expected losses over the life of the asset.
Derivative financial instruments and hedge accounting
The accounting treatment of any gain or loss resulting from changes in the fair value of a derivative depends on whether the derivative in question meets all the criteria for hedge accounting and, if appropriate, on the nature of the hedge.
Changes in fair value of derivatives that qualify as fair value hedging instruments are recognized in the income statement, together with changes in the fair value of the hedged asset or liability attributable to the risk being hedged.
Changes in the fair value of derivatives that qualify and have been designated as cash flows hedges, which are highly effective, are recognized in equity. The ineffective portion is recognized immediately in the income statement. Fair value changes recognized in equity arising from hedges that relate to firm commitments or forecast transactions that result in the recognition of non-financial assets or liabilities are included in the initial carrying amount of those assets or liabilities. Otherwise, changes in fair value previously recognized in equity are recognized in the income statement in the period in which the hedged transaction affects profit or loss.
An instrument designated to hedge foreign currency exposure from a net investment in a foreign operation is accounted for in a similar manner to cash flow hedges.
When the Group chooses not to apply hedge accounting criteria, gains or losses resulting from changes in the fair value of derivatives are taken directly to the income statement. In this respect, transactions used to reduce the exchange rate risk of income contributed by foreign subsidiaries are not treated as hedging transactions.
j) Inventories
Materials stored for use in investment projects and inventories for consumption and replacement are valued at the lower of weighted average cost and net realizable value.
k) Pensions and other employee obligations
Provisions required to cover the accrued liability for defined-benefit pension plans are determined using “the projected unit credit” actuarial valuation method. The calculation is based on demographic and financial assumptions determined at a country level, and in consideration of the macroeconomic environment. The discount rates are determined based on high quality market yield curves. Plan assets are measured at fair value.
Provisions for post-employment benefits (e.g. early retirement or other) are calculated individually based on the terms agreed with the employees. In some cases, these may require actuarial valuations based on both demographic and financial assumptions.
l) Revenue and expenses
The Telefónica Group revenues are derived principally from providing the following telecommunications services: traffic, connection fees, regular (normally monthly) network usage fees, interconnection, network and equipment leasing,
F-21
handset sales and other digital services such as Pay TV and value-added services or maintenance. Products and services may be sold separately or bundled in promotional packages.
Revenues from calls carried on Telefónica’s networks (traffic) entail an initial call establishment fee plus a variable call rate, based on call length, distance and type of service. Both fixed and wireless traffic is recognized as revenue as service is provided. For prepaid calls, the amount of unused traffic generates a deferred revenue presented in “Contractual liabilities” on the statement of financial position. Prepaid cards generally expire within
12
months and any deferred revenue from prepaid traffic is recognized directly in the income statement when the card expires as the Group has no obligation to provide service after expiry date.
Revenues from traffic sales and services at a fixed rate over a specified period of time (flat rate) are recognized on a straight-line basis over the term covered by the rate paid by the customer.
Installation fees are taken to the income statement on a straight-line basis over the related period. Equipment leases and other services are taken to profit or loss as they are consumed.
Interconnection revenues from fixed-wireless and wireless-fixed calls and other customer services are recognized in the period in which the calls are made.
Revenues from handset and equipment sales are recognized once the sale is considered complete, i.e., generally when delivered to the end customer.
For bundled packages that include multiple elements sold in the fixed, wireless, Internet and television businesses it is determined whether it is necessary to separate the separately identifiable elements and apply the corresponding revenue recognition policy to each element. Total package revenue is allocated among the identified elements based on their respective standalone selling prices.
As connection or initial activation fees, or upfront non-refundable fees, are not separately identifiable elements in these types of packages, any revenues received from the customer for these items are allocated to the remaining elements.
Expenses relating to customer contracts are recognized as an asset to the extent that they are incremental and are expected to be recovered, with subsequent amortization over the same term as the revenue associated with such contract, unless the expected amortization period is one year or less, in which case they are expensed as incurred.
m) Use of estimates
The key assumptions concerning the future and other relevant sources of uncertainty in estimates at the reporting date that could have a significant impact on the consolidated financial statements within the next financial year are discussed below.
A significant change in the facts and circumstances on which these estimates and related judgments are based could have a material impact on the Group’s results and financial position. Accordingly, sensitivity analyzes are disclosed for the most relevant situations (see Notes 7 and 21).
Property, plant and equipment, intangible assets and goodwill
The accounting treatment of investments in property, plant and equipment and intangible assets entails the use of estimates to determine the useful life for depreciation and amortization purposes and to assess fair value at their acquisition dates for assets acquired in business combinations.
Determining useful life requires making estimates in connection with future technological developments and alternative uses for assets. There is a significant element of judgment involved in making technological development assumptions, since the timing and scope of future technological advances are difficult to predict.
The decision to recognize an impairment loss involves developing estimates that include, among others, an analysis of the causes of the potential impairment, as well as its timing and expected amount. Furthermore, additional factors, such as technological obsolescence, the suspension of certain services and other circumstantial changes, which highlight the need to evaluate a possible impairment, are taken into account.
The Telefónica Group evaluates its cash-generating units’ performance regularly to identify potential goodwill impairments. Determining the recoverable amount of the cash-generating units to which goodwill is allocated also entails the use of assumptions and estimates and requires a significant element of judgment.
F-22
Deferred income taxes
The Group assesses the recoverability of deferred tax assets based on estimates of future earnings, and of all the options available to achieve an outcome, it considers the most efficient one in tax terms within the legal framework the Group is subject to. Such recoverability ultimately depends on the Group’s ability to generate taxable earnings over the period for which the deferred tax assets remain deductible. This analysis is based on the estimated schedule for reversing deferred tax liabilities, as well as estimates of taxable earnings, which are sourced from internal projections that are continuously updated to reflect the latest trends.
The recognition of tax assets and liabilities depends on a series of factors, including estimates as to the timing and realization of deferred tax assets and the projected tax payment schedule. Actual Group company income tax receipts and payments could differ from the estimates made by the Group as a result of changes in tax legislation, the outcome of underway tax proceedings or unforeseen future transactions that could affect tax balances.
Provisions
Provisions are recorded when, at the end of the period, we have a present obligation as a result of past events, whose settlement requires an outflow of resources that is considered probable and can be measured reliably. This obligation may be legal or constructive, arising from, but not limited to, regulation, contracts, common practice or public commitments, which have created a valid expectation for third parties that we will assume certain responsibilities. The amount recorded is the best estimation performed by the management in respect of the expenditure that will be required to settle the obligations, considering all the information available at the closing date, including the advice of external experts, such as legal advisors or consultants.
Should we be unable to reliably measure the obligation, no provision would be recorded and information would then be presented in the notes to the Consolidated Financial Statements.
Because of the inherent uncertainties in this estimation, actual expenditures may be different from the originally estimated amount recognized.
Revenue recognition
Bundled offers
Bundled offers that combine different elements are assessed to determine whether it is necessary to separate the different identifiable components and apply the corresponding revenue recognition policy to each element. Total package revenue is allocated among the identified elements based on their respective standalone selling prices.
Determining standalone selling prices for each identified element requires estimates that are complex due to the nature of the business.
A change in estimates of standalone selling prices could affect the apportionment of revenue among the elements and, as a result, the timing of recognition of revenues.
Exchange rate and inflation rates used to translate the financial statements of our Venezuelan subsidiaries
We review, on a regular basis, the economic conditions in Venezuela and the specific circumstances of our Venezuelan operations. In light of the worsening of the economic and political crisis in Venezuela and in the absence of official rates that are representative of the situation in such country, at December 31, 2018 the Group maintains its policy to estimate an exchange rate that matches the progression of inflation in Venezuela and contributes to reflect the economic and financial position of the Group’s Venezuelan operations within its consolidated financial statements in a more accurate way.
Assessment of the exchange rate that best reflects the economics of Telefónica’s business activities in Venezuela relies on several factors and is performed considering all the information available at the closing date, and entails the use of assumptions and estimates and significant management judgment.
Due to inherent uncertainties in the estimates required to determine the appropriate exchange rate for the conversion of Venezuelan bolivar-denominated financial statements, actual cash flows denominated in such currency may differ from the amounts currently recognized on the basis of our estimates, as a result of changes in currency laws or changes in exchange mechanisms or published exchange rates that may have an impact on the conversion rate used for our
F-23
Venezuelan subsidiaries’ financial statements, affecting the net monetary position of Venezuelan bolivar-denominated assets (liabilities).
In addition to this, Venezuela is considered as a hyperinflationary economy since 2009. Telefónica recognizes the effects of inflation by restating the financial information of its Venezuelan operation using the “Indice Nacional de Precios al Consumidor de Venezuela” issued by the Central Bank of Venezuela, or the best estimate in case the final index is not available.
Significant management judgment is required to determine the appropriate inflation rate where the official rate is not available. The estimates and underlying assumptions are based on careful consideration of factors that are considered to be relevant and rely on all the information available at the closing date. Actual results may differ from these estimates as a result of changes in circumstances and assumptions about future developments in Venezuela due to evolving market conditions, uncertainty about currency and operating restrictions or other circumstances arising beyond the control of the Company.
n) New IFRS and interpretations of the IFRS Interpretations Committee (IFRIC)
The accounting policies applied in the preparation of the consolidated financial statements for the year ended
December 31, 2018
are consistent with those used in the preparation of the Group’s consolidated annual financial statements for the year ended
December 31, 2017
, with the exception of the following new standards and amendments to existing standards issued by the IASB and adopted by the European Union for application in Europe, which are mandatory for annual periods beginning on or after 1 January 2018:
|
•
|
IFRS 9 Financial Instruments
|
IFRS 9 sets out the requirements for recognizing and measuring financial assets and financial liabilities. This new standard includes:
|
a.
|
a model for classifying financial assets that is driven by an asset’s cash flow characteristics and the business model in which it is held. IFRS 9 simplifies the previous measurement model for financial assets and establishes three main categories: amortized cost, fair value through profit or loss and fair value through Other Comprehensive Income (OCI).
|
|
b.
|
a model for classifying financial liabilities, where there are no significant changes from the criteria applied in prior periods.
|
|
c.
|
a new model for impairment losses on financial assets not measured at fair value through profit or loss, i.e. the expected credit loss model, which replaces the incurred loss model applied previously. Under this new impairment model entities are required to account for expected credit losses upon initial recognition of financial assets.
|
|
d.
|
a new hedge accounting model, less restrictive, that more closely aligns the accounting treatment with the entity’s risk management activities, requiring an economic relationship between the hedged item and the hedging instrument and requiring that the coverage ratio be the same as that applied by the entity for its risk management. The new standard modifies the criteria for documentation of hedging relationships and includes enhanced disclosure requirements about risk management activity.
|
Information on the impact of initially applying this standard is disclosed in Note 2
.
|
•
|
IFRS 15 Revenues from Contracts with Customers
|
IFRS 15 establishes a comprehensive framework for determining when to recognize revenue and how much revenue to recognize. The core principle is that an entity should recognize revenue to depict the transfer of promised goods or services to the customer in an amount that reflects the consideration to which the entity expects to be entitled in exchange for those goods or services. The main changes introduce by the new standard are as follows:
|
a.
|
Under IFRS 15, for bundled packages that combine multiple fixed, wireless, data, Internet or television goods or services, the total revenue is allocated to each performance obligation based on their standalone selling prices in relation to the total consideration of the package and is recognized when (or as) the obligation is satisfied, regardless of whether there are undelivered items. This differs from previous accounting where the
|
F-24
portion of the total consideration that was contingent upon delivery of undelivered elements was not allocated to delivered elements. Consequently, when bundles include a discount on equipment, the adoption of these new requirements results in an increase of revenues recognized from the sale of handsets and other equipment, generally recognized upon delivery to the end customer, in detriment of ongoing service revenue over subsequent periods. The difference between the revenue from the sale of equipment and the consideration received from the customer upfront is recognized as a contract asset on the statement of financial position.
|
b.
|
IFRS 15 requires the recognition of an asset for those incremental costs (sales commissions and other third party acquisition costs) directly related with obtaining a contract and that are expected to be recovered. These are subsequently amortized over the same period as the revenue associated with such asset. Costs to obtain a contract are expensed when incurred if the Group estimates that their amortization period is one year or less.
|
|
c.
|
IFRS 15 sets out more detailed requirements on how to account for contract modifications. Certain changes must be accounted for as a retrospective change (i.e. as a continuation of the original contract), while other modifications must be accounted for prospectively as separate contracts, like the end of the original contract and the creation of a new one.
|
|
d.
|
IFRS 15 requires separate recognition of significant financing components in contracts with customers. The Group does not consider significant the financing component where the period between the transfer of goods or services to the customer and payment by the customer does not exceed one year.
|
Information on the impact of initially applying this standard is disclosed in Note 2.
|
•
|
Amendments to IFRS 2, Classification and Measurement of Share-based Payment Transactions
|
These amendments contain requirements on the accounting for:
|
a.
|
the effects of vesting and non-vesting conditions on the measurement of cash-settled share-based payments;
|
|
b.
|
the classification of a share-based payment transaction with a net settlement feature for withholding tax obligations; and
|
|
c.
|
accounting where a modification to the terms and conditions of a share-based payment that changes the classification of the transaction from cash-settled to equity-settled.
|
The application of these amendments did not have a significant impact on the Group’s consolidated financial position or results.
|
•
|
Amendments to IAS 40, Transfers of Investment Property
|
This amendment clarifies when an entity should transfer property (including property under construction or development) into, or out of investment property. The amendments state that a change in use occurs when the property meets, or ceases to meet, the definition of investment property and there is evidence of the change in use. A mere change in management’s intentions for the use of a property does not provide evidence of a change in use. The application of these amendments did not have a significant impact on the Group’s consolidated financial position or results.
|
•
|
Annual Improvements to IFRS Standards 2014-2016 Cycle
|
The annual improvements projects provide a vehicle for making non-urgent but necessary amendments to IFRSs, with the aim of removing inconsistencies and clarifying wording. The amendment relating to the measurement of an associate or joint venture at fair value clarifies that entities that elect to measure investments in joint ventures and associates at fair value through profit or loss may make this election separately for each associate or joint venture. The application of these amendments did not have a significant impact on the Group’s consolidated financial position or results.
|
•
|
IFRIC 22 Foreign Currency Transactions and Advance Consideration
|
This new interpretation clarifies that, in determining the spot exchange rate to use on initial recognition of the related asset, expense or income (or part of it) on the derecognition of a non-monetary asset or non-monetary liability relating to advance consideration in a foreign currency, the date of the transaction is the date on which an entity initially recognizes the non-monetary asset or non-monetary liability arising from the advance consideration. If there are
F-25
multiple payments or receipts in advance, then the entity must determine a date of the transactions for each payment or receipt of advance consideration. The application of this interpretation did not have a significant impact on the Group’s consolidated financial position or results.
New standards and amendments to standards issued but not effected as of
December 31, 2018
.
At the date of preparation of the consolidated financial statements, the following IFRS and amendments had been published, but their application was not mandatory:
|
Standards and amendments
|
Mandatory application: annual periods beginning on or after
|
|
|
IFRS 16
|
Leases
|
January 1, 2019
|
|
IFRIC 23
|
Uncertainty over Income Tax Treatments
|
January 1, 2019
|
|
Amendments to IFRS 9
|
Prepayment Features with Negative
Compensation |
January 1, 2019
|
|
Amendments to IAS 19
|
Plan Amendment, Curtailment or Settlement
|
January 1, 2019
|
|
Amendments to IAS 28
|
Long-term Interests in Associates and Joint Ventures
|
January 1, 2019
|
|
Improvements to IFRS Standards 2015-2017 Cycle
|
January 1, 2019
|
|
|
Amendments to References to the Conceptual Framework in IFRS Standards
|
January 1, 2020
|
|
|
Amendments to IFRS 3
|
Definition of a Business
|
January 1, 2020
|
|
Amendments to IAS 1 and IAS 8
|
Definition of Material
|
January 1, 2020
|
|
IFRS 17
|
Insurance Contracts
|
January 1, 2021
|
|
Amendments to IFRS 10 and IAS 28
|
Sale or Contribution of Assets between an Investor and its Associate or Joint Venture
|
Deferred
Indefinitely |
With respect to the other standards, amendments and interpretations that are issued but not effective, based on the analyzes performed to date, the Group considers that their application will not have a significant impact on the consolidated financial statements in the initial period of application.
|
•
|
IFRS 16 Leases
|
IFRS 16 requires lessees to recognize assets and liabilities arising from all leases in the statement of financial position. A lessee may elect not to apply the general requirements to short-term leases and leases of low-value assets.
The Group acts as a lessee on a very significant number of lease agreements over different assets, such as third-party towers, circuits, office buildings and stores and land where the towers are located, mainly. A significant portion of these contracts is accounted for as operating lease under the current lease standard, with lease payments being recognized generally on a straight-line basis over the contract term.
The project to implement the new requirements in the Group is highly complex due to factors such as the high number of contracts affected and the diversity of data source systems, as well as the need to make certain estimates. These include the estimation of the lease term, based on the non-cancelable period and the periods covered by options to extend the lease, when the exercise depends only on Telefónica and where such exercise is reasonably certain. This will depend, to a large extent, on the specific facts and circumstances by class of assets in the telecom industry (technology, regulation, competition, business model, among others). In addition to this, the Group must make assumptions to calculate the discount rate, which will be based mainly on the incremental borrowing rate of interest for the estimated term. On the other hand, the Group shall not recognize non-lease components separately from lease
F-26
components for those classes of assets in which non-lease components are not significant with respect to the total value of the arrangement.
The standard allows for two transition methods: retrospectively for all periods presented, or using a modified retrospective approach where the cumulative effect of adoption is recognized at the date of initial application. The Group shall adopt the latter transition method; therefore, the Group will recognize the cumulative effect of initial application as an adjustment to retained earnings in the year of initial application of IFRS 16. Moreover, the Group will apply the practical expedient that allows not reassessing whether a contract is or contains a lease on the date of initial application of IFRS 16 but directly apply the new requirements to all those contracts identified as leases under the current accounting standard. Also, certain practical expedients are available on first-time application in connection with the right of use asset measurement, discount rates, impairment, leases that finish within the twelve months subsequent to the date of first application, initial direct costs, and term of the lease. The following practical expedients will be adopted by the Group on transition to the new requirements:
|
•
|
Right of use asset measurement: for a vast majority of leases previously classified as an operating lease the group shall recognize a right-of-use asset at the date of initial application measured at an amount equal to the lease liability, adjusted by the amount of any prepaid or accrued lease payments relating to that lease recognized in the statement of financial position immediately before the date of initial application.
|
|
•
|
Discount rates: a lessee may apply a single discount rate to a portfolio of leases with reasonably similar characteristics such as lease term, class of underlying asset, currency and economic environment.
|
|
•
|
Leases expiring in 2019: the Group will use the practical exemption from application of the new requirements to leases whose lease term ends within 12 months of the date of initial application.
|
|
•
|
Initial direct costs: the Group will exclude initial direct costs from the measurement of the right-of-use asset at the date of initial application.
|
The Group expects that the changes introduced by IFRS 16 will have a significant impact on its financial statements from the date of adoption. Based on the assessment preformed to date, the Group expects that the opening balance sheet at the date of initial application will show an increase in assets and liabilities between
7,400
and
8,100
million euro in connection with the rights of use and payment obligations arising from the majority of contracts that are classified as operating leases under the current lease standard.
The impact expected in equity is not significant
at 1 January 2019. Also, amortization of the right of use assets and recognition of interest costs on the lease obligation on the statements of income will replace amounts recognized as lease expense under the current lease standard. Classification of lease payments in the statement of cash flows will also be affected by the requirements of the new lease standard: a significant portion of the lease payments recognized as cash flows from operating activities in the statement of cash flows under the current lease standard, will be classified as cash flows from financing activities upon application of the new lease accounting requirements. In addition to this, the Group's Financial Statements will include broader disclosures with relevant information regarding lease contracts.
Regarding the lease commitments disclosed in the Group's annual financial statements (see Note 23), the Company estimates that the main differences with respect to the new lease liability measurement will relate to, among others:
|
–
|
Differences relating to the contract population considered: lease liabilities do not include short-term leases or leases of low-value or intangible assets, while those are included in the expected payment schedule. On the other hand, payments relating to contracts that can be canceled without penalty are not included within lease payment commitments, but they are included in the lease liability.
|
|
–
|
Differences in the lease term: extension options that are reasonably certain are part of the measurement of the lease liability, whereas they are not taken into consideration in the estimated payments schedule for operating leases.
|
|
–
|
Discount rate differences: to the extent that there are differences in lease terms, the discount rates used are different as a consequence of such differences.
|
Estimated adoption impacts are based on the assessments conducted to date. Actual impacts at 1 January 2019 could be different because the Group is currently assessing the impacts of the initial application of the new requirements testing the new systems considering the multiple alternatives available in transition, the estimations required and the high number of contracts affected. The new accounting policies will not be final until the Group presents its first financial statements subsequent to the effective date of IFRS 16.
F-27
On January 31, 2018, the Board of Directors of Telefónica resolved to adopt a new organizational structure in order to make the Group more agile, simple and focused on management, customer service, growth, efficiency and profitability.
The previous organizational structure, which was approved by the Board of Directors of Telefónica, S.A. on February 26, 2014 was made up of the following segments: Telefónica Spain, Telefónica United Kingdom, Telefónica Germany, Telefónica Brazil and Telefónica Hispanoamérica (formed by the Group’s operators in Argentina, Chile, Peru, Colombia, Mexico, Venezuela, Central America, Ecuador and Uruguay).
Following the Board of Directors' resolution on January 31, 2018,
Telefónica Hispanoamérica was split into two new segments in order to more effectively manage the different market situations: Telefónica Hispam Norte, encompassing the operations in Colombia, Mexico, Central America, Ecuador and Venezuela, and Telefónica Hispam Sur, encompassing operations in Argentina, Chile, Peru and Uruguay.
Due to the implementation of the new organizational structure referred to above, the comparative results of the segments of the Group for 2017 and 2016 and the comparative segmentation of assets, liabilities and investments accounted for by the equity method as of December 31, 2017 have been restated to reflect this new organization. These changes in the segments have had no impact on the consolidated results of the Group.
In the 2017 consolidated financial statements, the 2016 comparative segment results had been revised, reflecting the integration within Telxius of the mobile telecommunications towers transferred from the Telefónica Spain, Telefónica Germany, Telefónica Brazil and Telefónica Hispanoamérica segments and the international submarine fiber optic cable, the inclusion of the companies Telefónica Studios and Telefónica Servicios Audiovisuales in the Telefónica Spain segment and the inclusion of the results of the data center business in Spain and Chile in the Telefónica Spain and Telefónica Hispanoamérica segments, respectively.
The segments referred to above include the information related to the fixed, wireless, cable, data, Internet and television businesses and other digital services provided in each country.
Information relating to other Group companies not specifically included in these segments (see the section "Other companies" of Appendix I
)
is reported under "Other companies and eliminations", which includes Telxius, holding companies, companies whose main purpose is to provide cross-sectional services to Group companies and other companies
.
Revenues of Telxius in 2018 amounted to
792 million
euros (
730 million
euros in
2017), of which
458 million
euros correspond to inter-segment revenues (
449 million
euros in 2017). OIBDA of Telxius in 2018 amounted to
370 million
euros (
346 million
euros in 2017). The capital expenditures in 2018 in Telxius amounted to
181 million
euros (
203 million
euros in 2017)
.
Fixed assets of Telxius at December 31, 2018 amounted to
1,116 million
euros (
1,093 million
euros at December 31, 2017).
External revenues of the companies included in "Other companies and eliminations" in 2018, excluding Telxius, amounted to
1,139
million euros (
1,222
million euros in 2017).
The Group centrally manages borrowing activities, mainly through Telefónica, S.A. and other companies included in "Other companies" (see Note 17, Appendix III and Appendix V
), so most of the Group's financial assets and liabilities are reported under "Other companies and eliminations". In addition, Telefónica, S.A. is the head of the Telefónica tax group in Spain
(see Note
22
).
Therefore, a significant part of the deferred tax assets and liabilities is included under “Other companies and eliminations”. For these reasons, the results of the segments are disclosed up to operating income.
Revenue and expenses arising from intra-group invoicing for the use of the trademark and management services were eliminated from the operating results of each Group segment. These adjustments had no impact on the Group’s consolidated results. In addition, segment reporting considers the impact of the purchase price allocation to the assets acquired and the liabilities assumed by the companies included in each segment. The assets and liabilities presented in each segment are those managed by the heads of each segment, regardless of their legal structure.
Operating income before depreciation and amortization (OIBDA) is calculated by excluding solely depreciation and amortization from operating income. OIBDA is used to track the performance of the business and to establish operating and strategic targets of the Telefónica Group companies. OIBDA is a commonly reported measure and is widely used among analysts, investors and other interested parties in the telecommunications industry, although not a measure
F-28
explicitly defined in IFRS, and therefore, may not be comparable to similar indicators used by other companies. OIBDA should not be considered as a substitute for operating income
.
The following table presents income and CapEx information (capital expenditures in intangible assets and property, plant and equipment (see Notes 6 and 8) regarding the Group’s operating segments:
|
2018
|
||||||||||||||||
|
Millions of euros
|
Telefónica
Spain
|
|
Telefónica
United Kingdom
|
|
Telefónica Germany
|
|
Telefónica
Brazil
|
|
Telefónica
Hispam Norte
|
|
Telefónica
Hispam Sur |
|
Other companies and eliminations
|
|
Total Group
|
|
|
Revenues
|
12,706
|
|
6,790
|
|
7,320
|
|
10,126
|
|
4,075
|
|
6,677
|
|
999
|
|
48,693
|
|
|
External revenues
|
12,461
|
|
6,757
|
|
7,281
|
|
10,105
|
|
3,986
|
|
6,630
|
|
1,473
|
|
48,693
|
|
|
Inter-segment revenues
|
245
|
|
33
|
|
39
|
|
21
|
|
89
|
|
47
|
|
(474
|
)
|
—
|
|
|
Other operating income and expenses
|
(7,943
|
)
|
(4,925
|
)
|
(5,486
|
)
|
(5,815
|
)
|
(3,282
|
)
|
(4,958
|
)
|
(713
|
)
|
(33,122
|
)
|
|
OIBDA
|
4,763
|
|
1,865
|
|
1,834
|
|
4,311
|
|
793
|
|
1,719
|
|
286
|
|
15,571
|
|
|
Depreciation and amortization
|
(1,650
|
)
|
(943
|
)
|
(2,071
|
)
|
(1,990
|
)
|
(967
|
)
|
(1,167
|
)
|
(261
|
)
|
(9,049
|
)
|
|
Operating income
|
3,113
|
|
922
|
|
(237
|
)
|
2,321
|
|
(174
|
)
|
552
|
|
25
|
|
6,522
|
|
|
Capital expenditures (CapEx)
|
1,719
|
|
1,464
|
|
966
|
|
1,910
|
|
668
|
|
1,116
|
|
276
|
|
8,119
|
|
|
2017 (revised)
|
||||||||||||||||
|
Millions of euros
|
Telefónica
Spain
|
|
Telefónica
United Kingdom
|
|
Telefónica Germany
|
|
Telefónica
Brazil
|
|
Telefónica
Hispam Norte |
|
Telefónica
Hispam Sur |
|
Other companies and eliminations
|
|
Total Group
|
|
|
Revenues
|
12,653
|
|
6,540
|
|
7,296
|
|
12,019
|
|
4,331
|
|
8,218
|
|
951
|
|
52,008
|
|
|
External revenues
|
12,364
|
|
6,505
|
|
7,252
|
|
11,994
|
|
4,220
|
|
8,170
|
|
1,503
|
|
52,008
|
|
|
Inter-segment revenues
|
289
|
|
35
|
|
44
|
|
25
|
|
111
|
|
48
|
|
(552
|
)
|
—
|
|
|
Other operating income and expenses
|
(7,701
|
)
|
(4,901
|
)
|
(5,475
|
)
|
(7,828
|
)
|
(3,068
|
)
|
(5,943
|
)
|
(905
|
)
|
(35,821
|
)
|
|
OIBDA
|
4,952
|
|
1,639
|
|
1,821
|
|
4,191
|
|
1,263
|
|
2,275
|
|
46
|
|
16,187
|
|
|
Depreciation and amortization
|
(1,688
|
)
|
(1,047
|
)
|
(1,954
|
)
|
(2,228
|
)
|
(992
|
)
|
(1,198
|
)
|
(289
|
)
|
(9,396
|
)
|
|
Operating income
|
3,264
|
|
592
|
|
(133
|
)
|
1,963
|
|
271
|
|
1,077
|
|
(243
|
)
|
6,791
|
|
|
Capital expenditures (CapEx)
|
1,683
|
|
827
|
|
951
|
|
2,225
|
|
1,264
|
|
1,414
|
|
333
|
|
8,697
|
|
|
2016 (revised)
|
||||||||||||||||
|
Millions of euros
|
Telefónica
Spain
|
|
Telefónica
United Kingdom
|
|
Telefónica Germany
|
|
Telefónica
Brazil
|
|
Telefónica
Hispam Norte |
|
Telefónica
Hispam Sur |
|
Other companies and eliminations
|
|
Total Group
|
|
|
Revenues
|
12,815
|
|
6,861
|
|
7,503
|
|
11,090
|
|
4,711
|
|
7,870
|
|
1,186
|
|
52,036
|
|
|
External revenues
|
12,512
|
|
6,821
|
|
7,460
|
|
11,060
|
|
4,515
|
|
7,822
|
|
1,846
|
|
52,036
|
|
|
Inter-segment revenues
|
303
|
|
40
|
|
43
|
|
30
|
|
196
|
|
48
|
|
(660
|
)
|
—
|
|
|
Other operating income and expenses
|
(8,412
|
)
|
(5,152
|
)
|
(5,732
|
)
|
(7,388
|
)
|
(3,598
|
)
|
(5,510
|
)
|
(1,126
|
)
|
(36,918
|
)
|
|
OIBDA
|
4,403
|
|
1,709
|
|
1,771
|
|
3,702
|
|
1,113
|
|
2,360
|
|
60
|
|
15,118
|
|
|
Depreciation and amortization
|
(1,827
|
)
|
(1,090
|
)
|
(2,200
|
)
|
(2,036
|
)
|
(1,112
|
)
|
(1,075
|
)
|
(309
|
)
|
(9,649
|
)
|
|
Operating income
|
2,576
|
|
619
|
|
(429
|
)
|
1,666
|
|
1
|
|
1,285
|
|
(249
|
)
|
5,469
|
|
|
Capital expenditures (CapEx)
|
1,852
|
|
931
|
|
1,107
|
|
2,137
|
|
878
|
|
1,737
|
|
286
|
|
8,928
|
|
F-29
The following table presents main segment assets and liabilities:
|
2018
|
||||||||||||||||
|
Millions of euros
|
Telefónica
Spain
|
|
Telefónica
United Kingdom
|
|
Telefónica Germany
|
|
Telefónica
Brazil
|
|
Telefónica
Hispam Norte |
|
Telefónica
Hispam Sur |
|
Other companies and eliminations
|
|
Total Group
|
|
|
Fixed assets
|
15,347
|
|
9,646
|
|
13,520
|
|
21,230
|
|
4,971
|
|
9,041
|
|
2,144
|
|
75,899
|
|
|
Investments accounted for by the equity method
|
2
|
|
8
|
|
—
|
|
2
|
|
1
|
|
—
|
|
55
|
|
68
|
|
|
Financial assets and other non-currents assets
|
163
|
|
304
|
|
377
|
|
1,718
|
|
363
|
|
469
|
|
3,715
|
|
7,109
|
|
|
Deferred tax assets
|
2,084
|
|
2
|
|
204
|
|
335
|
|
1,063
|
|
165
|
|
3,778
|
|
7,631
|
|
|
Other current financial assets
|
31
|
|
79
|
|
9
|
|
88
|
|
68
|
|
145
|
|
1,789
|
|
2,209
|
|
|
Total allocated assets
|
23,622
|
|
12,609
|
|
16,837
|
|
27,402
|
|
8,672
|
|
12,043
|
|
12,862
|
|
114,047
|
|
|
Non-current financial liabilities
|
649
|
|
1,077
|
|
2,004
|
|
1,058
|
|
1,101
|
|
1,618
|
|
37,827
|
|
45,334
|
|
|
Deferred tax liabilities
|
189
|
|
102
|
|
236
|
|
693
|
|
134
|
|
397
|
|
923
|
|
2,674
|
|
|
Current financial liabilities
|
1,683
|
|
—
|
|
145
|
|
334
|
|
1,083
|
|
339
|
|
5,784
|
|
9,368
|
|
|
Total allocated liabilities
|
14,328
|
|
4,633
|
|
6,287
|
|
7,204
|
|
5,096
|
|
5,396
|
|
44,123
|
|
87,067
|
|
|
2017 (revised)
|
||||||||||||||||
|
Millions of euros
|
Telefónica
Spain
|
|
Telefónica
United Kingdom
|
|
Telefónica Germany
|
|
Telefónica
Brazil
|
|
Telefónica
Hispam Norte |
|
Telefónica
Hispam Sur |
|
Other companies and eliminations
|
|
Total Group
|
|
|
Fixed assets
|
15,288
|
|
9,198
|
|
14,611
|
|
23,845
|
|
6,075
|
|
7,840
|
|
2,214
|
|
79,071
|
|
|
Investments accounted for by the equity method
|
2
|
|
7
|
|
—
|
|
2
|
|
1
|
|
—
|
|
65
|
|
77
|
|
|
Financial assets and other non-currents assets
|
154
|
|
309
|
|
292
|
|
1,944
|
|
313
|
|
387
|
|
4,768
|
|
8,167
|
|
|
Deferred tax assets
|
2,151
|
|
41
|
|
162
|
|
235
|
|
1,339
|
|
273
|
|
3,619
|
|
7,820
|
|
|
Other current financial assets
|
30
|
|
59
|
|
17
|
|
106
|
|
39
|
|
185
|
|
1,718
|
|
2,154
|
|
|
Total allocated assets
|
22,722
|
|
11,610
|
|
17,225
|
|
30,229
|
|
9,194
|
|
11,009
|
|
13,077
|
|
115,066
|
|
|
Non-current financial liabilities
|
1,929
|
|
—
|
|
1,268
|
|
1,371
|
|
1,210
|
|
1,712
|
|
38,842
|
|
46,332
|
|
|
Deferred tax liabilities
|
204
|
|
108
|
|
87
|
|
296
|
|
158
|
|
152
|
|
1,140
|
|
2,145
|
|
|
Current financial liabilities
|
819
|
|
801
|
|
637
|
|
766
|
|
1,061
|
|
260
|
|
5,070
|
|
9,414
|
|
|
Total allocated liabilities
|
13,391
|
|
4,063
|
|
5,889
|
|
8,130
|
|
5,118
|
|
5,611
|
|
46,246
|
|
88,448
|
|
F-30
The composition of segment revenues, detailed by the main countries in which the Group operates, is as follows:
|
Millions of euros
|
2018
|
2017 (revised)
|
2016 (revised)
|
|||||||||||||||||||||
|
Country by segments
|
Fixed
|
|
Mobile
|
|
Others and elims.
|
|
Total
|
|
Fixed
|
|
Mobile
|
|
Others and elims.
|
|
Total
|
|
Fixed
|
|
Mobile
|
|
Others and elims.
|
|
Total
|
|
|
Spain (*)
|
|
|
|
|
|
|
12,706
|
|
|
|
|
|
|
|
12,653
|
|
|
|
|
|
|
|
12,815
|
|
|
United Kingdom (**)
|
—
|
|
6,390
|
|
400
|
|
6,790
|
|
—
|
|
6,216
|
|
324
|
|
6,540
|
|
—
|
|
6,572
|
|
289
|
|
6,861
|
|
|
Germany
|
767
|
|
6,539
|
|
14
|
|
7,320
|
|
862
|
|
6,415
|
|
19
|
|
7,296
|
|
981
|
|
6,498
|
|
24
|
|
7,503
|
|
|
Brazil
|
3,754
|
|
6,372
|
|
—
|
|
10,126
|
|
4,659
|
|
7,360
|
|
—
|
|
12,019
|
|
4,427
|
|
6,663
|
|
—
|
|
11,090
|
|
|
Hispam Norte
|
732
|
|
3,343
|
|
—
|
|
4,075
|
|
736
|
|
3,595
|
|
—
|
|
4,331
|
|
831
|
|
3,881
|
|
(1
|
)
|
4,711
|
|
|
Colombia
|
574
|
|
894
|
|
—
|
|
1,468
|
|
554
|
|
909
|
|
—
|
|
1,463
|
|
548
|
|
861
|
|
—
|
|
1,409
|
|
|
Mexico
|
—
|
|
1,175
|
|
—
|
|
1,175
|
|
—
|
|
1,336
|
|
—
|
|
1,336
|
|
—
|
|
1,410
|
|
—
|
|
1,410
|
|
|
Remaining operators and segment eliminations
|
158
|
|
1,274
|
|
—
|
|
1,432
|
|
182
|
|
1,350
|
|
—
|
|
1,532
|
|
283
|
|
1,610
|
|
(1
|
)
|
1,892
|
|
|
Hispam Sur
|
2,712
|
|
3,965
|
|
—
|
|
6,677
|
|
3,225
|
|
4,993
|
|
—
|
|
8,218
|
|
3,173
|
|
4,697
|
|
—
|
|
7,870
|
|
|
Argentina
|
818
|
|
1,497
|
|
—
|
|
2,315
|
|
1,216
|
|
2,279
|
|
—
|
|
3,495
|
|
1,133
|
|
1,867
|
|
—
|
|
3,000
|
|
|
Chile
|
864
|
|
1,215
|
|
—
|
|
2,079
|
|
926
|
|
1,259
|
|
—
|
|
2,185
|
|
926
|
|
1,237
|
|
—
|
|
2,163
|
|
|
Peru
|
1,037
|
|
1,038
|
|
—
|
|
2,075
|
|
1,092
|
|
1,226
|
|
—
|
|
2,318
|
|
1,126
|
|
1,373
|
|
—
|
|
2,499
|
|
|
Remaining operators and segment eliminations
|
(7
|
)
|
215
|
|
—
|
|
208
|
|
(9
|
)
|
229
|
|
—
|
|
220
|
|
(12
|
)
|
220
|
|
—
|
|
208
|
|
|
Other and inter-segment eliminations
|
|
|
|
|
999
|
|
999
|
|
|
|
|
|
951
|
|
951
|
|
|
|
|
|
1,186
|
|
1,186
|
|
|
Total Group
|
|
|
|
|
|
|
48,693
|
|
|
|
|
|
|
|
52,008
|
|
|
|
|
|
|
|
52,036
|
|
Note: In the countries of the Telefónica Hispam Norte and Telefónica Hispam Sur segment with separate fixed and mobile operating companies, intercompany revenues were not considered.
(*) The detail of revenues for Telefónica Spain is shown in the table below.
(**)
Telefónica United Kingdom mobile revenues include MVNO revenues since 1 January 2017, which were previously accounted as "others". Comparative figures for 2016 were revised accordingly.
Given the convergence reached at Telefónica Spain due to the high penetration of convergent offers in Telefónica Spain, the revenue breakdown by fixed and mobile is less relevant in this segment. For this reason, management believes that the revenue breakdown shown below is more meaningful
.
|
Millions of euros
|
||||
|
Telefónica Spain
|
2018
|
|
2017
|
|
|
Mobile handset sale
|
386
|
|
379
|
|
|
Ex-Mobile handset sale
|
12,320
|
|
12,274
|
|
|
Consumer
|
6,689
|
|
6,602
|
|
|
Corporate
|
3,462
|
|
3,401
|
|
|
Others
|
2,169
|
|
2,271
|
|
|
Total
|
12,706
|
|
12,653
|
|
F-31
Business combinations
Finalization of the purchase price alocation by Coltel of control over Telebucaramanga, Metrotel and Optecom
On 30 September 2017, as part of the early termination agreement regarding the contract with PARAPAT (refer to Note 2), Colombia Telecomunicaciones, S.A. ESP (Coltel) acquired control of Colombian companies Empresa de Telecomunicaciones de Telebucaramanga S.A. ESP (Telebucaramanga), operating in the city of Bucaramanga; Metropolitana de Telecomunicaciones S.A. ESP (Metrotel); and Operaciones Tecnológicas y Comerciales S.A.S. (Optecom), operating in the city of Barranquilla, for an overall price of
509,975 million
Colombian pesos (approximately
147 million
euros on the transaction date). These companies primarily provide fixed telephony, data, pay TV, installation and maintenance services
.
At the date of authorization for issuer of the 2017 consolidated financial statements of the Telefónica Group the purchase price allocation was provisional. In 2018 the preliminary allocation was reviewed within the twelve-month period from the acquisition date. The following table summarizes the consideration, the final fair values of the assets and liabilities identified on acquisition and the generated goodwill.
|
Millions of euros
|
||
|
Consideration paid for the acquisition of control
(1)
|
147
|
|
|
Fair value of the prior stake
|
41
|
|
|
Fair value of the minority stake
|
3
|
|
|
Consideration
|
191
|
|
|
Intangible assets
|
13
|
|
|
Customer relationships
|
13
|
|
|
Other intangible assets
|
—
|
|
|
Property, plant and equipment
|
147
|
|
|
Deferred tax assets
|
7
|
|
|
Other non-current assets
|
16
|
|
|
Cash and cash equivalents
|
13
|
|
|
Other current assets
|
18
|
|
|
Deferred tax liabilities
|
(23
|
)
|
|
Other non-current liabilities
|
(100
|
)
|
|
Current liabilities
|
(26
|
)
|
|
Fair value of net assets
|
65
|
|
|
Goodwill
|
126
|
|
(1)
Excluding the proportion assumed by the non-controlling shareholder and the cash and cash equivalents contributed by the companies at the moment of its inclusion in the consolidation scope, the impact in the consolidated cash flow amounted to
85
million euros (see Note 25).
Transactions with non-controlling interests
2018
Sale of 9.99% of the total share capital of Telxius
On July 27, 2018, Telefónica transferred to a subsidiary of the Pontegadea Group
16.65%
of the share capital of the Telefónica's subsidiary Pontel Participaciones, S.L. ("Pontel"), which owns
60%
of the share capital of Telxius Telecom, S.A. ("Telxius"), for an amount of
378.8
million euros, resulting in a price of
15.2
euros per share of Telxius. This participation of
16.65%
in the capital stock of Pontel is equivalent, in economic terms, to an indirect participation of
9.99%
in the share capital of Telxius. The impact of this transaction on the equity attributable to equity holders of the parent amounted to
232
million euros and being the impact on equity attributable to non-controlling interest amounted to
139
million euros.
F-32
2017
Share swap with KPN
In March 2017, Telefónica entered into a swap agreement with Koninklijke KPN NV (hereinafter, KPN) to deliver
72.0 million
of its treasury shares (representing
1.43%
of its share capital) in exchange for
178.5 million
shares of its subsidiary Telefónica Deutschland Holding AG, representing
6.0%
of the share capital of the latter (see Note 15). This transaction thus entailed no cash movements.
The exchange ratio was determined based on the average of the volume weighted average price of the respective shares over the last five trading sessions. The impact in the consolidated statement of changes in equity was a decrease in net equity attributable to minority interests amounting to
671
million euros (Note 15.h), an increase in treasury shares amounting to
754
million euros and a decrease in retained earnings amounting to
83
million euros.
As a result of this agreement, Telefónica increased its shareholding in Telefonica Deutschland from
63.2%
to
69.2%
.
Sale of 24.8% and 15.2% of the total share capital of Telxius
On February 20, 2017, Telefónica reached an agreement for the sale of up to
40%
of the total share capital in Telxius Telecom, S.A. to KKR, for a total amount of
1,275 million
euros (
12.75
euros per share).
The aforementioned agreement included a purchase agreement for the sale of
62 million
shares (representing
24.8%
of the share capital) of Telxius Telecom, S.A. for
790.5 million
euros, and options on over
38 million
shares (representing
15.2%
of the share capital) for a price of at least
484.5 million
euros.
These options corresponded to a call option exercisable by KKR and to a put option exercisable by Telefónica upon maturity of the call option.
On October 24, 2017, after obtaining all the relevant regulatory approvals, Telefónica transferred
62 million
shares of Telxius (representing
24.8%
of its share capital) to KKR in exchange for
790.5 million
euros (
12.75
euros per share).
On November 13, 2017, KKR exercised the call option contemplated in the Agreement on over
38 million
shares of Telxius (representing
15.2%
of its share capital) in exchange for
484.5 million
euros (
12.75
euros per share).
Following the closing of this sale of
15.2%
of the share capital in Telxius in December 2017, together with
24.8%
of the share capital acquired on October 24, 2017, KKR had acquired
40%
of the share capital of Telxius in exchange for an aggregate amount of
1,275 million
euros (see Note 25).
These transactions had no impact on the consolidated results of the Telefónica Group as it consisted of the sale of minority interests, with Telefónica retaining control over Telxius.
The impact on the consolidated statement of changes in equity was an increase in net equity attributable to minority interests amounting to
690
million euros (Note 15.i), an increase in retained earnings amounting to
570
million euros,
and a decrease in translation differences of
9
million euros.
F-33
The composition of and movements in net intangible assets in
2018
and
2017
are as follows:
|
2018
|
|
|
|
|
|
|
|
|
||||||||
|
Millions of euros
|
Balance at 12/31/2017
|
|
Additions
|
|
Amortization
|
|
Disposals
|
|
Transfers and others
|
|
Translation differences and hyperinflation adjustments
|
|
Exclusion
of companies
|
|
Balance at 12/31/2018
|
|
|
Service concession arrangements and licenses
|
10,785
|
|
509
|
|
(1,221
|
)
|
—
|
|
(9
|
)
|
(69
|
)
|
—
|
|
9,995
|
|
|
Software
|
2,987
|
|
632
|
|
(1,450
|
)
|
(19
|
)
|
876
|
|
(86
|
)
|
—
|
|
2,940
|
|
|
Customer base
|
2,731
|
|
—
|
|
(539
|
)
|
—
|
|
(5
|
)
|
(49
|
)
|
—
|
|
2,138
|
|
|
Trademarks
|
780
|
|
—
|
|
(58
|
)
|
—
|
|
—
|
|
(32
|
)
|
—
|
|
690
|
|
|
Other intangible assets
|
86
|
|
22
|
|
(30
|
)
|
—
|
|
4
|
|
(2
|
)
|
(3
|
)
|
77
|
|
|
Intangible assets in process
|
636
|
|
815
|
|
—
|
|
—
|
|
(412
|
)
|
(23
|
)
|
—
|
|
1,016
|
|
|
Total intangible assets
|
18,005
|
|
1,978
|
|
(3,298
|
)
|
(19
|
)
|
454
|
|
(261
|
)
|
(3
|
)
|
16,856
|
|
|
2017
|
|
|
|
|
|
|
|
|
||||||||
|
Millions of euros
|
Balance at 12/31/16
|
|
Additions
|
|
Amortization
|
|
Disposals
|
|
Transfers and others
|
|
Translation differences and hyperinflation adjustments
|
|
Inclusion
of companies
|
|
Balance at 12/31/2017
|
|
|
Service concession arrangements and licenses
|
11,594
|
|
493
|
|
(1,234
|
)
|
—
|
|
852
|
|
(920
|
)
|
—
|
|
10,785
|
|
|
Software
|
2,892
|
|
640
|
|
(1,441
|
)
|
—
|
|
1,109
|
|
(216
|
)
|
3
|
|
2,987
|
|
|
Customer base
|
3,435
|
|
—
|
|
(639
|
)
|
—
|
|
1
|
|
(87
|
)
|
21
|
|
2,731
|
|
|
Trademarks
|
912
|
|
—
|
|
(74
|
)
|
—
|
|
—
|
|
(58
|
)
|
—
|
|
780
|
|
|
Other intangible assets
|
127
|
|
18
|
|
(55
|
)
|
2
|
|
(5
|
)
|
(4
|
)
|
3
|
|
86
|
|
|
Intangible assets in process
|
1,558
|
|
667
|
|
—
|
|
—
|
|
(1,559
|
)
|
(30
|
)
|
—
|
|
636
|
|
|
Total intangible assets
|
20,518
|
|
1,818
|
|
(3,443
|
)
|
2
|
|
398
|
|
(1,315
|
)
|
27
|
|
18,005
|
|
The gross cost, accumulated amortization and impairment losses of intangible assets at
December 31, 2018
and
2017
are as follows:
|
Balance at 12/31/2018
|
||||||||
|
Millions of euros
|
Gross cost
|
|
Accumulated amortization
|
|
Impairment losses
|
|
Intangible assets
|
|
|
Service concession arrangements and licenses
|
21,145
|
|
(11,150
|
)
|
—
|
|
9,995
|
|
|
Software
|
17,153
|
|
(14,213
|
)
|
—
|
|
2,940
|
|
|
Customer base
|
6,766
|
|
(4,628
|
)
|
—
|
|
2,138
|
|
|
Trademarks
|
1,853
|
|
(1,163
|
)
|
—
|
|
690
|
|
|
Other intangible assets
|
1,022
|
|
(942
|
)
|
(3
|
)
|
77
|
|
|
Intangible assets in process
|
1,016
|
|
—
|
|
—
|
|
1,016
|
|
|
Intangible assets
|
48,955
|
|
(32,096
|
)
|
(3
|
)
|
16,856
|
|
F-34
|
Balance at 12/31/2017
|
||||||||
|
Millions of euros
|
Gross cost
|
|
Accumulated amortization
|
|
Impairment losses
|
|
Intangible assets
|
|
|
Service concession arrangements and licenses
|
21,333
|
|
(10,548
|
)
|
—
|
|
10,785
|
|
|
Software
|
16,407
|
|
(13,420
|
)
|
—
|
|
2,987
|
|
|
Customer base
|
6,931
|
|
(4,200
|
)
|
—
|
|
2,731
|
|
|
Trademarks
|
1,909
|
|
(1,129
|
)
|
—
|
|
780
|
|
|
Other intangible assets
|
1,081
|
|
(993
|
)
|
(2
|
)
|
86
|
|
|
Intangible assets in process
|
636
|
|
—
|
|
—
|
|
636
|
|
|
Intangible assets
|
48,297
|
|
(30,290
|
)
|
(2
|
)
|
18,005
|
|
The main acquisitions of radio spectrum in
2018
are as follows:
|
▪
|
In Telefónica United Kingdom, the acquisition of
40
Mhz in band of
2.3
Ghz for
230
million euros, and
40
Mhz in band of
3.4
Ghz amounting to
358
million euros registered as intangible assets in process.
|
|
▪
|
In Telefónica Spain, the acquisition of the purchase of spectrum in the band
3.7
Ghz amounting to
108
million euros.
|
|
▪
|
In Telefónica Hispam Norte, the acquisition by Telefónica Móviles México of
2.5
Ghz blocks for
33
million euros and the renewal of spectrum in the band of
1900
Mhz for
102
million euros.
|
|
▪
|
In Telefónica Hispam Sur, the acquisition of spectrum in
2.6
GHz band by Telefónica Argentina for
21
million euros.
|
"Transfers and others" in 2018 includes the reclasification of the intangible assets of Telefónica Móviles Guatemala and Telefónica Móviles El Salvador amounting to
44
and
30
million euros, respectively, recorded in "Non-current assets classified as held for sale" of the statements of financial position (see Note
28
).
Appendix VI contains the details of the main concessions and licenses with which the Group operates.
The result of the translation to euros of the intangible assets by the companies of the Group in Argentina and Venezuela, together with the effect of the hyperinflation adjustments (see Note 2) are shown in the column "Translation differences and hyperinflation adjustments". The hyperinflation adjustment at January 1, 2018 corresponding to the intangible assets of the Group companies in Argentina totaled
483
million euros (mainly
458
million euros for service concession arrangements and licenses and
24
million euros for software).
On July 25, 2017, Coltel and another telecom operator were notified of the arbitration award issued in the arbitration proceedings initiated by the MinTIC. The arbitration award was not favorable to the co-defendants and as a consequence the shareholders' meeting of Coltel approved a capital increase for an aggregate amount of
1,651,012
million Colombian pesos (approximately
470
million euros) to pay the entire amount set forth in the arbitration award (see Note 2). Both ColTel and Telefónica have initiated legal actions (see Appendix VI). The payment of the sum awarded was recognized in 2017 as an additional cost of the license since this cost was mandatory and unavoidable in order to continue using the license.
“Inclusion of companies” in 2017 mainly corresponded to Coltel acquiring control over the companies Telebucaramanga, Metrotel and Optecom.
F-35
The movement in goodwill assigned to each Group segment was as follows:
|
2018
|
||||||||||
|
Millions of euros
|
Balance at 12/31/2017
|
|
Transfer to Non-currents assets held for sale
|
|
Write-offs
|
|
Exchange rate impact and other
|
|
Balance at 12/31/2018
|
|
|
Telefónica Spain
|
4,310
|
|
—
|
|
—
|
|
—
|
|
4,310
|
|
|
Telefónica Brazil
|
10,057
|
|
—
|
|
—
|
|
(1,066
|
)
|
8,991
|
|
|
Telefónica Germany
|
4,815
|
|
—
|
|
—
|
|
—
|
|
4,815
|
|
|
Telefónica United Kingdom
|
4,648
|
|
—
|
|
—
|
|
(37
|
)
|
4,611
|
|
|
Telefónica Hispam Norte
|
1,002
|
|
(183
|
)
|
(350
|
)
|
(5
|
)
|
464
|
|
|
Telefónica Hispam Sur
|
1,907
|
|
—
|
|
—
|
|
555
|
|
2,462
|
|
|
Others
|
102
|
|
—
|
|
(6
|
)
|
(1
|
)
|
95
|
|
|
Total
|
26,841
|
|
(183
|
)
|
(356
|
)
|
(554
|
)
|
25,748
|
|
|
2017(*)
|
||||||||||
|
Millions of euros
|
Balance at 12/31/2016
|
|
Additions
|
|
Write-offs
|
|
Exchange rate impact and other
|
|
Balance at 12/31/2017
|
|
|
Telefónica Spain
|
4,306
|
|
—
|
|
—
|
|
4
|
|
4,310
|
|
|
Telefónica Brazil
|
11,565
|
|
—
|
|
—
|
|
(1,508
|
)
|
10,057
|
|
|
Telefónica Germany
|
4,787
|
|
28
|
|
—
|
|
—
|
|
4,815
|
|
|
Telefónica United Kingdom
|
4,824
|
|
—
|
|
—
|
|
(176
|
)
|
4,648
|
|
|
Telefónica Hispam Norte
|
957
|
|
147
|
|
—
|
|
(102
|
)
|
1,002
|
|
|
Telefónica Hispam Sur
|
2,083
|
|
—
|
|
—
|
|
(176
|
)
|
1,907
|
|
|
Others
|
164
|
|
—
|
|
—
|
|
(62
|
)
|
102
|
|
|
Total
|
28,686
|
|
175
|
|
—
|
|
(2,020
|
)
|
26,841
|
|
(*) The movement in 2017 has been restated to reflect the spin off process of the Telefónica Hispanoamérica segment of Telefónica Hispam Norte and Telefónica Hispam Sur (see Note 4).
The goodwill transferred to Non-current assets held for sale in 2018 corresponds to Telefónica Móviles Guatemala and Telefónica Móviles El Salvador (see Note 28).
In 2018, an impairment loss was recognized for the total value of the goodwill assigned to Telefónica Móviles México, amounting to
350
million euros, with a balancing entry in “Other expenses” (see Note 23). In 2018, changes occurred in Mexico's macroeconomic and financial conditions, which were reflected in the risk premiums that compute in the calculation of the cost of capital. In this context, the estimated WACC increased to
10.6%
(from the
9.5%
used in the valuation at the end of the 2017 financial year). On top of the macroeconomic situation, there was also increased market competition in 2018, mainly in prepay. Against this background, the latest available business plans, approved by the Company in November 2018, show a slowdown in the expected growth for the main operating variables.
In addition, goodwill of 6 million euros from the sale of Tokbox Inc was derecognized (see Note 23 and Appendix I).
As explained in Note 2, in 2018 Telefónica Group applied inflation adjustments to its companies whose functional currency is the Argentine peso. The adjustment for inflation at January 1, 2018, of the goodwill recognized in relation to the Group’s operators in Argentina was
858
million euros, recorded in the column "Exchange rate impact and other" of Telefónica Hispam Sur.
Additions of Telefónica Hispam Norte in 2017 relate to the acquisition of control by Coltel of the companies Empresa de Telecomunicaciones de Telebucaramanga S.A. ESP, Metropolitana de Telecomunicaciones S.A. ESP and
F-36
Operaciones Tecnológicas y Comerciales S.A.S. In 2018 the preliminary allocation of goodwill was reviewed within the twelve-month period from the acquisition date (see Note 5). Additions of Telefónica Germany relate to Minodes GmbH and Co-Trade GmbH (see Appendix I).
In order to test for impairment, goodwill was allocated to the different cash-generating units (CGUs), which are grouped into the following reportable operating segments:
|
|
12/31/2018
|
|
12/31/2017
|
|
|
Telefónica Spain
|
4,310
|
|
4,310
|
|
|
Telefónica Brazil
|
8,991
|
|
10,057
|
|
|
Telefónica Germany
|
4,815
|
|
4,815
|
|
|
Telefónica United Kingdom
|
4,611
|
|
4,648
|
|
|
Telefónica Hispam Norte
|
464
|
|
1,002
|
|
|
Colombia
|
192
|
|
222
|
|
|
Mexico
|
—
|
|
339
|
|
|
Central America
|
144
|
|
319
|
|
|
Ecuador
|
128
|
|
122
|
|
|
Telefónica Hispam Sur
|
2,462
|
|
1,907
|
|
|
Chile
|
906
|
|
978
|
|
|
Peru
|
744
|
|
739
|
|
|
Argentina
|
785
|
|
161
|
|
|
Uruguay
|
27
|
|
29
|
|
|
Others
|
95
|
|
102
|
|
|
TOTAL
|
25,748
|
|
26,841
|
|
Goodwill is tested for impairment at the end of the year using the business plans (approved by the Board of Directors) of the cash-generating units to which the goodwill is assigned. The business plans cover a
four years
period,
including the closing year. Therefore, in order to complete the
five years
of cash flows after the closing year, an additional
two
-year normalization period is added to the business plans based on the operating ratios until the terminal parameters are reached. The analysts consensus' forecasts are used as a reference. For specific cases, extended business plans are used to cover the five-year period of cash flows, when the normalization period does not properly reflect the expected evolution of the business. Finally, to determine the terminal value of each CGU, a constant free cash flows growth over time is assumed, applying a terminal growth rate. The model used is similar to the dividend discount model developed by Gordon-Shapiro, internationally recognized for business valuations.
The process of preparing the CGUs’ business plans considers the current market condition of each CGU, analyzing the macroeconomic, competitive, regulatory and technological environments, as well as the growth opportunities of the CGUs, and the differentiation capabilities compared to the competition based on market projections. A growth target is therefore defined for each CGU, based on the appropriate allocation of operating resources and the capital investments required to achieve the target. In addition, operating efficiency improvements are defined, in line with the strategic transformation initiatives, in order to increase the forecasted operating cash flow. In this process, the Group considers the compliance with business plans in the past.
Main assumptions used in calculating value in use
CGUs’ Value in use are calculated based on the approved business plans. Certain variables are then considered, including the OIBDA margin and Capital Expenditure ratio (expressed as a percentage of revenue), which are considered the key operating variables to measure business performance and to set financial targets. Finally, the discount rates and the perpetuity growth rates are considered.
In terms of revenue, the plan is in line with the average
three
-year analyst consensus, which reflects a stability or improvement trend. This trend is based on the quality and the differentiation of the products and services offered by the Group, increasing the high-value customer portfolio and the monetization of the growing data consumption, despite the strong competition in certain segments.
F-37
Therefore, revenues in Spain reflect the increase in the penetration of convergent products and services, offered over a network with differential quality. In Germany, the strong growth of high-value mobile data customers. In Brazil, the strength of Telefónica's leadership driven by its differential quality and the optimization of integration synergies. In the United Kingdom, the attractive momentum of mobile data.
The main variables considered for each CGU with significant goodwill (Brazil, Spain, United Kingdom and Germany), are described below.
The OIBDA margin and long-term Capital Expenditure (CapEx) ratio
The values obtained, described in the previous paragraphs, are compared with the available data on competitors in the geographic markets where Telefónica Group operates. With regard to Europe, the long-term OIBDA margin for operations in Spain is
40%
, though it is much lower in Germany (
28%
) and the United Kingdom (
27%
). The long-term OIBDA margin is therefore in line with analysts' forecasts over a three-year horizon, with Spain estimated at
40%
, Germany at
27%
and the United Kingdom at
26%
.
Regarding the ratio of CapEx over revenues, forecasted in the business plans, the Group’s European operators invest at a percentage of revenue aligned with the range for peers in the region. However, the valuations performed for the impairment tests for Spain, Germany and United Kingdom consider the opinions of Telefónica Group’s analysts with regard to investment needs (around
12%
for the three countries).
The OIBDA margin for Brazil is
42%
, within the range of analysts' long-term forecasts (between 37% and 43%). Over the term of the business plans, the operator will invest a percentage in line with the investment needs forecasted by analysts (
18%
).
Discount rate
The discount rate, applied to measure cash flows, is the weighted average cost of capital (WACC), determined by the weighted average cost of equity and debt according to the finance structure established for each CGU.
This rate is calculated using the capital asset pricing model (CAPM), which considers the asset’s systemic risk, and impact of risks on cash flows not generated internally such as country risk, business-specific credit risk, currency risk and price risk specific to the financial asset.
In the UK, the uncertainty surrounding the Brexit process continues to generate an adverse impact on certain financial indicators and lower economic growth that it should be. For this reason, the cost of capital used in the valuation continues to be stressed, through a higher than implied market premium
.
The most significant components of WACC are summarized as follows:
|
•
|
Risk-Free Rate: defined as the interest rate offered by long-term sovereign bonds. The rate is determined using current market data and equilibrium level estimates (according to standard econometric models) between which the interest rates should fall, thus adjusting the return in low rates because of the high influence of public debt purchased by central banks.
|
|
•
|
Political Risk Premium: adds the country's insolvency risk due to political and/or financial events; calculation is based on the quoted prices of credit default swaps for each country or, the EMBI+ index published by JP Morgan based on the information available and the liquidity conditions of these swaps.
|
|
•
|
Equity Risk Premium (ERP): the return in excess that equity assets are expected to yield over the risk-free rate. It is determined using a combination of historical approaches (ex post) backed by external publications and studies based on historical market returns series, and prospective approaches (ex ante), based on market publications, considering the medium- and long-term profit expectations based on the degree of maturity and development of each country.
|
|
•
|
Beta Coefficient: a measure of the volatility, or systematic risk, of an equity asset in comparison to the entire market. It is estimated based on a series of historical share prices of comparable companies listed on the stock exchange, to estimate the correlation between the company shares´ returns and the stock market returns, of the country where the company is listed. The main underlying data used in these calculations are obtained from independent and renowned external information sources.
|
F-38
The main underlying data used in these calculations are obtained from independent and renowned external information sources.
The discount rates applied to the cash flow projections in
2018
and
2017
for the main CGUs are as follows:
|
2018
|
2017
|
|||
|
Discount rate in local currency
|
Before tax
|
After-tax
|
Before tax
|
After-tax
|
|
Spain
|
8.3%
|
6.4%
|
7.7%
|
5.9%
|
|
Brazil
|
14.4%
|
11.2%
|
14.0%
|
10.9%
|
|
United Kingdom
|
7.5%
|
6.3%
|
7.5%
|
6.3%
|
|
Germany
|
6.9%
|
5.2%
|
6.2%
|
4.7%
|
Perpetuity growth rate
Cash flow projections from the sixth year are calculated using an expected constant growth rate (g), considering the analyst consensus estimates for each business and country, based on the maturity of the industry and technology, and the degree of development of each country. Each indicator is compared to the forecasted long-term real and nominal GDP growth of each country and growth data from external sources, adjusting any particular case with specific characteristics related with the business evolution.
The perpetuity growth rates applied to the cash flow projections in
2018
and
2017
for the main CGUs are as follows:
|
Perpetuity growth rate
in local currency
|
2018
|
2017
|
|
Spain
|
0.9%
|
0.8%
|
|
Brazil
|
4.5%
|
4.5%
|
|
United Kingdom
|
0.8%
|
0.8%
|
|
Germany
|
1.0%
|
1.0%
|
There were no significant changes in the perpetuity growth rates for
2018
compared to
2017
. Europe remains around
1%
.
In Brazil, the perpetuity growth rate is in line with the Brazilian Central Bank’s medium-term inflation target (
4%
, within a range of ±1.5 percentage points) and is aligned with the analyst consensus for the business plans horizon (below
4.5%
) yet below the forecasted nominal GDP growth rate (which oscillates around
6.5%
). A conservative outlook was maintained in line with analysts’ expectations.
Sensitivity to changes in assumptions
The Group performs a sensitivity analysis of the impairment test by considering reasonable changes in the main assumptions used in the test. For the main CGU, the following maximum increases or decreases, expressed in percentage points (percentage points), were assumed:
|
Changes in key assumptions,
In percentage points (percentage points) |
Spain
|
United Kingdom
|
Germany
|
Brazil
|
|
Financial variables
|
|
|
|
|
|
Discount rate
|
+/- 0.5
|
+/- 1
|
+/- 0.5
|
+/- 1
|
|
Perpetuity growth rates
|
+/- 0.25
|
+/- 0.5
|
+/- 0.25
|
+/- 0.5
|
|
Operating variables
|
|
|||
|
OIBDA Margin
|
+/- 2
|
+/- 1.25
|
+/- 1.25
|
+/- 2
|
|
Ratio of CapEx/Revenues
|
+/- 1
|
+/- 0.63
|
+/- 0.63
|
+/- 1
|
For the sensitivity analysis of the valuation of Telefónica United Kingdom, the threshold of the reasonable variations of financial assumptions has been increased, due to the uncertainty of Brexit (to +/-
1
percentage points in the discount rate and +/-
0.5
percentage points in the perpetuity growth rate). In the case of the reasonable variations of the operating
F-39
variables, there is also a significant gap between these valuations and the carrying value. Although the final result of Brexit could have a negative effect on Telefónica United Kingdom, it must be pointed out that, since the Brexit referendum took place in 2016, the company has not experienced any worsening of its operating variables, recording growth in revenue, OIBDA and OIBDA margin in the last two years in local currency (see Note 4).
The sensitivity analysis revealed a comfortable gap between the recoverable value and carrying amount for the rest of CGU at December 31, 2018.
In the case of Telefónica Argentina, an increase of
200
basis points (
21.2%
to
23.2%
) in its WACC, would generate a negative impact through impairment of goodwill of approximately
13
million euros. This increase in WACC, combined with a lower terminal growth rate of
0.75
percentage points, would increase this negative impact to
95
million euros. In turn, a
1.25
percentage points drop in the OIBDA margin and a
0.63
percentage points increase in the investment/sales ratio would have no impact on the carrying value of this goodwill.
F-40
The composition of and movement in the items constituting net “Property, plant and equipment” in
2018
and
2017
were as follows:
|
2018
|
|
|
|
|
|
|
|
|
|
|
|
|
|
|
|
Millions of euros
|
Balance at 12/31/17
|
|
Additions
|
|
Depreciation
|
|
Disposals
|
|
Transfers and others
|
|
Translation
differences and
hyperinflation
adjustments
|
|
Balance at 12/31/18
|
|
|
Land and buildings
|
4,383
|
|
42
|
|
(368
|
)
|
(29
|
)
|
77
|
|
205
|
|
4,310
|
|
|
Plant and machinery
|
25,297
|
|
1,305
|
|
(4,905
|
)
|
(6
|
)
|
4,204
|
|
(549
|
)
|
25,346
|
|
|
Furniture, tools and other items
|
1,267
|
|
134
|
|
(478
|
)
|
(21
|
)
|
340
|
|
(41
|
)
|
1,201
|
|
|
PP&E in progress
|
3,278
|
|
4,660
|
|
—
|
|
(15
|
)
|
(5,401
|
)
|
(84
|
)
|
2,438
|
|
|
Total PP&E
|
34,225
|
|
6,141
|
|
(5,751
|
)
|
(71
|
)
|
(780
|
)
|
(469
|
)
|
33,295
|
|
|
2017
|
|
|
|
|
|
|
|
|
|
|
|
|
|
|
|
|
|
Millions of euros
|
Balance at 12/31/16
|
|
Additions
|
|
Depreciation
|
|
Disposals
|
|
Transfers and others
|
|
Translation
differences and
hyperinflation
adjustments
|
|
Inclusion
of companies |
|
Balance at 12/31/17
|
|
|
Land and buildings
|
4,858
|
|
64
|
|
(391
|
)
|
(14
|
)
|
139
|
|
(293
|
)
|
20
|
|
4,383
|
|
|
Plant and machinery
|
26,770
|
|
2,096
|
|
(5,062
|
)
|
4
|
|
3,455
|
|
(2,039
|
)
|
73
|
|
25,297
|
|
|
Furniture, tools and other items
|
1,426
|
|
223
|
|
(500
|
)
|
(4
|
)
|
230
|
|
(117
|
)
|
9
|
|
1,267
|
|
|
PP&E in progress
|
3,339
|
|
4,496
|
|
—
|
|
(8
|
)
|
(4,237
|
)
|
(323
|
)
|
11
|
|
3,278
|
|
|
Total PP&E
|
36,393
|
|
6,879
|
|
(5,953
|
)
|
(22
|
)
|
(413
|
)
|
(2,772
|
)
|
113
|
|
34,225
|
|
The gross cost, accumulated depreciation and impairment losses of property, plant and equipment at
December 31, 2018
and
2017
were as follows:
|
Balance at December 31, 2018
|
||||||||
|
Millions of euros
|
Gross cost
|
|
Accumulated depreciation
|
|
Impairment losses
|
|
PP&E
|
|
|
Land and buildings
|
11,949
|
|
(7,636
|
)
|
(3
|
)
|
4,310
|
|
|
Plant and machinery
|
102,615
|
|
(77,222
|
)
|
(47
|
)
|
25,346
|
|
|
Furniture, tools and other items
|
7,137
|
|
(5,931
|
)
|
(5
|
)
|
1,201
|
|
|
PP&E in progress
|
2,453
|
|
—
|
|
(15
|
)
|
2,438
|
|
|
Total PP&E
|
124,154
|
|
(90,789
|
)
|
(70
|
)
|
33,295
|
|
|
Balance at December 31, 2017
|
||||||||
|
Millions of euros
|
Gross cost
|
|
Accumulated depreciation
|
|
Impairment losses
|
|
PP&E
|
|
|
Land and buildings
|
11,344
|
|
(6,958
|
)
|
(3
|
)
|
4,383
|
|
|
Plant and machinery
|
96,335
|
|
(70,969
|
)
|
(69
|
)
|
25,297
|
|
|
Furniture, tools and other items
|
6,900
|
|
(5,624
|
)
|
(9
|
)
|
1,267
|
|
|
PP&E in progress
|
3,289
|
|
—
|
|
(11
|
)
|
3,278
|
|
|
Total PP&E
|
117,868
|
|
(83,551
|
)
|
(92
|
)
|
34,225
|
|
F-41
Investment by Telefónica Spain in property plant and equipment in
2018
and
2017
amounted to
1,387
and
1,451
million euros, respectively. Rapid fiber optic rollout, exceeding
21 million
premises passed by the end of 2018, as well as investments in LTE network, reaching
96%
population coverage.
Investment by Telefónica United Kingdom in property plant and equipment in
2018
and
2017
amounted to
777
and
727
million
euros, respectively. The investment has been focused on increasing LTE experience, achieving
99%
population coverage by the end of 2018, and also pursuing the improvement of network- capacity and quality.
Investment by Telefónica Germany in property plant and equipment in
2018
and
2017
amounted to
697
and
675
million
euros, respectively. The company continued its dedication to extend LTE coverage, achieving a coverage of
88%
by year-end 2018.
Investment by Telefónica Brazil in property plant and equipment in
2018
and
2017
amounted to
1,625
and
1,842
million
euros, respectively. The investment was mainly dedicated to extend the coverage and capacity of LTE mobile networks, the deployment and connection of fiber network, the improvement of network quality, the extension of fiber network in the fixed business, as well as network simplification and digitalization of processes and systems.
Investment by Telefónica Hispam Norte in property plant and equipment in
2018
and
2017
amounted to
460
and
658
million
euros, respectively. This investment has been mainly focused on improving the coverage and capacity of LTE networks, deployment of ultra-broadband fixed capabilities (fiber / HFC) in Colombia, as well as processes and systems simplification and digitalization in the region.
Investment by Telefónica Hispam Sur in property plant and equipment in
2018
and
2017
amounted to
997
and
1,268
million euros, respectively. This investment has been mainly focused on improving the coverage and capacity of LTE networks and ultra-broadband fixed capabilities (fiber / HFC).
"Transfers and others" in 2018 includes the reclasification of property, plant and equipment of Telefónica Móviles Guatemala and Telefónica Móviles El Salvador amounting to
157
and
91
million euros, respectively, recorded in "Non-current assets classified as held for sale" of the statements of financial position (see Note 28).
The result of the translation to euros of property, plant and equipment by the companies of the Group in Argentina and Venezuela, together with the effect of the hyperinflation adjustments (see Note 2) are shown in the column "Translation differences and hyperinflation adjustments". The hyperinflation adjustment at January 1, 2018 corresponding to property, plant and equipment of the Group companies in Argentina totaled
1,029
million euros (mainly
623
million euros for plant and machinery and
298
million euros for buildings).
“Inclusion of companies” in 2017 mainly corresponds to the control that Coltel acquired over the companies Telebucaramanga, Metrotel and Optecom.
Telefónica Group companies purchased insurance policies to reasonably cover the possible risks to which their property, plant and equipment used in operations are subject, with suitable limits and coverage. Additionally, as part of its commercial activities and network deployment, the Group maintains several property acquisition commitments. The timing of scheduled payments in this regard is disclosed in Note 23.
Property, plant and equipment deriving from finance leases amounted to
190
million euros at
December 31, 2018
(
254 million
euros at
December 31, 2017
).
F-42
The breakdown of items related to associates and joint ventures recognized in the consolidated statements of financial position and consolidated income statements is as follows:
|
Millions of euros
|
12/31/2018
|
|
12/31/2017
|
|
|
Investments accounted for by the equity method
|
68
|
|
77
|
|
|
Loans to associates and joint ventures
|
—
|
|
16
|
|
|
Receivables from associates and joint ventures for current operations (Note 12)
|
33
|
|
32
|
|
|
Financial debt, associates and joint ventures
|
104
|
|
10
|
|
|
Payables to associates and joint ventures (Note 19)
|
520
|
|
491
|
|
|
Millions of euros
|
2018
|
|
2017
|
|
2016
|
|
|
Share of income (loss) of investments accounted for by the equity method
|
4
|
|
5
|
|
(5
|
)
|
|
Revenue from operations with associates and joint ventures
|
233
|
|
218
|
|
213
|
|
|
Expenses from operations with associates and joint ventures
|
14
|
|
20
|
|
32
|
|
|
Financial revenues with associates and joint ventures
|
1
|
|
—
|
|
—
|
|
|
Financial expenses with associates and joint ventures
|
—
|
|
—
|
|
2
|
|
The detail of the movement in investments in associates in
2018
and
2017
was as follows:
|
Investments accounted for by the equity method
|
Millions of euros
|
|
|
Balance at 12/31/16
|
76
|
|
|
Additions
|
8
|
|
|
Translation differences and other comprehensive income (loss)
|
(1
|
)
|
|
Income (loss)
|
5
|
|
|
Dividends
|
(11
|
)
|
|
Balance at 12/31/17
|
77
|
|
|
Additions
|
5
|
|
|
Disposals
|
(4
|
)
|
|
Translation differences and other comprehensive income (loss)
|
2
|
|
|
Income (loss)
|
4
|
|
|
Dividends
|
(14
|
)
|
|
Transfers and others
|
(2
|
)
|
|
Balance at 12/31/18
|
68
|
|
F-43
Significant shareholders
The significant shareholders of the Company are Banco Bilbao Vizcaya Argentaria, S.A. (BBVA), Caja de Ahorros y Pensiones de Barcelona ("la Caixa") and Blackrock, Inc., with stakes in Telefónica, S.A. of
5.28%
,
5.01%
and
5.08%
, respectively.
During 2018 and 2017, the Group carried out no significant transactions with Blackrock, Inc. other than the corresponding dividends paid.
The following is a summary of significant transactions between the Telefónica Group and BBVA and la Caixa companies, carried out at market prices:
|
Millions of euros
|
|
|
|
|
|
2018
|
BBVA
|
|
La Caixa
|
|
|
Finance costs
|
37
|
|
9
|
|
|
Receipt of services
|
6
|
|
6
|
|
|
Purchase of goods
|
—
|
|
60
|
|
|
Other expenses
|
3
|
|
—
|
|
|
Total costs
|
46
|
|
75
|
|
|
Finance income
|
42
|
|
—
|
|
|
Dividends received
(1)
|
11
|
|
N/A
|
|
|
Services rendered
|
26
|
|
60
|
|
|
Sale of goods
|
3
|
|
48
|
|
|
Other income
|
2
|
|
—
|
|
|
Total revenue
|
84
|
|
108
|
|
|
Finance arrangements: loans and capital contributions (borrower)
|
368
|
|
368
|
|
|
Finance arrangements: loans and capital contributions (lessee)
|
—
|
|
10
|
|
|
Guarantees
|
202
|
|
104
|
|
|
Commitments
|
—
|
|
94
|
|
|
Finance arrangements: loans and capital contributions (lender)
|
595
|
|
891
|
|
|
Dividends paid
|
124
|
|
105
|
|
|
Factoring operations
|
643
|
|
300
|
|
(
1)
At
December 31, 2018
, Telefónica holds a
0.66%
stake (
0.66%
stake
at
December 31, 2017
) in the share capital of Banco Bilbao Vizcaya Argentaria, S.A. (see Note 11).
The nominal value of outstanding derivatives held with BBVA and la Caixa in
2018
amounted to
17,962
and
543
million euros, respectively (
21,749
million held with BBVA
and
404 million
euros held with La Caixa in 2017)
. As explained under Derivatives policy in Note 17, this figure is inflated by the use in some cases of several levels of derivatives applied to the nominal value of a single underlying. The net fair value of these same derivatives in the statement of financial position is
428
and
-
10
million euros, respectively at December 31, 2018 (
390
and
-28 million
euros, respectively, at
December 31, 2017)
. Additionally, at
December 31, 2018
, collateral guarantees on derivatives from BBVA and la Caixa have been received, amounting to
8
and
6 million
euros, respectively (at December 31, 2017, there were collateral guarantees on derivatives provided to BBVA amounting to
286 million
).
F-44
|
Millions of euros
|
|
|
|
|
|
2017
|
BBVA
|
|
La Caixa
|
|
|
Finance costs
|
35
|
|
5
|
|
|
Receipt of services
|
2
|
|
9
|
|
|
Purchase of goods
|
—
|
|
56
|
|
|
Other expenses
|
7
|
|
—
|
|
|
Total costs
|
44
|
|
70
|
|
|
Finance income
|
28
|
|
—
|
|
|
Contracts of management
|
1
|
|
—
|
|
|
Dividends received
|
11
|
|
N/A
|
|
|
Services rendered
|
38
|
|
71
|
|
|
Sale of goods
|
4
|
|
43
|
|
|
Total revenue
|
82
|
|
114
|
|
|
Finance arrangements: loans and capital contributions (borrower)
|
1,038
|
|
292
|
|
|
Finance arrangements: loans and capital contributions (lender)
|
—
|
|
14
|
|
|
Guarantees
|
222
|
|
51
|
|
|
Commitments
|
—
|
|
85
|
|
|
Finance arrangements: loans and capital contributions (lessee)
|
1,209
|
|
414
|
|
|
Dividends
|
128
|
|
104
|
|
|
Factoring operations
|
—
|
|
250
|
|
On the other hand, in July 2018, there was a non-extinguishing modifying novation of the investment and agreement between shareholders related to Telefónica Consumer Finance, E.F.C., S.A. signed between Telefónica, S.A., CaixaBank Consumer Finance, E.F.C., S.A. (formerly Finconsum, E.F.C., S.A.) and CaixaBank, S.A. on September 6, 2013, adhered to by Telefónica Consumer Finance, E.F.C., S.A. on February 6, 2014 (the "Novation of the Agreement of Investment and Contract between Shareholders"), in order to implement as an activity of Telefónica Consumer Finance, E.F.C., S.A. the granting of financing products from users from the universe of customers of the Telefónica Group in Spain, as well as for the corporate governance of Telefónica Consumer Finance, E.F.C., S.A. to adapt to the new regulatory framework applicable to the Financial Credit Institutions.
Similarly, in September 2018, a statement of intent was signed between Telefónica Digital España, S.L.U. and Banco Bilbao Vizcaya Argentaria, S.A., in order to explore a potential partnership to offer financing to consumers, the self-employed and small companies in Argentina, Colombia, Peru and Mexico.
Likewise, in December 2018, a financial collaboration agreement was signed between Telefónica, S.A. and Banco Bilbao Vizcaya Argentaria, S.A., with special conditions for employees, pensioners and early-retirees of the Telefónica Group.
Other related parties
The most significant balances and transactions with associates and joint ventures are detailed in Note 9.
During 2018, the Directors and senior executives performed no transactions with Telefónica, S.A. or any Telefónica Group company other than those in the Group’s normal trading activity and business.
Compensation and other benefits paid to members of the Board of Directors and senior executives are detailed in Note 26.g and Appendix II.
Telefónica contracted a civil liability insurance scheme (D&O) for Directors, managers and staff with similar functions in the Telefónica Group, with standard conditions in these type of insurance and a premium attributable to
2018
of
1,916,210
euros
(
1,943,007
euros
in
2017
). This scheme provides coverage for Telefónica, S.A. and its subsidiaries in certain cases.
Certain Telefónica Group subsidiaries performed transactions in 2018 with Global Dominion Access Group, related to the Group´s ordinary course of business, mainly in Telefónica de España amounting to
25
million euros (
23
million euros in 2017).
A representative from Telefónica remains on China Unicom’s board of directors, and vice versa (see Note 11), as well as an industrial alliance with this company. In 2015 a "joint venture" with China Unicom was incorporated, for the
F-45
development of Big Data Services in China, using the "Smart Steps" technology developed by Telefónica. Telefónica's stake in this Company is
45%
through Telefónica Digital España, S.L., with China Unicom Big Data Limited Corporation owning the remaining
55%
stake. In 2018 this company obtained a turnover equivalent to
10
million euros. Similarly, the operation consisting of the entry of the company Beijing Jingdong Financial Technology Holding Co., Ltd., controlled by JD.com, in the aforementioned "joint venture" was approved in December 2018, which will result in a capital increase fully to subscribe by Beijing Jingdong Financial Technology Holding Co., Ltd. (
17
%, approximately) with the consequent dilution of the current shareholders (Telefónica will held about
33%
, approximately).
F-46
The breakdown of financial assets and other non-current assets of the Telefónica Group at December 31, 2018 and December 31, 2017 is as follows:
|
Millions of euros
|
12/31/2018
|
|
12/31/2017
|
|
|
Non-current financial assets (Note 14)
|
6,393
|
|
7,771
|
|
|
Investments
|
573
|
|
650
|
|
|
Credits and others financial assets
|
1,050
|
|
1,183
|
|
|
Deposits and guarantees
|
1,624
|
|
2,625
|
|
|
Trade receivables
|
488
|
|
638
|
|
|
Impairment of trade receivables
|
(118
|
)
|
(137
|
)
|
|
Derivative financial assets (Note 17)
|
2,776
|
|
2,812
|
|
|
Other non-current assets
|
716
|
|
396
|
|
|
Contractual assets (Note 20)
|
108
|
|
—
|
|
|
Deferred expenses (Note 20)
|
191
|
|
—
|
|
|
Prepayments
|
417
|
|
396
|
|
|
Total
|
7,109
|
|
8,167
|
|
Non-current financial assets
The movement in investments, credits and others financial assets, deposits and guarantees, trade receivables and impairment of trade receivables in 2018 and 2017, is as follows:
|
Millions of euros
|
Investments
|
|
Credits and other financial assets
|
|
Deposits and guarantees
|
|
Trade receivables
|
|
Impairment of trade receivables
|
|
|
Balance at 12/31/16
|
825
|
|
1,177
|
|
1,938
|
|
593
|
|
(154
|
)
|
|
Acquisitions
|
16
|
|
358
|
|
955
|
|
602
|
|
(12
|
)
|
|
Disposals
|
(155
|
)
|
(173
|
)
|
(156
|
)
|
(59
|
)
|
41
|
|
|
Translation differences
|
(7
|
)
|
(41
|
)
|
(258
|
)
|
(40
|
)
|
16
|
|
|
Fair value adjustments and financial updates
|
5
|
|
4
|
|
84
|
|
(5
|
)
|
—
|
|
|
Transfers and other
|
(34
|
)
|
(142
|
)
|
62
|
|
(453
|
)
|
(28
|
)
|
|
Balance at 12/31/17
|
650
|
|
1,183
|
|
2,625
|
|
638
|
|
(137
|
)
|
|
First application of IFRS 9 impact
|
—
|
|
—
|
|
—
|
|
(201
|
)
|
17
|
|
|
Acquisitions
|
65
|
|
2,077
|
|
66
|
|
662
|
|
(21
|
)
|
|
Disposals
|
(24
|
)
|
(663
|
)
|
(728
|
)
|
(148
|
)
|
10
|
|
|
Translation differences
|
(5
|
)
|
(43
|
)
|
(149
|
)
|
(12
|
)
|
1
|
|
|
Fair value adjustments and financial updates
|
(115
|
)
|
23
|
|
18
|
|
(4
|
)
|
—
|
|
|
Transfers and other
|
2
|
|
(1,527
|
)
|
(208
|
)
|
(447
|
)
|
12
|
|
|
Balance at 12/31/18
|
573
|
|
1,050
|
|
1,624
|
|
488
|
|
(118
|
)
|
F-47
Investments
“Investments” includes the fair value of investments in companies where Telefónica exercises no significant control and for which there is no specific short-term disposal plan (see Note 3.i).
Additionally, the Telefónica Group’s shareholding in BBVA amounted to
205
million euros (
314
million euros at December 31, 2017), representing
0.66%
of its share capital at December 31, 2018 (same percentage at December 31, 2017).
At December 31, 2018, Telefónica maintained a
0.59%
stake in the share capital of China Unicom (Hong Kong) Limited, valued at
169
million euros (same percentage at December 31, 2017, valued at
205
million euros).
In 2017, shares of China Unicom (Hong Kong) Limited were sold representing
0.24%
of its share capital for
72
million euros, that had a negative impact in Net financial expense of
4
million euros.
At December 31, 2018, Telefónica maintained a
9.44%
stake in the share capital of Promotora de Informaciones, S.A. (Prisa), valued at
93
million euros
(
11.78%
at December 31, 2017 valued at
27
million euros). In 2018 Telefónica subscribed the capital increase of PRISA, acquiring
42.2
million new shares and selling the rest of the preferred subscription rights. The net amount of the transaction was
49
million euros.
With the application of IFRS 9, the shares described above, classified as financial available-for-sale assets at December 31, 2017, have been reclassified as of January 1, 2018 to the categories of financial assets at fair value thought other comprehensive income, equity instruments (see Note 14).
In June 2017, Telefónica sold its entire shareholding in Mediaset Premium (representing
11.1%
), which had a negative impact on net financial expense of
76
million euros.
"Transfers and other" in 2017 primarily includes the prior stake in Colombian companies Telebucaramanga, Metrotel y Optecom (see Note 5).
Long-term credits and other financial assets
The composition of long-term credits is as follows:
|
Millions of euros
|
12/31/2018
|
|
12/31/2017
|
|
|
Long-term receivables for indirect taxes
|
731
|
|
189
|
|
|
Other long-term credits
|
319
|
|
994
|
|
|
Total
|
1,050
|
|
1,183
|
|
In 2018 two final decisions in favor of Telefónica Brazil were passed, which recognized the right to deduct the state tax on goods and services (ICMS) from the calculation basis of the Social Integration Program-PIS (Programa de Integração Social) and the Financing of Social Security-COFINS (Contribuição para Financiamento da Seguridade Social). These decisions cover the period from September 2003 to June 2017, and the period from July 2004 to June 2013.
Once the values were determined, Telefónica Brazil presented to the tax authorities a refund request for the payments of PIS/COFINS affected by the judicial decision, together with the corresponding default interest. The total amount, recorded as additions of Credits and other financial assets in the table above, amounted to
6,240
million Brazilian reals (around
1,454
million euros at an average exchange rate of 2018). The impact on the consolidated income statement amounted to
3,386
million Brazilian reals (
789
million euros), reducing the “Taxes” item under “Other expenses” (Note 23), and
2,854
million Brazilian reals (
665
million euros) under “Finance Income”.
In August 2018 Telefónica Brazil started compensating the credits. In October 2018 the competent authority in Brazil filed a review of the supporting documentation with the purpose of approving the PIS and COFINS credits. This review is still ongoing at the date of approval of these consolidated financial statements. Telefónica Brazil met all the requests of this procedure and it continues compensating the credits, in line with the favorable decision issued by the court.
The outstanding credit at December 31, 2018 amounted to
4,915
million Brazilian reals (
1,107
million euros at the closing exchange rate for 2018). “Long-term receivables for indirect taxes” includes the amount expected to be offset in more than 12 months, off
539
million (
568
million euros at short-term, see Note 22).
F-48
The Company is still engaged in three other lawsuits of the same nature (including the lawsuits of the companies GVT and Telemig, currently incorporated in Telefónica Brazil). According to the company’s estimates, the contingent assets for these processes, which comprise various periods between December 2001 and June 2017, lie in a range between
1,700
and
2,200
million Brazilian reals (between
383
and
496
million euros at the year-end exchange rate for 2018).
“Other long-term credits” at December 31, 2017 included long-term financial assets of the subsidiary Seguros de Vida y Pensiones Antares, S.A., fundamentally fixed-income securities, amounting to
692
million euros. At December 31, 2018, these long-term financial assets amounted to
634
million euros and were reclassified as non-current assets classified as held for sale (see Note 28). These assets are mainly intended to cover obligations from the defined benefit plans of Telefónica de España (ITP and Survival) but do not qualify as “plan assets” under Employee Benefits (IAS 19) (see Note 21). Likewise, this line item includes long-term financial assets of Telefónica Germany amounting to
62
and
58
million euros at December 31, 2018 and 2017, respectively, that are mainly intended to cover obligations from the defined benefit plan of Telefónica Germany but do not represent "plan assets" in accordance with IAS 19 (see Note 21).
The vast majority of long-term credits, recognized at amortized cost (Note 14), are considered to be low credit risk assets, therefore the impairment analysis was carried out on the basis of expected credit losses in the next
12
months.
Deposits and guarantees
Telefónica Brazil has non-current judicial deposits amounting to
810
million euros (see Note 21) at December 31, 2018 (
1,598
million euros at December 31, 2017).
At December 31, 2018, there were deposits related to the collateral guarantees on derivatives signed by Telefónica, S.A. and its counterparties for the credit risk management of derivatives amounting to
687
million euros of which
276
million euros cross currency swap (
902
million euros at December 31, 2017 that included
701
million euros related to cross currency swap).
In addition,
120,000
bonds issued by Telefónica Emisiones, S.A.U. are deposited in a securities account of Telefónica SA linked to these collateral contracts as guarantee for a nominal amount of
105
million euros.
The vast majority deposits and guarantees recognized at amortized cost (Note 14), are considered to be low credit risk assets, therefore the impairment analysis was carried out on the basis of expected credit losses in the next 12 months.
F-49
The detail of receivables and other current assets of the Telefónica Group at December 31, 2018 and December 31, 2017 is as follows:
|
Millions of euros
|
12/31/2018
|
|
12/31/2017
|
|
|
Receivables (Note 14)
|
8,419
|
|
8,727
|
|
|
Trade receivables
|
10,666
|
|
10,891
|
|
|
Impairment of trade receivables
|
(2,657
|
)
|
(2,563
|
)
|
|
Receivables from associates and joint ventures (Note 9)
|
33
|
|
32
|
|
|
Other receivables
|
377
|
|
367
|
|
|
Other current assets
|
2,160
|
|
1,366
|
|
|
Contractual assets (Note 20)
|
341
|
|
—
|
|
|
Capitalized costs (Note 20)
|
566
|
|
—
|
|
|
Prepayments
|
1,253
|
|
1,366
|
|
|
Total
|
10,579
|
|
10,093
|
|
Public-sector net trade receivables at
December 31, 2018
and
2017
amounted to
345 million
euros and
346 million
euros, respectively.
The movement in impairment of trade receivables in
2018
and
2017
is as follows:
|
|
Millions of euros
|
|
|
Impairment provision at December 31, 2016
|
2,795
|
|
|
Allowances
|
998
|
|
|
Inclusion of companies
|
14
|
|
|
Amounts applied
|
(1,019
|
)
|
|
Translation differences and other
|
(225
|
)
|
|
Impairment provision at December 31, 2017
|
2,563
|
|
|
Adjustment on initial application of NIIF 9 (Note 14)
|
126
|
|
|
Allowances
|
853
|
|
|
Transfers
|
(10
|
)
|
|
Amounts applied
|
(768
|
)
|
|
Translation differences and other
|
(107
|
)
|
|
Impairment provision at December 31, 2018
|
2,657
|
|
The detail of the age of the accounts receivable balances from customers and their corrections for impairment as of December 31, 2018 and 2017 is as follows:
F-50
|
Millions of euros
|
12/31/2018
|
12/31/2017
|
||||||
|
Trade receivables
|
Impairment
|
Trade receivables
|
Impairment
|
|||||
|
Trade receivables pending billing
|
2,682
|
|
(25
|
)
|
3,015
|
|
(16
|
)
|
|
Amount not overdue invoiced
|
3,508
|
|
(195
|
)
|
3,446
|
|
(166
|
)
|
|
Less than 90 days
|
1,532
|
|
(164
|
)
|
1,566
|
|
(83
|
)
|
|
Between 90 and 180 days
|
519
|
|
(168
|
)
|
455
|
|
(228
|
)
|
|
Between 180 and 360 days
|
364
|
|
(212
|
)
|
385
|
|
(244
|
)
|
|
More than 360 days
|
2,061
|
|
(1,893
|
)
|
2,024
|
|
(1,826
|
)
|
|
Total
|
10,666
|
|
(2,657
|
)
|
10,891
|
|
(2,563
|
)
|
F-51
The other current financial assets include the following items:
|
•
|
Derivative financial assets with a short-term maturity or not used to hedge non-current items in the consolidated statement of financial position amounted to
922
million euros at December 31, 2018 (
845
million euros at December 31, 2017, see Note 17).
|
|
•
|
Short-term investments in financial instruments recognized at fair value to cover commitments undertaken by the Group’s insurance companies, amounted to
87
million euros at December 31, 2018 (
130
million euros at December 31, 2017) and were recorded at fair value. At December 31, 2017 Antares amounted to
60
million euros. At December 31, 2018 Antares amounting to
52
million euros that were reclassified as non-current assets classified as held for sale (see Note 28).
|
|
•
|
Short-term deposits and guarantees amounted to
95
million euros at December 31, 2018 (
125
million euros at December 31, 2017) which includes current judicial deposits amounting to
71
million euros (see Note 21) constituted by Telefónica Brazil (
82
million euros at December 31, 2017).
|
|
•
|
Short-term credits, net of impairment provisions, amounted to
1,102
million euros at December 31, 2018 (
877
million euros at December 31, 2017). At December 31, 2018, this amount included bank deposits with a maturity between three and twelve months formalized by Telefónica, S.A. which amounted to
972
million euros (
700
million euros at December 31, 2017).
|
The vast majority of short-term credits, deposits and guarantees recognized at amortized cost and at fair value with changes in "Other comprehensive income" (Note 14) are considered to be low credit risk assets.
Current financial assets that are highly liquid and have maturity periods of three months or less from the date contracted, and present an insignificant risk of value changes, are recorded under “Cash and cash equivalents” on the accompanying consolidated statement of financial position.
F-52
The breakdown of financial assets of the Telefónica Group at December 31, 2017 was as follows:
|
December 31, 2017
|
||||||||||||||||||||||
|
|
Fair value through profit or loss
|
|
|
|
|
Measurement hierarchy
|
|
|
|
|
|
|
|
|
||||||||
|
Millions of euros
|
Held for trading
|
|
Fair value option
|
|
Available-for-sale
|
|
Hedges
|
|
Level 1 (Quoted prices)
|
|
Level 2 (Other directly observable market inputs)
|
|
Level 3 (Inputs not based on observable market data)
|
|
Held-to-maturity invest-ments
|
|
Rest of financial assets at amortized cost
|
|
Total carrying amount
|
|
Total fair value
|
|
|
Non-current financial assets (Note 11)
|
1,074
|
|
250
|
|
1,117
|
|
1,738
|
|
822
|
|
3,339
|
|
18
|
|
—
|
|
3,592
|
|
7,771
|
|
7,771
|
|
|
Investments
|
—
|
|
—
|
|
650
|
|
—
|
|
567
|
|
83
|
|
—
|
|
—
|
|
—
|
|
650
|
|
650
|
|
|
Credits and other financial assets
|
—
|
|
250
|
|
467
|
|
—
|
|
86
|
|
613
|
|
18
|
|
—
|
|
466
|
|
1,183
|
|
1,183
|
|
|
Deposits and guarantees
|
—
|
|
—
|
|
—
|
|
—
|
|
—
|
|
—
|
|
—
|
|
—
|
|
2,625
|
|
2,625
|
|
2,625
|
|
|
Derivative instruments
|
1,074
|
|
—
|
|
—
|
|
1,738
|
|
169
|
|
2,643
|
|
—
|
|
—
|
|
—
|
|
2,812
|
|
2,812
|
|
|
Trade receivables
|
—
|
|
—
|
|
—
|
|
—
|
|
—
|
|
—
|
|
—
|
|
—
|
|
638
|
|
638
|
|
501
|
|
|
Impairment of trade receivables
|
—
|
|
—
|
|
—
|
|
—
|
|
—
|
|
—
|
|
—
|
|
—
|
|
(137
|
)
|
(137
|
)
|
—
|
|
|
Current financial assets
|
163
|
|
60
|
|
66
|
|
731
|
|
105
|
|
915
|
|
—
|
|
169
|
|
14,884
|
|
16,073
|
|
16,073
|
|
|
Trade receivables (*) (Note 12)
|
—
|
|
—
|
|
—
|
|
—
|
|
—
|
|
—
|
|
—
|
|
—
|
|
11,290
|
|
11,290
|
|
8,727
|
|
|
Impairment of trade receivables (*) (Note 12)
|
—
|
|
—
|
|
—
|
|
—
|
|
—
|
|
—
|
|
—
|
|
—
|
|
(2,563
|
)
|
(2,563
|
)
|
—
|
|
|
Other financial assets (Note 13)
|
163
|
|
60
|
|
66
|
|
731
|
|
105
|
|
915
|
|
—
|
|
169
|
|
965
|
|
2,154
|
|
2,154
|
|
|
Cash and cash equivalents
|
—
|
|
—
|
|
—
|
|
—
|
|
—
|
|
—
|
|
—
|
|
—
|
|
5,192
|
|
5,192
|
|
5,192
|
|
|
Total
|
1,237
|
|
310
|
|
1,183
|
|
2,469
|
|
927
|
|
4,254
|
|
18
|
|
169
|
|
18,476
|
|
23,844
|
|
23,844
|
|
(*) For comparative purposes, and considering the impact of the IFRS 9 application on the impairment of trade receivables, short-term trade receivables are included in the breakdown of financial assets by category as of December 31, 2017.
F-53
The opening balance as of January 1, 2018, after the impacts of the first application of IFRS 9 (see Notes 2 and 3), is as follows:
|
January 1, 2018
|
||||||||||||||||||||||||||
|
|
Fair value through profit or loss
|
Fair value through other comprehensive income
|
|
|
Measurement hierarchy
|
|
|
|
|
|
|
|||||||||||||||
|
Millions of euros
|
Balance at December 31, 2017
|
First application of FRS9 Impact
|
Held for tra-ding
|
|
Fair value option
|
|
Debt instru-ments
|
|
Equity instru-ments
|
|
Hedges
|
|
Level 1 (Quo-ted prices)
|
|
Level 2 (Other directly obser-vable market inputs)
|
|
Level 3 (Inputs not based on obser-vable market data)
|
|
Amor-tized cost
|
|
Total carrying amount
|
|
Total fair value
|
|
||
|
Non-current financial assets
|
7,771
|
|
(184
|
)
|
1,118
|
|
250
|
|
511
|
|
631
|
|
1,738
|
|
822
|
|
3,408
|
|
18
|
|
3,339
|
|
7,587
|
|
7,587
|
|
|
Investments
|
650
|
|
—
|
|
19
|
|
—
|
|
—
|
|
631
|
|
—
|
|
567
|
|
83
|
|
—
|
|
—
|
|
650
|
|
650
|
|
|
Credits and other financial assets
|
1,183
|
|
—
|
|
25
|
|
250
|
|
442
|
|
—
|
|
—
|
|
86
|
|
613
|
|
18
|
|
466
|
|
1,183
|
|
1,183
|
|
|
Deposits and guarantees
|
2,625
|
|
—
|
|
—
|
|
—
|
|
—
|
|
—
|
|
—
|
|
—
|
|
—
|
|
—
|
|
2,625
|
|
2,625
|
|
2,625
|
|
|
Derivative instruments
|
2,812
|
|
—
|
|
1,074
|
|
—
|
|
—
|
|
—
|
|
1,738
|
|
169
|
|
2,643
|
|
—
|
|
—
|
|
2,812
|
|
2,812
|
|
|
Trade receivables
|
638
|
|
(201
|
)
|
—
|
|
—
|
|
69
|
|
—
|
|
—
|
|
—
|
|
69
|
|
—
|
|
368
|
|
437
|
|
317
|
|
|
Impairment of trade receivables
|
(137
|
)
|
17
|
|
—
|
|
—
|
|
—
|
|
—
|
|
—
|
|
—
|
|
—
|
|
—
|
|
(120
|
)
|
(120
|
)
|
—
|
|
|
Current financial assets
|
16,073
|
|
(37
|
)
|
803
|
|
60
|
|
488
|
|
—
|
|
731
|
|
105
|
|
1,977
|
|
—
|
|
13,954
|
|
16,036
|
|
16,036
|
|
|
Trade receivables
|
11,290
|
|
89
|
|
575
|
|
—
|
|
487
|
|
—
|
|
—
|
|
—
|
|
1,062
|
|
—
|
|
10,317
|
|
11,379
|
|
8,690
|
|
|
Impairment of trade receivables
|
(2,563
|
)
|
(126
|
)
|
—
|
|
—
|
|
—
|
|
—
|
|
—
|
|
—
|
|
—
|
|
—
|
|
(2,689
|
)
|
(2,689
|
)
|
—
|
|
|
Other current financial assets
|
2,154
|
|
—
|
|
228
|
|
60
|
|
1
|
|
—
|
|
731
|
|
105
|
|
915
|
|
—
|
|
1,134
|
|
2,154
|
|
2,154
|
|
|
Cash and cash equivalents
|
5,192
|
|
—
|
|
—
|
|
—
|
|
—
|
|
—
|
|
—
|
|
—
|
|
—
|
|
—
|
|
5,192
|
|
5,192
|
|
5,192
|
|
|
Total
|
23,844
|
|
(221
|
)
|
1,921
|
|
310
|
|
999
|
|
631
|
|
2,469
|
|
927
|
|
5,385
|
|
18
|
|
17,293
|
|
23,623
|
|
23,623
|
|
The main impacts of the first application of IFRS 9 at January 1, 2018 are the following:
|
•
|
Impact of
221
million euros (with counterparty in reserves net of tax impact) corresponding to the increase of impairment of trade receivables classified at amortized cost (
200
million euros) and the decrease of the book value of trade assets classified at fair value (
21
million euros).
|
In addition, according to the new categories introduced by IFRS 9, the following reclassifications have been recorded:
|
•
|
Reclassification of trade receivables associated with portfolios whose business model is based on a combination of held to collect contractual cash flows and sell the financial asset, or only to sell, valued as financial assets at amortized cost as of December 31, 2017, to financial assets at fair value through other comprehensive income and fair value through profit or loss amounting to
556
and
596
million euros respectively. The impact on the book value of these assets was a decrease of
21
million euros as of January 1, 2018, previously mentioned. On the other hand, the first application impact of non-current trade receivables amounting to
201
million euros, mainly includes the reclassification of part of trade receivables classified as financial assets at amortized cost as of December 31, 2017, to the category of financial assets at fair value through profit or loss according to the business
|
F-54
model determined in accordance with IFRS 9 (commercial portfolio sales operations) and these assets are presented in the short-term at fair value.
|
•
|
Reclassification of held-to-maturity investments as of December 31, 2017 to the category of financial assets at amortized cost (
169
million euros). The Group intends to hold these assets until maturity to collect the contractual cash flows, which correspond to payment of principal and interest. There has been no impact on the book value of these assets due to the application of IFRS 9.
|
|
•
|
Reclassification of the investments, classified as available-for-sale financial assets at December 31, 2017 to the categories of financial assets at fair value through other comprehensive income, equity instruments (
631
million euros) and financial assets at fair value through profit or loss (
19
million euros). This choice of valuation is based on the Group's management objectives in relation to its investments. Impairment losses from previous years corresponding to these assets at fair value through other comprehensive income, recorded at December 31, 2017 in retained earnings, have been reclassified to other comprehensive income in equity, in the line of adjustments on initial application of new reporting standards.
|
|
•
|
Reclassification of the rest of financial assets classified as available for sale at December 31, 2017, to financial assets at fair value through other comprehensive income, debt instruments (
443
million euros) and to financial assets at fair value through profit or loss (
90
million euros), without impact on the accounting valuation of these financial assets.
|
The breakdown of financial assets of the Telefónica Group at December 31, 2018 is as follows:
|
December 31, 2018
|
||||||||||||||||||||||
|
|
Fair value through profit or loss
|
Fair value through other comprehensive income
|
|
|
Measurement hierarchy
|
|
|
|
|
|
|
|||||||||||
|
Millions of euros
|
Held for trading
|
|
Fair value option
|
|
Debt instru-ments
|
|
Equity instru-ments
|
|
Hedges
|
|
Level 1 (Quoted prices)
|
|
Level 2 (Other directly observable market inputs)
|
|
Level 3 (Inputs not based on observable market data)
|
|
Amortized cost
|
|
Total carrying amount
|
|
Total fair value
|
|
|
Non-current financial assets (Note 11)
|
860
|
|
—
|
|
70
|
|
545
|
|
1,950
|
|
660
|
|
2,765
|
|
—
|
|
2,968
|
|
6,393
|
|
6,393
|
|
|
Investments
|
28
|
|
—
|
|
—
|
|
545
|
|
—
|
|
492
|
|
81
|
|
—
|
|
—
|
|
573
|
|
573
|
|
|
Credits and other financial assets
|
6
|
|
—
|
|
—
|
|
—
|
|
—
|
|
6
|
|
—
|
|
—
|
|
1,044
|
|
1,050
|
|
1,050
|
|
|
Deposits and guarantees
|
—
|
|
—
|
|
—
|
|
—
|
|
—
|
|
—
|
|
—
|
|
—
|
|
1,624
|
|
1,624
|
|
1,624
|
|
|
Derivative instruments
|
826
|
|
—
|
|
—
|
|
—
|
|
1,950
|
|
162
|
|
2,614
|
|
—
|
|
—
|
|
2,776
|
|
2,776
|
|
|
Trade receivables
|
—
|
|
—
|
|
70
|
|
—
|
|
—
|
|
—
|
|
70
|
|
—
|
|
418
|
|
488
|
|
370
|
|
|
Impairment of trade receivables
|
—
|
|
—
|
|
—
|
|
—
|
|
—
|
|
—
|
|
—
|
|
—
|
|
(118
|
)
|
(118
|
)
|
—
|
|
|
Current financial assets
|
961
|
|
—
|
|
681
|
|
—
|
|
660
|
|
154
|
|
2,148
|
|
—
|
|
14,018
|
|
16,320
|
|
16,320
|
|
|
Trade receivables (Note 12)
|
580
|
|
—
|
|
680
|
|
—
|
|
—
|
|
—
|
|
1,260
|
|
—
|
|
9,816
|
|
11,076
|
|
8,419
|
|
|
Impairment of trade receivables (Note 12)
|
—
|
|
—
|
|
—
|
|
—
|
|
—
|
|
—
|
|
—
|
|
—
|
|
(2,657
|
)
|
(2,657
|
)
|
—
|
|
|
Other current financial assets (Note 13)
|
381
|
|
—
|
|
1
|
|
—
|
|
660
|
|
154
|
|
888
|
|
—
|
|
1,167
|
|
2,209
|
|
2,209
|
|
|
Cash and cash equivalents
|
—
|
|
—
|
|
—
|
|
—
|
|
—
|
|
—
|
|
—
|
|
—
|
|
5,692
|
|
5,692
|
|
5,692
|
|
|
Total
|
1,821
|
|
—
|
|
751
|
|
545
|
|
2,610
|
|
814
|
|
4,913
|
|
—
|
|
16,986
|
|
22,713
|
|
22,713
|
|
The calculation of the fair values of the Telefónica Group’s debt instruments required an estimate, for each currency and counterparty, of a credit spread curve using the prices of the Group’s bonds and credit derivatives.
F-55
a) Share capital and share premium
2018
At December 31, 2018, Telefónica, S.A.´s share capital amounted to
5,192,131,686
euros and consisted of
5,192,131,686
fully paid ordinary shares of a single series, par value of
1
euro, all recorded by the book-entry system and traded on the Spanish electronic trading system (“Continuous Market”), where they form part of the “Ibex 35” Index, on the four Spanish Stock Exchanges (Madrid, Barcelona, Valencia and Bilbao) and listed on the London and Buenos Aires Stock Exchanges, and on the New York and Lima Stock Exchanges, through American Depositary Shares (‘ADSs’).
2017
On September 20, 2017, the public deed evidencing the conversion of bonds, share capital increase and amortization of bonds was registered, whereby issuing
154,326,696
new ordinary shares of a nominal value of
1 euro
each within the framework of the conversion of the bonds mandatorily convertible into shares of Telefónica, S.A. that were issued by its wholly owned subsidiary, Telefónica Participaciones, S.A.U., on September 24, 2014, guaranteed by Telefónica, S.A. As a result of the aforementioned conversion and the referred capital increase, the share capital of Telefónica, S.A. was set at
5,192,131,686
euros, divided into
5,192,131,686
ordinary shares of the same class and series, with a nominal value of
1
euro each.
At December 31, 2017, Telefónica, S.A.´s share capital amounted to
5,192,131,686
euros and comprised
5,192,131,686
fully paid ordinary shares of a single series, par value of
1
euro.
Authorizations by Shareholders’ Meeting
With respect to share capital-related authorizations, on June 12, 2015, authorization was given at the Annual Shareholders’ Meeting of Telefónica, S.A. for the Board of Directors, at its discretion and in accordance with the Company’s needs, to increase the Company’s capital, once or several times, within a maximum
five years
period from that date, up to a maximum nominal increase of
2,469,208,757
euros, equivalent to half of Telefónica, S.A.’s share capital at that date, by issuing and placing new shares, with or without a share premium, and, in all cases, in exchange for cash, expressly considering the possibility that the new shares may not be fully subscribed. The Board of Directors was also empowered to exclude, partially or fully, pre-emptive subscription rights under the terms of article 506 of the Spanish Corporate Enterprises Act. However, the power to exclude pre-emptive rights is limited to
20%
of the Company’s share capital on the date of adoption of this resolution. Pursuant to the aforementioned authorizations, as of December 31, 2018, the Board of Directors may increase the share capital up to the maximum nominal amount of
2,469,208,757
euros.
In addition, at the June 9, 2017 Shareholders’ Meeting of Telefónica, S.A., authorization was given for the Board of Directors to issue debentures, bonds, promissory notes and other fixed-income securities and hybrid instruments, including preferred shares, in all cases be they simple, tradable, and/or convertible and/or granting the holders thereof a share in the earnings of the company, as well as warrants, with the power to exclude the pre-emptive rights of shareholders. The issuance of the aforementioned securities may be conducted at one or several times, at any time, within a maximum five-year period from that date. These securities may be in the form of debentures, bonds, promissory notes or any other kind of fixed-income security, or debt instruments of similar category or hybrid instruments in any legally admitted form (including yet not restricted to preferred shares), plain or, in the case of debentures, bonds and hybrid instruments convertible into shares of the Company and/or exchangeable for shares of any of the Group companies, or any other company and/or giving the holders thereof a share in the earnings of the Company. This delegation also includes warrants or other similar securities that might give the right to directly or indirectly subscribe or acquire shares, whether newly issued or outstanding, and which may be paid for by physical delivery or by offset. The aggregated amount of the issuance(s) of securities approved under this delegation of powers may not exceed the sum of
25,000 million
euros or the equivalent in another currency at any time. For promissory notes, the outstanding balance of promissory notes issued under this authorization will be calculated for the purpose of the aforementioned limit. Likewise, for the sake of the aforementioned limit, in the case of warrants, the sum of the premiums and exercise prices of the warrants for each issuance approved under this delegation shall be taken into account.
F-56
Furthermore, on June 8, 2018, shareholders voted to authorize the acquisition by the Board of Directors of Telefónica, S.A. treasury shares, up to the limits and pursuant to the terms and conditions established at the Shareholders’ Meeting, within a maximum five-year period
from that date. However, it specified that in no circumstances could the par value of the shares acquired, added to that of the treasury shares already held by Telefónica, S.A. and by any of its controlled subsidiaries, exceed the maximum legal percentage at any time (currently
10%
of Telefónica, S.A.’s share capital).
b) Dividends
Dividends distribution in 2018
Approval was given at the General Shareholders' Meeting of June 8, 2018 to pay a gross dividend of
0.40
for each company share issued, in circulation and carrying entitlement to this distribution against unrestricted reserves, payable in two tranches. The first payment of a gross amount of
0.20
in cash per share was made on June 15, 2018 amounting to
1,025
million euros and the second payment of a gross amount of
0.20
in cash per share was made on December 20, 2018 amounting to
1,026 million
euros.
Dividends distribution in 2017
Approval was given at the General Shareholders' Meeting of June 9, 2017 to pay a gross dividend of
0.40
for each company share issued, in circulation and carrying entitlement to this distribution against unrestricted reserves, payable in two tranches. The first payment of a gross amount of
0.20
in cash per share was made on June 16, 2017 amounting to
994 million
euros and the second payment of a gross amount of
0.20
in cash per share was made on December 14, 2017 amounting to
1,025 million
euros.
Dividends distribution in 2016 and capital increase
Approval was given at the General Shareholders' Meeting of May 12, 2016 to pay a dividend with a charge to unrestricted reserves of a fixed gross
0.40
euros per outstanding share carrying dividend rights. The dividend was paid in full on May 19, 2016 and the total amount paid was
1,906 million
euros.
On November 11, 2016 the Executive Commission of Telefónica, S.A.’s Board of Directors approved to pay a scrip dividend amounting to approximately
0.35
euros per share, consisting of the assignment of free allotment rights with an irrevocable purchase commitment by the Company, and a subsequent capital increase with a charge to reserves by such amount as may be determined pursuant to the terms and conditions of the resolution, by means of the issue of new ordinary shares having a par value of
one
euro, to fulfill said allotments. The payment was made on December 7, 2016 with an impact in equity amounting to
500 million
euros.
Additionally, the shareholders of
70.01%
of the free-of-charge allotment rights were entitled, therefore, to receive new shares of Telefónica, S.A. Thus, the final number of shares issued in the capital increase was
137,233,781
shares with a nominal value of
1
euro each.
Proposed distribution of profit attributable to equity holders of the parent
Telefónica, S.A. generated
3,014 million
euros of profit in 2018.
The Company’s Board of Directors will submit the following proposed distribution of 2018 profit for approval at the Shareholders’ Meeting:
|
|
Millions of euros
|
|
|
Legal reserve
|
—
|
|
|
Other reserves
|
3,014
|
|
|
Total
|
3,014
|
|
F-57
c) Other equity instruments
Undated deeply subordinated securities
Unless specified otherwise, undated deeply subordinated securities were issued by Telefónica Europe, B.V.
The characteristic of undated deeply subordinated securities are as follows (millions of euros):
|
Issue date
|
Annual
Fix
|
|
Variable
|
Exercisable by issuer
|
12/31/2017
|
|
Tender Offer
|
|
Amount repurchased
|
|
Redemption
|
|
12/31/2018
|
|
|
03/22/18
|
3
|
%
|
from 12/04/23 rate SWAP + spread incremental
|
2023
|
—
|
|
—
|
|
—
|
|
—
|
|
1,250
|
|
|
3.875
|
%
|
from 09/22/26 rate SWAP + spread incremental
|
2026
|
—
|
|
—
|
|
—
|
|
—
|
|
1,000
|
|
|
|
12/07/17
|
2.625
|
%
|
from 06/07/23 rate SWAP + spread incremental
|
2023
|
1,000
|
|
—
|
|
—
|
|
—
|
|
1,000
|
|
|
09/15/16
|
3.750
|
%
|
from 03/15/22 rate SWAP + spread incremental
|
2022
|
1,000
|
|
—
|
|
—
|
|
—
|
|
1,000
|
|
|
03/30/15(*)
|
8.50
|
%
|
from 03/30/20 rate SWAP + spread incremental
|
2020
|
452
|
|
—
|
|
—
|
|
—
|
|
452
|
|
|
12/04/14
|
4.20
|
%
|
from 12/04/19 rate SWAP + spread incremental
|
2019
|
850
|
|
850
|
|
(145
|
)
|
—
|
|
705
|
|
|
03/31/14
|
5
|
%
|
from 03/31/20 rate SWAP + spread incremental
|
2020
|
750
|
|
750
|
|
(158
|
)
|
—
|
|
592
|
|
|
5.875
|
%
|
from 03/31/24 rate SWAP + spread incremental
|
2024
|
1,000
|
|
1,000
|
|
—
|
|
—
|
|
1,000
|
|
|
|
11/26/2013(**)
|
6.75
|
%
|
from 11/26/20 rate SWAP + spread incremental
|
2020
|
716
|
|
716
|
|
(511
|
)
|
—
|
|
205
|
|
|
09/18/13
|
6.5
|
%
|
from 09/18/18 rate SWAP + spread incremental
|
2018
|
1,125
|
|
1,125
|
|
(652
|
)
|
(473
|
)
|
—
|
|
|
7.625
|
%
|
from 09/18/21 rate SWAP + spread incremental
|
2021
|
625
|
|
625
|
|
(333
|
)
|
—
|
|
292
|
|
|
|
|
|
|
|
|
7,518
|
|
|
|
|
|
|
|
7,496
|
|
(*) Issued by Colombia Telecomunicaciones, S.A. ESP (
500 million
U.S. dollars)
(**) Tender offer over
600
million pounds of undated deeply subordinated securities of which
428
million pounds were accepted (equivalent to
511
million euros at the rate of exchange at the date of the issuance).
In all issuances of undated deeply subordinated securities, the issuer has an option to defer the payment of coupons and holders of such securities cannot call for payment.
As the repayment of principal and the payment of coupons depend solely on Telefónica’s decision, these undated deeply subordinated securities are equity instruments and are presented under “Other equity instruments” in the accompanying consolidated statement of changes in equity.
In March 2018, Telefónica Europe, B.V. executed an operation to proactively manage its hybrid capital composed of: a) two new emissions per aggregate amount of
2,250
million euros; and b) a tender offer on a basket of hybrids in euros and pounds with early amortization dates between September 2018 and March 2024. The issuer accepted the purchase in cash and immediately thereafter these were amortized in advance. The operations of new issuance and repurchase were liquidated with dates March 22, 2018 and March 23, 2018, respectively.
On September 18, 2018, Telefónica Europe, B.V. exercised the issue call option of
1,125 million
euros of undated deeply subordinated securities issued on September 18, 2013 with the subordinated guarantee of Telefónica. Through
F-58
the exercise of this option, the company proceeded to repurchase, at par, and amortize all of the outstanding securities at the date of this issuance, in an aggregate principal amount of
473 million
euros.
In
2018
, the payment of the coupons related to the undated deeply subordinated securities, in an aggregate amount, net of tax effects, of
392 million
euros (
263 million
and
255 million
euros in
2017
and
2016
, respectively), was recorded as “Retained earnings” in the consolidated statements of changes in equity.
In 2018, the coupons related to the undated deeply subordinated securities has been impacted by the premium of the tender
offer amounting to
139 million
euros, net of tax effects.
Notes mandatorily convertible into shares of Telefónica, S.A.
On September 24, 2014, Telefónica Participaciones, S.A.U. issued
1,500 million
euros of notes mandatorily convertible into new and/or existing shares of Telefónica, S.A. at a nominal fixed interest rate of
4.9%
, due on September 25, 2017, guaranteed by Telefónica, S.A. At maturity of the notes, Telefónica, S.A. delivered a total of
154,341,669
shares of Telefónica, S.A. on behalf of Telefónica Participaciones, S.A.U. at a conversion price of
9.7174
euros per share (minimum conversion price after the standard adjustments included in the terms of the notes). To meet the conversion of the notes, Telefónica, S.A. issued
154,326,696
new shares in execution of a capital increase and delivered
14,973
treasury shares.
These mandatorily convertible notes were compound instruments split into two components, namely a debt component amounting to
215 million
euros, corresponding to the present value of the coupons; and an equity component for the remaining amount, since the issuer opted to convert the treasury shares at a fixed ratio, as included in the heading “other equity instruments”. The third coupon was paid in
2017
and amounted to
74 million
euros (
74 million
euros in
2016
).
d) Legal reserve
According to the consolidated text of the Spanish Corporate Enterprises Act, companies must transfer
10%
of profit for the year to a legal reserve until this reserve reaches at least
20%
of share capital. The legal reserve can be used to increase capital by the amount exceeding
10%
of the increased share capital amount. Except for this purpose, until the legal reserve exceeds the limit of
20%
of share capital, it can only be used to offset losses, if there are no other reserves available
. At
December 31, 2017
, after the capital increase carried forward in
2017
, the Company needed to increase the legal reserve by an additional
51 million
euros, until the legal reserve was fully constituted. The proposed distribution of
2017
profit included a corresponding allocation of
51 million
euros
. At
December 31, 2018
the Company had duly set aside
1,038
million euros to comply with legal reserve requirements.
e) Retained earnings
These reserves include undistributed profits of companies constituting the consolidated Group less interim dividends paid against profit for the year, actuarial gains and losses, the impact of the asset ceiling on defined benefit plans and the payment of coupons related to subordinated securities, if applicable.
In addition, these reserves include equity effects derived from the restatement for inflation of the financial statements of the Group companies operating in Venezuela and Argentina, and the translation differences generated upon translating their respective financial statements into euros using the exchange rate at the end of the period (see Note 2).
These reserves also include revaluation reserves and the reserve for canceled share capital. These reserves are regulated by some restrictions for their distribution.
Revaluation reserves
The balance of “Revaluation reserves” arose as a result of the revaluation made pursuant to Spanish Royal Decree-Law 7/1996 of June 7, and may be used, free of tax, to offset any losses incurred in the future and to increase capital. It may also be allocated to unrestricted reserves, provided that the capital gain has been realized.
The capital gain will be deemed to have been realized in respect of the portion on which the depreciation was recorded for accounting purposes or when the revalued assets were transferred or recognized. In this respect,
6 million
euros were reclassified to “Retained earnings” in
2018
(
6 million
euros in
2017
and
8 million
euros in
2016
), corresponding to revaluation reserves subsequently considered to be unrestricted. At
December 31, 2018
, this reserve amounted to
72 million
euros (
78 million
euros at
December 31, 2017
).
F-59
Reserve for canceled share capital
In accordance with Section 335.c) of the Spanish Corporate Enterprises Act and to render null and void the right of opposition provided for in Section 334 of the same Act, whenever the Company decreases capital, should record a reserve for canceled share capital for an amount equal to the par value of the canceled shares, which can only be used upon satisfaction of the same requirements as those applicable to the reduction of share capital. In
2018
and 2017, no amount was recorded in this account. In
2016
, the reserve for canceled share capital amounted to
75 million
euros, the same amount as the capital reduction made in the year. The cumulative amount at
December 31, 2018
and
2017
was
731
million euros each, respectively.
f) Translation differences
The breakdown of the accumulated contribution of translation differences attributable to equity holders of the parent at December 31 is as follows:
|
Millions of euros
|
2018
|
|
2017
|
|
2016
|
|
|
Brazilian real
|
(10,603
|
)
|
(8,710
|
)
|
(5,999
|
)
|
|
Pound sterling
|
(3,266
|
)
|
(3,223
|
)
|
(2,918
|
)
|
|
Other currencies
|
(882
|
)
|
(3,921
|
)
|
(2,658
|
)
|
|
Total Group
|
(14,751
|
)
|
(15,854
|
)
|
(11,575
|
)
|
Translation differences for 2017 and 2016 have been revised due to the
change in the presentation policy for
hyperinflation effects in equity, which affects the translation differences accumulated in each of the periods of the subsidiaries in Venezuela (see Note 2).
g) Adjustment on initial application of new reporting standards IFRS 9 and IFRS 15
The initial application of new reporting standards IFRS 9 Financial instruments and IFRS 15 Revenue from contracts with customers (see Note 2), effective as of
January 1, 2018
, had a net impact on total equity amounting to
-165 million
euros and
743 million
euros, respectively, with the following detail:
|
Millions of euros
|
IFRS 9
|
|
IFRS 15
|
|
Total
|
|
|
Gross impact on equity
|
(221
|
)
|
1,006
|
|
785
|
|
|
Tax effect
|
56
|
|
(263
|
)
|
(207
|
)
|
|
Impact on equity
|
(165
|
)
|
743
|
|
578
|
|
|
Attributable to equity holders
|
(142
|
)
|
654
|
|
512
|
|
|
Attributable to non-controlling interest
|
(23
|
)
|
89
|
|
66
|
|
The amount reclassified to other comprehensive income from retained earnings, related to impairment losses of previous years, was included in the adjustment on initial application (see Note 14).
h) Treasury share instruments
Telefónica, S.A. held the following treasury shares at
December 31, 2018
,
2017
and
2016
:
|
|
|
|
Euros per share
|
|
|
|
|
|||
|
|
Number of shares
|
|
Acquisition price
|
|
Trading price
|
|
Market value
(*)
|
|
%
|
|
|
Treasury shares at 12/31/18
|
65,496,120
|
|
10.48
|
|
7.34
|
|
481
|
|
1.26145
|
%
|
|
Treasury shares at 12/31/17
|
65,687,859
|
|
10.48
|
|
8.13
|
|
534
|
|
1.26514
|
%
|
|
Treasury shares at 12/31/16
|
141,229,134
|
|
10.48
|
|
8.82
|
|
1,246
|
|
2.80339
|
%
|
(*) Millions of euros
F-60
The following transactions involving treasury shares were carried out in
2018
,
2017
and
2016
:
|
|
Number of shares
|
|
|
Treasury shares at 12/31/15
|
141,639,159
|
|
|
Acquisitions
|
77,087,297
|
|
|
Employee share option plan
|
(2,869,334
|
)
|
|
Capital reduction
|
(74,627,988
|
)
|
|
Treasury shares at 12/31/16
|
141,229,134
|
|
|
Acquisitions
|
—
|
|
|
Employee share option plan
|
(3,518,795
|
)
|
|
Capital reduction
|
(72,022,480
|
)
|
|
Treasury shares at 12/31/17
|
65,687,859
|
|
|
Acquisitions
|
—
|
|
|
Employee share option plan
|
(191,739
|
)
|
|
Other movements
|
—
|
|
|
Treasury shares at 12/31/18
|
65,496,120
|
|
There were no treasury shares purchases in
2018
and 2017
(
668
million euros
in
2016
).
The most significant transaction with treasury shares in 2017 was the swap with Koninklijke KPN NV (hereinafter, KPN) by which Telefónica delivered
72.0 million
of its treasury shares (representing
1.43%
of its share capital) in exchange for
178.5 million
shares of its subsidiary Telefónica Deutschland Holding AG, representing
6.0%
of the share capital of the latter, amounting to
754 million
euros (see Note 5).
On September 30, 2017, and September 30, 2018, the first and second cycles, respectively, of the Telefónica, S.A. long-term incentive plans called “Performance and Investment Plan 2014-2019” (PIP 2014-2019) and "Talent for the Future Share Plan (TFSP)" ended, which did not entail the delivery of any shares (see Note 24).
On July 31, 2017, the Global Employee Share Plan III matured and
3,187,055
treasury shares were delivered to the Group employees who met the requirements (see Note 24).
On June 30, 2016, the third phase of the Telefónica, S.A. long-term incentive plan called “Performance and Investment Plan 2011-2016” (PIP 2011-2016) ended, which did not entail the delivery of any shares to Telefónica Group managers.
On October 13, 2016, pursuant to the resolution of the share capital reduction, by the cancellation of treasury shares, as adopted by the Annual General Shareholders’ Meeting of Telefónica held on May 12, 2016, the public deed of this share capital reduction was registered. Therefore,
74,627,988
of the treasury shares of Telefónica, S.A. totaling
813 million
euros were canceled.
The Company maintains a derivative financial instrument subject to net settlement on a notional equivalent of
21.7 million
of Telefónica shares in
2018
(
35.2 million
shares in
2017
), recognized under “Current financial liabilities” in the consolidated financial statements for both fiscal years.
i) Equity attributable to non-controlling interests
“Equity attributable to non-controlling interests” represents the share of non-controlling interests in the equity and income or loss for the year of fully consolidated Group companies. The movements in this balance for the
2018
,
2017
and
2016
consolidated statements of financial position are as follows:
F-61
|
Millions of euros
|
Balance at 12/31/17
|
|
Sales of non-controlling interests and inclusion of companies
|
|
Acquisitions of non-controlling interests and exclusion of companies
|
|
Dividends paid
|
|
Profit/(loss) for the year
|
|
Change in translation differences
|
|
Other movements
|
|
Balance at 12/31/18
|
|
|
Telefônica Brasil, S.A.
|
5,018
|
|
—
|
|
—
|
|
(406
|
)
|
556
|
|
(550
|
)
|
(14
|
)
|
4,604
|
|
|
Telefónica Deutschland Holding, A.G.
|
3,114
|
|
—
|
|
—
|
|
(238
|
)
|
(88
|
)
|
—
|
|
85
|
|
2,873
|
|
|
Colombia Telecomunicaciones, S.A., ESP
|
523
|
|
—
|
|
—
|
|
—
|
|
41
|
|
(19
|
)
|
(22
|
)
|
523
|
|
|
Telefónica Centroamericana Inversiones, S.L.
|
307
|
|
—
|
|
—
|
|
(28
|
)
|
30
|
|
7
|
|
—
|
|
316
|
|
|
Telxius Telecom, S.A.
|
694
|
|
139
|
|
—
|
|
(231
|
)
|
80
|
|
5
|
|
(10
|
)
|
677
|
|
|
Other
|
42
|
|
—
|
|
1
|
|
(3
|
)
|
—
|
|
(1
|
)
|
1
|
|
40
|
|
|
Total
|
9,698
|
|
139
|
|
1
|
|
(906
|
)
|
619
|
|
(558
|
)
|
40
|
|
9,033
|
|
|
Millions of euros
|
Balance at 12/31/16
|
|
Sales of non-controlling interests and inclusion of companies
|
|
Acquisitions of non-controlling interests and exclusion of companies
|
|
Dividends paid
|
|
Profit/(loss) for the year
|
|
Change in translation differences
|
|
Other movements
|
|
Balance at 12/31/17
|
|
|
Telefônica Brasil, S.A.
|
5,756
|
|
25
|
|
—
|
|
(320
|
)
|
336
|
|
(772
|
)
|
(7
|
)
|
5,018
|
|
|
Telefónica Deutschland Holding, A.G.
|
4,150
|
|
—
|
|
(671
|
)
|
(229
|
)
|
(140
|
)
|
—
|
|
4
|
|
3,114
|
|
|
Colombia Telecomunicaciones, S.A., ESP
|
(88
|
)
|
605
|
|
—
|
|
—
|
|
26
|
|
(4
|
)
|
(16
|
)
|
523
|
|
|
Telefónica Centroamericana Inversiones, S.L.
|
354
|
|
—
|
|
—
|
|
(22
|
)
|
18
|
|
(43
|
)
|
—
|
|
307
|
|
|
Telxius Telecom, S.A.
|
—
|
|
690
|
|
—
|
|
—
|
|
7
|
|
(3
|
)
|
—
|
|
694
|
|
|
Other
|
56
|
|
—
|
|
—
|
|
(12
|
)
|
(1
|
)
|
(2
|
)
|
1
|
|
42
|
|
|
Total
|
10,228
|
|
1,320
|
|
(671
|
)
|
(583
|
)
|
246
|
|
(824
|
)
|
(18
|
)
|
9,698
|
|
|
Millions of euros
|
Balance at 12/31/15
|
|
Sales of non-controlling interests and inclusion of companies
|
|
Acquisitions of non-controlling interests and exclusion of companies
|
|
Dividends paid
|
|
Profit/(loss) for the year
|
|
Change in translation differences
|
|
Other movements
|
|
Balance at 12/31/16
|
|
|
Telefônica Brasil, S.A.
|
4,644
|
|
—
|
|
—
|
|
(232
|
)
|
257
|
|
1,099
|
|
(12
|
)
|
5,756
|
|
|
Telefónica Deutschland Holding, A.G.
|
4,638
|
|
—
|
|
—
|
|
(263
|
)
|
(217
|
)
|
—
|
|
(8
|
)
|
4,150
|
|
|
Colombia Telecomunicaciones, S.A., ESP
|
(30
|
)
|
—
|
|
—
|
|
—
|
|
(32
|
)
|
(7
|
)
|
(19
|
)
|
(88
|
)
|
|
Telefónica Centroamericana Inversiones, S.L.
|
354
|
|
—
|
|
—
|
|
(28
|
)
|
19
|
|
8
|
|
1
|
|
354
|
|
|
Other
|
59
|
|
1
|
|
(8
|
)
|
(1
|
)
|
3
|
|
3
|
|
(1
|
)
|
56
|
|
|
Total
|
9,665
|
|
1
|
|
(8
|
)
|
(524
|
)
|
30
|
|
1,103
|
|
(39
|
)
|
10,228
|
|
Note 4 contains the revenues, OIBDA, capital expenditure and the main items of the statement of financial position for the main segments of the Telefónica Group with non-controlling interests, namely Telefónica Brazil and Telefónica Germany. The detail of these figures for Colombia Telecomunicaciones is as follows:
F-62
|
Millions of euros
|
|
|
|
|
|
|
|
Colombia Telecomunicaciones
|
2018
|
|
2017
|
|
2016
|
|
|
Revenues
|
1,468
|
|
1,462
|
|
1,409
|
|
|
OIBDA
|
556
|
|
482
|
|
464
|
|
|
Depreciation and amortization
|
(385
|
)
|
(357
|
)
|
(296
|
)
|
|
Operating income
|
171
|
|
125
|
|
168
|
|
|
Capital Expenditure
|
192
|
|
796
|
|
330
|
|
|
Fixed Assets
|
1,950
|
|
2,221
|
|
1,710
|
|
|
Total allocated assets
|
3,073
|
|
3,246
|
|
2,788
|
|
|
Total allocated liabilities
|
1,615
|
|
1,790
|
|
3,226
|
|
The statements of cash flows of these companies are as follows:
|
Millions of euros
|
|
|
|
|
|
|
|
Telefónica Brazil
|
2018
|
|
2017
|
|
2016
|
|
|
Net cash flow provided by operating activities
|
3,599
|
|
3,710
|
|
3,123
|
|
|
Net cash flow used in investing activities
|
(2,012
|
)
|
(2,285
|
)
|
(2,039
|
)
|
|
Net cash flow used in financing activities
|
(1,660
|
)
|
(1,653
|
)
|
(1,218
|
)
|
|
|
(73
|
)
|
(228
|
)
|
(134
|
)
|
|
Millions of euros
|
|
|
|
|
|
|
|
Telefónica Germany
|
2018
|
|
2017
|
|
2016
|
|
|
Net cash flow provided by operating activities
|
1,898
|
|
1,942
|
|
2,154
|
|
|
Net cash flow used in investing activities
|
(1,137
|
)
|
(1,223
|
)
|
(1,252
|
)
|
|
Net cash flow used in financing activities
|
(569
|
)
|
(706
|
)
|
(1,323
|
)
|
|
|
192
|
|
13
|
|
(421
|
)
|
|
Millions of euros
|
|
|
|
|
|
|
|
Colombia Telecomunicaciones
|
2018
|
|
2017
|
|
2016
|
|
|
Net cash flow provided by operating activities
|
344
|
|
324
|
|
198
|
|
|
Net cash flow used in investing activities
|
(167
|
)
|
(684
|
)
|
(278
|
)
|
|
Net cash flow used in financing activities
|
(229
|
)
|
407
|
|
70
|
|
|
|
(52
|
)
|
47
|
|
(10
|
)
|
In 2018, “Sales of non-controlling interests and inclusion of companies” reflects the effect of the sale of
16.65%
of the total share capital of Pontel to a subsidiary of the Pontegadea Group amounting to
378.8 million
euros. This participation is equivalent to an indirect participation of
9.99%
in the share capital of Telxius (see Note 5).
In
2017,
“Sales of non-controlling interests and inclusion of companies” reflects the effect of the capital increase in Colombia Telecomunicaciones (see Note 2) and the sale of
40%
of the total share capital of Telxius Telecom, S.A.U. to KKR amounting to
1,275 million
euros. The swap agreement with KPN is particularly noteworthy, whereby Telefónica delivered
72.0 million
of its treasury shares (representing
1.43%
of its share capital) in exchange for
178.5 million
shares of its subsidiary Telefónica Deutschland Holding AG, representing
6.0%
of the share capital of the latter (see Note 5).
F-63
The breakdown of financial liabilities at
December 31, 2018
and the corresponding maturities schedule is as follows:
|
Millions of euros
|
||||||||||||||||
|
|
Current
|
Non-current
|
|
|
||||||||||||
|
Maturity
|
2019
|
2020
|
2021
|
2022
|
2023
|
Subsequent years
|
Non-current total
|
Total
|
||||||||
|
Debentures and bonds
|
4,234
|
|
5,161
|
|
4,821
|
|
4,958
|
|
2,316
|
|
19,686
|
|
36,942
|
|
41,176
|
|
|
Promissory notes & commercial paper
|
1,979
|
|
113
|
|
—
|
|
—
|
|
117
|
|
245
|
|
475
|
|
2,454
|
|
|
Total Issues
|
6,213
|
|
5,274
|
|
4,821
|
|
4,958
|
|
2,433
|
|
19,931
|
|
37,417
|
|
43,630
|
|
|
Loans and other payables
|
2,925
|
|
515
|
|
876
|
|
525
|
|
849
|
|
2,865
|
|
5,630
|
|
8,555
|
|
|
Derivative instruments (Note 17)
|
230
|
|
628
|
|
300
|
|
224
|
|
138
|
|
997
|
|
2,287
|
|
2,517
|
|
|
Total
|
9,368
|
|
6,417
|
|
5,997
|
|
5,707
|
|
3,420
|
|
23,793
|
|
45,334
|
|
54,702
|
|
The estimate of future payments for interest on these financial liabilities at
December 31, 2018
is as follows:
1,624
million euros in
2019
,
1,399
million euros in
2020
,
1,171
million euros in
2021
,
1,021
million euros in 2022,
836
million euros in
2023
and
8,320
million euros
in years after
2023
. For floating rate financing, the Group mainly estimates future interest using the forward curve of the various currencies at
December 31, 2018
.
Derivative instruments consider the fair value of derivatives classified as financial liabilities, i.e. when they have a negative mark-to-market, yet excluding the fair value of derivatives classified as current financial assets (
922
million euros) and non-current (
2,776
million euros), i.e. when they have a positive mark-to-market.
In 2017 and 2018, the Group entered into agreements to extend payment terms with various suppliers, and with factoring companies when such payments are discounted. When the new extended payment terms exceed customary payment terms in the industry, trade liabilities are reclassified to other financial liabilities and the deferred payments made are recognized in net cash flow used in financing activities (see Note 25)
.
At
December 31, 2018
,
the corresponding amount pending payment, recognized in “Loans and other payables”, was
210
million euros (
153
million euros at
December 31, 2017
). The deferred payments made in relation to this item during the year amounted to
428
million euros (
717
million euros in 2017).
The composition of these financial liabilities by category at
December 31, 2018
and
2017
is as follows:
|
December 31, 2018
|
||||||||||||||||||
|
|
Fair value through profit or loss
|
|
Measurement hierarchy
|
|
|
|
||||||||||||
|
Millions of euros
|
Held for trading
|
|
Fair value option
|
|
Hedges
|
|
Level 1 (Quoted prices)
|
|
Level 2 (Other directly observable market inputs)
|
|
Level 3 (Inputs not based on observable market data)
|
|
Liabilities at amortized cost
|
|
Total carrying amount
|
|
Total fair value
|
|
|
Issues
|
—
|
|
—
|
|
—
|
|
—
|
|
—
|
|
—
|
|
43,630
|
|
43,630
|
|
44,939
|
|
|
Loans and other payables
|
—
|
|
—
|
|
—
|
|
—
|
|
—
|
|
—
|
|
8,555
|
|
8,555
|
|
8,517
|
|
|
Derivative instruments
|
870
|
|
—
|
|
1,647
|
|
71
|
|
2,446
|
|
—
|
|
—
|
|
2,517
|
|
2,517
|
|
|
Total financial liabilities
|
870
|
|
—
|
|
1,647
|
|
71
|
|
2,446
|
|
—
|
|
52,185
|
|
54,702
|
|
55,973
|
|
F-64
|
December 31, 2017
|
||||||||||||||||||
|
|
Fair value through profit or loss
|
|
Measurement hierarchy
|
|
|
|
||||||||||||
|
Millions of euros
|
Held for trading
|
|
Fair value option
|
|
Hedges
|
|
Level 1 (Quoted prices)
|
|
Level 2 (Other directly observable market inputs)
|
|
Level 3 (Inputs not based on observable market data)
|
|
Liabilities at amortized cost
|
|
Total carrying amount
|
|
Total fair value
|
|
|
Issues
|
—
|
|
—
|
|
—
|
|
—
|
|
—
|
|
—
|
|
43,694
|
|
43,694
|
|
47,166
|
|
|
Loans and other payables
|
—
|
|
—
|
|
—
|
|
—
|
|
—
|
|
—
|
|
8,900
|
|
8,900
|
|
9,010
|
|
|
Derivative instruments
|
1,180
|
|
—
|
|
1,972
|
|
80
|
|
3,072
|
|
—
|
|
—
|
|
3,152
|
|
3,152
|
|
|
Total financial liabilities
|
1,180
|
|
—
|
|
1,972
|
|
80
|
|
3,072
|
|
—
|
|
52,594
|
|
55,746
|
|
59,328
|
|
The calculation of the fair values of the Telefónica Group’s debt instruments required an estimate of the credit spread curve for each currency and corresponding subsidiary using the prices of the Group’s bonds and credit derivatives.
At
December 31, 2018
, some of the financing arranged by Telefónica Group companies in Latin America (Brazil, Panama, Ecuador and Guatemala), which amounted to approximately
2%
of the Telefónica Group’s gross debt, was subject to compliance with certain financial covenants. To date, these covenants are being met. Due to the absence of cross-defaults, breach of the covenants would not affect the debt at Telefónica, S.A. level.
Part of the amount owed by the Telefónica Group includes restatements related to amortized cost at
December 31, 2018
and
2017
as a result of fair value interest rate and exchange rate hedges.
Issues, promissory notes, commercial paper, loans and other payables
The movement in changes in issues, promissory notes, commercial paper, loans and other payables in 2018 and 2017 arising from financial activities is as follows:
|
|
Cash used in financing activities
|
|||||||||||||
|
Millions of euros
|
Balance at 12/31/17
|
|
Cash received
|
|
Cash paid
|
|
Translation differences and exchange gains and losses
|
|
Fair value adjustment and financial updates
|
|
Other movements
|
|
Balance at 12/31/18
|
|
|
Issues
|
41,288
|
|
4,289
|
|
(4,654
|
)
|
533
|
|
(280
|
)
|
—
|
|
41,176
|
|
|
Promissory notes and commercial paper
|
2,406
|
|
299
|
|
(255
|
)
|
4
|
|
—
|
|
—
|
|
2,454
|
|
|
Loans and other payables
|
8,900
|
|
3,465
|
|
(4,161
|
)
|
80
|
|
10
|
|
261
|
|
8,555
|
|
F-65
|
|
Cash used in financing activities
|
|||||||||||||
|
Millions of euros
|
Balance at 12/31/16
|
|
Cash received
|
|
Cash paid
|
|
Translation differences and exchange gains and losses
|
|
Fair value adjustment and financial updates
|
|
Other movements
|
|
Balance at 12/31/17
|
|
|
Issues
|
42,084
|
|
8,390
|
|
(6,687
|
)
|
(2,178
|
)
|
(296
|
)
|
(25
|
)
|
41,288
|
|
|
Promissory notes and commercial paper
|
3,360
|
|
60
|
|
(1,008
|
)
|
(6
|
)
|
—
|
|
—
|
|
2,406
|
|
|
Loans and other payables
|
11,397
|
|
4,209
|
|
(6,241
|
)
|
(699
|
)
|
(16
|
)
|
(250
|
)
|
8,900
|
|
Debentures and bonds
At
December 31, 2018
,
the nominal amount of outstanding debentures and bonds issues is
39,709
million euros (
39,581
million euros at
December 31, 2017
). Appendix III presents the characteristics of all outstanding debentures and bond issues at the year-end of
2018
, and the significant issues made during the year.
On July 24, 2017, the mandatory exchangeable bonds convertible into ordinary shares of Telecom Italia, S.p.A., issued by Telefónica, S.A. on July 24, 2014, for
750
million euros, matured. At the maturity date, the Company fulfilled its commitments to deliver the shares with the vesting of the equity swap instrument arranged for that purpose.
Telefónica, S.A. has a full and unconditional guarantee on issues made by Telefónica Emisiones, S.A.U., Telefónica Finanzas México, S.A. de C.V., Telefónica Europe, B.V. and Telefónica Participaciones, S.A.U., all of which are directly or indirectly fully-owned subsidiaries of Telefónica, S.A.
Promissory notes and commercial paper
The main programs for issuance of promissory notes and commercial paper are the following:
|
•
|
At
December 31, 2018
,
Telefónica Europe, B.V. had a commercial paper issuance program guaranteed by Telefónica, S.A. for up to
5,000
million euros. The outstanding balance of commercial paper issued under this program at
December 31, 2018
was
1,666
million euros,
issued at an average interest rate of -
0.23%
for
2018
(
1,850
million euros issued in
2017
at an average rate of -
0.17%
).
|
|
•
|
At
December 31, 2018
,
Telefónica, S.A. had a corporate promissory note program for
500
million euros, which can be increased to
2,000
million euros, with an outstanding balance at
December 31, 2018
of
181
million euros (
204
million euros in
2017
).
|
Interest-bearing debt
The average interest rate on outstanding loans and other payables at
December 31, 2018
was
1.70%
(
2.01%
in
2017
). This percentage does not include the impact of hedges arranged by the Group.
The main financing transactions included under “Interest-bearing debt” outstanding at
December 31, 2018
and
2017
and their nominal amounts are provided in Appendix V.
F-66
Interest-bearing debt arranged or repaid in
2018
mainly includes the following:
|
Description
|
Limit 12/31/2018 (million euros)
|
Currency
|
Outstanding balance 12/31/2018 (million euros)
|
Arrangement date
|
Maturity date
|
Drawndown 2018 (million euros)
|
Repayment 2018 (million euros)
|
||||
|
Telefónica, S.A.
|
|
|
|
|
|
|
|
|
|
|
|
|
Syndicated facility
(1)
|
5,500
|
|
EUR
|
—
|
|
03/15/2018
|
03/15/2023
|
—
|
|
—
|
|
|
Bilateral loan
|
100
|
|
EUR
|
100
|
|
11/24/2017
|
01/30/2026
|
100
|
|
—
|
|
|
Bilateral loan
|
100
|
|
EUR
|
100
|
|
12/28/2017
|
10/22/2020
|
100
|
|
—
|
|
|
Bilateral loan
|
385
|
|
EUR
|
385
|
|
12/20/2017
|
07/22/2019
|
385
|
|
—
|
|
|
Loan
(2)
|
—
|
|
EUR
|
—
|
|
03/08/2016
|
09/28/2018
|
—
|
|
(300
|
)
|
|
Bilateral loan
(3)
|
1,000
|
|
EUR
|
1,000
|
|
06/26/2014
|
06/26/2019
|
—
|
|
(500
|
)
|
|
Telxius Telecom, S.A.
|
|
|
|
|
|
|
|
|
|
|
|
|
Syndicated facility
(4)
|
300
|
|
EUR
|
300
|
|
12/01/2017
|
12/01/2023
|
300
|
|
—
|
|
|
Telefónica Europe, B.V.
|
|
|
|
|
|
|
|
|
|
|
|
|
Structured financing
(*)
|
—
|
|
EUR
|
1,500
|
|
11/28/2016
|
11/28/2024
|
750
|
|
—
|
|
|
(1)
|
On
March 15, 2018
, Telefónica, S.A. executed a syndicated facility agreement for an aggregate amount of
5,500
million euros which unifies and replaces two existing revolving credit facilities: a revolving credit facility for
3,000
million euros with maturity in February 2021, and a credit facility of
2,500
million euros with maturity in February
2022
. The facility agreement matures in
2023
, with two annual extension options, at the request of Telefónica, for a maximum maturity in
2025
.
|
|
(2)
|
On
September 28, 2018
, an early repayment was made by Telefónica, S.A. for the
300
million euros loan originally scheduled to mature on
March 8, 2021
.
|
|
(3)
|
On
July 17, 2018
, an early repayment was made by Telefónica, S.A. for
500
million euros originally scheduled to mature on
June 26, 2019
.
|
|
(4)
|
On
December 1, 2018
, Telxius Telecom, S.A. extended for
12
months its syndicated facility signed in December
2017
.
|
(*) Facility with amortization schedule, showing the undrawn amount in the column "Limit".
At
December 31, 2018
, the Telefónica Group presented availabilities of financing from different sources that amounted to approximately
12,219
million euros (
13,531
million euros at
December 31, 2017
), of which
11,887
million euros will mature in more twelve months.
Loans by currency
The breakdown of “Loans and other payables” by currency at
December 31, 2018
and
2017
, and the equivalent value of foreign-currency loans in euros, is as follows:
|
|
Outstanding balance (in millions)
|
|||||||
|
|
Local Currency
|
Euros
|
||||||
|
Currency
|
12/31/18
|
|
12/31/17
|
|
12/31/18
|
|
12/31/17
|
|
|
Euro
|
5,114
|
|
4,682
|
|
5,114
|
|
4,682
|
|
|
U.S. dollar
|
2,413
|
|
2,936
|
|
2,106
|
|
2,448
|
|
|
Brazilian real
|
2,964
|
|
3,939
|
|
668
|
|
993
|
|
|
Colombian peso
|
1,031,005
|
|
1,398,550
|
|
277
|
|
391
|
|
|
Pounds sterling
|
100
|
|
106
|
|
112
|
|
120
|
|
|
Peruvian nuevo sol
|
525
|
|
462
|
|
136
|
|
119
|
|
|
Other currencies
|
|
|
142
|
|
147
|
|
||
|
Total Group
|
|
|
8,555
|
|
8,900
|
|
||
The Telefónica Group is exposed to various financial market risks as a result of: (i) its ordinary business activity, (ii) debt incurred to finance its business, (iii) its investments in companies, and (iv) other financial instruments related to the above commitments.
The main market risks affecting the Group companies are as follows:
F-67
|
•
|
Exchange rate risk
: arises primarily from: (i) Telefónica’s international presence, through its investments and businesses in countries that use currencies other than the euro (primarily in Latin America, but also in the United Kingdom), (ii) debt denominated in currencies other than that of the country where the business is conducted or the home country of the company incurring such debt ,and (iii) for those trade receivables or payables in foreign currency related to the company with the transaction registered.
|
|
•
|
Interest rate risk
: arises primarily in connection with changes in interest rates affecting: (i) financial expenses on floating rate debt (or short-term debt likely to be renewed), due to changes in interest rates and (ii) the value of long-term liabilities at fixed interest rates.
|
|
•
|
Share price risk
: arises primarily from changes in the value of the equity investments (that may be bought, sold or otherwise involved in transactions), from changes in the value of derivatives associated with such investments, from changes in the value of treasury shares and from changes in the value of equity derivatives.
|
|
•
|
Liquidity risk
: the Telefónica Group is also exposed to liquidity risk if a mismatch arises between its financing needs (including operating and financial expenses, investment, debt redemptions and dividend commitments) and its sources of finance (including revenues, divestments, credit lines from financial institutions and capital market transactions). The cost of finance could also be affected by movements in the credit spreads (over benchmark rates) demanded by lenders.
|
|
•
|
Country risk
: refers to the possible decline in the value of assets, cash flows generated or cash flows returned to the parent company as a result of political, economic or social instability in the countries where the Telefónica Group operates, especially in Latin America.
|
|
•
|
Credit risk
: appears when a counterparty fails to meet or delays its payment obligations in accordance with the agreed terms, driving an impairment in an asset due to: (i) solvency issues, or (ii) no intention to pay.
|
Risk management
The Telefónica Group actively manages these risks through the use of derivatives (primarily on exchange rates, interest rates, share prices and commodities) and by incurring debt in local currencies, where appropriate, with a view to optimize the financial cost and to stabilizing cash flows, the income statement and investments. In this way, it attempts to protect the Telefónica Group’s solvency, facilitate financial planning and take advantage of investment opportunities.
The Telefónica Group manages its exchange rate risk and interest rate risk in terms of net financial debt plus commitments and net financial debt as calculated by the Group. The Telefónica Group believes that these parameters are more appropriate to understanding its debt position. Net financial debt and net financial debt plus commitments take into account the impact of the Group’s cash balance and cash equivalents including derivatives positions with a positive value linked to liabilities. Neither net financial debt nor net financial debt plus commitments as calculated by the Telefónica Group should be considered as a substitute for gross financial debt (the sum of current and non-current interest-bearing debt).
For a more detailed description on reconciliation of net financial debt and net financial debt plus commitments to gross financial debt
, see “Item 5. Operating and Financial Review and Prospects-Operating Results-Presentation of Financial Information-Net financial debt and net financial debt plus commitments”.
Exchange rate risk
The fundamental objective of the exchange rate risk management policy is that, in event of depreciation in foreign currencies relative to the euro, any potential losses in the value of the OIBDA generated by the businesses in such currencies, caused by depreciation in exchange rates of a foreign currency relative to the euro, are offset (to some extent) by savings from the reduction in the euro value of debt denominated in such currencies. This objective is also reflected on the decrease of the sensitivity to exchange rate variations of the net debt to OIBDA ratio, in order to protect the Group solvency. The degree of exchange rate hedging varies depending on the type of investment and may easily and actively be adjusted. For transactions of purchase or sale of business in currencies other than euro, additional hedges can be made on the estimate prices of the transactions or on estimated cash flows and OIBDA.
At
December 31, 2018
, the net financial debt in Latin American currencies was equivalent to approximately
4,209
million euros (
4,689
million euros in 2017). However, the Latin American currencies in which this debt is denominated is not distributed in proportion to the OIBDA generated in each currency. The future effectiveness of the strategy described above as a hedge of exchange rate risks therefore depends on which currencies depreciate relative to the euro.
F-68
Telefónica occasionally takes out dollar-denominated debt to hedge the euro-dollar intermediate component in the relation Euro-Latin American currencies, either in Spain (where such debt is associated with an investment as long as it is considered to be an effective hedge) or in the country itself, where the market for local currency financing or hedges may be inadequate or non-existent. At
December 31, 2018
, the Telefónica Group’s net financial debt denominated in dollars to hedge that component was equivalent to
458
million euros (
146
million euros in 2017).
At
December 31, 2018
, the net financial debt in pounds sterling was approximately
1.97
times the value of the business' operating income before depreciation and amortization (OIBDA) in 2018 for Group companies in the United Kingdom, which is in line with the previous years policy of 2 times the OIBDA ratio.
At
December 31, 2018
, the net financial debt denominated in pounds sterling was equivalent to
3,566
million euros, which is more than the
3,089
million euros at
December 31, 2017
.
The Telefónica Group also manages exchange rate risk by seeking to reduce the negative impact of any exchange rate exposure on the income statement, as a result of transactions recognized on the balance sheet and highly probable transactions, regardless of whether there are open positions. Such open position exposure can arise for any of three reasons: (i) a thin market for local derivatives or difficulty in sourcing local currency finance which makes it impossible to arrange a low-cost hedge (as in Argentina and Venezuela), (ii) financing through intra-group loans, where the accounting treatment of exchange rate risk is different from that for financing through capital contributions, and (iii) as the result of a deliberate policy decision, to avoid the high cost of hedges that are not warranted by expectations or high risk of depreciation.
The main transactions that generate or may generate exchange rate risk (regardless of whether or not they have an impact on the income statement) are, among others, as follows: issues in currencies other than the functional currency of the Group company, highly probable transactions in other currencies, future cash inflows in other currencies, investments and divestments, provisions for collections or payments in foreign currency, the actual value of the investments (subsidiaries) in currencies other than the euro.
In
2018
, net negative foreign exchange results (excluding monetary correction) amounted to
963
million euros (
419
million euros in
2017
), mainly due to the conversion of the Venezuelan Bolivar "Fuerte" from
36,115
to
7,608
Bolivar Soberano per US dollar (see Note 2), that resulted in exchange losses of
954
million euros (
426
million euros in 2017).
The following table illustrates the sensitivity of foreign currency gains and sensitivity losses and of equity to changes in exchange rates, where: a) in calculating the impact on the income statement, the exchange rate position affecting the income statement at the end of
2018
was considered constant during
2019
; b) in calculating the impact on equity, only monetary items have been considered, namely debt and derivatives such as hedges of net investment and loans to subsidiaries related to the investment, breakdown of which is considered constant in
2019
and identical to that existing at the end of
2018
. In both cases, Latin American currencies are assumed to change their value against the dollar and the rest of the currencies against the euro by
10%
.
|
Millions of euros
|
|
|
|
|
|
|
Currency
|
Change
|
Impact on the consolidated income statement
|
|
Impact on consolidated equity
|
|
|
All currencies vs EUR
|
10%
|
1
|
|
(541
|
)
|
|
USD
|
10%
|
(2
|
)
|
(101
|
)
|
|
European currencies vs EUR
|
10%
|
1
|
|
(350
|
)
|
|
Latin American currencies vs USD
|
10%
|
2
|
|
(90
|
)
|
|
All currencies vs EUR
|
(10%)
|
(1
|
)
|
541
|
|
|
USD
|
(10%)
|
2
|
|
101
|
|
|
European currencies vs EUR
|
(10%)
|
(1
|
)
|
350
|
|
|
Latin American currencies vs USD
|
(10%)
|
(2
|
)
|
90
|
|
The Group’s monetary position in Venezuela at
December 31, 2018
is a net debt position of
1,375,524
million Venezuelan bolivars equivalent to
-158
million euros (
7,358,790
million Venezuelan bolivars equivalent to
-170
million euros
at
December 31, 2017
).
The net monetary position exposure in
2018
has been a debtor position, which led to a higher
F-69
financial income of
1,173
million euros due to the effect of the monetary correction for inflation during the year (
510
million euros in 2017).
Interest rate risk
The main objective of the interest rate risk management policy is to bring the Company's financing costs in line with the budget for financial expenses for the current year, as well as the current strategic plan. In accordance with this objective, Telefónica decided to actively adjust the exposure of its debt to interest rates, i.e., the amount of debt that would accrue interest at fixed rates and variable rates.
In order to meet this target, Telefónica mainly carried out the following:
a) The interest rate of borrowings tied to a variable interest rate was set.
b) Interest rate fluctuations of debt tied to a variable interest rate were reduced.
c) Fixed rate debt instruments were converted into variable market rate debt instruments.
These transactions may be carried out against an existing underlying asset or those that are highly likely to take place in the future (for example, a highly probable future issue of debt).
The Telefónica Group’s financial expenses are exposed to changes in interest rates. In
2018
the Euribor, the Brazilian SELIC, the dollar Libor, the pound sterling Libor, the Mexican UDI and the Colombian UVR were the short term rates that accounted for most of the exposure. In nominal terms, at
December 31, 2018
,
73.6%
of Telefónica’s net financial debt plus commitments was pegged to fixed interest rates for a period greater than one year, compared to
71.0%
in
2017
. Of the remaining
26.4%
(net debt at floating rates or at fixed rates maturing within one year),
0.9
percentage points had interest rates bounded in a period over one year, versus
0.8
percentage points of net debt at floating rates or with fixed rates maturing within one year at
December 31, 2017
.
In addition, early retirement and Individual Suspension Plan liabilities (see Note 21) were discounted to present value over the year, based on the curve for instruments with very high credit quality. The increase in interest rates during the year has leaded to a decrease the market value of these liabilities. However, this decrease was nearly completely offset by the decrease in the market value of the hedges on these positions.
Net financial results amounted to
955
million euros in
2018
,
1,244
million lower than the previous year, on one hand thanks to the positive impacts on the financial statements associated with the before mentioned favorable court ruling in Brazil and on the other hand thanks to the reduction in both debt and average cost of debt.
To illustrate the sensitivity of the Company's net financial expense to fluctuations in short-term interest rates, on one hand a 100 basis point increase in interest rates in all currencies in which Telefónica has financial positions at
December 31, 2018
, and a 100 basis point decrease in all currencies has been assumed, and on the other hand a constant position equal to the position at year-end has been considered.
To calculate the sensitivity of equity to fluctuations in interest rates, on one hand a 100 basis point increase in interest rates in all currencies and in all periods on the yield curve in which Telefónica has financial positions at
December 31, 2018
, and a 100 basis point decrease in all currencies and all periods was assumed, and on the other hand only positions with cash flow hedges were considered, which are basically the only positions in which changes in market value due to interest rate fluctuations are recognized in equity.
|
Millions of euros
|
||||
|
Change in basis points (bp)
|
Impact on consolidated income statement
|
|
Impact on consolidated equity
|
|
|
+100bp
|
(102
|
)
|
317
|
|
|
-100bp
|
88
|
|
(317
|
)
|
Share price risk
F-70
The Telefónica Group is exposed to changes in the value of equity investments, derivatives associated with such investments, convertible or exchangeable instruments issued by Telefónica Group, Share-based payments plans, treasury shares and equity derivatives over treasury shares.
According to the Share-based payments plans (see Note 24) the shares to be delivered to employees under such plan may be either Telefónica S.A. treasury shares, acquired by itself or any of its Group companies; or newly-issued shares. The possibility of delivering shares to beneficiaries of the plan in the future, implies a risk since there could be an obligation to hand over a maximum number of shares at the end of each phase, whose acquisition (in the event of acquisition in the market) in the future could imply a higher cash outflow than required on the start date of each phase if the share price is above the corresponding price on the phase start date. In the event that new shares are issued for delivery to the beneficiaries of the plan, there would be a dilutive effect for ordinary shareholders of Telefónica as a result of the higher number of shares delivered under such plan outstanding.
In 2018, the General Shareholder’s Meeting approved a Long-Term Incentive Plan consisting of the delivery of shares of Telefónica, S.A. allocated to Senior Executive Officers of the Telefónica Group. The Plan will have a total duration of five years and will be divided into three mutually exclusive cycles of three years each. The first cycle commenced in 2018 (see Note 24). Additionally, the Shareholder’s Meeting approved a Global Employee Incentive Share Purchase Plan for shares of Telefónica, S.A. for the Employees of the Telefónica Group, which at the end of 2018 has not yet been implemented.
To reduce the risk associated with variations in share price under these plans, Telefónica could acquire instruments that hedge the risk profile of some of these plans.
In addition, the Group may use part of the treasury shares of Telefónica, S.A. held at December 31, 2018 to cover shares deliverable under the new Plans. The net asset value of the treasury shares could increase or decrease depending on variations in Telefónica, S.A.’s share price.
Liquidity risk
The Telefónica Group seeks to match the schedule for its debt maturity payments to its capacity to generate cash flows to meet these maturities, while allowing for some flexibility. In practice, this has been translated into two key principles:
|
1.
|
The Telefónica Group’s average maturity of net financial debt is intended to stay above
6
years, or be restored above that threshold in a reasonable period of time if it eventually falls below it. This principle is considered as a guideline when managing debt and access to credit markets, but not a rigid requirement. When calculating the average maturity for the net financial debt, a portion of the undrawn credit lines can be considered as offsetting the shorter debt maturities, and extension options on some financing facilities may be considered as exercised, for calculation purposes.
|
|
2.
|
The Telefónica Group must be able to pay all commitments over the next
12
months without accessing new borrowing or tapping the capital markets (drawing upon firm credit lines arranged with banks), assuming budget projections are met.
|
At
December 31, 2018
, the average maturity of net financial debt (
41,785
million euros) was
8.98
years (liquidity included).
At
December 31, 2018
, gross financial debt scheduled to mature in
2019
amounted to
9,368
million euros. These maturities are lower than the amount of funds available, calculated as the sum of: a) cash and cash equivalents and current financial assets; b) annual cash generation projected for
2019
, and c) undrawn credit facilities arranged with banks whose original maturity is over one year (an aggregate of
11,887
million euros at
December 31, 2018
), providing flexibility to the Telefónica Group with regard to accessing capital or credit markets in the next
2
years. For a further description of the Telefónica Group’s liquidity and capital resources in
2018
, see Note 16 and Appendix V.
Country risk
The Telefónica Group managed or mitigated country risk by pursuing two lines of action (in addition to its normal business practices):
|
1.
|
Partly matching assets to liabilities (those not guaranteed by the parent company) in the Telefónica Group’s Latin American companies such that any potential asset impairment would be accompanied by a reduction in liabilities; and
|
F-71
|
2.
|
Repatriating funds generated in Latin America that are not required for the pursuit of new, profitable business development opportunities in the region.
|
Regarding the first point, at
December 31, 2018
, the Telefónica Group’s Latin American companies had net financial debt not guaranteed by the parent company of
1,857
million euros, which represents
4%
of net financial debt of the Group. Nevertheless, in certain countries, such as Venezuela, there is a net cash balance (instead of a net liability balance).
Regarding the net repatriation of funds to Spain,
778
million euros from Latin America companies have been received in
2018
, of which
823
million euros was from dividends and on the other hand cash outflows of
46
million euros, mainly, due to capital increases of Group companies.
F-72
Credit risk
The Telefónica Group trades in derivatives with creditworthy counterparties. Therefore, Telefónica, S.A. generally trades with credit entities whose “senior debt” ratings are of at least “A-” or in case of Spanish entities in line with the credit rating of Kingdom of Spain. In Spain, where most of the Group’s derivatives portfolio is held, there are netting agreements with financial institutions, with debtor or creditor positions offset in case of bankruptcy, limiting the risk to the net position. In addition, the CDS (Credit Default Swap) of all the counterparties with which Telefónica, S.A. operates is monitored at all times in order to assess the maximum allowable CDS for operating at any given time. Transactions are generally only carried out with counterparties whose CDS is below the threshold.
Net CVA (CVA+DVA) or Credit Valuation Adjustment is the method used to measure credit risk for both counterparties and Telefónica in order to determine the fair value of the derivatives portfolio. This adjustment reflects the probability of default or the deterioration of the credit quality of both Telefónica and its counterparties. The simplified formula to calculate CVA is Expected Exposure times Probability of Default times Loss Given Default. In order to calculate these variables standard market practices are used.
When managing credit risk, Telefónica considers the use of CDS, novations, derivatives with Break Clauses and signing CSA´s under certain conditions.
For other subsidiaries, particularly those in Latin America, assuming a stable sovereign rating provides a ceiling which is below “A”, trades are with local financial entities whose rating by local standards is considered to be of high creditworthiness.
Meanwhile, with credit risk arising from cash and cash equivalents, the Telefónica Group places its cash surpluses in high quality and highly liquid money-market assets. These placements are regulated by a general framework, revised annually. Counterparties are chosen according to criteria of liquidity, solvency and diversification based on the conditions of the market and countries where the Group operates. The general framework sets: the maximum amounts to be invested by counterparty based on its rating (long-term debt rating); and the instruments in which the surpluses may be invested (money-market instruments).
The Telefónica Group considers customer credit risk management as a key element to achieve its business and customer base growth targets in a sustainable way. This management approach relies on the active evaluation of the risk-reward balance within the commercial operations and on the adequate separation between the risk ownership and risk management functions.
Formal delegation of authority procedures and management practices are implemented in the different Group companies, taking into account benchmark risk management techniques but adapted to the local characteristics of each market. Commercial debtors that may cause a relevant impact on the Telefónica Group consolidated financial statements and increased risk profile products - due to customer target, term, channels or other commercial characteristics - are subject to specific management practices in order to mitigate the exposure to credit risk.
T
his customer credit risk management model is embedded in the day-to-day operational processes of the different companies, where the credit risk assessment guides both the product and services available for the different customers and the collection strategy.
The Telefónica Group’s maximum exposure to credit risk is initially represented by the carrying amounts of the financial assets (see notes 11 to 14) and the guarantees given by the Telefónica Group.
Several Telefónica Group companies provide operating guarantees granted by external counterparties, which are offered during their normal commercial activity, in bids for licenses, permits and concessions, and spectrum acquisitions. At
December 31, 2018
, these guarantees amounted to approximately
5,328
million euros (
5,144
million euros at
December 31, 2017
).
Capital management
Telefónica’s corporate finance department takes into consideration several factors for the evaluation of the Telefónica’s capital structure, with the aim of maintaining the solvency and creating value to the shareholders.
F-73
The corporate finance department estimates the cost of capital on a continuous basis through the monitoring of the financial markets and the application of standard industry approaches for calculating weighted average cost of capital, or WACC, so that it can be applied in the valuation of businesses in course and in the evaluation of investment projects. In addition, Telefónica also uses as reference a net financial debt (excluding items of a non-recurring or exceptional nature) that allows for a comfortable investment grade credit rating as assigned by credit rating agencies, aiming at protecting credit solvency and making it compatible with alternative uses of cash flow that could arise at any time.
These general principles are refined by other considerations and the application of specific variables, such as country risk in the broadest sense, or the volatility in cash flow generation that are considered, when evaluating the financial structure of the Telefónica Group and its different areas.
Derivatives policy
At
December 31, 2018
, the nominal value of outstanding derivatives with external counterparties amounted to
138,102
million euros equivalent, a
5%
decrease from
December 31, 2017
(
145,166
million euros equivalent). This figure is inflated by the use in some cases of several levels of derivatives applied to the nominal value of a single underlying liability. For example, a foreign currency loan can be hedged into floating rate, and then each interest rate period can be fixed using a fixed rate hedge, or FRA (forward rate agreement) The high volume is also due to the fact that when a derivative transaction is canceled, the company may either cancel the derivative or take the opposite position, which cancels out the variability thereof. The second option is usually chosen in order to cut costs. Even using such techniques to reduce the position, it is still necessary to take extreme care in the use of derivatives to avoid potential problems arising through error or a failure to understand the real position and its associated risks. The main principles in the management of derivatives are detailed as follow:
1) Derivatives based on a clearly identified hedged items.
Telefónica’s derivatives policy emphasizes the following points:
Acceptable underlyings include assets and liabilities, profits, revenues and cash flows in either a company’s functional currency or another currency. These flows can be contractual (debt and interest payments, settlement of foreign currency payables, etc.), reasonably certain or foreseeable (PP&E purchases, future debt issues, commercial paper programs, etc.). The acceptability of an underlying asset in the above cases does not depend on whether it complies with accounting rules requirements for hedge accounting, as is required in the case of certain intragroup transactions, for instance. Parent company investments in subsidiaries with functional currencies other than the euro also qualify as acceptable underlying assets.
Economic hedges are hedges that have a designated underlying asset and that, under certain circumstances, may offset the changes in the value of the underlying asset. These economic hedges may not always meet the requirements to be treated as hedges for accounting purposes. The decision to arrange these hedges if they do not meet certain requirements will depend on the marginal impact on the income statement and, therefore, on how far this may compromise the goal of having a stable income statement. In any case, the changes are recognized in the income statement.
2) Matching of the hedged item to one side of the derivative.
This matching basically applies to foreign currency debt and derivatives hedging foreign currency payments by Telefónica Group subsidiaries. The aim is to eliminate the risk arising from changes in foreign currency interest rates. Nonetheless, even when the aim is to achieve perfect hedging for all cash flows, the lack of liquidity in certain markets, especially in Latin American currencies, has meant that historically there have been mismatches between the terms of the hedges and those of the debts they are meant to hedge. The Telefónica Group intends to reduce these mismatches, provided that doing so does not involve disproportionate costs. In this regard, if adjustment does prove too costly, the financial timing of the underlying asset in foreign currency will be modified in order to minimize interest rate risk in foreign currency.
In certain cases, the timing of the underlying as defined for derivative purposes may not be exactly the same as the timing of the contractual underlying.
F-74
3) Matching the company contracting the derivative and the company that owns the hedged item.
Generally, the aim is to ensure that the hedging derivative and the hedged asset or liability belong to the same company. Sometimes, however, the holding companies (Telefónica, S.A. and Telefónica Latinoamérica Holding, S.L.) have arranged hedges on behalf of a subsidiary that owns the underlying asset. The main reasons for separating the hedge and the underlying asset were possible differences in the legal validity of local and international hedges (as a result of unforeseen legal changes) and the different credit ratings of the counterparties (of the Telefónica Group companies as well as those of the banks).
4) Ability to measure the derivative’s fair value using the valuation systems available to the Telefónica Group.
Telefónica uses several tools to evaluate and manage the risk involved in derivatives and debt. These tools most notably include the Kondor+ system, licensed by Reuters, for extended use among various financial institutions, as well as the specialized libraries in the MBRM financial calculation, both of which are widespread throughout the market and have shown proven reliability. In order to perform these calculations, customary market techniques are used when configuring the calculation methods and information from money market curves is used on a daily basis as market inputs (swaps, depos, FRA, etc.) for interest rates, official fixings for exchange rates and the interest rates and volatility matrices for interest and exchange rates that are listed in the multi-contributor systems, Reuters and Bloomberg. For those yield curves that are less liquid or whose prices published in Reuters and Bloomberg are considered not to adequately reflect the market situation, these curves will be requested from relevant banks in these markets.
5) Sale of options only when there is an underlying exposure.
Telefónica considers the sale of options when: i) there is an underlying exposure (on the consolidated statement of financial position or associated with a highly probable cash outflow) that would offset the potential loss for the year if the counterparty exercised the option. This exposure does not have to be treated as a purchased option, but rather it can be another type of hedged item (in these cases, hedge accounting does not apply since this hedging instrument does not meet the criteria required by accounting standards to treat the sale of options as hedging instruments), or ii) the option is part of a structure in which another derivative offsets any loss. The sale of options is also permitted in option structures where, at the moment they are taken out, the net premium is either positive or zero.
For instance, it would be possible to sell short-term options on interest rate swaps that entitle the counterparty to receive a certain fixed interest rate, below the level prevailing at the time the option was sold. This would mean that if rates fell and the counterparty exercised its option, the Group would swap part of its debt from floating rate to a lower fixed rate, having received a premium.
6) Hedge accounting.
The main risks that may qualify for hedge accounting are as follows:
|
•
|
Variations in market interest rates (either money-market rates, credit spreads or both) that affect the value of the underlying asset or the measurement of the cash flows.
|
|
•
|
Variations in exchange rates that change the value of the underlying asset in the company’s functional currency and affect the measurement of the cash flow in the functional currency.
|
|
•
|
Variations in the valuation of any financial asset, particularly shares of companies included in the portfolio of “Available-for-sale financial assets”.
|
|
•
|
Variations in the price of commodities related to contracts that the Group has with third parties.
|
Regarding the underlying:
|
•
|
Hedges can cover all or part of the value of the underlying.
|
|
•
|
The risk to be hedged can be for the whole period of the transaction or for only part of the period.
|
|
•
|
The underlying may be a highly probable future transaction, or a contractual underlying (loan, foreign currency payment, investment, financial asset, etc.) or a combination of both that defines an underlying with a longer term.
|
F-75
The main coverage instruments used are:
|
•
|
Forwards / NDF: they are used mainly for exchange rate hedges related to commercial positions in foreign currency. They can also be used to hedge financing in foreign currency and net investment hedge in foreign currency.
|
|
•
|
Exchange Rate Options: in some cases, this type of instruments can be used linked to future capex and opex operations and investments and divestments in foreign currency.
|
|
•
|
Spots: for purchases and sales of currencies that are made same day value or two days’ value. Generally used for operational needs or for divestments of operations in foreign currency.
|
|
•
|
Currency swaps: this type of transaction is generally executed to hedge bonds issuance or loans issued in foreign currency or net investment hedge.
|
|
•
|
Interest Swaps / Interest Rate Options: these instruments are used to manage the interest rate of the debt portfolio. The use of them is ruled by the Financial Expenses Budget with the objective of its fulfillment. Both the volume to be contracted and the maturity of these products is determined by the underlying assets to be hedged.
|
|
•
|
It is possible that in several markets the maturity, as well as the low liquidity, does not allow to contract a "perfect” hedge, but this circumstance will have to be analyzed case by case.
|
|
•
|
CDS: in order to manage the counterparty credit risk or CVA / DVA, CDS operations can be arranged to mitigate this risk.
|
|
•
|
Derivatives of Commodities: supporting the business lines that may need it and always hedging the commercial risks of the signed contracts. They would be settled by differences, this is, in a non-deliverable format.
|
|
•
|
Equity Derivatives: these are derivatives that address strategic decisions or hedging needs, either to hedge future investments or hedge existing risks. They protect Telefónica from the potential appreciation or depreciation in the price of the shares they hold as underlying.
|
Between the hedged item and the hedging instrument there is an economic relationship, this is, in general terms they move in opposite directions due to the same risk or risk covered. In other words, there must be an expectation that the value of the hedging instrument and the value of the hedged item will change systematically in opposite directions in response to the movements of one of the following elements:
|
•
|
the same underlying item; or
|
|
•
|
Underlying items that are economically related in such sense that they respond similarly to the risk that is being hedged.
|
Depending on the complexity of the hedge relationship and the way in which the hedge has been structured, a quantitative or qualitative analysis will have to be performed to demonstrate that there is an economic relationship between the hedged item and the hedging instrument.
This may on occasion mean that the hedging instruments have longer terms than the related contractual underlying. This happens when the Telefónica Group enters into long-term swaps, caps or collars to protect ourselves against interest rate rises that may raise the financial expense of its promissory notes, commercial paper and some floating rate loans which mature earlier than their hedges. These floating rate financing programs are highly likely to be renewed and Telefónica commits to this by defining the underlying asset in a more general way as a floating rate financing program whose term coincides with the maturity of the hedge. In those cases in which the underlying assets representing the risk hedged are canceled or refinanced early, and if there is an open risk with similar characteristics as the underlying asset that was canceled or refinanced early, either because there is new financing or because there is an underlying asset with similar characteristics and risk profile, the hedge may remain in force with the derivatives assigned thereto and the risk will be subject to the hedge arranged in the aforementioned refinancing. When either of these situations occurs, the effectiveness of the hedge will be reviewed taking into account the new situation.
F-76
Hedges can be of three types:
|
•
|
Fair value hedges.
|
|
•
|
Cash flow hedges. Such hedges can be set at any value of the risk to be hedged (interest rates, exchange rates, etc.) or for a defined range (interest rates between
2%
and
4%
, above
4%
, etc.). In this last case, the hedging instrument used is options.
|
|
•
|
Hedges of net investment in consolidated foreign subsidiaries. Generally, such hedges are arranged by Telefónica S.A. and the other Telefónica holding companies. Wherever possible, these hedges are implemented through real debt in foreign currency. Often, however, this is not always possible as many Latin American currencies are non-convertible, making it impossible for non-resident companies to issue local currency debt. It may also be that, due to the debt market deepness, the debt in the currency concerned is not enough to accommodate the required hedge, or that an acquisition is made in cash with no need for market financing. In these circumstances derivatives, either forwards or cross-currency swaps are mainly used to hedge the net investment.
|
When using options, forwards or cross-currency swaps as hedging instruments, the exclusion of the time value of the option, the element at maturity of the forward and the currency spread of the cross-currency swap of the hedging relationship are evaluated on a case by case basis, in order to be treated as hedge costs.
Hedges can comprise a combination of different derivatives.
Management of accounting hedges is not static, and the hedging relationship may change before maturity. The interruption of the hedge accounting is possible within the framework of the management of financial risks and described in the internal document of “financial risks management and hedging strategy under IFRS 9”. To gauge the efficiency of transactions defined as accounting hedges, the Group analyzes the extent to which the changes in the fair value or in the cash flows attributable to the hedged item would offset the changes in fair value or cash flows attributable to the hedged risk using a linear regression model prospectively.
To evaluate the effectiveness of hedges, under IFRS 9, there is no numerical range under which it is accepted that a hedge is effective and hence the hedge accounting standards are applicable. Therefore, Telefónica considers that if there is an economic relationship, not dominated by changes in credit risk and if the appropriate hedging rationale has been designated, the requirements for effectiveness are met. However, at the moment when ineffectiveness arises, Telefónica will evaluate whether there is still an economic relationship or whether the designated hedging rationale is appropriate. The possible sources of ineffectiveness that Telefónica can have when designing a hedging relationship and that will be considered when establishing the hedging rationale are:
|
•
|
The hedging instrument and the hedged item have different maturity dates, initial dates, contract dates, repricing dates, etc.
|
|
•
|
The hedging instrument starts with initial value and a financing effect is produced.
|
|
•
|
When a cross-currency swap is designated as a hedging instrument on a foreign currency bond and the currency basis spread remains within the coverage.
|
|
•
|
When the underlying items have different sensitivity and are not homogeneous, for example EURIBOR 3M versus EURIBOR 6M.
|
The main guiding principles for risk management are laid down by Telefónica’s Finance Department and implemented by company financial officers (who are responsible for balancing the interests of each company and those of the Telefónica Group). The Corporate Finance Department may allow exceptions to this policy where these can be justified, normally when the market is too thin for the volume of transactions required or on clearly limited and small risks. New companies joining the Telefónica Group as a result of mergers or acquisitions may also need time to adapt.
7) Cancellation of derivatives.
When a derivative transaction is canceled, the company may:
|
•
|
Cancel the derivative and pay its market value.
|
|
•
|
Take the opposite position which cancels out the variability thereof, if cancellation costs are high or if it is recommended for operating or business reasons.
|
F-77
The breakdown of the financial results recognized in
2018
,
2017
and
2016
is as follows:
|
Millions of euros
|
2018
|
|
2017
|
|
2016
|
|
|
Interest income
|
234
|
|
638
|
|
723
|
|
|
Dividends received
|
15
|
|
16
|
|
19
|
|
|
Other financial income
|
826
|
|
17
|
|
38
|
|
|
Subtotal
|
1,075
|
|
671
|
|
780
|
|
|
Changes in fair value of asset derivatives at fair value through profit or loss
|
202
|
|
35
|
|
438
|
|
|
Changes in fair value of liability derivatives at fair value through profit or loss
|
(190
|
)
|
(97
|
)
|
(463
|
)
|
|
Changes in the fair value of debt instruments and other assets at fair value to profit or loss
|
(3
|
)
|
—
|
|
—
|
|
|
Transfer from equity of results of cash flow hedges - future cash flows that are not longer expected to happen
|
(7
|
)
|
—
|
|
—
|
|
|
Transfer from equity to profit and loss from available-for-sale assets and others
|
n.a.
|
|
(33
|
)
|
(136
|
)
|
|
(Loss)/Gain on fair value hedges
|
(223
|
)
|
(150
|
)
|
(26
|
)
|
|
Gain/(loss) on adjustment to items hedged by fair value hedges
|
271
|
|
194
|
|
(6
|
)
|
|
Subtotal
|
50
|
|
(51
|
)
|
(193
|
)
|
|
Interest expenses
|
(1,715
|
)
|
(2,137
|
)
|
(2,463
|
)
|
|
Ineffective portion of cash flow hedges
|
(29
|
)
|
(10
|
)
|
1
|
|
|
Accretion of provisions and other liabilities
|
(410
|
)
|
(453
|
)
|
(466
|
)
|
|
Other financial expenses
|
(203
|
)
|
(310
|
)
|
(365
|
)
|
|
Subtotal
|
(2,357
|
)
|
(2,910
|
)
|
(3,293
|
)
|
|
Net finance costs excluding foreign exchange differences and hyperinflation adjustments
|
(1,232
|
)
|
(2,290
|
)
|
(2,706
|
)
|
n.a.: not applicable.
I
nterest expenses includes transfers from equity from cash flow hedges of interest rate amounting to +
68
million euros in 2018 (
-162
million euros and
-238
million euros in 2017 and 2016, respectively).
At December 31, 2018 in other financial income include
665
million euros from Telefónica Brazil corresponding to the default interest derivatives of the final decision in favor about the right to deduct the ICMS from the calculation basis of PIS/COFINS (see Note 11).
F-78
Evolution of derivative instruments
The movement of the net position of derivatives during the years ended December 31, 2018 and 2017 is as follows:
|
Millons of euros
|
Movement in 2018
|
|
Movement in 2017
|
|
|
Opening balance of assets/(liabilities)
|
505
|
|
3,401
|
|
|
Financing payments
|
52
|
|
179
|
|
|
Financing proceeds
|
(209
|
)
|
(574
|
)
|
|
Interest (proceeds)/payments
|
(126
|
)
|
(298
|
)
|
|
Other (proceeds)/payments
|
(28
|
)
|
(101
|
)
|
|
Fair value adjustments through other comprehensive income
|
999
|
|
(47
|
)
|
|
Movements with counterparty in the income statement
|
2
|
|
(1,909
|
)
|
|
Translation differences
|
(70
|
)
|
(87
|
)
|
|
Other movements
|
56
|
|
(59
|
)
|
|
Closing balance of assets/(liabilities)
|
1,181
|
|
505
|
|
The variation in 2018 represents an increase of
676
million euros of asset (reduction of
2,896
million euros in 2017) mainly due to the evolution of the EUR/USD exchange rate.
These variations are offset mainly by the variation of the different Telefónica Group issues and loans performed in dollars.
In 2017, variations in cash flow hedges, the impact of which coincided with the period of the profit or loss generated by the respective hedged items, were directly recognized in the income statement, offsetting the profit or loss of the hedged items without including them in the statement of comprehensive income, presenting these variations under the heading "Movements with counterparty in the income statement" in the table above.
In 2018, taking into consideration IFRS 9, it was decided to modify the presentation of these variations, with them being included in the statement of comprehensive income and recycled to profit and loss for the same period. These variations are recognized in the line "Fair value Adjustments recognized against other comprehensive income" in the table above. This change to the presentation of these variations has no impact on the income statement or on other comprehensive income.
The breakdown of Telefónica’s detail of hedges and other derivative instruments at December 31, 2018, their fair value at year-end and the expected maturity schedule is as set forth in the table below:
F-79
|
Notional amount - Maturities (*)
|
Book value of the derivative and no-derivative instruments (**)
|
||||||||||||||||||||
|
Millions of euros
|
2019
|
2020
|
2021
|
Later
|
Total
|
Non-current asset
|
Current asset
|
Non-current liabilities
|
Current liabilities
|
Total
|
|||||||||||
|
Derivate instruments of accounting hedges
|
(4,443
|
)
|
4,743
|
|
2,799
|
|
7,471
|
|
10,570
|
|
(1,950
|
)
|
(660
|
)
|
1,447
|
|
200
|
|
(963
|
)
|
|
|
Interest rate risk
|
(686
|
)
|
1,746
|
|
(299
|
)
|
(86
|
)
|
675
|
|
(398
|
)
|
(186
|
)
|
270
|
|
9
|
|
(305
|
)
|
|
|
Cash flow hedges
|
(607
|
)
|
1,567
|
|
46
|
|
1,269
|
|
2,275
|
|
(154
|
)
|
(2
|
)
|
228
|
|
4
|
|
76
|
|
|
|
Fair value hedges
|
(79
|
)
|
179
|
|
(345
|
)
|
(1,355
|
)
|
(1,600
|
)
|
(244
|
)
|
(184
|
)
|
42
|
|
5
|
|
(381
|
)
|
|
|
Exchange rate risk
|
(4,718
|
)
|
2,219
|
|
1,102
|
|
5,980
|
|
4,583
|
|
(835
|
)
|
(183
|
)
|
939
|
|
70
|
|
(9
|
)
|
|
|
Cash flow hedges
|
341
|
|
2,219
|
|
1,102
|
|
5,980
|
|
9,642
|
|
(834
|
)
|
(76
|
)
|
939
|
|
10
|
|
39
|
|
|
|
Fair value hedges
|
50
|
|
—
|
|
—
|
|
—
|
|
50
|
|
(1
|
)
|
(45
|
)
|
—
|
|
14
|
|
(32
|
)
|
|
|
Net investments hedges
|
(5,109
|
)
|
—
|
|
—
|
|
—
|
|
(5,109
|
)
|
—
|
|
(62
|
)
|
—
|
|
46
|
|
(16
|
)
|
|
|
Interest rate and exchange rate risk
|
961
|
|
778
|
|
1,996
|
|
1,577
|
|
5,312
|
|
(717
|
)
|
(291
|
)
|
238
|
|
121
|
|
(649
|
)
|
|
|
Cash flow hedges
|
962
|
|
801
|
|
2,001
|
|
1,736
|
|
5,500
|
|
(541
|
)
|
(291
|
)
|
238
|
|
121
|
|
(473
|
)
|
|
|
Fair value hedges
|
(1
|
)
|
(23
|
)
|
(5
|
)
|
(159
|
)
|
(188
|
)
|
(176
|
)
|
—
|
|
—
|
|
—
|
|
(176
|
)
|
|
|
Derivate instruments of no-accounting hedges
|
(4,318
|
)
|
(321
|
)
|
(531
|
)
|
(2,551
|
)
|
(7,721
|
)
|
(826
|
)
|
(262
|
)
|
840
|
|
30
|
|
(218
|
)
|
|
|
Other derivatives of interest rate
|
(3,571
|
)
|
(321
|
)
|
(531
|
)
|
(2,551
|
)
|
(6,974
|
)
|
(826
|
)
|
(128
|
)
|
830
|
|
3
|
|
(121
|
)
|
|
|
Other derivatives of exchange rate
|
(747
|
)
|
—
|
|
—
|
|
—
|
|
(747
|
)
|
—
|
|
(134
|
)
|
—
|
|
25
|
|
(109
|
)
|
|
|
Other derivatives
|
—
|
|
—
|
|
—
|
|
—
|
|
—
|
|
—
|
|
—
|
|
10
|
|
2
|
|
12
|
|
|
|
Total derivative instruments
|
(8,761
|
)
|
4,422
|
|
2,268
|
|
4,920
|
|
2,849
|
|
(2,776
|
)
|
(922
|
)
|
2,287
|
|
230
|
|
(1,181
|
)
|
|
|
No derivatives instruments of accounting hedges (***)
|
—
|
|
56
|
|
56
|
|
858
|
|
970
|
|
—
|
|
—
|
|
996
|
|
—
|
|
996
|
|
|
|
Exchange rate risk
|
—
|
|
56
|
|
56
|
|
858
|
|
970
|
|
—
|
|
—
|
|
996
|
|
—
|
|
996
|
|
|
|
Fair value hedges
|
—
|
|
—
|
|
—
|
|
—
|
|
—
|
|
—
|
|
—
|
|
—
|
|
—
|
|
—
|
|
|
|
Net investments hedges
|
—
|
|
56
|
|
56
|
|
858
|
|
970
|
|
—
|
|
—
|
|
996
|
|
—
|
|
996
|
|
|
(*) For interest rate hedges, the positive amount is in terms of fixed “payment.” For foreign currency hedges, a positive amount means payment in functional vs. foreign currency.
(**) Positive amounts indicate payables.
(***) Of the hedging instruments that are not derivatives,
243
million euros correspond to "Loans and other debts" and
753
million euros to "Obligations and bonds" (see Note 16).
Net financial debt as of December 31, 2018 includes a positive value of the derivatives portfolio for a net amount of
1,181
million euros (see Note 2). This amount includes a positive value of
535
million euros due to hedges (cross currency swaps) to transfer financial debt issued in foreign currency to local currency (a negative value of
104
million euros at December 31,2017).
The calculation of the fair values of the Telefónica Group’s debt instruments required an estimate, for each currency and counterparty, of a credit spread curve using the prices of the Group’s bonds and credit derivatives.
The derivatives portfolio was measured through the techniques and models normally used in the market, based on money market curves and volatility prices available in the markets. Additionally, the credit valuation adjustment or net CVA per counterparty (CVA+DVA) is calculated on that measurement as the method used to measure the credit risks of the counterparties and also Telefónica for the purpose of adjusting the fair value valuation of the derivatives. This adjustment reflects the possibility of bankruptcy or credit rating impairment of the counterparty and Telefónica.
Derivatives arranged by the Group at
December 31, 2018
are detailed in Appendix IV.
F-80
The breakdown of Telefónica’s derivatives at
December 31, 2017
, their fair value at year-end and the expected maturity schedule are as set forth in the table below:
|
2017
|
|||||||||||||
|
Millions of euros
|
Fair value
(**)
|
Notional amount Maturities (*)
|
|||||||||||
|
Derivatives
|
|
2018
|
2019
|
2020
|
Subsequent years
|
Total
|
|||||||
|
Interest rate hedges
|
(285
|
)
|
(1,596
|
)
|
(901
|
)
|
1,563
|
|
1,701
|
|
767
|
|
|
|
Cash flow hedges
|
140
|
|
(1,015
|
)
|
(658
|
)
|
1,399
|
|
3,778
|
|
3,504
|
|
|
|
Fair value hedges
|
(425
|
)
|
(581
|
)
|
(243
|
)
|
164
|
|
(2,077
|
)
|
(2,737
|
)
|
|
|
Exchange rate hedges
|
339
|
|
(220
|
)
|
547
|
|
2,219
|
|
4,720
|
|
7,266
|
|
|
|
Cash flow hedges
|
344
|
|
1,700
|
|
621
|
|
2,219
|
|
4,720
|
|
9,260
|
|
|
|
Fair value hedges
|
(5
|
)
|
(1,920
|
)
|
(74
|
)
|
—
|
|
—
|
|
(1,994
|
)
|
|
|
Interest and exchange rate hedges
|
(546
|
)
|
344
|
|
963
|
|
952
|
|
4,419
|
|
6,678
|
|
|
|
Cash flow hedges
|
(422
|
)
|
344
|
|
963
|
|
800
|
|
3,744
|
|
5,851
|
|
|
|
Fair value hedges
|
(124
|
)
|
—
|
|
—
|
|
152
|
|
675
|
|
827
|
|
|
|
Net investment Hedges
|
—
|
|
(140
|
)
|
—
|
|
—
|
|
—
|
|
(140
|
)
|
|
|
Other Derivatives
|
(13
|
)
|
(2,431
|
)
|
1,840
|
|
(495
|
)
|
(2,451
|
)
|
(3,537
|
)
|
|
|
Interest rate
|
(109
|
)
|
(3,035
|
)
|
1,840
|
|
(495
|
)
|
(3,051
|
)
|
(4,741
|
)
|
|
|
Exchange rate
|
26
|
|
(209
|
)
|
—
|
|
—
|
|
—
|
|
(209
|
)
|
|
|
Others
|
70
|
|
813
|
|
—
|
|
—
|
|
600
|
|
1,413
|
|
|
(*) For interest rate hedges, the positive amount is in terms of fixed “payment.” For foreign currency hedges, a positive amount means payment in functional vs. foreign currency.
(**) Positive amounts indicate payables.
The fair value of the Telefónica Group derivatives at
December 31, 2017
amounted to a positive MTM (accounts receivable) of
505
million euros.
F-81
The detail of hedged items by fair value hedges at December 31, 2018, is as follows:
|
Hedged items carrying amount
|
Accumulated amount in the hedged item adjusted by fair value hedge (*)
|
||||||||||||||||||
|
Millions of euros
|
Interest rate risk
|
Exchange rate risk
|
Interest rate and exchange rate risk
|
Total
|
Interest rate risk
|
Exchange rate risk
|
Interest rate and exchange rate risk
|
Total
|
Of which: accumulated amount of any hedge item that have cesased to be adjusted for gains and losses
|
||||||||||
|
Assets
|
—
|
|
371
|
|
—
|
|
371
|
|
—
|
|
(29
|
)
|
—
|
|
(29
|
)
|
—
|
|
|
|
Financial assets and other non-current assets
|
—
|
|
143
|
|
—
|
|
143
|
|
—
|
|
—
|
|
—
|
|
—
|
|
—
|
|
|
|
Receivables and other current assets
|
—
|
|
213
|
|
—
|
|
213
|
|
—
|
|
(34
|
)
|
—
|
|
(34
|
)
|
—
|
|
|
|
Other current financial assets
|
—
|
|
15
|
|
—
|
|
15
|
|
—
|
|
5
|
|
—
|
|
5
|
|
—
|
|
|
|
Liabilities
|
2,445
|
|
1,111
|
|
6,429
|
|
9,985
|
|
236
|
|
(11
|
)
|
(141
|
)
|
84
|
|
197
|
|
|
|
Non-current financial liabilities
|
1,729
|
|
670
|
|
6,062
|
|
8,461
|
|
357
|
|
15
|
|
(146
|
)
|
226
|
|
199
|
|
|
|
Payables and other non-current liabilities
|
530
|
|
—
|
|
—
|
|
530
|
|
(121
|
)
|
—
|
|
—
|
|
(121
|
)
|
—
|
|
|
|
Current financial liabilities
|
186
|
|
9
|
|
367
|
|
562
|
|
—
|
|
—
|
|
5
|
|
5
|
|
1
|
|
|
|
Payables and other current liabilities
|
—
|
|
432
|
|
—
|
|
432
|
|
—
|
|
(26
|
)
|
—
|
|
(26
|
)
|
(3
|
)
|
|
F-82
The evolution of hedges in equity at December 31, 2018 is as follows:
|
Derivate instruments
|
No derivate instruments
|
Total Gross amount
|
|
Tax effect
|
|
Total hedges in equity
|
|
||||||||||
|
Gains (losses) of cash flow hedges
|
Derivates - Net investment hedges
|
|
No Derivates - Net investment hedges
|
|
|||||||||||||
|
Million euros
|
Derivates - Cash flow hedges- interest rate risk
|
Derivates - Cash flow hedges- Exchange rate risk
|
Derivates - Cash flow hedges- Exchange rate and interest rate risks
|
||||||||||||||
|
Balance at 12/31/2017
|
(394
|
)
|
(357
|
)
|
(179
|
)
|
1,502
|
|
—
|
|
572
|
|
(188
|
)
|
384
|
|
|
|
Changes in the fair value registered in equity
|
(52
|
)
|
584
|
|
392
|
|
33
|
|
(5
|
)
|
952
|
|
(243
|
)
|
709
|
|
|
|
Transfer to the initial value of hedged item
|
—
|
|
—
|
|
(1
|
)
|
—
|
|
—
|
|
(1
|
)
|
—
|
|
(1
|
)
|
|
|
Transfer to the income statement of the period - the hedged future cash flows are no longer expected to happen
|
7
|
|
—
|
|
—
|
|
—
|
|
—
|
|
7
|
|
(2
|
)
|
5
|
|
|
|
Transfer to the income statement of the period - the hedged item has affected profit or loss
|
144
|
|
(574
|
)
|
(290
|
)
|
—
|
|
—
|
|
(720
|
)
|
184
|
|
(536
|
)
|
|
|
Total translation differences
|
—
|
|
(1
|
)
|
—
|
|
—
|
|
—
|
|
(1
|
)
|
—
|
|
(1
|
)
|
|
|
Balance at 12/31/2018
|
(295
|
)
|
(348
|
)
|
(78
|
)
|
1,535
|
|
(5
|
)
|
809
|
|
(249
|
)
|
560
|
|
|
|
Amounts remaining in equity for continuing hedges
|
(176
|
)
|
(377
|
)
|
14
|
|
1,534
|
|
(5
|
)
|
990
|
|
|||||
|
Amounts remaining in equity from any hedging relationship for which hedge accounting is no longer applied
|
(119
|
)
|
29
|
|
(92
|
)
|
1
|
|
—
|
|
(181
|
)
|
|||||
|
Balance at 12/31/2018
|
(295
|
)
|
(348
|
)
|
(78
|
)
|
1,535
|
|
(5
|
)
|
809
|
|
|||||
The total amount of "Transfer to the income statements of the period - the hedged item has affected profit or loss" has impacted in financial results, reported under "Interest expenses" amounted to
+68
million euros (see detail of "Net finance costs excluding foreign exchange differences and hyperinflation adjustments" in this note) and in exchange differences amounted to +
645
million euros.
The evolution of cost of hedging in equity is as follows:
|
Exchange rate risk
|
Total gross amount
|
|
Tax effect
|
|
Total cost of hedging in equity
|
|
||
|
Forward element /CBS
|
||||||||
|
Million euros
|
A time - period related hedge item
|
|
||||||
|
Balance at 12/31/2017
|
—
|
|
—
|
|
—
|
|
—
|
|
|
Changes in the fair value registered in equity
|
51
|
|
51
|
|
(13
|
)
|
38
|
|
|
Transfer to the income statement of the period - the hedged item has affected profit or loss
|
(2
|
)
|
(2
|
)
|
1
|
|
(1
|
)
|
|
Balance at 12/31/2018
|
49
|
|
49
|
|
(12
|
)
|
37
|
|
F-83
The detail of ineffective portion of accounting hedges with impact on the income statement is as follows:
|
Million euros
|
Changes in fair value of the hedging instrument
|
|
Changes in the fair value of hedges item for the hedged risk
|
|
Ineffective portion hedged registered in the income statement
|
|
|
Interest rate risk
|
(53
|
)
|
(53
|
)
|
—
|
|
|
Cash flow hedges
|
(27
|
)
|
(27
|
)
|
—
|
|
|
Fair value hedges
|
(26
|
)
|
(26
|
)
|
—
|
|
|
Exchange rate risk
|
622
|
|
651
|
|
(29
|
)
|
|
Cash flow hedges
|
605
|
|
634
|
|
(29
|
)
|
|
Net investment hedges
|
17
|
|
17
|
|
—
|
|
|
Interest rate and exchange rate risk
|
377
|
|
377
|
|
—
|
|
|
Cash flow hedges
|
377
|
|
377
|
|
—
|
|
|
Total
|
946
|
|
975
|
|
(29
|
)
|
F-84
The composition of “Payables and other non-current liabilities” of the Telefónica Group at December 31, 2018 and December 31, 2017 is as follows:
|
Millions of euros
|
12/31/2018
|
12/31/2017
|
||
|
Payables
|
856
|
|
900
|
|
|
Trade payables
|
87
|
|
86
|
|
|
Payables to suppliers of property, plant and equipment
|
9
|
|
5
|
|
|
Debt for spectrum acquisition
|
662
|
|
569
|
|
|
Other payables
|
98
|
|
240
|
|
|
Other non-current liabilities
|
1,034
|
|
787
|
|
|
Contractual liabilities (Note 20)
|
613
|
|
—
|
|
|
Deferred revenue
|
283
|
|
774
|
|
|
Current tax payables
|
138
|
|
13
|
|
|
Total
|
1,890
|
|
1,687
|
|
At December 31, 2018, “Debt for spectrum acquisition” comprised the deferred portion of the payment for acquiring the spectrum use license in Mexico in 2010, for an equivalent of
530
million euros (
526
million euros at December 31, 2017, see Note 19), and the pending payment portion for spectrum acquisition in Spain in 2018, amounting to
102
million euros
(see Note 6).
In addition, this section also includes the deferred portion of the payment for reframing the radioelectric spectrum acquired in 2014 by Telefónica Brazil for an equivalent of
28
million euros (
29
million euros at December 31, 2017, see Note 19 and Appendix VI).
Payments for financed licenses for the years 2018 and 2017 amounted to
44
and
329
million euros, respectively (see Note 25).
“Deferred revenues” primarily included at December 31, 2017 the amount of deferred revenues from rights of use on the cable network and activation fees not yet recognized in the income statement. At December 31, 2018 these items are included in contractual liabilities (see Note 20). At December 31, 2018 grants are included, amounted to
97
million euros (
72
million euros at December 31, 2017).
F-85
The composition of “Payables and other current liabilities” at December 31, 2018 and December 31, 2017 is as follows:
|
Millions of euros
|
12/31/2018
|
|
12/31/2017
|
|
|
Payables
|
13,868
|
|
13,536
|
|
|
Trade payables
|
8,457
|
|
7,943
|
|
|
Payables to suppliers of property, plant and equipment
|
3,237
|
|
3,580
|
|
|
Debt for spectrum acquisition
|
251
|
|
172
|
|
|
Other payables
|
1,092
|
|
1,115
|
|
|
Dividends pending payment
|
311
|
|
235
|
|
|
Associates and joint ventures payables (Note 9)
|
520
|
|
491
|
|
|
Other current liabilities
|
1,617
|
|
1,559
|
|
|
Contract liabilities (Note 20)
|
1,335
|
|
—
|
|
|
Deferred revenue
|
106
|
|
1,387
|
|
|
Advances received
|
176
|
|
172
|
|
|
Total
|
15,485
|
|
15,095
|
|
At December 31, 2018, “Debt for spectrum acquisition” comprised the deferred portion of the current pending payment for acquiring the spectrum in Mexico for an equivalent of
79
million euros (
72
million at December 31, 2017, see Note 18) and the pending payment portion for the acquisition in 2018 of spectrum
by Telefónica Mexico
for
107
million euros (see Note 6).
At December 31, 2017 it also included the current pending payment portion for reframing the radioelectric spectrum acquired in 2014 by Telefónica Brazil for an equivalent of
36
million euros (see Note 18).
“Deferred revenue” primarily included at December 31, 2017 the amount of deferred revenue from sales of prepay cards, handsets transferred to the distributor, rights of use on the cable network and activation fees not yet recognized in the income statement. At December 31, 2018 these items are included in contractual liabilities (see Note 20).
At December 31, 2018 grants are also included and amounted to
16
million euros (
15
million euros at December 31, 2017).
F-86
The composition of current "Other payables" at December 31, 2018 and December 31, 2017 is as follows:
|
Millions of euros
|
12/31/2018
|
|
12/31/2017
|
|
|
Accrued employee benefits
|
611
|
|
696
|
|
|
Other non-financial non-trade payables
|
481
|
|
419
|
|
|
Total
|
1,092
|
|
1,115
|
|
“Other non-financial non-trade payables” at December 31, 2018 included the pending payment of
49
million euros corresponding to Telefónica, S.A.’s irrevocable commitment acquired in 2015 to pay a
325
million euros donation to Fundación Telefónica as part of the financing needed to implement the social programs and activities it currently performs or could initiate in the short and medium terms to fulfill its purpose as a foundation (
145
million euros at December 31, 2017).
Information on average payment period to suppliers. Third additional provision, “Information requirement” of Law 15/2010 of July 5.
In accordance with the aforementioned Law, the following information corresponding to the Spanish companies of the Telefónica Group is disclosed:
|
|
2018
|
|
2017
|
|
|
Number of days
|
||||
|
Weighted average maturity period
|
49
|
|
53
|
|
|
Ratio of payments
|
50
|
|
54
|
|
|
Ratio of outstanding invoices
|
44
|
|
41
|
|
|
Millions of euros
|
|
|
||
|
Total payments
|
6,770
|
|
6,703
|
|
|
Outstanding invoices
|
1,190
|
|
847
|
|
The Telefónica Group’s Spanish companies adapted their internal processes and payment schedules to the provisions of Law 15/2010 (amended by Law 31/2014) and Royal Decree-Law 4/2013, amending Law 3/2004, which establishes measures against late payment in commercial transactions. Engagement conditions with commercial suppliers in 2018 included payment periods of up to 60 days, according to the terms agreed between the parties.
For efficiency purposes and in line with general business practices, Telefónica Group companies in Spain have agreed payment schedules with suppliers, whereby most of the payments are made on set days of each month. Invoices falling due between two payment days are settled on the following payment date in the schedule.
Payments to Spanish suppliers in 2018 surpassing the established legal limit were the result of circumstances or incidents beyond the payment policies, mainly the delay in issuing invoices (legal obligation of the supplier), the closing of agreements with suppliers over the delivery of goods or rendering of services, or occasional processing issues.
The average payment period to suppliers of the Telefónica Group’s companies in Spain in 2018, calculated in accordance with the only additional provision of the Resolution of the Instituto de Contabilidad y Auditoría de Cuentas (Spanish Accounting and Audit Institute) of January 29, 2016, amounted to
49
days (
53
days in 2017).
F-87
The movement of contractual assets and capitalized costs in
2018
is as follows:
|
Millions of euros
|
Balance at 12/31/17
|
|
First application of new IFRS impacts
|
|
Additions
|
|
Disposals
|
|
Transfers
|
|
Translation differences and hyperinflation adjustments
|
|
Balance at 12/31/18
|
|
|
Long-term contractual assets (Note 11)
|
—
|
|
68
|
|
153
|
|
(2
|
)
|
(110
|
)
|
(1
|
)
|
108
|
|
|
Contractual assets
|
—
|
|
71
|
|
156
|
|
(2
|
)
|
(110
|
)
|
(1
|
)
|
114
|
|
|
Impairment losses
|
—
|
|
(3
|
)
|
(3
|
)
|
—
|
|
—
|
|
—
|
|
(6
|
)
|
|
Short-term contractual assets (Note 12)
|
—
|
|
332
|
|
761
|
|
(856
|
)
|
113
|
|
(9
|
)
|
341
|
|
|
Contractual assets
|
—
|
|
354
|
|
764
|
|
(857
|
)
|
113
|
|
(10
|
)
|
364
|
|
|
Impairment losses
|
—
|
|
(22
|
)
|
(3
|
)
|
1
|
|
—
|
|
1
|
|
(23
|
)
|
|
Total
|
—
|
|
400
|
|
914
|
|
(858
|
)
|
3
|
|
(10
|
)
|
449
|
|
Once the amounts recognized as contract assets become receivables, which normally occurs when they are invoiced, they are transferred to the "Trade receivables" heading. In this regard, the balance of the contract assets account basically represents amounts not yet due.
The movement of the deferred expenses in 2018 is as follows:
|
Millions of euros
|
Balance at 12/31/17
|
|
First application of new IFRS impacts
|
|
Additions
|
|
Disposals
|
|
Transfers
|
|
Translation differences and hyperinflation adjustments
|
|
Balance at 12/31/18
|
|
|
Non-current capitalized costs (Note 11)
|
—
|
|
172
|
|
366
|
|
(1
|
)
|
(343
|
)
|
(3
|
)
|
191
|
|
|
Of obtaining a contract
|
—
|
|
170
|
|
349
|
|
(1
|
)
|
(338
|
)
|
(2
|
)
|
178
|
|
|
Of fulfilling a contract
|
—
|
|
2
|
|
17
|
|
—
|
|
(5
|
)
|
(1
|
)
|
13
|
|
|
Impairment losses
|
—
|
|
—
|
|
—
|
|
—
|
|
—
|
|
—
|
|
—
|
|
|
Current capitalized costs (Note 12)
|
—
|
|
540
|
|
437
|
|
(746
|
)
|
342
|
|
(7
|
)
|
566
|
|
|
Of obtaining a contract
|
—
|
|
522
|
|
400
|
|
(713
|
)
|
337
|
|
(5
|
)
|
541
|
|
|
Of fulfilling a contract
|
—
|
|
18
|
|
37
|
|
(33
|
)
|
5
|
|
(2
|
)
|
25
|
|
|
Impairment losses
|
—
|
|
—
|
|
—
|
|
—
|
|
—
|
|
—
|
|
—
|
|
|
Total
|
—
|
|
712
|
|
803
|
|
(747
|
)
|
(1
|
)
|
(10
|
)
|
757
|
|
The movement of contractual liabilities of contracts with customers in
2018
is as follows:
F-88
|
Millions of euros
|
Balance at 12/31/17
|
|
First application of new IFRS impacts
|
|
Additions
|
|
Disposals
|
|
Transfers
|
|
Translation differences and hyperinflation adjustments
|
|
Balance at 12/31/18
|
|
|
Long-term contractual liabilities (Note 18)
|
—
|
|
106
|
|
558
|
|
(295
|
)
|
240
|
|
4
|
|
613
|
|
|
Short-term contractual liabilities (Note 19)
|
—
|
|
98
|
|
7,561
|
|
(7,631
|
)
|
1,317
|
|
(10
|
)
|
1,335
|
|
|
Total
|
—
|
|
204
|
|
8,119
|
|
(7,926
|
)
|
1,557
|
|
(6
|
)
|
1,948
|
|
The “transfers” column shows amounts relating to contractual liabilities reclassified from the “Deferred revenue” (see Notes 18 and 19) line item to reflect the new terminology of IFRS 15. Contract liabilities relate to unperformed performance obligations mainly referred to IRU contracts, prepaid airtime, set up fees and other prepaid services. The most significant portion of the amounts presented as non-current will be recognized as revenues within
24
months and up to
10
years.
The maturity schedule of contractual liabilities at December 31, 2018 is as follows:
|
Millions of euros
|
2019
|
|
2020
|
|
2021
|
|
Subsequent years
|
|
Total
|
|
|
Contractual liabilities, activation fees
|
158
|
|
5
|
|
3
|
|
11
|
|
177
|
|
|
Contractual liabilities, sales of prepay cards
|
552
|
|
—
|
|
—
|
|
—
|
|
552
|
|
|
Contractual liabilities, services
|
315
|
|
30
|
|
3
|
|
13
|
|
361
|
|
|
Contractual liabilities, sales of handsets
|
75
|
|
3
|
|
—
|
|
—
|
|
78
|
|
|
Contractual liabilities, irrevocable rights to use
|
26
|
|
24
|
|
24
|
|
183
|
|
257
|
|
|
Other contractual liabilities
|
209
|
|
121
|
|
115
|
|
78
|
|
523
|
|
|
Maturity of performance obligations
|
1,335
|
|
183
|
|
145
|
|
285
|
|
1,948
|
|
F-89
The amounts of provisions in
2018
and
2017
are as follows:
|
|
12/31/2018
|
12/31/2017
|
||||||||||
|
Millions of euros
|
Current
|
|
Non-current
|
|
Total
|
|
Current
|
|
Non-current
|
|
Total
|
|
|
Employee benefits
|
886
|
|
4,499
|
|
5,385
|
|
912
|
|
5,666
|
|
6,578
|
|
|
Termination plans
|
441
|
|
805
|
|
1,246
|
|
515
|
|
1,282
|
|
1,797
|
|
|
Post-employment defined benefit plans
|
9
|
|
389
|
|
398
|
|
9
|
|
1,030
|
|
1,039
|
|
|
Other benefits
|
436
|
|
3,305
|
|
3,741
|
|
388
|
|
3,354
|
|
3,742
|
|
|
Desmantling of assets
|
125
|
|
784
|
|
909
|
|
85
|
|
888
|
|
973
|
|
|
Other provisions
|
901
|
|
2,237
|
|
3,138
|
|
1,219
|
|
2,664
|
|
3,883
|
|
|
Total
|
1,912
|
|
7,520
|
|
9,432
|
|
2,216
|
|
9,218
|
|
11,434
|
|
a) Employee benefits
Termination plans
The movement in provisions for termination plans in
2018
and
2017
is as follows:
|
Millions of euros
|
Total
|
|
|
Provisions for termination plans at 12/31/16
|
2,394
|
|
|
Additions
|
179
|
|
|
Retirements/amount applied
|
(759
|
)
|
|
Transfers
|
(8
|
)
|
|
Translation differences and accretion
|
(9
|
)
|
|
Provisions for termination plans at 12/31/17
|
1,797
|
|
|
Additions
|
140
|
|
|
Retirements/amount applied
|
(579
|
)
|
|
Transfers
|
(109
|
)
|
|
Translation differences, hyperinflation adjustments and accretion
|
(3
|
)
|
|
Provisions for termination plans at 12/31/18
|
1,246
|
|
The reclassification of provision for termination plans of the entity Seguros de Vida y Pensiones Antares, S.A. to the line "Liabilities associated with non-current assets held for sale" of the statement of financial position is recorded under "Transfers" for the 2018, amounted to
109
million euros (see Note 28).
Telefónica Spain
The 2003-2007 labor force reduction plan in Telefónica de España concluded with
13,870
participating employees and the provisions recorded at
December 31, 2018
and
2017
amounted to
46 million
euros and
83 million
euros, respectively. The amount for this provision classified as current totaled
20 million
euros at
December 31, 2018
.
The 2011-2013 labor force reduction plan in Telefónica de España, concluded with
6,830
participating employees and the provisions recorded at
December 31, 2018
and
2017
amounted to
797 million
euros and
1,061 million
euros, respectively. The amount for this provision classified as current totaled
275 million
euros at
December 31, 2018
.
The companies bound by these commitments calculated provisions required at
2018
and
2017
year-end using actuarial assumptions pursuant to current legislation, including the PERM/F- 2000C mortality tables and a high quality credit market based interest rate.
The discount rate used for these provisions at
December 31, 2018
was
0.41%
with an average plan length of
1.75
years.
F-90
Telefónica Germany
Within the context of the transformation of Telefónica Deutschland following the purchase of E-Plus in a bid to increase profitability by securing operational synergies, a provision of
321 million
euros was made in 2014 for employee restructuring. An additional provision of
19 million
euros was made in
2018
(compared with the additional
44 million
euros in
2017
).
This provision stood at
48 million
euros at
December 31, 2018
(
65 million
euros at
December 31, 2017
).
Telefónica, S.A.
With respect to the simplification and transformation process of the Telefónica Group, Telefónica, S.A. launched in 2015 a voluntary termination plan ending in December 2017 for the employees who met the requirements defined by the plan regarding age and seniority in the Company, among others. Following this transformation and simplification framework, the Company has, on one hand, extended the plan termination till 2018 and on the other hand, it has set up in December 2016 a new voluntary program aimed at employees who met certain requirements related to seniority in the Company. In 2017 the last program had been extended. The provision for this concept at
December 31, 2018
totaled
100 million
euros (
159 million
euros in
2017
).
Post-employment defined benefit plans
The Group has a number of defined benefit plans in the countries where it operates. The following tables present the main data of these plans:
|
12/31/2018
|
||||||||||||||
|
Millions of euros
|
United
Kingdom
|
|
Germany
|
|
Brazil
|
|
Hispam Norte
|
|
Hispam Sur
|
|
Others
|
|
Total
|
|
|
Obligation
|
1,548
|
|
239
|
|
749
|
|
68
|
|
6
|
|
18
|
|
2,628
|
|
|
Assets
|
(1,570
|
)
|
(90
|
)
|
(848
|
)
|
—
|
|
—
|
|
(12
|
)
|
(2,520
|
)
|
|
Net provision before asset ceiling
|
(22
|
)
|
149
|
|
(99
|
)
|
68
|
|
6
|
|
6
|
|
108
|
|
|
Asset ceiling
|
—
|
|
—
|
|
249
|
|
—
|
|
—
|
|
—
|
|
249
|
|
|
Total
|
(22
|
)
|
149
|
|
150
|
|
68
|
|
6
|
|
6
|
|
357
|
|
|
Net provision
|
4
|
|
157
|
|
153
|
|
72
|
|
6
|
|
6
|
|
398
|
|
|
Net assets
|
26
|
|
8
|
|
3
|
|
4
|
|
—
|
|
—
|
|
41
|
|
|
12/31/2017
|
||||||||||||||||
|
Millions of euros
|
Spain (Antares)
|
|
United
Kingdom
|
|
Germany
|
|
Brazil
|
|
Hispam Norte
|
|
Hispam Sur
|
|
Others
|
|
Total
|
|
|
Obligation
|
490
|
|
1,828
|
|
235
|
|
734
|
|
72
|
|
8
|
|
16
|
|
3,383
|
|
|
Assets
|
—
|
|
(1,651
|
)
|
(84
|
)
|
(835
|
)
|
—
|
|
—
|
|
(9
|
)
|
(2,579
|
)
|
|
Net provision before asset ceiling
|
490
|
|
177
|
|
151
|
|
(101
|
)
|
72
|
|
8
|
|
7
|
|
804
|
|
|
Asset ceiling
|
—
|
|
—
|
|
—
|
|
232
|
|
—
|
|
—
|
|
—
|
|
232
|
|
|
Total
|
490
|
|
177
|
|
151
|
|
131
|
|
72
|
|
8
|
|
7
|
|
1,036
|
|
|
Net provision
|
490
|
|
177
|
|
151
|
|
134
|
|
72
|
|
8
|
|
7
|
|
1,039
|
|
|
Net assets
|
—
|
|
—
|
|
—
|
|
3
|
|
—
|
|
—
|
|
—
|
|
3
|
|
F-91
The movement in the present value of obligations in
2018
and
2017
is as follows:
|
Millions of euros
|
Spain (Antares)
|
|
United Kingdom
|
|
Germany
|
|
Brazil
|
|
Hispam Norte
|
|
Hispam Sur
|
|
Other
|
|
Total
|
|
|
Present value of obligation at 12/31/16
|
533
|
|
1,834
|
|
233
|
|
737
|
|
18
|
|
7
|
|
16
|
|
3,378
|
|
|
Translation differences
|
—
|
|
(67
|
)
|
—
|
|
(109
|
)
|
(13
|
)
|
(2
|
)
|
(2
|
)
|
(193
|
)
|
|
Current service cost
|
6
|
|
—
|
|
9
|
|
3
|
|
2
|
|
—
|
|
1
|
|
21
|
|
|
Interest cost
|
6
|
|
46
|
|
4
|
|
73
|
|
5
|
|
1
|
|
1
|
|
136
|
|
|
Actuarial losses and gains
|
(9
|
)
|
60
|
|
(8
|
)
|
85
|
|
7
|
|
1
|
|
—
|
|
136
|
|
|
Benefits paid
|
(46
|
)
|
(46
|
)
|
(3
|
)
|
(55
|
)
|
(3
|
)
|
—
|
|
(1
|
)
|
(154
|
)
|
|
Inclusion of companies
|
—
|
|
—
|
|
—
|
|
—
|
|
61
|
|
—
|
|
—
|
|
61
|
|
|
Other movements
|
—
|
|
1
|
|
—
|
|
—
|
|
(5
|
)
|
1
|
|
1
|
|
(2
|
)
|
|
Present value of obligation at 12/31/17
|
490
|
|
1,828
|
|
235
|
|
734
|
|
72
|
|
8
|
|
16
|
|
3,383
|
|
|
Translation differences
|
—
|
|
(12
|
)
|
—
|
|
(81
|
)
|
(3
|
)
|
(3
|
)
|
1
|
|
(98
|
)
|
|
Current service cost
|
6
|
|
—
|
|
9
|
|
4
|
|
1
|
|
—
|
|
1
|
|
21
|
|
|
Interest cost
|
7
|
|
44
|
|
4
|
|
65
|
|
5
|
|
2
|
|
1
|
|
128
|
|
|
Actuarial losses and gains
|
4
|
|
(260
|
)
|
(6
|
)
|
68
|
|
(2
|
)
|
1
|
|
—
|
|
(195
|
)
|
|
Benefits paid
|
(41
|
)
|
(50
|
)
|
(3
|
)
|
(41
|
)
|
(5
|
)
|
(2
|
)
|
(1
|
)
|
(143
|
)
|
|
Transfers
|
(466
|
)
|
—
|
|
—
|
|
—
|
|
—
|
|
—
|
|
—
|
|
(466
|
)
|
|
Other movements
|
—
|
|
(2
|
)
|
—
|
|
—
|
|
—
|
|
—
|
|
—
|
|
(2
|
)
|
|
Present value of obligation at 12/31/18
|
—
|
|
1,548
|
|
239
|
|
749
|
|
68
|
|
6
|
|
18
|
|
2,628
|
|
The reclassification of provision for post-employment plans of the entity Seguros de Vida y Pensiones Antares, S.A. to the line "Liabilities associated with non-current assets held for sale" of the statement of financial position is recorded under "Transfers" of the 2018 movement, and amounted to
466
million euros (see Note 28).
Movements in the fair value of plan assets in
2018
and
2017
are as follows:
|
Millions of euros
|
United Kingdom
|
|
Germany
|
|
Brazil
|
|
Other
|
|
Total
|
|
|
Fair value of plan assets at 12/31/16
|
1,662
|
|
128
|
|
982
|
|
8
|
|
2,780
|
|
|
Translation differences
|
(61
|
)
|
—
|
|
(130
|
)
|
(1
|
)
|
(192
|
)
|
|
Interest income
|
42
|
|
2
|
|
99
|
|
1
|
|
144
|
|
|
Actuarial losses and gains
|
55
|
|
—
|
|
(64
|
)
|
—
|
|
(9
|
)
|
|
Company contributions
|
—
|
|
6
|
|
1
|
|
1
|
|
8
|
|
|
Benefits paid
|
(46
|
)
|
(2
|
)
|
(52
|
)
|
(1
|
)
|
(101
|
)
|
|
Other movements
|
(1
|
)
|
(50
|
)
|
(1
|
)
|
1
|
|
(51
|
)
|
|
Fair value of plan assets at 12/31/17
|
1,651
|
|
84
|
|
835
|
|
9
|
|
2,579
|
|
|
Translation differences
|
(13
|
)
|
—
|
|
(92
|
)
|
—
|
|
(105
|
)
|
|
Interest income
|
40
|
|
1
|
|
74
|
|
—
|
|
115
|
|
|
Actuarial losses and gains
|
(57
|
)
|
1
|
|
69
|
|
1
|
|
14
|
|
|
Company contributions
|
(2
|
)
|
—
|
|
—
|
|
1
|
|
(1
|
)
|
|
Participants contributions
|
—
|
|
3
|
|
—
|
|
—
|
|
3
|
|
|
Benefits paid
|
(49
|
)
|
(2
|
)
|
(38
|
)
|
—
|
|
(89
|
)
|
|
Other movements
|
—
|
|
3
|
|
—
|
|
1
|
|
4
|
|
|
Fair value of plan assets at 12/31/18
|
1,570
|
|
90
|
|
848
|
|
12
|
|
2,520
|
|
F-92
"Other movements" of Telefónica Germany in 2017 relate to the reclassification of long-term financial assets that do not qualify as plan assets under IAS 19 amounting to
50 million
euros (see Note 11).
The Group’s main defined-benefit plans are:
Antares
a) ITP
Telefónica Spain reached an agreement with its employees whereby it recognized supplementary pension payments for retired employees as of June 30, 1992 equal to the difference between the pension payable by the social security system and pension that would be paid to them by ITP (Institución Telefónica de Previsión). Once the aforementioned supplementary pension payments had been quantified, they became fixed, lifelong and non-updatable, with
60%
of the payments ransferable to the surviving spouse, recognized as such as of June 30, 1992, and underage children.
The amount for this provision totaled
206 million
euros at
December 31, 2018
(
233 million
euros at
December 31, 2017
).
b) Survival
Serving employees who did not join the defined pension plan are still entitled to receive survivorship benefits at the age of 65.
The amount for this provision totaled
260 million
euros at
December 31, 2018
(
257 million
euros at
December 31, 2017
).
These provisions have been reclassified to "Liabilities associated with non-current assets classified as held for sale" of the statement of financial position. The long-term financial assets to cover the obligations of these two defined benefit plans
amounting to
634
million euros (see Note 11) have been also reclassified to "Non-current assets classified as held for sale" of the statement of financial position (see Note 28).
The average length of the plans is
7.42
years. The main actuarial assumptions used in valuing these plans are as follows:
|
|
Survival
|
ITP
|
||||||
|
|
12/31/2018
|
|
12/31/2017
|
|
12/31/2018
|
|
12/31/2017
|
|
|
Discount rate
|
1.32
|
%
|
1.45
|
%
|
1.29
|
%
|
1.37
|
%
|
|
Expected rate of salary increase
|
0%-0.5%
|
|
0%-0.5%
|
|
−
|
|
−
|
|
|
Mortality tables
|
PERM/F 2000P OM77
|
|
PERM/F 2000P OM77
|
|
90%PERM 2000C/98% PERF 2000C
|
|
90%PERM 2000C/98% PERF 2000C
|
|
Telefónica United Kingdom Pension Plan
The Telefónica United Kingdom Pension Plan provides pension benefits to the various companies of the Telefónica Group in United Kingdom coming from the O2 Group. The Plan comprises a defined contribution and defined benefit sections. The defined benefit sections were closed to future accrual starting from February 28, 2013. The companies continued providing retirement benefits through the defined contribution sections of the plan.
The number of beneficiaries of these plans at
December 31, 2018
and
2017
were
4,456
and
4,491
respectively. At December 31, 2018, the weighted average duration of the plan was
23
years.
The main actuarial assumptions used in valuing the plan are as follows:
F-93
|
|
12/31/2018
|
|
12/31/2017
|
|
|
Nominal rate of pension payment increase
|
3.05
|
%
|
3.15
|
%
|
|
Discount rate
|
2.85
|
%
|
2.45
|
%
|
|
Expected inflation
|
3.20
|
%
|
3.30
|
%
|
|
Mortality tables
|
95% S2NA,
|
|
95% S2NA,
|
|
|
CMI 2017 1% 7.5
|
|
CMI 2016 1% 7.5
|
|
|
Fair value of Plan assets is as follows:
|
Millions of euros
|
12/31/2018
|
|
12/31/2017
|
|
|
Bonds
|
1,570
|
|
1,651
|
|
|
Total
|
1,570
|
|
1,651
|
|
So long as other assumptions remained constant, at
December 31, 2018
, reasonably possible changes to one of the following actuarial assumptions would have affected the defined benefit obligation by the amounts shown below:
|
Millions of euros
|
Increase in defined benefit obligation
|
|
|
Discount rate (0.25% decrease)
|
97
|
|
|
Expected inflation (0.25% increase)
|
93
|
|
|
Life expectancy (1 year longer)
|
38
|
|
Telefónica Brazil pension plans
Telefônica Brazil sponsors the following post-employment benefit plans:
|
Plans
|
Management entity
|
Sponsor
|
|
Health plans
|
|
|
|
Plano de Assistência Médica ao Aposentado y Programa de Coberturas Especiais (PAMA/PCE)
|
Fundação Sistel de Seguridade Social
|
Telefônica Brasil, jointly and severally with other companies resulting from the privatization of Telebrás (Telecomunicações Brasileiras, S.A.)
|
|
Assistencia médica – Lei 9.656/98
|
Telefônica Brasil
|
Telefônica Brasil, Terra Networks and TGLog
|
|
Pension plans
|
|
|
|
PBS Assistidos (PBS-A)
|
Fundação Sistel de Seguridade Social
|
Telefônica Brasil, jointly and severally with other companies resulting from the privatization of Telebrás (Telecomunicações Brasileiras, S.A.)
|
|
CTB
|
Telefônica Brasil
|
Telefônica Brasil
|
|
Telefônica BD
|
Visão Prev
|
Telefônica Brasil
|
|
Planes VISAO
|
Visão Prev
|
Telefônica Brasil, Terra Networks and TGLog
|
The main actuarial assumptions used in valuing these plans are as follows:
|
|
12/31/2018
|
|
12/31/2017
|
|
|
Discount rate
|
8.96% - 9.27%
|
|
9.46% - 9.88%
|
|
|
Nominal rate of salary increase
|
5.67
|
%
|
5.93
|
%
|
|
Long-term inflation rate
|
4.00
|
%
|
4.25
|
%
|
|
Growth rate for medical costs
|
7.12
|
%
|
7.38
|
%
|
|
Mortality tables
|
AT 2000 M/F
|
|
AT 2000 M/F
|
|
F-94
The discount rate and growth rate for medical costs are considered to be the most significant actuarial assumptions with a reasonable possibility of fluctuations depending on demographic and economic changes and may significantly change the amount of the post-employment benefit obligation. The sensitivity to changes in these assumptions is shown below:
|
|
Present value of the discounted obligation at the current discount rate
|
|
Present value of the obligation by increasing the discount rate by 0.5%
|
|
Present value of the obligation by reducing the discount rate by 0.5%
|
|
|
Pension plans
|
453
|
|
436
|
|
472
|
|
|
Health plans
|
296
|
|
275
|
|
320
|
|
|
Total obligation
|
749
|
|
711
|
|
792
|
|
|
|
Present value of the obligation at the current growth rate for medical costs
|
|
Present value of the obligation by increasing the rate by 1%
|
|
Present value of the obligation by reducing the rate by 1%
|
|
|
Pension plans
|
453
|
|
453
|
|
453
|
|
|
Health plans
|
296
|
|
346
|
|
256
|
|
|
Total obligation
|
749
|
|
799
|
|
709
|
|
Other benefits
Teléfonica de España, Telefónica Móviles España and Telefónica Soluciones Individual Suspension Plan
In 2015 Telefónica de España, S.A.U., Telefónica Móviles España, S.A.U. and Telefónica Soluciones de Informática y Comunicaciones de España, S.A.U. signed the 1st Collective Bargaining Agreement of Related Companies (CEV), wholly backed by the largest labor unions. This agreement considered elements that included a plan of measures for individual suspension of the employment relationship in 2016 and 2017, applying principles of voluntariness, universality, non-discrimination and social responsibility. In December 2016, the Collective Bargaining Agreement of Related Companies was extended until 2018 by virtue of the provisions thereof.
This plan is based on mutual agreement between the company and employees and entails the possibility of voluntarily suspending the employment relationship for an initial three-year period, renewable for consecutive three-year periods until the retirement age. Employees who meet the age and seniority requirements may enter the Individual Suspension Plan (PSI) in the periods opened for this purposes.
At the end of each period, the current value of the forecast payment flows to meet the commitments of this program (applying certain hypotheses regarding estimated number of accessions and future reintegration ratio) is recognized. This figure was calculated using actuarial criteria (PERM/F-2000C tables, combined with the invalidity table published in the 1977 ministerial order) and a high quality credit market based interest rate.
The corresponding provision is recognized under “Other benefits” in the above table. The provision at
December 31, 2018
amounted to
3,588 million
euros (
3,580 million
euros at December 31, 2017).
The discount rate used for these provisions at
December 31, 2018
was
0.9%
with an average plan length of
4.7
years.
The table below shows the sensitivity of the value of termination, post-employment and other obligations, including the Individual Suspension Plan of Telefónica Group companies in Spain to changes in the discount rate:
|
-100 b.p.
|
+100 b.p.
|
||||||
|
Impact on value
|
|
Impact on income statement
|
|
Impact on value
|
|
Impact on income statement
|
|
|
(184
|
)
|
(184
|
)
|
171
|
|
171
|
|
A 100 b.p. increase in the discount rate would reduce the value of the liabilities by
171 million
euros and have a positive impact on the income statement of
171 million
euros before tax. On the other hand, a 100 b.p. decrease in the discount rate would increase the value of the liabilities by
184 million
euros and have a negative impact on the income statement of
184 million
euros before tax.
F-95
The Telefónica Group actively manages this position and has arranged a derivatives portfolio to significantly reduce the impact of changes in the discount rate (see Note 17).
b) Provisions for dismantling of assets
The movement of provision for dismantling of assets in 2018 and 2017 is as follows:
|
|
Millions of euros
|
|
|
Dismantling of assets at 12/31/16
|
1,001
|
|
|
Additions and accretion
|
91
|
|
|
Retirements/amount applied
|
(53
|
)
|
|
Translation differences and other
|
(66
|
)
|
|
Dismantling of assets at 12/31/17
|
973
|
|
|
Additions and accretion
|
96
|
|
|
Retirements/amount applied
|
(83
|
)
|
|
Translation differences and other
|
(77
|
)
|
|
Dismantling of assets at 12/31/18
|
909
|
|
The detail by segments of provision for dismantling of assets in 2018 and 2017 is as follows:
|
Millions of euros
|
12/31/2018
|
|
12/31/2017
|
|
|
Telefónica Spain
|
7
|
|
14
|
|
|
Telefónica Germany
|
421
|
|
450
|
|
|
Telefónica Brazil
|
152
|
|
146
|
|
|
Telefónica United Kingdom
|
85
|
|
91
|
|
|
Telefónica Hispam Norte
|
26
|
|
40
|
|
|
Telefónica Hispam Sur
|
76
|
|
89
|
|
|
Other companies
|
142
|
|
143
|
|
|
Total
|
909
|
|
973
|
|
c) Other provisions
The movement in “Other provisions” in
2018
and
2017
is as follows:
|
|
Millions of euros
|
|
|
Other provisions at December 31, 2016
|
3,943
|
|
|
Additions and accretion
|
1,406
|
|
|
Retirements/amount applied
|
(1,074
|
)
|
|
Translation differences and other
|
(392
|
)
|
|
Other provisions at December 31, 2017
|
3,883
|
|
|
Additions and accretion
|
911
|
|
|
Retirements/amount applied
|
(1,276
|
)
|
|
Transfers
|
(89
|
)
|
|
Translation differences and other
|
(291
|
)
|
|
Other provisions at December 31, 2018
|
3,138
|
|
The reclassification of other provisions of the entity Seguros de Vida y Pensiones Antares, S.A. to the line "Liabilities associated with non-current assets held for sale" of the statement of financial position is recorded under "Transfers" of the 2018 movement, amounted to
81
million euros (see Note 28).
F-96
The Group is exposed to risks of claims and litigation, mainly relating to tax and regulatory proceedings, and labor and civil claims.
Given the nature of the risks covered by these provisions, no reliable schedule of potential payments, if any, can be determined.
Telefónica Brasil
Telefônica Brasil, S.A. and its subsidiaries are party to administrative and judicial proceedings and labor, tax and civil claims filed in different courts. The Telefónica Group management based on the opinion of its legal counsel, recognized provisions for proceedings for which an unfavorable outcome is considered likely.
The balance of these provisions at December 31, 2018 and December, 31 2017 is shown in the following table:
|
Millions of euros
|
12/31/2018
|
|
12/31/2017
|
|
|
Provisions for tax proceedings
|
440
|
|
902
|
|
|
Provisions for regulatory proceedings
|
230
|
|
278
|
|
|
Provisions for labor claims
|
176
|
|
247
|
|
|
Provisions for civil proceedings
|
226
|
|
266
|
|
|
Total
|
1,072
|
|
1,693
|
|
Additionally, Telefónica Brasil recognized contingent liabilities according to IFRS 3 generated on acquisition of the controlling interest of Vivo Participaçoes in 2011 and GVT in 2015. These contingent liabilities amounted to
186
million euros at December 31, 2018 (
213
million euros at December 31, 2017).
The detail of provisions for tax proceedings by nature of risk is as follows:
|
Millions of euros
|
12/31/2018
|
|
12/31/2017
|
|
|
Federal taxes
|
119
|
|
127
|
|
|
State taxes
|
205
|
|
58
|
|
|
Municipal taxes
|
8
|
|
8
|
|
|
FUST, FISTEL and EBC
|
108
|
|
709
|
|
|
Total
|
440
|
|
902
|
|
The provision corresponding to the litigation in relation to the Social Security contribution rate of Empresa Brasileña de Comunicaciones (EBC) and Fondo de Fiscalización de las Telecomunicaciones (FISTEL) was reduced in 2018 by the amount of the judicial deposits accepted as payment in judicial proceedings, which in the case of the litigation related to EBC remain in the courts at December 31, 2018.
F-97
The breakdown of changes in provisions for tax proceedings in 2018 and 2017 is as follows:
|
Millions of euros
|
|
|
|
Balance at 12/31/2016
|
911
|
|
|
Movements with a counterparty in judicial deposits
|
26
|
|
|
Movements with a counterparty in the income statement
|
43
|
|
|
Write-offs due to payment
|
(47
|
)
|
|
Monetary updating
|
97
|
|
|
Translation differences
|
(134
|
)
|
|
Other movements
|
6
|
|
|
Balance at 12/31/2017
|
902
|
|
|
Movements with a counterparty in judicial deposits
|
(569
|
)
|
|
Movements with a counterparty in the income statement
|
105
|
|
|
Write-offs due to payment
|
(12
|
)
|
|
Monetary updating
|
97
|
|
|
Translation differences
|
(83
|
)
|
|
Balance at 12/31/2018
|
440
|
|
Group management and legal counsel understand that losses are possible from tax contingencies in federal, state, municipal and other taxes for an aggregated amount of
8,136
million euros (
8,919
million
euros as of 31 December 2017). Noteworthy state tax-related contingencies include the "ICMS" tax (see Note 22), while the federal taxes include corporate income tax (see Note 22). Moreover, Telefónica Brasil presently has different open proceedings regarding the Fundo de Universalização de Serviços de Telecomunicações (FUST, refer to Note 26).
With regard to regulatory proceedings, Telefónica Brasil is party to administrative proceedings against Agencia Nacional de Telecomunicações (ANATEL) based on an alleged failure to meet sector regulations and judicial proceedings to contest sanctions applied by ANATEL at the administrative level. At December 31, 2018, consolidated provisions totaled
230 million
euros (
278 million
euros at December 31, 2017). In addition, Group management and legal counsel understand that losses are possible from regulatory contingencies amounting to
1,379
million
euros at December 31, 2018 (
1,277 million
euros at December 31, 2017).
In some situations, in connection with a legal requirement or presentation of guarantees, judicial deposits are made to secure the continuance of the claims under discussion. The judicial deposits by nature of risk at December 31, 2018 and December 31, 2017 are as follows:
|
Millions of euros
|
12/31/2018
|
|
12/31/2017
|
|
|
Tax proceedings
|
435
|
|
1,066
|
|
|
Labor claims
|
118
|
|
223
|
|
|
Civil proceedings
|
262
|
|
304
|
|
|
Regulatory proceedings
|
47
|
|
51
|
|
|
Garnishments
|
19
|
|
36
|
|
|
Total
|
881
|
|
1,680
|
|
|
Current (see Note 13)
|
71
|
|
82
|
|
|
Non-current (see Note 11)
|
810
|
|
1,598
|
|
Telefónica del Perú
In 2015, the Group established a provision of
1,521
million Peruvian soles (approximately
431
million euros) in relation to tax claims involving Telefónica Peru (see Note 22). At
December 31, 2018
this provision amounted to
439
million euros
(
425
million euros at December 31, 2017).
Telefónica, S.A.
F-98
The Group has continued provisioning the amount of the goodwill amortized for tax purposes (see Note 22), for a total of
283 million
euros at December 31, 2018 (
215 million
euros at December 31, 2017).
Pursuant to a Ministerial Order dated December 27, 1989, Telefónica, S.A. files consolidated tax returns in Spain for certain Group companies. The consolidated tax group comprised
44
companies at December 31, 2018 (
45
companies at December, 31
2017
).
This tax consolidation regime applies indefinitely providing the companies continue to meet the requirements set down in prevailing legislation, and that application of the regime is not expressly waived.
Group companies resident in Spain that are not part of this consolidation regime and non-resident companies file individual or aggregated tax returns under the tax law applicable in each country.
Deferred taxes movement
The movements in deferred taxes in the Telefónica Group in
2018
and
2017
are as follows:
|
Millions of euros
|
Deferred tax assets
|
|
Deferred tax liabilities
|
|
|
Balance at December 31, 2017
|
7,820
|
|
2,145
|
|
|
Additions
|
1,866
|
|
916
|
|
|
Disposals
|
(1,844
|
)
|
(320
|
)
|
|
Transfers
|
(79
|
)
|
(204
|
)
|
|
Translation differences and hyperinflation adjustments
|
(127
|
)
|
130
|
|
|
Company movements and others
|
(5
|
)
|
7
|
|
|
Balance at December 31, 2018
|
7,631
|
|
2,674
|
|
|
Millions of euros
|
Deferred tax assets
|
|
Deferred tax liabilities
|
|
|
Balance at December 31, 2016
|
8,229
|
|
2,395
|
|
|
Additions
|
1,702
|
|
579
|
|
|
Disposals
|
(1,711
|
)
|
(413
|
)
|
|
Transfers
|
(196
|
)
|
(391
|
)
|
|
Translation differences and hyperinflation adjustments
|
(211
|
)
|
(70
|
)
|
|
Company movements and others
|
7
|
|
45
|
|
|
Balance at December 31, 2017
|
7,820
|
|
2,145
|
|
Main changes registered in 2018
I
n Spain, tax credits for loss carryforwards amounting to
791
millions of euros were capitalized in 2018, and tax credits from deductions of
477
million euros were reversed, mainly due to the effect of the ruling of the Central Economic-Administrative Court notified on January 22, 2019, partially upholding the Company's position (as shown in the section "Inspections of the Spanish tax group" in this present Note to the financial statements) in the expected schedule of realization of deferred tax assets and liabilities (see "Expected realization of deferred tax assets and liabilities" below).
Telefónica Móviles México derecognized deferred tax assets for temporary differences amounting to
327
million euros (with a balancing entry in Corporate income tax), mainly due to a change in the assumptions used within the existing tax framework, that affect the time horizon in which the Group expects to recover the assets.
After the completion of a deferred tax asset recoverability analysis, based in Colombia Telecomunicaciones, S.A. ESP financial projections, tax losses carryforwards amounting to
106
million euros were capitalized.
Furthermore, this company applied tax loss carryforwards in 2018 amounting to
57
million euros.
F-99
Telefónica Brasil recognized tax credits for loss carryforwards amounting to
160
million euros, mainly generated in the year. On the other hand, the evolution of temporary differences resulted in additions and disposals of deferred tax assets amounting to
184
million euros and
271
million euros, respectively. In addition, Telefónica Brazil recognized deferred tax liabilities amounting to
415
million euros, mainly related to the tax amortization of goodwill.
Given that Venezuela is considered a hyperinflationary economy, the financial statements of Telefónica Venezolana are adjusted for inflation (see Note 3.a). The hyperinflation adjustment is not deductible according to the present tax regime in Venezuela, thus it generates deferred taxes for the differences between the accounting value and the tax value of the net assets. These deferred taxes do not represent a cash outflow and the net impact in equity will be neutral when the assets are totally amortized. The movement of these deferred taxes in 2018 generated a tax expense of
186
million euros (see Note 2).
The additions of deferred tax assets included tax credits recognized in the amount of
84
million euros by the German company Group 3G UMTS Holding GmbH. Furthermore, this company applied tax loss carryforwards in 2018 amounting to
77
million euros.
In 2018 the additions of deferred tax assets recognized in the amount of
101
million euros were the result of the provisions recognized during the year in relation to the various workforce restructuring plans and other obligations with employees of the companies included in the group in Spain (see Note 21). Likewise,
disposals of deferred tax assets in 2018 include the impact of the recognition of these provisions, amounting to
215
million euros.
Furthermore, in compliance with the sixteenth transitional provision of this amended Royal Decree-Law, which requires the inclusion of one-fifth of the investment portfolio impairment losses which had been deductible in the tax base before January 1, 2013, the Group reclassified
206
million euros of deferred tax liabilities in order to recognize a higher tax payable to the Spanish tax authorities, corresponding to one-fifth of the tax losses affected by this law.
The impact of initial application of IFRS 15 was a decrease of
27
million euros of deferred tax assets and increase of
164
million euros in deferred tax liabilities (see Note 2).
The movements relating deferred tax recognized directly in equity in 2018 amounted to
89
million euros of additions (net position of more deferred tax liabilities) and
13
million euros of disposals (net position of more deferred tax assets).
Main changes registered in 2017
After the early termination of the contract with PARAPAT (refer to Note 2), Colombia Telecomunicaciones, S.A. ESP derecognized tax credits due to temporary differences associated with the debt with PARAPAT amounting to
324
million euros, and recognized tax credits for negative tax bases and temporary differences of
233
million euros and
63
million euros, respectively. Besides, after the completion of a deferred tax asset recoverability analysis, tax losses carryforwards amounting to
163
million euros were also capitalized.
Telefónica Brasil recognized tax credits for loss carryforwards amounting to
198
million euros, mainly generated in the year. On the other hand, the evolution of temporary differences resulted in additions and disposals of deferred tax assets amounting to
258
million euros and
281
million euros, respectively. In addition, Telefónica Brazil recognized deferred tax liabilities amounting to
317
million euros, mainly related to the tax amortization of goodwill.
After the merger through absorption of its subsidiary Telefónica Móviles Chile, S.A., Inversiones Telefónica Móviles Holding, S.A. recognized deferred tax assets totaling
193
million euros.
The deferred tax assets of Telefónica Germany decreased from
427
million euros at December 31, 2016 to
162
million euros at December 31, 2017, mainly due to the evolution of temporary differences for the tax amortization of intangible assets.
The movement of deferred taxes of Telefónica Venezolana in 2017 generated a tax expense of
138
million euros (see Note 2).
The additions of deferred tax assets included tax credits recognized in the amount of
82
million euros by the German company Group 3G UMTS Holding GmbH. Furthermore, this company applied tax loss carryforwards in 2017 amounting to
78
million euros.
In 2017 the additions of deferred tax assets recognized in the amount of
84
million euros were the result of the provisions recognized during the year in relation to the various workforce restructuring plans of the companies included in the tax group in Spain (see Note 21).
F-100
The disposals of deferred tax assets in 2017 also included the impact of the Group’s labor force reduction plans in Spain, amounting to
192
million euros.
Furthermore, in compliance with the sixteenth transitional provision of this amended Royal Decree-Law, which requires the inclusion of one-fifth of the investment portfolio impairment losses which had been deductible in the tax base before January 1, 2013, the Group reclassified
229
million euros of deferred tax liabilities in order to recognize a higher tax payable to the Spanish tax authorities, corresponding to one-fifth of the tax losses affected by this law.
The companies in the Spanish tax group recognized on disposals deferred tax assets totaling
134
million euros in 2017, as a result of the limit placed on deductible financial expenses.
The movements relating deferred tax recognized directly in equity in 2017 amounted to
24
million euros of additions and
96
million euros of disposals.
Expected realization of deferred tax assets and liabilities
The Group assesses the recoverability of deferred tax assets based on the future activities carried out by the different companies, on tax regulations in the different countries in which these companies operate, and on the strategic decisions affecting the companies. The schedule in Spain, with respect to carryforward tax losses, temporary differences and deductions, has been calculated at 2018 year end, considering the effects of the resolution notified on January 22, 2019, issued by the Central Economic-Administrative Court (TEAC) which partially upheld the claims made by Telefónica in connection with the tax inspections for the years 2008 to 2011, which allows the use of tax credits, mainly tax losses carryforward for years, 2008, 2009 and 2010. Under the assumptions made, considering the TEAC resolution, the estimated realization of deferred tax assets and liabilities recognized in the consolidated statement of financial position in
2018
and
2017
is as follows:
|
Millions of euros
|
||||||
|
12/31/2018
|
Total
|
|
Less than 1 year
|
|
More than 1 year
|
|
|
Deferred tax assets
|
7,631
|
|
1,736
|
|
5,895
|
|
|
Deferred tax liabilities
|
2,674
|
|
(9
|
)
|
2,683
|
|
|
Millions of euros
|
||||||
|
12/31/2017
|
Total
|
|
Less than 1 year
|
|
More than 1 year
|
|
|
Deferred tax assets
|
7,820
|
|
922
|
|
6,898
|
|
|
Deferred tax liabilities
|
2,145
|
|
(86
|
)
|
2,231
|
|
Deferred tax assets less than one year mainly come from the Tax Group in Spain (
1,461
million euros in
2018
and
558
million euros in
2017
).
Deferred tax assets in the accompanying consolidated statements of financial position include the tax loss carryforwards, unused tax credits recognized and deductible temporary differences recognized at the end of the reporting period.
|
Millions of euros
|
12/31/2018
|
|
12/31/2017
|
|
|
Tax credits for loss carryforwards
|
3,828
|
|
2,776
|
|
|
Unused tax deductions
|
1,422
|
|
1,858
|
|
|
Deferred tax assets for temporary differences
|
2,381
|
|
3,186
|
|
|
Total deferred tax assets
|
7,631
|
|
7,820
|
|
Tax credits for loss carryforwards
The movements in Tax credits for loss carryforwards in the Telefónica Group in
2018
and
2017
are as follows:
F-101
|
Location of the company (Millions of euros)
|
Balance at 12/31/2017
|
|
Additions
|
|
Reversals
|
|
Perimeter changes
|
|
Translation differences and other
|
|
Balance at 12/31/2018
|
|
|
Spain
|
1,500
|
|
791
|
|
(11
|
)
|
—
|
|
(8
|
)
|
2,272
|
|
|
Germany
|
472
|
|
185
|
|
(77
|
)
|
—
|
|
—
|
|
580
|
|
|
Hispanoamérica
|
799
|
|
292
|
|
(69
|
)
|
—
|
|
(46
|
)
|
976
|
|
|
Other countries
|
5
|
|
—
|
|
(4
|
)
|
—
|
|
(1
|
)
|
—
|
|
|
Total tax credits for loss carryforwards
|
2,776
|
|
1,268
|
|
(161
|
)
|
—
|
|
(55
|
)
|
3,828
|
|
|
Location of the company (Millions of euros)
|
Balance at 12/31/2016
|
|
Additions
|
|
Reversals
|
|
Perimeter changes
|
|
Translation differences and other
|
|
Balance at 12/31/2017
|
|
|
Spain
|
1,617
|
|
—
|
|
(114
|
)
|
(1
|
)
|
(2
|
)
|
1,500
|
|
|
Germany
|
550
|
|
82
|
|
(160
|
)
|
—
|
|
—
|
|
472
|
|
|
Hispanoamérica
|
321
|
|
675
|
|
(53
|
)
|
—
|
|
(144
|
)
|
799
|
|
|
Other countries
|
25
|
|
—
|
|
(20
|
)
|
—
|
|
—
|
|
5
|
|
|
Total tax credits for loss carryforwards
|
2,513
|
|
757
|
|
(347
|
)
|
(1
|
)
|
(146
|
)
|
2,776
|
|
The Spanish tax group had unused tax loss carryforwards at
December 31, 2018
amounting to
11,045
million euros:
|
Million of euros
|
Total
|
Less than 1 year
|
|
More than 1 year
|
|
|
Tax loss carryforwards generated in the tax group
|
8,040
|
3,322
|
|
4,718
|
|
|
Tax loss carryforwards generated before consolidation in the tax group
|
3,005
|
—
|
|
3,005
|
|
In 2017, as a result of the testing on the recoverability of deferred tax assets, carried out by the Group under the new legislative framework, were derecognized deferred tax assets relating to tax loss carryforwards amounting to
98
million euros.
In 2018 total tax credits for loss carryforwards in Spain in the statement of financial position at December 31, 2018 amounted to
2,272
million euros (
1,500
million euros at December 31, 2017). These tax credits do not expire. In 2018, tax credits for loss carryforwards amounting to
791
millions of euros were capitalized, mainly due to the effect of the ruling of the Central Economic-Administrative Court of January 22, 2019, partially upholding the Company's position (as shown in the section "Inspections of the Spanish tax group" in this present Note to the financial statements) in the expected schedule of realization of deferred tax assets and liabilities. Total unrecognized tax credits for loss carryforwards of the Spanish tax group amounted to
622
million euros. These tax credits do not expire.
The Group companies in Germany have recognized
580
million euros of tax credits for loss carryforwards at December 31, 2018. Total unrecognized tax credits for loss carryforwards of these companies amount to
6,478
million euros. These tax credits do not expire.
Recognized tax credits in the consolidated statement of financial arising from the Latin American subsidiaries at December 31, 2018 amounted to
976
million euros. Total unrecognized tax credits for tax loss carryforwards in Latin America amount to
240
million euros.
Deductions
The Group has recognized
1,422
million euros at December 31, 2018, mainly of the tax group in Spain, generated primarily from export activity, R+D+i, double taxation and donations to non-profit organizations.
In Spain tax credits from deductions of
477
million euros were reversed, as a consequence of the review in the expected schedule of realization of deferred tax assets and liabilities. In 2017, tax credits from deductions were recognized, in the amount of
71
million euros.
F-102
Temporary differences
The sources of deferred tax assets and liabilities from temporary differences recognized at
December 31, 2018
and
2017
are as follows:
|
Millions of euros
|
12/31/2018
|
|
12/31/2017
|
|
|
Goodwill and intangible assets
|
724
|
|
1,044
|
|
|
Property, plant and equipment
|
742
|
|
1,139
|
|
|
Personnel commitments
|
1,397
|
|
1,562
|
|
|
Provisions
|
895
|
|
1,079
|
|
|
Investments in subsidiaries, associates and other shareholdings
|
6
|
|
4
|
|
|
Inventories and receivables
|
254
|
|
301
|
|
|
Other
|
572
|
|
746
|
|
|
Total deferred tax assets for temporary differences
|
4,590
|
|
5,875
|
|
|
Deferred tax assets and liabilities offset
|
(2,209
|
)
|
(2,689
|
)
|
|
Total deferred tax assets for temporary differences registered in the statement of financial position
|
2,381
|
|
3,186
|
|
|
Millions of euros
|
12/31/2018
|
|
12/31/2017
|
|
|
Goodwill and intangible assets
|
1,981
|
|
2,192
|
|
|
Property, plant and equipment
|
1,307
|
|
1,168
|
|
|
Personnel commitments
|
19
|
|
35
|
|
|
Provisions
|
19
|
|
42
|
|
|
Investments in subsidiaries, associates and other shareholdings
|
780
|
|
1,015
|
|
|
Inventories and receivables
|
185
|
|
53
|
|
|
Other
|
592
|
|
329
|
|
|
Total deferred tax liabilities for temporary differences
|
4,883
|
|
4,834
|
|
|
Deferred tax assets and liabilities offset
|
(2,209
|
)
|
(2,689
|
)
|
|
Total deferred tax liabilities for temporary differences registered in the statement of financial position
|
2,674
|
|
2,145
|
|
Deferred tax assets and liabilities are offset if a legally enforceable right exists to set off current tax assets against current tax liabilities and the deferred taxes relate to the same taxable entity and the same taxation authority.
The heading "Other” includes, among others, the difference between the accounting and tax values created by the value of financial derivatives at year end (see Note 17).
F-103
Tax payables and receivables
Current tax payables and receivables at
December 31, 2018
and
2017
are as follows:
|
Millions of euros
|
Balance at 12/31/2018
|
|
Balance at 12/31/2017
|
|
|
Taxes payable
|
|
|
|
|
|
Tax withholdings
|
98
|
|
154
|
|
|
Indirect taxes
|
781
|
|
1,030
|
|
|
Social security
|
123
|
|
151
|
|
|
Current income taxes payable
|
580
|
|
580
|
|
|
Other
|
465
|
|
426
|
|
|
Total
|
2,047
|
|
2,341
|
|
|
Millions of euros
|
Balance at 12/31/2018
|
|
Balance at 12/31/2017
|
|
|
Tax receivables
|
|
|
|
|
|
Indirect tax
|
1,073
|
|
618
|
|
|
Current income taxes receivable
|
456
|
|
618
|
|
|
Other
|
147
|
|
139
|
|
|
Total
|
1,676
|
|
1,375
|
|
Reconciliation of book profit before taxes to taxable income
The reconciliation between book profit before tax and the income tax expense from continuing operations for
2018
,
2017
and
2016
is as follows:
|
Millions of euros
|
2018
|
|
2017
|
|
2016
|
|
|
Accounting profit before tax
|
5,571
|
|
4,597
|
|
3,245
|
|
|
Tax expense at prevailing statutory rate
|
1,544
|
|
1,310
|
|
897
|
|
|
Permanent differences
|
133
|
|
(186
|
)
|
(42
|
)
|
|
Changes in deferred tax charge due to changes in tax rates
|
6
|
|
19
|
|
1
|
|
|
(Capitalization)/reversal of tax deduction and tax relief
|
371
|
|
(79
|
)
|
(762
|
)
|
|
(Capitalization)/reversal of loss carryforwards
|
(1,067
|
)
|
(123
|
)
|
714
|
|
|
(Increase)/decrease in tax expense arising from temporary differences
|
569
|
|
157
|
|
(8
|
)
|
|
Other
|
65
|
|
121
|
|
46
|
|
|
Income tax expense
|
1,621
|
|
1,219
|
|
846
|
|
|
Breakdown of current/deferred tax expense
|
|
|
|
|
|
|
|
Current tax expense
|
1,122
|
|
968
|
|
1,012
|
|
|
Deferred tax expense/(benefit)
|
499
|
|
251
|
|
(166
|
)
|
|
Total income tax expense
|
1,621
|
|
1,219
|
|
846
|
|
Tax deductibility of financial goodwill in Spain
The tax regulations added article 12.5 to the Corporate Income Tax Law, which came into force on January 1, 2002. The article regulated the deductibility of tax amortization of financial goodwill arising from the acquisition of non-Spanish companies, which could be amortized over 20 years at
5%
per annum. Following the entry into force of the Laws 9/2011 of August 19, 2011 and 16/2013 of October 29, 2013, the amount of goodwill amortization deductible for tax purposes under article 12.5 for the years 2011 to 2015 was reduced from
5%
to
1%
. The effect is temporary because the
4%
not amortized during five years (
20%
in total) will be recovered extending the deduction period from the initial
20
years to
25
years.
F-104
The Telefónica Group, under this regulation, has been amortizing for tax purposes the financial goodwill from its investments, both direct and indirect, in O2, BellSouth and Coltel (prior to December 21, 2007) and Vivo (acquired in 2010). The positive accumulated effect in the corresponding settlements of corporate income tax from 2004 to the closing of December 31, 2018, was
1,389 million
euros.
In relation to this tax incentive, the European Commission (EC) has in recent years commenced three proceedings against the Spanish State as it deems that this tax benefit could constitute an example of state aid. Although the EC itself acknowledged the validity of its first two decisions for those investors that invested in European companies (for operations carried out before December 21, 2007 in the first decision, and before May 21, 2011 for investments in other countries in the second decision), in its third decision from October 15, 2014 it calls into question the applicability of the principle of legitimate expectations in the application of the incentive for indirect acquisitions, whatever the date of acquisition may have been.
As of the date of
these consolidated financial statements,
the three decisions continue to be subject to a final ruling. The first two were annulled by two judgments of the General Court of the European Union, which were appealed by the EC before the Court of Justice of the European Union and sent again to the General Court by the Judgment dated December 21, 2016, to reassess the tax incentive. In its ruling of November 15, 2018, the General Court confirmed the applicability of the legitimate expectations principle, but considered the "goodwill amortization" as state aid not compatible with the common market. This ruling has been appealed before the Court of Justice of the European Union.
Furthermore, there are doubts in the Spanish courts regarding the classification of the incentive as a deduction and if this deduction would remain in the case of a subsequent transfer of the relevant stake.
The Group has continued provisioning the amount of the goodwill amortized for tax purposes, corresponding mainly to the purchase of Vivo, for a total of
283
million euros at December 31, 2018 (
215 million
euros at Decembe
r 31, 2017).
Inspections of the tax group in Spain
In 2012, tax inspections for all taxes for the years 2005 to 2007 were completed, with the Company signing off a corporate income tax assessment of
135
million euros, which was paid in 2012, whilst disputing other adjustments with which it disagreed. Although the settlement agreement for the disputed tax assessment did not give rise to any tax payment, since the adjustments proposed were offset by unused tax loss carryforwards, the Company filed an appeal with the Central Economic-Administrative Court against these adjustments in May 2015, regarding the tax treatment of the “juros sobre el capital propio” (interest on own capital) as dividends.
In July 2015 tax inspections for all taxes for the years 2008 to 2011 were completed, with the Company signing off certain corporate income tax assessments and disputing others. This resulted in 2015 in an expense amounting to
206
million euros. However, this did not require any tax payment, as the adjustments arising from the inspection were offset by unused tax loss carryforwards, at the corresponding tax rate for each period.
Although the settlement agreement for the disputed tax assessment did not give rise to any tax payment, in July 2015 the Company filed an appeal with the Central Economic-Administrative Court against the adjustments it disputes, regarding the tax treatment of the “juros sobre el capital propio” (interest on own capital) as dividends, and the criteria to use tax loss carryforwards in the years subject to settlement.
In June 2017 the Company received an order of the Audiencia Nacional extending the effects of its ruling from February 27, 2014 from another tax payer to the individual legal status of Telefónica, in connection with the “Juros sobre el capital propio” (interest on own capital). As a consequence of the aforementioned, the Audiencia Nacional voided the corporate income tax assessment for the years 2005 to 2007 and 2008 to 2011 related to “Juros sobre el capital propio” settled by the tax authorities.
With respect to the use of tax loss carryforwards in the years subject to settlement during the inspection 2008 to 2011, still under litigation, in November 2017 the Company brought a judicial appeal to the Audiencia Nacional, against the alleged dismissal of the claim in the absence of a reply from the authorities. On January 22, 2019, Telefónica was notified of a resolution issued by the Central Economic-Administrative Court which partially upheld the claims made by Telefónica in connection with the tax inspections for the years 2008 to 2011. Telefónica intends to appeal this resolution (which is pending execution) in respect of such matters that were not resolved in favor of Telefónica.
At 2018 year end, it is not expected that there is any need to recognize additional liabilities for the outcome of this litigation.
F-105
Tax litigation in Telefónica Brazil
State taxes
The Telefónica Group is involved in a range of tax litigation in Brazil over direct and indirect taxes (including those relating to GVT). This includes a number of appeals relating to ICMS tax (a tax similar to VAT, levied on telecommunications services). There is a dispute with the Brazilian tax authorities over which services should be subject to settlement of this tax.
To date the most significant issues have focused on the requirement to collect ICMS on penalties charged to customers for non-compliance, Internet advertising services, and complementary or additional services to the basic telecommunications services such as value-added services, modem rental, and the application of this tax on the basic fee (
assinatura básica
). In the case of the latter (assinatura básica), a case is still pending before the Supreme Court including Oi, which could affect other companies of the telecommunications sector.
All related procedures are being contested in all instances (administrative and court proceedings). The aggregate amount of the relevant proceedings, updated to take into account interest, fines and other items, is approximately
16,295
million Brazilian reals (approximately
3,672
million euros, see Note 21 to the Consolidated Financial Statements). Telefónica Brazil has obtained independent expert reports supporting its position, i.e. that the aforesaid services are not subject to ICMS.
Federal taxes
Regarding the income tax (federal tax) the tax authorities proposed adjustments in relation to the tax amortization in the period from 2011 to 2014 of the goodwill generated by Telefônica Brasil's acquisition and merger with Vivo. The tax inspections were conducted from 2016 to 2018 and the accumulated amount at December 31, 2018 was
8,654
million Brazilian reals (approximately
1,950
million euros). These proceedings are at the administrative stage and no provisions have been made since the potential risk associated with them has been classified as "not probable" and Telefónica Brazil has received independent expert reports that support this view.
Tax litigation in Telefónica del Perú
With regard to tax matters in Peru, litigation continues over corporate income tax for 2000 and 2001, payments on account in respect of the year 2000, recoverable balances for 1998 and 1999, and the interest and penalties that should apply to these.
In August 2015, the court of second instance handed down a ruling partially upholding the position of Telefónica del Perú, ruling in its favor on three of the five objections filed by the tax authorities and appealed against to the courts, relating, inter alia, to corporate income tax for 2000-2001 (among others). This dispute accounts for more than
75%
of the total amount under litigation, with the objections relating to insolvency provisions, interest on borrowing and leases of space for public telephones. Both the tax authorities and the company have filed appeals against the decision in higher courts.
The settlements carried out by SUNAT for 2000 and 2001 are in the final stage of the legal process (under review by the Supreme Court) and a ruling has not yet been released.
In connection with these proceedings in Peru, the Group and its legal advisors consider that the Group’s position continues to be based on robust legal arguments.
In January 2019, Telefónica was notified that the Supreme Court has handed down a ruling partially upholding its position in relation to certain matters relating to 1998. In particular, on one hand, it has made a final ruling in favor of Telefónica in matters relating to the lease of space for public telephones, and on the other, it has resolved the matter relating to insolvency provisions by annulling the ruling of the court of second instance and returning the case to the court of first instance for it to pass judgment on the matter again.
In parallel to the aforementioned court proceedings, the tax authorities proceeded to collect corporate income tax due for the years 2000-2001 and payments on account of corporate income tax in respect of the year 2000. There were successive reductions to the sums claimed in the two cases following appeals filed by Telefónica del Perú against the settlements and due to the precautionary measures imposed. The company paid out
286
million Peruvian soles (approximately,
80
million euros) in 2012 and 2013 pending the final rulings.
In the context of these execution processes, in June 2015 the tax authorities issued Compliance Resolutions demanding payment of
1,521
million Peruvian soles (approximately
431 million
euros). An appeal was filed against this with the Tax Court, and the adoption of precautionary suspension measures duly requested from the legal authorities (as a
F-106
definitive court ruling on these cases is currently pending). No ruling was made in relation to these appeals in 2018, whilst in January 2018 the Tax Court suspended payment until the final ruling of the Supreme Court.
Given the sentences and rulings handed down in June and August 2015, the Group recognized a provision in the consolidated financial statements,
that at December 31, 2018 amounted to
1,697
million Peruvian soles (approximately
439
million euros). See Note 21 to the Consolidated Financial Statements.
Years open for inspection in the Group companies
The years open for review by the tax inspection authorities for the main applicable taxes vary from one consolidated company to another, based on each country’s tax legislation, taking into account their respective statute-of-limitations periods. In Spain the taxes from 2013 onwards are open to inspection.
In the other countries in which the Telefónica Group has a significant presence, the years open for inspection by the relevant authorities are generally as follows:
|
•
|
The last fourteen years in Germany.
|
|
•
|
The last nine years in United Kingdom.
|
|
•
|
The last seven years in Argentina.
|
|
•
|
The last five years in Brazil, Mexico, Uruguay and the Netherlands.
|
|
•
|
The last six years in Colombia (except in respect of years in which there were tax losses that are then used to offset tax charges, in which case the period is extended to 12 years).
|
|
•
|
The last four years in Peru, Guatemala, Nicaragua and Costa Rica.
|
|
•
|
From 2015 onwards. Since 2016, the statute of limitation is six years in Venezuela.
|
|
•
|
The last three years in Chile, Ecuador, El Salvador, the United States and Panama.
|
The tax inspection of the open years is not expected to give rise to additional material liabilities for the Group.
F-107
Revenues
The breakdown of “Revenues” is as follows:
|
Millions of euros
|
2018
|
|
2017
|
|
2016
|
|
|
Rendering of services
|
43,085
|
|
47,175
|
|
47,321
|
|
|
Sales
|
5,608
|
|
4,833
|
|
4,715
|
|
|
Total
|
48,693
|
|
52,008
|
|
52,036
|
|
Sales mainly include the sale of mobile terminals.
The breakdown of Revenues by segments is detailed in Note 4.
Other income
The breakdown of “Other income” is as follows:
|
Millions of euros
|
2018
|
|
2017
|
|
2016
|
|
|
Own work capitalized
|
815
|
|
863
|
|
867
|
|
|
Gain on disposal of companies
|
21
|
|
3
|
|
228
|
|
|
Gain on disposal of other assets
|
241
|
|
176
|
|
130
|
|
|
Government grants
|
22
|
|
23
|
|
28
|
|
|
Other operating income
|
523
|
|
424
|
|
510
|
|
|
Total
|
1,622
|
|
1,489
|
|
1,763
|
|
“Gain on disposal of companies” in 2018 mainly includes the gain on disposal of Tokbox Inc (see Appendix I). In 2016, this heading included the gain on disposal of Telefónica Media Argentina, S.A. and Atlántida Comunicaciones, S.A., holding companies of the Group’s stake in Televisión Federal, S.A. (Telefé), amounting to
199
million euros.
“Gain on disposal of other assets” includes gains from the sale of telephone towers of
53
million euros,
7
million euros and
1
million euros in
2018
,
2017
and
2016
, respectively.
"Other operating income" in 2018 includes gains from changes in the fair value of equity instruments in the amount of
24
million euros.
Other expenses
The breakdown of “Other expenses” is as follows:
|
Millions of euros
|
2018
|
|
2017
|
|
2016
|
|
|
Leases included in "Other expenses"
|
1,071
|
|
1,069
|
|
1,076
|
|
|
Advertising
|
1,029
|
|
1,211
|
|
1,256
|
|
|
Other external services
|
10,398
|
|
10,445
|
|
10,436
|
|
|
Taxes other than income tax
|
365
|
|
1,285
|
|
1,136
|
|
|
Change in trade provisions
|
748
|
|
863
|
|
799
|
|
|
Losses on disposal of fixed assets and changes in provisions for fixed assets
|
35
|
|
44
|
|
71
|
|
|
Goodwill impairment (Note 7)
|
350
|
|
—
|
|
215
|
|
|
Other operating expenses
|
403
|
|
509
|
|
352
|
|
|
Total
|
14,399
|
|
15,426
|
|
15,341
|
|
The favorable court rulings obtained by Telefónica Brazil in relation to the right to exclude the state tax on goods and services (ICMS) from the tax base for PIS and COFINS contributions, reduced the “Taxes” item by
789
million euros in 2018 (see Note 11).
F-108
"Other operating expenses " in 2018 includes losses from changes in the fair value of equity instruments in the amount of
3
million euros and the impairment of trade receivables measured at fair value through OCI in the amount of
46
million euros.
Estimated payment schedule
The estimated payment schedule in millions of euros for the next few years on operating leases and purchase and other contractual commitments (non-cancelable without penalty cost) are as follows:
|
12/31/2018
|
Total
|
Less than 1 year
|
|
1 to 3 years
|
|
3 to 5 years
|
|
More than 5 years
|
|
|
|
Telefónica Brazil
|
2,338
|
|
446
|
|
760
|
|
555
|
|
577
|
|
|
Telefónica Germany
|
2,151
|
|
436
|
|
667
|
|
432
|
|
616
|
|
|
Telefónica Hispam Norte
|
1,347
|
|
271
|
|
479
|
|
265
|
|
332
|
|
|
Telefónica Hispam Sur
|
446
|
|
112
|
|
186
|
|
86
|
|
62
|
|
|
Telefónica Spain
|
534
|
|
114
|
|
191
|
|
136
|
|
93
|
|
|
Telefónica United Kingdom
|
578
|
|
177
|
|
189
|
|
103
|
|
109
|
|
|
Others
|
491
|
|
93
|
|
165
|
|
99
|
|
134
|
|
|
Operating lease obligations
(1)
|
7,885
|
|
1,649
|
|
2,637
|
|
1,676
|
|
1,923
|
|
|
Purchase and other contractual obligations
(2)
|
12,881
|
|
4,864
|
|
4,990
|
|
1,801
|
|
1,226
|
|
(1) This item includes definitive payments (non-cancelable without penalty cost). Our operating lease obligations have in some cases extension options conditioned on the applicable law of each country. Accordingly, we have included only those amounts that represent the initial contract period.
(2) This item includes definitive payments (non-cancelable without penalty cost) due for agreements to purchase goods (such as network equipment) and services.
At
December 31, 2018
, the present value of future payments for Telefónica Group operating leases was
7,229
million euros (
1,962
million euros in Telefónica Brazil,
2,153
million euros in Telefónica Germany,
1,083
million euros in Telefónica Hispam Norte,
410
million euros in Telefónica Hispam Sur,
545
million euros in Telefónica Spain,
594
million euros in Telefónica United Kingdom and
482
million euros in other companies classified as “Others” on the table above).
The main finance lease transactions are described in Note 27.
Headcount
The table below presents the breakdown of the Telefónica Group’s average number of employees by segment (see Note 4) in
2018
,
2017
and
2016
, together with total headcount at December 31 each year. The comparative figures have been restated to reflect the division of the Telefónica Hispanoamérica segment in Telefónica Hispam Norte and Telefónica Hispam Sur (see note 4).
|
|
2018
|
2017
|
2016
|
|||||||||
|
|
Average
|
|
Year-end
|
|
Average
|
|
Year-end
|
|
Average
|
|
Year-end
|
|
|
Telefónica Spain
|
26,712
|
|
25,305
|
|
28,084
|
|
27,291
|
|
30,214
|
|
28,772
|
|
|
Telefónica United Kingdom
|
6,732
|
|
7,188
|
|
6,776
|
|
6,687
|
|
7,454
|
|
7,075
|
|
|
Telefónica Germany
|
8,366
|
|
8,203
|
|
8,653
|
|
8,535
|
|
8,341
|
|
8,517
|
|
|
Telefónica Brazil
|
34,068
|
|
33,499
|
|
33,991
|
|
34,125
|
|
34,247
|
|
33,782
|
|
|
Telefónica Hispam Norte
|
12,254
|
|
12,156
|
|
12,620
|
|
12,354
|
|
13,214
|
|
13,150
|
|
|
Telefónica Hispam Sur
|
24,883
|
|
24,673
|
|
25,378
|
|
25,095
|
|
25,674
|
|
25,751
|
|
|
Other companies
|
8,838
|
|
9,114
|
|
9,869
|
|
8,631
|
|
12,976
|
|
10,276
|
|
|
Total
|
121,853
|
|
120,138
|
|
125,371
|
|
122,718
|
|
132,120
|
|
127,323
|
|
Of the final headcount at
December 31, 2018
, approximately
37.7%
are women (
37.7%
at
December 31, 2017
).
At
December 31, 2018
, the number of employees with disabilities is
955
(
217
in Spain).
F-109
Depreciation and amortization
The breakdown of “Depreciation and amortization” on the consolidated income statement is as follows:
|
Millions of euros
|
2018
|
|
2017
|
|
2016
|
|
|
Depreciation of property, plant and equipment (Note 8)
|
5,751
|
|
5,953
|
|
5,951
|
|
|
Amortization of intangible assets (Note 6)
|
3,298
|
|
3,443
|
|
3,698
|
|
|
Total
|
9,049
|
|
9,396
|
|
9,649
|
|
Earnings per share
Basic earnings per share amounts are calculated by dividing (a) the profit for the year attributable to equity holders of the parent, adjusted for the net coupon corresponding to the undated deeply subordinated securities (see Note 15) and for the interest cost accrued in the period in relation to the debt component of the mandatorily convertible notes of the parent company (which matured on September 25, 2017, see note 15) by (b) the weighted average number of ordinary shares outstanding during the year plus the weighted average number of ordinary shares that would be issued upon the conversion of the said mandatorily convertible notes from the date of their issuance.
Diluted earnings per share amounts are calculated by dividing the net profit for the year attributable to ordinary equity holders of the parent, adjusted as described above, by the weighted average number of ordinary shares adjusted as described in the preceding paragraph, plus the weighted average number of ordinary shares that would be issued on the conversion of all the dilutive potential ordinary shares into ordinary shares.
Both basic and diluted earnings per share attributable to equity holders of the parent are calculated based on the following data:
|
Millions of euros
|
2018
|
|
2017
|
|
2016
|
|
|
Profit attributable to ordinary equity holders of the parent from continuing operations
|
3,331
|
|
3,132
|
|
2,369
|
|
|
Adjustment for the coupon corresponding to undated deeply subordinated securities
|
(540
|
)
|
(374
|
)
|
(348
|
)
|
|
Tax effect
|
138
|
|
97
|
|
91
|
|
|
Adjustment for the financial expense of the debt component of the mandatorily convertible notes
|
—
|
|
1
|
|
1
|
|
|
Total profit attributable to ordinary equity holders of the parent for basic and diluted earnings per share from continuing operations
|
2,929
|
|
2,856
|
|
2,113
|
|
|
Thousands
|
|
|
|
|
|
|
|
Number of shares
|
2018
|
|
2017
|
|
2016
|
|
|
Weighted average number of ordinary shares (excluding treasury shares) for basic earnings per share
|
5,126,575
|
|
5,110,188
|
|
4,909,254
|
|
|
Adjustment for mandatorily convertible notes
|
—
|
|
—
|
|
151,265
|
|
|
Adjusted number of shares for basic earnings per share (excluding treasury shares)
|
5,126,575
|
|
5,110,188
|
|
5,060,519
|
|
|
Telefónica, S.A. share option plans
|
663
|
|
—
|
|
2,716
|
|
|
Weighted average number of ordinary shares outstanding for diluted earnings per share
|
5,127,238
|
|
5,110,188
|
|
5,063,235
|
|
For the purposes of calculating the earnings per share (basic and diluted) of 2016, the weighted average number of shares outstanding was retrospectively adjusted for the bonus share issues carried out to meet the scrip dividends paid in 2016 (see Note 15) as if such transaction has occurred at the beginning of the period, since the number of shares outstanding changed without a corresponding change in equity.
F-110
Thus, basic and diluted earnings per share attributable to equity holders of the parent are as follows:
|
Figures in euros
|
2018
|
|
2017
|
|
2016
|
|
|
Basic earnings per share
|
0.57
|
|
0.56
|
|
0.42
|
|
|
Diluted earnings per share
|
0.57
|
|
0.56
|
|
0.42
|
|
Long-term incentive plan based on Telefónica, S.A. shares: Performance Share Plan 2018-2022
At the General Shareholders’ Meeting held on June 8, 2018, a long-term incentive plan was approved, consisting of the delivery of shares of Telefónica, S.A. aimed at senior executive officers of the Telefónica Group, including the Executive Directors of Telefónica, S.A. The plan consists of the delivery to the participants of a certain number of shares of Telefónica, S.A. based on compliance with the objectives established for each of the cycles into which the plan is divided.
In the first cycle of the plan, the number of shares to deliver will depend (i)
50%
on achievement of the total shareholder return ("TSR") objective for shares of Telefónica, S.A. and (ii)
50%
on the generation of free cash flow of the Telefónica Group ("FCF").
For each of the remaining cycles, the Board of Directors of Telefónica, S.A. may introduce new objectives linked to sustainability, the environment or corporate governance, as well as vary the relative weight accorded to each of them.
The plan will have a total duration of five years and will be divided into three cycles of three years each. The first cycle commenced in 2018 and will be finalized on December 31, 2020, with delivery of the respective shares in 2021. The maximum number of shares assigned to this cycle of the plan was
8,466,996
shares and the outstanding shares at December 31, 2018
8,451,511
, with the following breakdown:
|
First cycle
|
No. of shares assigned
|
Outstanding shares at 12/31/2018
|
Unit fair value
|
|
||
|
TSR Objective
|
4,233,498
|
|
4,225,755.5
|
|
4.52
|
|
|
FCF Objective
|
4,233,498
|
|
4,225,755.5
|
|
6.46
|
|
Long-term incentive plan based on Telefónica, S.A. shares: “Performance and Investment Plan 2014-2019”
The Telefónica, S.A. General Shareholders’ Meeting on May 30, 2014 approved a new installment of the long-term share-based incentive “Performance and Investment Plan” for certain senior executives and members of the Group’s management team, operational on completion of the first “Performance and Investment Plan”.
The term of the plan was a total of
five
years divided into
three
cycles. The initial and the second share allocations took place on October 1, 2014, and on October 1, 2015, respectively. Regarding the third cycle of this 2016-2019 Plan, the Company's Board of Directors, following a favorable report from the Nomination, Compensation and Corporate Governance Committee, resolved not to execute or implement it, after having decided that it was not sufficiently in line with the Telefónica Group's strategic plan, taking into account the circumstances and macroeconomic environment.
The first cycle expired on September 30, 2017. The maximum number of shares assigned to this cycle of the plan was
6,927,953
shares assigned on October 1, 2014, with a fair value of
6.82
euros per share. The second cycle expired on September 30, 2018. The maximum number of shares assigned to this cycle was
6,775,445
shares assigned on October 1, 2015, with a fair value of
6.46
euros per share. Delivery of shares was not required at the end of each of these cycles according to the general conditions of the plan; therefore, managers did not receive any shares.
Long-term incentive plan based on Telefónica, S.A. shares: “Talent for the Future Share Plan 2014-2019” (TFSP)
At the General Shareholders’ Meeting held on May 30, 2014, a long-term share-based incentive plan called “Talent for the Future Share Plan” was approved for certain Telefónica Group employees.
F-111
The plan consisted of the delivery of a certain number of shares of Telefónica, S.A. to participants selected by the Company who had opted to take part in the scheme and had met the requirements and conditions stipulated to this end.
The term of the plan was five years and it was divided into three cycles. The initial and the second share allocations took place on October 1, 2014, and on October 1, 2015, respectively. Regarding the third cycle of this 2016-2019 Plan, the Company's Board of Directors, following a favorable report from the Nomination, Compensation and Corporate Governance Committee, resolved not to execute or implement it, after having decided that it was not sufficiently in line with the Telefónica Group's strategic plan, taking into account the circumstances and macroeconomic environment.
The first cycle expired on September 30, 2017. The maximum number of shares assigned to this phase of the plan was
556,795
shares assigned on October 1, 2014, with a fair value of
6.82
euros per share. The second cycle expired on September 30, 2018. The maximum number of shares assigned to this phase of the plan was
618,000
shares assigned on October 1, 2015, with a fair value of
6.46
euros per share. Delivery of shares was not required at the end of each of these cycles according to the general conditions of the plan.
Long-term incentive plan based on Telefónica, S.A. shares: “Talent for the Future Share Plan 2018-2022” (TFSP)
The Telefónica, S.A.'s Board of Directors, at its meeting on June 8, 2018, agreed the launch of a new installment of the long-term incentive plan "Talent for the Future Share Plan".
The term of this new plan is also five years and it is divided into three cycles. As in the case of the Performance Share Plan described above, in the first cycle of the plan the number of shares to deliver will depend (i)
50%
on achievement of the total shareholder return ("TSR") objective for shares of Telefónica, S.A. and (ii)
50%
on the generation of free cash flow of the Telefónica Group ("FCF").
The first cycle commenced in 2018 and will be finalized on December 31, 2020, with delivery of the respective shares in 2021. The maximum number of shares assigned to this cycle of the plan was
787,500
shares and the outstanding shares at December 31, 2018
785,750
, with the following breakdown:
|
First cycle
|
No. of shares assigned
|
Outstanding shares at 12/31/2018
|
Unit fair value (euros)
|
|
||
|
TSR Objective
|
393,750
|
|
392,875
|
|
4.52
|
|
|
FCF Objective
|
393,750
|
|
392,875
|
|
6.46
|
|
Telefónica, S.A. global share plans
The Telefónica, S.A. Ordinary General Shareholders’ meeting on May 30, 2014 approved a new voluntary plan for incentivised purchases of shares of Telefónica, S.A. for the employees of the Group, with certain exceptions. Under this Plan, employees were offered the option to acquire Telefónica, S.A. shares during a twelve-month period (the acquisition period), with the company undertaking to deliver a certain number of free shares to participants, subject to certain requirements. Each employee was limited to buying a maximum of
1,800
euros in Telefónica, S.A. shares, subject to a minimum of
300
euros. The employees that remained part of the Telefónica Group and held on to the shares for one year following the acquisition period (the shareholding period), were entitled to receive
one
free share for each share they acquired and retained throughout the shareholding period.
The acquisition period commenced in July 2015 and ended in June 2016. The share holding period ended in August 2017.
27,018
employees on the scheme were rewarded with a total of
3,187,055
Telefónica shares, valued at approximately
33 million
euros at the time they were delivered.
In addition, at the General Shareholders’ Meeting held on June 8, 2018, a new global employee incentive share purchase plan for shares of Telefónica, S.A. was approved, aimed at employees of the Telefónica Group, that will be launched in 2019. The total number of free shares to be delivered for the whole plan may never exceed
0.1%
of the share capital of Telefónica, S.A.
F-112
Net cash flow provided by operating activities
The detail of net cash flow provided by operating activities is the following:
|
Millions of euros
|
2018
|
|
2017
|
|
2016
|
|
|
Cash received from operations
|
58,815
|
|
63,456
|
|
63,514
|
|
|
Cash paid from operations
|
(42,891
|
)
|
(46,929
|
)
|
(47,384
|
)
|
|
Cash paid to suppliers
|
(37,044
|
)
|
(40,508
|
)
|
(40,831
|
)
|
|
Cash paid to employees
|
(5,072
|
)
|
(5,725
|
)
|
(5,815
|
)
|
|
Payments related to cancellation of commitments
|
(775
|
)
|
(696
|
)
|
(738
|
)
|
|
Net payments of interest and other financial expenses net of dividends received
|
(1,636
|
)
|
(1,726
|
)
|
(2,143
|
)
|
|
Net interest and other financial expenses paid
|
(1,664
|
)
|
(1,755
|
)
|
(2,187
|
)
|
|
Dividends received
|
28
|
|
29
|
|
44
|
|
|
Taxes paid
|
(865
|
)
|
(1,005
|
)
|
(649
|
)
|
|
Net cash flow provided by operating activities
|
13,423
|
|
13,796
|
|
13,338
|
|
Net cash flow used in investing activities
The detail of (Payments on investments)/proceeds from the sale in property, plant and equipment and intangible assets, net is the following:
|
Millions of euros
|
2018
|
|
2017
|
|
2016
|
|
|
Proceeds from the sale in property, plant and equipment and intangible assets
|
192
|
|
148
|
|
134
|
|
|
Payments on investments in property, plant and equipment and intangible assets
|
(8,777
|
)
|
(9,140
|
)
|
(9,321
|
)
|
|
(Payments on investments)/proceeds from the sale in property, plant and equipment and intangible assets, net
|
(8,585
|
)
|
(8,992
|
)
|
(9,187
|
)
|
Spectrum license payments in 2018 totaled
674
million euros, mainly due to the payment of
588
million euros for the spectrum auction in the United Kingdom (see Note 6).
Spectrum license payments totaled
352
million euros in
2017
,
notably in Group companies in Coltel, related to the arbitration award amounting to
317
million euros (see Note 2).
The detail of proceeds on disposals of companies, net of cash and cash equivalents disposed and payments on investments in companies, net of cash and cash equivalents acquired is the following:
|
Millions of euros
|
2018
|
|
2017
|
|
2016
|
|
|
Sale of Televisión Federal, S.A. (Telefé) (see Note 23)
|
—
|
|
—
|
|
306
|
|
|
Proceeds arising from hedges associated with Telefónica United Kingdom
|
—
|
|
—
|
|
399
|
|
|
Sale of Telefónica Telecomunicaciones Públicas, S.A.U.
|
—
|
|
28
|
|
2
|
|
|
Sale of Axonix Ltd and Telefónica Digital Inc.
|
29
|
|
—
|
|
—
|
|
|
Others
|
—
|
|
12
|
|
60
|
|
|
Proceeds on disposals of companies, net of cash and cash equivalents disposed
|
29
|
|
40
|
|
767
|
|
|
A
cquisition
of DTS
|
—
|
|
—
|
|
(36
|
)
|
|
Acquisition of Coltel affiliates (Note 5)
|
—
|
|
(85
|
)
|
—
|
|
|
Acquisition of Minodes GmbH
|
—
|
|
(9
|
)
|
—
|
|
|
Acquisition of Co-trade GmbH
|
—
|
|
(20
|
)
|
—
|
|
|
Others
|
(3
|
)
|
(14
|
)
|
(18
|
)
|
|
Payments on investments in companies, net of cash and cash equivalents acquired
|
(3
|
)
|
(128
|
)
|
(54
|
)
|
F-113
The detail of proceeds on financial investments not included under cash equivalents and payments on financial investments not included under cash equivalents is the following:
|
Millions of euros
|
2018
|
|
2017
|
|
2016
|
|
|
Sale of stake in Indra
|
—
|
|
—
|
|
85
|
|
|
Sale of stake in China Unicom (Hong Kong) Limited (see Note 11)
|
—
|
|
72
|
|
322
|
|
|
Investments of Seguros de Vida y Pensiones Antares, S.A.
|
78
|
|
49
|
|
—
|
|
|
Sale of stake in Shortcut I GmbH & Co. KG
|
21
|
|
—
|
|
—
|
|
|
Collateral guarantees on derivatives
|
806
|
|
72
|
|
—
|
|
|
Others
|
99
|
|
103
|
|
82
|
|
|
Proceeds on financial investments not included under cash equivalents
|
1,004
|
|
296
|
|
489
|
|
|
Legal deposits
|
(54
|
)
|
(75
|
)
|
(104
|
)
|
|
Investment in Mediaset Premium
|
—
|
|
—
|
|
(20
|
)
|
|
Long term deposits
|
—
|
|
(150
|
)
|
—
|
|
|
Collateral guarantees on derivatives
|
(754
|
)
|
(781
|
)
|
—
|
|
|
Others
|
(157
|
)
|
(100
|
)
|
(141
|
)
|
|
Payments on financial investments not included under cash equivalents
|
(965
|
)
|
(1,106
|
)
|
(265
|
)
|
Payments and proceeds on placements of cash surpluses not included under cash equivalents in
2018
and
2017
largely relate to placements made by Telefónica, S.A.
Net cash flow used in financing activities
The detail of dividends paid, proceeds from issue of share capital increase, payments and proceeds of treasury shares and other operations with shareholder and minority interest, and operations with other equity holders is the following:
|
Millions of euros
|
2018
|
|
2017
|
|
2016
|
|
|
Dividends paid by Telefónica, S.A.
(*)
|
(2,048
|
)
|
(1,904
|
)
|
(2,395
|
)
|
|
Payments to non-controlling interests of Telefônica Brasil, S.A.
|
(245
|
)
|
(290
|
)
|
(216
|
)
|
|
Payments to non-controlling interests of Telefónica Deutschland Holding, A.G.
|
(238
|
)
|
(229
|
)
|
(263
|
)
|
|
Payments to non-controlling interests of Telefónica Centroamérica Inversiones
|
(28
|
)
|
(23
|
)
|
(27
|
)
|
|
Payments to non-controlling interests of Telxius Telecom, S.A. y Pontel Participaciones, S.L.
|
(231
|
)
|
—
|
|
—
|
|
|
Others
|
(4
|
)
|
(13
|
)
|
(5
|
)
|
|
Dividends paid (see Note 15)
|
(2,794
|
)
|
(2,459
|
)
|
(2,906
|
)
|
|
Proceeds from share capital increase
|
—
|
|
2
|
|
—
|
|
|
Transactions with Telefónica, S.A. treasury shares
(see Note 15)
|
—
|
|
—
|
|
(645
|
)
|
|
Sale of 40% of Telxius Telecom, S.A. to Taurus Bidco S.à.r.l. (Note 2)
|
—
|
|
1,275
|
|
—
|
|
|
Sale of 16.65% of Pontel Participaciones, S.L. (Note 2)
|
379
|
|
—
|
|
—
|
|
|
Others
|
—
|
|
(6
|
)
|
(15
|
)
|
|
(Payments)/proceeds of treasury shares and other operations with shareholders and with minority interests
|
379
|
|
1,269
|
|
(660
|
)
|
|
Issuance of undated deeply subordinated securities (Note 15)
|
2,250
|
|
1,000
|
|
1,000
|
|
|
Acquisition of undated deeply subordinated securities (Note 15)
|
(1,779
|
)
|
—
|
|
—
|
|
|
Payment of undated deeply subordinated securities (Note 15)
|
(473
|
)
|
—
|
|
—
|
|
|
Payment of the coupon related to the issuances of undated deeply subordinated securities issued (See Note 15)
|
(559
|
)
|
(354
|
)
|
(344
|
)
|
|
Operations with other equity holders
|
(561
|
)
|
646
|
|
656
|
|
(*)
This amount differs from that indicated in Note 15 because of withholding taxes deducted in the payment to certain major shareholders.
F-114
The detail of proceeds on issue of debentures and bonds, and other debts, proceeds on loans, borrowings and promissory notes, amortization of debentures and bonds, and other debts, repayments of loans, borrowings and promissory notes and financed operating payments and investments in property, plant and equipment and intangible assets payments is the following:
|
Millions of euros
|
2018
|
|
2017
|
|
2016
|
|
|
Issued under the EMTN program of Telefónica Emisiones, S.A.U. (see Appendix III)
(*)
|
2,000
|
|
3,517
|
|
4,900
|
|
|
Issued of non-dilutive convertible debentures
in Telefónica Participaciones, S.A.U. (Appendix III)
|
—
|
|
—
|
|
600
|
|
|
Issued under the SHELF program of Telefónica Emisiones, S.A.U. (see Appendix III)
(*)
|
1,746
|
|
3,335
|
|
—
|
|
|
Issuance of Telefônica Brasil, S.A.
|
—
|
|
756
|
|
—
|
|
|
Issuance of O2 Telefónica Deutschland Finanzierungs, GmbH (Appendix III)
|
600
|
|
—
|
|
—
|
|
|
Others
|
(57
|
)
|
782
|
|
193
|
|
|
Proceeds on issue of debentures and bonds, and other debts
|
4,289
|
|
8,390
|
|
5,693
|
|
|
Syndicated loan of 3,000 million euros by Telefónica, S.A.
|
—
|
|
—
|
|
3,070
|
|
|
Syndicated loan of 3,000 million euros by Telefónica, S.A.
|
—
|
|
—
|
|
1,280
|
|
|
Structured financing (see Note 16)
|
750
|
|
750
|
|
—
|
|
|
Disposal bilateral loans of Telefónica, S.A. (see Note 16)
|
585
|
|
—
|
|
—
|
|
|
Syndicated loan of 750 million euros by Telefónica Germany GmbH
|
—
|
|
650
|
|
—
|
|
|
Syndicated loan of Telxius Telecom, S.A. (see Note 16)
|
289
|
|
—
|
|
—
|
|
|
Settlement of nominal value of gross debt hedging derivatives
|
209
|
|
575
|
|
1,017
|
|
|
Others
|
2,140
|
|
2,869
|
|
4,965
|
|
|
Proceeds on loans, borrowings and promissory notes (see Appendix V)
|
3,973
|
|
4,844
|
|
10,332
|
|
|
Repayments of debentures and bonds, and other debts
|
(4,654
|
)
|
(6,687
|
)
|
(6,873
|
)
|
|
Syndicated loan of 3,000 million euros by Telefónica, S.A.
|
—
|
|
—
|
|
(3,070
|
)
|
|
Syndicated loan of 2,500 million euros by Telefónica, S.A.
|
—
|
|
(550
|
)
|
—
|
|
|
Syndicated loan of 3,000 million euros by Telefónica, S.A.
|
—
|
|
—
|
|
(1,980
|
)
|
|
Loans paid by GVT
|
—
|
|
—
|
|
(93
|
)
|
|
Syndicated loan of 750 million euros by Telefónica Germany GmbH
|
—
|
|
(700
|
)
|
—
|
|
|
Amortization bilateral loans of Telefónica, S.A. (see Note 16)
|
(800
|
)
|
—
|
|
—
|
|
|
Settlement of nominal value of amortized debt hedging derivatives
|
(52
|
)
|
(179
|
)
|
(616
|
)
|
|
Others
|
(3,188
|
)
|
(5,282
|
)
|
(2,747
|
)
|
|
Repayments of loans, borrowings and promissory notes (see Appendix V)
|
(4,040
|
)
|
(6,711
|
)
|
(8,506
|
)
|
|
Financed spectrum licenses payments (Note 18)
|
(44
|
)
|
(329
|
)
|
(198
|
)
|
|
Payments to suppliers with extended payment terms
(Note 16)
|
(428
|
)
|
(717
|
)
|
(1,758
|
)
|
|
Financed operating payments and investments in property, plant and equipment and intangible assets payments
|
(472
|
)
|
(1,046
|
)
|
(1,956
|
)
|
(*)
Data
converted at the exchange rate at the end of each of the corresponding periods. The impact of the exchange rate with respect to the date of the transaction is included in the "Others" line within the same sub-heading.
F-115
a) Litigation and arbitration
Telefónica and its group companies are party to several legal proceedings which are currently in progress in the courts of law and the arbitration bodies of the various countries in which we are present.
Based on the advice of our legal counsel it is reasonable to assume that these legal proceedings will not materially affect the financial condition or solvency of the Telefónica Group.
The contingencies arising from the litigation and commitments described below were evaluated (see Note 3.m) when the consolidated financial statements for the year ended
December 31, 2018
were prepared. The provisions recorded in respect of the commitments taken as a whole are not material.
The following unresolved legal proceedings or those underway in
2018
are highlighted (see Note 22 for details of tax-related cases):
Appeal against the decision by Agencia Nacional de Telecomunicações (“ANATEL”) regarding the inclusion of interconnection and network usage revenues in the Fundo de Universalização de Serviços de Telecomunicações (“FUST”)
Vivo Group operators (currently Telefônica de Brasil), together with other cellular operators, appealed ANATEL’s decision of December 16, 2005, to include interconnection and network usage revenues and expenses in the calculation of the amounts payable into the FUST (Fundo de Universalização de Serviços de Telecomunicações) –a fund which pays for the obligations to provide Universal Service- with retroactive application from 2000. On March 13, 2006, Regional Federal Court no. 1. granted a precautionary measure which stopped the application of ANATEL’s decision. On March 6, 2007, a ruling in favor of the wireless operators was issued, stating that it was not appropriate to include the revenues received by transfer from other operators in the taxable income for the FUST’s calculation and rejecting the retroactive application of ANATEL’s decision. On January 26, 2016, ANATEL filed an appeal to overturn this decision with Brasilia Regional Federal Court no. 1, which was also dismissed. On May 10, 2017 ANATEL appealed to the higher courts on the merits of the case.
At the same time, Telefônica Brasil and Telefónica Empresas, S.A., together with other wireline operators through ABRAFIX (Associação Brasileira de Concessionárias de Serviço Telefonico Fixo Comutado) appealed ANATEL’s decision of December 16, 2005, also obtaining the precautionary measures requested. On June 21, 2007, Federal Regional Court no. 1 ruled that it was not appropriate to include the interconnection and network usage revenues in the FUST’s taxable income and rejected the retroactive application of ANATEL’s decision. ANATEL filed an appeal to overturn this ruling on April 29, 2008, before Brasilia Federal Regional Court no. 1, which was dismissed on May 10, 2016. ANATEL filed an appeal against this dismissal.
The fixed operators filed an appeal to clarify that revenues obtained through interconnection and dedicated line operation should not be included in the calculation of the amounts payable to the FUST. In addition, the court was also requested to rule on two grounds which had not been analyzed in the initial decision: (i) that the FUST has become obsolete, among other reasons, by the advance of mobile telephony; and (ii) that amounts collected are not applied to the purpose for which the FUST was created, since only a very low percentage of the revenues collected by the FUST is used to finance fixed telephony. Although the petition for clarification was dismissed on August 23, 2016, the court noted that the FUST should not be funded with revenues from interconnection and dedicated line operation. ABRAFIX appealed to the higher courts on these two elements that had not been analyzed. ANATEL appealed all the holdings of the ruling to the higher courts.
The amount of the claim is quantified at
1%
of the interconnection revenues.
Appeal against the Decision of the European Commission dated January 23, 2013, to sanction Telefónica for the infringement of Article 101 of the Treaty on the functioning of the European Union
On January 19, 2011, the European Commission initiated formal proceedings to investigate whether Telefónica, S.A. (Telefónica) and Portugal Telecom SGPS, S.A. (Portugal Telecom) had infringed European Union anti-trust laws with respect to a clause contained in the sale and purchase agreement of Portugal Telecom’s ownership interest in Brasilcel, N.V., a joint venture in which both were venturers and which was the owner of the Brazilian company Vivo.
F-116
On January 23, 2013, the European Commission passed a ruling on the formal proceedings. The ruling imposed a fine on Telefónica of
67
million euros, as the European Commission ruled that Telefónica and Portugal Telecom committed an infraction of Article 101 of the Treaty on the Functioning of the European Union for having entered into the agreement set forth in Clause Nine of the sale and purchase agreement of Portugal Telecom’s ownership interest of Brasilcel, N.V.
On April 9, 2013, Telefónica filed an appeal for annulment of this ruling with the European Union General Court. On August 6, 2013, the European Union General Court notified Telefónica of the response issued by the European Commission, in which the European Commission reaffirmed the main arguments of its ruling and, specially, that Clause Nine includes a competition restriction. On September 30, 2013, Telefónica filed its reply. On December 18, 2013, the European Commission filed its appeal.
A hearing was held on May 19, 2015, at the European Union General Court.
On June 28, 2016, the European Union General Court ruled. Although it declares the existence of an infringement of competition law, it annuls Article 2 of the contested Decision and requires the European Commission to reassess the amount of the fine imposed. The General Court considers that the European Commission has not neutralized the allegations and evidences provided by Telefónica on services in which there was not potential competition or were outside the scope of Clause Nine.
Telefónica understands that there are grounds for believing that the ruling does not suit at law; consequently, it filed an appeal to the Court of Justice of the European Union, on September 11, 2016.
On November 23, 2016, the European Commission filed its response against the Telefónica´s appeal. On January 30, 2017, Telefónica filed its response. On March 9, 2017, the European Commission filed its rejoinder.
On December 13, 2017, the General Court dismissed the appeal filed by Telefónica. The European Commission must issue a new resolution in accordance with the judgment of the General Court of June 2016, which urged the Commission to recalculate the amount of the fine.
Claim of consumers association "FACUA" against Telefónica de España, S.A.U. in connection with the increase of the price of Movistar Fusión
On September 5, 2016, notification was given to Telefónica de España of a claim filed against it by the consumers association ("
FACUA
"). Through such claim, the association exercises an action to protect consumers' and users' collective interests stipulated in articles 11 of the Civil Procedure Act (
Ley de Enjuiciamiento Civil
) and 24.1 of the Consumer and Users Protection Act (
Ley General de Defensa de los Consumidores y Usuarios
) on the basis of alleged disloyalty towards the consumers, arising from the raising of the prices of the product "Movistar Fusión" from May 5, 2015, by an amount of
5
euros per month.The claim contains a declaratory statement stating that disloyalty arises from misleading advertising regarding the price rise, and a prohibitory injunction requesting that Telefónica de España be ordered not to apply such price rise and to prohibit its future application to all customers who became customers of Movistar Fusión prior to May 5, 2015. It contains, besides, a third statement, requesting Telefónica de España to be condemned to repay the excess amounts collected as a result of the rise in prices to those customers who have chosen to maintain the service contracted, together with accrued interest on such amount.
The claim was filed for an undetermined amount, given the impossibility of determining
a priori
the total amount of the claim. On October 28, 2016, Telefónica de España filed its response.
On April 5, 2017, the Court ruled in favor of Telefónica de España, upholding the objection of unsuitable action and ordering the dismissal of the action. FACUA appealed that ruling.
On September 21, 2018, the Court of Appeals dismissed the appeal filed by FACUA, confirming the first instance resolution in favor of Telefónica.
Decision by the High Court regarding the acquisition by Telefónica of shares in Český Telecom by way of tender offer
Venten Management Limited ("
Venten
") and Lexburg Enterprises Limited ("
Lexburg
"), were minority shareholders of CESKY TELECOM. In September 2005 both companies sold their shares to Telefónica in a mandatory tender offer. Subsequently Venten and Lexburg, in 2006 and 2009, respectively, filed actions against Telefónica claiming a higher price than the price for which they sold their shares in the mandatory tender offer.
F-117
On August 5, 2016, the hearing before the High Court in Prague took place in order to decide the appeal against the second decision of the Municipal Court, which had been favorable to Telefónica's position (as was also the case with the first decision of the Municipal Court). At the end of the hearing, the High Court announced the Second Appellate Decision by which it reversed the second decision of the Municipal Court and ordered Telefónica to pay
644
million Czech koruna (approximately
23
million euros) to Venten and
227
million Czech koruna (approximately
8
million euros) to Lexburg, in each case plus interest.
On December 28, 2016, the decision was notified to Telefónica. Telefónica filed an extraordinary appeal, requesting the suspension of the effects of the decision.
In March 2017, Telefónica was notified of the decision of the Supreme Court, which ordered the suspension of the effects of the unfavorable decision to Telefónica issued by the High Court.
Venten and Lexburg filed with the Supreme Court a motion to partially abolish the suspension of enforceability of the Decision of the High Court in Prague. On January 17, 2018, Telefónica filed its response seeking dismissal of such motion for lack of legal basis.
On February 14, 2019, notification was given to Telefónica of the resolution of the Supreme Court which, based on the extraordinary appeal filed by Telefonica, abolished the decision of the High Court in Prague dated August 5, 2016 and remanded the case back to the High Court.
Claim by Entel against Telefónica de Argentina, S.A.
In 1999, Entel (the National Telecommunications Company of Argentina before its privatization) sued Telefónica de Argentina, S.A. ("
TASA
"), who was the licensee of the telecom service after the privatization process, seeking detailed and documented accounting and reimbursement of the amounts that it received from and on behalf of Entel after assuming the telecom service as a licensee, and of the amounts deducted as commissions.
In general terms, the items in dispute were the amounts that TASA charged on behalf of Entel soon after having taken possession as a licensee of the telecom service (i.e.; the consumptions charges for telecom services from prior customers of Entel, either billed or unbilled, but pending payment at the time of the privatization). Entel also challenged the commissions that TASA discounted to Entel in exchange for the service of collection of fees on behalf of Entel. Additionally, Entel also claimed several credits received by TASA which allegedly belonged to Entel and had not been transferred to TASA in the privatization process.
TASA replied arguing the inadmissibility of the accountability request, since such liquidations had previously been submitted to the Entel Liquidating Commission without being timely challenged.
In 2010, the Court of First Instance ruled in favor of Entel and held TASA accountable to Entel.
After exhausting all legal appeals available, TASA submitted the requested accounting to Entel, which was challenged by the national government on behalf of the liquidated Entel.
Several accounting drafts and cross-claims between the parties followed, with the intervention of a court-appointed expert accountant. After several court decisions, the intervening judge rejected TASA´s objections to the accounting presented by the national government and adopted the calculations made by Entel and the court-appointed expert.
Although this judicial decision was appealed, TASA's appeal was dismissed by the Court of Appeals in October 2017, confirming, to a large extent, the accounting of Entel and the court-appointed expert, but also ordering Entel to recalculate interests. Specifically, the resolution of the Court accepted certain concepts that TASA had questioned and the application of a "judicial" interest rate (average passive rate), which implies a daily capitalization component, in detriment of the rate set forth in the privatization specifications which set a simple annual interest of 8% (which had even been used by the court-appointed expert and Entel in their calculations).
On February 22, 2018, Entel submitted the new principal and interest calculations required by the judge, claiming an amount of
1,689
million Argentine pesos (approximately
39
million euros).
The resolution of the Court of Appeals exhausted the ordinary remedies available. TASA filed an extraordinary appeal, which was rejected in November 2017. TASA has submitted an exceptional appeal before the Argentine Supreme Court, although this appeal does not suspend the potential execution by Entel of prior rulings against TASA.
F-118
Appeal against the resolution of ANATEL to sanction Telefônica Brasil for breaches of the Fixed Telephony Regulation
In May 2018, Telefónica filed a judicial action for annulment against a resolution issued by ANATEL (National Telecommunications Agency of Brazil) in March 2018 concluding the PADO (“Processo Administrativo para Apuração de Descumprimento de Obrigações” or Administrative Process for Determination of Non-compliance with Obligations) investigating alleged infractions of the Fixed Telephony Regulation by Telefônica Brasil.
This PADO investigation had been suspended during the negotiations of the TAC (“Termo de Ajustamento de Conduta” or Conduct Adjustment Term) between Telefónica and ANATEL relating to this and certain other PADO investigations. Since the negotiations concluded without agreement, the suspended PADO sanctioning procedures were reactivated and finalized.
In its resolution of March 2018, ANATEL considered that Telefônica Brasil committed several infractions, in particular those related to the inadequate notice of suspension of services to defaulting users, the terms of reactivation of services after payment of outstanding amounts by defaulting users and the disagreement with the terms of refunds claimed by users of the services.
The fine imposed by ANATEL and appealed by Telefônica Brasil is approximately
211
million reals (approximately
48
million euros)
,
which amounted to approximately
482
million reals after currency value updates and accrued interests as of December 31, 2018 (approximately
109
million euros).
Telefônica Brasil has appealed the fine imposed by ANATEL based, fundamentally, on the following arguments: (i) ANATEL should have considered a smaller universe of users to determine the fine and (ii) the calculation of the fine is disproportionate and based on insufficient grounds.
Telefônica Brasil has not yet paid the fine, although Telefônica Brasil has guaranteed its payment through a guarantee insurance submitted to the court.
The procedure is in the first instance and a date has not yet been set for the conciliation hearing.
b) Other proceedings
Telefónica is currently conducting internal investigations covering various countries regarding possible violations of applicable anti-corruption laws. Telefónica continues to cooperate with governmental authorities and continues with the ongoing investigations. Although it is not possible at this time to predict the scope or duration of these matters or their likely outcome, Telefónica believes that, considering the size of the Group, any potential penalty as a result of the resolution of these investigations would not materially affect the Group's financial condition.
c) Commitments
Agreement related to the Sale of Customer Relationship Management (“CRM”) Business, Atent
o
As a result of the sale agreement of Atento by Telefónica, announced on October 12, 2012, and ratified on December 12, 2012, both companies signed a Master Service Agreement which regulates Atento’s relationship with the Telefónica Group as a service provider for a period of nine years and which was amended on May 16, 2014, on November 8, 2016 and on May 11, 2018. This period was extended only for Spain and Brazil in November 2016, for two additional years until 2023.
By virtue of this agreement, Atento became Telefónica’s preferred Contact Center and Customer Relationship Management (“CRM”) service provider, stipulating annual commitments in terms of turnover which is updated based on inflation and deflation that vary from country to country, pursuant to the volume of services Atento has been providing to the entire Group. Effective January 1, 2017, the minimum volume commitments that Telefónica must comply with have significantly decreased for Brazil.
Failure to meet the annual turnover commitments in principle results in the obligation to the counterparty, to pay additional amounts, which would be calculated based on the difference between the actual amount of turnover and the predetermined commitment, applying a percentage based on the Contact Center’s business margin to the final calculation.
F-119
Notwithstanding the above, as a consequence of the amendment signed with the Atento Group on May 11, 2018, starting on January 1, 2018 the payment obligation for failure to meet the annual turnover commitment will be calculated for each year of the agreement but will only be liquidated upon termination of the agreement. Such payment will only be due if the balance is in favor of Atento after adding certain amounts agreed between the parties and deducting an annual percentage of the Atento Group’s sales to the Telefónica Group.
The Master Agreement sets forth a reciprocal arrangement, whereby Atento assumes similar commitments to subscribe its telecommunications services to Telefónica.
Telefónica Latinoamérica Holding, S.L. as strategic partner of Colombia Telecomunicaciones, S.A. ESP
Pursuant to amendment nº 2 of the Framework Investment Agreement executed as of September 21, 2017, after the closing of the merger between Colombia Telecomunicaciones, S.A. ESP and Telefónica Móviles Colombia, S.A., the Colombian Government may, at any time, offer to Telefónica all or part of the shares it holds in the company, the latter being obliged to acquire them, (directly or via one of its subsidiaries) in the event that the increase in Colombia Telecomunicaciones, S.A. ESP's EBITDA (CAGR) is less than
5.75%
in the measurement periods, and provided that during the twelve (12) months following the ordinary shareholders’ meetings during which the measurement was made, at least one of the following occurs: 1) Colombia Telecomunicaciones S.A. ESP has paid a brand fee or any other type of payment to the Strategic Partner for the use of its brands; or 2) Colombia Telecomunicaciones S.A. ESP orders and/or pays dividends with the favorable vote of the Strategic Partner.
Pursuant to the exercise by Colombian Government of its right to require Telefónica to vote in favor of the register of the shares of Colombia Telecomunicaciones, S.A. ESP in the National Securities and Issuer’s Registry and in the Colombia Stock Exchange, on March 22, 2018, and upon request of the Government of Colombia, the General Shareholders Meeting of Colombia Telecomunicaciones, S.A. ESP approved to apply for the register of the shares of Colombia Telecomunicaciones, S.A. ESP in the National Securities and Issuer’s Registry and in the Colombia Stock Exchange. Telefónica is under no obligation whatsoever to purchase or transfer any of its shares in Colombia Telecomunicaciones, S.A. ESP, either as a result of the shareholders´resolution, or a result of the register in the National Securities and Issuer’s Registry or in the Colombia Stock Exchange. Following the registration in the National Securities and Issuer’s Registry on May 10, 2018, the Colombia Stock Exchange approved the conditional registration of the shares of Colombia Telecomunicaciones, S.A. ESP on May 23, 2018, subject to the effective fulfillment by the Colombian Government of the issuance of a first public tender offer to the so-called solidarity sector (“sector solidario”) pursuant to Law 226 of 1995 (December 20), which develops article 60 of the Colombian Constitution on the disposal of national property in share capital, the adoption of measures to democratize such property and other relevant provisions. On August 2, 2018, the Nation - Ministry of Finance and Public Credit, as shareholder of Colombia Telecomunicaciones, S.A. ESP, published a notice of public offering of the shares of its property in Colombia Telecomunicaciones, S.A. ESP to the solidary sector in accordance with Law 226 of 1995- Thus, resulting from said publication, Colombia Telecomunicaciones, S.A. ESP and its ordinary shares were registered in the Colombian Stock Exchange. Through Informative Document No. 242 of October 3, 2018, the Colombian Stock Exchange informed that the first stage of the sale program of the shares owned by the Nation - Ministry of Finance and Public Credit in Colombia Telecomunicaciones, S.A. ESP, aimed at the solidarity sector, was declared inconclusive as no acceptances at all were received during the term of the offer.
In addition, the Framework Investment Agreement provides that (a) if Telefónica decides to dispose or transfer of all or part of its shareholding in Colombia Telecomunicaciones, S.A. ESP to third parties, Telefónica commits that: (i) the acquirer or transferee will be obliged to adhere to the Framework Investment Agreement; and (ii) that the acquirer or transferee will be obliged to present an offer to purchase all of the shares in Colombia Telecomunicaciones, S.A. ESP held by the Colombian Government (that amounts to
32.5%
of the share capital) at the same price and under the same terms and conditions negotiated with Telefónica, through the legally-established procedure for disposal of shares held by public entities and, (b) if the Colombian Government transfer its shares in Colombia Telecomunicaciones, S.A. ESP under certain circumstances, the Strategic Partner shall subscribe with the acquirer of the shares a new shareholders agreement which will have to be then negotiated by the parties and which, as the case may be, will include some of the rights currently held by the Colombian Government under the Framework Investment Agreement currently in force.
Communications Investment Platform ("CIP")
On May 8, 2015, Telefónica Open Future, S.L.U. (“
TOF
”) signed a Limited Partnership Agreement (and related agreements) with Coral Group, L.L.C. (and affiliates thereof) ("
Coral
") pursuant thereto, TOF has committed to undertake investments up to
200
million U.S. dollar over a
7
year period (expandable up to two additional years) in technology companies that fall within the strategic priorities jointly agreed with Telefónica.
F-120
As a result of the addition of an additional Strategic Investor to the CIP in 2017, on October 25, 2017, TOF and Coral entered into a new Amended and Restated Limited Partnership Agreement, which retains TOF’s original capital commitment, but also amends certain terms and conditions to provide TOF with certain early termination and capital commitment reduction rights upon certain events.
On August 1, 2018, TOF notified Coral its rightful early termination of the aforementioned agreement, and was therefore immediately released from any further investment commitments. As a result of the foregoing, on October 31, 2018 the Coral/Telefónica CIP Limited Partnership incorporated on May 7, 2015 was finally dissolved.
Agreement for the sale of the shares of Telefónica Gestión de Servicios Compartidos España, S.A.U., Telefónica Gestión de Servicios Compartidos Argentina, S.A. and T-Gestiona Servicios Contables y Capital Humano, S.A.C.
On March 1, 2016, a share purchase agreement between, on one hand, Telefónica, S.A., Telefónica Servicios Globales, S.L.U. and Telefónica Gestión de Servicios Compartidos Perú, S.A.C. (as sellers), and, on the other hand, IBM Global Services España, S.A., IBM del Perú, S.A.C., IBM Canada Limited and IBM Americas Holding, LLC (as purchasers) for the sale of the companies Telefónica Gestión de Servicios Compartidos España, S.A.U., Telefónica Gestión de Servicios Compartidos Argentina, S.A. and T-Gestiona Servicios Contables y Capital Humano, S.A.C., for a total price of approximately
22
million euros, was ratified before Notary Public. This share purchase agreement was subscribed on December 31, 2015.
Following the aforementioned share purchase agreement and in connection with the latter transaction, also, on December 31, 2015, Telefónica subscribed a master services agreement with IBM for the outsourcing of economic-financial and HR activities and functions to be provided to the Telefónica Group during a period of ten years, for a total amount of approximately
450
million euros. Most of the Telefónica Group’s subsidiary companies have already adhered to that master services agreement.
Commitments derived from the agreements reached for the acquisition of football (soccer) related rights
On June 25, 2018, Telefónica was provisionally awarded with the broadcasting rights for all football (soccer) matches of the Spanish First Division Football League National Championship in the residential subscribers market for exploitation on pay television for the 2019-2022 cycle (packages 4 and 5 of the auction called by the Professional Football League). The definitive agreements were signed on July 5.
The award was granted for a total amount of
2,940
million euros, at an identical price of
980
million euros for each of the three seasons, which represents a slight decrease compared to the last season of the previous cycle. Telefónica, as the operator of these broadcasting rights for the 2019-2022 cycle, will have the right to decide, design and develop the broadcasting contents, which will carry the Movistar hallmark for the 2019-2020 season.
Additionally, on June 28, 2018, Telefónica Audiovisual Digital, S.L.U. ("Telefónica") and Mediaproducción, S.L.U. ("Mediapro"), reached an agreement whereby Telefónica acquired the pay television rights of football (soccer) matches of the "UEFA Champions League" and "UEFA Europa League" competitions corresponding to the three seasons 2018/19, 2019/20 and 2020/21. Such matches may be included in thematic channels produced by Telefónica and be sold to private or residential clients. Telefónica will have the right to exploit such license on an exclusive basis with the exception of certain matches of the "UEFA Europa League" competition that Mediapro has reserved for its free-to-air television broadcast along with highlights programs covering both competitions. The total consideration agreed for the three seasons was
1,080
million euros (
360
million euros for each of the three seasons). Telefónica may sublicense the related thematic channels to other operators interested in this content. Mediapro will have the right to receive a share of advertising revenues from the new channels that Telefónica intends to launch. These channels will carry the Movistar hallmark. The aforementioned license was subject to UEFA’s approval, which was granted in August 2018.
On December 21, 2018, Telefónica was provisionally awarded with the broadcasting rights for all football (soccer) matches of the Spanish Second Division Football League National Championship in the residential subscribers market for exploitation on pay television for the 2019-2022 cycle (package 6 of the auction called by the Professional Football League). No other bids were submitted for such package during the first round of the auction called by the Professional Football League. The award was granted for a total amount of
105
million euros (i.e.,
35
million euros for each of the three seasons).
Agreement for the sale of Telefónica El Salvador
F-121
On January 24, 2019, Telefónica Centroamérica Inversiones, S.L. (a subsidiary of Telefónica
60%
of which is owned, directly or indirectly, by Telefónica and
40%
of which is owned, directly or indirectly, by Corporación Multi Inversiones, S.A.) reached an agreement with América Móvil, S.A.B de C.V. for the sale of
99.3%
of Telefónica Móviles El Salvador, S.A., a company providing fixed and mobile communications services in El Salvador, for an amount (enterprise value) of
315
million USD,
277
million euros as of the date of the agreement.
The closing of the transaction is subject to the pertinent regulatory approvals. As of the date of the issuance of these Financial Statements, such conditions have not been met.
Agreement for the sale of Telefónica Panamá
On February 20, 2019, Telefónica Centroamérica Inversiones, S.L. (a subsidiary of Telefónica,
60%
of which is owned, directly or indirectly, by Telefónica and
40%
of which is owned, directly or indirectly, by Corporación Multi Inversiones, S.A.) reached an agreement with Millicom International Cellular, S.A. for the sale of
100%
of Telefónica Móviles Panamá, S.A., a company that provides fixed and mobile communication services in Panamá, for an amount (enterprise value) of
650 million
dollars, approximately
573 million
euros at the exchange rate as of the date of the agreement.
The closing of the transaction is subject to the pertinent regulatory conditions and will take place once such conditions are satisfied. As of the date of the issuance of these Financial Statements, such conditions have not been met.
Agreement for the sale of Telefónica Nicaragua
On February 20, 2019, Telefónica Centroamérica Inversiones, S.L. (a subsidiary of Telefónica,
60%
of which is owned, directly or indirectly, by Telefónica and
40%
of which is owned, directly or indirectly, by Corporación Multi Inversiones, S.A.) reached an agreement with Millicom International Cellular, S.A. for the sale of
100%
of Telefónica Celular de Nicaragua, S.A., a company that provides fixed and mobile communication services in Nicaragua, for an amount (enterprise value) of
430 million
dollars, approximately
379 million
euros at the exchange rate as of the date of the agreement.
The closing of the transaction is subject to the pertinent regulatory conditions and will take place once such conditions are satisfied. As of the date of the issuance of these Financial Statements, such conditions have not been met.
Agreement for the sale of Telefónica Costa Rica
On February 20, 2019, Telefónica, S.A. reached an agreement with Millicom International Cellular, S.A. for the sale of
100%
of Telefónica de Costa Rica TC, S.A., a company that provides fixed and mobile communication services in Costa Rica, for an amount (enterprise value) of
570 million
dollars, approximately
503 million
euros at the exchange rate as of the date of the agreement.
The closing of the transaction is subject to the pertinent regulatory conditions and will take place once such conditions are satisfied. As of the date of the issuance of these Financial Statements, such conditions have not been met.
d) Environmental matters
Environmental strategy is the responsibility of the Board of Directors, which approves the environmental Policy and objectives, within the framework of the Global Responsible Business Plan of the Group.
Telefónica acts at different levels in alignment with the business strategy:
•
Environmental management under ISO 14001:2015.
•
Internal eco-eficiency.
•
Promotion of the circular economy.
•
Decarbonization of the activities.
•
Development of products and services that provide solutions for environmental problems.
The environment is a central issue throughout the Company, involving the areas of operations and management, as well as business and innovation.
F-122
Telefónica has a global multidisciplinary team spread out across different countries that is responsible for carrying out this strategy at different levels of responsibility.
Currently
99.4%
of the Company has Environmental Management Systems (EMS) in accordance with Regulation ISO 14001, certified by an external body, which contribute to the proper management of its environmental aspects and to extending a culture of environmental responsibility across the whole supply chain.
On
February 5, 2019
, Telefónica Emisiones, S.A.U. issued notes in the Euro market (see Note 29) guaranteed by Telefónica, S.A., amounting to
1,000
million euros. The net proceeds of the notes are to be allocated towards projects aiming to improve energy efficiency in the network transformation from copper to fiber optic in Spain.
e) Auditors’ fees
Principal Auditor
The expenses accrued in respect of the fees for services rendered to the various member firms of the PwC international organization, of which PricewaterhouseCoopers Auditores, S.L. (the auditors of the Telefónica Group) forms part, amounted to
19.11 million
euros and
19.78 million
euros in 2018 and 2017, respectively
.
The detail of these amounts is as follows:
|
Millions of euros
|
2018
|
|
2017
|
|
|
Audit services
|
18.41
|
|
18.33
|
|
|
Audit-related services
|
0.70
|
|
0.49
|
|
|
Tax services
|
—
|
|
0.20
|
|
|
All other services (consulting, advisory, etc.)
|
—
|
|
0.76
|
|
|
Total
|
19.11
|
|
19.78
|
|
Audit services: mainly audit services of the annual and reviews of interim financial statements, services related to the issuance of comfort letters, work to comply with the requirements of the Sarbanes-Oxley Act (Section 404), the work in connection with the 20-F report to file with the US Securities and Exchange Commission (SEC) and the issuance of comfort letters.
Audit-related services: services related to the review of the information required by regulatory authorities, agreed financial reporting procedures not requested by legal or regulatory bodies, review of Corporate Social Responsibility Reports issued in the Group and Telefónica, S.A.’s verification Statement of Non Financial Information - Digital responsibility and well-being.
Tax Services: permitted services by the applicable independence regulation, basically, they are tax advice and studies of transference prices.
All other services: permitted services by the applicable independence regulation, mainly advisory services on migration questions to expatriates’ employees.
In particular, the auditor of the Telefónica Group, PricewaterhouseCoopers Auditores, SL, during the year 2018 has provided services related to the issuance of the following reports: audit of the financial statements (includes SOX and 20-F), limited reviews of the intermediate periods, comfort letters, agreed procedures and corporate social responsibility.
Other auditors
The expenses accrued in respect of the fees for services rendered by other auditors in
2018
and
2017
amounted to
58.35 million
euros and
40.50 million
euros, respectively, as follows:
|
Millions of euros
|
2018
|
|
2017
|
|
|
Audit services
|
1.52
|
|
2.80
|
|
|
Audit-related services
|
1.01
|
|
0.48
|
|
|
Tax services
|
7.83
|
|
5.75
|
|
|
All other services (consulting, advisory, etc.)
|
47.99
|
|
31.47
|
|
|
Total
|
58.35
|
|
40.50
|
|
F-123
f) Trade and other guarantees
The Company is required to issue trade guarantees and deposits for concession and spectrum tender bids (see Note 16) and in the ordinary course of its business. No significant additional liabilities in the accompanying consolidated financial statements are expected to arise from guarantees and deposits issued.
g) Directors’ and Senior Executives’ compensation and other benefits
The compensation of the members of Telefónica’s Board of Directors is governed by article 35 of the Company’s By-Laws, which provides that the annual amount of the compensation to be paid thereby to all of the Directors in their capacity as such, i.e., as members of the Board of Directors and for the performance of the duty of supervision and collective decision-making inherent in such body, shall be fixed by the shareholders at the General Shareholders' Meeting. The Board of Directors shall determine the exact amount to be paid within such limit and the distribution thereof among the Directors, taking into account the duties and responsibilities assigned to each Director, their membership on Committees within the Board of Directors and other objective circumstances that it deems relevant. Furthermore, Executive Directors shall receive such compensation as the Board determines for the performance of executive duties delegated or entrusted to them by the Board of Directors. Such compensation shall conform to the Director compensation policy approved by the shareholders at the General Shareholders’ Meeting.
In accordance with the foregoing, the shareholders acting at the Ordinary General Shareholders’ Meeting held on April 11, 2003 set at
6
million euros the maximum amount of annual gross compensation to be received by the Board of Directors as a fixed allotment and as attendance fees for attending the meetings of the Advisory or Control Committees of the Board of Directors. Thus, as regards fiscal year
2018
, the total amount of compensation accrued by the Directors of Telefónica, in their capacity as such, was
2,838,067
euros for the fixed allocation and for attendance fees.
The compensation of the Directors of Telefónica in their capacity as members of the Board of Directors, of the Executive Commission and/or of the Advisory or Control Committees consists of a fixed amount payable monthly and of attendance fees for attending the meetings of the Advisory or Control Committees.
Set forth below are the amounts established in fiscal year
2018
as fixed amounts for belonging to the Board of Directors, the Executive Commission and the Advisory or Control Committees of Telefónica and the attendance fees for attending meetings of the Advisory or Control Committees of the Board of Directors:
Compensation of the Board of Directors and of the Committees thereof
|
Amounts in euros
|
||||||
|
Position
|
Board of Directors
|
|
Executive Commission
|
|
Advisory or Control Committees (*)
|
|
|
Chairman
|
240,000
|
|
80,000
|
|
22,400
|
|
|
Vice chairman
|
200,000
|
|
80,000
|
|
—
|
|
|
Executive Member
|
—
|
|
—
|
|
—
|
|
|
Proprietary Member
|
120,000
|
|
80,000
|
|
11,200
|
|
|
Independent Member
|
120,000
|
|
80,000
|
|
11,200
|
|
|
Other external
|
120,000
|
|
80,000
|
|
11,200
|
|
In this regard, it is noted that the current Executive Chairman, Mr. José María Álvarez-Pallete López, has waived the receipt of the above amounts (i.e.,
240,000
euros as Chairman of the Board of Directors and
80,000
euros as Chairman of the Executive Commission).
Likewise, the fixed remuneration, for their executive roles, of
1,923,100
euros that the Executive Chairman, Mr. José María Álvarez-Pallete López, has established for the 2019 financial year is equal to the one received in the years 2018, 2017 and 2016, which was set in his capacity as Chief Operating Officer, remaining invariably after his appointment as Chairman. This compensation is a
13.8%
lower to the compensation established for the position of Executive Chairman prior to his appointment as such.
The fix remuneration, for their executive roles, of
1,600,000
euros that the Chief Operating Officer (C.O.O.), Mr. Ángel Vilá Boix, has established for the 2019 financial year is equal to the one received in the year 2018.
F-124
Individualized description
Annex II provides an individual breakdown by item of the compensation and benefits that the members of the Board of Directors and of the Senior Management of the Company have accrued and/or received from Telefónica, S.A. and from other companies of the Telefónica Group during fiscal year
2018
. Likewise, the compensation and benefits accrued and/or received, during such year, by the members of the Company's Senior Management are broken down.
F-125
The main finance leases at the Telefónica Group are as follows:
a) Future minimum lease payment commitments in relation to finance leases at Telefónica Brazil companies
The payment schedule of finance leases of Telefónica Brazil at
December 31, 2018
, is as follows:
|
Millions of euros
|
Present value
|
|
Revaluation
|
|
Pending payment
|
|
|
Within one year
|
12
|
|
2
|
|
14
|
|
|
From one to five years
|
33
|
|
14
|
|
47
|
|
|
More than five years
|
44
|
|
69
|
|
113
|
|
|
Total
|
89
|
|
85
|
|
174
|
|
At
December 31, 2018
there are net assets under finance lease agreements amounting to
61
million euros recognized under property, plant and equipment.
Additionally, Telefónica Brazil acts as a lessor in financial leases. The minimum lease payment receivables at
December 31, 2018
are scheduled as follows:
|
Millions of euros
|
Present value
|
|
Revaluation
|
|
Pending receivables
|
|
|
Within one year
|
60
|
|
3
|
|
63
|
|
|
From one to five years
|
57
|
|
9
|
|
66
|
|
|
Total
|
117
|
|
12
|
|
129
|
|
|
Accumulated allowance
|
(44
|
)
|
||||
|
Total after accumulated allowance
|
73
|
|
||||
b) Future minimum lease payment commitments in relation to finance leases at Telefónica Germany companies
The payment schedule of finance leases of Telefónica Germany at
December 31, 2018
, is as follows:
|
Millions of euros
|
Present value
|
|
Revaluation
|
|
Pending payment
|
|
|
Within one year
|
8
|
|
—
|
|
8
|
|
|
From one to five years
|
22
|
|
1
|
|
23
|
|
|
Total
|
30
|
|
1
|
|
31
|
|
At
December 31, 2018
there are net assets under finance lease agreements amounting to
76 million
euros recognized under property, plant and equipment.
F-126
The breakdown of non-current assets classified as held for sale and liabilities associated at December 31, 2018 is as follows:
|
Million of euros
|
Non-current assets as held for sale
|
|
Liabilities associated to non-current assets as held for sale
|
|
|
Antares
|
793
|
|
661
|
|
|
Telefónica Móviles Guatemala
|
376
|
|
105
|
|
|
Telefónica Móviles El Salvador
|
234
|
|
71
|
|
|
Other companies
|
89
|
|
—
|
|
|
Total
|
1,492
|
|
837
|
|
On November 8, 2018, Telefónica reached an agreement with Grupo Catalana Occidente for the sale of 100% of Antares, for a total amount of
161 million
euros. At December 31, 2018, the assets corresponding to Antares were classified as non-current assets held for sale and the liabilities as liabilities associated with non-current assets classified as held for sale (see Note 29).
In addition, on January 24, 2019, Telefonica Centroamérica Inversiones, S.L.,
60%
of which is owned by Telefónica and
40%
by Corporación Multi Inversiones, reached an agreement with América Móvil, S.A.B. of C.V. for the sale of the entire share capital of Telefónica Móviles Guatemala and
99.3%
of Telefónica Móviles El Salvador (see Note 29).
The breakdown of non-current assets classified as held for sale and liabilities associated of Antares, Telefónica Móviles Guatemala and Telefónica Móviles El Salvador at December 31, 2018 is as follows:
|
Million of euros
|
Antares
|
T. Guatemala
|
T. El Salvador
|
|||
|
Non-current assets
|
635
|
|
326
|
|
184
|
|
|
Intangible assets
|
1
|
|
44
|
|
30
|
|
|
Goodwill
|
—
|
|
123
|
|
60
|
|
|
Property, plant and equipment
|
—
|
|
157
|
|
91
|
|
|
Financial assets and other non-current assets
|
634
|
|
2
|
|
2
|
|
|
Deferred tax assets
|
—
|
|
—
|
|
1
|
|
|
Current assets
|
158
|
|
50
|
|
50
|
|
|
Inventories
|
—
|
|
9
|
|
7
|
|
|
Receivables and other current assets
|
10
|
|
25
|
|
30
|
|
|
Tax receivables
|
—
|
|
9
|
|
3
|
|
|
Other current financial assets
|
52
|
|
—
|
|
2
|
|
|
Cash and cash equivalents
|
96
|
|
7
|
|
8
|
|
|
Non-current liabilities
|
656
|
|
45
|
|
11
|
|
|
Non-current financial liabilities
|
—
|
|
19
|
|
—
|
|
|
Payable and other non-current liabilities
|
—
|
|
—
|
|
1
|
|
|
Deferred tax liabilities
|
1
|
|
13
|
|
5
|
|
|
Non-current provisions
|
655
|
|
13
|
|
5
|
|
|
Current liabilities
|
5
|
|
60
|
|
60
|
|
|
Current financial liabilities
|
—
|
|
5
|
|
18
|
|
|
Payables and other current liabilities
|
4
|
|
52
|
|
39
|
|
|
Tax payables
|
—
|
|
3
|
|
3
|
|
|
Current provisions
|
1
|
|
—
|
|
—
|
|
F-127
The following events regarding the Telefónica Group took place between
December 31, 2018
and the date of authorization for issue of the accompanying consolidated financial statements:
|
•
|
On
January 23, 2019
, Telefónica announced that Telefónica UK Limited had agreed non-binding heads of terms with Vodafone Limited to strengthen their existing network sharing partnership in the United Kingdom. The parties plan to extend the term of their existing network sharing partnership and include 5G capacity at joint radio network sites, and to upgrade transmission networks to support 5G technology. They also intend to devolve more activities to their joint venture company, Cornerstone Telecommunications Infrastructure Limited (CTIL), which manages passive tower infrastructure
.
|
|
•
|
On January 23, 2019, Telefónica announced that it was notified of a resolution issued by the Spanish Central Economic-Administrative Tax Court (Tribunal Económico-Administrativo Central) partially upholding the claims filed against the assessments relating to the 2008-2011 Corporate Income Tax Audit. Final implementation of this resolution will most likely lead to a tax refund related to overpayments made by the company in those tax years. At this point of time, it is not possible to quantify the exact amount of the expected refund since, as pointed out by the Central Economic-Administrative Court’s resolution, the final amount shall only be settled once the resolution is duly executed by the Spanish Tax Authorities.
|
|
•
|
On
January 23, 2019
, Telefónica, S.A. made a repayment of
100
million euros on its bilateral loan signed on
December 20, 2017
|
|
•
|
On
January 24, 2019
, Telefonica Centroamérica Inversiones, S.L. (
60%
of which is owned, directly and indirectly, by Telefonica and
40%
of which is owned by Corporación Multi Inversiones), reached an agreement with América Móvil, S.A.B. of C.V. for the sale of the entire share capital of Telefónica Móviles Guatemala, S.A. and
99.3%
of Telefónica Móviles El Salvador, S.A. de C.V. The closing of the Telefónica El Salvador sale is subject to applicable regulatory conditions while the sale of Telefónica Móviles Guatemala was completed on such date.
|
The aggregate consideration for both companies (enterprise value) is
648
million US dollars (approximately
570
million euros at the exchange rate on the date of the agreement,
293
million of which correspond to Telefónica Móviles Guatemala and
277
million of which correspond to Telefónica Móviles El Salvador).
|
•
|
On
January 25, 2019
, Telefónica Emisiones, S.A.U. redeemed
150
million euros of its notes issued on
January 25, 2017
. The notes were guaranteed by Telefónica, S.A.
|
|
•
|
On
February 5, 2019
, Telefónica Emisiones, S.A.U. issued under its
Guaranteed Euro Program for the Issuance of Debt Instruments
("EMTN Program") notes in the Euro market guaranteed by Telefónica, S.A., amounting to
1,000
million euros. These notes are due on
February 5, 2024
, pay an annual coupon of
1.069%
and were issued at par (
100%
). The net proceeds of the notes are to be allocated towards projects aiming to improve energy efficiency in the network transformation from copper to fiber optic in Spain.
|
|
•
|
On February 14, 2019, once the pertinent regulatory approvals were obtained, Telefónica transferred to Grupo Catalana Occidente
100%
of Antares’ share capital for a total amount of
161
million euros. On the closing of the sale, Telefónica and Grupo Catalana Occidente executed an agreement pursuant to which Grupo Catalana Occidente will continue to manage the insurance policies of the Telefónica Group on an exclusive basis for the next
10
years.
|
|
•
|
On
February 18, 2019
, Telefónica, S.A. made an early repayment for
500
million euros of its bilateral loan of
1,000
million euros signed on
June 26, 2014
and originally scheduled to mature on
June 26, 2019
.
|
|
•
|
On
February 20, 2019
, Telefónica reached an agreement with Millicom International Cellular, S.A. for the sale of the entire share capital of Telefónica de Costa Rica TC, S.A., and for the sale by Telefónica's subsidiary Telefonica Centroamérica Inversiones, S.L. (
60%
of which is owned, directly and indirectly, by Telefonica and
40%
of which is owned by Corporación Multi Inversiones), of the entire share capital of Telefónica Móviles Panamá, S.A. and Telefónica Celular de Nicaragua, S.A. The closing of the sale of these three companies is subject to the applicable regulatory conditions and will take place for each transaction once those conditions are being satisfied.
|
F-128
The aggregate amount of the transaction (enterprise value) for all the companies is
1,650
million dollars (approximately
1,455
million euros at the current exchange rate,
503
million of which correspond to Telefónica Costa Rica,
573
million to Telefónica Panama and
379
million to Telefónica Nicaragua).
The detail of the assets and liabilities of these companies as of
December 31, 2018
is as follows:
|
Millions of euros
|
Telefónica Móviles Panamá, S.A.
|
Telefonía Celular de Nicaragua, S.A.
|
Telefónica de Costa Rica TC, S.A.
|
|
Non-current assets
|
332
|
146
|
177
|
|
Current assets
|
34
|
38
|
51
|
|
Total assets
|
366
|
184
|
228
|
|
Non-current liabilities
|
69
|
21
|
32
|
|
Current liabilities
|
71
|
49
|
53
|
|
Total liabilities
|
140
|
70
|
85
|
F-129
Appendix I: Scope of consolidation
The main Companies of the Telefónica Group
The table below lists the main companies comprising the Telefónica Group at December 31, 2018 and the main investments consolidated using the equity method.
Included for each company are the company name, corporate purpose, country, functional currency, share capital (in millions of functional currency units), the Telefónica Group’s effective shareholding and the company or companies through which the Group holds a stake.
Parent Company
Telefónica, S.A.
|
Name and corporate purpose
|
Country
|
Currency
|
Capital
|
|
%Telefónica Group
|
|
Holding Company
|
|
Telefónica Spain
|
|
||||||
|
Telefónica de España, S.A.U.
Telecommunications service provider |
Spain
|
EUR
|
1,024
|
|
100
|
%
|
Telefónica, S.A.
|
|
Telefónica Móviles España, S.A.U.
Wireless communications services provider |
Spain
|
EUR
|
209
|
|
100
|
%
|
Telefónica, S.A.
|
|
Acens Technologies, S.L.
Holding housing and telecommunications solutions Service provider |
Spain
|
EUR
|
23
|
|
100
|
%
|
Telefónica de España, S.A.U.
|
|
Teleinformática y Comunicaciones, S.A.U. (Telyco)
Promotion, marketing and distribution of telephone and telematic equipment and services |
Spain
|
EUR
|
8
|
|
100
|
%
|
Telefónica de España, S.A.U.
|
|
Telefónica Soluciones de Informática y Com. de España S.A.U.
Telecommunications systems, networks and infrastructure engineering |
Spain
|
EUR
|
2
|
|
100
|
%
|
Telefónica de España, S.A.U.
|
|
Telefónica Soluciones de Outsourcing, S.A.
Promotion and networks management |
Spain
|
EUR
|
1
|
|
100
|
%
|
Telefónica Soluciones de Informática y Com. de España S.
A.U.
|
|
Telefónica Servicios Integrales de Distribución S.A.U.
Logistic service provider |
Spain
|
EUR
|
2
|
|
100
|
%
|
Telefónica de España, S.A.U.
|
|
DTS Distribuidora de Televisión Digital, S.A.
Broacasting satellite TV signal transmission and linkage services |
Spain
|
EUR
|
80
|
|
100
|
%
|
Telefónica de España, S.A.U.
|
|
Telefónica Servicios Audiovisuales, S.A.U.
Provision of all type of audiovisual telecommunications services |
Spain
|
EUR
|
6
|
|
100
|
%
|
Telefónica de Contenidos, S.A.U.
|
|
Telefónica Broadcast Services, S.L.U.
DSNG-based transmission and operation services |
Spain
|
EUR
|
—
|
|
100
|
%
|
Telefónica Servicios Audiovisuales, S.A.U.
|
|
Telefónica Audiovisual Digital, S.L.U.
Provision of all type of audiovisual telecommunications services |
Spain
|
EUR
|
46
|
|
100
|
%
|
Telefónica de Contenidos, S.A.U.
|
|
Compañía Independiente de Televisión, S.L.
Provision of all type of audiovisual telecommunications services |
Spain
|
EUR
|
1
|
|
100
|
%
|
Telefónica Audiovisual Digital, S.L.U.
|
|
Telefónica United Kingdom
|
|
|
|||||
|
Telefónica Europe plc
Holding company |
UK
|
GBP
|
9
|
|
100
|
%
|
Telefónica, S.A. (99.99%)
Telefónica Capital S.A. (0.01%) |
|
MmO2 plc
Holding company |
UK
|
GBP
|
20
|
|
100
|
%
|
O2 Secretaries Ltd. (0.01%)
Telefónica Europe plc (99.99%) |
F-130
|
Name and corporate purpose
|
Country
|
Currency
|
Capital
|
|
%Telefónica Group
|
|
Holding Company
|
|
Telefónica United Kingdom (Cont.)
|
|||||||
|
O2 Holdings Ltd
Holding company |
UK
|
GBP
|
12
|
|
100
|
%
|
Telefónica Europe plc
|
|
Telefónica United Kingdom Ltd.
Wireless communications |
UK
|
GBP
|
10
|
|
100
|
%
|
O2 Holdings Ltd.
|
|
Giffgaff Ltd
Wireless communications services provider |
UK
|
GBP
|
—
|
|
100
|
%
|
Telefónica United Kingdom Ltd.
|
|
O2 Networks Ltd.
Holding company |
UK
|
GBP
|
—
|
|
100
|
%
|
O2 Holdings Ltd.
|
|
Cornerstone Telecommunications
Network sharing |
UK
|
GBP
|
—
|
|
50
|
%
|
O2 Networks Ltd. (40%)
O2 Cedar Ltd (10%) |
|
Telefónica Germany
|
|
|
|
|
|
|
|
|
Telefónica Deutschland Holding A.G
Holding company |
Germany
|
EUR
|
2,975
|
|
69.22
|
%
|
Telefónica Germany Holdings Limited
|
|
Telefónica Germany GmbH & Co. OHG
Wireless communications services operator |
Germany
|
EUR
|
51
|
|
69.22
|
%
|
Telefónica Deutschland Holding A.G (69.21%)
T. Germany Management, GmbH (0.01%) |
|
E-Plus Services GmbH
Wireless communications services operator |
Germany
|
EUR
|
—
|
|
69.22
|
%
|
Telefónica Germany GmbH & Co. OHG
|
|
Telefónica Germany Next GmbH
Technological and consulting services in Big Data provider |
Germany
|
EUR
|
—
|
|
69.22
|
%
|
Telefónica Germany GmbH & Co. OHG
|
|
Minodes GmbH
Technological and consulting services in Big Data provider |
Germany
|
EUR
|
—
|
|
69.22
|
%
|
Telefónica Germany Next Gmbh
|
|
Telefónica Brazil
|
|
|
|
|
|
|
|
|
Telefônica Brasil, S.A.
Wireline telephony operator |
Brazil
|
BRL
|
63,571
|
|
73.68
|
%
|
Telefónica Latinoamérica Holding, S.L. (24.18%)
Telefónica, S.A. (29.77%) Sao Paulo Telecomunicaçoes Participaçoes, Ltda. (19.67%) Telefónica Chile, S.A. (0.06%) |
|
Terra Networks Brasil, S.A.
ISP and portal |
Brazil
|
BRL
|
—
|
|
73.68
|
%
|
Telefônica Brasil, S
.A.
|
|
Telefónica Hispam Norte
|
|||||||
|
Telefónica Venezolana, C.A.
Wireless communications operator |
Venezuela
|
VES
|
498,953
|
|
100
|
%
|
Latin America Cellular Holdings, S.L. (97.04%)
Comtel Comunicaciones Telefónicas, S.A. (2.87%) Telefónica, S.A. (0.09%) |
F-131
|
Name and corporate purpose
|
Country
|
Currency
|
Capital
|
|
%Telefónica Group
|
|
Holding Company
|
|
Telefónica Hispam Norte (Cont.)
|
|||||||
|
Colombia Telecomunicaciones, S.A. ESP
Communications services operator |
Colombia
|
COP
|
3,410
|
|
67.5
|
%
|
Telefónica Latinoamérica Holding, S.L. (51.52%)
Latin American Cellular Holdings, S.L. (8.08%) Telefónica, S.A. (7.90%) |
|
Empresa de Telecomunicaciones de Bucaramanga S.A. E.S.P
Communications services operator |
Colombia
|
COP
|
83,191
|
|
63.77
|
%
|
Colombia Telecomunicaciones, S.A. ESP (35.71%)
Metropolitana de Telecomunicaciones S.A E.S.P (28.06%) |
|
Metropolitana de Telecomunicaciones S.A E.S.P
Communications services operator |
Colombia
|
COP
|
50,212
|
|
59.03
|
%
|
Colombia Telecomunicaciones, S.A. ESP (30.89%)
Empresa de Telecomunicaciones de Bucaramanga S.A. E.S.P (28.14%) |
|
Operaciones Tecnológicas y Comerciales S.A.S
Communications services operator |
Colombia
|
COP
|
2,330
|
|
60.93
|
%
|
Empresa de Telecomunicaciones de Bucaramanga S.A. E.S.P (24.37%)
Metropolitana de Telecomunicaciones S.A E.S.P (36.56%) |
|
Telefónica Móviles México, S.A. de C.V.
Holding Company |
Mexico
|
MXN
|
99,384
|
|
100
|
%
|
Telefónica, S.A.
|
|
Telefónica Móviles Panamá, S.A.
Wireless telephony services |
Panama
|
USD
|
45
|
|
60
|
%
|
Telefónica Centroamérica Inversiones, S.L.
|
|
Telefonía Celular de Nicaragua, S.A.
Wireless telephony services |
Nicaragua
|
NIO
|
247
|
|
60
|
%
|
Telefónica Centroamérica Inversiones S.L. (59.99%)
Guatemala Cellular Holdings, B.V. (0.01%) |
|
Otecel, S.A.
Wireless communications services provider |
Ecuador
|
USD
|
183
|
|
100
|
%
|
Telefónica Latinoamérica Holding, S.L.
|
|
Telefónica de Costa Rica TC, S.A.
Wireless communications |
Costa Rica
|
CRC
|
199,892
|
|
100
|
%
|
Telefónica, S.A.
|
|
Telefónica Hispam Sur
|
|
|
|
|
|
|
|
|
Telefónica de Argentina, S.A.
Telecommunications service provider |
Argentina
|
ARS
|
22,403
|
|
100
|
%
|
Telefónica Móviles Argentina, S.A. (81.05%)
Telefónica Latinoamérica Holding, S.L. (16.73%) Telefónica, S.A. (1.46%) Telefónica International Holding, B.V. (0.76%) |
F-132
|
Name and corporate purpose
|
Country
|
Currency
|
Capital
|
|
%Telefónica Group
|
|
Holding Company
|
|
Telefónica Hispam Sur (Cont.)
|
|||||||
|
Telefónica Móviles Argentina, S.A.
Telecommunications service provider |
Argentina
|
ARS
|
4,432
|
|
100
|
%
|
Telefónica, S.A. (73.20%)
Telefónica Latinoamérica Holding, S.L. (25.28%) Telefónica International Holding, B.V. (1.52%) |
|
Telefónica Móviles Chile, S.A.
Wireless communications servi ces operator |
Chile
|
CLP
|
1,294,872
|
|
100
|
%
|
Inversiones Telefónica Móviles Holding Limitada (98.90%)
Telefónica, S.A. (1.1%) |
|
Telefónica Chile, S.A.
Local and international long distance telephony services provider |
Chile
|
CLP
|
569,773
|
|
99.14
|
%
|
Telefónica Móviles Chile, S.A.
|
|
Telefónica del Perú, S.A.A.
Local, domestic and international long distance telephone ser vice provider |
Peru
|
PEN
|
2,954
|
|
98.57
|
%
|
Telefónica Latinoamérica Holdi
ng, S.L. (50.22%)
Latin American Cellular Holdings, S.L. (48.35%) |
|
Telefónica Móviles del Uruguay, S.A.
Wireless c ommunications and services operator |
Urugu
ay
|
UYU
|
1,107
|
|
100
|
%
|
Telefónica Latin
oamérica Holding, S.L.
|
|
Other Companies
|
|
|
|
|
|
|
|
|
O2 International Holdings Ltd.
Holding company |
UK
|
GBP
|
—
|
|
100
|
%
|
O2 (Europe) Ltd.
|
|
Telefónica Germany Holdings Ltd.
Holding company |
UK
|
EUR
|
—
|
|
100
|
%
|
O2 (Europe) Ltd.
|
|
O2 (Europe) Ltd.
Holding company |
UK
|
EUR
|
1,239
|
|
100
|
%
|
Telefónica, S.A.
|
|
Telefónica International Holding, B.V
Holding company |
Netherlan
ds
|
EUR
|
—
|
|
100
|
%
|
Telefónica Latinoamérica Holding, S.L.
|
|
Telefónica Latinoamérica Holding, S.L.
Holding company |
Spain
|
EUR
|
237
|
|
100
|
%
|
Telefónica, S.A.
|
|
Pontel Participaciones, S.L.
Holding company |
Sp
ain
|
EUR
|
—
|
|
83.35
|
%
|
Telefónica
, S.A.
|
|
Telxius Telecom, S.A.
Telecommunications service provider |
Sp
ain
|
EUR
|
250
|
|
50.01
|
%
|
Pontel Participa
ciones, S.L.
|
|
Telxius Cable América, S.A.
Prov ision of high bandwidth communications services |
Ur
uguay
|
USD
|
429
|
|
50.01
|
%
|
Telxius Telecom,
S.A.
|
|
Telxius Cable España, S.L.U.
Establishment and operat ion of any kind of communications infrastructure and/or network |
Spain
|
EUR
|
5
|
|
50.01
|
%
|
Telxius Telecom, S.A.
|
|
Telxius Cable República Dominicana, S.A.S.
Operation a nd deployment of telecommunications infraestructure |
Repub
lica Dominicana
|
USD
|
3
|
|
50.01
|
%
|
Telxius Cable América,
S.A. (49.51%)
Telxius Cable España, S.L.U. (0.50%) |
|
Telxius Cable Argentina, S.A.
Operati on and deployment of telecommunications infraestructure |
Argen
tina
|
USD
|
78
|
|
50.01
|
%
|
Telxius Cable Am
érica, S.A. (49.98%)
Telxius Cable España, S.L.U. (0.03%) |
F-133
|
Name and corporate purpose
|
Country
|
Currency
|
Capital
|
|
%Telefónica Group
|
|
Holding Company
|
|
Other Companies (Cont.)
|
|||||||
|
Telxius Cable Panamá, S.A.
Installation and operation of telecommunications net works for wholesalers |
Panama
|
USD
|
—
|
|
50.01
|
%
|
Telxius Cable América
, S.A.
|
|
Telxius Cable Puerto Rico, Inc.
High capacity optical fiber network communications services |
Puert
o Rico
|
USD
|
24
|
|
50.01
|
%
|
Telxius Cable América
, S.A.
|
|
Telxius Cable USA, Inc.
High bandwidth communications services |
US
|
USD
|
58
|
|
50.01
|
%
|
Telxius Cable América, S.A.
|
|
Telxius Cable Ecuador, S.A.
Sale of usage of data transmission capacity via an underwater optical fiber network |
Ecuador
|
USD
|
5
|
|
50.01
|
%
|
Telxius Cable América, S.A. (50%)
Telxius Cable Perú, S.A.C. (0.01%) |
|
Telxius Cable Chile, S.A.
Involvement in businesses related to public or private telecommunications services |
Chile
|
USD
|
37
|
|
50.01
|
%
|
Telxius Cable América, S.A.
|
|
Telxius Cable Guatemala, S.A.
Installation and operation of telecommunications networks for wholesalers |
Guatemala
|
USD
|
24
|
|
50.01
|
%
|
Telxius Cable América, S.A.
|
|
Telxius Cable Perú, S.A.C.
Involvement in the operation and deployment of international telecommunications s ervices via underwater cables and others means |
Pe
ru
|
USD
|
20
|
|
50.01
|
%
|
Telxius Cable América, S.A.
|
|
Telxius Cable Colombia, S.A.
Supply of data transmission capacity via underwater cable system |
Colombi
a
|
USD
|
4
|
|
50.01
|
%
|
Telxius Cable América, S.A. (47.50%)
Telxius Cable Chile, S.A. (0.83%) Telxius Cable Perú, S.A.C. (0.84%) Telxius Cable Guatemala, S.A. (0.83%) Telxius Cable Argentina, S.A. (0.01%) |
|
Telxius Cable Brasil Participaçoes, Ltda.
Holding company |
Brazi
l
|
USD
|
62
|
|
50.01
|
%
|
Telxius Cable América, S.A.
|
|
Telxius Cable Brasil, Ltda.
Operation and deployment of telecommunications infrastructure |
Brazil
|
USD
|
74
|
|
50.01
|
%
|
Telxius Cable Brasil Partici
paçoes, Ltda.
|
|
Telxius Cable Bolivia, S.A.
Establishment and operation of any kind of communications infrastructure and/or net work |
Boli
via
|
USD
|
5
|
|
50.01
|
%
|
Telxius Cable América, S.A.
(49.01%)
Telxius Cable España, S.L.U. (0.5%) Telxius Cable Argentina, S.A. (0.5%) |
|
Telxius Torres Latam, S.L.U.
Establishment and operation of any kind of communications infrastructure and/or netw ork |
Spain
|
EUR
|
8
|
|
50.01
|
%
|
Telxius Telecom, S.A.
|
|
Telxius Torres España, S.L.U.
Establishment and operation of any kind of communications infrastructure and/or network |
Spain
|
EUR
|
10
|
|
50.01
|
%
|
Telxius Telecom, S.A.
|
|
Telxius Towers Germany, Gmbh.
Establishment and operation of any kind of communications infrastructure and/or ne twork |
German
y
|
EUR
|
—
|
|
50.01
|
%
|
Telxius Telecom, S.A.
|
|
Telxius Torres Perú S.A.C.
Establishment and operation of any kind of communications infrastructure and/or networ k |
Peru
|
PEN
|
104
|
|
50.01
|
%
|
Telxius Torres Latam,
S.L.U.
|
F-134
|
Name and corporate purpose
|
Country
|
Currency
|
Capital
|
|
%Telefónica Group
|
|
Holding Company
|
|
Other Companies (Cont.)
|
|||||||
|
Telxius Torres Chile Holding, S.A.
Holding company |
Chile
|
EUR
|
8
|
|
50.01
|
%
|
Telxius Torres Latam,
S.L.U. (50%)
Telxius Torres España, S.L.U. (0.01%) |
|
Telxius Torres Chile, S.A.
Operation and deployment of telecommunications infrastructure |
Chile
|
CLP
|
8,891
|
|
50.01
|
%
|
Telxius Torres Chile
Holding, S.A.
|
|
Telxius Torres Brasil, Ltda.
Establishment and operation of any kind of communications infrastructure and/or ne twork |
Braz
il
|
BRL
|
764
|
|
50.01
|
%
|
Telxius Torres Latam, S.L.U.
|
|
Telxius Torres Argentina, S.A.
Establishment and o peration of any kind of communications infrastructure and/or network |
Argen
tina
|
ARS
|
1,005
|
|
50.01
|
%
|
Telxius Torres Latam, S.L.U. (47.51%)
Telxius Telecom, S.A. (2.50%) |
|
Latin American Cellular Holdings, S.L.
Holding company |
Spain
|
EUR
|
—
|
|
100
|
%
|
Telefónica Latinoamérica Holding,
S.L.
|
|
Telefónica International Wholesale Services II, S.L.
International services provider |
Spain
|
EUR
|
1
|
|
100
|
%
|
Telefónica, S.A.
|
|
Telefónica International Wholesale Services México, S.A.
Telecommunications research activities and proyects |
Mexico
|
MXN
|
31
|
|
100
|
%
|
Telefónica International Wholesale Services II, S.L.
|
|
Telefónica Digital España, S.L.
Developer Telco Servic es Holding Company |
Spain
|
EUR
|
24
|
|
100
|
%
|
Telefónica, S.A
|
|
Wayra Investigación y Desarrollo S.L.
Talent identification and development in ICT. |
Spain
|
EUR
|
2
|
|
100
|
%
|
Telefónica Digi
tal España, S.L.
|
|
Wayra Chile Tecnología e Innovación Limitada
Technological innovation based business project development |
Chile
|
CLP
|
29,644
|
|
100
|
%
|
Wayra Investigacion y Desarrollo, S.L.
|
|
Wayra Brasil Aceleradora de Projetos Ltda.
Technological innovation base d business project development |
Brazi
l
|
BRL
|
43
|
|
100
|
%
|
Wayra Investigación y Desarrollo S.L.
|
|
WY Telecom, S.A. de C.V.
Talent identification and development in ICT |
Mexic
o
|
MXN
|
153
|
|
100
|
%
|
Wayra Investigacion y Desarrollo, S.L.
|
|
Wayra Argentina, S.A.
Talent identification a nd development in ICT |
Ar
gentina
|
ARS
|
144
|
|
100
|
%
|
Wayra Investigacion y Desarrollo, S.L. (95%)
Telefónica Latinoamérica Holding, S.L. (5%) |
|
Wayra Colombia, S.A.S.
Technological innovation based business project development |
Colom
bia
|
COP
|
2,400
|
|
100
|
%
|
Wayra Investigacion y Desarrollo, S.L.
|
|
Proyecto Wayra, C.A.
Commercial, industrial and mercantile activities |
Venezu
ela
|
VES
|
3,051
|
|
100
|
%
|
Telefónica Venezolana, C.A.
|
|
Wayra Perú Aceleradora de Proyectos, S.A.C.
Technological innovation based business project development |
Peru
|
PEN
|
20
|
|
100
|
%
|
Wayra Investigacion y Desarrollo, S.L.
|
|
Wayra UK Ltd.
Technological innovation based business project deve lopment |
UK
|
GBP
|
—
|
|
100
|
%
|
Wayra Investigación y Desarrollo, S.L.
|
F-135
|
Name and corporate purpose
|
Country
|
Currency
|
Capital
|
|
%Telefónica Group
|
|
Holding Company
|
|
Other Companies (Cont.)
|
|||||||
|
Terra Networks Perú, S.A.
ISP and portal |
Peru
|
PEN
|
10
|
|
100
|
%
|
Telefónica Latinoamérica Holding, S.L.
|
|
Terra Networks Argentina, S.A.
ISP and portal |
Argentina
|
ARS
|
58
|
|
100
|
%
|
Telefónica Latinoamérica Hol
ding, S.L. (99.99%)
Telefónica International Holding, B.V. (0.01%) |
|
Terra Networks México, S.A. de C.V.
ISP, portal and real-time financial information services |
Mexi
co
|
MXN
|
305
|
|
100
|
%
|
Terra Networks Mexico Holding, S.A. de
C.V.
|
|
Telfisa Global, B.V.
Integrated cash management, consulting and financial support for Group companies |
Ne
therlands
|
EUR
|
—
|
|
100
|
%
|
Telefónica, S.A.
|
|
Telefónica Global Activities Holding, B.V
.
Holding Company |
Ne
therlands
|
EUR
|
—
|
|
100
|
%
|
Telfisa Global, B.V.
|
|
Telefónica Global Services, GmbH
Purchasing services |
Germany
|
EUR
|
—
|
|
100
|
%
|
Group 3G UMTS Hol
ding, GmbH
|
|
Telefónica Global Roaming, GmbH
Optimization of network tr affic |
Germany
|
EUR
|
—
|
|
100
|
%
|
Telefónica Global Ser
vices, GmbH
|
|
Group 3G UMTS Holding GmbH
Holding Company |
Germany
|
EUR
|
250
|
|
100
|
%
|
Telefónica Global Activitie
s Holdings, B.V
|
|
Telefónica Compras Electrónicas, S.L.
Development and provision of information Society services |
Spain
|
EUR
|
—
|
|
100
|
%
|
Telefónica Global Services, GmbH
|
|
Telefónica de Contenidos, S.A.U.
Organizat ion and operation of multimedia service-related business |
Spain
|
EUR
|
226
|
|
100
|
%
|
Telefónica, S.A.
|
|
Telefónica On The Spot Services, S.A.U.
Provision of telemarketing services |
Spain
|
EUR
|
1
|
|
100
|
%
|
Telefónica de Contenidos, S.A.U.
|
|
Telefónica Educación Digital, S.L.
Vertical e learning portal |
Spain
|
EUR
|
1
|
|
100
|
%
|
Telefónica Digita
l España, S.L.
|
|
Telfin Ireland Ltd.
Intragroup financing |
Irela
nd
|
EUR
|
—
|
|
100
|
%
|
Telefónica, S.A.
|
|
Telefónica Ingeniería de Seguridad, S.A.U.
Security services a nd systems |
Spain
|
EUR
|
13
|
|
100
|
%
|
Telefónica, S.A.
|
|
Telefónica Engenharia de Segurança do Br
asil Ltda
Security services and systems |
Brazil
|
BRL
|
155
|
|
99.99
|
%
|
Telefónica Ingeniería de Seguridad, S.A.U.
|
|
Telefónica Capital, S.A.U.
Finance company |
Spain
|
EUR
|
7
|
|
100
|
%
|
Telefónica, S.A.
|
|
Lotca Servicios Integrales, S.L.
Aircraft ownership and operation |
Spain
|
EUR
|
17
|
|
100
|
%
|
Telefónica, S.A.
|
|
Fonditel Pensiones, Entidad Gestora de Fon
dos de Pensiones, S.A
Administration of pension funds |
Spain
|
EUR
|
16
|
|
70
|
%
|
Telefónica Capita
l, S.A.
|
F-136
|
Name and corporate purpose
|
Country
|
Currency
|
Capital
|
|
%Telefónica Group
|
|
Holding Company
|
|
Other Companies (Cont.)
|
|||||||
|
Fonditel Gestión, Soc. Gestora de Instituciones de Inversión Cole
ctiva, S.A.
Administration and representation of collective investment schemes |
Spain
|
EUR
|
2
|
|
100
|
%
|
Telefónica Capita
l, S.A.
|
|
Telefónica Investigación y Desarrollo, S.A.U.
Telecommunications research activities and projec ts |
Spain
|
EUR
|
7
|
|
100
|
%
|
Telefónica, S.A.
|
|
Media Networks Latin America, S.A.C
Telecommunications research activities and proyects |
Peru
|
USD
|
91
|
|
100
|
%
|
Telefónica Latinoamérica
Holding, S.L.
|
|
Telefónica Luxembourg Holding, S.à.r.L.
Holding company |
Luxem
bourg
|
EUR
|
3
|
|
100
|
%
|
Telefónica, S.A.
|
|
Casiopea Reaseguradora, S.A.
Reinsurance |
Luxe
mbourg
|
EUR
|
4
|
|
100
|
%
|
Telefónica Luxembourg Holding, S.à.r.L
.
|
|
Nova Casiopea RE S.A.
Reinsurance |
Luxembourg
|
EUR
|
15
|
|
100
|
%
|
Telefónica Luxemb
ourg Holding, S.à.r.L.
|
|
Telefónica Insurance, S.A.
Direct insuran ce transactions |
Luxembourg
|
EUR
|
23
|
|
100
|
%
|
Telefónica Luxembourg Holding, S.à.r.L.
|
|
Telefónica Finanzas, S.A.U.
Integ rated cash management, consulting and financial support for Group companies |
Spain
|
EUR
|
3
|
|
100
|
%
|
Telefónica, S.A.
|
|
Pléyade Peninsular, Correduría de Seguros y Reaseguros del Grupo Telefónica, S.A.
Distribution, promotion or preparation of insurance contracts |
Spain
|
EUR
|
—
|
|
100
|
%
|
Telefónica Finanzas, S.A.U. (TELFISA) (8
3.33%)
Telefónica, S.A. (16.67%) |
|
Fisatel Mexico, S.A. de C.V.
Integrated cash mangement, consulting and financial suppor t for Group companies |
Mexic
o
|
MXN
|
3,505
|
|
100
|
%
|
Telefónica, S.A.
|
|
Telefónica Europe, B.V.
Fund raising in capital markets |
Nethe
rlands
|
EUR
|
—
|
|
100
|
%
|
Telefónica, S.A.
|
|
Telefónica Participaciones, S.A.U.
Financial debt instrument issuer |
Spain
|
EUR
|
—
|
|
100
|
%
|
Telefónica, S.A.
|
|
Telefónica Emisiones, S.A.U.
Financial debt instrument issuer |
Spain
|
EUR
|
—
|
|
100
|
%
|
Telefónica, S.A.
|
|
Telefónica Global Technology, S.A.U.
Global management and operation of IT systems |
Spain
|
EUR
|
16
|
|
100
|
%
|
Telefónica, S.A.
|
|
Aliança Atlântica Holding B.V.
Holding company |
Nethe
rlands
|
EUR
|
150
|
|
100
|
%
|
Telefónica, S.A.
(50%)
Telefônica Brasil, S.A. (50%) |
|
Telefónica Serviços Empresariais do BRASIL, Ltda.
Management and administrative services rendered |
Brazi
l
|
BRL
|
45
|
|
99.99
|
%
|
Telefónica Servic
ios Globales, S.L.U.
|
|
Telefónica Gestión Logística, S.A.C
Logistic service provider |
Peru
|
PEN
|
15
|
|
100
|
%
|
Telefónica Servicios Globales, S.L.U. (99.49%)
Telef ónica del Perú, S.A.A. (0.51%) |
|
Telefónica Gestión Integral de Edificios y Servicios S.L.
Management and administrative services rendered |
Spain
|
EUR
|
—
|
|
100
|
%
|
Telefónica Servicios Globales,
S.L.U.
|
F-137
|
Name and corporate purpose
|
Country
|
Currency
|
Capital
|
|
%Telefónica Group
|
|
Holding Company
|
|
Other Companies (Cont.)
|
|||||||
|
Tempotel, Empresa de Trabajo Temporal, S.A.
Temporary employment agency |
Spain
|
EUR
|
—
|
|
100
|
%
|
Telefónica Servicios Globales, S.L.U.
|
|
O2 Worldwide Limited
Wireless telecommunications activities |
UK
|
GBP
|
—
|
|
100
|
%
|
Telefónica, S.A.
|
|
Telefónica Innovación Alpha, S.L.
Electronic communications and audiovisual services provider |
Spain
|
EUR
|
1
|
|
100
|
%
|
Telefónica, S.A.
|
|
Telefónica Servicios Globales, S.L.U.
Holding Company |
Spain
|
EUR
|
1
|
|
100
|
%
|
Telefónica, S.A.
|
|
Telefónica Holding Atticus, B.V.
Holding company |
Ne
therlands
|
EUR
|
—
|
|
100
|
%
|
Telefónica Lati
noamérica Holding, S.L.
|
|
Telefónica Chile Holdings, S.L.
Holding Company |
Chile
|
CLP
|
—
|
|
100
|
%
|
Telefónica, S.A.
|
|
Other companies held for sale
|
|
|
|
|
|
|
|
|
Seguros de Vida y Pensiones Antares, S.A.
Life insura nce, pensions and health insurance |
Spain
|
EUR
|
51
|
|
100
|
%
|
Telefónica, S.A.
|
|
Telefónica Móviles El Salvador, S.A. de C.V.
Provision of wireless and international long distance communications services |
El Salvador
|
USD
|
42
|
|
59.58
|
%
|
Telefónica Centroamérica Inversiones S.L. (59.46%)
Telefónica Multiservicios S.A. de C.V. (0.12%) |
|
Telefónica Móviles Guatemala, S.A.
Wireless, wireline and radio paging communications services provider |
Guatemala
|
GTQ
|
1,396
|
|
60
|
%
|
Telefónica Centroamérica Inversiones S.L. (0.01%)
Guatemala Cellular Holdings, B.V. (59.99%) |
|
Companies accounted for using the equity method
|
|
|
|
|
|
|
|
|
Telefónica Factoring España, S.A.
Factoring services provider |
Spain
|
EUR
|
5
|
|
50
|
%
|
Telefónica, S.A.
|
|
Telefónica Factoring Do Brasil, Ltd.
Factoring services provider |
Brazil
|
BRL
|
5
|
|
50
|
%
|
Telefónica, S.A. (40.00%)
Telefónica Factoring España, S.A. (10.00)% |
|
Telefónica Factoring Mexico, S.A. de C.V. SOFOM ENR
Factoring services provider |
Mexico
|
MXN
|
34
|
|
50
|
%
|
Telefónica, S.A. (40.50%)
Telefónica Factoring España, S.A. (9.50)% |
|
Telefónica Factoring Perú, S.A.C.
Factoring services provider |
Peru
|
PEN
|
6
|
|
50
|
%
|
Telefónica, S.A. (40.50%)
Telefónica Factoring España, S.A. (9.50%) |
|
Telefónica Factoring Colombia, S.A.
Factoring services provider |
Colombia
|
COP
|
4,000
|
|
50
|
%
|
Telefónica, S.A. (40.50%)
Telefónica Factoring España, S.A. (9.50%) |
|
Mobile Financial Services Holding SPRL
Financial services |
Belgica
|
USD
|
197
|
|
50
|
%
|
Telefónica Internacional Holding, B.V (26.28%)
Telefónica Holding Atticus, B.V (23.72%) |
F-138
|
Name and corporate purpose
|
Country
|
Currency
|
Capital
|
|
%Telefónica Group
|
|
Holding Company
|
|
Telefónica Consumer Finance, Establecimiento Financiero de Crédito, S.A.
Specialized credit institution |
Spain
|
EUR
|
5
|
|
50
|
%
|
Telefónica, S.A.
|
|
Companies accounted for using the equity method (Cont.)
|
|||||||
|
Tesco Mobile Ltd.
Wireless telephony services |
UK
|
GBP
|
—
|
|
50
|
%
|
O2 Communication Ltd.
|
|
The Smart Steps Data Technology Company
Big data services in China |
China
|
CNY
|
—
|
|
45
|
%
|
Telefónica Digital España, S.L.
|
Main changes in the scope of consolidation for the year 2018
Constitution of new companies
|
Companies/Segment/Subsidiaries
|
Country
|
Date of inclusion
|
% Acquisition
|
|
|
Other companies
|
|
|
|
|
|
Telxius Cable Bolivia, S.A.
Establishment and operation of any kind of communications infrastructure and/or network |
Bolivia
|
03/31/2018
|
50.01
|
%
|
|
Pontel Participaciones, S.L.
Holding company |
Spain
|
07/31/2018
|
83.35
|
%
|
Sold companies
|
Companies/Segment/Subsidiaries
|
Country
|
Date of deconsolidated
|
% Sold
|
|
|
Telefónica Spain
|
|
|
|
|
|
Centro de Asistencia Telefónica, S.A.
Provision of services related to databases |
Spain
|
12/31/2018
|
100
|
%
|
|
Telefónica Germany
|
|
|
|
|
|
Shortcut I GmbH & Co. KG
Technological innovation based business project development |
Germany
|
10/31/2018
|
69.22
|
%
|
|
Other companies
|
|
|
|
|
|
Telefónica Digital Inc.
IP telephony platform |
US
|
08/31/2018
|
100
|
%
|
|
Tokbox Inc.
IP telephony platform |
US
|
08/31/2018
|
100
|
%
|
|
Axonix Ltd
Digital and mobile advertising |
UK
|
08/31/2018
|
78
|
%
|
F-139
Merged companies
|
Companies/Segment/Subsidiaries
|
Country
|
Date
|
Surviving company
|
|
Telefónica Germany
|
|
|
|
|
Co-Trade GmbH
Technological services |
Germany
|
07/31/2018
|
Telefónica Germany Retail Gmbh
|
|
Other companies
|
|
|
|
|
Synergic Partners, S.L.
Technological and consulting services in Big Data provider |
Spain
|
10/31/2018
|
Telefónica Digital España, S.L.
|
Companies liquidation
|
Companies/Segment/Subsidiaries
|
Country
|
Date of deconsolidated
|
% Participation
|
|
|
Other companies
|
|
|
|
|
|
Telefónica Gestión de Servicios Compartidos México, S.A. de C.V.
Management and administrative services rendered |
Mexico
|
12/31/2018
|
100
|
%
|
Operations with minority interests
|
Companies/Segment/Subsidiaries
|
Country
|
Date
|
% Participation after operation
|
|
|
Other companies
|
|
|
|
|
|
Pontel Participaciones, S.L.
Holding company |
Spain
|
07/31/2018
|
83.35
|
%
|
Main changes in the scope of consolidation for the year 2017
Constitution of new companies
|
Companies/Segment/Subsidiaries
|
Country
|
Date of inclusion
|
% Acquisition
|
|
|
Other companies
|
||||
|
Telxius Torres Argentina, S.A.
Any type of infrastructures and/or communications networks institution and operation |
Argentina
|
05/31/2017
|
60
|
%
|
Acquired companies
|
Companies/Segment/Subsidiaries
|
Country
|
Date of inclusion
|
% Acquisition
|
|
|
Telefónica Germany
|
||||
|
Minodes GmbH
Technological and consulting services in Big Data provider |
Germany
|
05/31/2017
|
69.22
|
%
|
|
Co-Trade GmbH
Technological services |
Germany
|
10/31/2017
|
69.22
|
%
|
F-140
Acquisition of control
|
Companies/Segment/Subsidiaries
|
Country
|
Date of inclusion
|
% Acquisition
|
|
|
Telefónica Hispam Norte
|
||||
|
Empresa de Telecomunicaciones de Bucaramanga S.A. E.S.P
Communications services operator |
Colombia
|
09/30/2017
|
63.77
|
%
|
|
Metropolitana de Telecomunicaciones S.A E.S.P
Communications services operator |
Colombia
|
09/30/2017
|
59.03
|
%
|
|
Operaciones Tecnológicas y Comerciales S.A.S
Communications services operator |
Colombia
|
09/30/2017
|
60.93
|
%
|
Sold companies
|
Companies/Segment/Subsidiaries
|
Country
|
Date of deconsolidated
|
% Sold
|
|
|
Telefónica Hispam Norte
|
||||
|
Compañía Señales del Norte, S.A. de C.V
Other business support services |
Mexico
|
12/31/2017
|
100
|
%
|
|
Other companies
|
||||
|
Telefónica Gestión de Servicios Compartidos Perú, S.A.C.
Management and administrative services rendered |
Peru
|
10/31/2017
|
100
|
%
|
F-141
Merged companies
|
Companies/Segment/Subsidiaries
|
Country
|
Date
|
Surviving company
|
|
Telefónica Spain
|
|||
|
Telefónica Telecomunicaciones Públicas, S.A.U.
Installation of public telephones |
Spain
|
05/29/2017
|
Telefónica de España, S.A.U.
|
|
Tuenti Technologies, S.L.
Telecommunications service provider |
Spain
|
10/31/2017
|
Telefónica Móviles España, S.A.U.
|
|
Iberbanda, S.A.
Broadband telecommunications operator |
Spain
|
10/31/2017
|
Telefónica de España, S.A.U.
|
|
Telefónica Studios S.L.
Audiovisual Productions |
Spain
|
09/30/2017
|
Telefónica
Audiovisual Digital, S.L.U. |
|
Telefónica Germany
|
|||
|
E-Plus Mobilfunk GmbH &Co. KG, GmbG
Wireless communications services operator |
Germany
|
07/31/2017
|
E-Plus Services GmbH
|
|
Telefónica Hispam Sur
|
|||
|
Compañía Internacional de Telecomunicaciones, S.A.
Holding company |
Argentina
|
05/31/2017
|
Telefónica Móviles Argentina, S.A.
|
|
Telefónica Móviles Argentina Holding, S.A.
Holding company |
Argentina
|
05/31/2017
|
Telefónica Móviles Argentina, S.A.
|
|
Telefónica Móviles Chile, S.A.
Wireless communications services operator |
Chile
|
05/31/2017
|
Inversiones Telefónica Móviles Holding, S.A.
|
|
Other companies
|
|||
|
Telefónica Datacorp, S.A.U
Holding company |
Spain
|
09/30/2017
|
Telefónica Latinoamérica Holding, S.L.
|
|
Eyeos, S.L
Cloud Computing |
Spain
|
09/30/2017
|
Telefónica Investigación y Desarrollo, S.A.U.
|
|
Telefónica International Wholesale Services, S.L.
International services provider |
Spain
|
12/31/2017
|
Telefónica International Wholesale Services II, S.L.
|
|
Wayra Ireland Ltd
Technological innovation based business project development |
Ireland
|
12/31/2017
|
Wayra Investigación y Desarrollo S.L
|
Companies liquidation
|
Companies/Segment/Subsidiaries
|
Country
|
Date of deconsolidated
|
% Participation
|
|
|
Other companies
|
||||
|
Saluspot Spain, S.L.
Medical services and articles through Internet provider |
Spain
|
12/31/2017
|
65
|
%
|
Operations with minority interests
|
Companies/Segment/Subsidiaries
|
Country
|
Date
|
% Participation after operation
|
|
|
Telefónica Germany
|
||||
|
Telefónica Deutschland Holding A.G
Exchange of shares with KPN |
Germany
|
03/31/2017
|
69.22
|
%
|
|
Other companies
|
||||
|
Telxius Telecom, S.A.
Sold to Taurus Bidco S.à.r.l. (“KKR”) |
Spain
|
12/31/2017
|
60
|
%
|
F-142
Appendix II: Board and Senior Management Compensation
TELEFÓNICA, S.A.
(Amounts in euros)
|
Directors
|
Salary
1
|
Fixed compen-sation
2
|
Attendance fees
3
|
Short-term variable compensation
4
|
Compensation for belonging to Committees of the Board
5
|
Other items
6
|
Total
|
|
Mr. José María Álvarez-Pallete López
|
1,923,100
|
—
|
—
|
3,478,888
|
—
|
5,794
|
5,407,782
|
|
Mr. Isidro Fainé Casas
|
—
|
200,000
|
—
|
—
|
80,000
|
—
|
280,000
|
|
Mr. José María Abril Pérez
|
—
|
200,000
|
9,000
|
—
|
91,200
|
—
|
300,200
|
|
Mr. Ángel Vilá Boix
|
1,600,000
|
—
|
—
|
2,412,000
|
—
|
16,960
|
4,028,960
|
|
Mr. Juan Ignacio Cirac Sasturain
|
—
|
120,000
|
10,000
|
—
|
11,200
|
—
|
141,200
|
|
Mr. José Javier Echenique Landiríbar
|
—
|
120,000
|
23,000
|
—
|
113,600
|
—
|
256,600
|
|
Mr. Peter Erskine
|
—
|
120,000
|
12,000
|
—
|
113,600
|
—
|
245,600
|
|
Ms. Sabina Fluxà Thienemann
|
—
|
120,000
|
9,000
|
—
|
11,200
|
—
|
140,200
|
|
Mr. Luiz Fernando Furlán
|
—
|
120,000
|
11,000
|
—
|
11,200
|
—
|
142,200
|
|
Ms. Carmen García de Andrés
|
—
|
120,000
|
16,000
|
—
|
22,400
|
—
|
158,400
|
|
Ms. María Luisa García Blanco
7
|
—
|
80,000
|
9,000
|
—
|
13,067
|
—
|
102,067
|
|
Mr. Jordi Gual Solé
7
|
—
|
110,000
|
16,000
|
—
|
20,533
|
—
|
146,533
|
|
Mr. Peter Löscher
|
—
|
120,000
|
13,000
|
—
|
24,267
|
—
|
157,267
|
|
Mr. Ignacio Moreno Martínez
|
—
|
120,000
|
25,000
|
—
|
44,800
|
—
|
189,800
|
|
Mr. Francisco Javier de Paz Mancho
|
—
|
120,000
|
35,000
|
—
|
124,800
|
—
|
279,800
|
|
Mr. Francisco José Riberas Mera
|
—
|
120,000
|
—
|
—
|
—
|
—
|
120,000
|
|
Mr. Wang Xiaochu
|
—
|
120,000
|
—
|
—
|
—
|
—
|
120,000
|
1 Salary: Regarding Mr José María Álvarez-Pallete López and Mr Ángel Vilá Boix, the amount includes the non-variable remuneration earned from their executive functions.
2 Fixed remuneration: Amount of the compensation in cash, with a pre-established payment periodicity, subject to consolidation over time or not, earned by the member for his/her position on the Board, regardless of the effective attendance of the member to board meetings.
3 Allowances: Total amount of allowances for attending Advisory or Steering Committee meetings.
4 Variable short-term remuneration (bonuses): Variable amount linked to the performance or achievement of a series of individual or group objectives (quantitative or qualitative) within a period of time equal to or less than a year, corresponding to the year 2018 and paid in the year 2019. In reference to the bonus corresponding to 2017, which was paid in 2018, Executive Board Member Mr José María Álvarez-Pallete López perceived
3,426,964
euros and Executive Board Member Mr Ángel Vilá Boix perceived
990,000
euros (Mr Vilá's bonus only included the amount accrued since his appointment as Director of the company, on July 26, 2017).
5 Remuneration for belonging to the Board Committees: Amount of items other than allowances, which the directors are beneficiaries through their position on the Executive Committee and the Advisory or Steering Committees, regardless of the effective attendance of the board member such Committee meetings.
6. Other concepts: This includes, among others, the amounts received as remuneration in kind (general medical and dental coverage and vehicle insurance), paid by Telefónica, S.A.
7 Mr Jordi Gual Solé was appointed Director of the company on January 31, 2018, and Ms María Luisa García Blanco was named Director on April 25, 2018, reflecting, therefore, the remuneration accrued and perceived, respectively, from the aforementioned dates.
F-143
Likewise, Ms Eva Castillo Sanz stood down as Board Member on April 25, 2018, reflecting below the payment received and accrued by her, in 2018 until the dates mentioned.
|
Directors
|
Salary
1
|
Fixed compen-sation
2
|
Attendance fees
3
|
Short-term variable compensation
4
|
Compensation for belonging to Committees of the Board
5
|
Other items
6
|
Total
|
|||||||
|
Ms. Eva Castillo Sanz
|
—
|
|
40,000
|
|
7,000
|
|
—
|
|
11,200
|
|
—
|
|
58,200
|
|
The following table breaks down the amounts accrued and/or received from other companies of the Telefónica Group other than Telefónica, S.A. individually, by the Board Members of the Company, by the performance of executive functions or by their membership to the Board of Directors of such companies:
F-144
OTHER COMPANIES OF THE TELEFÓNICA GROUP
(Amounts in euros)
|
Directors
|
Salary
1
|
Fixed compen-sation
2
|
Attendance fees
3
|
Short-term variable compensation
4
|
Compensation for belonging to Committees of the Board
5
|
Other items
6
|
Total
|
|
|
Mr. José María Álvarez-Pallete López
|
—
|
—
|
—
|
—
|
—
|
—
|
—
|
|
|
Mr. Isidro Fainé Casas
|
—
|
—
|
—
|
—
|
—
|
—
|
—
|
|
|
Mr. José María Abril Pérez
|
—
|
—
|
—
|
—
|
—
|
—
|
—
|
|
|
Mr. Ángel Vilá Boix
|
—
|
—
|
—
|
—
|
—
|
—
|
—
|
|
|
Mr. Juan Ignacio Cirac Sasturain
|
—
|
—
|
—
|
—
|
—
|
—
|
—
|
|
|
Mr. José Javier Echenique Landiríbar
|
—
|
104,652
|
—
|
—
|
—
|
—
|
104,652
|
|
|
Mr. Peter Erskine
|
—
|
20,000
|
—
|
—
|
—
|
—
|
20,000
|
|
|
Ms. Sabina Fluxà Thienemann
|
—
|
—
|
—
|
—
|
—
|
—
|
—
|
|
|
Mr. Luiz Fernando Furlán
|
—
|
85,366
|
—
|
—
|
—
|
—
|
85,366
|
|
|
Ms Carmen García de Andrés
|
—
|
—
|
—
|
—
|
—
|
—
|
—
|
|
|
Ms. María Luisa García Blanco
|
—
|
—
|
—
|
—
|
—
|
—
|
0
|
|
|
Mr. Jordi Gual Solé
|
—
|
—
|
—
|
—
|
—
|
—
|
0
|
|
|
Mr. Peter Löscher
|
—
|
—
|
—
|
—
|
—
|
—
|
—
|
|
|
Mr. Ignacio Moreno Martínez
|
—
|
—
|
—
|
—
|
—
|
—
|
—
|
|
|
Mr. Francisco Javier de Paz Mancho
|
—
|
260,440
|
—
|
—
|
—
|
—
|
260,440
|
|
|
Mr. Francisco José Riberas Mera
|
—
|
—
|
—
|
—
|
—
|
—
|
—
|
|
|
Mr. Wang Xiaochu
|
—
|
—
|
—
|
—
|
—
|
—
|
—
|
|
1 Salary: Amount of non-variable remuneration earned by the Director from other companies of the Telefónica Group for his/her executive functions.
2 Fixed remuneration: Amount of the compensation in cash, with a pre-established payment periodicity, subject to consolidation over time or not, earned by the member for his/her position on the boards of other companies of the Telefónica Group.
Herewith it is stated that Mr Ángel Vilá Boix received during the year 2018, for his position on the Supervisory Board of Telefónica Deutschland Holding, A.G. during 2017 (resigned from his office on October 4, 2017), an amount of
2,000
euros. Similarly, Mr Peter Erskine received during the 2018 fiscal year, for his position on the Supervisory Board of Telefónica Deutschland Holding, A.G. during 2017, an amount of
20,000
euros.
3 Allowances: Total amount of the allowances for attending the board meetings of other companies of the Telefónica Group.
4. Variable short-term remuneration (bonuses): Variable amount linked to the performance or achievement of a series of individual or group objectives (quantitative or qualitative) within a period of time equal to or less than a year, corresponding to the year 2018 and paid in the year 2019 by other companies of the Telefónica Group.
Remuneration for belonging to the Board Committees of other companies of the Telefónica Group: Amount of items other than allowances, which the directors are beneficiaries through their position on the Advisory or Steering Committees of other companies of the Telefónica Group, regardless of the effective attendance of the board member such Committee meetings.
6. Other concepts: This includes, among others, the amounts received as remuneration in kind (general medical and dental coverage and vehicle insurance), paid by other companies of the Telefónica Group.
Likewise, Ms Eva Castillo Sanz stood down as Board Member on April 25, 2018, reflecting below the payment accrued by her, in 2018 until the dates mentioned.
F-145
|
Directors
|
Salary
1
|
Fixed compen-sation
2
|
Attendance fees
3
|
Short-term variable compensation
4
|
Compensation for belonging to Committees of the Board
5
|
Other items
6
|
Total
|
|||||||
|
Ms Eva Castillo Sanz
|
—
|
|
26,849
|
|
—
|
|
—
|
|
—
|
|
—
|
|
26,849
|
|
1 to 6: Definitions of these concepts are those included in the previous table.
Herewith, it is stated that Ms. Eva Castillo Sanz received during the year 2018, for her position on the Supervisory Board of Telefónica Deutschland Holding, A.G. during 2017, an amount of
80,000
euros.
Additionally, as mentioned in the Remuneration Policy section, the Executive Board Members have a series of Assistance Services. Below, the contributions made during 2018 are detailed for the Company to long-term savings systems (Pension Plans and Social Welfare Plan):
LONG-TERM SAVINGS SYSTEMS
(Amounts in euros)
|
Directors
|
Contributions for fiscal year 2018
|
|
|
Mr. José María Álvarez-Pallete López
|
673,085
|
|
|
Mr. Ángel Vilá Boix
|
560,000
|
|
The breakdown of the long-term saving systems includes contributions to Pension Plans, to the Benefit Plan and to the Unit link-type Insurance, as set out below:
(Amounts in euros)
|
Directors
|
Contributions to Pension Plans
|
Contributions to Benefit Plan
1
|
Contributions to Unit link-type Insurance/Pension Plan Surplus
2
|
|
Mr. José María Álvarez-Pallete López
|
6,060
|
540,968
|
126,057
|
|
Mr. Ángel Vilá Boix
|
5,377
|
487,840
|
66,783
|
1 Contributions to the Executive Social Welfare Plan established in 2006, financed exclusively by the Company, to complement the current Pension Plan, which involves defined contributions equivalent to a certain percentage of the fixed remuneration of the Director, depending on the professional levels in the organization of the Telefónica Group.
2 Contributions to Unit link-type Insurance/Pension Plan Surplus: In 2015 applicable law reduced the financial and tax limits of the contributions to Pension Plans; for this reason, in order to compensate for the difference in favor of the Beneficiaries, a Unit-link type group insurance policy was arranged to channel such differences that occur during each fiscal year.
This Unit-link type insurance is arranged with the entity Seguros de Vida y Pensiones Antares, S.A., and covers the same contingencies as those of the “Pension Plan” and the same exceptional liquidity events in case of serious illness or long-term unemployment.
The 2018 amounts for life insurance premiums were as follows:
LIFE INSURANCE PREMIUMS
(Amounts in euros)
|
Directors
|
Life insurance premiums
|
|
|
Mr. José María Álvarez-Pallete López
|
13,176
|
|
|
Mr. Ángel Vilá Boix
|
14,116
|
|
F-146
As regards to remuneration plans based on shares (exclusively involving Executive Directors), the following two long-term variable remuneration plans were in existence during the year 2018:
1.-
The so-called "Performance & Investment Plan" ("PIP")
, made up of three cycles (2014-2017; 2015-2018; 2016-2019), approved by the General Shareholders' Meeting held on May 30, 2014, which has already ended.
The first cycle of this Plan began in 2014 and concluded in October 2017. The second cycle of this Plan began in 2015 and concluded in October 2018. In accordance with the provisions of its terms and conditions, the delivery of shares did not proceed for the first and second cycle of the Plan (2014-2017; 2015-2018), so no shares were delivered to the Executive Directors participating in these cycles.
As for the third cycle of this Plan (2016-2019), the Company's Board of Directors, following a favorable report from the Appointments, Remuneration and Good Governance Committee, agreed not to execute nor implement the plan as it was not sufficiently aligned with the Telefónica Group’s strategic plan, taking into account the circumstances and the macroeconomic situation.
2.-
The so-called "Performance Share Plan" ("PSP")
, made up of three cycles (2018-2020; 2019-2021; 2020-2022), approved by the General Shareholders' Meeting held on June 8, 2018. The first cycle began on January 1, 2018 (with delivery of the corresponding shares in 2021), the second cycle began January 1, 2019 (with delivery of the corresponding shares in 2022), and the third will begin January 1, 2020 (with delivery of the corresponding shares in 2023).
It is hereby stated in following the maximum number of shares assigned if maximum compliance with the TSR ("Total Shareholder Return") and FCF ("Free Cash Flow") targets set for the first and second cycle of the Plan.
PSP - First Cycle / 2018-2020
|
Directors
|
Maximum number of shares (*)
|
|
Mr. José María Álvarez-Pallete López
|
421,000
|
|
Mr. Ángel Vilá Boix
|
312,000
|
(*) Maximum possible number of shares to be received in case of maximum completion of FCF and TSR target.
PSP - Second Cycle / 2019-2021
(shares allocate in February 2019)
|
Directors
|
Maximum number of shares (*)
|
|
Mr. José María Álvarez-Pallete López
|
468,000
|
|
Mr. Ángel Vilá Boix
|
347,000
|
(
*) Maximum possible number of shares to be received in case of maximum completion of FCF and TSR target.
In
any case, herewith it is stated that no shares have been delivered to the Executive Directors under the first and second cycle of the PSP and that the above tables only reflect the potentially deliverable number of shares, without this in any way implying all or part thereof will be effectively delivered.
Indeed, the number of Telefónica, S.A. shares that, always within the established maximum, could be delivered, where appropriate, to the participants is conditioned and determined by the established goals:
50%
% of the compliance with the targets set out for Total Shareholder Return ("TSR") on Telefónica, S.A. shares and
50%
of the Free Cash Flow (the "FCF") of the Telefónica Group.
To determine compliance with the TSR target and calculate the specific number of shares to be delivered for this concept, the evolution of the TSR of Telefónica, S.A. shares will be measured during the period of the duration of each three-year cycle in relation to the TSR experienced by certain companies belonging to the telecommunications sector, weighted according to their relevance for Telefónica, S.A., which for the purposes of the Plan will constitute the comparison group (hereinafter the "Comparison Group"). The companies included in the comparison group are listed below: América Móvil, BT Group, Deutsche Telekom, Orange, Telecom Italy, Vodafone Group, Proximus, Royal KPN, Millicom, Swisscom, Telenor, TeliaSonera, and Tim Participações.
F-147
With regard to compliance with the TSR target, the Plan foresees that the number of shares to be delivered in relation to the fulfillment of this objective will range between
15%
of the number of theoretical shares assigned, in the event that the evolution of the TSR of the Telefónica, S.A. share is found within, at least, the mean of the Comparison Group, and
50%
in the case that the evolution is placed in the third quartile or higher of the comparison group, by calculating the percentage by linear interpolation for cases which are situated between the mean and the third quartile.
To determine completion of the FCF target and calculate the specific number of shares to be delivered under this concept, the level of FCF generated by the Telefónica Group during each year will be measured against the value set in the budgets approved by the Board of Directors for each financial year.
In relation to the FCF, at the beginning of each cycle, a scale of achievement will be determined that will include a minimum threshold below which an incentive is not paid and whose compliance will require the delivery of
25%
of the assigned theoretical shares, and a maximum level, which will involve the delivery of
50%
of the assigned theoretical shares.
At least
25%
of the shares are delivered under the Plan to the Executive Directors and other participants determined by the Board of Directors shall be subject to a one-year retention.
In addition, it should be noted that the external directors of the company do not perceive nor have perceived remuneration during the year 2018 in concept of pensions or life insurance, nor do they participate in compensation plans referenced to the value of the share price.
Furthermore, the company does not grant nor has granted during the year 2018, an advance, loan or credit in favor of its Board Members or its Senior Management, complying with the requirements of the Sarbanes-Oxley Act published in the United States, which is applicable to Telefónica as a listed company in this market.
F-148
Remuneration of the Company’s Senior Management.
As for the Directors who made up the Senior Management
1
of the company in the year 2018, excluding those who form an integral part of the Board of Directors, have accrued
2
a total amount of
7,966,605
euros during the 2018 fiscal year.
In addition, and in terms of long-term savings systems, the contributions made by the Telefónica Group during the year 2018 to the Social Security Plan described in the "Income and expenditure" note with regard to these directors increased to
854,125
euros; the contributions corresponding to the Pension Plan increased to
21,508
euros; the contributions to the Seguro Unit link-Excess Pension Fund increased to
107,493
euros.
Furthermore, the amount related to the remuneration in kind (which includes the fees for life insurance and other insurance, such as the general medical and dental coverage, and vehicle insurance) was
95,256
euros.
On the other hand, regarding share-based remuneration plans, during the year 2018, there were the following two long-term variable remuneration plans:
1.-
The so-called "Performance & Investment Plan" ("PIP")
, made up of three cycles (2014-2017; 2015-2018; 2016-2019), approved by the General Shareholders' Meeting held on May 30, 2014, which has already ended.
The first cycle of this Plan began in 2014 and concluded in October 2017. The second cycle of this Plan began in 2015 and concluded in October 2018. In accordance with the provisions of its terms and conditions, the delivery of shares did not proceed for the first and second cycle of the Plan (2014-2017; 2015-2018), so no shares were delivered to the Directors participating in these cycles.
As for the third cycle of this Plan (2016-2019), the company's Board of Directors, following a favorable report from the Appointments, Remuneration and Good Governance Committee, agreed not to execute nor implement the plan as it was not sufficiently aligned with the Telefónica Group’s strategic plan, taking into account the circumstances and the macroeconomic situation.
2.-
The so-called "Performance Share Plan" ("PSP")
, made up of three cycles (2018-2020; 2019-2021; 2020-2022), approved by the General Shareholders' Meeting held on June 8, 2018. The first cycle of this Plan began in 2018 and will conclude December 31, 2020. The maximum number of shares assigned in the event of maximum compliance with the TSR ("Total Shareholder Return") and FCF ("Free Cash Flow") target, at the beginning of the first cycle (2018-2020) to the group of directors forming part of the company's senior management was of
491,570
.
The second cycle of this Plan began in 2019 and will conclude December 31, 2021. The maximum number of shares assigned in the event of maximum compliance with the TSR ("Total Shareholder Return") and FCF ("Free Cash Flow") target, at the beginning of the second cycle (2019-2021) to the group of Directors part of the company's Senior Management was
545,591
.
1
Senior Management being understood, for these purposes, those persons that implement, de facto or de jure, senior management duties reporting directly to the Board of Directors or Executive Committees or Managing Directors of the Company, including in any case the supervisor of Internal Auditing.
2
Similarly, herewith it is stated that the amount perceived in the year 2018 by the directors forming part of the company's Senior Management, excluding those on the Board of Directors, was
19,221,735
euros. This amount includes the remuneration perceived by Mr Ramiro Sánchez de Lerín García-Ovies, former Secretary-General and Secretary of the Board of Directors of Telefónica, S.A., until the date of his disengagement from the company, including the compensation perceived as a result of his removal.
F-149
Appendix III: Debentures and bonds
The detail and key features of outstanding debentures and bonds at December 31, 2018 are as follows (in millions of euros):
|
Total Telefónica and its instrumental companies
|
|||||||||||||||||
|
|
|
|
|
Maturity (nominal)
|
|||||||||||||
|
Debentures and bonds
|
Currency
|
% Interest rate
|
|
2019
|
|
2020
|
|
2021
|
|
2022
|
|
2023
|
|
Subsequent years
|
|
Total
|
|
|
T. EUROPE BV SEP_00 BOND GLOBAL D
|
USD
|
8.250
|
%
|
—
|
|
—
|
|
—
|
|
—
|
|
—
|
|
1,070
|
|
1,070
|
|
|
TEBV FEB_03 EMTN FIXED TRANCHE B
|
EUR
|
5.875
|
%
|
—
|
|
—
|
|
—
|
|
—
|
|
—
|
|
500
|
|
500
|
|
|
Telefónica Europe, B.V.
|
|
—
|
|
—
|
|
—
|
|
—
|
|
—
|
|
1,570
|
|
1,570
|
|
||
|
EMTN O2 GBP
|
GBP
|
5.375
|
%
|
—
|
|
—
|
|
—
|
|
—
|
|
—
|
|
559
|
|
559
|
|
|
TELEF EMISIONES JUNE 06 TRANCHE D
|
USD
|
7.045
|
%
|
—
|
|
—
|
|
—
|
|
—
|
|
—
|
|
1,746
|
|
1,746
|
|
|
TELEF EMISIONES JANUARY 07 A
|
EUR
|
1 x EURIBOR6M + 0,83000%
|
|
—
|
|
—
|
|
55
|
|
—
|
|
—
|
|
—
|
|
55
|
|
|
TELEF EMISIONES MAY 2014
|
EUR
|
2.242
|
%
|
—
|
|
—
|
|
—
|
|
1,250
|
|
—
|
|
—
|
|
1,250
|
|
|
TELEF EMISIONES JULY 15, 2019
|
USD
|
5.877
|
%
|
873
|
|
—
|
|
—
|
|
—
|
|
—
|
|
—
|
|
873
|
|
|
TELEF EMISIONES NOVEMBER 11, 2019
|
EUR
|
4.693
|
%
|
1,750
|
|
—
|
|
—
|
|
—
|
|
—
|
|
—
|
|
1,750
|
|
|
EMTN GBP 12/09/2022 650 GBP
|
GBP
|
5.289
|
%
|
—
|
|
—
|
|
—
|
|
726
|
|
—
|
|
—
|
|
726
|
|
|
TELE EMISIONES APRIL 2010
|
USD
|
5.134
|
%
|
—
|
|
1,222
|
|
—
|
|
—
|
|
—
|
|
—
|
|
1,222
|
|
|
EMTN GBP 10/08/2029 400 GBP
|
GBP
|
5.445
|
%
|
—
|
|
—
|
|
—
|
|
—
|
|
—
|
|
447
|
|
447
|
|
|
TELEF EMISIONES FEBRUARY 2011
|
USD
|
5.462
|
%
|
—
|
|
—
|
|
1,310
|
|
—
|
|
—
|
|
—
|
|
1,310
|
|
|
TELEF. EMISIONES FEBRUARY 2012
|
GBP
|
5.597
|
%
|
—
|
|
782
|
|
—
|
|
—
|
|
—
|
|
—
|
|
782
|
|
|
TELEF. EMISIONES OCTOBER 2012
|
EUR
|
4.710
|
%
|
—
|
|
1,200
|
|
—
|
|
—
|
|
—
|
|
—
|
|
1,200
|
|
|
TELEF. EMISIONES DECEMBER 2012
|
CHF
|
3.450
|
%
|
—
|
|
—
|
|
—
|
|
133
|
|
—
|
|
—
|
|
133
|
|
|
TELEF EMISIONES JANUARY 2013
|
EUR
|
3.987
|
%
|
—
|
|
—
|
|
—
|
|
—
|
|
1,500
|
|
—
|
|
1,500
|
|
|
TELEF. EMISIONES MARCH 2013
|
EUR
|
3.961
|
%
|
—
|
|
—
|
|
1,000
|
|
—
|
|
—
|
|
—
|
|
1,000
|
|
|
TELEF EMISIONES APRIL 2013
|
USD
|
4.570
|
%
|
—
|
|
—
|
|
—
|
|
—
|
|
655
|
|
—
|
|
655
|
|
|
TELEF. EMISIONES MAY 2013
|
EUR
|
2.736
|
%
|
750
|
|
—
|
|
—
|
|
—
|
|
—
|
|
—
|
|
750
|
|
|
TELEF. EMISIONES OCTOBER 2013
|
CHF
|
2.595
|
%
|
—
|
|
200
|
|
—
|
|
—
|
|
—
|
|
—
|
|
200
|
|
|
TELEF. EMISIONES OCTOBER 2014
|
EUR
|
2.932
|
%
|
—
|
|
—
|
|
—
|
|
—
|
|
—
|
|
800
|
|
800
|
|
F-150
|
Total Telefónica and its instrumental companies (cont.)
|
|||||||||||||||||
|
|
|
|
|
Maturity (nominal)
|
|||||||||||||
|
Debentures and bonds
|
Currency
|
% Interest rate
|
|
2019
|
|
2020
|
|
2021
|
|
2022
|
|
2023
|
|
Subsequent years
|
|
Total
|
|
|
TELEF EMISIONES JULY 2015
|
EUR
|
1 x EURIBOR6M +0,83%
|
|
—
|
|
—
|
|
—
|
|
67
|
|
—
|
|
—
|
|
67
|
|
|
TELEF. EMISIONES SEPTEMBER 2015
|
EUR
|
1.477
|
%
|
—
|
|
—
|
|
1,000
|
|
—
|
|
—
|
|
—
|
|
1,000
|
|
|
TELEF EMISIONES APRIL 2016
|
EUR
|
0.750
|
%
|
—
|
|
—
|
|
—
|
|
1,400
|
|
—
|
|
—
|
|
1,400
|
|
|
TELEF EMISIONES APRIL 2016
|
EUR
|
1.460
|
%
|
—
|
|
—
|
|
—
|
|
—
|
|
—
|
|
1,350
|
|
1,350
|
|
|
TELEF. EMISIONES OCTOBER 2016
|
EUR
|
0.318
|
%
|
—
|
|
1,250
|
|
—
|
|
—
|
|
—
|
|
—
|
|
1,250
|
|
|
TELEF. EMISIONES OCTOBER 2016
|
EUR
|
1.930
|
%
|
—
|
|
—
|
|
—
|
|
—
|
|
—
|
|
750
|
|
750
|
|
|
TELEF. EMISIONES DECEMBER 2016
|
EUR
|
4.000
|
%
|
—
|
|
—
|
|
—
|
|
—
|
|
—
|
|
150
|
|
150
|
|
|
TELEF. EMISIONES JANUARY 2017
|
EUR
|
1 x EURIBOR3M +0,40%
|
|
150
|
|
—
|
|
—
|
|
—
|
|
—
|
|
—
|
|
150
|
|
|
TELEF. EMISIONES JANUARY 2017
|
EUR
|
1.528
|
%
|
—
|
|
—
|
|
—
|
|
—
|
|
—
|
|
1,250
|
|
1,250
|
|
|
TELEF. EMISIONES JANUARY 2017
|
EUR
|
2.318
|
%
|
—
|
|
—
|
|
—
|
|
—
|
|
—
|
|
500
|
|
500
|
|
|
TELEF. EMISIONES MARCH 2017
|
USD
|
4.103
|
%
|
—
|
|
—
|
|
—
|
|
—
|
|
—
|
|
1,310
|
|
1,310
|
|
|
TELEF. EMISIONES MARCH 2017
|
USD
|
5.213
|
%
|
—
|
|
—
|
|
—
|
|
—
|
|
—
|
|
1,746
|
|
1,746
|
|
|
TELEF. EMISIONES MARCH 2017
|
EUR
|
2.318
|
%
|
—
|
|
—
|
|
—
|
|
—
|
|
—
|
|
200
|
|
200
|
|
|
TELEF. EMISIONES APRIL 2017
|
USD
|
4.900
|
%
|
—
|
|
—
|
|
—
|
|
—
|
|
—
|
|
175
|
|
175
|
|
|
TELEF. EMISIONES APRIL 2017
|
USD
|
5.213
|
%
|
—
|
|
—
|
|
—
|
|
—
|
|
—
|
|
437
|
|
437
|
|
|
TELEF. EMISIONES SEPTEMBER 2017
|
EUR
|
1.715
|
%
|
—
|
|
—
|
|
—
|
|
—
|
|
—
|
|
1,250
|
|
1,250
|
|
|
TELEF. EMISIONES JANUARY 2018
|
EUR
|
1.447
|
%
|
—
|
|
—
|
|
—
|
|
—
|
|
—
|
|
1,000
|
|
1,000
|
|
|
TELEF. EMISIONES MARCH 2018
|
USD
|
4.895
|
%
|
—
|
|
—
|
|
—
|
|
—
|
|
—
|
|
1,091
|
|
1,091
|
|
|
TELEF. EMISIONES MARCH 2018
|
USD
|
4.665
|
%
|
—
|
|
—
|
|
—
|
|
—
|
|
—
|
|
655
|
|
655
|
|
|
TELEF. EMISIONES SEPTEMBER 2018
|
EUR
|
1.495
|
%
|
—
|
|
—
|
|
—
|
|
—
|
|
—
|
|
1,000
|
|
1,000
|
|
|
Telefónica Emisiones, S.A.U.
|
|
3,523
|
|
4,654
|
|
3,365
|
|
3,576
|
|
2,155
|
|
16,416
|
|
33,689
|
|
||
|
Exchangeable Bond MARCH 2016 (*)
|
EUR
|
—
|
|
—
|
|
—
|
|
600
|
|
—
|
|
—
|
|
—
|
|
600
|
|
|
Telefónica Participaciones
|
|
—
|
|
—
|
|
—
|
|
600
|
|
—
|
|
—
|
|
—
|
|
600
|
|
|
Total Telefónica, S.A. and its instrumental companies
|
|
3,523
|
|
4,654
|
|
3,965
|
|
3,576
|
|
2,155
|
|
17,986
|
|
35,859
|
|
||
|
(*) Issue of non-dilutive cash-settled equity-linked bonds referenced to Telefónica share price, with a nominal amount of 600 million euros, issue price of 101.25% and maturing in March 2021.
|
|||||||||||||||||
|
Foreign operators
|
|||||||||||||||||
|
|
|
|
|
Maturity
|
|||||||||||||
|
Debentures and bonds
|
Currency
|
% Interest rate
|
|
2019
|
|
2020
|
|
2021
|
|
2022
|
|
2023
|
|
Subsequent years
|
|
Total
|
|
|
Bond Q
|
CLP
|
5.750
|
%
|
59
|
|
—
|
|
—
|
|
—
|
|
—
|
|
—
|
|
59
|
|
|
Bond T
|
CLP
|
4.900
|
%
|
—
|
|
12
|
|
24
|
|
—
|
|
24
|
|
—
|
|
60
|
|
|
144A Bond
|
USD
|
3.875
|
%
|
—
|
|
—
|
|
—
|
|
437
|
|
—
|
|
—
|
|
437
|
|
|
Telefónica Chile, S.A.
|
|
59
|
|
12
|
|
24
|
|
437
|
|
24
|
|
—
|
|
556
|
|
||
|
Bond F
|
UF
|
3.600
|
%
|
—
|
|
—
|
|
—
|
|
—
|
|
104
|
|
—
|
|
104
|
|
|
Bond G
|
UF
|
2.200
|
%
|
—
|
|
69
|
|
—
|
|
—
|
|
—
|
|
—
|
|
69
|
|
|
Bond I
|
UF
|
1.950
|
%
|
—
|
|
69
|
|
—
|
|
—
|
|
—
|
|
—
|
|
69
|
|
|
Bond K
|
CLP
|
4.900
|
%
|
—
|
|
—
|
|
119
|
|
—
|
|
—
|
|
—
|
|
119
|
|
F-151
|
Foreign operators (cont.)
|
|||||||||||||||||
|
|
|
|
|
Maturity
|
|||||||||||||
|
Debentures and bonds
|
Currency
|
% Interest rate
|
|
2019
|
|
2020
|
|
2021
|
|
2022
|
|
2023
|
|
Subsequent years
|
|
Total
|
|
|
Telefónica Móviles Chile, S.A.
|
|
—
|
|
138
|
|
119
|
|
—
|
|
104
|
|
—
|
|
361
|
|
||
|
T. Finanzas Mex 0710 FIX
|
MXN
|
8.070
|
%
|
—
|
|
89
|
|
—
|
|
—
|
|
—
|
|
—
|
|
89
|
|
|
Telefónica Finanzas México, S.A.
|
|
—
|
|
89
|
|
—
|
|
—
|
|
—
|
|
—
|
|
89
|
|
||
|
Bond T. Peru 4th Program (19th Serie A)
|
N. SOL
|
VAC + 3.625%
|
|
—
|
|
—
|
|
—
|
|
—
|
|
—
|
|
22
|
|
22
|
|
|
Bond T. Peru 4th Program (12th Serie A)
|
N. SOL
|
VAC + 3.6875%
|
|
22
|
|
—
|
|
—
|
|
—
|
|
—
|
|
—
|
|
22
|
|
|
Bond T. Peru 4th Program (19th Serie B)
|
N. SOL
|
VAC + 2.8750%
|
|
—
|
|
—
|
|
—
|
|
—
|
|
—
|
|
17
|
|
17
|
|
|
Bond T. Peru 4th Program (37th Serie A)
|
N. SOL
|
VAC + 3.1250%
|
|
—
|
|
—
|
|
—
|
|
—
|
|
—
|
|
17
|
|
17
|
|
|
Bond T. Peru 4th Program (19th Serie C)
|
N. SOL
|
VAC + 3.1875%
|
|
—
|
|
—
|
|
—
|
|
—
|
|
—
|
|
7
|
|
7
|
|
|
Bond T. Peru 5th Program (22nd Serie Ab)
|
N. SOL
|
VAC + 3.5000%
|
|
4
|
|
—
|
|
—
|
|
—
|
|
—
|
|
—
|
|
4
|
|
|
Bond T. Peru 5th Program (22nd Serie Ac)
|
N. SOL
|
VAC + 3.5000%
|
|
—
|
|
—
|
|
8
|
|
—
|
|
—
|
|
—
|
|
8
|
|
|
Bond T. Peru 6th Program (17th Serie A)
|
N. SOL
|
VAC + 3.09375%
|
|
—
|
|
—
|
|
—
|
|
—
|
|
—
|
|
16
|
|
16
|
|
|
Bond T. Peru 7th Program (27th Serie A)
|
N. SOL
|
5.531
|
%
|
13
|
|
—
|
|
—
|
|
—
|
|
—
|
|
—
|
|
13
|
|
|
Bond T. Peru 6th Program (11th Serie A)
|
N. SOL
|
6.656
|
%
|
—
|
|
—
|
|
—
|
|
—
|
|
67
|
|
—
|
|
67
|
|
|
Bond T. Peru 6th Program (11th Serie B)
|
N. SOL
|
6.188
|
%
|
—
|
|
—
|
|
—
|
|
—
|
|
—
|
|
31
|
|
31
|
|
|
Bond T. Peru 6th Program (12th Serie A)
|
N. SOL
|
5.063
|
%
|
—
|
|
28
|
|
—
|
|
—
|
|
—
|
|
—
|
|
28
|
|
|
Bond T. Peru 6th Program (13th Serie A)
|
N. SOL
|
5.500
|
%
|
—
|
|
—
|
|
—
|
|
36
|
|
—
|
|
—
|
|
36
|
|
|
Bond T. Peru 6th Program (14th Serie A)
|
N. SOL
|
5.344
|
%
|
—
|
|
—
|
|
—
|
|
26
|
|
—
|
|
—
|
|
26
|
|
|
Bond T. Peru 6th Program (15th Serie A)
|
N. SOL
|
5.469
|
%
|
—
|
|
—
|
|
—
|
|
—
|
|
—
|
|
35
|
|
35
|
|
|
Bond T. Peru 6th Program (16th Serie A)
|
N. SOL
|
5.500
|
%
|
—
|
|
—
|
|
—
|
|
—
|
|
—
|
|
27
|
|
27
|
|
|
Bond T. Peru 6th Program (12th Serie B)
|
N. SOL
|
4.188
|
%
|
—
|
|
—
|
|
18
|
|
—
|
|
—
|
|
—
|
|
18
|
|
|
Bond T. Peru 1st Private Program (1st Serie A)
|
N. SOL
|
7.281
|
%
|
—
|
|
—
|
|
—
|
|
—
|
|
—
|
|
21
|
|
21
|
|
|
Telefónica del Perú, S.A.
|
|
39
|
|
28
|
|
26
|
|
62
|
|
67
|
|
193
|
|
415
|
|
||
|
Nonconvertible bonds
|
BRL
|
1,0825 XCDI
|
|
—
|
|
—
|
|
225
|
|
225
|
|
—
|
|
—
|
|
450
|
|
|
Nonconvertible bonds
|
BRL
|
1,0 XCDI + 0,24%
|
|
—
|
|
225
|
|
—
|
|
—
|
|
—
|
|
—
|
|
225
|
|
|
Nonconvertible bonds
|
BRL
|
1 XIPXA +4
|
|
7
|
|
—
|
|
—
|
|
—
|
|
—
|
|
—
|
|
7
|
|
|
Nonconvertible bonds (Telemig) I
|
BRL
|
IPCA + 0,5%
|
|
—
|
|
—
|
|
—
|
|
—
|
|
—
|
|
—
|
|
—
|
|
|
Nonconvertible bonds (Telemig) II
|
BRL
|
IPCA + 0,5%
|
|
1
|
|
1
|
|
1
|
|
—
|
|
—
|
|
—
|
|
3
|
|
|
Nonconvertible bonds (Telemig) III
|
BRL
|
IPCA + 0,5%
|
|
2
|
|
2
|
|
2
|
|
—
|
|
—
|
|
—
|
|
6
|
|
|
Telefônica Brasil, S.A.
|
|
10
|
|
228
|
|
228
|
|
225
|
|
—
|
|
—
|
|
691
|
|
||
|
BOND R144-A
|
USD
|
5.375
|
%
|
—
|
|
—
|
|
—
|
|
638
|
|
—
|
|
—
|
|
638
|
|
|
Colombia Telecomunicaciones, S.A, ESP
|
|
—
|
|
—
|
|
—
|
|
638
|
|
—
|
|
—
|
|
638
|
|
||
|
Bond
|
EUR
|
2.375
|
%
|
—
|
|
—
|
|
500
|
|
—
|
|
—
|
|
—
|
|
500
|
|
|
Bond
|
EUR
|
1.750
|
%
|
—
|
|
—
|
|
—
|
|
—
|
|
—
|
|
600
|
|
600
|
|
|
O2 Telefónica Deutschland Finanzierungs, GmbH
|
|
|
|
—
|
|
—
|
|
500
|
|
—
|
|
—
|
|
600
|
|
1,100
|
|
|
Total Outstanding Debentures and Bonds Foreign operators
|
|
|
|
108
|
|
495
|
|
897
|
|
1,362
|
|
195
|
|
793
|
|
3,850
|
|
|
Total Outstanding Debentures and Bonds
|
|
|
|
3,631
|
|
5,149
|
|
4,862
|
|
4,938
|
|
2,350
|
|
18,779
|
|
39,709
|
|
F-152
The main debentures and bonds issued by the Group in 2018 are as follows:
|
|
|
|
Nominal (millions)
|
|
|
||||
|
Item
|
Date
|
Maturity Date
|
Currency
|
|
Euros
|
|
Currency of issuance
|
Coupon
|
|
|
Telefónica Emisiones, S.A.U.
|
|
|
|
|
|
|
|||
|
EMTN BOND
|
01/22/2018
|
01/22/2027
|
1,000
|
|
1,000
|
|
EUR
|
1.447
|
%
|
|
SHELF BOND
|
03/06/2018
|
03/06/2038
|
750
|
|
655
|
|
USD
|
4.665
|
%
|
|
SHELF BOND
|
03/06/2018
|
03/06/2048
|
1,250
|
|
1,091
|
|
USD
|
4.895
|
%
|
|
EMTN BOND
|
09/11/2018
|
09/11/2025
|
1,000
|
|
1,000
|
|
EUR
|
1.495
|
%
|
|
O2 Telefónica Deutschland Finanzierungs GmbH
|
|
|
|
|
|
|
|
|
|
|
BOND
|
07/05/2018
|
07/05/2025
|
600
|
|
600
|
|
EUR
|
1.750
|
%
|
F-153
Appendix IV: Financial instruments
The detail of the type of financial instruments arranged by the Group (notional amount) by currency and interest rates at December 31, 2018 is as follows:
|
|
|
|
|
|
|
|
|
Fair value
|
||||||||||||
|
Millions of Euros
|
2019
|
|
2020
|
|
2021
|
|
2022
|
|
2023
|
|
Subsequent years
|
|
Notional
|
|
Underlying debt
|
|
Associated derivatives
|
|
TOTAL
|
|
|
Euro
|
(2,534
|
)
|
6,271
|
|
6,637
|
|
3,652
|
|
2,890
|
|
19,487
|
|
36,403
|
|
25,093
|
|
11,987
|
|
37,080
|
|
|
Floating rate
|
6,195
|
|
156
|
|
3,037
|
|
670
|
|
1,903
|
|
2,750
|
|
14,711
|
|
2,820
|
|
11,936
|
|
14,756
|
|
|
Spread
|
1.77
|
%
|
(1.92
|
%)
|
(0.20
|
%)
|
0.22
|
%
|
0.01
|
%
|
0.18
|
%
|
0.73
|
%
|
—
|
|
—
|
|
—
|
|
|
Fixed rate
|
(8,729
|
)
|
6,115
|
|
3,600
|
|
2,982
|
|
987
|
|
16,737
|
|
21,692
|
|
22,273
|
|
51
|
|
22,324
|
|
|
Interest rate
|
0.18
|
%
|
3.17
|
%
|
1.86
|
%
|
1.59
|
%
|
3.24
|
%
|
1.80
|
%
|
2.89
|
%
|
—
|
|
—
|
|
—
|
|
|
Rate cap
|
—
|
|
—
|
|
—
|
|
—
|
|
—
|
|
—
|
|
—
|
|
—
|
|
—
|
|
—
|
|
|
Other european currencies
|
||||||||||||||||||||
|
Instruments in CZK
|
(67
|
)
|
—
|
|
—
|
|
—
|
|
—
|
|
—
|
|
(67
|
)
|
—
|
|
(66
|
)
|
(66
|
)
|
|
Floating rate
|
—
|
|
—
|
|
—
|
|
—
|
|
—
|
|
—
|
|
—
|
|
—
|
|
—
|
|
—
|
|
|
Spread
|
—
|
|
—
|
|
—
|
|
—
|
|
—
|
|
—
|
|
—
|
|
—
|
|
—
|
|
—
|
|
|
Fixed rate
|
(67
|
)
|
—
|
|
—
|
|
—
|
|
—
|
|
—
|
|
(67
|
)
|
—
|
|
(66
|
)
|
(66
|
)
|
|
Interest rate
|
—
|
|
—
|
|
—
|
|
—
|
|
—
|
|
—
|
|
—
|
|
—
|
|
—
|
|
—
|
|
|
Rate cap
|
—
|
|
—
|
|
—
|
|
—
|
|
—
|
|
—
|
|
—
|
|
—
|
|
—
|
|
—
|
|
|
Instruments in GBP
|
2,102
|
|
(398
|
)
|
56
|
|
727
|
|
—
|
|
1,006
|
|
3,493
|
|
1,870
|
|
1,702
|
|
3,572
|
|
|
Floating rate
|
(532
|
)
|
(436
|
)
|
134
|
|
861
|
|
(445
|
)
|
447
|
|
29
|
|
(1
|
)
|
28
|
|
27
|
|
|
Spread
|
—
|
|
—
|
|
—
|
|
—
|
|
—
|
|
—
|
|
—
|
|
—
|
|
—
|
|
—
|
|
|
Fixed rate
|
2,634
|
|
38
|
|
(78
|
)
|
(246
|
)
|
445
|
|
559
|
|
3,352
|
|
1,759
|
|
1,674
|
|
3,433
|
|
|
Interest rate
|
0.75
|
%
|
75.89
|
%
|
0.03
|
%
|
(1.71
|
%)
|
1.11
|
%
|
5.38
|
%
|
2.62
|
%
|
—
|
|
—
|
|
—
|
|
|
Rate cap
|
—
|
|
—
|
|
—
|
|
112
|
|
—
|
|
—
|
|
112
|
|
112
|
|
—
|
|
112
|
|
|
Instruments in CHF
|
—
|
|
—
|
|
—
|
|
—
|
|
—
|
|
—
|
|
—
|
|
366
|
|
(367
|
)
|
(1
|
)
|
|
Floating rate
|
—
|
|
—
|
|
—
|
|
—
|
|
—
|
|
—
|
|
—
|
|
—
|
|
(1
|
)
|
(1
|
)
|
|
Spread
|
—
|
|
—
|
|
—
|
|
—
|
|
—
|
|
—
|
|
—
|
|
—
|
|
—
|
|
—
|
|
|
Fixed rate
|
—
|
|
—
|
|
—
|
|
—
|
|
—
|
|
—
|
|
—
|
|
366
|
|
(366
|
)
|
—
|
|
|
Interest rate
|
—
|
|
—
|
|
—
|
|
—
|
|
—
|
|
—
|
|
—
|
|
—
|
|
—
|
|
—
|
|
|
Rate cap
|
—
|
|
—
|
|
—
|
|
—
|
|
—
|
|
—
|
|
—
|
|
—
|
|
—
|
|
—
|
|
|
America
|
||||||||||||||||||||
|
Instruments in USD
|
(643
|
)
|
(123
|
)
|
(1,466
|
)
|
779
|
|
10
|
|
1,944
|
|
501
|
|
19,103
|
|
(18,481
|
)
|
622
|
|
|
Floating rate
|
(132
|
)
|
(116
|
)
|
(1,466
|
)
|
796
|
|
10
|
|
1,941
|
|
1,033
|
|
612
|
|
(171
|
)
|
441
|
|
|
Spread
|
(0.42
|
%)
|
(0.38
|
%)
|
(0.19
|
%)
|
0.10
|
%
|
7.92
|
%
|
0.02
|
%
|
0.55
|
%
|
—
|
|
—
|
|
—
|
|
|
Fixed rate
|
(511
|
)
|
(7
|
)
|
—
|
|
(17
|
)
|
—
|
|
3
|
|
(532
|
)
|
18,491
|
|
(18,310
|
)
|
181
|
|
|
Interest rate
|
(2.81
|
%)
|
(222.91
|
%)
|
—
|
|
(186.47
|
%)
|
—
|
|
5.79
|
%
|
(11.86
|
%)
|
—
|
|
—
|
|
—
|
|
|
Rate cap
|
—
|
|
—
|
|
—
|
|
—
|
|
—
|
|
—
|
|
—
|
|
—
|
|
—
|
|
—
|
|
|
Instruments in UYU
|
(5
|
)
|
—
|
|
—
|
|
—
|
|
—
|
|
—
|
|
(5
|
)
|
(6
|
)
|
4
|
|
(2
|
)
|
|
Floating rate
|
—
|
|
—
|
|
—
|
|
—
|
|
—
|
|
—
|
|
—
|
|
—
|
|
—
|
|
—
|
|
|
Spread
|
—
|
|
—
|
|
—
|
|
—
|
|
—
|
|
—
|
|
—
|
|
—
|
|
—
|
|
—
|
|
|
Fixed rate
|
(5
|
)
|
—
|
|
—
|
|
—
|
|
—
|
|
—
|
|
(5
|
)
|
(6
|
)
|
4
|
|
(2
|
)
|
|
Interest rate
|
4.49
|
%
|
—
|
|
—
|
|
—
|
|
—
|
|
—
|
|
4.49
|
%
|
—
|
|
—
|
|
—
|
|
|
Rate cap
|
—
|
|
—
|
|
—
|
|
—
|
|
—
|
|
—
|
|
—
|
|
—
|
|
—
|
|
—
|
|
|
Instruments in ARS
|
(31
|
)
|
7
|
|
—
|
|
—
|
|
—
|
|
(2
|
)
|
(26
|
)
|
(19
|
)
|
—
|
|
(19
|
)
|
|
Floating rate
|
(1
|
)
|
—
|
|
—
|
|
—
|
|
—
|
|
—
|
|
(1
|
)
|
(1
|
)
|
—
|
|
(1
|
)
|
|
Spread
|
—
|
|
—
|
|
—
|
|
—
|
|
—
|
|
—
|
|
—
|
|
—
|
|
—
|
|
—
|
|
|
Fixed rate
|
(30
|
)
|
7
|
|
—
|
|
—
|
|
—
|
|
(2
|
)
|
(25
|
)
|
(18
|
)
|
—
|
|
(18
|
)
|
F-154
|
|
|
|
|
|
|
|
|
Fair value
|
||||||||||||
|
Millions of Euros
|
2019
|
|
2020
|
|
2021
|
|
2022
|
|
2023
|
|
Subsequent years
|
|
Notional
|
|
Underlying debt
|
|
Associated derivatives
|
|
TOTAL
|
|
|
Interest rate
|
17.69
|
%
|
33.26
|
%
|
—
|
|
—
|
|
—
|
|
38.15
|
%
|
14.99
|
%
|
—
|
|
—
|
|
—
|
|
|
Rate cap
|
—
|
|
—
|
|
—
|
|
—
|
|
—
|
|
—
|
|
—
|
|
—
|
|
—
|
|
—
|
|
|
Instruments in BRL
|
946
|
|
(144
|
)
|
300
|
|
269
|
|
4
|
|
92
|
|
1,467
|
|
(693
|
)
|
2,159
|
|
1,466
|
|
|
Floating rate
|
(1,407
|
)
|
(263
|
)
|
287
|
|
262
|
|
5
|
|
(122
|
)
|
(1,238
|
)
|
(1,196
|
)
|
(26
|
)
|
(1,222
|
)
|
|
Spread
|
(0.23
|
%)
|
(1.35
|
%)
|
0.37
|
%
|
0.39
|
%
|
2.49
|
%
|
—
|
|
(0.72
|
%)
|
—
|
|
—
|
|
—
|
|
|
Fixed rate
|
2,353
|
|
119
|
|
13
|
|
7
|
|
(1
|
)
|
214
|
|
2,705
|
|
503
|
|
2,185
|
|
2,688
|
|
|
Interest rate
|
5.72
|
%
|
5.93
|
%
|
5.55
|
%
|
5.05
|
%
|
6.39
|
%
|
2.81
|
%
|
5.50
|
%
|
—
|
|
—
|
|
—
|
|
|
Rate cap
|
—
|
|
—
|
|
—
|
|
—
|
|
—
|
|
—
|
|
—
|
|
—
|
|
—
|
|
—
|
|
|
Instruments in CLP
|
(111
|
)
|
186
|
|
267
|
|
302
|
|
170
|
|
(3
|
)
|
811
|
|
(228
|
)
|
1,051
|
|
823
|
|
|
Floating rate
|
55
|
|
(19
|
)
|
3
|
|
305
|
|
149
|
|
—
|
|
493
|
|
—
|
|
455
|
|
455
|
|
|
Spread
|
1.21
|
%
|
(0.40
|
%)
|
26.86
|
%
|
(0.80
|
%)
|
1.17
|
%
|
—
|
|
0.17
|
%
|
—
|
|
—
|
|
—
|
|
|
Fixed rate
|
(166
|
)
|
205
|
|
264
|
|
(3
|
)
|
21
|
|
(3
|
)
|
318
|
|
(228
|
)
|
596
|
|
368
|
|
|
Interest rate
|
3.73
|
%
|
4.35
|
%
|
4.13
|
%
|
4.90
|
%
|
4.90
|
%
|
2.56
|
%
|
4.54
|
%
|
—
|
|
—
|
|
—
|
|
|
Rate cap
|
—
|
|
—
|
|
—
|
|
—
|
|
—
|
|
—
|
|
—
|
|
—
|
|
—
|
|
—
|
|
|
Instruments in UFC
|
—
|
|
—
|
|
—
|
|
—
|
|
—
|
|
—
|
|
—
|
|
266
|
|
(266
|
)
|
—
|
|
|
Floating rate
|
—
|
|
—
|
|
—
|
|
—
|
|
—
|
|
—
|
|
—
|
|
266
|
|
(266
|
)
|
—
|
|
|
Spread
|
—
|
|
—
|
|
—
|
|
—
|
|
—
|
|
—
|
|
—
|
|
—
|
|
—
|
|
—
|
|
|
Fixed rate
|
—
|
|
—
|
|
—
|
|
—
|
|
—
|
|
—
|
|
—
|
|
—
|
|
—
|
|
—
|
|
|
Interest rate
|
—
|
|
—
|
|
—
|
|
—
|
|
—
|
|
—
|
|
—
|
|
—
|
|
—
|
|
—
|
|
|
Rate cap
|
—
|
|
—
|
|
—
|
|
—
|
|
—
|
|
—
|
|
—
|
|
—
|
|
—
|
|
—
|
|
|
Instruments in PEN
|
280
|
|
99
|
|
18
|
|
62
|
|
67
|
|
114
|
|
640
|
|
414
|
|
228
|
|
642
|
|
|
Floating rate
|
—
|
|
—
|
|
—
|
|
—
|
|
—
|
|
—
|
|
—
|
|
—
|
|
—
|
|
—
|
|
|
Spread
|
—
|
|
—
|
|
—
|
|
—
|
|
—
|
|
—
|
|
—
|
|
—
|
|
—
|
|
—
|
|
|
Fixed rate
|
280
|
|
99
|
|
18
|
|
62
|
|
67
|
|
114
|
|
640
|
|
414
|
|
228
|
|
642
|
|
|
Interest rate
|
3.96
|
%
|
4.90
|
%
|
4.19
|
%
|
5.43
|
%
|
6.66
|
%
|
6.00
|
%
|
4.90
|
%
|
—
|
|
—
|
|
—
|
|
|
Rate cap
|
—
|
|
—
|
|
—
|
|
—
|
|
—
|
|
—
|
|
—
|
|
—
|
|
—
|
|
—
|
|
|
Instruments in VAC
|
26
|
|
—
|
|
8
|
|
—
|
|
—
|
|
79
|
|
113
|
|
113
|
|
—
|
|
113
|
|
|
Floating rate
|
26
|
|
—
|
|
8
|
|
—
|
|
—
|
|
79
|
|
113
|
|
113
|
|
—
|
|
113
|
|
|
Spread
|
3.66
|
%
|
—
|
|
3.50
|
%
|
—
|
|
—
|
|
3.21
|
%
|
3.33
|
%
|
—
|
|
—
|
|
—
|
|
|
Fixed rate
|
—
|
|
—
|
|
—
|
|
—
|
|
—
|
|
—
|
|
—
|
|
—
|
|
—
|
|
—
|
|
|
Interest rate
|
—
|
|
—
|
|
—
|
|
—
|
|
—
|
|
—
|
|
—
|
|
—
|
|
—
|
|
—
|
|
|
Rate cap
|
—
|
|
—
|
|
—
|
|
—
|
|
—
|
|
—
|
|
—
|
|
—
|
|
—
|
|
—
|
|
|
Instruments in COP
|
698
|
|
69
|
|
71
|
|
46
|
|
31
|
|
44
|
|
959
|
|
200
|
|
758
|
|
958
|
|
|
Floating rate
|
35
|
|
—
|
|
27
|
|
(6
|
)
|
(34
|
)
|
44
|
|
66
|
|
237
|
|
—
|
|
237
|
|
|
Spread
|
0.72
|
%
|
—
|
|
7.32
|
%
|
(18.97
|
%)
|
(3.05
|
%)
|
2.81
|
%
|
8.50
|
%
|
—
|
|
—
|
|
—
|
|
|
Fixed rate
|
663
|
|
69
|
|
44
|
|
52
|
|
65
|
|
—
|
|
893
|
|
(37
|
)
|
758
|
|
721
|
|
|
Interest rate
|
4.60
|
%
|
5.01
|
%
|
5.20
|
%
|
5.25
|
%
|
5.23
|
%
|
—
|
|
4.75
|
%
|
—
|
|
—
|
|
—
|
|
|
Rate cap
|
—
|
|
—
|
|
—
|
|
—
|
|
—
|
|
—
|
|
—
|
|
—
|
|
—
|
|
—
|
|
|
Instruments in VEB
|
(1
|
)
|
—
|
|
—
|
|
—
|
|
—
|
|
—
|
|
(1
|
)
|
(1
|
)
|
—
|
|
(1
|
)
|
|
Floating rate
|
—
|
|
—
|
|
—
|
|
—
|
|
—
|
|
—
|
|
—
|
|
—
|
|
—
|
|
—
|
|
|
Spread
|
—
|
|
—
|
|
—
|
|
—
|
|
—
|
|
—
|
|
—
|
|
—
|
|
—
|
|
—
|
|
|
Fixed rate
|
(1
|
)
|
—
|
|
—
|
|
—
|
|
—
|
|
—
|
|
(1
|
)
|
(1
|
)
|
—
|
|
(1
|
)
|
|
Interest rate
|
0.01
|
%
|
—
|
|
—
|
|
—
|
|
—
|
|
—
|
|
0.01
|
%
|
—
|
|
—
|
|
—
|
|
|
Rate cap
|
—
|
|
—
|
|
—
|
|
—
|
|
—
|
|
—
|
|
—
|
|
—
|
|
—
|
|
—
|
|
F-155
|
|
|
|
|
|
|
|
|
Fair value
|
||||||||||||
|
Millions of Euros
|
2019
|
|
2020
|
|
2021
|
|
2022
|
|
2023
|
|
Subsequent years
|
|
Notional
|
|
Underlying debt
|
|
Associated derivatives
|
|
TOTAL
|
|
|
Instruments in MXN
|
(95
|
)
|
132
|
|
39
|
|
46
|
|
54
|
|
248
|
|
424
|
|
319
|
|
110
|
|
429
|
|
|
Floating rate
|
19
|
|
9
|
|
11
|
|
13
|
|
15
|
|
87
|
|
154
|
|
161
|
|
—
|
|
161
|
|
|
Spread
|
5.49
|
%
|
5.95
|
%
|
6.01
|
%
|
6.04
|
%
|
6.07
|
%
|
5.03
|
%
|
5.39
|
%
|
—
|
|
—
|
|
—
|
|
|
Fixed rate
|
(114
|
)
|
123
|
|
28
|
|
33
|
|
39
|
|
161
|
|
270
|
|
158
|
|
110
|
|
268
|
|
|
Interest rate
|
3.67
|
%
|
7.80
|
%
|
6.77
|
%
|
6.78
|
%
|
6.83
|
%
|
9.64
|
%
|
10.26
|
%
|
—
|
|
—
|
|
—
|
|
|
Rate cap
|
—
|
|
—
|
|
—
|
|
—
|
|
—
|
|
—
|
|
—
|
|
—
|
|
—
|
|
—
|
|
|
Instruments in GTQ
|
(1
|
)
|
19
|
|
—
|
|
—
|
|
—
|
|
—
|
|
18
|
|
18
|
|
—
|
|
18
|
|
|
Floating rate
|
(6
|
)
|
—
|
|
—
|
|
—
|
|
—
|
|
—
|
|
(6
|
)
|
(6
|
)
|
—
|
|
(6
|
)
|
|
Spread
|
0.01
|
%
|
—
|
|
—
|
|
—
|
|
—
|
|
—
|
|
0.01
|
%
|
—
|
|
—
|
|
—
|
|
|
Fixed rate
|
5
|
|
19
|
|
—
|
|
—
|
|
—
|
|
—
|
|
24
|
|
24
|
|
—
|
|
24
|
|
|
Interest rate
|
4.06
|
%
|
4.00
|
%
|
—
|
|
—
|
|
—
|
|
—
|
|
3.98
|
%
|
—
|
|
—
|
|
—
|
|
|
Rate cap
|
—
|
|
—
|
|
—
|
|
—
|
|
—
|
|
—
|
|
—
|
|
—
|
|
—
|
|
—
|
|
|
Instruments in NIO
|
(6
|
)
|
—
|
|
—
|
|
—
|
|
—
|
|
5
|
|
(1
|
)
|
(1
|
)
|
—
|
|
(1
|
)
|
|
Floating rate
|
(7
|
)
|
—
|
|
—
|
|
—
|
|
—
|
|
—
|
|
(7
|
)
|
(7
|
)
|
—
|
|
(7
|
)
|
|
Spread
|
0.01
|
%
|
—
|
|
—
|
|
—
|
|
—
|
|
—
|
|
0.01
|
%
|
—
|
|
—
|
|
—
|
|
|
Fixed rate
|
1
|
|
—
|
|
—
|
|
—
|
|
—
|
|
5
|
|
6
|
|
6
|
|
—
|
|
6
|
|
|
Interest rate
|
18.48
|
%
|
—
|
|
—
|
|
—
|
|
—
|
|
7.46
|
%
|
8.75
|
%
|
—
|
|
—
|
|
—
|
|
|
Rate cap
|
—
|
|
—
|
|
—
|
|
—
|
|
—
|
|
—
|
|
—
|
|
—
|
|
—
|
|
—
|
|
|
Asia
|
||||||||||||||||||||
|
Instruments in JPY
|
—
|
|
—
|
|
—
|
|
—
|
|
—
|
|
—
|
|
—
|
|
(2
|
)
|
—
|
|
(2
|
)
|
|
Floating rate
|
—
|
|
—
|
|
—
|
|
—
|
|
—
|
|
—
|
|
—
|
|
—
|
|
—
|
|
—
|
|
|
Spread
|
—
|
|
—
|
|
—
|
|
—
|
|
—
|
|
—
|
|
—
|
|
—
|
|
—
|
|
—
|
|
|
Fixed rate
|
—
|
|
—
|
|
—
|
|
—
|
|
—
|
|
—
|
|
—
|
|
(2
|
)
|
—
|
|
(2
|
)
|
|
Interest rate
|
—
|
|
—
|
|
—
|
|
—
|
|
—
|
|
—
|
|
—
|
|
—
|
|
—
|
|
—
|
|
|
Rate cap
|
—
|
|
—
|
|
—
|
|
—
|
|
—
|
|
—
|
|
—
|
|
—
|
|
—
|
|
—
|
|
|
TOTAL
|
44,729
|
|
46,812
|
|
(1,181
|
)
|
45,631
|
|
||||||||||||
|
Floating rate
|
15,347
|
|
2,998
|
|
11,955
|
|
14,953
|
|
||||||||||||
|
Fixed rate
|
29,270
|
|
43,702
|
|
(13,211
|
)
|
30,491
|
|
||||||||||||
|
Rate cap
|
112
|
|
112
|
|
—
|
|
112
|
|
||||||||||||
|
Currency Options and Others (*)
|
—
|
|
—
|
|
75
|
|
75
|
|
||||||||||||
F-156
The table below is an extract of the previous table that shows the sensitivity to interest rates originated by our position on interest rate swaps categorized into instruments entered into for trading purposes and instruments entered into for purposes other than trading at December 31, 2018:
|
Interest rate swaps
|
||||||||||||||||
|
Millions of euros
|
Maturity
|
|
||||||||||||||
|
Non trading purposes
|
2019
|
|
2020
|
|
2021
|
|
2022
|
|
2023
|
|
Subsequent years
|
|
Total
|
|
Fair value
|
|
|
EUR
|
(141
|
)
|
||||||||||||||
|
Fixed to fix
|
—
|
|
—
|
|
—
|
|
—
|
|
—
|
|
—
|
|
—
|
|
2
|
|
|
Receiving leg
|
(25
|
)
|
—
|
|
(100
|
)
|
(75
|
)
|
—
|
|
—
|
|
(200
|
)
|
(103
|
)
|
|
Average Interest Rate
|
—
|
|
—
|
|
—
|
|
—
|
|
—
|
|
—
|
|
—
|
|
—
|
|
|
Paying leg
|
25
|
|
—
|
|
100
|
|
75
|
|
—
|
|
—
|
|
200
|
|
105
|
|
|
Average Interest Rate
|
0.85
|
%
|
—
|
|
1.18
|
%
|
0.55
|
%
|
—
|
|
—
|
|
—
|
|
—
|
|
|
Fixed to floating
|
—
|
|
—
|
|
—
|
|
—
|
|
—
|
|
—
|
|
—
|
|
(859
|
)
|
|
Receiving leg
|
(9,761
|
)
|
(8,845
|
)
|
(7,182
|
)
|
(3,918
|
)
|
(3,724
|
)
|
(5,083
|
)
|
(38,513
|
)
|
(23,880
|
)
|
|
Average Interest Rate
|
1.55
|
%
|
1.41
|
%
|
1.70
|
%
|
1.04
|
%
|
1.51
|
%
|
0.89
|
%
|
1.40
|
%
|
—
|
|
|
Paying leg
|
9,761
|
|
8,845
|
|
7,182
|
|
3,918
|
|
3,724
|
|
5,083
|
|
38,513
|
|
23,021
|
|
|
Average Spread
|
1.50
|
%
|
0.36
|
%
|
0.50
|
%
|
1.01
|
%
|
0.37
|
%
|
—
|
|
0.69
|
%
|
—
|
|
|
Floating to fixed
|
—
|
|
—
|
|
—
|
|
—
|
|
—
|
|
—
|
|
—
|
|
716
|
|
|
Receiving leg
|
(2,558
|
)
|
(4,785
|
)
|
(3,460
|
)
|
(358
|
)
|
(1,997
|
)
|
(3,542
|
)
|
(16,700
|
)
|
(16,678
|
)
|
|
Average Spread
|
0.19
|
%
|
—
|
|
0.02
|
%
|
—
|
|
—
|
|
—
|
|
0.03
|
%
|
—
|
|
|
Paying leg
|
2,558
|
|
4,785
|
|
3,460
|
|
358
|
|
1,997
|
|
3,542
|
|
16,700
|
|
17,394
|
|
|
Average Interest Rate
|
0.07
|
%
|
2.51
|
%
|
1.95
|
%
|
1.30
|
%
|
1.02
|
%
|
0.94
|
%
|
1.48
|
%
|
—
|
|
|
USD
|
(13
|
)
|
||||||||||||||
|
Fixed to floating
|
—
|
|
—
|
|
—
|
|
—
|
|
—
|
|
—
|
|
—
|
|
(8
|
)
|
|
Receiving leg
|
(732
|
)
|
(297
|
)
|
(297
|
)
|
(559
|
)
|
(297
|
)
|
(148
|
)
|
(2,330
|
)
|
(859
|
)
|
|
Average Interest Rate
|
2.90
|
%
|
1.52
|
%
|
1.61
|
%
|
1.73
|
%
|
1.74
|
%
|
3.55
|
%
|
2.17
|
%
|
—
|
|
|
Paying leg
|
732
|
|
297
|
|
297
|
|
559
|
|
297
|
|
148
|
|
2,330
|
|
851
|
|
|
Average Spread
|
0.62
|
%
|
1.61
|
%
|
1.68
|
%
|
0.92
|
%
|
1.77
|
%
|
—
|
|
1.06
|
%
|
—
|
|
|
Floating to fixed
|
—
|
|
—
|
|
—
|
|
—
|
|
—
|
|
—
|
|
—
|
|
(5
|
)
|
|
Receiving leg
|
—
|
|
—
|
|
—
|
|
(262
|
)
|
—
|
|
(148
|
)
|
(410
|
)
|
(412
|
)
|
|
Average Spread
|
—
|
|
—
|
|
—
|
|
—
|
|
—
|
|
—
|
|
—
|
|
—
|
|
|
Paying leg
|
—
|
|
—
|
|
—
|
|
262
|
|
—
|
|
148
|
|
410
|
|
407
|
|
|
Average Interest Rate
|
—
|
|
—
|
|
—
|
|
1.93
|
%
|
—
|
|
2.52
|
%
|
—
|
|
—
|
|
|
Floating to floating
|
—
|
|
—
|
|
—
|
|
—
|
|
—
|
|
—
|
|
—
|
|
—
|
|
|
Receiving leg
|
(271
|
)
|
—
|
|
—
|
|
—
|
|
—
|
|
—
|
|
(271
|
)
|
(272
|
)
|
|
Average Spread
|
0.87
|
%
|
—
|
|
—
|
|
—
|
|
—
|
|
—
|
|
—
|
|
—
|
|
|
Paying leg
|
271
|
|
—
|
|
—
|
|
—
|
|
—
|
|
—
|
|
271
|
|
272
|
|
|
Average Interest Rate
|
0.70
|
%
|
—
|
|
—
|
|
—
|
|
—
|
|
—
|
|
—
|
|
—
|
|
|
GBP
|
(36
|
)
|
||||||||||||||
|
Fixed to floating
|
—
|
|
—
|
|
—
|
|
—
|
|
—
|
|
—
|
|
—
|
|
(46
|
)
|
|
Receiving leg
|
(28
|
)
|
(22
|
)
|
(246
|
)
|
(604
|
)
|
—
|
|
—
|
|
(900
|
)
|
(946
|
)
|
|
Average Interest Rate
|
2.25
|
%
|
2.36
|
%
|
1.76
|
%
|
3.00
|
%
|
—
|
|
—
|
|
—
|
|
—
|
|
|
Paying leg
|
28
|
|
22
|
|
246
|
|
604
|
|
—
|
|
—
|
|
900
|
|
900
|
|
|
Average Spread
|
—
|
|
—
|
|
—
|
|
—
|
|
—
|
|
—
|
|
—
|
|
—
|
|
|
Floating to fixed
|
—
|
|
—
|
|
—
|
|
—
|
|
—
|
|
—
|
|
—
|
|
10
|
|
|
Receiving leg
|
—
|
|
(67
|
)
|
(168
|
)
|
(190
|
)
|
(445
|
)
|
—
|
|
(870
|
)
|
(871
|
)
|
|
Average Spread
|
—
|
|
—
|
|
—
|
|
—
|
|
—
|
|
—
|
|
—
|
|
—
|
|
|
Paying leg
|
—
|
|
67
|
|
168
|
|
190
|
|
445
|
|
—
|
|
870
|
|
881
|
|
|
Average Interest Rate
|
—
|
|
0.73
|
%
|
2.56
|
%
|
1.84
|
%
|
1.11
|
%
|
—
|
|
—
|
|
—
|
|
F-157
|
Interest rate swaps
|
||||||||||||||||
|
Millions of euros
|
Maturity
|
|
||||||||||||||
|
Trading purposes
|
2019
|
|
2020
|
|
2021
|
|
2022
|
|
2023
|
|
Subsequent years
|
|
Total
|
|
Fair value
|
|
|
EUR
|
424
|
|
||||||||||||||
|
Fixed to floating
|
—
|
|
—
|
|
—
|
|
—
|
|
—
|
|
—
|
|
—
|
|
(86
|
)
|
|
Receiving leg
|
—
|
|
—
|
|
(500
|
)
|
—
|
|
(800
|
)
|
(400
|
)
|
(1,700
|
)
|
(1,781
|
)
|
|
Average Interest Rate
|
—
|
|
—
|
|
1.25
|
%
|
—
|
|
1.50
|
%
|
0.59
|
%
|
—
|
|
—
|
|
|
Paying leg
|
—
|
|
—
|
|
500
|
|
—
|
|
800
|
|
400
|
|
1,700
|
|
1,695
|
|
|
Average Spread
|
—
|
|
—
|
|
—
|
|
—
|
|
—
|
|
—
|
|
—
|
|
—
|
|
|
Floating to fixed
|
—
|
|
—
|
|
—
|
|
—
|
|
—
|
|
—
|
|
—
|
|
510
|
|
|
Receiving leg
|
(1,012
|
)
|
(4,097
|
)
|
(1,102
|
)
|
(192
|
)
|
—
|
|
(6,733
|
)
|
(13,136
|
)
|
(11,343
|
)
|
|
Average Spread
|
1.70
|
%
|
0.05
|
%
|
0.03
|
%
|
—
|
|
—
|
|
—
|
|
—
|
|
—
|
|
|
Paying leg
|
1,012
|
|
4,097
|
|
1,102
|
|
192
|
|
—
|
|
6,733
|
|
13,136
|
|
11,853
|
|
|
Average Interest Rate
|
0.19
|
%
|
2.57
|
%
|
1.92
|
%
|
0.12
|
%
|
—
|
|
1.31
|
%
|
—
|
|
—
|
|
|
USD
|
(597
|
)
|
||||||||||||||
|
Fixed to floating
|
—
|
|
—
|
|
—
|
|
—
|
|
—
|
|
—
|
|
—
|
|
(597
|
)
|
|
Receiving leg
|
(749
|
)
|
(1,863
|
)
|
(1,580
|
)
|
(1,293
|
)
|
(766
|
)
|
(8,361
|
)
|
(14,612
|
)
|
(14,317
|
)
|
|
Average Interest Rate
|
3.17
|
%
|
3.02
|
%
|
3.44
|
%
|
1.83
|
%
|
1.85
|
%
|
3.28
|
%
|
3.06
|
%
|
—
|
|
|
Paying leg
|
749
|
|
1,863
|
|
1,580
|
|
1,293
|
|
766
|
|
8,361
|
|
14,612
|
|
13,720
|
|
|
Average Spread
|
—
|
|
0.22
|
%
|
—
|
|
—
|
|
—
|
|
—
|
|
0.03
|
%
|
—
|
|
|
MXN
|
(3
|
)
|
||||||||||||||
|
Fixed to floating
|
—
|
|
—
|
|
—
|
|
—
|
|
—
|
|
—
|
|
—
|
|
(1
|
)
|
|
Receiving leg
|
—
|
|
(133
|
)
|
—
|
|
—
|
|
—
|
|
—
|
|
(133
|
)
|
(135
|
)
|
|
Average Interest Rate
|
—
|
|
7.90
|
%
|
—
|
|
—
|
|
—
|
|
—
|
|
—
|
|
—
|
|
|
Paying leg
|
—
|
|
133
|
|
—
|
|
—
|
|
—
|
|
—
|
|
133
|
|
134
|
|
|
Average Spread
|
—
|
|
0.41
|
%
|
—
|
|
—
|
|
—
|
|
—
|
|
—
|
|
—
|
|
|
Floating to fixed
|
—
|
|
—
|
|
—
|
|
—
|
|
—
|
|
—
|
|
—
|
|
(2
|
)
|
|
Receiving leg
|
—
|
|
(133
|
)
|
—
|
|
—
|
|
—
|
|
—
|
|
(133
|
)
|
(134
|
)
|
|
Average Spread
|
—
|
|
0.41
|
%
|
—
|
|
—
|
|
—
|
|
—
|
|
—
|
|
—
|
|
|
Paying leg
|
—
|
|
133
|
|
—
|
|
—
|
|
—
|
|
—
|
|
133
|
|
132
|
|
|
Average Interest Rate
|
—
|
|
6.67
|
%
|
—
|
|
—
|
|
—
|
|
—
|
|
—
|
|
—
|
|
|
GBP
|
(163
|
)
|
||||||||||||||
|
Fixed to floating
|
—
|
|
—
|
|
—
|
|
—
|
|
—
|
|
—
|
|
—
|
|
(163
|
)
|
|
Receiving leg
|
—
|
|
(782
|
)
|
—
|
|
(559
|
)
|
—
|
|
(447
|
)
|
(1,788
|
)
|
(1,947
|
)
|
|
Average Interest Rate
|
—
|
|
1.87
|
%
|
—
|
|
3.51
|
%
|
—
|
|
3.42
|
%
|
2.77
|
%
|
—
|
|
|
Paying leg
|
—
|
|
782
|
|
—
|
|
559
|
|
—
|
|
447
|
|
1,788
|
|
1,784
|
|
|
Average Spread
|
—
|
|
—
|
|
—
|
|
—
|
|
—
|
|
—
|
|
—
|
|
—
|
|
F-158
|
Millions of euros
|
Maturity
|
|
||||||||||||||
|
Trading purposes
|
2019
|
|
2020
|
|
2021
|
|
2022
|
|
2023
|
|
Subsequent years
|
|
Total
|
|
Fair value
|
|
|
CLP
|
(1
|
)
|
||||||||||||||
|
Fixed to floating
|
—
|
|
—
|
|
—
|
|
—
|
|
—
|
|
—
|
|
—
|
|
(1
|
)
|
|
Receiving leg
|
(59
|
)
|
(6
|
)
|
(3
|
)
|
(3
|
)
|
(3
|
)
|
—
|
|
(74
|
)
|
(4
|
)
|
|
Average Interest Rate
|
5.75
|
%
|
4.90
|
%
|
4.90
|
%
|
4.90
|
%
|
4.90
|
%
|
—
|
|
0.20
|
%
|
—
|
|
|
Paying leg
|
59
|
|
6
|
|
3
|
|
3
|
|
3
|
|
—
|
|
74
|
|
3
|
|
|
Average Spread
|
1.12
|
%
|
1.27
|
%
|
1.27
|
%
|
1.27
|
%
|
1.27
|
%
|
—
|
|
0.05
|
%
|
—
|
|
|
Floating to fixed
|
—
|
|
—
|
|
—
|
|
—
|
|
—
|
|
—
|
|
—
|
|
—
|
|
|
Receiving leg
|
—
|
|
(25
|
)
|
(124
|
)
|
—
|
|
—
|
|
—
|
|
(149
|
)
|
(85
|
)
|
|
Average Spread
|
—
|
|
—
|
|
—
|
|
—
|
|
—
|
|
—
|
|
—
|
|
—
|
|
|
Paying leg
|
—
|
|
25
|
|
124
|
|
—
|
|
—
|
|
—
|
|
149
|
|
85
|
|
|
Average Interest Rate
|
—
|
|
3.31
|
%
|
3.26
|
%
|
—
|
|
—
|
|
—
|
|
—
|
|
—
|
|
|
CHF
|
(12
|
)
|
||||||||||||||
|
Fixed to floating
|
—
|
|
—
|
|
—
|
|
—
|
|
—
|
|
—
|
|
—
|
|
(12
|
)
|
|
Receiving leg
|
—
|
|
(200
|
)
|
—
|
|
(133
|
)
|
—
|
|
—
|
|
(333
|
)
|
(344
|
)
|
|
Average Interest Rate
|
—
|
|
0.95
|
%
|
—
|
|
0.75
|
%
|
—
|
|
—
|
|
—
|
|
—
|
|
|
Paying leg
|
—
|
|
200
|
|
—
|
|
133
|
|
—
|
|
—
|
|
333
|
|
332
|
|
|
Average Spread
|
—
|
|
—
|
|
—
|
|
—
|
|
—
|
|
—
|
|
—
|
|
—
|
|
|
BRL
|
(1
|
)
|
||||||||||||||
|
Floating to floating
|
(2
|
)
|
—
|
|
—
|
|
—
|
|
—
|
|
—
|
|
(2
|
)
|
(1
|
)
|
|
Receiving leg
|
(35
|
)
|
—
|
|
—
|
|
—
|
|
—
|
|
—
|
|
(35
|
)
|
(34
|
)
|
|
Average Spread
|
1.51
|
%
|
—
|
|
—
|
|
—
|
|
—
|
|
—
|
|
—
|
|
—
|
|
|
Paying leg
|
33
|
|
—
|
|
—
|
|
—
|
|
—
|
|
—
|
|
33
|
|
33
|
|
|
Average Interest Rate
|
—
|
|
—
|
|
—
|
|
—
|
|
—
|
|
—
|
|
—
|
|
—
|
|
|
COP
|
2
|
|
||||||||||||||
|
Fixed to floating
|
—
|
|
—
|
|
—
|
|
—
|
|
—
|
|
—
|
|
—
|
|
—
|
|
|
Receiving leg
|
(8
|
)
|
(8
|
)
|
(8
|
)
|
(4
|
)
|
—
|
|
—
|
|
(28
|
)
|
—
|
|
|
Average Interest Rate
|
7.25
|
%
|
7.25
|
%
|
7.25
|
%
|
7.25
|
%
|
—
|
|
—
|
|
—
|
|
—
|
|
|
Paying leg
|
8
|
|
8
|
|
8
|
|
4
|
|
—
|
|
—
|
|
28
|
|
—
|
|
|
Average Spread
|
2.80
|
%
|
2.80
|
%
|
2.80
|
%
|
2.80
|
%
|
—
|
|
—
|
|
—
|
|
—
|
|
|
Floating to fixed
|
—
|
|
—
|
|
—
|
|
5
|
|
(6
|
)
|
—
|
|
(1
|
)
|
2
|
|
|
Receiving leg
|
(8
|
)
|
(30
|
)
|
(44
|
)
|
(47
|
)
|
(71
|
)
|
—
|
|
(200
|
)
|
—
|
|
|
Average Spread
|
—
|
|
—
|
|
—
|
|
—
|
|
—
|
|
—
|
|
—
|
|
—
|
|
|
Paying leg
|
8
|
|
30
|
|
44
|
|
52
|
|
65
|
|
—
|
|
199
|
|
2
|
|
|
Average Interest Rate
|
4.87
|
%
|
5.13
|
%
|
5.18
|
%
|
5.24
|
%
|
5.23
|
%
|
—
|
|
—
|
|
—
|
|
F-159
Interest rate options, by maturity, are as follows:
|
Interest rate options
|
Maturities
|
|||||||||||
|
Millions of euros
|
2019
|
|
2020
|
|
2021
|
|
2022
|
|
2023
|
|
Subsequent years
|
|
|
Collars
|
|
|
|
|
|
|
|
|
|
|
|
|
|
Notional amount of options bought
|
—
|
|
—
|
|
—
|
|
838
|
|
—
|
|
—
|
|
|
Strike Cap
|
—
|
|
—
|
|
—
|
|
4.92
|
|
—
|
|
—
|
|
|
Strike Floor
|
—
|
|
—
|
|
—
|
|
4.15
|
|
—
|
|
—
|
|
|
Caps
|
||||||||||||
|
Notional amount of options bought
|
—
|
|
—
|
|
—
|
|
—
|
|
—
|
|
—
|
|
|
Strike
|
—
|
|
—
|
|
—
|
|
—
|
|
—
|
|
—
|
|
|
Notional amount of options sold
|
—
|
|
—
|
|
—
|
|
838
|
|
—
|
|
—
|
|
|
Strike
|
—
|
|
—
|
|
—
|
|
5.53
|
|
—
|
|
—
|
|
|
Floors
|
||||||||||||
|
Notional amount of options bought
|
—
|
|
—
|
|
—
|
|
838
|
|
—
|
|
—
|
|
|
Strike
|
—
|
|
—
|
|
—
|
|
1.17
|
|
—
|
|
—
|
|
|
Notional amount of options sold
|
—
|
|
—
|
|
—
|
|
—
|
|
—
|
|
—
|
|
|
Strike
|
—
|
|
—
|
|
—
|
|
—
|
|
—
|
|
—
|
|
Cash flows receivable or payable on derivative financial instruments to be settled via the swap of nominals, categorized by currency of collection/payment, along with contractual maturities are as follows:
|
Millions of euros
|
|
2019
|
|
2020
|
|
2021
|
|
2022
|
|
2023
|
|
Subsequent years
|
|
Total
|
|
|
Currency swaps
|
|
|
|
|
|
|
|
|
|
|
|
|
|
|
|
|
Receive
|
ARS
|
—
|
|
—
|
|
—
|
|
—
|
|
—
|
|
—
|
|
—
|
|
|
Pay
|
ARS
|
—
|
|
—
|
|
—
|
|
—
|
|
—
|
|
—
|
|
—
|
|
|
Receive
|
BRL
|
125
|
|
—
|
|
—
|
|
—
|
|
—
|
|
—
|
|
125
|
|
|
Pay
|
BRL
|
(226
|
)
|
—
|
|
—
|
|
—
|
|
—
|
|
—
|
|
(226
|
)
|
|
Receive
|
CLP
|
—
|
|
—
|
|
—
|
|
302
|
|
87
|
|
—
|
|
389
|
|
|
Pay
|
CLP
|
—
|
|
(126
|
)
|
(124
|
)
|
(604
|
)
|
(233
|
)
|
—
|
|
(1,087
|
)
|
|
Receive
|
COP
|
—
|
|
—
|
|
—
|
|
—
|
|
—
|
|
—
|
|
—
|
|
|
Pay
|
COP
|
(2
|
)
|
—
|
|
—
|
|
—
|
|
—
|
|
—
|
|
(2
|
)
|
|
Receive
|
CZK
|
—
|
|
—
|
|
—
|
|
—
|
|
—
|
|
—
|
|
—
|
|
|
Pay
|
CZK
|
—
|
|
—
|
|
—
|
|
—
|
|
—
|
|
—
|
|
—
|
|
|
Receive
|
EUR
|
146
|
|
—
|
|
—
|
|
—
|
|
—
|
|
—
|
|
146
|
|
|
Pay
|
EUR
|
(1,774
|
)
|
(3,019
|
)
|
(3,104
|
)
|
(313
|
)
|
(668
|
)
|
(6,647
|
)
|
(15,525
|
)
|
|
Receive
|
GBP
|
559
|
|
1,229
|
|
—
|
|
—
|
|
—
|
|
—
|
|
1,788
|
|
|
Pay
|
GBP
|
—
|
|
—
|
|
—
|
|
—
|
|
—
|
|
—
|
|
—
|
|
|
Receive
|
JPY
|
—
|
|
—
|
|
—
|
|
—
|
|
—
|
|
—
|
|
—
|
|
|
Pay
|
JPY
|
—
|
|
—
|
|
—
|
|
—
|
|
—
|
|
—
|
|
—
|
|
|
Receive
|
MXN
|
—
|
|
—
|
|
—
|
|
—
|
|
—
|
|
—
|
|
—
|
|
|
Pay
|
MXN
|
—
|
|
—
|
|
—
|
|
—
|
|
—
|
|
—
|
|
—
|
|
|
Receive
|
PEN
|
—
|
|
—
|
|
—
|
|
—
|
|
—
|
|
—
|
|
—
|
|
|
Pay
|
PEN
|
(1
|
)
|
—
|
|
—
|
|
—
|
|
1
|
|
—
|
|
—
|
|
|
Receive
|
UFC
|
—
|
|
139
|
|
—
|
|
—
|
|
208
|
|
—
|
|
347
|
|
|
Pay
|
UFC
|
—
|
|
—
|
|
—
|
|
—
|
|
(104
|
)
|
—
|
|
(104
|
)
|
|
Receive
|
USD
|
1,331
|
|
1,688
|
|
3,458
|
|
1,075
|
|
826
|
|
6,440
|
|
14,818
|
|
|
Pay
|
USD
|
(101
|
)
|
—
|
|
—
|
|
(437
|
)
|
(1
|
)
|
—
|
|
(539
|
)
|
|
Receive
|
UDI
|
—
|
|
—
|
|
—
|
|
—
|
|
—
|
|
—
|
|
—
|
|
|
Pay
|
UDI
|
—
|
|
—
|
|
—
|
|
—
|
|
—
|
|
—
|
|
—
|
|
|
Receive
|
CHF
|
—
|
|
200
|
|
—
|
|
133
|
|
—
|
|
—
|
|
333
|
|
|
Pay
|
CHF
|
—
|
|
—
|
|
—
|
|
—
|
|
—
|
|
—
|
|
—
|
|
|
TOTAL
|
|
57
|
|
111
|
|
230
|
|
156
|
|
116
|
|
(207
|
)
|
463
|
|
F-160
(*) The largest volume of cash flows collected in this table falls into the following currency pairs. The average exchange rates to which the settlements have been closed are: EUR/GBP (0.78), EUR/USD (1.19), USD/COP (2,905.73) and EUR/CHF (1.22).
|
Millions of euros
|
2019
|
|
2020
|
|
2021
|
|
2022
|
|
2023
|
|
Subsequent years
|
|
Total
|
|
|
|
Forwards
|
|
|
|
|
|
|
|
|
|
|
|
|
|
|
|
|
Receive
|
ARS
|
—
|
|
—
|
|
—
|
|
—
|
|
—
|
|
—
|
|
—
|
|
|
Pay
|
ARS
|
—
|
|
—
|
|
—
|
|
—
|
|
—
|
|
—
|
|
—
|
|
|
Receive
|
BRL
|
104
|
|
—
|
|
—
|
|
—
|
|
—
|
|
—
|
|
104
|
|
|
Pay
|
BRL
|
(2,178
|
)
|
—
|
|
—
|
|
—
|
|
—
|
|
—
|
|
(2,178
|
)
|
|
Receive
|
CLP
|
14
|
|
—
|
|
—
|
|
—
|
|
—
|
|
—
|
|
14
|
|
|
Pay
|
CLP
|
(460
|
)
|
(23
|
)
|
—
|
|
—
|
|
—
|
|
—
|
|
(483
|
)
|
|
Receive
|
COP
|
33
|
|
—
|
|
—
|
|
—
|
|
—
|
|
—
|
|
33
|
|
|
Pay
|
COP
|
(709
|
)
|
(5
|
)
|
—
|
|
—
|
|
—
|
|
—
|
|
(714
|
)
|
|
Receive
|
CZK
|
66
|
|
—
|
|
—
|
|
—
|
|
—
|
|
—
|
|
66
|
|
|
Pay
|
CZK
|
—
|
|
—
|
|
—
|
|
—
|
|
—
|
|
—
|
|
—
|
|
|
Receive
|
EUR
|
8,361
|
|
—
|
|
—
|
|
—
|
|
—
|
|
—
|
|
8,361
|
|
|
Pay
|
EUR
|
(1,422
|
)
|
—
|
|
—
|
|
—
|
|
—
|
|
—
|
|
(1,422
|
)
|
|
Receive
|
GBP
|
284
|
|
—
|
|
—
|
|
—
|
|
—
|
|
—
|
|
284
|
|
|
Pay
|
GBP
|
(4,084
|
)
|
—
|
|
—
|
|
—
|
|
—
|
|
—
|
|
(4,084
|
)
|
|
Receive
|
MXN
|
33
|
|
—
|
|
—
|
|
—
|
|
—
|
|
—
|
|
33
|
|
|
Pay
|
MXN
|
(276
|
)
|
—
|
|
—
|
|
—
|
|
—
|
|
—
|
|
(276
|
)
|
|
Receive
|
PEN
|
27
|
|
—
|
|
—
|
|
—
|
|
—
|
|
—
|
|
27
|
|
|
Pay
|
PEN
|
(255
|
)
|
—
|
|
—
|
|
—
|
|
—
|
|
—
|
|
(255
|
)
|
|
Receive
|
UFC
|
—
|
|
—
|
|
—
|
|
—
|
|
—
|
|
—
|
|
—
|
|
|
Pay
|
UFC
|
—
|
|
—
|
|
—
|
|
—
|
|
—
|
|
—
|
|
—
|
|
|
Receive
|
USD
|
2,372
|
|
29
|
|
—
|
|
—
|
|
—
|
|
—
|
|
2,401
|
|
|
Pay
|
USD
|
(1,873
|
)
|
—
|
|
—
|
|
—
|
|
—
|
|
—
|
|
(1,873
|
)
|
|
Receive
|
UYU
|
—
|
|
—
|
|
—
|
|
—
|
|
—
|
|
—
|
|
—
|
|
|
Pay
|
UYU
|
(4
|
)
|
—
|
|
—
|
|
—
|
|
—
|
|
—
|
|
(4
|
)
|
|
TOTAL
|
|
33
|
|
1
|
|
—
|
|
—
|
|
—
|
|
—
|
|
34
|
|
(*) The largest volume of cash flows collected in this table falls into the following currency pairs. The average exchange rates to which the settlements have been closed are: EUR/GBP (0.89), EUR/USD (1.15), USD/COP (3,077.06) and EUR/BRL (4.51).
F-161
Appendix V: Interest-bearing debt
The main financing transactions at December 31, 2018 and 2017 and their nominal amounts are as follows:
|
|
|
|
|
Outstanding principal balance
|
|
|
|||
|
|
|
|
|
(millions of euros)
|
|
|
|||
|
Descriptive name summary
|
Current limit (millions)
|
|
Currency
|
12/31/2018
|
|
12/31/2017
|
|
Arrangement date
|
Maturity date
|
|
Telefónica, S.A
|
|
|
|
|
|
|
|
|
|
|
Structured Financing (*)
|
106
|
|
USD
|
93
|
|
128
|
|
05/03/2011
|
07/30/2021
|
|
Structured Financing (*)
|
434
|
|
USD
|
379
|
|
460
|
|
02/22/2013
|
01/31/2023
|
|
Structured Financing (*)
|
359
|
|
USD
|
314
|
|
371
|
|
08/01/2013
|
10/31/2023
|
|
Bilateral loan (1)
|
1,000
|
|
EUR
|
1,000
|
|
1,500
|
|
06/26/2014
|
06/26/2019
|
|
Structured Financing (*)
|
591
|
|
USD
|
516
|
|
566
|
|
12/11/2015
|
03/11/2026
|
|
Structured Financing (*)
|
401
|
|
EUR
|
401
|
|
423
|
|
12/11/2015
|
03/11/2026
|
|
Bilateral loan
|
100
|
|
EUR
|
100
|
|
100
|
|
02/23/2016
|
02/23/2021
|
|
Bilateral (2)
|
—
|
|
EUR
|
—
|
|
300
|
|
03/08/2016
|
09/28/2018
|
|
Bilateral loan
|
150
|
|
EUR
|
150
|
|
150
|
|
10/24/2016
|
03/19/2019
|
|
Credit
|
380
|
|
EUR
|
271
|
|
292
|
|
12/27/2002
|
12/27/2020
|
|
Credit
|
200
|
|
EUR
|
—
|
|
167
|
|
03/27/2013
|
03/14/2020
|
|
Bilateral loan
|
100
|
|
EUR
|
100
|
|
—
|
|
11/24/2017
|
01/30/2026
|
|
Bilateral loan
|
100
|
|
EUR
|
100
|
|
—
|
|
12/28/2017
|
10/22/2020
|
|
Bilateral loan
|
385
|
|
EUR
|
385
|
|
—
|
|
12/20/2017
|
07/22/2019
|
|
Credit
|
100
|
|
GBP
|
112
|
|
113
|
|
05/23/2013
|
03/01/2020
|
|
Telefónica Germany GmbH & Co. OHG
|
|
|
|
|
|
|
|||
|
Syndicated facility
|
—
|
|
EUR
|
450
|
|
450
|
|
06/13/2016
|
06/13/2025
|
|
Telefónica Europe, B.V.
|
|
|
|
|
|
|
|||
|
Structured Financing (*)
|
—
|
|
EUR
|
1,500
|
|
750
|
|
11/28/2016
|
11/28/2024
|
|
Telxius Telecom, S.A.
|
|
|
|
|
|
|
|
|
|
|
Syndicated facility (3)
|
300
|
|
EUR
|
300
|
|
—
|
|
12/01/2017
|
12/01/2023
|
(1)
On
July 17, 2018
, an early repayment was made by Telefónica, S.A. for
500
million euros originally scheduled to mature on
June 26, 2019
.
(2) On
September 28, 2018
, an early repayment was made by Telefónica, S.A. for the
300
million euros bilateral loan originally scheduled to mature on
March 8, 2021
.
(3) On
December 1, 2018
, Telxius Telecom, S.A. extended for
12
months its syndicated facility signed in 2017.
(*)
Facility with amortization schedule, showing in the column "Current limit" the undrawn amount.
F-162
Appendix VI: Key regulatory issues and concessions and licenses held by the Telefónica Group
Regulations
As a digital telecommunications operator, the Telefónica Group is subject to sector-specific telecommunications regulations, general competition law and a variety of other regulations, including privacy and security, which can have a direct and material effect on the Group’s business areas. The extent to which regulations apply to the Telefónica Group depends largely on the nature of its activities in a particular country, with traditional fixed telephony services and fixed broadband usually subject to stricter regulations.
In order to provide services and operate its networks and to use spectrum, the Telefónica Group must obtain general authorizations, concessions and/or licenses from the pertinent authorities in each country in which the Group operates (hereinafter referred to as national regulatory authorities or NRAs). The Group is also required to obtain radio frequency licenses for its mobile operations.
This section describes the legislative framework and the recent legislative key developments in the most relevant countries and regions in which the Group has significant interests. Many of the legislative changes and the adoption of regulatory measures by sector-specific regulators which are described in this section are in the process of being adopted and, therefore, have not yet concluded.
Electronic Communication Regulation in the European Union
By Directive (EU) 2018/1972, of December 11, 2018, the European Code of Electronic Communications (EECC in its acronym in English) was approved by the European Parliament and the Council. The Member States have a period of
2
years (until December 21, 2020) to transpose said Directive into their national legislation.
The Code includes measures to stimulate investment on very high capacity network (VHCN), modernization of the provisions of the Universal Service and certain changes in the regulation of services with the aim of balancing the supply conditions (Level Playing Field) between telecom operators and OTTs. In addition, some improvements are included for the coordination of spectrum management processes throughout the EU as well as a harmonization of licenses duration up to
20
years. In relation to the establishment of an upper limit at European level for both fixed and mobile termination rates (FTRs/MTRs), it is worth mentioning that their drop in recent years has been so important that future decreases are estimated to have a much modest impact on incomes that they had in the past.
In general, different provisions included in the new Code are so extensive and complex that its final impact will highly depend on the interpretation that National Regulatory Authorities made in each Member State. The EECC will continue to oblige National Regulatory Authorities to analyze telecommunications markets and determine whether any operators dominate the market. Such operators will continue to be designated as having significant market power (SMP) and face additional obligations in that territory. In the case of fiber networks, such SMP obligations could be relaxed if co-investment agreements bear fruit among other network operators.
In parallel to the Code, the Body of European Regulators of Electronic Communications (BEREC) approved its new Regulation (EU) 2018/1971 that among other provisions, it includes the regulation of Intra-EU calls. It should be noted that this legislative act modifies the Regulation (EU) 2015/2120, by introducing a maximum price of 19c€/min of communications within the European Union (“intra-community communications”) and a limit of
6
c€ per SMS, which will entry into force next May 15, 2019.
Telecom Single Market
EU Regulation 2015/2120 of the EP and of the Council of November 25, 2015, lays down measures basically concerning open Internet access (Net Neutrality) and roaming on public mobile communications networks within the Union.
|
•
|
Roaming:
Since June 15, 2017, operators have not been allowed to charge roaming users within the EU additional fees to their domestic prices for roaming calls, SMS and data services. However, in some circumstances, operators may still apply consumption limits and additional surcharge under a "fair use policy" or additional surcharges under the sustainability exemption. On June 9, 2017, an agreement between the Parliament and the Council approving maximum wholesale caps was published. These caps are effective from June 15, 2017 for roaming services with the following currents limits that remain in force until June 30, 2022
:
|
F-163
i)
0.01€
/SMS; ii)
0.032€
/minute; iii) data service glide path:
4.5€
/GB (2019);
3.5€
/GB (2020);
3€
/GB (2021) and
2.5€
/GB (2022).
|
•
|
Net Neutrality:
Under the principle of network neutrality applicable to Internet access services area, network operators are not permitted to establish technical or commercial restrictions regarding the terminals that can be connected or the services, or applications and contents that can be accessed or distributed through the Internet by the end user. It also refers to the non-discriminatory behavior (e.g. non-anticompetitive) to be adopted by operators regarding the different types of Internet traffic circulating through their networks.
|
Digital Single Market
Among the most relevant regulatory initiatives we can find the following:
|
•
|
Package of measures to boost the Connectivity in the Single Digital Market - towards the European Gigabit Society
.
|
|
•
|
Network and Information Security:
According to Directive 2016/1148 of the EP and of the Council, the providers of essential facilities are obliged to take appropriate security measures and report incidents to the national authorities.
|
|
•
|
Content Package:
|
|
•
|
On November 28, 2018, the
new audiovisual Directive (AVMS)
has been published in the Official Journal of the European Union. The text came into force on December 19, and must be transposed into national law in the EU member States within
21
months (by September 19, 2020). Among the main novelties, it includes greater protection of children, limits on advertising and boost to European production. Rules will apply to television channel and also to video-on-demand platforms and distribution of videos, as well as to live broadcasts on these platforms. In particular video sharing platforms will be obliged to reserve at least
30%
of European production in their video catalogs on demand. In addition, Member States may impose financing obligations to providers of VOD services established in another Member State but offering services in their countries.
|
|
•
|
Regulation (EU) 2017/1128
on cross-border portability of online content services
is directly applicable in all Member States from April 1, 2018. This Regulation seeks to ensure that subscribers to online content services provided in their Member States of residence are able to access these services and use them when they are temporarily in other Member State which is not their Member State of residence.
|
|
•
|
The
Geo-Blocking Regulation
tries to limit geographically-based restrictions which undermine online shopping and cross-border sales. The Regulation was published in February 2018, being applicable from December 2018 and being reviewed in two years by the CE with the aim of assess any possible inclusion of copyright protected material within its scope of application. The final text has reached an agreement on some of the controversial points; in particular, copyright protected audiovisual content ended up being left out of the scope of the Regulation. This outcome is a positive result for rights holders and for pay TV services industries.
|
|
•
|
Copyright Package:
The EC presented a legislative package proposal in September 2016, regarding on the one hand, the proposed revision of the Cable and Satellite Regulation, and on the other, the revision of the Copyright Directive.
|
|
◦
|
Regarding the legislative processing of the
proposal on the Cable and Satellite Directive
, on December 13, 2018, the European Parliament and the Council reached an interim agreement on the future regulation. The Council has published its final compromise text on January 15, 2019.
Member States must incorporate the Directive into their national legislation within two years of its entry into force. The Directive will provide users of any Member State a greater variety of choice of TV programs and radio online originated in any EU country by facilitating licensing of material protected by Copyright rights included in these programs. Among the main measures, the Directive proposes: i) to promote cross-border provision of ancillary online services to broadcast (simulcasting and catch up) applying the principle of country of origin on remuneration rights, and, ii) to facilitate retransmission rights through other technologies apart from cable and satellite, such as IPTV, mobile and Internet (always
|
F-164
in a controllable environment) of TV and radio generated in other Member States applying the compulsory collective management regime.
|
◦
|
On February 13, an agreement between the Parliament and the Council has been reached as regards
the Copyright Directive proposal.
The main issues addressed therein are a further capacity of choice and access to online content and cross-border access. The proposal extends the scope of application of some exceptions and limitations in the fields of education, text and data mining for scientific research, cultural heritage and to improve a sustainable and a better balanced contractual relationship between authors and industries. Among other measures proposed, platforms would not automatically be legally responsible for hosting content for which they have not obtained a license. The value Gap article is much more focused on making sure that platforms are legally required to prevent unauthorized content from appearing online. It seems, cloud providers and internet access providers are expressly excluded from this obligation.
|
Data Protection
In relation with Data Protection & Privacy, the new General Data Protection Regulation (GDPR) of April 27, 2016, directly applicable in all member States in Europe from May 25, 2018, introduces administrative fines of up to
4%
of an undertaking’s annual global turnover for breaching the new data protection rules. Member States, among them Spain, Germany and United Kingdom have adopted implementing measures of this Regulation.
In Spain, on December 5, 2018 the Personal Data Protection and Digital Rights Act was approved. This Act implements GDPR in Spain, addressing several particularities concerning data blocking for judicial purposes or specific matters on databases for advertising purposes or data relating to deceased people. Equally, it implements procedural mechanisms within the framework of legal investigations concerning potential infringements of the GDPR.
On January 10, 2017, the EC put forward its proposal for a Regulation on ePrivacy, which will replace the current Directive 2002/58/EC on privacy in the electronic communications sector and will complement the GDPR. The EC proposal also introduces administrative fines of up to
4%
of an undertaking’s annual global turnover for breaching new regulation. In this area, a strict data protection and privacy regulation may result in limitations on the ability to offer innovative digital services. The future e-Privacy Regulation is not expected to be adopted before the end of 2019.
On the other hand, the Privacy Shield, approved by the EC on July 12, 2016 to lay out the framework for the international transfer of personal data from the EU to the US, was challenged before the EU's General Court by civil-society groups. One of the appeals was not admitted and the admission of a second appeal is still pending. The results of the second annual revision of the Privacy Shield by the Commission were published on December 19, 2018. The report concludes that the United States continues to guarantee an adequate level of protection of transferred personal data under the Privacy Shield and that the measures adopted by US authorities to implement the recommendations made by the Commission in 2017 report have improved the functioning of the framework.
Radio spectrum policy
On December 14, 2016, the three European institutions reached an agreement on how to coordinate the use of the
700
MHz band facilitating the introduction of 5G as of 2020. The
700
MHz band should be assigned to mobile operators and made available for wireless broadband use by June 30, 2020, at the latest, in all EU Member states. Duly justified exceptions on grounds defined in Decision 2017/899/CE are allowed until June 30, 2022.
EU competition law
European competition provisions have the force of law in Member States and, therefore, are applicable to our operations in those States.
The Treaty on the Functioning of the European Union (TFEU) prohibits “concerted practices” and any agreement between companies that may affect trade between Member States and that restricts or has the objective of restricting competition in domestic market. The Treaty also prohibits any abuse of dominant position within the European Union or any considerable part thereof that may affect trade between Member States.
The Community Merger Regulation requires that all mergers, acquisitions and joint ventures involving companies that meet certain volume thresholds are subject to review by the European Commission rather than the national competition authorities. In accordance with the amended Community Merger Regulation, market concentrations that significantly
F-165
impede effective competition in the market will be prohibited. The European Commission has the authority to apply the EU framework for the defense of the competition.
There are similar competition rules in the legislation of each Member State. Those responsible for ensuring compliance are the national competition authorities. All European countries in which Group Telefónica operates and to which we refer below are Member States of the European Union.
Spain
General regulatory framework
The legal framework for the regulation of the telecommunications sector in Spain is governed by the General Telecommunications Law (9/2014) of May 9. The main modifications of this Law compared to the previous one were the reduction of administrative burdens to boost networks deployments, as well as the adoption of complementary measures for boosting investment in telecommunications sector.
The Market and Competition National Commission, or CNMC, created by the Law 3/2013, assumed in 2013 its role as telecommunications and audiovisual service regulator in Spain. This organism is also the competition authority in Spain and the national regulatory authority for transport, postal services and energy.
The main licenses and concessions held by Telefonica in Spain are listed at the end of this Appendix VI under the title “Main concessions and licenses held by the Telefónica Group”.
Market analysis
The obligations imposed by the national regulator in the most relevant markets in which Telefónica is deemed to have Significant Market Power (SMP) are detailed below.
Fixed markets
Wholesale fixed access and call origination market
On January 17, 2017, the CNMC approved the definition and the analysis of the market for access and call origination on fixed networks. Considering that Telefónica has SMP, the CNMC imposed specific obligations to Telefónica regarding the provision of origination services, preselection and wholesale access service to the telephone line on a cost-oriented production, and regarding the implementation of an accounting system. Telefónica was imposed, among others, the obligation of no discrimination, transparency and separation of accounts.
Fixed call termination market on individual networks
In October 2014, the CNMC carried out a market analysis in terminated fixed networks, and concluded that every single provider, including Telefónica de España, are dominants in terminating fixed networks and, as a consequence, are obliged to provide the terminating service applying cost-orientation and non-discrimination obligations to the rest of operators, according to a purely incremental costs model. In fixed call termination market on IP networks, Telefónica de España is required to submit an “Interconnection Reference Offer” (IRO).
In December 2018, the CNMC has submitted to public consultation a new market analysis in fixed networks call termination, reaching the same conclusions as in the previous analysis, maintaining the regime of obligations for all operators. Relevant developments are the updating of terminating prices for the period 2019-2021, as well as the possibility of charging a surcharge for traffic originated outside the EU under the principle of reciprocity. The proposed prices are as follows: from the date the decision becomes effective until December 31, 2019 at €0.0640 per minute; from January 1, 2020 until December 31, 2020 at €0.0591 per minute and from January 1, 2021 at €0.0542 per minute.
Mobile market
Mobile network call termination
In January 2018, the CNMC adopted the final decision setting the rate of MTR for mobile operators at 0.0067 €/min during the year 2019.
Wholesale (physical) to network infrastructure access and wholesale broadband access
F-166
In February 2016, the CNMC adopted a Resolution which established the elimination of the
30
Mbps limit and the incorporation of geographical segmentation to the regulation for the residential customers, so that Telefónica is not obliged to offer wholesale broadband services access (bitstream) in the most competitive areas (
66
cities).
In this sense, Telefónica de España is only obliged to offer its wholesale broadband access services (bitstream) for residential segment in non-competitive areas. The price of fiber wholesale access services is calculated under a model of economic replicability of Telefónica's retail offerings in the residential and business segments. The price of access services to the copper network is cost oriented. For the business segment, the Resolution requires Telefónica de España to offer its wholesale broadband access services both on the copper and fiber network, throughout the national territory. It is anticipated that this Resolution will last for at least four years. Its implementation is expected to result in a moderate increase of the current regulatory obligations of Telefónica in Spain, due to the mandatory granting of access to other operators to its fiber network, and due to certain aspects relating specifically to the business segment (high quality bitstream service for business customers with national coverage). This Resolution has been appealed by Telefónica de España.
On January 18, 2017, the CNMC adopted a Resolution which approved the reference offer of the new wholesale unbundled virtual access service to Telefónica's new broadband Ethernet service (local NEBA). NEBA services are expected to allow alternative operators more flexibility to structure their retail offers over Telefónica's fiber network. In March 2018, the CNMC approved the methodology to be used to assess the maximum wholesale access price which Telefónica could charge to other operators for accessing the optical fiber network in regulated areas (NEBA Local and NEBA services), set at
17.57
€/month.
This price will be updated twice a year in order to assess whether Telefonica's retail offers (broadband flagship products) are economically replicable with such price.
In July 2018, the CNMC approved the methodology to analyze whether Telefónica’s business offers can be replicated by other operators.
Those Resolutions has been appealed by Telefónica de España.
Universal service obligations
Telefónica de España has been designated the operator responsible for the provision of the connection to the public electronic communications network for a
three
-year maximum period (January 1, 2017 - December 31, 2019), with the possibility of establishing broadband data connection with a descending speed no less than
1
Mbit per second, and the provision of the public telephone service available from a fixed location.
On December 28, 2018, the Government approved by Royal Decree 1517/2018, the modification of the regulatory framework applicable to Universal Service, eliminating the obligation to provide telephone directories that was assigned to Telefónica de España, S.A.U. from January 1, 2017, but maintaining its designation as operator in charge for the provision of a sufficient supply of public payphones until December 31, 2019.
Spectrum
In July 2018, Telefónica Móviles España acquired a total of
50
MHz (
10
blocks of
5
MHz) in
3.6
-
3.8
GHz band in the bidding process called by the Ministry of Economic and Business. And, in August 2018, the Ministry of Economy and Business approved the transfer of
10
MHz in
2.6
GHz band from Aire Networks to Telefónica, as well as the subsequent assignment to the first of the same amount of spectrum in the Autonomous Community of Madrid and the Autonomous City of Melilla.
Contribution to RTVE funding
In August 2009, the Radio and Television Corporation Finance Law (
Ley de Financiación de la Corporación de Radio y Television Española
) was approved establishing that: (i) telecommunication operators which operate nationwide or at least in more than one region, have to pay a fixed annual contribution of
0.9%
of the invoiced operating income of the year (excluding the revenues of the wholesale reference market); and (ii) the concessionaire companies and providers of TV services which operate nationwide or at least in more than one region have to pay an annual fixed contribution to the RTVE funding as follows: (a)
3%
on the gross revenue of the year for open concessionaire companies or TV services providers; and (b)
1.5%
on the gross revenue of the year for concessionaire companies to provide Pay TV services.
Contributions made to the funding of RTVE were appealed by Telefónica España and Telefónica Móviles España. The proceedings are currently on hold waiting for the ruling on (i) a prejudicial question submitted by the National High Court to the Court of Justice of the European Union; and (ii) also on an unconstitutionality question submitted to the
F-167
Spanish Constitutional Court regarding compliance of the underlying law with the European legislation and the Spanish Constitution.
Acquisition of Distribuidor Oficial de Televisión, S.A. (DTS)
The Resolution of the CNMC of April 22, 2015 authorized the acquisition of the exclusive control of DTS (Distribuidor Oficial de Televisión, S.A.) by Telefónica de Contenidos, S.A.U. As a result of such authorization, the new entity assumed a set of commitments for a five-year period, which briefly are: i) the obligation to make available a wholesale offer of channels with premium content, that allows the replicability of Telefónica retail Pay TV offer; ii) the prohibition of including a period of permanence clause in contracts for Pay TV packages; iii) the prohibition of attract DTS customers for a period of two months; iv) the obligation to keep at least three international routes uncongested with three Internet Connectivity Providers; and v) the prohibition of formalizing exclusive contracts exceeding three years with content providers.
Germany
General regulatory framework
The European Union legislative framework was implemented in Germany at the end of June 2004, by the approval of Telecommunications Act (Telekommunikationsgesetz). Following the adaptation of the 2009 EU Telecom Package, the Telecommunications Act has been repeatedly amended over the last years. The national regulatory authority responsible for regulation of electronic communication networks and services is the Bundesnetzagentur, or BNetzA.
The main licenses and concessions held by Telefónica in Germany are listed at the end of this Appendix VI under the title “Main concessions and licenses held by the Telefónica Group”.
Spectrum
In Germany, on May 14, 2018 the Regulatory Agency for Electricity, Gas, Telecommunications, Post and Railway ("BNetzA") published Decisions I and II on the method to award frequencies nationwide, in the 2GHz band and a large part of the 3.6 GHz band. In addition, under the same decisions, BNetzA allocated 100 MHz in the 3.6 GHz band and also frequencies in the 26 GHz band, both for local/regional assignments upon application.
Subsequently, on November 26, 2018, BNetzA published Decisions III and IV establishing the conditions for frequency usage and auction rules on the above mention 2 GHz and 3.6 GHz bands (Auction Rules). The awarded rules include obligations for better coverage in both urban and rural areas, as well as along transport routes and, other conditions, such as the obligation to negotiate on national roaming and network sharing.
The above four decisions have been challenged in Court by Telefonica Deutschland Group. Nevertheless, Telefonica Deutschland Group submitted its application to the auction by January 25, 2019. The auction is scheduled to begin in the first quarter of 2019.
Local roaming
The government coalition is considering initiating a legislative process to introduce an enabling basis for local roaming in the near future, or the corresponding regulations in the current 5th TKG Amendment Act. BNetzA is to be authorized to order local roaming in locally limited areas with many coverage gaps on the basis of such authorization. This order is addressed to the mobile network operators who are in competition with each other. The legislative process is not expected to be completed before March 2019. Telefónica Deutschland Group does not believe that this legislative proposal requires any disproportionate intervention in the competitive mobile telephony market.
Overall mobile communications concept for 2019
In a resolution dated November 26, 2018, the BNetzA Advisory Council determined that it would like to develop an overall concept for the expansion of mobile communications networks in Germany by mid-2019 together with BNetzA, the German federal government, the Bundestag and the federal states. The aim of this concept is to develop a roadmap for the further development of mobile radio networks in rural areas. From the perspective of the Telefónica Deutschland Group, it is not expedient to develop such a concept without the participation of the market. The Telefónica Deutschland Group will therefore play an active role in the political process.
Market reviews
Mobile termination rates (MTR)
F-168
The MTR approved by BNetzA in its decision of March 6, 2017 were further reduced as planned from December 1, 2018 from 1.07 euro cents per minute to 0.95 euro cents per minute. This rate is effective until November 30, 2019. Approval procedures for the MTRs valid from December 1, 2019 will be conducted in 2019.
Fixed termination rates (FTR)
The FTR of
0.1
euro cents
per minute expired at the end of December 2018. Telefónica Deutschland Group has submitted a new rate application to BNetzA for the subsequent period. The FTRs of Telekom Deutschland GmbH serve as a reference benchmark for all the other fixed line operators. BNetzA set a new rate of 0.08 euro cents per minute by a provisional retroactive decision on January 16, 2019 symmetrical for all regulated fixed network operators with a duration until December 30, 2020. The decision needs to be notified with the European Commission. A final decision is expected by mid-2019.
BNetzA consultation and market studies on fiber optic infrastructures
The studies by BNetzA in 2017 on “Issues in rates regulation for FttH/B-based wholesale products with a view to the development of fiber optic infrastructures capable of high performance” as well as on the need for regulation and the existence of significant market power on markets 3a (wholesale local access provided at a fixed location) and 3b (wholesale central access provided at a fixed location for mass-market products) continued in 2018. The key aspect of these studies were questions of regulatory support for an accelerated roll-out of fiber optic networks based on rates and whether FttH/B-based wholesale products will continue to be assigned to the nationwide connection market in which copper-based connections and cable-based connections can also be found. Initial decisions are expected to be made in the second quarter of 2019 at the earliest.
Introduction of a regulated wholesale product “Super Vectoring” by Telekom
In August 2018, Telekom Deutschland GmbH expanded its product offering as part of its regulated wholesale service “Bitstream Access” to include “Super Vectoring” connections. This will significantly increase the potential bandwidth of VDSL connections compared to today (from max. 100 Mbit/s to up to 250 Mbit/s). Super Vectoring is not available nationwide, but Telekom is continuously upgrading its network infrastructure. The prices offered by Telekom for Super Vectoring were reviewed by BNetzA and considered competitive. An improvement in Telefónica Deutschland Group’s competitive position in the fixed line market is expected due to “Super Vectoring” as competitiveness versus cable network operators and FTTB/H providers can be improved.
United Kingdom
General legislative framework
The EU Regulatory Framework was implemented in the United Kingdom by the Communications Act in 2003. The Office of Communications, or Ofcom, is designated as the NRA responsible for the regulation of electronic communications networks and services.
The main licenses and concessions held by Telefonica in the United Kingdom are listed at the end of this Appendix VI under the title “Main concessions and licenses held by the Telefónica Group”.
Wholesale price regulation
Following a market review, mobile termination rates for all mobile providers, including the four national mobile communications operators are subject to controls based on the pure long-run incremental cost ("pure LRIC") approach.
The present mobile wholesale termination rate is
0.489
ppm. From April 1, 2019, it will be 0.479 ppm.
Ofcom is forecasting a rate of 0.471 ppm from April 1, 2020 to March 31, 2021.
Spectrum
From 2017, Telefónica United Kingdom has to maintain its obligations in the 800 MHz spectrum license, to provide indoor coverage to 98% of the United Kingdom population (and 95% of the populations of each of England, Wales, Scotland and Northern Ireland) and in its 900/1800 MHz spectrum license, to provide voice and text services to 90% of the UK landmass.
In an auction ending in April 2018, Telefonica United Kingdom won 20 year licences for 40 MHz of 2.3 GHz spectrum and 40 MHz of 3.4 GHz spectrum.
Ofcom is planning to auction 700 MHz and 3.6 GHz spectrum in the first quarter of 2020.
F-169
Brazil
General legislative framework
The delivery of telecommunications services in Brazil is subject to regulation under the regulatory framework provided in the General Telecommunications Law enacted in July 1997. The National Agency for Telecommunications (
Agência Nacional de Telecomunicações
or ANATEL), is the principal regulatory authority for the Brazilian telecommunications sector.
Brazilian competition regulation is based on Law No. 12529 of November 30, 2011. The Administrative Council for Economic Defense, or CADE, is the agency in charge of enforcing the competition rules.
The antitrust law establishes a pre-merger notification regime for concentration transactions, with new turnover thresholds (
one
participant with gross revenue of 750 million
Brazilian reals
in Brazil and other participant with gross revenue of
75 million
Brazilian reals
in Brazil) and maximum time length for merger review procedure (
240
days, extendable to
330
days).
On October 18, 2016, CADE issued the Resolution No 17, which changed the rules concerning the mandatory notification of the so called ‘associative agreements’. The new regulation tends to reduce notifications of associative agreements that do not raise antitrust concerns.
The main licenses and concessions held by Telefónica in Brazil are listed at the end of this Appendix VI under the title “Main concessions and licenses held by the Telefónica Group”.
Licenses
In Brazil, concessions are awarded for providing services under the public regime, while authorizations are granted for providing private regime services. The only service currently provided under both regimes is the Fixed Switched Telephony Service (STFC). All other services are provided under the private system only.
In the state of São Paulo, Telefônica Brasil provides local and national long-distance fixed switched telephony services (STFC) under the so-called public regime, through a concession agreement which is expected to remain in force until 2025. At December 31, 2018, estimated residual value of reversible assets was
8,622 million
Brazilian reals (approximately
1,943 million
euros under the exchange rate applicable on such date) (
8,763
million Brazilian reals as of December 31, 2017, approximately
2,209
million euros under the exchange rate applicable to such date), which comprised switching and transmission equipment and public use terminals, external network equipment, energy, system and operational support equipment. In principle, the assets assigned to the provision of STFC were considered reversible assets, and thus, supposed to be reverted to the Federal Union at the end of the concession agreement.
In this sense, a bill amending the regulatory framework in Brazil is in process, establishing, among other things, that such assets would no longer be reversible under a new license regime in exchange for significant broadband investment commitments. The bill has been approved at both legislative houses, but it has been challenged before the Federal Supreme Court due an alleged procedure misstep. Outcome of this lawsuit is uncertain, although the Senate's board may overcome it sending the bill for voting in the Plenary. In the event that the bill is finally approved, ANATEL would be entitled to adopt the relevant administrative decisions for the amendment of the respective licenses with the consequent amendment of the future obligations imposed on STFC providers. At the present time, there is no certainty that the proposed change in the regulatory framework will be completed, or that it will be completed in fully satisfactory terms for Telefónica Brazil. Only after this bill or a similar law is adopted (enabling the exchange of reversion obligations for investment commitments), could ANATEL impose the investment obligations referred to above.
As of the date of this Annual Report, it is not possible to estimate the hypothetical investment obligations that ANATEL could impose on the concessionaires, including Telefónica Brazil, in exchange for eliminating their obligation to revert assets used for the provision of the STFC services.
In addition, the General Plan for Universalization of Fixed Switched Telephony Services (PGMU) was published on December 21, 2018 (Presidential Decree n. 9.619/2018).
The document ensures three new exemptions, namely: (i) the material decrease of the maintenance obligations of Public Use Terminals; (ii) the material reduction of the obligations to meet requests for installation of individual accesses within 7 days; and (iii) the extinction of the obligations to install and maintain Multifacilities Service Stations.
F-170
Furthermore, the decree imposes a new obligation (corresponding in terms of value, to the exemption of public use terminals - Item “i” above): implementation of "fixed wireless access systems with support for broadband connection" through the implementation of a base radio station in 310 pre-determined localities in the State of São Paulo.
In the remaining states of Brazil, Telefônica Brasil provides local, and long-distance and international STFC service, personal mobile service, and broadband multimedia communication services (which includes the provision of fixed broadband connections) and Pay TV services, all under the private regime.
Radiofrequencies authorizations, for its turn, are granted for a limited period of time (maximum of
20
years, renewable once). The most important radiofrequencies authorizations held by Telefônica Brasil are those associated with the exploitation of mobile services and are described in the licenses section.
In 2014, ANATEL auctioned radiofrequencies licenses in the
700
MHz frequency and Telefônica Brasil acquired the license to use one of the bands. According to the bidding notice, the successful bidders were required to incorporate an independent entity to manage the whole reframing process of the
700
MHz
(currently, the band occupied by the free-to-air analog broadcasters). Successful bidders should also provide such entity with the financial and operational resources to provide equipment and support for the broadcasters and the final users (which, subject to certain conditions, will be entitled to receive Digital TV receivers). Federal regulation establishes a timeline to implement such reframing which is scheduled to be concluded by December 2018.
In September 2018, the Brazilian regulator, Anatel launched a first consultation to award spectrum in the 2.3 GHz TDD (time-division duplexing) band and spectrum in the 3.5 GHz TDD band. A consultation on the auction of the remaining spectrum in the 700 MHz band is expected to take place in the first half of 2019. Anatel’s 5G commission has also identified 1500 MHz which could be auctioned. An auction to award spectrum in any of these bands could take place in 2019 or 2020.
Interconnection, tariffs and prices
Interconnection among public networks is mandatory in Brazil. Generally, parties can freely negotiate the terms and conditions about technical points, economic discounts and rights/obligations, of the interconnection agreements. Interconnection rates for fixed network operators identified as operators with SMP
(Resolution No.
588
/
2012
) are defined by ANATEL; the interconnection rates for the use of mobile operators networks (Resolution No.
438
/
2006
), may be agreed between the parties. However, if the parties fail to reach a consensus, particularly regarding charges to fixed operators (Resolution No.
576
/
2011
),
ANATEL imposes the rates to be used. The mobile termination market is based on the model of incremental costs and, pursuant to applicable laws, reductions of VU-M must be reflected in VC1 (retail price paid by users for local fixed-mobile calls) and VC2 and VC3 (retail price paid by users for national long distance fixed-mobile calls).
The Telefónica Group, including VIVO, has been identified as an operator with SMP in the following markets: (i) fixed network infrastructure access for data transmission in copper pairs or coaxial cables at speeds up to
12
Mbps in the region of São Paulo; (ii) wholesale fixed network infrastructure to transport local and long distance transmission at speeds up to
34
Mbps in the region of São Paulo;
(iii) passive ducts and trenches infrastructure throughout Brazil; (iv) call termination on mobile network in Brazil; (v) national roaming market throughout Brazil.
ANATEL's Resolution no. 694/2018 in July 2018 changed the PGMC, which, besides others changes, recognized a new relevant wholesale market of high capacity data transport services with speeds higher than 34 Mbps, in which Telefónica is established as SMP throughout Brazil. There are pending administrative proceedings before ANATEL questioning the number of cities in which VIVO has been recognized as SMP.
In addition, operators without SMP are no longer entitled to charge fixed termination fees up to 20% higher than the highest fee adopted by fixed operators with SMP in the same region, since the publication of the Resolution no. 694/2018 in July 2018.
Further, ANATEL’s Resolution No. 694 of July 17, 2018, changed article 41 of the Appendix II of the General Plan of Competition Goals (PGMC), and established the “bill and keep” between SMP and the non-SMP operators as 50/50%, from February 24, 2018 for the next 4 years, when this might be revised by ANATEL. Accordingly, the VU-M values (in Brazilian reals) for 2019 applicable to Telefónica Brazil are the following: i) Region I: 0.01379; ii) Region 2: 0.01471; and iii) Region 3: 0.02517.
Regulation on Universal Service
F-171
Currently, only Fixed Switched Telephony Services are subject to
universalization
obligations. These obligations are established in the General Plan of
Universalization
Targets (
Plano Geral de Metas de Universalização
- PGMU) and can be reviewed every five years.
The PGMU containing targets for the period from 2011 to 2016 was approved by Decree 7,512/2011. Nevertheless, the plan, which should regulate the period from 2016 to 2020, was only published on December 21, 2018 (Presidential Decree No. 9,619/2018), after a long period of discussions between the public administration and the concessionaires.
The General Plan lessens the USO framework in three ways, namely: (i) there is a material decrease in the maintenance obligations with respect to Public Use Terminals; (ii) there is a material reduction of the obligations to meet requests for installation of individual accesses within seven days; and (iii) the extinction of the obligations to install and maintain Multifacilities Service Stations.
However, the General Plan imposes a new obligation with respect to "fixed wireless access systems with support for broadband connection" through the implementation of a base radio station in 310 pre-determined localities in the State of São Paulo.
Mexico
General regulatory framework
In Mexico, the provision of telecommunication services is governed by the Constitution and the Federal Telecommunication and Broadcasting Law (LFTy R), published on July 14, 2014, among others.
The Federal Telecommunications Institute (IFT) is the authority responsible for the regulation, promotion and supervision of the use, development and exploitation of radio spectrum, networks and the provision of broadcasting services and telecommunications, as well as the antitrust authority for broadcasting and telecommunications sectors. Furthermore, on August 26, 2015, a special division on Telecommunications affairs was established by the Consumers Affair Authority to monitor, coordinate, control, substantiate and resolve conciliation, arbitration and infringements, review, modification and grant the use of adhesion contracts in terms of Federal Consumer Act.
The IFT, as the Mexican national authority in communications and broadcasting sectors, declared in 2014 the “América Móvil Group” a preponderant operator in the telecommunications market, imposing it specific measures with asymmetric obligations in order to avoid damaging competition and free market participation. Within these measures are the imposition of a regulated framework interconnection agreement and a set of reference offers for: leasing of dedicated links, access and shared use of passive infrastructure in fixed and mobile networks, MVNOs, roaming and local loop unbundling. In this sense, on November 17, 2016, Telefónica México and América Móvil Group signed an agreement in order for America Móvil to provide the wholesale service of national roaming in the areas where Telefónica México currently has no coverage. This was done in light of the specific measures with asymmetric obligations imposed by the IFT to the Preponderant Economic Agent.
The Federal Law of Economic Competition published on May 23, 2014, its regulations and the Regulatory Provisions of the Federal Law of Economic Competition for telecommunications and broadcasting published by the IFT on January 12, 2015, constitute the applicable regulatory framework by the IFT in terms of economic competition for the broadcasting and telecommunications sectors.
Licenses
The main licenses and concessions to use spectrum are shown in the table at the end of this Annex.
Pegaso PCS, S.A. de C.V. (Pegaso PCS) has multiple licenses to use a public telecommunications network and to use spectrum for the provision of mobile and fixed local service nationwide, long distance and public telephony.
In August 2018, the IFT awarded Telefónica two blocks of
20
MHz on the
2500
-
2690
MHz band, which is considered technologically neutral. It will be used mainly to increase the capacity of existing LTE services. The rules and the procedure of the auction were challenged by a third-party operator and Telefónica has responded to the allegations.
The concessions in the 1900 MHz band expired in 2018 are on the renewal process. The IFT is expected to decide on the renewal of this concession during the first quarter of 2019. Telefónica may continue to use that spectrum while the IFT decision is pending.
Prices and tariffs
F-172
Tariffs charged to customers are not regulated. They are set by mobile operating companies and must be registered with the IFT, in order to be enforced.
Interconnection
On November 13, 2018, the IFT published the MTRs applicable to solve any conflicts regarding MTR during 2019. Such MTRs were set, for the Preponderant Economic Agent (Radiomóvil Dipsa, S.A. de CV- Telcel) at
0.028313
Pesos per minute, while for the non-preponderant ones they were set at
0.112623
Pesos per minute.
These rates were calculated using the same method that was used in 2018 but adjusting the variables in the cost model. Both this decision and the one that established the MTRs applicable to 2018 were challenged by Telefónica.
On June 21, 2012, the Secretary-General of the International Center for Settlement of Investment Disputes (ICSID) declared admissible the international arbitration filed by Telefónica, S.A. against Mexican United States. Telefónica, S.A. filed a lawsuit on September 20, 2013, claiming damages incurred as a consequence of several decisions of different Mexican regulatory and administrative bodies in interconnections disputes regarding MTRs. Mexican United States replied on February 28, 2014. On June 26, 2014, Telefónica filed its response and on October 17, 2014 Mexico filed its rejoined (
dúplica
).
Considering that, on the one hand, Mexico had substantially modified its Constitution regarding telecommunications in June 2013, approving a Federal Telecommunications Law in August 2014 and that, on the other hand, Telefónica México, under this new regulatory framework, was reaching voluntary agreements with other operators to resolve interconnection disputes from previous years, Telefónica, S.A. and the Mexican state entered into negotiations for a joint and friendly withdrawal from international arbitration. This led to the suspension of the procedure on March 18, 2016. In January 2018, a joint dismissal was presented by both parties before the arbitration tribunal, requesting the tribunal to finalize the arbitration. Such finalization will be agreed in the following weeks.
Foreign ownership/restrictions on transfer of ownership
Since the amendments to the Constitution published in June 2013 foreign investment (FDI) up to
one hundred percent
in telecommunications is allowed.
Chile
General regulatory framework
The General Telecommunications Law No. 18168 of 1982, as amended, establishes the legal framework for the provision of telecommunications services in Chile. The main regulatory authority in Chile is SUBTEL (the Under-Secretary of Telecommunications). On February 13, 2014, the Regulation on Telecommunications Services was published and came into force on June 14, 2014, regulating a number of new services as Internet, Pay TV, etc.
In May 2014, law No. 20750 allowing the introduction of DTT was published in the Official Journal. It set an extensible deadline of
5 years
for the blackout analog. It also set forth that the concessions of free-to-air broadcasting could be nationwide, regional, local and with European coverage. It also set forth the mandatory application of “Granted Retransmission” when two requirements are met: (i) digital coverage for at least
85%
of the total population in the service area and (ii) the “must carry” of, at less
four
regional channels (as long as it is technologically feasible and the service area remains unaltered) is fulfilled. It also established that football matches of Chilean national soccer team would be broadcasted by free-to-air channels. On April 15, 2015, SUBTEL published in the Official Journal the Digital Broadcasting TV Plan.
The principal regulation concerning competition in Chile is Decree No. 211 of 1973, whose current text was established in Law Decree No. 1 of 2005 (
Ministerio of Economía, Fomento y Reconstrucción
). The Competition Court deals with infringements of competition law. This Law Nº 20.945 was published on August 30, 2016. The law increases the administrative fines up to
30%
of
the sales relating to the product line or services associated with the infringement during the period in which the alleged infringement took place, or up to the double of the economic profit reached by the infringement.
Other relevant laws that have an impact on the operation are Law No. 20,808, published in the Official Gazette on January 28, 2015, which protects the free choice of users in cable, Internet or telephony services, and Law No. 21,046 that establishes the obligation of a guaranteed minimum speed of Internet access, published in the Official Gazette of November 25, 2017.
Licenses
F-173
The main licenses and concessions to use spectrum are shown in the table at the end of this Annex.
Additionally, Telefónica Chile has been granted licenses of public local phone services, Voice Over Internet Protocol services, concessions of long distance and concessions to install and exploit the national fiber optic network and mobile satellite.
2.6
GHz
and 700 MHz concessions established an obligation for Telefonica Móviles Chile to provide a wholesale service to MVNOs, for what the latter had to published a completely Facilities Offer (including prices), available in non-discriminatory terms.
In September 2015, Decree No. 71/2015 of the Ministry of Transport and Telecommunications was published in the Official Journal, which granted to Telefonica Móviles Chile a service concession for transmitting data on the
713
-
748
MHz and
768
-
803
MHz frequency bands. A frequency block at the national level of
2
x
10
MHz
was also awarded to the company through an auction procedure. The deadline to start providing the services contained in the commercial project expired on September 14, 2017, and for locations, routes and compulsory schools (remunerations) expired on March 14, 2017. Due to causes of force majeure, certain areas and mandatory routes were authorized to start services on October 30, 2017. Both the commercial project and the considerations received were accepted by the regulator within the committed deadlines.
Telefónica Móviles Chile, S.A. and other two telecommunications operators were awarded spectrum in the
700
MHz band in March 2014, with Telefónica Móviles Chile being awarded
2
x
10
MHz. While services are being provided on such spectrum, a consumer organization filed a claim before the Tribunal for the Defense of Free Competition (the "TDFC") against Telefónica Móviles Chile, S.A. and the other two operators, regarding the allocation of spectrum in the
700
MHz band and challenging the outcome of the spectrum allocation. The TDFC rejected this claim on consecutive occasions but, on 25 June 2018, the Supreme Court issued a final judgment stating that the assignment of spectrum in the
700
MHz band to the mobile operators constituted anticompetitive behavior as it awarded spectrum blocks without respecting the
60
MHz spectrum cap set by the Supreme Court in a ruling from 2009.
The Supreme Court ruled that the incumbent operators have to relinquish the same amount of spectrum that they acquired in the 700 MHz band auction. However, the ruling of the Supreme Court allows the operators to choose the band from which the spectrum that exceeds the fixed cap (60 MHz) is to be relinquished and no deadline has been set to complete such relinquishment. As of the date of this Annual Report, Telefónica Móviles Chile, S.A has not relinquished any of the required spectrum, since the procedure is temporally suspended due to resolution issued by Constitutional Court on January 29, 2019.
The Supreme Court ruling also states that if the sector-specific authority ("Subtel") considers it necessary to review the maximum spectrum cap, it should put in place a consultation process before the TDFC. Subtel must otherwise initiate the necessary procedures to adapt the set cap to the fixed parameters of 60 MHz for each participating operator in the aforementioned radio spectrum. On October 3, 2018, Subtel sumbitted its proposal on the review of the maximum spectrum cap to the TDFC.
Additionally, Subtel submitted he TDFC a proposal of “complementary conditions” with a general scope which would be applicable to all bands, as well as another proposal of “special conditions” to be considered in future auctions. The TDFC set a deadline of December 28, 2018 for interested parties to provide their comments. The process initiated by the TDFC is expected to last several months.
In addition, the Supreme Court rejected the appeal filed by Telefónica Móviles Chile, S.A. against the resolution of the TDFC that ordered immediate compliance with the spectrum relinquishment obligations, without waiting for the result of the spectrum cap consultation.However, on January 29, 2019, the Constitutional Court temporarily suspended the obligation to immediately comply with such spectrum relinquishment obligations until the remedy of inapplicability that has been filed by Telefónica is resolved.
Additionally, regarding the 3.5 GHz band, Subtel issued a decision on June 21, 2018 regarding the 3.4-3.8 GHz spectrum band, which, among other things, has suspended the granting of authorizations, the modification of concessions and the reception of network roll-outs in connection with this spectrum band. Its purpose is to carry out an in-depth study on the efficiency of the usage of this band for 5G and with the purpose of ensuring the efficient usage of this band in light of international best practices and the need for efficient spectrum management. The decision had a limited impact on Telefónica's operations as Telefónica Chile, S.A. only has 50 MHz of spectrum assigned in that band in Regions XI and XII (representing less than 2% of the population) and that spectrum is currently not in use. On October 3, 2018, Subtel modified the above mentioned resolution and resolved to release part of this spectrum to enable operators to provide wireless fixed services. Of the 50 MHz awarded to Telefónica Chile, S.A., 30 MHz were
F-174
lifted and may only be used for mobile services, which is a required change for 5G provision, once future auctions on 3400-3800 MHz range are firmly awarded. The remainder of the spectrum may not currently be used for any service.
On November 20, 2018, Telefónica Chile, S.A. requested the TDFC to initiate a consultation process to determine whether the decision of Subtel regarding 3.5 GHz band violates competition law. The deadline for third parties to provide background information expired on February 18, 2019.
Prices and tariffs
Public telecommunication services prices and prices for intermediate telecommunication services are freely established by operators, unless there is an express resolution by Chile's Competition Court on existing conditions in the market confirming that there is not enough competition. Additionally, maximum prices for interconnection services (access charges for network use, mainly) are subject to tariff regulation for all operators, being set by stipulated procedures.
The Ministries set maximum tariffs under efficient operator model basis.
Maximum tariffs for telephony services are set every five years jointly by the Ministry of Transport and Telecommunications and the Ministry of Economy.
Interconnection
Interconnection is obligatory for all license holders with the same type of public telecommunications services and between telephony public services and intermediate services that provide international long distance services. Every
five years
, SUBTEL sets the applicable tariffs for services provided through the interconnected networks.
A Tariff Decree regarding fixed termination rate was adopted for the 2014-2019 period. The new tariff came into force on May 8, 2014, and it applied a reduction of
37%
from the one demanded the previous period.
Regarding mobile termination rates, on February 5, 2019, Subtel notified TMCH a new proposal on tariff decree, which will be applicable for the next 5 years, The average tariff which will apply until 2024 was 1.8 CLP per minute (0.0024 euros , without VAT, based on the exchange rate as of February 6, 2019, to be charged on a per second basis). The validity of the new tariff decree starts on January 26, 2019. New tariffs on fixed operations will come into force in May 2019.
Argentina
General regulatory framework
The basic legal framework for the provision of telecommunications services in Argentina is set forth in the Law “Argentina Digital” No. 27078 issued on January 7, 2015. This legal framework declared of public interest the development and regulation of information technology, communications and its associated resources (TIC´s). Thus, this law became the specific regulatory regime for the free market, including rules on interconnection, universal service and radio spectrum, and setting out the principles of network neutrality and giving to the technological, informational and communicational companies the possibility of providing broadcasting services (except satellite infrastructure), and setting a single license system.
Additionally, the Government approved the Decree No. 267/2015, published in the Official Gazette on January 4, 2016, which amended the Argentina Digital Act creating the National Communication Agency (ENACOM), which is the continuation of the Federal Authority for ICTs (
Autoridad Federal de Tecnologías de la Información y las Comunicaciones
). Additionally, the Decree No. 1340/2016, which was published on January 2, 2017 instructed the
Ente Nacional de Comunicaciones
to issue new regulations during 2017 which would ensure the allocation of new frequency bands for provision of wireless or fixed wireless services and would enable the reassignment of frequencies previously granted to other providers. Furthermore, it confirmed the authorization to Telefónica de Argentina and Telefónica Móviles Argentina to provide broadcasting services by subscription from January 1, 2018 in the cities of Buenos Aires, Córdoba y Rosario, while a mechanism is established for the rest of the country based on the protection of small and medium-size providers and cooperatives. Finally, some standards were set forth in the law for the establishment of the Interconnection Regulation, such as the asymmetric rates regime and the automatic roaming service.
Furthermore, “Law on Defense of Competition” No. 27442 prohibits any acts or behaviors contrary to such law and establishes an authority of competition that is pending to be constituted In the meantime, the Secretary of Commerce continues to act, assisted by the National Commission for the Defense of Competition created by Law No. 22262.
F-175
Licenses
The main licenses and concessions to use spectrum are shown in the table at the end of this Annex.
Additionally, Telefónica de Argentina has licenses for an indefinite period of time for the provision of communications services; local telephone services; long-distance national and international, telex, international communication and data transfer services; national and international value-added services, and other telecommunication services provided by the different license agreements entered into with the National State, and administrative acts entered into with the National State.
Since the promulgation of the “Argentina Digital” legal framework No. 27078, the licenses system became a license-only system, without prejudice to the corresponding inscription of each service in the terms that the Authority of Application determines, and has national scope. For this purpose, the legal framework contained transitional provisions under which licenses outstanding at the time of the promulgation of that Act that were called “Single Telecommunication Service License” would be considered under the new regime as “Single Argentina Digital License” with the same content, scope and effects.
Otherwise, Argentina Digital Act No. 27078 ruled that the telecommunication licensees may require a license to provide subscription television services, except those provided through a satellite link. Nevertheless, from the promulgation of the Decree No. 267/2015, amending the aforementioned Act, some telecommunication licensees, including Telefónica de Argentina, S.A. and Telefónica Móviles Argentina, S.A., may provide broadcasting services by subscription since January 1, 2018 in certain areas and will be able to progressively extend to others.
On January 21, 2019, the government issued a decree (
Decreto de Necesidad y Urgencia
) that contemplates the possibility of auctioning the spectrum previously reserved for ARSAT (a public company). The spectrum that was reserved for ARSAT includes 20 MHz in the 700 MHz band (national), 50 MHz in the AWS band (national) and 20 MHz in the 1900 MHz band (regional).
Prices and tariffs
Additionally, the “Argentina Digital” legal framework establishes that providers of TIC´s services may freely set rates and/or prices for their service which shall be reasonable and fair, covering all the operation costs and a consequent reasonable profit margin. The Law also declares that the basic telephone service maintains the condition of “public service”.
Interconnection
The National Entity of Communications (ENACOM) has the power to control prices and tariffs, and also to set them in order to the general costs or other compensation mechanism.
The Ministry of Modernization issued resolution 286/2018 establishing a new interconnection regulation. Based on this, ENACOM set a local termination rate in the Fixed Telephony Service's networks equivalent to US $ 0.0045 per minute, for the local transit service a rate equivalent 0.0010 dollars per minute and for the service of long distance transport a rate equivalent to 0.0027 dollars per minute. A rate of 0.0108 dollars per minute applies to termination services in mobile networks
Colombia
General regulatory framework
In Colombia, telecommunications are a public service subject to state regulation and oversight. Law 1341/2009 (Technologies of Information and Communications Law) reformed the legal framework, establishing the general regime for information and communication technologies. Under this law, providers of network and telecommunications services in Colombia must register with the Information and Communication Technologies Minister. In addition, operators must obtain a concession from the National Television Authority (previously a Commission) in order to provide television services. The Colombian telecommunications regulator is the
Comisión de Regulación de Comunicaciones
or CRC, and the authority in charge of the spectrum is the
Agencia Nacional del Espectro
or ANE.
The Colombian competition law is included in Law No. 155/1959, Decree No. 2153/1992 and Law No. 1340/2009 on restrictive trade practices. The Superintendent of Industry and Commerce is the Colombian competition authority.
Licenses
F-176
The main licenses and concessions to use spectrum are shown in the table at the end of this Annex.
Additionally, Colombia Telecomunicaciones, S.A. ESP (ColTel) adopted on November 8, 2011 the general entitled regime of approval established in law No. 1341/2009, which allows ColTel to continue providing network and communications services, like added-value services, carrier national services and mobile services, amongst others. In addition, ColTel holds a concession in order to provide satellite TV (DBS) or Direct Home TV (DTH), which was renewed on February 22, 2017.
The Ministry of Information Technologies and Communications (ITC) issued resolution 597 on March 27, 2014 to renew
850
MHz/
1900
MHz band licenses for
ten
additional years. Under the scope of such resolution, ColTel (
67.5%
of which is owned, directly and indirectly, by Telefónica and
32.5%
of which is owned by the government of the Colombian Nation) renewed its license to exploit such radioelectric spectrum to provide telecommunication services.
The concession agreements from 1994, which were renewed in 2004 and under which the mobile telephone services were provided until November 28, 2013, contained a reversion clause for the underlying assets. Law 422 of 1998 and Law 1341 of 2009 clarified that upon expiration of a concession agreement for telecommunication services, only the spectrum reverts to the State. That was the understanding under which all the operators, including the authorities, were operating between 1998 and 2013. In 2013, however, when analyzing an appeal on the constitutionality of said laws, the Constitutional Court confirmed the constitutionality of the laws but clarified that it could not be concluded that those laws modified with retroactive effect the reversion clause of the concession agreements of 1994. On February 16, 2016, the ITC started an arbitration proceeding in accordance with the terms of the relevant concession agreement of 1994, in order to clarify the validity and scope of such reversion clause. On July 1, 2016, the co-defendant concession holders (including ColTel) filed a response to the claim prompted by the ITC. The arbitration award was rendered on July 25, 2017 and was not favorable for ColTel and its co-defendants.
The arbitration tribunal ordered ColTel to pay
1,651,012 million
Colombian Pesos, after finding on August 4, 2017 that an arithmetic error led to a minor amendment decreasing the amount contained in the original award from July 25, 2017. On August 29, 2017, the shareholders' meeting of ColTel approved a capital increase in a total amount of
1,651,012 million
Colombian pesos,
470 million
euros at the exchange rate as of such date, to pay the amount imposed by the arbitration award. The Telefónica Group and the Colombian government subscribed the capital increase pro rata to their respective shareholding in ColTel. Telefónica's decision to participate in the capital increase does not constitute, and should not be understood as, an acceptance of the arbitration award. Telefónica reserves all of its legal rights and the exercise by Telefónica or ColTel of any applicable legal action, national or international. Both ColTel and Telefónica have started legal actions. On August 18, 2017, ColTel filed an appeal to challenge the arbitration award at Colombia's highest court of administrative litigation (
Consejo de Estado
).
This appeal was dismissed by resolution of May 24, 2018. In addition, on December 18, 2017, ColTel also filed a constitutional action “acción de tutela” seeking to protect its constitutional rights jeopardized by the arbitration award. On March 15, 2018, the constitutional action was denied and ColTel filed an appeal against this ruling on April 18, 2018, which was dismissed on May 24, 2018. On November 27, 2018, a recusal motion was filed at the Constitutional Court, which is pending for resolution.
On the other hand, pursuant to the relevant bilateral treaty, Telefónica notified Colombia of its intention to file an International Center for Settlement of Investment Disputes (ICSID) claim after the expiration of the 90-day notice period. After the expiration of such deadline, on February 1, 2018, Telefónica submitted the arbitration request to the ICSID. Telefónica submitted the arbitration request to the ICSID and, on February 20, 2018, the General Secretary of ICSID registered the request for the institution of arbitration proceedings. The request for arbitration is ongoing and the arbitral tribunal is in the process of being appointed.
Regarding use of spectrum, the consultation processes launched in 2017 and early 2018 on the conditions of 700MHz spectrum auction were suspended following the change of government that took place in August 2018. The new government announced the submission of a draft bill on information and communications technologies, including an extension to the duration of the licenses for the use of the spectrum. This might have an impact on the timing of the auction. This initiative will be debated in the first quarter of 2019.
Interconnection
Mobile and fixed operators in Colombia have the right to interconnect to other operators’ networks. Before the intervention of regulatory authorities, operators must attempt direct negotiations. Interconnection must assure compliance with the objectives of non-discriminatory treatment, transparency, prices based on costs plus a reasonable profit and promotion of competition.
F-177
In February 2017, the
Comisión de Regulación de Comunicaciones
(CRC) published resolution 5108 establishing, starting in 2017, symmetric reductions of
11.4
COP per minute and
4.3 million
COP per monthly capacity to the termination rates for established operators and asymmetric termination rates of
24.58
COP per minute and
9.8 million
COP per monthly capacity for new entrant operators in a
five
-year period.
The CRC also adopted measures to promote the entry of MVNOs, including the regulation of prices for the access to the mobile networks.
In December 2018, the regulator (Comisión de Regulación de Comunicaciones) published two consultations. The first initiative would reduce the FTRs from 0.01 to 0.003 USD in 2019, which would be beneficial to ColTel as it is a net payer of FTRs. As of 2020, FTRs between fixed networks would be completely eliminated. The second initiative on one hand, seeks to substitute the national roaming charges n incoming calls for operators using National Roaming, for mobile termination rate, which would negatively impact the revenues of ColTel. In the other hand, modifies the formula that defines the regulated rate for network provision for MVNO, from the minimum ARPU reported to the average ARPU from the past four quarters.
|
Value/year/ COP$
|
2018
|
|
|
MTRs
|
||
|
Charge per minute
|
10.99
|
|
|
% Reduction
|
42.2
|
%
|
|
Capacity Charge
|
4,273,389.92
|
|
|
% Reduction
|
43.9
|
%
|
|
FTRs
|
|
|
|
Charge per minute (average)
|
40.62
|
|
|
Capacity Charge (average)
|
11,101,266.7
|
|
Prices and tariffs
The Technologies of Information and Communications Law provides for a free pricing system for communication services, unless there are market failures or quality problems. From 2016 retail tariffs for fix to mobile calls are no longer regulated except for TIGO (one of the commercial names under which Colombia Movil operates) which still holds concession for the provision of personal communication services (PCS´s).
Television services
The Colombian national Television V authority (Autoridad Nacional de Televisión or ANTV) published the payment regime applicable to subscription television operators for providing their services, which has been in force since November 1, 2017. This regime sets forth variable tariffs based on income or fixed tariffs per user (whichever is higher), based on the population of each municipality and aiming at reducing the current level of fees.
|
Fee
|
Population
|
2017-2018
|
2019->
|
||
|
Variable tariffs
|
>100,000
|
1.0%
|
$ 340
|
0.8%
|
$ 272
|
|
<100,000
|
0.4%
|
$ 88
|
0.3%
|
$ 66
|
|
|
Compensation
|
>100,000
|
4.9%
|
$ 1,666
|
4.3%
|
$ 1,462
|
|
<100,000
|
1.0%
|
$ 220
|
0.5%
|
$ 110
|
|
|
Fixed tariffs
|
$11,462,644
|
||||
On January 14, 2019, the ANTV published draft specifications of the allocation process that allows the satellite TV operators, such as Telefónica, to provide TV services supported in other technologies, such as IPTV or Cable.
According to the schedule set by ANTV, on February 11, 2019, will be published the definitive conditions of the allocation process, offers will be received until March 11, 2019 and the allocation hearing will take place on April 9, 2019.
F-178
Peru
General regulatory framework
The provision of telecommunications services in Peru is governed by the Telecommunications Law and related regulations. In July 2012, the Peruvian Congress approved the Law of Promotion of the Broad Band and Construction of the National Fiber Optic Backbone, Law No. 29904. This Law declared both (i) the construction of a National Fiber Optic Backbone available to the government to make possible the connectivity by the broad band; and (ii) the access and use of the infrastructure associated with the public services of energy and hydrocarbon to facilitate the display of the telecommunication network for the provision of the broad band of public necessity. In addition, Law No. 29904 implied that operators of electric, transport and hydrocarbon infrastructure projects would have to install fiber optic that would be available to the government and given in concession to telecommunication operators. Also, this law established that a percentage of the capacity of the National Fiber Optic Backbone would be reserved to the government to satisfy its necessities. Additionally, this Law incorporated the obligation of the Internet services providers to comply with the Net Neutrality regulations. In this sense, the NRA, the
Organismo Supervisor de las Telecomunicaciones
(OSIPTEL), adopted regulations aimed at providing clear guidelines on the implementation of the net neutrality regime adopted in Peru in 2012 that are in force since January 1, 2017.
Law No. 30083 was approved in September 2013, which seeks to strengthen competition in the public mobile market service by introducing MVNOs and mobile rural infrastructure operators (MRIO). Regulations developing the Act were published in August 2015.
The general competition framework in Peru is based on the Legislative Decree No. 1034. This Law it is applied, in the telecommunication sector, by OSIPTEL.
Licenses
The main licenses and concessions to use spectrum are shown in the table at the end of this Annex.
In October 2018, The Ministry of Transport and Communications approved a new regulation for the reorganization of frequency bands, known as "refarming". This could result in a spectrum award process in 2019 or 2020.
Additionally, Telefónica del Perú, S.A.A. provides nationwide fixed electronic communications services pursuant to two concession agreements issued by the Transports and Communications Ministry on May 16, 1994. Both agreements had a
20 years
term, subject to partial renewals for additional periods of
five years
up to a maximum of
20 years
. To date, three partial renewals have been approved and, consequently, the concession agreements have been extended until November 27, 2027. In December 2013, Telefónica del Perú, S.A.A. submitted to the Transport and Communications Ministry an application to renew its concessions to provide nationwide fixed telecommunications services for
five
additional years.
On November 26, 2018, the Ministry of Transportation and Communications notified the resolution that declared the denial of the renewal of such concessions. Telefónica presented an appeal for reconsideration. On February 5, 2019 the Ministry dismissed the mentioned appeal and Telefónica is considering to challenge the decision.
In December 2014, June 2016 and May 2017, Telefónica filed renewal requests for an additional twenty years in relation to a concession for the provision of local carrier services, to one of the concessions to provide mobile services in certain provinces, and to one concession to provide fixed-line services, respectively.
The cable distribution broadcasting service concessions were renewed in May 2016 until March 2032 and 2033, respectively.
In April 2016, Telefónica filed a renewal request in relation to the 1,900 MHz frequency spectrum for the Provincias (all of Peru except for Lima and Callao), which license expired in 2018. As of the date of this Annual Report, the decision of the Ministry of Transport and Communications in these proceedings is still pending and, according to the legislation, the underlying concessions remain in force as long as the proceedings are pending
Prices and tariffs
Tariffs for fixed telephony services must be approved by OSIPTEL in accordance with a price cap formula based on a productivity factor. Rates charged by mobile providers to their customers have been subject to a free tariff regime supervised by OSIPTEL. Tariffs must be reported to OSIPTEL prior to implementation. On May 19, 2016, OSIPTEL adjusted the tariff maximum rate applicable to local calls made from Telefónica del Perú S.A.A.’s fixed telephones to mobile networks in PEN
0.0017
per second without IGV. This new rate is in force since May 21, 2016.
Interconnection
F-179
OSIPTEL started in November 2016 the process to amend the maximum MTRs. On December 21, 2018, the regulator, OSIPTEL, published the new MTRs. The new MTRs applicable to all operators of mobile public services was fixed at $ 0.00302 per minute rated at the second, which entails a 54% decrease from the previous rate ($ 0.00661 per minute rated at the second). The new rates have been in effect since January 1, 2019 and will remain in effect until a new MTR value is defined by the regulator.
F-180
Main concessions and licenses held by the Telefónica Group
The following tables list the concessions and licenses as at December 31, 2018 to use spectrum for mobile services and selected other applications in each country.
|
EUROPE
|
Frequency
|
Bandwidth (MHz)
|
|
|
|
Year of Exp. Date
|
|
||
|
Spain
|
800
|
|
MHz
|
20
|
|
2031
|
|
||
|
|
900
|
|
MHz
|
29.6
|
|
2030
|
|
||
|
|
1800
|
|
MHz
|
40
|
|
2030
|
|
||
|
|
1900
|
|
MHz
|
5
|
|
2020
|
(1)
|
||
|
|
2100
|
|
MHz
|
29.6
|
|
2020
|
(1)
|
||
|
|
2600
|
|
MHz
|
40
|
|
2030
|
|
||
|
2600
|
|
MHz
|
20
|
|
(2)
|
|
2030
|
|
|
|
2600
|
|
Mhz
|
10
|
|
(3
|
)
|
2030
|
|
|
|
3.5
|
|
GHz
|
40
|
|
2020
|
(1)
|
|||
|
3.7
|
|
GHz
|
50
|
|
2038
|
|
|||
|
United Kingdom
|
800
|
|
MHz
|
20
|
|
Indefinite
|
(4)
|
||
|
|
900
|
|
MHz
|
34.8
|
|
Indefinite
|
|
||
|
|
1800
|
|
MHz
|
11.6
|
|
Indefinite
|
|
||
|
|
1900
|
|
MHz
|
5
|
|
Indefinite
|
|
||
|
|
2100
|
|
MHz
|
20
|
|
Indefinite
|
|
||
|
2300
|
|
MHz
|
40
|
|
Indefinite
|
(4)
|
|||
|
3.5
|
|
GHz
|
40
|
|
Indefinite
|
(4)
|
|||
|
Germany
|
700
|
|
MHz
|
20
|
|
2033
|
|
||
|
|
800
|
|
MHz
|
20
|
|
2025
|
|
||
|
|
900
|
|
MHz
|
20
|
|
2033
|
|
||
|
|
1800
|
|
MHz
|
20
|
|
2033
|
|
||
|
|
1800
|
|
MHz
|
20
|
|
2025
|
|
||
|
|
1900
|
|
MHz
|
5
|
|
2025
|
|
||
|
|
1900
|
|
MHz
|
5
|
|
2020
|
|
||
|
|
2000
|
|
MHz
|
14.2
|
|
2025
|
|
||
|
|
2100
|
|
MHz
|
39.6
|
|
2020
|
(5)
|
||
|
|
2100
|
|
MHz
|
29.7
|
|
2025
|
(5)
|
||
|
|
2600
|
|
MHz
|
60
|
|
2025
|
|
||
|
|
2600
|
|
MHz
|
20
|
|
2025
|
|
||
|
|
3.5
|
|
GHz
|
42
|
|
2021
|
(5)
|
||
(1) Additional
10 years
license extension until 2030.
(2) Regional licenses in Madrid and Melilla.
(3) National license excluding Madrid and Melilla
(4) In its initial term of
20 years
, will be renewed automatically after it (indefinite licenses)
(5)
2100
MHz and
3.5
GHz bands will be auctioned in 2019.
|
BRAZIL
(9)
|
Frequency
|
Bandwidth (MHz)
|
|
Year of Exp. Date
|
|
|||
|
450
|
|
MHz
|
14
|
|
(1)
|
2027
|
|
|
|
|
700
|
|
MHz
|
20
|
|
|
2029
|
|
|
|
850
|
|
MHz
|
25
|
|
(2)
|
2020-2028
|
(3)
|
|
|
900
|
|
MHz
|
5
|
|
(4)
|
2020-2023
|
(5)
|
|
|
1800
|
|
MHz
|
20-50
|
|
(6)
|
2020-2023
|
(5)
|
|
|
2100
|
|
MHz
|
30
|
|
|
2023
|
|
|
|
2500
|
|
MHz
|
40
|
|
(7)
|
2027-2031
|
(8)
|
(1) SP State (towns with CN 13 to 19), MG and North East (AL, CE, PB, PE, PI, RN e SE).
(2) Except regions 2', 4', 6', 7' and 10.
(3) Regional licenses: expiration and renewal dates are dependent on the region. The license in Rio de Janeiro is due to expire in 2020.
(4) Only in regions 3, 4, 4', 5, 6, 7, 8 and 9. Not in regions 1, 2, 2', 5', 6', 7' and 10.
(5) Regional licenses: expiration and renewal dates are dependent on the region. The license in MG Interior is the first to reach its renewal date in 2020.
(6)
20
MHz in regions 1,2`,3,3`,4,5,6,7 and 9,
25
MHz in regions 2 and 8,
30
MHz in regions 4` and 5`,
45
MHz in region 7` and
50
MHz in regions 6`, 7`` and 10
F-181
(7)
40
MHz in all regions of Brazil and additional
20
MHz in the cities of São Paulo, Rio de Janeiro, Florianópolis, Porto Alegre, Caxias do Sul, Palmas e Dourados
(8) Spectrum acquired in 2012 will expire in 2027, and spectrum acquired in 2015 will expire in 2031.
(9) Regional codes are included in Annex 1.
|
HISPANOAMÉRICA
|
Frequency
|
Bandwidth (MHz)
|
Year of Exp. Date
|
|
|||
|
Argentina
|
700
|
|
MHz
|
20
|
|
2033
|
|
|
|
850
|
|
MHz (AMBA)
|
30
|
|
Indefinite
|
|
|
|
850
|
|
MHz (Sur)
|
25
|
|
Indefinite
|
|
|
|
1900
|
|
MHz (AMBA)
|
20
|
|
Indefinite
|
|
|
|
1900
|
|
MHz (Norte)
|
50
|
|
Indefinite
|
|
|
|
1900
|
|
MHz (Sur)
|
25
|
|
Indefinite
|
|
|
|
1700
|
|
MHz/2100 MHz
|
20
|
|
2033
|
|
|
2600
|
|
MHz
|
30
|
|
2035
|
(1)
|
|
|
|
3.5
|
|
GHz
|
50
|
|
Indefinite
|
(2)
|
|
Chile
|
700
|
|
MHz
|
20
|
|
2045
|
(3)
|
|
|
850
|
|
MHz
|
25
|
|
Indefinite
|
|
|
|
1900
|
|
MHz
|
30
|
|
2032/2033
|
(4)
|
|
|
2600
|
|
MHz
|
40
|
|
2043
|
|
|
|
2600
|
|
MHz
|
12
|
|
2038
|
(5)
|
|
|
3.5
|
|
GHz
|
50
|
|
2037
|
(3) ; (6)
|
|
Colombia
|
850
|
|
MHz
|
25
|
|
2024
|
|
|
|
1700
|
|
MHz/2100 MHz
|
30
|
|
2023
|
|
|
|
1900
|
|
MHz
|
15
|
|
2024
|
|
|
|
1900
|
|
MHz
|
15
|
|
2021
|
|
|
Ecuador
|
850
|
|
MHz
|
25
|
|
2023
|
|
|
|
1,900
|
|
MHz
|
60
|
|
2023
|
|
|
Mexico
(7)
|
850
|
|
MHz (Reg. 1, 2, 3, 4)
|
20
|
|
2025
|
|
|
|
850
|
|
MHz (Monterrey and surroundings)
|
1.92
|
|
2025
|
|
|
|
1900
|
|
MHz (Reg. 1)
|
40
|
|
2018/2030
|
(8)
|
|
|
1900
|
|
MHz (Reg. 2)
|
50
|
|
2018/2030
|
(9)
|
|
|
1900
|
|
MHz (Reg. 3 and 7)
|
60
|
|
2018/2025/2030
|
(10)
|
|
|
1900
|
|
MHz (Reg. 4)
|
50
|
|
2018/2030
|
(11)
|
|
|
1900
|
|
MHz (Reg. 5)
|
50
|
|
2018/2025/2030
|
(12)
|
|
|
1900
|
|
MHz (Reg. 6)
|
60
|
|
2018/2030
|
(13)
|
|
|
1900
|
|
MHz (Reg.8 - Guerrero, Oaxaca, Puebla,Tiaxcala and Veracruz)
|
60
|
|
2018/2030
|
(14)
|
|
|
1900
|
MHz (Reg. 9 – México D.F.)
|
70
|
|
2018/2025/2030
|
(15)
|
|
|
2600
|
|
MHz (National)
|
40
|
|
2038
|
|
|
|
Peru
|
450
|
|
MHz
|
10
|
|
2028
|
(16)
|
|
|
700
|
|
MHz
|
30
|
|
2036
|
|
|
|
850
|
|
MHz
|
25
|
|
2030
|
(17)
|
|
|
900
|
|
MHz (Lima and Callao)
|
10
|
|
2028
|
|
|
|
900
|
|
MHz (Rest of provinces)
|
16
|
|
2028
|
(18)
|
|
|
1700
|
|
MHz/2100 MHz
|
40
|
|
2033
|
|
|
|
1900
|
|
MHz (Lima and Callao)
|
25
|
|
2030
|
|
|
|
1900
|
|
MHz (Rest of provinces)
|
25
|
|
2018
|
(19)
|
|
|
3.5
|
|
GHz
|
50
|
|
2027
|
(16)
|
|
Uruguay
|
700
|
|
MHz
|
30
|
|
2037
|
|
|
850
|
|
MHz
|
25
|
|
2024
|
|
|
|
|
1900
|
|
MHz
|
20
|
|
2022/2024
|
(20)
|
|
|
1900
|
|
MHz
|
40
|
|
2033
|
|
|
Venezuela
|
850
|
|
MHz
|
25
|
|
2022
|
|
|
|
1900
|
|
MHz
|
50
|
|
2022
|
|
|
|
1700
|
|
MHz/2100 MHz
|
20
|
|
2022
|
|
|
|
2600
|
|
MHz
|
40
|
|
2029
|
|
|
|
3.5
|
|
GHz
|
50
|
|
2026
|
(16)
|
|
Costa Rica
|
850
|
|
MHz
|
10.6
|
|
2026
|
|
|
1800
|
|
MHz
|
30
|
|
2026
|
|
|
|
|
1800
|
|
MHz
|
20
|
|
2032
|
|
F-182
|
|
2100
|
|
MHz
|
20
|
|
2026
|
|
|
2100
|
|
MHz
|
20
|
|
2032
|
|
|
|
El Salvador
|
850
|
|
MHz
|
25
|
|
2038
|
|
|
|
1900
|
|
MHz
|
30
|
|
2021
|
(21)
|
|
Guatemala
|
1900
|
|
MHz
|
80
|
|
2034
|
|
|
Nicaragua
|
700
|
|
MHz
|
40
|
|
2023
|
|
|
|
850
|
|
MHz
|
25
|
|
2023
|
|
|
|
1900
|
|
MHz
|
60
|
|
2023
|
|
|
|
1700
|
|
MHz/2100 MHz
|
40
|
|
2023
|
|
|
Panama
|
700
|
|
MHz
|
20
|
|
2036
|
|
|
|
850
|
|
MHz
|
25
|
|
2036
|
(22)
|
|
|
1900
|
|
MHz
|
20
|
|
2036
|
-22
|
(1) License covering
65%
of the population. Spectrum still being cleaned and assigned in certain regions.
(2) Local licenses.. Restricted to Fixed services.
(3) For more details on current
700
MHz and
3.5
GHz holdings situation, please refer to the Risk Factors Section.
(4)
20
MHz expires in November 2032;
10
MHz in April 2033.
(5) License in Santiago de Chile Metropolitan Region.
(6) License in Aysén and Punta Arenas Regions.
(7) Regional codes are included in Annex 2.
(8)
30
MHz expires in 2018, started the renewal process and an outcome is expected on 2Q 2019;
10
MHz in 2030.
(9)
30
MHz expires in 2018, started the renewal process and an outcome is expected on 2Q 2019;
20
MHz in 2030.
(10)
10
MHz expires in 2018, started the renewal process and an outcome is expected on 2Q 2019;
20
MHz expires in 2025;
30
MHz expires in 2030.
(11)
40
MHz expires in 2018, started the renewal process and an outcome is expected on 2Q 2019;
10
MHz in 2030.
(12)
10
MHz expires in 2018, started the renewal process and an outcome is expected on 2Q 2019;
20
MHz expires in 2025;
20
MHz expires in 2030.
(13)
30
MHz expires in 2018, started the renewal process and an outcome is expected on 2Q 2019;
30
MHz expires in 2030.
(14)
30
MHz expires in 2018, started the renewal process and an outcome is expected on 2Q 2019;
30
MHz expires in 2030.
(15)
30
MHz expires in 2018, started the renewal process and an outcome is expected on 2Q 2019;
10
MHz expires in 2025;
30
MHz expires in 2030.
(16) Restricted to Fixed services.
(17) Provinces of Lima and Callao: expiration date of March 2030; rest of provinces in December 2030.
(18) Used in rural areas.
(19) Under review. Extension requested on May 30, 2016. According to the law, the license maintains its validity until the Ministry of Transport and Communications decides.
(20)
10
MHz expires in 2022;
10
MHz in 2024.
(21) Started the process to extend the license period.
(22) Renewal agreement reached in February 2014.
Besides the spectrum assets included in the above tables, Telefónica owns other assets of spectrum used for other services in higher frequency ranges (above
6
GHz), including access transport.
F-183
ANNEX 1
|
BRAZIL'S SPECTRUM PORTFOLIO: MEANING OF THE STATES, REGIONS AND SECTORS ACRONYMS
|
|
|
Acronym
|
State
|
|
AC
|
Acre
|
|
AL
|
Alagoas
|
|
AP
|
Amapá
|
|
AM
|
Amazonas
|
|
BA
|
Bahia
|
|
CE
|
Ceara
|
|
DF
|
Distrito Federal
|
|
ES
|
Espírito Santo
|
|
GO
|
Goiás
|
|
MA
|
Maranhão
|
|
MT
|
Mato Grosso
|
|
MS
|
Mato Grosso do Sul
|
|
MG
|
Minas Gerais
|
|
PA
|
Pará
|
|
PB
|
Paraíba
|
|
PR
|
Paraná
|
|
PE
|
Pernambuco
|
|
PI
|
Piauí
|
|
RJ
|
Rio de Janeiro
|
|
RN
|
Rio Grande do Norte
|
|
RS
|
Rio Grande do Sul
|
|
RO
|
Rondônia
|
|
RR
|
Roraima
|
|
SC
|
Santa Catarina
|
|
SP
|
São Paulo
|
|
SE
|
Sergipe
|
|
TO
|
Tocantins
|
|
|
|
|
Regions
|
States & towns
included in the regions
|
|
1
|
SP (City)
|
|
2
|
SP (Interior)
|
|
2'
|
SP - towns of sector 33 of the GPLG
|
|
3
|
RJ y ES
|
|
4
|
MG
|
|
4'
|
MG - towns of sector 3 of the GPLG
|
|
5
|
PR y SC
|
|
5'
|
PR - towns of sector 20 of the GPLG
|
|
6
|
RS
|
|
6'
|
RS - towns of sector 30 of the GPLG
|
|
7
|
AC, DF, GO, MS, MT, RO y TO
|
|
7'
|
GO - towns of sector 25 of the GPLG
|
|
8
|
AM, AP, MA, PA y RR
|
|
9
|
BA y SE
|
|
10
|
AL, CE, PB, PE, PI y RN
|
F-184
|
Sectors
|
GPLG - general plan of the licenses granted (geographic areas that correspond to the sectors)
|
|
1
|
RJ
|
|
2
|
MG - except towns included in sector 3
|
|
3
|
MG - towns of Araporã, Araújo, Campina Verde, Campo Florido, Campos Altos, Canálopis, Capinópolis, Carmo do Paranaíba, Carneirinhos, Centralina, Comendador Gomes, Conceição das Alagoas, Córrego Danta, Cruzeiro da Fortaleza, Delta, Frutal, Gurinhatã, Ibiraci, Igaratinga, Iguatama, Indianópolis, Ipiaçú, Itapagipe, Ituiutaba, Iturama, Lagamar, Lagoa Formosa, Lagoa Grande, Limeira D'Oeste, Luz, Maravilhas, Moema, Monte Alegre de Minas, Monte Santo de Minas, Nova Ponte, Nova Serrana, Papagaios, Pará de Minas, Patos de Minas, Pedrinópolis, Pequi, Perdigão, Pirajuba, Pitangui, Planura, Prata, Presidente Olegário, Rio Paranaíba, Santa Juliana, Santa Vitória, São Francisco de Sales, São José da Varginha, Tupaciguara, Uberaba, Uberlândia, União de Minas & Vazante
|
|
4
|
ES
|
|
5
|
BA
|
|
6
|
SE
|
|
7
|
AL
|
|
8
|
PE
|
|
9
|
PB
|
|
10
|
RN
|
|
11
|
CE
|
|
12
|
PI
|
|
13
|
MA
|
|
14
|
PA
|
|
15
|
AP
|
|
16
|
AM
|
|
17
|
RR
|
|
18
|
SC
|
|
19
|
PR –except towns included of sector 20
|
|
20
|
PR – towns of Londrina and Tamarana
|
|
21
|
MS – except the town integrating of sector 22
|
|
22
|
MS – town of Paranaíba
|
|
23
|
MT
|
|
24
|
TO y GO – except towns included in sector 25
|
|
25
|
GO – towns of Buriti Alegre, Cachoeira Dourada, Inaciolândia, Itumbiara, Paranaiguara and São Simão
|
|
26
|
DF
|
|
27
|
RO
|
|
28
|
AC
|
|
29
|
RS
|
|
30
|
RS – towns of Pelotas, Capão do Leão, Morro Redondo and Turuçu
|
|
31
|
SP – except the towns included in sector 33
|
|
33
|
SP – towns of Altinópolis, Aramina, Batatais, Brodosqui, Buritizal, Cajuru, Cássia dos Coqueiros, Colômbia, Franca, Guaíra, Guará, Ipuã, Ituverava, Jardinópolis, Miguelópolis, Morro Agudo, Nuporanga, Orlândia, Ribeirão Corrente, Sales de Oliveira, Santa Cruz da Esperança, Santo Antônio da Alegria and São Joaquim da Barra
|
F-185
ANNEX 2
|
Mexico spectrum portofolio: meaning of the region numbers
|
|
|
Region 1
|
Baja California: Baja California, Baja California Sur, Sonora (San Luis Río Colorado).
|
|
Region 2
|
Sinaloa, Sonora (excluding San Luis Río Colorado).
|
|
Region 3
|
Chihuahua, Durango, Coahuila de Zaragoza (Torreón, San Pedro, Matamoros, Francisco I. Madero, Viesca).
|
|
Region 4
|
Nuevo León, Tamaulipas, Coahuila de Zaragoza (excluding municipalities of the North Region).
|
|
Region 5
|
Chiapas, Tabasco, Yucatán, Quintana Roo, Campeche.
|
|
Region 6
|
Jalisco (excluding municipalities of the Central Region), Michoacán de Ocampo, Nayarit, Colima.
|
|
Region 7
|
Guanajuato, San Luis Potosí, Zacatecas, Querétaro de Arteaga, Aguascalientes, Jalisco (Lagos de Moreno, Encarnación de Díaz, Teocaltiche, Ojuelos de Jalisco, Colotlán, Villa Hidalgo, Mezquitic, Huejuquilla el Alto, Huejúcar, Villa Guerrero, Bolaños, Santa María de los Ángeles).
|
|
Region 8
|
Veracruz-Llave, Puebla, Oaxaca, Guerrero, Tlaxcala.
|
|
Region 9
|
State of México, Distrito Federal, Hidalgo, Morelos.
|
F-186
TABLE OF CONTENTS
Part IItem 1. Identity Of Directors, Senior Management and AdvisorsItem 2. Offer Statistics and Expected TimetableItem 3. Key InformationItem 4. Information on The CompanyItem 4A. Unresolved Staff CommentsItem 5. Operating and Financial Review and ProspectsItem 6. Directors, Senior Management and EmployeesItem 7. Major Shareholders and Related Party TransactionsItem 8. Financial InformationItem 9. The Offering and ListingItem 10. Additional InformationItem 11. Quantitative and Qualitative Disclosures About Market RiskItem 12. Description Of Securities Other Than Equity SecuritiesPart IIItem 13. Defaults, Dividend Arrearages and DelinquenciesItem 14. Material Modifications To The Rights Of Security Holders and Use Of ProceedsItem 15. Controls and ProceduresItem 16. [reserved]Item 16A. Audit Committee Financial ExpertItem 16B. Code Of EthicsItem 16C. Principal Accountant Fees and ServicesItem 16D. Exemptions From The Listing Standards For Audit CommitteesItem 16E. Purchases Of Equity Securities By The Issuer and Affiliated PurchasersItem 16F. Change in Registrant S Certifying AccountantItem 16G. Corporate GovernancePart IIIItem 17. Financial StatementsItem 18. Financial StatementsItem 19. ExhibitsNote 1. Background and General InformationNote 2. Basis Of Presentation Of The Consolidated Financial StatementsNote 3. Accounting PoliciesNote 4. Segment InformationNote 5. Business Combinations and Acquisitions Of Non-controlling InterestsNote 6. Intangible AssetsNote 7. GoodwillNote 8. Property, Plant and EquipmentNote 9. Associates and Joint VenturesNote 10. Related PartiesNote 11. Financial Assets and Other Non-current AssetsNote 12. Receivables and Other Current AssetsNote 13. Other Current Financial AssetsNote 14. Breakdown Of Financial AssetsNote 15. EquityNote 16. Financial LiabilitiesNote 17. Derivative Financial Instruments and Risk Management PoliciesNote 18. Payables and Other Non-current LiabilitiesNote 19. Payables and Other Current LiabilitiesNote 20. Breakdown Of Contractual Assets and Liabilities, and Capitalized CostsNote 21. ProvisionsNote 22. Income Tax MattersNote 23. Revenue and ExpensesNote 24. Share-based Payment PlansNote 25. Cash Flow DetailNote 26. Other InformationNote 27. Finance LeasesNote 28. Operations Classified As Held For SaleNote 29. Events After The Reporting PeriodItem Date Maturity Date Currency Euros Currency Of Issuance Coupon