|
|
|
|
|
|
|
|
|
|
|
|
|
|
|
|
|
|
|
|
|
|
|
|
|
|
|
|
|
|
|
|
|
|
|
|
|
|
|
|
|
|
|
|
|
|
|
|
|
|
|
|
|
|
|
|
|
|
|
|
|
|
Use these links to rapidly review the document
TE CONNECTIVITY LTD. TABLE OF CONTENTS
TE CONNECTIVITY LTD. INDEX TO CONSOLIDATED FINANCIAL STATEMENTS
UNITED STATES
SECURITIES AND EXCHANGE COMMISSION
Washington, D.C. 20549
FORM 10-K
| (Mark One) | ||
| ý | ANNUAL REPORT PURSUANT TO SECTION 13 OR 15(d) OF THE SECURITIES EXCHANGE ACT OF 1934 | |
|
For the fiscal year ended September 28, 2018 |
||
|
or |
||
|
o |
|
TRANSITION REPORT PURSUANT TO SECTION 13 OR 15(d) OF THE SECURITIES EXCHANGE ACT OF 1934 |
001-33260
(Commission File Number)

TE CONNECTIVITY LTD.
(Exact name of registrant as specified in its charter)
|
Switzerland
(Jurisdiction of Incorporation) |
98-0518048
(IRS Employer Identification No.) |
Rheinstrasse 20, CH-8200 Schaffhausen, Switzerland
(Address of principal executive offices)
+41 (0)52 633 66 61
(Registrant's telephone number)
Securities registered pursuant to Section 12(b) of the Act:
| Title of each class | Name of each exchange on which registered | |
|---|---|---|
| Common Shares, Par Value CHF 0.57 | New York Stock Exchange |
Securities registered pursuant to Section 12(g) of the Act: None
Indicate by check mark if the registrant is a well-known seasoned issuer, as defined in Rule 405 of the Securities Act. Yes ý No o
Indicate by check mark if the registrant is not required to file reports pursuant to Section 13 or 15(d) of the Act. Yes o No ý
Indicate by check mark whether the registrant (1) has filed all reports required to be filed by Section 13 or 15(d) of the Securities Exchange Act of 1934 during the preceding 12 months (or for such shorter period that the registrant was required to file such reports), and (2) has been subject to such filing requirements for the past 90 days. Yes ý No o
Indicate by check mark whether the registrant has submitted electronically every Interactive Data File required to be submitted pursuant to Rule 405 of Regulation S-T during the preceding 12 months (or for such shorter period that the registrant was required to submit such files). Yes ý No o
Indicate by check mark if disclosure of delinquent filers pursuant to Item 405 of Regulation S-K is not contained herein, and will not be contained, to the best of registrant's knowledge, in definitive proxy or information statements incorporated by reference in Part III of this Form 10-K or any amendment to this Form 10-K. ý
Indicate by check mark whether the registrant is a large accelerated filer, an accelerated filer, a non-accelerated filer, a smaller reporting company, or an emerging growth company. See the definitions of "large accelerated filer," "accelerated filer," "smaller reporting company," and "emerging growth company" in Rule 12b-2 of the Exchange Act:
| Large accelerated filer ý | Accelerated filer o | Non-accelerated filer o | Smaller reporting company o | Emerging growth company o |
If an emerging growth company, indicate by check mark if the registrant has elected not to use the extended transition period for complying with any new or revised financial accounting standards provided pursuant to Section 13(a) of the Exchange Act. o
Indicate by check mark whether the registrant is a shell company (as defined in Rule 12b-2 of the Act). Yes o No ý
The aggregate market value of the registrant's common shares held by non-affiliates of the registrant was $36.3 billion as of March 30, 2018, the last business day of the registrant's most recently completed second fiscal quarter. Directors and executive officers of the registrant are considered affiliates for purposes of this calculation but should not necessarily be deemed affiliates for any other purpose.
The number of common shares outstanding as of November 8, 2018 was 343,034,000.
DOCUMENTS INCORPORATED BY REFERENCE
Portions of the registrant's Proxy Statement to be filed in connection with the registrant's 2019 annual general meeting of shareholders are incorporated by reference into Part III of this Form 10-K.
TE CONNECTIVITY LTD.
TABLE OF CONTENTS
i
SPECIAL NOTE ABOUT FORWARD-LOOKING STATEMENTS
We have made forward-looking statements in this Annual Report that are based on our management's beliefs and assumptions and on information currently available to our management. Forward-looking statements include, among others, the information concerning our possible or assumed future results of operations, business strategies, financing plans, competitive position, potential growth opportunities, potential operating performance improvements, acquisitions, divestitures, the effects of competition, and the effects of future legislation or regulations. Forward-looking statements include all statements that are not historical facts and can be identified by the use of forward-looking terminology such as the words "believe," "expect," "plan," "intend," "anticipate," "estimate," "predict," "potential," "continue," "may," "should," or the negative of these terms or similar expressions.
Forward-looking statements involve risks, uncertainties, and assumptions. Actual results may differ materially from those expressed in these forward-looking statements. Investors should not place undue reliance on any forward-looking statements. We do not have any intention or obligation to update forward-looking statements after we file this report except as required by law.
The risk factors discussed in "Risk Factors" and other risks described in this Annual Report could cause our results to differ materially from those expressed in forward-looking statements. There may be other risks and uncertainties that we are unable to predict at this time or that we currently do not expect to have a material adverse effect on our business.
ii
"TE Connectivity" and "TE Connectivity (logo)" are trademarks. This report further contains other trademarks of ours and additional trade names and trademarks of other companies that are not owned by TE Connectivity. We do not intend our use or display of other companies' trade names or trademarks to imply an endorsement or sponsorship of us by such companies, or any relationship with any of these companies.
© 2018 TE Connectivity Ltd. All Rights Reserved.
TE Connectivity Ltd. ("TE Connectivity" or the "Company," which may be referred to as "we," "us," or "our") is a global technology and manufacturing leader creating a safer, sustainable, productive, and connected future. Our connectivity and sensor solutions, proven in the harshest environments, have enabled advancements in transportation, industrial applications, medical technology, energy, data communications, and the home.
We became an independent, publicly traded company in 2007; however, through our predecessor companies, we trace our foundations in the connectivity business back to 1941. We are organized under the laws of Switzerland. The rights of holders of our shares are governed by Swiss law, our Swiss articles of association, and our Swiss organizational regulations.
We have a 52- or 53-week fiscal year that ends on the last Friday of September. For fiscal years in which there are 53 weeks, the fourth quarter reporting period includes 14 weeks. Fiscal 2018, 2017, and 2016 ended on September 28, 2018, September 29, 2017, and September 30, 2016, respectively. Fiscal 2018 and 2017 were 52 weeks in length. Fiscal 2016 was a 53-week year.
We operate through three reportable segments: Transportation Solutions, Industrial Solutions, and Communications Solutions. We believe our segments serve a combined market of approximately $190 billion. In fiscal 2018, our Subsea Communications business met the held for sale and discontinued operations criteria. As a result, we reclassified amounts previously reported to reflect this business as a discontinued operation in all periods presented. Prior to reclassification to discontinued operations, this business was included in our Communications Solutions segment.
Our net sales by segment as a percentage of our total net sales were as follows:
|
|
Fiscal | |||||||||
|---|---|---|---|---|---|---|---|---|---|---|
|
|
2018 | 2017 | 2016 | |||||||
|
Transportation Solutions |
59 | % | 58 | % | 58 | % | ||||
|
Industrial Solutions |
28 | 29 | 28 | |||||||
|
Communications Solutions |
13 | 13 | 14 | |||||||
| | | | | | | | | | | |
|
Total |
100 | % | 100 | % | 100 | % | ||||
| | | | | | | | | | | |
| | | | | | | | | | | |
| | | | | | | | | | | |
Below is a description of our reportable segments and the primary products, markets, and competitors of each segment.
1
Transportation Solutions
The Transportation Solutions segment is a leader in connectivity and sensor technologies. The primary products sold by the Transportation Solutions segment include terminals and connector systems and components; sensors; antennas; relays; application tooling; and wire and heat shrink tubing. The Transportation Solutions segment's products, which must withstand harsh conditions, are used in the following end markets:
- •
-
Automotive (74% of segment's net sales).
We are one of the leading
providers of advanced automobile connectivity solutions. The automotive industry uses our products in automotive technologies for body and chassis systems, convenience applications, driver
information, infotainment solutions, miniaturization solutions, motor and powertrain applications, and safety and security systems. Hybrid and electronic mobility solutions include in-vehicle
technologies, battery technologies, and charging solutions.
- •
-
Commercial transportation (15% of segment's net sales).
We deliver reliable
connectivity products designed to withstand harsh environmental conditions for on- and off-highway vehicles and recreational transportation, including heavy trucks, construction, agriculture, buses,
and other vehicles.
- •
- Sensors (11% of segment's net sales). We offer a portfolio of intelligent, efficient, and high-performing sensor solutions that are used by customers across multiple industries, including automotive, industrial equipment, commercial transportation, medical solutions, aerospace and defense, and consumer applications.
The Transportation Solutions segment's major competitors include Yazaki, Aptiv, Delphi, Sumitomo, Sensata, Honeywell, Molex, and Amphenol.
Industrial Solutions
The Industrial Solutions segment is a leading supplier of products that connect and distribute power, data, and signals. The primary products sold by the Industrial Solutions segment include terminals and connector systems and components; heat shrink tubing; relays; and wire and cable. The Industrial Solutions segment's products are used in the following end markets:
- •
-
Industrial equipment (52% of segment's net sales).
Our products are used in
factory automation and process control systems such as industrial controls, robotics, human machine interface, industrial communication, and power distribution. Our intelligent building products are
used to connect lighting, HVAC, elevators/escalators, and security. Our rail products are used in high-speed trains, metros, light rail vehicles, locomotives, and signaling switching equipment. Also,
our products are used by the solar industry. The medical industry uses our products in imaging, diagnostic, surgical, and minimally invasive interventional applications.
- •
-
Aerospace, defense, oil, and gas (30% of segment's net sales).
We design,
develop, and manufacture a comprehensive portfolio of critical electronic components and systems for the harsh operating conditions of the aerospace, defense, and marine industries. Our products and
systems are designed and manufactured to operate effectively in harsh conditions ranging from the depths of the ocean to the far reaches of space.
- •
- Energy (18% of segment's net sales). Our products are used by OEMs and utility companies in the electrical power industry and include a wide range of solutions for the electrical power generation, transmission, distribution, and industrial markets.
The Industrial Solutions segment competes primarily against Amphenol, Belden, Hubbell, Carlisle Companies, 3M, Integer Holdings, Esterline, Molex, and Phoenix Contact.
2
Communications Solutions
The Communications Solutions segment is a leading supplier of electronic components for the data and devices and the appliances markets. The primary products sold by the Communications Solutions segment include terminals and connector systems and components; relays; heat shrink tubing; and antennas. The Communications Solutions segment's products are used in the following end markets:
- •
-
Data and devices (58% of segment's net sales).
We deliver products and
solutions that are used in a variety of equipment architectures within the networking equipment, data center equipment, and wireless infrastructure industries. Additionally, we deliver a range of
connectivity solutions for the Internet of Things, smartphones, tablet computers, notebooks, and virtual reality applications to help our customers meet their current challenges and future
innovations.
- •
- Appliances (42% of segment's net sales). We provide solutions to meet the daily demands of home appliances. Our products are used in many household appliances, including washers, dryers, refrigerators, air conditioners, dishwashers, cooking appliances, water heaters, and microwaves. Our expansive range of standard products is supplemented by an array of custom-designed solutions.
The Communications Solutions segment's major competitors include Amphenol, Molex, JST, and Korea Electric Terminal (KET).
As an industry leader, we have established close working relationships with many of our customers. These relationships allow us to better anticipate and respond to customer needs when designing new products and new technical solutions. By working with our customers in developing new products and technologies, we believe we can identify and act on trends and leverage knowledge about next-generation technology across our products.
Our approach to our customers is driven by our dedication to further develop our product families and ensure that we are globally positioned to best provide our customers with sales and engineering support. We believe that as electronic component technologies continue to proliferate, our broad product portfolio and engineering capability give us a potential competitive advantage when addressing the needs of our global customers.
We manufacture and sell a broad portfolio of products to customers in various industries. Our customers include many of the leaders in their respective industries, and our relationships with them typically date back many years. We believe that our diversified customer base provides us an opportunity to leverage our skills and experience across markets and reduce our exposure to individual end markets, thereby reducing the variability of our financial performance. Additionally, we believe that the diversity of our customer base reduces the level of cyclicality in our results and distinguishes us from our competitors.
No single customer accounted for a significant amount of our net sales in fiscal 2018, 2017, or 2016.
3
We maintain a strong local presence in each of the geographic regions in which we operate. Our net sales by geographic region (1) as a percentage of our total net sales were as follows:
|
|
Fiscal | |||||||||
|---|---|---|---|---|---|---|---|---|---|---|
|
|
2018 | 2017 | 2016 | |||||||
|
Europe/Middle East/Africa ("EMEA") |
38 | % | 36 | % | 36 | % | ||||
|
Asia–Pacific |
34 | 35 | 35 | |||||||
|
Americas |
28 | 29 | 29 | |||||||
| | | | | | | | | | | |
|
Total |
100 | % | 100 | % | 100 | % | ||||
| | | | | | | | | | | |
| | | | | | | | | | | |
| | | | | | | | | | | |
- (1)
- Net sales to external customers are attributed to individual countries based on the legal entity that records the sale.
We sell our products into approximately 140 countries primarily through direct selling efforts to manufacturers. In fiscal 2018, our direct sales represented approximately 80% of total net sales. We also sell our products indirectly via third-party distributors.
We maintain distribution centers around the world. Products are generally delivered to the distribution centers by our manufacturing facilities and then subsequently delivered to the customer. In some instances, however, products are delivered directly from our manufacturing facility to the customer. Our global coverage positions us near our customers' locations and allows us to assist them in consolidating their supply base and lowering their production costs. We contract with a wide range of transport providers to deliver our products globally via road, rail, sea, and air. We believe our balanced sales distribution lowers our exposure to any particular geography and improves our financial profile.
We experience a slight seasonal pattern to our business. Overall, the third and fourth fiscal quarters are typically the strongest quarters of our fiscal year, whereas the first fiscal quarter is negatively affected by holidays and the second fiscal quarter may be affected by adverse winter weather conditions in some of our markets.
Certain of our end markets experience some seasonality. Our sales into the automotive market are dependent upon global automotive production, and seasonal declines in European production may negatively impact net sales in the fourth fiscal quarter. Also, our sales into the energy market typically increase in the third and fourth fiscal quarters as customer activity increases.
Customer orders typically fluctuate from quarter to quarter based upon business and market conditions. Backlog is not necessarily indicative of future net sales as unfilled orders may be cancelled prior to shipment of goods. Backlog by reportable segment was as follows:
|
|
Fiscal Year End | ||||||
|---|---|---|---|---|---|---|---|
|
|
2018 | 2017 | |||||
|
|
(in millions)
|
||||||
|
Transportation Solutions |
$ | 1,779 | $ | 1,681 | |||
|
Industrial Solutions |
1,245 | 1,032 | |||||
|
Communications Solutions |
441 | 418 | |||||
| | | | | | | | |
|
Total |
$ | 3,465 | $ | 3,131 | |||
| | | | | | | | |
| | | | | | | | |
| | | | | | | | |
We expect that the majority of our backlog at fiscal year end 2018 will be filled during fiscal 2019.
4
The industries in which we operate are highly competitive, and we compete with thousands of companies that range from large multinational corporations to local manufacturers. Competition is generally based on breadth of product offering, product innovation, price, quality, delivery, and service. Our markets have generally been growing but with downward pressure on prices.
We use a wide variety of raw materials in the manufacture of our products. The principal raw materials that we use include plastic resins for molding; precious metals such as gold and silver for plating; and other metals such as copper, aluminum, brass, and steel for manufacturing cable, contacts, and other parts that are used for cable and component bodies and inserts. Many of these raw materials are produced in a limited number of countries around the world or are only available from a limited number of suppliers. The prices of these materials are driven by global supply and demand.
Patents and other proprietary rights are important to our business. We also rely upon trade secrets, manufacturing know-how, continuing technological innovations, and licensing opportunities to maintain and improve our competitive position. We review third-party proprietary rights, including patents and patent applications, as available, in an effort to develop an effective intellectual property strategy, avoid infringement of third-party proprietary rights, identify licensing opportunities, and monitor the intellectual property claims of others.
We own a large portfolio of patents that relate principally to electrical, optical, and electronic products. We also own a portfolio of trademarks and are a licensee of various patents and trademarks. Patents for individual products extend for varying periods according to the date of patent filing or grant and the legal term of patents in the various countries where patent protection is obtained. Trademark rights may potentially extend for longer periods of time and are dependent upon national laws and use of the trademarks.
While we consider our patents and trademarks to be valued assets, we do not believe that our competitive position or our operations are dependent upon or would be materially impacted by any single patent or group of related patents.
We believe our management team has the experience necessary to effectively execute our strategy and advance our product and technology leadership. Our chief executive officer and segment leaders average over 25 years of industry experience. They are supported by an experienced and talented management team who is dedicated to maintaining and expanding our position as a global leader in the industry.
Our strong employee base, along with their commitment to uncompromising values, provides the foundation of our company's success. We continue to emphasize employee development and training, and we embrace diversity and inclusion.
We have employees located throughout the world. As of fiscal year end 2018, we employed approximately 80,000 people worldwide, of whom 30,000 were in the EMEA region, 25,000 were in the Asia–Pacific region, and 25,000 were in the Americas region. Of our total employees, approximately 51,000 were employed in manufacturing.
5
Government Regulation and Supervision
The import and export of products are subject to regulation by the various jurisdictions where we conduct business. A small portion of our products, including defense-related products, may require governmental import and export licenses, whose issuance may be influenced by geopolitical and other events. We have a trade compliance organization and other systems in place to apply for licenses and otherwise comply with such regulations. Any failure to maintain compliance with domestic and foreign trade regulation could limit our ability to import and export raw materials and finished goods into or from the relevant jurisdiction.
Our operations are subject to numerous environmental, health, and safety laws and regulations, including those regulating the discharge of materials into the environment, greenhouse gas emissions, hazardous materials in products, and chemical usage. We are committed to complying with these laws and to the protection of our employees and the environment. We maintain a global environmental, health, and safety program that includes appropriate policies and standards; staff dedicated to environmental, health, and safety issues; periodic compliance auditing; training; and other measures. We also have a program for compliance with the European Union ("EU") Restriction of Hazardous Substances and Waste Electrical and Electronic Equipment Directives, the China Restriction of Hazardous Substances law, the EU Registration, Evaluation, Authorization, and Restriction of Chemicals ("REACH") Regulation, and similar laws.
Compliance with these laws has increased our costs of doing business in a variety of ways and may continue to do so in the future. For example, laws regarding product content and chemical registration require extensive and costly data collection, management, and reporting, and laws regulating greenhouse gas emissions may increase our costs for energy and certain materials and products. We also have projects underway at a number of current and former manufacturing sites to investigate and remediate environmental contamination resulting from past operations. Based upon our experience, available information, and applicable laws, as of fiscal year end 2018, we concluded that we would incur investigation and remediation costs at these sites in the reasonably possible range of $15 million to $42 million, and we accrued $17 million as the probable loss, which was the best estimate within this range. We do not anticipate any material capital expenditures during fiscal 2019 for environmental control facilities or other costs of compliance with laws or regulations relating to greenhouse gas emissions.
All periodic and current reports, registration filings, and other filings that we are required to file with the United States Securities and Exchange Commission ("SEC"), including Annual Reports on Form 10-K, Quarterly Reports on Form 10-Q, Current Reports on Form 8-K, and amendments to those reports filed or furnished pursuant to Section 13(a) or 15(d) of the Securities Exchange Act of 1934 ("Exchange Act") are available free of charge through our internet website at www.te.com . Such documents are available as soon as reasonably practicable after electronic filing or furnishing of the material with the SEC. The information on our website is not incorporated by reference in this Annual Report on Form 10-K.
6
Investors should carefully consider the risks described below before investing in our securities. These risks are not the only ones facing us. Our business is also subject to general risks that affect many other companies. Additional risks not currently known to us or that we currently believe are immaterial may also impair our business operations, financial condition, and liquidity.
Risks Relating to the Macroeconomic Environment and Our Global Presence
Conditions in global or regional economies, capital and money markets, and banking systems, and cyclical industry demand may adversely affect our results of operations, financial position, and cash flows.
Our business and operating results have been and will continue to be affected by economic conditions regionally or globally, including the cost and availability of consumer and business credit, end demand from consumer and industrial markets, and concerns as to sovereign debt levels including credit rating downgrades and defaults on sovereign debt and significant bank failures or defaults. Any of these economic factors could cause our customers to experience deterioration of their businesses, cash flow, and ability to obtain financing. As a result, existing or potential customers may delay or cancel plans to purchase our products and may not be able to fulfill their obligations to us in a timely fashion or in full. Further, our vendors may experience similar problems, which may impact their ability to fulfill our orders or meet agreed service and quality levels. If regional or global economic conditions deteriorate, our results of operations, financial position, and cash flows could be materially adversely affected. Also, deterioration in economic conditions could trigger the recognition of impairment charges for our goodwill or other long-lived assets. Impairment charges, if any, may be material to our results of operations and financial position.
Foreign currency exchange rates may adversely affect our results.
Our Consolidated Financial Statements are prepared in United States ("U.S.") dollars; however, a significant portion of our business is conducted outside the U.S. Changes in the relative values of currencies may have a significant effect on our results of operations, financial position, and cash flows.
We are exposed to the effects of changes in foreign currency exchange rates on our costs and revenue. Approximately 60% of our net sales for fiscal 2018 were invoiced in currencies other than the U.S. dollar, and we expect non-U.S. dollar revenue to continue to represent a significant portion of our future net sales. We have elected not to hedge this foreign currency exposure. Therefore, when the U.S. dollar strengthens in relation to the currencies of the countries where we sell our products, such as the euro or Asian currencies, our U.S. dollar reported revenue and income will decrease.
We manage certain cash, intercompany, and other balance sheet currency exposures in part by entering into financial derivative contracts. In addition to the risk of non-performance by the counterparty to these contracts, our efforts to manage these risks might not be successful.
We could suffer significant business interruptions.
Our operations and those of our suppliers and customers, and the supply chains that support their operations, may be vulnerable to interruption by natural disasters such as earthquakes, tsunamis, typhoons, or floods; or other disasters such as fires, explosions, acts of terrorism or war, disease, or failures of management information or other systems due to internal or external causes. If a business interruption occurs and we are unsuccessful in our continuing efforts to minimize the impact of these events, our business, results of operations, financial position, and cash flows could be materially adversely affected.
7
We could be adversely affected by a decline in the market value of our pension plans' investment portfolios or a reduction in returns on plan assets.
Concerns about deterioration in the global economy, together with concerns about credit, inflation, or deflation, have caused and could continue to cause significant volatility in the price of all securities, including fixed income and equity securities, which has reduced and could further reduce the value of our pension plans' investment portfolios. In addition, the expected returns on plan assets may not be achieved. A decrease in the value of our pension plans' investment portfolios or a reduction in returns on plan assets could have an adverse effect on our results of operations, financial position, and cash flows.
Disruption in credit markets and volatility in equity markets may affect our ability to access sufficient funding.
The global equity markets have been volatile and at times credit markets have been disrupted, which has reduced the availability of investment capital and credit. Downgrades of sovereign debt credit ratings have similarly affected the availability and cost of capital. As a result, we may be unable to access adequate funding to operate and grow our business. Our inability to access adequate funding or to generate sufficient cash from operations may require us to reconsider certain projects and capital expenditures. The extent of any impact will depend on several factors, including our operating cash flows, the duration of tight credit conditions and volatile equity markets, our credit ratings and credit capacity, the cost of financing, and other general economic and business conditions.
We are subject to global risks of political, economic, and military instability.
Our workforce; manufacturing, research, administrative, and sales facilities; markets; customers; and suppliers are located throughout the world. As a result, we are exposed to risks that could negatively affect sales or profitability, including:
- •
-
changes in global trade policies, including sanctions, tariffs, trade barriers, and trade disputes;
- •
-
regulations related to customs and import/export matters;
- •
-
variations in lengths of payment cycles and challenges in collecting accounts receivable;
- •
-
tax law and regulatory changes in the U.S. and EU among other jurisdictions, including tax law and regulatory changes that may be effected as a
result of tax policy recommendations from quasi-governmental organizations such as the Organisation for Economic Co-operation and Development ("OECD"), examinations by taxing authorities, variations
in tax laws from country to country, changes to the terms of income tax treaties, and difficulties in the tax-efficient repatriation of cash generated or held in a number of jurisdictions;
- •
-
employment regulations and local labor conditions, including increases in employment costs, particularly in low-cost regions in which we
currently operate;
- •
-
difficulties protecting intellectual property;
- •
-
instability in economic or political conditions, including sovereign debt levels, Eurozone uncertainty, inflation, recession, actual or
anticipated military or political conflicts, and any impact as a result of the expected exit of the United Kingdom from the EU; and
- •
- the impact of each of the foregoing on our outsourcing and procurement arrangements.
We have sizeable operations in China, including 16 manufacturing sites. In addition, approximately 20% of our net sales in fiscal 2018 were made to customers in China. Economic conditions in China have been and may continue to be volatile and uncertain. In addition, the legal and regulatory system in China is still developing and subject to change. Accordingly, our operations and transactions with
8
customers in China could be adversely affected by changes to market conditions, changes to the regulatory environment, or interpretation of Chinese law.
In addition, any downgrade by rating agencies of long-term U.S. sovereign debt or downgrades or defaults of sovereign debt of other nations may negatively affect global financial markets and economic conditions, which could negatively affect our business, financial condition, and liquidity.
Changes in U.S. federal tax laws could result in adverse consequences to U.S. persons treated as owning 10% or more of our shares.
Although we are a Swiss corporation, recent U.S. tax law changes have expanded application of certain ownership attribution rules and cause certain of our non-U.S. subsidiaries to be treated as Controlled Foreign Corporations ("CFCs") for U.S. federal income tax purposes. A U.S. person that is treated for U.S. federal income tax purposes as owning, directly, indirectly, or constructively, 10% or more of our shares may be required to annually report and include in its U.S. taxable income its pro rata share of certain types of income earned by our subsidiaries that are treated as CFCs, whether or not we make any distributions to such U.S. shareholder. A U.S. person that owns 10% or more of our shares should consult a tax adviser regarding the potential implications to it of these changes in U.S. federal income tax law. The risk of U.S. federal income tax reporting and compliance obligations with respect to our subsidiaries that now are treated as CFCs may deter our current shareholders from increasing their investment in us, and others from investing in us, which could impact the demand for, and value of, our shares.
Risks Relating to the Industry in Which We Operate
We are dependent on the automotive and other industries.
We are dependent on end market dynamics to sell our products, and our operating results could be adversely affected by cyclical and reduced demand in these markets. Periodic downturns in our customers' industries can significantly reduce demand for certain of our products, which could have a material adverse effect on our results of operations, financial position, and cash flows.
Approximately 44% of our net sales for fiscal 2018 were to customers in the automotive industry. The automotive industry is dominated by large manufacturers that can exert significant price pressure on their suppliers. Additionally, the automotive industry has historically experienced significant downturns during periods of deteriorating global or regional economic or credit conditions. As a supplier of automotive electronics products, our sales of these products and our profitability have been and could continue to be negatively affected by significant declines in global or regional economic and credit conditions and changes in the operations, products, business models, part-sourcing requirements, financial condition, and market share of automotive manufacturers, as well as potential consolidations among automotive manufacturers.
During fiscal 2018, approximately 14% of our net sales were to customers in the industrial equipment end market, 9% of our net sales were to customers in the commercial transportation market, and 8% of our net sales were to customers in the aerospace, defense, oil, and gas end market. Demand for industrial equipment is dependent upon economic conditions, including customer investment in factory automation, intelligent buildings, and process control systems, as well as market conditions in the medical, rail transportation, solar and lighting, and other major industrial markets we serve. The commercial transportation industry can experience variability in demand depending on the economic environment and market conditions in the heavy truck, construction, agriculture, and recreational vehicle markets. The aerospace and defense industry has undergone significant fluctuations in demand, depending on worldwide economic and political conditions. Demand in the oil and gas market is impacted by oil price volatility.
9
We encounter competition in substantially all areas of the electronic components industry.
We operate in highly competitive markets for electronic components, and expect that both direct and indirect competition will increase in the future. Our overall competitive position depends on a number of factors including the price, quality, and performance of our products; the level of customer service; the development of new technology; our ability to participate in emerging markets; and customers' expectations relating to socially responsible operations. The competition we experience across product lines from other companies ranges in size from large, diversified manufacturers to small, highly specialized manufacturers. The electronic components industry has become increasingly concentrated and globalized in recent years, and our major competitors have significant financial resources and technological capabilities. A number of these competitors compete with us primarily on price, and in some instances may enjoy lower production costs for certain products. We cannot provide assurance that additional competitors will not enter our markets, or that we will be able to compete successfully against existing or new competitors. Increased competition may result in price reductions, reduced margins, or loss of market share, any of which could materially and adversely affect our results of operations, financial position, and cash flows.
We are dependent on market acceptance of our new product introductions and product innovations for future revenue.
Substantially all markets in which we operate are impacted by technological change or change in consumer tastes and preferences, which are rapid in certain end markets. Our operating results depend substantially upon our ability to continually design, develop, introduce, and sell new and innovative products; to modify existing products; and to customize products to meet customer requirements driven by such change. There are numerous risks inherent in these processes, including the risk that we will be unable to anticipate the direction of technological change or that we will be unable to develop and market profitable new products and applications in time to satisfy customer demands.
Like other suppliers to the electronics industry, we are subject to continuing pressure to lower our prices.
We have historically experienced, and we expect to continue to experience, continuing pressure to lower our prices. In recent years, we have experienced price erosion averaging from 1% to 2% each year. To maintain our margins, we must continue to reduce our costs by similar amounts. We cannot provide assurance that continuing pressures to reduce our prices will not have a material adverse effect on our margins, results of operations, financial position, and cash flows.
We may be negatively affected as our customers and vendors continue to consolidate.
Many of the industries to which we sell our products, as well as many of the industries from which we buy materials, have become more concentrated in recent years, including the automotive, data and devices, and aerospace and defense industries. Consolidation of customers may lead to decreased product purchases from us. In addition, as our customers buy in larger volumes, their volume buying power has increased, enabling them to negotiate more favorable pricing and find alternative sources from which to purchase. Our materials suppliers similarly have increased their ability to negotiate favorable pricing. These trends may adversely affect the margins on our products, particularly for commodity components.
The life cycles of certain of our products can be very short.
The life cycles of certain of our products can be very short relative to their development cycle. As a result, the resources devoted to product sales and marketing may not result in material revenue and, from time to time, we may need to write off excess or obsolete inventory or equipment. If we were to incur significant engineering expenses and investments in inventory and equipment that we were not
10
able to recover, and we were not able to compensate for those expenses, our results of operations, financial position, and cash flows could be materially and adversely affected.
Risks Relating to Our Operations
Our results are sensitive to raw material availability, quality, and cost.
We are a large buyer of resins, chemicals, additives, and metals, including copper, gold, silver, aluminum, brass, steel, and zinc. Many of these raw materials are produced in a limited number of countries around the world or are only available from a limited number of suppliers. In addition, the price of many of these raw materials, including gold and copper, continues to fluctuate. If we have difficulty obtaining these raw materials, the quality of available raw materials deteriorates, or there are significant price increases for these raw materials, it could have a substantial impact on the price we pay for raw materials. To the extent we cannot compensate for cost increases through productivity improvements or price increases to our customers, our margins may decline, materially affecting our results of operations, financial position, and cash flows. In addition, we use financial instruments to hedge the volatility of certain commodities prices. The success of our hedging program depends on accurate forecasts of planned consumption of the hedged commodity materials. We could experience unanticipated hedge gains or losses if these forecasts are inaccurate.
In accordance with the Dodd-Frank Wall Street Reform and Consumer Protection Act, the SEC established annual disclosure and reporting requirements for those companies who use tin, tantalum, tungsten, or gold ("conflict minerals" or "3TG") mined from the Democratic Republic of the Congo ("DRC") and adjoining countries (together with the DRC, the "Covered Countries") in their products. These requirements could affect the sourcing, pricing, and availability of 3TG used in the manufacture of certain of our products. As a result, there may only be a limited pool of suppliers who can demonstrate that they do not source any 3TG from the Covered Countries, and we cannot provide assurance that we will be able to obtain non-conflict 3TG in sufficient quantities or at competitive prices. Further, since our supply chain is complex, we may face reputational challenges with our customers and other stakeholders if we are unable to sufficiently verify the origins and chain of custody for all conflict minerals used in our products through our due diligence procedures.
We may use components and products manufactured by third parties.
We may rely on third-party suppliers for the components used in our products, and we may rely on third-party manufacturers to manufacture certain of our assemblies and finished products. Our results of operations, financial position, and cash flows could be adversely affected if such third parties lack sufficient quality control or if there are significant changes in their financial or business condition. If these third parties fail to deliver quality products, parts, and components on time and at reasonable prices, we could have difficulties fulfilling our orders, sales and profits could decline, and our commercial reputation could be damaged.
Our future success is significantly dependent on our ability to attract and retain management and executive management employees.
Our success depends to a significant extent upon our continued ability to retain our management and executive management employees and hire new management and executive management employees to replace, succeed, or add to members of our management team. Our management team has significant industry experience and would be difficult to replace. Competition for management talent is intense, and any difficulties we may have to retain or hire members of mangagement to achieve our objectives may have an adverse effect on our results of operations, financial position, and cash flows.
11
Security breaches and other disruptions to our information technology infrastructure could interfere with our operations, compromise confidential information, and expose us to liability which could materially adversely impact our business and reputation.
Security breaches and other disruptions to our information technology infrastructure could interfere with our operations; compromise information belonging to us, our employees, customers, and suppliers; and expose us to liability which could adversely impact our business and reputation. In the normal course of business, we rely on information technology networks and systems, some of which are managed by third parties, to process, transmit, and store electronic information, and to manage or support a variety of business processes and activities. Additionally, we collect and store certain data, including proprietary business information and customer and employee data, and may have access to confidential or personal information in certain of our businesses that is subject to privacy and security laws, regulations, and customer-imposed controls. Despite our cybersecurity measures (including employee and third-party training, monitoring of networks and systems, and maintenance of backup and protective systems) which are continuously reviewed and upgraded to mitigate persistent and continuously evolving cybersecurity threats, our information technology networks and infrastructure may still be vulnerable to damage, disruptions, or shutdowns due to attack by hackers or breaches, employee error or malfeasance, power outages, computer viruses, telecommunication or utility failures, systems failures, natural disasters, or other catastrophic events. Any such events could result in legal claims or proceedings, liability or penalties under privacy laws, disruption in operations, and damage to our reputation, which could materially adversely affect our business. While we have experienced, and expect to continue to experience, these types of threats to our information technology networks and infrastructure, to date none of these threats have had a material impact on our business or operations.
Covenants in our debt instruments may adversely affect us.
Our five-year unsecured senior revolving credit facility ("Credit Facility") contains financial and other covenants, such as a limit on the ratio of Consolidated Total Debt to Consolidated EBITDA (as defined in the Credit Facility) and limits on the amount of subsidiary debt and incurrence of liens. Our outstanding notes' indentures contain customary covenants including limits on incurrence of liens, sale and lease-back transactions, and our ability to consolidate, merge, and sell assets.
Although none of these covenants are presently restrictive to our operations, our continued ability to meet the Credit Facility financial covenant can be affected by events beyond our control, and we cannot provide assurance that we will continue to comply with the covenant. A breach of any of our covenants could result in a default under our Credit Facility or indentures. Upon the occurrence of certain defaults under our Credit Facility and indentures, the lenders or trustee could elect to declare all amounts outstanding thereunder to be immediately due and payable, and our lenders could terminate commitments to extend further credit under our Credit Facility. If the lenders or trustee accelerate the repayment of borrowings, we cannot provide assurance that we will have sufficient assets or access to lenders or capital markets to repay or fund the repayment of any amounts outstanding under our Credit Facility and our other affected indebtedness. Acceleration of any debt obligation under any of our material debt instruments may permit the holders or trustee of our other material debt to accelerate payment of debt obligations to the creditors thereunder.
The indentures governing our outstanding senior notes contain covenants that may require us to offer to buy back the notes for a price equal to 101% of the principal amount, plus accrued and unpaid interest to the repurchase date, upon a change of control triggering event (as defined in the indentures). We cannot provide assurance that we will have sufficient funds available or access to funding to repurchase tendered notes in that event, which could result in a default under the notes. Any future debt that we incur may contain covenants regarding repurchases in the event of a change of control triggering event.
12
The market price of our shares may fluctuate widely.
The market price of our shares may fluctuate widely, depending upon many factors, including:
- •
-
our quarterly or annual earnings;
- •
-
quarterly or annual sales or earnings guidance that we may provide or changes thereto;
- •
-
actual or anticipated fluctuations in our operating results;
- •
-
volatility in financial markets and market fluctuations caused by global and regional economic conditions and investors' concerns about
potential risks to future economic growth;
- •
-
changes in earnings estimates by securities analysts or our ability to meet those estimates;
- •
-
changes in accounting standards, policies, guidance, interpretations, or principles;
- •
-
tax legislative and regulatory actions and proposals in Switzerland, the U.S., and other jurisdictions;
- •
-
announcements by us or our competitors of significant acquisitions or dispositions; and
- •
- the operating and stock price performance of comparable companies and companies that serve end markets important to our business.
Risks Relating to Strategic Transactions
Future acquisitions may not be successful.
We regularly evaluate the possible acquisition of strategic businesses, product lines, or technologies which have the potential to strengthen our market position or enhance our existing product offerings. We cannot provide assurance that we will identify or successfully complete transactions with acquisition candidates in the future. We also cannot provide assurance that completed acquisitions will be successful. If an acquired business fails to operate as anticipated or cannot be successfully integrated with our existing business, our results of operations, financial position, and cash flows could be materially and adversely affected.
Future acquisitions could require us to issue additional debt or equity.
If we were to make a substantial acquisition with cash, the acquisition may need to be financed in part through funding from banks, public offerings or private placements of debt or equity securities, or other arrangements. This acquisition financing might decrease our ratio of earnings to fixed charges and adversely affect other leverage measures. We cannot provide assurance that sufficient acquisition financing would be available to us on acceptable terms if and when required. If we were to make an acquisition partially or wholly funded by issuing equity securities or equity-linked securities, the issued securities may have a dilutive effect on the interests of the holders of our shares.
Divestitures of some of our businesses or product lines may have a material adverse effect on our results of operations, financial position, and cash flows.
We continue to evaluate the strategic fit of specific businesses and products which may result in additional divestitures. Any divestitures may result in significant write-offs, including those related to goodwill and other intangible assets, which could have a material adverse effect on our results of operations and financial position. Divestitures could involve additional risks, including difficulties in the separation of operations, services, products, and personnel; the diversion of management's attention from other business concerns; the disruption of our business; and the potential loss of key employees. There can be no assurance that we will be successful in addressing these or any other significant risks encountered.
13
Risks Relating to Intellectual Property, Litigation, and Regulations
Our ability to compete effectively depends, in part, on our ability to maintain the proprietary nature of our products and technology.
The electronics industry is characterized by litigation regarding patent and other intellectual property rights. Within this industry, companies have become more aggressive in asserting and defending patent claims against competitors. There can be no assurance that we will not be subject to future litigation alleging infringement or invalidity of certain of our intellectual property rights or that we will not have to pursue litigation to protect our property rights. Depending on the importance of the technology, product, patent, trademark, or trade secret in question, an unfavorable outcome regarding one of these matters may have a material adverse effect on our results of operations, financial position, and cash flows.
We are a defendant to a variety of litigation in the course of our business that could cause a material adverse effect on our results of operations, financial position, and cash flows.
In the normal course of business, we are, from time to time, a defendant in litigation, including litigation alleging the infringement of intellectual property rights, anti-competitive behavior, product liability, breach of contract, and employment-related claims. In certain circumstances, patent infringement and antitrust laws permit successful plaintiffs to recover treble damages. The defense of these lawsuits may divert our management's attention, and we may incur significant expenses in defending these lawsuits. In addition, we may be required to pay damage awards or settlements, or become subject to injunctions or other equitable remedies, that could cause a material adverse effect on our results of operations, financial position, and cash flows.
If any of our operations are found not to comply with applicable antitrust or competition laws or applicable trade regulations, our business may suffer.
Our operations are subject to applicable antitrust and competition laws in the jurisdictions in which we conduct our business, in particular the U.S. and the EU. These laws prohibit, among other things, anticompetitive agreements and practices. If any of our commercial agreements and practices with respect to the electronic components or other markets are found to violate or infringe such laws, we may be subject to civil and other penalties. We may also be subject to third-party claims for damages. Further, agreements that infringe these antitrust and competition laws may be void and unenforceable, in whole or in part, or require modification in order to be lawful and enforceable. If we are unable to enforce our commercial agreements, whether at all or in material part, our results of operations, financial position, and cash flows could be adversely affected. Further, any failure to maintain compliance with trade regulations could limit our ability to import and export raw materials and finished goods into or from the relevant jurisdiction, which could negatively impact our results of operations, financial position, and cash flows.
We could be adversely affected by violations of the U.S. Foreign Corrupt Practices Act, the United Kingdom's Bribery Act, and similar worldwide anti-bribery laws.
The U.S. Foreign Corrupt Practices Act, the United Kingdom's Bribery Act, and similar worldwide anti-bribery laws generally prohibit companies and their intermediaries from making improper payments to government officials for the purpose of obtaining or retaining business. Our policies mandate compliance with these anti-bribery laws. We operate in many parts of the world that have experienced governmental corruption to some degree, and in certain circumstances, strict compliance with anti-bribery laws may conflict with local customs and practices. Despite our training and compliance program, we cannot provide assurance that our internal control policies and procedures always will protect us from reckless or criminal acts committed by our employees or agents. Violations
14
of these laws, or allegations of such violations, could disrupt our business and result in a material adverse effect on our results of operations, financial position, and cash flows.
Our operations expose us to the risk of material environmental liabilities, litigation, government enforcement actions, and reputational risk.
We are subject to numerous federal, state, and local environmental protection and health and safety laws and regulations in the various countries where we operate and where our products are sold. These laws and regulations govern, among other things:
- •
-
the generation, storage, use, and transportation of hazardous materials;
- •
-
emissions or discharges of substances into the environment;
- •
-
investigation and remediation of hazardous substances or materials at various sites;
- •
-
greenhouse gas emissions;
- •
-
product hazardous material content; and
- •
- the health and safety of our employees.
We may not have been, or we may not always be, in compliance with all environmental and health and safety laws and regulations. If we violate these laws, we could be fined, criminally charged, or otherwise sanctioned by regulators. In addition, environmental and health and safety laws are becoming more stringent, resulting in increased costs and compliance requirements.
Certain environmental laws assess liability on current or previous owners or operators of real property for the costs of investigation, removal, and remediation of hazardous substances or materials at their properties or at properties at which they have disposed of hazardous substances. Liability for investigation, removal, and remediation costs under certain federal and state laws is retroactive, strict, and joint and several. In addition to cleanup actions brought by governmental authorities, private parties could bring personal injury or other claims due to the presence of, or exposure to, hazardous substances. We have received notifications from the U.S. Environmental Protection Agency, other environmental agencies, and third parties that conditions at a number of currently and formerly-owned or operated sites where we and others have disposed of hazardous substances require investigation, cleanup, and other possible remedial action and require that we reimburse the government or otherwise pay for the costs of investigation and remediation and for natural resource damage claims from such sites. We also have independently investigated various sites and determined that further investigation and/or remediation is necessary.
While we plan for future capital and operating expenditures to maintain compliance with environmental laws, we cannot provide assurance that our costs of complying with current or future environmental protection and health and safety laws, or our liabilities arising from past or future releases of, or exposures to, hazardous substances will not exceed our estimates or adversely affect our results of operations, financial position, and cash flows or that we will not be subject to additional environmental claims for personal injury, property damage, and/or cleanup in the future based on our past, present, or future business activities.
Our products are subject to various requirements related to chemical usage, hazardous material content, and recycling.
The EU, China, and other jurisdictions in which our products are sold have enacted or are proposing to enact laws addressing environmental and other impacts from product disposal, use of hazardous materials in products, use of chemicals in manufacturing, recycling of products at the end of their useful life, and other related matters. These laws include but are not limited to the EU
15
Restriction of Hazardous Substances, End of Life Vehicle, and Waste Electrical and Electronic Equipment Directives; the EU REACH Regulation; and the China law on Management Methods for Controlling Pollution by Electronic Information Products. These laws prohibit the use of certain substances in the manufacture of our products and directly and indirectly impose a variety of requirements for modification of manufacturing processes, registration, chemical testing, labeling, and other matters. These laws continue to proliferate and expand in these and other jurisdictions to address other materials and other aspects of our product manufacturing and sale. These laws could make the manufacture or sale of our products more expensive or impossible, could limit our ability to sell our products in certain jurisdictions, and could result in liability for product recalls, penalties, or other claims.
Risks Relating to Our Swiss Jurisdiction of Incorporation
As a Swiss corporation, we have less flexibility with respect to certain aspects of capital management involving the issuance of shares.
As a Swiss corporation, our board of directors may not declare and pay dividends or distributions on our shares or reclassify reserves on our standalone unconsolidated Swiss balance sheet without shareholder approval and without satisfying certain other requirements. In addition, our articles of association allow us to create authorized share capital that can be issued by the board of directors, but this authorization is limited to (i) authorized share capital up to 50% of the existing registered shares with such authorization valid for a maximum of two years, which authorization period ends on March 14, 2020, approved by our shareholders at our March 14, 2018 annual general meeting of shareholders and (ii) conditional share capital of up to 50% of the existing registered shares that may be issued only for specific purposes. Additionally, subject to specified exceptions, Swiss law grants preemptive rights to existing shareholders to subscribe for new issuances of shares from authorized share capital and advance subscription rights to existing shareholders to subscribe for new issuances of shares from conditional share capital. Swiss law also does not provide much flexibility in the various terms that can attach to different classes of shares, and reserves for approval by shareholders many types of corporate actions, including the creation of shares with preferential rights with respect to liquidation, dividends, and/or voting. Moreover, under Swiss law, we generally may not issue registered shares for an amount below par value without prior shareholder approval to decrease the par value of our registered shares. Any such actions for which our shareholders must vote will require that we file a preliminary proxy statement with the SEC and convene a meeting of shareholders, which would delay the timing to execute such actions. Such limitations provide the board of directors less flexibility with respect to our capital management. While we do not believe that Swiss law requirements relating to the issuance of shares will have a material adverse effect on us, we cannot provide assurance that situations will not arise where such flexibility would have provided substantial benefits to our shareholders and such limitations on our capital management flexibility would make our stock less attractive to investors.
We might not be able to make distributions on our shares without subjecting shareholders to Swiss withholding tax.
In order to make distributions on our shares to shareholders free of Swiss withholding tax, we anticipate making distributions to shareholders through a reduction of contributed surplus (as determined for Swiss tax and statutory purposes). Various tax law and corporate law proposals in Switzerland, if passed in the future, may affect our ability to pay dividends or distributions to our shareholders free from Swiss withholding tax. There can be no assurance that we will be able to meet the legal requirements for future distributions to shareholders through dividends from contributed surplus or through a reduction of registered share capital, or that Swiss withholding rules would not be changed in the future. In addition, over the long term, the amount of registered share capital available for reductions will be limited. Our ability to pay dividends or distributions to our shareholders free
16
from Swiss withholding tax is a significant component of our capital management and shareholder return practices that we believe is important to our shareholders, and any restriction on our ability to do so could make our stock less attractive to investors.
Currency fluctuations between the U.S. dollar and the Swiss franc may limit the amount available for any future distributions on our shares without subjecting shareholders to Swiss withholding tax.
Under Swiss law, the registered share capital in our unconsolidated Swiss statutory financial statements is required to be denominated in Swiss francs. Although distributions that are effected through a return of contributed surplus or registered share capital are expected to be paid in U.S. dollars, shareholder resolutions with respect to such distributions must take into account the Swiss francs denomination of the registered share capital. If the U.S. dollar were to increase in value relative to the Swiss franc, the U.S. dollar amount of registered share capital available for future distributions without Swiss withholding tax will decrease.
We have certain limitations on our ability to repurchase our shares.
The Swiss Code of Obligations regulates a corporation's ability to hold or repurchase its own shares. We and our subsidiaries may only repurchase shares to the extent that sufficient freely distributable reserves (including contributed surplus as determined for Swiss tax and statutory purposes) are available. The aggregate par value of our registered shares held by us and our subsidiaries may not exceed 10% of our registered share capital. We may repurchase our registered shares beyond the statutory limit of 10%, however, only if our shareholders have adopted a resolution at a general meeting of shareholders authorizing the board of directors to repurchase registered shares in an amount in excess of 10% and the repurchased shares are dedicated for cancellation. Additionally, various tax law and corporate law proposals in Switzerland, if passed in the future, may affect our ability to repurchase our shares. Our ability to repurchase our shares is a significant component of our capital management and shareholder return practices that we believe is important to our shareholders, and any restriction on our ability to repurchase our shares could make our stock less attractive to investors.
Registered holders of our shares must be registered as shareholders with voting rights in order to vote at shareholder meetings.
Our articles of association contain a provision regarding voting rights that is required by Swiss law for Swiss companies like us that issue registered shares (as opposed to bearer shares). This provision provides that to be able to exercise voting rights, holders of our shares must be registered in our share register (Aktienbuch) as shareholders with voting rights. Only shareholders whose shares have been registered with voting rights on the record date may participate in and vote at our shareholders' meetings, but all shareholders will be entitled to dividends, distributions, preemptive rights, advance subscription rights, and liquidation proceeds. The board of directors may, in its discretion, refuse to register shares as shares with voting rights if a shareholder does not fulfill certain disclosure requirements in our articles of association. Additionally, various proposals in Switzerland for corporate law changes, if passed in the future, may require shareholder registration in order to exercise voting rights for shareholders who hold their shares in street name through brokerages and banks. Such a registration requirement could make our stock less attractive to investors.
17
Certain provisions of our articles of association may reduce the likelihood of any unsolicited acquisition proposal or potential change of control that our shareholders might consider favorable.
Our articles of association contain provisions that could be considered "anti-takeover" provisions because they would make it harder for a third party to acquire us without the consent of our incumbent board of directors. Under these provisions, among others:
- •
-
shareholders may act only at shareholder meetings and not by written consent, and
- •
- restrictions will apply to any merger or other business combination between our company and any holder of 15% or more of our issued voting shares who became such without the prior approval of our board of directors.
These provisions may only be amended by the affirmative vote of the holders of 80% of our issued voting shares, which could have the effect of discouraging an unsolicited acquisition proposal or delaying, deferring, or preventing a change of control transaction that might involve a premium price, or otherwise be considered favorable by our shareholders. Our articles of association also contain provisions permitting our board of directors to issue new shares from authorized or conditional capital (in either case, representing a maximum of 50% of the shares presently registered in the commercial register and in case of issuances from authorized capital, until March 14, 2020 unless re-authorized by shareholders for a subsequent two-year period) without shareholder approval and without regard for shareholders' preemptive rights or advance subscription rights, for the purpose of the defense of an actual, threatened, or potential unsolicited takeover bid, in relation to which the board of directors, upon consultation with an independent financial advisor, has not recommended acceptance to the shareholders. We note that Swiss courts have not addressed whether or not a takeover bid of this nature is an acceptable reason under Swiss law for withdrawing or limiting preemptive rights with respect to authorized share capital or advance subscription rights with respect to conditional share capital. In addition, the New York Stock Exchange ("NYSE"), on which our shares are listed, requires shareholder approval for issuances of shares equal to 20% or more of the outstanding shares or voting power, with limited exceptions.
Legislative and regulatory actions and proposals in Switzerland, the U.S., and other jurisdictions could cause a material change in our worldwide effective corporate tax rate.
Various legislative and regulatory proposals have been directed at multinational companies with operations in lower-tax jurisdictions. There has been heightened focus on adoption of such legislation and on other initiatives, such as:
- •
-
the OECD's initiative to develop agreed-upon best practices to prevent base erosion and profit shifting, which contemplate changes to numerous
long-standing tax principles related to the distribution of profits between affiliated entities in different tax jurisdictions,
- •
-
corporate tax reform in Switzerland, which is proposed in response to OECD and EU concerns,
- •
-
EU and other country efforts to adopt certain OECD proposals and modified OECD proposals (including the Anti-Tax Avoidance Directive, state aid
cases, and various transparency proposals), and
- •
- tax policy in the U.S., such as federal tax reform and revisions to the Model Income Tax Treaty.
If these proposals are adopted in the main jurisdictions in which we do business, they could, among other things, cause double taxation, increase audit risk, and materially increase our worldwide corporate effective tax rate. We cannot predict the outcome of any specific legislative proposals or initiatives, and we cannot provide assurance that any such legislation or initiative will not apply to us.
18
Legislation in the U.S. could adversely impact our results of operations, financial position, and cash flows.
Various U.S. federal and state legislative proposals have been introduced in recent years that may negatively impact the growth of our business by denying government contracts to U.S. companies that have moved to lower-tax jurisdictions.
We expect the U.S. Congress to continue to consider implementation and/or expansion of policies that would restrict the federal and state governments from contracting with entities that have corporate locations abroad. We cannot predict the likelihood that, or final form in which, any such proposed legislation might become law, the nature of regulations that may be promulgated under any future legislative enactments, the effect such enactments and increased regulatory scrutiny may have on our business, or the outcome of any specific legislative proposals. Therefore, we cannot provide assurance that any such legislative action will not apply to us. In addition, we are unable to predict whether the final form of any potential legislation discussed above also would affect our indirect sales to U.S. federal or state governments or the willingness of our non-governmental customers to do business with us. As a result of these uncertainties, we are unable to assess the potential impact of any proposed legislation in this area and cannot provide assurance that the impact will not be materially adverse to us.
Swiss law differs from the laws in effect in the U.S. and may afford less protection to holders of our securities.
As we are organized under the laws of Switzerland, it may not be possible to enforce court judgments obtained in the U.S. against us in Switzerland based on the civil liability provisions of the U.S. federal or state securities laws. In addition, there is some uncertainty as to whether the courts of Switzerland would recognize or enforce judgments of U.S. courts obtained against us or our directors or officers based on the civil liability provisions of the U.S. federal or state securities laws or hear actions against us or those persons based on those laws. We have been advised that the U.S. and Switzerland currently do not have a treaty providing for the reciprocal recognition and enforcement of judgments in civil and commercial matters. Some remedies available under the laws of U.S. jurisdictions, including some remedies available under the U.S. federal securities laws, would not be allowed in Swiss courts as they are contrary to Switzerland's public policy.
Swiss law differs in certain material respects from laws generally applicable to U.S. corporations and their shareholders. These differences include the manner in which directors must disclose transactions in which they have an interest, the rights of shareholders to bring class action and derivative lawsuits, and the scope of indemnification available to directors and officers. Thus, holders of our securities may have more difficulty protecting their interests than would holders of securities of a corporation incorporated in a jurisdiction of the U.S.
19
Our principal executive office is located in Schaffhausen, Switzerland. As of fiscal year end 2018, we owned approximately 20 million square feet and leased approximately 9 million square feet of manufacturing, warehousing, and office space. We believe our facilities are suitable for the conduct of our business and adequate for our current needs.
We manufacture our products in approximately 25 countries worldwide. Our manufacturing sites focus on various aspects of our manufacturing processes, including our primary processes of stamping, plating, molding, extrusion, beaming, and assembly. We consider the productive capacity of our manufacturing facilities sufficient. As of fiscal year end 2018, our principal centers of manufacturing output by segment and geographic region were as follows:
|
|
Transportation
Solutions |
Industrial
Solutions |
Communications
Solutions |
Total | |||||||||
|---|---|---|---|---|---|---|---|---|---|---|---|---|---|
|
|
(number of manufacturing facilities)
|
||||||||||||
|
EMEA |
19 | 22 | 3 | 44 | |||||||||
|
Asia–Pacific |
7 | 7 | 8 | 22 | |||||||||
|
Americas |
11 | 23 | 4 | 38 | |||||||||
| | | | | | | | | | | | | | |
|
Total |
37 | 52 | 15 | 104 | |||||||||
| | | | | | | | | | | | | | |
| | | | | | | | | | | | | | |
| | | | | | | | | | | | | | |
In the normal course of business, we are subject to various legal proceedings and claims, including product liability matters, employment disputes, disputes on agreements, other commercial disputes, environmental matters, antitrust claims, and tax matters, including non-income tax matters such as value added tax, sales and use tax, real estate tax, and transfer tax. In addition, we operate in an industry susceptible to significant patent legal claims. At any given time in the normal course of business, we are involved as either a plaintiff or defendant in a number of patent infringement actions. If infringement of a third party's patent were to be determined against us, we might be required to make significant royalty or other payments or might be subject to an injunction or other limitation on our ability to manufacture or sell one or more products. If a patent owned by or licensed to us were determined to be invalid or unenforceable, we might be required to reduce the value of the patent on our Consolidated Balance Sheet and to record a corresponding charge, which could be significant in amount.
Management believes that these legal proceedings and claims likely will be resolved over an extended period of time. Although it is not feasible to predict the outcome of these proceedings, based upon our experience, current information, and applicable law, we do not expect that the outcome of these proceedings, either individually or in the aggregate, will have a material effect on our results of operations, financial position, or cash flows.
During the fourth quarter of fiscal 2018, one of our manufacturing sites in China was found to have failed to complete the environmental impact assessment inspection for certain of its production lines and assets within the mandatory timeframe as defined within applicable environmental regulation. At the request of the Shanghai Xuhui Environmental Protection Bureau, we are taking remedial action to cure the deficiencies, and we expect to pay an administrative penalty in the amount of 700,000 Chinese renminbi (approximately $0.1 million using an exchange rate of $0.15 per renminbi). We do not anticipate that any monetary sanctions or remedial actions we take will have a material adverse effect on our results of operations, financial position, or cash flows.
20
Market Information and Holders
Our common shares are listed and traded on the NYSE under the symbol "TEL." The number of registered holders of our common shares at November 8, 2018 was 20,236.
The following graph compares the cumulative total shareholder return on our common shares against the cumulative return on the S&P 500 Index and the Dow Jones Electrical Components and Equipment Index. The graph assumes the investment of $100 in our common shares and in each index at fiscal year end 2013 and assumes the reinvestment of all dividends and distributions. The graph shows the cumulative total return for the last five fiscal years. The comparisons in the graph are based upon historical data and are not indicative of, nor intended to forecast, future performance of our common shares.
COMPARISON OF CUMULATIVE TOTAL RETURN
AMONG TE CONNECTIVITY LTD., S&P 500 INDEX, AND
DOW JONES ELECTRICAL COMPONENTS AND EQUIPMENT INDEX
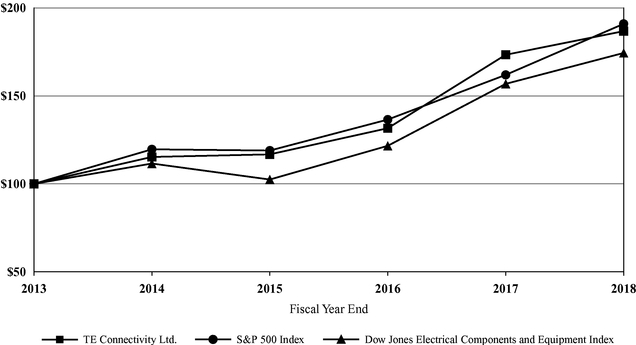
|
|
Fiscal Year End | ||||||||||||||||||
|---|---|---|---|---|---|---|---|---|---|---|---|---|---|---|---|---|---|---|---|
|
|
2013 (1) | 2014 | 2015 | 2016 | 2017 | 2018 | |||||||||||||
|
TE Connectivity Ltd. |
$ | 100.00 | $ | 115.30 | $ | 116.76 | $ | 131.63 | $ | 173.37 | $ | 186.80 | |||||||
|
S&P 500 Index |
100.00 | 119.64 | 118.93 | 136.54 | 161.95 | 190.95 | |||||||||||||
|
Dow Jones Electrical Components and Equipment Index |
100.00 | 111.56 | 102.46 | 121.63 | 156.84 | 174.41 | |||||||||||||
- (1)
- $100 invested on September 27, 2013 in TE Connectivity Ltd.'s common shares and in indexes. Indexes calculated on month-end basis.
21
Issuer Purchases of Equity Securities
The following table presents information about our purchases of our common shares during the quarter ended September 28, 2018:
|
Period
|
Total Number
of Shares Purchased (1) |
Average Price
Paid Per Share (1) |
Total Number of
Shares Purchased as Part of Publicly Announced Plans or Programs (2) |
Maximum
Approximate Dollar Value of Shares that May Yet Be Purchased Under the Plans or Programs (2) |
|||||||||
|---|---|---|---|---|---|---|---|---|---|---|---|---|---|
|
June 30–July 27, 2018 |
1,465 | $ | 93.28 | — | $ | 1,368,819,073 | |||||||
|
July 28–August 31, 2018 |
2,217,725 | 92.90 | 2,213,500 | 1,163,190,015 | |||||||||
|
September 1–September 28, 2018 |
1,655,395 | 90.63 | 1,635,400 | 1,014,947,770 | |||||||||
| | | | | | | | | | | | | | |
|
Total |
3,874,585 | $ | 91.93 | 3,848,900 | |||||||||
| | | | | | | | | | | | | | |
| | | | | | | | | | | | | | |
| | | | | | | | | | | | | | |
- (1)
-
These
columns include the following transactions which occurred during the quarter ended September 28, 2018:
- (i)
-
the
acquisition of 25,685 common shares from individuals in order to satisfy tax withholding requirements in connection with the vesting of restricted share awards
issued under equity compensation plans; and
- (ii)
-
open
market purchases totaling 3,848,900 common shares, summarized on a trade-date basis, in conjunction with the share repurchase program announced in September
2007.
- (2)
- Our share repurchase program authorizes us to purchase a portion of our outstanding common shares from time to time through open market or private transactions, depending on business and market conditions. The share repurchase program does not have an expiration date.
22
The following table presents selected consolidated financial data. The data presented should be read in conjunction with our Consolidated Financial Statements and accompanying notes and "Management's Discussion and Analysis of Financial Condition and Results of Operations" included elsewhere in this Annual Report. Our consolidated financial information may not be indicative of our future performance.
|
|
As of or for Fiscal | |||||||||||||||
|---|---|---|---|---|---|---|---|---|---|---|---|---|---|---|---|---|
|
|
2018 | 2017 (1) | 2016 (1)(2) | 2015 (1) | 2014 (1) | |||||||||||
|
|
(in millions, except per share data)
|
|||||||||||||||
|
Statement of Operations Data |
||||||||||||||||
|
Net sales |
$ | 13,988 | $ | 12,185 | $ | 11,352 | $ | 11,524 | $ | 11,690 | ||||||
|
Acquisition and integration costs |
14 | 6 | 22 | 55 | 31 | |||||||||||
|
Restructuring and other charges (credits), net (3) |
126 | 147 | (2 | ) | 152 | 15 | ||||||||||
|
Other income (expense), net (4) |
1 | (42 | ) | (677 | ) | (55 | ) | 63 | ||||||||
|
Income tax (expense) benefit (4) |
344 |
(180 |
) |
826 |
(306 |
) |
(160 |
) |
||||||||
|
Income from continuing operations |
2,584 | 1,540 | 1,847 | 1,180 | 1,634 | |||||||||||
|
Income (loss) from discontinued operations, net of income taxes (5) |
(19 | ) | 143 | 162 | 1,240 | 147 | ||||||||||
|
Net income |
$ | 2,565 | $ | 1,683 | $ | 2,009 | $ | 2,420 | $ | 1,781 | ||||||
|
Per Share Data |
|
|
|
|
|
|||||||||||
|
Basic earnings per share: |
||||||||||||||||
|
Income from continuing operations |
$ | 7.38 | $ | 4.34 | $ | 5.05 | $ | 2.91 | $ | 3.99 | ||||||
|
Net income |
7.33 | 4.74 | 5.49 | 5.98 | 4.34 | |||||||||||
|
Diluted earnings per share: |
||||||||||||||||
|
Income from continuing operations |
$ | 7.32 | $ | 4.30 | $ | 5.01 | $ | 2.87 | $ | 3.92 | ||||||
|
Net income |
7.27 | 4.70 | 5.44 | 5.89 | 4.27 | |||||||||||
|
Dividends paid per common share |
$ |
1.68 |
$ |
1.54 |
$ |
1.40 |
$ |
1.24 |
$ |
1.08 |
||||||
|
Balance Sheet Data |
|
|
|
|
|
|||||||||||
|
Total assets |
$ | 20,386 | $ | 19,403 | $ | 17,608 | $ | 20,589 | $ | 20,132 | ||||||
|
Long-term liabilities |
5,145 | 5,805 | 6,057 | 7,429 | 7,128 | |||||||||||
|
Total shareholders' equity |
$ | 10,831 | $ | 9,751 | $ | 8,485 | $ | 9,585 | $ | 9,007 | ||||||
- (1)
-
In
fiscal 2018, our Subsea Communications business met the held for sale and discontinued operations criteria. As a result, we reclassified amounts previously
reported to reflect this business as a discontinued operation in all periods presented. For additional information regarding discontinued operations, see Notes 4 and 23 to the Consolidated
Financial Statements.
- (2)
-
Fiscal
2016 was a 53-week year.
- (3)
-
Fiscal
2016 included a pre-tax gain of $144 million on the sale of our Circuit Protection Devices business. See Note 3 to the Consolidated Financial
Statements for additional information.
- (4)
-
For
fiscal 2018, 2017, and 2016, see Notes 15 and 16 to the Consolidated Financial Statements for additional information. Fiscal 2015 income tax (expense)
benefit included a $216 million income tax charge associated with the tax impacts of certain intercompany legal entity restructurings made in connection with our integration of Measurement
Specialties, Inc; a $201 million income tax benefit related to the effective settlement of all undisputed tax matters for the years 2001 through 2007 and the related impact of
$84 million to other expense pursuant to the Tax Sharing Agreement with Tyco International plc and Covidien plc; and a $63 million income tax benefit associated with the
effective settlement of all undisputed tax matters for the years 2008 through 2010. Fiscal 2014 income tax (expense) benefit included a $282 million income tax benefit recognized in connection
with a reduction in the valuation allowance associated with certain tax loss carryforwards relating to ADC Telecommunications, Inc.
- (5)
- Fiscal 2015 included a pre-tax gain of $1.1 billion on the sale of our Broadband Network Solutions business.
23
The following discussion and analysis of our financial condition and results of operations should be read in conjunction with our Consolidated Financial Statements and the accompanying notes included elsewhere in this Annual Report. The following discussion may contain forward-looking statements that reflect our plans, estimates, and beliefs. Our actual results could differ materially from those discussed in these forward-looking statements. Factors that could cause or contribute to these differences include those factors discussed below and elsewhere in this Annual Report, particularly in "Risk Factors" and "Forward-Looking Information."
Our Consolidated Financial Statements have been prepared in U.S. dollars, in accordance with accounting principles generally accepted in the U.S. ("GAAP").
The following discussion includes organic net sales growth which is a non-GAAP financial measure. See "Non-GAAP Financial Measure" for additional information regarding this measure.
We are a global technology and manufacturing leader creating a safer, sustainable, productive, and connected future. For more than 75 years, our connectivity and sensor solutions, proven in the harshest environments, have enabled advancements in transportation, industrial applications, medical technology, energy, data communications, and the home.
Fiscal 2018 highlights included the following:
- •
-
Our fiscal 2018 net sales increased 14.8% over fiscal 2017 levels due to growth in all segments. On an organic basis, our net sales increased
9.2% in fiscal 2018 as compared to fiscal 2017.
- •
-
Our net sales by segment were as follows:
- •
-
Transportation Solutions
—Our net sales increased 17.8% as a result of
increased sales in all end markets. Also, our net sales in the automotive end market benefited from sales contributions from a recent acquisition.
- •
-
Industrial Solutions
—Our net sales increased 10.0% due to increased
sales in the industrial equipment end market and, to a lesser degree, the aerospace, defense, oil, and gas and the energy end markets.
- •
-
Communications Solutions
—Our net sales increased 12.4% due to sales
increases in the appliances and the data and devices end markets.
- •
-
During fiscal 2018, our shareholders approved a dividend payment to shareholders of $1.76 per share, payable in four equal quarterly
installments of $0.44 beginning in the third quarter of fiscal 2018 and ending in the second quarter of fiscal 2019.
- •
- Net cash provided by continuing operating activities was $2,301 million in fiscal 2018.
In the first quarter of fiscal 2019, we expect our net sales to be between $3.33 billion and $3.43 billion as compared to $3.34 billion in the first quarter of fiscal 2018, with sales increases in the Industrial Solutions and Communications Solutions segments. Additional information regarding expectations for our reportable segments for the first quarter of fiscal 2019 as compared to the same period of fiscal 2018 is as follows:
- •
- Transportation Solutions —We expect our net sales increase in the sensors end market to be offset by sales declines in the automotive end market. Our net sales in the automotive end market are
24
- •
-
Industrial Solutions
—We expect our net sales growth to be driven primarily by
increased sales in the aerospace, defense, oil, and gas and the industrial equipment end markets.
- •
- Communications Solutions —We expect net sales growth primarily as a result of increased sales in the data and devices end market.
expected to benefit from content gains; however, this growth will be more than offset by the negative impact of foreign currency exchange rates. We expect global automotive production to decline approximately 2% in the first quarter of fiscal 2019.
In the first quarter of fiscal 2019, we expect diluted earnings per share from continuing operations to be in the range of $1.09 to $1.13 per share. This outlook reflects the negative impact of foreign currency exchange rates on net sales and earnings per share of approximately $75 million and $0.04 per share, respectively, in the first quarter of fiscal 2019 as compared to the same period of fiscal 2018.
We expect our net sales to be between $13.9 billion and $14.3 billion in fiscal 2019 as compared to $14.0 billion in fiscal 2018, with moderate growth in all segments. Additional information regarding expectations for our reportable segments for fiscal 2019 as compared to fiscal 2018 is as follows:
- •
-
Transportation Solutions
—We expect our net sales increases in the sensors end
market to be largely offset by sales declines in the commercial transportation end market. Fiscal 2019 global automotive production is expected to be consistent with fiscal 2018 levels.
- •
-
Industrial Solutions
—We expect our net sales to increase in the industrial
equipment end market due primarily to continued growth in medical applications and a recent acquisition.
- •
- Communications Solutions —We expect net sales growth due primarily to sales increases in the data and devices end market.
We expect diluted earnings per share from continuing operations to be in the range of $5.20 to $5.40 per share in fiscal 2019. This outlook reflects the negative impact of foreign currency exchange rates on net sales and earnings per share of approximately $400 million and $0.16 per share, respectively, in fiscal 2019 as compared to fiscal 2018.
The above outlook is based on foreign currency exchange rates and commodity prices that are consistent with current levels.
We are monitoring the current macroeconomic environment and its potential effects on our customers and the end markets we serve. We continue to closely manage our costs in line with economic conditions. Additionally, we are managing our capital resources and monitoring capital availability to ensure that we have sufficient resources to fund future capital needs. See further discussion in "Liquidity and Capital Resources."
During fiscal 2018, we acquired two businesses for a combined cash purchase price of $153 million, net of cash acquired. The acquisitions were reported as part of our Industrial Solutions segment from the date of acquisition.
We acquired two businesses during fiscal 2017 for a combined cash purchase price of $250 million, net of cash acquired. The acquisitions were reported as part of our Transportation Solutions and Industrial Solutions segments from the date of acquisition.
In fiscal 2016, we acquired four businesses, including the Creganna Medical group ("Creganna"), for a combined cash purchase price of $1.3 billion, net of cash acquired. The acquisitions were reported as part of our Industrial Solutions and Transportation Solutions segments from the date of acquisition.
25
See Note 5 to the Consolidated Financial Statements for additional information regarding acquisitions.
On September 16, 2018, we entered into a definitive agreement to sell our Subsea Communications ("SubCom") business for $325 million, subject to a final working capital adjustment. The SubCom business met the held for sale and discontinued operations criteria and has been reported as such in all periods presented on the Consolidated Financial Statements. Prior to reclassification to discontinued operations, the SubCom business was included in the Communications Solutions segment.
See Notes 4 and 23 to the Consolidated Financial Statements for additional information regarding discontinued operations.
During fiscal 2016, we sold our Circuit Protection Devices ("CPD") business for net cash proceeds of $333 million. We recognized a pre-tax gain of $144 million on the transaction. The CPD business was reported as part of the Data and Devices business within our Communications Solutions segment.
The following table presents our net sales and the percentage of total net sales by segment:
|
|
Fiscal | ||||||||||||||||||
|---|---|---|---|---|---|---|---|---|---|---|---|---|---|---|---|---|---|---|---|
|
|
2018 | 2017 | 2016 | ||||||||||||||||
|
|
($ in millions)
|
||||||||||||||||||
|
Transportation Solutions |
$ | 8,290 | 59 | % | $ | 7,039 | 58 | % | $ | 6,503 | 58 | % | |||||||
|
Industrial Solutions |
3,856 | 28 | 3,507 | 29 | 3,215 | 28 | |||||||||||||
|
Communications Solutions |
1,842 | 13 | 1,639 | 13 | 1,634 | 14 | |||||||||||||
| | | | | | | | | | | | | | | | | | | | |
|
Total |
$ | 13,988 | 100 | % | $ | 12,185 | 100 | % | $ | 11,352 | 100 | % | |||||||
| | | | | | | | | | | | | | | | | | | | |
| | | | | | | | | | | | | | | | | | | | |
| | | | | | | | | | | | | | | | | | | | |
The following table provides an analysis of the change in our net sales compared to the prior fiscal year by segment:
|
|
Fiscal | ||||||||||||||||||||||||||||||||||||
|---|---|---|---|---|---|---|---|---|---|---|---|---|---|---|---|---|---|---|---|---|---|---|---|---|---|---|---|---|---|---|---|---|---|---|---|---|---|
|
|
2018 | 2017 | |||||||||||||||||||||||||||||||||||
|
|
Change in Net Sales versus Prior Fiscal Year | Change in Net Sales versus Prior Fiscal Year | |||||||||||||||||||||||||||||||||||
|
|
Net Sales
Growth |
Organic Net
Sales Growth |
Translation | Acquisitions |
Net Sales
Growth |
Organic Net
Sales Growth |
Translation |
Acquisitions
(Divestiture) |
|||||||||||||||||||||||||||||
|
|
($ in millions)
|
||||||||||||||||||||||||||||||||||||
|
Transportation Solutions |
$ | 1,251 | 17.8 | % | $ | 739 | 10.5 | % | $ | 295 | $ | 217 | $ | 536 | 8.2 | % | $ | 553 | 8.5 | % | $ | (47 | ) | $ | 30 | ||||||||||||
|
Industrial Solutions |
349 | 10.0 | 207 | 5.9 | 110 | 32 | 292 | 9.1 | 50 | 1.6 | (20 | ) | 262 | ||||||||||||||||||||||||
|
Communications Solutions |
203 | 12.4 | 172 | 10.5 | 31 | — | 5 | 0.3 | 91 | 5.7 | (16 | ) | (70 | ) | |||||||||||||||||||||||
| | | | | | | | | | | | | | | | | | | | | | | | | | | | | | | | | | | | | | |
|
Total |
$ | 1,803 | 14.8 | % | $ | 1,118 | 9.2 | % | $ | 436 | $ | 249 | $ | 833 | 7.3 | % | $ | 694 | 6.1 | % | $ | (83 | ) | $ | 222 | ||||||||||||
| | | | | | | | | | | | | | | | | | | | | | | | | | | | | | | | | | | | | | |
| | | | | | | | | | | | | | | | | | | | | | | | | | | | | | | | | | | | | | |
| | | | | | | | | | | | | | | | | | | | | | | | | | | | | | | | | | | | | | |
Net sales increased $1,803 million, or 14.8%, in fiscal 2018 as compared to fiscal 2017. The increase in net sales resulted from organic net sales growth of 9.2%, the positive impact of foreign currency translation of 3.6% due to the strengthening of certain foreign currencies, and sales contributions from acquisitions of 2.0%. Organic net sales were adversely affected by price erosion of $180 million in fiscal 2018.
26
Net sales increased $833 million, or 7.3%, in fiscal 2017 as compared to fiscal 2016. The increase in net sales resulted from organic net sales growth of 6.1% and net sales contributions from acquisitions and a divestiture of 1.9%, partially offset by the negative impact of foreign currency translation of 0.7% due to the weakening of certain foreign currencies. Organic net sales were adversely affected by price erosion of $218 million in fiscal 2017. Fiscal 2016 included an additional week which contributed $227 million in net sales. The impact of the additional week was estimated using an average weekly sales figure for the last month of the fiscal year.
See further discussion of net sales below under "Segment Results."
Net Sales by Geographic Region. Our business operates in three geographic regions—EMEA, Asia–Pacific, and the Americas—and our results of operations are influenced by changes in foreign currency exchange rates. Increases or decreases in the value of the U.S. dollar, compared to other currencies, will directly affect our reported results as we translate those currencies into U.S. dollars at the end of each fiscal period. We sell our products into approximately 140 countries, and approximately 60% of our net sales were invoiced in currencies other than the U.S. dollar in fiscal 2018. The percentage of net sales in fiscal 2018 by major currencies invoiced was as follows:
|
Currencies
|
Percentage | |||
|---|---|---|---|---|
|
U.S. dollar |
40 | % | ||
|
Euro |
32 | |||
|
Chinese renminbi |
14 | |||
|
Japanese yen |
6 | |||
|
All others |
8 | |||
| | | | | |
|
Total |
100 | % | ||
| | | | | |
| | | | | |
| | | | | |
The following table presents our net sales and the percentage of total net sales by geographic region:
|
|
Fiscal | ||||||||||||||||||
|---|---|---|---|---|---|---|---|---|---|---|---|---|---|---|---|---|---|---|---|
|
|
2018 | 2017 | 2016 | ||||||||||||||||
|
|
($ in millions)
|
||||||||||||||||||
|
EMEA |
$ | 5,255 | 38 | % | $ | 4,399 | 36 | % | $ | 4,114 | 36 | % | |||||||
|
Asia–Pacific |
4,762 | 34 | 4,312 | 35 | 3,923 | 35 | |||||||||||||
|
Americas |
3,971 | 28 | 3,474 | 29 | 3,315 | 29 | |||||||||||||
| | | | | | | | | | | | | | | | | | | | |
|
Total |
$ | 13,988 | 100 | % | $ | 12,185 | 100 | % | $ | 11,352 | 100 | % | |||||||
| | | | | | | | | | | | | | | | | | | | |
| | | | | | | | | | | | | | | | | | | | |
| | | | | | | | | | | | | | | | | | | | |
The following table provides an analysis of the change in our net sales compared to the prior fiscal year by geographic region:
|
|
Fiscal | ||||||||||||||||||||||||||||||||||||
|---|---|---|---|---|---|---|---|---|---|---|---|---|---|---|---|---|---|---|---|---|---|---|---|---|---|---|---|---|---|---|---|---|---|---|---|---|---|
|
|
2018 | 2017 | |||||||||||||||||||||||||||||||||||
|
|
Change in Net Sales versus Prior Fiscal Year | Change in Net Sales versus Prior Fiscal Year | |||||||||||||||||||||||||||||||||||
|
|
Net Sales
Growth |
Organic Net
Sales Growth |
Translation | Acquisitions |
Net Sales
Growth |
Organic Net
Sales Growth |
Translation |
Acquisitions
(Divestiture) |
|||||||||||||||||||||||||||||
|
|
($ in millions)
|
||||||||||||||||||||||||||||||||||||
|
EMEA |
$ | 856 | 19.5 | % | $ | 330 | 7.5 | % | $ | 332 | $ | 194 | $ | 285 | 6.9 | % | $ | 140 | 3.4 | % | $ | (24 | ) | $ | 169 | ||||||||||||
|
Asia–Pacific |
450 | 10.4 | 318 | 7.4 | 117 | 15 | 389 | 9.9 | 498 | 12.7 | (66 | ) | (43 | ) | |||||||||||||||||||||||
|
Americas |
497 | 14.3 | 470 | 13.6 | (13 | ) | 40 | 159 | 4.8 | 56 | 1.7 | 7 | 96 | ||||||||||||||||||||||||
| | | | | | | | | | | | | | | | | | | | | | | | | | | | | | | | | | | | | | |
|
Total |
$ | 1,803 | 14.8 | % | $ | 1,118 | 9.2 | % | $ | 436 | $ | 249 | $ | 833 | 7.3 | % | $ | 694 | 6.1 | % | $ | (83 | ) | $ | 222 | ||||||||||||
| | | | | | | | | | | | | | | | | | | | | | | | | | | | | | | | | | | | | | |
| | | | | | | | | | | | | | | | | | | | | | | | | | | | | | | | | | | | | | |
| | | | | | | | | | | | | | | | | | | | | | | | | | | | | | | | | | | | | | |
27
Cost of Sales and Gross Margin
The following table presents cost of sales and gross margin information:
|
|
Fiscal |
Fiscal
2018 versus 2017 |
Fiscal
2017 versus 2016 |
|||||||||||||
|---|---|---|---|---|---|---|---|---|---|---|---|---|---|---|---|---|
|
|
2018 | 2017 | 2016 | |||||||||||||
|
|
($ in millions)
|
|||||||||||||||
|
Cost of sales |
$ | 9,243 | $ | 8,002 | $ | 7,525 | $ | 1,241 | $ | 477 | ||||||
|
As a percentage of net sales |
66.1 | % | 65.7 | % | 66.3 | % | ||||||||||
|
Gross margin |
$ |
4,745 |
$ |
4,183 |
$ |
3,827 |
(1) |
$ |
562 |
$ |
356 |
|||||
|
As a percentage of net sales |
33.9 | % | 34.3 | % | 33.7 | % | ||||||||||
- (1)
- Fiscal 2016 included an additional week which contributed $86 million in gross margin.
In fiscal 2018, gross margin increased $562 million as compared to fiscal 2017, primarily as a result of higher volume and the positive impact of foreign currency translation, partially offset by price erosion. Gross margin as a percentage of net sales decreased to 33.9% in fiscal 2018 from 34.3% in fiscal 2017. Gross margin increased $356 million in fiscal 2017 as compared to fiscal 2016 due primarily to higher volume and lower material costs, partially offset by price erosion. Gross margin as a percentage of net sales increased to 34.3% in fiscal 2017 from 33.7% in fiscal 2016.
Cost of sales and gross margin are subject to variability in raw material prices which continue to fluctuate for many of the raw materials used in the manufacture of our products. In fiscal 2018, we purchased approximately 195 million pounds of copper, 139,000 troy ounces of gold, and 2.8 million troy ounces of silver. The following table presents the average prices incurred related to copper, gold, and silver.
|
|
|
Fiscal | ||||||||||
|---|---|---|---|---|---|---|---|---|---|---|---|---|
|
|
Measure | 2018 | 2017 | 2016 | ||||||||
|
Copper |
Lb. | $ | 2.86 | $ | 2.48 | $ | 2.49 | |||||
|
Gold |
Troy oz. | 1,281 | 1,229 | 1,212 | ||||||||
|
Silver |
Troy oz. | 17.15 | 16.75 | 16.08 | ||||||||
In fiscal 2019, we expect to purchase approximately 210 million pounds of copper, 140,000 troy ounces of gold, and 2.8 million troy ounces of silver.
The following table presents operating expense information:
|
|
Fiscal |
Fiscal
2018 versus 2017 |
Fiscal
2017 versus 2016 |
|||||||||||||
|---|---|---|---|---|---|---|---|---|---|---|---|---|---|---|---|---|
|
|
2018 | 2017 | 2016 | |||||||||||||
|
|
($ in millions)
|
|||||||||||||||
|
Selling, general, and administrative expenses |
$ | 1,594 | $ | 1,543 | $ | 1,396 | $ | 51 | $ | 147 | ||||||
|
As a percentage of net sales |
11.4 | % | 12.7 | % | 12.3 | % | ||||||||||
|
Research, development, and engineering expenses |
$ |
680 |
$ |
611 |
$ |
603 |
$ |
69 |
$ |
8 |
||||||
|
Restructuring and other charges (credits), net |
126 | 147 | (2 | ) | (21 | ) | 149 | |||||||||
Selling, General, and Administrative Expenses. In fiscal 2018, selling, general, and administrative expenses increased $51 million as compared to fiscal 2017 due primarily to increased selling expenses to support higher sales levels and incremental expenses attributable to recently acquired businesses,
28
partially offset by lower incentive compensation costs and a gain on the sale of certain assets. Selling, general, and administrative expenses increased $147 million in fiscal 2017 as compared to fiscal 2016 primarily as a result of increased incentive compensation costs, increased selling expenses to support higher sales levels, and increased costs associated with long-term expense reduction initiatives.
Research, Development, and Engineering Expenses. In fiscal 2018, research, development, and engineering expenses increased $69 million as compared to fiscal 2017 due to costs related to growth initiatives, primarily in the Transportation Solutions segment.
Restructuring and Other Charges (Credits), Net. We are committed to continuous productivity improvements, and we evaluate opportunities to simplify our global manufacturing footprint, migrate facilities to lower-cost regions, reduce fixed costs, and eliminate excess capacity. These initiatives are designed to help us maintain our competitiveness in the industry, improve our operating leverage, and position us for future growth.
During fiscal 2018, we initiated a restructuring program associated with footprint consolidation and structural improvements primarily impacting the Industrial Solutions and Transportation Solutions segments. During fiscal 2017, we initiated a restructuring program associated with footprint consolidation related to recent acquisitions and structural improvements impacting all segments. During fiscal 2016, we initiated a restructuring program associated with headcount reductions impacting all segments and product line closures in the Communications Solutions segment.
In connection with these initiatives, we recorded net restructuring charges of $140 million, $146 million, and $121 million in fiscal 2018, 2017, and 2016, respectively. Annualized cost savings related to actions initiated in fiscal 2018 are expected to be approximately $125 million and are expected to be realized by the end of fiscal 2020. Cost savings will be reflected primarily in cost of sales and selling, general, and administrative expenses. During fiscal 2019, we expect net restructuring charges to be similar to fiscal 2018 levels and we expect total spending, which will be funded with cash from operations, to be approximately $140 million.
During fiscal 2016, we recognized a pre-tax gain of $144 million on the sale of our CPD business.
See Note 3 to the Consolidated Financial Statements for additional information regarding net restructuring and other charges (credits).
The following table presents operating income and operating margin information:
|
|
Fiscal |
Fiscal
2018 versus 2017 |
Fiscal
2017 versus 2016 |
|||||||||||||
|---|---|---|---|---|---|---|---|---|---|---|---|---|---|---|---|---|
|
|
2018 | 2017 | 2016 | |||||||||||||
|
|
($ in millions)
|
|||||||||||||||
|
Operating income |
$ | 2,331 | $ | 1,876 | $ | 1,808 | (1) | $ | 455 | $ | 68 | |||||
|
Operating margin |
16.7 | % | 15.4 | % | 15.9 | % | ||||||||||
- (1)
- Fiscal 2016 included an additional week which contributed $53 million in operating income.
29
Operating income included the following:
|
|
Fiscal | |||||||||
|---|---|---|---|---|---|---|---|---|---|---|
|
|
2018 | 2017 | 2016 | |||||||
|
|
(in millions)
|
|||||||||
|
Acquisition related charges: |
||||||||||
|
Acquisition and integration costs |
$ | 14 | $ | 6 | $ | 22 | ||||
|
Charges associated with the amortization of acquisition-related fair value adjustments |
8 | 5 | 10 | |||||||
| | | | | | | | | | | |
|
|
22 | 11 | 32 | |||||||
|
Restructuring and other charges (credits), net |
126 |
147 |
(2 |
) |
||||||
| | | | | | | | | | | |
|
Total |
$ | 148 | $ | 158 | $ | 30 | ||||
| | | | | | | | | | | |
| | | | | | | | | | | |
| | | | | | | | | | | |
See discussion of operating income below under "Segment Results."
The following table presents select non-operating information:
|
|
Fiscal |
Fiscal
2018 versus 2017 |
Fiscal
2017 versus 2016 |
|||||||||||||
|---|---|---|---|---|---|---|---|---|---|---|---|---|---|---|---|---|
|
|
2018 | 2017 | 2016 | |||||||||||||
|
|
($ in millions)
|
|||||||||||||||
|
Other income (expense), net |
$ | 1 | $ | (42 | ) | $ | (677 | ) | $ | 43 | $ | 635 | ||||
|
Income tax expense (benefit) |
(344 |
) |
180 |
(826 |
) |
(524 |
) |
1,006 |
||||||||
|
Effective tax rate |
(15.4 | )% | 10.5 | % | (80.9 | )% | ||||||||||
|
Income (loss) from discontinued operations, net of income taxes |
$ |
(19 |
) |
$ |
143 |
$ |
162 |
$ |
(162 |
) |
$ |
(19 |
) |
|||
Other Income (Expense), Net. In fiscal 2016, we recorded net other expense primarily pursuant to the Tax Sharing Agreement with Tyco International plc ("Tyco International") and Covidien plc ("Covidien"). See Note 16 to the Consolidated Financial Statements for further information regarding net other income (expense).
Income Taxes. See Note 15 to the Consolidated Financial Statements for information regarding items impacting income tax expense (benefit) and the effective tax rate for fiscal 2018, 2017, and 2016 and information regarding the Tax Cuts and Jobs Act (the "Act"). We do not expect a significant change in our effective tax rate on future results of operations as a result of the Act.
The valuation allowance for deferred tax assets was $2,191 million and $3,627 million at fiscal year end 2018 and 2017, respectively. See Note 15 to the Consolidated Financial Statements for further information regarding the valuation allowance for deferred tax assets.
As of fiscal year end 2018, certain subsidiaries had approximately $23 billion of cumulative undistributed earnings that have been retained indefinitely and reinvested in our global manufacturing operations, including working capital; property, plant, and equipment; intangible assets; and research and development activities. See Note 15 to the Consolidated Financial Statements for additional information regarding undistributed earnings.
Income (Loss) from Discontinued Operations, Net of Income Taxes. On September 16, 2018, we entered into a definitive agreement to sell our SubCom business. The net sales of the business were $702 million, $928 million, $886 million in fiscal 2018, 2017, and 2016, respectively. In fiscal 2018, net sales and operating income were negatively impacted by production delays on a program. In fiscal 2017, net sales increased as a result of higher project activity and operating income was positively impacted by lower material costs and improved manufacturing productivity as compared to fiscal 2016.
30
In connection with the sale of the SubCom business, in fiscal 2018, we recorded a pre-tax impairment charge of $19 million, which is included in income (loss) from discontinued operations on the Consolidated Statement of Operations, to write the carrying value of the business down to its estimated fair value less costs to sell. We expect to incur a pre-tax loss on sale of approximately $90 million, related primarily to the recognition of cumulative translation adjustment losses and certain guarantee liabilities, which will be presented in income (loss) from discontinued operations on the Consolidated Statement of Operations. In November 2018, we completed the sale of the SubCom business for $325 million. The proceeds received are subject to a final working capital adjustment.
During fiscal 2016, we settled a lawsuit with the former shareholders of Com-Net, which we acquired in fiscal 2001, and recorded pre-tax credits of $30 million representing a release of excess reserves. This amount was reflected in income (loss) from discontinued operations on the Consolidated Statement of Operations as the Com-Net case was associated with our former Wireless Systems business which was sold in fiscal 2009. Also during fiscal 2016, we recognized an additional pre-tax gain of $29 million on the fiscal 2015 divestiture of our Broadband Network Solutions ("BNS") business, related primarily to pension and net working capital adjustments.
See Notes 4 and 23 to the Consolidated Financial Statements for additional information regarding discontinued operations.
Net Sales. The following table presents the Transportation Solutions segment's net sales and the percentage of total net sales by primary industry end market (1) :
|
|
Fiscal | ||||||||||||||||||
|---|---|---|---|---|---|---|---|---|---|---|---|---|---|---|---|---|---|---|---|
|
|
2018 | 2017 | 2016 | ||||||||||||||||
|
|
($ in millions)
|
||||||||||||||||||
|
Automotive |
$ | 6,092 | 74 | % | $ | 5,228 | 74 | % | $ | 4,912 | 75 | % | |||||||
|
Commercial transportation |
1,280 | 15 | 997 | 14 | 825 | 13 | |||||||||||||
|
Sensors |
918 | 11 | 814 | 12 | 766 | 12 | |||||||||||||
| | | | | | | | | | | | | | | | | | | | |
|
Total |
$ | 8,290 | 100 | % | $ | 7,039 | 100 | % | $ | 6,503 | 100 | % | |||||||
| | | | | | | | | | | | | | | | | | | | |
| | | | | | | | | | | | | | | | | | | | |
| | | | | | | | | | | | | | | | | | | | |
- (1)
- Industry end market information is presented consistently with our internal management reporting and may be revised periodically as management deems necessary.
The following table provides an analysis of the change in the Transportation Solutions segment's net sales compared to the prior fiscal year by primary industry end market:
|
|
Fiscal | ||||||||||||||||||||||||||||||||||||
|---|---|---|---|---|---|---|---|---|---|---|---|---|---|---|---|---|---|---|---|---|---|---|---|---|---|---|---|---|---|---|---|---|---|---|---|---|---|
|
|
2018 | 2017 | |||||||||||||||||||||||||||||||||||
|
|
Change in Net Sales versus Prior Fiscal Year | Change in Net Sales versus Prior Fiscal Year | |||||||||||||||||||||||||||||||||||
|
|
Net Sales
Growth |
Organic Net
Sales Growth |
Translation | Acquisition |
Net Sales
Growth |
Organic Net
Sales Growth |
Translation | Acquisition | |||||||||||||||||||||||||||||
|
|
($ in millions)
|
||||||||||||||||||||||||||||||||||||
|
Automotive |
$ | 864 | 16.5 | % | $ | 434 | 8.2 | % | $ | 213 | $ | 217 | $ | 316 | 6.4 | % | $ | 349 | 7.1 | % | $ | (33 | ) | $ | — | ||||||||||||
|
Commercial transportation |
283 | 28.4 | 233 | 23.2 | 50 | — | 172 | 20.8 | 181 | 21.9 | (9 | ) | — | ||||||||||||||||||||||||
|
Sensors |
104 | 12.8 | 72 | 8.9 | 32 | — | 48 | 6.3 | 23 | 3.0 | (5 | ) | 30 | ||||||||||||||||||||||||
| | | | | | | | | | | | | | | | | | | | | | | | | | | | | | | | | | | | | | |
|
Total |
$ | 1,251 | 17.8 | % | $ | 739 | 10.5 | % | $ | 295 | $ | 217 | $ | 536 | 8.2 | % | $ | 553 | 8.5 | % | $ | (47 | ) | $ | 30 | ||||||||||||
| | | | | | | | | | | | | | | | | | | | | | | | | | | | | | | | | | | | | | |
| | | | | | | | | | | | | | | | | | | | | | | | | | | | | | | | | | | | | | |
| | | | | | | | | | | | | | | | | | | | | | | | | | | | | | | | | | | | | | |
In fiscal 2018, net sales in the Transportation Solutions segment increased $1,251 million, or 17.8%, from fiscal 2017 due to organic net sales growth of 10.5%, the positive impact of foreign
31
currency translation of 4.2%, and sales contributions from an acquisition of 3.1%. Our organic net sales by primary industry end market were as follows:
- •
-
Automotive
—Our organic net sales increased 8.2% in fiscal 2018 with growth of 16.0%
in the Americas region, 8.3% in the EMEA region, and 5.0% in the Asia–Pacific region. Our growth in the Americas region resulted from electronification and market share gains in North
America and market growth in South America. In the EMEA region, our growth was driven by market growth, electronification, and market share gains. Our growth in the Asia–Pacific region was
driven by market share gains and electronification.
- •
-
Commercial transportation
—Our organic net sales increased 23.2% in fiscal 2018 with
growth in all regions due primarily to strength in the heavy truck, construction, and agriculture markets.
- •
- Sensors —Our organic net sales increased 8.9% in fiscal 2018 primarily as a result of growth in the commercial transportation, industrial equipment, and automotive markets.
Net sales in the Transportation Solutions segment increased $536 million, or 8.2%, in fiscal 2017 from fiscal 2016 primarily as a result of organic net sales growth of 8.5%. Fiscal 2016 included an additional week which contributed $130 million in net sales. Our organic net sales by primary industry end market were as follows:
- •
-
Automotive
—Our organic net sales increased 7.1% in fiscal 2017. The increase
resulted from growth of 11.1% in the Asia–Pacific region, 5.6% in the EMEA region, and 1.4% in the Americas region. Our growth in the Asia–Pacific region was driven by
increased demand in China resulting from a tax incentive program, market share gains, and increased electronification. In the EMEA region, our organic net sales growth was driven by market growth,
electronification, and new model launches. Our growth in the Americas region resulted from continued market recovery in South America.
- •
-
Commercial transportation
—Our organic net sales increased 21.9% in fiscal 2017
primarily as a result of growth in the heavy truck market in all regions and content gains in China.
- •
- Sensors —Our organic net sales increased 3.0% in fiscal 2017 due primarily to growth in the industrial equipment and commercial transportation markets, partially offset by declines in the data and devices market.
Operating Income. The following table presents the Transportation Solutions segment's operating income and operating margin information:
|
|
Fiscal |
Fiscal
2018 versus 2017 |
Fiscal
2017 versus 2016 |
|||||||||||||
|---|---|---|---|---|---|---|---|---|---|---|---|---|---|---|---|---|
|
|
2018 | 2017 | 2016 | |||||||||||||
|
|
($ in millions)
|
|||||||||||||||
|
Operating income |
$ | 1,578 | $ | 1,294 | $ | 1,209 | $ | 284 | $ | 85 | ||||||
|
Operating margin |
19.0 | % | 18.4 | % | 18.6 | % | ||||||||||
Operating income in the Transportation Solutions segment increased $284 million in fiscal 2018 as compared to fiscal 2017. In fiscal 2017, operating income in the Transportation Solutions segment
32
increased $85 million from fiscal 2016. The Transportation Solutions segment's operating income included the following:
|
|
Fiscal | |||||||||
|---|---|---|---|---|---|---|---|---|---|---|
|
|
2018 | 2017 | 2016 | |||||||
|
|
(in millions)
|
|||||||||
|
Acquisition related charges: |
||||||||||
|
Acquisition and integration costs |
$ | 8 | $ | 3 | $ | 9 | ||||
|
Charges associated with the amortization of acquisition-related fair value adjustments |
4 | — | — | |||||||
| | | | | | | | | | | |
|
|
12 | 3 | 9 | |||||||
|
Restructuring and other charges, net |
33 | 69 | 47 | |||||||
| | | | | | | | | | | |
|
Total |
$ | 45 | $ | 72 | $ | 56 | ||||
| | | | | | | | | | | |
| | | | | | | | | | | |
| | | | | | | | | | | |
Excluding these items, operating income increased in fiscal 2018 primarily as a result of higher volume and, to a lesser degree, lower material costs, partially offset by price erosion. Excluding these items, operating income increased in fiscal 2017 primarily as a result of higher volume, partially offset by price erosion.
Net Sales. The following table presents the Industrial Solutions segment's net sales and the percentage of total net sales by primary industry end market (1) :
|
|
Fiscal | ||||||||||||||||||
|---|---|---|---|---|---|---|---|---|---|---|---|---|---|---|---|---|---|---|---|
|
|
2018 | 2017 | 2016 | ||||||||||||||||
|
|
($ in millions)
|
||||||||||||||||||
|
Industrial equipment |
$ | 1,987 | 52 | % | $ | 1,747 | 50 | % | $ | 1,419 | 44 | % | |||||||
|
Aerospace, defense, oil, and gas |
1,157 | 30 | 1,075 | 31 | 1,100 | 34 | |||||||||||||
|
Energy |
712 | 18 | 685 | 19 | 696 | 22 | |||||||||||||
| | | | | | | | | | | | | | | | | | | | |
|
Total |
$ | 3,856 | 100 | % | $ | 3,507 | 100 | % | $ | 3,215 | 100 | % | |||||||
| | | | | | | | | | | | | | | | | | | | |
| | | | | | | | | | | | | | | | | | | | |
| | | | | | | | | | | | | | | | | | | | |
- (1)
- Industry end market information is presented consistently with our internal management reporting and may be revised periodically as management deems necessary.
The following table provides an analysis of the change in the Industrial Solutions segment's net sales compared to the prior fiscal year by primary industry end market:
|
|
Fiscal | ||||||||||||||||||||||||||||||||||||
|---|---|---|---|---|---|---|---|---|---|---|---|---|---|---|---|---|---|---|---|---|---|---|---|---|---|---|---|---|---|---|---|---|---|---|---|---|---|
|
|
2018 | 2017 | |||||||||||||||||||||||||||||||||||
|
|
Change in Net Sales versus Prior Fiscal Year | Change in Net Sales versus Prior Fiscal Year | |||||||||||||||||||||||||||||||||||
|
|
Net Sales
Growth |
Organic Net
Sales Growth |
Translation | Acquisitions |
Net Sales
Growth |
Organic Net
Sales Growth |
Translation | Acquisitions | |||||||||||||||||||||||||||||
|
|
($ in millions)
|
||||||||||||||||||||||||||||||||||||
|
Industrial equipment |
$ | 240 | 13.7 | % | $ | 150 | 8.6 | % | $ | 58 | $ | 32 | $ | 328 | 23.1 | % | $ | 77 | 5.5 | % | $ | (10 | ) | $ | 261 | ||||||||||||
|
Aerospace, defense, oil, and gas |
82 | 7.6 | 51 | 4.7 | 31 | — | (25 | ) | (2.3 | ) | (19 | ) | (1.7 | ) | (7 | ) | 1 | ||||||||||||||||||||
|
Energy |
27 | 3.9 | 6 | 0.9 | 21 | — | (11 | ) | (1.6 | ) | (8 | ) | (1.0 | ) | (3 | ) | — | ||||||||||||||||||||
| | | | | | | | | | | | | | | | | | | | | | | | | | | | | | | | | | | | | | |
|
Total |
$ | 349 | 10.0 | % | $ | 207 | 5.9 | % | $ | 110 | $ | 32 | $ | 292 | 9.1 | % | $ | 50 | 1.6 | % | $ | (20 | ) | $ | 262 | ||||||||||||
| | | | | | | | | | | | | | | | | | | | | | | | | | | | | | | | | | | | | | |
| | | | | | | | | | | | | | | | | | | | | | | | | | | | | | | | | | | | | | |
| | | | | | | | | | | | | | | | | | | | | | | | | | | | | | | | | | | | | | |
Net sales in the Industrial Solutions segment increased $349 million, or 10.0%, in fiscal 2018 as compared to fiscal 2017 due to organic net sales growth of 5.9%, the positive impact of foreign
33
currency translation of 3.2%, and sales contributions from acquisitions of 0.9%. Our organic net sales by primary industry end market were as follows:
- •
-
Industrial equipment
—Our organic net sales increased 8.6% in fiscal 2018 primarily
as a result of strength in factory automation and controls and medical applications.
- •
-
Aerospace, defense, oil, and gas
—Our organic net sales increased 4.7% in fiscal
2018 due to growth in the commercial aerospace, defense, and oil and gas markets.
- •
- Energy —Our organic net sales increased 0.9% in fiscal 2018 as a result of growth in the Americas region, partially offset by declines in the EMEA and Asia–Pacific regions.
In the Industrial Solutions segment, net sales increased $292 million, or 9.1%, in fiscal 2017 from fiscal 2016 due to sales contributions from acquisitions of 8.1% and organic net sales growth of 1.6%, partially offset by the negative impact of foreign currency translation of 0.6%. Fiscal 2016 included an additional week which contributed $65 million in net sales. Our organic net sales by primary industry end market were as follows:
- •
-
Industrial equipment
—Our organic net sales increased 5.5% in fiscal 2017 due
primarily to growth in factory automation and controls and medical applications.
- •
-
Aerospace, defense, oil, and gas
—Our organic net sales decreased 1.7% in fiscal
2017 due to continued weakness in the oil and gas market and declines in our sales into the commercial aerospace market, partially offset by growth in the defense market.
- •
- Energy —Our organic net sales decreased 1.0% in fiscal 2017 due to declines in the EMEA and Americas regions, partially offset by growth in the Asia–Pacific region.
Operating Income. The following table presents the Industrial Solutions segment's operating income and operating margin information:
|
|
Fiscal |
Fiscal
2018 versus 2017 |
Fiscal
2017 versus 2016 |
|||||||||||||
|---|---|---|---|---|---|---|---|---|---|---|---|---|---|---|---|---|
|
|
2018 | 2017 | 2016 | |||||||||||||
|
|
($ in millions)
|
|||||||||||||||
|
Operating income |
$ | 465 | $ | 364 | $ | 353 | $ | 101 | $ | 11 | ||||||
|
Operating margin |
12.1 | % | 10.4 | % | 11.0 | % | ||||||||||
Operating income in the Industrial Solutions segment increased $101 million in fiscal 2018 as compared to fiscal 2017 and increased $11 million in fiscal 2017 as compared to fiscal 2016. The Industrial Solutions segment's operating income included the following:
|
|
Fiscal | |||||||||
|---|---|---|---|---|---|---|---|---|---|---|
|
|
2018 | 2017 | 2016 | |||||||
|
|
(in millions)
|
|||||||||
|
Acquisition related charges: |
||||||||||
|
Acquisition and integration costs |
$ | 6 | $ | 3 | $ | 13 | ||||
|
Charges associated with the amortization of acquisition-related fair value adjustments |
4 | 5 | 10 | |||||||
| | | | | | | | | | | |
|
|
10 | 8 | 23 | |||||||
|
Restructuring and other charges, net |
80 | 74 | 31 | |||||||
| | | | | | | | | | | |
|
Total |
$ | 90 | $ | 82 | $ | 54 | ||||
| | | | | | | | | | | |
| | | | | | | | | | | |
| | | | | | | | | | | |
34
Excluding these items, operating income increased in fiscal 2018 due primarily to higher volume. Excluding these items, operating income increased in fiscal 2017 primarily as a result of higher volume, partially offset by price erosion.
Net Sales. The following table presents the Communications Solutions segment's net sales and the percentage of total net sales by primary industry end market (1) :
|
|
Fiscal | ||||||||||||||||||
|---|---|---|---|---|---|---|---|---|---|---|---|---|---|---|---|---|---|---|---|
|
|
2018 | 2017 | 2016 | ||||||||||||||||
|
|
($ in millions)
|
||||||||||||||||||
|
Data and devices |
$ | 1,068 | 58 | % | $ | 963 | 59 | % | $ | 1,019 | 62 | % | |||||||
|
Appliances |
774 | 42 | 676 | 41 | 615 | 38 | |||||||||||||
| | | | | | | | | | | | | | | | | | | | |
|
Total |
$ | 1,842 | 100 | % | $ | 1,639 | 100 | % | $ | 1,634 | 100 | % | |||||||
| | | | | | | | | | | | | | | | | | | | |
| | | | | | | | | | | | | | | | | | | | |
| | | | | | | | | | | | | | | | | | | | |
- (1)
- Industry end market information is presented consistently with our internal management reporting and may be revised periodically as management deems necessary.
The following table provides an analysis of the change in the Communications Solutions segment's net sales compared to the prior fiscal year by primary industry end market:
|
|
Fiscal | |||||||||||||||||||||||||||||||||
|---|---|---|---|---|---|---|---|---|---|---|---|---|---|---|---|---|---|---|---|---|---|---|---|---|---|---|---|---|---|---|---|---|---|---|
|
|
2018 | 2017 | ||||||||||||||||||||||||||||||||
|
|
Change in Net Sales versus Prior Fiscal Year | Change in Net Sales versus Prior Fiscal Year | ||||||||||||||||||||||||||||||||
|
|
Net Sales
Growth |
Organic Net
Sales Growth |
Translation |
Net Sales
Growth |
Organic Net
Sales Growth |
Translation | Divestiture | |||||||||||||||||||||||||||
|
|
($ in millions)
|
|||||||||||||||||||||||||||||||||
|
Data and devices |
$ | 105 | 10.9 | % | $ | 91 | 9.5 | % | $ | 14 | $ | (56 | ) | (5.5 | )% | $ | 24 | 2.3 | % | $ | (10 | ) | $ | (70 | ) | |||||||||
|
Appliances |
98 | 14.5 | 81 | 12.0 | 17 | 61 | 9.9 | 67 | 10.8 | (6 | ) | — | ||||||||||||||||||||||
| | | | | | | | | | | | | | | | | | | | | | | | | | | | | | | | | | | |
|
Total |
$ | 203 | 12.4 | % | $ | 172 | 10.5 | % | $ | 31 | $ | 5 | 0.3 | % | $ | 91 | 5.7 | % | $ | (16 | ) | $ | (70 | ) | ||||||||||
| | | | | | | | | | | | | | | | | | | | | | | | | | | | | | | | | | | |
| | | | | | | | | | | | | | | | | | | | | | | | | | | | | | | | | | | |
| | | | | | | | | | | | | | | | | | | | | | | | | | | | | | | | | | | |
In fiscal 2018, net sales in the Communications Solutions segment increased $203 million, or 12.4%, as compared to fiscal 2017 due to organic net sales growth of 10.5% and the positive impact of foreign currency translation of 1.9%. Our organic net sales by primary industry end market were as follows:
- •
-
Data and devices
—Our organic net sales increased 9.5% in fiscal 2018 as a result of
growth in all regions, primarily attributable to growth in high speed connectivity in data center applications.
- •
- Appliances —Our organic net sales increased 12.0% in fiscal 2018 as a result of growth in all regions and market share gains.
Net sales in the Communications Solutions segment increased $5 million in fiscal 2017 as compared to fiscal 2016. Organic net sales growth of 5.7% was largely offset by sales declines resulting from a divestiture of 4.3% and the negative impact of foreign currency translation of 1.1%. Fiscal 2016 included an additional week which contributed $32 million in net sales. Our organic net sales by primary industry end market were as follows:
- •
-
Data and devices
—Our organic net sales increased 2.3% in fiscal 2017 primarily as a
result of increased sales to cloud infrastructure customers, partially offset by sales declines resulting from weakness in the wireless market.
- •
- Appliances —Our organic net sales increased 10.8% in fiscal 2017 due primarily to growth in the Asia–Pacific region as a result of increased market demand and share gains.
35
Operating Income. The following table presents the Communications Solutions segment's operating income and operating margin information:
|
|
Fiscal |
Fiscal
2018 versus 2017 |
Fiscal
2017 versus 2016 |
|||||||||||||
|---|---|---|---|---|---|---|---|---|---|---|---|---|---|---|---|---|
|
|
2018 | 2017 | 2016 | |||||||||||||
|
|
($ in millions)
|
|||||||||||||||
|
Operating income |
$ | 288 | $ | 218 | $ | 246 | $ | 70 | $ | (28 | ) | |||||
|
Operating margin |
15.6 | % | 13.3 | % | 15.1 | % | ||||||||||
In the Communications Solutions segment, operating income increased $70 million in fiscal 2018 as compared to fiscal 2017 and decreased $28 million in fiscal 2017 as compared to fiscal 2016. The Communications Solutions segment's operating income included the following:
|
|
Fiscal | |||||||||
|---|---|---|---|---|---|---|---|---|---|---|
|
|
2018 | 2017 | 2016 | |||||||
|
|
(in millions)
|
|||||||||
|
Restructuring and other charges (credits), net |
$ | 13 | $ | 4 | $ | (80 | ) (1) | |||
- (1)
- Includes pre-tax gain of $144 million on the sale of our CPD business during fiscal 2016.
Excluding these items, operating income increased in both fiscal 2018 and 2017 due primarily to higher volume and improved manufacturing productivity, partially offset by price erosion.
Liquidity and Capital Resources
Our ability to fund our future capital needs will be affected by our ability to continue to generate cash from operations and may be affected by our ability to access the capital markets, money markets, or other sources of funding, as well as the capacity and terms of our financing arrangements. We believe that cash generated from operations and, to the extent necessary, these other sources of potential funding will be sufficient to meet our anticipated capital needs for the foreseeable future, including the payment of $325 million of 2.375% senior notes and $250 million of 2.35% senior notes due in fiscal 2019. We may use excess cash to purchase a portion of our common shares pursuant to our authorized share repurchase program, to acquire strategic businesses or product lines, to pay dividends on our common shares, or to reduce our outstanding debt. The cost or availability of future funding may be impacted by financial market conditions. We will continue to monitor financial markets and respond as necessary to changing conditions.
As of fiscal year end 2018, our cash and cash equivalents were held in subsidiaries which are located in various countries throughout the world. Under current applicable laws, substantially all of these amounts can be repatriated to Tyco Electronics Group S.A. ("TEGSA"), our Luxembourg subsidiary, which is the obligor of substantially all of our debt, and to TE Connectivity Ltd., our Swiss parent company; however, the repatriation of these amounts could subject us to additional tax expense. We provide for tax liabilities on the Consolidated Financial Statements with respect to amounts that we expect to repatriate; however, no tax liabilities are recorded for amounts that we consider to be retained indefinitely and reinvested in our global manufacturing operations. As of fiscal year end 2018, we had approximately $11.6 billion of cash, cash equivalents, and intercompany deposits, principally in our subsidiaries, that we have the ability to distribute to TEGSA and TE Connectivity Ltd. but we consider to be permanently reinvested. We estimate that up to $0.9 billion of tax expense would be recognized on the Consolidated Financial Statements if our intention to permanently reinvest these amounts were to change. Our current plans do not demonstrate a need to repatriate cash, cash equivalents, and intercompany deposits that are designated as permanently reinvested in order to fund our operations, including investing and financing activities.
36
Cash Flows from Operating Activities
Net cash provided by continuing operating activities increased $28 million to $2,301 million in fiscal 2018 as compared to $2,273 million in fiscal 2017. The increase resulted primarily from higher pre-tax income levels, substantially offset by the impact of higher working capital to support increased business levels and increased incentive compensation payments.
Net cash provided by continuing operating activities increased $340 million to $2,273 million in fiscal 2017 as compared to $1,933 million in fiscal 2016. The increase resulted primarily from higher pre-tax income levels, an increase in accrued and other current liabilities related primarily to incentive compensation, and a decrease in net payments related to pre-separation tax matters, partially offset by the impact of increased sales on accounts receivable levels.
The amount of income taxes paid, net of refunds, during fiscal 2018, 2017, and 2016 was $393 million, $323 million, and $806 million, respectively. In fiscal 2017 and 2016, these amounts included refunds of $23 million and payments of $471 million, respectively, related to pre-separation tax matters. During fiscal 2016, we received net reimbursements of $321 million from Tyco International and Covidien pursuant to their indemnifications for pre-separation tax matters. We do not expect a significant change in our income tax payments as a result of the Tax Cuts and Jobs Act.
See Note 15 to the Consolidated Financial Statements for further information regarding the Tax Sharing Agreement and payments related to pre-separation tax matters.
Pension contributions in fiscal 2018, 2017, and 2016 were $54 million, $48 million, and $67 million, respectively. We expect pension contributions to be $47 million in fiscal 2019, before consideration of any voluntary contributions.
Cash Flows from Investing Activities
Capital expenditures were $935 million, $679 million, and $603 million in fiscal 2018, 2017, and 2016, respectively. Capital spending increased in fiscal 2018 as a result of increased investments in growth initiatives, primarily in the Transportation Solutions segment. We expect fiscal 2019 capital spending levels to be approximately 5-6% of net sales. We believe our capital funding levels are adequate to support new programs, and we continue to invest in our manufacturing infrastructure to further enhance productivity and manufacturing capabilities.
During fiscal 2018, we acquired two businesses for a combined cash purchase price of $153 million, net of cash acquired. We acquired two businesses during fiscal 2017 for a combined cash purchase price of $250 million, net of cash acquired. In fiscal 2016, we acquired four businesses, including Creganna, for a combined cash purchase price of $1.3 billion, net of cash acquired. See Note 5 to the Consolidated Financial Statements for additional information regarding acquisitions.
During fiscal 2016, we received net cash proceeds of $333 million related to the sale of our CPD business. See Note 3 to the Consolidated Financial Statements for further information.
Cash Flows from Financing Activities and Capitalization
Total debt at fiscal year end 2018 and 2017 was $4,000 million and $4,344 million, respectively. See Note 11 to the Consolidated Financial Statements for additional information regarding debt.
TEGSA, our 100%-owned subsidiary, has a five-year unsecured senior revolving credit facility ("Credit Facility") with a maturity date of December 2020 and total commitments of $1,500 million. TEGSA had no borrowings under the Credit Facility at fiscal year end 2018 or 2017.
The Credit Facility contains a financial ratio covenant providing that if, as of the last day of each fiscal quarter, our ratio of Consolidated Total Debt to Consolidated EBITDA (as defined in the Credit
37
Facility) for the then most recently concluded period of four consecutive fiscal quarters exceeds 3.75 to 1.0, an Event of Default (as defined in the Credit Facility) is triggered. The Credit Facility and our other debt agreements contain other customary covenants. None of our covenants are presently considered restrictive to our operations. As of fiscal year end 2018, we were in compliance with all of our debt covenants and believe that we will continue to be in compliance with our existing covenants for the foreseeable future.
Periodically, TEGSA issues commercial paper to U.S. institutional accredited investors and qualified institutional buyers in accordance with available exemptions from the registration requirements of the Securities Act of 1933 as part of our ongoing effort to maintain financial flexibility and to potentially decrease the cost of borrowings. Borrowings under the commercial paper program are backed by the Credit Facility.
TEGSA's payment obligations under its senior notes, commercial paper, and Credit Facility are fully and unconditionally guaranteed by its parent, TE Connectivity Ltd.
Payments of common share dividends to shareholders were $588 million, $546 million, and $509 million in fiscal 2018, 2017, and 2016, respectively. See Note 18 to the Consolidated Financial Statements for additional information regarding dividends on our common shares.
Future dividends on our common shares, if any, must be approved by our shareholders. In exercising their discretion to recommend to the shareholders that such dividends be approved, our board of directors will consider our results of operations, cash requirements and surplus, financial condition, statutory requirements of applicable law, contractual restrictions, and other factors that they may deem relevant.
During fiscal 2018 and 2016, our board of directors authorized increases of $1.5 billion and $1.0 billion, respectively, in the share repurchase program. We repurchased approximately 10 million of our common shares for $966 million, 8 million of our common shares for $621 million, and 43 million of our common shares for $2,610 million under the share repurchase program during fiscal 2018, 2017, and 2016, respectively. At fiscal year end 2018, we had $1.0 billion of availability remaining under our share repurchase authorization.
The following table provides a summary of our contractual obligations and commitments for debt, minimum lease payment obligations under non-cancelable leases, and other obligations at fiscal year end 2018:
|
|
|
Payments Due by Fiscal Year | ||||||||||||||||||||
|---|---|---|---|---|---|---|---|---|---|---|---|---|---|---|---|---|---|---|---|---|---|---|
|
|
Total | 2019 | 2020 | 2021 | 2022 | 2023 | Thereafter | |||||||||||||||
|
|
(in millions)
|
|||||||||||||||||||||
|
Debt (1) |
$ | 4,021 | $ | 963 | $ | — | $ | 252 | $ | 501 | $ | 639 | $ | 1,666 | ||||||||
|
Interest payments on debt (2) |
1,092 | 119 | 109 | 103 | 88 | 79 | 594 | |||||||||||||||
|
Operating leases |
403 | 97 | 76 | 62 | 48 | 38 | 82 | |||||||||||||||
|
Purchase obligations (3) |
820 | 798 | 17 | 2 | — | — | 3 | |||||||||||||||
| | | | | | | | | | | | | | | | | | | | | | | |
|
Total contractual cash obligations (4)(5)(6) |
$ | 6,336 | $ | 1,977 | $ | 202 | $ | 419 | $ | 637 | $ | 756 | $ | 2,345 | ||||||||
| | | | | | | | | | | | | | | | | | | | | | | |
| | | | | | | | | | | | | | | | | | | | | | | |
| | | | | | | | | | | | | | | | | | | | | | | |
- (1)
-
Debt
represents principal payments. See Note 11 to the Consolidated Financial Statements for additional information regarding debt.
- (2)
-
Interest
payments exclude the impact of our interest rate swap contracts.
- (3)
- Purchase obligations consist primarily of commitments for purchases of goods and services.
38
- (4)
-
The
above table does not reflect unrecognized income tax benefits of $566 million and related accrued interest and penalties of $60 million, the timing
of which is uncertain. See Note 15 to the Consolidated Financial Statements for additional information regarding unrecognized income tax benefits, interest, and penalties.
- (5)
-
The
above table does not reflect pension obligations to certain employees and former employees. We are obligated to make contributions to our pension plans; however,
we are unable to determine the amount of plan contributions due to the inherent uncertainties of obligations of this type, including timing, interest rate charges, investment performance, and amounts
of benefit payments. We expect to contribute $47 million to pension plans in fiscal 2019, before consideration of any voluntary contributions. See Note 14 to the Consolidated Financial
Statements for additional information regarding these plans and our estimates of future contributions and benefit payments.
- (6)
- Other long-term liabilities of $487 million are excluded from the above table as we are unable to estimate the timing of payment for these items.
In the normal course of business, we are subject to various legal proceedings and claims, including patent infringement claims, product liability matters, employment disputes, disputes on agreements, other commercial disputes, environmental matters, antitrust claims, and tax matters, including non-income tax matters such as value added tax, sales and use tax, real estate tax, and transfer tax. Although it is not feasible to predict the outcome of these proceedings, based upon our experience, current information, and applicable law, we do not expect that the outcome of these proceedings, either individually or in the aggregate, will have a material effect on our results of operations, financial position, or cash flows.
Off-Balance Sheet Arrangements
In certain instances, we have guaranteed the performance of third parties and provided financial guarantees for uncompleted work and financial commitments. The terms of these guarantees vary with end dates ranging from fiscal 2019 through the completion of such transactions. The guarantees would be triggered in the event of nonperformance, and the potential exposure for nonperformance under the guarantees would not have a material effect on our results of operations, financial position, or cash flows.
In disposing of assets or businesses, we often provide representations, warranties, and/or indemnities to cover various risks including unknown damage to assets, environmental risks involved in the sale of real estate, liability for investigation and remediation of environmental contamination at waste disposal sites and manufacturing facilities, and unidentified tax liabilities and legal fees related to periods prior to disposition. We do not expect that these uncertainties will have a material adverse effect on our results of operations, financial position, or cash flows.
At fiscal year end 2018, we had outstanding letters of credit, letters of guarantee, and surety bonds of $275 million.
As discussed above, in September 2018, we entered into a definitive agreement to sell our SubCom business. Following the divestiture, we will continue to honor performance guarantees and letters of credit related to the SubCom business' existing projects. These existing guarantees have a combined value of approximately $1.7 billion and are expected to expire at various dates through fiscal 2025; however, the majority are expected to expire within two years. Also, under the terms of the definitive agreement, we are required to issue up to $300 million of new performance guarantees, subject to certain limitations, for projects entered into by the SubCom business following the sale for a period of up to three years. We have contractual recourse against the SubCom business if we are required to perform on these guarantees; however, based on historical experience, we do not anticipate having to
39
perform. See Notes 4 and 23 to the Consolidated Financial Statements for additional information regarding the divestiture of the SubCom business.
Critical Accounting Policies and Estimates
The preparation of the Consolidated Financial Statements in conformity with GAAP requires management to make estimates and assumptions that affect the reported amounts of assets and liabilities, the disclosure of contingent assets and liabilities, and the reported amounts of revenue and expenses. Our significant accounting policies are summarized in Note 2 to the Consolidated Financial Statements. We believe the following accounting policies are the most critical as they require significant judgments and assumptions that involve inherent risks and uncertainties. Management's estimates are based on the relevant information available at the end of each period.
Our revenue recognition policies are in accordance with Accounting Standards Codification ("ASC") 605, Revenue Recognition . Our revenues are generated principally from the sale of our products. Revenue from the sale of products is recognized at the time title and the risks and rewards of ownership pass to the customer. This generally occurs when the products reach the shipping point, the sales price is fixed and determinable, and collection is reasonably assured. A reserve for estimated returns is established at the time of sale based on historical return experience and is recorded as a reduction of sales. Other allowances include customer quantity and price discrepancies. A reserve for other allowances is generally established at the time of sale based on historical experience and also is recorded as a reduction of sales.
Contract revenues for construction related projects, which are generated in the SubCom business which is reported in discontinued operations, are recorded primarily using the percentage-of-completion method. Profits recognized on contracts in process are based upon estimated contract revenue and related cost to complete. Percentage-of-completion is measured based on the ratio of actual costs incurred to total estimated costs. Revisions in cost estimates as contracts progress have the effect of increasing or decreasing profits in the current period. Provisions for anticipated losses are made in the period in which they first become determinable. In addition, provisions for credit losses related to unbilled receivables on construction related projects are recorded as reductions of revenue in the period in which they first become determinable.
See Notes 4 and 23 to the Consolidated Financial Statements for additional information regarding the SubCom business. See Note 2 to the Consolidated Financial Statements for information regarding our adoption of ASC 606, Revenue from Contracts with Customers , in fiscal 2019.
Goodwill and Other Intangible Assets
Intangible assets include both indeterminable-lived residual goodwill and determinable-lived identifiable intangible assets. Intangible assets with determinable lives primarily include intellectual property, consisting of patents, trademarks, and unpatented technology, and customer relationships. Recoverability estimates range from 1 to 50 years and costs are generally amortized on a straight-line basis. Evaluations of the remaining useful lives of determinable-lived intangible assets are performed on a periodic basis and when events and circumstances warrant.
We test for goodwill impairment at the reporting unit level. A reporting unit is generally an operating segment or one level below an operating segment (a "component") if the component constitutes a business for which discrete financial information is available and regularly reviewed by segment management. At fiscal year end 2018, we had five reporting units, all of which contained goodwill. There were two reporting units in both the Transportation Solutions and Industrial Solutions segments and one reporting unit in the Communications Solutions segment. When changes occur in the
40
composition of one or more reporting units, goodwill is reassigned to the reporting units affected based on their relative fair values. We review our reporting unit structure each year as part of our annual goodwill impairment test, or more frequently based on changes in our structure.
Goodwill impairment is evaluated by comparing the carrying value of each reporting unit to its fair value on the first day of the fourth fiscal quarter of each year or whenever we believe a triggering event requiring a more frequent assessment has occurred. In assessing the existence of a triggering event, management relies on a number of reporting unit-specific factors including operating results, business plans, economic projections, anticipated future cash flows, transactions, and market place data. There are inherent uncertainties related to these factors and management's judgment in applying these factors to the impairment analysis.
When testing for goodwill impairment, we perform a step I goodwill impairment test to identify potential impairment by comparing the fair value of a reporting unit with its carrying amount. If the carrying amount of a reporting unit exceeds its fair value, goodwill may be impaired and a step II goodwill impairment test is performed to measure the amount of impairment, if any. In the step II goodwill impairment test, we compare the implied fair value of reporting unit goodwill with the carrying amount of that goodwill. If the carrying amount of reporting unit goodwill exceeds the implied fair value of that goodwill, an impairment loss is recognized in an amount equal to the excess. The implied fair value of goodwill is determined in a manner consistent with how goodwill is recognized in a business combination. We allocate the fair value of a reporting unit to the assets and liabilities of that unit, including intangible assets, as if the reporting unit had been acquired in a business combination. Any excess of the fair value of a reporting unit over the amounts assigned to its assets and liabilities is the implied fair value of goodwill.
Fair value estimates used in the step I goodwill impairment tests are calculated using an income approach based on the present value of future cash flows of each reporting unit. The income approach has been supported by guideline analyses (a market approach). These approaches incorporate a number of assumptions including future growth rates, discount rates, income tax rates, and market activity in assessing fair value and are reporting unit specific. Changes in economic and operating conditions impacting these assumptions could result in goodwill impairments in future periods.
We completed our annual goodwill impairment test in the fourth quarter of fiscal 2018 and determined that no impairment existed.
In determining income for financial statement purposes, we must make certain estimates and judgments. These estimates and judgments affect the calculation of certain tax liabilities and the determination of the recoverability of certain deferred tax assets, which arise from temporary differences between the income tax return and financial statement recognition of revenue and expense.
In evaluating our ability to recover our deferred tax assets, we consider all available positive and negative evidence including our past operating results, the existence of cumulative losses in the most recent years, and our forecast of taxable income. In estimating future taxable income, we develop assumptions including the amount of pre-tax operating income in various tax jurisdictions, the reversal of temporary differences, and the implementation of feasible and prudent tax planning strategies. These assumptions require significant judgment about the forecasts of taxable income and are consistent with the plans and estimates we are using to manage the underlying businesses.
We currently have recorded significant valuation allowances that we intend to maintain until it is more likely than not the deferred tax assets will be realized. Our income tax expense recorded in the future will be reduced to the extent of decreases in our valuation allowances. The realization of our remaining deferred tax assets is dependent primarily on future taxable income in the appropriate
41
jurisdictions. Any reduction in future taxable income including any future restructuring activities may require that we record an additional valuation allowance against our deferred tax assets. An increase in the valuation allowance would result in additional income tax expense in such period and could have a significant impact on our future earnings.
Changes in tax laws and rates also could affect recorded deferred tax assets and liabilities in the future. Management is not aware of any such changes that would have a material effect on our results of operations, financial position, or cash flows.
In addition, the calculation of our tax liabilities includes estimates for uncertainties in the application of complex tax regulations across multiple global jurisdictions where we conduct our operations. Under the uncertain tax position provisions of ASC 740, Income Taxes , we recognize liabilities for tax and related interest for issues in tax jurisdictions based on our estimate of whether, and the extent to which, additional taxes and related interest will be due. These tax liabilities and related interest are reflected net of the impact of related tax loss carryforwards, as such tax loss carryforwards will be applied against these tax liabilities and will reduce the amount of cash tax payments due upon the eventual settlement with the tax authorities. These estimates may change due to changing facts and circumstances. Due to the complexity of these uncertainties, the ultimate resolution may result in a settlement that differs from our current estimate of the tax liabilities and related interest. These tax liabilities and related interest are recorded in income taxes and accrued and other current liabilities on the Consolidated Balance Sheets.
Our defined benefit pension plan expense and obligations are developed from actuarial assumptions. The funded status of our plans is recognized on the Consolidated Balance Sheets and is measured as the difference between the fair value of plan assets and the projected benefit obligation at the measurement date. The projected benefit obligation represents the actuarial present value of benefits projected to be paid upon retirement factoring in estimated future compensation levels. The fair value of plan assets represents the current market value of cumulative company and participant contributions made to irrevocable trust funds, held for the sole benefit of participants, which are invested by the trustee of the funds. The benefits under our defined benefit pension plans are based on various factors, such as years of service and compensation.
Net periodic pension benefit cost is based on the utilization of the projected unit credit method of calculation and is charged to earnings on a systematic basis over the expected average remaining service lives of current participants.
Two critical assumptions in determining pension expense and obligations are the discount rate and expected long-term return on plan assets. We evaluate these assumptions at least annually. Other assumptions reflect demographic factors such as retirement, mortality, and employee turnover. These assumptions are evaluated periodically and updated to reflect our actual experience. Actual results may differ from actuarial assumptions. The discount rate represents the market rate for high-quality fixed income investments and is used to calculate the present value of the expected future cash flows for benefit obligations to be paid under our pension plans. A decrease in the discount rate increases the present value of pension benefit obligations. At fiscal year end 2018, a 25 basis point decrease in the discount rate would have increased the present value of our pension obligations by $124 million; a 25 basis point increase would have decreased the present value of our pension obligations by $111 million. We consider the current and expected asset allocations of our pension plans, as well as historical and expected long-term rates of return on those types of plan assets, in determining the expected long-term rate of return on plan assets. A 50 basis point decrease or increase in the expected long-term return on plan assets would have increased or decreased, respectively, our fiscal 2018 pension expense by $12 million.
42
At fiscal year end 2018, the long-term target asset allocation in our U.S. plans' master trust is 10% return-seeking assets and 90% liability-hedging assets. Asset re-allocation to meet that target is occurring over a multi-year period based on the funded status. We expect to reach our target allocation when the funded status of the plans exceeds 105%. Based on the funded status of the plans as of fiscal year end 2018, our target asset allocation is 45% return-seeking and 55% liability-hedging.
See Note 2 to the Consolidated Financial Statements for information regarding recently issued and recently adopted accounting pronouncements.
We present organic net sales growth as we believe it is appropriate for investors to consider this adjusted financial measure in addition to results in accordance with GAAP. Organic net sales growth represents net sales growth (the most comparable GAAP financial measure) excluding the impact of foreign currency exchange rates, and acquisitions and divestitures that occurred in the preceding twelve months, if any. Organic net sales growth is a useful measure of our performance because it excludes items that are not completely under management's control, such as the impact of changes in foreign currency exchange rates, and items that do not reflect the underlying growth of the company, such as acquisition and divestiture activity.
Organic net sales growth provides useful information about our results and the trends of our business. Management uses organic net sales growth to monitor and evaluate performance. Also, management uses organic net sales growth together with GAAP financial measures in its decision-making processes related to the operations of our reportable segments and our overall company. It is also a significant component in our incentive compensation plans. We believe that investors benefit from having access to the same financial measures that management uses in evaluating operations. The tables presented in "Results of Operations" and "Segment Results" provide reconciliations of organic net sales growth to net sales growth calculated in accordance with GAAP.
Organic net sales growth is a non-GAAP financial measure and should not be considered a replacement for results in accordance with GAAP. This non-GAAP financial measure may not be comparable to similarly-titled measures reported by other companies. The primary limitation of this measure is that it excludes the financial impact of items that would otherwise either increase or decrease our reported results. This limitation is best addressed by using organic net sales growth in combination with net sales growth in order to better understand the amounts, character, and impact of any increase or decrease in reported amounts.
Certain statements in this Annual Report are "forward-looking statements" within the meaning of the U.S. Private Securities Litigation Reform Act of 1995. These statements are based on our management's beliefs and assumptions and on information currently available to our management. Forward-looking statements include, among others, the information concerning our possible or assumed future results of operations, business strategies, financing plans, competitive position, potential growth opportunities, potential operating performance improvements, acquisitions, divestitures, the effects of competition, and the effects of future legislation or regulations. Forward-looking statements include all statements that are not historical facts and can be identified by the use of forward-looking terminology such as the words "believe," "expect," "plan," "intend," "anticipate," "estimate," "predict," "potential," "continue," "may," "should," or the negative of these terms or similar expressions.
43
Forward-looking statements involve risks, uncertainties, and assumptions. Actual results may differ materially from those expressed in these forward-looking statements. Investors should not place undue reliance on any forward-looking statements. We do not have any intention or obligation to update forward-looking statements after we file this report except as required by law.
The following and other risks, which are described in greater detail in "Part I. Item 1A. Risk Factors," as well as other risks described in this Annual Report, could cause our results to differ materially from those expressed in forward-looking statements:
- •
-
conditions in the global or regional economies and global capital markets, and cyclical industry conditions;
- •
-
conditions affecting demand for products in the industries we serve, particularly the automotive industry;
- •
-
competition and pricing pressure;
- •
-
market acceptance of our new product introductions and product innovations and product life cycles;
- •
-
raw material availability, quality, and cost;
- •
-
fluctuations in foreign currency exchange rates;
- •
-
financial condition and consolidation of customers and vendors;
- •
-
reliance on third-party suppliers;
- •
-
risks associated with current and future acquisitions and divestitures;
- •
-
global risks of business interruptions such as natural disasters and political, economic, and military instability;
- •
-
risks associated with security breaches and other disruptions to our information technology infrastructure;
- •
-
risks related to compliance with current and future environmental and other laws and regulations;
- •
-
our ability to protect our intellectual property rights;
- •
-
risks of litigation;
- •
-
our ability to operate within the limitations imposed by our debt instruments;
- •
-
the possible effects on us of various non-U.S. and U.S. legislative proposals and other initiatives that, if adopted, could materially increase
our worldwide corporate effective tax rate and negatively impact our U.S. government contracts business;
- •
-
various risks associated with being a Swiss corporation;
- •
-
the impact of fluctuations in the market price of our shares; and
- •
- the impact of certain provisions of our articles of association on unsolicited takeover proposals.
There may be other risks and uncertainties that we are unable to predict at this time or that we currently do not expect to have a material adverse effect on our business.
44
In the normal course of business, our financial position is routinely subject to a variety of risks, including market risks associated with interest rate and foreign currency movements on outstanding debt and non-U.S. dollar denominated assets and liabilities and commodity price movements. We utilize established risk management policies and procedures in executing derivative financial instrument transactions to manage a portion of these risks.
We do not execute transactions or hold derivative financial instruments for trading or speculative purposes. Substantially all counterparties to derivative financial instruments are limited to major financial institutions with at least an A/A2 credit rating. There is no significant concentration of exposures with any one counterparty.
As part of managing the exposure to changes in foreign currency exchange rates, we utilize cross-currency swap contracts and foreign currency forward contracts, a portion of which are designated as cash flow hedges. The objective of these contracts is to minimize impacts to cash flows and profitability due to changes in foreign currency exchange rates on intercompany and other cash transactions. A 10% appreciation or depreciation of the underlying currency in our cross-currency swap contracts or foreign currency forward contracts from the fiscal year end 2018 market rates would have changed the unrealized value of our contracts by $101 million. A 10% appreciation or depreciation of the underlying currency in our cross-currency swap contracts or foreign currency forward contracts from the fiscal year end 2017 market rates would have changed the unrealized value of our contracts by $122 million. Such gains or losses on these contracts would generally be offset by the losses or gains on the revaluation or settlement of the underlying transactions.
Interest Rate and Investment Exposures
We issue debt, as needed, to fund our operations and capital requirements. Such borrowings can result in interest rate exposure. To manage the interest rate exposure, we use interest rate swap contracts to convert a portion of fixed-rate debt into variable-rate debt. We may use forward starting interest rate swap contracts to manage interest rate exposure in periods prior to the anticipated issuance of fixed-rate debt. We also utilize investment swap contracts to manage earnings exposure on certain nonqualified deferred compensation liabilities.
Based on our floating rate debt balances at fiscal year end 2018 and 2017, a 50 basis point increase in the levels of the U.S. dollar interest rates, with all other variables held constant, would have resulted in an immaterial increase in interest expense in both fiscal 2018 and 2017.
Our worldwide operations and product lines may expose us to risks from fluctuations in commodity prices. To limit the effects of fluctuations in the future market price paid and related volatility in cash flows, we utilize commodity swap contracts designated as cash flow hedges. We continually evaluate the commodity market with respect to our forecasted usage requirements over the next eighteen months and periodically enter into commodity swap contracts to hedge a portion of usage requirements over that period. At fiscal year end 2018, our commodity hedges, which related to expected purchases of gold, silver, and copper, were in a net loss position of $34 million and had a notional value of $401 million. At fiscal year end 2017, our commodity hedges, which related to expected purchases of gold, silver, and copper, were in a net gain position of $20 million and had a notional value of $314 million. A 10% appreciation or depreciation of the price of a troy ounce of gold, a troy ounce of silver, and a pound of copper, from the fiscal year end 2018 prices would have changed the unrealized value of our forward contracts by $37 million. A 10% appreciation or depreciation of the price of a
45
troy ounce of gold, a troy ounce of silver, and a pound of copper, from the fiscal year end 2017 prices would have changed the unrealized value of our forward contracts by $33 million.
See Note 13 to the Consolidated Financial Statements for additional information regarding financial instruments.
The following Consolidated Financial Statements and schedule specified by this Item, together with the reports thereon of Deloitte & Touche LLP, are presented following Item 15 and the signature pages of this report:
Financial Statements:
Reports of Independent Registered Public Accounting Firm
Consolidated Statements of Operations for the Fiscal Years Ended September 28, 2018, September 29, 2017, and September 30, 2016
Consolidated Statements of Comprehensive Income for the Fiscal Years Ended September 28, 2018, September 29, 2017, and September 30, 2016
Consolidated Balance Sheets as of September 28, 2018 and September 29, 2017
Consolidated Statements of Shareholders' Equity for the Fiscal Years Ended September 28, 2018, September 29, 2017, and September 30, 2016
Consolidated Statements of Cash Flows for the Fiscal Years Ended September 28, 2018, September 29, 2017, and September 30, 2016
Notes to Consolidated Financial Statements
Financial Statement Schedule:
Schedule II—Valuation and Qualifying Accounts
All other financial statements and schedules have been omitted since the information required to be submitted has been included on the Consolidated Financial Statements and related notes or because they are either not applicable or not required under the rules of Regulation S-X.
Evaluation of Disclosure Controls and Procedures
Our management, with the participation of our Chief Executive Officer and Chief Financial Officer, evaluated the effectiveness of our disclosure controls and procedures (as defined in Rule 13a-15(e) under the Exchange Act) as of September 28, 2018. Based on that evaluation, our Chief Executive Officer and Chief Financial Officer concluded that our disclosure controls and procedures were effective as of September 28, 2018.
Management's Report on Internal Control Over Financial Reporting
Our management is responsible for establishing and maintaining adequate internal control over financial reporting (as defined in Rule 13a-15(f) under the Exchange Act). Management, with the participation of our Chief Executive Officer and Chief Financial Officer, evaluated the effectiveness of our internal control over financial reporting based on the framework in Internal Control—Integrated Framework (2013) issued by the Committee of Sponsoring Organizations of the Treadway Commission. Based on this evaluation, management concluded our internal control over financial reporting was effective as of September 28, 2018.
46
Because of its inherent limitations, internal control over financial reporting may not prevent or detect misstatements. Also, projections of any evaluation of effectiveness to future periods are subject to the risk that controls may become inadequate because of changes in conditions, or that the degree of compliance with policies and procedures may deteriorate.
Deloitte & Touche LLP, an independent registered public accounting firm, has issued an attestation report on our internal control over financial reporting as of September 28, 2018, which is included in this Annual Report.
Changes in Internal Control Over Financial Reporting
During the quarter ended September 28, 2018, there were no changes in our internal control over financial reporting that have materially affected, or are reasonably likely to materially affect, our internal control over financial reporting.
47
Information concerning directors, executive officers, and corporate governance may be found under the captions "Agenda Item No. 1—Election of Directors," "Nominees for Election," "Corporate Governance," "The Board of Directors and Board Committees," and "Executive Officers" in our definitive proxy statement for our 2019 Annual General Meeting of Shareholders (the "2019 Proxy Statement"), which will be filed with the SEC within 120 days after the close of our fiscal year. Such information is incorporated herein by reference. The information in the 2019 Proxy Statement under the caption "Section 16(a) Beneficial Ownership Reporting Compliance" is incorporated herein by reference.
We have adopted a guide to ethical conduct, which applies to all employees, officers, and directors. Our Guide to Ethical Conduct meets the requirements of a "code of ethics" as defined by Item 406 of Regulation S-K and applies to our Chief Executive Officer, Chief Financial Officer, and Chief Accounting Officer, as well as all other employees and directors. Our Guide to Ethical Conduct also meets the requirements of a code of business conduct and ethics under the listing standards of the NYSE. Our Guide to Ethical Conduct is posted on our website at www.te.com under the heading "Corporate Responsibility—Governance and Environment—Guide to Ethical Conduct." We also will provide a copy of our Guide to Ethical Conduct to shareholders upon request. We intend to disclose any amendments to our Guide to Ethical Conduct, as well as any waivers for executive officers or directors, on our website.
Information concerning executive compensation may be found under the captions "Compensation Discussion and Analysis," "Management Development and Compensation Committee Report," "Compensation Committee Interlocks and Insider Participation," "Executive Officer Compensation," and "Compensation of Non-Employee Directors" in our 2019 Proxy Statement. Such information is incorporated herein by reference.
The information in our 2019 Proxy Statement under the caption "Security Ownership of Certain Beneficial Owners and Management" is incorporated herein by reference.
48
Equity Compensation Plan Information
The following table provides information as of fiscal year end 2018 with respect to common shares issuable under our equity compensation plans:
|
Plan Category
|
Number of securities
to be issued upon exercise of outstanding options, warrants and rights (a) |
Weighted-average
exercise price of outstanding options, warrants and rights (b) (3) |
Number of securities
remaining available for future issuance under equity compensation plans (excluding securities reflected in column (a)) (c) (4) |
|||||||
|---|---|---|---|---|---|---|---|---|---|---|
|
Equity compensation plans approved by security holders: |
||||||||||
|
2007 Stock and Incentive Plan, amended and restated as of March 8, 2017 (1) |
7,705,831 | $ | 65.20 | 19,087,257 | ||||||
|
Equity compensation plans not approved by security holders: |
||||||||||
|
Equity awards under the 2010 Stock and Incentive Plan, amended and restated as of March 9, 2017 (2) |
1,374,677 | 70.67 | 1,375,652 | |||||||
| | | | | | | | | | | |
|
Total |
9,080,508 | 20,462,909 | ||||||||
| | | | | | | | | | | |
| | | | | | | | | | | |
| | | | | | | | | | | |
- (1)
-
The
TE Connectivity Ltd. 2007 Stock and Incentive Plan, amended and restated as of March 8, 2017 (the "2017 Plan"), provides for the award of annual
performance bonuses and long-term performance awards, including share options; restricted, performance, and deferred share units; and other share-based awards (collectively, "Awards") to board
members, officers, and non-officer employees. The 2017 Plan provides for a maximum of 69,843,452 common shares to be issued as Awards, subject to adjustment as provided under the terms of the 2017
Plan.
- (2)
-
In
connection with the acquisition of ADC Telecommunications, Inc. ("ADC") in fiscal 2011, we assumed equity awards issued under plans sponsored by ADC and
the remaining pool of shares available for grant under the plans. Subsequent to the acquisition, we registered 6,764,455 shares related to the plans via Forms S-3 and S-8 and renamed the
primary ADC plan the TE Connectivity Ltd. 2010 Stock and Incentive Plan, amended and restated as of March 9, 2017 (the "2010 Plan"). Grants under the 2010 Plan are settled in TE
Connectivity common shares.
- (3)
-
Does
not take into account restricted, performance, or deferred share unit awards that do not have exercise prices.
- (4)
- The 2017 Plan and the 2010 Plan apply weightings of 1.80 and 1.21, respectively, to outstanding nonvested restricted, performance, and deferred share units. The remaining shares issuable under both the 2017 Plan and the 2010 Plan are increased by forfeitures and cancellations, among other factors.
The information in our 2019 Proxy Statement under the captions "Corporate Governance," "The Board of Directors and Board Committees," and "Certain Relationships and Related Transactions" is incorporated herein by reference.
The information in our 2019 Proxy Statement under the caption "Agenda Item No. 7—Election of Auditors—Agenda Item No. 7.1" is incorporated herein by reference.
49
- (a)
-
1. Financial
Statements. See Item 8.
- 2.
-
Financial
Statement Schedule. See Item 8.
- 3.
- Exhibit Index:
50
51
52
|
|
|
|
Incorporated by Reference Herein | |||||||||
|---|---|---|---|---|---|---|---|---|---|---|---|---|
|
Exhibit
Number |
|
|
||||||||||
|
|
Description | Form | Exhibit | Filing Date | ||||||||
| 10.10 | ‡ | Form of Restricted Stock Unit Award Terms and Conditions for RSU Grants Beginning in November 2017 | Annual Report on Form 10-K for the fiscal year ended September 29, 2017 | 10.10 | November 14, 2017 | |||||||
| 10.11 | ‡ | Form of Performance Stock Unit Award Terms and Conditions | Quarterly Report on Form 10-Q for the quarterly period ended December 28, 2012 | 10.1 | January 25, 2013 | |||||||
| 10.12 | ‡ | Form of Performance Stock Unit Award Terms and Conditions for Performance Cycles Starting in Fiscal Year 2016 and Fiscal Year 2017 | Annual Report on Form 10-K for the fiscal year ended September 30, 2016 | 10.11 | November 15, 2016 | |||||||
| 10.13 | ‡ | Form of Performance Stock Unit Award Terms and Conditions for Performance Cycles Starting in and After Fiscal Year 2018 | Annual Report on Form 10-K for the fiscal year ended September 29, 2017 | 10.13 | November 14, 2017 | |||||||
| 10.14 | ‡ | TE Connectivity Change in Control Severance Plan for Certain U.S. Executives (as amended and restated) | Annual Report on Form 10-K for the fiscal year ended September 25, 2015 | 10.10 | November 10, 2015 | |||||||
| 10.15 | ‡* | TE Connectivity Severance Plan for U.S. Executives (as amended and restated) | ||||||||||
| 10.16 | ‡ | Tyco Electronics Ltd. Deferred Compensation Plan for Directors | Annual Report on Form 10-K for the fiscal year ended September 28, 2007 | 10.16 | December 14, 2007 | |||||||
| 10.17 | ‡ | Tyco Electronics Corporation Supplemental Savings and Retirement Plan | Annual Report on Form 10-K for the fiscal year ended September 25, 2009 | 10.13 | November 18, 2009 | |||||||
| 10.18 | ‡ | TE Connectivity Ltd. Savings Related Share Plan (as amended and restated) | Current Report on Form 8-K | 10.1 | March 14, 2018 | |||||||
| 10.19 | Form of Indemnification Agreement | Annual Report on Form 10-K for the fiscal year ended September 30, 2016 | 10.17 | November 15, 2016 | ||||||||
| 10.20 | ‡ | TE Connectivity Ltd. 2010 Stock and Incentive Plan (amended and restated March 9, 2017) | Annual Report on Form 10-K for the fiscal year ended September 29, 2017 | 10.20 | November 14, 2017 | |||||||
| 10.21 | ‡ | Employment Agreement between Thomas J. Lynch and Tyco Electronics Corporation dated December 15, 2015 | Current Report on Form 8-K | 10.1 | December 16, 2015 | |||||||
|
|
||||||||||||
53
54
|
|
|
|
Incorporated by Reference Herein | |||||||||
|---|---|---|---|---|---|---|---|---|---|---|---|---|
|
Exhibit
Number |
|
|
||||||||||
|
|
Description | Form | Exhibit | Filing Date | ||||||||
| 101 | * | Financial statements from the Annual Report on Form 10-K of TE Connectivity Ltd. for the fiscal year ended September 28, 2018, filed on November 13, 2018, formatted in XBRL: (i) the Consolidated Statements of Operations, (ii) the Consolidated Statements of Comprehensive Income, (iii) the Consolidated Balance Sheets, (iv) the Consolidated Statements of Shareholders' Equity, (v) the Consolidated Statements of Cash Flows, and (vi) the Notes to Consolidated Financial Statements | ||||||||||
- †
-
The
schedules to the Share Purchase Agreement and Stock Purchase Agreement have been omitted from this filing pursuant to Item 601(b)(2) of
Regulation S-K. We will furnish copies of such schedules to the SEC upon its request; provided, however, that we may request confidential treatment pursuant to Rule 24b-2 of the Exchange
Act for any schedule so furnished.
- ‡
-
Management
contract or compensatory plan or arrangement
- *
-
Filed
herewith
- **
- Furnished herewith
55
Pursuant to the requirements of Section 13 or 15(d) of the Securities Exchange Act of 1934, the registrant has duly caused this report to be signed on its behalf by the undersigned, thereunto duly authorized.
|
|
TE CONNECTIVITY LTD. | |||
|
|
By: |
/s/ HEATH A. MITTS
|
||
Date: November 13, 2018
Pursuant to the requirements of the Securities Exchange Act of 1934, this report has been signed below by the following persons on behalf of the registrant and in the capacities and on the dates indicated.
|
Signature
|
Title
|
Date
|
||
|---|---|---|---|---|
|
|
|
|
|
|
|
/s/ TERRENCE R. CURTIN
Terrence R. Curtin |
Chief Executive Officer and Director
(Principal Executive Officer) |
November 13, 2018 | ||
|
/s/ HEATH A. MITTS Heath A. Mitts |
|
Executive Vice President and Chief Financial Officer (Principal Financial Officer) |
|
November 13, 2018 |
|
/s/ ROBERT J. OTT Robert J. Ott |
|
Senior Vice President and Corporate Controller (Principal Accounting Officer) |
|
November 13, 2018 |
|
* Pierre R. Brondeau |
|
Director |
|
November 13, 2018 |
|
* Carol A. Davidson |
|
Director |
|
November 13, 2018 |
|
* William A. Jeffrey |
|
Director |
|
November 13, 2018 |
56
|
Signature
|
Title
|
Date
|
||
|---|---|---|---|---|
|
|
|
|
|
|
|
*
Thomas J. Lynch |
Director | November 13, 2018 | ||
|
* Yong Nam |
|
Director |
|
November 13, 2018 |
|
* Daniel J. Phelan |
|
Director |
|
November 13, 2018 |
|
* Paula A. Sneed |
|
Director |
|
November 13, 2018 |
|
* Abhijit Y. Talwalkar |
|
Director |
|
November 13, 2018 |
|
* Mark C. Trudeau |
|
Director |
|
November 13, 2018 |
|
* John C. Van Scoter |
|
Director |
|
November 13, 2018 |
|
* Laura H. Wright |
|
Director |
|
November 13, 2018 |
- *
- John S. Jenkins, Jr., by signing his name hereto, does sign this document on behalf of the above noted individuals, pursuant to powers of attorney duly executed by such individuals, which have been filed as Exhibit 24.1 to this Report.
|
|
By: |
/s/ JOHN S. JENKINS, JR.
John S. Jenkins, Jr. Attorney-in-fact |
57
TE CONNECTIVITY LTD.
INDEX TO CONSOLIDATED FINANCIAL STATEMENTS
58
REPORT OF INDEPENDENT REGISTERED PUBLIC ACCOUNTING FIRM
To the Shareholders and the Board of Directors of TE Connectivity Ltd.:
Opinion on the Financial Statements
We have audited the accompanying consolidated balance sheets of TE Connectivity Ltd. and subsidiaries (the "Company") as of September 28, 2018 and September 29, 2017, the related consolidated statements of operations, comprehensive income, shareholders' equity, and cash flows, for each of the three fiscal years in the period ended September 28, 2018, and the related notes and schedule listed in the Index at Item 15 (collectively referred to as the "financial statements"). In our opinion, the financial statements present fairly, in all material respects, the financial position of the Company as of September 28, 2018 and September 29, 2017, and the results of its operations and its cash flows for each of the three fiscal years in the period ended September 28, 2018, in conformity with accounting principles generally accepted in the United States of America.
We have also audited, in accordance with the standards of the Public Company Accounting Oversight Board (United States) (PCAOB), the Company's internal control over financial reporting as of September 28, 2018, based on the criteria established in Internal Control—Integrated Framework (2013) issued by the Committee of Sponsoring Organizations of the Treadway Commission and our report dated November 13, 2018 expressed an unqualified opinion on the Company's internal control over financial reporting.
These financial statements are the responsibility of the Company's management. Our responsibility is to express an opinion on the Company's financial statements based on our audits. We are a public accounting firm registered with the PCAOB and are required to be independent with respect to the Company in accordance with the U.S. federal securities laws and the applicable rules and regulations of the Securities and Exchange Commission and the PCAOB.
We conducted our audits in accordance with the standards of the PCAOB. Those standards require that we plan and perform the audit to obtain reasonable assurance about whether the financial statements are free of material misstatement, whether due to error or fraud. Our audits included performing procedures to assess the risks of material misstatement of the financial statements, whether due to error or fraud, and performing procedures that respond to those risks. Such procedures included examining, on a test basis, evidence regarding the amounts and disclosures in the financial statements. Our audits also included evaluating the accounting principles used and significant estimates made by management, as well as evaluating the overall presentation of the financial statements. We believe that our audits provide a reasonable basis for our opinion.
/s/ Deloitte & Touche LLP
Philadelphia,
Pennsylvania
November 13, 2018
We have served as the Company's auditor since 2007.
59
REPORT OF INDEPENDENT REGISTERED PUBLIC ACCOUNTING FIRM
To the Shareholders and the Board of Directors of TE Connectivity Ltd.:
Opinion on Internal Control over Financial Reporting
We have audited the internal control over financial reporting of TE Connectivity Ltd. and subsidiaries (the "Company") as of September 28, 2018, based on criteria established in Internal Control—Integrated Framework (2013) issued by the Committee of Sponsoring Organizations of the Treadway Commission (COSO). In our opinion, the Company maintained, in all material respects, effective internal control over financial reporting as of September 28, 2018, based on criteria established in Internal Control—Integrated Framework (2013) issued by COSO.
We have also audited, in accordance with the standards of the Public Company Accounting Oversight Board (United States) (PCAOB), the financial statements as of and for the fiscal year ended September 28, 2018 of the Company and our report dated November 13, 2018 expressed an unqualified opinion on those financial statements.
The Company's management is responsible for maintaining effective internal control over financial reporting and for its assessment of the effectiveness of internal control over financial reporting, included in the accompanying Management's Report on Internal Control Over Financial Reporting. Our responsibility is to express an opinion on the Company's internal control over financial reporting based on our audit. We are a public accounting firm registered with the PCAOB and are required to be independent with respect to the Company in accordance with the U.S. federal securities laws and the applicable rules and regulations of the Securities and Exchange Commission and the PCAOB.
We conducted our audit in accordance with the standards of the PCAOB. Those standards require that we plan and perform the audit to obtain reasonable assurance about whether effective internal control over financial reporting was maintained in all material respects. Our audit included obtaining an understanding of internal control over financial reporting, assessing the risk that a material weakness exists, testing and evaluating the design and operating effectiveness of internal control based on the assessed risk, and performing such other procedures as we considered necessary in the circumstances. We believe that our audit provides a reasonable basis for our opinion.
Definition and Limitations of Internal Control over Financial Reporting
A company's internal control over financial reporting is a process designed to provide reasonable assurance regarding the reliability of financial reporting and the preparation of financial statements for external purposes in accordance with generally accepted accounting principles. A company's internal control over financial reporting includes those policies and procedures that (1) pertain to the maintenance of records that, in reasonable detail, accurately and fairly reflect the transactions and dispositions of the assets of the company; (2) provide reasonable assurance that transactions are recorded as necessary to permit preparation of financial statements in accordance with generally accepted accounting principles, and that receipts and expenditures of the company are being made only in accordance with authorizations of management and directors of the company; and (3) provide reasonable assurance regarding prevention or timely detection of unauthorized acquisition, use, or disposition of the company's assets that could have a material effect on the financial statements.
Because of its inherent limitations, internal control over financial reporting may not prevent or detect misstatements. Also, projections of any evaluation of effectiveness to future periods are subject to the risk that controls may become inadequate because of changes in conditions, or that the degree of compliance with the policies or procedures may deteriorate.
/s/ Deloitte & Touche LLP
Philadelphia,
Pennsylvania
November 13, 2018
60
TE CONNECTIVITY LTD.
CONSOLIDATED STATEMENTS OF OPERATIONS
Fiscal Years Ended September 28, 2018, September 29, 2017, and
September 30, 2016
|
|
Fiscal | |||||||||
|---|---|---|---|---|---|---|---|---|---|---|
|
|
2018 | 2017 | 2016 | |||||||
|
|
(in millions, except per share data)
|
|||||||||
|
Net sales |
$ | 13,988 | $ | 12,185 | $ | 11,352 | ||||
|
Cost of sales |
9,243 | 8,002 | 7,525 | |||||||
| | | | | | | | | | | |
|
Gross margin |
4,745 | 4,183 | 3,827 | |||||||
|
Selling, general, and administrative expenses |
1,594 | 1,543 | 1,396 | |||||||
|
Research, development, and engineering expenses |
680 | 611 | 603 | |||||||
|
Acquisition and integration costs |
14 | 6 | 22 | |||||||
|
Restructuring and other charges (credits), net |
126 | 147 | (2 | ) | ||||||
| | | | | | | | | | | |
|
Operating income |
2,331 | 1,876 | 1,808 | |||||||
|
Interest income |
15 | 16 | 17 | |||||||
|
Interest expense |
(107 | ) | (130 | ) | (127 | ) | ||||
|
Other income (expense), net |
1 | (42 | ) | (677 | ) | |||||
| | | | | | | | | | | |
|
Income from continuing operations before income taxes |
2,240 | 1,720 | 1,021 | |||||||
|
Income tax (expense) benefit |
344 | (180 | ) | 826 | ||||||
| | | | | | | | | | | |
|
Income from continuing operations |
2,584 | 1,540 | 1,847 | |||||||
|
Income (loss) from discontinued operations, net of income taxes |
(19 | ) | 143 | 162 | ||||||
| | | | | | | | | | | |
|
Net income |
$ | 2,565 | $ | 1,683 | $ | 2,009 | ||||
| | | | | | | | | | | |
| | | | | | | | | | | |
| | | | | | | | | | | |
|
Basic earnings per share: |
||||||||||
|
Income from continuing operations |
$ | 7.38 | $ | 4.34 | $ | 5.05 | ||||
|
Income (loss) from discontinued operations |
(0.05 | ) | 0.40 | 0.44 | ||||||
|
Net income |
7.33 | 4.74 | 5.49 | |||||||
|
Diluted earnings per share: |
|
|
|
|||||||
|
Income from continuing operations |
$ | 7.32 | $ | 4.30 | $ | 5.01 | ||||
|
Income (loss) from discontinued operations |
(0.05 | ) | 0.40 | 0.44 | ||||||
|
Net income |
7.27 | 4.70 | 5.44 | |||||||
|
Weighted-average number of shares outstanding: |
|
|
|
|||||||
|
Basic |
350 | 355 | 366 | |||||||
|
Diluted |
353 | 358 | 369 | |||||||
See Notes to Consolidated Financial Statements.
61
TE CONNECTIVITY LTD.
CONSOLIDATED STATEMENTS OF COMPREHENSIVE INCOME
Fiscal Years Ended September 28, 2018, September 29, 2017, and
September 30, 2016
|
|
Fiscal | |||||||||
|---|---|---|---|---|---|---|---|---|---|---|
|
|
2018 | 2017 | 2016 | |||||||
|
|
(in millions)
|
|||||||||
|
Net income |
$ | 2,565 | $ | 1,683 | $ | 2,009 | ||||
|
Other comprehensive income (loss): |
||||||||||
|
Currency translation |
(117 | ) | 37 | (92 | ) | |||||
|
Adjustments to unrecognized pension and postretirement benefit costs, net of income taxes |
83 | 330 | (88 | ) | ||||||
|
Gains (losses) on cash flow hedges, net of income taxes |
(74 | ) | 15 | 11 | ||||||
| | | | | | | | | | | |
|
Other comprehensive income (loss) |
(108 | ) | 382 | (169 | ) | |||||
| | | | | | | | | | | |
|
Comprehensive income . |
$ | 2,457 | $ | 2,065 | $ | 1,840 | ||||
| | | | | | | | | | | |
| | | | | | | | | | | |
| | | | | | | | | | | |
See Notes to Consolidated Financial Statements.
62
TE CONNECTIVITY LTD.
CONSOLIDATED BALANCE SHEETS
As of September 28, 2018 and September 29, 2017
|
|
Fiscal Year End | ||||||
|---|---|---|---|---|---|---|---|
|
|
2018 | 2017 | |||||
|
|
(in millions, except
share data) |
||||||
|
Assets |
|||||||
|
Current assets: |
|||||||
|
Cash and cash equivalents |
$ | 848 | $ | 1,218 | |||
|
Accounts receivable, net of allowance for doubtful accounts of $22 and $18, respectively |
2,361 | 2,138 | |||||
|
Inventories |
1,857 | 1,647 | |||||
|
Prepaid expenses and other current assets |
661 | 578 | |||||
|
Current assets held for sale |
472 | 345 | |||||
| | | | | | | | |
|
Total current assets |
6,199 | 5,926 | |||||
|
Property, plant, and equipment, net |
3,497 | 3,159 | |||||
|
Goodwill |
5,684 | 5,651 | |||||
|
Intangible assets, net |
1,704 | 1,841 | |||||
|
Deferred income taxes |
2,144 | 2,141 | |||||
|
Noncurrent assets held for sale |
— | 257 | |||||
|
Other assets |
1,158 | 428 | |||||
| | | | | | | | |
|
Total Assets |
$ | 20,386 | $ | 19,403 | |||
| | | | | | | | |
| | | | | | | | |
| | | | | | | | |
|
Liabilities and Shareholders' Equity |
|||||||
|
Current liabilities: |
|||||||
|
Short-term debt |
$ | 963 | $ | 710 | |||
|
Accounts payable |
1,548 | 1,387 | |||||
|
Accrued and other current liabilities |
1,711 | 1,613 | |||||
|
Current liabilities held for sale |
188 | 137 | |||||
| | | | | | | | |
|
Total current liabilities |
4,410 | 3,847 | |||||
|
Long-term debt |
3,037 | 3,634 | |||||
|
Long-term pension and postretirement liabilities |
1,102 | 1,158 | |||||
|
Deferred income taxes |
207 | 236 | |||||
|
Income taxes |
312 | 293 | |||||
|
Noncurrent liabilities held for sale |
— | 43 | |||||
|
Other liabilities |
487 | 441 | |||||
| | | | | | | | |
|
Total Liabilities |
9,555 | 9,652 | |||||
| | | | | | | | |
|
Commitments and contingencies (Note 12) |
|||||||
|
Shareholders' equity: |
|||||||
|
Common shares, CHF 0.57 par value, 357,069,981 shares authorized and issued |
157 | 157 | |||||
|
Accumulated earnings |
12,114 | 10,175 | |||||
|
Treasury shares, at cost, 12,279,603 and 5,356,369 shares, respectively |
(1,134 | ) | (421 | ) | |||
|
Accumulated other comprehensive loss |
(306 | ) | (160 | ) | |||
| | | | | | | | |
|
Total Shareholders' Equity |
10,831 | 9,751 | |||||
| | | | | | | | |
|
Total Liabilities and Shareholders' Equity |
$ | 20,386 | $ | 19,403 | |||
| | | | | | | | |
| | | | | | | | |
| | | | | | | | |
See Notes to Consolidated Financial Statements.
63
TE CONNECTIVITY LTD.
CONSOLIDATED STATEMENTS OF SHAREHOLDERS' EQUITY
Fiscal Years Ended September 28, 2018, September 29, 2017, and
September 30, 2016
|
|
Common
Shares |
Treasury
Shares |
|
|
|
|
|||||||||||||||||||
|---|---|---|---|---|---|---|---|---|---|---|---|---|---|---|---|---|---|---|---|---|---|---|---|---|---|
|
|
|
|
Accumulated
Other Comprehensive Loss |
|
|||||||||||||||||||||
|
|
Contributed
Surplus |
Accumulated
Earnings |
Total
Shareholders' Equity |
||||||||||||||||||||||
|
|
Shares | Amount | Shares | Amount | |||||||||||||||||||||
|
|
(in millions)
|
||||||||||||||||||||||||
|
Balance at September 25, 2015 |
414 | $ | 182 | (20 | ) | $ | (1,256 | ) | $ | 4,359 | $ | 6,673 | $ | (373 | ) | $ | 9,585 | ||||||||
|
Net income |
— | — | — | — | — | 2,009 | — | 2,009 | |||||||||||||||||
|
Other comprehensive loss |
— | — | — | — | — | — | (169 | ) | (169 | ) | |||||||||||||||
|
Share-based compensation expense |
— | — | — | — | 91 | — | — | 91 | |||||||||||||||||
|
Dividends approved |
— | — | — | — | (512 | ) | — | — | (512 | ) | |||||||||||||||
|
Exercise of share options |
— | — | 2 | 90 | — | — | — | 90 | |||||||||||||||||
|
Restricted share award vestings and other activity |
— | — | 2 | 146 | (145 | ) | — | — | 1 | ||||||||||||||||
|
Repurchase of common shares |
— | — | (43 | ) | (2,610 | ) | — | — | — | (2,610 | ) | ||||||||||||||
|
Cancellation of treasury shares |
(31 | ) | (14 | ) | 31 | 2,006 | (1,992 | ) | — | — | — | ||||||||||||||
| | | | | | | | | | | | | | | | | | | | | | | | | | |
|
Balance at September 30, 2016 |
383 | $ | 168 | (28 | ) | $ | (1,624 | ) | $ | 1,801 | $ | 8,682 | $ | (542 | ) | $ | 8,485 | ||||||||
| | | | | | | | | | | | | | | | | | | | | | | | | | |
|
Adoption of ASU No. 2016-09 |
— | — | — | — | — | 165 | — | 165 | |||||||||||||||||
|
Net income |
— | — | — | — | — | 1,683 | — | 1,683 | |||||||||||||||||
|
Other comprehensive income |
— | — | — | — | — | — | 382 | 382 | |||||||||||||||||
|
Share-based compensation expense |
— | — | — | — | 99 | — | — | 99 | |||||||||||||||||
|
Dividends approved |
— | — | — | — | (564 | ) | — | — | (564 | ) | |||||||||||||||
|
Exercise of share options |
— | — | 3 | 117 | — | — | — | 117 | |||||||||||||||||
|
Restricted share award vestings and other activity |
— | — | 2 | 195 | (184 | ) | (6 | ) | — | 5 | |||||||||||||||
|
Repurchase of common shares |
— | — | (8 | ) | (621 | ) | — | — | — | (621 | ) | ||||||||||||||
|
Cancellation of treasury shares |
(26 | ) | (11 | ) | 26 | 1,512 | (1,152 | ) | (349 | ) | — | — | |||||||||||||
| | | | | | | | | | | | | | | | | | | | | | | | | | |
|
Balance at September 29, 2017 |
357 | $ | 157 | (5 | ) | $ | (421 | ) | $ | — | $ | 10,175 | $ | (160 | ) | $ | 9,751 | ||||||||
| | | | | | | | | | | | | | | | | | | | | | | | | | |
|
Adoption of ASU No. 2018-02 |
— | — | — | — | — | 38 | (38 | ) | — | ||||||||||||||||
|
Net income |
— | — | — | — | — | 2,565 | — | 2,565 | |||||||||||||||||
|
Other comprehensive loss |
— | — | — | — | — | — | (108 | ) | (108 | ) | |||||||||||||||
|
Share-based compensation expense |
— | — | — | — | 98 | — | — | 98 | |||||||||||||||||
|
Dividends approved |
— | — | — | — | — | (610 | ) | — | (610 | ) | |||||||||||||||
|
Exercise of share options |
— | — | 1 | 100 | — | — | — | 100 | |||||||||||||||||
|
Restricted share award vestings and other activity |
— | — | 2 | 153 | (98 | ) | (54 | ) | — | 1 | |||||||||||||||
|
Repurchase of common shares |
— | — | (10 | ) | (966 | ) | — | — | — | (966 | ) | ||||||||||||||
| | | | | | | | | | | | | | | | | | | | | | | | | | |
|
Balance at September 28, 2018 |
357 | $ | 157 | (12 | ) | $ | (1,134 | ) | $ | — | $ | 12,114 | $ | (306 | ) | $ | 10,831 | ||||||||
| | | | | | | | | | | | | | | | | | | | | | | | | | |
| | | | | | | | | | | | | | | | | | | | | | | | | | |
| | | | | | | | | | | | | | | | | | | | | | | | | | |
See Notes to Consolidated Financial Statements.
64
TE CONNECTIVITY LTD.
CONSOLIDATED STATEMENTS OF CASH FLOWS
Fiscal Years Ended September 28, 2018, September 29, 2017, and
September 30, 2016
|
|
Fiscal | |||||||||
|---|---|---|---|---|---|---|---|---|---|---|
|
|
2018 | 2017 | 2016 | |||||||
|
|
(in millions)
|
|||||||||
|
Cash Flows From Operating Activities: |
||||||||||
|
Net income |
$ | 2,565 | $ | 1,683 | $ | 2,009 | ||||
|
(Income) loss from discontinued operations, net of income taxes |
19 | (143 | ) | (162 | ) | |||||
| | | | | | | | | | | |
|
Income from continuing operations |
2,584 | 1,540 | 1,847 | |||||||
|
Adjustments to reconcile income from continuing operations to net cash provided by operating activities: |
||||||||||
|
Depreciation and amortization |
667 | 611 | 560 | |||||||
|
Deferred income taxes |
(791 | ) | (142 | ) | 136 | |||||
|
Provision for losses on accounts receivable and inventories |
30 | 20 | 13 | |||||||
|
Tax sharing expense |
— | 8 | 632 | |||||||
|
Share-based compensation expense |
95 | 95 | 87 | |||||||
|
Gain on divestiture |
(2 | ) | — | (144 | ) | |||||
|
Other |
7 | 17 | 99 | |||||||
|
Changes in assets and liabilities, net of the effects of acquisitions and divestitures: |
||||||||||
|
Accounts receivable, net |
(269 | ) | (204 | ) | 95 | |||||
|
Inventories |
(247 | ) | (270 | ) | 154 | |||||
|
Prepaid expenses and other current assets |
(63 | ) | (62 | ) | 281 | |||||
|
Accounts payable |
201 | 314 | (87 | ) | ||||||
|
Accrued and other current liabilities |
5 | 224 | (4 | ) | ||||||
|
Income taxes |
54 | (1 | ) | (1,769 | ) | |||||
|
Other |
30 | 123 | 33 | |||||||
| | | | | | | | | | | |
|
Net cash provided by continuing operating activities |
2,301 | 2,273 | 1,933 | |||||||
|
Net cash provided by discontinued operating activities |
150 | 48 | 14 | |||||||
| | | | | | | | | | | |
|
Net cash provided by operating activities |
2,451 | 2,321 | 1,947 | |||||||
| | | | | | | | | | | |
|
Cash Flows From Investing Activities: |
||||||||||
|
Capital expenditures |
(935 | ) | (679 | ) | (603 | ) | ||||
|
Proceeds from sale of property, plant, and equipment |
23 | 19 | 8 | |||||||
|
Acquisition of businesses, net of cash acquired |
(153 | ) | (250 | ) | (1,336 | ) | ||||
|
Proceeds from divestiture of business, net of cash retained by sold business |
— | 4 | 333 | |||||||
|
Other |
(8 | ) | (3 | ) | 42 | |||||
| | | | | | | | | | | |
|
Net cash used in continuing investing activities |
(1,073 | ) | (909 | ) | (1,556 | ) | ||||
|
Net cash used in discontinued investing activities |
(21 | ) | (23 | ) | (25 | ) | ||||
| | | | | | | | | | | |
|
Net cash used in investing activities |
(1,094 | ) | (932 | ) | (1,581 | ) | ||||
| | | | | | | | | | | |
|
Cash Flows From Financing Activities: |
||||||||||
|
Net increase (decrease) in commercial paper |
270 | (330 | ) | 330 | ||||||
|
Proceeds from issuance of debt |
119 | 589 | 352 | |||||||
|
Repayment of debt |
(708 | ) | — | (501 | ) | |||||
|
Proceeds from exercise of share options |
100 | 117 | 90 | |||||||
|
Repurchase of common shares |
(879 | ) | (614 | ) | (2,787 | ) | ||||
|
Payment of common share dividends to shareholders |
(588 | ) | (546 | ) | (509 | ) | ||||
|
Transfers (to) from discontinued operations |
129 | 25 | (11 | ) | ||||||
|
Other |
(36 | ) | (30 | ) | (30 | ) | ||||
| | | | | | | | | | | |
|
Net cash used in continuing financing activities |
(1,593 | ) | (789 | ) | (3,066 | ) | ||||
|
Net cash provided by (used in) discontinued financing activities |
(129 | ) | (25 | ) | 11 | |||||
| | | | | | | | | | | |
|
Net cash used in financing activities |
(1,722 | ) | (814 | ) | (3,055 | ) | ||||
| | | | | | | | | | | |
|
Effect of currency translation on cash |
(5 | ) | (4 | ) | 7 | |||||
|
Net increase (decrease) in cash and cash equivalents |
(370 | ) | 571 | (2,682 | ) | |||||
|
Cash and cash equivalents at beginning of fiscal year |
1,218 | 647 | 3,329 | |||||||
| | | | | | | | | | | |
|
Cash and cash equivalents at end of fiscal year |
$ | 848 | $ | 1,218 | $ | 647 | ||||
| | | | | | | | | | | |
| | | | | | | | | | | |
| | | | | | | | | | | |
|
Supplemental Cash Flow Information: |
||||||||||
|
Interest paid |
$ | 127 | $ | 128 | $ | 117 | ||||
|
Income taxes paid, net of refunds |
393 | 323 | 806 | |||||||
See Notes to Consolidated Financial Statements.
65
TE CONNECTIVITY LTD.
NOTES TO CONSOLIDATED FINANCIAL STATEMENTS
1. Basis of Presentation
The Consolidated Financial Statements reflect the consolidated operations of TE Connectivity Ltd. and its subsidiaries and have been prepared in United States ("U.S.") dollars in accordance with accounting principles generally accepted in the U.S. ("GAAP").
Description of the Business
TE Connectivity Ltd. ("TE Connectivity" or the "Company," which may be referred to as "we," "us," or "our") is a global technology and manufacturing leader creating a safer, sustainable, productive, and connected future. For more than 75 years, our connectivity and sensor solutions, proven in the harshest environments, have enabled advancements in transportation, industrial applications, medical technology, energy, data communications, and the home.
We operate through three reportable segments:
- •
-
Transportation Solutions.
The Transportation Solutions segment is a leader
in connectivity and sensor technologies. Our products, which must withstand harsh conditions, are used in the automotive, commercial transportation, and sensors markets.
- •
-
Industrial Solutions.
The Industrial Solutions segment is a leading
supplier of products that connect and distribute power, data, and signals. Our products are used in the industrial equipment; aerospace, defense, oil, and gas; and energy markets.
- •
- Communications Solutions. The Communications Solutions segment is a leading supplier of electronic components for the data and devices and the appliances markets.
Use of Estimates
The preparation of the Consolidated Financial Statements in conformity with GAAP requires management to make estimates and assumptions that affect the reported amounts of assets and liabilities, the disclosure of contingent assets and liabilities, and the reported amounts of revenues and expenses. Significant estimates in these Consolidated Financial Statements include restructuring and other charges, assets acquired and liabilities assumed in acquisitions, allowances for doubtful accounts receivable, estimates of future cash flows and discount rates associated with asset impairments, useful lives for depreciation and amortization, loss contingencies, net realizable value of inventories, estimated contract revenue and related costs, legal contingencies, tax reserves and deferred tax asset valuation allowances, and the determination of discount and other rate assumptions for pension benefit cost. Actual results could differ materially from these estimates.
Fiscal Year
We have a 52- or 53-week fiscal year that ends on the last Friday of September. For fiscal years in which there are 53 weeks, the fourth quarter reporting period includes 14 weeks. Fiscal 2018, 2017, and 2016 ended on September 28, 2018, September 29, 2017, and September 30, 2016, respectively. Fiscal 2018 and 2017 were 52 weeks in length. Fiscal 2016 was a 53-week year.
66
TE CONNECTIVITY LTD.
NOTES TO CONSOLIDATED FINANCIAL STATEMENTS (Continued)
2. Summary of Significant Accounting Policies
Principles of Consolidation
We consolidate entities in which we own or control more than 50% of the voting shares or otherwise have the ability to control through similar rights. All intercompany transactions have been eliminated. The results of companies acquired or disposed of are included on the Consolidated Financial Statements from the effective date of acquisition or up to the date of disposal.
Revenue Recognition
Our revenues are generated principally from the sale of our products. Revenue from the sale of products is recognized at the time title and the risks and rewards of ownership pass to the customer. This generally occurs when the products reach the shipping point, the sales price is fixed and determinable, and collection is reasonably assured.
We generally warrant that our products will conform to our, or mutually agreed to, specifications and that our products will be free from material defects in materials and workmanship for a limited time. We limit our warranty to the replacement or repair of defective parts, or a refund or credit of the price of the defective product. We accept returned goods only when the customer makes a verified claim and we have authorized the return. Generally, a reserve for estimated returns is established at the time of sale based on historical return experience and is recorded as a reduction of sales.
We provide certain distributors with an inventory allowance for returns or scrap equal to a percentage of qualified purchases. A reserve for estimated returns and scrap allowances is established at the time of the sale based on an agreed-upon, fixed percentage of sales to distributors and is recorded as a reduction of sales.
Other allowances include customer quantity and price discrepancies. A reserve for other allowances is generally established at the time of sale based on historical experience and is recorded as a reduction of sales. We believe we can reasonably and reliably estimate the amounts of future allowances.
See "Recently Issued Accounting Pronouncements" below for information regarding our adoption of Accounting Standards Codification ("ASC") 606, Revenue from Contracts with Customers , in fiscal 2019.
Inventories
Inventories are recorded at the lower of cost or net realizable value using the first-in, first-out cost method.
Property, Plant, and Equipment, Net
Property, plant, and equipment is recorded at cost less accumulated depreciation. Maintenance and repair expenditures are charged to expense when incurred. Depreciation is calculated using the straight-line method over the estimated useful lives of the assets, which are 10 to 20 years for land improvements, 5 to 40 years for buildings and improvements, and 1 to 15 years for machinery and equipment.
We periodically evaluate, when events and circumstances warrant, the net realizable value of property, plant, and equipment and other long-lived assets, relying on a number of factors including
67
TE CONNECTIVITY LTD.
NOTES TO CONSOLIDATED FINANCIAL STATEMENTS (Continued)
2. Summary of Significant Accounting Policies (Continued)
operating results, business plans, economic projections, and anticipated future cash flows. When indicators of potential impairment are present, the carrying values of the asset group are evaluated in relation to the operating performance and estimated future undiscounted cash flows of the underlying asset group. Impairment of the carrying value is recognized whenever anticipated future undiscounted cash flow estimates are less than the carrying value of the asset. Fair value estimates are based on assumptions concerning the amount and timing of estimated future cash flows and discount rates, reflecting varying degrees of perceived risk.
Goodwill and Other Intangible Assets
Intangible assets include both indeterminable-lived residual goodwill and determinable-lived identifiable intangible assets. Intangible assets with determinable lives primarily include intellectual property, consisting of patents, trademarks, and unpatented technology, and customer relationships. Recoverability estimates range from 1 to 50 years and costs are generally amortized on a straight-line basis. Evaluations of the remaining useful lives of determinable-lived intangible assets are performed on a periodic basis and when events and circumstances warrant.
At fiscal year end 2018, we had five reporting units, all of which contained goodwill. There were two reporting units in both the Transportation Solutions and Industrial Solutions segments and one reporting unit in the Communications Solutions segment. When changes occur in the composition of one or more reporting units, goodwill is reassigned to the reporting units affected based on their relative fair values.
Goodwill impairment is evaluated by comparing the carrying value of each reporting unit to its fair value on the first day of the fourth fiscal quarter of each year or whenever we believe a triggering event requiring a more frequent assessment has occurred. In assessing the existence of a triggering event, management relies on a number of reporting unit-specific factors including operating results, business plans, economic projections, anticipated future cash flows, transactions, and market place data. There are inherent uncertainties related to these factors and management's judgment in applying these factors to the impairment analysis.
When testing for goodwill impairment, we perform a step I goodwill impairment test to identify potential impairment by comparing the fair value of a reporting unit with its carrying amount. If the carrying amount of a reporting unit exceeds its fair value, goodwill may be impaired and a step II goodwill impairment test is performed to measure the amount of impairment, if any. In the step II goodwill impairment test, we compare the implied fair value of reporting unit goodwill with the carrying amount of that goodwill. If the carrying amount of reporting unit goodwill exceeds the implied fair value of that goodwill, an impairment loss is recognized in an amount equal to the excess. The implied fair value of goodwill is determined in a manner consistent with how goodwill is recognized in a business combination. We allocate the fair value of a reporting unit to the assets and liabilities of that unit, including intangible assets, as if the reporting unit had been acquired in a business combination. Any excess of the fair value of a reporting unit over the amounts assigned to its assets and liabilities is the implied fair value of goodwill.
Fair value estimates used in the step I goodwill impairment tests are calculated using an income approach based on the present value of future cash flows of each reporting unit. The income approach has been supported by guideline analyses (a market approach). These approaches incorporate a number of assumptions including future growth rates, discount rates, income tax rates, and market activity in
68
TE CONNECTIVITY LTD.
NOTES TO CONSOLIDATED FINANCIAL STATEMENTS (Continued)
2. Summary of Significant Accounting Policies (Continued)
assessing fair value and are reporting unit specific. Changes in economic and operating conditions impacting these assumptions could result in goodwill impairments in future periods.
Research and Development
Research and development expenditures are expensed when incurred and are included in research, development, and engineering expenses on the Consolidated Statements of Operations. Research and development expenses include salaries, direct costs incurred, and building and overhead expenses. The amounts expensed in fiscal 2018, 2017, and 2016 were $606 million, $548 million, and $525 million, respectively.
Income Taxes
Income taxes are computed in accordance with the provisions of ASC 740, Income Taxes . Deferred tax liabilities and assets are recognized for the expected future tax consequences of events that have been reflected on the Consolidated Financial Statements. Deferred tax liabilities and assets are determined based on the differences between the book and tax bases of particular assets and liabilities and operating loss carryforwards using tax rates in effect for the years in which the differences are expected to reverse. A valuation allowance is provided to offset deferred tax assets if, based upon the available evidence, it is more likely than not that some or all of the deferred tax assets will not be realized.
The calculation of our tax liabilities includes estimates for uncertainties in the application of complex tax regulations across multiple global jurisdictions where we conduct our operations. Under the uncertain tax position provisions of ASC 740, we recognize liabilities for tax and related interest for issues in tax jurisdictions based on our estimate of whether, and the extent to which, additional taxes and related interest will be due. These tax liabilities and related interest are reflected net of the impact of related tax loss carryforwards, as such tax loss carryforwards will be applied against these tax liabilities and will reduce the amount of cash tax payments due upon the eventual settlement with the tax authorities. These estimates may change due to changing facts and circumstances. Due to the complexity of these uncertainties, the ultimate resolution may result in a settlement that differs from our current estimate of the tax liabilities and related interest.
Financial Instruments
Our financial instruments consist primarily of cash and cash equivalents, accounts receivable, accounts payable, debt, and derivative financial instruments.
We account for derivative financial instrument contracts on the Consolidated Balance Sheets at fair value. For instruments not designated as hedges under ASC 815, Derivatives and Hedging , the changes in the instruments' fair value are recognized currently in earnings. For instruments designated as cash flow hedges, the effective portion of changes in the fair value of a derivative is recorded in other comprehensive income (loss) and reclassified into earnings in the same period or periods during which the underlying hedged item affects earnings. Ineffective portions of a cash flow hedge, including amounts excluded from the hedging relationship, are recognized currently in earnings. Changes in the fair value of instruments designated as fair value hedges affect the carrying value of the asset or liability hedged, with changes in both the derivative instrument and the hedged asset or liability being recognized currently in earnings.
69
TE CONNECTIVITY LTD.
NOTES TO CONSOLIDATED FINANCIAL STATEMENTS (Continued)
2. Summary of Significant Accounting Policies (Continued)
We determine the fair value of our financial instruments by using methods and assumptions that are based on market conditions and risks existing at each balance sheet date. Standard market conventions are used to determine the fair value of financial instruments, including derivatives.
The cash flows related to derivative financial instruments are reported in the operating activities section of the Consolidated Statements of Cash Flows.
Our derivative financial instruments present certain market and counterparty risks. Concentration of counterparty risk is mitigated, however, by our use of financial institutions worldwide, substantially all of which have long-term Standard & Poor's, Moody's, and/or Fitch credit ratings of A/A2 or higher. In addition, we utilize only conventional derivative financial instruments. We are exposed to potential losses if a counterparty fails to perform according to the terms of its agreement. With respect to counterparty net asset positions recognized at fiscal year end 2018, we have assessed the likelihood of counterparty default as remote. We currently provide guarantees from a wholly-owned subsidiary to the counterparties to our commodity swap derivatives and exchange cash collateral with the counterparties to our cross-currency swap contracts. The likelihood of performance on the guarantees has been assessed as remote. For all other derivative financial instruments, we are not required to provide, nor do we require counterparties to provide, collateral or other security.
Fair Value Measurements
ASC 820, Fair Value Measurements and Disclosures , specifies a fair value hierarchy based upon the observable inputs utilized in valuation of certain assets and liabilities. Observable inputs (highest level) reflect market data obtained from independent sources, while unobservable inputs (lowest level) reflect internally developed market assumptions. Fair value measurements are classified under the following hierarchy:
- •
-
Level 1.
Quoted prices in active markets for identical assets and
liabilities.
- •
-
Level 2.
Quoted prices in active markets for similar assets and
liabilities, or other inputs that are observable for the asset or liability, either directly or indirectly, for substantially the full term of the asset or liability.
- •
- Level 3. Unobservable inputs that are supported by little or no market activity and that are significant to the fair value of the assets and liabilities. This includes certain pricing models, discounted cash flows methodologies, and similar techniques that use significant unobservable inputs.
Derivative financial instruments measured at fair value on a recurring basis are generally valued using level 2 inputs.
Financial instruments other than derivative instruments include cash and cash equivalents, accounts receivable, accounts payable, and debt. These instruments are recorded on the Consolidated Balance Sheets at book value. For cash and cash equivalents, accounts receivable, and accounts payable, we believe book value approximates fair value due to the short-term nature of these instruments. See Note 11 for disclosure of the fair value of debt. The following is a description of the valuation methodologies used for the respective financial instruments:
- •
- Cash and cash equivalents. Cash and cash equivalents are valued at book value, which we consider to be equivalent to unadjusted quoted prices (level 1).
70
TE CONNECTIVITY LTD.
NOTES TO CONSOLIDATED FINANCIAL STATEMENTS (Continued)
2. Summary of Significant Accounting Policies (Continued)
- •
-
Accounts receivable.
Accounts receivable are valued based on the net value
expected to be realized. The net realizable value generally represents an observable contractual agreement (level 2).
- •
-
Accounts payable.
Accounts payable are valued based on the net value
expected to be paid, generally supported by an observable contractual agreement (level 2).
- •
- Debt. The fair value of debt, including both current and non-current maturities, is derived from quoted market prices or other pricing determinations based on the results of market approach valuation models using observable market data such as recently reported trades, bid and offer information, and benchmark securities (level 2).
Pension Liabilities
The funded status of our defined benefit pension plans is recognized on the Consolidated Balance Sheets and is measured as the difference between the fair value of plan assets and the projected benefit obligation at the measurement date. The projected benefit obligation represents the actuarial present value of benefits projected to be paid upon retirement factoring in estimated future compensation levels. The fair value of plan assets represents the current market value of cumulative company and participant contributions made to irrevocable trust funds, held for the sole benefit of participants, which are invested by the trustee of the funds. The benefits under our defined benefit pension plans are based on various factors, such as years of service and compensation.
Net periodic pension benefit cost is based on the utilization of the projected unit credit method of calculation and is charged to earnings on a systematic basis over the expected average remaining service lives of current participants.
The measurement of benefit obligations and net periodic benefit cost is based on estimates and assumptions determined by our management. These valuations reflect the terms of the plans and use participant-specific information such as compensation, age, and years of service, as well as certain assumptions, including estimates of discount rates, expected return on plan assets, rate of compensation increases, interest crediting rates, and mortality rates.
Share-Based Compensation
We determine the fair value of share awards on the date of grant. Share options are valued using the Black-Scholes-Merton valuation model; restricted share awards and performance awards are valued using our end-of-day share price on the date of grant. The fair value is expensed ratably over the expected service period, with an allowance made for estimated forfeitures based on historical employee activity. Estimates regarding the attainment of performance criteria are reviewed periodically; the cumulative impact of a change in estimate regarding the attainment of performance criteria is recorded in the period in which that change is made.
Earnings Per Share
Basic earnings per share is computed by dividing net income by the basic weighted-average number of common shares outstanding. Diluted earnings per share is computed by dividing net income by the weighted-average number of common shares outstanding adjusted for the potentially dilutive impact of share-based compensation arrangements.
71
TE CONNECTIVITY LTD.
NOTES TO CONSOLIDATED FINANCIAL STATEMENTS (Continued)
2. Summary of Significant Accounting Policies (Continued)
Currency Translation
For our non-U.S. dollar functional currency subsidiaries, assets and liabilities are translated into U.S. dollars using fiscal year end exchange rates. Sales and expenses are translated at average monthly exchange rates. Foreign currency translation gains and losses are included as a component of accumulated other comprehensive income (loss) within equity.
Gains and losses resulting from foreign currency transactions, which are included in earnings, were immaterial in fiscal 2018, 2017, and 2016.
Restructuring Charges
Restructuring activities involve employee-related termination costs, facility exit costs, and asset impairments resulting from reductions-in-force, migration of facilities or product lines from higher-cost to lower-cost countries, or consolidation of facilities within countries. We recognize termination costs based on requirements established by severance policy, government law, or previous actions. Facility exit costs generally reflect the cost to terminate a facility lease before the end of its term (measured at fair value at the time we cease using the facility) or costs that will continue to be incurred under the facility lease without future economic benefit to us. Restructuring activities often result in the disposal or abandonment of assets that require an acceleration of depreciation or impairment reflecting the excess of the assets' carrying values over fair value.
The recognition of restructuring costs require that we make certain judgments and estimates regarding the nature, timing, and amount of costs associated with the planned exit activity. To the extent our actual results differ from our estimates and assumptions, we may be required to revise the estimated liabilities, requiring the recognition of additional restructuring costs or the reduction of liabilities already recognized. At the end of each reporting period, we evaluate the remaining accrued balances to ensure these balances are properly stated and the utilization of the reserves are for their intended purpose in accordance with developed exit plans.
Contingent Liabilities
We record a loss contingency when the available information indicates it is probable that we have incurred a liability and the amount of the loss is reasonably estimable. When a range of possible losses with equal likelihood exists, we record the low end of the range. The likelihood of a loss with respect to a particular contingency is often difficult to predict, and determining a meaningful estimate of the loss or a range of loss may not be practicable based on information available. In addition, it is not uncommon for such matters to be resolved over many years, during which time relevant developments and new information must continuously be evaluated to determine whether a loss is probable and a reasonable estimate of that loss can be made. When a loss is probable but a reasonable estimate cannot be made, or when a loss is at least reasonably possible, disclosure is provided.
Recently Issued Accounting Pronouncements
In October 2016, the Financial Accounting Standards Board ("FASB") issued Accounting Standards Update ("ASU") No. 2016-16, an update to ASC 740, Income Taxes . This new guidance requires the recognition of the income tax consequences of intra-entity transfers of assets other than inventory in the period in which the transfer occurs. The update, which we will adopt on a modified
72
TE CONNECTIVITY LTD.
NOTES TO CONSOLIDATED FINANCIAL STATEMENTS (Continued)
2. Summary of Significant Accounting Policies (Continued)
retrospective basis, is effective for us in the first quarter of fiscal 2019. Adoption is expected to result in a $443 million cumulative-effect adjustment to beginning accumulated earnings, which represents the net reversal of all balances associated with deferred tax impacts of intra-entity transfers of assets other than inventory. This will result in a decrease in other assets of $798 million, an increase in deferred tax assets of $418 million, and a decrease in prepaid expenses and other current assets of $63 million on the Consolidated Balance Sheet.
In February 2016, the FASB issued ASU No. 2016-02 which codified ASC 842, Leases . This guidance, as subsequently amended, requires lessees to recognize a lease liability and a right-of-use asset for most leases and is effective for us in the first quarter of fiscal 2020. We are currently in the process of updating policies, internal controls, financial statement disclosures, and systems to incorporate the impact of the new standard in our financial reporting processes. We intend to adopt the standard using the modified retrospective approach in the period of adoption, as permitted by ASU No. 2018-11. We expect that adoption will likely have a material impact to our Consolidated Balance Sheet; however, we currently do not expect adoption to have a material impact to our results of operations or cash flows. We believe that we are following an appropriate timeline to adopt the new standard in the first quarter of fiscal 2020.
In May 2014, the FASB issued ASU No. 2014-09 which codified ASC 606, Revenue from Contracts with Customers . This guidance supersedes ASC 605, Revenue Recognition , and introduces a single, comprehensive, five-step revenue recognition model. ASC 606 also enhances disclosures related to revenue recognition. ASC 606, as amended, is effective for us beginning in fiscal 2019. Significantly all our revenues are generated from the sale of products. Our Subsea Communications ("SubCom") business, which is reported in discontinued operations, generates contract revenues for construction related projects which are recorded primarily using the percentage-of-completion method. Our review of existing contracts, which is complete, affirms that product revenue and contract revenue will continue to be recognized at a point in time and over-time, respectively, in a manner consistent with current practice. See Notes 4 and 23 for additional information regarding our SubCom business. In fiscal 2018, we completed the process of updating policies, internal controls, financial statement disclosures, and systems to incorporate the impact of the new standard in our financial reporting processes. We will adopt the new standard using the modified retrospective approach and have determined that transition impacts, which relate primarily to incentive compensation arrangements, are not material to our results of operations or financial position.
Recently Adopted Accounting Pronouncements
In February 2018, the FASB issued ASU No. 2018-02, an update to ASC 220, Income Statement—Reporting Comprehensive Income , to allow a reclassification from accumulated other comprehensive income (loss) for stranded tax effects resulting from the Tax Cuts and Jobs Act (the "Act"). See Note 15 for additional information regarding the Act. We elected to early adopt this update in fiscal 2018 and reclassify the stranded tax effects resulting from the change in the U.S. federal corporate income tax rate. This change in accounting principle resulted in a reclassification of $38 million, primarily associated with our pension plans, during the period of adoption. The reclassification increased both accumulated other comprehensive loss and accumulated earnings on the Consolidated Balance Sheet with no impact to total shareholders' equity.
73
TE CONNECTIVITY LTD.
NOTES TO CONSOLIDATED FINANCIAL STATEMENTS (Continued)
2. Summary of Significant Accounting Policies (Continued)
In March 2017, the FASB issued ASU No. 2017-07, an update to ASC 715, Compensation—Retirement Benefits, which changes the income statement presentation of net periodic pension and postretirement benefit costs. The ASU requires that service costs be presented with other employee compensation costs within operating income and that other cost components be presented outside of operating income. We elected to early adopt this update in fiscal 2018. The update was applied retrospectively and did not have a material impact on our Consolidated Statements of Operations.
In March 2016, the FASB issued ASU No. 2016-09, an update to ASC 718, Compensation—Stock Compensation , to simplify various aspects of accounting for share-based payments to employees. We elected to early adopt this update in fiscal 2017. The provisions of the update addressing the accounting for excess tax benefits and deficiencies were adopted using a modified retrospective transition approach, with a cumulative-effect adjustment to beginning accumulated earnings and a corresponding increase in deferred tax assets of $165 million. The provision of the update addressing the presentation on the statement of cash flows of employee taxes paid via the withholding of shares was applied retrospectively and did not have a material impact on our Consolidated Financial Statements. Adoption of other provisions, which were applied prospectively, also did not have a material impact on our Consolidated Financial Statements.
3. Restructuring and Other Charges (Credits), Net
Net restructuring and other charges (credits) consisted of the following:
|
|
Fiscal | |||||||||
|---|---|---|---|---|---|---|---|---|---|---|
|
|
2018 | 2017 | 2016 | |||||||
|
|
(in millions)
|
|||||||||
|
Restructuring charges, net |
$ | 140 | $ | 146 | $ | 121 | ||||
|
Gain on divestiture |
(2 | ) | — | (144 | ) | |||||
|
Other charges (credits), net |
(12 | ) | 1 | 21 | ||||||
| | | | | | | | | | | |
|
|
$ | 126 | $ | 147 | $ | (2 | ) | |||
| | | | | | | | | | | |
| | | | | | | | | | | |
| | | | | | | | | | | |
Net restructuring charges by segment were as follows:
|
|
Fiscal | |||||||||
|---|---|---|---|---|---|---|---|---|---|---|
|
|
2018 | 2017 | 2016 | |||||||
|
|
(in millions)
|
|||||||||
|
Transportation Solutions |
$ | 42 | $ | 69 | $ | 39 | ||||
|
Industrial Solutions |
83 | 73 | 28 | |||||||
|
Communications Solutions |
15 | 4 | 54 | |||||||
| | | | | | | | | | | |
|
Restructuring charges, net |
$ | 140 | $ | 146 | $ | 121 | ||||
| | | | | | | | | | | |
| | | | | | | | | | | |
| | | | | | | | | | | |
74
TE CONNECTIVITY LTD.
NOTES TO CONSOLIDATED FINANCIAL STATEMENTS (Continued)
3. Restructuring and Other Charges (Credits), Net (Continued)
Activity in our restructuring reserves was as follows:
|
|
Balance at
Beginning of Fiscal Year |
Charges |
Changes in
Estimate |
Cash
Payments |
Non-Cash
Items |
Currency
Translation |
Balance at
End of Fiscal Year |
|||||||||||||||
|---|---|---|---|---|---|---|---|---|---|---|---|---|---|---|---|---|---|---|---|---|---|---|
|
|
(in millions)
|
|||||||||||||||||||||
|
Fiscal 2018 Activity: |
||||||||||||||||||||||
|
Fiscal 2018 Actions: |
||||||||||||||||||||||
|
Employee severance |
$ | — | $ | 130 | $ | — | $ | (16 | ) | $ | — | $ | — | $ | 114 | |||||||
|
Facility and other exit costs |
— | 6 | — | (2 | ) | — | — | 4 | ||||||||||||||
|
Property, plant, and equipment |
— | 6 | — | — | (6 | ) | — | — | ||||||||||||||
| | | | | | | | | | | | | | | | | | | | | | | |
|
Total |
— | 142 | — | (18 | ) | (6 | ) | — | 118 | |||||||||||||
| | | | | | | | | | | | | | | | | | | | | | | |
|
Fiscal 2017 Actions: |
||||||||||||||||||||||
|
Employee severance |
102 | 5 | (10 | ) | (60 | ) | — | (1 | ) | 36 | ||||||||||||
|
Facility and other exit costs |
1 | 2 | — | (3 | ) | — | — | — | ||||||||||||||
|
Property, plant, and equipment |
— | 1 | (2 | ) | 2 | (1 | ) | — | — | |||||||||||||
| | | | | | | | | | | | | | | | | | | | | | | |
|
Total |
103 | 8 | (12 | ) | (61 | ) | (1 | ) | (1 | ) | 36 | |||||||||||
| | | | | | | | | | | | | | | | | | | | | | | |
|
Fiscal 2016 Actions: |
||||||||||||||||||||||
|
Employee severance |
26 | 7 | (7 | ) | (14 | ) | — | — | 12 | |||||||||||||
|
Facility and other exit costs |
— | 4 | — | (4 | ) | — | — | — | ||||||||||||||
|
Property, plant, and equipment |
— | 1 | (3 | ) | 3 | (1 | ) | — | — | |||||||||||||
| | | | | | | | | | | | | | | | | | | | | | | |
|
Total |
26 | 12 | (10 | ) | (15 | ) | (1 | ) | — | 12 | ||||||||||||
| | | | | | | | | | | | | | | | | | | | | | | |
|
Pre-Fiscal 2016 Actions: |
||||||||||||||||||||||
|
Employee severance |
9 | — | (2 | ) | (5 | ) | — | (1 | ) | 1 | ||||||||||||
|
Facility and other exit costs |
— | 2 | — | (1 | ) | — | (1 | ) | — | |||||||||||||
| | | | | | | | | | | | | | | | | | | | | | | |
|
Total |
9 | 2 | (2 | ) | (6 | ) | — | (2 | ) | 1 | ||||||||||||
| | | | | | | | | | | | | | | | | | | | | | | |
|
Total fiscal 2018 activity |
$ | 138 | $ | 164 | $ | (24 | ) | $ | (100 | ) | $ | (8 | ) | $ | (3 | ) | $ | 167 | ||||
| | | | | | | | | | | | | | | | | | | | | | | |
| | | | | | | | | | | | | | | | | | | | | | | |
| | | | | | | | | | | | | | | | | | | | | | | |
|
Fiscal 2017 Activity: |
||||||||||||||||||||||
|
Fiscal 2017 Actions: |
||||||||||||||||||||||
|
Employee severance |
$ | — | $ | 141 | $ | (5 | ) | $ | (39 | ) | $ | — | $ | 5 | $ | 102 | ||||||
|
Facility and other exit costs |
— | 2 | — | (1 | ) | — | — | 1 | ||||||||||||||
|
Property, plant, and equipment |
— | 9 | — | — | (9 | ) | — | — | ||||||||||||||
| | | | | | | | | | | | | | | | | | | | | | | |
|
Total |
— | 152 | (5 | ) | (40 | ) | (9 | ) | 5 | 103 | ||||||||||||
| | | | | | | | | | | | | | | | | | | | | | | |
|
Fiscal 2016 Actions: |
||||||||||||||||||||||
|
Employee severance |
53 | 8 | (9 | ) | (26 | ) | — | — | 26 | |||||||||||||
|
Facility and other exit costs |
— | 3 | — | (3 | ) | — | — | — | ||||||||||||||
| | | | | | | | | | | | | | | | | | | | | | | |
|
Total |
53 | 11 | (9 | ) | (29 | ) | — | — | 26 | |||||||||||||
| | | | | | | | | | | | | | | | | | | | | | | |
|
Pre-Fiscal 2016 Actions: |
||||||||||||||||||||||
|
Employee severance |
23 | — | (4 | ) | (7 | ) | — | (3 | ) | 9 | ||||||||||||
|
Facility and other exit costs |
1 | 1 | — | (2 | ) | — | — | — | ||||||||||||||
| | | | | | | | | | | | | | | | | | | | | | | |
|
Total |
24 | 1 | (4 | ) | (9 | ) | — | (3 | ) | 9 | ||||||||||||
| | | | | | | | | | | | | | | | | | | | | | | |
|
Total fiscal 2017 activity |
$ | 77 | $ | 164 | $ | (18 | ) | $ | (78 | ) | $ | (9 | ) | $ | 2 | $ | 138 | |||||
| | | | | | | | | | | | | | | | | | | | | | | |
| | | | | | | | | | | | | | | | | | | | | | | |
| | | | | | | | | | | | | | | | | | | | | | | |
|
|
||||||||||||||||||||||
75
TE CONNECTIVITY LTD.
NOTES TO CONSOLIDATED FINANCIAL STATEMENTS (Continued)
3. Restructuring and Other Charges (Credits), Net (Continued)
|
|
Balance at
Beginning of Fiscal Year |
Charges |
Changes in
Estimate |
Cash
Payments |
Non-Cash
Items |
Currency
Translation |
Balance at
End of Fiscal Year |
|||||||||||||||
|---|---|---|---|---|---|---|---|---|---|---|---|---|---|---|---|---|---|---|---|---|---|---|
|
|
(in millions)
|
|||||||||||||||||||||
|
Fiscal 2016 Activity: |
||||||||||||||||||||||
|
Fiscal 2016 Actions: |
||||||||||||||||||||||
|
Employee severance |
$ | — | $ | 84 | $ | — | $ | (32 | ) | $ | — | $ | 1 | $ | 53 | |||||||
|
Facility and other exit costs |
— | 2 | — | (2 | ) | — | — | — | ||||||||||||||
|
Property, plant, and equipment |
— | 41 | — | — | (41 | ) | — | — | ||||||||||||||
| | | | | | | | | | | | | | | | | | | | | | | |
|
Total |
— | 127 | — | (34 | ) | (41 | ) | 1 | 53 | |||||||||||||
| | | | | | | | | | | | | | | | | | | | | | | |
|
Pre-Fiscal 2016 Actions: |
||||||||||||||||||||||
|
Employee severance |
68 | 2 | (10 | ) | (39 | ) | — | 2 | 23 | |||||||||||||
|
Facility and other exit costs |
1 | 2 | — | (2 | ) | — | — | 1 | ||||||||||||||
| | | | | | | | | | | | | | | | | | | | | | | |
|
Total |
69 | 4 | (10 | ) | (41 | ) | — | 2 | 24 | |||||||||||||
| | | | | | | | | | | | | | | | | | | | | | | |
|
Total fiscal 2016 activity |
$ | 69 | $ | 131 | $ | (10 | ) | $ | (75 | ) | $ | (41 | ) | $ | 3 | $ | 77 | |||||
| | | | | | | | | | | | | | | | | | | | | | | |
| | | | | | | | | | | | | | | | | | | | | | | |
| | | | | | | | | | | | | | | | | | | | | | | |
Fiscal 2018 Actions
During fiscal 2018, we initiated a restructuring program associated with footprint consolidation and structural improvements primarily impacting the Industrial Solutions and Transportation Solutions segments. In connection with this program, during fiscal 2018, we recorded restructuring charges of $142 million. We expect to complete all restructuring actions commenced during fiscal 2018 by the end of fiscal 2020 and to incur additional charges of approximately $15 million primarily in the Industrial Solutions segment.
Fiscal 2017 Actions
During fiscal 2017, we initiated a restructuring program associated with footprint consolidation related to recent acquisitions and structural improvements impacting all segments. In connection with this program, during fiscal 2018 and 2017, we recorded net restructuring credits of $4 million and charges of $147 million, respectively. We expect to complete all restructuring actions commenced during fiscal 2017 by the end of fiscal 2019 and anticipate that any additional charges will be insignificant.
Fiscal 2016 Actions
During fiscal 2016, we initiated a restructuring program associated with headcount reductions impacting all segments and product line closures in the Communications Solutions segment. In connection with this program, during fiscal 2018, 2017, and 2016, we recorded net restructuring charges of $2 million, $2 million, and $127 million, respectively. We expect to complete all restructuring actions commenced during fiscal 2016 by the end of fiscal 2019 and to incur additional employee severance charges of approximately $10 million primarily in the Communications Solutions segment.
76
TE CONNECTIVITY LTD.
NOTES TO CONSOLIDATED FINANCIAL STATEMENTS (Continued)
3. Restructuring and Other Charges (Credits), Net (Continued)
Pre-Fiscal 2016 Actions
During fiscal 2017 and 2016, we recorded net restructuring credits of $3 million and $6 million, respectively, related to pre-fiscal 2016 actions. We do not expect to incur any additional charges related to pre-fiscal 2016 actions.
Total Restructuring Reserves
Restructuring reserves included on the Consolidated Balance Sheets were as follows:
|
|
Fiscal Year End | ||||||
|---|---|---|---|---|---|---|---|
|
|
2018 | 2017 | |||||
|
|
(in millions)
|
||||||
|
Accrued and other current liabilities |
$ | 141 | $ | 127 | |||
|
Other liabilities |
26 | 11 | |||||
| | | | | | | | |
|
Restructuring reserves |
$ | 167 | $ | 138 | |||
| | | | | | | | |
| | | | | | | | |
| | | | | | | | |
During fiscal 2016, we sold our Circuit Protection Devices ("CPD") business for net cash proceeds of $333 million. We recognized a pre-tax gain of $144 million on the transaction. The CPD business was reported in our Communications Solutions segment.
4. Discontinued Operations
On September 16, 2018, we entered into a definitive agreement to sell our Subsea Communications ("SubCom") business for $325 million, subject to a final working capital adjustment. The agreement provides that, if the purchaser sells the business within two years of the closing date, we will be entitled to 20% of the net proceeds of that future sale, as defined in the agreement, in excess of $325 million. The sale of the SubCom business, which was previously included in our Communications Solutions segment, represents our exit from the telecommunications market and is significant to our sales and profitability, both to the Communications Solutions segment and to the consolidated company. We have concluded that the divestiture is a strategic shift that will have a major effect on our operations and financial results. As a result, the SubCom business met the held for sale and discontinued operations criteria and was reported as a discontinued operation on our Consolidated Financial Statements for all periods presented.
Upon entering into the definitive agreement, which we consider a level 2 observable input in the fair value hierarchy, we assessed the carrying value of the SubCom business and determined that it was in excess of its fair value. In fiscal 2018, we recorded a pre-tax impairment charge of $19 million, which is included in income (loss) from discontinued operations on the Consolidated Statement of Operations, to write the carrying value of the business down to its estimated fair value less costs to sell. We expect to incur a pre-tax loss on sale of approximately $90 million, related primarily to the recognition of cumulative translation adjustment losses and the guarantee liabilities discussed below, which will be presented in income (loss) from discontinued operations on the Consolidated Statement of Operations. See Note 23 for additional information regarding the divestiture.
77
TE CONNECTIVITY LTD.
NOTES TO CONSOLIDATED FINANCIAL STATEMENTS (Continued)
4. Discontinued Operations (Continued)
Following the divestiture, we will continue to honor performance guarantees and letters of credit related to the SubCom business' existing projects. These existing guarantees have a combined value of approximately $1.7 billion and are expected to expire at various dates through fiscal 2025; however, the majority are expected to expire within two years. Also, under the terms of the definitive agreement, we are required to issue up to $300 million of new performance guarantees, subject to certain limitations, for projects entered into by the SubCom business following the sale for a period of up to three years. We have contractual recourse against the SubCom business if we are required to perform on these guarantees; however, based on historical experience, we do not anticipate having to perform.
The SubCom business generates contract revenues for construction related projects which are recorded primarily using the percentage-of-completion method. Profits recognized on contracts in process are based upon estimated contract revenue and related cost to complete. Percentage-of-completion is measured based on the ratio of actual costs incurred to total estimated costs. Revisions in cost estimates as contracts progress have the effect of increasing or decreasing profits in the current period. Provisions for anticipated losses are made in the period in which they first become determinable. In addition, provisions for credit losses related to unbilled receivables on construction related projects are recorded as reductions of revenue in the period in which they first become determinable.
The following table presents the summarized components of income (loss) from discontinued operations, net of income taxes, for the SubCom business and prior divestitures:
|
|
Fiscal | |||||||||
|---|---|---|---|---|---|---|---|---|---|---|
|
|
2018 | 2017 | 2016 | |||||||
|
|
(in millions)
|
|||||||||
|
Net sales |
$ | 702 | $ | 928 | $ | 886 | ||||
|
Cost of sales |
602 | 653 | 666 | |||||||
| | | | | | | | | | | |
|
Gross margin |
100 | 275 | 220 | |||||||
|
Selling, general, and administrative expenses (1) |
48 | 50 | 13 | |||||||
|
Research, development, and engineering expenses |
39 | 40 | 34 | |||||||
|
Restructuring and other charges (credits), net (2) |
30 | (3 | ) | 3 | ||||||
| | | | | | | | | | | |
|
Operating income (loss) |
(17 | ) | 188 | 170 | ||||||
|
Non-operating income, net (3) |
— | 22 | — | |||||||
| | | | | | | | | | | |
|
Pre-tax income (loss) from discontinued operations |
(17 | ) | 210 | 170 | ||||||
|
Pre-tax gain (loss) on sale of discontinued operations (4) |
(2 | ) | 3 | 29 | ||||||
|
Income tax (expense) benefit |
— | (70 | ) | (37 | ) | |||||
| | | | | | | | | | | |
|
Income (loss) from discontinued operations, net of income taxes |
$ | (19 | ) | $ | 143 | $ | 162 | |||
| | | | | | | | | | | |
| | | | | | | | | | | |
| | | | | | | | | | | |
- (1)
-
Fiscal
2016 included $30 million of credits related to the settlement of the Com-Net case as discussed below.
- (2)
-
Fiscal
2018 included a $19 million impairment charge recorded in connection with the sale of our SubCom business.
- (3)
- Fiscal 2017 included a $19 million credit related to the SubCom business' curtailment of a postretirement benefit plan.
78
TE CONNECTIVITY LTD.
NOTES TO CONSOLIDATED FINANCIAL STATEMENTS (Continued)
4. Discontinued Operations (Continued)
- (4)
- Fiscal 2016 included a gain of $29 million on the fiscal 2015 divestiture of our Broadband Network Solutions ("BNS") business as discussed below.
The following table presents balance sheet information for assets and liabilities held for sale:
|
|
Fiscal Year End | ||||||
|---|---|---|---|---|---|---|---|
|
|
2018 | 2017 | |||||
|
|
(in millions)
|
||||||
|
Accounts receivable, net |
$ | 72 | $ | 152 | |||
|
Inventories |
130 | 166 | |||||
|
Other current assets |
32 | 27 | |||||
|
Property, plant, and equipment, net (1) |
221 | 241 | |||||
|
Other assets |
17 | 16 | |||||
| | | | | | | | |
|
Total assets held for sale (2) |
$ | 472 | $ | 602 | |||
| | | | | | | | |
| | | | | | | | |
| | | | | | | | |
|
Accounts payable |
$ | 63 | $ | 50 | |||
|
Accrued and other current liabilities |
26 | 39 | |||||
|
Deferred revenue |
60 | 48 | |||||
|
Other liabilities |
39 | 43 | |||||
| | | | | | | | |
|
Total liabilities held for sale (2) |
$ | 188 | $ | 180 | |||
| | | | | | | | |
| | | | | | | | |
| | | | | | | | |
- (1)
-
Fiscal
year end 2018 included a reduction of $19 million related to the impairment charge recorded in connection with the sale of our SubCom business.
- (2)
- Assets and liabilities held for sale at fiscal year end 2017 were classified as both current and noncurrent on the Consolidated Balance Sheet.
During fiscal 2016, we settled a lawsuit with the former shareholders of Com-Net, which we acquired in fiscal 2001, and paid an aggregate amount of $96 million. In connection with the settlement, we recorded pre-tax credits of $30 million, representing a release of excess reserves, during fiscal 2016. This amount was reflected in income (loss) from discontinued operations on the Consolidated Statement of Operations as the Com-Net case was associated with our former Wireless Systems business which was sold in fiscal 2009. Also during fiscal 2016, we recognized an additional pre-tax gain of $29 million on the fiscal 2015 divestiture of our BNS business, related primarily to pension and net working capital adjustments.
The Wireless Systems and BNS businesses met the held for sale and discontinued operations criteria and were reported as such in all periods presented on the Consolidated Financial Statements. Prior to reclassification to discontinued operations, the Wireless Systems and BNS businesses were included in the former Wireless Systems and Network Solutions segments, respectively.
5. Acquisitions
Fiscal 2018 Acquisitions
During fiscal 2018, we acquired two businesses for a combined cash purchase price of $153 million, net of cash acquired. The acquisitions were reported as part of our Industrial Solutions segment from the date of acquisition.
79
TE CONNECTIVITY LTD.
NOTES TO CONSOLIDATED FINANCIAL STATEMENTS (Continued)
5. Acquisitions (Continued)
Fiscal 2017 Acquisitions
During fiscal 2017, we acquired two businesses for a combined cash purchase price of $250 million, net of cash acquired. The acquisitions were reported as part of our Transportation Solutions and Industrial Solutions segments from the date of acquisition.
Fiscal 2016 Acquisitions
In fiscal 2016, we acquired four businesses, including the Creganna Medical group, for a combined cash purchase price of $1.3 billion, net of cash acquired. The acquisitions were reported as part of our Industrial Solutions and Transportation Solutions segments from the date of acquisition.
The following table summarizes the allocation of the purchase price to the fair value of identifiable assets acquired and liabilities assumed at the date of acquisition, in accordance with the acquisition method of accounting:
|
|
(in millions) | |||
|---|---|---|---|---|
|
Cash and cash equivalents |
$ | 77 | ||
|
Other current assets |
97 | |||
|
Goodwill |
802 | |||
|
Intangible assets |
530 | |||
|
Other non-current assets |
73 | |||
| | | | | |
|
Total assets acquired |
1,579 | |||
| | | | | |
|
Current liabilities |
46 | |||
|
Deferred income taxes |
100 | |||
|
Other non-current liabilities |
20 | |||
| | | | | |
|
Total liabilities assumed |
166 | |||
| | | | | |
|
Net assets acquired |
1,413 | |||
|
Cash and cash equivalents acquired |
(77 | ) | ||
| | | | | |
|
Net cash paid |
$ | 1,336 | ||
| | | | | |
| | | | | |
| | | | | |
The fair values assigned to intangible assets were determined using the income approach, specifically the relief from royalty and the multi-period excess earnings methods. Both valuation methods rely on management judgment, including expected future cash flows resulting from existing customer relationships, customer attrition rates, contributory effects of other assets utilized in the business, peer group cost of capital and royalty rates, and other factors. Useful lives for intangible assets were determined based upon the remaining useful economic lives of the intangible assets that are expected to contribute directly or indirectly to future cash flows.
80
TE CONNECTIVITY LTD.
NOTES TO CONSOLIDATED FINANCIAL STATEMENTS (Continued)
5. Acquisitions (Continued)
Acquired intangible assets consisted of the following:
|
|
Amount |
Weighted-Average
Amortization Period |
|||||
|---|---|---|---|---|---|---|---|
|
|
(in millions)
|
(in years)
|
|||||
|
Customer relationships |
$ | 300 | 18 | ||||
|
Developed technology |
170 | 11 | |||||
|
Trade names and trademarks |
45 | 25 | |||||
|
Customer order backlog |
15 | 3 | |||||
| | | | | | | | |
|
Total |
$ | 530 | 16 | ||||
| | | | | | | | |
| | | | | | | | |
| | | | | | | | |
The acquired intangible assets are being amortized on a straight-line basis over their expected useful lives.
Goodwill of $802 million was recognized in these transactions, representing the excess of the purchase price over the fair value of the tangible and intangible assets acquired and liabilities assumed. This goodwill is attributable primarily to cost savings and other synergies related to operational efficiencies including the consolidation of manufacturing, marketing, and general and administrative functions. The goodwill has been allocated to the Industrial Solutions and Transportation Solutions segments and is not deductible for tax purposes. However, prior to being acquired by us, one of the fiscal 2016 acquisitions completed certain acquisitions that resulted in goodwill with an estimated value of $15 million that is deductible primarily for U.S. tax purposes, which we will deduct through 2025.
Fiscal 2016 acquisitions contributed net sales of $167 million and operating income of $8 million to our Consolidated Statement of Operations during fiscal 2016. The operating income included $10 million of acquisition costs, $7 million associated with the amortization of acquisition-related fair value adjustments related to acquired inventories and customer order backlog, and $2 million of integration costs.
The following unaudited pro forma financial information reflects our consolidated results of operations had the fiscal 2016 acquisitions occurred at the beginning of fiscal 2015:
|
|
Fiscal | |||
|---|---|---|---|---|
|
|
2016 | |||
|
|
(in millions, except
per share data) |
|||
|
Net sales |
$ | 11,585 | ||
|
Net income |
2,038 | |||
|
Diluted earnings per share |
$ | 5.52 | ||
The pro forma adjustments, which were not significant, included interest expense based on pro forma changes in our combined capital structure, charges related to acquired customer order backlog, charges related to the amortization of the fair value of acquired intangible assets, charges related to the fair value adjustment to acquisition-date inventories, and acquisition and other costs, and the related tax effects.
Pro forma results do not include any anticipated synergies or other anticipated benefits of these acquisitions. Accordingly, the unaudited pro forma financial information is not necessarily indicative of
81
TE CONNECTIVITY LTD.
NOTES TO CONSOLIDATED FINANCIAL STATEMENTS (Continued)
5. Acquisitions (Continued)
either future results of operations or results that might have been achieved had these acquisitions occurred at the beginning of the preceding fiscal years.
6. Inventories
Inventories consisted of the following:
|
|
Fiscal Year End | ||||||
|---|---|---|---|---|---|---|---|
|
|
2018 | 2017 | |||||
|
|
(in millions)
|
||||||
|
Raw materials |
$ | 276 | $ | 271 | |||
|
Work in progress |
656 | 570 | |||||
|
Finished goods |
925 | 806 | |||||
| | | | | | | | |
|
Inventories |
$ | 1,857 | $ | 1,647 | |||
| | | | | | | | |
| | | | | | | | |
| | | | | | | | |
7. Property, Plant, and Equipment, Net
Net property, plant, and equipment consisted of the following:
|
|
Fiscal Year End | ||||||
|---|---|---|---|---|---|---|---|
|
|
2018 | 2017 | |||||
|
|
(in millions)
|
||||||
|
Land and improvements |
$ | 171 | $ | 174 | |||
|
Buildings and improvements |
1,379 | 1,324 | |||||
|
Machinery and equipment |
7,124 | 6,757 | |||||
|
Construction in process |
724 | 683 | |||||
| | | | | | | | |
|
Gross property, plant, and equipment |
9,398 | 8,938 | |||||
|
Accumulated depreciation |
(5,901 | ) | (5,779 | ) | |||
| | | | | | | | |
|
Property, plant, and equipment, net |
$ | 3,497 | $ | 3,159 | |||
| | | | | | | | |
| | | | | | | | |
| | | | | | | | |
Depreciation expense was $487 million, $442 million, and $411 million in fiscal 2018, 2017, and 2016, respectively.
82
TE CONNECTIVITY LTD.
NOTES TO CONSOLIDATED FINANCIAL STATEMENTS (Continued)
8. Goodwill
The changes in the carrying amount of goodwill by segment were as follows:
|
|
Transportation
Solutions |
Industrial
Solutions |
Communications
Solutions |
Total | |||||||||
|---|---|---|---|---|---|---|---|---|---|---|---|---|---|
|
|
(in millions)
|
||||||||||||
|
Fiscal year end 2016 (1) |
$ | 1,903 | $ | 3,005 | $ | 584 | $ | 5,492 | |||||
|
Acquisitions |
82 | 14 | — | 96 | |||||||||
|
Currency translation |
26 | 28 | 9 | 63 | |||||||||
| | | | | | | | | | | | | | |
|
Fiscal year end 2017 (1) |
2,011 | 3,047 | 593 | 5,651 | |||||||||
|
Acquisitions |
— | 78 | — | 78 | |||||||||
|
Currency translation |
(18 | ) | (21 | ) | (6 | ) | (45 | ) | |||||
| | | | | | | | | | | | | | |
|
Fiscal year end 2018 (1) |
$ | 1,993 | $ | 3,104 | $ | 587 | $ | 5,684 | |||||
| | | | | | | | | | | | | | |
| | | | | | | | | | | | | | |
| | | | | | | | | | | | | | |
- (1)
- At fiscal year end 2018, 2017, and 2016, accumulated impairment losses for the Transportation Solutions, Industrial Solutions, and Communications Solutions segments were $2,191 million, $669 million, and $489 million, respectively.
During fiscal 2018, we recognized goodwill of $78 million in the Industrial Solutions segment due primarily to recent acquisitions. During fiscal 2017, we acquired two businesses and recognized goodwill of $130 million, which benefitted the Transportation Solutions and Industrial Solutions segments. Also in fiscal 2017, we finalized the purchase price allocation of our fiscal 2016 acquisitions, and the associated goodwill was reduced by $34 million. This reduction, which was primarily within the Industrial Solutions segment, is reflected in fiscal 2017 acquisitions in the above table. See Note 5 for additional information regarding acquisitions.
We completed our annual goodwill impairment test in the fourth quarter of fiscal 2018 and determined that no impairment existed.
9. Intangible Assets, Net
Intangible assets consisted of the following:
|
|
Fiscal Year End | ||||||||||||||||||
|---|---|---|---|---|---|---|---|---|---|---|---|---|---|---|---|---|---|---|---|
|
|
2018 | 2017 | |||||||||||||||||
|
|
Gross
Carrying Amount |
Accumulated
Amortization |
Net
Carrying Amount |
Gross
Carrying Amount |
Accumulated
Amortization |
Net
Carrying Amount |
|||||||||||||
|
|
(in millions)
|
||||||||||||||||||
|
Customer relationships |
$ | 1,468 | $ | (389 | ) | $ | 1,079 | $ | 1,433 | $ | (300 | ) | $ | 1,133 | |||||
|
Intellectual property |
1,261 | (653 | ) | 608 | 1,262 | (574 | ) | 688 | |||||||||||
|
Other |
33 | (16 | ) | 17 | 36 | (16 | ) | 20 | |||||||||||
| | | | | | | | | | | | | | | | | | | | |
|
Total |
$ | 2,762 | $ | (1,058 | ) | $ | 1,704 | $ | 2,731 | $ | (890 | ) | $ | 1,841 | |||||
| | | | | | | | | | | | | | | | | | | | |
| | | | | | | | | | | | | | | | | | | | |
| | | | | | | | | | | | | | | | | | | | |
83
TE CONNECTIVITY LTD.
NOTES TO CONSOLIDATED FINANCIAL STATEMENTS (Continued)
9. Intangible Assets, Net (Continued)
Intangible asset amortization expense was $180 million, $169 million, and $149 million for fiscal 2018, 2017, and 2016, respectively. At fiscal year end 2018, the aggregate amortization expense on intangible assets is expected to be as follows:
|
|
(in millions) | |||
|---|---|---|---|---|
|
Fiscal 2019 |
$ | 184 | ||
|
Fiscal 2020 |
176 | |||
|
Fiscal 2021 |
173 | |||
|
Fiscal 2022 |
173 | |||
|
Fiscal 2023 |
172 | |||
|
Thereafter |
826 | |||
| | | | | |
|
Total |
$ | 1,704 | ||
| | | | | |
| | | | | |
| | | | | |
10. Accrued and Other Current Liabilities
Accrued and other current liabilities consisted of the following:
|
|
Fiscal Year End | ||||||
|---|---|---|---|---|---|---|---|
|
|
2018 | 2017 | |||||
|
|
(in millions)
|
||||||
|
Accrued payroll and employee benefits |
$ | 565 | $ | 577 | |||
|
Dividends payable to shareholders |
303 | 281 | |||||
|
Income taxes payable |
109 | 121 | |||||
|
Restructuring reserves |
141 | 127 | |||||
|
Share repurchase program payable |
94 | 7 | |||||
|
Interest payable |
34 | 58 | |||||
|
Deferred revenue |
27 | 27 | |||||
|
Other |
438 | 415 | |||||
| | | | | | | | |
|
Accrued and other current liabilities |
$ | 1,711 | $ | 1,613 | |||
| | | | | | | | |
| | | | | | | | |
| | | | | | | | |
84
TE CONNECTIVITY LTD.
NOTES TO CONSOLIDATED FINANCIAL STATEMENTS (Continued)
Debt was as follows:
|
|
Fiscal Year End | ||||||
|---|---|---|---|---|---|---|---|
|
|
2018 | 2017 | |||||
|
|
(in millions)
|
||||||
|
Commercial paper, at a weighted-average interest rate of 2.35% at fiscal year end 2018 |
$ | 270 | $ | — | |||
|
6.55% senior notes due 2017 |
— | 708 | |||||
|
2.375% senior notes due 2018 |
325 | 325 | |||||
|
2.35% senior notes due 2019 |
250 | 250 | |||||
|
4.875% senior notes due 2021 |
250 | 250 | |||||
|
3.50% senior notes due 2022 |
500 | 500 | |||||
|
1.10% euro-denominated senior notes due 2023 |
639 | 650 | |||||
|
3.45% senior notes due 2024 |
350 | 350 | |||||
|
3.70% senior notes due 2026 |
350 | 350 | |||||
|
3.125% senior notes due 2027 |
400 | 400 | |||||
|
7.125% senior notes due 2037 |
477 | 477 | |||||
|
Other |
210 | 96 | |||||
| | | | | | | | |
|
Total principal debt |
4,021 | 4,356 | |||||
|
Unamortized discounts and debt issuance costs |
(21 | ) | (26 | ) | |||
|
Effects of fair value hedge-designated interest rate swap contracts |
— | 14 | |||||
| | | | | | | | |
|
Total debt |
$ | 4,000 | $ | 4,344 | |||
| | | | | | | | |
| | | | | | | | |
| | | | | | | | |
Tyco Electronics Group S.A. ("TEGSA"), our 100%-owned subsidiary, has a five-year unsecured senior revolving credit facility ("Credit Facility") with a maturity date of December 2020 and total commitments of $1,500 million. TEGSA had no borrowings under the Credit Facility at fiscal year end 2018 or 2017.
Borrowings under the Credit Facility bear interest at a rate per annum equal to, at the option of TEGSA, (1) LIBOR plus an applicable margin based upon the senior, unsecured, long-term debt rating of TEGSA, or (2) an alternate base rate equal to the highest of (i) Bank of America, N.A.'s base rate, (ii) the federal funds effective rate plus 1 / 2 of 1%, and (iii) one-month LIBOR plus 1%, plus, in each case, an applicable margin based upon the senior, unsecured, long-term debt rating of TEGSA. TEGSA is required to pay an annual facility fee ranging from 5.0 to 12.5 basis points based upon the amount of the lenders' commitments under the Credit Facility and the applicable credit ratings of TEGSA.
The Credit Facility contains a financial ratio covenant providing that if, as of the last day of each fiscal quarter, our ratio of Consolidated Total Debt to Consolidated EBITDA (as defined in the Credit Facility) for the then most recently concluded period of four consecutive fiscal quarters exceeds 3.75 to 1.0, an Event of Default (as defined in the Credit Facility) is triggered. The Credit Facility and our other debt agreements contain other customary covenants.
Periodically, TEGSA issues commercial paper to U.S. institutional accredited investors and qualified institutional buyers in accordance with available exemptions from the registration requirements of the Securities Act of 1933 as part of our ongoing effort to maintain financial flexibility
85
TE CONNECTIVITY LTD.
NOTES TO CONSOLIDATED FINANCIAL STATEMENTS (Continued)
11. Debt (Continued)
and to potentially decrease the cost of borrowings. Borrowings under the commercial paper program are backed by the Credit Facility.
TEGSA's payment obligations under its senior notes, commercial paper, and Credit Facility are fully and unconditionally guaranteed by its parent, TE Connectivity Ltd.
At fiscal year end 2018, principal payments required for debt are as follows:
|
|
(in millions) | |||
|---|---|---|---|---|
|
Fiscal 2019 |
$ | 963 | ||
|
Fiscal 2020 |
— | |||
|
Fiscal 2021 |
252 | |||
|
Fiscal 2022 |
501 | |||
|
Fiscal 2023 |
639 | |||
|
Thereafter |
1,666 | |||
| | | | | |
|
Total |
$ | 4,021 | ||
| | | | | |
| | | | | |
| | | | | |
The fair value of our debt, based on indicative valuations, was approximately $4,149 million and $4,622 million at fiscal year end 2018 and 2017, respectively.
12. Commitments and Contingencies
Legal Proceedings
In the normal course of business, we are subject to various legal proceedings and claims, including patent infringement claims, product liability matters, employment disputes, disputes on agreements, other commercial disputes, environmental matters, antitrust claims, and tax matters, including non-income tax matters such as value added tax, sales and use tax, real estate tax, and transfer tax. Although it is not feasible to predict the outcome of these proceedings, based upon our experience, current information, and applicable law, we do not expect that the outcome of these proceedings, either individually or in the aggregate, will have a material effect on our results of operations, financial position, or cash flows.
Environmental Matters
We are involved in various stages of investigation and cleanup related to environmental remediation matters at a number of sites. The ultimate cost of site cleanup is difficult to predict given the uncertainties regarding the extent of the required cleanup, the interpretation of applicable laws and regulations, and alternative cleanup methods. As of fiscal year end 2018, we concluded that we would incur investigation and remediation costs at these sites in the reasonably possible range of $15 million to $42 million, and we accrued $17 million as the probable loss, which was the best estimate within this range. We believe that any potential payment of such estimated amounts will not have a material adverse effect on our results of operations, financial position, or cash flows.
Leases
We have facility, land, vehicle, and equipment leases that expire at various dates. Rental expense under these operating leases was $141 million, $147 million, and $137 million for fiscal 2018, 2017, and
86
TE CONNECTIVITY LTD.
NOTES TO CONSOLIDATED FINANCIAL STATEMENTS (Continued)
12. Commitments and Contingencies (Continued)
2016, respectively. At fiscal year end 2018, future minimum lease payments under non-cancelable operating lease obligations were as follows:
|
|
(in millions) | |||
|---|---|---|---|---|
|
Fiscal 2019 |
$ | 97 | ||
|
Fiscal 2020 |
76 | |||
|
Fiscal 2021 |
62 | |||
|
Fiscal 2022 |
48 | |||
|
Fiscal 2023 |
38 | |||
|
Thereafter |
82 | |||
| | | | | |
|
Total |
$ | 403 | ||
| | | | | |
| | | | | |
| | | | | |
Guarantees
In disposing of assets or businesses, we often provide representations, warranties, and/or indemnities to cover various risks including unknown damage to assets, environmental risks involved in the sale of real estate, liability for investigation and remediation of environmental contamination at waste disposal sites and manufacturing facilities, and unidentified tax liabilities and legal fees related to periods prior to disposition. We do not expect that these uncertainties will have a material adverse effect on our results of operations, financial position, or cash flows.
At fiscal year end 2018, we had outstanding letters of credit, letters of guarantee, and surety bonds of $275 million.
13. Financial Instruments and Fair Value Measurements
We use derivative and non-derivative financial instruments to manage certain exposures to foreign currency, interest rate, investment, and commodity risks.
The effects of derivative instruments on the Consolidated Statements of Operations were immaterial for fiscal 2018, 2017, and 2016.
Foreign Exchange Risks and Hedges of Net Investment
As part of managing the exposure to changes in foreign currency exchange rates, we utilize cross-currency swap contracts and foreign currency forward contracts, a portion of which are designated as cash flow hedges. The objective of these contracts is to minimize impacts to cash flows and profitability due to changes in foreign currency exchange rates on intercompany and other cash transactions. We expect that significantly all of the balance in accumulated other comprehensive income (loss) associated with the cash flow hedge-designated instruments addressing foreign exchange risks will be reclassified into the Consolidated Statement of Operations within the next twelve months.
During fiscal 2015, we entered into cross-currency swap contracts with an aggregate notional value of €1,000 million to reduce our exposure to foreign currency exchange risk associated with certain intercompany loans. Under the terms of these contracts, which have been designated as cash flow hedges, we make quarterly interest payments in euros at 3.50% per annum and receive interest in U.S. dollars at a weighted-average rate of 5.33% per annum. Upon maturity of these contracts in fiscal 2022,
87
TE CONNECTIVITY LTD.
NOTES TO CONSOLIDATED FINANCIAL STATEMENTS (Continued)
13. Financial Instruments and Fair Value Measurements (Continued)
we will pay the notional value of the contracts in euros and receive U.S. dollars from our counterparties. In connection with the cross-currency swap contracts, we are required to post cash collateral with our counterparties.
At fiscal year end 2018 and 2017, our cross-currency swap contracts were in liability positions of $100 million and $96 million, respectively, and were recorded in other liabilities on the Consolidated Balance Sheets. At fiscal year end 2018 and 2017, collateral paid to our counterparties approximated the derivative positions and was recorded in prepaid expenses and other current assets on the Consolidated Balance Sheets. The impacts of our cross-currency swap contracts were as follows:
|
|
Fiscal | |||||||||
|---|---|---|---|---|---|---|---|---|---|---|
|
|
2018 | 2017 | 2016 | |||||||
|
|
(in millions)
|
|||||||||
|
Losses recorded in other comprehensive income (loss) |
$ | (25 | ) | $ | (20 | ) | $ | (26 | ) | |
|
Gains (losses) excluded from the hedging relationship (1) |
21 | (58 | ) | (7 | ) | |||||
- (1)
- Gains and losses excluded from the hedging relationship are recognized prospectively in selling, general, and administrative expenses and are offset by losses and gains generated as a result of re-measuring certain intercompany loans to the U.S. dollar.
We hedge our net investment in certain foreign operations using intercompany loans and external borrowings denominated in the same currencies. The aggregate notional value of these hedges was $4,064 million and $3,110 million at fiscal year end 2018 and 2017, respectively. The impacts of our hedging program were as follows:
|
|
Fiscal | |||||||||
|---|---|---|---|---|---|---|---|---|---|---|
|
|
2018 | 2017 | 2016 | |||||||
|
|
(in millions)
|
|||||||||
|
Foreign currency exchange gains (losses) (1) |
$ | 36 | $ | (74 | ) | $ | (45 | ) | ||
- (1)
- Foreign currency exchange gains and losses are recorded as currency translation, a component of accumulated other comprehensive income (loss), and are offset by changes attributable to the translation of the net investment.
Interest Rate and Investment Risk Management
We issue debt, as needed, to fund our operations and capital requirements. Such borrowings can result in interest rate exposure. To manage the interest rate exposure, we use interest rate swap contracts to convert a portion of fixed-rate debt into variable-rate debt. We may use forward starting interest rate swap contracts to manage interest rate exposure in periods prior to the anticipated issuance of fixed-rate debt. We also utilize investment swap contracts to manage earnings exposure on certain nonqualified deferred compensation liabilities.
Commodity Hedges
As part of managing the exposure to certain commodity price fluctuations, we utilize commodity swap contracts designated as cash flow hedges. The objective of these contracts is to minimize impacts to cash flows and profitability due to changes in prices of commodities used in production.
88
TE CONNECTIVITY LTD.
NOTES TO CONSOLIDATED FINANCIAL STATEMENTS (Continued)
13. Financial Instruments and Fair Value Measurements (Continued)
At fiscal year end 2018 and 2017, our commodity hedges had notional values of $401 million and $314 million, respectively. We expect that significantly all of the balance in accumulated other comprehensive income (loss) associated with the commodity hedges will be reclassified into the Consolidated Statement of Operations within the next twelve months.
Fair Value Measurements
Financial instruments recorded at fair value on a recurring basis, which consist of derivative instruments and marketable securities, were immaterial at fiscal year end 2018 and 2017.
14. Retirement Plans
Defined Benefit Pension Plans
We have a number of contributory and noncontributory defined benefit retirement plans covering certain of our non-U.S. and U.S. employees, designed in accordance with local customs and practice.
The net periodic pension benefit cost for all non-U.S. and U.S. defined benefit pension plans was as follows:
|
|
Non-U.S. Plans | U.S. Plans | |||||||||||||||||
|---|---|---|---|---|---|---|---|---|---|---|---|---|---|---|---|---|---|---|---|
|
|
Fiscal | Fiscal | |||||||||||||||||
|
|
2018 | 2017 | 2016 | 2018 | 2017 | 2016 | |||||||||||||
|
|
($ in millions)
|
||||||||||||||||||
|
Service cost |
$ | 46 | $ | 50 | $ | 48 | $ | 14 | $ | 12 | $ | 9 | |||||||
|
Interest cost |
42 | 35 | 52 | 43 | 43 | 50 | |||||||||||||
|
Expected return on plan assets |
(69 | ) | (68 | ) | (68 | ) | (59 | ) | (53 | ) | (59 | ) | |||||||
|
Amortization of net actuarial loss |
24 | 41 | 36 | 22 | 40 | 40 | |||||||||||||
|
Other |
(6 | ) | (4 | ) | (6 | ) | — | — | — | ||||||||||
| | | | | | | | | | | | | | | | | | | | |
|
Net periodic pension benefit cost |
$ | 37 | $ | 54 | $ | 62 | $ | 20 | $ | 42 | $ | 40 | |||||||
| | | | | | | | | | | | | | | | | | | | |
| | | | | | | | | | | | | | | | | | | | |
| | | | | | | | | | | | | | | | | | | | |
|
Weighted-average assumptions used to determine net pension benefit cost during the fiscal year: |
|||||||||||||||||||
|
Discount rate |
1.87 | % | 1.44 | % | 2.50 | % | 3.77 | % | 3.58 | % | 4.38 | % | |||||||
|
Expected return on plan assets |
4.92 | % | 5.21 | % | 5.98 | % | 6.45 | % | 5.93 | % | 6.97 | % | |||||||
|
Rate of compensation increase |
2.53 | % | 2.52 | % | 2.81 | % | — | % | — | % | — | % | |||||||
The components of net periodic pension benefit cost other than service cost are included in net other income (expense) on the Consolidated Statements of Operations.
89
TE CONNECTIVITY LTD.
NOTES TO CONSOLIDATED FINANCIAL STATEMENTS (Continued)
14. Retirement Plans (Continued)
The following table represents the changes in benefit obligation and plan assets and the net amount recognized on the Consolidated Balance Sheets for all non-U.S. and U.S. defined benefit pension plans:
|
|
Non-U.S. Plans | U.S. Plans | |||||||||||
|---|---|---|---|---|---|---|---|---|---|---|---|---|---|
|
|
Fiscal | Fiscal | |||||||||||
|
|
2018 | 2017 | 2018 | 2017 | |||||||||
|
|
($ in millions)
|
||||||||||||
|
Change in benefit obligation: |
|||||||||||||
|
Benefit obligation at beginning of fiscal year |
$ | 2,292 | $ | 2,535 | $ | 1,191 | $ | 1,250 | |||||
|
Service cost |
46 | 50 | 14 | 12 | |||||||||
|
Interest cost |
42 | 35 | 43 | 43 | |||||||||
|
Actuarial gain |
(22 | ) | (301 | ) | (69 | ) | (34 | ) | |||||
|
Benefits and administrative expenses paid |
(77 | ) | (69 | ) | (86 | ) | (82 | ) | |||||
|
Currency translation |
(43 | ) | 29 | — | — | ||||||||
|
Other |
(18 | ) | 13 | — | 2 | ||||||||
| | | | | | | | | | | | | | |
|
Benefit obligation at end of fiscal year |
2,220 | 2,292 | 1,093 | 1,191 | |||||||||
| | | | | | | | | | | | | | |
|
Change in plan assets: |
|||||||||||||
|
Fair value of plan assets at beginning of fiscal year |
1,402 | 1,371 | 963 | 929 | |||||||||
|
Actual return on plan assets |
51 | 49 | 37 | 115 | |||||||||
|
Employer contributions |
51 | 47 | 3 | 1 | |||||||||
|
Benefits and administrative expenses paid |
(77 | ) | (69 | ) | (86 | ) | (82 | ) | |||||
|
Currency translation |
(30 | ) | (2 | ) | — | — | |||||||
|
Other |
(7 | ) | 6 | — | — | ||||||||
| | | | | | | | | | | | | | |
|
Fair value of plan assets at end of fiscal year |
1,390 | 1,402 | 917 | 963 | |||||||||
| | | | | | | | | | | | | | |
|
Funded status |
$ | (830 | ) | $ | (890 | ) | $ | (176 | ) | $ | (228 | ) | |
| | | | | | | | | | | | | | |
| | | | | | | | | | | | | | |
| | | | | | | | | | | | | | |
|
Amounts recognized on the Consolidated Balance Sheets: |
|||||||||||||
|
Other assets |
$ | 107 | $ | 50 | $ | — | $ | — | |||||
|
Accrued and other current liabilities |
(23 | ) | (22 | ) | (5 | ) | (5 | ) | |||||
|
Long-term pension and postretirement liabilities |
(914 | ) | (918 | ) | (171 | ) | (223 | ) | |||||
| | | | | | | | | | | | | | |
|
Net amount recognized |
$ | (830 | ) | $ | (890 | ) | $ | (176 | ) | $ | (228 | ) | |
| | | | | | | | | | | | | | |
| | | | | | | | | | | | | | |
| | | | | | | | | | | | | | |
|
Weighted-average assumptions used to determine pension benefit obligation at fiscal year end: |
|||||||||||||
|
Discount rate |
1.94 | % | 1.87 | % | 4.35 | % | 3.77 | % | |||||
|
Rate of compensation increase |
2.57 | % | 2.53 | % | — | % | — | % | |||||
90
TE CONNECTIVITY LTD.
NOTES TO CONSOLIDATED FINANCIAL STATEMENTS (Continued)
14. Retirement Plans (Continued)
The pre-tax amounts recognized in accumulated other comprehensive income (loss) for all non-U.S. and U.S. defined benefit pension plans were as follows:
|
|
Non-U.S. Plans | U.S. Plans | |||||||||||
|---|---|---|---|---|---|---|---|---|---|---|---|---|---|
|
|
Fiscal | Fiscal | |||||||||||
|
|
2018 | 2017 | 2018 | 2017 | |||||||||
|
|
(in millions)
|
||||||||||||
|
Change in net loss: |
|||||||||||||
|
Unrecognized net loss at beginning of fiscal year |
$ | 513 | $ | 839 | $ | 292 | $ | 428 | |||||
|
Current year change recorded in accumulated other comprehensive income (loss) |
(13 | ) | (285 | ) | (46 | ) | (96 | ) | |||||
|
Amortization reclassified to earnings |
(24 | ) | (41 | ) | (22 | ) | (40 | ) | |||||
| | | | | | | | | | | | | | |
|
Unrecognized net loss at end of fiscal year |
$ | 476 | $ | 513 | $ | 224 | $ | 292 | |||||
| | | | | | | | | | | | | | |
| | | | | | | | | | | | | | |
| | | | | | | | | | | | | | |
|
Change in prior service credit: |
|||||||||||||
|
Unrecognized prior service credit at beginning of fiscal year |
$ | (59 | ) | $ | (70 | ) | $ | 2 | $ | — | |||
|
Current year change recorded in accumulated other comprehensive income (loss) |
(5 | ) | 5 | — | 2 | ||||||||
|
Amortization reclassified to earnings (1) |
6 | 6 | — | — | |||||||||
| | | | | | | | | | | | | | |
|
Unrecognized prior service credit at end of fiscal year |
$ | (58 | ) | $ | (59 | ) | $ | 2 | $ | 2 | |||
| | | | | | | | | | | | | | |
| | | | | | | | | | | | | | |
| | | | | | | | | | | | | | |
- (1)
- Amortization of prior service credit is included in other in the above table summarizing the components of net periodic pension benefit cost.
In fiscal 2018 and 2017, unrecognized actuarial gains recorded in accumulated other comprehensive income (loss) were primarily the result of higher discount rates and favorable asset performance for both non-U.S. and U.S. defined benefit pension plans as compared to fiscal 2017 and 2016, respectively.
The estimated amortization of actuarial losses from accumulated other comprehensive income (loss) into net periodic pension benefit cost for non-U.S. and U.S. defined benefit pension plans in fiscal 2019 is expected to be $24 million and $17 million, respectively. The estimated amortization of prior service credit from accumulated other comprehensive income (loss) into net periodic pension benefit cost for non-U.S. defined benefit pension plans in fiscal 2019 is expected to be $7 million.
In determining the expected return on plan assets, we consider the relative weighting of plan assets by class and individual asset class performance expectations.
The investment strategies for non-U.S. and U.S. pension plans are governed locally. Our investment strategy for our pension plans is to manage the plans on a going concern basis. Current investment policy is to achieve a reasonable return on assets, subject to a prudent level of portfolio risk, for the purpose of enhancing the security of benefits for participants. Projected returns are based primarily on pro forma asset allocation, expected long-term returns, and forward-looking estimates of active portfolio and investment management.
At fiscal year end 2018, the long-term target asset allocation in our U.S. plans' master trust is 10% return-seeking assets and 90% liability-hedging assets. Return-seeking assets, including non-U.S. and U.S. equity securities, are assets intended to generate returns in excess of pension liability growth.
91
TE CONNECTIVITY LTD.
NOTES TO CONSOLIDATED FINANCIAL STATEMENTS (Continued)
14. Retirement Plans (Continued)
Liability-hedging assets, including government and corporate bonds, are assets intended to have characteristics similar to pension liabilities and are used to better match asset cash flows with expected obligation cash flows. Asset re-allocation to meet that target is occurring over a multi-year period based on the funded status. We expect to reach our target allocation when the funded status of the plans exceeds 105%. Based on the funded status of the plans as of fiscal year end 2018, our target asset allocation is 45% return-seeking and 55% liability-hedging.
Target weighted-average asset allocation and weighted-average asset allocation for non-U.S. and U.S. pension plans were as follows:
|
|
Non-U.S. Plans | U.S. Plans | |||||||||||||||||
|---|---|---|---|---|---|---|---|---|---|---|---|---|---|---|---|---|---|---|---|
|
|
Target |
Fiscal
Year End 2018 |
Fiscal
Year End 2017 |
Target |
Fiscal
Year End 2018 |
Fiscal
Year End 2017 |
|||||||||||||
|
Asset category: |
|||||||||||||||||||
|
Equity securities |
27 | % | 29 | % | 30 | % | 45 | % | 53 | % | 50 | % | |||||||
|
Fixed income |
51 | 49 | 49 | 55 | 47 | 50 | |||||||||||||
|
Insurance contracts and other investments |
20 | 20 | 19 | — | — | — | |||||||||||||
|
Real estate investments |
2 | 2 | 2 | — | — | — | |||||||||||||
| | | | | | | | | | | | | | | | | | | | |
|
Total |
100 | % | 100 | % | 100 | % | 100 | % | 100 | % | 100 | % | |||||||
| | | | | | | | | | | | | | | | | | | | |
| | | | | | | | | | | | | | | | | | | | |
| | | | | | | | | | | | | | | | | | | | |
Our common shares are not a direct investment of our pension funds; however, the pension funds may indirectly include our shares. The aggregate amount of our common shares would not be considered material relative to the total pension fund assets.
Our funding policy is to make contributions in accordance with the laws and customs of the various countries in which we operate as well as to make discretionary voluntary contributions from time to time. We expect to make the minimum required contributions of $42 million and $5 million to our non-U.S. and U.S. pension plans, respectively, in fiscal 2019. We may also make voluntary contributions at our discretion.
At fiscal year end 2018, benefit payments, which reflect future expected service, as appropriate, are expected to be paid as follows:
|
|
Non-U.S. Plans | U.S. Plans | |||||
|---|---|---|---|---|---|---|---|
|
|
(in millions)
|
||||||
|
Fiscal 2019 |
$ | 74 | $ | 76 | |||
|
Fiscal 2020 |
78 | 73 | |||||
|
Fiscal 2021 |
82 | 73 | |||||
|
Fiscal 2022 |
83 | 74 | |||||
|
Fiscal 2023 |
88 | 74 | |||||
|
Fiscal 2024–2028 |
487 | 368 | |||||
92
TE CONNECTIVITY LTD.
NOTES TO CONSOLIDATED FINANCIAL STATEMENTS (Continued)
14. Retirement Plans (Continued)
Presented below is the accumulated benefit obligation for all non-U.S. and U.S. pension plans as well as additional information related to plans with an accumulated benefit obligation in excess of plan assets and plans with a projected benefit obligation in excess of plan assets.
|
|
Non-U.S. Plans | U.S. Plans | |||||||||||
|---|---|---|---|---|---|---|---|---|---|---|---|---|---|
|
|
Fiscal Year End | Fiscal Year End | |||||||||||
|
|
2018 | 2017 | 2018 | 2017 | |||||||||
|
|
(in millions)
|
||||||||||||
|
Accumulated benefit obligation |
$ | 2,099 | $ | 2,167 | $ | 1,093 | $ | 1,191 | |||||
|
Pension plans with accumulated benefit obligations in excess of plan assets: |
|||||||||||||
|
Accumulated benefit obligation |
1,400 | 1,402 | 1,093 | 1,191 | |||||||||
|
Fair value of plan assets |
580 | 581 | 917 | 963 | |||||||||
|
Pension plans with projected benefit obligations in excess of plan assets: |
|||||||||||||
|
Projected benefit obligation |
1,560 | 1,524 | 1,093 | 1,191 | |||||||||
|
Fair value of plan assets |
623 | 583 | 917 | 963 | |||||||||
We value our pension assets based on the fair value hierarchy of ASC 820, Fair Value Measurements and Disclosures . Details of the fair value hierarchy are described in Note 2. The following table presents our defined benefit pension plans' asset categories and their associated fair value within the fair value hierarchy:
|
|
Fiscal Year End 2018 | ||||||||||||||||||||||||
|---|---|---|---|---|---|---|---|---|---|---|---|---|---|---|---|---|---|---|---|---|---|---|---|---|---|
|
|
Non-U.S. Plans | U.S. Plans | |||||||||||||||||||||||
|
|
Level 1 | Level 2 | Level 3 | Total | Level 1 | Level 2 | Level 3 | Total | |||||||||||||||||
|
|
(in millions)
|
||||||||||||||||||||||||
|
Equity: |
|||||||||||||||||||||||||
|
Non-U.S. equity securities (1) |
$ | — | $ | — | $ | — | $ | — | $ | 220 | $ | — | $ | — | $ | 220 | |||||||||
|
U.S. equity securities (1) |
— | — | — | — | 265 | — | — | 265 | |||||||||||||||||
|
Commingled equity funds (2) |
— | 397 | — | 397 | — | — | — | — | |||||||||||||||||
|
Fixed income: |
|||||||||||||||||||||||||
|
Government bonds (3) |
— | 213 | — | 213 | — | 45 | — | 45 | |||||||||||||||||
|
Corporate bonds (4) |
— | 6 | — | 6 | — | 283 | — | 283 | |||||||||||||||||
|
Commingled bond funds (5) |
— | 464 | — | 464 | — | 87 | — | 87 | |||||||||||||||||
|
Other (6) |
— | 184 | 120 | 304 | — | 11 | — | 11 | |||||||||||||||||
| | | | | | | | | | | | | | | | | | | | | | | | | | |
|
Subtotal |
$ | — | $ | 1,264 | $ | 120 | 1,384 | $ | 485 | $ | 426 | $ | — | 911 | |||||||||||
| | | | | | | | | | | | | | | | | | | | | | | | | | |
| | | | | | | | | | | | | | | | | | | | | | | | | | |
| | | | | | | | | | | | | | | | | | | | | | | | | | |
|
Items to reconcile to fair value of plan assets (7) |
6 | 6 | |||||||||||||||||||||||
| | | | | | | | | | | | | | | | | | | | | | | | | | |
|
Fair value of plan assets |
$ | 1,390 | $ | 917 | |||||||||||||||||||||
| | | | | | | | | | | | | | | | | | | | | | | | | | |
| | | | | | | | | | | | | | | | | | | | | | | | | | |
| | | | | | | | | | | | | | | | | | | | | | | | | | |
93
TE CONNECTIVITY LTD.
NOTES TO CONSOLIDATED FINANCIAL STATEMENTS (Continued)
14. Retirement Plans (Continued)
|
|
Fiscal Year End 2017 | ||||||||||||||||||||||||
|---|---|---|---|---|---|---|---|---|---|---|---|---|---|---|---|---|---|---|---|---|---|---|---|---|---|
|
|
Non-U.S. Plans | U.S. Plans | |||||||||||||||||||||||
|
|
Level 1 | Level 2 | Level 3 | Total | Level 1 | Level 2 | Level 3 | Total | |||||||||||||||||
|
|
(in millions)
|
||||||||||||||||||||||||
|
Equity: |
|||||||||||||||||||||||||
|
Non-U.S. equity securities (1) |
$ | — | $ | — | $ | — | $ | — | $ | 227 | $ | — | $ | — | $ | 227 | |||||||||
|
U.S. equity securities (1) |
— | — | — | — | 250 | — | — | 250 | |||||||||||||||||
|
Commingled equity funds (2) |
— | 418 | — | 418 | — | — | — | — | |||||||||||||||||
|
Fixed income: |
|||||||||||||||||||||||||
|
Government bonds (3) |
— | 219 | — | 219 | — | 59 | — | 59 | |||||||||||||||||
|
Corporate bonds (4) |
— | 8 | — | 8 | — | 351 | — | 351 | |||||||||||||||||
|
Commingled bond funds (5) |
— | 455 | — | 455 | — | 48 | — | 48 | |||||||||||||||||
|
Other (6) |
— | 180 | 117 | 297 | — | 16 | — | 16 | |||||||||||||||||
| | | | | | | | | | | | | | | | | | | | | | | | | | |
|
Subtotal |
$ | — | $ | 1,280 | $ | 117 | 1,397 | $ | 477 | $ | 474 | $ | — | 951 | |||||||||||
| | | | | | | | | | | | | | | | | | | | | | | | | | |
| | | | | | | | | | | | | | | | | | | | | | | | | | |
| | | | | | | | | | | | | | | | | | | | | | | | | | |
|
Items to reconcile to fair value of plan assets (7) |
5 | 12 | |||||||||||||||||||||||
| | | | | | | | | | | | | | | | | | | | | | | | | | |
|
Fair value of plan assets |
$ | 1,402 | $ | 963 | |||||||||||||||||||||
| | | | | | | | | | | | | | | | | | | | | | | | | | |
| | | | | | | | | | | | | | | | | | | | | | | | | | |
| | | | | | | | | | | | | | | | | | | | | | | | | | |
- (1)
-
Non-U.S.
and U.S. equity securities are valued at the closing price reported on the stock exchange on which the individual securities are traded.
- (2)
-
Commingled
equity funds are pooled investments in multiple equity-type securities. Fair value is calculated as the closing price of the underlying investments, an
observable market condition, divided by the number of shares of the fund outstanding.
- (3)
-
Government
bonds are marked to fair value based on quoted market prices or market approach valuation models using observable market data such as quotes, spreads, and
data points for yield curves.
- (4)
-
Corporate
bonds are marked to fair value based on quoted market prices or market approach valuation models using observable market data such as quotes, spreads, and
data points for yield curves.
- (5)
-
Commingled
bond funds are pooled investments in multiple debt-type securities. Fair value is calculated as the closing price of the underlying investments, an
observable market condition, divided by the number of shares of the fund outstanding.
- (6)
-
Other
investments are composed of insurance contracts, derivatives, short-term investments, structured products such as collateralized obligations and mortgage- and
asset-backed securities, real estate investments, and hedge funds. Insurance contracts are valued using cash surrender value, or face value of the contract if a cash surrender value is unavailable
(level 2), as these values represent the amount that the plan would receive on termination of the underlying contract. Derivatives, short-term investments, and structured products are marked to
fair value using models that are supported by observable market based data (level 2). Real estate investments include investments in commingled real estate funds and are valued at net asset
value which is calculated using unobservable inputs that are supported by little or no market activity (level 3). Hedge funds are valued at their net asset value which is calculated using
unobservable inputs that are supported by little or no market activity (level 3).
- (7)
- Items to reconcile to fair value of plan assets include amounts receivable for securities sold, amounts payable for securities purchased, and any cash balances, considered to be carried at book value, that are held in the plans.
94
TE CONNECTIVITY LTD.
NOTES TO CONSOLIDATED FINANCIAL STATEMENTS (Continued)
14. Retirement Plans (Continued)
Changes in Level 3 assets in non-U.S. plans were primarily the result of purchases in fiscal 2018 and 2017.
Defined Contribution Retirement Plans
We maintain several defined contribution retirement plans, the most significant of which is located in the U.S. These plans include 401(k) matching programs, as well as qualified and nonqualified profit sharing and share bonus retirement plans. Expense for the defined contribution plans is computed as a percentage of participants' compensation and was $62 million, $60 million, and $52 million for fiscal 2018, 2017, and 2016, respectively.
Deferred Compensation Plans
We maintain nonqualified deferred compensation plans, which permit eligible employees to defer a portion of their compensation. A record keeping account is set up for each participant and the participant chooses from a variety of measurement funds for the deemed investment of their accounts. The measurement funds correspond to a number of funds in our 401(k) plans and the account balance fluctuates with the investment returns on those funds. At fiscal year end 2018 and 2017, total deferred compensation liabilities were $189 million and $157 million, respectively, and were recorded primarily in other liabilities on the Consolidated Balance Sheets. See Note 13 for additional information regarding our risk management strategy related to deferred compensation liabilities.
Postretirement Benefit Plans
In addition to providing pension and 401(k) benefits, we also provide certain health care coverage continuation for qualifying retirees from the date of retirement to age 65. The accumulated postretirement benefit obligation was $18 million and $19 million at fiscal year end 2018 and 2017, respectively, and the underfunded status of the postretirement benefit plans was included primarily in long-term pension and postretirement liabilities on the Consolidated Balance Sheets. Activity during fiscal 2018, 2017, and 2016 was not significant.
95
TE CONNECTIVITY LTD.
NOTES TO CONSOLIDATED FINANCIAL STATEMENTS (Continued)
15. Income Taxes
Significant components of the income tax expense (benefit) were as follows:
|
|
Fiscal | |||||||||
|---|---|---|---|---|---|---|---|---|---|---|
|
|
2018 | 2017 | 2016 | |||||||
|
|
(in millions)
|
|||||||||
|
Current income tax expense (benefit): |
||||||||||
|
U.S.: |
||||||||||
|
Federal |
$ | 20 | $ | (9 | ) | $ | (1,120 | ) | ||
|
State |
21 | 9 | (163 | ) | ||||||
|
Non-U.S. |
406 | 322 | 321 | |||||||
| | | | | | | | | | | |
|
|
447 | 322 | (962 | ) | ||||||
| | | | | | | | | | | |
|
Deferred income tax expense (benefit): |
||||||||||
|
U.S.: |
||||||||||
|
Federal |
499 | (119 | ) | 133 | ||||||
|
State |
(30 | ) | (15 | ) | 18 | |||||
|
Non-U.S. |
(1,260 | ) | (8 | ) | (15 | ) | ||||
| | | | | | | | | | | |
|
|
(791 | ) | (142 | ) | 136 | |||||
| | | | | | | | | | | |
|
Income tax expense (benefit) |
$ | (344 | ) | $ | 180 | $ | (826 | ) | ||
| | | | | | | | | | | |
| | | | | | | | | | | |
| | | | | | | | | | | |
The U.S. and non-U.S. components of income from continuing operations before income taxes were as follows:
|
|
Fiscal | |||||||||
|---|---|---|---|---|---|---|---|---|---|---|
|
|
2018 | 2017 | 2016 | |||||||
|
|
(in millions)
|
|||||||||
|
U.S. |
$ | (245 | ) | $ | (273 | ) | $ | (244 | ) | |
|
Non-U.S. |
2,485 | 1,993 | 1,265 | |||||||
| | | | | | | | | | | |
|
Income from continuing operations before income taxes |
$ | 2,240 | $ | 1,720 | $ | 1,021 | ||||
| | | | | | | | | | | |
| | | | | | | | | | | |
| | | | | | | | | | | |
96
TE CONNECTIVITY LTD.
NOTES TO CONSOLIDATED FINANCIAL STATEMENTS (Continued)
15. Income Taxes (Continued)
The reconciliation between U.S. federal income taxes at the statutory rate and income tax expense (benefit) was as follows:
|
|
Fiscal | |||||||||
|---|---|---|---|---|---|---|---|---|---|---|
|
|
2018 | 2017 | 2016 | |||||||
|
|
(in millions)
|
|||||||||
|
Notional U.S. federal income tax expense at the statutory rate (1) |
$ | 551 | $ | 602 | $ | 357 | ||||
|
Adjustments to reconcile to the income tax expense (benefit): |
||||||||||
|
U.S. state income tax benefit, net |
(7 | ) | (4 | ) | (94 | ) | ||||
|
Other expense—Tax Sharing Agreement (2) |
— | 3 | 221 | |||||||
|
Tax law changes |
638 | 7 | (3 | ) | ||||||
|
Tax credits |
(8 | ) | (8 | ) | (10 | ) | ||||
|
Non-U.S. net earnings (3) |
(213 | ) | (355 | ) | (341 | ) | ||||
|
Change in accrued income tax liabilities |
13 | 24 | (1,056 | ) | ||||||
|
Valuation allowance |
33 | (1 | ) | 97 | ||||||
|
Legal entity restructuring and intercompany transactions |
(1,329 | ) | (40 | ) | 39 | |||||
|
Divestitures |
(1 | ) | — | (31 | ) | |||||
|
Excess tax benefits from share-based payments |
(24 | ) | (40 | ) | — | |||||
|
Other |
3 | (8 | ) | (5 | ) | |||||
| | | | | | | | | | | |
|
Income tax expense (benefit) |
$ | (344 | ) | $ | 180 | $ | (826 | ) | ||
| | | | | | | | | | | |
| | | | | | | | | | | |
| | | | | | | | | | | |
- (1)
-
The
U.S. federal statutory rate was 24.58% for fiscal 2018 and 35% for both fiscal 2017 and 2016.
- (2)
-
Net
other expense pursuant to the Tax Sharing Agreement with Tyco International plc and Covidien plc is not taxable or deductible.
- (3)
- Excludes items which are separately presented.
The income tax benefit for fiscal 2018 included a $1,222 million net income tax benefit associated with the tax impacts of certain legal entity restructurings and intercompany transactions that occurred in the quarter ended September 28, 2018. The net income tax benefit of $1,222 million related primarily to the recognition of certain non-U.S. loss carryforwards and basis differences in subsidiaries expected to be utilized against future taxable income, partially offset by a $46 million increase in the valuation allowance for certain U.S. federal tax credit carryforwards. The income tax benefit for fiscal 2018 also included $567 million of income tax expense related to the tax impacts of the Tax Cuts and Jobs Act (the "Act") and a $61 million net income tax benefit related to the tax impacts of certain legal entity restructurings that occurred in the quarter ended December 29, 2017. See "Tax Cuts and Jobs Act" below for additional information regarding the Act.
The income tax expense for fiscal 2017 included a $52 million income tax benefit associated with the tax impacts of certain intercompany transactions and the corresponding reduction in the valuation allowance for U.S. tax loss carryforwards, a $40 million income tax benefit related to share-based payments and the adoption of ASU No. 2016-09, and a $14 million income tax benefit associated with
97
TE CONNECTIVITY LTD.
NOTES TO CONSOLIDATED FINANCIAL STATEMENTS (Continued)
15. Income Taxes (Continued)
pre-separation tax matters. See Note 2 for additional information regarding recently adopted accounting pronouncements.
The income tax benefit for fiscal 2016 included a $1,135 million income tax benefit related to the effective settlement of tax matters for the years 1997 through 2000, partially offset by a $91 million income tax charge related to an increase to the valuation allowance for certain U.S. deferred tax assets. Additionally, the tax benefit for fiscal 2016 included an $83 million net income tax benefit related to tax settlements in certain other tax jurisdictions, partially offset by an income tax charge related to certain legal entity restructurings. See "Internal Revenue Service Audits" below for additional information regarding settlements with the Internal Revenue Service ("IRS").
In fiscal 2016, the increase to the valuation allowance for deferred tax assets related primarily to certain U.S. federal and state tax loss and credit carryforwards. Based on our forecast of taxable income for certain U.S. tax reporting groups, U.S. tax loss and credit carryforwards finalized as a result of settlement of the disputed debt matter with the IRS, and certain tax planning actions and strategies, we believed it was more likely than not that a portion of our deferred tax assets would not be realized.
Deferred Tax Assets and Liabilities
Deferred income taxes result from temporary differences between the amount of assets and liabilities recognized for financial reporting and tax purposes. The components of the net deferred income tax asset were as follows:
|
|
Fiscal Year End | ||||||
|---|---|---|---|---|---|---|---|
|
|
2018 | 2017 | |||||
|
|
(in millions)
|
||||||
|
Deferred tax assets: |
|||||||
|
Accrued liabilities and reserves |
$ | 255 | $ | 357 | |||
|
Tax loss and credit carryforwards |
3,237 | 5,264 | |||||
|
Inventories |
58 | 48 | |||||
|
Pension and postretirement benefits |
179 | 231 | |||||
|
Deferred revenue |
5 | 8 | |||||
|
Interest |
30 | 366 | |||||
|
Unrecognized income tax benefits |
8 | 10 | |||||
|
Basis difference in subsidiaries |
946 | — | |||||
|
Other |
13 | 22 | |||||
| | | | | | | | |
|
|
4,731 | 6,306 | |||||
| | | | | | | | |
|
Deferred tax liabilities: |
|||||||
|
Intangible assets |
(552 | ) | (653 | ) | |||
|
Property, plant, and equipment |
(13 | ) | (22 | ) | |||
|
Other |
(38 | ) | (99 | ) | |||
| | | | | | | | |
|
|
(603 | ) | (774 | ) | |||
| | | | | | | | |
|
Net deferred tax asset before valuation allowance |
4,128 | 5,532 | |||||
|
Valuation allowance |
(2,191 | ) | (3,627 | ) | |||
| | | | | | | | |
|
Net deferred tax asset |
$ | 1,937 | $ | 1,905 | |||
| | | | | | | | |
| | | | | | | | |
| | | | | | | | |
98
TE CONNECTIVITY LTD.
NOTES TO CONSOLIDATED FINANCIAL STATEMENTS (Continued)
15. Income Taxes (Continued)
Our tax loss and credit carryforwards (tax effected) at fiscal year end 2018 were as follows:
|
|
Expiration Period |
|
|||||||||||
|---|---|---|---|---|---|---|---|---|---|---|---|---|---|
|
|
Through
Fiscal 2023 |
Fiscal 2024
Through Fiscal 2038 |
No
Expiration |
Total | |||||||||
|
|
(in millions)
|
||||||||||||
|
U.S. Federal: |
|||||||||||||
|
Net operating loss carryforwards |
$ | 119 | $ | 385 | $ | — | $ | 504 | |||||
|
Tax credit carryforwards |
32 | 115 | 52 | 199 | |||||||||
|
U.S. State: |
|||||||||||||
|
Net operating loss carryforwards |
45 | 52 | — | 97 | |||||||||
|
Tax credit carryforwards |
9 | 16 | 8 | 33 | |||||||||
|
Non-U.S.: |
|||||||||||||
|
Net operating loss carryforwards |
12 | 863 | 1,496 | 2,371 | |||||||||
|
Tax credit carryforwards |
— | 1 | 1 | 2 | |||||||||
|
Capital loss carryforwards |
— | 3 | 28 | 31 | |||||||||
| | | | | | | | | | | | | | |
|
Total tax loss and credit carryforwards |
$ | 217 | $ | 1,435 | $ | 1,585 | $ | 3,237 | |||||
| | | | | | | | | | | | | | |
| | | | | | | | | | | | | | |
| | | | | | | | | | | | | | |
The valuation allowance for deferred tax assets of $2,191 million and $3,627 million at fiscal year end 2018 and 2017, respectively, related principally to the uncertainty of the utilization of certain deferred tax assets, primarily tax loss, capital loss, and credit carryforwards in various jurisdictions. During fiscal 2018, tax loss and credit carryforwards decreased primarily as a result of a $1,675 million (tax effected) recovery of prior years' net write-downs of investments in subsidiaries in certain jurisdictions, offset by a corresponding decrease to the valuation allowance. We believe that we will generate sufficient future taxable income to realize the income tax benefits related to the remaining net deferred tax assets on the Consolidated Balance Sheet.
We have provided income taxes for earnings that are currently distributed as well as the taxes associated with several subsidiaries' earnings that are expected to be distributed in the future. No additional provision has been made for Swiss or non-Swiss income taxes on the undistributed earnings of subsidiaries or for unrecognized deferred tax liabilities for temporary differences related to basis differences in investments in subsidiaries, as such earnings are expected to be permanently reinvested, the investments are essentially permanent in duration, or we have concluded that no additional tax liability will arise as a result of the distribution of such earnings. As of fiscal year end 2018, certain subsidiaries had approximately $23 billion of cumulative undistributed earnings that have been retained indefinitely and reinvested in our global manufacturing operations, including working capital; property, plant, and equipment; intangible assets; and research and development activities. A liability could arise if our intention to permanently reinvest such earnings were to change and amounts are distributed by such subsidiaries or if such subsidiaries are ultimately disposed. It is not practicable to estimate the additional income taxes related to permanently reinvested earnings or the basis differences related to investments in subsidiaries. As of fiscal year end 2018, we had approximately $11.6 billion of cash, cash equivalents, and intercompany deposits, principally in our subsidiaries, that we have the ability to distribute to TEGSA, our Luxembourg subsidiary, which is the obligor of substantially all of our debt, and to TE Connectivity Ltd., our Swiss parent company, but we consider to be permanently reinvested. We estimate that up to $0.9 billion of tax expense would be recognized on the Consolidated Financial
99
TE CONNECTIVITY LTD.
NOTES TO CONSOLIDATED FINANCIAL STATEMENTS (Continued)
15. Income Taxes (Continued)
Statements if our intention to permanently reinvest these amounts were to change. Our current plans do not demonstrate a need to repatriate cash, cash equivalents, and intercompany deposits that are designated as permanently reinvested in order to fund our operations, including investing and financing activities.
As of fiscal year end 2018, we had total unrecognized income tax benefits of $566 million. If recognized in future years, $467 million of these currently unrecognized income tax benefits would impact income tax expense (benefit) and the effective tax rate. As of fiscal year end 2017, we had total unrecognized income tax benefits of $501 million. If recognized in future years, $431 million of these currently unrecognized income tax benefits would impact income tax expense (benefit) and the effective tax rate. The following table summarizes the activity related to unrecognized income tax benefits:
|
|
Fiscal | |||||||||
|---|---|---|---|---|---|---|---|---|---|---|
|
|
2018 | 2017 | 2016 | |||||||
|
|
(in millions)
|
|||||||||
|
Balance at beginning of fiscal year |
$ | 501 | $ | 490 | $ | 1,368 | ||||
|
Additions related to prior years tax positions |
14 | 40 | 75 | |||||||
|
Reductions related to prior years tax positions |
(11 | ) | (9 | ) | (817 | ) | ||||
|
Additions related to current year tax positions |
105 | 70 | 124 | |||||||
|
Acquisitions |
— | — | 4 | |||||||
|
Settlements |
(7 | ) | (4 | ) | (205 | ) | ||||
|
Reductions due to lapse of applicable statute of limitations |
(36 | ) | (86 | ) | (59 | ) | ||||
| | | | | | | | | | | |
|
Balance at end of fiscal year |
$ | 566 | $ | 501 | $ | 490 | ||||
| | | | | | | | | | | |
| | | | | | | | | | | |
| | | | | | | | | | | |
We record accrued interest and penalties related to uncertain tax positions as part of income tax expense (benefit). As of fiscal year end 2018 and 2017, we had $60 million of accrued interest and penalties related to uncertain tax positions on the Consolidated Balance Sheets, recorded primarily in income taxes. During fiscal 2018, 2017, and 2016, we recognized income tax expense of $5 million, benefits of $5 million, and benefits of $765 million, respectively, related to interest and penalties on the Consolidated Statements of Operations.
We file income tax returns on a unitary, consolidated, or stand-alone basis in multiple state and local jurisdictions, which generally have statutes of limitations ranging from 3 to 4 years. Various state and local income tax returns are currently in the process of examination or administrative appeal.
Our non-U.S. subsidiaries file income tax returns in the countries in which they have operations. Generally, these countries have statutes of limitations ranging from 3 to 10 years. Various non-U.S. subsidiary income tax returns are currently in the process of examination by taxing authorities.
100
TE CONNECTIVITY LTD.
NOTES TO CONSOLIDATED FINANCIAL STATEMENTS (Continued)
15. Income Taxes (Continued)
As of fiscal year end 2018, under applicable statutes, the following tax years remained subject to examination in the major tax jurisdictions indicated:
|
Jurisdiction
|
Open Years | |||
|---|---|---|---|---|
|
China |
2008 through 2018 | |||
|
Czech Republic |
2015 through 2018 | |||
|
Germany |
2013 through 2018 | |||
|
Hong Kong |
2012 through 2018 | |||
|
Ireland |
2013 through 2018 | |||
|
Italy |
2013 through 2018 | |||
|
Japan |
2012 through 2018 | |||
|
Korea |
2012 through 2018 | |||
|
Luxembourg |
2013 through 2018 | |||
|
Netherlands |
2012 through 2018 | |||
|
Singapore |
2013 through 2018 | |||
|
Spain |
2014 through 2018 | |||
|
Switzerland |
2013 through 2018 | |||
|
United Kingdom |
2016 through 2018 | |||
|
U.S.—federal |
2015 through 2018 | |||
In most jurisdictions, taxing authorities retain the ability to review prior tax years and to adjust any net operating loss and tax credit carryforwards from these years that are utilized in a subsequent period.
Although it is difficult to predict the timing or results of our worldwide examinations, we estimate that approximately $130 million of unrecognized income tax benefits, excluding the impact relating to accrued interest and penalties, could be resolved within the next twelve months.
We are not aware of any other matters that would result in significant changes to the amount of unrecognized income tax benefits reflected on the Consolidated Balance Sheet as of fiscal year end 2018.
Tax Cuts and Jobs Act
On December 22, 2017, the President of the U.S. signed the Tax Cuts and Jobs Act (the "Act") into law. The Act includes numerous significant changes to existing tax law, including a permanent reduction in the U.S. federal corporate income tax rate from 35% to 21%, further limitations on the deductibility of interest expense and certain executive compensation, repeal of the corporate Alternative Minimum Tax, and imposition of a territorial tax system with a one-time repatriation tax on deemed repatriated earnings of foreign subsidiaries. While some of the new provisions of the Act will impact us in fiscal 2019 and beyond, the change in the tax rate was effective January 1, 2018. In the period of enactment, we were required to revalue our U.S. federal deferred tax assets and liabilities at the new tax rate. Accordingly, during fiscal 2018, we recorded income tax expense of $567 million primarily in connection with the write-down of our U.S. federal deferred tax asset for net operating loss and interest carryforwards to the lower tax rate. Included in the expense of $567 million was an income
101
TE CONNECTIVITY LTD.
NOTES TO CONSOLIDATED FINANCIAL STATEMENTS (Continued)
15. Income Taxes (Continued)
tax benefit of $34 million related to the reduction in the existing valuation allowance recorded against certain U.S. federal tax credit carryforwards. The limitations on interest expense deductions contained in the Act are expected to increase prospective taxable income and thereby allow the utilization of more tax credits in future years. As a Swiss corporation, the one-time repatriation tax imposed by the Act will not be significant to us.
The Act makes broad and complex changes to the U.S. Internal Revenue Code, and in certain instances, lacks clarity and is subject to interpretation until additional IRS guidance is issued. The ultimate impact of the Act may differ from our estimates due to changes in the interpretations and assumptions we made as well as any forthcoming regulatory guidance.
Intra-Entity Transfers of Assets
In fiscal 2018, there were certain sales of assets other than inventory between affiliated companies that are consolidated for financial statement purposes but file separate tax returns. In accordance with U.S. GAAP, the tax impact of these intra-entity transfers of assets was deferred and not recognized. Such transactions resulted in a $674 million increase to other assets and a $48 million increase to prepaid expenses and other current assets on the Consolidated Balance Sheet during fiscal 2018. See Note 2 for information regarding our adoption of ASU No. 2016-16 in fiscal 2019 and the net reversal of all balances associated with deferred tax impacts of intra-entity transfers of assets other than inventory.
Tax Sharing Agreement
Under a Tax Sharing Agreement entered into upon our separation from Tyco International plc ("Tyco International") in fiscal 2007, we, Tyco International, and Covidien plc ("Covidien") share 31%, 27%, and 42%, respectively, of income tax liabilities that arise from adjustments made by tax authorities to the collective income tax returns for periods prior to and including June 29, 2007. Pursuant to the Tax Sharing Agreement, we entered into certain guarantee commitments and indemnifications with Tyco International and Covidien. We have substantially settled all U.S. federal income tax matters with the IRS for periods covered under the Tax Sharing Agreement. Certain shared U.S. state and non-U.S. income tax matters remain open. We do not expect these matters will have a material effect on our results of operations, financial position, or cash flows. As a result of subsequent transactions, Tyco International plc ("Tyco International") and Covidien plc ("Covidien") now operate as part of Johnson Controls International plc and Medtronic plc, respectively.
Internal Revenue Service Audits
As previously disclosed, in fiscal 2013, the IRS effectively settled its audit of all tax matters for the years 1997 through 2000, excluding one issue involving the tax treatment of certain intercompany debt transactions. In fiscal 2016, the U.S. Tax Court resolved all aspects of the disputed debt matter for the 1997 to 2000 audit cycle and the Appeals Division of the IRS effectively settled the intercompany debt issues on appeal for subsequent audit cycles (years 2001 to 2007). In connection with these developments, in fiscal 2016, we recognized an income tax benefit of $1,135 million, representing a reduction in tax reserves, and other expense of $604 million, representing a reduction of associated indemnification receivables, pursuant to the Tax Sharing Agreement with Tyco International and Covidien.
102
TE CONNECTIVITY LTD.
NOTES TO CONSOLIDATED FINANCIAL STATEMENTS (Continued)
15. Income Taxes (Continued)
During fiscal 2016, in connection with the disputed debt matter, we made a payment to the IRS of $443 million for tax deficiencies for which we were the primary obligor. Concurrent with remitting this payment, we received net reimbursements of $303 million from Tyco International and Covidien pursuant to their indemnifications for pre-separation tax matters.
16. Other Income (Expense), Net
In fiscal 2018, 2017, and 2016, we recorded net other income of $1 million, net other expense of $42 million, and net other expense of $677 million, respectively. In fiscal 2016, net other expense was primarily pursuant to the Tax Sharing Agreement with Tyco International and Covidien and included $604 million related to the effective settlement of tax matters for the years 1997 through 2000 and $46 million related to a tax settlement in another tax jurisdiction. See Note 15 for further information regarding the Tax Sharing Agreement and settlements.
17. Earnings Per Share
The weighted-average number of shares outstanding used in the computations of basic and diluted earnings per share were as follows:
|
|
Fiscal | |||||||||
|---|---|---|---|---|---|---|---|---|---|---|
|
|
2018 | 2017 | 2016 | |||||||
|
|
(in millions)
|
|||||||||
|
Basic |
350 | 355 | 366 | |||||||
|
Dilutive impact of share-based compensation arrangements |
3 | 3 | 3 | |||||||
| | | | | | | | | | | |
|
Diluted |
353 | 358 | 369 | |||||||
| | | | | | | | | | | |
| | | | | | | | | | | |
| | | | | | | | | | | |
There were one million, one million, and three million share options that were not included in the computation of diluted earnings per share for fiscal 2018, 2017, and 2016, respectively, because the instruments' underlying exercise prices were greater than the average market prices of our common shares and inclusion would be antidilutive.
18. Shareholders' Equity
Common Shares
We are organized under the laws of Switzerland. The rights of holders of our shares are governed by Swiss law, our Swiss articles of association, and our Swiss organizational regulations. Accordingly, the par value of our common shares is stated in Swiss francs ("CHF"). We continue to use the U.S. dollar, however, as our reporting currency on the Consolidated Financial Statements.
Subject to certain conditions specified in our articles of association, we are authorized to increase our conditional share capital by issuing new shares in aggregate not exceeding 50% of our authorized shares. In March 2018, our shareholders reapproved and extended through March 14, 2020, our board of directors' authorization to issue additional new shares, subject to certain conditions specified in the articles of association, in aggregate not exceeding 50% of the amount of our authorized shares.
103
TE CONNECTIVITY LTD.
NOTES TO CONSOLIDATED FINANCIAL STATEMENTS (Continued)
18. Shareholders' Equity (Continued)
Common Shares Held in Treasury
At fiscal year end 2018, approximately 12 million common shares were held in treasury, of which 6 million were owned by one of our subsidiaries. At fiscal year end 2017, approximately 5 million common shares were held in treasury and owned by one of our subsidiaries. Shares held both directly by us and by our subsidiary are presented as treasury shares on the Consolidated Balance Sheets.
In fiscal 2017 and 2016, our shareholders approved the cancellation of 26 million and 31 million shares, respectively, purchased under our share repurchase program. These capital reductions by cancellation of shares were subject to a notice period and filing with the commercial register in Switzerland.
Contributed Surplus
During fiscal 2017, cumulative equity transactions, including dividend activity and treasury share cancellations, reduced our contributed surplus balance to zero with residual activity recorded against accumulated earnings as reflected on the Consolidated Statement of Shareholders' Equity. To the extent that the contributed surplus balance continues to be zero, the impact of future transactions that normally would have been recorded as a reduction of contributed surplus will be recorded in accumulated earnings. Contributed surplus established for Swiss tax and statutory purposes ("Swiss Contributed Surplus"), is not impacted by our GAAP treatment.
Swiss Contributed Surplus, subject to certain conditions, is a freely distributable reserve. As of fiscal year end 2018 and 2017, Swiss Contributed Surplus was CHF 6,724 million and CHF 7,300 million, respectively (equivalent to $5,809 million and $6,420 million, respectively).
Dividends
We paid cash dividends to shareholders of $1.68, $1.54, and $1.40 per share in fiscal 2018, 2017, and 2016, respectively.
Under Swiss law, subject to certain conditions, dividends paid from reserves from capital contributions (equivalent to Swiss Contributed Surplus) are exempt from Swiss withholding tax. Dividends on our shares must be approved by our shareholders.
104
TE CONNECTIVITY LTD.
NOTES TO CONSOLIDATED FINANCIAL STATEMENTS (Continued)
18. Shareholders' Equity (Continued)
Our shareholders approved the following dividends on our common shares:
|
Approval Date
|
Annual Payment Per Share | Payment Dates | ||
|---|---|---|---|---|
|
March 2015 |
$1.32, payable in four quarterly installments of $0.33 |
Third quarter of fiscal 2015
Fourth quarter of fiscal 2015 First quarter of fiscal 2016 Second quarter of fiscal 2016 |
||
|
March 2016 |
$1.48, payable in four quarterly installments of $0.37 |
Third quarter of fiscal 2016 Fourth quarter of fiscal 2016 First quarter of fiscal 2017 Second quarter of fiscal 2017 |
||
|
March 2017 |
$1.60, payable in four quarterly installments of $0.40 |
Third quarter of fiscal 2017 Fourth quarter of fiscal 2017 First quarter of fiscal 2018 Second quarter of fiscal 2018 |
||
|
March 2018 |
$1.76, payable in four quarterly installments of $0.44 |
Third quarter of fiscal 2018 Fourth quarter of fiscal 2018 First quarter of fiscal 2019 Second quarter of fiscal 2019 |
Upon shareholders' approval of a dividend payment, we record a liability with a corresponding charge to shareholders' equity. At fiscal year end 2018 and 2017, the unpaid portion of the dividends recorded in accrued and other current liabilities on the Consolidated Balance Sheets totaled $303 million and $281 million, respectively.
Share Repurchase Program
During fiscal 2018 and 2016, our board of directors authorized increases of $1.5 billion and $1.0 billion, respectively, in the share repurchase program. Common shares repurchased under the share repurchase program were as follows:
|
|
Fiscal | |||||||||
|---|---|---|---|---|---|---|---|---|---|---|
|
|
2018 | 2017 | 2016 | |||||||
|
|
(in millions)
|
|||||||||
|
Number of common shares repurchased |
10 | 8 | 43 | |||||||
|
Repurchase value |
$ | 966 | $ | 621 | $ | 2,610 | ||||
At fiscal year end 2018, we had $1.0 billion of availability remaining under our share repurchase authorization.
105
TE CONNECTIVITY LTD.
NOTES TO CONSOLIDATED FINANCIAL STATEMENTS (Continued)
19. Accumulated Other Comprehensive Income (Loss)
The changes in each component of accumulated other comprehensive income (loss) were as follows:
|
|
Currency
Translation (1) |
Unrecognized
Pension and Postretirement Benefit Costs |
Gains (Losses)
on Cash Flow Hedges |
Accumulated
Other Comprehensive Income (Loss) |
|||||||||
|---|---|---|---|---|---|---|---|---|---|---|---|---|---|
|
|
(in millions)
|
||||||||||||
|
Balance at fiscal year end 2015 |
$ | 408 | $ | (738 | ) | $ | (43 | ) | $ | (373 | ) | ||
| | | | | | | | | | | | | | |
|
Other comprehensive income (loss), net of tax: |
|||||||||||||
|
Other comprehensive loss before reclassifications |
(69 | ) | (190 | ) | (14 | ) | (273 | ) | |||||
|
Amounts reclassified from accumulated other comprehensive income (loss) |
(23 | ) | 70 | 32 | 79 | ||||||||
|
Income tax (expense) benefit |
— | 32 | (7 | ) | 25 | ||||||||
| | | | | | | | | | | | | | |
|
Other comprehensive income (loss), net of tax |
(92 | ) | (88 | ) | 11 | (169 | ) | ||||||
| | | | | | | | | | | | | | |
|
Balance at fiscal year end 2016 |
316 | (826 | ) | (32 | ) | (542 | ) | ||||||
| | | | | | | | | | | | | | |
|
Other comprehensive income, net of tax: |
|||||||||||||
|
Other comprehensive income before reclassifications |
38 | 378 | 32 | 448 | |||||||||
|
Amounts reclassified from accumulated other comprehensive income (loss) |
(1 | ) | 74 | (14 | ) | 59 | |||||||
|
Income tax expense |
— | (122 | ) | (3 | ) | (125 | ) | ||||||
| | | | | | | | | | | | | | |
|
Other comprehensive income, net of tax |
37 | 330 | 15 | 382 | |||||||||
| | | | | | | | | | | | | | |
|
Balance at fiscal year end 2017 |
353 | (496 | ) | (17 | ) | (160 | ) | ||||||
| | | | | | | | | | | | | | |
|
Adoption of ASU No. 2018–02 |
— | (39 | ) | 1 | (38 | ) | |||||||
|
Other comprehensive income (loss), net of tax: |
|||||||||||||
|
Other comprehensive income (loss) before reclassifications |
(117 | ) | 64 | (60 | ) | (113 | ) | ||||||
|
Amounts reclassified from accumulated other comprehensive income (loss) |
— | 40 | (23 | ) | 17 | ||||||||
|
Income tax (expense) benefit |
— | (21 | ) | 9 | (12 | ) | |||||||
| | | | | | | | | | | | | | |
|
Other comprehensive income (loss), net of tax |
(117 | ) | 83 | (74 | ) | (108 | ) | ||||||
| | | | | | | | | | | | | | |
|
Balance at fiscal year end 2018 |
$ | 236 | $ | (452 | ) | $ | (90 | ) | $ | (306 | ) | ||
| | | | | | | | | | | | | | |
| | | | | | | | | | | | | | |
| | | | | | | | | | | | | | |
- (1)
- Includes hedges of net investment foreign currency exchange gains or losses which offset foreign currency exchange losses or gains attributable to the translation of the net investments.
106
TE CONNECTIVITY LTD.
NOTES TO CONSOLIDATED FINANCIAL STATEMENTS (Continued)
20. Share Plans
Our equity compensation plans, of which the TE Connectivity Ltd. 2007 Stock and Incentive Plan, amended and restated as of March 8, 2017 (the "2017 Plan"), is the primary plan, provide for the award of annual performance bonuses and long-term performance awards, including share options; restricted, performance, and deferred share units; and other share-based awards (collectively, "Awards") and allow for the use of unissued shares or treasury shares to be used to satisfy such Awards. As of fiscal year end 2018, our plans provided for a maximum of 77 million shares to be issued as Awards, subject to adjustment as provided under the terms of the plans. A total of 20 million shares remained available for issuance under our plans as of fiscal year end 2018.
Share-Based Compensation Expense
Share-based compensation expense, which was included in selling, general, and administrative expenses on the Consolidated Statements of Operations, was as follows:
|
|
Fiscal | |||||||||
|---|---|---|---|---|---|---|---|---|---|---|
|
|
2018 | 2017 | 2016 | |||||||
|
|
(in millions)
|
|||||||||
|
Share-based compensation expense |
$ | 95 | $ | 95 | $ | 87 | ||||
We recognized a related tax benefit associated with our share-based compensation arrangements of $20 million, $31 million, and $28 million in fiscal 2018, 2017, and 2016, respectively.
Restricted Share Awards
Restricted share awards, which are generally in the form of restricted share units, are granted subject to certain restrictions. Conditions of vesting are determined at the time of grant. All restrictions on an award will lapse upon death or disability of the employee. If the employee satisfies retirement requirements, a portion of the award may vest, depending on the terms and conditions of the particular grant. Recipients of restricted share units have no voting rights, but do receive dividend equivalents. For grants that vest through passage of time, the fair value of the award at the time of the grant is amortized to expense over the period of vesting. The fair value of restricted share awards is determined based on the closing value of our shares on the grant date. Restricted share awards generally vest in increments over a period of four years as determined by the management development and compensation committee.
Restricted share award activity was as follows:
|
|
Shares |
Weighted-Average
Grant-Date Fair Value |
|||||
|---|---|---|---|---|---|---|---|
|
Nonvested at fiscal year end 2017 |
1,990,784 | $ | 64.40 | ||||
|
Granted |
592,852 | 93.45 | |||||
|
Vested |
(799,724 | ) | 62.06 | ||||
|
Forfeited |
(152,442 | ) | 70.88 | ||||
| | | | | | | | |
|
Nonvested at fiscal year end 2018 |
1,631,470 | $ | 75.39 | ||||
| | | | | | | | |
| | | | | | | | |
| | | | | | | | |
107
TE CONNECTIVITY LTD.
NOTES TO CONSOLIDATED FINANCIAL STATEMENTS (Continued)
20. Share Plans (Continued)
The weighted-average grant-date fair value of restricted share awards granted during fiscal 2018, 2017, and 2016 was $93.45, $67.72, and $64.88, respectively.
The total fair value of restricted share awards that vested during fiscal 2018, 2017, and 2016 was $50 million, $50 million, and $51 million, respectively.
As of fiscal year end 2018, there was $66 million of unrecognized compensation cost related to nonvested restricted share awards. The cost is expected to be recognized over a weighted-average period of 1.6 years.
Performance Share Awards
Performance share awards, which are generally in the form of performance share units, are granted with pay-out subject to vesting requirements and certain performance conditions that are determined at the time of grant. Based on our performance, the pay-out of performance share units can range from 0% to 200% of the number of units originally granted. The grant-date fair value of performance share awards is expensed over the period of performance once achievement of the performance criteria is deemed probable. Recipients of performance share units have no voting rights but do receive dividend equivalents. Performance share awards generally vest after a period of three years as determined by the management development and compensation committee.
Performance share award activity was as follows:
|
|
Shares |
Weighted-Average
Grant-Date Fair Value |
|||||
|---|---|---|---|---|---|---|---|
|
Outstanding at fiscal year end 2017 |
703,407 | $ | 65.13 | ||||
|
Granted |
301,483 | 92.96 | |||||
|
Vested |
(300,174 | ) | 61.99 | ||||
|
Forfeited |
(15,813 | ) | 71.26 | ||||
| | | | | | | | |
|
Outstanding at fiscal year end 2018 |
688,903 | $ | 73.38 | ||||
| | | | | | | | |
| | | | | | | | |
| | | | | | | | |
The weighted-average grant-date fair value of performance share awards granted during fiscal 2018, 2017, and 2016 was $92.96, $62.88, and $55.15, respectively.
The total fair value of performance share awards that vested during fiscal 2018, 2017, and 2016 was $19 million, $15 million, and $15 million, respectively.
As of fiscal year end 2018, there was $24 million of unrecognized compensation cost related to nonvested performance share awards. The cost is expected to be recognized over a weighted-average period of 1.0 years.
Share Options
Share options are granted to purchase our common shares at prices which are equal to or greater than the market price of the common shares on the date the option is granted. Conditions of vesting are determined at the time of grant. All restrictions on the award will lapse upon death or disability of the employee. If the employee satisfies retirement requirements, a portion of the award may vest, depending on the terms and conditions of the particular grant. Options generally vest and become
108
TE CONNECTIVITY LTD.
NOTES TO CONSOLIDATED FINANCIAL STATEMENTS (Continued)
20. Share Plans (Continued)
exercisable in equal annual installments over a period of four years and expire ten years after the date of grant.
Share option award activity was as follows:
|
|
Shares |
Weighted-Average
Exercise Price |
Weighted-Average
Remaining Contractual Term |
Aggregate
Intrinsic Value |
|||||||||
|---|---|---|---|---|---|---|---|---|---|---|---|---|---|
|
|
|
|
(in years)
|
(in millions)
|
|||||||||
|
Outstanding at fiscal year end 2017 |
7,685,093 | $ | 55.70 | ||||||||||
|
Granted |
1,386,850 | 93.44 | |||||||||||
|
Exercised |
(2,103,141 | ) | 46.50 | ||||||||||
|
Expired |
(8,565 | ) | 60.44 | ||||||||||
|
Forfeited |
(201,160 | ) | 70.98 | ||||||||||
| | | | | | | | | | | | | | |
|
Outstanding at fiscal year end 2018 |
6,759,077 | $ | 65.85 | 7.0 | $ | 157 | |||||||
| | | | | | | | | | | | | | |
| | | | | | | | | | | | | | |
| | | | | | | | | | | | | | |
|
Vested and expected to vest at fiscal year end 2018 |
6,376,801 | $ | 65.27 | 7.0 | $ | 151 | |||||||
|
Exercisable at fiscal year end 2018 |
2,908,893 | $ | 53.08 | 5.5 | $ | 101 | |||||||
The weighted-average exercise price of share option awards granted during fiscal 2018, 2017, and 2016 was $93.44, $66.76, and $65.70, respectively.
The total intrinsic value of options exercised during fiscal 2018, 2017, and 2016 was $106 million, $130 million, and $67 million, respectively. We received cash related to the exercise of options of $100 million, $117 million, and $90 million in fiscal 2018, 2017, and 2016, respectively.
As of fiscal year end 2018, there was $34 million of unrecognized compensation cost related to nonvested share options granted under our share option plans. The cost is expected to be recognized over a weighted-average period of 1.7 years.
Share-Based Compensation Assumptions
The grant-date fair value of each share option grant was estimated using the Black-Scholes-Merton option pricing model. Use of a valuation model requires management to make certain assumptions with respect to selected model inputs. We employ our historical share volatility when calculating the grant-date fair value of our share option grants using the Black-Scholes-Merton option pricing model. Currently, we do not have exchange-traded options of sufficient duration to employ an implied volatility assumption in the calculation and therefore rely solely on the historical volatility calculation. The average expected life was based on the contractual term of the option and expected employee exercise and post-vesting employment termination behavior. The risk-free interest rate was based on U.S. Treasury zero-coupon issues with a remaining term that approximated the expected life assumed at the date of grant. The expected annual dividend per share was based on our expected dividend rate. The recognized share-based compensation expense was net of estimated forfeitures, which are based on voluntary termination behavior as well as an analysis of actual option forfeitures.
109
TE CONNECTIVITY LTD.
NOTES TO CONSOLIDATED FINANCIAL STATEMENTS (Continued)
20. Share Plans (Continued)
The weighted-average grant-date fair value of options granted and the weighted-average assumptions we used in the Black-Scholes-Merton option pricing model were as follows:
|
|
Fiscal | |||||||||
|---|---|---|---|---|---|---|---|---|---|---|
|
|
2018 | 2017 | 2016 | |||||||
|
Weighted-average grant-date fair value |
$ | 16.49 | $ | 12.80 | $ | 14.26 | ||||
|
Assumptions: |
|
|
|
|||||||
|
Expected share price volatility |
20 | % | 24 | % | 26 | % | ||||
|
Risk free interest rate |
2.2 | % | 1.9 | % | 2.0 | % | ||||
|
Expected annual dividend per share |
$ | 1.60 | $ | 1.48 | $ | 1.32 | ||||
|
Expected life of options (in years) |
5.3 | 5.6 | 5.7 | |||||||
21. Segment and Geographic Data
We operate through three reportable segments: Transportation Solutions, Industrial Solutions, and Communications Solutions. See Note 1 for a description of the segments in which we operate.
Segment performance is evaluated based on net sales and operating income. Generally, we consider all expenses to be of an operating nature and, accordingly, allocate them to each reportable segment. Costs specific to a segment are charged to the segment. Corporate expenses, such as headquarters administrative costs, are allocated to the segments based on segment operating income. Intersegment sales were not material and were recorded at selling prices that approximate market prices. Corporate assets are allocated to the segments based on segment assets.
Net sales and operating income by segment were as follows:
|
|
Net Sales | Operating Income | |||||||||||||||||
|---|---|---|---|---|---|---|---|---|---|---|---|---|---|---|---|---|---|---|---|
|
|
Fiscal | Fiscal | |||||||||||||||||
|
|
2018 | 2017 | 2016 | 2018 | 2017 | 2016 | |||||||||||||
|
|
(in millions)
|
||||||||||||||||||
|
Transportation Solutions |
$ | 8,290 | $ | 7,039 | $ | 6,503 | $ | 1,578 | $ | 1,294 | $ | 1,209 | |||||||
|
Industrial Solutions |
3,856 | 3,507 | 3,215 | 465 | 364 | 353 | |||||||||||||
|
Communications Solutions |
1,842 | 1,639 | 1,634 | 288 | 218 | 246 | (1) | ||||||||||||
| | | | | | | | | | | | | | | | | | | | |
|
Total |
$ | 13,988 | $ | 12,185 | $ | 11,352 | $ | 2,331 | $ | 1,876 | $ | 1,808 | |||||||
| | | | | | | | | | | | | | | | | | | | |
| | | | | | | | | | | | | | | | | | | | |
| | | | | | | | | | | | | | | | | | | | |
- (1)
- Includes pre-tax gain of $144 million on the sale of our CPD business during fiscal 2016.
No single customer accounted for a significant amount of our net sales in fiscal 2018, 2017, or 2016.
As we are not organized by product or service, it is not practicable to disclose net sales by product or service.
110
TE CONNECTIVITY LTD.
NOTES TO CONSOLIDATED FINANCIAL STATEMENTS (Continued)
21. Segment and Geographic Data (Continued)
Depreciation and amortization and capital expenditures were as follows:
|
|
Depreciation and
Amortization |
Capital Expenditures | |||||||||||||||||
|---|---|---|---|---|---|---|---|---|---|---|---|---|---|---|---|---|---|---|---|
|
|
Fiscal | Fiscal | |||||||||||||||||
|
|
2018 | 2017 | 2016 | 2018 | 2017 | 2016 | |||||||||||||
|
|
(in millions)
|
||||||||||||||||||
|
Transportation Solutions |
$ | 416 | $ | 362 | $ | 341 | $ | 711 | $ | 473 | $ | 432 | |||||||
|
Industrial Solutions |
178 | 165 | 134 | 145 | 123 | 108 | |||||||||||||
|
Communications Solutions |
73 | 84 | 85 | 79 | 83 | 63 | |||||||||||||
| | | | | | | | | | | | | | | | | | | | |
|
Total |
$ | 667 | $ | 611 | $ | 560 | $ | 935 | $ | 679 | $ | 603 | |||||||
| | | | | | | | | | | | | | | | | | | | |
| | | | | | | | | | | | | | | | | | | | |
| | | | | | | | | | | | | | | | | | | | |
Segment assets and a reconciliation of segment assets to total assets were as follows:
|
|
Segment Assets | |||||||||
|---|---|---|---|---|---|---|---|---|---|---|
|
|
Fiscal Year End | |||||||||
|
|
2018 | 2017 | 2016 | |||||||
|
|
(in millions)
|
|||||||||
|
Transportation Solutions |
$ | 4,707 | $ | 4,084 | $ | 3,510 | ||||
|
Industrial Solutions |
2,049 | 1,909 | 1,725 | |||||||
|
Communications Solutions |
959 | 951 | 889 | |||||||
| | | | | | | | | | | |
|
Total segment assets (1) |
7,715 | 6,944 | 6,124 | |||||||
|
Other current assets |
1,981 | 2,141 | 1,460 | |||||||
|
Other non-current assets |
10,690 | 10,318 | 10,024 | |||||||
| | | | | | | | | | | |
|
Total assets |
$ | 20,386 | $ | 19,403 | $ | 17,608 | ||||
| | | | | | | | | | | |
| | | | | | | | | | | |
| | | | | | | | | | | |
- (1)
- Segment assets are composed of accounts receivable, inventories, and net property, plant, and equipment.
111
TE CONNECTIVITY LTD.
NOTES TO CONSOLIDATED FINANCIAL STATEMENTS (Continued)
21. Segment and Geographic Data (Continued)
Net sales and net property, plant, and equipment by geographic region were as follows:
|
|
Net Sales (1) |
Property, Plant, and
Equipment, Net |
|||||||||||||||||
|---|---|---|---|---|---|---|---|---|---|---|---|---|---|---|---|---|---|---|---|
|
|
Fiscal | Fiscal Year End | |||||||||||||||||
|
|
2018 | 2017 | 2016 | 2018 | 2017 | 2016 | |||||||||||||
|
|
(in millions)
|
||||||||||||||||||
|
Europe/Middle East/Africa: |
|||||||||||||||||||
|
Switzerland |
$ | 3,478 | $ | 3,016 | $ | 2,979 | $ | 94 | $ | 80 | $ | 62 | |||||||
|
Germany |
443 | 235 | 127 | 448 | 413 | 334 | |||||||||||||
|
Other Europe/Middle East/Africa |
1,334 | 1,148 | 1,008 | 829 | 741 | 628 | |||||||||||||
| | | | | | | | | | | | | | | | | | | | |
|
Total Europe/Middle East/Africa |
5,255 | 4,399 | 4,114 | 1,371 | 1,234 | 1,024 | |||||||||||||
| | | | | | | | | | | | | | | | | | | | |
|
Asia–Pacific: |
|||||||||||||||||||
|
China |
2,739 | 2,414 | 2,165 | 627 | 555 | 491 | |||||||||||||
|
Other Asia–Pacific |
2,023 | 1,898 | 1,758 | 436 | 390 | 371 | |||||||||||||
| | | | | | | | | | | | | | | | | | | | |
|
Total Asia–Pacific |
4,762 | 4,312 | 3,923 | 1,063 | 945 | 862 | |||||||||||||
| | | | | | | | | | | | | | | | | | | | |
|
Americas: |
|||||||||||||||||||
|
U.S. |
3,583 | 3,136 | 3,018 | 964 | 880 | 830 | |||||||||||||
|
Other Americas |
388 | 338 | 297 | 99 | 100 | 93 | |||||||||||||
| | | | | | | | | | | | | | | | | | | | |
|
Total Americas |
3,971 | 3,474 | 3,315 | 1,063 | 980 | 923 | |||||||||||||
| | | | | | | | | | | | | | | | | | | | |
|
Total |
$ | 13,988 | $ | 12,185 | $ | 11,352 | $ | 3,497 | $ | 3,159 | $ | 2,809 | |||||||
| | | | | | | | | | | | | | | | | | | | |
| | | | | | | | | | | | | | | | | | | | |
| | | | | | | | | | | | | | | | | | | | |
- (1)
- Net sales to external customers is attributed to individual countries based on the legal entity that records the sale.
112
TE CONNECTIVITY LTD.
NOTES TO CONSOLIDATED FINANCIAL STATEMENTS (Continued)
22. Quarterly Financial Data (unaudited)
Summarized quarterly financial data was as follows:
|
|
Fiscal | ||||||||||||||||||||||||
|---|---|---|---|---|---|---|---|---|---|---|---|---|---|---|---|---|---|---|---|---|---|---|---|---|---|
|
|
2018 | 2017 | |||||||||||||||||||||||
|
|
First
Quarter (1) |
Second
Quarter |
Third
Quarter |
Fourth
Quarter (2) |
First
Quarter |
Second
Quarter |
Third
Quarter |
Fourth
Quarter |
|||||||||||||||||
|
|
(in millions, except per share data)
|
||||||||||||||||||||||||
|
Net sales |
$ | 3,336 | $ | 3,562 | $ | 3,581 | $ | 3,509 | $ | 2,848 | $ | 3,007 | $ | 3,095 | $ | 3,235 | |||||||||
|
Gross margin |
1,164 | 1,212 | 1,187 | 1,182 | 1,015 | 1,041 | 1,060 | 1,067 | |||||||||||||||||
|
Acquisition and integration costs |
2 | 3 | 4 | 5 | 2 | 2 | 1 | 1 | |||||||||||||||||
|
Restructuring and other charges, net |
34 | 6 | 64 | 22 | 46 | 59 | 20 | 22 | |||||||||||||||||
|
Income (loss) from continuing operations |
(33 |
) |
490 |
453 |
1,674 |
387 |
374 |
390 |
389 |
||||||||||||||||
|
Income (loss) from discontinued operations, net of income taxes |
(7 | ) | — | 1 | (13 | ) | 22 | 31 | 45 | 45 | |||||||||||||||
|
Net income (loss) |
$ | (40 | ) | $ | 490 | $ | 454 | $ | 1,661 | $ | 409 | $ | 405 | $ | 435 | $ | 434 | ||||||||
|
Basic earnings (loss) per share: |
|
|
|
|
|
|
|
|
|||||||||||||||||
|
Income (loss) from continuing operations |
$ | (0.09 | ) | $ | 1.40 | $ | 1.30 | $ | 4.82 | $ | 1.09 | $ | 1.05 | $ | 1.10 | $ | 1.10 | ||||||||
|
Net income (loss) |
(0.11 | ) | 1.40 | 1.30 | 4.79 | 1.15 | 1.14 | 1.23 | 1.23 | ||||||||||||||||
|
Diluted earnings (loss) per share: |
|
|
|
|
|
|
|
|
|||||||||||||||||
|
Income (loss) from continuing operations |
$ | (0.09 | ) | $ | 1.38 | $ | 1.29 | $ | 4.78 | $ | 1.08 | $ | 1.04 | $ | 1.09 | $ | 1.09 | ||||||||
|
Net income (loss) |
(0.11 | ) | 1.38 | 1.29 | 4.75 | 1.14 | 1.13 | 1.22 | 1.22 | ||||||||||||||||
- (1)
-
Results
for the quarter ended December 29, 2017 included $567 million of income tax expense related to the tax impacts of the Tax Cuts and Jobs Act.
See Note 15 for additional information regarding income taxes.
- (2)
- Results for the quarter ended September 28, 2018 included a $1,222 million net income tax benefit associated with the tax impacts of certain legal entity restructurings and intercompany transactions. See Note 15 for additional information regarding income taxes.
23. Subsequent Event
In November 2018, we completed the sale of the Subsea Communications business for $325 million. The proceeds received are subject to a final working capital adjustment.
113
TE CONNECTIVITY LTD.
NOTES TO CONSOLIDATED FINANCIAL STATEMENTS (Continued)
24. Tyco Electronics Group S.A.
Tyco Electronics Group S.A. ("TEGSA"), a Luxembourg company and our 100%-owned subsidiary, is a holding company that owns, directly or indirectly, all of our operating subsidiaries. TEGSA is the obligor under our senior notes, commercial paper, and Credit Facility, which are fully and unconditionally guaranteed by its parent, TE Connectivity Ltd. The following tables present condensed consolidating financial information for TE Connectivity Ltd., TEGSA, and all other subsidiaries that are not providing a guarantee of debt but which represent assets of TEGSA, using the equity method of accounting.
Condensed Consolidating Statement of Operations
For the Fiscal Year Ended September 28, 2018
|
|
TE
Connectivity Ltd. |
TEGSA |
Other
Subsidiaries |
Consolidating
Adjustments |
Total | |||||||||||
|---|---|---|---|---|---|---|---|---|---|---|---|---|---|---|---|---|
|
|
(in millions)
|
|||||||||||||||
|
Net sales |
$ | — | $ | — | $ | 13,988 | $ | — | $ | 13,988 | ||||||
|
Cost of sales |
— | — | 9,243 | — | 9,243 | |||||||||||
| | | | | | | | | | | | | | | | | |
|
Gross margin |
— | — | 4,745 | — | 4,745 | |||||||||||
|
Selling, general, and administrative expenses, net |
154 | 6 | 1,434 | — | 1,594 | |||||||||||
|
Research, development, and engineering expenses |
— | — | 680 | — | 680 | |||||||||||
|
Acquisition and integration costs |
— | — | 14 | — | 14 | |||||||||||
|
Restructuring and other charges, net |
— | — | 126 | — | 126 | |||||||||||
| | | | | | | | | | | | | | | | | |
|
Operating income (loss) |
(154 | ) | (6 | ) | 2,491 | — | 2,331 | |||||||||
|
Interest income |
— | 2 | 13 | — | 15 | |||||||||||
|
Interest expense |
— | (105 | ) | (2 | ) | — | (107 | ) | ||||||||
|
Other income, net |
— | — | 1 | — | 1 | |||||||||||
|
Equity in net income of subsidiaries |
2,808 | 2,841 | — | (5,649 | ) | — | ||||||||||
|
Equity in net loss of subsidiaries of discontinued operations |
(19 | ) | (19 | ) | — | 38 | — | |||||||||
|
Intercompany interest income (expense), net |
(70 | ) | 76 | (6 | ) | — | — | |||||||||
| | | | | | | | | | | | | | | | | |
|
Income from continuing operations before income taxes |
2,565 | 2,789 | 2,497 | (5,611 | ) | 2,240 | ||||||||||
|
Income tax benefit |
— | — | 344 | — | 344 | |||||||||||
| | | | | | | | | | | | | | | | | |
|
Income from continuing operations |
2,565 | 2,789 | 2,841 | (5,611 | ) | 2,584 | ||||||||||
|
Loss from discontinued operations, net of income taxes |
— | — | (19 | ) | — | (19 | ) | |||||||||
| | | | | | | | | | | | | | | | | |
|
Net income |
2,565 | 2,789 | 2,822 | (5,611 | ) | 2,565 | ||||||||||
|
Other comprehensive loss |
(108 | ) | (108 | ) | (82 | ) | 190 | (108 | ) | |||||||
| | | | | | | | | | | | | | | | | |
|
Comprehensive income |
$ | 2,457 | $ | 2,681 | $ | 2,740 | $ | (5,421 | ) | $ | 2,457 | |||||
| | | | | | | | | | | | | | | | | |
| | | | | | | | | | | | | | | | | |
| | | | | | | | | | | | | | | | | |
114
TE CONNECTIVITY LTD.
NOTES TO CONSOLIDATED FINANCIAL STATEMENTS (Continued)
24. Tyco Electronics Group S.A. (Continued)
Condensed Consolidating Statement of Operations
For the Fiscal Year Ended September 29, 2017
|
|
TE
Connectivity Ltd. |
TEGSA |
Other
Subsidiaries |
Consolidating
Adjustments |
Total | |||||||||||
|---|---|---|---|---|---|---|---|---|---|---|---|---|---|---|---|---|
|
|
(in millions)
|
|||||||||||||||
|
Net sales |
$ | — | $ | — | $ | 12,185 | $ | — | $ | 12,185 | ||||||
|
Cost of sales |
— | — | 8,002 | — | 8,002 | |||||||||||
| | | | | | | | | | | | | | | | | |
|
Gross margin |
— | — | 4,183 | — | 4,183 | |||||||||||
|
Selling, general, and administrative expenses, net (1) |
184 | 1,911 | (552 | ) | — | 1,543 | ||||||||||
|
Research, development, and engineering expenses |
— | — | 611 | — | 611 | |||||||||||
|
Acquisition and integration costs |
— | — | 6 | — | 6 | |||||||||||
|
Restructuring and other charges, net |
— | — | 147 | — | 147 | |||||||||||
| | | | | | | | | | | | | | | | | |
|
Operating income (loss) |
(184 | ) | (1,911 | ) | 3,971 | — | 1,876 | |||||||||
|
Interest income |
— | — | 16 | — | 16 | |||||||||||
|
Interest expense |
— | (129 | ) | (1 | ) | — | (130 | ) | ||||||||
|
Other expense, net |
— | — | (42 | ) | — | (42 | ) | |||||||||
|
Equity in net income of subsidiaries |
1,756 | 3,686 | — | (5,442 | ) | — | ||||||||||
|
Equity in net income of subsidiaries of discontinued operations |
143 | 156 | — | (299 | ) | — | ||||||||||
|
Intercompany interest income (expense), net |
(32 | ) | 110 | (78 | ) | — | — | |||||||||
| | | | | | | | | | | | | | | | | |
|
Income from continuing operations before income taxes |
1,683 | 1,912 | 3,866 | (5,741 | ) | 1,720 | ||||||||||
|
Income tax expense |
— | — | (180 | ) | — | (180 | ) | |||||||||
| | | | | | | | | | | | | | | | | |
|
Income from continuing operations |
1,683 | 1,912 | 3,686 | (5,741 | ) | 1,540 | ||||||||||
|
Income (loss) from discontinued operations, net of income taxes (2) |
— | (13 | ) | 156 | — | 143 | ||||||||||
| | | | | | | | | | | | | | | | | |
|
Net income |
1,683 | 1,899 | 3,842 | (5,741 | ) | 1,683 | ||||||||||
|
Other comprehensive income |
382 | 382 | 375 | (757 | ) | 382 | ||||||||||
| | | | | | | | | | | | | | | | | |
|
Comprehensive income |
$ | 2,065 | $ | 2,281 | $ | 4,217 | $ | (6,498 | ) | $ | 2,065 | |||||
| | | | | | | | | | | | | | | | | |
| | | | | | | | | | | | | | | | | |
| | | | | | | | | | | | | | | | | |
- (1)
-
TEGSA
selling, general and administrative expenses include losses of $1,965 million related to intercompany transactions. These losses are offset by
corresponding gains recorded by other subsidiaries.
- (2)
- Includes the internal allocation of gains and losses associated with the divestiture of our BNS business.
115
TE CONNECTIVITY LTD.
NOTES TO CONSOLIDATED FINANCIAL STATEMENTS (Continued)
24. Tyco Electronics Group S.A. (Continued)
Condensed Consolidating Statement of Operations
For the Fiscal Year Ended September 30, 2016
|
|
TE
Connectivity Ltd. |
TEGSA |
Other
Subsidiaries |
Consolidating
Adjustments |
Total | |||||||||||
|---|---|---|---|---|---|---|---|---|---|---|---|---|---|---|---|---|
|
|
(in millions)
|
|||||||||||||||
|
Net sales |
$ | — | $ | — | $ | 11,352 | $ | — | $ | 11,352 | ||||||
|
Cost of sales |
— | — | 7,525 | — | 7,525 | |||||||||||
| | | | | | | | | | | | | | | | | |
|
Gross margin |
— | — | 3,827 | — | 3,827 | |||||||||||
|
Selling, general, and administrative expenses, net (1) |
168 | 95 | 1,133 | — | 1,396 | |||||||||||
|
Research, development, and engineering expenses |
— | — | 603 | — | 603 | |||||||||||
|
Acquisition and integration costs |
— | — | 22 | — | 22 | |||||||||||
|
Restructuring and other charges (credits), net |
2 | (1 | ) | (3 | ) | — | (2 | ) | ||||||||
| | | | | | | | | | | | | | | | | |
|
Operating income (loss) |
(170 | ) | (94 | ) | 2,072 | — | 1,808 | |||||||||
|
Interest income |
— | — | 17 | — | 17 | |||||||||||
|
Interest expense |
— | (126 | ) | (1 | ) | — | (127 | ) | ||||||||
|
Other expense, net |
— | — | (677 | ) | — | (677 | ) | |||||||||
|
Equity in net income of subsidiaries |
2,045 | 2,167 | — | (4,212 | ) | — | ||||||||||
|
Equity in net income of subsidiaries of discontinued operations |
161 | 262 | — | (423 | ) | — | ||||||||||
|
Intercompany interest income (expense), net |
(28 | ) | 98 | (70 | ) | — | — | |||||||||
| | | | | | | | | | | | | | | | | |
|
Income from continuing operations before income taxes |
2,008 | 2,307 | 1,341 | (4,635 | ) | 1,021 | ||||||||||
|
Income tax benefit |
— | — | 826 | — | 826 | |||||||||||
| | | | | | | | | | | | | | | | | |
|
Income from continuing operations |
2,008 | 2,307 | 2,167 | (4,635 | ) | 1,847 | ||||||||||
|
Income (loss) from discontinued operations, net of income taxes (2) |
1 | (101 | ) | 262 | — | 162 | ||||||||||
| | | | | | | | | | | | | | | | | |
|
Net income |
2,009 | 2,206 | 2,429 | (4,635 | ) | 2,009 | ||||||||||
|
Other comprehensive loss |
(169 | ) | (169 | ) | (143 | ) | 312 | (169 | ) | |||||||
| | | | | | | | | | | | | | | | | |
|
Comprehensive income |
$ | 1,840 | $ | 2,037 | $ | 2,286 | $ | (4,323 | ) | $ | 1,840 | |||||
| | | | | | | | | | | | | | | | | |
| | | | | | | | | | | | | | | | | |
| | | | | | | | | | | | | | | | | |
- (1)
-
TEGSA
selling, general, and administrative expenses include losses of $80 million related to intercompany transactions. These losses are offset by
corresponding gains recorded by other subsidiaries.
- (2)
- Includes the internal allocation of gains and losses associated with the divestiture of our BNS business.
116
TE CONNECTIVITY LTD.
NOTES TO CONSOLIDATED FINANCIAL STATEMENTS (Continued)
24. Tyco Electronics Group S.A. (Continued)
As of September 28, 2018
|
|
TE
Connectivity Ltd. |
TEGSA |
Other
Subsidiaries |
Consolidating
Adjustments |
Total | |||||||||||
|---|---|---|---|---|---|---|---|---|---|---|---|---|---|---|---|---|
|
|
(in millions)
|
|||||||||||||||
|
Assets |
||||||||||||||||
|
Current assets: |
||||||||||||||||
|
Cash and cash equivalents |
$ | — | $ | — | $ | 848 | $ | — | $ | 848 | ||||||
|
Accounts receivable, net |
— | — | 2,361 | — | 2,361 | |||||||||||
|
Inventories |
— | — | 1,857 | — | 1,857 | |||||||||||
|
Intercompany receivables |
37 | 2,391 | 48 | (2,476 | ) | — | ||||||||||
|
Prepaid expenses and other current assets |
5 | 112 | 544 | — | 661 | |||||||||||
|
Current assets held for sale |
— | — | 472 | — | 472 | |||||||||||
| | | | | | | | | | | | | | | | | |
|
Total current assets |
42 | 2,503 | 6,130 | (2,476 | ) | 6,199 | ||||||||||
|
Property, plant, and equipment, net |
— | — | 3,497 | — | 3,497 | |||||||||||
|
Goodwill |
— | — | 5,684 | — | 5,684 | |||||||||||
|
Intangible assets, net |
— | — | 1,704 | — | 1,704 | |||||||||||
|
Deferred income taxes |
— | — | 2,144 | — | 2,144 | |||||||||||
|
Investment in subsidiaries |
13,626 | 26,613 | — | (40,239 | ) | — | ||||||||||
|
Intercompany loans receivable |
2 | 6,535 | 17,887 | (24,424 | ) | — | ||||||||||
|
Other assets |
— | — | 1,158 | — | 1,158 | |||||||||||
| | | | | | | | | | | | | | | | | |
|
Total Assets |
$ | 13,670 | $ | 35,651 | $ | 38,204 | $ | (67,139 | ) | $ | 20,386 | |||||
| | | | | | | | | | | | | | | | | |
| | | | | | | | | | | | | | | | | |
| | | | | | | | | | | | | | | | | |
|
Liabilities and Shareholders' Equity |
||||||||||||||||
|
Current liabilities: |
||||||||||||||||
|
Short-term debt |
$ | — | $ | 961 | $ | 2 | $ | — | $ | 963 | ||||||
|
Accounts payable |
2 | — | 1,546 | — | 1,548 | |||||||||||
|
Accrued and other current liabilities |
400 | 36 | 1,275 | — | 1,711 | |||||||||||
|
Intercompany payables |
2,437 | — | 39 | (2,476 | ) | — | ||||||||||
|
Current liabilities held for sale |
— | — | 188 | — | 188 | |||||||||||
| | | | | | | | | | | | | | | | | |
|
Total current liabilities |
2,839 | 997 | 3,050 | (2,476 | ) | 4,410 | ||||||||||
|
Long-term debt |
— | 3,033 | 4 | — | 3,037 | |||||||||||
|
Intercompany loans payable |
— | 17,888 | 6,536 | (24,424 | ) | — | ||||||||||
|
Long-term pension and postretirement liabilities |
— | — | 1,102 | — | 1,102 | |||||||||||
|
Deferred income taxes |
— | — | 207 | — | 207 | |||||||||||
|
Income taxes |
— | — | 312 | — | 312 | |||||||||||
|
Other liabilities |
— | 107 | 380 | — | 487 | |||||||||||
| | | | | | | | | | | | | | | | | |
|
Total Liabilities |
2,839 | 22,025 | 11,591 | (26,900 | ) | 9,555 | ||||||||||
| | | | | | | | | | | | | | | | | |
|
Total Shareholders' Equity |
10,831 | 13,626 | 26,613 | (40,239 | ) | 10,831 | ||||||||||
| | | | | | | | | | | | | | | | | |
|
Total Liabilities and Shareholders' Equity |
$ | 13,670 | $ | 35,651 | $ | 38,204 | $ | (67,139 | ) | $ | 20,386 | |||||
| | | | | | | | | | | | | | | | | |
| | | | | | | | | | | | | | | | | |
| | | | | | | | | | | | | | | | | |
117
TE CONNECTIVITY LTD.
NOTES TO CONSOLIDATED FINANCIAL STATEMENTS (Continued)
24. Tyco Electronics Group S.A. (Continued)
Condensed Consolidating Balance Sheet
As of September 29, 2017
|
|
TE
Connectivity Ltd. |
TEGSA |
Other
Subsidiaries |
Consolidating
Adjustments |
Total | |||||||||||
|---|---|---|---|---|---|---|---|---|---|---|---|---|---|---|---|---|
|
|
(in millions)
|
|||||||||||||||
|
Assets |
||||||||||||||||
|
Current assets: |
||||||||||||||||
|
Cash and cash equivalents |
$ | — | $ | — | $ | 1,218 | $ | — | $ | 1,218 | ||||||
|
Accounts receivable, net |
— | — | 2,138 | — | 2,138 | |||||||||||
|
Inventories |
— | — | 1,647 | — | 1,647 | |||||||||||
|
Intercompany receivables |
49 | 1,914 | 60 | (2,023 | ) | — | ||||||||||
|
Prepaid expenses and other current assets |
4 | 96 | 478 | — | 578 | |||||||||||
|
Current assets held for sale |
— | — | 345 | — | 345 | |||||||||||
| | | | | | | | | | | | | | | | | |
|
Total current assets |
53 | 2,010 | 5,886 | (2,023 | ) | 5,926 | ||||||||||
|
Property, plant, and equipment, net |
— | — | 3,159 | — | 3,159 | |||||||||||
|
Goodwill |
— | — | 5,651 | — | 5,651 | |||||||||||
|
Intangible assets, net |
— | — | 1,841 | — | 1,841 | |||||||||||
|
Deferred income taxes |
— | — | 2,141 | — | 2,141 | |||||||||||
|
Investment in subsidiaries |
11,960 | 20,109 | — | (32,069 | ) | — | ||||||||||
|
Intercompany loans receivable |
— | 4,027 | 9,700 | (13,727 | ) | — | ||||||||||
|
Noncurrent assets held for sale |
— | — | 257 | — | 257 | |||||||||||
|
Other assets |
— | 6 | 422 | — | 428 | |||||||||||
| | | | | | | | | | | | | | | | | |
|
Total Assets |
$ | 12,013 | $ | 26,152 | $ | 29,057 | $ | (47,819 | ) | $ | 19,403 | |||||
| | | | | | | | | | | | | | | | | |
| | | | | | | | | | | | | | | | | |
| | | | | | | | | | | | | | | | | |
|
Liabilities and Shareholders' Equity |
||||||||||||||||
|
Current liabilities: |
||||||||||||||||
|
Short-term debt |
$ | — | $ | 708 | $ | 2 | $ | — | $ | 710 | ||||||
|
Accounts payable |
2 | — | 1,385 | — | 1,387 | |||||||||||
|
Accrued and other current liabilities |
286 | 59 | 1,268 | — | 1,613 | |||||||||||
|
Intercompany payables |
1,974 | — | 49 | (2,023 | ) | — | ||||||||||
|
Current liabilities held for sale |
— | — | 137 | — | 137 | |||||||||||
| | | | | | | | | | | | | | | | | |
|
Total current liabilities |
2,262 | 767 | 2,841 | (2,023 | ) | 3,847 | ||||||||||
|
Long-term debt |
— | 3,629 | 5 | — | 3,634 | |||||||||||
|
Intercompany loans payable |
— | 9,700 | 4,027 | (13,727 | ) | — | ||||||||||
|
Long-term pension and postretirement liabilities |
— | — | 1,158 | — | 1,158 | |||||||||||
|
Deferred income taxes |
— | — | 236 | — | 236 | |||||||||||
|
Income taxes |
— | — | 293 | — | 293 | |||||||||||
|
Noncurrent liabilities held for sale |
— | — | 43 | — | 43 | |||||||||||
|
Other liabilities |
— | 96 | 345 | — | 441 | |||||||||||
| | | | | | | | | | | | | | | | | |
|
Total Liabilities |
2,262 | 14,192 | 8,948 | (15,750 | ) | 9,652 | ||||||||||
| | | | | | | | | | | | | | | | | |
|
Total Shareholders' Equity |
9,751 | 11,960 | 20,109 | (32,069 | ) | 9,751 | ||||||||||
| | | | | | | | | | | | | | | | | |
|
Total Liabilities and Shareholders' Equity |
$ | 12,013 | $ | 26,152 | $ | 29,057 | $ | (47,819 | ) | $ | 19,403 | |||||
| | | | | | | | | | | | | | | | | |
| | | | | | | | | | | | | | | | | |
| | | | | | | | | | | | | | | | | |
118
TE CONNECTIVITY LTD.
NOTES TO CONSOLIDATED FINANCIAL STATEMENTS (Continued)
24. Tyco Electronics Group S.A. (Continued)
Condensed Consolidating Statement of Cash Flows
For the Fiscal Year Ended September 28, 2018
|
|
TE
Connectivity Ltd. |
TEGSA |
Other
Subsidiaries |
Consolidating
Adjustments |
Total | |||||||||||
|---|---|---|---|---|---|---|---|---|---|---|---|---|---|---|---|---|
|
|
(in millions)
|
|||||||||||||||
|
Cash Flows From Operating Activities: |
||||||||||||||||
|
Net cash provided by continuing operating activities (1) |
$ | 486 | $ | 343 | $ | 2,625 | $ | (1,153 | ) | $ | 2,301 | |||||
|
Net cash provided by discontinued operating activities |
— | — | 150 | — | 150 | |||||||||||
| | | | | | | | | | | | | | | | | |
|
Net cash provided by operating activities |
486 | 343 | 2,775 | (1,153 | ) | 2,451 | ||||||||||
| | | | | | | | | | | | | | | | | |
|
Cash Flows From Investing Activities: |
||||||||||||||||
|
Capital expenditures |
— | — | (935 | ) | — | (935 | ) | |||||||||
|
Proceeds from sale of property, plant, and equipment |
— | — | 23 | — | 23 | |||||||||||
|
Acquisition of businesses, net of cash acquired |
— | — | (153 | ) | — | (153 | ) | |||||||||
|
Intercompany distribution receipts (1) |
— | 794 | — | (794 | ) | — | ||||||||||
|
Change in intercompany loans |
— | 62 | — | (62 | ) | — | ||||||||||
|
Other |
— | — | (8 | ) | — | (8 | ) | |||||||||
| | | | | | | | | | | | | | | | | |
|
Net cash provided by (used in) continuing investing activities |
— | 856 | (1,073 | ) | (856 | ) | (1,073 | ) | ||||||||
|
Net cash used in discontinued investing activities |
— | — | (21 | ) | — | (21 | ) | |||||||||
| | | | | | | | | | | | | | | | | |
|
Net cash provided by (used in) investing activities |
— | 856 | (1,094 | ) | (856 | ) | (1,094 | ) | ||||||||
| | | | | | | | | | | | | | | | | |
|
Cash Flows From Financing Activities: |
||||||||||||||||
|
Changes in parent company equity (2) |
112 | (170 | ) | 58 | — | — | ||||||||||
|
Net increase in commercial paper |
— | 270 | — | — | 270 | |||||||||||
|
Proceeds from issuance of debt |
— | 119 | — | — | 119 | |||||||||||
|
Repayment of debt |
— | (708 | ) | — | — | (708 | ) | |||||||||
|
Proceeds from exercise of share options |
— | — | 100 | — | 100 | |||||||||||
|
Repurchase of common shares |
(478 | ) | — | (401 | ) | — | (879 | ) | ||||||||
|
Payment of common share dividends to shareholders |
(594 | ) | — | 6 | — | (588 | ) | |||||||||
|
Intercompany distributions (1) |
— | (710 | ) | (505 | ) | 1,215 | — | |||||||||
|
Loan activity with parent |
474 | — | (1,268 | ) | 794 | — | ||||||||||
|
Transfers from discontinued operations |
— | — | 129 | — | 129 | |||||||||||
|
Other |
— | — | (36 | ) | — | (36 | ) | |||||||||
| | | | | | | | | | | | | | | | | |
|
Net cash used in continuing financing activities |
(486 | ) | (1,199 | ) | (1,917 | ) | 2,009 | (1,593 | ) | |||||||
|
Net cash used in discontinued financing activities |
— | — | (129 | ) | — | (129 | ) | |||||||||
| | | | | | | | | | | | | | | | | |
|
Net cash used in financing activities |
(486 | ) | (1,199 | ) | (2,046 | ) | 2,009 | (1,722 | ) | |||||||
| | | | | | | | | | | | | | | | | |
|
Effect of currency translation on cash |
— | — | (5 | ) | — | (5 | ) | |||||||||
|
Net decrease in cash and cash equivalents |
— | — | (370 | ) | — | (370 | ) | |||||||||
|
Cash and cash equivalents at beginning of fiscal year |
— | — | 1,218 | — | 1,218 | |||||||||||
| | | | | | | | | | | | | | | | | |
|
Cash and cash equivalents at end of fiscal year |
$ | — | $ | — | $ | 848 | $ | — | $ | 848 | ||||||
| | | | | | | | | | | | | | | | | |
| | | | | | | | | | | | | | | | | |
| | | | | | | | | | | | | | | | | |
- (1)
-
During
fiscal 2018, other subsidiaries made distributions to TEGSA in the amount of $505 million and TEGSA made distributions to TE Connectivity Ltd.
in the amount of $710 million. Cash flows are presented based upon the nature of the distributions.
- (2)
- Changes in parent company equity includes cash flows related to certain intercompany equity and funding transactions, and other intercompany activity.
119
TE CONNECTIVITY LTD.
NOTES TO CONSOLIDATED FINANCIAL STATEMENTS (Continued)
24. Tyco Electronics Group S.A. (Continued)
Condensed Consolidating Statement of Cash Flows
For the Fiscal Year Ended September 29, 2017
|
|
TE
Connectivity Ltd. |
TEGSA |
Other
Subsidiaries |
Consolidating
Adjustments |
Total | |||||||||||
|---|---|---|---|---|---|---|---|---|---|---|---|---|---|---|---|---|
|
|
(in millions)
|
|||||||||||||||
|
Cash Flows From Operating Activities: |
||||||||||||||||
|
Net cash provided by (used in) continuing operating activities (1) |
$ | (180 | ) | $ | 102 | $ | 2,581 | $ | (230 | ) | $ | 2,273 | ||||
|
Net cash provided by discontinued operating activities |
— | — | 48 | — | 48 | |||||||||||
| | | | | | | | | | | | | | | | | |
|
Net cash provided by (used in) operating activities |
(180 | ) | 102 | 2,629 | (230 | ) | 2,321 | |||||||||
| | | | | | | | | | | | | | | | | |
|
Cash Flows From Investing Activities: |
||||||||||||||||
|
Capital expenditures |
— | — | (679 | ) | — | (679 | ) | |||||||||
|
Proceeds from sale of property, plant, and equipment |
— | — | 19 | — | 19 | |||||||||||
|
Acquisition of businesses, net of cash acquired |
— | — | (250 | ) | — | (250 | ) | |||||||||
|
Proceeds from divestiture of business, net of cash retained by sold business |
— | — | 4 | — | 4 | |||||||||||
|
Intercompany distribution receipts (1) |
— | 516 | — | (516 | ) | — | ||||||||||
|
Change in intercompany loans |
— | (1,369 | ) | — | 1,369 | — | ||||||||||
|
Other |
— | (12 | ) | 9 | — | (3 | ) | |||||||||
| | | | | | | | | | | | | | | | | |
|
Net cash used in continuing investing activities |
— | (865 | ) | (897 | ) | 853 | (909 | ) | ||||||||
|
Net cash used in discontinued investing activities |
— | — | (23 | ) | — | (23 | ) | |||||||||
| | | | | | | | | | | | | | | | | |
|
Net cash used in investing activities |
— | (865 | ) | (920 | ) | 853 | (932 | ) | ||||||||
| | | | | | | | | | | | | | | | | |
|
Cash Flows From Financing Activities: |
||||||||||||||||
|
Changes in parent company equity (2) |
97 | 559 | (656 | ) | — | — | ||||||||||
|
Net decrease in commercial paper |
— | (330 | ) | — | — | (330 | ) | |||||||||
|
Proceeds from issuance of debt |
— | 589 | — | — | 589 | |||||||||||
|
Proceeds from exercise of share options |
— | — | 117 | — | 117 | |||||||||||
|
Repurchase of common shares |
— | — | (614 | ) | — | (614 | ) | |||||||||
|
Payment of common share dividends to shareholders |
(550 | ) | — | 4 | — | (546 | ) | |||||||||
|
Intercompany distributions (1) |
— | (50 | ) | (696 | ) | 746 | — | |||||||||
|
Loan activity with parent |
633 | — | 736 | (1,369 | ) | — | ||||||||||
|
Transfers from discontinued operations |
— | — | 25 | — | 25 | |||||||||||
|
Other |
— | (5 | ) | (25 | ) | — | (30 | ) | ||||||||
| | | | | | | | | | | | | | | | | |
|
Net cash provided by (used in) continuing financing activities |
180 | 763 | (1,109 | ) | (623 | ) | (789 | ) | ||||||||
|
Net cash used in discontinued financing activities |
— | — | (25 | ) | — | (25 | ) | |||||||||
| | | | | | | | | | | | | | | | | |
|
Net cash provided by (used in) financing activities |
180 | 763 | (1,134 | ) | (623 | ) | (814 | ) | ||||||||
| | | | | | | | | | | | | | | | | |
|
Effect of currency translation on cash |
— | — | (4 | ) | — | (4 | ) | |||||||||
|
Net increase in cash and cash equivalents |
— | — | 571 | — | 571 | |||||||||||
|
Cash and cash equivalents at beginning of fiscal year |
— | — | 647 | — | 647 | |||||||||||
| | | | | | | | | | | | | | | | | |
|
Cash and cash equivalents at end of fiscal year |
$ | — | $ | — | $ | 1,218 | $ | — | $ | 1,218 | ||||||
| | | | | | | | | | | | | | | | | |
| | | | | | | | | | | | | | | | | |
| | | | | | | | | | | | | | | | | |
- (1)
-
During
fiscal 2017, other subsidiaries made distributions to TEGSA in the amount of $696 million and TEGSA made distributions to TE Connectivity Ltd.
in the amount of $50 million. Cash flows are presented based upon the nature of the distributions.
- (2)
- Changes in parent company equity includes cash flows related to certain intercompany equity and funding transactions, and other intercompany activity.
120
TE CONNECTIVITY LTD.
NOTES TO CONSOLIDATED FINANCIAL STATEMENTS (Continued)
24. Tyco Electronics Group S.A. (Continued)
Condensed Consolidating Statement of Cash Flows
For the Fiscal Year Ended September 30, 2016
|
|
TE
Connectivity Ltd. |
TEGSA |
Other
Subsidiaries |
Consolidating
Adjustments |
Total | |||||||||||
|---|---|---|---|---|---|---|---|---|---|---|---|---|---|---|---|---|
|
|
(in millions)
|
|||||||||||||||
|
Cash Flows From Operating Activities: |
||||||||||||||||
|
Net cash provided by (used in) continuing operating activities (1) |
$ | (37 | ) | $ | 211 | $ | 2,095 | $ | (336 | ) | $ | 1,933 | ||||
|
Net cash provided by discontinued operating activities |
— | — | 14 | — | 14 | |||||||||||
| | | | | | | | | | | | | | | | | |
|
Net cash provided by (used in) operating activities |
(37 | ) | 211 | 2,109 | (336 | ) | 1,947 | |||||||||
| | | | | | | | | | | | | | | | | |
|
Cash Flows From Investing Activities: |
||||||||||||||||
|
Capital expenditures |
— | — | (603 | ) | — | (603 | ) | |||||||||
|
Proceeds from sale of property, plant, and equipment |
— | — | 8 | — | 8 | |||||||||||
|
Acquisition of businesses, net of cash acquired |
— | — | (1,336 | ) | — | (1,336 | ) | |||||||||
|
Proceeds from divestiture of business, net of cash retained by sold business |
— | 199 | 134 | — | 333 | |||||||||||
|
Intercompany distribution receipts (1) |
1,082 | 1,729 | — | (2,811 | ) | — | ||||||||||
|
Change in intercompany loans |
— | (1,244 | ) | — | 1,244 | — | ||||||||||
|
Other (2) |
— | (120 | ) | 162 | — | 42 | ||||||||||
| | | | | | | | | | | | | | | | | |
|
Net cash provided by (used in) continuing investing activities |
1,082 | 564 | (1,635 | ) | (1,567 | ) | (1,556 | ) | ||||||||
|
Net cash used in discontinued investing activities |
— | — | (25 | ) | — | (25 | ) | |||||||||
| | | | | | | | | | | | | | | | | |
|
Net cash provided by (used in) investing activities |
1,082 | 564 | (1,660 | ) | (1,567 | ) | (1,581 | ) | ||||||||
| | | | | | | | | | | | | | | | | |
|
Cash Flows From Financing Activities: |
||||||||||||||||
|
Changes in parent company equity (3) |
410 | 300 | (710 | ) | — | — | ||||||||||
|
Net increase in commercial paper |
— | 330 | — | — | 330 | |||||||||||
|
Proceeds from issuance of debt |
— | 349 | 3 | — | 352 | |||||||||||
|
Repayment of debt |
— | (500 | ) | (1 | ) | — | (501 | ) | ||||||||
|
Proceeds from exercise of share options |
— | — | 90 | — | 90 | |||||||||||
|
Repurchase of common shares |
(2,780 | ) | — | (7 | ) | — | (2,787 | ) | ||||||||
|
Payment of common share dividends to shareholders |
(513 | ) | — | 4 | — | (509 | ) | |||||||||
|
Intercompany distributions (1) |
— | (1,250 | ) | (1,897 | ) | 3,147 | — | |||||||||
|
Loan activity with parent |
1,838 | — | (594 | ) | (1,244 | ) | — | |||||||||
|
Transfers to discontinued operations |
— | — | (11 | ) | — | (11 | ) | |||||||||
|
Other |
— | (4 | ) | (26 | ) | — | (30 | ) | ||||||||
| | | | | | | | | | | | | | | | | |
|
Net cash used in continuing financing activities |
(1,045 | ) | (775 | ) | (3,149 | ) | 1,903 | (3,066 | ) | |||||||
|
Net cash provided by discontinued financing activities |
— | — | 11 | — | 11 | |||||||||||
| | | | | | | | | | | | | | | | | |
|
Net cash used in financing activities |
(1,045 | ) | (775 | ) | (3,138 | ) | 1,903 | (3,055 | ) | |||||||
| | | | | | | | | | | | | | | | | |
|
Effect of currency translation on cash |
— | — | 7 | — | 7 | |||||||||||
|
Net decrease in cash and cash equivalents |
— | — | (2,682 | ) | — | (2,682 | ) | |||||||||
|
Cash and cash equivalents at beginning of fiscal year |
— | — | 3,329 | — | 3,329 | |||||||||||
| | | | | | | | | | | | | | | | | |
|
Cash and cash equivalents at end of fiscal year |
$ | — | $ | — | $ | 647 | $ | — | $ | 647 | ||||||
| | | | | | | | | | | | | | | | | |
| | | | | | | | | | | | | | | | | |
| | | | | | | | | | | | | | | | | |
- (1)
-
During
fiscal 2016, other subsidiaries made distributions to TEGSA in the amount of $1,897 million and TEGSA made distributions to TE Connectivity Ltd.
in the amount of $1,250 million. Cash flows are presented based upon the nature of the distributions.
- (2)
-
Includes
the internal allocation of proceeds between TEGSA and other subsidiaries associated with the divestiture of our BNS business.
- (3)
- Changes in parent company equity includes cash flows related to certain intercompany equity and funding transactions, and other intercompany activity.
121
SCHEDULE II—VALUATION AND QUALIFYING ACCOUNTS
Fiscal Years Ended September 28, 2018, September 29, 2017, and September 30, 2016
|
Description
|
Balance at
Beginning of Fiscal Year |
Additions
Charged to Costs and Expenses |
Acquisitions,
Divestitures, and Other |
Deductions |
Balance at
End of Fiscal Year |
|||||||||||
|---|---|---|---|---|---|---|---|---|---|---|---|---|---|---|---|---|
|
|
(in millions)
|
|||||||||||||||
|
Fiscal 2018: |
||||||||||||||||
|
Allowance for doubtful accounts receivable |
$ | 18 | $ | 7 | $ | (1 | ) | $ | (2 | ) | $ | 22 | ||||
|
Valuation allowance on deferred tax assets |
3,627 | 261 | — | (1,697 | ) | 2,191 | ||||||||||
|
Fiscal 2017: |
|
|
|
|
|
|||||||||||
|
Allowance for doubtful accounts receivable |
$ | 17 | $ | 5 | $ | — | $ | (4 | ) | $ | 18 | |||||
|
Valuation allowance on deferred tax assets |
3,096 | 1,072 | — | (541 | ) | 3,627 | ||||||||||
|
Fiscal 2016: |
|
|
|
|
|
|||||||||||
|
Allowance for doubtful accounts receivable |
$ | 18 | $ | — | $ | 1 | $ | (2 | ) | $ | 17 | |||||
|
Valuation allowance on deferred tax assets |
3,237 | 283 | 1 | (425 | ) | 3,096 | ||||||||||
122