TEREX CORP
10-Ks and 10-Qs
|
|
|
|
|
|
|
|
|
|
|
|
|
|
|
|
|
|
|
|
|
|
|
|
|
|
|
|
|
|
|
|
|
|
|
|
|
|
|
|
|
|
|
|
|
|
|
|
|
|
|
|
|
|
|
|
|
|
|
UNITED STATES SECURITIES AND EXCHANGE COMMISSION
Washington, DC 20549
FORM 10-K
FOR ANNUAL AND TRANSITIONAL REPORTS PURSUANT TO
SECTIONS 13 OR 15(d) OF THE SECURITIES EXCHANGE ACT OF 1934
(Mark One)
|
x
|
ANNUAL REPORT PURSUANT TO SECTION 13 OR 15(d) OF THE SECURITIES EXCHANGE ACT OF 1934
|
For the Fiscal Year Ended
December 31, 2016
or
|
o
|
TRANSITION REPORT PURSUANT TO SECTION 13 OR 15 (d) OF THE SECURITIES EXCHANGE ACT OF 1934
|
Commission file number 1-10702
TEREX CORPORATION
(Exact name of registrant as specified in its charter)
|
Delaware
|
34-1531521
|
|
|
(State of Incorporation)
|
(IRS Employer Identification No.)
|
|
|
200 Nyala Farm Road, Westport, Connecticut
|
06880
|
|
|
(Address of principal executive offices)
|
(Zip Code)
|
|
Registrant’s telephone number, including area code:
(203) 222-7170
Securities registered pursuant to Section 12(b) of the Act:
COMMON STOCK, $.01 PAR VALUE
(Title of Class)
NEW YORK STOCK EXCHANGE
(Name of Exchange on which Registered)
Securities registered pursuant to Section 12(g) of the Act:
NONE
Indicate by check mark if the Registrant is a well-known seasoned issuer, as defined in Rule 405 of the Securities Act.
|
YES
x
|
NO
o
|
|
Indicate by check mark if the Registrant is not required to file reports pursuant to Section 13 or 15(d) of the Securities Act.
|
YES
o
|
NO
x
|
|
Indicate by check mark whether the Registrant (1) has filed all reports required to be filed by Section 13 or 15(d) of the Securities Exchange Act of 1934 during the preceding 12 months (or for such shorter period that the registrant was required to file such reports) and (2) has been subject to such filing requirements for the past 90 days.
|
YES
x
|
NO
o
|
|
Indicate by check mark whether the registrant has submitted electronically and posted on its corporate Web site, if any, every Interactive Data File required to be submitted and posted pursuant to Rule 405 of Regulation S-T during the preceding 12 months (or for such shorter period that the registrant was required to submit and post such files).
|
YES
x
|
NO
o
|
|
Indicate by check mark if disclosure of delinquent filers pursuant to Item 405 of Regulation S-K is not contained herein, and will not be contained, to the best of Registrant’s knowledge, in definitive proxy or information statements incorporated by reference in Part III of this Form 10-K or any amendment to this Form 10-K.
x
Indicate by check mark whether the Registrant is a large accelerated filer, an accelerated filer, non-accelerated filer or a smaller reporting company. See the definitions of “large accelerated filer,” “accelerated filer” and “smaller reporting company” in Rule 12b-2 of the Exchange Act. (Check one):
|
Large Accelerated Filer
x
|
Accelerated Filer
o
|
Non-accelerated Filer
o
|
Smaller Reporting Company
o
|
Indicate by check mark whether the Registrant is a shell company (as defined in Rule 12b-2 of the Exchange Act).
|
YES
o
|
NO
x
|
|
The aggregate market value of the voting and non-voting common equity stock held by non-affiliates of the Registrant was approximately
$2,156 million
based on the last sale price on
June 30, 2016
.
THE NUMBER OF SHARES OF THE REGISTRANT’S COMMON STOCK OUTSTANDING WAS
105.9
MILLION AS OF
February 21, 2017
.
DOCUMENTS INCORPORATED BY REFERENCE:
Portions of the Terex Corporation Proxy Statement to be filed with the Securities and Exchange Commission within 120 days after the year covered by this Form 10-K with respect to the
2017
Annual Meeting of Stockholders are incorporated by reference into Part III hereof.
As used in this Annual Report on Form 10-K, unless otherwise indicated, Terex Corporation, together with its consolidated subsidiaries, is hereinafter referred to as “Terex,” the “Registrant,” “us,” “we,” “our” or the “Company.” This Annual Report generally speaks as of
December 31, 2016
, unless specifically noted otherwise.
Forward-Looking Information
Certain information in this Annual Report includes forward-looking statements (within the meaning of Section 27A of the Securities Act of 1933 and Section 21E of the Securities Exchange Act of 1934 and the Private Securities Litigation Reform Act of 1995) regarding future events or our future financial performance that involve certain contingencies and uncertainties, including those discussed below in the section entitled “Management’s Discussion and Analysis of Financial Condition and Results of Operations – Contingencies and Uncertainties.” In addition, when included in this Annual Report or in documents incorporated herein by reference, the words “may,” “expects,” “should,” “intends,” “anticipates,” “believes,” “plans,” “projects,” “estimates” and the negatives thereof and analogous or similar expressions are intended to identify forward-looking statements. However, the absence of these words does not mean that the statement is not forward-looking. We have based these forward-looking statements on current expectations and projections about future events. These statements are not guarantees of future performance. Such statements are inherently subject to a variety of risks and uncertainties that could cause actual results to differ materially from those reflected in such forward-looking statements. Such risks and uncertainties, many of which are beyond our control, include, among others:
|
•
|
our business is cyclical and weak general economic conditions affect the sales of our products and financial results;
|
|
•
|
our need to comply with restrictive covenants contained in our debt agreements;
|
|
•
|
our ability to generate sufficient cash flow to service our debt obligations and operate our business;
|
|
•
|
our ability to access the capital markets to raise funds and provide liquidity;
|
|
•
|
our business is sensitive to government spending;
|
|
•
|
our business is highly competitive and is affected by our cost structure, pricing, product initiatives and other actions taken by competitors;
|
|
•
|
our retention of key management personnel;
|
|
•
|
the financial condition of suppliers and customers, and their continued access to capital;
|
|
•
|
our providing financing and credit support for some of our customers;
|
|
•
|
we may experience losses in excess of recorded reserves;
|
|
•
|
the carrying value of our goodwill could become impaired;
|
|
•
|
our ability to obtain parts and components from suppliers on a timely basis at competitive prices;
|
|
•
|
our business is global and subject to changes in exchange rates between currencies, commodity price changes, regional economic conditions and trade restrictions;
|
|
•
|
our operations are subject to a number of potential risks that arise from operating a multinational business, including compliance with changing regulatory environments, the Foreign Corrupt Practices Act and other similar laws, and political instability;
|
|
•
|
a material disruption to one of our significant facilities;
|
|
•
|
possible work stoppages and other labor matters;
|
|
•
|
compliance with changing laws and regulations, particularly environmental and tax laws and regulations;
|
|
•
|
litigation, product liability claims, intellectual property claims, class action lawsuits and other liabilities;
|
|
•
|
our ability to comply with an injunction and related obligations imposed by the United States Securities and Exchange Commission (“SEC”);
|
|
•
|
disruption or breach in our information technology systems; and
|
|
•
|
other factors.
|
Actual events or our actual future results may differ materially from any forward-looking statement due to these and other risks, uncertainties and significant factors. The forward-looking statements contained herein speak only as of the date of this Annual Report and the forward-looking statements contained in documents incorporated herein by reference speak only as of the date of the respective documents. We expressly disclaim any obligation or undertaking to release publicly any updates or revisions to any forward-looking statement contained or incorporated by reference in this Annual Report to reflect any change in our expectations with regard thereto or any change in events, conditions or circumstances on which any such statement is based.
2
TEREX CORPORATION AND SUBSIDIARIES
Index to Annual Report on Form 10-K
For the Year Ended
December 31, 2016
|
PAGE
|
||
3
|
|
|
|
ITEM 1.
|
BUSINESS
|
GENERAL
Terex is a global manufacturer of lifting and material processing products and services that deliver lifecycle solutions to maximize customer return on investment. The Company delivers lifecycle solutions to a broad range of industries, including the construction, infrastructure, manufacturing, shipping, transportation, refining, energy, utility, quarrying and mining industries. We report in three business segments: (i) Aerial Work Platforms (“AWP”); (ii) Cranes; and (iii) Materials Processing (“MP”).
Our Company was incorporated in Delaware in October 1986 as Terex U.S.A., Inc. We have changed significantly since that time, and much of this change has been historically accomplished through acquisitions and managing our portfolio of companies by divestiture of non-core businesses and products. We also continue to focus on becoming an industry leading operating company.
Our business is international in scope, with our products manufactured in North and South America, Europe, Australia and Asia and sold worldwide.
For financial information about our industry and a description of recent business reorganizations and segment descriptions, including geographic information, see “Management’s Discussion and Analysis of Financial Condition and Results of Operations” and Note C – “Business Segment Information” in the Notes to the Consolidated Financial Statements.
AERIAL WORK PLATFORMS
Our AWP segment designs, manufactures, services and markets aerial work platform equipment, telehandlers and light towers. Products include portable material lifts, portable aerial work platforms, trailer-mounted articulating booms, self-propelled articulating and telescopic booms, scissor lifts, telehandlers and trailer-mounted light towers as well as their related components and replacement parts. Customers use these products to construct and maintain industrial, commercial and residential buildings and facilities and for other commercial operations, as well as in a wide range of infrastructure projects. We market aerial work platform products principally under the Terex
®
and Genie
®
brand names.
AWP has the following significant manufacturing operations:
|
•
|
Aerial work platform equipment is manufactured in Redmond and Moses Lake, Washington, Rock Hill, South Carolina, Umbertide, Italy and Changzhou, China;
|
|
•
|
Telehandlers are manufactured in Oklahoma City, Oklahoma and Umbertide, Italy; and
|
|
•
|
Trailer-mounted light towers are manufactured in Rock Hill, South Carolina.
|
We have a parts and logistics center located in North Bend, Washington for our aerial work platform equipment. Additionally, a portion of our aerial work platform parts business is conducted at a shared Terex facility in Southaven, Mississippi. Our European, Asian Pacific and Latin American parts and logistics operations are conducted through out-sourced facilities.
CRANES
Our Cranes segment designs, manufactures, services, refurbishes and markets mobile telescopic cranes (all terrain cranes, rough terrain cranes, truck-mounted cranes (boom trucks), truck cranes, and pick and carry cranes), lattice boom crawler cranes, tower cranes, and utility equipment, as well as their related components and replacement parts. Customers use these products primarily for construction, repair and maintenance of commercial buildings, manufacturing facilities, energy related projects, construction and maintenance of utility and telecommunication lines, tree trimming, certain construction and foundation drilling applications and a wide range of infrastructure projects. We market our Cranes products principally under the Terex
®
and Demag
®
brand names.
4
Cranes has the following significant manufacturing operations:
|
•
|
Rough terrain cranes are manufactured in Crespellano, Italy and Oklahoma City, Oklahoma;
|
|
•
|
All-terrain cranes are manufactured in Montceau-les-Mines, France, and Zweibrücken, Germany;
|
|
•
|
Truck cranes are manufactured in Oklahoma City, Oklahoma;
|
|
•
|
Truck-mounted cranes are manufactured in Oklahoma City, Oklahoma;
|
|
•
|
Tower cranes are manufactured in Fontanafredda, Italy;
|
|
•
|
Lattice boom crawler cranes are manufactured in Oklahoma City, Oklahoma, Jinan, China, and Zweibrücken, Germany;
|
|
•
|
Pick and carry cranes are manufactured in Brisbane, Australia;
|
|
•
|
Steel assemblies for cranes are manufactured in Bierbach-Homburg, Germany and Pecs, Hungary; and
|
|
•
|
Utility products are manufactured in Watertown and Huron, South Dakota and Betim, Brazil.
|
We also provide service and support for utility and aerial products in the U.S. through a network of service branches and field service operations. We have announced plans to exit and sell our facilities in Bierbach-Homburg, Germany, Pecs, Hungary, Jinan, China and Betim, Brazil.
We have a minority interest in a Chinese company which manufactures truck cranes and truck-mounted cranes in China.
MATERIALS PROCESSING
Our MP segment designs, manufactures and markets materials processing and specialty equipment, including crushers, washing systems, screens, apron feeders, material handlers, wood processing, biomass and recycling equipment, concrete mixer trucks and concrete pavers, and their related components and replacement parts. Customers use these products in construction, infrastructure and recycling projects, in various quarrying and mining applications, as well as in landscaping and biomass production industries, material handling applications, and in building roads and bridges. We market our MP products principally under the Terex
®
, Powerscreen
®
, Fuchs
®
and CBI
®
brand names and the Terex
®
name in conjunction with certain historic brand names.
MP has the following significant manufacturing operations:
|
•
|
Mobile crushers, mobile screens and washing systems are manufactured in Omagh and Dungannon, Northern Ireland;
|
|
•
|
Mobile crushers, mobile screens, base crushers, base screens, modular and wheeled crushing and screening plants, track conveyors and washing systems are manufactured in Hosur, India, primarily for the Indian market and for export in Asia, Middle East and East Africa Regions;
|
|
•
|
Base crushers and base screens are manufactured in Subang Jaya, Malaysia and Oklahoma City, Oklahoma;
|
|
•
|
Screening equipment is manufactured in Durand, Michigan;
|
|
•
|
Base crushers are manufactured in Coalville, England;
|
|
•
|
Wood processing, biomass and recycling equipment systems are manufactured in Newton, New Hampshire, and Dungannon, Northern Ireland.
|
|
•
|
Material handlers are manufactured in Bad Schönborn, Germany;
|
|
•
|
Concrete pavers are manufactured in Canton, South Dakota; and
|
|
•
|
Front and rear discharge concrete mixer trucks are manufactured in Fort Wayne, Indiana.
|
We have a North American distribution center in Louisville, Kentucky and service centers in Australia, Thailand, Turkey and Malaysia.
OTHER
We may assist customers in their rental, leasing and acquisition of our products through Terex Financial Services (“TFS”). TFS uses its equipment financing experience to provide financing solutions to our customers who purchase our equipment. TFS provides financing support primarily: (i) in the United States and on a limited basis in China, originating, underwriting, documenting, funding and servicing financing transactions directly with end-user customers, distributors and rental companies; and (ii) by facilitating loans and leases between our customers and third party financial institutions. Most of the transactions are fixed and floating rate loans. However, TFS also provides sales-type leases, operating leases and rentals. TFS, in the normal course of business, also sells loans and leases to financial institutions with which it has established relationships.
The on-book financing activities of TFS have primarily been limited to the United States and China. Additionally, in those countries in which TFS engages in on-book financing, TFS continually evaluates the level to which it utilizes third party funding versus direct customer financing to meet its business objectives.
5
TFS continually monitors used equipment values of Terex equipment in the secondary market sales channels for all of our equipment categories. This provides a basis for TFS to project future values of equipment for the underwriting of leases or loans. These re-marketing channels are also used if equipment is returned at end of lease, or is repossessed in case of a customer default. TFS uses the resale channel which maximizes proceeds and/or mitigates risk for Terex and our funding partners
.
DISCONTINUED OPERATIONS
Material Handling and Port Solutions (“MHPS”)
On January 4, 2017, the Company completed the disposition of its MHPS business (the “Disposition”) to Konecranes Plc, a Finnish public company limited by shares (“Konecranes”) pursuant to a Stock and Asset Purchase Agreement (the “SAPA”). In connection with the Disposition, we received 19.6 million newly issued Class B shares of Konecranes and approximately
$832 million
in cash after adjustments for estimated cash, debt and net working capital at closing and the divestiture of Konecranes’ Stahl Crane Systems business (“Stahl”), which was undertaken by Konecranes in connection with the Disposition. The final transaction consideration is subject to post-closing adjustments for the actual cash, debt and net working capital at closing, the 2016 performance of the MHPS business and Konecranes business, and the closing of the sale of Stahl. The sale of the Company’s MHPS business to Konecranes represents a significant strategic shift in the Company’s business away from universal, process, mobile harbor and ship-to-shore cranes that will have a major effect on the Company’s future operating results, primarily because the MHPS business represented the entirety of one of the Company’s five previous reportable operating segments and comprised two of the Company’s six previous reporting units, representing a significant portion of the Company’s revenues and assets, and is therefore accounted for as a discontinued operation. MHPS products include universal cranes, process cranes and components, such as rope hoists, chain hoists, light crane systems, travel units and electric motors, primarily for industrial applications, and mobile harbor cranes, ship-to-shore gantry cranes, rubber tired and rail mounted gantry cranes, straddle carriers, sprinter carriers, reach stackers, container handlers, general cargo lift trucks, automated stacking cranes, automated guided vehicles and software solutions for logistics terminals. On February 15, 2017, Terex sold approximately 7.5 million Konecranes shares for net proceeds of approximately $268 million. Following the sale of shares, Terex owns approximately 15.5% of the outstanding shares of Konecranes and has two director representatives on the Konecranes Board.
See Note A – “Sale of MHPS Business” in the Notes to the Consolidated Financial Statements for further information regarding the sale of the MHPS business.
Truck Business
On May 30, 2014, the Company sold its truck business, which was consolidated in its former Construction segment, to Volvo Construction Equipment for approximately
$160 million
. The truck business manufactured and sold off-highway rigid and articulated haul trucks. Included in the transaction was the manufacturing facility in Motherwell, Scotland. As a result, the reporting of the truck business has been included in discontinued operations for all applicable periods presented.
See Note E – “Discontinued Operations and Assets and Liabilities Held for Sale” in the Notes to our Consolidated Financial Statements for more information on our discontinued operations.
BUSINESS STRATEGY
Terex is a specialized manufacturer of capital equipment and related services. Our goal is to design, manufacture and market equipment and services that provide superior life-cycle return on invested capital to our customers (“Customer ROIC”). Customer ROIC is a primary focus of our organization and is central to our ability to generate returns for investors.
6
We operate our business based on our value system, “The Terex Way.” The Terex Way values shape the culture of our Company and reflect our collective commitment to what it means to be a part of Terex. The Terex Way is based on six key values:
|
•
|
Integrity
:
Integrity reflects honesty, ethics, transparency and accountability. We are committed to maintaining high ethical standards in all of our business dealings and we never sacrifice our integrity for profit.
|
|
•
|
Respect
: Respect incorporates concern for safety, health, teamwork, diversity, inclusion and performance. We treat all our team members, customers and suppliers with respect and dignity.
|
|
•
|
Improvement
: Improvement encompasses quality, problem-solving systems, a continuous improvement culture and collaboration. We continuously search for new and better ways of doing things, focusing on continuous improvement and the elimination of waste.
|
|
•
|
Servant Leadership
: Servant leadership requires service to others, humility, authenticity and leading by example. We work to serve the needs of our customers, investors and team members.
|
|
•
|
Courage
: Courage entails willingness to take risks, responsibility, action and empowerment. We have the courage to make a difference even when it is difficult.
|
|
•
|
Citizenship
:
Citizenship means social responsibility and environmental stewardship. We comply with all laws, respect all people’s values and cultures, and are good global, national and local citizens.
|
During 2016, Terex began implementing a strategic transformation strategy that has three principal elements:
|
1.
|
Focus
the portfolio on businesses best positioned to generate returns above the cost of capital through the cycle.
|
|
2.
|
Simplify
company structure, systems and footprint to improve efficiency and enhance global competitiveness.
|
|
3.
|
Execute to Win
, driving process discipline, execution rigor, and accountability in core processes.
|
The “Focus” element of this strategy is to concentrate our business portfolio in product categories where we are among the top three competitors and a market leader. Where we are not among the market leaders our strategy has been to either divest those product lines or pursue a business strategy which we believe will enable us to become a market leader. Being among the leaders in a category is important as it implies a product offering that customers respect and an ability to generate returns that exceed our cost of capital. Work related to this strategic theme involves ongoing review of all businesses in the portfolio from the perspectives of market attractiveness and competitive position.
In pursuit of the focus element of our business strategy, our product portfolio has undergone significant change in recent years. We took several actions to focus the business portfolio. In particular, we strategically divested our former MHPS segment and we have also divested many of the businesses that comprised our former Construction segment.
Following the Disposition and sales of our former Construction segment product lines, Terex is a smaller company whose revenue is more concentrated in terms of both geographic and end market exposures. Our 2016 revenues, excluding divested businesses, were 51% North America, 27% Western Europe, and 22% other geographies. End-use mix is weighted towards construction and maintenance end-uses which represented more than 80% of 2016 revenue. Given anticipated economic conditions in the U.S. and Europe over the next several years, we believe that this mix of products offers meaningful near term opportunity for our Company. We do not currently anticipate major portfolio actions over the near term that would significantly alter our current business mix.
The “Simplify” element of the Terex strategy is centered on complexity reduction and cost management. Historically, Terex has grown through acquisitions and our businesses were generally operated autonomously. This resulted in a complex legal entity structure, multiple financial systems, and high organizational complexity. As part of our transformational strategy, we are addressing these issues and are implementing strategic initiatives to simplify our structure, footprint and processes. We are working to flatten and streamline the organization. We have undertaken a financial transformation that will simplify the way that we measure and manage the Company day-to-day. We are also simplifying the Company’s manufacturing footprint by reducing the number of production facilities, sharing facilities across businesses, and driving aggressive productivity improvement within the facilities that we operate. While the actions required to achieve these improvements are difficult, the benefits to both customers and shareholders are significant.
7
The third major theme of the Terex strategy is “Execute to Win” (“ETW”), which is a focus on three key management processes: Talent development, strategy development and deployment, and operational excellence. ETW represents a major change in the philosophy of our Company in terms of where and how work is done. Our goal is to become operationally excellent, balancing desire for business autonomy with the need for overall efficiency and relying on process excellence as a critical enabler of both business and company performance. We have identified three specific near-term transformational priorities in our implementation of Execute to Win.
|
1.
|
Lifecycle Solutions are comprehensive solutions that include our equipment and other offerings such as financing, spare parts, technical and repair services, operator training, and technology solutions that drive Customer ROIC.
|
|
2.
|
Commercial Excellence is about driving process discipline and execution in our commercial operations, such as sales, pricing, marketing, and sales support.
|
|
3.
|
Strategic Sourcing will involve implementing a standard, Terex-wide strategic sourcing process that will help us leverage our spending, thereby achieving lower costs from suppliers.
|
Each of these activities is being managed as a company-wide priority, with leadership from the center and support from within Terex businesses. Implementation involves a wide-ranging set of actions that are intended to deliver step-change performance improvement. These actions appropriately balance the unique needs of specific businesses with overall potential for efficiency and for leverage on investments. We are expecting major contributions in these three areas over the next one to three years as well as improved processes that will become foundational drivers for differentiating Terex in the years ahead.
Capital allocation is the final element of our overall strategy. We view capital allocation priorities (in order) as follows:
|
1.
|
Maintain an optimal capital structure (~2.5 x average net debt to EBITDA over the cycle)
|
|
2.
|
Organic growth investments (product & service development, maintenance capex, geographic expansion)
|
|
3.
|
Restructuring investments (general & administrative cost reduction, footprint rationalization)
|
|
4.
|
Efficient return of capital to shareholders (dividends and share repurchases)
|
PRODUCTS
AERIAL WORK PLATFORMS
AERIAL WORK PLATFORMS. Aerial work platform equipment safely positions workers and materials easily and quickly to elevated work areas to enhance productivity. These products have developed as alternatives to scaffolding and ladders. We offer a variety of aerial lifts that are categorized into six product families: portable material lifts; portable aerial work platforms; trailer-mounted articulating booms; self-propelled articulating and self-propelled telescopic booms; and scissor lifts.
|
•
|
Portable material lifts are used primarily indoors in the construction, industrial and theatrical markets.
|
|
•
|
Portable aerial work platforms are used primarily indoors in a variety of markets to perform overhead maintenance.
|
|
•
|
Trailer-mounted articulating booms are used both indoors and outdoors. They provide versatile reach, and have the ability to be towed between job sites.
|
|
•
|
Self-propelled articulating booms are primarily used in construction and industrial applications, both indoors and outdoors. They feature lifting versatility with up, out and over position capabilities to access difficult to reach overhead areas.
|
|
•
|
Self-propelled telescopic booms are used outdoors in commercial and industrial construction, as well as highway and bridge maintenance projects.
|
|
•
|
Scissor lifts are used in indoor and outdoor applications in a variety of construction, industrial and commercial settings.
|
TELEHANDLERS. Telehandlers move and place materials on residential and commercial construction sites and are used in the energy and infrastructure industries.
LIGHT TOWERS. Trailer-mounted light towers are used primarily to light work areas for construction, entertainment, emergency assistance and security during nighttime or low light applications.
8
CRANES
We offer a wide variety of cranes, including mobile telescopic cranes, lattice boom crawler cranes, tower cranes, and utility equipment.
MOBILE TELESCOPIC CRANES. Mobile telescopic cranes are used primarily for industrial applications, in commercial and public works construction, and in maintenance applications to lift equipment or material. We offer a complete line of mobile telescopic cranes, including rough terrain cranes, truck cranes, truck-mounted cranes (boom trucks), all terrain cranes and pick and carry cranes.
|
•
|
Rough terrain cranes move materials and equipment on rugged or uneven terrain and are often located on a single construction or work site for long periods. Rough terrain cranes cannot be driven on highways (other than in Italy) and accordingly must be transported by truck to the work site.
|
|
•
|
Truck cranes have two cabs and can travel rapidly from job site to job site at highway speeds. Truck cranes are often used for multiple local jobs, primarily in urban or suburban areas.
|
|
•
|
Truck-mounted cranes (boom trucks). We manufacture telescopic boom cranes and articulated hydraulic cranes for mounting on a commercial truck chassis. Truck-mounted cranes are used primarily in the construction and maintenance industries to lift equipment or materials to various heights. Boom trucks are generally lighter and have less lifting capacity than truck cranes, and are used for many of the same applications when lower lifting capacities are sufficient. An advantage of a boom truck is that the equipment or material to be lifted by the crane can be transported by the truck, which can travel at highway speeds. Applications include delivery of building materials and the installation of commercial air conditioners and other roof-mounted equipment, and the erection of transmission towers and substation equipment in the electrical grids.
|
|
•
|
All-terrain cranes are a cross between rough terrain and truck cranes, and are designed to travel across both rough terrain and highways.
|
|
•
|
Pick and carry cranes are designed for a wide variety of applications, including use at mine sites, large fabrication yards, building and construction sites and in machinery maintenance and installation. They combine high road speed with all-terrain capability.
|
LATTICE BOOM CRAWLER CRANES. Lattice boom crawler and lattice boom pedestal cranes are designed to lift material on rough terrain. The boom is made of tubular steel sections, which, together with the base unit, are transported to and erected at a construction site. Applications include infrastructure building, wind turbine erection, construction of nuclear power and petrochemical plants and heavy lifting within oil refineries and the construction industry.
TOWER CRANES. Tower cranes are often used in urban areas where space is constrained and in long-term or very high building sites. Tower cranes lift construction material and place the material at the point of use. We produce the following types of tower cranes:
|
•
|
Self-erecting tower cranes unfold from sections and can be trailer mounted; certain larger models have a telescopic tower and folding jib. These cranes can be assembled on site in a few hours. Applications include residential and small commercial construction.
|
|
•
|
Hammerhead tower cranes have a tower and a horizontal jib assembled from sections. The tower extends above the jib to which suspension cables supporting the jib are attached. These cranes are assembled on-site in one to three days depending on height, and can increase in height with the project.
|
|
•
|
Flat top tower cranes have a tower and a horizontal jib assembled from sections. There is no A-frame above the jib, which is self-supporting and consists of reinforced jib sections. These cranes are assembled on-site in one to two days, and can increase in height with the project.
|
|
•
|
Luffing jib tower cranes have a tower and an angled jib assembled from sections. There is one A-frame above the jib to which suspension cables supporting the jib are attached. Unlike other tower cranes, there is no trolley to control linear movement of the load, which is accomplished by changing the jib angle. These cranes are assembled on-site in two to three days, and can increase in height with the project.
|
9
UTILITY EQUIPMENT. Our utility products include digger derricks, auger drills, insulated and non-insulated aerial devices and cable placers. These products are used by electric utilities, tree care companies, telecommunications and cable companies, and the related construction industries, as well as by government organizations.
|
•
|
Digger derricks are insulated products used to dig holes, hoist and set utility poles, as well as lift transformers and other materials at job sites near energized power lines. Auger drills are used to dig holes for utility poles or construction foundations requiring larger diameter holes in difficult soil conditions.
|
|
•
|
Insulated aerial devices are used to elevate workers and material to work areas at the top of utility poles near energized transmission and distribution lines and for trimming trees near energized electrical lines, as well as for miscellaneous purposes such as sign maintenance. Non-insulated aerials are used in applications where energized electrical lines are not a hazard.
|
|
•
|
Cable placers are used to install fiber optic, copper and strand telephone and cable lines.
|
SERVICES. We offer a range of services for aerial work platform and utility equipment consisting of inspections, preventative maintenance, general repairs, reconditioning, refurbishment, modernization and spare parts, as well as consultancy and training services. Our services are provided on our own products and on third-party products and related equipment.
MATERIALS PROCESSING
Materials processing equipment is used in processing aggregate materials for building applications and is also used in the quarrying, mining, demolition, recycling, landscaping and biomass production industries. Our materials processing equipment includes crushers, screens and feeders, washing systems as well as wood and biomass chippers.
We manufacture a range of jaw, impactor (both horizontal and vertical shaft) and cone crushers, as well as base crushers for integration within mobile, modular and static plants.
|
•
|
Jaw crushers are used for crushing larger rock, primarily at the quarry face or on recycling duties. Applications include hard rock, sand and gravel and recycled materials. Cone crushers are used in secondary and tertiary applications to reduce a number of materials, including quarry rock and riverbed gravel.
|
|
•
|
Horizontal shaft impactors are primary and secondary crushers. They are typically applied to reduce soft to medium hard materials, as well as recycled materials. Vertical shaft impactors are secondary and tertiary crushers that reduce material utilizing various rotor configurations and are highly adaptable to any application.
|
Our screening and feeder equipment includes:
|
•
|
Heavy duty inclined and horizontal screens and feeders, which are used in low to high tonnage applications and are available as either stationary or heavy-duty mobile equipment. Screens are used in all phases of plant design from handling quarried material to fine screening. Dry screening is used to process materials such as sand, gravel, quarry rock, coal, ore, construction and demolition waste, soil, compost and wood chips.
|
|
•
|
Feeders are used to unload materials from hoppers and bulk material storage at controlled rates. They are available for applications ranging from primary feed hoppers to fine material bin unloading. Our range includes apron feeders, grizzly feeders and pan feeders.
|
Washing system products include mobile and static wash plants incorporating separation, washing, scrubbing, dewatering and stockpiling. We manufacture mobile and stationary rinsing screens, scrubbing systems, sand screw dewaterers, bucket-wheel dewaterers, hydrocyclone plants for efficient silt extraction and a range of stockpiling conveyors. Washing systems operate in the aggregates, recycling, mining and industrial sands segments.
Wood processing biomass and recycling equipment includes grinders, chippers, compost turners, shredders, and de-barker systems. This equipment is used in, among other things, the pulp and paper, wood energy, green waste/construction and demolition recycling industries.
10
SPECIALTY EQUIPMENT. We manufacture material handlers, concrete mixer trucks and concrete pavers.
|
•
|
Material handlers are designed for handling logs, scrap, recycling and other bulky materials with clamshell, magnet or grapple attachments.
|
|
•
|
Concrete mixer trucks are machines with a large revolving drum in which cement is mixed with other materials to make concrete. We offer models with custom chassis as well as rear discharge models mounted on commercial chassis, both with configurations from three to seven axles.
|
|
•
|
Our concrete pavers are used to finish bridges, concrete streets, highways and airport surfaces.
|
PRODUCT CATEGORY SALES
The following table lists our main product categories and their percentage of our total sales:
|
PERCENTAGE OF SALES
|
||||||||
|
PRODUCT CATEGORY
|
2016
|
2015
|
2014
|
|||||
|
Aerial Work Products
|
37
|
%
|
35
|
%
|
34
|
%
|
||
|
Mobile & Tower Cranes
|
19
|
|
22
|
|
23
|
|
||
|
Materials Processing Equipment
|
14
|
|
13
|
|
12
|
|
||
|
Specialty Equipment
|
9
|
|
7
|
|
6
|
|
||
|
Utility Equipment
|
7
|
|
7
|
|
6
|
|
||
|
Telehandlers & Light Construction Equipment
|
6
|
|
8
|
|
8
|
|
||
|
Compact Construction Equipment
(1)
|
6
|
|
6
|
|
9
|
|
||
|
Services
|
2
|
|
2
|
|
2
|
|
||
|
TOTAL
|
100
|
%
|
100
|
%
|
100
|
%
|
||
(1) During the fourth quarter of 2016, we sold the majority of the business that manufactured our compact construction equipment.
BACKLOG
Our backlog for continuing operations as of
December 31, 2016
and
2015
was as follows:
|
December 31,
|
|||||||
|
2016
|
2015
|
||||||
|
(in millions)
|
|||||||
|
AWP
|
$
|
506.1
|
|
$
|
569.7
|
|
|
|
Cranes
|
323.4
|
|
407.4
|
|
|||
|
MP
|
215.6
|
|
148.5
|
|
|||
|
Corporate and other
|
27.4
|
|
51.6
|
|
|||
|
Total
|
$
|
1,072.5
|
|
$
|
1,177.2
|
|
|
We define backlog as firm orders that are expected to be filled within one year, although there can be no assurance that all such backlog orders will be filled within that time. Our backlog orders represent primarily new equipment orders. Parts orders are generally filled on an as-ordered basis.
Our management views backlog as one of many indicators of the performance of our business. Because many variables can cause changes in backlog, and these changes may or may not be of any significance, we consequently view backlog as an important, but not necessarily determinative, indicator of future results. High backlog can indicate a high level of future sales; however, when backlogs are high, this may also reflect a high level of production delays, which may result in future order cancellations from disappointed customers. Low backlog may indicate less future sales; however, they may also reflect a rapid ability to fill orders that is appreciated by our customers.
11
Our overall backlog amounts at
December 31, 2016
decreased
$104.7 million
from our backlog amounts at
December 31, 2015
, primarily due to lower orders in AWP and Cranes and disposition of certain construction equipment product lines. The translation effect of foreign exchange rates negatively impacted backlog year-over-year by approximately 2%.
AWP segment backlog at
December 31, 2016
decreased approximately
11%
from our backlog amounts at
December 31, 2015
. This decrease from the prior year was primarily due to lower fleet orders from large North American rental customers.
The backlog at our Cranes segment decreased approximately
21%
from
December 31, 2015
. This decrease from the prior year was driven by the impact of low oil prices in North America and Middle East and caution in Europe tied to reduced wind power subsidies in Germany. Foreign exchange negatively impacted 2016 backlog by approximately 1% when compared to 2015.
Our MP segment backlog at
December 31, 2016
increased approximately
45%
from
December 31, 2015
. The increase in backlog over the prior year was primarily due to strong demand for concrete products in the U.S. and timing of orders for crushing and screening products. Foreign exchange negatively impacted 2016 backlog by approximately 7% when compared to 2015.
Corporate and other backlog at
December 31, 2016
decreased approximately
47%
from
December 31, 2015
, primarily due to disposition of our midi/mini excavators, wheeled excavators, compact wheel loaders, and components product lines in 2016.
DISTRIBUTION
We distribute our products through a global network of dealers, rental companies, major accounts and direct sales to customers.
AERIAL WORK PLATFORMS
Our aerial work platform, telehandler and light tower products are distributed principally through a global network of rental companies, independent distributors and, to a lesser extent, strategic accounts. We employ sales representatives who service these channel partners from offices located throughout the world.
CRANES
We market our crane products globally, optimizing assorted channel marketing systems, including a distribution network and a direct sales force. We have direct sales, primarily to specialized crane rental companies, in certain crane markets such as Australia, the United Kingdom, Germany, Spain, Belgium, Italy, France, Scandinavia and China to offer comprehensive service and support to customers. Distribution via a distributor network is often utilized in other geographic areas, including the United States and Canada where we also sell directly to key accounts.
We sell utility equipment to the utility and municipal markets through a direct sales effort in certain territories and through independent distributors in North America. Outside of North America, independent distributors sell our utility equipment directly to customers.
MATERIALS PROCESSING
We distribute our products through a global network of independent distributors, rental companies, major accounts and direct sales to customers.
RESEARCH, DEVELOPMENT AND ENGINEERING
We maintain engineering staff primarily at our manufacturing locations to conduct research, development and engineering for site-specific products. We have also established competency centers that support entire segments from single locations in certain fields such as control systems. Our businesses also assess global trends to understand future needs of our customers and help us decide which technologies to implement in future development projects. In addition, our engineering center in India supports our engineering teams worldwide through new product design, existing product design improvement and development of products for local markets. Continually monitoring our materials, manufacturing and engineering costs is essential to identify possible savings, then leverage those savings to improve our competitiveness and our customers’ return on investment. Our research, development and engineering expenses are primarily incurred to develop (i) additional applications and extensions of our existing product lines to meet customer needs and take advantage of growth opportunities, and (ii) customer responsive enhancements and continuous cost improvements of existing products.
12
Our engineering focus mirrors the business priorities of delivering customer responsive solutions, growing in developing markets, complying with evolving regulatory standards in our global markets and applying our lean manufacturing principles by standardizing products, rationalizing components and strategically aligning with select global suppliers. Our engineering teams in China and India represent our commitment to engineering products for developing markets. They take equipment technology from the developed markets and translate it to appropriate technology for developing markets using the experience and cultural understanding of engineering teams native to those markets.
Product change driven by regulations requiring Tier 4 emissions compliance in most of our diesel engine powered machinery has been an important part of our engineering priorities over the last several years and will continue to play a role in product development programs through 2017, although such role will be increasingly diminished as we move forward. We have increased our emphasis on creating new models and meeting the demands of our customers. We have also focused on producing more cost-effective product solutions across various segments.
Costs incurred to develop new products and improve existing products remained relatively flat in 2016 as compared to 2015, but decreased in 2015 as compared to 2014 due to completion of much of our Tier 4 conversion work, fewer project bids and the positive effects of changes in foreign exchange rates. We will continue our commitment to appropriate levels of research, development and engineering spending in order to meet our customer needs, uphold competitive functionality of our products and maintain regulatory compliance in all the markets that we serve.
MATERIALS
Information regarding principal materials, components and commodities and any risks associated with these items are included in Item 7A. – “Quantitative and Qualitative Disclosures about Market Risk – Commodities Risk.”
13
COMPETITION
We face a competitive global manufacturing market for all of our products. We compete with other manufacturers based on many factors, particularly price, performance and product reliability. We generally operate under a best value strategy, where we attempt to offer our customers products that are designed to improve customers’ return on invested capital. However, in some instances, customers may prefer the pricing, performance or reliability aspects of a competitor’s product despite our product pricing or performance. We do not have a single competitor across all business segments. The following table shows the primary competitors for our products in the following categories:
|
BUSINESS SEGMENT
|
PRODUCTS
|
PRIMARY COMPETITORS
|
||
|
Aerial Work Platforms
|
Portable Material Lifts and Portable Aerial Work Platforms
|
Oshkosh (JLG), Vestil, Sumner and Wesco
|
||
|
|
|
|
||
|
Boom Lifts
|
Oshkosh (JLG), Haulotte, Linamar (Skyjack), Xtreme/Tanfield (Snorkel) and Aichi
|
|||
|
Scissor Lifts
|
Oshkosh (JLG), Linamar (Skyjack), Haulotte, Manitou and Xtreme/Tanfield (Snorkel)
|
|||
|
|
|
|||
|
Telehandlers
|
Oshkosh (JLG, Skytrak, Caterpillar and Lull brands), JCB, CNH, Merlo and Manitou (Gehl)
|
|||
|
|
|
|||
|
Trailer-mounted Light Towers
|
Allmand Bros., Generac, Wacker Neuson
and Doosan
|
|||
|
Cranes
|
Mobile Telescopic Cranes
|
Liebherr, Manitowoc (Grove), Tadano-Faun, Sumitomo (Link-Belt), XCMG, Kato, Zoomlion and Sany
|
||
|
Tower Cranes
|
Liebherr, Manitowoc (Potain), Comansa, Jaso, Zoomlion, XCMG and Wolffkran
|
|||
|
|
|
|||
|
Lattice Boom Crawler Cranes
|
Manitowoc, Sumitomo (Link-Belt), Liebherr, Hitachi, Kobelco, XCMG, Zoomlion, Fushun and Sany
|
|||
|
|
|
|||
|
Lattice Boom Truck Cranes
|
Liebherr
|
|||
|
|
|
|||
|
Truck-Mounted Cranes
|
Manitowoc (National Crane), Altec and Manitex
|
|||
|
|
|
|||
|
Utility Equipment
|
Altec and Time Manufacturing
|
|||
|
Materials Processing
|
Crushing Equipment
|
Metso, Astec Industries, Sandvik, McCloskey, Komatsu and Kleemann
|
||
|
|
|
|
||
|
Screening Equipment
|
Metso, Astec Industries, McCloskey, Kleemann and Sandvik
|
|||
|
Washing systems
|
McLanahan, Astec Industries and CDE Global
|
|||
|
Wood processing biomass and recycling
|
Vermeer, Bandit, Morbark, Astec Industries, Doppstadt, Komptech and Hammell
|
|||
|
Material Handlers
|
Liebherr, Sennebogen, Linkbelt, Exodus and Caterpillar
|
|||
|
|
|
|||
|
Concrete Pavers
|
Gomaco, Wirtgen, Power Curbers and Guntert & Zimmerman
|
|||
|
Concrete Mixer Trucks
|
Oshkosh, Kimble and Continental Manufacturing
|
|||
MAJOR CUSTOMERS
None of our customers individually accounted for more than 10% of our consolidated net sales in
2016
. In
2016
, our largest customer accounted for less than
5%
of our consolidated net sales and our top ten customers in the aggregate accounted for less than
19%
of our consolidated net sales.
14
EMPLOYEES
As of
December 31, 2016
, we had approximately
11,300
employees (excluding approximately 6,800 MHPS employees); including approximately
4,900
employees in the U.S. Approximately
one
percent of our employees in the U.S. are represented by labor unions. Outside of the U.S., we enter into employment contracts and collective agreements in those countries in which such relationships are mandatory or customary. The provisions of these agreements correspond in each case with the required or customary terms in the subject jurisdiction. We generally consider our relations with our employees to be good.
PATENTS, LICENSES AND TRADEMARKS
We use proprietary materials such as patents, trademarks, trade secrets and trade names in our operations and take actions to protect these rights.
We use several significant trademarks and trade names, most notably the Terex
®
, Genie
®
, Demag
®
and Powerscreen
®
trademarks. The other trademarks and trade names that we use include registered trademarks of Terex Corporation or its subsidiaries. Demag
®
is a registered trademark of Demag IP Holdings GmbH, which is a joint venture owned 50% by Terex and 50% by Konecranes.
We have many patents that we use in connection with our operations, and most of our products contain some proprietary technology. Many of these patents and related proprietary technology are important to the production of particular products; however, overall, our patents, taken together, are not material to our business or our overall financial results.
Currently, we are engaged in various legal proceedings with respect to intellectual property rights. While the outcome of these matters cannot be predicted with certainty, we believe the outcome of such matters will not have a material adverse effect, individually or in the aggregate, on our business or operating performance. For more detail, see “Item 3 – Legal Proceedings.”
SAFETY AND ENVIRONMENTAL CONSIDERATIONS
As part of The Terex Way, we are committed to providing a safe and healthy environment for our team members, and strive to provide quality products that are safe to use and operate in an environmentally conscious and respectful manner.
We generate hazardous and non-hazardous wastes in the normal course of our manufacturing operations. As a result, we are subject to a wide range of environmental laws and regulations. All of our employees are required to obey all applicable health, safety and environmental laws and regulations and must observe proper safety rules and environmental practices in work situations. These laws and regulations govern actions that may have adverse environmental effects, such as discharges to air and water, and require compliance with certain practices when handling and disposing of hazardous and non-hazardous wastes. These laws and regulations would also impose liability for costs of, and damages resulting from, cleaning up sites, past spills, disposals and other releases of hazardous substances, should any of such events occur. We are committed to complying with these standards and monitoring our workplaces to determine if equipment, machinery and facilities meet specified safety standards. Each of our manufacturing facilities is subject to an environmental audit at least once every five years to monitor compliance and no incidents have occurred which required us to pay material amounts to comply with such laws and regulations. We are dedicated to seeing that safety and health hazards are adequately addressed through appropriate work practices, training and procedures. For example, we continue to reduce lost time injuries in the workplace and work toward a world-class level of safety practices in our industry.
We are dedicated to product safety when designing and manufacturing our equipment. Our equipment is designed to meet all applicable laws, regulations and industry standards for use in their markets. We continually incorporate safety improvements in our products. We maintain an internal product safety team that is dedicated to improving safety and investigating and resolving any product safety issues that arise.
The use and operation of our equipment in an environmentally conscious manner is a priority for us. We are aware of global discussions regarding climate change and the impact of greenhouse gas emissions on global warming. We are increasing our production of products that have lower greenhouse gas emissions in response to both regulatory initiatives and anticipated market demand trends. For example, starting in 2010, one of our most significant design priorities was to include Tier 4 emission compliant diesel engines in our machinery. This continued to be a priority in 2016 and will continue to play a role in our product development programs through 2017 (although such role will be diminished going forward) as we move through the engine-horsepower dependent phase-in of Tier 4 regulations across our diesel-engine equipped products. We manufacture a utility truck that uses plug-in electric hybrid technology to save fuel, reduce emissions and reduce noise in residential areas.
15
Increasing laws and regulations dealing with the environmental aspects of the products we manufacture can result in significant expenditures in designing and manufacturing new forms of equipment that satisfy such new laws and regulations. Compliance with laws and regulations regarding safety and the environment has required, and will continue to require, us to make expenditures. We currently do not expect these expenditures to have a material adverse effect on our business or results of operations.
FINANCIAL INFORMATION ABOUT INDUSTRY SEGMENTS, GEOGRAPHIC AREAS AND EXPORT SALES
Information regarding foreign and domestic operations, export sales and segment information is included in Note C – “Business Segment Information” in the Notes to the Consolidated Financial Statements.
SEASONAL FACTORS
Terex is a globally diverse company, supporting multiple end uses. Seasonality is a factor in some businesses, where annual purchasing patterns are impacted by the seasonality of downstream project spending. Specifically, our businesses can experience stronger demand during the second quarter, as customers in the northern hemisphere make investments in time for the annual construction season (April to October).
Non-seasonal macro factors are also important, however, and can surpass seasonal influences in importance in some years. Entering 2017, for example, we would expect the overall economic environment to have greater influence on our sales than historical seasonal trends. Industry-specific factors, like the AWP replacement cycle, will also be an important, non-seasonal driver of customer demand.
WORKING CAPITAL
Our businesses are working capital intensive and require funding to purchase production and replacement parts inventories, capital expenditures to repair, replace and upgrade existing facilities, as well as funding to finance receivables from customers and dealers. We have debt service requirements, including semi-annual interest payments on our outstanding notes and quarterly interest payments on our bank credit facility. We believe cash generated from operations, together with availability under our bank credit facility and cash on hand, provide us with adequate liquidity to meet our operating and debt service requirements. See Item 1A “Risk Factors” for a detailed description of the risks resulting from our debt and our ability to generate sufficient cash flow to operate our business. We will continue to pursue cash generation opportunities, including reducing costs and working capital, reviewing alternatives for under-utilized assets, and selectively investing in our businesses to promote growth opportunities.
AVAILABLE INFORMATION
We maintain a website at www.terex.com. We make available on our website under “About Terex” – “Investor Relations” – “SEC Filings,” free of charge, our annual reports on Form 10-K, quarterly reports on Form 10-Q, current reports on Form 8-K, and amendments to those reports as soon as reasonably practicable after we electronically file or furnish such material with the SEC. References to our website in this report are provided as a convenience, and the information on our website is not, and shall not be deemed to be a part of this report or incorporated into any other filings we make with the SEC. The public may read and copy any materials the Company has filed with the SEC at the SEC’s Public Reference Room at 100 F Street, N.E., Washington, DC 20549. The public may obtain information on the operation of the Public Reference Room by calling the SEC at (800) SEC-0330. The SEC maintains an Internet site (www.sec.gov) that contains reports, proxy and information statements, and other information regarding issuers that file electronically with the SEC. In addition, we make available on our website under “About Terex” – “Investor Relations” – “Corporate Governance,” free of charge, our Audit Committee Charter, Compensation Committee Charter, Governance and Nominating Committee Charter, Corporate Governance Guidelines and Code of Ethics and Conduct. In addition, the foregoing information is available in print, without charge, to any stockholder who requests these materials from us.
16
|
ITEM 1A.
|
RISK FACTORS
|
You should carefully consider the following risks, together with the cautionary statement under the caption “Forward-Looking Information” above and the other information included in this report. The risks described below are not the only ones we face. Additional risks that are currently unknown to us or that we currently consider immaterial may also impair our business or adversely affect our financial condition or results of operations. If any of the following risks actually occurs, our business, financial condition or results of operation could be adversely affected.
Our business is affected by the cyclical nature of markets we serve.
Demand for our products tends to be cyclical and is affected by the general strength of the economies in which we sell our products, prevailing interest rates, residential and non-residential construction spending, capital expenditure allocations of our customers and other factors. The global economy has continued to experience uneven recovery and financial uncertainty continues to exist, including as it relates to oil and gas prices. We cannot provide any assurance the global economic weakness of the recent past will not recur. Uncertainty related to the withdrawal of the United Kingdom (“U.K.”) from the European Union (“E.U.”) could also negatively impact the global economy, particularly many important European economies. Given the lack of comparable precedent, it is unclear what financial, trade and legal implications the withdrawal of the U.K. from the E.U. would have and how such withdrawal would affect us. Further, certain countries in Asia and Latin America have experienced slower growth rates and the Australian market has experienced declines. If the global economy weakens, it may cause customers to continue to forego or postpone new purchases in favor of reducing their existing fleets or refurbishing or repairing existing machinery.
Our sales depend in part upon our customers’ replacement or repair cycles, which is impacted in part by historical purchase levels. It is anticipated there will be reduced replacement demand in certain of our businesses, such as AWP, resulting from very low industry purchases in 2009 and 2010. In addition, if our customers are not successful in generating sufficient revenue or are precluded from securing financing, they may not be able to pay, or may delay payment of, accounts receivable owed to us. If the global economic weakness of the past several years continues or becomes more severe, or if any economic recovery progresses more slowly than our market expectations, then there could be an adverse effect on our net sales, financial condition, profitability and/or cash flow and could result in the need for us to record impairments.
We have a significant amount of debt outstanding and must comply with restrictive covenants in our debt agreements.
Our total debt at
December 31, 2016
was approximately
$1.6 billion
and after our announced debt repayments in 2017, our total debt will be approximately $1.0 billion. Our credit agreement and other debt agreements contain financial and restrictive covenants that may limit our ability to, among other things, borrow additional funds or take advantage of business opportunities. While we are currently in compliance with the financial covenants, increases in our debt or decreases in our earnings could cause us to fail to comply with these financial covenants. Failing to comply with such covenants could result in an event of default that, if not cured or waived, could result in the acceleration of all our indebtedness or otherwise have a material adverse effect on our financial position, results of operations and debt service capability.
Our level of debt and the financial and restrictive covenants contained in our credit agreement could have important consequences on our financial position and results of operations, including increasing our vulnerability to increases in interest rates because debt under our credit agreement bears interest at variable rates.
We may be unable to generate sufficient cash flow to service our debt obligations.
Servicing our debt requires a significant amount of cash. Our ability to generate sufficient cash depends on numerous factors beyond our control and our business may not generate sufficient cash flow from operating activities. Our ability to make payments on, and refinance, our debt and fund planned capital expenditures will depend on our ability to generate cash in the future. To some extent, this is subject to general economic, financial, competitive, legislative, regulatory and other factors that are beyond our control. Lower sales, or uncollectible receivables, generally will reduce our cash flow.
We cannot assure our business will generate sufficient cash flow from operations, or future borrowings will be available to us under our credit facility or otherwise, in an amount sufficient to fund our liquidity needs.
17
If our cash flows and capital resources are insufficient to service our indebtedness, we may be forced to reduce or delay capital expenditures, sell assets, seek additional capital or restructure or refinance our indebtedness. These alternative measures may not be successful and may not permit us to meet our scheduled debt service obligations. Our ability to restructure or refinance our debt will depend on the condition of the capital markets and our financial condition at such time. Any refinancing of our debt could be at higher interest rates and may require us to comply with more onerous covenants, which could further restrict our business operations.
Our access to capital markets and borrowing capacity could be limited in certain circumstances.
Our access to capital markets to raise funds through the sale of equity or debt securities is subject to various factors, including general economic and/or financial market conditions. Significant changes in market liquidity conditions could impact access to funding and associated funding costs, which could reduce our earnings and cash flows. If our consolidated cash flow coverage ratio is less than 2.0 to 1.0, we are subject to significant restrictions on the amount of indebtedness we can incur. Although our cash flow coverage ratio was greater than 2.0 to 1.0 at the end of 2016, there can be no assurance this will continue to occur.
Our access to debt financing at competitive risk-based interest rates is partly a function of our credit ratings. A downgrade to our credit ratings could increase our interest rates, could limit our access to public debt markets, could limit the institutions willing to provide us credit facilities, and could make any future credit facilities or credit facility amendments more costly and/or difficult to obtain.
Although we believe the banks participating in our credit facility have adequate capital and resources, we can provide no assurance that all of these banks will continue to operate as a going concern in the future. If any of the banks in our lending group were to fail or be unwilling to renew our credit facility at or prior to its expiration, it is possible that the borrowing capacity under our current or any future credit facility would be reduced. If the availability under our credit facility was reduced significantly, we could be required to obtain capital from alternate sources to finance our capital needs. Our options for addressing such capital constraints would include, but not be limited to (i) obtaining commitments from the remaining banks in the lending group or from new banks to fund increased amounts under the terms of our credit facility, or (ii) accessing the public capital markets. If it becomes necessary to access additional capital, it is possible that any such alternatives in the current market could be on terms less favorable than under our existing credit facility terms, which could have a negative impact on our consolidated financial position, results of operations or cash flows.
Our business is sensitive to government spending.
Many of our customers depend substantially on government funding of highway construction, maintenance and other infrastructure projects. In addition, we sell products to governments and government agencies in the U.S. and other nations. Policies of governments attempting to address local deficit or structural economic issues could have a material impact on our customers and markets. Any decrease or delay in government funding of highway construction and maintenance, other infrastructure projects and overall government spending could cause our revenues and profits to decrease.
We operate in a highly competitive industry.
Our industry is highly competitive. To compete successfully, our products must excel in terms of quality, reliability, productivity, price, features, ease of use, safety and comfort, and we must provide excellent customer service. The greater financial resources of certain of our competitors may put us at a competitive disadvantage. Low-cost competition from China and other developing markets could also result in decreased demand for our products. If competition in our industry intensifies or if our current competitors lower their prices for competing products, we may lose sales or be required to lower the prices we charge for our products. If we are unable to provide continued technological improvements in our equipment that meet our customers’ expectations, or the industry’s expectations, the demand for our equipment could be substantially adversely affected. Our ability to match new product offerings to diverse global customers’ anticipated preferences for different types and sizes of equipment and various equipment features and functionality, at affordable prices, is critical to our success. This requires a thorough understanding of our existing and potential customers on a global basis, particularly in developing markets, including Brazil, China and India. Failure to compete effectively with our competitors could result in lower revenues from our products and services, lower gross margins or cause us to lose market share.
We rely on key management.
We rely on the management and leadership skills of our senior management team, particularly those of the Chief Executive Officer. The loss of the services of key employees or senior officers, or the inability to identify, hire and retain other highly qualified personnel in the future, could adversely affect the quality and profitability of our business operations.
18
Some of our customers rely on financing with third parties to purchase our products.
We rely on sales of our products to generate cash from operations. Significant portions of our sales are financed by third party finance companies on behalf of our customers. The availability of financing by third parties is affected by general economic conditions, credit worthiness of our customers and estimated residual value of our equipment. Deterioration in credit quality of our customers or estimated residual value of our equipment could negatively impact the ability of our customers to obtain resources they need to purchase our equipment. Given current economic conditions, there can be no assurance third party finance companies will continue to extend credit to our customers.
Due to ongoing uncertainty in certain global economies, some of our customers have been unable to obtain the credit they need to buy our equipment. As a result, some of our customers may need to cancel existing orders. Given the lack of liquidity, our customers may be compelled to sell their equipment at less than fair value to raise cash, which could have a negative impact on residual values of our equipment. These economic conditions could have a material adverse effect on demand for our products and on our financial condition and operating results.
We provide financing and credit support for some of our customers.
We assist customers in their rental, leasing and acquisition of our products through TFS. We provide financing for some of our customers, primarily in the U.S., to acquire and use our equipment through loans, sales-type leases, and operating leases. TFS enters into these financing agreements with the intent either to hold the financing until maturity or to sell the financing to a third party within a short time period. Until such financing obligations are satisfied through either customer payments or a third party sale, we retain the risks associated with such customer financing. Our results could be adversely affected if such customers default on their contractual obligations to us, if residual values of such equipment on these transactions decline below original estimated values or we are unable to sell the financing receivable to a third party.
As described above, our customers, from time to time, may fund acquisition of our equipment through third-party finance companies. In certain instances, we may provide credit guarantees, residual value guarantees or buyback guarantees. With these guarantees, we must assess the probability of losses or non-performance in ways similar to the evaluation of accounts receivable, including consideration of a customer’s payment history, leverage, availability of third party financing, political and currency exchange risks, and other factors. Many of these factors, including assessment of a customer’s ability to pay, are influenced by economic and market factors that cannot be predicted with certainty. In circumstances where we believe it is probable that a specific customer will have difficulty meeting its financial obligations, a specific reserve is recorded to recognize a liability for a guarantee we expect to pay, taking into account any amounts that we would anticipate realizing if we are forced to repossess the equipment that supports the customer’s financial obligations to us. During periods of economic weakness, collateral underlying our guarantees of indebtedness of customers or receivables can decline sharply, thereby increasing our exposure to losses. In the future, we may incur losses in excess of our recorded reserves if the financial condition of our customers were to deteriorate further or the full amount of any anticipated proceeds from the sale of the collateral supporting our customers’ financial obligations is not realized. To date, losses related to guarantees have been negligible; however, there can be no assurance that our historical experience with respect to guarantees will be indicative of future results.
We may experience losses in excess of our recorded reserves for trade receivables.
As of
December 31, 2016
, we had trade receivables of
$512.5 million
. We evaluate the collectability of open accounts, finance receivables and note receivables based on a combination of factors and establish reserves based on our estimates of probable losses. In circumstances where we believe it is probable that a specific customer will have difficulty meeting its financial obligations, a specific reserve is recorded to reduce the net recognized receivable to the amount we expect to recover. We also establish additional reserves based upon our perception of the quality of the current receivables, the current financial position of our customers and past collections experience. Continued economic uncertainty could result in additional requirements for specific reserves, which could have a negative impact on our consolidated financial position.
19
Impairment in the carrying value of goodwill could negatively affect our operating results.
We have a significant amount of goodwill on our balance sheet as a result of acquisitions we have completed. Carrying value of goodwill represents fair value of an acquired business in excess of identifiable assets and liabilities as of the acquisition date. We evaluate goodwill for impairment at least annually, or more frequently if potential interim indicators exist that could result in impairment. In testing for impairment, if we believe, as a result of a qualitative assessment, that it is more likely than not that fair value of a reporting unit is less than its carrying amount, a quantitative two-step goodwill impairment test is required. In a two-step goodwill impairment test, if carrying value of a reporting unit exceeds its current fair value as determined based on the discounted future cash flows of the reporting unit and market comparable sales and earnings multiples, the goodwill is considered impaired and is reduced to fair value via a non-cash charge to earnings. Events and conditions that could result in impairment include a prolonged period of global economic weakness and tight credit markets, further decline in economic conditions or a slow, weak economic recovery, as well as sustained declines in the price of our common stock, adverse changes in interest rates, or other factors leading to reductions in the long-term sales or profitability that we expect. Determination of fair value of a reporting unit includes developing estimates which are highly subjective and incorporate calculations that are sensitive to minor changes in underlying assumptions. Management’s assumptions change as more information becomes available. Changes in these assumptions could result in additional impairment charges in the future, which could have a significant adverse impact on our reported earnings. In 2016, we recorded a $176.0 million impairment charge in our Cranes segment’s results to write down goodwill. For more information, see Note L – “Goodwill and Intangible Assets, Net” in the Notes to the Consolidated Financial Statements.
We are dependent upon third-party suppliers, making us vulnerable to supply shortages and price increases.
We obtain materials and manufactured components from third-party suppliers. In the absence of labor strikes or other unusual circumstances, substantially all materials and components are normally available from multiple suppliers. However, certain of our businesses receive materials and components from a single source supplier, although alternative suppliers of such materials are generally available. Delays in our suppliers’ abilities, especially any sole suppliers for a particular business, to provide us with necessary materials and components may delay production at a number of our manufacturing locations, or may require us to seek alternative supply sources. Delays in obtaining supplies may result from a number of factors affecting our suppliers, including capacity constraints, labor disputes, suppliers’ impaired financial condition, suppliers’ allocations to other purchasers, weather emergencies or acts of war or terrorism. Any delay in receiving supplies could impair our ability to deliver products to our customers and, accordingly, could have a material adverse effect on our business, results of operations and financial condition.
Principal materials and components used in our various manufacturing processes include steel, castings, engines, tires, hydraulics, cylinders, drive trains, electric controls and motors, and a variety of other commodities and fabricated or manufactured items. Extreme movements in the cost of these materials and components may affect our financial performance. If we are not able to recover increased raw material or component costs from our customers, our margins could be adversely affected.
In addition, we purchase material and services from our suppliers on terms extended based on our overall credit rating. Deterioration in our credit rating may impact suppliers’ willingness to extend terms and in turn increase the cash requirements of our business.
We are subject to currency fluctuations.
Our products are sold in over 100 countries around the world. The reporting currency for our consolidated financial statements is the U.S. dollar. Certain of our assets, liabilities, expenses, revenues and earnings are denominated in other countries’ currencies, including the euro, British Pound and Australian dollar. Those assets, liabilities, expenses, revenues and earnings are translated into U.S. dollars at the applicable exchange rates to prepare our consolidated financial statements. Therefore, increases or decreases in exchange rates between the U.S. dollar and those other currencies affect the value of those items as reflected in our consolidated financial statements, even if their value remains unchanged in their original currency. Due to the continued volatility of foreign currency exchange rates to the U.S. dollar, fluctuations in currency exchange rates may have an impact on the accuracy of our financial guidance. Such fluctuations in foreign currency rates relative to the U.S. dollar may cause our actual results to differ materially from those anticipated in our guidance and have a material adverse effect on our business or results of operations. In addition, as a result of the withdrawal of the U.K. from the E.U., the value of the British Pound has sharply declined as compared to the U.S. dollar and other currencies. This increased volatility in foreign currencies may continue as the U.K. negotiates and executes its exit from the E.U., but it is uncertain over what time period this will occur.
We may buy protecting or offsetting positions (known as “hedges”) in certain currencies to reduce the risk of an adverse currency exchange movement. We have not engaged in any speculative hedging activities. Although we partially hedge our revenues and costs, currency fluctuations may impact our financial performance in the future.
20
We are exposed to political, economic and other risks that arise from operating a multinational business.
Our operations are subject to a number of potential risks. Such risks principally include:
|
•
|
trade protection measures and currency exchange controls;
|
|
•
|
labor unrest;
|
|
•
|
global and regional economic conditions;
|
|
•
|
political instability;
|
|
•
|
terrorist activities and the U.S. and international response thereto;
|
|
•
|
restrictions on the transfer of funds into or out of a country;
|
|
•
|
export duties and quotas;
|
|
•
|
domestic and foreign customs and tariffs;
|
|
•
|
current and changing regulatory environments;
|
|
•
|
difficulties protecting our intellectual property;
|
|
•
|
transportation delays and interruptions;
|
|
•
|
costs and difficulties in integrating, staffing and managing international operations, especially in developing markets such as China, India, Brazil, Russia and the Middle East;
|
|
•
|
difficulty in obtaining distribution support; and
|
|
•
|
current and changing tax laws.
|
In addition, many of the nations in which we operate have developing legal and economic systems adding greater uncertainty to our operations in those countries than would be expected in North America and Western Europe. These factors may have an adverse effect on our international operations in the future.
We must comply with all applicable laws, including the Foreign Corrupt Practices Act (“FCPA”) and other laws that prohibit engaging in corruption for the purpose of obtaining or retaining business. These anti-corruption laws prohibit companies and their intermediaries from making improper payments or providing anything of value to improperly influence government officials or private individuals for the purpose of obtaining or retaining a business advantage regardless of whether those practices are legal or culturally expected in a particular jurisdiction. Our global activities and distribution model are subject to risk of corruption by our employees and in addition, our sales agents, distributors, dealers and other third parties that transact Terex business particularly because these parties are generally not subject to our control. We have an internal policy that expressly prohibits engaging in any commercial bribery and public corruption, including facilitation payments. We conduct corruption risk assessments, we have implemented training programs for our employees with respect to the Company’s prohibition against public corruption and commercial bribery, and we perform reputational due diligence on certain third parties that transact Terex business. In addition, we conduct transaction testing to assess compliance with our internal anti-corruption policy and procedures. However, we cannot assure you that our policies, procedures and programs always will protect us from reckless or criminal acts committed by our employees or third parties that transact Terex business. We have a zero tolerance policy for violations of anti-corruption laws and our anti-corruption policy. In the event we believe or have reason to believe our employees, agents, representatives, dealers or distributors or other third parties that transact Terex business have or may have violated applicable anti-corruption laws, including the FCPA, we investigate or have outside counsel investigate relevant facts and circumstances. Although we have a compliance program in place designed to reduce the likelihood of potential violations of such laws, any violations of the FCPA or other anti-corruption laws could result in significant fines, criminal sanctions against us or our employees, prohibitions on the conduct of our business including our business with the U.S. government, an adverse effect on our reputation, business and results of operations and financial condition and a violation of our injunction or cease and desist order with the SEC. See Risk Factor entitled, “We must comply with an injunction and related obligations resulting from the settlement of an SEC investigation.”
We continue to focus on operational improvement in developing markets such as China, India, Brazil and the Middle East. These efforts will require us to hire, train and retain qualified personnel in countries where language, cultural or regulatory barriers may exist. Any significant difficulties in continuing to improve or expand our operations in developing markets may divert management’s attention from our existing operations and require a greater level of resources than we plan to commit.
Expansion into developing markets may require modification of products to meet local requirements or preferences. Modification to the design of our products to meet local requirements and preferences may take longer or be more costly than we anticipate and could have a material adverse effect on our ability to achieve international sales growth.
21
A material disruption to one of our significant manufacturing plants could adversely affect our ability to generate revenue.
We produce most of our machines for each product type at one manufacturing facility. If operations at a significant facility were disrupted as a result of equipment failures, natural disasters, work stoppages, power outages or other reasons, our business, financial conditions and results of operations could be adversely affected. Interruptions in production could increase costs and delay delivery of units in production. Production capacity limits could cause us to reduce or delay sales efforts until production capacity is available.
We may be adversely impacted by work stoppages and other labor matters.
As of
December 31, 2016
, we employed approximately
11,300
people worldwide in our continuing operations businesses. While we have no reason to believe that we will be impacted by work stoppages or other labor matters, we cannot assure that future issues with our team members or labor unions will be resolved favorably or that we will not encounter future strikes, further unionization efforts or other types of conflicts with labor unions or our team members. Any of these factors may have an adverse effect on us or may limit our flexibility in dealing with our workforce.
Compliance with environmental regulations could be costly and require us to make significant expenditures.
We generate hazardous and nonhazardous wastes in the normal course of our manufacturing operations. As a result, we are subject to a wide range of environmental laws and regulations. These laws and regulations govern actions that may have adverse environmental effects and require compliance with certain practices when handling and disposing of hazardous and nonhazardous wastes. Some environmental laws impose strict, retroactive and joint and several liability for the remediation of the release of hazardous substances, which could subject us to liability without regard to whether we were negligent or at fault. Failure to comply with environmental laws could expose us to substantial fines or penalties and to civil and criminal liability. These liabilities, sanctions, damages and remediation efforts related to any non-compliance with such laws and regulations could have a material adverse effect on our business or results of operations. No such incidents have occurred which required us to pay material amounts to comply with such laws and regulations.
In addition, increasing laws and regulations dealing with environmental aspects of the products we manufacture can result in significant expenditures in designing and manufacturing new forms of equipment that satisfy such new laws and regulations. In particular, climate change is receiving increasing attention worldwide. Many scientists, legislators and others attribute climate change to increased levels of greenhouse gases, including carbon dioxide, which has led to significant legislative and regulatory efforts to limit greenhouse gas emissions. While additional regulation of emissions in the future appears likely, it is too early to predict how new regulations would ultimately affect our business, operations or financial results, although government policies limiting greenhouse gas emissions of our products will likely require increased compliance expenditures on our part.
We are also continuing the transition to Tier 4 power systems. While plans are in place to comply with the phase-in of Tier 4 regulations, we are dependent on our engine suppliers to continue to timely deliver. A failure to timely receive appropriate engines from our suppliers could result in our being placed in uncompetitive positions or without finished product when needed. Compliance with environmental laws and regulations has required, and will continue to require, us to make expenditures, however we do not expect these expenditures to have a material adverse effect on our business or results of operations.
We face litigation and product liability claims, class action lawsuits and other liabilities.
In our lines of business, numerous suits have been filed alleging damages for accidents that have occurred during use or operation of our products. We are self-insured, up to certain limits, for these product liability exposures, as well as for certain exposures related to general, workers’ compensation and automobile liability. We obtain insurance coverage for catastrophic losses as well as those risks where insurance is required by law or contract. We do not believe that the outcome of such matters will have a material adverse effect on our consolidated financial position; however, any significant liabilities not covered by insurance could have an adverse effect on our financial condition.
We are the subject of a securities class action lawsuit and a stockholder derivative lawsuit. These lawsuits generally cover the time period from February 2008 to February 2009 and allege, among other things, that certain of our SEC filings and other public statements contained false and misleading statements which resulted in damages to the plaintiffs and the members of the purported class when they purchased our securities and that there were breaches of fiduciary duties. We believe that the allegations in the suits are without merit, and Terex, its directors and the named executives will vigorously defend against them. We believe that we have acted, and continue to act, in compliance with federal securities laws with respect to these matters. However, the outcome of the lawsuits cannot be predicted and, if determined adversely, could ultimately result in us incurring significant liabilities.
22
In connection with the Company’s purchase of Demag Cranes AG (a component of MHPS), certain former shareholders of Demag Cranes AG initiated proceedings relating to (i) a domination and profit loss transfer agreement between Demag Cranes AG and Terex Germany GmbH & Co. KG (the “DPLA Proceeding”) and (ii) the squeeze out of the former Demag Cranes AG shareholders (the “Squeeze out Proceeding”) against the Company alleging that the Company did not pay fair value for the shares of Demag Cranes AG. The Company believes it did pay fair value for the shares of Demag Cranes AG and that no further payment from the Company to any former shareholders of Demag Cranes AG is required. The initial court ruling in the DPLA Proceeding was in favor of the Company and against the claimants ( i.e. no increase in compensation was owed to the former shareholders). However, the court did rule that the costs of the proceedings, including legal costs for both parties, would need to be borne by Terex. This initial court ruling in the DPLA Proceeding is being appealed. The Squeeze out Proceeding is still in the relatively early stages. While the Company believes the position of the former shareholders of Demag Cranes AG is without merit and is vigorously opposing it, no assurance can be given as to the final resolution of these disputes or that the Company will not ultimately be required to make an additional payment as a result of such disputes, which amount could be material.
We must comply with an injunction and related obligations imposed by the SEC.
We and our directors, officers and employees are required to comply at all times with the terms of a settlement with the SEC that includes an injunction barring us from committing or aiding and abetting any future violations of the anti-fraud, books and records, reporting and internal control provisions of the federal securities laws and related SEC rules. In addition, regarding a separate and unrelated SEC matter, we consented to the entry of an administrative cease and desist order prohibiting future violations of certain provisions of the federal securities laws. As a result, if we commit or aid or abet any future violations of the anti-fraud, books and records, reporting and internal control provisions of the federal securities laws and related SEC rules, we are likely to suffer severe penalties, financial and otherwise, that could have a material negative impact on our business and results of operations.
We may be adversely affected by disruption in, or breach in security of, our information technology systems.
We rely on information technology systems, some of which are managed by third parties, to process, transmit and store electronic information (including sensitive data such as confidential business information and personally identifiable data relating to employees, customers and other business partners), and to manage or support a variety of critical business processes and activities. These systems may be damaged, disrupted or shut down due to attacks by computer hackers, computer viruses, employee error or malfeasance, power outages, hardware failures, telecommunication or utility failures, catastrophes or other unforeseen events, and in any such circumstances our system redundancy and other disaster recovery planning may be ineffective or inadequate. A failure of or breach in information technology security could expose us and our customers, distributors and suppliers to risks of misuse of information or systems, the compromise of confidential information, manipulation and destruction of data, defective products, production downtimes and operations disruptions. In addition, such breaches in security could result in litigation, regulatory action and potential liability, as well as the costs and operational consequences of implementing further data protection measures, each of which could have a material adverse effect on our business or results of operations.
|
ITEM 1B.
|
UNRESOLVED STAFF COMMENTS
|
Not applicable.
23
|
ITEM 2.
|
PROPERTIES
|
As of
December 31, 2016
, our principal manufacturing, warehouse, service and office facilities comprised a total of approximately 9 million square feet of space worldwide. The following table outlines the principal manufacturing, warehouse, service and office facilities owned or leased (as indicated below) by the Company and its subsidiaries in relation to our continuing businesses:
|
BUSINESS UNIT
|
FACILITY LOCATION
|
BUSINESS UNIT
|
FACILITY LOCATION
|
|||
|
Terex (Corporate Offices)
|
Westport, Connecticut
(1)
|
MP
|
Louisville, Kentucky
|
|||
|
Schaeffhausen, Switzerland
|
Durand, Michigan
|
|||||
|
AWP
|
Oklahoma City, Oklahoma
|
Coalville, England
|
||||
|
Rock Hill, South Carolina
|
Hosur, India
|
|||||
|
Moses Lake, Washington
(1)
|
Subang Jaya, Malaysia
(1)
|
|||||
|
North Bend, Washington
(1)
|
Omagh, Northern Ireland
(1)
|
|||||
|
Redmond, Washington
(1)
|
Dungannon, Northern Ireland
(1)
|
|||||
|
Darra, Australia
(1)
|
Newton, New Hampshire
|
|||||
|
Changzhou, China
|
Ballymoney, Northern Ireland
|
|||||
|
Umbertide, Italy
|
Canton, South Dakota
|
|||||
|
Cranes
|
Watertown, South Dakota
(1)
|
Fort Wayne, Indiana
|
||||
|
Huron, South Dakota
|
Bad Schönborn, Germany
|
|||||
|
Brisbane, Australia
(1)
|
Corporate/Other
|
Southaven, Mississippi
(1)
|
||||
|
Betim, Brazil
(1) (2)
|
Coventry, England
(1) (2)
|
|||||
|
Jinan, China
(2)
|
Greater Noida, Uttar Pradesh, India
(1) (2)
|
|||||
|
Long Crendon, England
(1)
|
||||||
|
Montceau-les-Mines, France
(3)
|
||||||
|
Bierbach-Homburg, Germany
(1) (2)
|
||||||
|
Zweibrücken-Dinglerstrasse, Germany
(1)
|
||||||
|
Zweibrücken-Wallerscheid, Germany
(1)
|
||||||
|
Pecs, Hungary
(1) (2)
|
||||||
|
Crespellano, Italy
|
||||||
|
Fontanafredda, Italy
|
||||||
|
(1)
|
These facilities are either leased or subleased.
|
(2)
Plans have been announced to exit the business associated with these facilities.
(3)
This is a shared facility between Cranes and MHPS that was included in the Disposition.
We also have numerous owned or leased locations for new machine and parts sales and distribution and rebuilding of components located worldwide.
We believe the properties listed above are suitable and adequate for our use. We have determined that certain of our other properties exceed our requirements. Such properties may be sold, leased or utilized in another manner and have been excluded from the above list.
24
|
ITEM 3.
|
LEGAL PROCEEDINGS
|
General
We are involved in various legal proceedings, including product liability, general liability, workers’ compensation liability, employment, commercial and intellectual property litigation, which have arisen in the normal course of operations. We are insured for product liability, general liability, workers’ compensation, employer’s liability, property damage and other insurable risk required by law or contract with retained liability to us or deductibles. We believe the outcome of such matters, individually and in aggregate, will not have a material adverse effect on our consolidated financial position. However, the outcomes of lawsuits cannot be predicted and, if determined adversely, could ultimately result in us incurring significant liabilities which could have a material adverse effect on our results of operations.
For information concerning litigation and other contingencies and uncertainties, including our securities class action and stockholder derivative lawsuits as well as proceedings involving certain former shareholders of Demag Cranes AG, see Note S – “Litigation and Contingencies,” in the Notes to the Consolidated Financial Statements.
|
ITEM 4.
|
MINE SAFETY DISCLOSURE
|
Not applicable.
|
|
|
|
ITEM 5.
|
MARKET FOR THE REGISTRANT
’
S COMMON EQUITY RELATED STOCKHOLDER MATTERS AND ISSUER PURCHASES OF EQUITY SECURITIES
|
(a) Our common stock, par value $.01 per share (“Common Stock”) is listed on the NYSE under the symbol “TEX.” The high and low quarterly stock prices for our Common Stock on the NYSE Composite Tape (for the last two completed years) are as follows:
|
2016
|
2015
|
||||||||||||||||||||||||||||||
|
Fourth
|
Third
|
Second
|
First
|
Fourth
|
Third
|
Second
|
First
|
||||||||||||||||||||||||
|
High
|
$
|
33.17
|
|
$
|
25.66
|
|
$
|
25.57
|
|
$
|
25.38
|
|
$
|
22.76
|
|
$
|
27.11
|
|
$
|
29.32
|
|
$
|
28.53
|
|
|||||||
|
Low
|
$
|
21.88
|
|
$
|
19.49
|
|
$
|
18.91
|
|
$
|
13.62
|
|
$
|
17.29
|
|
$
|
16.54
|
|
$
|
22.25
|
|
$
|
22.01
|
|
|||||||
We declared and paid a
$0.07
per share dividend during each quarter of
2016
and
$0.06
during each quarter of
2015
. Certain of our debt agreements contain restrictions as to the payment of cash dividends to stockholders. In addition, Delaware law limits payment of dividends. We declared a dividend of $0.08 per share in the first quarter of
2017
, which will be paid in March 2017. However, any additional payments of cash dividends will depend upon our financial condition, capital requirements and earnings, as well as other factors that the Board of Directors may deem relevant.
As of
February 21, 2017
, there were
758
stockholders of record of our Common Stock.
Performance Graph
The following stock performance graph is intended to show our stock performance compared with that of comparable companies. The stock performance graph shows the change in market value of $100 invested in our Common Stock, the Standard & Poor’s 500 Stock Index, the 2016 Peer Group (as defined below) and the 2015 Peer Group (as defined below) for the period commencing December 31,
2011
through December 31,
2016
. The cumulative total stockholder return assumes dividends are reinvested. The stockholder return shown on the graph below is not indicative of future performance. The companies in the 2016 Peer Group and 2015 Peer Group are weighted by market capitalization. We have revised our peer group to match the peer group that is used by our Compensation Committee in benchmarking our executive officer’s compensation.
25
The 2015 Peer Group, used in last year’s Annual Report on Form 10-K, consists of the following companies that are in our same industry, of comparable revenue size to us and/or other manufacturing companies: AGCO Corporation, Cameron International Corporation, Carlisle Companies Inc., Crane Company, Cummins Inc., Dover Corporation, Flowserve Corporation, FMC Technologies, Inc., Hubbell Inc., Illinois Tool Works Inc., Ingersoll-Rand Plc, Joy Global Inc., Lennox International Inc., The Manitowoc Company, Inc., Meritor Inc., Navistar International Corporation, Oshkosh Corporation, Paccar Inc., Parker-Hannifin Corporation, Pentair Ltd., Rockwell Automation, Inc., Roper Technologies Inc., SPX Corporation, Textron Inc., Timken Company and Trinity Industries Inc.
The 2016 Peer Group consists of the same companies in the 2015 Peer Group with the following exceptions: Cameron International Corporation, Cummins Inc., Illinois Tool Works Inc., Ingersoll-Rand Plc, Paccar Inc., Parker-Hannifin Corporation, SPX Corporation and Textron Inc. were removed and Dana Incorporated and Westinghouse Air Brake Technologies Corporation were added.
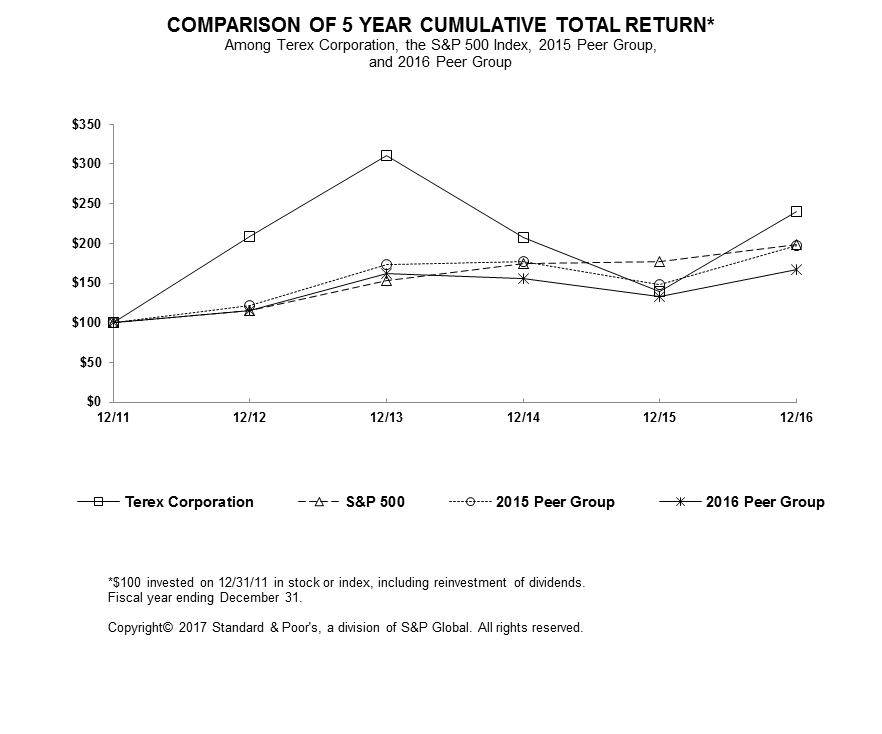
|
12/11
|
|
12/12
|
|
12/13
|
|
12/14
|
|
12/15
|
|
12/16
|
|
|
|
Terex Corporation
|
100.00
|
|
208.07
|
|
311.22
|
|
207.78
|
|
139.16
|
|
240.39
|
|
|
S&P 500
|
100.00
|
|
116.00
|
|
153.58
|
|
174.60
|
|
177.01
|
|
198.18
|
|
|
2015 Peer Group
|
100.00
|
|
122.22
|
|
173.30
|
|
176.80
|
|
148.72
|
|
197.76
|
|
|
2016 Peer Group
|
100.00
|
|
115.28
|
|
161.82
|
|
155.66
|
|
132.86
|
|
166.85
|
|
|
Copyright© 2016 Standard & Poor's, a division of The McGraw-Hill Companies Inc. All rights reserved. (www.researchdatagroup.com/S&P.htm)
|
||||||||||||
(b) Not applicable.
26
(c) The following table provides information about purchases during the quarter ended December 31,
2016
of our common stock that is registered by us pursuant to the Exchange Act.
|
Issuer Purchases of Equity Securities
|
||||||||
|
Period
|
(a) Total Number of Shares Purchased
|
(b) Average Price Paid per Share
|
(c) Total Number of Shares Purchased as Part of Publicly Announced Plans or Programs
(1)
|
(d) Approximate Dollar Value of Shares that May Yet be Purchased
Under the Plans or Programs (in thousands)
(1)
|
||||
|
October 1, 2016 – October 31, 2016
|
—
|
$—
|
—
|
$70,402
|
||||
|
November 1, 2016 – November 30, 2016
|
78,760 (2)
|
$22.69
|
74,760
|
$68,729
|
||||
|
December 1, 2016 – December 31, 2016
|
—
|
$—
|
—
|
$68,729
|
||||
|
Total
|
78,760
|
$22.69
|
74,760
|
$68,729
|
||||
|
(1)
|
In February 2015, our Board of Directors authorized and the Company publicly announced the repurchase of up to $200 million of the Company’s outstanding common shares.
|
|
(2)
|
In November 2016, the Company purchased 4,000 shares of common stock to satisfy requirements under its deferred compensation obligations to employees.
|
27
|
ITEM 6.
|
SELECTED FINANCIAL DATA
|
FIVE-YEAR SELECTED FINANCIAL DATA
The following table summarizes our selected financial data and should be read in conjunction with the more detailed Consolidated Financial Statements and related notes and Management’s Discussion and Analysis of Financial Condition and Results of Operations. This selected financial data includes comparative income statement data whose presentation has been retrospectively adjusted for the effects of discontinued operations. All periods are presented on a consistent basis.
(in millions, except per share amounts and employees)
|
AS OF OR FOR THE YEAR ENDED DECEMBER 31,
|
|||||||||||||||||||
|
2016
|
2015
|
2014
|
2013
|
2012
|
|||||||||||||||
|
SUMMARY OF OPERATIONS
|
|||||||||||||||||||
|
Net sales
|
$
|
4,443.1
|
|
$
|
5,021.7
|
|
$
|
5,484.0
|
|
$
|
5,344.5
|
|
$
|
5,217.4
|
|
||||
|
Income (loss) from operations
|
(147.8
|
)
|
323.7
|
|
400.0
|
|
418.6
|
|
327.3
|
|
|||||||||
|
Income (loss) from continuing operations
|
(193.3
|
)
|
128.2
|
|
252.0
|
|
222.1
|
|
70.5
|
|
|||||||||
|
Income (loss) from discontinued operations – net of tax
|
14.3
|
|
17.4
|
|
8.9
|
|
(3.8
|
)
|
32.7
|
|
|||||||||
|
Gain (loss) on disposition of discontinued operations – net of tax
|
3.5
|
|
3.4
|
|
58.6
|
|
2.6
|
|
0.4
|
|
|||||||||
|
Net income (loss) attributable to common stockholders
|
(176.1
|
)
|
145.9
|
|
319.0
|
|
226.0
|
|
105.8
|
|
|||||||||
|
Per Common and Common Equivalent Share:
|
|||||||||||||||||||
|
Basic attributable to common stockholders
|
|||||||||||||||||||
|
Income (loss) from continuing operations
|
$
|
(1.79
|
)
|
$
|
1.20
|
|
$
|
2.31
|
|
$
|
2.04
|
|
$
|
0.67
|
|
||||
|
Income (loss) from discontinued operations – net of tax
|
0.13
|
|
0.13
|
|
0.06
|
|
(0.03
|
)
|
0.29
|
|
|||||||||
|
Gain (loss) on disposition of discontinued operations – net of tax
|
0.03
|
|
0.03
|
|
0.54
|
|
0.02
|
|
—
|
|
|||||||||
|
Net income (loss) attributable to common stockholders
|
(1.63
|
)
|
1.36
|
|
2.91
|
|
2.03
|
|
0.96
|
|
|||||||||
|
Diluted attributable to common stockholders
|
|||||||||||||||||||
|
Income (loss) from continuing operations
|
$
|
(1.79
|
)
|
$
|
1.17
|
|
$
|
2.22
|
|
$
|
1.94
|
|
$
|
0.65
|
|
||||
|
Income (loss) from discontinued operations – net of tax
|
0.13
|
|
0.13
|
|
0.06
|
|
(0.03
|
)
|
0.28
|
|
|||||||||
|
Gain (loss) on disposition of discontinued operations – net of tax
|
0.03
|
|
0.03
|
|
0.51
|
|
0.02
|
|
—
|
|
|||||||||
|
Net income (loss) attributable to common stockholders
|
(1.63
|
)
|
1.33
|
|
2.79
|
|
1.93
|
|
0.93
|
|
|||||||||
|
CURRENT ASSETS AND LIABILITIES
(1)
|
|||||||||||||||||||
|
Current assets
(1)
|
$
|
2,700.5
|
|
$
|
3,140.2
|
|
$
|
3,352.3
|
|
$
|
3,633.9
|
|
$
|
3,791.4
|
|
||||
|
Current liabilities
|
1,407.0
|
|
1,458.6
|
|
1,643.0
|
|
1,724.7
|
|
1,708.8
|
|
|||||||||
|
PROPERTY, PLANT AND EQUIPMENT
|
|||||||||||||||||||
|
Net property, plant and equipment
|
$
|
304.6
|
|
$
|
371.9
|
|
$
|
339.7
|
|
$
|
373.2
|
|
$
|
382.3
|
|
||||
|
Capital expenditures
|
(58.1
|
)
|
(81.5
|
)
|
(58.3
|
)
|
(55.4
|
)
|
(48.1
|
)
|
|||||||||
|
Depreciation
|
65.5
|
|
63.9
|
|
70.4
|
|
68.9
|
|
64.7
|
|
|||||||||
|
TOTAL ASSETS
(1)
|
$
|
5,006.8
|
|
$
|
5,616.0
|
|
$
|
5,903.3
|
|
$
|
6,511.2
|
|
$
|
6,712.9
|
|
||||
|
CAPITALIZATION
|
|||||||||||||||||||
|
Long-term debt and notes payable (includes capital leases)
(1)
|
$
|
1,575.8
|
|
$
|
1,796.2
|
|
$
|
1,754.8
|
|
$
|
1,922.5
|
|
$
|
1,984.4
|
|
||||
|
Total Terex Corporation Stockholders’ Equity
|
1,484.7
|
|
1,877.4
|
|
2,005.9
|
|
2,190.1
|
|
2,007.7
|
|
|||||||||
|
Dividends per share of Common Stock
|
0.28
|
|
0.24
|
|
0.20
|
|
0.05
|
|
—
|
|
|||||||||
|
Shares of Common Stock outstanding at year end
|
105.0
|
|
107.7
|
|
105.4
|
|
109.9
|
|
109.9
|
|
|||||||||
|
EMPLOYEES
(2)
|
11,300
|
|
13,700
|
|
13,400
|
|
13,100
|
|
13,300
|
|
|||||||||
See “Management’s Discussion and Analysis of Financial Condition and Results of Operations” and the Notes to the Consolidated Financial Statements for a discussion of “Discontinued Operations,” “Dispositions,” “Goodwill,” “Long-Term Obligations” and “Stockholders’ Equity.”
(1) We adopted ASU 2015-03, “Imputation of Interest: Simplifying the Presentation of Debt Issuance Cost,” as of January 1, 2016 on a retrospective basis, by recasting all prior periods shown to reflect the effect of adoption on Current assets, Total assets and Long-term debt and notes payable (includes capital leases) in the above table, the effect of which is not material.
(2) Excludes approximately 6,800, 6,700, 7,000, 7,400 and 7,600 MHPS employees in years 2016, 2015, 2014, 2013 and 2012, respectively.
28
|
ITEM 7.
|
MANAGEMENT’S DISCUSSION AND ANALYSIS OF FINANCIAL CONDITION AND RESULTS OF OPERATIONS
|
BUSINESS DESCRIPTION
Terex is a global manufacturer of lifting and material processing products and services that deliver lifecycle solutions to maximize customer return on investment. The Company delivers lifecycle solutions to a broad range of industries, including the construction, infrastructure, manufacturing, shipping, transportation, refining, energy, utility, quarrying and mining industries. We report in three business segments: (i) AWP; (ii) Cranes; and (iii) MP. Please refer to Note B - “Basis of Presentation” and Note C - “Business Segment Information” in the accompanying Consolidated Financial Statements for a description of recent business reorganizations and segment descriptions.
Non-GAAP Measures
In this document, we refer to various GAAP (U.S. generally accepted accounting principles) and non-GAAP financial measures. These non-GAAP measures may not be comparable to similarly titled measures disclosed by other companies. We present non-GAAP financial measures in reporting our financial results to provide investors with additional analytical tools which we believe are useful in evaluating our operating results and the ongoing performance of our underlying businesses. We do not, nor do we suggest that investors consider such non-GAAP financial measures in isolation from, or as a substitute for, financial information prepared in accordance with GAAP.
Non-GAAP measures we may use include translation effect of foreign currency exchange rate changes on net sales, gross profit, selling, general & administrative (“SG&A”) costs and operating profit, as well as the net sales, gross profit, SG&A costs and operating profit excluding the impact of acquisitions.
As changes in foreign currency exchange rates have a non-operating impact on our financial results, we believe excluding effect of these changes assists in assessment of our business results between periods. We calculate the translation effect of foreign currency exchange rate changes by translating current period results at rates that the comparable prior periods were translated at to isolate the foreign exchange component of the fluctuation from the operational component. Similarly, the impact of changes in our results from acquisitions that were not included in comparable prior periods may be subtracted from the absolute change in results to allow for better comparability of results between periods.
We calculate a non-GAAP measure of free cash flow. We define free cash flow as Net cash provided by (used in) operating activities, plus (minus) increases (decreases) in Terex Financial Services (“TFS”) assets, plus (minus) decreases (increases) in cash balances held for settlement on securitized assets, less Capital expenditures. We believe that this measure of free cash flow provides management and investors further useful information on cash generation or use in our primary operations.
We discuss forward looking information related to expected earnings per share (“EPS”) excluding restructuring charges and other items. The Company’s 2017 outlook for earnings per share is a non-GAAP financial measure because it excludes items such as restructuring and other related charges, deal related costs, the impact of the release of tax valuation allowances and gains and losses on divestitures. The Company is not able to reconcile these forward-looking non-GAAP financial measures to their most directly comparable forward-looking GAAP financial measures without unreasonable efforts because the Company is unable to predict with a reasonable degree of certainty the exact timing and impact of such items. The unavailable information could have a significant impact on the Company’s full-year 2017 GAAP financial results. Adjusted EPS provides guidance to investors about our EPS expectations excluding restructuring and other charges that we do not believe are reflective of our ongoing operations.
Working capital is calculated using the Consolidated Balance Sheet amounts for Trade receivables (net of allowance) plus Inventories, less Trade accounts payable and Customer advances. We view excessive working capital as an inefficient use of resources, and seek to minimize the level of investment without adversely impacting the ongoing operations of the business. Trailing three month annualized net sales is calculated using the net sales for the most recent quarter end multiplied by four. The ratio calculated by dividing working capital by trailing three months annualized net sales, is a non-GAAP measure that we believe measures our resource use efficiency.
Non-GAAP measures we use also include Net Operating Profit After Tax (“NOPAT”) as adjusted, income (loss) before income taxes as adjusted, income (loss) from operations as adjusted, (benefit from) provision for income taxes as adjusted and stockholders’ equity as adjusted, which are used in the calculation of our after tax return on invested capital (“ROIC”) (collectively the “Non-GAAP Measures”), which are discussed in detail below.
29
Overview
We continue to work towards transforming Terex into a more focused company. We completed the sale of our German compact construction business during 2016 and the sale of our MHPS business in January 2017. We have also announced the sale of our dumper and backhoe loader business in Coventry, England. Recently, we announced that we have designated our Brazilian utilities and Indian loader backhoe businesses as held for sale. With these actions, we are nearing completion of the “Focus” phase of our strategy deployment.
Operationally, we had mixed results across our businesses in 2016. Our AWP and MP segments performed in line with our expectations, while our Cranes segment performance was impacted by more challenging markets than we anticipated. The overall market dynamic for large capital equipment continues to be challenging, and we do not see market conditions improving in the near future. Our overall 2016 results were negatively impacted by margin declines in our AWP and Cranes segments mostly due to sales volume reductions.
We continue to review all aspects of our cost structure and have continued to take actions throughout the entire Company to reduce costs, with emphasis on functional general and administrative costs. These actions have resulted in savings which have been critical to at least partially offset challenging market conditions. We have also taken actions to continue to rationalize our manufacturing footprint, consolidating facilities across all three of our segments. Since the beginning of 2016, we have either closed or sold eight facilities. We have also announced plans to sell or close an additional six locations and are in the process of reducing our footprint at our manufacturing complexes in Redmond, Washington and Zweibrucken, Germany. Leveraging our existing capacity is necessary for the market environment we are in and will help us become more globally cost competitive. We are also reducing our headcount in our global cranes business as we adjust to lower production volumes. See Note N - “Restructuring and Other Charges” in our Consolidated Financial Statements for more information on these actions.
Our AWP segment’s net sales and profitability declined year over year as the North American market declined on softer rental demand for aerials and telehandlers, while Europe was up modestly for the year. Sales volumes increased in the Asia Pacific region and the Latin American market was extremely weak. Operating margins in our AWP segment were lower primarily as a result of lower net sales volumes and global pricing dynamics, which were partially offset by manufacturing and SG&A cost reduction actions and geographical mix of sales. Looking ahead to 2017, the most influential market dynamic will continue to be the North American replacement cycle. While there is growth in non-residential construction in North America, this is more than offset by the dip in replacement demand as a result of the 2008 to 2010 market decline which is negatively impacting our sales and backlog. We expect Western Europe to remain fairly stable and believe the cost reduction actions we took in 2016, and the planned actions for 2017, will help align costs with the lower volumes expected in 2017.
Net sales and profitability in our Cranes segment declined year over year as the global crane market remains challenging for nearly all products and regions. The North American market remained weak, as low oil, gas and commodity prices continued to impact the sale of mobile cranes. The European market was hurt by changes in subsidies in the wind power market in Germany resulting in fewer large crawler crane sales. The Latin American, Australian and other commodity-driven markets were very weak and are expected to remain weak in 2017. Although our utilities products were down compared to last year, sales were profitable and we believe the North American utilities market is relatively stable. As described above, we have taken actions to improve the Cranes business, including reducing the Cranes footprint and cost structure and restructuring our Cranes leadership team in the fourth quarter of 2016. We do not expect the Cranes markets to improve in 2017.
Our MP segment’s operating profit improved on essentially flat net sales. Concrete equipment sales were up compared to last year. Crushing and screening equipment sales remained relatively flat, with the aggregates market growing slightly, and the mining-related market remaining weak. Our Fuchs scrap handling business was down, as was the market, driven by low steel scrap metal prices. Backlog for the segment is up compared to the prior year period, primarily due to strength in the mobile crushing and screening and North American concrete markets. Our mobile crushing and screening business is expected to remain stable and we continue to anticipate growth in our concrete products.
Geographically, our largest market remains North America, which now represents approximately 51% of our global sales in continuing operations. However, our North American sales declined 13% on a year-over-year basis, driven by softness in our AWP and mobile crane product categories. While the Asian/Pacific market grew, our other markets were generally down, with Latin America down significantly.
30
Net cash provided by operating activities was
$367.0 million
in 2016. We generated
$189.3 million
in free cash flow in 2016 (see reconciliation of net cash provided by operating activities to free cash flow in Liquidity and Capital Resources). In January 2017, we issued $600 million of 8-year senior unsecured notes and also refinanced our credit facility. As a result of these actions and our MHPS sale, we are in the process of repaying our higher cost long-term debt. This will result in debt reductions of approximately $600 million, interest rate reductions and extensions of debt maturities. In total, these actions will lower our interest run-rate by approximately $35 million annually. See “Liquidity and Capital Resources” for a detailed description of liquidity and working capital levels, including the primary factors affecting such levels.
We believe our liquidity continues to be sufficient to meet our business plans. See “Liquidity and Capital Resources” for a detailed description of liquidity and working capital levels, including the primary factors affecting such levels.
Looking ahead to 2017, we expect 2017 earnings per share (“EPS”) to be between $0.60 and $0.80, excluding restructuring and other unusual items on net sales of approximately $3.9 billion. Our EPS guidance assumes stock repurchases to cover equity compensation and no impact from our ownership interest in Konecranes.
ROIC
ROIC continues to be a metric we use to measure our performance. ROIC and Non-GAAP Measures assist in showing how effectively we utilize capital invested in our operations. After-tax ROIC is determined by dividing the sum of NOPAT for each of the previous four quarters by the average of the sum of Total Terex Corporation stockholders’ equity plus Debt (as defined below) less Cash and cash equivalents (as defined below) for the previous five quarters. NOPAT for each quarter is calculated by multiplying Income (loss) from continuing and discontinued operations by a figure equal to one minus the effective tax rate of the Company. We believe that earnings from discontinued operations, as well as the net assets that comprise those operations’ invested capital, should be included in this calculation because it captures the financial returns on our capital allocation decisions for the measured periods.
Furthermore, we believe returns on capital deployed in TFS do not represent our primary operations and, therefore, TFS assets and results from operations have been excluded from the Non-GAAP Measures. The effective tax rate is equal to the (Provision for) benefit from income taxes divided by Income (loss) from continuing operations before income taxes for the respective quarter. Debt is calculated using amounts for Notes payable and current portion of long-term debt plus Long-term debt, less current portion. We calculate ROIC using the last four quarters’ adjusted NOPAT as this represents the most recent 12-month period at any given point of determination. In order for the denominator of the ROIC ratio to properly match the operational period reflected in the numerator, we include the average of five quarters’ ending balance sheet amounts so that the denominator includes the average of the opening through ending balances (on a quarterly basis) thereby providing, over the same time period as the numerator, four quarters of average invested capital.
31
Terex management and Board of Directors use ROIC as one of the primary measures to assess operational performance, including in connection with certain compensation programs. We use ROIC as a metric because we believe it measures how effectively we invest our capital and provides a better measure to compare ourselves to peer companies to assist in assessing how we drive operational improvement. We believe ROIC measures return on the amount of capital invested in our primary businesses, excluding TFS, as opposed to another metric such as return on stockholders’ equity that only incorporates book equity, and is thus a more accurate and descriptive measure of our performance. We also believe adding Debt less Cash and cash equivalents to Total stockholders’ equity provides a better comparison across similar businesses regarding total capitalization, and ROIC highlights the level of value creation as a percentage of capital invested. As the tables below show, our ROIC at
December 31, 2016
was
17.7%
.
Amounts described below are reported in millions of U.S. dollars, except for the effective tax rates. Amounts are as of and for the three months ended for the periods referenced in the tables below.
|
Dec ’16
|
Sep '16
|
Jun '16
|
Mar '16
|
Dec ’15
|
|||||||||||
|
Provision for (benefit from) income taxes as adjusted
|
$
|
(3.5
|
)
|
$
|
(7.6
|
)
|
$
|
(61.4
|
)
|
$
|
5.0
|
|
|||
|
Divided by: Income (loss) before income taxes as adjusted
|
(269.9
|
)
|
89.7
|
|
3.1
|
|
(69.4
|
)
|
|||||||
|
Effective tax rate
|
1.3
|
%
|
(8.5
|
)%
|
(1,980.6
|
)%
|
(7.2
|
)%
|
|||||||
|
Income (loss) from operations as adjusted
|
$
|
(228.0
|
)
|
$
|
118.9
|
|
$
|
30.8
|
|
$
|
(43.4
|
)
|
|||
|
Multiplied by: 1 minus Effective tax rate
|
98.7
|
%
|
108.5
|
%
|
2,080.6
|
%
|
107.2
|
%
|
|||||||
|
Adjusted net operating income (loss) after tax
|
$
|
(225.0
|
)
|
$
|
129.0
|
|
$
|
640.8
|
|
$
|
(46.5
|
)
|
|||
|
Debt (as defined above) as adjusted
|
$
|
1,592.6
|
|
$
|
1,688.0
|
|
$
|
1,709.0
|
|
$
|
1,830.9
|
|
$
|
1,810.1
|
|
|
Less: Cash and cash equivalents as adjusted
|
(501.9
|
)
|
(343.7
|
)
|
(298.1
|
)
|
(323.6
|
)
|
(466.5
|
)
|
|||||
|
Debt less Cash and cash equivalents as adjusted
|
$
|
1,090.7
|
|
$
|
1,344.3
|
|
$
|
1,410.9
|
|
$
|
1,507.3
|
|
$
|
1,343.6
|
|
|
Total Terex Corporation stockholders’ equity as adjusted
|
$
|
1,246.2
|
|
$
|
1,588.1
|
|
$
|
1,527.2
|
|
$
|
1,501.0
|
|
$
|
1,528.0
|
|
|
Debt less Cash and cash equivalents plus Total Terex Corporation stockholders’ equity as adjusted
|
$
|
2,336.9
|
|
$
|
2,932.4
|
|
$
|
2,938.1
|
|
$
|
3,008.3
|
|
$
|
2,871.6
|
|
|
December 31, 2016 ROIC
|
17.7
|
%
|
|
|
NOPAT as adjusted (last 4 quarters)
|
$
|
498.3
|
|
|
Average Debt less Cash and cash equivalents plus Total Terex Corporation stockholders’ equity as adjusted (5 quarters)
|
$
|
2,817.5
|
|
32
|
Three months ended 12/31/16
|
Three months ended 9/30/16
|
Three months ended 06/30/16
|
Three months ended 03/31/16
|
||||||||||||
|
Reconciliation of Provision for (benefit from) income taxes:
|
|||||||||||||||
|
Provision for (benefit from) income taxes from continuing operations
|
5.1
|
|
(19.3
|
)
|
(67.1
|
)
|
3.9
|
|
|||||||
|
Provision for (benefit from) income taxes from discontinued operations
|
(8.6
|
)
|
11.7
|
|
5.7
|
|
1.1
|
|
|||||||
|
Provision for (benefit from) income taxes as adjusted
|
$
|
(3.5
|
)
|
$
|
(7.6
|
)
|
$
|
(61.4
|
)
|
$
|
5.0
|
|
|||
|
Reconciliation of Income (loss) before income taxes:
|
|
|
|
|
|||||||||||
|
Income (loss) before income taxes from continuing operations
|
(309.0
|
)
|
13.9
|
|
42.5
|
|
(18.1
|
)
|
|||||||
|
Income (loss) before income taxes from discontinued operations
|
39.1
|
|
75.8
|
|
(39.4
|
)
|
(51.3
|
)
|
|||||||
|
Income (loss) before income taxes from operations as adjusted
|
$
|
(269.9
|
)
|
$
|
89.7
|
|
$
|
3.1
|
|
$
|
(69.4
|
)
|
|||
|
Reconciliation of income (loss) from operations:
|
|||||||||||||||
|
Income (loss) from operations
|
$
|
(272.1
|
)
|
$
|
39.6
|
|
$
|
73.4
|
|
$
|
11.3
|
|
|||
|
Income (loss) from discontinued operations
|
50.8
|
|
79.5
|
|
(39.3
|
)
|
(53.0
|
)
|
|||||||
|
(Income) loss from operations for TFS
|
(6.7
|
)
|
(0.2
|
)
|
(3.3
|
)
|
(1.7
|
)
|
|||||||
|
Income (loss) from operations as adjusted
|
$
|
(228.0
|
)
|
$
|
118.9
|
|
$
|
30.8
|
|
$
|
(43.4
|
)
|
|||
|
As of 12/31/16
|
As of 9/30/16
|
As of 06/30/16
|
As of 03/31/16
|
As of 12/31/15
|
|||||||||||
|
Reconciliation of Cash and cash equivalents:
|
|||||||||||||||
|
Cash and cash equivalents from continuing operations
|
$
|
428.5
|
|
$
|
248.8
|
|
$
|
200.8
|
|
$
|
216.2
|
|
$
|
371.2
|
|
|
Cash and cash equivalents in assets held for sale
|
73.4
|
|
94.9
|
|
97.3
|
|
107.4
|
|
95.3
|
|
|||||
|
Cash and cash equivalents as adjusted
|
$
|
501.9
|
|
$
|
343.7
|
|
$
|
298.1
|
|
$
|
323.6
|
|
$
|
466.5
|
|
|
Reconciliation of Debt:
|
|||||||||||||||
|
Debt from continuing operations
|
$
|
1,575.8
|
|
$
|
1,663.5
|
|
$
|
1,686.3
|
|
$
|
1,809.1
|
|
$
|
1,796.2
|
|
|
Debt included in liabilities held for sale
|
16.8
|
|
24.5
|
|
22.7
|
|
21.8
|
|
13.9
|
|
|||||
|
Debt as adjusted
|
$
|
1,592.6
|
|
$
|
1,688.0
|
|
$
|
1,709.0
|
|
$
|
1,830.9
|
|
$
|
1,810.1
|
|
|
Reconciliation of Terex Corporation stockholders’ equity:
|
|||||||||||||||
|
Terex Corporation stockholders’ equity as reported
|
$
|
1,484.7
|
|
$
|
1,877.7
|
|
$
|
1,856.1
|
|
$
|
1,855.1
|
|
$
|
1,877.4
|
|
|
TFS Assets
|
(238.5
|
)
|
(289.6
|
)
|
(328.9
|
)
|
(354.1
|
)
|
(349.4
|
)
|
|||||
|
Terex Corporation stockholders’ equity as adjusted
|
$
|
1,246.2
|
|
$
|
1,588.1
|
|
$
|
1,527.2
|
|
$
|
1,501.0
|
|
$
|
1,528.0
|
|
Sale of MHPS Business
See Item 1,
Business,
and Note A – “Sale of MHPS Business” in the Notes to the Consolidated Financial Statements for further information regarding the sale of our former MHPS segment to Konecranes.
33
RESULTS OF OPERATIONS
2016
COMPARED WITH
2015
Terex Consolidated
|
|
2016
|
2015
|
|
|
||||||||||||
|
|
|
% of
Sales
|
|
% of
Sales
|
|
% Change In Reported Amounts
|
||||||||||
|
|
($ amounts in millions)
|
|
|
|||||||||||||
|
Net sales
|
$
|
4,443.1
|
|
—
|
|
$
|
5,021.7
|
|
—
|
|
|
(11.5
|
)%
|
|||
|
Gross profit
|
$
|
712.4
|
|
16.0
|
%
|
$
|
971.2
|
|
19.3
|
%
|
|
(26.6
|
)%
|
|||
|
SG&A
|
$
|
684.2
|
|
15.4
|
%
|
$
|
647.5
|
|
12.9
|
%
|
|
5.7
|
%
|
|||
|
Goodwill impairment
|
$
|
176.0
|
|
4.0
|
%
|
$
|
—
|
|
—
|
%
|
*
|
|
||||
|
Income (loss) from operations
|
$
|
(147.8
|
)
|
(3.3
|
)%
|
$
|
323.7
|
|
6.4
|
%
|
|
(145.7
|
)%
|
|||
|
*
|
Not meaningful as a percentage
|
Net sales for the year ended
December 31, 2016
decreased
$578.6 million
when compared to
2015
. The decline in net sales was driven by lower net sales in Cranes, AWP and in certain construction product lines in Corporate. Changes in foreign exchange rates negatively impacted consolidated net sales by approximately 2%, or $80 million. These declines were partially offset by net sales improvement in our MP segment.
Gross profit for the year ended
December 31, 2016
decreased
$258.8 million
when compared to
2015
. The decrease was primarily due to declines in gross profit in our Cranes and AWP segments, mostly due to lower sales volume and pricing reductions and approximately $70 million in severance expense in these two segments. We also recognized approximately $25 million of increased expense associated with inventory and warranty reserves, primarily in Cranes and AWP. Changes in foreign exchange rates negatively impacted gross profit in all segments, except Cranes. These decreases were partially offset by improved gross profit in our MP segment due to improved sales volumes and manufacturing cost improvements.
SG&A costs for the year ended
December 31, 2016
increased
$36.7 million
when compared to
2015
. The majority of the increase in SG&A costs was due to approximately $42 million of asset impairment charges in Corporate and Cranes, and approximately $33 million of severance costs in Cranes, AWP and Corporate, partially offset by general and administrative cost reductions across our business from actions taken in 2016 and positive impact of changes in foreign currency exchange rates.
Due to deteriorating market conditions in our Cranes segment, we recorded a non-cash impairment charge of approximately $176 million to write down the value of goodwill, which was recorded in the operating results of our Cranes segment in the year ended December 31, 2016.
Income from operations decreased by
$471.5 million
for the year ended
December 31, 2016
when compared to
2015
. The decrease was primarily due to the Cranes segment goodwill impairment charge, lower operating performance in the AWP and Cranes segments, for the reasons noted above, and severance and asset impairment charges in Cranes and Corporate.
34
Aerial Work Platforms
|
|
2016
|
2015
|
|
|
||||||||||||
|
|
|
% of
Sales
|
|
% of
Sales
|
|
% Change In Reported Amounts
|
||||||||||
|
|
($ amounts in millions)
|
|
|
|||||||||||||
|
Net sales
|
$
|
1,977.8
|
|
|
—
|
|
$
|
2,246.0
|
|
|
—
|
|
|
(11.9
|
)%
|
|
|
Income (loss) from operations
|
$
|
177.4
|
|
|
9.0
|
%
|
$
|
270.2
|
|
|
12.0
|
%
|
|
(34.3
|
)%
|
|
Net sales for the AWP segment for the year ended
December 31, 2016
decreased
$268.2 million
when compared to
2015
. Net sales decreased approximately $220 million due to volume declines primarily in North America and South America and pricing declines driven by market conditions and competition. The volume decline reflected softer aerial and telehandler sales primarily in North America, partially offset by stronger aerial volumes internationally. Approximately $26 million of the decline was due to declines in refurbishment service activity and approximately $22 million was due to negative impact of foreign exchange rate changes.
Income from operations for the year ended
December 31, 2016
decreased
$92.8 million
when compared to
2015
. The decrease was primarily due to sales volume declines, unfavorable pricing and severance expense, partially offset by better product mix, lower manufacturing costs and lower operating expenses, including selling, general and administrative expenses.
Cranes
|
|
2016
|
2015
|
|
|
||||||||||||
|
|
|
% of
Sales
|
|
% of
Sales
|
|
% Change In Reported Amounts
|
||||||||||
|
|
($ amounts in millions)
|
|
|
|||||||||||||
|
Net sales
|
$
|
1,274.5
|
|
|
—
|
|
$
|
1,566.5
|
|
|
—
|
|
|
(18.6
|
)%
|
|
|
Income (loss) from operations
|
$
|
(321.7
|
)
|
|
(25.2
|
)%
|
$
|
56.3
|
|
|
3.6
|
%
|
|
(671.4
|
)%
|
|
Net sales for the Cranes segment for the year ended
December 31, 2016
decreased by
$292.0 million
when compared to
2015
, as the global Cranes market remained challenging for nearly all products and regions. The North American market remained weak as low oil, gas and commodity prices continued to impact sales of mobile cranes. The European market was hurt by changes in subsidies in the wind power market in Germany, resulting in fewer large crawler crane sales. Latin American, Australian and other commodity driven markets were also weak in 2016.
Loss from operations for the year ended December 31, 2016 was $321.7 million compared to income from operations of $56.3 million for the same period in 2015. The decrease in operating performance was driven by an approximately $176 million goodwill impairment charge, approximately $82 million from sales volume declines and product mix noted above, approximately $92 million for severance and restructuring charges and approximately $20 million for asset impairment charges in Europe, Asia and the U.S, primarily associated with manufacturing facility closures to transfer production between facilities to improve labor efficiency and reduce overhead costs, and approximately $17 million of charges for increased warranty and inventory reserves. This decrease was partially offset by approximately $10 million of general and administrative expense reductions compared to the prior year period.
See Note L - “Goodwill and Intangible Assets, Net” in the accompanying Consolidated Financial Statements for more information about the goodwill impairment charge recognized in 2016.
35
Materials Processing
|
|
2016
|
2015
|
|
|
||||||||||||
|
|
|
% of
Sales
|
|
% of
Sales
|
|
% Change In Reported Amounts
|
||||||||||
|
|
($ amounts in millions)
|
|
|
|||||||||||||
|
Net sales
|
$
|
944.5
|
|
|
—
|
|
$
|
940.1
|
|
|
—
|
|
|
0.5
|
%
|
|
|
Income (loss) from operations
|
$
|
86.3
|
|
|
9.1
|
%
|
$
|
68.6
|
|
|
7.3
|
%
|
|
25.8
|
%
|
|
Net sales for the MP segment increased by
$4.4 million
for the year ended
December 31, 2016
when compared to
2015
. Net sales increased approximately $37 million due to the effect of an acquisition, increased volumes and favorable pricing, partially offset by approximately $33 million of negative impact of foreign exchange rate changes. Concrete equipment sales were up significantly compared to last year, crushing and screening equipment sales were slightly improved from the prior year, while mining-related and scrap handling equipment sales were weaker compared to last year.
Income from operations for the year ended
December 31, 2016
increased
$17.7 million
when compared to
2015
. The increase was driven primarily by increased sales volumes and favorable pricing, the effect of a supplier settlement and operating cost improvements, partially offset by negative impact of foreign exchange rate changes and an acquisition.
Corporate and Other/Eliminations
|
|
2016
|
2015
|
|
|
||||||||||||
|
|
|
% of
Sales
|
|
% of
Sales
|
|
% Change In Reported Amounts
|
||||||||||
|
|
($ amounts in millions)
|
|
|
|||||||||||||
|
Net sales
|
$
|
246.3
|
|
|
—
|
|
$
|
269.1
|
|
|
—
|
|
|
(8.5
|
)%
|
|
|
Income (loss) from operations
|
$
|
(89.8
|
)
|
|
*
|
|
$
|
(71.4
|
)
|
|
*
|
|
|
25.8
|
%
|
|
|
*
|
Not meaningful as a percentage
|
Net sales decreased by
$22.8 million
for the year ended December 31, 2016 when compared to 2015. The net sales amounts include sales in various construction product lines and on-book financing of TFS, as well as elimination of intercompany sales activity among segments. The net sales decrease is primarily attributable to product line divestitures and unfavorable foreign currency exchange rate changes in our construction product lines.
Loss from operations increased $18.4 million for the year ended December 31, 2016 compared to 2015, primarily due to approximately $22 million of asset impairment charges and approximately $4 million for severance expense, partially offset by general and administrative cost reductions and the positive impact of changes in foreign currency exchange rates.
Interest Expense, Net of Interest Income
During the year ended
December 31, 2016
, our interest expense, net of interest income, was
$97.7 million
, or
$6.6 million
lower than the prior year. The reduction resulted primarily from the settlement of the 4% Convertible Notes on June 1, 2015 and lower debt balances in the current year when compared to the prior year.
Other Income (Expense) — Net
Other income (expense) — net for the year ended
December 31, 2016
was expense of
$25.2 million
, an increase of
$1.5 million
when compared to expense of
$23.7 million
in the prior year. During 2016, we recognized approximately $25 million for impairments related to certain investments and approximately $20 million of merger and deal-related costs, partially offset by approximately $19 million of foreign currency exchange gains. The 2015 expense was driven primarily by approximately $15 million of merger and deal-related costs and approximately $6 million of foreign currency exchange losses.
36
Income Taxes
During the year ended
December 31, 2016
, we recognized an income tax benefit of
$77.4 million
on a loss of
$270.7 million
, an effective tax rate of
28.6%
, as compared to an income tax expense of
$67.5 million
on income of
$195.7 million
, an effective tax rate of
34.5%
, for the year ended
December 31, 2015
. The lower effective tax rate for the year ended December 31, 2016 was primarily due to changes caused by the Disposition in expectations concerning the indefinite reinvestment of foreign earnings and nondeductible goodwill impairment in our Cranes segment, partially offset by tax benefits from valuation allowance releases and prior year net operating loss carryforwards.
Income (Loss) from Discontinued Operations
Income from discontinued operations for the year ended
December 31, 2016
decreased by approximately
$3 million
when compared to the prior year primarily as a result of declining operating performance of our MHPS business.
Gain (Loss) on Disposition of Discontinued Operations
During the year ended December 31, 2016, we recognized a gain on disposition of discontinued operations - net of tax of $3.5 million related to the sale of our Atlas heavy construction equipment and knuckle-boom cranes businesses, due to contractual earnout payments, and from our truck business. During the year ended December 31, 2015 we recognized a gain on disposition of discontinued operations - net of tax of $3.4 million due primarily to a gain of $2.8 million related to the sale of our Atlas heavy construction equipment and knuckle-boom cranes businesses based on contractual earnout payments from the purchaser, partially offset by a loss of $1.3 million related to sale of our truck business, including settlement of certain disputes in the asset sale agreement.
2015
COMPARED WITH
2014
Terex Consolidated
|
|
2015
|
2014
|
|
|
||||||||||||
|
|
|
% of
Sales
|
|
% of
Sales
|
|
% Change In Reported Amounts
|
||||||||||
|
|
($ amounts in millions)
|
|
|
|||||||||||||
|
Net sales
|
$
|
5,021.7
|
|
—
|
|
$
|
5,484.0
|
|
—
|
|
|
(8.4
|
)%
|
|||
|
Gross profit
|
$
|
971.2
|
|
19.3
|
%
|
$
|
1,051.5
|
|
19.2
|
%
|
|
(7.6
|
)%
|
|||
|
SG&A
|
$
|
647.5
|
|
12.9
|
%
|
$
|
651.5
|
|
11.9
|
%
|
|
(0.6
|
)%
|
|||
|
Income (loss) from operations
|
$
|
323.7
|
|
6.4
|
%
|
$
|
400.0
|
|
7.3
|
%
|
|
(19.1
|
)%
|
|||
Net sales for the year ended
December 31, 2015
decreased
$462.3 million
when compared to
2014
. The decline in net sales was driven by lower net sales across all segments, except MP, with the largest declines coming from AWP and construction-related product lines within Corporate and Other. Changes in foreign exchange rates negatively impacted consolidated net sales by approximately 7% or $358 million. Net sales decreased by approximately $220 million due to the disposition of construction-related product lines in Corporate and Other. The declines were partially offset by approximately $124 million from acquired businesses in our MP and Cranes segments and improvements in certain product lines or regions in all of our segments.
Gross profit for the year ended
December 31, 2015
decreased
$80.3 million
when compared to
2014
. The decrease was primarily due to declines in all segments except MP, which delivered improved margins. Changes in foreign exchange rates negatively impacted gross profit in all segments, and sales volumes were down in all segments except for Cranes. These decreases were partially offset by reduced material and manufacturing costs.
SG&A costs for the year ended
December 31, 2015
decreased by
$4.0 million
when compared to
2014
. The decrease was primarily due to approximately $42 million of positive impact of changes in foreign exchange rates, partially offset by approximately $24 million of general and administrative cost increases and approximately $16 million from increased costs associated with acquired businesses in MP and Cranes.
Income from operations decreased by
$76.3 million
for the year ended
December 31, 2015
when compared to
2014
. The decrease was primarily due to lower operating performance in the AWP and Cranes segments.
37
Aerial Work Platforms
|
|
2015
|
2014
|
|
|
||||||||||||
|
|
|
% of
Sales
|
|
% of
Sales
|
|
% Change In Reported Amounts
|
||||||||||
|
|
($ amounts in millions)
|
|
|
|||||||||||||
|
Net sales
|
$
|
2,246.0
|
|
|
—
|
|
$
|
2,403.0
|
|
|
—
|
|
|
(6.5
|
)%
|
|
|
Income (loss) from operations
|
$
|
270.2
|
|
|
12.0
|
%
|
$
|
304.9
|
|
|
12.7
|
%
|
|
(11.4
|
)%
|
|
Net sales for the AWP segment for the year ended
December 31, 2015
decreased
$157.0 million
when compared to
2014
. Net sales decreased approximately $82 million due to the negative impact of foreign exchange rate changes. North American net sales decreased due to lower pricing and softening demand for telehandlers and aerials, which were impacted by the uncertainty surrounding oil and gas markets. Sales in Latin America were lower due to the continuing impact of economic uncertainties in Brazil as well as softer pricing. These decreases were partially offset by increased net sales in Europe due to robust replacement demand and increased product adoption in China.
Income from operations for the year ended
December 31, 2015
decreased
$34.7 million
when compared to
2014
. The decrease was due to declines in net sales noted above, as well as unfavorable pricing, and negative impact from foreign exchange rate changes. These decreases were partially offset by lower material costs and reduced manufacturing costs associated with decreased indirect labor.
Cranes
|
|
2015
|
2014
|
|
|
||||||||||||
|
|
|
% of
Sales
|
|
% of
Sales
|
|
% Change In Reported Amounts
|
||||||||||
|
|
($ amounts in millions)
|
|
|
|||||||||||||
|
Net sales
|
$
|
1,566.5
|
|
|
—
|
|
$
|
1,656.9
|
|
|
—
|
|
|
(5.5
|
)%
|
|
|
Income (loss) from operations
|
$
|
56.3
|
|
|
3.6
|
%
|
$
|
83.8
|
|
|
5.1
|
%
|
|
(32.8
|
)%
|
|
Net sales for the Cranes segment for the year ended
December 31, 2015
decreased by
$90.4 million
when compared to
2014
. Net sales decreased approximately $172 million due to the negative impact of foreign exchange rate changes. Lower demand for mobile cranes in North America and Australia, largely due to declines in oil, gas and commodity prices, also contributed to the decrease in net sales. These decreases were partially offset by higher cranes product sales in Europe and Asia and the contribution from an acquired business of approximately $73 million.
Income from operations for the year ended
December 31, 2015
decreased
$27.5 million
when compared to
2014
, resulting primarily from approximately $16 million of foreign exchange rate changes and approximately $15 million from lower factory utilization.
38
Materials Processing
|
|
2015
|
2014
|
|
|
||||||||||||
|
|
|
% of
Sales
|
|
% of
Sales
|
|
% Change In Reported Amounts
|
||||||||||
|
|
($ amounts in millions)
|
|
|
|||||||||||||
|
Net sales
|
$
|
940.1
|
|
|
—
|
|
$
|
938.9
|
|
|
—
|
|
|
0.1
|
%
|
|
|
Income (loss) from operations
|
$
|
68.6
|
|
|
7.3
|
%
|
$
|
65.6
|
|
|
7.0
|
%
|
|
4.6
|
%
|
|
Net sales in the MP segment increased by
$1.2 million
for the year ended
December 31, 2015
when compared to
2014
. The increase was primarily due to approximately $51 million from acquired businesses and increased sales in India, partially offset by approximately $44 million from negative impact of foreign exchange rate changes. Concrete equipment sales were up significantly in 2015 compared to 2014, but these volume increases were more than offset by weakness in product sales in mining-related markets.
Income from operations for the year ended
December 31, 2015
increased
$3.0 million
when compared to
2014
. The increase was driven by approximately $11 million of manufacturing cost savings, partially offset by approximately $9 million from negative impact of foreign exchange rate changes.
Corporate and Other/Eliminations
|
|
2015
|
2014
|
|
|
|||||||||||
|
|
|
% of
Sales
|
|
% of
Sales
|
|
% Change In Reported Amounts
|
|||||||||
|
|
($ amounts in millions)
|
|
|
||||||||||||
|
Net sales
|
$
|
269.1
|
|
|
—
|
|
$
|
485.2
|
|
|
—
|
|
|
*
|
|
|
Income (loss) from operations
|
$
|
(71.4
|
)
|
|
*
|
|
$
|
(54.3
|
)
|
|
*
|
|
|
*
|
|
* Not meaningful as a percentage
Net sales decreased by $216.1 million for the year ended December 31, 2015 when compared to 2014. Net sales amounts include sales in various construction equipment product lines and on-book financing of TFS, as well as elimination of intercompany sales activity among segments. Net sales decreased by approximately $220 million due to the disposition of our majority interest in the compact track loader business in the fourth quarter of 2014, unfavorable foreign currency exchange rate changes, and reduced compact construction sales in Germany and India. Partially offsetting these decreases were increased site dumper sales in the U.K.
Loss from operations increased $17.1 million for the year ended December 31, 2015 compared to 2014. The increased operating loss was primarily from lower net sales in construction product lines, which drove a reduction of approximately $15 million from lower volume, and the business divestiture noted above, partially offset by favorable pricing and sales mix.
Interest Expense, Net of Interest Income
During the year ended
December 31, 2015
, our interest expense net of interest income was
$104.3 million
, or
$12.4 million
lower than the prior year. The reduction resulted from the settlement of the 4% Convertible Notes on June 1, 2015 and lower effective interest rates in the current year.
Other Income (Expense) — Net
Other income (expense) — net for the year ended
December 31, 2015
was expense of
$23.7 million
, an increase of
$19.0 million
when compared to expense of
$4.7 million
in the prior year. During 2015, we recognized approximately $15 million of merger and deal-related costs and approximately $6 million of foreign currency exchange losses. In 2014, the expense was primarily attributable to a loss of $2.6 million on early extinguishment of debt related to termination of our 2011 Credit Agreement and foreign currency exchange losses.
39
Income Taxes
During the year ended
December 31, 2015
, we recognized income tax expense of
$67.5 million
on income of
$195.7 million
, an effective tax rate of
34.5%
, as compared to income tax expense of
$26.6 million
on income of
$278.6 million
, an effective tax rate of
9.5%
, for the year ended
December 31, 2014
. The higher effective tax rate for the year ended December 31, 2015 was primarily due to tax benefits derived from divestitures in the year ended December 31, 2014, and increased losses in 2015 that did not produce tax benefits, partially offset by a favorable geographic mix of earnings in 2015.
Income (Loss) from Discontinued Operations
Income from discontinued operations for the year ended
December 31, 2015
increased by approximately
$8.5 million
when compared to the prior year primarily as a result of improved operating performance of our MHPS business due to lower restructuring charges and loss from sale of an entity, despite approximately $35 million of goodwill and intangible asset impairment charges in 2015.
Gain (Loss) on Disposition of Discontinued Operations
Gain on disposition of discontinued operations decreased by
$55.2 million
primarily due to the sale of the truck business in the year ended
December 31, 2014
.
CRITICAL ACCOUNTING POLICIES
The preparation of financial statements in conformity with generally accepted accounting principles requires management to make estimates and assumptions that affect reported amounts of assets and liabilities and, disclosure of contingent assets and liabilities at the date of the financial statements and reported amounts of revenues and expenses during the reporting period. Changes in estimates and assumptions used by management could have significant impacts on our financial results. Actual results could differ from those estimates.
We believe that the following are among our most significant accounting policies which are important in determining the reporting of transactions and events and which utilize estimates about the effect of matters that are inherently uncertain and therefore are based on management judgment. Please refer to Note B – “Basis of Presentation” in the accompanying Consolidated Financial Statements for a complete listing of our accounting policies.
Inventories
–
In valuing inventory, we are required to make assumptions regarding level of reserves required to value potentially obsolete or over-valued items at the lower of cost or market. These assumptions require us to analyze the aging of and forecasted demand for our inventory, forecast future products sales prices, pricing trends and margins, and to make judgments and estimates regarding obsolete or excess inventory. Future product sales prices, pricing trends and margins are based on the best available information at that time including actual orders received, negotiations with our customers for future orders, including their plans for expenditures, and market trends for similar products. Our judgments and estimates for excess or obsolete inventory are based on analysis of actual and forecasted usage. Valuation of used equipment taken in trade from customers requires us to use the best information available to determine the value of the equipment to potential customers. This value is subject to change based on numerous conditions. Inventory reserves are established taking into account age, frequency of use, or sale, and in the case of repair parts, the installed base of machines. While calculations are made involving these factors, significant management judgment regarding expectations for future events is involved. Future events that could significantly influence our judgment and related estimates include general economic conditions in markets where our products are sold, new equipment price fluctuations, actions of our competitors, including introduction of new products and technological advances, as well as new products and design changes we introduce. We make adjustments to our inventory reserve based on the identification of specific situations and increase our inventory reserves accordingly. As further changes in future economic or industry conditions occur, we will revise estimates that were used to calculate our inventory reserves.
If actual conditions are less favorable than those we have projected, we will increase our reserves for lower of cost or market (“LCM”), excess and obsolete inventory accordingly. Any increase in our reserves will adversely impact our results of operations. Establishment of a reserve for LCM, excess and obsolete inventory establishes a new cost basis in the inventory. Such reserves are not reduced until the product is sold.
40
Accounts Receivable
–
We are required to judge our ability to collect accounts receivable from our customers. Valuation of receivables includes evaluating customer payment histories, customer leverage, availability of third-party financing, political and exchange risks and other factors. Many of these factors, including assessment of a customer’s ability to pay, are influenced by economic and market factors that cannot be predicted with certainty. Given current economic conditions, there can be no assurance our historical accounts receivable collection experience will be indicative of future results.
Guarantees
–
As of
December 31, 2016
, we have issued guarantees to financial institutions related to customer financing of equipment purchases by our customers. We must assess the probability of losses or non-performance in ways similar to the evaluation of accounts receivable, including consideration of a customer’s payment history, leverage, availability of third party financing, political and exchange risks, and other factors. Many of these factors, including the assessment of a customer’s ability to pay, are influenced by economic and market factors that cannot be predicted with certainty.
Our customers, from time to time, may fund acquisition of our equipment through third-party finance companies. In certain instances, we may provide a credit guarantee to the finance company by which we agree to make payments to the finance company should the customer default. Our maximum liability is limited to the remaining payments due to the finance company at the time of default. In the event of customer default, we have generally been able to recover and dispose of the equipment at a minimum loss, if any, to us. There can be no assurance that our historical credit default experience will be indicative of future results. Our ability to recover losses experienced from our guarantees may be affected by economic conditions in effect at time of loss.
We issue residual value guarantees under sales-type leases. A residual value guarantee involves a guarantee that a piece of equipment will have a minimum fair market value at a future point in time. We are generally able to mitigate risk associated with these guarantees because the maturity of the guarantees is staggered, which limits the amount of used equipment entering the marketplace at any one time.
We guarantee, from time to time, that we will buy equipment from our customers in the future at a stated price if certain conditions are met by the customer. Such guarantees are referred to as buyback guarantees. These conditions generally pertain to the functionality and state of repair of the machine. We are generally able to mitigate the risk of these guarantees because maturity of guarantees is staggered, limiting the amount of used equipment entering the marketplace at any one time, and through leveraging our access to the used equipment markets provided by our original equipment manufacturer status.
We record a liability for the estimated fair value of guarantees issued pursuant to Financial Accounting Standards Board (“FASB”) Accounting Standards Codification (“ASC”) 460, “Guarantees” (“ASC 460”). We recognize a loss under a guarantee when our obligation to make payment under the guarantee is probable and the amount of the loss can be estimated. A loss would be recognized if our payment obligation under the guarantee exceeds the value we could expect to recover to offset such payment, primarily through the sale of the equipment underlying the guarantee.
There can be no assurances that our historical experience in used equipment markets will be indicative of future results. Our ability to recover losses experienced from our guarantees may be affected by economic conditions in used equipment markets at the time of loss.
See Note S – “Litigation and Contingencies” in the Notes to the Consolidated Financial Statements for further information regarding our guarantees.
Revenue Recognition
– Revenue and related costs are generally recorded when products are shipped and invoiced to either independently owned and operated dealers or to end-customers.
Revenue generated in the United States is recognized when title and risk of loss pass from us to our customers, which generally occurs upon shipment depending upon the shipping terms negotiated. We also have a policy requiring that certain criteria be met in order to recognize revenue, including satisfaction of the following requirements:
|
a)
|
Persuasive evidence that an arrangement exists;
|
|
b)
|
The price to the buyer is fixed or determinable;
|
|
c)
|
Collectability is reasonably assured; and
|
|
d)
|
We have no significant obligations for future performance.
|
41
In the United States, we have the ability to enter into a security agreement and receive a security interest in the product by filing an appropriate Uniform Commercial Code (“UCC”) financing statement. However, a significant portion of our revenue is generated outside of the United States. In many countries outside of the United States, as a matter of statutory law, a seller retains title to a product until payment is made. The laws do not provide for a seller’s retention of a security interest in goods in the same manner as established in the UCC. In these countries, we retain title to goods delivered to a customer until the customer makes payment so that we can recover the goods in the event of customer default on payment. In these circumstances, where we only retain title to secure our recovery in the event of customer default, we also have a policy, which requires meeting certain criteria in order to recognize revenue, including satisfaction of the following requirements:
|
a)
|
Persuasive evidence that an arrangement exists;
|
|
b)
|
Delivery has occurred or services have been rendered;
|
|
c)
|
The price to the buyer is fixed or determinable;
|
|
d)
|
Collectability is reasonably assured;
|
|
e)
|
We have no significant obligations for future performance; and
|
|
f)
|
We are not entitled to direct the disposition of the goods, cannot rescind the transaction, cannot prohibit the customer from moving, selling, or otherwise using the goods in the ordinary course of business and have no other rights of holding title that rest with a titleholder of property that is subject to a lien under the UCC.
|
In circumstances where the sales transaction requires acceptance by the customer for items such as testing on site, installation, trial period or performance criteria, revenue is not recognized unless the following criteria have been met:
|
a)
|
Persuasive evidence that an arrangement exists;
|
|
b)
|
Delivery has occurred or services have been rendered;
|
|
c)
|
The price to the buyer is fixed or determinable;
|
|
d)
|
Collectability is reasonably assured; and
|
|
e)
|
The customer has given their acceptance, the time period for acceptance has elapsed or we have otherwise objectively demonstrated that the criteria specified in the acceptance provisions have been satisfied.
|
In addition to performance commitments, we analyze factors such as the reason for the purchase to determine if revenue should be recognized. This analysis is done before the product is shipped and includes the evaluation of factors that may affect the conclusion related to the revenue recognition criteria as follows:
|
a)
|
Persuasive evidence that an arrangement exists;
|
|
b)
|
Delivery has occurred or services have been rendered;
|
|
c)
|
The price to the buyer is fixed or determinable; and
|
|
d)
|
Collectability is reasonably assured.
|
Revenue from sales-type leases is recognized at the inception of the lease. Income from operating leases is recognized ratably over the term of the lease. We routinely sell equipment subject to operating leases and related lease payments. If we do not retain a substantial risk of ownership in the equipment, the transaction is recorded as a sale. If we do retain a substantial risk of ownership, the transaction is recorded as a borrowing, the operating lease payments are recognized as revenue over the term of the lease and the debt is amortized over a similar period.
We, from time to time, issue buyback guarantees in conjunction with certain sales agreements. These primarily relate to trade value agreements (“TVAs”) in which a customer may trade in equipment in the future at a stated price/credit if the customer meets certain conditions. The trade-in price/credit is determined at the time of the original sale of equipment. In conjunction with the trade-in, these conditions include a requirement to purchase new equipment at fair market value at the time of trade-in, which fair value is required to be of equal or greater value than the original equipment cost. Other conditions also include the general functionality and state of repair of the machine. We have concluded that any credit provided to customers under a TVA/buyback guarantee, which is expected to be equal to or less than the fair value of the equipment returned on the trade-in date, is a guarantee to be accounted for in accordance with ASC 460.
The original sale of equipment, accompanied by a buyback guarantee, is a multiple element transaction wherein we offer our customer the right, after some period of time, for a limited period of time, to exchange purchased equipment for a fixed price trade-in credit toward another of our products. The fixed price trade-in credit is accounted for under the guidance provided by ASC 460. Pursuant to this right, we have agreed to make a payment (in the form of a trade-in credit) to the customer contingent upon the customer exercising its right to trade in the original purchased equipment. Under the guidance of ASC 460, we record the fixed price trade-in credit at its fair value. Accordingly, as noted above, we have accounted for the trade-in credit as a separate deliverable in a multiple element arrangement.
42
When a sales transaction includes multiple deliverables, such as sales of multiple products or sales of products and services that are delivered over multiple reporting periods, the multiple deliverables are evaluated to determine the units of accounting, and the entire fee from the arrangement is allocated to each unit of accounting based on the relative selling price. The selling price of a unit of accounting is determined using a selling price hierarchy. Vendor-specific objective evidence (“VSOE”) is established based upon the price charged for products and services that are sold separately in standalone transactions. If VSOE cannot be established, third-party evidence (“TPE”) is evaluated based on competitor prices for similar deliverables when sold separately. If neither VSOE nor TPE is available, management's best estimate of selling price is established based upon the price at which we would sell the product on a standalone basis taking into consideration factors including, but not limited to, internal costs, gross margin objectives, pricing practices and market conditions. Revenue is recognized when revenue recognition criteria for each unit of accounting are met.
Goodwill –
Goodwill, representing the difference between total purchase price and fair value of assets (tangible and intangible) and liabilities at the date of acquisition, is reviewed for impairment annually, and more frequently as circumstances warrant, and written down only in the period in which the recorded value of such assets and liabilities exceeds fair value. We selected October 1 as the date for our required annual impairment test.
Goodwill is tested for impairment at the reporting unit level, which is defined as an operating segment or a component of an operating segment that constitutes a business for which discrete financial information with similar economic characteristics is available and operating results are regularly reviewed by our chief operating decision maker. The AWP, Cranes, and MP operating segments plus the Material Handling (“MH”) business and Port Solutions (“PS”) business of our former MHPS segment, which is a discontinued operation, comprise the five reporting units for goodwill impairment testing purposes.
We may elect to perform a qualitative analysis for our reporting units to determine whether it is more likely than not the fair value of the reporting unit is greater than its carrying value. If the qualitative analysis indicates that it is more likely than not the fair value of a reporting unit is less than its carrying amount or if we elect not to perform a qualitative analysis, we perform a quantitative analysis to determine whether a goodwill impairment exists.
The quantitative goodwill impairment analysis is a two-step process. The first step used to identify potential impairment involves comparing each reporting unit’s estimated fair value to its carrying value, including goodwill. We use an income approach derived from a discounted cash flow model to estimate fair value of our reporting units. The aggregate fair value of our reporting units is compared to our market capitalization on the valuation date to assess its reasonableness. Initial recognition of goodwill, as well as the annual review of carrying value of goodwill, requires that we develop estimates of future business performance. These estimates are used to derive expected cash flows and include assumptions regarding future sales levels and the level of working capital needed to support a given business. We rely on data developed by business segment management as well as macroeconomic data in making these calculations. The discounted cash flow model also includes a determination of our weighted average cost of capital by reporting unit. Cost of capital is based on assumptions about interest rates as well as a risk-adjusted rate of return required by our equity investors. Changes in these estimates can impact present value of expected cash flows used in determining fair value of a given business.
The second step of the process involves calculation of an implied fair value of goodwill for each reporting unit for which step one indicated impairment. Implied fair value of goodwill is determined by measuring the excess of estimated fair value of the reporting unit over estimated fair values of individual assets, liabilities and identifiable intangibles as if the reporting unit was being acquired in a business combination. If implied fair value of goodwill exceeds carrying value of goodwill assigned to the reporting unit, there is no impairment. If carrying value of goodwill assigned to a reporting unit exceeds implied fair value of goodwill, an impairment loss is recorded for the excess. An impairment loss cannot exceed carrying value of goodwill assigned to a reporting unit and subsequent reversal of goodwill impairment losses is not permitted.
As a result of our annual impairment test in the fourth quarter of 2016, we recorded a non-cash charge of $176.0 million in our Cranes segment and in the fourth quarter of 2015, we recorded a non-cash charge of $11.3 million in our former MHPS segment, which is a discontinued operation, to reflect impairment of goodwill in our PS reporting unit. There were no indicators of goodwill impairment in the test performed as of October 1,
2014
. See Note L – “Goodwill and Intangible Assets, Net” and Note E – “Discontinued Operations and Assets and Liabilities Held for Sale” in the Notes to the Consolidated Financial Statements for further information.
In order to evaluate the sensitivity of any quantitative fair value calculations on the goodwill impairment test, we applied a hypothetical 10% decrease to the fair values of any reporting unit calculated. This hypothetical 10% decrease would still result in excess fair value over carrying value for the reporting units tested, other than Cranes, as of October 1,
2016
.
43
Further impairments may be necessary in the future if conditions differ substantially from the assumptions utilized.
Impairment of Long-Lived Assets
– Our policy is to assess the realizability of our long-lived assets, including definite-lived intangible assets, and to evaluate such assets for impairment whenever events or changes in circumstances indicate the carrying amount of such assets (or group of assets) may not be recoverable. Impairment is determined to exist if estimated future undiscounted cash flows are less than carrying value. If an impairment is indicated, assets are written down to their fair value, which is typically determined by a discounted cash flow analysis. Future cash flow projections include assumptions regarding future sales levels and the level of working capital needed to support the assets. We use data developed by business segment management as well as macroeconomic data in making these calculations. There are no assurances that future cash flow assumptions will be achieved. The amount of any impairment then recognized would be calculated as the difference between the estimated fair value and the carrying value of the asset.
Accrued Warranties
– We record accruals for unasserted warranty claims based on our claim experience. Warranty costs are accrued at the time revenue is recognized. However, adjustments to the initial warranty accrual are recorded if actual claims experience indicates that adjustments are necessary. These warranty costs are based upon management’s assessment of past claims and current experience. However, actual claims could be higher or lower than amounts estimated, as the amount and value of warranty claims are subject to variation as a result of many factors that cannot be predicted with certainty, including production quality issues, performance of new products, models and technology, changes in weather conditions for product operation, different uses for products and other similar factors.
Accrued Product Liability –
We record accruals for product liability claims when deemed probable and estimable based on facts and circumstances and our prior claims experience. Accruals for product liability claims are valued based upon our prior claims experience, including consideration of the jurisdiction, circumstances of the accident, type of loss or injury, identity of plaintiff, other potential responsible parties, analysis of outside legal counsel, analysis of internal product liability counsel and the experience of our product safety team. Actual product liability costs could be different due to a number of variables such as the decisions of juries or judges.
Defined Benefit Plans
– Pension benefits represent financial obligations that will be ultimately settled in the future with employees who meet eligibility requirements. As of
December 31, 2016
, we maintained one qualified defined benefit pension plan and one nonqualified plan covering certain U.S. employees. Benefits covering salaried employees are based primarily on years of service and employees’ qualifying compensation during final years of employment. Benefits covering bargaining unit employees are based primarily on years of service and a flat dollar amount per year of service. Participation in the qualified plan is frozen and participants are only credited with post-freeze service for purposes of determining vesting and retirement eligibility. It is our policy, generally, to fund the qualified U.S. plan based on requirements of the Employee Retirement Income Security Act of 1974. See Note Q – “Retirement Plans and Other Benefits” in the Notes to the Consolidated Financial Statements. The nonqualified plan provides retirement benefits to certain senior executives of the Company and is unfunded. Generally, the nonqualified plan provides a benefit based on average total compensation earned over a participant’s final five years of employment and years of service reduced by benefits earned under any Company retirement program, excluding salary deferrals and matching contributions. In addition, benefits are reduced by Social Security Primary Insurance Amounts attributable to Company contributions. Participation in the nonqualified plan is frozen; however, eligible participants are credited with post-freeze service for purposes of determining vesting and the amount of benefits.
We maintain defined benefit plans in France, Germany, India, Switzerland and the United Kingdom (“U.K.”) for some of our subsidiaries. The plans in France, Germany and India are unfunded plans. The plan in the U.K. is frozen. Participation in the German plans is frozen; however, eligible participants are credited with post-freeze service for purposes of determining vesting and the amount of benefits. For our operations in Austria and Italy there are mandatory termination indemnity plans providing a benefit payable upon termination of employment in substantially all cases of termination. We record this obligation based on the mandated requirements. The measure of the current obligation is not dependent on the employees’ future service and therefore is measured at current value.
Plan assets consist primarily of common stocks, bonds and short-term cash equivalent funds. For the U.S. plan, approximately
32%
of the assets are in equity securities and
68%
are in fixed income securities. For non-U.S. funded plans, approximately
25%
of the assets are in equity securities,
72%
are in fixed income securities and
3%
are in real estate investment securities. These allocations are reviewed periodically and updated to meet the long-term goals of the plans.
44
Determination of defined benefit pension and post-retirement plan obligations and their associated expenses requires use of actuarial valuations to estimate the benefits employees earn while working, as well as the present value of those benefits. We use the services of independent actuaries to assist with these calculations. Inherent in these valuations are economic assumptions, including expected returns on plan assets, discount rates at which liabilities may be settled, rates of increase of health care costs, rates of future compensation increases as well as employee demographic assumptions such as retirement patterns, mortality and turnover. The actuarial assumptions used may differ materially from actual results due to changing market and economic conditions, higher or lower turnover rates, or longer or shorter life spans of participants. In 2014, the Society of Actuaries (the “Society”) issued the RP-2014 mortality tables and improvement scale MP-2014. In 2015 and again in 2016, the Society issued improvement scales MP-2015 and MP-2016, respectively. The improvement scales are intended to improve the accuracy of the RP-2014 mortality tables and provide the best mortality estimates available for calculating expense and projected benefit obligations. Terex adopted the MP-2014 mortality tables when they were issued and has also adopted each improvement scale for its U.S. pension plans when they have become available. Actual results that differ from the actuarial assumptions used are recorded as unrecognized gains and losses. Unrecognized gains and losses that exceed 10% of the greater of the plan’s projected benefit obligations or the market-related value of assets are amortized to earnings over the shorter of the estimated future service period of the plan participants or the period until any anticipated final plan settlements. The assumptions used in the actuarial models are evaluated periodically and are updated to reflect experience. We believe the assumptions used in the actuarial calculations are reasonable and are within accepted practices in each of the respective geographic locations in which we operate.
Expected long-term rates of return on pension plan assets were
7.00%
for the U.S. plan,
4.50%
for the U.K. plan and
2.00%
for the Swiss plan at
December 31, 2016
. Our strategy with regard to the investments in the pension plans is to earn a rate of return sufficient to match or exceed the long-term growth of pension liabilities. The expected rate of return of plan assets represents an estimate of long-term returns on the investment portfolio. These rates are determined annually by management based on a weighted average of current and historical market trends, historical portfolio performance and the portfolio mix of investments. The expected long-term rate of return on plan assets at December 31 is used to measure the earnings effects for the subsequent year. The difference between the expected return and the actual return on plan assets affects the calculated value of plan assets and, ultimately, future pension expense (income).
The discount rates for pension plan liabilities were
4.03%
for the U.S. plan and
0.50%
to
10.71%
with a weighted average of
2.27%
for non-U.S. plans at
December 31, 2016
. The discount rate enables us to estimate the present value of expected future cash flows on the measurement date. The rate used reflects a rate of return on high-quality fixed income investments that match the duration of expected benefit payments at the December 31 measurement date. The discount rate at December 31 is used to measure the year-end benefit obligations and the earnings effects on the subsequent year. Typically, a higher discount rate decreases the present value of benefit obligations.
Our U.S. pension plan is frozen so there is no expected rate of compensation increase, however, our nonqualified Supplemental Executive Retirement Plan has an expected rate of compensation increase of 3.75%. The expected rates of compensation increase for our non-U.S. pension plans were
1.00%
to
9.00%
with a weighted average of
0.89%
at
December 31, 2016
. These estimated annual compensation increases are determined by management every year and are based on historical trends and market indices.
We have recorded the underfunded status on our balance sheet as a liability and the unrecognized prior service costs and actuarial gains (losses) as an adjustment to Stockholders’ equity on the Consolidated Balance Sheet. The net decrease in the liability and funded status of
$3.8 million
was due to earnings on our pension assets and the positive effect of changes in foreign exchange rates, offset by changes in assumptions from the previous year, primarily decreases in discount rates.
Actual results in any given year will often differ from actuarial assumptions because of demographic, economic and other factors. Market value of plan assets can change significantly in a relatively short period of time. Additionally, the measurement of plan benefit obligations is sensitive to changes in interest rates. As a result, if the equity market declines and/or interest rates decrease, the plans’ estimated benefit obligations could increase, causing an increase in liabilities and a reduction in Stockholders’ Equity.
We expect any future obligations under our plans that are not currently funded will be funded from future cash flows from operations. If our contributions are insufficient to adequately fund the plans to cover our future obligations, or if the performance of assets in our plans does not meet expectations, or if our assumptions are modified, contributions could be higher than expected, which would reduce cash available for our business. Changes in U.S. or foreign laws governing these plans could require additional contributions. In addition, changes in generally accepted accounting principles in the U.S. could require recording additional liabilities and costs related to these plans.
45
Assumptions used in computing our net pension expense and projected benefit obligation have a significant effect on the amounts reported. A 25 basis point change in each assumption below would have the following effects upon net pension expense and projected benefit obligation, respectively, as of and for the year ended
December 31, 2016
:
|
Increase
|
Decrease
|
||||||||||||||
|
Discount Rate
|
Expected long-
term rate of return
|
Discount Rate
|
Expected long-
term rate of return
|
||||||||||||
|
($ amounts in millions)
|
|||||||||||||||
|
U. S. Plan:
|
|||||||||||||||
|
Net pension expense
|
$
|
(0.2
|
)
|
$
|
(0.3
|
)
|
$
|
0.2
|
|
$
|
0.3
|
|
|||
|
Projected benefit obligation
|
$
|
(4.6
|
)
|
$
|
—
|
|
$
|
4.9
|
|
$
|
—
|
|
|||
|
Non-U.S. Plans:
|
|||||||||||||||
|
Net pension expense
|
$
|
0.4
|
|
$
|
(0.3
|
)
|
$
|
0.1
|
|
$
|
0.3
|
|
|||
|
Projected benefit obligation
|
$
|
(8.9
|
)
|
$
|
—
|
|
$
|
9.4
|
|
$
|
—
|
|
|||
Income Taxes
– We estimate income taxes based on enacted tax laws in the various jurisdictions where we conduct business. We recognize deferred income tax assets and liabilities, which represent future tax benefits or obligations of our legal entities. These deferred income tax balances arise from temporary differences due to divergent treatment of certain items for accounting and income tax purposes.
We evaluate our deferred tax assets each period to ensure that estimated future taxable income will be sufficient in character, amount and timing to result in the use of our deferred tax assets. “Character” refers to the type (ordinary income versus capital gain) as well as the source (foreign vs. domestic) of the income we generate. “Timing” refers to the period in which future income is expected to be generated. Timing is important because, in certain jurisdictions, net operating losses (“NOLs”) and other tax attributes expire if not used within an established statutory time frame. Based on these evaluations, we have determined that it is more likely than not that expected future earnings will be sufficient to use most of our deferred tax assets.
We do not provide for income taxes or tax benefits on differences between financial reporting basis and tax basis of our non-U.S. subsidiaries where such differences are reinvested and, in our opinion, will continue to be indefinitely reinvested. If earnings of foreign subsidiaries are not considered indefinitely reinvested, deferred U.S. income taxes, foreign income taxes, and foreign withholding taxes may have to be provided. We do not record deferred income taxes on the temporary difference between the book and tax basis in domestic subsidiaries where permissible. At this time, determination of unrecognized deferred tax liabilities for temporary differences related to the investment in subsidiaries is not practicable.
Judgments and estimates are required to determine tax expense and deferred tax valuation allowances and in assessing uncertain tax positions. Tax returns are subject to audit and local taxing authorities could challenge tax-filing positions we take. Our practice is to file income tax returns that conform to requirements of each jurisdiction and to record provisions for tax liabilities, including interest and penalties, in accordance with ASC 740, “Income Taxes.” As our business has grown in geographic scope, size and complexity, so has our potential exposure to uncertain tax positions. Given the subjective nature of applicable tax laws, results of an audit of some of our tax returns could have a significant impact on our financial statements.
RECENT ACCOUNTING PRONOUNCEMENTS
Please refer to Note B – “Basis of Presentation” in the accompanying Consolidated Financial Statements for a listing of recent accounting pronouncements.
46
LIQUIDITY AND CAPITAL RESOURCES
We continue to focus on generating cash and improving margins. We generated
$367.0 million
in cash from operating activities and achieved our expectations for free cash flow with
$189.3 million
generated for the year ended December 31, 2016. This was primarily due to improved working capital efficiency. Our liquidity (cash and availability under our revolving credit line) increased from
December 31, 2015
to
December 31, 2016
by approximately
$35 million
.
The following table reconciles Net cash provided by (used in) operating activities to free cash flow (in millions):
|
Year Ended
12/31/2016 |
||||
|
Net cash provided by (used in) operating activities
|
367.0
|
|
||
|
Increase (decrease) in TFS assets
|
(110.9
|
)
|
||
|
(Increase) decrease in cash for securitization settlement
|
6.2
|
|
||
|
Capital expenditures
|
(73.0
|
)
|
||
|
Free cash flow
|
$
|
189.3
|
|
|
Generating cash from operations depends primarily on the Company’s ability to earn net income through the sales of its products and to manage its investment in working capital. Pursuant to terms of the Company’s trade accounts receivable factoring arrangements, during the year ended December 31, 2016, we sold, without recourse, approximately $620 million of trade accounts receivable to provide additional liquidity. During the year ended December 31, 2016, we also sold approximately $291 million of sales-type leases and commercial loans.
Our main sources of funding are cash generated from operations, loans from our bank credit facilities, and funds raised in capital markets. We had cash and cash equivalents, including cash and cash equivalents recorded as Current assets held for sale, of
$501.9 million
at
December 31, 2016
. We seek to use cash held by our foreign subsidiaries to support our operations and continued growth plans outside the United States through funding of capital expenditures, operating expenses or other similar cash needs of these operations. Such cash could be used in the U.S., if necessary. Cash repatriated to the U.S. could be subject to incremental local and U.S. taxation. Primarily as a result of the sale of the MHPS business to Konecranes, the Company has repatriated approximately $1.3 billion of amounts invested outside the U.S. Because our expectation for changes to existing tax laws worldwide is high, we will continue to monitor tax legislation for opportunities to tax-efficiently mobilize and redeploy funds. There are no other trends, demands or uncertainties as a result of the Company’s cash re-investment policy that are reasonably likely to have a material effect on us as a whole or that may be relevant to our financial flexibility.
We believe cash generated from operations together with access to our bank credit facilities and cash on hand, provide adequate liquidity to continue to support internal operating initiatives and meet our operating and debt service requirements for at least the next 12 months. See Item 1A “Risk Factors” for a detailed description of the risks resulting from our debt and our ability to generate sufficient cash flow to operate our business.
Our ability to generate cash from operations is subject to numerous factors, including the following:
|
•
|
Many of our customers fund their purchases through third-party finance companies that extend credit based on the credit-worthiness of customers and expected residual value of our equipment. Changes either in customers’ credit profile or used equipment values may affect the ability of customers to purchase equipment. There can be no assurance third-party finance companies will continue to extend credit to our customers as they have in the past.
|
|
•
|
As our sales change, the amount of working capital needed to support our business may change.
|
|
•
|
Our suppliers extend payment terms to us primarily based on our overall credit rating. Declines in our credit rating may influence suppliers’ willingness to extend terms and in turn increase cash requirements of our business.
|
|
•
|
Sales of our products are subject to general economic conditions, weather, competition, translation effect of foreign currency exchange rate changes, and other factors that in many cases are outside our direct control. For example, during periods of economic uncertainty, our customers have delayed purchasing decisions, which reduces cash generated from operations.
|
|
•
|
Availability and utilization of other sources of liquidity such as trade receivables sales programs.
|
Typically, we have invested our cash in a combination of highly rated, liquid money market funds and in short-term bank deposits with large, highly rated banks. Our investment objective is to preserve capital and liquidity while earning a market rate of interest.
47
Our investment in financial services assets was approximately
$239 million
, net at
December 31, 2016
. We remain focused on expanding financing solutions in key markets like the U.S. and Europe. We also anticipate using TFS to drive incremental sales by increasing direct customer financing through TFS in certain instances.
During 2016, cash provided by reduction in inventory was approximately
$97 million
, which was mostly driven by inventory reductions in our Cranes segment. Working capital as a percent of trailing three month annualized net sales was
20.8%
at
December 31, 2016
.
The following tables show the calculation of our working capital and trailing three months annualized sales as of
December 31, 2016
(in millions):
|
Three months ended 12/31/16
|
|||
|
Net Sales
|
$
|
974.7
|
|
|
x
|
4
|
|
|
|
Trailing Three Month Annualized Net Sales
|
$
|
3,898.8
|
|
|
As of 12/31/16
|
|||
|
Inventories
|
$
|
853.8
|
|
|
Trade Receivables
|
512.5
|
|
|
|
Less: Trade Accounts Payable
|
(522.7
|
)
|
|
|
Less: Customer advances
|
(33.0
|
)
|
|
|
Total Working Capital
|
$
|
810.6
|
|
On January 31, 2017, we entered into a new credit agreement (the “2017 Credit Agreement”). The 2017 Credit Agreement provides us with a senior secured revolving line of credit of up to $450.0 million that is available through January 31, 2022 and a $400.0 million senior secured term loan, which will mature on January 31, 2024. The 2017 Credit Agreement allows unlimited incremental commitments, which may be extended at the option of the existing or new lenders and can be in the form of revolving credit commitments, term loan commitments, or a combination of both, with incremental amounts in excess of $300.0 million as long as the Company satisfies a senior secured leverage ratio contained in the 2017 Credit Agreement.
Our previous credit agreement provided us with a revolving line of credit of up to $600 million. See Note O - “Long-Term Obligations,” in our Consolidated Financial Statements for information concerning the 2017 Credit Agreement and our previous credit agreement. Borrowings under our U.S. dollar and Euro denominated term loans were
$428.6 million
as of
December 31, 2016
.
Interest rates charged under the revolving line of credit in the 2017 Credit Agreement are subject to adjustment based on our consolidated leverage ratio. The U.S. dollar term loan bears interest at a rate of London Interbank Offer Rate (“LIBOR”) plus 2.50%, with a floor of 0.75% on LIBOR. Under our previous credit agreement, we had a U.S. dollar term loan with interest at a rate of LIBOR plus 2.75%, with a floor of 0.75% on LIBOR and a Euro term loan with interest at a rate of Euro Interbank Offer Rate (“EURIBOR”) plus 2.75%, with a floor of 0.75% on EURIBOR. At
December 31, 2016
, the weighted average interest rate on these term loans was
3.63%
.
We manage our interest rate risk by maintaining a balance between fixed and floating rate debt, including the use of interest rate derivatives when appropriate. Over the long term, we believe this mix will produce lower interest cost than a purely fixed rate mix while reducing interest rate risk.
48
On January 31, 2017, the Company sold and issued $600.0 million aggregate principal amount of Senior Notes due 2025 (“5-5/8% Notes”) at par in a private offering. The proceeds from the 5-5/8% Notes, together with cash on hand, including cash from the sale of our MHPS business, have been and will be used: (i) to complete a tender offer for up to $550.0 million of our 6% Senior Notes, (ii) to redeem and discharge such portion of the 6% Notes that are not purchased in the tender offer, (iii) to fund a $300.0 million partial redemption of the 6% Notes, (iv) to fund anticipated redemption, repurchase or other retirement of all $300.0 million aggregate principal amount outstanding of our 6.5% Notes on or before April 3, 2017, (v) to pay related premiums, fees, discounts and expenses and (vi) for general corporate purposes, including repayment of borrowings outstanding under our previous credit agreement. The 5-5/8% Notes are jointly and severally guaranteed by certain of the Company’s domestic subsidiaries.
On May 28, 2015, we entered into a securitization facility with capacity up to $350 million secured by equipment loans and leases to our customers originated by TFS. On May 31, 2016, we terminated the securitization facility because it was not providing us with the flexibility needed for our portfolio of assets. See Note O - “Long-Term Obligations,” in our Consolidated Financial Statements for information concerning this securitization facility.
We announced in February 2015 that our Board of Directors authorized the repurchase of up to $200 million of our outstanding shares of common stock. During 2016, we repurchased 3.5 million shares for $81.3 million. We have approximately $69 million remaining available under the 2015 share repurchase authorization. We announced in February 2017 that our Board of Directors authorized the repurchase of up to an additional $350 million of our outstanding shares of common stock. In each quarter of 2016, we paid a $0.07 cash dividend to our shareholders. Our Board of Directors declared a dividend of
$0.08
per share in the first quarter of 2017, which will be paid in March 2017. However, additional declarations of quarterly dividends and the establishment of future record and payment dates are subject to the determination of our Board of Directors.
Our ability to access capital markets to raise funds, through sale of equity or debt securities, is subject to various factors, some specific to us, and others related to general economic and/or financial market conditions. These include results of operations, projected operating results for future periods and debt to equity leverage. Our ability to access capital markets is also subject to our timely filing of periodic reports with the Securities and Exchange Commission (“SEC”). In addition, terms of our bank credit facilities, senior notes and senior subordinated notes contain restrictions on our ability to make further borrowings and to sell substantial portions of our assets.
Cash Flows
Cash provided by operations for the
year ended
December 31, 2016
totaled
$367.0 million
, compared to cash provided by operations of
$212.9 million
for the
year ended
December 31, 2015
. The change in cash from operations was primarily driven by lower cash used in working capital in 2016.
Cash used in investing activities for the
year ended
December 31, 2016
was
$11.8 million
, compared to
$172.7 million
cash used in investing activities for the
year ended
December 31, 2015
. The decrease of cash used in investing activities was primarily due to cash received from the sale of our compact construction business, lower cash used for acquisitions and lower capital expenditures in 2016 compared to 2015.
Cash used in financing activities was
$300.1 million
for the
year ended
December 31, 2016
, compared to cash used in financing activities for the
year ended
December 31, 2015
of
$14.4 million
. The increase in cash used in financing activities in 2016 compared to 2015 was primarily due to lower net borrowings and increased share repurchases in 2016 compared to 2015.
49
Contractual Obligations
The following table sets out our specified contractual obligations at
December 31, 2016
(in millions):
|
Payments due by period
|
|||||||||||||||||||
|
Total
|
< 1 year
|
1-3 years
|
3-5 years
|
> 5 years
|
|||||||||||||||
|
Long-term debt obligations
|
$
|
1,961.7
|
|
$
|
101.2
|
|
$
|
186.7
|
|
$
|
1,672.4
|
|
$
|
1.4
|
|
||||
|
Capital lease obligations
|
3.1
|
|
0.2
|
|
1.2
|
|
1.1
|
|
0.6
|
|
|||||||||
|
Operating lease obligations
|
132.3
|
|
32.5
|
|
37.4
|
|
21.7
|
|
40.7
|
|
|||||||||
|
Purchase obligations
(1)
|
400.4
|
|
400.4
|
|
—
|
|
—
|
|
—
|
|
|||||||||
|
Total
|
$
|
2,497.5
|
|
$
|
534.3
|
|
$
|
225.3
|
|
$
|
1,695.2
|
|
$
|
42.7
|
|
||||
|
(1)
|
Purchase obligations include non-cancellable and cancellable commitments. In many cases, cancellable commitments contain penalty provisions for cancellation.
|
Long-term debt obligations include expected interest expense. Interest expense is calculated using fixed interest rates for indebtedness that has fixed rates and the implied forward rates as of
December 31, 2016
for indebtedness that has floating interest rates.
As of
December 31, 2016
, our liability for uncertain income tax positions was $45.4 million. With respect to our tax audits worldwide, it is reasonably possible that we will make payments in 2017 of up to $12.2 million. Payments may be made in part to mitigate the accrual of interest in connection with income tax audit assessments that may be issued and that we would contest, or may in part be made to settle the matter with the tax authorities. Due to the high degree of uncertainty regarding the timing of potential future cash flows associated with the remaining liabilities, we are unable to make a reasonable estimate of the amount and period in which these remaining liabilities might be paid.
Additionally, at
December 31, 2016
, we had outstanding letters of credit that totaled
$183.2 million
(
$121.4 million
related to discontinued operations) and had issued
$42.3 million
($2.0 million related to discontinued operations) in credit guarantees of customer financing to purchase equipment and
$3.5 million
($3.2 million related to discontinued operations) in buyback guarantees.
We maintain defined benefit pension plans for some of our operations in the United States and Europe. It is our policy to fund the retirement plans at the minimum level required by applicable regulations. In
2016
, we made cash contributions and payments to the retirement plans of
$8 million
, and we estimate that our retirement plan contributions will be approximately
$8 million
in
2017
. Changes in market conditions, changes in our funding levels or actions by governmental agencies may result in accelerated funding requirements in future periods.
OFF-BALANCE SHEET ARRANGEMENTS
Guarantees
Our customers, from time to time, fund the acquisition of our equipment through third-party finance companies. In certain instances, we may provide a credit guarantee to the finance company by which we agree to make payments to the finance company should the customer default. Our maximum liability is generally limited to our customer’s remaining payments due to the finance company at the time of default. In the event of a customer default, we are generally able to recover and dispose of the equipment at a minimum loss, if any, to us.
We issue, from time to time, residual value guarantees under sales-type leases. A residual value guarantee involves a guarantee that a piece of equipment will have a minimum fair market value at a future date. We are generally able to mitigate the risk associated with these guarantees because maturity of guarantees is staggered, which limits the amount of used equipment entering the marketplace at any one time.
We guarantee, from time to time, that we will buy equipment from our customers in the future at a stated price if certain conditions are met by the customer. Such guarantees are referred to as buyback guarantees. These conditions generally pertain to functionality and state of repair of the machine. We are generally able to mitigate risk of these guarantees by staggering the timing of the buybacks and through leveraging our access to used equipment markets provided by our original equipment manufacturer status.
50
See Note S – “Litigation and Contingencies” in the Notes to the Consolidated Financial Statements for further information regarding our guarantees.
There can be no assurance our historical experience in used equipment markets will be indicative of future results. Our ability to recover losses from our guarantees may be affected by economic conditions in used equipment markets at the time of loss.
CONTINGENCIES AND UNCERTAINTIES
Foreign Currencies and Interest Rate Risk
Our products are sold in over 100 countries around the world and, accordingly, our revenues are generated in foreign currencies, while costs associated with those revenues are only partly incurred in the same currencies. Major foreign currencies, among others, in which we do business are the Euro, British Pound and Australian Dollar. We may, from time to time, hedge specifically identified committed and forecasted cash flows in foreign currencies using forward currency sale or purchase contracts. At
December 31, 2016
, we had foreign exchange contracts with a notional value of
$245.5 million
that were initially designated as hedge contracts. Fair market value of these arrangements, which represents the cost to settle these contracts, was a net loss of
$2.6 million
at
December 31, 2016
. See Risk Factor entitled, “We are subject to currency fluctuations,” for further information on our foreign exchange risk.
We manage exposure to interest rates by incurring a mix of indebtedness bearing interest at both floating and fixed rates at inception and maintaining an ongoing balance between floating and fixed rates on this mix of indebtedness using interest rate swaps when necessary.
See “Quantitative and Qualitative Disclosures About Market Risk” below for a discussion of the impact that changes in foreign currency exchange rates and interest rates may have on our financial performance.
Other
We are subject to a number of contingencies and uncertainties including, without limitation, product liability claims, workers’ compensation liability, intellectual property litigation, self-insurance obligations, tax examinations, guarantees, class action lawsuits and other matters. See Note S – “Litigation and Contingencies” for more information concerning contingencies and uncertainties, including our securities and stockholder derivative lawsuits, and our proceedings involving certain former shareholders of Demag Cranes AG, in the Notes to the Consolidated Financial Statements. We are insured for product liability, general liability, workers’ compensation, employer’s liability, property damage, intellectual property and other insurable risk required by law or contract with retained liability to us or deductibles. Many of the exposures are unasserted or proceedings are at a preliminary stage, and it is not presently possible to estimate the amount or timing of any of our costs. However, we do not believe these contingencies and uncertainties will, individually or in the aggregate, have a material adverse effect on our operations. For contingencies and uncertainties other than income taxes, when it is probable that a loss will be incurred and possible to make reasonable estimates of our liability with respect to such matters, a provision is recorded for the amount of such estimate or for the minimum amount of a range of estimates when it is not possible to estimate the amount within the range that is most likely to occur.
See Item 1. Business – Safety and Environmental Considerations for additional discussion of safety and environmental items.
51
|
ITEM 7A.
|
QUANTITATIVE AND QUALITATIVE DISCLOSURES ABOUT MARKET RISK
|
We are exposed to certain market risks that exist as part of our ongoing business operations and we use derivative financial instruments, where appropriate, to manage these risks. As a matter of policy, we do not engage in trading or speculative transactions. For further information on accounting policies related to derivative financial instruments, refer to Note M – “Derivative Financial Instruments” in our Consolidated Financial Statements.
Foreign Exchange Risk
We are exposed to fluctuations in foreign currency cash flows related to third-party purchases and sales, intercompany product shipments and other intercompany transactions. We are also exposed to fluctuations in the value of foreign currency investments in subsidiaries and cash flows related to repatriation of these investments. Additionally, we are exposed to volatility in translation of foreign currency earnings to U.S. Dollars. Primary exposures include the U.S. Dollar when compared to functional currencies of our major markets, which include the Euro, British Pound and Australian Dollar. We assess foreign currency risk based on transactional cash flows, identify naturally offsetting positions and purchase hedging instruments to partially offset anticipated exposures. See Risk Factor entitled, “We are subject to currency fluctuations,” for further information on our foreign exchange risk.
At
December 31, 2016
, we performed a sensitivity analysis on the impact that aggregate changes in the translation effect of foreign currency exchange rate changes would have on our operating income. Based on this sensitivity analysis, we have determined that a change in the value of the U.S. dollar relative to other currencies by 10% to amounts already incorporated in the financial statements for the year ended
December 31, 2016
would have had an approximately
$11 million
impact on the translation effect of foreign currency exchange rate changes already included in our reported operating income for the period.
Interest Rate Risk
We are exposed to interest rate volatility with regard to future issuances of fixed rate debt and existing issuances of variable rate debt. Primary exposure includes movements in the U.S. prime rate and LIBOR. We manage interest rate risk by incurring a mix of indebtedness bearing interest at both floating and fixed rates at inception and maintain an ongoing balance between floating and fixed rates on this mix of indebtedness using interest rate swaps when necessary. At
December 31, 2016
, approximately
27%
of our debt was floating rate debt and the weighted average interest rate for all debt was
5.46%
.
At
December 31, 2016
, we performed a sensitivity analysis for our derivatives and other financial instruments that have interest rate risk. We calculated the pretax earnings effect on our interest sensitive instruments. Based on this sensitivity analysis, we have determined that an increase of 10% in our average floating interest rates at
December 31, 2016
would have increased interest expense by approximately
$2 million
for the year ended
December 31, 2016
.
Commodities Risk
Principal materials and components that we use in our manufacturing processes include steel, castings, engines, tires, hydraulics, cylinders, drive trains, electric controls and motors, and a variety of other commodities and fabricated or manufactured items. Extreme movements in the cost and availability of these materials and components may affect our financial performance. In 2016, minor, unfavorable input cost changes in some areas were more than off-set by favorable changes in other areas.
In the absence of labor strikes or other unusual circumstances, substantially all materials and components are normally available from multiple suppliers. However, certain of our businesses receive materials and components from a single source supplier, although alternative suppliers of such materials may be generally available. Current and potential suppliers are evaluated regularly on their ability to meet our requirements and standards. We actively manage our material supply sourcing, and employ various methods to limit risk associated with commodity cost fluctuations and availability. The inability of suppliers, especially any single source suppliers for a particular business, to deliver materials and components promptly could result in production delays and increased costs to manufacture our products. We have designed and implemented plans to mitigate the impact of these risks by using alternate suppliers, expanding our supply base globally, leveraging our overall purchasing volumes to obtain favorable quantities and developing a closer working relationship with key suppliers. One key element of our Execute to Win strategy is to focus on strategic sourcing to gain efficiencies using our global purchasing power, which includes building a global sourcing organization and standardizing our sourcing processes across our businesses.
52
|
ITEM 8.
|
FINANCIAL STATEMENTS AND SUPPLEMENTARY DATA
|
The report of our independent registered public accounting firm and our Consolidated Financial Statements and Financial Statement Schedule are filed pursuant to this Item 8 and are included later in this report. See Index to Consolidated Financial Statements and Financial Statement Schedule on page F-1.
Unaudited Quarterly Financial Data
Certain amounts reported below have been changed from those previously reported on Forms 10-Q to reflect the impact of discontinued operations for all periods. Summarized quarterly financial data for
2016
and
2015
are as follows (in millions, except per share amounts):
|
2016
|
2015
|
||||||||||||||||||||||||||||||
|
Fourth
|
Third
|
Second
|
First
|
Fourth
|
Third
|
Second
|
First
|
||||||||||||||||||||||||
|
Net sales
|
$
|
974.7
|
|
$
|
1,056.4
|
|
$
|
1,297.7
|
|
$
|
1,114.3
|
|
$
|
1,167.6
|
|
$
|
1,255.4
|
|
$
|
1,442.9
|
|
$
|
1,155.8
|
|
|||||||
|
Gross profit
|
104.7
|
|
183.9
|
|
242.1
|
|
181.7
|
|
215.3
|
|
252.4
|
|
302.2
|
|
201.3
|
|
|||||||||||||||
|
Net income (loss) from continuing operations attributable to common stockholders
(1)
|
(313.9
|
)
|
33.3
|
|
109.6
|
|
(22.0
|
)
|
23.8
|
|
30.3
|
|
75.9
|
|
(1.6
|
)
|
|||||||||||||||
|
Income (loss) from discontinued operations – net of tax
|
46.7
|
|
63.5
|
|
(44.6
|
)
|
(52.2
|
)
|
(9.2
|
)
|
14.5
|
|
9.3
|
|
(0.5
|
)
|
|||||||||||||||
|
Gain (loss) on disposition of discontinued operations – net of tax
|
—
|
|
—
|
|
0.1
|
|
3.4
|
|
1.9
|
|
(1.2
|
)
|
(0.4
|
)
|
3.1
|
|
|||||||||||||||
|
Net income (loss) attributable to Terex Corporation
|
(267.2
|
)
|
96.8
|
|
65.1
|
|
(70.8
|
)
|
16.5
|
|
43.6
|
|
84.8
|
|
1.0
|
|
|||||||||||||||
|
Per share:
|
|||||||||||||||||||||||||||||||
|
Basic
|
|||||||||||||||||||||||||||||||
|
Net income (loss) from continuing operations attributable to common stockholders
|
$
|
(2.96
|
)
|
$
|
0.31
|
|
$
|
1.01
|
|
$
|
(0.20
|
)
|
$
|
0.22
|
|
$
|
0.28
|
|
$
|
0.71
|
|
$
|
(0.02
|
)
|
|||||||
|
Income (loss) from discontinued operations – net of tax
|
0.44
|
|
0.59
|
|
(0.41
|
)
|
(0.48
|
)
|
(0.09
|
)
|
0.13
|
|
0.09
|
|
—
|
|
|||||||||||||||
|
Gain (loss) on disposition of discontinued operations – net of tax
|
—
|
|
—
|
|
—
|
|
0.03
|
|
0.02
|
|
(0.01
|
)
|
—
|
|
0.03
|
|
|||||||||||||||
|
Net income (loss) attributable to Terex Corporation
|
(2.52
|
)
|
0.90
|
|
0.60
|
|
(0.65
|
)
|
0.15
|
|
0.40
|
|
0.80
|
|
0.01
|
|
|||||||||||||||
|
Diluted
|
|||||||||||||||||||||||||||||||
|
Net income (loss) from continuing operations attributable to common stockholders
|
$
|
(2.96
|
)
|
$
|
0.31
|
|
$
|
1.00
|
|
$
|
(0.20
|
)
|
$
|
0.22
|
|
$
|
0.28
|
|
$
|
0.70
|
|
$
|
(0.02
|
)
|
|||||||
|
Income (loss) from discontinued operations – net of tax
|
0.44
|
|
0.58
|
|
(0.41
|
)
|
(0.48
|
)
|
(0.09
|
)
|
0.13
|
|
0.08
|
|
—
|
|
|||||||||||||||
|
Gain (loss) on disposition of discontinued operations – net of tax
|
—
|
|
—
|
|
—
|
|
0.03
|
|
0.02
|
|
(0.01
|
)
|
—
|
|
0.03
|
|
|||||||||||||||
|
Net income (loss) attributable to Terex Corporation
|
(2.52
|
)
|
0.89
|
|
0.59
|
|
(0.65
|
)
|
0.15
|
|
0.40
|
|
0.78
|
|
0.01
|
|
|||||||||||||||
(1) The fourth quarter 2015 results include correcting adjustments of $4.2 million of expense related to prior periods which was identified and recorded in this quarter, primarily related to a tax valuation allowance and excess freight reimbursement accruals. The Company believes these adjustments are immaterial to current and prior periods.
The accompanying unaudited quarterly financial data have been prepared in accordance with generally accepted accounting principles in the United States for interim financial information and with Item 302 of Regulation S-K. In our opinion, all adjustments considered necessary for a fair statement have been made and were of a normal recurring nature.
53
|
ITEM 9.
|
CHANGES IN AND DISAGREEMENTS WITH ACCOUNTANTS ON ACCOUNTING AND FINANCIAL DISCLOSURE
|
Not applicable.
|
ITEM 9A.
|
CONTROLS AND PROCEDURES
|
EVALUATION OF DISCLOSURE CONTROLS AND PROCEDURES
We maintain disclosure controls and procedures that are designed to ensure that information required to be disclosed in reports we file under the Securities Exchange Act of 1934, as amended (the “Exchange Act”) is recorded, processed, summarized and reported within the time periods specified in the SEC’s rules and forms, and that such information is accumulated and communicated to our management, including our Chief Executive Officer (“CEO”) and Chief Financial Officer (“CFO”), as appropriate, to allow timely decisions regarding required financial disclosure. In connection with the preparation of this Annual Report on Form 10-K, our management carried out an evaluation, under the supervision and with the participation of our management, including the CEO and CFO, as of
December 31, 2016
, of the effectiveness of the design and operation of our disclosure controls and procedures, as such term is defined under Rule 13a-15(e) under the Exchange Act. Based upon this evaluation, our CEO and CFO concluded that our disclosure controls and procedures were effective as of
December 31, 2016
.
MANAGEMENT’S ANNUAL REPORT ON INTERNAL CONTROL OVER FINANCIAL REPORTING
Management is responsible for establishing and maintaining adequate internal control over financial reporting for the Company, as such term is defined in Rules 13a-15(f) and 15d-15(f) under the Exchange Act. Our internal control over financial reporting is a process designed to provide reasonable assurance regarding the reliability of financial reporting and the preparation of financial statements for external reporting purposes in accordance with generally accepted accounting principles. Internal control over financial reporting includes those policies and procedures that: pertain to the maintenance of records that, in reasonable detail, accurately and fairly reflect the transactions and dispositions of our assets; provide reasonable assurance transactions are recorded as necessary to permit preparation of financial statements in accordance with generally accepted accounting principles, and that our receipts and expenditures are being made only in accordance with authorizations of our management and directors; and provide reasonable assurance regarding prevention or timely detection of unauthorized acquisition, use or disposition of our assets that could have a material effect on our financial statements. Because of its inherent limitations, internal control over financial reporting may not prevent or detect misstatements. Also, projections of any evaluation of effectiveness to future periods are subject to the risk that controls may become inadequate because of changes in conditions, or that the degree of compliance with the policies or procedures may deteriorate.
Management has conducted an assessment, including testing, of the effectiveness of our internal control over financial reporting as of
December 31, 2016
. In making its assessment of internal control over financial reporting, management used the criteria in
Internal Control — Integrated Framework (2013)
issued by the Committee of Sponsoring Organizations of the Treadway Commission. Based on this assessment, the Company’s management has concluded that, as of
December 31, 2016
, the Company’s internal control over financial reporting was effective.
The effectiveness of our internal control over financial reporting as of
December 31, 2016
has been audited by PricewaterhouseCoopers LLP, an independent registered public accounting firm, as stated in their report which appears in this Annual Report on Form 10-K.
CHANGES IN INTERNAL CONTROL OVER FINANCIAL REPORTING
There were no changes in our internal control over financial reporting (as defined in Rules 13a-15(f) and 15d-15(f) under the Exchange Act) that occurred during our quarter ended
December 31, 2016
, that have materially affected, or are reasonably likely to materially affect, our internal control over financial reporting.
The effectiveness of any system of controls and procedures is subject to certain limitations, and, as a result, there can be no assurance that our controls and procedures will detect all errors or fraud. A control system, no matter how well conceived and operated, can provide only reasonable, not absolute, assurance that the objectives of the control system will be attained.
|
ITEM 9B.
|
OTHER INFORMATION
|
None.
54
|
|
|
|
ITEM 10.
|
DIRECTORS, EXECUTIVE OFFICERS AND CORPORATE GOVERNANCE
|
The information required by Item 10 is incorporated by reference to the definitive Terex Corporation Proxy Statement to be filed with the Securities and Exchange Commission not later than 120 days after the end of the fiscal year covered by this Annual Report on Form 10-K.
|
ITEM 11.
|
EXECUTIVE COMPENSATION
|
The information required by Item 11 is incorporated by reference to the definitive Terex Corporation Proxy Statement to be filed with the Securities and Exchange Commission not later than 120 days after the end of the fiscal year covered by this Annual Report on Form 10-K.
|
ITEM 12.
|
SECURITY OWNERSHIP OF CERTAIN BENEFICIAL OWNERS AND MANAGEMENT AND RELATED STOCKHOLDER MATTERS
|
Equity Compensation Plan Information
The following table summarizes information about the Company’s equity compensation plans as of
December 31, 2016
:
|
Plan Category
|
|
Number of securities to be issued upon exercise of outstanding options, warrants and rights (a)
|
|
Weighted average exercise price of outstanding options, warrants and rights (b)
|
|
Number of securities remaining available for future issuance under equity compensation plans (excluding securities reflected in column (a)) (c)
|
|
Equity compensation plans approved by stockholders
|
|
13,059 (1)
|
|
$65.17
|
|
2,542,645
|
|
Equity compensation plans not approved by stockholders
|
|
—
|
|
—
|
|
—
|
|
Total
|
|
13,059
|
|
|
2,542,645
|
|
|
(1)
|
This does not include 3,531,188 shares of restricted stock awards and 851,982 shares held in a Rabbi Trust for a deferred compensation plan, which are also not included in the calculation of the weighted average exercise price of outstanding options, warrants and rights in column (b) of this table.
|
The other information required by Item 12 is incorporated by reference to the definitive Terex Corporation Proxy Statement to be filed with the Securities and Exchange Commission not later than 120 days after the end of the fiscal year covered by this Annual Report on Form 10-K.
|
ITEM 13.
|
CERTAIN RELATIONSHIPS AND RELATED TRANSACTIONS, AND DIRECTOR INDEPENDENCE
|
The information required by Item 13 is incorporated by reference to the definitive Terex Corporation Proxy Statement to be filed with the Securities and Exchange Commission not later than 120 days after the end of the fiscal year covered by this Annual Report on Form 10-K.
|
ITEM 14.
|
PRINCIPAL ACCOUNTANT FEES AND SERVICES
|
The information required by Item 14 is incorporated by reference to the definitive Terex Corporation Proxy Statement to be filed with the Securities and Exchange Commission not later than 120 days after the end of the fiscal year covered by this Annual Report on Form 10-K.
55
|
|
|
|
ITEM 15.
|
EXHIBITS AND FINANCIAL STATEMENT SCHEDULES
|
(a) (1) and (2) Financial Statements and Financial Statement Schedules.
See “Index to Consolidated Financial Statements and Financial Statement Schedule” on Page F-1.
(3) Exhibits
See “Exhibit Index” on Page E-1.
|
ITEM 16.
|
FORM 10-K SUMMARY
|
Not applicable.
56
SIGNATURES
Pursuant to the requirements of Section 13 or 15(d) of the Securities Exchange Act of 1934, the registrant has duly caused this report to be signed on its behalf by the undersigned thereunto duly authorized.
TEREX CORPORATION
|
By:
|
/s/ John L. Garrison, Jr.
|
February 24, 2017
|
|
|
John L. Garrison, Jr.
|
|||
|
President, Chief Executive
Officer and Director
|
|||
Pursuant to the requirements of the Securities Exchange Act of 1934, this report has been signed below by the following persons on behalf of the registrant and in the capacities and on the dates indicated.
|
NAME
|
TITLE
|
DATE
|
|
/s/ John L. Garrison, Jr
|
President, Chief Executive Officer
|
February 24, 2017
|
|
John L. Garrison, Jr.
|
and Director
|
|
|
(Principal Executive Officer)
|
||
|
/s/ Kevin P. Bradley
|
Senior Vice President and Chief Financial
|
February 24, 2017
|
|
Kevin P. Bradley
|
Officer
|
|
|
(Principal Financial Officer)
|
||
|
/s/ Mark I. Clair
|
Vice President, Controller and Chief
|
February 24, 2017
|
|
Mark I. Clair
|
Accounting Officer
|
|
|
(Principal Accounting Officer)
|
||
|
/s/ Paula H. J. Cholmondeley
|
Director
|
February 24, 2017
|
|
Paula H. J. Cholmondeley
|
||
|
/s/ Don DeFosset
|
Director
|
February 24, 2017
|
|
Don DeFosset
|
||
|
/s/ Thomas J. Hansen
|
Director
|
February 24, 2017
|
|
Thomas J. Hansen
|
||
|
/s/ Matthew P. Hepler
|
Director
|
February 24, 2017
|
|
Matthew P. Hepler
|
||
|
/s/ Raimund Klinkner
|
Director
|
February 24, 2017
|
|
Raimund Klinkner
|
||
|
/s/ David A. Sachs
|
Non-Executive Chairman and Director
|
February 24, 2017
|
|
David A. Sachs
|
||
|
/s/ Oren G. Shaffer
|
Director
|
February 24, 2017
|
|
Oren G. Shaffer
|
||
|
/s/ David C. Wang
|
Director
|
February 24, 2017
|
|
David C. Wang
|
||
|
/s/ Scott W. Wine
|
Director
|
February 24, 2017
|
|
Scott W. Wine
|
||
57
THIS PAGE IS INTENTIONALLY BLANK
NEXT PAGE IS NUMBERED “E-1”
58
EXHIBIT INDEX
|
2.1
|
Stock and Asset Purchase Agreement between Terex Corporation and Konecranes Plc (incorporated by reference to Exhibit 2.1 of the Form 8-K Current Report, Commission File No. 1-10702, dated May 16, 2016 and filed with the Commission on May 19, 2016).
|
|
2.2
|
Amendment No. 1 to the Stock and Asset Purchase Agreement between Terex Corporation and Konecranes Plc (incorporated by reference to Exhibit 2.1 of the Form 8-K Current Report, Commission File No. 1-10702, dated June 21, 2016 and filed with the Commission on June 24, 2016).
|
|
3.1
|
Restated Certificate of Incorporation of Terex Corporation (incorporated by reference to Exhibit 3.1 of the Form S-1 Registration Statement of Terex Corporation, Registration No. 33-52297).
|
|
3.2
|
Certificate of Elimination with respect to the Series B Preferred Stock (incorporated by reference to Exhibit 4.3 of the Form 10-K for the year ended December 31, 1997 of Terex Corporation, Commission File No. 1-10702).
|
|
3.3
|
Certificate of Amendment to Certificate of Incorporation of Terex Corporation dated September 5, 1998 (incorporated by reference to Exhibit 3.3 of the Form 10-K for the year ended December 31, 1998 of Terex Corporation, Commission File No. 1-10702).
|
|
3.4
|
Certificate of Amendment of the Certificate of Incorporation of Terex Corporation dated July 17, 2007 (incorporated by reference to Exhibit 3.1 of the Form 8-K Current Report, Commission File No. 1-10702, dated July 17, 2007 and filed with the Commission on July 17, 2007).
|
|
3.5
|
Amended and Restated Bylaws of Terex Corporation (incorporated by reference to Exhibit 3.1 of the Form 8-K Current Report, Commission File No. 1-10702, dated October 15, 2015 and filed with the Commission on October 19, 2015).
|
|
4.1
|
Indenture, dated July 20, 2007, between Terex Corporation and HSBC Bank USA, National Association, as Trustee, relating to senior debt securities (incorporated by reference to Exhibit 4.1 of the Form S-3 Registration Statement of Terex Corporation, Registration No. 333-144796).
|
|
4.2
|
Indenture, dated July 20, 2007, between Terex Corporation and HSBC Bank USA, National Association, as Trustee, relating to subordinated debt securities (incorporated by reference to Exhibit 4.2 of the Form S-3 Registration Statement of Terex Corporation, Registration No. 333-144796).
|
|
4.3
|
Third Supplemental Indenture, dated as of March 27, 2012, to Senior Debt Indenture dated as of July 20, 2007, with HSBC Bank USA, National Association as Trustee relating to the 6.50% Senior Notes due 2020 (incorporated by reference to Exhibit 4.1 of the Form 8-K Current Report, Commission File No. 1-10702, dated March 27, 2012 and filed with the Commission on March 30, 2012).
|
|
4.4
|
Fourth Supplemental Indenture, dated as of November 26, 2012, to the Senior Debt Indenture dated as of July 20, 2007, with HSBC Bank USA, National Association as Trustee relating to 6% Senior Notes due 2021 (incorporated by reference to Exhibit 4.1 of the Form 8-K Current Report, Commission File No. 1-10702, dated November 26, 2012 and filed with the Commission on November 30, 2012).
|
|
4.5
|
Supplemental Indenture to the Third Supplemental Indenture dated as of March 27, 2012 to Senior Debt Indenture dated as of July 20, 2007, with HSBC Bank USA, National Association as Trustee relating to the 6.50% Senior Notes due 2020 (incorporated by reference to Exhibit 4.1 of the Form 8-K Current Report, Commission File No. 1-10702, dated September 8, 2015 and filed with the Commission on September 14, 2015).
|
|
4.6
|
Supplemental Indenture to the Fourth Supplemental Indenture, dated as of November 26, 2012, to the Senior Debt Indenture dated as of July 20, 2007, with HSBC Bank USA, National Association as Trustee relating to 6% Senior Notes due 2021 (incorporated by reference to Exhibit 4.2 of the Form 8-K Current Report, Commission File No. 1-10702, dated September 8, 2015 and filed with the Commission on September 14, 2015).
|
|
4.7
|
Waiver Agreement, dated September 30, 2016, to Third Supplemental Indenture, dated as of March 27, 2012, to the Senior Debt Indenture dated as of July 20, 2007, with HSBC Bank USA, National Association as Trustee relating to the 6.50% Senior Notes due 2020 (incorporated by reference to Exhibit 4.1 of the Form 8-K Current Report, Commission File No. 1-10702, dated September 30, 2016 and filed with the Commission on October 5, 2016).
|
E-1
|
4.8
|
Waiver Agreement, dated September 30, 2016, to Fourth Supplemental Indenture, Dated as of November 26, 2012, to the Senior Debt Indenture dated as of July 20, 2007, with HSBC Bank USA, National Association as Trustee relating to the 6% Senior Notes due 2021 (incorporated by reference to Exhibit 4.2 of the Form 8-K Current Report, Commission File No. 1-10702, dated September 30, 2016 and filed with the Commission on October 5, 2016).
|
|
4.9
|
Indenture, dated as of January 31, 2017, among Terex Corporation, the Guarantors and HSBC Bank USA, National Association as Trustee relating to 5.625% Senior Notes due 2025 (incorporated by reference to Exhibit 4.1 of the Form 8-K Current Report, Commission File No. 1-10702, dated January 31, 2017 and filed with the Commission on February 2, 2017).
|
|
10.1
|
Terex Corporation Amended and Restated Employee Stock Purchase Plan (incorporated by reference to Exhibit 10.2 of the Form 10-Q for the quarter ended June 30, 2007 of Terex Corporation, Commission File No. 1-10702). ***
|
|
10.2
|
1996 Terex Corporation Long Term Incentive Plan (incorporated by reference to Exhibit 10.1 of the Form S-8 Registration Statement of Terex Corporation, Registration No. 333-03983). ***
|
|
10.3
|
Amendment No. 1 to 1996 Terex Corporation Long Term Incentive Plan (incorporated by reference to Exhibit 10.5 of the Form 10-K for the year ended December 31, 1999 of Terex Corporation, Commission File No. 1-10702). ***
|
|
10.4
|
Amendment No. 2 to 1996 Terex Corporation Long Term Incentive Plan (incorporated by reference to Exhibit 10.6 of the Form 10-K for the year ended December 31, 1999 of Terex Corporation, Commission File No. 1-10702). ***
|
|
10.5
|
Terex Corporation Amended and Restated 2000 Incentive Plan (incorporated by reference to Exhibit 10.3 of the Form 8-K Current Report, Commission File No. 1-10702, dated October 14, 2008 and filed with the Commission on October 17, 2008). ***
|
|
10.6
|
Form of Restricted Stock Agreement under the Terex Corporation 2000 Incentive Plan between Terex Corporation and participants of the 2000 Incentive Plan (incorporated by reference to Exhibit 10.4 of the Form 8-K Current Report, Commission File No. 1-10702, dated January 1, 2005 and filed with the Commission on January 5, 2005). ***
|
|
10.7
|
Form of Option Agreement under the Terex Corporation 2000 Incentive Plan between Terex Corporation and participants of the 2000 Incentive Plan (incorporated by reference to Exhibit 10.5 of the Form 8-K Current Report, Commission File No. 1-10702, dated January 1, 2005 and filed with the Commission on January 5, 2005). ***
|
|
10.8
|
Terex Corporation Amended and Restated Supplemental Executive Retirement Plan (incorporated by reference to Exhibit 10.10 of the Form 10-K for the year ended December 31, 2008 of Terex Corporation, Commission File No. 1-10702). ***
|
|
10.9
|
Terex Corporation Amended and Restated Deferred Compensation Plan (incorporated by reference to Exhibit 10.11 of the Form 10-Q for the quarter ended June 30, 2004 of Terex Corporation, Commission File No. 1-10702). ***
|
|
10.10
|
Amendment to the Terex Corporation Amended and Restated Deferred Compensation Plan (incorporated by reference to Exhibit 10.1 of the Form 8-K Current Report, Commission File No. 1-10702, dated October 14, 2008 and filed with the Commission on October 17, 2008). ***
|
|
10.11
|
Terex Corporation Deferred Compensation Plan (incorporated by reference to Exhibit 10.2 of the Form 8-K Current Report, Commission File No. 1-10702, dated May 9, 2013 and filed with the Commission on May, 14, 2013). ***
|
|
10.12
|
Terex Corporation Amended and Restated 2009 Omnibus Incentive Plan (incorporated by reference to Exhibit 10.1 of the Form 8-K Current Report, Commission File No. 1-10702, dated May 9, 2013 and filed with the Commission on May, 14, 2013). ***
|
|
10.13
|
Form of Restricted Stock Agreement (time based) under the Terex Corporation Amended and Restated 2009 Omnibus Incentive Plan between Terex Corporation and participants of the 2009 Omnibus Incentive Plan. ***
|
|
10.14
|
Form of Restricted Stock Agreement (performance based) under the Terex Corporation Amended and Restated 2009 Omnibus Incentive Plan between Terex Corporation and participants of the 2009 Omnibus Incentive Plan. ***
|
|
10.15
|
Credit Agreement dated as of August 13, 2014, among Terex Corporation, certain of its subsidiaries, the Lenders named therein and Credit Suisse AG, as Administrative Agent and Collateral Agent (incorporated by reference to Exhibit 10.1 of the Form 8-K Current Report, Commission File No. 1-10702, dated August 15, 2014 and filed with the Commission August 15, 2014).
|
E-2
|
10.16
|
Guarantee and Collateral Agreement dated as of August 13, 2014, among Terex Corporation, certain of its subsidiaries, and Credit Suisse AG, as Collateral Agent (incorporated by reference to Exhibit 10.2 of the Form 8-K Current Report, Commission File No. 1-10702, dated August 15, 2014 and filed with the Commission August 15, 2014).
|
|
10.17
|
Incremental Assumption Agreement and Amendment No. 1, dated as of May 29, 2015, to the Credit Agreement dated as of August 13, 2014, among Terex Corporation, certain of its subsidiaries, the Lenders named therein and Credit Suisse AG, as Administrative Agent and Collateral Agent (incorporated by reference to Exhibit 10.1 of the Form 8-K Current Report, Commission File No. 1-10702, dated May 28, 2015 and filed with the Commission June 2, 2015).
|
|
10.18
|
Credit Agreement dated as of January 31, 2017, among Terex Corporation, certain of its subsidiaries, the Lenders and Issuing Banks named therein and Credit Suisse AG, Cayman Islands Branch, as Administrative Agent and Collateral Agent (incorporated by reference to Exhibit 10.1 of the Form 8-K Current Report, Commission File No. 1-10702, dated January 31, 2017 and filed with the Commission February 2, 2017).
|
|
10.19
|
Guarantee and Collateral Agreement dated as of January 31, 2017, among Terex Corporation, certain of its subsidiaries, and Credit Suisse AG, Cayman Islands Branch, as Collateral Agent (incorporated by reference to Exhibit 10.1 of the Form 8-K Current Report, Commission File No. 1-10702, dated January 31, 2017 and filed with the Commission February 2, 2017).
|
|
10.20
|
Form of Change in Control and Severance Agreement between Terex Corporation and certain executive officers (incorporated by reference to Exhibit 10.1 of the Form 8-K Current Report, Commission File No. 1-10702, dated March 29, 2011 and filed with the Commission on March 31, 2011). ***
|
|
10.21
|
Form of Change in Control and Severance Agreement between Terex Corporation and certain executive officers (incorporated by reference to Exhibit 10.2 of the Form 8-K Current Report, Commission File No. 1-10702, dated March 29, 2011 and filed with the Commission on March 31, 2011). ***
|
|
10.22
|
Employment Letter from Terex Corporation signed by John Garrison on October 15, 2015 (incorporated by reference to Exhibit 10.1 of the Form 8-K Current Report, Commission File No. 1-10702, dated October 15, 2015 and filed with the Commission on October 19, 2015). ***
|
|
10.23
|
Consulting Agreement between Terex Corporation and Ronald M. DeFeo, dated December 11, 2015 (incorporated by reference to Exhibit 10.1 of the Form 8-K Current Report, Commission File No. 1-10702, dated December 11, 2015 and filed with the Commission on December 14, 2015). ***
|
|
10.24
|
Shareholders Agreement by and between Terex Corporation and Konecranes Plc, dated as of January 4, 2017 (incorporated by reference to Exhibit 10.1 of the Form 8-K Current Report, Commission File No. 1-10702, dated January 4, 2017 and filed with the Commission on January 10, 2017).
|
|
10.25
|
Registration Rights Agreement by and between Terex Corporation and Konecranes Plc, dated as of January 4, 2017 (incorporated by reference to Exhibit 10.2 of the Form 8-K Current Report, Commission File No. 1-10702, dated January 4, 2017 and filed with the Commission on January 10, 2017).
|
|
12
|
Calculation of Ratio of Earnings to Fixed Charges. *
|
|
21.1
|
Subsidiaries of Terex Corporation.*
|
|
23.1
|
Consent of Independent Registered Public Accounting Firm PricewaterhouseCoopers LLP, Stamford, Connecticut.*
|
|
24.1
|
Power of Attorney.*
|
|
31.1
|
Chief Executive Officer Certification pursuant to Rule 13a-14(a)/15d-14(a). *
|
|
31.2
|
Chief Financial Officer Certification pursuant to Rule 13a-14(a)/15d-14(a). *
|
|
32
|
Chief Executive Officer and Chief Financial Officer Certification pursuant to 18 U.S.C. Section 1350, as adopted pursuant to Section 906 of the Sarbanes –Oxley Act of 2002. **
|
|
101.INS
|
XBRL Instance Document. *
|
|
101.SCH
|
XBRL Taxonomy Extension Schema Document. *
|
E-3
|
101.CAL
|
XBRL Taxonomy Extension Calculation Linkbase Document. *
|
|
101.DEF
|
XBRL Taxonomy Extension Definition Linkbase Document. *
|
|
101.LAB
|
XBRL Taxonomy Extension Label Linkbase Document. *
|
|
101.PRE
|
XBRL Taxonomy Extension Presentation Linkbase Document. *
|
|
*
|
Exhibit filed with this document.
|
|
**
|
Exhibit furnished with this document.
|
|
***
|
Denotes a management contract or compensatory plan or arrangement.
|
E-4
TEREX CORPORATION AND SUBSIDIARIES
INDEX TO CONSOLIDATED FINANCIAL STATEMENTS AND FINANCIAL STATEMENT SCHEDULE
TEREX CORPORATION
CONSOLIDATED FINANCIAL STATEMENTS AS OF
DECEMBER 31, 2016
AND
2015
AND FOR EACH OF THE THREE YEARS
IN THE PERIOD ENDED
DECEMBER 31, 2016
|
|
Page
|
|
|
|
FINANCIAL STATEMENT SCHEDULE
All other schedules for which provision is made in the applicable regulations of the Securities and Exchange Commission are not required under the related instructions, or are not applicable, and therefore have been omitted.
F-1
REPORT OF INDEPENDENT REGISTERED PUBLIC ACCOUNTING FIRM
To the Board of Directors
and Stockholders of Terex Corporation
In our opinion, the consolidated financial statements listed in the accompanying index present fairly, in all material respects, the financial position of Terex Corporation and its subsidiaries at
December 31, 2016
and
2015
, and the results of their operations and their cash flows for each of the three years in the period ended
December 31, 2016
in conformity with accounting principles generally accepted in the United States of America. In addition, in our opinion, the financial statement schedule listed in the accompanying index presents fairly, in all material respects, the information set forth therein when read in conjunction with the related consolidated financial statements. Also in our opinion, the Company maintained, in all material respects, effective internal control over financial reporting as of
December 31, 2016
, based on criteria established in
Internal Control - Integrated Framework (2013)
issued by the Committee of Sponsoring Organizations of the Treadway Commission (COSO). The Company’s management is responsible for these financial statements and financial statement schedule, for maintaining effective internal control over financial reporting and for its assessment of the effectiveness of internal control over financial reporting, included in Management’s Annual Report on Internal Control over Financial Reporting appearing under Item 9A. Our responsibility is to express opinions on these financial statements, on the financial statement schedule, and on the Company's internal control over financial reporting based on our integrated audits. We conducted our audits in accordance with the standards of the Public Company Accounting Oversight Board (United States). Those standards require that we plan and perform the audits to obtain reasonable assurance about whether the financial statements are free of material misstatement and whether effective internal control over financial reporting was maintained in all material respects. Our audits of the financial statements included examining, on a test basis, evidence supporting the amounts and disclosures in the financial statements, assessing the accounting principles used and significant estimates made by management, and evaluating the overall financial statement presentation. Our audit of internal control over financial reporting included obtaining an understanding of internal control over financial reporting, assessing the risk that a material weakness exists, and testing and evaluating the design and operating effectiveness of internal control based on the assessed risk. Our audits also included performing such other procedures as we considered necessary in the circumstances. We believe that our audits provide a reasonable basis for our opinions.
A company’s internal control over financial reporting is a process designed to provide reasonable assurance regarding the reliability of financial reporting and the preparation of financial statements for external purposes in accordance with generally accepted accounting principles. A company’s internal control over financial reporting includes those policies and procedures that (i) pertain to the maintenance of records that, in reasonable detail, accurately and fairly reflect the transactions and dispositions of the assets of the company; (ii) provide reasonable assurance that transactions are recorded as necessary to permit preparation of financial statements in accordance with generally accepted accounting principles, and that receipts and expenditures of the company are being made only in accordance with authorizations of management and directors of the company; and (iii) provide reasonable assurance regarding prevention or timely detection of unauthorized acquisition, use, or disposition of the company’s assets that could have a material effect on the financial statements.
Because of its inherent limitations, internal control over financial reporting may not prevent or detect misstatements. Also, projections of any evaluation of effectiveness to future periods are subject to the risk that controls may become inadequate because of changes in conditions, or that the degree of compliance with the policies or procedures may deteriorate.
/s/PricewaterhouseCoopers LLP
Stamford, Connecticut
February 24, 2017
F-2
TEREX CORPORATION AND SUBSIDIARIES
(in millions, except per share data)
|
Year Ended
December 31, |
|||||||||||
|
|
2016
|
2015
|
2014
|
||||||||
|
Net sales
|
$
|
4,443.1
|
|
$
|
5,021.7
|
|
$
|
5,484.0
|
|
||
|
Cost of goods sold
|
(3,730.7
|
)
|
(4,050.5
|
)
|
(4,432.5
|
)
|
|||||
|
Gross profit
|
712.4
|
|
971.2
|
|
1,051.5
|
|
|||||
|
Selling, general and administrative expenses
|
(684.2
|
)
|
(647.5
|
)
|
(651.5
|
)
|
|||||
|
Goodwill impairment
|
(176.0
|
)
|
—
|
|
—
|
|
|||||
|
Income (loss) from operations
|
(147.8
|
)
|
323.7
|
|
400.0
|
|
|||||
|
Other income (expense)
|
|||||||||||
|
Interest income
|
4.3
|
|
3.8
|
|
6.0
|
|
|||||
|
Interest expense
|
(102.0
|
)
|
(108.1
|
)
|
(122.7
|
)
|
|||||
|
Other income (expense) – net
|
(25.2
|
)
|
(23.7
|
)
|
(4.7
|
)
|
|||||
|
Income (loss) from continuing operations before income taxes
|
(270.7
|
)
|
195.7
|
|
278.6
|
|
|||||
|
(Provision for) benefit from income taxes
|
77.4
|
|
(67.5
|
)
|
(26.6
|
)
|
|||||
|
Income (loss) from continuing operations
|
(193.3
|
)
|
128.2
|
|
252.0
|
|
|||||
|
Income (loss) from discontinued operations – net of tax
|
14.3
|
|
17.4
|
|
8.9
|
|
|||||
|
Gain (loss) on disposition of discontinued operations – net of tax
|
3.5
|
|
3.4
|
|
58.6
|
|
|||||
|
Net income (loss)
|
(175.5
|
)
|
149.0
|
|
319.5
|
|
|||||
|
Net loss (income) from continuing operations attributable to noncontrolling interest
|
0.3
|
|
0.2
|
|
1.5
|
|
|||||
|
Net loss (income) from discontinued operations attributable to noncontrolling interest
|
(0.9
|
)
|
(3.3
|
)
|
(2.0
|
)
|
|||||
|
Net income (loss) attributable to Terex Corporation
|
$
|
(176.1
|
)
|
$
|
145.9
|
|
$
|
319.0
|
|
||
|
Amounts attributable to Terex Corporation common stockholders:
|
|||||||||||
|
Income (loss) from continuing operations
|
$
|
(193.0
|
)
|
$
|
128.4
|
|
$
|
253.5
|
|
||
|
Income (loss) from discontinued operations – net of tax
|
13.4
|
|
14.1
|
|
6.9
|
|
|||||
|
Gain (loss) on disposition of discontinued operations – net of tax
|
3.5
|
|
3.4
|
|
58.6
|
|
|||||
|
Net income (loss) attributable to Terex Corporation
|
$
|
(176.1
|
)
|
$
|
145.9
|
|
$
|
319.0
|
|
||
|
Basic Earnings (Loss) per Share Attributable to Terex Corporation Common Stockholders:
|
|||||||||||
|
Income (loss) from continuing operations
|
$
|
(1.79
|
)
|
$
|
1.20
|
|
$
|
2.31
|
|
||
|
Income (loss) from discontinued operations – net of tax
|
0.13
|
|
0.13
|
|
0.06
|
|
|||||
|
Gain (loss) on disposition of discontinued operations – net of tax
|
0.03
|
|
0.03
|
|
0.54
|
|
|||||
|
Net income (loss) attributable to Terex Corporation
|
$
|
(1.63
|
)
|
$
|
1.36
|
|
$
|
2.91
|
|
||
|
Diluted Earnings (Loss) per Share Attributable to Terex Corporation Common Stockholders:
|
|||||||||||
|
Income (loss) from continuing operations
|
$
|
(1.79
|
)
|
$
|
1.17
|
|
$
|
2.22
|
|
||
|
Income (loss) from discontinued operations – net of tax
|
0.13
|
|
0.13
|
|
0.06
|
|
|||||
|
Gain (loss) on disposition of discontinued operations – net of tax
|
0.03
|
|
0.03
|
|
0.51
|
|
|||||
|
Net income (loss) attributable to Terex Corporation
|
$
|
(1.63
|
)
|
$
|
1.33
|
|
$
|
2.79
|
|
||
|
Weighted average number of shares outstanding in per share calculation
|
|||||||||||
|
Basic
|
107.9
|
|
107.4
|
|
109.7
|
|
|||||
|
Diluted
|
107.9
|
|
109.6
|
|
114.2
|
|
|||||
The accompanying notes are an integral part of these consolidated financial statements.
F-3
TEREX CORPORATION AND SUBSIDIARIES
CONSOLIDATED STATEMENT OF COMPREHENSIVE INCOME (LOSS)
(in millions)
|
Year Ended December 31,
|
||||||||||
|
2016
|
2015
|
2014
|
||||||||
|
Net income (loss)
|
$
|
(175.5
|
)
|
$
|
149.0
|
|
$
|
319.5
|
|
|
|
Other comprehensive income (loss), net of tax:
|
||||||||||
|
Cumulative translation adjustment, net of (provision for) benefit from taxes of $14.0, $11.7 and $0.9, respectively
|
(123.0
|
)
|
(247.3
|
)
|
(237.7
|
)
|
||||
|
Derivative hedging adjustment, net of (provision for) benefit from taxes of $1.2, $(0.4) and $1.2, respectively
|
(4.7
|
)
|
3.0
|
|
(3.4
|
)
|
||||
|
Debt and equity securities adjustment, net of (provision for) benefit from taxes of $(0.1), $0.1 and $0.0, respectively
|
6.9
|
|
(7.9
|
)
|
1.6
|
|
||||
|
Pension liability adjustment:
|
||||||||||
|
Net gain (loss), net of (provision for) benefit from taxes of $12.1, $2.6 and $11.4, respectively
|
(28.3
|
)
|
11.7
|
|
(94.0
|
)
|
||||
|
Amortization of actuarial (gain) loss, net of provision for (benefit from) taxes of $(3.1), $(1.6) and $(1.2), respectively
|
6.7
|
|
9.6
|
|
4.9
|
|
||||
|
Foreign exchange and other effects, net of (provision for) benefit from taxes of $(2.4), $(1.9) and $(1.2), respectively
|
12.2
|
|
11.0
|
|
15.2
|
|
||||
|
Total pension liability adjustment
|
(9.4
|
)
|
32.3
|
|
(73.9
|
)
|
||||
|
Other comprehensive income (loss)
|
(130.2
|
)
|
(219.9
|
)
|
(313.4
|
)
|
||||
|
Comprehensive income (loss)
|
(305.7
|
)
|
(70.9
|
)
|
6.1
|
|
||||
|
Comprehensive loss (income) attributable to noncontrolling interest
|
(0.2
|
)
|
(3.0
|
)
|
(0.4
|
)
|
||||
|
Comprehensive income (loss) attributable to Terex Corporation
|
$
|
(305.9
|
)
|
$
|
(73.9
|
)
|
$
|
5.7
|
|
|
The accompanying notes are an integral part of these consolidated financial statements.
F-4
TEREX CORPORATION AND SUBSIDIARIES
(in millions, except par value)
|
December 31,
|
|||||||
|
2016
|
2015
|
||||||
|
Assets
|
|||||||
|
Current assets
|
|||||||
|
Cash and cash equivalents
|
$
|
428.5
|
|
$
|
371.2
|
|
|
|
Trade receivables (net of allowance of $16.5 and $20.4 at December 31, 2016 and 2015, respectively)
|
512.5
|
|
703.3
|
|
|||
|
Inventories
|
853.8
|
|
1,063.6
|
|
|||
|
Prepaid and other current assets
|
172.8
|
|
252.5
|
|
|||
|
Current assets held for sale
|
732.9
|
|
749.6
|
|
|||
|
Total current assets
|
2,700.5
|
|
3,140.2
|
|
|||
|
Non-current assets
|
|||||||
|
Property, plant and equipment – net
|
304.6
|
|
371.9
|
|
|||
|
Goodwill
|
259.7
|
|
459.1
|
|
|||
|
Intangible assets – net
|
18.4
|
|
22.6
|
|
|||
|
Other assets
|
552.3
|
|
461.7
|
|
|||
|
Non-current assets held for sale
|
1,171.3
|
|
1,160.5
|
|
|||
|
Total assets
|
$
|
5,006.8
|
|
$
|
5,616.0
|
|
|
|
Liabilities and Stockholders’ Equity
|
|||||||
|
Current liabilities
|
|||||||
|
Notes payable and current portion of long-term debt
|
$
|
13.8
|
|
$
|
66.4
|
|
|
|
Trade accounts payable
|
522.7
|
|
560.7
|
|
|||
|
Accrued compensation and benefits
|
125.1
|
|
128.5
|
|
|||
|
Accrued warranties and product liability
|
61.2
|
|
51.5
|
|
|||
|
Other current liabilities
|
230.4
|
|
205.5
|
|
|||
|
Current liabilities held for sale
|
453.8
|
|
446.0
|
|
|||
|
Total current liabilities
|
1,407.0
|
|
1,458.6
|
|
|||
|
Non-current liabilities
|
|||||||
|
Long-term debt, less current portion
|
1,562.0
|
|
1,729.8
|
|
|||
|
Retirement plans
|
153.8
|
|
157.0
|
|
|||
|
Other non-current liabilities
|
50.7
|
|
60.1
|
|
|||
|
Non-current liabilities held for sale
|
312.1
|
|
298.5
|
|
|||
|
Total liabilities
|
3,485.6
|
|
3,704.0
|
|
|||
|
Commitments and contingencies
|
|
|
|
|
|||
|
Stockholders’ equity
|
|||||||
|
Common stock, $.01 par value – authorized 300.0 shares; issued 129.6 and 128.8 shares at December 31, 2016 and 2015, respectively
|
1.3
|
|
1.3
|
|
|||
|
Additional paid-in capital
|
1,300.0
|
|
1,273.3
|
|
|||
|
Retained earnings
|
1,897.9
|
|
2,104.6
|
|
|||
|
Accumulated other comprehensive (loss) income
|
(779.4
|
)
|
(649.6
|
)
|
|||
|
Less cost of shares of common stock in treasury – 24.6 and 21.1 shares at December 31, 2016 and 2015, respectively
|
(935.1
|
)
|
(852.2
|
)
|
|||
|
Total Terex Corporation stockholders’ equity
|
1,484.7
|
|
1,877.4
|
|
|||
|
Noncontrolling interest
|
36.5
|
|
34.6
|
|
|||
|
Total stockholders’ equity
|
1,521.2
|
|
1,912.0
|
|
|||
|
Total liabilities, noncontrolling interest and stockholders’ equity
|
$
|
5,006.8
|
|
$
|
5,616.0
|
|
|
The accompanying notes are an integral part of these consolidated financial statements.
F-5
CONSOLIDATED STATEMENT OF CHANGES IN STOCKHOLDERS’ EQUITY
(in millions)
|
Outstanding
Shares
|
Common
Stock
|
Additional
Paid-in
Capital
|
Retained
Earnings
|
Accumulated
Other
Comprehensive
Income (Loss)
|
Common
Stock in
Treasury
|
Non-controlling
Interest
|
Total
|
|||||||||||||||||||||||
|
Balance at December 31, 2013
|
109.9
|
|
$
|
1.2
|
|
$
|
1,247.5
|
|
$
|
1,688.1
|
|
$
|
(116.5
|
)
|
$
|
(630.2
|
)
|
$
|
24.7
|
|
$
|
2,214.8
|
|
|||||||
|
Net Income (Loss)
|
—
|
|
—
|
|
—
|
|
319.0
|
|
—
|
|
—
|
|
0.5
|
|
319.5
|
|
||||||||||||||
|
Other Comprehensive Income (Loss) – net of tax
|
—
|
|
—
|
|
—
|
|
—
|
|
(313.3
|
)
|
—
|
|
(0.1
|
)
|
(313.4
|
)
|
||||||||||||||
|
Issuance of Common Stock
|
0.9
|
|
—
|
|
21.7
|
|
—
|
|
—
|
|
—
|
|
—
|
|
21.7
|
|
||||||||||||||
|
Compensation under Stock-based Plans – net
|
—
|
|
—
|
|
8.8
|
|
—
|
|
—
|
|
1.2
|
|
—
|
|
10.0
|
|
||||||||||||||
|
Acquisition
|
—
|
|
—
|
|
—
|
|
—
|
|
—
|
|
—
|
|
8.1
|
|
8.1
|
|
||||||||||||||
|
Dividends
|
—
|
|
—
|
|
0.4
|
|
(22.2
|
)
|
—
|
|
—
|
|
—
|
|
(21.8
|
)
|
||||||||||||||
|
Purchase of noncontrolling interest
|
—
|
|
—
|
|
(26.9
|
)
|
—
|
|
—
|
|
—
|
|
—
|
|
(26.9
|
)
|
||||||||||||||
|
Acquisition of Treasury Stock
|
(5.4
|
)
|
—
|
|
—
|
|
—
|
|
—
|
|
(172.9
|
)
|
—
|
|
(172.9
|
)
|
||||||||||||||
|
Balance at December 31, 2014
|
105.4
|
|
1.2
|
|
1,251.5
|
|
1,984.9
|
|
(429.8
|
)
|
(801.9
|
)
|
33.2
|
|
2,039.1
|
|
||||||||||||||
|
Net Income (Loss)
|
—
|
|
—
|
|
—
|
|
145.9
|
|
—
|
|
—
|
|
3.1
|
|
149.0
|
|
||||||||||||||
|
Other Comprehensive Income (Loss) – net of tax
|
—
|
|
—
|
|
—
|
|
—
|
|
(219.8
|
)
|
—
|
|
(0.1
|
)
|
(219.9
|
)
|
||||||||||||||
|
Issuance of Common Stock
|
4.3
|
|
0.1
|
|
25.8
|
|
—
|
|
—
|
|
—
|
|
—
|
|
25.9
|
|
||||||||||||||
|
Compensation under Stock-based Plans – net
|
—
|
|
—
|
|
(4.5
|
)
|
—
|
|
—
|
|
2.3
|
|
—
|
|
(2.2
|
)
|
||||||||||||||
|
Dividends
|
—
|
|
—
|
|
0.4
|
|
(26.2
|
)
|
—
|
|
—
|
|
(0.3
|
)
|
(26.1
|
)
|
||||||||||||||
|
Purchase of noncontrolling interest
|
—
|
|
—
|
|
0.1
|
|
—
|
|
—
|
|
—
|
|
(1.3
|
)
|
(1.2
|
)
|
||||||||||||||
|
Acquisition of Treasury Stock
|
(2.0
|
)
|
—
|
|
—
|
|
—
|
|
—
|
|
(52.6
|
)
|
—
|
|
(52.6
|
)
|
||||||||||||||
|
Balance at December 31, 2015
|
107.7
|
|
1.3
|
|
1,273.3
|
|
2,104.6
|
|
(649.6
|
)
|
(852.2
|
)
|
34.6
|
|
1,912.0
|
|
||||||||||||||
|
Net Income (Loss)
|
—
|
|
—
|
|
—
|
|
(176.1
|
)
|
—
|
|
—
|
|
0.6
|
|
(175.5
|
)
|
||||||||||||||
|
Other Comprehensive Income (Loss) – net of tax
|
—
|
|
—
|
|
—
|
|
—
|
|
(129.8
|
)
|
—
|
|
(0.4
|
)
|
(130.2
|
)
|
||||||||||||||
|
Issuance of Common Stock
|
0.8
|
|
—
|
|
22.1
|
|
—
|
|
—
|
|
—
|
|
—
|
|
22.1
|
|
||||||||||||||
|
Compensation under Stock-based Plans – net
|
0.1
|
|
—
|
|
4.0
|
|
—
|
|
—
|
|
1.4
|
|
—
|
|
5.4
|
|
||||||||||||||
|
Proceeds from noncontrolling interest
|
—
|
|
—
|
|
—
|
|
—
|
|
—
|
|
—
|
|
2.9
|
|
2.9
|
|
||||||||||||||
|
Dividends
|
—
|
|
—
|
|
0.6
|
|
(30.6
|
)
|
—
|
|
—
|
|
(1.2
|
)
|
(31.2
|
)
|
||||||||||||||
|
Acquisition of Treasury Stock
|
(3.6
|
)
|
—
|
|
—
|
|
—
|
|
—
|
|
(84.3
|
)
|
—
|
|
(84.3
|
)
|
||||||||||||||
|
Balance at December 31, 2016
|
105.0
|
|
$
|
1.3
|
|
$
|
1,300.0
|
|
$
|
1,897.9
|
|
$
|
(779.4
|
)
|
$
|
(935.1
|
)
|
$
|
36.5
|
|
$
|
1,521.2
|
|
|||||||
The accompanying notes are an integral part of these financial statements.
F-6
TEREX CORPORATION AND SUBSIDIARIES
(in millions)
|
Year Ended December 31,
|
|||||||||||
|
2016
|
2015
|
2014
|
|||||||||
|
OPERATING ACTIVITIES
|
|||||||||||
|
Net income (loss)
|
$
|
(175.5
|
)
|
$
|
149.0
|
|
$
|
319.5
|
|
||
|
Adjustments to reconcile net income (loss) to cash provided by (used in) operating activities:
|
|||||||||||
|
Depreciation and amortization
|
96.7
|
|
132.4
|
|
165.5
|
|
|||||
|
(Gain) loss on disposition of discontinued operations
|
(3.5
|
)
|
(3.4
|
)
|
(58.6
|
)
|
|||||
|
Deferred taxes
|
(137.6
|
)
|
(2.6
|
)
|
(17.8
|
)
|
|||||
|
Goodwill impairment
|
176.0
|
|
11.3
|
|
—
|
|
|||||
|
Asset impairments
|
70.0
|
|
25.4
|
|
3.9
|
|
|||||
|
(Gain) loss on sale of assets
|
(5.8
|
)
|
(1.0
|
)
|
16.6
|
|
|||||
|
Stock-based compensation expense
|
37.8
|
|
38.5
|
|
46.5
|
|
|||||
|
Inventory and other non-cash charges
|
60.6
|
|
32.1
|
|
21.2
|
|
|||||
|
Changes in operating assets and liabilities (net of effects of acquisitions and divestitures):
|
|||||||||||
|
Trade receivables
|
33.0
|
|
74.1
|
|
(4.2
|
)
|
|||||
|
Inventories
|
97.3
|
|
(90.6
|
)
|
(27.1
|
)
|
|||||
|
Trade accounts payable
|
(21.0
|
)
|
41.7
|
|
85.8
|
|
|||||
|
Income taxes payable / receivable
|
16.9
|
|
16.1
|
|
(68.3
|
)
|
|||||
|
Other assets and liabilities
|
165.6
|
|
(228.6
|
)
|
(92.6
|
)
|
|||||
|
Foreign exchange and other operating activities, net
|
(43.5
|
)
|
18.5
|
|
20.3
|
|
|||||
|
Net cash provided by (used in) operating activities
|
367.0
|
|
212.9
|
|
410.7
|
|
|||||
|
INVESTING ACTIVITIES
|
|||||||||||
|
Capital expenditures
|
(73.0
|
)
|
(103.8
|
)
|
(81.5
|
)
|
|||||
|
Acquisitions, net of cash acquired
|
(7.0
|
)
|
(71.2
|
)
|
(7.4
|
)
|
|||||
|
Other investments
|
—
|
|
—
|
|
(20.0
|
)
|
|||||
|
Proceeds (payments) from disposition of discontinued operations
|
3.5
|
|
(0.2
|
)
|
162.2
|
|
|||||
|
Proceeds from sale of assets
|
67.2
|
|
3.1
|
|
43.3
|
|
|||||
|
Other investing activities, net
|
(2.5
|
)
|
(0.6
|
)
|
(1.6
|
)
|
|||||
|
Net cash provided by (used in) investing activities
|
(11.8
|
)
|
(172.7
|
)
|
95.0
|
|
|||||
|
FINANCING ACTIVITIES
|
|||||||||||
|
Repayments of debt
|
(1,286.3
|
)
|
(1,397.8
|
)
|
(1,801.8
|
)
|
|||||
|
Proceeds from issuance of debt
|
1,097.7
|
|
1,462.8
|
|
1,684.2
|
|
|||||
|
Proceeds from (purchase of) noncontrolling interest, net
|
2.9
|
|
(1.2
|
)
|
(78.6
|
)
|
|||||
|
Share repurchases
|
(82.7
|
)
|
(50.8
|
)
|
(171.2
|
)
|
|||||
|
Dividends paid
|
(30.0
|
)
|
(25.8
|
)
|
(21.8
|
)
|
|||||
|
Other financing activities, net
|
(1.7
|
)
|
(1.6
|
)
|
(7.5
|
)
|
|||||
|
Net cash provided by (used in) financing activities
|
(300.1
|
)
|
(14.4
|
)
|
(396.7
|
)
|
|||||
|
Effect of Exchange Rate Changes on Cash and Cash Equivalents
|
(19.7
|
)
|
(37.5
|
)
|
(38.9
|
)
|
|||||
|
Net Increase (Decrease) in Cash and Cash Equivalents
|
35.4
|
|
(11.7
|
)
|
70.1
|
|
|||||
|
Cash and Cash Equivalents at Beginning of Period
|
466.5
|
|
478.2
|
|
408.1
|
|
|||||
|
Cash and Cash Equivalents at End of Period
|
$
|
501.9
|
|
$
|
466.5
|
|
$
|
478.2
|
|
||
The accompanying notes are an integral part of these consolidated financial statements.
F-7
TEREX CORPORATION AND SUBSIDIARIES
NOTES TO CONSOLIDATED FINANCIAL STATEMENTS
December 31, 2016
(dollar amounts in millions, unless otherwise noted, except per share amounts)
NOTE A – SALE OF MHPS BUSINESS
On May 16, 2016, Terex Corporation (“Terex”, the “Company”) agreed to sell its Material Handling and Port Solutions business (“MHPS”) business to Konecranes Plc, a Finnish public company limited by shares (“Konecranes”) by entering into a Stock and Asset Purchase Agreement, as amended (the “SAPA”), with Konecranes. As a result, the Company and Konecranes terminated the Business Combination Agreement and Plan of Merger (the “BCA”) announced on August 11, 2015, with no penalties incurred by either party. On January 4, 2017, the Company completed the disposition of its MHPS business to Konecranes (the “Disposition”), pursuant to the SAPA. In connection with the Disposition, the Company received
19.6 million
newly issued Class B shares of Konecranes and approximately
$832 million
in cash after adjustments for estimated cash, debt and net working capital at closing and the divestiture of Konecranes’ Stahl Crane Systems business (“Stahl”), which was undertaken by Konecranes in connection with the Disposition. The final transaction consideration is subject to post-closing adjustments for the actual cash, debt and net working capital at closing, the 2016 performance of the MHPS business and Konecranes business, and the closing of the sale of Stahl.
The Company and Konecranes entered into a Stockholders Agreement (the “Stockholders Agreement”), dated as of January 4, 2017, providing certain restrictions, including Terex’s commitment that it will not directly or indirectly sell or otherwise transfer the shares of Konecranes stock received by the Company for a period of three months, subject to certain exceptions, including transfers to affiliates. In addition, under the Stockholders Agreement, Terex is subject to certain standstill obligations for a four-year period, as well as some limited obligations following the initial four-year period. Terex also has customary registration rights pursuant to a registration rights agreement between Terex and Konecranes entered into on January 4, 2017 (the “Registration Rights Agreement”).
In connection with the Disposition, Konecranes’ articles of association were amended to create a new class of B shares. On February 15, 2017, Terex sold approximately
7.5 million
Konecranes shares for net proceeds of approximately
$268 million
. Following the sale of shares, Terex owns approximately
15.5%
of the outstanding shares of Konecranes. Pursuant to the Stockholders Agreement and amended articles of association, Terex has nominated
two
members to the Board of Directors of Konecranes. Terex's initial Board representatives are David Sachs and Oren Shaffer.
Also in connection with the Disposition, the Company and Konecranes entered into certain ancillary agreements, including a Transition Services Agreement, dated as of January 4, 2017, under which the parties will provide one another certain transition services to facilitate both the separation of the MHPS business being disposed from the businesses being retained by the Company and the interim operations of the MHPS business being acquired by Konecranes.
SAPA and BCA Related Expenses
Terex incurred transaction costs directly related to the SAPA of
$14.2 million
for the year ended
December 31, 2016
, which amounts are recorded in Income (loss) from discontinued operations - net of tax in the Consolidated Statement of Income (Loss).
The Company incurred transaction costs directly related to the BCA of
$14.0 million
and
$13.8 million
for the year ended
December 31, 2016
and
2015
, respectively, which is recorded in Other income (expense) - net in the Consolidated Statement of Income (Loss).
F-8
NOTE B – BASIS OF PRESENTATION
Principles of Consolidation
. The Consolidated Financial Statements include the accounts of Terex Corporation and its majority-owned subsidiaries. The Company consolidates all majority-owned and controlled subsidiaries, applies the equity method of accounting for investments in which the Company is able to exercise significant influence, and applies the cost method for all other investments. All material intercompany balances, transactions and profits have been eliminated.
Reclassification.
In conjunction with the adoption of new accounting standards, certain prior year debt issuance costs as well as certain other amounts have been reclassified to conform to the current year’s presentation, for all periods presented.
Effective January 1, 2016, the Company reorganized the reportable segments to align with its new management reporting structure and business activities which resulted in the scrap material handling business in its former Construction segment being reassigned to its Materials Processing (“MP”) segment, certain non-operations related assets in the U.K. being reassigned from its former Construction segment to Corporate and Other category, and parts of its North America services business, which was formerly part of its Cranes segment being reassigned into its Aerial Work Platforms (“AWP”) and its former MHPS segments. Historical results have been reclassified to give effect to these changes.
Effective as of June 30, 2016, further adjustments were made to the Company’s reportable segments as a result of definitive agreements to sell portions of its business and reorganize the management structure of other portions of its business, as discussed below. On May 16, 2016, the Company entered into an agreement to sell its MHPS business to Konecranes. As a result, the former MHPS segment is reported in discontinued operations in the Consolidated Statement of Income (Loss) for all periods presented, and in assets and liabilities held for sale in the Consolidated Balance Sheet at December 31, 2016 and 2015, and is no longer a reportable segment. During June and July of 2016, the Company entered into agreements to sell certain portions of its former Construction segment. As a result, concrete mixer trucks and concrete paver product lines from the former Construction segment have been reassigned to the Company’s MP segment and remaining product lines within the former Construction segment, such as loader backhoes and site dumpers, have been reassigned to the Corporate and Other category, as a result of changes in management responsibilities and reporting associated with these product lines. The effect of these changes has been shown in all periods presented.
On May 30, 2014, the Company sold its truck business, which was consolidated in its former Construction segment, to Volvo Construction Equipment for approximately
$160 million
. As a result, reporting of the truck business has been included in discontinued operations for all periods presented.
See Note A - “Sale of MHPS Business”, Note C - “Business Segment Information”, Note E - “Discontinued Operations and Assets and Liabilities Held for Sale” and Note L - “Goodwill and Intangible Assets, Net” for further information.
Use of Estimates.
The preparation of financial statements in conformity with generally accepted accounting principles requires management to make estimates and assumptions that affect reported amounts of assets and liabilities and disclosure of contingent assets and liabilities at the date of the financial statements and the reported amounts of revenues and expenses during the reporting period. Actual amounts could differ from those estimates.
Cash and Cash Equivalents.
Cash equivalents consist of highly liquid investments with original maturities of three months or less. The carrying amount of cash and cash equivalents approximates its fair value. Cash and cash equivalents at
December 31, 2016
and
2015
include
$6.0 million
and
$18.0 million
, respectively, which were not immediately available for use. These consist primarily of cash balances held in escrow to secure various obligations of the Company.
F-9
Inventories.
Inventories are stated at the lower of cost or market (“LCM”) value. Cost is determined by the average cost and first-in, first-out (“FIFO”) methods (approximately
30%
and
70%
, respectively). In valuing inventory, the Company is required to make assumptions regarding the level of reserves required to value potentially obsolete or over-valued items at the lower of cost or market. These assumptions require the Company to analyze aging of and forecasted demand for its inventory, forecast future product sales prices, pricing trends and margins, and to make judgments and estimates regarding obsolete or excess inventory. Future product sales prices, pricing trends and margins are based on the best available information at that time including actual orders received, negotiations with the Company’s customers for future orders, including their plans for expenditures, and market trends for similar products. The Company’s judgments and estimates for excess or obsolete inventory are based on analysis of actual and forecasted usage. The valuation of used equipment taken in trade from customers requires the Company to use the best information available to determine the value of the equipment to potential customers. This value is subject to change based on numerous conditions. Inventory reserves are established taking into account age, frequency of use, or sale, and in the case of repair parts, the installed base of machines. While calculations are made involving these factors, significant management judgment regarding expectations for future events is involved. Future events that could significantly influence the Company’s judgment and related estimates include general economic conditions in markets where the Company’s products are sold, new equipment price fluctuations, actions of the Company’s competitors, including introduction of new products and technological advances, as well as new products and design changes the Company introduces. The Company makes adjustments to its inventory reserves based on the identification of specific situations and increases its inventory reserves accordingly. As further changes in future economic or industry conditions occur, the Company may revise estimates that were used to calculate its inventory reserves. At
December 31, 2016
and
2015
, reserves for LCM, excess and obsolete inventory totaled
$83.3 million
and
$76.8 million
, respectively.
If actual conditions are less favorable than those the Company has projected, the Company will increase its reserves for LCM, excess and obsolete inventory accordingly. Any increase in the Company’s reserves will adversely impact its results of operations. Establishment of a reserve for LCM, excess and obsolete inventory establishes a new cost basis in the inventory. Such reserves are not reduced until the product is sold.
Shipping and handling costs for product shipments to customers are recorded in Cost of goods sold (“COGS”).
Intangible Assets.
Intangible assets include purchased patents, trademarks, customer relationships and other specifically identifiable assets and are amortized on a straight-line basis over the respective estimated useful lives, which range from
one
to
fifty-seven
years. Intangible assets are reviewed for impairment when circumstances warrant.
Goodwill.
Goodwill, representing the difference between total purchase price and fair value of assets (tangible and intangible) and liabilities at date of acquisition, is reviewed for impairment annually, and more frequently as circumstances warrant, and written down only in the period in which recorded value of such assets and liabilities exceed fair value. The Company selected October 1 as the date for the required annual impairment test.
Goodwill is tested for impairment at the reporting unit level, which is defined as an operating segment or a component of an operating segment that constitutes a business for which discrete financial information with similar economic characteristics is available and the operating results are regularly reviewed by the Company’s chief operating decision maker. AWP, Cranes, and MP operating segments, plus the Material Handling (“MH”) business and Port Solutions (“PS”) business of our former MHPS segment, which is a discontinued operation, comprise the five reporting units for goodwill impairment testing purposes.
We may elect to perform a qualitative analysis for our reporting units to determine whether it is more likely than not that fair value of the reporting unit is greater than its carrying value. If the qualitative analysis indicates that it is more likely than not that the fair value of a reporting unit is less than its carrying amount, or if we elect not to perform a qualitative analysis, we perform a quantitative analysis to determine whether a goodwill impairment exists.
F-10
The quantitative goodwill impairment analysis is a two-step process. The first step used to identify potential impairment involves comparing each reporting unit’s estimated fair value to its carrying value, including goodwill. The Company uses an income approach, along with other relevant market information, derived from a discounted cash flow model to estimate fair value of its reporting units. Aggregate fair value of the Company’s reporting units is compared to the Company’s market capitalization on the valuation date to assess its reasonableness. Initial recognition of goodwill, as well as the annual review of carrying value of goodwill, requires that the Company develop estimates of future business performance. These estimates are used to derive expected cash flows and include assumptions regarding future sales levels and level of working capital needed to support a given business. The Company relies on data developed by business segment management as well as macroeconomic data in making these calculations. The discounted cash flow model also includes a determination of the Company’s weighted average cost of capital by reporting unit. Cost of capital is based on assumptions about interest rates as well as a risk-adjusted rate of return required by the Company’s equity investors. Changes in these estimates can impact present value of expected cash flows that is used in determining fair value of a given business.
The second step of the process involves calculation of an implied fair value of goodwill for each reporting unit for which step one indicated impairment. Implied fair value of goodwill is determined by measuring excess of estimated fair value of the reporting unit over estimated fair values of individual assets, liabilities and identifiable intangibles as if the reporting unit was being acquired in a business combination. If implied fair value of goodwill exceeds carrying value of goodwill assigned to the reporting unit, there is no impairment. If carrying value of goodwill assigned to a reporting unit exceeds implied fair value of goodwill, an impairment loss is recorded for the excess. An impairment loss cannot exceed carrying value of goodwill assigned to a reporting unit and the subsequent reversal of goodwill impairment losses is not permitted.
As a result of the goodwill impairment tests performed as of October 1,
2016
,
2015
and
2014
, we recorded an impairment charge of
$176.0 million
in our Cranes segment during the year ended December 31, 2016 and an impairment charge of
$11.3 million
in our former MHPS segment, which is a discontinued operation, during the year ended December 31, 2015. There were
no
goodwill impairment charges recorded during 2014. See Note E – “Discontinued Operations and Assets and Liabilities Held for Sale” and Note L – “Goodwill and Intangible Assets, Net”.
Property, Plant and Equipment
.
Property, plant and equipment are stated at cost. Expenditures for major renewals and improvements are capitalized while expenditures for maintenance and repairs not expected to extend the life of an asset beyond its normal useful life are charged to expense when incurred. Plant and equipment are depreciated over the estimated useful lives (
1
-
40
years and
2
-
20
years, respectively) of the assets under the straight-line method of depreciation for financial reporting purposes and both straight-line and other methods for tax purposes.
Impairment of Long-Lived Assets.
The Company’s policy is to assess the realizability of its long-lived assets, including definite-lived intangible assets, and to evaluate such assets for impairment whenever events or changes in circumstances indicate that the carrying amount of such assets (or group of assets) may not be recoverable. Impairment is determined to exist if estimated future undiscounted cash flows is less than carrying value. If an impairment is indicated, the assets are written down to their fair value, which is typically determined by a discounted cash flow analysis. Future cash flow projections include assumptions for future sales levels and the level of working capital needed to support the assets. The Company uses data developed by business segment management as well as macroeconomic data in making these calculations. The amount of any impairment then recognized would be calculated as the difference between estimated fair value and carrying value of the asset. Included in Selling, general & administrative expenses (“SG&A”) are approximately
$41.2 million
of asset impairments for the year ended
December 31, 2016
and
$1.4 million
for the year ended
December 31, 2015
. The impairment charges recognized during 2016 include a
$16.6 million
charge in Corporate and Other to write off information technology assets related to cessation of implementation efforts in several locations and
$17.4 million
in the Company’s Cranes segment for restructuring and facility exit activities. The Company also recorded a
$20.5 million
impairment charge in Other income (expense) - net to recognize impairment of a cost-basis investment. See Note N – “Restructuring and Other Charges” for information on asset impairments recorded as part of restructuring activities.
Accounts Receivable and Allowance for Doubtful Accounts.
Trade accounts receivable are recorded at the invoiced amount and do not bear interest. The allowance for doubtful accounts is the Company’s best estimate of the amount of probable credit losses in its existing accounts receivable. The Company determines the allowance based on historical customer review and current financial conditions. The Company reviews its allowance for doubtful accounts at least quarterly. Past due balances over
90
days and over a specified amount are reviewed individually for collectability. All other balances are reviewed on a pooled basis by type of receivable. Account balances are charged off against the allowance when the Company determines it is probable the receivable will not be recovered. There can be no assurance that the Company’s historical accounts receivable collection experience will be indicative of future results. The Company has off-balance sheet credit exposure related to guarantees provided to financial institutions as disclosed in Note S – “Litigation and Contingencies.” Substantially all receivables were trade receivables at
December 31, 2016
and
2015
.
F-11
Pursuant to terms of the Company’s trade accounts receivable factoring arrangements, certain of the Company’s subsidiaries may sell their trade accounts receivable. In certain cases, the Company continues to service such accounts. These trade receivables qualify for sales treatment under Accounting Standards Codification (“ASC”) 860, “Transfers and Servicing” (“ASC 860”) and accordingly, the proceeds are included in net cash provided by operating activities. The gross amount of trade receivables sold for years ended December 31, 2016 and 2015 totaled
$620.4 million
and
$54.1 million
, respectively. There were no trade receivables sold for the year ended December 31, 2014. The factoring discount paid upon sale is recorded as interest expense in the Consolidated Statement of Income (Loss). As of December 31, 2016,
$64.3 million
of receivables qualifying for sale treatment were outstanding and will continue to be serviced by us.
Revenue Recognition.
Revenue and related costs are generally recorded when products are shipped and invoiced to either independently owned and operated dealers or to end-customers.
Revenue generated in the United States is recognized when title and risk of loss pass from the Company to its customers which generally occurs upon shipment depending upon the shipping terms negotiated. The Company also has a policy which requires it to meet certain criteria in order to recognize revenue, including satisfaction of the following requirements:
a)
Persuasive evidence that an arrangement exists;
b)
The price to the buyer is fixed or determinable;
c)
Collectability is reasonably assured; and
d)
The Company has no significant obligations for future performance.
In the United States, the Company has the ability to enter into a security agreement and receive a security interest in the product by filing an appropriate Uniform Commercial Code (“UCC”) financing statement. However, a significant portion of the Company’s revenue is generated outside of the United States. In many countries outside of the United States, as a matter of statutory law, a seller retains title to a product until payment is made. The laws do not provide for a seller’s retention of a security interest in goods in the same manner as established in the UCC. In these countries, the Company retains title to goods delivered to a customer until the customer makes payment so that the Company can recover the goods in the event of customer default on payment. In these circumstances, where the Company only retains title to secure its recovery in the event of customer default, the Company also has a policy requiring it to meet certain criteria in order to recognize revenue, including satisfaction of the following requirements:
a)
Persuasive evidence that an arrangement exists;
b)
Delivery has occurred or services have been rendered;
c)
The price to the buyer is fixed or determinable;
d)
Collectability is reasonably assured;
e)
The Company has no significant obligations for future performance; and
f)
The Company is not entitled to direct the disposition of the goods, cannot rescind the transaction, cannot prohibit the customer from moving, selling, or otherwise using the goods in the ordinary course of business and has no other rights of holding title that rest with a titleholder of property that is subject to a lien under the UCC.
In circumstances where the sales transaction requires acceptance by the customer for items such as testing on site, installation, trial period or performance criteria, revenue is not recognized unless the following criteria have been met:
a)
Persuasive evidence that an arrangement exists;
b)
Delivery has occurred or services have been rendered;
c)
The price to the buyer is fixed or determinable;
d)
Collectability is reasonably assured; and
e)
The customer has given their acceptance, the time period has elapsed or the Company has otherwise objectively demonstrated that the criteria specified in the acceptance provisions have been satisfied.
In addition to performance commitments, the Company analyzes factors such as the reason for the purchase to determine if revenue should be recognized. This analysis is done before the product is shipped and includes the evaluation of factors that may affect the conclusion related to the revenue recognition criteria as follows:
a)
Persuasive evidence that an arrangement exists;
b)
Delivery has occurred or services have been rendered;
c)
The price to the buyer is fixed or determinable; and
d)
Collectability is reasonably assured.
F-12
Revenue from sales-type leases is recognized at the inception of the lease. Income from operating leases is recognized ratably over the term of the lease. The Company routinely sells equipment subject to operating leases and related lease payments. If the Company does not retain a substantial risk of ownership in the equipment, the transaction is recorded as a sale. If the Company does retain a substantial risk of ownership, the transaction is recorded as a borrowing, the operating lease payments are recognized as revenue over the term of the lease and the debt is amortized over a similar period.
The Company, from time to time, issues buyback guarantees in conjunction with certain sales agreements. These primarily relate to trade value agreements (“TVAs”) in which a customer may trade in equipment in the future at a stated price/credit if the customer meets certain conditions. The trade-in price/credit is determined at the time of the original sale of equipment. In conjunction with the trade-in, these conditions include a requirement to purchase new equipment at fair market value at the time of trade-in, which fair value is required to be of equal or greater value than the original equipment cost. Other conditions also include the general functionality and state of repair of the machine. The Company has concluded that any credit provided to customers under a TVA/buyback guarantee, which is expected to be equal to or less than the fair value of the equipment returned on the trade-in date, is a guarantee to be accounted for in accordance with ASC 460, “Guarantees” (“ASC 460”).
The original sale of equipment, accompanied by a buyback guarantee, is a multiple element transaction wherein the Company offers its customer the right, after some period of time, for a limited period of time, to exchange purchased equipment for a fixed price trade-in credit toward another of our products. The fixed price trade-in credit is accounted for under the guidance provided by ASC 460. Pursuant to this right, the Company has agreed to make a payment (in the form of a trade-in credit) to the customer contingent upon the customer exercising its right to trade in the original purchased equipment. Under the guidance of ASC 460, the Company records the fixed price trade-in credit at its fair value. Accordingly, as noted above, the Company has accounted for the trade-in credit as a separate deliverable in a multiple element arrangement.
When a sales transaction includes multiple deliverables, such as sales of multiple products or sales of products and services that are delivered over multiple reporting periods, the multiple deliverables are evaluated to determine the units of accounting, and the entire fee from the arrangement is allocated to each unit of accounting based on the relative selling price. The selling price of a unit of accounting is determined using a selling price hierarchy. Vendor-specific objective evidence (“VSOE”) is established based upon the price charged for products and services that are sold separately in standalone transactions. If VSOE cannot be established, third-party evidence (“TPE”) is evaluated based on competitor prices for similar deliverables when sold separately. If neither VSOE or TPE is available, management's best estimate of selling price is established based upon the price at which the Company would sell the product on a standalone basis taking into consideration factors including, but not limited to, internal costs, gross margin objectives, pricing practices and market conditions. Revenue is recognized when revenue recognition criteria for each unit of accounting are met.
Guarantees
.
The Company records a liability for the estimated fair value of guarantees issued pursuant to ASC 460. The Company recognizes a loss under a guarantee when its obligation to make payment under the guarantee is probable and the amount of the loss can be estimated. A loss would be recognized if the Company’s payment obligation under the guarantee exceeds the value it can expect to recover to offset such payment, primarily through the sale of the equipment underlying the guarantee.
Accrued Warranties
.
The Company records accruals for potential warranty claims based on its claim experience. The Company’s products are typically sold with a standard warranty covering defects that arise during a fixed period. Each business provides a warranty specific to the products it offers. The specific warranty offered by a business is a function of customer expectations and competitive forces. Warranty length is generally a fixed period of time, a fixed number of operating hours, or both.
A liability for estimated warranty claims is accrued at the time of sale. The non-current portion of the warranty accrual is included in Other non-current liabilities in the Company’s Consolidated Balance Sheet. The liability is established using historical warranty claims experience for each product sold. Historical claims experience may be adjusted for known design improvements or for the impact of unusual product quality issues. Warranty reserves are reviewed quarterly to ensure critical assumptions are updated for known events that may affect the potential warranty liability.
F-13
The following table summarizes the changes in the consolidated product warranty liability (in millions):
|
Balance as of December 31, 2014
|
$
|
57.2
|
|
|
Accruals for warranties issued during the period
|
63.2
|
|
|
|
Changes in estimates
|
(1.3
|
)
|
|
|
Settlements during the year
|
(64.0
|
)
|
|
|
Foreign exchange effect/other
|
(2.1
|
)
|
|
|
Balance as of December 31, 2015
|
53.0
|
|
|
|
Accruals for warranties issued during the period
|
72.4
|
|
|
|
Changes in estimates
|
(2.3
|
)
|
|
|
Settlements during the year
|
(58.1
|
)
|
|
|
Foreign exchange effect/other
|
(5.2
|
)
|
|
|
Balance as of December 31, 2016
|
$
|
59.8
|
|
Accrued Product Liability.
The Company records accruals for product liability claims when deemed probable and estimable based on facts and circumstances, and prior claims experience. Accruals for product liability claims are valued based upon the Company’s prior claims experience, including consideration of the jurisdiction, circumstances of the accident, type of loss or injury, identity of plaintiff, other potential responsible parties, analysis of outside legal counsel, analysis of internal product liability counsel and the experience of the Company’s director of product safety. Actual product liability costs could be different due to a number of variables such as the decisions of juries or judges.
Defined Benefit Pension and Other Post-retirement Benefits.
The Company provides post-retirement benefits to certain former salaried and hourly employees and certain hourly employees covered by bargaining unit contracts that provide such benefits. The Company accounts for these benefits under ASC 715, “Compensation-Retirement Benefits” (“ASC 715”). ASC 715 requires balance sheet recognition of the overfunded or underfunded status of pension and post-retirement benefit plans. Under ASC 715, actuarial gains and losses, prior service costs or credits, and any remaining transition assets or obligations that have not been recognized under previous accounting standards must be recognized in Accumulated other comprehensive income, net of tax effects, until they are amortized as a component of net periodic benefit cost. See Note Q – “Retirement Plans and Other Benefits.”
Deferred Compensation.
The Company maintains a Deferred Compensation Plan, which is described more fully in Note Q – “Retirement Plans and Other Benefits.” The Company’s common stock, par value
$0.01
per share (“Common Stock”) held in a rabbi trust pursuant to the Company’s Deferred Compensation Plan, is treated in a manner similar to treasury stock and is recorded at cost within Stockholders’ equity as of
December 31, 2016
and
2015
. The plan obligations for participant deferrals in the Company’s Common Stock are classified as Additional paid-in capital within Stockholders’ equity. The total of the Company’s Common Stock required to settle this deferred compensation obligation is included in the denominator in both basic and diluted earnings per share calculations.
Stock-Based Compensation
.
At
December 31, 2016
, the Company had stock-based employee compensation plans, which are described more fully in Note R – “Stockholders’ Equity.” The Company accounts for those plans under the recognition and measurement principles of ASC 718, “Compensation–Stock Compensation” (“ASC 718”). ASC 718 requires that expense resulting from all share-based payment transactions be recognized in the financial statements at fair value.
Foreign Currency Translation.
Assets and liabilities of the Company’s non-U.S. operations are translated at year-end exchange rates. Income and expenses are translated at average exchange rates during the year. For operations whose functional currency is the local currency, translation adjustments are recorded in the Accumulated other comprehensive income component of Stockholders’ equity. Gains or losses resulting from foreign currency transactions are recorded in the accounts based on the underlying transaction.
Derivatives.
Derivative financial instruments are recorded in the Consolidated Balance Sheet at their fair value as either assets or liabilities. Changes in the fair value of derivatives are recorded each period in earnings or Accumulated other comprehensive income, depending on whether a derivative is designated and effective as part of a hedge transaction and, if it is, the type of hedge transaction. Gains and losses on derivative instruments reported in Accumulated other comprehensive income are included in earnings in the periods in which earnings are affected by the hedged item. See Note M – “Derivative Financial Instruments.”
F-14
Environmental Policies.
Environmental expenditures that relate to current operations are either expensed or capitalized depending on the nature of the expenditure. Expenditures relating to conditions caused by past operations that do not contribute to current or future revenue generation are expensed. Liabilities are recorded when environmental assessments and/or remedial actions are probable and the costs can be reasonably estimated. Such amounts were not material at
December 31, 2016
and
2015
.
Research, Development and Engineering Costs.
Research, development and engineering costs are expensed as incurred. Such costs incurred in the development of new products or significant improvements to existing products are included in SG&A. Research and development costs were
$86.2 million
,
$89.7 million
and
$102.3 million
during
2016
,
2015
and
2014
, respectively.
Income Taxes
.
The Company accounts for income taxes using the asset and liability method. This method requires the recognition of deferred tax assets and liabilities for the expected future tax consequences of temporary differences between financial statement carrying amounts and the tax bases of assets and liabilities. See Note D – “Income Taxes.”
Earnings Per Share.
Basic earnings (loss) per share is computed by dividing Net income (loss) attributable to Terex Corporation for the period by the weighted average number of shares of Common Stock outstanding. Diluted earnings (loss) per share is computed by dividing Net income (loss) attributable to Terex Corporation for the period by the weighted average number of shares of Common Stock outstanding and potential dilutive common shares. See Note F – “Earnings Per Share.”
Fair Value Measurements.
Assets and liabilities measured at fair value on a recurring basis under the provisions of ASC 820, “Fair Value Measurement and Disclosure” (“ASC 820”), include interest rate swap and foreign currency forward contracts discussed in Note M – “Derivative Financial Instruments.” These contracts are valued using a market approach, which uses prices and other relevant information generated by market transactions involving identical or comparable assets or liabilities. ASC 820 establishes a fair value hierarchy for those instruments measured at fair value that distinguishes between assumptions based on market data (observable inputs) and the Company’s assumptions (unobservable inputs). The hierarchy consists of three levels:
Level 1 – Unadjusted quoted prices in active markets that are accessible at the measurement date for identical, unrestricted assets or liabilities;
Level 2 – Quoted prices in markets that are not active, or inputs which are observable, either directly or indirectly, for substantially the full term of the asset or liability; and
Level 3 – Prices or valuation techniques that require inputs that are both significant to the fair value measurement and unobservable (i.e., supported by little or no market activity).
Determining which category an asset or liability falls within this hierarchy requires judgment. The Company evaluates its hierarchy disclosures each quarter.
Recent Accounting Pronouncements.
In May 2014, the Financial Accounting Standards Board (“FASB”) issued ASU 2014-09, “Revenue from Contracts with Customers (Topic 606),” (“ASU 2014-09”). ASU 2014-09 outlines a new, single comprehensive model for entities to use in accounting for revenue arising from contracts with customers and supersedes most current revenue recognition guidance, including industry-specific guidance. This new revenue recognition model provides a five-step analysis in determining when and how revenue is recognized. The new model requires revenue recognition to depict the transfer of promised goods or services to customers in an amount that reflects the consideration a company expects to receive. ASU 2014-09 also requires additional disclosure about the nature, amount, timing and uncertainty of revenue and cash flows arising from customer contracts, including significant judgments and changes in judgments and assets recognized from costs incurred to obtain or fulfill a contract. In August 2015, the FASB issued ASU 2015-14, “Deferral of the Effective Date”, which amends ASU 2014-09. As a result, the effective date will be the first quarter of fiscal year 2018 with early adoption permitted in the first quarter of fiscal year 2017.
Subsequently, the FASB has issued the following standards related to ASU 2014-09: ASU 2016-08, “Revenue from Contracts with Customers (Topic 606), Principal versus Agent Considerations (Reporting Revenue Gross versus Net),” (“ASU 2016-08”); ASU 2016-10, “Revenue from Contracts with Customers (Topic 606), Identifying Performance Obligations and Licensing,” (“ASU 2016-10”); ASU 2016-12, “Revenue from Contracts with Customers (Topic 606) Narrow-Scope Improvements and Practical Expedients,” (“ASU 2016-12”); and ASU 2016-20, “Technical Corrections and Improvements to Topic 606, Revenue from Contracts with Customers,” (“ASU 2016-20”), which are intended to provide additional guidance and clarity to ASU 2014-09. The Company must adopt ASU 2016-08, ASU 2016-10, ASU 2016-12 and ASU 2016-20 along with ASU 2014-09 (collectively, the “New Revenue Standards”).
F-15
The New Revenue Standards may be applied using one of two retrospective application methods: (1) a full retrospective approach for all periods presented, or (2) a modified retrospective approach that presents a cumulative effect as of the adoption date and additional required disclosures. The Company expects to adopt the New Revenue Standards in the first quarter of 2018 using the modified retrospective approach and is in the process of completing its initial analysis identifying the revenue streams that will be impacted by the adoption of this new standard and the impact to its consolidated financial statements and footnote disclosures.
In August 2014, the FASB issued ASU 2014-15, “Disclosure of Uncertainties about an Entity’s Ability to Continue as a Going
Concern,” (“ASU 2014-15”). ASU 2014-15 requires management to perform interim and annual assessments of an entity’s ability to continue as a going concern for a one year period subsequent to the date of issuance of its financial statements. An entity must provide certain disclosures if conditions or events raise substantial doubt about the entity’s ability to continue as a going concern. The Company adopted ASU 2014-15 during the fourth quarter of 2016. Adoption did not require additional disclosures in the Company’s consolidated financial statements.
In July 2015, the FASB issued ASU 2015-11, “Simplifying the Measurement of Inventory”. The ASU simplifies the subsequent measurement of inventory by using only the lower of cost or net realizable value. The ASU defines net realizable value as estimated selling prices in the ordinary course of business, less reasonably predictable costs of completion, disposal, and transportation. The effective date will be the first quarter of fiscal year 2017 with early adoption permitted. The ASU should be applied prospectively. The Company will adopt ASU 2015-11 in the first quarter of fiscal year 2017 and adoption is not expected to have a material effect on the Company’s consolidated financial statements.
In November 2015, the FASB issued ASU 2015-17, "Income Taxes (Topic 740): Balance Sheet Classification of Deferred Taxes". The amendments in ASU 2015-17 eliminate the current requirement for organizations to present deferred tax liabilities and assets as current and noncurrent in a classified balance sheet and instead require all deferred tax assets and liabilities to be classified as noncurrent. The Company adopted ASU 2015-17 as of January 1, 2016 on a prospective basis, which resulted in the reclassification of the Company’s current deferred tax assets and current deferred tax liabilities to non-current deferred tax assets or non-current deferred tax liabilities on its Consolidated Balance Sheet. No prior periods were retrospectively adjusted. Included in Prepaid and other current assets at December 31, 2015 is
$49.6 million
of deferred tax assets and included in Other current liabilities at December 31, 2015 is
$8.5 million
of deferred tax liabilities.
In January 2016, the FASB issued ASU 2016-01, "Financial Instruments-Overall (Subtopic 825-10): Recognition and Measurement of Financial Assets and Financial Liabilities." The amendments in ASU 2016-01, among other things, require equity investments (except those accounted for under the equity method of accounting, or those that result in consolidation of the investee) to be measured at fair value with changes
in fair value recognized in net income; require public business entities to use the exit price notion when measuring fair value of financial
instruments for disclosure purposes; require separate presentation of financial assets and financial liabilities by measurement category and form of
financial asset (i.e., securities or loans and receivables); and eliminate the requirement for public business entities to disclose the method(s) and significant assumptions used to estimate fair value that is required to be disclosed for financial instruments measured at amortized cost. The effective date will be the first quarter of fiscal year 2018. The Company is evaluating the impact that adoption of this new standard will have on its consolidated financial statements.
In February 2016, the FASB issued ASU 2016-02, “Leases (Topic 842),” (“ASU 2016-02”). ASU 2016-02 requires lessees to recognize assets and liabilities on the balance sheet for leases with lease terms greater than twelve months and disclose key information about leasing arrangements. The effective date will be the first quarter of fiscal year 2019, with early adoption permitted. The Company is evaluating the impact that adoption of this new standard will have on its consolidated financial statements.
In March 2016, the FASB issued ASU 2016-05, “Derivatives and Hedging (Topic 815),” (“ASU 2016-05”). ASU 2016-05 provides guidance clarifying that novation of a derivative contract (i.e., a change in counterparty) in a hedge accounting relationship does not, in and of itself, require dedesignation of that hedge accounting relationship. The effective date will be the first quarter of fiscal year 2017, with early adoption permitted. Adoption is not expected to have a material effect on the Company’s consolidated financial statements.
In March 2016, the FASB issued ASU 2016-06, “Derivatives and Hedging (Topic 815),” (“ASU 2016-06”). ASU 2016-06 simplifies the embedded derivative analysis for debt instruments containing contingent call or put options by clarifying that an exercise contingency does not need to be evaluated to determine whether it relates to interest rates and credit risk in an embedded derivative analysis. The effective date will be the first quarter of fiscal year 2017, with early adoption permitted. Adoption is not expected to have a material effect on the Company’s consolidated financial statements.
F-16
In March 2016, the FASB issued ASU 2016-07, “Investments-Equity Method and Joint Ventures (Topic 323),” (“ASU 2016-07”). ASU 2016-07 eliminates the retroactive adjustments to an investment qualifying for the equity method of accounting as a result of an increase in the level of ownership interest or degree of influence by the investor. The effective date will be the first quarter of fiscal year 2017. Adoption is not expected to have a material effect on the Company’s consolidated financial statements.
In March 2016, the FASB issued ASU 2016-09, “Compensation-Stock Compensation (Topic 718), Improvements to Employee Share-Based Payment Accounting,” (“ASU 2016-09”). ASU 2016-09 is intended to simplify several aspects related to how share-based payments are accounted for and presented in the financial statements, such as requiring all income tax effects of awards to be recognized in the income statement when the awards vest or are settled and allowing a policy election to account for forfeitures as they occur. In addition, all related cash flows resulting from share-based payments will be reported as operating activities on the statement of cash flows. ASU 2016-09 could result in increased volatility of the Company’s provision for income taxes and earnings per share, depending on the Company’s share price at exercise or vesting of share-based awards compared to grant date. The effective date will be the first quarter of fiscal year 2017, with early adoption permitted. The Company believes that adoption of this new standard will not be material to its consolidated financial statements; however, the impact on future effective tax rates could be significant.
In June 2016, the FASB issued ASU 2016-13, “Financial Instruments - Credit Losses,” (“ASU 2016-13”). ASU 2016-13 sets forth a “current expected credit loss” model which requires the Company to measure all expected credit losses for financial instruments held at the reporting date based on historical experience, current conditions and reasonable supportable forecasts. The guidance in this new standard replaces the existing incurred loss model and is applicable to the measurement of credit losses on financial assets measured at amortized cost and applies to some off-balance sheet credit exposures. The effective date will be the first quarter of fiscal year 2020. The Company is evaluating the impact that adoption of this new standard will have on its consolidated financial statements.
In August 2016, the FASB issued ASU 2016-15, “Statement of Cash Flows (Topic 230), Classification of Certain Cash Receipts and Cash Payments,” (“ASU 2016-15”). ASU 2016-15 reduces the existing diversity in practice in financial reporting by clarifying existing principles in ASC 230, “Statement of Cash Flows,” and provides specific guidance on certain cash flow classification issues. The effective date for ASU 2016-15 will be the first quarter of fiscal year 2018, with early adoption permitted. ASU 2016-15 will be applied retrospectively and may modify the Company's current disclosures and reclassifications within the Consolidated Statement of Cash Flows, but is not expected to have a material effect on the Company’s consolidated financial statements.
In October 2016, the FASB issued ASU 2016-16, “Income Taxes (Topic 740) - Intra-Entity Transfer of Assets Other than Inventory,” (“ASU 2016-16”). ASU 2016-16 requires recognition of current and deferred income taxes resulting from an intra-entity transfer of any asset (excluding inventory) when the transfer occurs. This is a change from existing GAAP which prohibits recognition of current and deferred income taxes until the asset is sold to a third party. The effective date for ASU 2016-16 will be the first quarter of fiscal year 2018 with early adoption permitted. Adoption will be applied on a modified retrospective basis, which could result in a cumulative-effect adjustment directly to retained earnings. The Company is evaluating the impact that adoption of this new standard will have on its consolidated financial statements.
In November 2016, the FASB issued ASU 2016-18, “Statement of Cash Flows (Topic 230) - Restricted Cash,” (“ASU 2016-18”). ASU 2016-18 requires a statement of cash flows to explain the change during the period in the total of cash, cash equivalents, and amounts generally described as restricted cash or restricted cash equivalents. Amounts generally described as restricted cash and restricted cash equivalents should be included with cash and cash equivalents when reconciling the beginning-of-period and end-of-period total amounts shown on the statement of cash flows. The effective date will be the first quarter of fiscal year 2018. Adoption will not have any effect on the Company’s consolidated financial statements.
In January 2017, the FASB issued ASU 2017-01, “Business Combinations (Topic 805): Clarifying the Definition of a Business,” (“ASU 2017-01”). ASU 2017-01 provides guidance in ascertaining whether a collection of assets and activities is considered a business. The effective date will be the first quarter of fiscal year 2018, with prospective application. Adoption is not expected to have a material effect on the Company’s consolidated financial statements.
F-17
In January 2017, the FASB issued ASU 2017-04, “Intangibles - Goodwill and Other (Topic 350): Simplifying the Test for Goodwill Impairment,” (“ASU 2017-04”). ASU 2017-04 eliminates Step 2 from the goodwill impairment test. Instead, an entity should perform its annual, or interim, goodwill impairment test by comparing the fair value of a reporting unit with its carrying amount. An entity should recognize an impairment charge for the amount by which the carrying amount exceeds the reporting unit’s fair value, if any. The loss recognized should not exceed the total amount of goodwill allocated to that reporting unit. Additionally, an entity should consider income tax effects from any tax deductible goodwill on the carrying amount of the reporting unit when measuring the goodwill impairment. The effective date will be the first quarter of fiscal year 2020, with early adoption permitted in 2017. The Company is evaluating the impact that adoption of this new standard will have on its consolidated financial statements.
NOTE C – BUSINESS SEGMENT INFORMATION
Terex is a global manufacturer of lifting and material processing products and services that deliver lifecycle solutions to maximize customer return on investment. The Company delivers lifecycle solutions to a broad range of industries, including the construction, infrastructure, manufacturing, shipping, transportation, refining, energy, utility, quarrying and mining industries. Historically, the Company operated in five reportable segments: (i) AWP; (ii) Cranes; (iii) MHPS; (iv) MP; and (v) Construction.
Subsequent to the reorganization discussed in Note B - “Basis of Presentation”, the Company now operates in
three
reportable segments: (i) AWP; (ii) Cranes; and (iii) MP.
The AWP segment designs, manufactures, services and markets aerial work platform equipment, telehandlers and light towers. Customers use these products to construct and maintain industrial, commercial and residential buildings and facilities and for other commercial operations, as well as in a wide range of infrastructure projects.
The Cranes segment designs, manufactures, services, refurbishes and markets a wide variety of cranes, including mobile telescopic cranes, lattice boom crawler cranes, tower cranes, and utility equipment, as well as their related components and replacement parts. Customers use these products primarily for construction, repair and maintenance of commercial buildings, manufacturing facilities, construction and maintenance of utility and telecommunication lines, tree trimming and certain construction and foundation drilling applications and a wide range of infrastructure projects.
The MP segment designs, manufactures and markets materials processing and specialty equipment, including crushers, washing systems, screens, apron feeders, material handlers, wood processing, biomass and recycling equipment, concrete mixer trucks and concrete pavers, and their related components and replacement parts. Customers use these products in construction, infrastructure and recycling projects, in various quarrying and mining applications, as well as in landscaping and biomass production industries, material handling applications, and in building roads and bridges.
The Company assists customers in their rental, leasing and acquisition of its products through Terex Financial Services (“TFS”). TFS uses its equipment financing experience to provide financing solutions to customers who purchase the Company’s equipment. TFS is included in the Corporate and Other category.
None
of our customers individually accounted for more than
10%
of consolidated net sales in
2016
. The results of businesses acquired are included from the dates of their respective acquisitions.
F-18
Included in Corporate and Other / Eliminations are the eliminations among the
three
segments, various construction product lines and on-book financing activities of TFS, as well as general and corporate items. Business segment information is presented below (in millions):
|
|
Year Ended December 31,
|
||||||||||
|
|
2016
|
2015
|
2014
|
||||||||
|
Net Sales
|
|||||||||||
|
AWP
|
$
|
1,977.8
|
|
$
|
2,246.0
|
|
$
|
2,403.0
|
|
||
|
Cranes
|
1,274.5
|
|
1,566.5
|
|
1,656.9
|
|
|||||
|
MP
|
944.5
|
|
940.1
|
|
938.9
|
|
|||||
|
Corporate and Other / Eliminations
|
246.3
|
|
269.1
|
|
485.2
|
|
|||||
|
Total
|
$
|
4,443.1
|
|
$
|
5,021.7
|
|
$
|
5,484.0
|
|
||
|
Income (loss) from Operations
|
|||||||||||
|
AWP
|
$
|
177.4
|
|
$
|
270.2
|
|
$
|
304.9
|
|
||
|
Cranes
|
(321.7
|
)
|
56.3
|
|
83.8
|
|
|||||
|
MP
|
86.3
|
|
68.6
|
|
65.6
|
|
|||||
|
Corporate and Other / Eliminations
|
(89.8
|
)
|
(71.4
|
)
|
(54.3
|
)
|
|||||
|
Total
|
$
|
(147.8
|
)
|
$
|
323.7
|
|
$
|
400.0
|
|
||
|
Depreciation and Amortization
|
|||||||||||
|
AWP
|
$
|
19.9
|
|
$
|
15.3
|
|
$
|
12.1
|
|
||
|
Cranes
|
21.5
|
|
21.0
|
|
28.3
|
|
|||||
|
MP
|
6.9
|
|
6.9
|
|
7.7
|
|
|||||
|
Corporate
|
26.0
|
|
33.4
|
|
51.0
|
|
|||||
|
Total
|
$
|
74.3
|
|
$
|
76.6
|
|
$
|
99.1
|
|
||
|
Capital Expenditures
|
|||||||||||
|
AWP
|
$
|
17.1
|
|
$
|
38.0
|
|
$
|
28.6
|
|
||
|
Cranes
|
13.2
|
|
13.8
|
|
14.0
|
|
|||||
|
MP
|
7.5
|
|
20.7
|
|
5.8
|
|
|||||
|
Corporate
|
20.3
|
|
9.0
|
|
9.9
|
|
|||||
|
Total
|
$
|
58.1
|
|
$
|
81.5
|
|
$
|
58.3
|
|
||
Sales between segments are generally priced to recover costs plus a reasonable markup for profit, which is eliminated in consolidation.
|
December 31,
|
|||||||
|
|
2016
|
2015
|
|||||
|
Identifiable Assets
|
|
|
|||||
|
AWP
|
$
|
1,659.8
|
|
$
|
1,701.2
|
|
|
|
Cranes
|
1,618.0
|
|
1,822.3
|
|
|||
|
MP
|
1,104.9
|
|
1,073.4
|
|
|||
|
Corporate and Other / Eliminations
|
(1,280.1
|
)
|
(891.0
|
)
|
|||
|
Assets held for sale
|
1,904.2
|
|
1,910.1
|
|
|||
|
Total
|
$
|
5,006.8
|
|
$
|
5,616.0
|
|
|
F-19
Geographic Net Sales information is presented below (in millions):
|
|
Year Ended December 31,
|
||||||||||
|
|
2016
|
2015
|
2014
|
||||||||
|
Net Sales
|
|
|
|
|
|
|
|||||
|
United States
|
$
|
2,131.4
|
|
$
|
2,420.1
|
|
$
|
2,552.7
|
|
||
|
United Kingdom
|
333.2
|
|
402.3
|
|
346.2
|
|
|||||
|
Germany
|
237.1
|
|
243.7
|
|
310.6
|
|
|||||
|
Other European countries
|
726.7
|
|
714.3
|
|
848.3
|
|
|||||
|
All other
|
1,014.7
|
|
1,241.3
|
|
1,426.2
|
|
|||||
|
Total
|
$
|
4,443.1
|
|
$
|
5,021.7
|
|
$
|
5,484.0
|
|
||
|
|
December 31,
|
||||||
|
|
2016
|
2015
|
|||||
|
Long-lived Assets
|
|
|
|
|
|||
|
United States
|
$
|
181.1
|
|
$
|
203.8
|
|
|
|
United Kingdom
|
34.9
|
|
41.2
|
|
|||
|
Germany
|
32.4
|
|
64.0
|
|
|||
|
Other European countries
|
14.8
|
|
17.5
|
|
|||
|
All other
|
41.4
|
|
45.4
|
|
|||
|
Total
|
$
|
304.6
|
|
$
|
371.9
|
|
|
The Company attributes sales to unaffiliated customers in different geographical areas based on the location of the customer. Long-lived assets consist of net fixed assets, which can be attributed to the specific geographic regions.
NOTE D – INCOME TAXES
The components of income (loss) from continuing operations before income taxes are as follows (in millions):
|
|
Year Ended December 31,
|
|||||||||||
|
2016
|
2015
|
2014
|
||||||||||
|
United States
|
$
|
(29.9
|
)
|
$
|
212.2
|
|
$
|
304.3
|
|
|||
|
Foreign
|
(240.8
|
)
|
(16.5
|
)
|
(25.7
|
)
|
||||||
|
Income (loss) from continuing operations before income taxes
|
$
|
(270.7
|
)
|
$
|
195.7
|
|
$
|
278.6
|
|
|||
Income (loss) before income taxes including Income (loss) from discontinued operations and Gain (loss) from disposition of discontinued operations attributable to the Company was
$(242.0) million
,
$231.1 million
and
$365.0 million
for the years ended
December 31, 2016
,
2015
and
2014
, respectively.
F-20
The major components of the Company’s provision for (benefit from) income taxes on continuing operations before income taxes are summarized below (in millions):
|
|
Year Ended December 31,
|
|||||||||||
|
|
2016
|
2015
|
2014
|
|||||||||
|
Current:
|
|
|
|
|
|
|
||||||
|
Federal
|
$
|
31.5
|
|
$
|
49.2
|
|
$
|
1.6
|
|
|||
|
State
|
6.2
|
|
3.1
|
|
7.6
|
|
||||||
|
Foreign
|
38.2
|
|
15.6
|
|
30.6
|
|
||||||
|
Current income tax provision (benefit)
|
75.9
|
|
67.9
|
|
39.8
|
|
||||||
|
Deferred:
|
|
|
|
|
|
|
||||||
|
Federal
|
(27.0
|
)
|
(3.7
|
)
|
9.9
|
|
||||||
|
State
|
(1.4
|
)
|
—
|
|
(0.7
|
)
|
||||||
|
Foreign
|
(124.9
|
)
|
3.3
|
|
(22.4
|
)
|
||||||
|
Deferred income tax (benefit) provision
|
(153.3
|
)
|
(0.4
|
)
|
(13.2
|
)
|
||||||
|
Total provision for (benefit from) income taxes
|
$
|
(77.4
|
)
|
$
|
67.5
|
|
$
|
26.6
|
|
|||
The elimination of tax from intercompany transactions is included in current tax expense. Including discontinued operations and disposition of discontinued operations, the total (benefit from) provision for income taxes was
$(66.5) million
,
$82.1 million
and
$45.5 million
for the years ended
December 31, 2016
,
2015
and
2014
, respectively.
Deferred tax assets and liabilities result from differences in the bases of assets and liabilities for tax and financial reporting purposes. The tax effects of the basis differences and loss carry forwards as of
December 31, 2016
and
2015
for continuing operations are summarized below for major balance sheet captions (in millions):
|
2016
|
2015
|
|||||||
|
Property, plant and equipment
|
$
|
(16.8
|
)
|
$
|
(36.4
|
)
|
||
|
Intangibles
|
(7.3
|
)
|
(27.6
|
)
|
||||
|
Inventories
|
18.1
|
|
21.5
|
|
||||
|
Accrued warranties and product liability
|
15.1
|
|
13.6
|
|
||||
|
Loss carry forwards
|
214.3
|
|
215.8
|
|
||||
|
Retirement plans
|
32.5
|
|
32.2
|
|
||||
|
Accrued compensation and benefits
|
40.1
|
|
38.4
|
|
||||
|
Investments
|
2.3
|
|
1.0
|
|
||||
|
Currency translation adjustments
|
(0.6
|
)
|
(0.3
|
)
|
||||
|
Credit carry forwards
|
11.9
|
|
1.7
|
|
||||
|
Other
|
20.8
|
|
31.3
|
|
||||
|
Deferred tax assets valuation allowance
|
(148.6
|
)
|
(215.1
|
)
|
||||
|
Net deferred tax assets (liabilities)
|
$
|
181.8
|
|
$
|
76.1
|
|
||
Deferred tax assets for continuing operations total
$331.3 million
before valuation allowances of
$148.6 million
, partially offset by deferred tax liabilities for continuing operations of
$0.9 million
at
December 31, 2016
. There were
$19.7 million
total deferred tax assets, partially offset by total deferred tax liabilities of
$3.7 million
for discontinued operations at
December 31, 2016
, and
$2.9 million
total deferred tax assets, partially offset by total deferred tax liabilities of
$17.1 million
for discontinued operations at
December 31, 2015
.
The Company evaluates the net realizable value of its deferred tax assets each reporting period. The Company must consider all objective evidence, both positive and negative, in evaluating the future realization of its deferred tax assets, including tax loss carry forwards. Historical information is supplemented by currently available information about future tax years. Realization of deferred tax assets requires sufficient taxable income of the appropriate character. To the extent estimates of future taxable income decrease or do not materialize, additional valuation allowances may be required. The Company records a valuation allowance for each deferred tax asset for which realization is not assessed as more likely than not. The valuation allowance for deferred tax assets as of
December 31, 2016
and
2015
was
$148.6 million
and
$215.1 million
, respectively. The net change in the total valuation allowance for the years ended
December 31, 2016
and
2015
was a decrease of
$66.5 million
and a decrease of
$28.9 million
, respectively.
F-21
During the second quarter of 2016, the Company released the valuation allowances for its German and Italian subsidiaries due to its change in judgment regarding the realization of the deferred tax assets in Germany and Italy. The change in judgment was due to the Disposition, recent earnings history, and expected future income supporting the more likely than not assessment that the deferred tax assets will be realized. As of December 31, 2015, the Company determined that it was appropriate to retain its valuation allowance on deferred tax assets of its Italian subsidiaries, although it was reasonably possible that, in the near term, continuing improvement in operating performance and other positive evidence could change the Company’s assessment of the realizability of the Italian deferred tax assets resulting in the reversal of all, or part of, the related valuation allowance.
The Company’s Provision for (benefit from) income taxes is different from the amount that would be provided by applying the statutory federal income tax rate to the Company’s Income (loss) from continuing operations before income taxes. The reasons for the difference are summarized as follows (in millions):
|
|
Year Ended December 31,
|
|||||||||||
|
2016
|
2015
|
2014
|
||||||||||
|
Tax at statutory federal income tax rate
|
$
|
(94.7
|
)
|
$
|
68.5
|
|
$
|
97.5
|
|
|||
|
State taxes (net of Federal benefit)
|
3.1
|
|
2.0
|
|
4.5
|
|
||||||
|
Change in valuation allowance
|
(47.7
|
)
|
(22.3
|
)
|
39.5
|
|
||||||
|
Foreign tax differential on income/losses of foreign subsidiaries
|
(37.5
|
)
|
12.2
|
|
(27.0
|
)
|
||||||
|
U.S. tax on multi-national operations
|
41.9
|
|
3.7
|
|
5.6
|
|
||||||
|
Change in foreign statutory rates
|
1.9
|
|
7.7
|
|
2.5
|
|
||||||
|
U.S. manufacturing and export incentives
|
(2.0
|
)
|
(4.3
|
)
|
(6.2
|
)
|
||||||
|
Tax effect of dispositions
|
2.1
|
|
—
|
|
(86.8
|
)
|
||||||
|
Impairment loss on goodwill and intangible assets
|
52.4
|
|
—
|
|
—
|
|
||||||
|
Other
|
3.1
|
|
—
|
|
(3.0
|
)
|
||||||
|
Total provision for (benefit from) income taxes
|
$
|
(77.4
|
)
|
$
|
67.5
|
|
$
|
26.6
|
|
|||
For the year ended December 31, 2016, the effective tax rate was reduced due to tax expense associated with the Disposition, which changed expectations concerning the indefinite reinvestment of foreign earnings. The effective tax rate on gain (loss) on disposition of discontinued operations in 2014 differs from the statutory rate primarily due to the majority of gains from the sale of the truck business not being subject to tax.
The Company received tax incentives in certain jurisdictions, some of which are expected to extend through 2020. The Company received
no
tax benefits in continuing operations (
$0.8 million
of tax benefits in discontinued operations) for the year ended December 31, 2016, received
$7.0 million
and
$0.8 million
of tax benefits in continuing operations (
$1.2 million
and
$0.1 million
of tax benefits in discontinued operations) for the years ended December 31,
2015
and
2014
, respectively.
Except for a limited number of immaterial subsidiaries and joint ventures accounted for under the equity method, the Company does not provide for foreign income and withholding, U.S. Federal, or state income taxes or tax benefits on the financial reporting basis over the tax basis of its investments in foreign subsidiaries because such amounts are indefinitely reinvested to support operations and continued growth plans outside the U.S. As a result of the Disposition, the Company repatriated approximately
$1 billion
of foreign earnings that were previously intended to be permanently reinvested. At
December 31, 2016
, the Company’s remaining unremitted earnings of its foreign subsidiary ownership chains that have positive retained earnings was approximately
$251 million
. The Company reviews its plan to indefinitely reinvest on a quarterly basis. In making its decision to indefinitely reinvest, the Company evaluates its plans of reinvestment, its ability to control repatriation and to mobilize funds without triggering basis differences, and the profitability of U.S. operations and their cash requirements and the need, if any, to repatriate funds. If the assessment of the Company with respect to earnings of foreign subsidiaries changes, deferred U.S. income taxes, foreign income taxes, and foreign withholding taxes may have to be accrued. At this time, determination of the unrecognized deferred tax liabilities for temporary differences related to the investment in foreign subsidiaries is not practicable.
At
December 31, 2016
, the Company has various state net operating loss carry forwards available to reduce future state taxable income and income taxes. These net operating loss carry forwards expire at various dates through 2036. In addition, the gross amount of the U.S. federal capital loss carryforward is
$72.4 million
which expires in 2019.
F-22
At
December 31, 2016
, the Company has approximately
$529 million
of loss carry forwards, consisting of
$150 million
in Germany,
$130 million
in Italy,
$66 million
in the United Kingdom,
$47 million
in China,
$48 million
in Switzerland, and
$88 million
in other countries, which are available to offset future taxable income. The majority of these tax loss carry forwards are available without expiration. In addition, the gross amount of the Australian capital loss carryforward is
$27 million
, and it has an unlimited carryforward period.
The Company had total net income tax payments including discontinued operations of
$52.8 million
,
$67.6 million
and
$124.1 million
in
2016
,
2015
and
2014
, respectively. At
December 31, 2016
and
2015
, Other current assets included net income tax receivable amounts of
$22.6 million
and
$42.7 million
respectively.
The Company and its subsidiaries conduct business globally and file income tax returns in U.S. federal, state and foreign jurisdictions, as required. From a tax perspective, major jurisdictions where the Company is often subject to examination by tax authorities include Germany, Italy, the United Kingdom and the U.S. Currently, various entities of the Company are under audit in Germany, Italy, the U.S. and elsewhere. With few exceptions, including certain subsidiaries in Germany that are under audit, the statute of limitations for the Company and most of its subsidiaries has expired for tax years prior to 2011. The Company assesses uncertain tax positions for recognition, measurement and effective settlement. Where the Company has determined that its tax return filing position does not satisfy the more likely than not recognition threshold of ASC 740, “Income Taxes,” it has recorded no tax benefits. Where the Company has determined that its tax return filing positions are more likely than not to be sustained, the Company has measured and recorded the largest amount of tax benefit greater than 50% likely to be realized. The Company recognizes accrued interest and penalties, if any, related to income taxes as (Provision for) benefit from income taxes in its Consolidated Statement of Income (Loss).
The following table summarizes the activity related to the Company’s total (including discontinued operations) unrecognized tax benefits (in millions). Amounts in 2014 have been adjusted to eliminate the impact of offsets, which are immaterial:
|
Balance as of January 1, 2014
|
$
|
88.4
|
|
|
Additions for current year tax positions
|
1.9
|
|
|
|
Additions for prior year tax positions
|
1.2
|
|
|
|
Reductions for prior year tax positions
|
(10.9
|
)
|
|
|
Reductions for current year tax positions
|
—
|
|
|
|
Reductions for expiration of statute of limitations
|
(2.4
|
)
|
|
|
Settlements
|
(0.1
|
)
|
|
|
Acquired balances
|
—
|
|
|
|
Balance as of December 31, 2014
|
78.1
|
|
|
|
Additions for current year tax positions
|
—
|
|
|
|
Additions for prior year tax positions
|
1.7
|
|
|
|
Reductions for prior year tax positions
|
(9.3
|
)
|
|
|
Reductions for current year tax positions
|
—
|
|
|
|
Reductions for expiration of statute of limitations
|
(1.1
|
)
|
|
|
Settlements
|
—
|
|
|
|
Acquired balances
|
—
|
|
|
|
Balance as of December 31, 2015
|
69.4
|
|
|
|
Additions for current year tax positions
|
—
|
|
|
|
Additions for prior year tax positions
|
6.3
|
|
|
|
Reductions for prior year tax positions
|
(3.1
|
)
|
|
|
Reductions for current year tax positions
|
—
|
|
|
|
Reductions for expiration of statute of limitations
|
(5.0
|
)
|
|
|
Settlements
|
(7.8
|
)
|
|
|
Acquired balances
|
—
|
|
|
|
Balance as of December 31, 2016
|
$
|
59.8
|
|
As a result of the Disposition, the Company expects that the ending balance of unrecognized tax benefits for the year ended December 31, 2016 will be reduced by approximately
$29 million
.
F-23
The Company evaluates each reporting period whether it is reasonably possible that material changes to its uncertain tax position liability could occur in the next 12 months. Changes may occur as a result of uncertain tax positions being considered effectively settled, re-measured, paid, acquired or divested, as a result of a change in accounting rules, tax law or judicial decision, or due to expiration of the relevant statute of limitations. It is not possible to predict which uncertain tax positions, if any, may be challenged by tax authorities. The timing and impact of income tax audits and their resolution is highly uncertain. New facts, laws, pronouncements and judicial decisions can change assessments concerning technical merit and measurement. The amounts of or periods in which changes to reserves for uncertain tax positions will occur is rarely ascertainable. Of the balances remaining after the Disposition, the Company believes it is reasonably possible the total amount of unrecognized tax benefits disclosed as of
December 31, 2016
may decrease approximately
$21 million
(approximately
$2 million
related to discontinued operations) in the fiscal year ending
December 31, 2017
. Such possible decrease relates primarily to audit settlements, transfer pricing, deductibility issues and expiration of statutes of limitation.
As of
December 31, 2016
and
2015
, the Company had
$59.8 million
and
$69.4 million
, respectively, of unrecognized tax benefits. Of the
$59.8 million
at
December 31, 2016
,
$26.5 million
, if recognized, would affect the effective tax rate. As of
December 31, 2016
and
2015
, the liability for potential interest and penalties was
$12.9 million
and
$13.9 million
, respectively. During the years ended
December 31, 2016
and
2015
, the Company recognized tax (benefit) expense of
$(1.0) million
and
$1.0 million
for interest and penalties, respectively.
NOTE E – DISCONTINUED OPERATIONS AND ASSETS AND LIABILITIES HELD FOR SALE
MHPS
On January 4, 2017, the Company completed the disposition of its MHPS business to Konecranes. See Note A - “Sale of MHPS Business” for further information on the Disposition. The Disposition represents a significant strategic shift in the Company’s business away from universal, process, mobile harbor and ship-to-shore cranes that will have a major effect on the Company’s future operating results, primarily because the MHPS business represented the entirety of one of the Company’s five previous reportable operating segments and comprised two of the Company’s six previous reporting units, representing a significant portion of the Company’s revenues and assets, and is therefore accounted for as a discontinued operation for all periods presented. MHPS products include universal cranes, process cranes and components, such as rope hoists, chain hoists, light crane systems, travel units and electric motors, primarily for industrial applications, and mobile harbor cranes, ship-to-shore gantry cranes, rubber tired and rail mounted gantry cranes, straddle carriers, sprinter carriers, reach stackers, container handlers, general cargo lift trucks, automated stacking cranes, automated guided vehicles and software solutions for logistics terminals.
As a result of the SAPA, the Company determined that the previously unrecognized deferred tax assets and liabilities related to the MHPS subsidiaries are more likely than not to be realized in the foreseeable future. The effective tax rate on income from discontinued operations in 2016 differs from the statutory rate, in part, due to the recognition of these deferred taxes.
Trucks
On May 30, 2014, the Company sold its truck business, which was previously consolidated in the Construction segment, to Volvo Construction Equipment for approximately
$160 million
. The truck business manufactured and sold off-highway rigid and articulated haul trucks. Included in the transaction was a manufacturing facility in Motherwell, Scotland.
Due to this divestiture, reporting of the truck business has been included in discontinued operations for all applicable periods presented.
Cash flows from the Company’s discontinued operations are included in the Consolidated Statements of Cash Flows.
F-24
Income (loss) from discontinued operations
The following amounts related to discontinued operations were derived from historical financial information and have been segregated from continuing operations and reported as discontinued operations in the Consolidated Statement of Income (Loss) (in millions):
|
|
Year ended December 31,
|
||||||||||||||||
|
|
2016
|
2015
|
2014
|
||||||||||||||
|
MHPS
|
MHPS
|
MHPS
|
Trucks
|
Total
|
|||||||||||||
|
Net sales
|
$
|
1,398.2
|
|
$
|
1,521.4
|
|
$
|
1,829.7
|
|
$
|
89.9
|
|
$
|
1,919.6
|
|
||
|
Cost of sales
|
(1,090.3
|
)
|
(1,184.1
|
)
|
(1,427.8
|
)
|
(82.4
|
)
|
(1,510.2
|
)
|
|||||||
|
Selling, general and administrative expenses
|
(266.8
|
)
|
(271.1
|
)
|
(378.9
|
)
|
(5.4
|
)
|
(384.3
|
)
|
|||||||
|
Goodwill and intangible asset impairments
|
(3.1
|
)
|
(34.7
|
)
|
—
|
|
—
|
|
—
|
|
|||||||
|
Net interest (expense)
|
(2.3
|
)
|
(1.4
|
)
|
(3.1
|
)
|
—
|
|
(3.1
|
)
|
|||||||
|
Other income (expense)
|
(11.5
|
)
|
0.8
|
|
(1.3
|
)
|
(0.4
|
)
|
(1.7
|
)
|
|||||||
|
Income (loss) from discontinued operations before income taxes
|
24.2
|
|
30.9
|
|
18.6
|
|
1.7
|
|
20.3
|
|
|||||||
|
(Provision for) benefit from income taxes
|
(9.9
|
)
|
(13.5
|
)
|
(11.1
|
)
|
(0.3
|
)
|
(11.4
|
)
|
|||||||
|
Income (loss) from discontinued operations – net of tax
|
14.3
|
|
17.4
|
|
7.5
|
|
1.4
|
|
8.9
|
|
|||||||
|
Net loss (income) attributable to noncontrolling interest
|
(0.9
|
)
|
(3.3
|
)
|
(2.0
|
)
|
—
|
|
(2.0
|
)
|
|||||||
|
Income (loss) from discontinued operations – net of tax attributable to Terex Corporation
|
$
|
13.4
|
|
$
|
14.1
|
|
$
|
5.5
|
|
$
|
1.4
|
|
$
|
6.9
|
|
||
As a result of goodwill impairment tests performed as of October 1, 2016, 2015 and 2014 for the MHPS business, the Company recorded a non-cash impairment charge of approximately
$11 million
during the year ended December 31, 2015. There were no goodwill impairment charges recorded during 2016 and 2014, respectively.
As a result of impairment tests performed in 2016, 2015 and 2014 for indefinite-lived tradenames in the MHPS business, the Company recorded non-cash impairment charges of approximately
$3 million
and
$23 million
during the years ended December 31, 2016 and 2015, respectively. The Company developed estimates of fair value using a discounted cash flow model. Assumptions critical to the process included forecasted financial information, discount rates and royalty rates. The estimates of fair value of indefinite-lived tradenames were based on the best information currently available. Fair value determination is categorized as Level 3 in the fair value hierarchy. See Note B - “Basis of Presentation”, for the definition of Level 3 input. There was no indefinite-lived tradenames impairment during 2014.
F-25
Cranes
As part of the transformation and improvement of its Cranes segment, the Company is actively seeking a buyer for a portion of its cranes business located in South America and, accordingly, the assets and liabilities are reported as held for sale at December 31, 2016. The Company recorded a non-cash impairment charge of
$1.6 million
to adjust net asset value to estimated fair value.
Construction
In December 2016, the Company entered an agreement to sell its Coventry, UK-based compact construction product line. The sale is subject to customary closing conditions and is expected to be completed in the first half of 2017. In addition, the Company is actively seeking a buyer for certain other construction product lines and expects to reach an agreement in 2017. The Company recorded a non-cash impairment charge of
$3.5 million
to adjust the net asset value of these other construction product lines to estimated fair value. The operating results for these construction product lines are reported in continuing operations, within the Corporate and Other category in our segment disclosures, and the assets and liabilities are reported as held for sale at December 31, 2016.
Assets and liabilities held for sale
Assets and liabilities held for sale consist of the Company’s former MHPS segment, portions of its Cranes segment and portions of its former Construction Segment. Such assets and liabilities are classified as held for sale upon meeting the requirements of ASC 360 - “Property, Plant and Equipment”, and are recorded at lower of carrying amount or fair value less costs to sell. Assets are no longer depreciated once classified as held for sale.
F-26
The following table provides the amounts of assets and liabilities held for sale in the Consolidated Balance Sheet (in millions):
|
December 31, 2016
|
December 31, 2015
|
|||||||||||||||
|
MHPS
|
Cranes
|
Construction
|
Total
|
MHPS
|
||||||||||||
|
Assets
|
|
|
||||||||||||||
|
Cash and cash equivalents
|
$
|
71.0
|
|
$
|
1.2
|
|
$
|
1.2
|
|
$
|
73.4
|
|
$
|
95.3
|
|
|
|
Trade receivables – net
|
243.5
|
|
3.1
|
|
24.4
|
|
271.0
|
|
236.0
|
|
||||||
|
Inventories
|
309.4
|
|
1.7
|
|
23.9
|
|
335.0
|
|
382.1
|
|
||||||
|
Prepaid and other current assets
|
49.9
|
|
0.5
|
|
3.1
|
|
53.5
|
|
36.2
|
|
||||||
|
Current assets held for sale
|
$
|
673.8
|
|
$
|
6.5
|
|
$
|
52.6
|
|
$
|
732.9
|
|
$
|
749.6
|
|
|
|
Property, plant and equipment – net
|
$
|
294.2
|
|
$
|
0.8
|
|
$
|
3.2
|
|
$
|
298.2
|
|
$
|
303.9
|
|
|
|
Goodwill
|
573.7
|
|
—
|
|
—
|
|
573.7
|
|
564.1
|
|
||||||
|
Intangible assets – net
|
212.6
|
|
2.9
|
|
—
|
|
215.5
|
|
226.9
|
|
||||||
|
Impairment reserve
|
—
|
|
(1.7
|
)
|
(3.5
|
)
|
(5.2
|
)
|
—
|
|
||||||
|
Other assets
|
86.4
|
|
1.1
|
|
1.6
|
|
89.1
|
|
65.6
|
|
||||||
|
Non-current assets held for sale
|
$
|
1,166.9
|
|
$
|
3.1
|
|
$
|
1.3
|
|
$
|
1,171.3
|
|
$
|
1,160.5
|
|
|
|
Liabilities
|
|
|
|
|
||||||||||||
|
Notes payable and current portion of long-term debt
|
$
|
13.1
|
|
$
|
—
|
|
$
|
1.3
|
|
$
|
14.4
|
|
$
|
13.8
|
|
|
|
Trade accounts payable
|
132.6
|
|
0.7
|
|
23.8
|
|
157.1
|
|
177.0
|
|
||||||
|
Accruals and other current liabilities
|
267.0
|
|
6.2
|
|
9.1
|
|
282.3
|
|
255.2
|
|
||||||
|
Current liabilities held for sale
|
$
|
412.7
|
|
$
|
6.9
|
|
$
|
34.2
|
|
$
|
453.8
|
|
$
|
446.0
|
|
|
|
Long-term debt, less current portion
|
$
|
2.4
|
|
$
|
—
|
|
$
|
—
|
|
$
|
2.4
|
|
$
|
0.1
|
|
|
|
Retirement plans
|
235.3
|
|
0.7
|
|
0.9
|
|
236.9
|
|
218.7
|
|
||||||
|
Other non-current liabilities
|
71.7
|
|
0.4
|
|
0.7
|
|
72.8
|
|
79.7
|
|
||||||
|
Non-current liabilities held for sale
|
$
|
309.4
|
|
$
|
1.1
|
|
$
|
1.6
|
|
$
|
312.1
|
|
$
|
298.5
|
|
|
The following table provides amounts of cash and cash equivalents presented in the Consolidated Statement of Cash Flows (in millions):
|
|
December 31, 2016
|
December 31, 2015
|
December 31, 2014
|
||||||||
|
Cash and cash equivalents:
|
|
|
|||||||||
|
Cash and cash equivalents - continuing operations
|
$
|
428.5
|
|
$
|
371.2
|
|
$
|
392.6
|
|
||
|
Cash and cash equivalents - held for sale
|
73.4
|
|
95.3
|
|
85.6
|
|
|||||
|
Total cash and cash equivalents:
|
$
|
501.9
|
|
$
|
466.5
|
|
$
|
478.2
|
|
||
Cash and cash equivalents held for sale at
December 31, 2016
,
2015
and
2014
include
$14.0 million
,
$9.8 million
and
$2.2 million
, respectively, which were not immediately available for use. These consist primarily of cash balances held in escrow to secure various obligations of the Company.
F-27
The following table provides supplemental cash flow information related to discontinued operations (in millions):
|
|
Year Ended December 31,
|
||||||||||
|
|
2016
|
2015
|
2014
|
||||||||
|
Non-cash operating items:
|
|||||||||||
|
Depreciation and amortization
|
$
|
22.4
|
|
$
|
55.8
|
|
$
|
66.4
|
|
||
|
Deferred taxes
|
$
|
15.8
|
|
$
|
(2.2
|
)
|
$
|
(4.5
|
)
|
||
|
Goodwill Impairment
|
$
|
—
|
|
$
|
11.3
|
|
$
|
—
|
|
||
|
Asset Impairments
|
$
|
3.0
|
|
$
|
23.9
|
|
$
|
3.8
|
|
||
|
Investing activities:
|
|||||||||||
|
Capital expenditures
|
$
|
(14.9
|
)
|
$
|
(22.3
|
)
|
$
|
(21.9
|
)
|
||
Other
|
|
Year Ended December 31,
|
||||||||||
|
|
2016
|
2015
|
2014
|
||||||||
|
Gain (loss) on disposition of discontinued operations
|
$
|
4.5
|
|
$
|
4.5
|
|
$
|
66.1
|
|
||
|
(Provision for) benefit from income taxes
|
(1.0
|
)
|
(1.1
|
)
|
(7.5
|
)
|
|||||
|
Gain (loss) on disposition of discontinued operations – net of tax
|
$
|
3.5
|
|
$
|
3.4
|
|
$
|
58.6
|
|
||
During the years ended
December 31, 2016
,
2015
, and
2014
the Company recognized a gain on disposition of discontinued operations - net of tax of
$3.5 million
,
$3.4 million
and
$58.6 million
, respectively. These gains are from contractual earnout payments related to the sale of the Company’s Atlas heavy construction equipment and knuckle-boom cranes businesses, and from our truck and mining businesses, including settlement of certain disputes in the truck sales agreement.
F-28
NOTE F – EARNINGS PER SHARE
|
For the year ended December 31,
|
|||||||||||
|
(in millions, except per share data)
|
|||||||||||
|
|
2016
|
2015
|
2014
|
||||||||
|
Income (loss) from continuing operations attributable to Terex Corporation common stockholders
|
$
|
(193.0
|
)
|
$
|
128.4
|
|
$
|
253.5
|
|
||
|
Income (loss) from discontinued operations-net of tax
|
13.4
|
|
14.1
|
|
6.9
|
|
|||||
|
Gain (loss) on disposition of discontinued operations-net of tax
|
3.5
|
|
3.4
|
|
58.6
|
|
|||||
|
Net income (loss) attributable to Terex Corporation
|
$
|
(176.1
|
)
|
$
|
145.9
|
|
$
|
319.0
|
|
||
|
Basic shares:
|
|||||||||||
|
Weighted average shares outstanding
|
107.9
|
|
107.4
|
|
109.7
|
|
|||||
|
Earnings (loss) per share - basic:
|
|||||||||||
|
Income (loss) from continuing operations
|
$
|
(1.79
|
)
|
$
|
1.20
|
|
$
|
2.31
|
|
||
|
Income (loss) from discontinued operations-net of tax
|
0.13
|
|
0.13
|
|
0.06
|
|
|||||
|
Gain (loss) on disposition of discontinued operations-net of tax
|
0.03
|
|
0.03
|
|
0.54
|
|
|||||
|
Net income (loss) attributable to Terex Corporation
|
$
|
(1.63
|
)
|
$
|
1.36
|
|
$
|
2.91
|
|
||
|
Diluted shares:
|
|||||||||||
|
Weighted average shares outstanding - basic
|
107.9
|
|
107.4
|
|
109.7
|
|
|||||
|
Effect of dilutive securities:
|
|||||||||||
|
Stock options, restricted stock awards and convertible notes
|
—
|
|
2.2
|
|
4.5
|
|
|||||
|
Diluted weighted average shares outstanding
|
107.9
|
|
109.6
|
|
114.2
|
|
|||||
|
Earnings (loss) per share - diluted:
|
|||||||||||
|
Income (loss) from continuing operations
|
$
|
(1.79
|
)
|
$
|
1.17
|
|
$
|
2.22
|
|
||
|
Income (loss) from discontinued operations-net of tax
|
0.13
|
|
0.13
|
|
0.06
|
|
|||||
|
Gain (loss) on disposition of discontinued operations-net of tax
|
0.03
|
|
0.03
|
|
0.51
|
|
|||||
|
Net income (loss) attributable to Terex Corporation
|
$
|
(1.63
|
)
|
$
|
1.33
|
|
$
|
2.79
|
|
||
The following table provides information to reconcile amounts reported on the Consolidated Statement of Income (Loss) to amounts used to calculate earnings per share attributable to Terex Corporation common stockholders (in millions) for the year ended December 31:
|
Reconciliation of amounts attributable to common stockholders:
|
2016
|
2015
|
2014
|
||||||||
|
Income (loss) from continuing operations
|
$
|
(193.3
|
)
|
$
|
128.2
|
|
$
|
252.0
|
|
||
|
Net loss (income) from continuing operations attributable to noncontrolling interest
|
0.3
|
|
0.2
|
|
1.5
|
|
|||||
|
Income (loss) from continuing operations attributable to common stockholders
|
$
|
(193.0
|
)
|
$
|
128.4
|
|
$
|
253.5
|
|
||
Weighted average options to purchase
0.1 million
shares of the Company’s common stock, par value
$0.01
per share (“Common Stock”), were outstanding during
2016
,
2015
and
2014
, but were not included in the computation of diluted shares as the effect would be anti-dilutive. Weighted average restricted stock awards of
1.5 million
shares,
0.9 million
shares and
0.4 million
shares were outstanding during
2016
,
2015
and
2014
, respectively, but were not included in the computation of diluted shares because the effect would be anti-dilutive or performance targets were not yet achieved for awards contingent upon performance. ASC 260, “Earnings per Share,” requires that employee stock options and non-vested restricted shares granted by the Company be treated as potential common shares outstanding in computing diluted earnings per share. Under the treasury stock method, the amount the employee must pay for exercising stock options, the amount of compensation cost for future services that the Company has not yet recognized and the amount of tax benefits that would be recorded in additional paid-in capital when the award becomes deductible are assumed to be used to repurchase shares. The Company includes the impact of pro forma deferred tax assets in determining the amount of tax benefits for potential windfalls and shortfalls (the differences between tax deductions and book expense) in this calculation.
F-29
In connection with settlement of the
4%
Convertible Senior Subordinated Notes the Company issued
3.4 million
shares of common stock in June 2015. See Note O – “Long-Term Obligations.” Included in the computation of diluted shares for the year ended December 31, 2015 was
1.4 million
shares that were contingently issuable prior to conversion. The number of shares that were contingently issuable for the year ended December 31, 2014 was
3.4 million
.
NOTE G – FINANCE RECEIVABLES
TFS leases equipment and provides financing to customers for the purchase and use of Terex equipment. In the normal course of business, TFS assesses credit risk, establishes structure and pricing of financing transactions, documents the finance receivable, and records and funds the transactions. TFS bills and collects cash from the end customer.
TFS primarily conducts on-book business in the U.S., with limited business in China, the United Kingdom, and Germany. TFS does business with various types of customers consisting of rental houses, end user customers and Terex equipment dealers.
The Company’s net finance receivable balances include both sales-type leases and commercial loans. Finance receivables that management intends to hold until maturity are stated at their outstanding unpaid principal balances, net of an allowance for loan losses as well as any deferred fees and costs. Finance receivables originated and intended for sale in the secondary market are carried at the lower of cost or estimated fair value, in the aggregate. During the years ended December 31, 2016, 2015 and 2014 the Company transferred finance receivables of
$290.5 million
,
$81.9 million
and
$308.2 million
, respectively, to third party financial institutions, which qualified for sales treatment under ASC 860. At December 31, 2016, the Company had
$4.7 million
of held for sale finance receivables recorded in Prepaid and other current assets in the Consolidated Balance Sheet.
Revenue attributable to finance receivables management intends to hold until maturity is recognized on the accrual basis using the effective interest method. TFS bills customers and accrues interest income monthly on the unpaid principal balance. The accrual of interest is generally discontinued when the contractual payment of principal or interest has become 90 days past due or management has significant doubts about further collectibility of contractual payments, even though the loan may be currently performing. A receivable may remain on accrual status if it is in the process of collection and is either guaranteed or secured. Interest received on non-accrual finance receivables is typically applied against principal. Finance receivables are generally restored to accrual status when the obligation is brought current and the borrower has performed in accordance with the contractual terms for a reasonable period of time and the ultimate collectibility of the total contractual principal and interest is no longer in doubt. The Company has a history of enforcing the terms of these separate financing agreements.
Finance receivables, net consisted of the following (in millions):
|
December 31,
2016 |
December 31,
2015 |
||||||
|
Commercial loans
|
$
|
226.4
|
|
$
|
331.4
|
|
|
|
Sales-type leases
|
16.4
|
|
21.9
|
|
|||
|
Total finance receivables, gross
|
242.8
|
|
353.3
|
|
|||
|
Allowance for credit losses
|
(6.3
|
)
|
(7.3
|
)
|
|||
|
Total finance receivables, net
|
$
|
236.5
|
|
$
|
346.0
|
|
|
Approximately
$74 million
of finance receivables are recorded in Prepaid and other current assets and approximately
$162 million
are recorded in Other assets in the Consolidated Balance Sheet.
F-30
Credit losses are charged against the allowance for credit losses when management ceases active collection efforts. Subsequent recoveries, if any, are credited to earnings. The allowance for credit losses is maintained at a level set by management which represents evaluation of known and inherent risks in the portfolio at the consolidated balance sheet date. Management’s periodic evaluation of the adequacy of the allowance is based on the Company’s past loan loss experience, market-based loss experience, specific customer situations, estimated value of any underlying collateral, current economic conditions, and other relevant factors. This evaluation is inherently subjective, since it requires estimates that may be susceptible to significant change. Although specific and general loss allowances are established in accordance with management’s best estimate, actual losses are dependent upon future events and, as such, further additions to or decreases from the level of loss allowances may be necessary.
The following table presents an analysis of the allowance for credit losses:
|
Year Ended December 31, 2016
|
Year Ended December 31, 2015
|
Year Ended December 31, 2014
|
||||||||||||||||||||||||||||||||||
|
Commercial Loans
|
Sales-Type Leases
|
Total
|
Commercial Loans
|
Sales-Type Leases
|
Total
|
Commercial Loans
|
Sales-Type Leases
|
Total
|
||||||||||||||||||||||||||||
|
Balance, beginning of period
|
$
|
6.5
|
|
0.8
|
|
$
|
7.3
|
|
$
|
1.9
|
|
$
|
1.1
|
|
$
|
3.0
|
|
$
|
1.9
|
|
$
|
0.4
|
|
$
|
2.3
|
|
||||||||||
|
Provision for credit losses
|
0.2
|
|
(0.2
|
)
|
—
|
|
4.6
|
|
(0.3
|
)
|
4.3
|
|
—
|
|
0.7
|
|
0.7
|
|
||||||||||||||||||
|
Charge offs
|
(0.8
|
)
|
(0.2
|
)
|
(1.0
|
)
|
—
|
|
—
|
|
—
|
|
—
|
|
—
|
|
—
|
|
||||||||||||||||||
|
Recoveries
|
—
|
|
—
|
|
—
|
|
—
|
|
—
|
|
—
|
|
—
|
|
—
|
|
—
|
|
||||||||||||||||||
|
Balance, end of period
|
$
|
5.9
|
|
$
|
0.4
|
|
$
|
6.3
|
|
$
|
6.5
|
|
$
|
0.8
|
|
$
|
7.3
|
|
$
|
1.9
|
|
$
|
1.1
|
|
$
|
3.0
|
|
|||||||||
The Company utilizes a two tier approach to set allowances: (1) identification of impaired finance receivables and establishment of specific loss allowances on such receivables; and (2) establishment of general loss allowances on the remainder of its portfolio. Specific loss allowances are established based on circumstances and factors of specific receivables. The Company regularly reviews the portfolio which allows for early identification of potentially impaired receivables. The process takes into consideration, among other things, delinquency status, type of collateral and other factors specific to the borrower.
General loss allowance levels are determined based upon a combination of factors including, but not limited to, TFS experience, general market loss experience, performance of the portfolio, current economic conditions, and management's judgment. The two primary risk characteristics inherent in the portfolio are (1) the customer's ability to meet contractual payment terms, and (2) the liquidation values of the underlying primary and secondary collaterals. The Company records a general or unallocated loss allowance that is calculated by applying the reserve rate to its portfolio, including the unreserved balance of accounts that have been specifically reserved for. All delinquent accounts are reviewed for potential impairment. A receivable is deemed to be impaired when based on current information and events, it is probable that the Company will be unable to collect all amounts due according to the contractual terms of the loan agreement. The amount of impairment is measured as the difference between the balance outstanding and the underlying collateral value of the equipment being financed, as well as any other collateral. All finance receivables identified as impaired are evaluated individually. Generally, the Company does not change the terms and conditions of existing finance receivables.
The following table presents individually impaired finance receivables (in millions):
|
December 31, 2016
|
December 31, 2015
|
|||||||||||||||||||||||
|
Commercial Loans
|
Sales-Type Leases
|
Total
|
Commercial Loans
|
Sales-Type Leases
|
Total
|
|||||||||||||||||||
|
Recorded investment
|
$
|
1.6
|
|
$
|
—
|
|
$
|
1.6
|
|
$
|
1.9
|
|
$
|
1.8
|
|
$
|
3.7
|
|
||||||
|
Related allowance
|
1.6
|
|
—
|
|
1.6
|
|
1.9
|
|
0.5
|
|
2.4
|
|
||||||||||||
|
Average recorded investment
|
1.7
|
|
0.9
|
|
2.6
|
|
1.0
|
|
2.5
|
|
3.5
|
|
||||||||||||
The average recorded investment for impaired finance receivables was
$1.7 million
for sales-type leases at
December 31, 2014
, which were fully reserved. There were no impaired finance receivables for commercial loans at December 31, 2014.
F-31
The allowance for credit losses and finance receivables by portfolio, segregated by those amounts that are individually evaluated for impairment and those that are collectively evaluated for impairment, was as follows (in millions):
|
December 31, 2016
|
December 31, 2015
|
|||||||||||||||||||||||
|
Allowance for credit losses, ending balance:
|
Commercial Loans
|
Sales-Type Leases
|
Total
|
Commercial Loans
|
Sales-Type Leases
|
Total
|
||||||||||||||||||
|
Individually evaluated for impairment
|
$
|
1.6
|
|
$
|
—
|
|
$
|
1.6
|
|
$
|
1.9
|
|
$
|
0.5
|
|
$
|
2.4
|
|
||||||
|
Collectively evaluated for impairment
|
4.3
|
|
0.4
|
|
4.7
|
|
4.6
|
|
0.3
|
|
4.9
|
|
||||||||||||
|
Total allowance for credit losses
|
$
|
5.9
|
|
$
|
0.4
|
|
$
|
6.3
|
|
$
|
6.5
|
|
$
|
0.8
|
|
$
|
7.3
|
|
||||||
|
Finance receivables, ending balance:
|
||||||||||||||||||||||||
|
Individually evaluated for impairment
|
$
|
1.6
|
|
$
|
—
|
|
$
|
1.6
|
|
$
|
1.9
|
|
$
|
1.8
|
|
$
|
3.7
|
|
||||||
|
Collectively evaluated for impairment
|
224.8
|
|
16.4
|
|
241.2
|
|
329.5
|
|
20.1
|
|
349.6
|
|
||||||||||||
|
Total finance receivables
|
$
|
226.4
|
|
$
|
16.4
|
|
$
|
242.8
|
|
$
|
331.4
|
|
$
|
21.9
|
|
$
|
353.3
|
|
||||||
Accounts are considered delinquent when the billed periodic payments of the finance receivables exceed 30 days past the due date.
The following table presents analysis of aging of recorded investment in finance receivables (in millions):
|
December 31, 2016
|
|||||||||||||||||||||||
|
Current
|
31-60 days past due
|
61-90 days past due
|
Greater than 90 days past due
|
Total past due
|
Total Finance Receivables
|
||||||||||||||||||
|
Commercial loans
|
$
|
224.2
|
|
$
|
0.6
|
|
$
|
0.2
|
|
$
|
1.4
|
|
$
|
2.2
|
|
$
|
226.4
|
|
|||||
|
Sales-type leases
|
15.8
|
|
—
|
|
0.6
|
|
—
|
|
0.6
|
|
16.4
|
|
|||||||||||
|
Total finance receivables
|
$
|
240.0
|
|
$
|
0.6
|
|
$
|
0.8
|
|
$
|
1.4
|
|
$
|
2.8
|
|
$
|
242.8
|
|
|||||
|
December 31, 2015
|
|||||||||||||||||||||||
|
Current
|
31-60 days past due
|
61-90 days past due
|
Greater than 90 days past due
|
Total past due
|
Total Finance Receivables
|
||||||||||||||||||
|
Commercial loans
|
$
|
329.6
|
|
$
|
0.8
|
|
$
|
—
|
|
$
|
1.0
|
|
$
|
1.8
|
|
$
|
331.4
|
|
|||||
|
Sales-type leases
|
20.2
|
|
0.5
|
|
—
|
|
1.2
|
|
1.7
|
|
21.9
|
|
|||||||||||
|
Total finance receivables
|
$
|
349.8
|
|
$
|
1.3
|
|
$
|
—
|
|
$
|
2.2
|
|
$
|
3.5
|
|
$
|
353.3
|
|
|||||
At
December 31, 2016
and 2015,
$1.4 million
and
$1.0 million
respectively, of commercial loans were 90 days or more past due. Commercial loans in the amount of
$7.4 million
and
$4.8 million
were on non-accrual status as of
December 31, 2016
and 2015, respectively.
At
December 31, 2016
there were
no
sales-type lease receivables that were 90 days or more past due. At
December 31, 2015
, there were
$1.2 million
of sales-type lease receivables were 90 days or more past due. At
December 31, 2016
, there were
no
sales-type leases on non-accrual status. There were
$1.3 million
of sales-type leases on non-accrual status as of
December 31, 2015
.
F-32
Credit Quality Information
Credit quality is reviewed periodically based on customers’ payment status. In addition to delinquency status, any information received regarding a customer (such as bankruptcy filings, etc.) will also be considered to determine the credit quality of the customer. Collateral asset values are also monitored regularly to determine the potential loss exposures on any given transaction.
The Company uses the following internal credit quality indicators, based on an internal risk rating system, using certain external credit data, listed from the lowest level of risk to highest level of risk. The internal rating system considers factors affecting specific borrowers’ ability to repay.
Finance receivables by risk rating (in millions):
|
Rating
|
December 31, 2016
|
December 31, 2015
|
||||||
|
Superior
|
$
|
9.6
|
|
$
|
21.5
|
|
||
|
Above Average
|
64.7
|
|
159.4
|
|
||||
|
Average
|
111.3
|
|
117.9
|
|
||||
|
Below Average
|
53.0
|
|
44.2
|
|
||||
|
Sub Standard
|
4.2
|
|
10.3
|
|
||||
|
Total
|
$
|
242.8
|
|
$
|
353.3
|
|
||
NOTE H – INVENTORIES
Inventories consist of the following (in millions):
|
December 31,
|
|||||||
|
|
2016
|
2015
|
|||||
|
Finished equipment
|
$
|
334.7
|
|
$
|
429.1
|
|
|
|
Replacement parts
|
144.9
|
|
168.3
|
|
|||
|
Work-in-process
|
175.4
|
|
190.4
|
|
|||
|
Raw materials and supplies
|
198.8
|
|
275.8
|
|
|||
|
Inventories
|
$
|
853.8
|
|
$
|
1,063.6
|
|
|
Reserves for lower of cost or market value, excess and obsolete inventory were
$83.3 million
and
$76.8 million
at
December 31, 2016
and
2015
, respectively.
F-33
NOTE I – PROPERTY, PLANT AND EQUIPMENT
Property, plant and equipment – net consist of the following (in millions):
|
December 31,
|
|||||||
|
|
2016
|
2015
|
|||||
|
Property
|
$
|
36.4
|
|
$
|
37.2
|
|
|
|
Plant
|
144.3
|
|
161.9
|
|
|||
|
Equipment
|
456.1
|
|
545.2
|
|
|||
|
Property, Plant and Equipment – Gross
|
636.8
|
|
744.3
|
|
|||
|
Less: Accumulated depreciation
|
(332.2
|
)
|
(372.4
|
)
|
|||
|
Property, plant and equipment – net
|
$
|
304.6
|
|
$
|
371.9
|
|
|
Depreciation expense for the years ended
December 31, 2016
,
2015
and
2014
, was
$65.5 million
,
$63.9 million
and
$70.4 million
, respectively.
NOTE J – EQUIPMENT SUBJECT TO OPERATING LEASES
Operating leases arise from leasing the Company’s products to customers. Initial non-cancellable lease terms typically range up to
84
months. The net book value of equipment subject to operating leases was approximately
$67 million
and
$58 million
(net of accumulated depreciation of approximately
$16 million
and
$37 million
) at
December 31, 2016
and
2015
, respectively, and is included in Other assets on the Company’s Consolidated Balance Sheet. The equipment is depreciated on a straight-line basis over its estimated useful life.
Future minimum lease payments to be received under non-cancellable operating leases with lease terms in excess of one year are as follows (in millions):
|
Years ending December 31,
|
|
|
|
|
2017
|
$
|
9.3
|
|
|
2018
|
4.9
|
|
|
|
2019
|
3.5
|
|
|
|
2020
|
1.9
|
|
|
|
2021
|
1.1
|
|
|
|
Thereafter
|
0.7
|
|
|
|
|
$
|
21.4
|
|
The Company received approximately
$14 million
and
$12 million
of rental income from assets under operating leases during
2016
and
2015
, respectively, none of which represented contingent rental payments.
NOTE K – DISPOSITIONS
Construction
During the year ended December 31, 2016, the Company sold certain portions of its former Construction segment, including the following products: midi/mini excavators, wheeled excavators, compact wheel loaders, and components, primarily in Europe. The Company recognized a loss of
$8.1 million
(
$5.6 million
after-tax) related to sale of its components assets, of which
$4.0 million
was recorded in COGS and
$4.1 million
was recorded in SG&A in the Consolidated Statement of Income (Loss). The Company received total proceeds of approximately
$60 million
and recognized a gain of
$7.2 million
(
$3.3 million
after-tax) within SG&A related to sale of its midi/mini excavators, wheeled excavators, and compact wheel loader business shares and assets. The remaining unsold assets and liabilities of the Company’s former Construction segment at December 31, 2016 are reported in the Consolidated Balance Sheet as held for sale.
F-34
A.S.V. Inc.
On December 19, 2014, the Company completed the sale of
51%
of A.S.V., Inc. to Manitex International, Inc. (“Manitex”), resulting in a joint venture in compact track loaders and skid steers that is
51%
owned by Manitex and
49%
owned by Terex and accounted for the investment under the equity method of accounting. The Company recognized a gain of approximately
$17 million
on this sale in SG&A on the Consolidated Statement of Income (Loss).
Demag Cranes and Components Pty. Ltd.
On December 31, 2014, the Company sold
100%
of Demag Cranes and Components Pty. Ltd. (“Demag Cranes”) in Australia to MHE-Demag (S) Pte. Ltd. (“MHE”), a
50%
owned joint venture accounted for under the equity method of accounting. The Company recorded a loss on this disposition of approximately
$33 million
in SG&A on the Consolidated Statement of Income (Loss). The loss was comprised primarily of approximately
$23 million
of cumulative translation adjustment and approximately
$6 million
of allocated goodwill. Cash received from these dispositions is included in investing activities in the Consolidated Statement of Cash Flows.
NOTE L – GOODWILL AND INTANGIBLE ASSETS, NET
An analysis of changes in the Company’s goodwill by business segment is as follows (in millions):
|
|
AWP (1)
|
Cranes (1)
|
MP
|
Total
|
|||||||||||
|
Balance at December 31, 2014, gross
|
$
|
139.4
|
|
$
|
198.8
|
|
$
|
198.1
|
|
$
|
536.3
|
|
|||
|
Accumulated impairment
|
(38.6
|
)
|
(4.2
|
)
|
(23.2
|
)
|
(66.0
|
)
|
|||||||
|
Balance at December 31, 2014, net
|
100.8
|
|
194.6
|
|
174.9
|
|
470.3
|
|
|||||||
|
Acquisitions
|
—
|
|
—
|
|
14.4
|
|
14.4
|
|
|||||||
|
Foreign exchange effect and other
|
(1.7
|
)
|
(15.7
|
)
|
(8.2
|
)
|
(25.6
|
)
|
|||||||
|
Balance at December 31, 2015, gross
|
137.7
|
|
183.1
|
|
204.3
|
|
525.1
|
|
|||||||
|
Accumulated impairment
|
(38.6
|
)
|
(4.2
|
)
|
(23.2
|
)
|
(66.0
|
)
|
|||||||
|
Balance at December 31, 2015, net
|
99.1
|
|
178.9
|
|
181.1
|
|
459.1
|
|
|||||||
|
Acquisitions
|
1.6
|
|
—
|
|
—
|
|
1.6
|
|
|||||||
|
Foreign exchange effect and other
|
(1.6
|
)
|
(3.8
|
)
|
(20.5
|
)
|
(25.9
|
)
|
|||||||
|
Balance at December 31, 2016, gross
|
137.7
|
|
|
179.3
|
|
183.8
|
|
500.8
|
|
||||||
|
Accumulated impairment
|
(38.6
|
)
|
(179.3
|
)
|
(23.2
|
)
|
(241.1
|
)
|
|||||||
|
Balance at December 31, 2016, net
(2)
|
$
|
99.1
|
|
$
|
—
|
|
$
|
160.6
|
|
$
|
259.7
|
|
|||
(1) Includes a
$17.9 million
reclassification of goodwill from Cranes to discontinued operations, and a
$0.9 million
reclassification of goodwill from Cranes to AWP as a result of segment realignments. See Note C - “Business Segment Information”.
(2) During the second quarter of 2016 the Company wrote off
$132.8 million
of fully impaired goodwill associated with its former Construction segment.
As part of our annual impairment test performed in the fourth quarter of 2016, we elected to perform a quantitative analysis (“Step 1”) on the AWP, Cranes and MP reporting units, to determine whether it is more likely than not that fair value exceeds carrying value for these reporting units. Based on the results of our Step 1 analysis, we determined that it is more likely than not that fair value exceeds carrying value for the AWP and MP reporting units. However, we concluded in our Step 1 analysis that the estimated fair value of our Cranes reporting unit was lower than carrying value.
Step 2 of the analysis requires us to perform a theoretical purchase price allocation for our Cranes reporting unit to determine implied fair value of goodwill and to compare the implied fair value of goodwill to the recorded amount of goodwill. Upon completion of Step 2 of the test, we recorded a non-cash goodwill impairment charge of
$176.0 million
. This impairment charge is recorded in Goodwill impairment in the Consolidated Statement of Income (Loss).
The outcome of any prospective tests may result in recording additional goodwill impairment charges in future periods.
F-35
Intangible assets, net were comprised of the following as of
December 31, 2016
and
2015
(in millions):
|
December 31, 2016
|
December 31, 2015
|
||||||||||||||||||||||||
|
Weighted Average Life
(in years) |
Gross Carrying Amount
|
Accumulated Amortization
|
Net Carrying Amount
|
Gross Carrying Amount
|
Accumulated Amortization
|
Net Carrying Amount
|
|||||||||||||||||||
|
Definite-lived intangible assets:
|
|||||||||||||||||||||||||
|
Technology
|
7
|
$
|
17.0
|
|
$
|
(15.7
|
)
|
$
|
1.3
|
|
$
|
17.3
|
|
$
|
(15.7
|
)
|
$
|
1.6
|
|
||||||
|
Customer Relationships
|
20
|
33.1
|
|
(25.2
|
)
|
7.9
|
|
34.8
|
|
(24.9
|
)
|
9.9
|
|
||||||||||||
|
Land Use Rights
|
68
|
7.9
|
|
(0.9
|
)
|
7.0
|
|
8.2
|
|
(0.9
|
)
|
7.3
|
|
||||||||||||
|
Other
|
6
|
25.8
|
|
(23.6
|
)
|
2.2
|
|
28.0
|
|
(24.2
|
)
|
3.8
|
|
||||||||||||
|
Total definite-lived intangible assets
|
$
|
83.8
|
|
$
|
(65.4
|
)
|
$
|
18.4
|
|
$
|
88.3
|
|
$
|
(65.7
|
)
|
$
|
22.6
|
|
|||||||
|
For the Year Ended December 31,
|
|||||||||||
|
(in millions)
|
2016
|
2015
|
2014
|
||||||||
|
Aggregate Amortization Expense
|
$
|
2.9
|
|
$
|
3.0
|
|
$
|
11.5
|
|
||
Estimated aggregate intangible asset amortization expense (in millions) for the next five years is as follows:
|
2017
|
$
|
2.1
|
|
|
|
2018
|
$
|
1.9
|
|
|
|
2019
|
$
|
1.8
|
|
|
|
2020
|
$
|
1.8
|
|
|
|
2021
|
$
|
1.7
|
|
|
NOTE M – DERIVATIVE FINANCIAL INSTRUMENTS
In the normal course of business, the Company enters into
two
types of derivatives to hedge its interest rate exposure and foreign currency exposure: hedges of fair value exposures and hedges of cash flow exposures. Fair value exposures relate to recognized assets or liabilities and firm commitments, while cash flow exposures relate to the variability of future cash flows associated with recognized assets or liabilities or forecasted transactions.
The Company operates internationally, with manufacturing and sales facilities in various locations around the world, and uses certain financial instruments to manage its foreign currency, interest rate and fair value exposures. To qualify a derivative as a hedge at inception and throughout the hedge period, the Company formally documents the nature and relationships between hedging instruments and hedged items, as well as its risk-management objectives and strategies for undertaking various hedge transactions, and the method of assessing hedge effectiveness. Additionally, for hedges of forecasted transactions, significant characteristics and expected terms of a forecasted transaction must be specifically identified, and it must be probable that each forecasted transaction will occur. If it is deemed probable the forecasted transaction will not occur, then the gain or loss would be recognized in current earnings. Financial instruments qualifying for hedge accounting must maintain a specified level of effectiveness between the hedging instrument and the item being hedged, both at inception and throughout the hedged period. The Company does not engage in trading or other speculative use of financial instruments.
The Company has used and may use forward contracts and options to mitigate its exposure to changes in foreign currency exchange rates on third party and intercompany forecasted transactions. Primary currencies to which the Company is exposed are the Euro, British Pound and Australian Dollar. The effective portion of unrealized gains and losses associated with forward contracts and the intrinsic value of option contracts are deferred as a component of Accumulated other comprehensive income (“AOCI”) until the underlying hedged transactions are reported in the Company’s Consolidated Statement of Income (Loss).
The Company has used and may use interest rate swaps to mitigate its exposure to changes in interest rates related to existing issuances of variable rate debt and changes in the fair value of fixed rate debt. Primary exposure includes movements in the U.S. prime rate and London Interbank Offered Rate (“LIBOR”). The effective portion of interest rate derivatives designated as cash flow hedges is deferred in AOCI and is recognized in earnings as hedged transactions occur. Changes in fair value associated with contracts deemed ineffective are recognized in earnings immediately.
F-36
In the Consolidated Statement of Income (Loss), the Company records hedging activity related to debt instruments and hedging activity related to foreign currency in the accounts for which the hedged items are recorded. On the Consolidated Statement of Cash Flows, the Company presents cash flows from hedging activities in the same manner as it records the underlying item being hedged.
The Company is party to currency exchange forward contracts that generally mature within
one year
to manage its exposure to changing currency exchange rates. At
December 31, 2016
, the Company had
$245.5 million
notional amount of currency exchange forward contracts outstanding that were initially designated as hedge contracts, most of which mature on or before December 31,
2017
. The fair market value of these contracts at
December 31, 2016
was a net loss of
$2.6 million
. At
December 31, 2016
,
$194.0 million
notional amount (
$2.7 million
of fair value losses) of these forward contracts have been designated as, and are effective as, cash flow hedges of forecasted and specifically identified transactions. During
2016
and
2015
, the Company recorded the change in fair value for these cash flow hedges to AOCI and reclassified to earnings a portion of the deferred gain or loss from AOCI as the hedged transactions occurred and were recognized in earnings.
The Company records foreign exchange contracts at fair value on a recurring basis. The foreign exchange contracts designated as hedging instruments are categorized under Level 2 of the ASC 820 hierarchy and are recorded at
December 31, 2016
and
2015
as a net liability of
$2.6 million
and a net asset of
$3.1 million
, respectively. See Note B – “Basis of Presentation,” for an explanation of the ASC 820 hierarchy. Fair values of these foreign exchange forward contracts are derived using quoted forward foreign exchange prices to interpolate values of outstanding trades at the reporting date based on their maturities.
The Company
uses forward foreign exchange contracts to mitigate its exposure to changes in foreign currency exchange rates on third party and intercompany forecasted transactions and balance sheet exposures. Certain of these contracts have not been designated as hedging instruments. The majority of gains and losses recognized from foreign exchange contracts not designated as hedging instruments were offset by changes in the underlying hedged items, resulting in no material net impact on earnings. Changes in the fair value of derivative financial instruments are recognized as gains or losses in Cost of goods sold or Other income (expense) - net in the Consolidated Statement of Income (Loss).
Concurrent with the 2014 sale of a majority stake in A.S.V., Inc. to Manitex International, Inc. (“Manitex”), the Company invested in a subordinated convertible promissory note from Manitex, which included an embedded derivative, the conversion feature. At the date of issuance, the embedded derivative was measured at fair value. The derivative is categorized under Level 2 of the ASC 820 hierarchy and marked-to-market each period with changes in fair value recorded in Other income (expense) - net in the Consolidated Statement of Income (Loss).
The Company entered into certain interest rate swap agreements to offset the variability of cash flows due to changes in the floating rate of borrowings under its Securitization Facility, which was terminated on May 31, 2016. See Note O – “Long-Term Obligations,” for additional information on the Securitization Facility. The interest rate swaps were designated as cash flow hedges of the changes in the cash flows of interest rate payments on debt associated with changes in floating interest rates. Changes in the fair value of these derivative financial instruments were recognized as gains or losses in Cost of goods sold in the Consolidated Statement of Income (Loss). The Company recorded these contracts at fair value on a recurring basis. At
December 31, 2016
the Company had no interest rate swap contracts outstanding, because it terminated the Securitization Facility and concurrently settled its outstanding interest rate swap contracts. The interest rate swap contracts designated as hedging instruments were categorized under Level 2 of the ASC 820 hierarchy and were recorded at December 31, 2015 as a net asset of
$0.2 million
. The fair value of these contracts was derived using quoted interest rate swap prices at the reporting date based on their maturities.
During 2016, the Company entered into forward foreign currency contracts, with notional value of
$100.0 million
, in connection with the sale of MHPS to Konecranes to hedge against its exposure to changes in the Euro to U.S. dollar exchange rate, as part of the proceeds from sale was received in Euros. The derivatives are categorized under Level 2 of the ASC 820 hierarchy and fair value is derived using quoted forward foreign exchange prices to interpolate values of outstanding trades at the reporting date based on their maturities. Fair value measurement resulted in a gain of
$2.0 million
recorded in Other income (expense) - net in the Consolidated Statement of Income (Loss).
F-37
The following table provides the location and fair value amounts of derivative instruments designated as hedging instruments that are reported in the Consolidated Balance Sheet (in millions):
|
Asset Derivatives
|
Balance Sheet Account
|
December 31,
2016 |
December 31,
2015 |
|||||
|
Foreign exchange contracts
|
Other current assets
|
$
|
4.2
|
|
$
|
4.0
|
|
|
|
Interest rate swap
|
Other assets
|
—
|
|
0.9
|
|
|||
|
Total asset derivatives
|
|
$
|
4.2
|
|
$
|
4.9
|
|
|
|
Liability Derivatives
|
|
|
|
|
|
|||
|
Foreign exchange contracts
|
Other current liabilities
|
(6.8
|
)
|
(0.8
|
)
|
|||
|
Interest rate swap
|
Other current liabilities
|
—
|
|
(0.7
|
)
|
|||
|
Total liability derivatives
|
|
$
|
(6.8
|
)
|
$
|
(1.5
|
)
|
|
|
Total Derivatives
|
|
$
|
(2.6
|
)
|
$
|
3.4
|
|
|
The following table provides the location and fair value amounts of derivative instruments not designated as hedging instruments that are reported in the Consolidated Balance Sheet (in millions):
|
Asset Derivatives
|
Balance Sheet Account
|
December 31,
2016 |
December 31,
2015 |
|||||
|
Foreign exchange contracts
|
Other current assets
|
$
|
2.6
|
|
$
|
0.5
|
|
|
|
Debt conversion feature
|
Other assets
|
1.1
|
|
1.1
|
|
|||
|
Total asset derivatives
|
$
|
3.7
|
|
$
|
1.6
|
|
||
|
Liability Derivatives
|
||||||||
|
Foreign exchange contracts
|
Other current liabilities
|
(1.2
|
)
|
(0.2
|
)
|
|||
|
Total liability derivatives
|
$
|
(1.2
|
)
|
$
|
(0.2
|
)
|
||
|
Total Derivatives
|
$
|
2.5
|
|
$
|
1.4
|
|
||
The following tables provide the effect of derivative instruments that are designated as hedges in the Consolidated Statements of Income (Loss), Comprehensive Income (Loss) and AOCI (in millions):
|
Gain (Loss) Recognized on Derivatives in AOCI:
|
Year Ended
December 31, |
|||||||||||
|
Cash Flow Derivatives
|
|
2016
|
2015
|
2014
|
||||||||
|
Foreign exchange contracts
|
|
$
|
(4.5
|
)
|
$
|
2.8
|
|
$
|
(3.4
|
)
|
||
|
Interest rate swap
|
(0.2
|
)
|
0.2
|
|
—
|
|
||||||
|
Total
|
$
|
(4.7
|
)
|
$
|
3.0
|
|
$
|
(3.4
|
)
|
|||
|
Gain (Loss) Reclassified from AOCI into Income (Loss) (Effective):
|
Year Ended
December 31, |
|||||||||||
|
Account
|
|
2016
|
2015
|
2014
|
||||||||
|
Cost of goods sold
|
|
$
|
(2.0
|
)
|
$
|
1.6
|
|
$
|
2.5
|
|
||
|
Gain (Loss) Recognized on Derivatives (Ineffective) in Income (Loss):
|
Year Ended
December 31, |
|||||||||||
|
Account
|
|
2016
|
2015
|
2014
|
||||||||
|
Cost of goods sold
|
$
|
1.0
|
|
$
|
2.3
|
|
$
|
(1.3
|
)
|
|||
|
Other income (expense) – net
|
$
|
—
|
|
$
|
(0.1
|
)
|
$
|
0.5
|
|
|||
|
Total
|
$
|
1.0
|
|
$
|
2.2
|
|
$
|
(0.8
|
)
|
|||
F-38
The following table provides the effect of derivative instruments that are not designated as hedges in the Consolidated Statements of Income (Loss) and Comprehensive Income (Loss) (in millions):
|
Gain (Loss) Recognized in Income on Derivatives not designated as hedges:
|
Year Ended
December 31, |
|||||||
|
Account
|
2016
|
2015
|
2014
|
|||||
|
Other income (expense) – net
|
0.9
|
|
(3.4
|
)
|
0.5
|
|
||
Counterparties to the Company’s currency exchange forward contracts and interest rate swap agreements are major financial institutions with credit ratings of investment grade or better and no collateral is required. There are no significant risk concentrations. Management continues to monitor counterparty risk and believes the risk of incurring losses on derivative contracts related to credit risk is unlikely and any losses would be immaterial.
Unrealized net gains (losses), net of tax, included in AOCI are as follows (in millions):
|
|
Year Ended December 31,
|
||||||||||
|
|
2016
|
2015
|
2014
|
||||||||
|
Balance at beginning of period
|
$
|
2.3
|
|
$
|
(0.7
|
)
|
$
|
2.7
|
|
||
|
Additional gains (losses) – net
|
(5.7
|
)
|
9.2
|
|
(1.4
|
)
|
|||||
|
Amounts reclassified to earnings
|
1.0
|
|
(6.2
|
)
|
(2.0
|
)
|
|||||
|
Balance at end of period
|
$
|
(2.4
|
)
|
$
|
2.3
|
|
$
|
(0.7
|
)
|
||
Within the unrealized net gains (losses) included in AOCI as of
December 31, 2016
, it is estimated that
$2.4 million
of losses are expected to be reclassified into earnings in the next twelve months.
NOTE N – RESTRUCTURING AND OTHER CHARGES
The Company continually evaluates its cost structure to be appropriately positioned to respond to changing market conditions. From time to time the Company may initiate certain restructuring programs to better utilize its workforce and optimize facility utilization to match the demand for its products.
During the year ended December 31, 2015, the Company established a restructuring program in the MP segment to close one of its manufacturing facilities in the U.S., consolidate production with other U.S. sites and exit the hand-fed chipper line of products. By consolidating operations, the Company has optimized its use of resources, eliminated areas of duplication and operates more efficiently and effectively. The program cost
$0.9 million
, resulted in a reduction of
38
team members and was completed in 2015.
During the year ended December 31, 2015, the Company established a restructuring program across multiple operating segments to centralize transaction processing and accounting functions into shared service centers. The program cost
$0.9 million
, resulted in the reduction of
69
team members and was completed in 2016. The segment breakdown of this program cost is as follows: Cranes (
$0.8 million
) and MP (
$0.1 million
).
During the year ended December 31, 2016, the Company established restructuring programs in its Cranes segment to transfer production between existing facilities and close certain facilities in order to maximize labor efficiencies and reduce overhead costs, and incurred
$76.9 million
of expense. The programs are expected to cost
$79.9 million
, result in the reduction of approximately
1,260
team members and be completed in 2018.
During the year ended December 31, 2016, the Company established restructuring programs in Corporate and Other to consolidate facilities, and incurred
$2.9 million
of expense. The programs are expected to cost
$2.9 million
, result in the reduction of approximately
32
team members and be completed in 2017.
F-39
The following table provides information for all restructuring activities by segment of the amount of expense incurred during the
year ended
December 31, 2016
, the cumulative amount of expenses incurred for the years ended
December 31, 2016
,
2015
and
2014
and the total amount expected to be incurred (in millions):
|
|
Amount incurred
during the year ended
December 31, 2016
|
Cumulative amount
incurred through
December 31, 2016
|
Total amount expected to be incurred
|
||||||||
|
AWP
|
$
|
0.9
|
|
$
|
0.9
|
|
$
|
0.9
|
|
||
|
Cranes
|
76.9
|
|
77.7
|
|
79.9
|
|
|||||
|
MP
|
0.4
|
|
1.4
|
|
1.4
|
|
|||||
|
Corporate and Other
|
2.9
|
|
2.9
|
|
2.9
|
|
|||||
|
Total
|
$
|
81.1
|
|
$
|
82.9
|
|
$
|
85.1
|
|
||
The following table provides information by type of restructuring activity with respect to the amount of expense incurred during the
year ended
December 31, 2016
, the cumulative amount of expenses incurred since inception of the programs and the total amount expected to be incurred (in millions):
|
|
Employee
Termination Costs
|
Facility
Exit Costs
|
Asset Disposal and Other Costs
|
Total
|
|||||||||||
|
Amount incurred in the year ended December 31, 2016
|
$
|
61.7
|
|
$
|
1.7
|
|
$
|
17.7
|
|
$
|
81.1
|
|
|||
|
Cumulative amount incurred through December 31, 2016
|
$
|
62.9
|
|
$
|
1.8
|
|
$
|
18.2
|
|
$
|
82.9
|
|
|||
|
Total amount expected to be incurred
|
$
|
64.4
|
|
$
|
2.5
|
|
$
|
18.2
|
|
$
|
85.1
|
|
|||
The following table provides a roll forward of the restructuring reserve by type of restructuring activity for the
year ended
December 31, 2016
(in millions):
|
|
Employee
Termination Costs
|
Total
|
|||||
|
Restructuring reserve at December 31, 2015
|
$
|
0.9
|
|
$
|
0.9
|
|
|
|
Restructuring charges
|
70.9
|
|
70.9
|
|
|||
|
Restructuring reductions
(1)
|
(9.6
|
)
|
(9.6
|
)
|
|||
|
Cash expenditures
|
(4.7
|
)
|
(4.7
|
)
|
|||
|
Foreign exchange
|
(0.7
|
)
|
(0.7
|
)
|
|||
|
Restructuring reserve at December 31, 2016
|
$
|
56.8
|
|
$
|
56.8
|
|
|
(1) Primarily related to reversal of accrued severance costs associated with the Company’s change in plan from closing to selling a certain business.
During the years ended
December 31, 2016
,
2015
and
2014
,
$42.6 million
,
$0.3 million
and
$0.3 million
, respectively, of restructuring charges were included in COGS. During the years ended
December 31, 2016
,
2015
and
2014
,
$20.8 million
,
$1.1 million
and
$0.3 million
, respectively, of restructuring charges were included in SG&A costs. There were
$17.7 million
and
$0.4 million
of asset impairments included in restructuring costs, recorded in SG&A, for the years ended
December 31, 2016
and
2015
, respectively. There were
no
asset impairments included in restructuring costs for the year ended
December 31, 2014
.
Other
During the year ended December 31, 2016, the Company recorded approximately
$21.1 million
and
$12.7 million
as a component of COGS and SG&A, respectively, for severance charges for structural cost reduction actions across all segments and corporate functions.
F-40
NOTE O – LONG-TERM OBLIGATIONS
Long-term debt is summarized as follows (in millions):
|
|
December 31,
|
||||||
|
|
2016
|
2015
|
|||||
|
6-1/2% Senior Notes due April 1, 2020, net of unamortized debt issuance costs of $2.1 and $2.8 respectively
|
$
|
297.9
|
|
$
|
297.2
|
|
|
|
6% Senior Notes due May 15, 2021, net of unamortized debt issuance costs of $7.5 and $9.2, respectively
|
842.5
|
|
840.8
|
|
|||
|
2014 Credit Agreement – term debt, net of unamortized debt issuance costs of $7.9 and $9.1, respectively
|
420.7
|
|
430.1
|
|
|||
|
2015 Securitization Facility
|
—
|
|
206.5
|
|
|||
|
Capital lease obligations
|
2.9
|
|
4.9
|
|
|||
|
Other
|
11.8
|
|
16.7
|
|
|||
|
Total debt
|
1,575.8
|
|
1,796.2
|
|
|||
|
Less: Notes payable and current portion of long-term debt
|
(13.8
|
)
|
(66.4
|
)
|
|||
|
Long-term debt, less current portion
|
$
|
1,562.0
|
|
$
|
1,729.8
|
|
|
2014 Credit Agreement
On January 31, 2017, in connection with the 2017 Credit Agreement (as defined below), the Company terminated its 2014 Credit Agreement (as defined below), among the Company and certain of its subsidiaries, the lenders thereunder and Credit Suisse AG, as administrative agent and collateral agent, and related agreements and documents.
On August 13, 2014 the Company entered into a credit agreement (the “2014 Credit Agreement”), with the lenders party thereto and Credit Suisse AG, as administrative agent and collateral agent. In connection with the 2014 Credit Agreement, the Company terminated its existing amended and restated credit agreement, dated as of August 5, 2011, as amended (the “2011 Credit Agreement”), among the Company and certain of its subsidiaries, the lenders thereunder and Credit Suisse AG, as administrative agent and collateral agent, and related agreements and documents.
The 2014 Credit Agreement provided the Company with a senior secured revolving line of credit of up to
$600 million
that was available through August 13, 2019, a
$230.0 million
senior secured term loan and a
€200.0 million
senior secured term loan, which both matured on August 13, 2021. The 2014 Credit Agreement allowed unlimited incremental commitments, which could be extended at the option of the existing or new lenders and could be in the form of revolving credit commitments, term loan commitments, or a combination of both as long as the Company satisfied a senior secured debt financial ratio contained in the 2014 Credit Agreement.
The 2014 Credit Agreement required the Company to comply with a number of covenants. The covenants limited, in certain circumstances, the Company’s ability to take a variety of actions, including but not limited to: incurring indebtedness; creating or maintaining liens on its property or assets; making investments, loans and advances; repurchasing shares of its Common Stock; engaging in acquisitions, mergers, consolidations and asset sales; redeeming debt; and paying dividends and distributions. On May 29, 2015, the Company entered into an Incremental Assumption Agreement and Amendment No. 1 to the 2014 Credit Agreement which lowered the interest rate on the Company’s
€200.0 million
Euro denominated term loan from Euro Interbank Offered Rate (“EURIBOR”) plus
3.25%
with a
0.75%
EURIBOR floor to EURIBOR plus
2.75%
with a
0.75%
EURIBOR floor. On September 30, 2016, the Company entered into an Amendment No. 2 (the “Amendment”) to the 2014 Credit Agreement, with the lenders party thereto and Credit Suisse AG, as administrative agent and collateral agent. The Amendment, among other things, waived the requirement that the Company and its restricted subsidiaries receive at least
75%
of the consideration from the SAPA in the form of cash and cash equivalents. The Amendment also provided the Company with additional flexibility to not use the net cash proceeds from the SAPA to prepay the term loans, although it did require the Company to use
$300 million
of the net cash proceeds received from the SAPA, within
60
days of receipt thereof, to reduce its outstanding senior indebtedness. During the year ended December 31, 2016, the Company incurred approximately
$0.3 million
of costs related to the Amendment (see Note A - “Sale of MHPS Business”).
F-41
If the Company’s borrowings under its revolving line of credit were greater than
30%
of the total revolving credit commitments, the 2014 Credit Agreement required the Company to comply with certain financial tests, as defined in the 2014 Credit Agreement. If applicable, the minimum required levels of the interest coverage ratio would be
2.5
to 1.0 and the maximum permitted levels of the senior secured leverage ratio would be
2.75
to 1.0.
The 2014 Credit Agreement contained customary default provisions and had various non-financial covenants, both requiring the Company to refrain from taking certain future actions (as described above) and requiring the Company to take certain actions, such as keeping its corporate existence in good standing, maintaining insurance, and providing its bank lending group with financial information on a timely basis.
In connection with termination of the 2011 Credit Agreement, the Company recorded charges of
$0.1 million
and
$2.6 million
for accelerated amortization of debt acquisition costs and original issue discount as a loss on early extinguishment of debt for the years ended
December 31, 2015
and 2014, respectively.
As of
December 31, 2016
and
2015
, the Company had
$428.6 million
and
$439.2 million
, respectively, in U.S. dollar and Euro denominated term loans outstanding under its 2014 Credit Agreement. The weighted average interest rate on the term loans at
December 31, 2016
and
2015
was
3.63%
and
3.50%
, respectively. The Company had
no
outstanding revolving credit amounts as of
December 31, 2016
and
2015
.
The 2014 Credit Agreement incorporated facilities for issuance of letters of credit up to
$400 million
. Letters of credit issued under the 2014 Credit Agreement letter of credit facility decreased availability under the
$600 million
revolving line of credit. As of
December 31, 2016
and
2015
, the Company had
no
letters of credit issued under the 2014 Credit Agreement. The 2014 Credit Agreement also permitted the Company to have additional letter of credit facilities up to
$300 million
, and letters of credit issued under such additional facilities did not decrease availability under the revolving line of credit. The Company had letters of credit issued under the additional letter of credit facilities of the 2014 Credit Agreement that totaled
$36.8 million
and
$21.2 million
as of
December 31, 2016
and
2015
, respectively.
The Company also has bilateral arrangements to issue letters of credit with various other financial institutions. These additional letters of credit did not reduce the Company’s availability under the 2014 Credit Agreement. The Company had letters of credit issued under these additional arrangements of
$146.4 million
(
$121.4 million
related to discontinued operations) and
$189.7 million
(
$153.6 million
related to discontinued operations) as of
December 31, 2016
and
2015
, respectively.
In total, as of
December 31, 2016
and
2015
, the Company had letters of credit outstanding of
$183.2 million
(
$121.4 million
related to discontinued operations) and
$210.9 million
(
$153.6 million
related to discontinued operations), respectively. The letters of credit generally serve as collateral for certain liabilities included in the Consolidated Balance Sheet. Certain letters of credit serve as collateral guaranteeing the Company’s performance under contracts.
The Company and certain of its subsidiaries agreed to take certain actions to secure borrowings under the 2014 Credit Agreement. As a result, the Company and certain of its subsidiaries entered into a Guarantee and Collateral Agreement with Credit Suisse, as collateral agent for the lenders, granting security to the lenders for amounts borrowed under the 2014 Credit Agreement. The Company was required to (a) pledge as collateral the capital stock of the Company’s material domestic subsidiaries and
65%
of the capital stock of certain of the Company’s material foreign subsidiaries, and (b) provide a first priority security interest in, and mortgages on, substantially all of the Company’s domestic assets.
6-1/2%
Senior Notes
On March 27, 2012, the Company sold and issued
$300 million
aggregate principal amount of Senior Notes Due 2020 (“
6-1/2%
Notes”) at par. The proceeds from these notes were used for general corporate purposes. The
6-1/2%
Notes are redeemable by the Company beginning in April 2016 at an initial redemption price of
103.25%
of principal amount. The
6-1/2%
Notes are jointly and severally guaranteed by certain of the Company’s domestic subsidiaries (see Note T – “Consolidating Financial Statements”).
On September 30, 2016, the Company obtained the requisite non-revocable consents required to grant certain waivers from the asset sale covenants in the indenture governing the 6-1/2% Notes. The waiver agreements waive the requirement that the Company receive at least 75% of the consideration from the SAPA in the form of cash and cash equivalents. In connection with the receipt and effectiveness of the consents, the Company paid a total of
$1.1 million
as a result of the Disposition, of which
$0.4 million
had been incurred as of December 31, 2016 (see Note A - “Sale of MHPS Business”).
F-42
6%
Senior Notes
On November 26, 2012, the Company sold and issued
$850 million
aggregate principal amount of Senior Notes due 2021 (“
6%
Notes”) at par. The proceeds from this offering plus other cash was used to redeem all
$800 million
principal amount of the outstanding
8%
Senior Subordinated Notes. The
6%
Notes are redeemable by the Company beginning in November 2016 at an initial redemption price of
103.00%
of principal amount. The
6%
Notes are jointly and severally guaranteed by certain of the Company’s domestic subsidiaries (see Note T – “Consolidating Financial Statements”).
On September 30, 2016, the Company obtained the requisite non-revocable consents required to grant certain waivers from the asset sale covenants in the indenture governing the 6% Notes. The waiver agreements waive the requirement that the Company receive at least 75% of the consideration from the SAPA in the form of cash and cash equivalents. In connection with the receipt and effectiveness of the consents, the Company paid a total of
$3.1 million
as a result of the Disposition, of which
$1.1 million
had been incurred as of December 31, 2016 (see Note A - “Sale of MHPS Business”).
4%
Convertible Senior Subordinated Notes
On June 3, 2009, the Company sold and issued
$172.5 million
aggregate principal amount of
4%
Convertible Notes. At issuance, the Company was required to separately account for the liability and equity components of the
4%
Convertible Notes in a manner that reflected the Company’s nonconvertible debt borrowing rate at the date of issuance for interest cost to be recognized in subsequent periods. The Company allocated
$54.3 million
of the
$172.5 million
principal amount of the
4%
Convertible Notes to the equity component, which represented a discount to the debt and was amortized into interest expense using the effective interest method through settlement. The Company recorded a related deferred tax liability of
$19.4 million
on the equity component. During 2012, the Company purchased approximately
25%
of the outstanding
4%
Convertible Notes. The balance of the
4%
Convertible Notes was
$128.8 million
at settlement on June 1, 2015. The Company recognized interest expense of
$5.7 million
and
$13.5 million
on the
4%
Convertible Notes for the years ended
December 31, 2015
and
2014
, respectively. Interest expense on the
4%
Convertible Notes throughout its term included
4%
annually of cash interest on the maturity balance of
$128.8 million
plus non-cash interest expense accreted to the debt balance as described.
On June 1, 2015 the Company paid cash of
$131.1 million
(including accrued interest of
$2.3 million
) and issued
3.4 million
shares of its
$.01
par value common stock to settle the
4%
Convertible Notes.
2015 Securitization Facility
On May 28, 2015, the Company, through certain of its subsidiaries, entered into a Loan and Security Agreement (the “Securitization Facility”) with lenders party thereto. The borrower under the Securitization Facility was a bankruptcy remote subsidiary of the Company (the “Borrower”). On May 31, 2016, the Company terminated the Securitization Facility, and repaid all outstanding loans because it was not providing the Company with the flexibility needed for its portfolio of assets. As a result of terminating the Securitization Facility, during the year ended December 31, 2016, the Company recorded a loss on early extinguishment of debt of
$0.4 million
to write-off deferred debt costs. Under the Securitization Facility, the Borrower received loans from time to time from conduit lenders thereunder, which were secured by and payable from collateral of the Borrower (primarily equipment loans and leases to Terex customers originated by TFS and transferred to the Borrower). The facility limit for such loans was
$350 million
and contained customary representations, warranties and covenants.
At December 31, 2015, the Company had
$206.5 million
in loans outstanding under the Securitization Facility. The weighted average interest rate on the Securitization Facility at December 31, 2015 was
1.46%
. Interest expense on loans outstanding under this facility was recorded to COGS in the Consolidated Statement of Income (Loss). The Company was party to certain derivative interest rate swap agreements entered into to hedge its exposure to variable interest rates related to the Securitization Facility. The effective interest rate on the Securitization Facility when combined with the interest rate swap agreements was
2.13%
at December 31, 2015. For further information on the interest rate swap agreements see Note M – “Derivative Financial Instruments.”
Commitment Letter
On May 16, 2016, as a result of terminating the BCA, the Company and Konecranes terminated the commitment letter they entered into on August 10, 2015 with Credit Suisse Securities (USA) LLC ("CS Securities") and Credit Suisse AG ("CS" and, together with CS Securities and their respective affiliates, "Credit Suisse") and the commitments thereunder by Credit Suisse, the other commitment parties and the lenders in respect of the senior secured credit facilities (the “Commitment Letter”). As the Company and Konecranes terminated the BCA, the parties no longer needed the use of funds that would have been supplied by the senior secured credit facilities pursuant to the Commitment Letter.
F-43
In connection with the Commitment Letter, the Company incurred fees of
$7.2 million
for the year ended December 31, 2016 which are included with transaction costs directly related to the BCA and are recorded in Other income (expense) - net in the Consolidated Statement of Comprehensive Income (Loss).
5-5/8%
Senior Notes
On
January 31, 2017
, the Company sold and issued
$600.0 million
aggregate principal amount of Senior Notes Due 2025 (“5-5/8% Notes”) at par in a private offering. The proceeds from the
5-5/8%
Notes, together with cash on hand, including cash from the sale of our MHPS business, have been and will be used: (i) to complete a tender offer for up to
$550.0 million
of our
6%
Senior Notes, (ii) to redeem and discharge such portion of the
6%
Notes that are not purchased in the tender offer, (iii) to fund a
$300.0 million
partial redemption of the
6%
Notes, (iv) to fund anticipated redemption, repurchase or other retirement of all
$300.0 million
aggregate principal amount outstanding of our
6-1/2%
Notes on or before April 3, 2017, (v) to pay related premiums, fees, discounts and expenses, and (vi) for general corporate purposes, including repayment of borrowings outstanding under the 2014 Credit Agreement. The 5-5/8% Notes are jointly and severally guaranteed by certain of the Company’s domestic subsidiaries. The Company expects to record a loss on early extinguishment of debt related to its
6%
Senior Notes and its
6-1/2%
Senior Notes of approximately
$44 million
in 2017.
2017 Credit Facility Agreement
On January 31, 2017 the Company entered into a new credit agreement (the “2017 Credit Agreement”), with the lenders and issuing banks party thereto (the “New Lenders”) and Credit Suisse AG, Cayman Islands Branch, (“CSAG”) as administrative agent and collateral agent. In connection with the 2017 Credit Agreement, the Company terminated its 2014 Credit Agreement, among the Company and certain of its subsidiaries, the lenders thereunder and Credit Suisse AG, as administrative agent and collateral agent, and related agreements and documents. The 2017 Credit Agreement provides the Company with a senior secured revolving line of credit of up to
$450 million
that is available through January 31, 2022 and a
$400.0 million
senior secured term loan, which will mature on January 31, 2024. The 2017 Credit Agreement allows unlimited incremental commitments, which may be extended at the option of the existing or new lenders and can be in the form of revolving credit commitments, term loan commitments, or a combination of both, with incremental amounts in excess of
$300.0 million
as long as the Company satisfies a senior secured leverage ratio contained in the 2017 Credit Agreement.
The 2017 Credit Agreement requires the Company to comply with a number of covenants, which limit, in certain circumstances, the Company’s ability to take a variety of actions, including but not limited to: incur indebtedness; create or maintain liens on its property or assets; make investments, loans and advances; repurchase shares of its common stock; engage in acquisitions, mergers, consolidations and asset sales; redeem debt; and pay dividends and distributions. If the Company’s borrowings under its revolving line of credit are greater than
30%
of the total revolving credit commitments, the 2017 Credit Agreement requires the Company to comply with certain financial tests, as defined in the 2017 Credit Agreement. If applicable, the minimum required levels of the interest coverage ratio would be
2.5
to 1.0 and the maximum permitted levels of the senior secured leverage ratio would be
2.75
to 1.0. The 2017 Credit Agreement also contains customary default provisions.
Furthermore, the Company and certain of its subsidiaries agreed to take certain actions to secure borrowings under the 2017 Credit Agreement. As a result, on January 31, 2017, Terex and certain of its subsidiaries entered into a Guarantee and Collateral Agreement with CSAG, as collateral agent for the New Lenders, granting security and guarantees to the New Lenders for amounts borrowed under the 2017 Credit Agreement. Pursuant to the Guarantee and Collateral Agreement, Terex is required to (a) pledge as collateral the capital stock of the Company’s material domestic subsidiaries and
65%
of the capital stock of certain of the Company’s material foreign subsidiaries, and (b) provide a first priority security interest in substantially all of the Company’s domestic assets.
The Company expects to record a loss on early extinguishment of debt related to its 2014 Credit Agreement of approximately
$8 million
in 2017.
F-44
Schedule of Debt Maturities
Scheduled annual maturities of the principal portion of long-term debt outstanding at
December 31, 2016
in the successive five-year period and thereafter are summarized below. These amounts do not reflect the impact of the 5-5/8% Senior Notes and 2017 Credit Agreement, which were entered into in January 2017. Amounts shown are exclusive of minimum lease payments for capital lease obligations (in millions):
|
2017
|
$
|
13.6
|
|
|
2018
|
4.7
|
|
|
|
2019
|
4.4
|
|
|
|
2020
|
304.0
|
|
|
|
2021
|
1,262.6
|
|
|
|
Thereafter
|
1.1
|
|
|
|
Total Debt
|
1,590.4
|
|
|
|
Less: Unamortized debt issuance costs
|
$
|
(17.5
|
)
|
|
Net debt
|
$
|
1,572.9
|
|
Based on indicative price quotations from financial institutions multiplied by the amount recorded on the Company’s Consolidated Balance Sheet, excluding debt acquisition costs (“Book Value”), the Company estimates the fair values (“FV”) of its debt set forth below as of
December 31, 2016
and
2015
, as follows (in millions, except for quotes):
|
2016
|
Book Value
|
Quote
|
FV
|
||||||||
|
6-1/2% Senior Notes
|
$
|
300.0
|
|
$
|
1.02500
|
|
$
|
308
|
|
||
|
6% Senior Notes
|
$
|
850.0
|
|
$
|
1.02750
|
|
$
|
873
|
|
||
|
2014 Credit Agreement Term Loan (net of discount) – USD
|
$
|
223.5
|
|
$
|
1.00000
|
|
$
|
224
|
|
||
|
2014 Credit Agreement Term Loan (net of discount) – EUR
|
$
|
205.1
|
|
$
|
0.99500
|
|
$
|
204
|
|
||
|
2015
|
Book Value
|
Quote
|
FV
|
||||||||
|
6-1/2% Senior Notes
|
$
|
300.0
|
|
$
|
0.96000
|
|
$
|
288
|
|
||
|
6% Senior Notes
|
$
|
850.0
|
|
$
|
0.91500
|
|
$
|
778
|
|
||
|
2014 Credit Agreement Term Loan (net of discount) – USD
|
$
|
225.5
|
|
$
|
0.99000
|
|
$
|
223
|
|
||
|
2014 Credit Agreement Term Loan (net of discount) – EUR
|
$
|
213.7
|
|
$
|
0.99750
|
|
$
|
213
|
|
||
The fair value of debt reported in the tables above is based on price quotations on the debt instrument in an active market and therefore categorized under Level 1 of the ASC 820 hierarchy. See Note B – “Basis of Presentation,” for an explanation of the ASC 820 hierarchy. The Company believes that the carrying value of its other borrowings, including amounts outstanding for the revolving line of credit under the 2014 Credit Agreement and the Securitization Facility, approximates fair market value based on maturities for debt of similar terms. The fair value of these other borrowings are categorized under Level 2 of the ASC 820 hierarchy.
The Company paid
$96.2 million
,
$98.9 million
and
$105.9 million
of interest in
2016
,
2015
and
2014
, respectively.
F-45
NOTE P – LEASE COMMITMENTS
Future minimum noncancellable operating lease payments at
December 31, 2016
are as follows (in millions):
|
|
Operating
Leases
|
||
|
2017
|
$
|
32.5
|
|
|
2018
|
21.0
|
|
|
|
2019
|
16.4
|
|
|
|
2020
|
11.2
|
|
|
|
2021
|
10.5
|
|
|
|
Thereafter
|
40.7
|
|
|
|
Total minimum obligations
|
$
|
132.3
|
|
Most of the Company’s operating leases provide the Company with the option to renew the leases for varying periods after the initial lease terms. These renewal options enable the Company to renew the leases based upon the fair rental values at the date of expiration of the initial lease. Total rental expense under operating leases was
$44.3 million
,
$49.6 million
, and
$50.4 million
in
2016
,
2015
and
2014
, respectively.
F-46
NOTE Q– RETIREMENT PLANS AND OTHER BENEFITS
U.S. Pension Plan
As of
December 31, 2016
, the Company maintained
one
qualified defined benefit pension plan covering certain domestic employees (the “Terex Plan”). Participation in the Terex Plan for all employees has been frozen. Participants are credited with post-freeze service for purposes of determining vesting and retirement eligibility only. The benefits covering salaried employees are based primarily on years of service and employees’ qualifying compensation during the final years of employment. The benefits covering bargaining unit employees are based primarily on years of service and a flat dollar amount per year of service. It is the Company’s policy generally to fund the Terex Plan based on the requirements of the Employee Retirement Income Security Act of 1974 (“ERISA”). Plan assets consist primarily of common stocks, bonds and short-term cash equivalent funds.
The Company maintains a nonqualified Supplemental Executive Retirement Plan (“SERP”). The SERP provides retirement benefits to certain senior executives of the Company. Generally, the SERP provides a benefit based on average total compensation earned over a participant’s final
five
years of employment and years of service reduced by benefits earned under any Company retirement program, excluding salary deferrals and matching contributions. In addition, benefits are reduced by Social Security Primary Insurance Amounts attributable to Company contributions. The SERP is unfunded and participation in the SERP has been frozen. There is a defined contribution plan for certain senior executives of the Company.
During July 2012, the Moving Ahead for Progress in the 21st Century Act (“MAP 21”) was enacted in the U.S. MAP 21 provided short-term relief of minimum contribution requirements by increasing the interest rates used to value pension liabilities beginning January 1, 2012 and increased the premiums due to the Pension Benefit Guaranty Corporation beginning in 2013 through 2015. On July 31, 2014, Congress passed the “Highway and Transportation Funding Act of 2014” (“HFTA-2014”). Included in HFTA-2014 were provisions to further stabilize the interest rates used in valuing pension liabilities. As a result of the provisions of MAP 21 and HFTA-2014, and existing funding commitments, there were
no
minimum contribution requirements for the 2016, 2015 and 2014 plan years.
Non-U.S. Plans
The Company maintains defined benefit plans in France, Germany, India, Switzerland and the United Kingdom for some of its subsidiaries. Participation in the United Kingdom plan has been frozen. The United Kingdom plan is a funded plan and the Company funds this plan in accordance with funding regulations in the United Kingdom and a negotiated agreement between the Company and the plan’s trustees. The plans in France, Germany and India are unfunded plans. For the Company’s operations in Italy there are mandatory termination indemnity plans providing a benefit payable upon termination of employment in substantially all cases of termination. The Company records this obligation based on mandated requirements. The measure of current obligation is not dependent on the employees’ future service and therefore is measured at current value.
Other Post-employment Benefits
The Company has several non-pension post-retirement benefit programs. The Company provides post-employment health and life insurance benefits to certain former salaried and hourly employees. The health care programs are contributory, with participants’ contributions adjusted annually, and the life insurance plan is noncontributory.
Savings Plans
The Company sponsors various tax deferred savings plans into which eligible employees may elect to contribute a portion of their compensation. The Company may, but is not obligated to, contribute to certain of these plans. The Company’s Common Stock held in a rabbi trust pursuant to the Deferred Compensation Plan is treated in a manner similar to treasury stock. The number of shares of the Company’s Common Stock held in the rabbi trust was
0.9 million
and
0.8 million
at
December 31, 2016
and
2015
, respectively.
Charges recognized for the Deferred Compensation Plan and these other savings plans were
$19.3 million
,
$20.6 million
and
$18.1 million
for the years ended
December 31, 2016
,
2015
and
2014
, respectively. For the years ended
December 31, 2016
,
2015
and
2014
, Company matching contributions to tax deferred savings plans were invested at the direction of plan participants.
F-47
Information regarding the Company’s plans, including SERP, was as follows (in millions, except percent values):
|
|
U.S. Pension Benefits
|
Non-U.S. Pension Benefits
|
Other Benefits
|
||||||||||||||||||||
|
|
2016
|
2015
|
2016
|
2015
|
2016
|
2015
|
|||||||||||||||||
|
Accumulated benefit obligation at end of year
|
$
|
161.2
|
|
$
|
167.2
|
|
$
|
209.7
|
|
$
|
214.9
|
|
|
|
|
|
|||||||
|
Change in benefit obligation:
|
|
|
|
|
|
|
|
|
|
|
|||||||||||||
|
Benefit obligation at beginning of year
|
$
|
174.0
|
|
$
|
184.9
|
|
$
|
217.1
|
|
$
|
243.0
|
|
$
|
4.9
|
|
$
|
5.7
|
|
|||||
|
Service cost
|
0.6
|
|
1.1
|
|
3.1
|
|
2.9
|
|
—
|
|
—
|
|
|||||||||||
|
Interest cost
|
7.1
|
|
7.2
|
|
6.5
|
|
6.9
|
|
0.2
|
|
0.2
|
|
|||||||||||
|
Transfer to Held for Sale
|
—
|
|
—
|
|
(5.5
|
)
|
—
|
|
—
|
|
—
|
|
|||||||||||
|
Actuarial loss (gain)
|
2.5
|
|
(7.8
|
)
|
25.9
|
|
(9.9
|
)
|
(0.6
|
)
|
(0.5
|
)
|
|||||||||||
|
Benefits paid
|
(16.6
|
)
|
(11.4
|
)
|
(9.4
|
)
|
(8.8
|
)
|
(0.3
|
)
|
(0.5
|
)
|
|||||||||||
|
Foreign exchange effect
|
—
|
|
—
|
|
(26.2
|
)
|
(17.0
|
)
|
—
|
|
—
|
|
|||||||||||
|
Benefit obligation at end of year
|
167.6
|
|
174.0
|
|
211.5
|
|
217.1
|
|
4.2
|
|
4.9
|
|
|||||||||||
|
Change in plan assets:
|
|
|
|
|
|
|
|
|
|
|
|||||||||||||
|
Fair value of plan assets at beginning of year
|
123.1
|
|
136.8
|
|
111.2
|
|
119.0
|
|
—
|
|
—
|
|
|||||||||||
|
Actual return on plan assets
|
9.5
|
|
(2.4
|
)
|
18.4
|
|
(0.3
|
)
|
—
|
|
—
|
|
|||||||||||
|
Employer contribution
|
1.1
|
|
0.1
|
|
6.7
|
|
7.2
|
|
0.3
|
|
0.5
|
|
|||||||||||
|
Employee contribution
|
—
|
|
—
|
|
0.4
|
|
0.3
|
|
—
|
|
—
|
|
|||||||||||
|
Benefits paid
|
(16.6
|
)
|
(11.4
|
)
|
(9.4
|
)
|
(8.8
|
)
|
(0.3
|
)
|
(0.5
|
)
|
|||||||||||
|
Foreign exchange effect
|
—
|
|
—
|
|
(19.0
|
)
|
(6.2
|
)
|
—
|
|
—
|
|
|||||||||||
|
Fair value of plan assets at end of year
|
117.1
|
|
123.1
|
|
108.3
|
|
111.2
|
|
—
|
|
—
|
|
|||||||||||
|
Funded status
|
$
|
(50.5
|
)
|
$
|
(50.9
|
)
|
$
|
(103.2
|
)
|
$
|
(105.9
|
)
|
$
|
(4.2
|
)
|
$
|
(4.9
|
)
|
|||||
|
Amounts recognized in the statement of financial position consist of:
|
|
|
|
|
|
|
|||||||||||||||||
|
Current liabilities
|
$
|
1.2
|
|
$
|
1.0
|
|
$
|
2.4
|
|
$
|
3.1
|
|
$
|
0.5
|
|
$
|
0.6
|
|
|||||
|
Non-current liabilities
|
49.3
|
|
49.9
|
|
100.8
|
|
102.8
|
|
3.7
|
|
4.3
|
|
|||||||||||
|
Total liabilities
|
$
|
50.5
|
|
$
|
50.9
|
|
$
|
103.2
|
|
$
|
105.9
|
|
$
|
4.2
|
|
$
|
4.9
|
|
|||||
|
Amounts recognized in accumulated other comprehensive loss consist of:
|
|
|
|
|
|
|
|
|
|
|
|||||||||||||
|
Actuarial net loss
|
$
|
75.6
|
|
$
|
78.5
|
|
$
|
148.5
|
|
$
|
126.5
|
|
$
|
—
|
|
$
|
0.6
|
|
|||||
|
Prior service cost
|
0.3
|
|
0.4
|
|
(2.2
|
)
|
0.2
|
|
—
|
|
—
|
|
|||||||||||
|
Total amounts recognized in accumulated other comprehensive loss
|
$
|
75.9
|
|
$
|
78.9
|
|
$
|
146.3
|
|
$
|
126.7
|
|
$
|
—
|
|
$
|
0.6
|
|
|||||
|
|
U.S. Pension Benefits
|
Non-U.S.Pension Benefits
|
Other Benefits
|
|||||||||||||||||||||||
|
|
2016
|
2015
|
2014
|
2016
|
2015
|
2014
|
2016
|
2015
|
2014
|
|||||||||||||||||
|
Weighted-average assumptions as of December 31:
|
|
|
|
|
|
|
|
|
|
|
|
|
|
|
|
|
|
|
||||||||
|
Discount rate
(1)
|
4.03
|
%
|
4.20
|
%
|
4.02
|
%
|
2.27
|
%
|
3.23
|
%
|
2.97
|
%
|
3.81
|
%
|
3.91
|
%
|
3.74
|
%
|
||||||||
|
Expected return on plan assets
|
7.00
|
%
|
7.50
|
%
|
7.50
|
%
|
5.90
|
%
|
5.93
|
%
|
5.96
|
%
|
N/A
|
|
N/A
|
|
N/A
|
|
||||||||
|
Rate of compensation increase
(1)
|
3.75
|
%
|
3.75
|
%
|
3.75
|
%
|
0.89
|
%
|
0.83
|
%
|
0.84
|
%
|
N/A
|
|
N/A
|
|
N/A
|
|
||||||||
(1) The weighted average assumptions as of December 31 are used to calculate the funded status at the end of the current year and the net periodic cost for the subsequent year.
F-48
|
|
U.S. Pension Benefits
|
Non-U.S. Pension Benefits
|
Other Benefits
|
||||||||||||||||||||||||||||||||
|
|
2016
|
2015
|
2014
|
2016
|
2015
|
2014
|
2016
|
2015
|
2014
|
||||||||||||||||||||||||||
|
Components of net periodic cost:
|
|||||||||||||||||||||||||||||||||||
|
Service cost
|
$
|
0.6
|
|
$
|
1.1
|
|
$
|
0.9
|
|
$
|
3.1
|
|
$
|
2.9
|
|
$
|
1.6
|
|
$
|
—
|
|
$
|
—
|
|
$
|
—
|
|
||||||||
|
Interest cost
|
7.1
|
|
7.2
|
|
7.2
|
|
6.5
|
|
6.9
|
|
8.9
|
|
0.2
|
|
0.2
|
|
0.2
|
|
|||||||||||||||||
|
Expected return on plan assets
|
(8.3
|
)
|
(9.9
|
)
|
(9.2
|
)
|
(6.0
|
)
|
(7.0
|
)
|
(6.7
|
)
|
—
|
|
—
|
|
—
|
|
|||||||||||||||||
|
Recognition of prior service cost
|
0.2
|
|
0.1
|
|
0.1
|
|
—
|
|
—
|
|
2.0
|
|
—
|
|
—
|
|
—
|
|
|||||||||||||||||
|
Amortization of actuarial loss
|
4.2
|
|
3.8
|
|
2.1
|
|
2.5
|
|
3.2
|
|
1.8
|
|
—
|
|
0.1
|
|
0.1
|
|
|||||||||||||||||
|
Other
|
—
|
|
—
|
|
—
|
|
(0.4
|
)
|
(0.3
|
)
|
—
|
|
—
|
|
—
|
|
—
|
|
|||||||||||||||||
|
Net periodic cost
|
$
|
3.8
|
|
$
|
2.3
|
|
$
|
1.1
|
|
$
|
5.7
|
|
$
|
5.7
|
|
$
|
7.6
|
|
$
|
0.2
|
|
$
|
0.3
|
|
$
|
0.3
|
|
||||||||
|
U.S. Pension Benefits
|
Non-U.S. Pension
Benefits
|
Other Benefits
|
|||||||||||||||||||||
|
|
2016
|
2015
|
2016
|
2015
|
2016
|
2015
|
|||||||||||||||||
|
Other Changes in Plan Assets and Benefit Obligations Recognized in Other Comprehensive Income (Loss):
|
|
|
|
|
|
|
|
|
|||||||||||||||
|
Net (gain) loss
|
$
|
1.3
|
|
$
|
4.3
|
|
$
|
39.7
|
|
$
|
(12.9
|
)
|
$
|
(0.6
|
)
|
$
|
(0.5
|
)
|
|||||
|
Amortization of actuarial losses
|
(4.2
|
)
|
(3.7
|
)
|
(5.6
|
)
|
(7.5
|
)
|
—
|
|
—
|
|
|||||||||||
|
Amortization of prior service cost
|
(0.1
|
)
|
(0.1
|
)
|
(2.3
|
)
|
(0.1
|
)
|
—
|
|
—
|
|
|||||||||||
|
Foreign exchange effect
|
—
|
|
—
|
|
(12.2
|
)
|
(12.7
|
)
|
—
|
|
—
|
|
|||||||||||
|
Total recognized in other comprehensive income (loss)
|
$
|
(3.0
|
)
|
$
|
0.5
|
|
$
|
19.6
|
|
$
|
(33.2
|
)
|
$
|
(0.6
|
)
|
$
|
(0.5
|
)
|
|||||
|
U.S. Pension
Benefits
|
Non-U.S. Pension
Benefits
|
Other
Benefits
|
|||||||||
|
Amounts expected to be recognized as components of net periodic cost for the year ending December 31, 2017:
|
|||||||||||
|
Actuarial net loss
|
$
|
4.1
|
|
$
|
3.3
|
|
$
|
—
|
|
||
|
Prior service cost
|
0.1
|
|
—
|
|
—
|
|
|||||
|
Total amount expected to be recognized as components of net periodic cost for the year ending December 31, 2017
|
$
|
4.2
|
|
$
|
3.3
|
|
$
|
—
|
|
||
For the Company’s plans, including the SERP, that have accumulated benefit obligations in excess of plan assets the projected benefit obligation, accumulated benefit obligation and fair value of plan assets were (in millions):
|
U.S. Pension
Benefits
|
Non-U.S. Pension
Benefits
|
||||||||||||||
|
2016
|
2015
|
2016
|
2015
|
||||||||||||
|
Projected benefit obligation
|
$
|
167.6
|
|
$
|
174.0
|
|
$
|
211.5
|
|
$
|
217.1
|
|
|||
|
Accumulated benefit obligation
|
$
|
161.2
|
|
$
|
167.2
|
|
$
|
209.7
|
|
$
|
214.9
|
|
|||
|
Fair value of plan assets
|
$
|
117.1
|
|
$
|
123.1
|
|
$
|
108.3
|
|
$
|
111.2
|
|
|||
Determination of plan obligations and associated expenses requires the use of actuarial valuations based on certain economic assumptions, which includes discount rates and expected rates of return on plan assets. The discount rate enables the Company to estimate the present value of expected future cash flows on the measurement date. The rate used reflects a rate of return on high-quality fixed income investments that matches the duration of expected benefit payments at the December 31 measurement date.
F-49
The rate used for the expected return on plan assets for the U.S. plan is based on a review of long-term historical asset performances aligned with the Company’s investment strategy and portfolio mix. While the Company examines performance annually, it also views historic asset portfolios and performance over a long period of years before recommending a change. In the short term, there may be fluctuations of positive and negative yields year-over-year, but over the long-term, the return is expected to be approximately
7%
.
The Company’s overall investment strategy for the U.S. defined benefit plan balances two objectives, investing in fixed income securities whose maturity broadly matches the maturity of the pension liabilities and investing in equities and other assets expected to generate higher returns. The Company invests through a number of investment funds with diversified asset types, strategies and managers. Equity securities, including investments in large to small-cap companies in the U.S. and internationally, constitute approximately
32%
and
31%
of the portfolio at
December 31, 2016
and
2015
, respectively. Fixed income securities including corporate bonds of companies from diversified industries, U.S. Treasuries and other securities, which may include mortgage-backed securities, asset-backed securities and collateralized mortgage obligations, constitute approximately
68%
and
69%
of the portfolio at
December 31, 2016
and
2015
, respectively. The target investment allocation for
2017
is approximately
22%
to
36%
for equity securities and approximately
64%
to
78%
for fixed income securities.
The methodology used to determine the rate of return on non-U.S. pension plan assets was based on average rate of earnings on funds invested and to be invested. Based on historical returns and future expectations, the Company believes the investment return assumptions are reasonable. The expected rate of return of plan assets represents an estimate of long-term returns on the investment portfolio. This assumption is reviewed by the trustees and varies with each of the plans.
The overall investment strategy for Non-U.S. defined benefit plans is to achieve a mix of investments to support long-term growth and minimize volatility while maximizing rates of return by diversification of asset types, fund strategies and fund managers. Fixed income investments include investments in European government securities and European corporate bonds and constitute approximately
72%
of the portfolio at
December 31, 2016
and
2015
. Equity investments, multi-asset investment funds and real estate investments that invest in a diversified range of property principally in the retail, office and industrial/warehouse sectors constitute approximately
28%
of the portfolio at
December 31, 2016
and
2015
. Investments of the plans primarily include investments in companies from diversified industries with approximately
93%
invested internationally and
7%
invested in North America. The target investment allocations to support our investment strategy for
2017
are approximately
65%
to
66%
fixed income securities and approximately
34%
to
35%
equity securities, multi-asset investment funds and real estate investments.
The fair value of cash in the table below is based on price quotations in an active market and therefore categorized under Level 1 of the ASC 820 hierarchy. The fair value of the investment funds is priced on the market value of the underlying investments in the portfolio and therefore categorized as Level 2 of the ASC 820 hierarchy. See Note B – “Basis of Presentation,” for an explanation of the ASC 820 hierarchy.
On January 1, 2016, the Company adopted ASU 2015-07, “Fair Value Measurement (Topic 820); Disclosures for Investments in Certain Entities That Calculate Net Asset Value Per Share (or Its Equivalent)” (“ASU 2015-07”). This ASU includes a practical expedient to remove the requirement to categorize within the fair value hierarchy all investments for which fair value is measured at the net asset value per share. ASU 2015-07 requires retroactive application and resulted in a reclassification of plan assets of
$119.5 million
in 2015 from Level 2 to Net asset value (“NAV”).
The fair value of the Company’s plan assets at
December 31, 2016
are as follows (in millions):
|
U.S. Pension Plan
|
Non-U.S. Pension Plans
|
||||||||||||||||||||||||||||||
|
|
Total
|
Level 1
|
Level 2
|
NAV
|
Total
|
Level 1
|
Level 2
|
NAV
|
|||||||||||||||||||||||
|
Cash, including money market funds
|
$
|
2.5
|
|
$
|
2.5
|
|
$
|
—
|
|
$
|
—
|
|
$
|
2.1
|
|
$
|
2.1
|
|
$
|
—
|
|
$
|
—
|
|
|||||||
|
U.S. equities
|
28.6
|
|
—
|
|
—
|
|
28.6
|
|
5.9
|
|
—
|
|
5.9
|
|
—
|
|
|||||||||||||||
|
Non-U.S. equities
|
8.7
|
|
—
|
|
—
|
|
8.7
|
|
21.2
|
|
—
|
|
21.2
|
|
—
|
|
|||||||||||||||
|
U.S. corporate bonds
|
56.4
|
|
—
|
|
—
|
|
56.4
|
|
0.9
|
|
—
|
|
0.9
|
|
—
|
|
|||||||||||||||
|
Non-U.S. corporate bonds
|
—
|
|
—
|
|
—
|
|
—
|
|
17.7
|
|
—
|
|
17.7
|
|
—
|
|
|||||||||||||||
|
U.S. government securities
|
12.7
|
|
—
|
|
—
|
|
12.7
|
|
0.6
|
|
—
|
|
0.6
|
|
—
|
|
|||||||||||||||
|
Non-U.S. government securities
|
0.3
|
|
—
|
|
—
|
|
0.3
|
|
29.3
|
|
—
|
|
29.3
|
|
—
|
|
|||||||||||||||
|
Real estate
|
—
|
|
—
|
|
—
|
|
—
|
|
2.8
|
|
—
|
|
2.8
|
|
—
|
|
|||||||||||||||
|
Other securities
|
7.9
|
|
—
|
|
—
|
|
7.9
|
|
27.8
|
|
—
|
|
27.8
|
|
—
|
|
|||||||||||||||
|
Total investments measured at fair value
|
$
|
117.1
|
|
$
|
2.5
|
|
$
|
—
|
|
$
|
114.6
|
|
$
|
108.3
|
|
$
|
2.1
|
|
$
|
106.2
|
|
$
|
—
|
|
|||||||
F-50
The fair value of the Company’s plan assets at
December 31, 2015
are as follows (in millions):
|
U.S. Pension Plan
|
Non-U.S. Pension Plans
|
||||||||||||||||||||||||||||||
|
|
Total
|
Level 1
|
Level 2
|
NAV
|
Total
|
Level 1
|
Level 2
|
NAV
|
|||||||||||||||||||||||
|
Cash, including money market funds
|
$
|
3.6
|
|
$
|
3.6
|
|
$
|
—
|
|
$
|
—
|
|
$
|
4.4
|
|
$
|
4.4
|
|
$
|
—
|
|
$
|
—
|
|
|||||||
|
U.S. equities
|
28.5
|
|
—
|
|
—
|
|
28.5
|
|
6.3
|
|
—
|
|
6.3
|
|
—
|
|
|||||||||||||||
|
Non-U.S. equities
|
9.3
|
|
—
|
|
—
|
|
9.3
|
|
21.7
|
|
—
|
|
21.7
|
|
—
|
|
|||||||||||||||
|
U.S. corporate bonds
|
58.7
|
|
—
|
|
—
|
|
58.7
|
|
0.1
|
|
—
|
|
0.1
|
|
—
|
|
|||||||||||||||
|
Non-U.S. corporate bonds
|
—
|
|
—
|
|
—
|
|
—
|
|
20.3
|
|
—
|
|
20.3
|
|
—
|
|
|||||||||||||||
|
U.S. government securities
|
14.0
|
|
—
|
|
—
|
|
14.0
|
|
—
|
|
—
|
|
—
|
|
—
|
|
|||||||||||||||
|
Non-U.S. government securities
|
0.1
|
|
—
|
|
—
|
|
0.1
|
|
29.8
|
|
—
|
|
29.8
|
|
—
|
|
|||||||||||||||
|
Real estate
|
—
|
|
—
|
|
—
|
|
—
|
|
3.4
|
|
—
|
|
3.4
|
|
—
|
|
|||||||||||||||
|
Other securities
|
8.9
|
|
—
|
|
—
|
|
8.9
|
|
25.2
|
|
—
|
|
25.2
|
|
—
|
|
|||||||||||||||
|
Total investments measured at fair value
|
$
|
123.1
|
|
$
|
3.6
|
|
$
|
—
|
|
$
|
119.5
|
|
$
|
111.2
|
|
$
|
4.4
|
|
$
|
106.8
|
|
$
|
—
|
|
|||||||
The Company plans to contribute approximately
$1 million
to its U.S. defined benefit pension and post-retirement plans and approximately
$7 million
to its non-U.S. defined benefit pension plans in
2017
. During the
year ended
December 31, 2016
, the Company contributed
$1.4 million
to its U.S. defined benefit pension plans and post-retirement plans and
$6.7 million
to its non-U.S. defined benefit pension plans.
The Company’s estimated future benefit payments under its plans are as follows (in millions):
|
Year Ending December 31,
|
U.S. Pension
Benefits
|
Non-U.S.
Pension Benefits
|
Other Benefits
|
|||||||||
|
2017
|
$
|
11.6
|
|
$
|
8.4
|
|
$
|
0.5
|
|
|||
|
2018
|
$
|
11.4
|
|
$
|
6.6
|
|
$
|
0.4
|
|
|||
|
2019
|
$
|
11.3
|
|
$
|
6.9
|
|
$
|
0.4
|
|
|||
|
2020
|
$
|
11.4
|
|
$
|
7.1
|
|
$
|
0.4
|
|
|||
|
2021
|
$
|
11.2
|
|
$
|
7.6
|
|
$
|
0.3
|
|
|||
|
2022-2026
|
$
|
54.5
|
|
$
|
41.5
|
|
$
|
1.4
|
|
|||
For the other benefits, for measurement purposes, a
6.50%
rate of increase in the per capita cost of covered health care benefits was assumed for
2017
, decreasing one-half percentage point per year until it reaches
4.50%
for 2021 and thereafter. Assumed health care cost trend rates may have a significant effect on the amounts reported for the health care plan.
A one-percentage-point change in assumed health care cost trend rates would have the following effects (in millions):
|
|
1-Percentage-
Point Increase
|
1-Percentage-
Point Decrease
|
|||||
|
Effect on total service and interest cost components
|
$
|
—
|
|
$
|
—
|
|
|
|
Effect on post-retirement benefit obligation
|
$
|
0.2
|
|
$
|
(0.2
|
)
|
|
NOTE R– STOCKHOLDERS’ EQUITY
On
December 31, 2016
, there were
129.6 million
shares of Common Stock issued and
105.0 million
shares of Common Stock outstanding. Of the
170.4 million
unissued shares of Common Stock at that date,
3.5 million
shares of Common Stock were reserved for issuance for the exercise of stock options and the vesting of restricted stock.
Common Stock in Treasury.
The Company values treasury stock on an average cost basis. As of
December 31, 2016
, the Company held
24.6 million
shares of Common Stock in treasury totaling
$935.1 million
, including
0.9 million
shares held in a trust for the benefit of the Company’s Deferred Compensation Plan at a total of
$19.7 million
.
Preferred Stock.
The Company’s certificate of incorporation was amended in June 1998 to authorize
50.0 million
shares of preferred stock,
$0.01
par value per share. As of
December 31, 2016
and
2015
, there were
no
shares of preferred stock outstanding.
F-51
Long-Term Incentive Plans.
In May 2009, the stockholders approved the Terex Corporation 2009 Omnibus Incentive Plan (the “2009 Plan”). The purpose of the 2009 Plan is to provide a means whereby employees, directors and third-party service providers of the Company develop a sense of proprietorship and personal involvement in the development and financial success of the Company, and to encourage them to devote their best efforts to the business of the Company, thereby advancing the interests of the Company and its stockholders. The 2009 Plan provides for incentive compensation in the form of (i) options to purchase shares of Common Stock, (ii) stock appreciation rights, (iii) restricted stock awards and restricted stock units, (iv) other stock awards, (v) cash awards, and (vi) performance awards. The maximum number of shares available for issuance under the 2009 Plan is
8.0 million
shares plus the number of shares remaining available for issuance under the Terex Corporation 2000 Incentive Plan (the “2000 Plan”) and the 1996 Terex Corporation Long-Term Incentive Plan (the “1996 Plan”). As of
December 31, 2016
,
2.5 million
shares were available for grant under the 2009 Plan.
In May 2000, the stockholders approved the 2000 Plan. The purpose of the 2000 Plan is to assist the Company in attracting and retaining selected individuals to serve as directors, officers, consultants, advisers and employees of the Company and its subsidiaries and affiliates who will contribute to the Company’s success and to achieve long-term objectives which will inure to the benefit of all stockholders of the Company through the additional incentive inherent in the ownership of the Common Stock. The maximum number of shares available for issuance under the 2000 Plan was
12.0 million
shares plus any shares related to awards under the 2000 Plan that were not issued or were subsequently forfeited, expired or otherwise terminated.
In May 1996, the stockholders approved the 1996 Plan. The maximum number of shares available for issuance under the 1996 Plan was
4.0 million
shares plus any shares related to awards under the 1996 Plan that were not issued or were subsequently forfeited, expired or otherwise terminated.
Substantially all stock option grants under the 2000 Plan and the 1996 Plan vested over a
four
year period and have a contractual life of
ten
years. There were
no
options granted during the years ended
December 31, 2016
,
2015
or
2014
, and the intrinsic value of all options outstanding is zero.
The following table is a summary of stock options under all of the Company’s plans.
|
|
Number of
Options
|
Weighted
Average
Exercise Price
per Share
|
Weighted
Average
Remaining
Contractual
Life (in years)
|
Aggregate
Intrinsic
Value
|
|||||||||
|
Outstanding at December 31, 2015
|
141,223
|
|
$
|
47.50
|
|
|
|
|
|||||
|
Exercised
|
—
|
|
$
|
—
|
|
|
|
|
|||||
|
Canceled or expired
|
(128,164
|
)
|
$
|
45.71
|
|
|
|
|
|||||
|
Outstanding at December 31, 2016
|
13,059
|
|
$
|
65.17
|
|
0.60
|
$
|
—
|
|
||||
|
Exercisable at December 31, 2016
|
13,059
|
|
$
|
65.17
|
|
0.60
|
$
|
—
|
|
||||
|
Vested at December 31, 2016
|
13,059
|
|
$
|
65.17
|
|
0.60
|
$
|
—
|
|
||||
Under the 2009 Plan, 2000 Plan and the 1996 Plan, approximately
11%
of all restricted stock awards outstanding vest over a
four
year period and approximately
89%
of all restricted stock awards vest over a
three
year period with approximately
70%
of these awards vesting on the first three anniversary dates and approximately
30%
vesting at the end of the three year period. Approximately
38%
of the outstanding restricted stock awards are subject to performance targets and market conditions that may or may not be met and for which the performance period has not yet been completed.
The fair value of restricted stock awards is based on the market price at the date of grant except for
0.9 million
shares based on a market condition. The Company uses the Monte Carlo method to provide grant date fair value for awards with a market condition. The Monte Carlo method is a statistical simulation technique used to provide the grant date fair value of an award. The following table presents the weighted-average assumptions used in the valuations:
|
Grant date
|
Grant date
|
Grant date
|
Grant date
|
||||
|
|
March 3, 2016
|
March 5, 2015
|
March 5, 2015
|
February 26, 2014
|
|||
|
Dividend yields
|
1.22%
|
0.91%
|
0.91%
|
0.46%
|
|||
|
Expected volatility
|
45.59%
|
45.48%
|
37.00%
|
56.84%
|
|||
|
Risk free interest rate
|
0.97%
|
0.98%
|
0.58%
|
0.63%
|
|||
|
Expected life (in years)
|
3
|
3
|
2
|
3
|
|||
|
Grant date fair value per share
|
$29.24
|
$28.10
|
$25.60
|
$53.17
|
|||
F-52
As of
December 31, 2016
, unrecognized compensation costs related to restricted stock totaled approximately
$40.6 million
, which will be expensed over a weighted average period of
1.8 years
. The grant date weighted average fair value for restricted stock awards during the years ended
December 31, 2016
,
2015
and
2014
was
$23.95
,
$26.83
and
$44.23
, respectively. The total fair value of shares vested for restricted stock awards was
$35.1 million
,
$42.6 million
and
$36.2 million
for the years ended
December 31, 2016
,
2015
and
2014
, respectively.
During the year ended
December 31, 2016
, the Company issued
64 thousand
shares of its outstanding Common Stock which were contributed into a deferred compensation plan under a Rabbi Trust.
The following table is a summary of restricted stock awards under all of the Company’s plans:
|
|
Restricted Stock
Awards
|
Weighted
Average Grant
Date Fair Value
|
|||||
|
Nonvested at December 31, 2015
|
3,092,943
|
|
$
|
30.29
|
|
||
|
Granted
|
2,015,229
|
|
$
|
23.95
|
|
||
|
Vested
|
(1,034,666
|
)
|
$
|
33.94
|
|
||
|
Canceled, expired or other
|
(542,318
|
)
|
$
|
29.61
|
|
||
|
Nonvested at December 31, 2016
|
3,531,188
|
|
$
|
25.42
|
|
||
Tax benefits associated with stock-based compensation were
$12.6 million
,
$12.4 million
and
$14.6 million
for the years ended
December 31, 2016
,
2015
and
2014
, respectively. The excess tax benefit for all stock-based compensation is included in the Consolidated Statement of Cash Flows as an operating cash outflow and a financing cash inflow.
Comprehensive Income (Loss).
The following table reflects the accumulated balances of other comprehensive income (loss) (in millions):
Accumulated Other Comprehensive Income (Loss) Attributable to Terex Corporation
|
Cumulative
Translation
Adjustment
|
Derivative
Hedging
Adjustment
|
Debt & Equity
Securities
Adjustment
|
Pension
Liability
Adjustment
|
Accumulated
Other
Comprehensive
Income (Loss)
|
||||||||||||||||
|
Balance at January 1, 2014
|
$
|
(7.9
|
)
|
$
|
2.7
|
|
$
|
—
|
|
$
|
(111.3
|
)
|
$
|
(116.5
|
)
|
|||||
|
Current year change
|
(237.6
|
)
|
(3.4
|
)
|
1.6
|
|
(73.9
|
)
|
(313.3
|
)
|
||||||||||
|
Balance at December 31, 2014
|
(245.5
|
)
|
(0.7
|
)
|
1.6
|
|
(185.2
|
)
|
(429.8
|
)
|
||||||||||
|
Current year change
|
(247.2
|
)
|
3.0
|
|
(7.9
|
)
|
32.3
|
|
(219.8
|
)
|
||||||||||
|
Balance at December 31, 2015
|
(492.7
|
)
|
2.3
|
|
(6.3
|
)
|
(152.9
|
)
|
(649.6
|
)
|
||||||||||
|
Current year change
|
(122.6
|
)
|
(4.7
|
)
|
6.9
|
|
(9.4
|
)
|
(129.8
|
)
|
||||||||||
|
Balance at December 31, 2016
|
$
|
(615.3
|
)
|
$
|
(2.4
|
)
|
$
|
0.6
|
|
$
|
(162.3
|
)
|
$
|
(779.4
|
)
|
|||||
Accumulated Other Comprehensive Income (Loss) Attributable to Noncontrolling Interest
|
Cumulative
Translation
Adjustment
|
Derivative
Hedging
Adjustment
|
Debt & Equity
Securities
Adjustment
|
Pension
Liability
Adjustment
|
Accumulated
Other
Comprehensive
Income (Loss)
|
||||||||||||||||
|
Balance at January 1, 2014
|
$
|
0.9
|
|
$
|
—
|
|
$
|
—
|
|
$
|
—
|
|
$
|
0.9
|
|
|||||
|
Current year change
|
(0.1
|
)
|
—
|
|
—
|
|
—
|
|
(0.1
|
)
|
||||||||||
|
Balance at December 31, 2014
|
0.8
|
|
—
|
|
—
|
|
—
|
|
0.8
|
|
||||||||||
|
Current year change
|
(0.1
|
)
|
—
|
|
—
|
|
—
|
|
(0.1
|
)
|
||||||||||
|
Balance at December 31, 2015
|
0.7
|
|
—
|
|
—
|
|
—
|
|
0.7
|
|
||||||||||
|
Current year change
|
(0.4
|
)
|
—
|
|
—
|
|
—
|
|
(0.4
|
)
|
||||||||||
|
Balance at December 31, 2016
|
$
|
0.3
|
|
$
|
—
|
|
$
|
—
|
|
$
|
—
|
|
$
|
0.3
|
|
|||||
F-53
Accumulated Other Comprehensive Income (Loss)
|
Cumulative
Translation
Adjustment
|
Derivative
Hedging
Adjustment
|
Debt & Equity
Securities
Adjustment
|
Pension
Liability
Adjustment
|
Accumulated
Other
Comprehensive
Income (Loss)
|
||||||||||||||||
|
Balance at January 1, 2014
|
$
|
(7.0
|
)
|
$
|
2.7
|
|
$
|
—
|
|
$
|
(111.3
|
)
|
$
|
(115.6
|
)
|
|||||
|
Current year change
|
(237.7
|
)
|
(3.4
|
)
|
1.6
|
|
(73.9
|
)
|
(313.4
|
)
|
||||||||||
|
Balance at December 31, 2014
|
(244.7
|
)
|
(0.7
|
)
|
1.6
|
|
(185.2
|
)
|
(429.0
|
)
|
||||||||||
|
Current year change
|
(247.3
|
)
|
3.0
|
|
(7.9
|
)
|
32.3
|
|
(219.9
|
)
|
||||||||||
|
Balance at December 31, 2015
|
(492.0
|
)
|
2.3
|
|
(6.3
|
)
|
(152.9
|
)
|
(648.9
|
)
|
||||||||||
|
Current year change
|
(123.0
|
)
|
(4.7
|
)
|
6.9
|
|
(9.4
|
)
|
(130.2
|
)
|
||||||||||
|
Balance at December 31, 2016
|
$
|
(615.0
|
)
|
$
|
(2.4
|
)
|
$
|
0.6
|
|
$
|
(162.3
|
)
|
$
|
(779.1
|
)
|
|||||
As of
December 31, 2016
, accumulated other comprehensive income for the pension liability adjustment and the derivative hedging adjustment are net of a tax benefit of
$59.9 million
and
$0.7 million
, respectively.
Changes in Accumulated Other Comprehensive Income (Loss)
The table below presents changes in AOCI by component for the year ended
December 31, 2016
and
2015
. All amounts are net of tax (in millions).
|
Year ended December 31, 2016
|
Year ended December 31, 2015
|
||||||||||||||||||||||||||||||
|
|
CTA
|
Derivative
Hedging
Adj.
|
Debt &
Equity
Securities
Adj.
|
Pension
Liability
Adj.
|
Total
|
CTA
|
Derivative
Hedging
Adj.
|
Debt &
Equity
Securities
Adj.
|
Pension
Liability
Adj.
|
Total
|
|||||||||||||||||||||
|
Beginning balance
|
$
|
(492.0
|
)
|
$
|
2.3
|
|
$
|
(6.3
|
)
|
$
|
(152.9
|
)
|
$
|
(648.9
|
)
|
$
|
(244.7
|
)
|
$
|
(0.7
|
)
|
$
|
1.6
|
|
$
|
(185.2
|
)
|
$
|
(429.0
|
)
|
|
|
Other comprehensive income before reclassifications
|
(121.1
|
)
|
(5.7
|
)
|
3.9
|
|
(16.1
|
)
|
(139.0
|
)
|
(247.3
|
)
|
9.2
|
|
(7.9
|
)
|
22.7
|
|
(223.3
|
)
|
|||||||||||
|
Amounts reclassified from AOCI
|
(1.9
|
)
|
1.0
|
|
3.0
|
|
6.7
|
|
8.8
|
|
—
|
|
(6.2
|
)
|
—
|
|
9.6
|
|
3.4
|
|
|||||||||||
|
Net Other Comprehensive Income (Loss)
|
(123.0
|
)
|
(4.7
|
)
|
6.9
|
|
(9.4
|
)
|
(130.2
|
)
|
(247.3
|
)
|
3.0
|
|
(7.9
|
)
|
32.3
|
|
(219.9
|
)
|
|||||||||||
|
Ending balance
|
$
|
(615.0
|
)
|
$
|
(2.4
|
)
|
$
|
0.6
|
|
$
|
(162.3
|
)
|
$
|
(779.1
|
)
|
$
|
(492.0
|
)
|
$
|
2.3
|
|
$
|
(6.3
|
)
|
$
|
(152.9
|
)
|
$
|
(648.9
|
)
|
|
Share Repurchases and Dividends
In February 2015, the Company announced authorization by its Board of Directors for the repurchase of up to
$200 million
of the Company’s outstanding shares of common stock. During the year ended December 31, 2016, the Company repurchased
3.5 million
shares for
$81.3 million
under this program. During the year ended December 31, 2015, the Company repurchased
1.9 million
shares for
$50.0 million
. In February 2017, the Company’s Board of Directors announced authorization for the repurchase of up to an additional
$350 million
of the Company’s outstanding shares of common stock. The Company’s Board of Directors declared and paid a dividend of
$0.07
and
$0.06
per share in each quarter of
2016
and 2015, respectively. Additionally, the Company’s Board of Directors declared a dividend of
$0.08
per share in the first quarter of 2017 which will be paid in March 2017.
F-54
NOTE S – LITIGATION AND CONTINGENCIES
General
The Company is involved in various legal proceedings, including product liability, general liability, workers’ compensation liability, employment, commercial and intellectual property litigation, which have arisen in the normal course of operations. The Company is insured for product liability, general liability, workers’ compensation, employer’s liability, property damage and other insurable risk required by law or contract, with retained liability or deductibles. The Company records and maintains an estimated liability in the amount of management’s estimate of the Company’s aggregate exposure for such retained liabilities and deductibles. For such retained liabilities and deductibles, the Company determines its exposure based on probable loss estimations, which requires such losses to be both probable and the amount or range of probable loss to be estimable. The Company believes it has made appropriate and adequate reserves and accruals for its current contingencies and the likelihood of a material loss beyond amounts accrued is remote. The Company believes the outcome of such matters, individually and in aggregate, will not have a material adverse effect on its financial statements as a whole. However, outcomes of lawsuits cannot be predicted and, if determined adversely, could ultimately result in the Company incurring significant liabilities which could have a material adverse effect on its results of operations.
Securities and Stockholder Derivative Lawsuits
The Company has received complaints seeking certification of class action lawsuits as follows:
|
•
|
A consolidated class action complaint for violations of securities laws in the securities lawsuit was filed in the United States District Court, District of Connecticut on November 18, 2010 and is entitled Sheet Metal Workers Local 32 Pension Fund and Ironworkers St. Louis Council Pension Fund, individually and on behalf of all others similarly situated v. Terex Corporation, et al.
|
|
•
|
A stockholder derivative complaint for violation of the Securities and Exchange Act of 1934, breach of fiduciary duty, waste of corporate assets and unjust enrichment was filed on April 12, 2010 in the United States District Court, District of Connecticut and is entitled Peter Derrer, derivatively on behalf of Terex Corporation v. Ronald M. DeFeo, Phillip C. Widman, Thomas J. Riordan, G. Chris Andersen, Donald P. Jacobs, David A. Sachs, William H. Fike, Donald DeFosset, Helge H. Wehmeier, Paula H.J. Cholmondeley, Oren G. Shaffer, Thomas J. Hansen, and David C. Wang, and Terex Corporation.
|
These lawsuits generally cover the period from February 2008 to February 2009 and allege, among other things, that certain of the Company’s SEC filings and other public statements contained false and misleading statements which resulted in damages to the Company, the plaintiffs and the members of the purported class when they purchased the Company’s securities and in the stockholder derivative complaint, that there were breaches of fiduciary duties. The stockholder derivative complaint also alleges waste of corporate assets relating to the repurchase of the Company’s shares in the market and unjust enrichment as a result of securities sales by certain officers and directors. The complaints seek, among other things, unspecified compensatory damages, costs and expenses. As a result, the Company is unable to estimate a possible loss or a range of losses for these lawsuits. The stockholder derivative complaint also seeks amendments to the Company’s corporate governance procedures in addition to unspecified compensatory damages from the individual defendants in its favor.
The Company believes that the allegations in the suits are without merit, and Terex, its directors and the named executives will continue to vigorously defend against them. The Company believes that it has acted, and continues to act, in compliance with federal securities laws and Delaware law with respect to these matters. Accordingly, the Company has filed motions to dismiss the securities lawsuit. The plaintiff in the stockholder derivative lawsuit has agreed with the Company to put this lawsuit on hold pending the outcome of the motion to dismiss in connection with the securities lawsuit.
F-55
Demag Cranes AG Appraisal Proceedings
In connection with the Company’s purchase of Demag Cranes AG (a component of MHPS), certain former shareholders of Demag Cranes AG initiated appraisal proceedings relating to (i) a domination and profit loss transfer agreement between Demag Cranes AG and Terex Germany GmbH & Co. KG (the “DPLA Proceeding”) and (ii) the squeeze out of the former Demag Cranes AG shareholders (the “Squeeze out Proceeding”) against the Company alleging that the Company did not pay fair value for the shares of Demag Cranes AG. The Company believes it did pay fair value for the shares of Demag Cranes AG and that no further payment from the Company to any former shareholders of Demag Cranes AG is required. The initial court ruling in the DPLA Proceeding was in favor of the Company and against the claimants ( i.e. no increase in compensation was owed to the former shareholders). However, the court did rule that the costs of the proceedings, including legal costs for both parties, would need to be borne by Terex. This initial court ruling in the DPLA Proceeding is being appealed. The Squeeze out Proceeding is still in the relatively early stages. While the Company believes the position of the former shareholders of Demag Cranes AG is without merit and is vigorously opposing it, no assurance can be given as to the final resolution of these disputes or that the Company will not ultimately be required to make an additional payment as a result of such disputes, which amount could be material.
Other
The Company is involved in various other legal proceedings, which have arisen in the normal course of its operations. The Company has recorded provisions for estimated losses in circumstances where a loss is probable and the amount or range of possible amounts of the loss is estimable.
Credit Guarantees
Customers of the Company from time to time may fund the acquisition of the Company’s equipment through third-party finance companies. In certain instances, the Company may provide a credit guarantee to the finance company, by which the Company agrees to make payments to the finance company should the customer default. The maximum liability of the Company is generally limited to its customer’s remaining payments due to the finance company at the time of default. In the event of customer default, the Company or the finance company is generally able to recover and dispose of the equipment at a minimum loss, if any, to the Company.
As of
December 31, 2016
and
2015
, the Company’s maximum exposure to such credit guarantees was
$42.3 million
and
$39.8 million
, respectively, including total guarantees issued by a German subsidiary, part of the Cranes segment, of
$16.3 million
and
$19.0 million
, respectively (credit guarantees as of December 31, 2016 and 2015 include
$2.0 million
and
$1.7 million
of guarantees related to discontinued operations, respectively). The terms of these guarantees coincide with the financing arranged by the customer and generally do not exceed
five years
. Given the Company’s position as the original equipment manufacturer and its knowledge of end markets, the Company, when called upon to fulfill a guarantee, generally has been able to liquidate the financed equipment at a minimal loss, if any, to the Company.
There can be no assurance that historical credit default experience will be indicative of future results. The Company’s ability to recover losses experienced from its guarantees may be affected by economic conditions in effect at the time of loss.
Residual Value and Buyback Guarantees
The Company issues residual value guarantees under sales-type leases. A residual value guarantee involves a guarantee that a piece of equipment will have a minimum fair market value at a future date. Maximum exposure for residual value guarantees issued by the Company totaled
$7.1 million
and
3.7 million
as of December 31, 2016 and 2015, respectively. The Company is generally able to mitigate risk associated with these guarantees because the maturity of guarantees is staggered, limiting the amount of used equipment entering the marketplace at any one time.
The Company from time to time guarantees that it will buy equipment from its customers in the future at a stated price if certain conditions are met by the customer. Such guarantees are referred to as buyback guarantees. These conditions generally pertain to the functionality and state of repair of the machine. As of
December 31, 2016
and
2015
, the Company’s maximum exposure pursuant to buyback guarantees was
$3.5 million
and
$6.9 million
, respectively (
$3.2 million
and
$6.6 million
related to discontinued operations, respectively). The Company is generally able to mitigate risk of these guarantees because maturity of the guarantees is staggered, limiting the amount of used equipment entering the marketplace at any one time and through leveraging its access to the used equipment markets provided by the Company’s original equipment manufacturer status.
See Note B – “Basis of Presentation – Revenue Recognition,” for a discussion of revenue recognition on arrangements with buyback guarantees.
F-56
The Company has recorded an aggregate liability within Other current liabilities and Other non-current liabilities in the Consolidated Balance Sheet of
$3.8 million
and
$3.1 million
as of
December 31, 2016
and
2015
, respectively, for the estimated fair value of all guarantees provided.
There can be no assurance that the Company’s historical experience in used equipment markets will be indicative of future results. The Company’s ability to recover losses experienced from its guarantees may be affected by economic conditions in the used equipment markets at the time of loss.
NOTE T – CONSOLIDATING FINANCIAL STATEMENTS
During 2012, the Company sold and issued the
6%
Notes and the
6-1/2%
Notes (collectively the “Notes”) (see Note O – “Long-Term Obligations”). The Notes are jointly and severally guaranteed by the following wholly-owned subsidiaries of the Company (the “Wholly-owned Guarantors”): CMI Terex Corporation, Genie Holdings, Inc., Genie Industries, Inc., Genie International, Inc., Powerscreen Holdings USA Inc., Powerscreen International LLC, Powerscreen North America Inc., Powerscreen USA, LLC, Terex Advance Mixer, Inc., Terex Aerials, Inc., Terex Financial Services, Inc., Terex South Dakota, Inc., Terex USA, LLC, Terex Utilities, Inc. and Terex Washington, Inc. Wholly-owned Guarantors are 100% owned by the Company. All of the guarantees are full and unconditional. The guarantees of the Wholly-owned Guarantors are subject to release in limited circumstances only upon the occurrence of certain customary conditions. No subsidiaries of the Company except the Wholly-owned Guarantors have provided a guarantee of the Notes.
The following summarized condensed consolidating financial information for the Company segregates the financial information of Terex Corporation, the Wholly-owned Guarantors and the non-guarantor subsidiaries. The results and financial position of businesses acquired are included from the dates of their respective acquisitions.
Terex Corporation consists of parent company operations. Subsidiaries of the parent company are reported on the equity basis. Wholly-owned Guarantors combine the operations of the Wholly-owned Guarantor subsidiaries. Subsidiaries of Wholly-owned Guarantors that are not themselves guarantors are reported on the equity basis. Non-guarantor subsidiaries combine the operations of subsidiaries which have not provided a guarantee of the Notes. Subsidiaries of non-guarantor subsidiaries that are guarantors are reported on the equity basis. Debt and goodwill allocated to subsidiaries are presented on a “push-down” accounting basis.
In December 2014, the Company sold a majority interest in one of its wholly-owned guarantor subsidiaries, A.S.V. Inc. ("ASV"). As a result, ASV and its wholly-owned subsidiary were no longer guarantors of the various notes of the Company and were deconsolidated by the Company at December 31, 2014. The changes made to wholly-owned guarantor subsidiaries did not impact the Company's previously reported consolidated net operating results, financial position or cash flows.
The condensed consolidating statements of income (loss) and cash flows for the year ended December 31, 2014 have been retrospectively adjusted to reflect this update to our wholly-owned guarantor subsidiaries as though ASV had been a non-guarantor in all applicable periods presented.
F-57
TEREX CORPORATION
CONDENSED CONSOLIDATING STATEMENT OF INCOME (LOSS)
YEAR ENDED
DECEMBER 31, 2016
(in millions)
|
|
Terex
Corporation
|
Wholly-owned
Guarantors
|
Non-guarantor
Subsidiaries
|
Intercompany
Eliminations
|
Consolidated
|
||||||||||||||
|
Net sales
|
$
|
5.9
|
|
$
|
2,473.6
|
|
$
|
2,741.2
|
|
$
|
(777.6
|
)
|
$
|
4,443.1
|
|
||||
|
Cost of goods sold
|
(5.1
|
)
|
(2,160.4
|
)
|
(2,324.7
|
)
|
759.5
|
|
(3,730.7
|
)
|
|||||||||
|
Gross profit
|
0.8
|
|
313.2
|
|
416.5
|
|
(18.1
|
)
|
712.4
|
|
|||||||||
|
Selling, general and administrative expenses
|
(72.0
|
)
|
(240.4
|
)
|
(389.9
|
)
|
18.1
|
|
(684.2
|
)
|
|||||||||
|
Goodwill and intangible asset impairment
|
—
|
|
(43.4
|
)
|
(132.6
|
)
|
—
|
|
(176.0
|
)
|
|||||||||
|
Income (loss) from operations
|
(71.2
|
)
|
29.4
|
|
(106.0
|
)
|
—
|
|
(147.8
|
)
|
|||||||||
|
Interest income
|
96.9
|
|
68.7
|
|
1.9
|
|
(163.2
|
)
|
4.3
|
|
|||||||||
|
Interest expense
|
(149.2
|
)
|
(8.4
|
)
|
(107.6
|
)
|
163.2
|
|
(102.0
|
)
|
|||||||||
|
Income (loss) from subsidiaries
|
43.5
|
|
8.2
|
|
(4.1
|
)
|
(47.6
|
)
|
—
|
|
|||||||||
|
Other income (expense) – net
|
(56.9
|
)
|
49.5
|
|
(17.8
|
)
|
—
|
|
(25.2
|
)
|
|||||||||
|
Income (loss) from continuing operations before income taxes
|
(136.9
|
)
|
147.4
|
|
(233.6
|
)
|
(47.6
|
)
|
(270.7
|
)
|
|||||||||
|
(Provision for) benefit from income taxes
|
(56.4
|
)
|
43.5
|
|
90.3
|
|
—
|
|
77.4
|
|
|||||||||
|
Income (loss) from continuing operations
|
(193.3
|
)
|
190.9
|
|
(143.3
|
)
|
(47.6
|
)
|
(193.3
|
)
|
|||||||||
|
Income from discontinued operations – net of tax
|
14.3
|
|
6.4
|
|
13.9
|
|
(20.3
|
)
|
14.3
|
|
|||||||||
|
Gain (loss) on disposition of discontinued operations – net of tax
|
0.5
|
|
—
|
|
3.0
|
|
—
|
|
3.5
|
|
|||||||||
|
Net income (loss)
|
(178.5
|
)
|
197.3
|
|
(126.4
|
)
|
(67.9
|
)
|
(175.5
|
)
|
|||||||||
|
Net loss (income) from continuing operations attributable to noncontrolling interest
|
—
|
|
—
|
|
0.3
|
|
—
|
|
0.3
|
|
|||||||||
|
Net loss (income) from discontinued operations attributable to noncontrolling interest
|
—
|
|
—
|
|
(0.9
|
)
|
—
|
|
(0.9
|
)
|
|||||||||
|
Net income (loss) attributable to Terex Corporation
|
$
|
(178.5
|
)
|
$
|
197.3
|
|
$
|
(127.0
|
)
|
$
|
(67.9
|
)
|
$
|
(176.1
|
)
|
||||
|
Comprehensive income (loss), net of tax
|
$
|
(305.9
|
)
|
$
|
195.8
|
|
$
|
(112.9
|
)
|
$
|
(82.7
|
)
|
$
|
(305.7
|
)
|
||||
|
Comprehensive loss (income) attributable to noncontrolling interest
|
—
|
|
—
|
|
(0.2
|
)
|
—
|
|
(0.2
|
)
|
|||||||||
|
Comprehensive income (loss) attributable to Terex Corporation
|
$
|
(305.9
|
)
|
$
|
195.8
|
|
$
|
(113.1
|
)
|
$
|
(82.7
|
)
|
$
|
(305.9
|
)
|
||||
F-58
TEREX CORPORATION
CONDENSED CONSOLIDATING STATEMENT OF INCOME (LOSS)
YEAR ENDED
DECEMBER 31, 2015
(in millions)
|
|
Terex
Corporation
|
Wholly-owned
Guarantors
|
Non-guarantor
Subsidiaries
|
Intercompany
Eliminations
|
Consolidated
|
||||||||||||||
|
Net sales
|
$
|
10.0
|
|
$
|
3,008.0
|
|
$
|
2,928.0
|
|
$
|
(924.3
|
)
|
$
|
5,021.7
|
|
||||
|
Cost of goods sold
|
(8.0
|
)
|
(2,503.5
|
)
|
(2,463.3
|
)
|
924.3
|
|
(4,050.5
|
)
|
|||||||||
|
Gross profit
|
2.0
|
|
504.5
|
|
464.7
|
|
—
|
|
971.2
|
|
|||||||||
|
Selling, general and administrative expenses
|
(26.8
|
)
|
(260.5
|
)
|
(360.2
|
)
|
—
|
|
(647.5
|
)
|
|||||||||
|
Income (loss) from operations
|
(24.8
|
)
|
244.0
|
|
104.5
|
|
—
|
|
323.7
|
|
|||||||||
|
Interest income
|
103.6
|
|
68.7
|
|
1.9
|
|
(170.4
|
)
|
3.8
|
|
|||||||||
|
Interest expense
|
(155.2
|
)
|
(6.5
|
)
|
(116.8
|
)
|
170.4
|
|
(108.1
|
)
|
|||||||||
|
Income (loss) from subsidiaries
|
239.3
|
|
8.6
|
|
(3.0
|
)
|
(244.9
|
)
|
—
|
|
|||||||||
|
Other income (expense) – net
|
(67.7
|
)
|
41.1
|
|
2.9
|
|
—
|
|
(23.7
|
)
|
|||||||||
|
Income (loss) from continuing operations before income taxes
|
95.2
|
|
355.9
|
|
(10.5
|
)
|
(244.9
|
)
|
195.7
|
|
|||||||||
|
(Provision for) benefit from income taxes
|
33.0
|
|
(79.5
|
)
|
(21.0
|
)
|
—
|
|
(67.5
|
)
|
|||||||||
|
Income (loss) from continuing operations
|
128.2
|
|
276.4
|
|
(31.5
|
)
|
(244.9
|
)
|
128.2
|
|
|||||||||
|
Income (loss) from discontinued operations – net of tax
|
17.5
|
|
2.4
|
|
18.6
|
|
(21.1
|
)
|
17.4
|
|
|||||||||
|
Gain (loss) on disposition of discontinued operations – net of tax
|
0.7
|
|
—
|
|
2.7
|
|
—
|
|
3.4
|
|
|||||||||
|
Net income (loss)
|
146.4
|
|
278.8
|
|
(10.2
|
)
|
(266.0
|
)
|
149.0
|
|
|||||||||
|
Net loss (income) from continuing operations attributable to noncontrolling interest
|
—
|
|
—
|
|
0.2
|
|
—
|
|
0.2
|
|
|||||||||
|
Net loss (income) from discontinued operations attributable to noncontrolling interest
|
—
|
|
—
|
|
(3.3
|
)
|
—
|
|
(3.3
|
)
|
|||||||||
|
Net income (loss) attributable to Terex Corporation
|
$
|
146.4
|
|
$
|
278.8
|
|
$
|
(13.3
|
)
|
$
|
(266.0
|
)
|
$
|
145.9
|
|
||||
|
Comprehensive income (loss), net of tax
|
(73.9
|
)
|
277.1
|
|
(166.3
|
)
|
(107.8
|
)
|
(70.9
|
)
|
|||||||||
|
Comprehensive loss (income) attributable to noncontrolling interest
|
—
|
|
—
|
|
(3.0
|
)
|
—
|
|
(3.0
|
)
|
|||||||||
|
Comprehensive income (loss) attributable to Terex Corporation
|
$
|
(73.9
|
)
|
$
|
277.1
|
|
$
|
(169.3
|
)
|
$
|
(107.8
|
)
|
$
|
(73.9
|
)
|
||||
F-59
TEREX CORPORATION
CONDENSED CONSOLIDATING STATEMENT OF INCOME (LOSS)
YEAR ENDED
DECEMBER 31, 2014
(in millions)
|
|
Terex
Corporation
|
Wholly-owned
Guarantors
|
Non-guarantor
Subsidiaries
|
Intercompany
Eliminations
|
Consolidated
|
||||||||||||||
|
Net sales
|
$
|
42.5
|
|
$
|
3,257.0
|
|
$
|
3,210.2
|
|
$
|
(1,025.7
|
)
|
$
|
5,484.0
|
|
||||
|
Cost of goods sold
|
(39.2
|
)
|
(2,679.8
|
)
|
(2,739.2
|
)
|
1,025.7
|
|
(4,432.5
|
)
|
|||||||||
|
Gross profit
|
3.3
|
|
577.2
|
|
471.0
|
|
—
|
|
1,051.5
|
|
|||||||||
|
Selling, general and administrative expenses
|
(29.4
|
)
|
(237.4
|
)
|
(384.7
|
)
|
—
|
|
(651.5
|
)
|
|||||||||
|
Income (loss) from operations
|
(26.1
|
)
|
339.8
|
|
86.3
|
|
—
|
|
400.0
|
|
|||||||||
|
Interest income
|
129.7
|
|
73.8
|
|
3.9
|
|
(201.4
|
)
|
6.0
|
|
|||||||||
|
Interest expense
|
(170.5
|
)
|
(16.6
|
)
|
(137.0
|
)
|
201.4
|
|
(122.7
|
)
|
|||||||||
|
Income (loss) from subsidiaries
|
348.8
|
|
9.4
|
|
(2.9
|
)
|
(355.3
|
)
|
—
|
|
|||||||||
|
Other income (expense) – net
|
(36.1
|
)
|
4.7
|
|
26.7
|
|
—
|
|
(4.7
|
)
|
|||||||||
|
Income (loss) from continuing operations before income taxes
|
245.8
|
|
411.1
|
|
(23.0
|
)
|
(355.3
|
)
|
278.6
|
|
|||||||||
|
(Provision for) benefit from income taxes
|
6.2
|
|
(24.3
|
)
|
(8.5
|
)
|
—
|
|
(26.6
|
)
|
|||||||||
|
Income (loss) from continuing operations
|
252.0
|
|
386.8
|
|
(31.5
|
)
|
(355.3
|
)
|
252.0
|
|
|||||||||
|
Income (loss) from discontinued operations – net of tax
|
8.9
|
|
5.4
|
|
8.0
|
|
(13.4
|
)
|
8.9
|
|
|||||||||
|
Gain (loss) on disposition of discontinued operations – net of tax
|
7.3
|
|
—
|
|
50.7
|
|
0.6
|
|
58.6
|
|
|||||||||
|
Net income (loss)
|
268.2
|
|
392.2
|
|
27.2
|
|
(368.1
|
)
|
319.5
|
|
|||||||||
|
Net loss (income) from continuing operations attributable to noncontrolling interest
|
—
|
|
—
|
|
1.5
|
|
—
|
|
1.5
|
|
|||||||||
|
Net loss (income) from discontinued operations attributable to noncontrolling interest
|
—
|
|
—
|
|
(2.0
|
)
|
—
|
|
(2.0
|
)
|
|||||||||
|
Net income (loss) attributable to Terex Corporation
|
$
|
268.2
|
|
$
|
392.2
|
|
$
|
26.7
|
|
$
|
(368.1
|
)
|
$
|
319.0
|
|
||||
|
Comprehensive income (loss), net of tax
|
$
|
5.7
|
|
$
|
388.8
|
|
$
|
(223.1
|
)
|
$
|
(165.3
|
)
|
$
|
6.1
|
|
||||
|
Comprehensive loss (income) attributable to noncontrolling interest
|
—
|
|
—
|
|
(0.4
|
)
|
—
|
|
(0.4
|
)
|
|||||||||
|
Comprehensive income (loss) attributable to Terex Corporation
|
$
|
5.7
|
|
$
|
388.8
|
|
$
|
(223.5
|
)
|
$
|
(165.3
|
)
|
$
|
5.7
|
|
||||
F-60
TEREX CORPORATION
CONDENSED CONSOLIDATING BALANCE SHEET
DECEMBER 31, 2016
(in millions)
|
|
Terex
Corporation
|
Wholly-owned
Guarantors
|
Non-guarantor
Subsidiaries
|
Intercompany
Eliminations
|
Consolidated
|
||||||||||||||
|
Assets
|
|
|
|
|
|
||||||||||||||
|
Current assets
|
|
|
|
|
|
||||||||||||||
|
Cash and cash equivalents
|
$
|
50.7
|
|
$
|
0.4
|
|
$
|
377.4
|
|
$
|
—
|
|
$
|
428.5
|
|
||||
|
Trade receivables – net
|
5.2
|
|
167.0
|
|
340.3
|
|
—
|
|
512.5
|
|
|||||||||
|
Intercompany receivables
|
28.7
|
|
37.8
|
|
88.8
|
|
(155.3
|
)
|
—
|
|
|||||||||
|
Inventories
|
0.5
|
|
310.6
|
|
542.7
|
|
—
|
|
853.8
|
|
|||||||||
|
Prepaid and other current assets
|
55.3
|
|
71.1
|
|
46.4
|
|
—
|
|
172.8
|
|
|||||||||
|
Current assets held for sale
|
—
|
|
15.1
|
|
717.8
|
|
—
|
|
732.9
|
|
|||||||||
|
Total current assets
|
140.4
|
|
602.0
|
|
2,113.4
|
|
(155.3
|
)
|
2,700.5
|
|
|||||||||
|
Property, plant and equipment – net
|
32.7
|
|
148.4
|
|
123.5
|
|
—
|
|
304.6
|
|
|||||||||
|
Goodwill
|
—
|
|
120.7
|
|
139.0
|
|
—
|
|
259.7
|
|
|||||||||
|
Non-current intercompany receivables
|
1,257.8
|
|
2,917.2
|
|
13.1
|
|
(4,188.1
|
)
|
—
|
|
|||||||||
|
Investment in and advances to (from) subsidiaries
|
4,120.8
|
|
90.9
|
|
94.1
|
|
(4,278.6
|
)
|
27.2
|
|
|||||||||
|
Other assets
|
109.8
|
|
175.8
|
|
257.9
|
|
—
|
|
543.5
|
|
|||||||||
|
Non-current assets held for sale
|
0.1
|
|
119.7
|
|
1,051.5
|
|
—
|
|
1,171.3
|
|
|||||||||
|
Total assets
|
$
|
5,661.6
|
|
$
|
4,174.7
|
|
$
|
3,792.5
|
|
$
|
(8,622.0
|
)
|
$
|
5,006.8
|
|
||||
|
Liabilities and Stockholders’ Equity
|
|
|
|
|
|
|
|
|
|
|
|||||||||
|
Current liabilities
|
|
|
|
|
|
|
|
|
|
|
|||||||||
|
Notes payable and current portion of long-term debt
|
$
|
—
|
|
$
|
0.2
|
|
$
|
13.6
|
|
$
|
—
|
|
$
|
13.8
|
|
||||
|
Trade accounts payable
|
40.3
|
|
197.6
|
|
284.8
|
|
—
|
|
522.7
|
|
|||||||||
|
Intercompany payables
|
4.0
|
|
42.3
|
|
109.0
|
|
(155.3
|
)
|
—
|
|
|||||||||
|
Accruals and other current liabilities
|
62.3
|
|
113.3
|
|
241.1
|
|
—
|
|
416.7
|
|
|||||||||
|
Current liabilities held for sale
|
—
|
|
13.3
|
|
440.5
|
|
—
|
|
453.8
|
|
|||||||||
|
Total current liabilities
|
106.6
|
|
366.7
|
|
1,089.0
|
|
(155.3
|
)
|
1,407.0
|
|
|||||||||
|
Long-term debt, less current portion
|
1,140.4
|
|
—
|
|
421.6
|
|
—
|
|
1,562.0
|
|
|||||||||
|
Non-current intercompany payables
|
2,884.3
|
|
—
|
|
1,303.8
|
|
(4,188.1
|
)
|
—
|
|
|||||||||
|
Other non-current liabilities
|
45.6
|
|
34.8
|
|
124.1
|
|
—
|
|
204.5
|
|
|||||||||
|
Non-current liabilities held for sale
|
—
|
|
—
|
|
312.1
|
|
—
|
|
312.1
|
|
|||||||||
|
Total stockholders’ equity
|
1,484.7
|
|
3,773.2
|
|
541.9
|
|
(4,278.6
|
)
|
1,521.2
|
|
|||||||||
|
Total liabilities, noncontrolling interest and stockholders’ equity
|
$
|
5,661.6
|
|
$
|
4,174.7
|
|
$
|
3,792.5
|
|
$
|
(8,622.0
|
)
|
$
|
5,006.8
|
|
||||
F-61
TEREX CORPORATION
CONDENSED CONSOLIDATING BALANCE SHEET
DECEMBER 31, 2015
(in millions)
|
|
Terex
Corporation
|
Wholly-owned
Guarantors
|
Non-guarantor
Subsidiaries
|
Intercompany
Eliminations
|
Consolidated
|
||||||||||||||
|
Assets
|
|
|
|
|
|
||||||||||||||
|
Current assets
|
|
|
|
|
|
||||||||||||||
|
Cash and cash equivalents
|
$
|
91.7
|
|
$
|
0.2
|
|
$
|
279.3
|
|
$
|
—
|
|
$
|
371.2
|
|
||||
|
Trade receivables – net
|
5.2
|
|
241.7
|
|
456.4
|
|
—
|
|
703.3
|
|
|||||||||
|
Intercompany receivables
|
57.5
|
|
55.3
|
|
64.7
|
|
(177.5
|
)
|
—
|
|
|||||||||
|
Inventories
|
—
|
|
424.2
|
|
639.4
|
|
—
|
|
1,063.6
|
|
|||||||||
|
Prepaid and other current assets
|
108.6
|
|
33.9
|
|
110.0
|
|
—
|
|
252.5
|
|
|||||||||
|
Current assets held for sale
|
—
|
|
17.1
|
|
732.5
|
|
—
|
|
749.6
|
|
|||||||||
|
Total current assets
|
263.0
|
|
772.4
|
|
2,282.3
|
|
(177.5
|
)
|
3,140.2
|
|
|||||||||
|
Property, plant and equipment – net
|
57.9
|
|
145.9
|
|
168.1
|
|
—
|
|
371.9
|
|
|||||||||
|
Goodwill
|
—
|
|
162.2
|
|
296.9
|
|
—
|
|
459.1
|
|
|||||||||
|
Non-current intercompany receivables
|
1,353.8
|
|
2,786.4
|
|
72.9
|
|
(4,213.1
|
)
|
—
|
|
|||||||||
|
Investment in and advances to (from) subsidiaries
|
4,010.2
|
|
94.4
|
|
95.2
|
|
(4,154.5
|
)
|
45.3
|
|
|||||||||
|
Other assets
|
29.2
|
|
104.3
|
|
305.5
|
|
—
|
|
439.0
|
|
|||||||||
|
Non-current assets held for sale
|
—
|
|
29.5
|
|
1,131.0
|
|
—
|
|
1,160.5
|
|
|||||||||
|
Total assets
|
$
|
5,714.1
|
|
$
|
4,095.1
|
|
$
|
4,351.9
|
|
$
|
(8,545.1
|
)
|
$
|
5,616.0
|
|
||||
|
Liabilities and Stockholders’ Equity
|
|
|
|
|
|
|
|
|
|
|
|||||||||
|
Current liabilities
|
|
|
|
|
|
|
|
|
|
|
|||||||||
|
Notes payable and current portion of long-term debt
|
$
|
—
|
|
$
|
0.7
|
|
$
|
65.7
|
|
$
|
—
|
|
$
|
66.4
|
|
||||
|
Trade accounts payable
|
21.4
|
|
222.8
|
|
316.5
|
|
—
|
|
560.7
|
|
|||||||||
|
Intercompany payables
|
3.1
|
|
56.6
|
|
117.8
|
|
(177.5
|
)
|
—
|
|
|||||||||
|
Accruals and other current liabilities
|
59.8
|
|
113.5
|
|
212.2
|
|
—
|
|
385.5
|
|
|||||||||
|
Current liabilities held for sale
|
—
|
|
17.6
|
|
428.4
|
|
—
|
|
446.0
|
|
|||||||||
|
Total current liabilities
|
84.3
|
|
411.2
|
|
1,140.6
|
|
(177.5
|
)
|
1,458.6
|
|
|||||||||
|
Long-term debt, less current portion
|
1,138.1
|
|
1.2
|
|
590.5
|
|
—
|
|
1,729.8
|
|
|||||||||
|
Non-current intercompany payables
|
2,562.3
|
|
—
|
|
1,650.8
|
|
(4,213.1
|
)
|
—
|
|
|||||||||
|
Other non-current liabilities
|
52.0
|
|
35.3
|
|
129.8
|
|
—
|
|
217.1
|
|
|||||||||
|
Non-current liabilities held for sale
|
—
|
|
—
|
|
298.5
|
|
—
|
|
298.5
|
|
|||||||||
|
Total stockholders’ equity
|
1,877.4
|
|
3,647.4
|
|
541.7
|
|
(4,154.5
|
)
|
1,912.0
|
|
|||||||||
|
Total liabilities, noncontrolling interest and stockholders’ equity
|
$
|
5,714.1
|
|
$
|
4,095.1
|
|
$
|
4,351.9
|
|
$
|
(8,545.1
|
)
|
$
|
5,616.0
|
|
||||
F-62
TEREX CORPORATION
CONDENSED CONSOLIDATING STATEMENT OF CASH FLOWS
YEAR ENDED
DECEMBER 31, 2016
(in millions)
|
|
Terex
Corporation
|
Wholly-owned
Guarantors
|
Non-guarantor
Subsidiaries
|
Intercompany
Eliminations
|
Consolidated
|
||||||||||||||
|
Net cash provided by (used in) operating activities
|
$
|
(253.0
|
)
|
$
|
420.7
|
|
$
|
193.6
|
|
$
|
5.7
|
|
$
|
367.0
|
|
||||
|
Cash flows from investing activities
|
|
|
|||||||||||||||||
|
Capital expenditures
|
(2.4
|
)
|
(32.0
|
)
|
(38.6
|
)
|
—
|
|
(73.0
|
)
|
|||||||||
|
Acquisitions, net of cash acquired
|
—
|
|
—
|
|
(7.0
|
)
|
—
|
|
(7.0
|
)
|
|||||||||
|
Proceeds (payments) from disposition of discontinued operations
|
—
|
|
—
|
|
3.5
|
|
—
|
|
3.5
|
|
|||||||||
|
Proceeds from sale of assets
|
0.1
|
|
5.4
|
|
61.7
|
|
—
|
|
67.2
|
|
|||||||||
|
Intercompany investing activities
(1)
|
327.0
|
|
(97.5
|
)
|
(23.4
|
)
|
(206.1
|
)
|
—
|
|
|||||||||
|
Other investing activities, net
|
—
|
|
—
|
|
26.6
|
|
(29.1
|
)
|
(2.5
|
)
|
|||||||||
|
Net cash provided by (used in) investing activities
|
324.7
|
|
(124.1
|
)
|
22.8
|
|
(235.2
|
)
|
(11.8
|
)
|
|||||||||
|
Cash flows from financing activities
|
|
|
|
|
|
|
|
|
|
||||||||||
|
Repayments of debt
|
(1,013.2
|
)
|
(1.7
|
)
|
(271.4
|
)
|
—
|
|
(1,286.3
|
)
|
|||||||||
|
Proceeds from issuance of debt
|
1,013.4
|
|
—
|
|
84.3
|
|
—
|
|
1,097.7
|
|
|||||||||
|
Proceeds from (purchase of) noncontrolling interest, net
|
—
|
|
—
|
|
2.9
|
|
—
|
|
2.9
|
|
|||||||||
|
Intercompany financing activities
(1)
|
—
|
|
(297.1
|
)
|
67.6
|
|
229.5
|
|
—
|
|
|||||||||
|
Share repurchases
|
(82.7
|
)
|
—
|
|
—
|
|
—
|
|
(82.7
|
)
|
|||||||||
|
Dividends paid
|
(30.0
|
)
|
—
|
|
—
|
|
—
|
|
(30.0
|
)
|
|||||||||
|
Other financing activities, net
|
—
|
|
—
|
|
(1.7
|
)
|
—
|
|
(1.7
|
)
|
|||||||||
|
Net cash provided by (used in) financing activities
|
(112.5
|
)
|
(298.8
|
)
|
(118.3
|
)
|
229.5
|
|
(300.1
|
)
|
|||||||||
|
Effect of exchange rate changes on cash and cash equivalents
|
—
|
|
—
|
|
(19.7
|
)
|
—
|
|
(19.7
|
)
|
|||||||||
|
Net increase (decrease) in cash and cash equivalents
|
(40.8
|
)
|
(2.2
|
)
|
78.4
|
|
—
|
|
35.4
|
|
|||||||||
|
Cash and cash equivalents, beginning of period
|
91.6
|
|
3.1
|
|
371.8
|
|
—
|
|
466.5
|
|
|||||||||
|
Cash and cash equivalents, end of period
|
$
|
50.8
|
|
$
|
0.9
|
|
$
|
450.2
|
|
$
|
—
|
|
$
|
501.9
|
|
||||
|
(1)
|
Intercompany investing and financing activities include cash pooling activity between Terex Corporation and Wholly-Owned Guarantors.
|
F-63
TEREX CORPORATION
CONDENSED CONSOLIDATING STATEMENT OF CASH FLOWS
YEAR ENDED
DECEMBER 31, 2015
(in millions)
|
|
Terex
Corporation
|
Wholly-owned
Guarantors
|
Non-guarantor
Subsidiaries
|
Intercompany
Eliminations
|
Consolidated
|
||||||||||||||
|
Net cash provided by (used in) operating activities
|
$
|
(510.0
|
)
|
$
|
647.6
|
|
$
|
277.4
|
|
$
|
(202.1
|
)
|
$
|
212.9
|
|
||||
|
Cash flows from investing activities
|
|
|
|
|
|
|
|
||||||||||||
|
Capital expenditures
|
(1.6
|
)
|
(41.9
|
)
|
(60.3
|
)
|
—
|
|
(103.8
|
)
|
|||||||||
|
Acquisitions, net of cash acquired
|
—
|
|
(52.1
|
)
|
(19.1
|
)
|
—
|
|
(71.2
|
)
|
|||||||||
|
Proceeds from disposition of discontinued operations
|
(3.4
|
)
|
—
|
|
3.2
|
|
—
|
|
(0.2
|
)
|
|||||||||
|
Proceeds from sale of assets
|
(1.0
|
)
|
0.9
|
|
3.2
|
|
—
|
|
3.1
|
|
|||||||||
|
Intercompany investing activities
(1)
|
713.3
|
|
—
|
|
(231.6
|
)
|
(481.7
|
)
|
—
|
|
|||||||||
|
Other investing activities, net
|
—
|
|
—
|
|
33.9
|
|
(34.5
|
)
|
(0.6
|
)
|
|||||||||
|
Net cash provided by (used in) investing activities
|
707.3
|
|
|
(93.1
|
)
|
(270.7
|
)
|
(516.2
|
)
|
|
(172.7
|
)
|
|||||||
|
Cash flows from financing activities
|
|
|
|
|
|
|
|
|
|
||||||||||
|
Repayments of debt
|
(1,317.4
|
)
|
(7.8
|
)
|
(72.6
|
)
|
—
|
|
(1,397.8
|
)
|
|||||||||
|
Proceeds from issuance of debt
|
1,188.7
|
|
—
|
|
274.1
|
|
—
|
|
1,462.8
|
|
|||||||||
|
Proceeds from (purchase of) noncontrolling interest, net
|
—
|
|
—
|
|
(1.2
|
)
|
—
|
|
(1.2
|
)
|
|||||||||
|
Intercompany financing activities
(1)
|
—
|
|
(545.5
|
)
|
(172.8
|
)
|
718.3
|
|
—
|
|
|||||||||
|
Share repurchases
|
(50.8
|
)
|
—
|
|
—
|
|
—
|
|
(50.8
|
)
|
|||||||||
|
Dividends paid
|
(25.8
|
)
|
—
|
|
—
|
|
—
|
|
(25.8
|
)
|
|||||||||
|
Other financing activities, net
|
0.6
|
|
—
|
|
(2.2
|
)
|
—
|
|
(1.6
|
)
|
|||||||||
|
Net cash provided by (used in) financing activities
|
(204.7
|
)
|
(553.3
|
)
|
25.3
|
|
718.3
|
|
(14.4
|
)
|
|||||||||
|
Effect of exchange rate changes on cash and cash equivalents
|
—
|
|
—
|
|
(37.5
|
)
|
—
|
|
(37.5
|
)
|
|||||||||
|
Net increase (decrease) in cash and cash equivalents
|
(7.4
|
)
|
1.2
|
|
(5.5
|
)
|
—
|
|
(11.7
|
)
|
|||||||||
|
Cash and cash equivalents, beginning of period
|
99.0
|
|
1.9
|
|
377.3
|
|
—
|
|
478.2
|
|
|||||||||
|
Cash and cash equivalents, end of period
|
$
|
91.6
|
|
$
|
3.1
|
|
$
|
371.8
|
|
$
|
—
|
|
$
|
466.5
|
|
||||
|
(1)
|
Intercompany investing and financing activities include cash pooling activity between Terex Corporation and Wholly-Owned Guarantors.
|
F-64
TEREX CORPORATION
CONDENSED CONSOLIDATING STATEMENT OF CASH FLOWS
YEAR ENDED
DECEMBER 31, 2014
(in millions)
|
|
Terex
Corporation
|
Wholly-
owned
Guarantors
|
Non-
guarantor
Subsidiaries
|
Intercompany
Eliminations
|
Consolidated
|
||||||||||||||
|
Net cash provided by (used in) operating activities
|
$
|
(113.4
|
)
|
$
|
901.9
|
|
$
|
35.2
|
|
$
|
(413.0
|
)
|
$
|
410.7
|
|
||||
|
Cash flows from investing activities
|
|
|
|
|
|
|
|
|
|
|
|||||||||
|
Capital expenditures
|
(4.4
|
)
|
(31.8
|
)
|
(45.3
|
)
|
—
|
|
(81.5
|
)
|
|||||||||
|
Acquisitions, net of cash acquired
|
—
|
|
—
|
|
(7.4
|
)
|
—
|
|
(7.4
|
)
|
|||||||||
|
Other investments
|
(20.0
|
)
|
—
|
|
—
|
|
—
|
|
(20.0
|
)
|
|||||||||
|
Proceeds (payments) from disposition of discontinued operations
|
31.3
|
|
—
|
|
130.9
|
|
—
|
|
162.2
|
|
|||||||||
|
Proceeds from sale of assets
|
25.0
|
|
12.1
|
|
6.2
|
|
—
|
|
43.3
|
|
|||||||||
|
Intercompany investing activities
(1)
|
363.5
|
|
—
|
|
—
|
|
(363.5
|
)
|
—
|
|
|||||||||
|
Other investing activities, net
|
—
|
|
—
|
|
(1.6
|
)
|
—
|
|
(1.6
|
)
|
|||||||||
|
Net cash provided by (used in) investing activities
|
395.4
|
|
|
(19.7
|
)
|
|
82.8
|
|
(363.5
|
)
|
95.0
|
|
|||||||
|
Cash flows from financing activities
|
|
|
|
|
|
|
|
|
|
|
|||||||||
|
Repayments of debt
|
(1,018.8
|
)
|
(3.2
|
)
|
(779.8
|
)
|
—
|
|
(1,801.8
|
)
|
|||||||||
|
Proceeds from issuance of debt
|
1,011.0
|
|
7.2
|
|
666.0
|
|
—
|
|
1,684.2
|
|
|||||||||
|
Purchase of noncontrolling interest
|
—
|
|
—
|
|
(78.6
|
)
|
—
|
|
(78.6
|
)
|
|||||||||
|
Intercompany financing activities
(1)
|
—
|
|
(888.2
|
)
|
111.7
|
|
776.5
|
|
—
|
|
|||||||||
|
Share repurchases
|
(171.2
|
)
|
—
|
|
—
|
|
—
|
|
(171.2
|
)
|
|||||||||
|
Dividends paid
|
(21.8
|
)
|
—
|
|
—
|
|
—
|
|
(21.8
|
)
|
|||||||||
|
Other financing activities, net
|
1.5
|
|
—
|
|
(9.0
|
)
|
—
|
|
(7.5
|
)
|
|||||||||
|
Net cash provided by (used in) financing activities
|
(199.3
|
)
|
(884.2
|
)
|
(89.7
|
)
|
776.5
|
|
(396.7
|
)
|
|||||||||
|
Effect of exchange rate changes on cash and cash equivalents
|
—
|
|
—
|
|
(38.9
|
)
|
—
|
|
(38.9
|
)
|
|||||||||
|
Net increase (decrease) in cash and cash equivalents
|
82.7
|
|
(2.0
|
)
|
(10.6
|
)
|
—
|
|
70.1
|
|
|||||||||
|
Cash and cash equivalents, beginning of period
|
16.3
|
|
3.9
|
|
387.9
|
|
—
|
|
408.1
|
|
|||||||||
|
Cash and cash equivalents, end of period
|
$
|
99.0
|
|
$
|
1.9
|
|
$
|
377.3
|
|
$
|
—
|
|
$
|
478.2
|
|
||||
|
(1)
|
Intercompany investing and financing activities include cash pooling activity between Terex Corporation and Wholly-Owned Guarantors.
|
F-65
SCHEDULE II – VALUATION AND QUALIFYING ACCOUNTS AND RESERVES
(Amounts in millions)
|
|
|
Additions
|
|
|
|||||||||||||||
|
|
Balance
Beginning
of Year
|
Charges to
Earnings
|
Other (1)
|
Deductions (2)
|
Balance End
of Year
|
||||||||||||||
|
Year ended December 31, 2016
|
|
|
|
|
|
|
|
|
|
|
|||||||||
|
Deducted from asset accounts:
|
|
|
|
|
|
|
|
|
|
|
|||||||||
|
Allowance for doubtful accounts - Current
|
$
|
20.4
|
|
$
|
5.6
|
|
$
|
(5.4
|
)
|
$
|
(4.1
|
)
|
$
|
16.5
|
|
||||
|
Allowance for doubtful accounts - Non-current
|
27.4
|
|
(1.5
|
)
|
(0.4
|
)
|
(0.3
|
)
|
25.2
|
|
|||||||||
|
Reserve for inventory
|
76.8
|
|
37.0
|
|
(10.8
|
)
|
(19.7
|
)
|
83.3
|
|
|||||||||
|
Valuation allowances for deferred tax assets
|
215.1
|
|
(50.8
|
)
|
(15.7
|
)
|
—
|
|
148.6
|
|
|||||||||
|
Totals
|
$
|
339.7
|
|
$
|
(9.7
|
)
|
$
|
(32.3
|
)
|
$
|
(24.1
|
)
|
$
|
273.6
|
|
||||
|
Year ended December 31, 2015
|
|
|
|
|
|
|
|
|
|
|
|||||||||
|
Deducted from asset accounts:
|
|
|
|
|
|
|
|
|
|
|
|||||||||
|
Allowance for doubtful accounts - Current
|
$
|
18.3
|
|
$
|
4.3
|
|
$
|
1.7
|
|
$
|
(3.9
|
)
|
$
|
20.4
|
|
||||
|
Allowance for doubtful accounts - Non-current
|
28.6
|
|
3.2
|
|
(2.1
|
)
|
(2.3
|
)
|
27.4
|
|
|||||||||
|
Reserve for inventory
|
77.9
|
|
18.2
|
|
(6.1
|
)
|
(13.2
|
)
|
76.8
|
|
|||||||||
|
Valuation allowances for deferred tax assets
|
244.0
|
|
(20.6
|
)
|
(8.3
|
)
|
—
|
|
215.1
|
|
|||||||||
|
Totals
|
$
|
368.8
|
|
$
|
5.1
|
|
$
|
(14.8
|
)
|
$
|
(19.4
|
)
|
$
|
339.7
|
|
||||
|
Year ended December 31, 2014
|
|
|
|
|
|
|
|
|
|
|
|||||||||
|
Deducted from asset accounts:
|
|
|
|
|
|
|
|
|
|
|
|||||||||
|
Allowance for doubtful accounts - Current
|
$
|
38.4
|
|
$
|
—
|
|
$
|
(5.7
|
)
|
$
|
(14.4
|
)
|
$
|
18.3
|
|
||||
|
Allowance for doubtful accounts - Non-current
|
29.1
|
|
1.5
|
|
(1.8
|
)
|
(0.2
|
)
|
28.6
|
|
|||||||||
|
Reserve for inventory
|
86.7
|
|
17.6
|
|
(11.8
|
)
|
(14.6
|
)
|
77.9
|
|
|||||||||
|
Valuation allowances for deferred tax assets
|
152.9
|
|
37.9
|
|
53.2
|
|
—
|
|
244.0
|
|
|||||||||
|
Totals
|
$
|
307.1
|
|
$
|
57.0
|
|
$
|
33.9
|
|
$
|
(29.2
|
)
|
$
|
368.8
|
|
||||
|
(1)
|
Primarily represents the impact of foreign currency exchange, business divestitures and other amounts recorded to accumulated other comprehensive income (loss).
|
|
(2)
|
Primarily represents the utilization of established reserves, net of recoveries.
|
F-66
TABLE OF CONTENTS
Part IItem 1. BusinessItem 1A. Risk FactorsItem 1B. Unresolved Staff CommentsItem 2. PropertiesItem 3. Legal ProceedingsItem 4. Mine Safety DisclosurePart IIItem 5. Market For The Registrant S Common Equity Related Stockholder Matters and Issuer Purchases Of Equity SecuritiesItem 6. Selected Financial DataItem 7. Management S Discussion and Analysis Of Financial Condition and Results Of OperationsItem 7A. Quantitative and Qualitative Disclosures About Market RiskItem 8. Financial Statements and Supplementary DataItem 9. Changes in and Disagreements with Accountants on Accounting and Financial DisclosureItem 9A. Controls and ProceduresItem 9B. Other InformationPart IIIItem 10. Directors, Executive Officers and Corporate GovernanceItem 11. Executive CompensationItem 12. Security Ownership Of Certain Beneficial Owners and Management and Related Stockholder MattersItem 13. Certain Relationships and Related Transactions, and Director IndependenceItem 14. Principal Accountant Fees and ServicesPart IVItem 15. Exhibits and Financial Statement SchedulesItem 16. Form 10-k Summary