|
|
|
|
|
|
|
|
|
|
|
|
|
|
|
|
|
|
|
|
|
|
|
|
|
|
|
|
|
|
|
|
|
|
|
|
|
|
|
|
|
|
|
|
|
|
|
|
|
|
|
|
|
|
|
|
Table of Contents
UNITED STATES
SECURITIES AND EXCHANGE COMMISSION
Washington, D.C. 20549
FORM 10-K
Annual Report Pursuant to Section 13 or 15(d)
of the Securities Exchange Act of 1934
For the fiscal year ended:
December 31, 2010
Commission File Number: 1-10853
BB&T CORPORATION
(Exact name of Registrant as specified in its Charter)
| North Carolina | 56-0939887 | |
| (State of Incorporation) | (I.R.S. Employer Identification No.) | |
|
200 West Second Street Winston-Salem, North Carolina |
27101 | |
| (Address of principal executive offices) | (Zip Code) | |
(336) 733-2000
(Registrant’s telephone number, including area code)
Securities Registered Pursuant to Section 12(b) of the Securities Exchange Act of 1934:
|
Title of each class |
Name of each exchange on which registered |
|
| Common Stock, $5 par value | New York Stock Exchange |
Indicate by check mark if the Registrant is a well-known seasoned issuer, as defined in Rule 405 of the Securities Act. YES þ NO ¨
Indicate by check mark if the Registrant is not required to file reports pursuant to Section 13 or Section 15(d) of the Act YES ¨ NO þ
Indicate by check mark whether the Registrant (1) has filed all reports required to be filed by Section 13 or 15(d) of the Securities Exchange Act of 1934 during the preceding 12 months (or for such shorter period that the Registrant was required to file such reports), and (2) has been subject to such filing requirements for the past 90 days. YES þ NO ¨
Indicate by check mark whether the Registrant has submitted electronically and posted on its corporate Web site, if any, every Interactive Data File required to be submitted and posted pursuant to Rule 405 of Regulation S-T (§232.405 of this chapter) during the preceding 12 months (or for such shorter period that the Registrant was required to submit and post such files). Yes þ No ¨
Indicate by check mark if disclosure of delinquent filers pursuant to Item 405 of Regulation S-K is not contained herein, and will not be contained, to the best of Registrant’s knowledge, in definitive proxy or information statements incorporated by references in Part III of this Form 10-K or any amendment to this Form 10-K. þ
Indicate by check mark whether the Registrant is a large accelerated filer, an accelerated filer, a non-accelerated filer, or a smaller reporting company. See the definitions of “large accelerated filer,” “accelerated filer” and “smaller reporting company” in Rule 12b-2 of the Exchange Act.
| Large accelerated filer | þ | Accelerated filer | ¨ | |||
| Non-accelerated filer | ¨ (Do not check if a smaller reporting company) | Smaller reporting company | ¨ | |||
Indicate by check mark whether the Registrant is a shell company (as defined in Rule 12b-2 of the Act). YES ¨ NO þ
At January 31, 2011, the Corporation had 694,603,885 shares of its Common Stock, $5 par value, outstanding. The aggregate market value of voting stock held by nonaffiliates of the Corporation is approximately $18.2 billion (based on the closing price of such stock as of June 30, 2010).
Table of Contents
| Page | ||||||||
|
PART I |
Item 1 |
Overview and Description of Business | 4 | |||||
|
Item 1A |
Risk Factors Related to BB&T’s Business | 4 | ||||||
|
Item 1B |
Unresolved Staff Comments None. |
|||||||
|
Item 2 |
Properties | 29 | ||||||
|
Item 3 |
Legal Proceedings | 148 | ||||||
|
Item 4 |
Removed and Reserved |
|||||||
|
PART II |
Item 5 |
Market for the Registrant’s Common Equity, Related Stockholder Matters and Issuer Purchases of Equity Securities | 30, 87 | |||||
|
Item 6 |
Selected Financial Data | 95 | ||||||
|
Item 7 |
Management’s Discussion and Analysis of Financial Condition and Results of Operations | 42 | ||||||
|
Item 7A |
Market Risk Management | 77 | ||||||
|
Item 8 |
Financial Statements and Supplementary Data | |||||||
| Consolidated Balance Sheets at December 31, 2010 and 2009 | 98 | |||||||
| Consolidated Statements of Income for each of the years in the three-year period ended December 31, 2010 | 99 | |||||||
| Consolidated Statements of Changes in Shareholders’ Equity for each of the years in the three-year period ended December 31, 2010 | 100 | |||||||
| Consolidated Statements of Cash Flows for each of the years in the three-year period ended December 31, 2010 | 102 | |||||||
| Notes to Consolidated Financial Statements | 103 | |||||||
| Report of Independent Registered Public Accounting Firm | 97 | |||||||
| Quarterly Financial Summary for 2010 and 2009 | 94 | |||||||
|
Item 9 |
Changes in and Disagreements with Accountants on Accounting and Financial Disclosure. None. |
|||||||
|
Item 9A |
Controls and Procedures | 96 | ||||||
|
Item 9B |
Other Information None. |
|||||||
|
PART III |
Item 10 |
Directors, Executive Officers and Corporate Governance | * | |||||
|
Item 11 |
Executive Compensation | * | ||||||
|
Item 12 |
Security Ownership of Certain Beneficial Owners and Management and Related Stockholder Matters | * | ||||||
|
Item 13 |
Certain Relationships and Related Transactions, and Director Independence | * | ||||||
|
Item 14 |
Principal Accounting Fees and Services | * | ||||||
|
PART IV |
Item 15 |
Exhibits, Financial Statement Schedules | ||||||
|
(a) |
Financial Statements—See Listing in Item 8 above. | |||||||
|
(b) |
Exhibits | |||||||
|
(c) |
Financial Statement Schedules—None required. | |||||||
2
Table of Contents
| * | For information regarding executive officers, refer to “Executive Officers of BB&T” in Part I hereof. The other information required by Item 10 is incorporated herein by reference to the information that appears under the headings “Proposal 1-Election of Directors”, “Corporate Governance Matters” and “Section 16(a) Beneficial Ownership Reporting Compliance” in the Registrant’s Proxy Statement for the 2011 Annual Meeting of Shareholders. |
| The information required by Item 11 is incorporated herein by reference to the information that appears under the headings “Compensation Discussion and Analysis”, “Compensation of Executive Officers”, “Compensation Committee Report on Executive Compensation”, “Compensation Committee Interlocks and Insider Participation”, and “Compensation of Directors” in the Registrant’s Proxy Statement for the 2011 Annual Meeting of Shareholders. |
| For information regarding the registrant’s securities authorized for issuance under equity compensation plans, refer to “Equity Compensation Plan Information” in Part II hereof. |
| The other information required by Item 12 is incorporated herein by reference to the information that appears under the headings “Security Ownership” and “Compensation of Executive Officers” in the Registrant’s Proxy Statement for the 2011 Annual Meeting of Shareholders. |
| The information required by Item 13 is incorporated herein by reference to the information that appears under the headings “Corporate Governance Matters” and “Transactions with Executive Officers and Directors” in the Registrant’s Proxy Statement for the 2011 Annual Meeting of Shareholders. |
| The information required by Item 14 is incorporated herein by reference to the information that appears under the headings “Fees to Auditors” and “Corporate Governance Matters” in the Registrant’s Proxy Statement for the 2011 Annual Meeting of Shareholders. |
3
Table of Contents
OVERVIEW AND DESCRIPTION OF BUSINESS
General
BB&T Corporation (“BB&T”, “the Company”, “the Corporation” or “the Parent Company”), is a financial holding company headquartered in Winston-Salem, North Carolina. BB&T conducts its business operations primarily through its commercial bank subsidiary, Branch Banking and Trust Company (“Branch Bank”), which has offices in North Carolina, Virginia, Florida, Georgia, Maryland, South Carolina, Alabama, Kentucky, West Virginia, Tennessee, Texas, Washington D.C and Indiana. In addition, BB&T’s operations consist of a federally chartered thrift institution, BB&T Financial, FSB (“BB&T FSB”), and several nonbank subsidiaries, which offer financial services products. Substantially all of the loans made by BB&T’s subsidiaries are to businesses and individuals in these market areas.
Forward-Looking Statements
This Annual Report on Form 10-K contains forward-looking statements with respect to the financial condition, results of operations and businesses of BB&T. These forward-looking statements involve certain risks and uncertainties and are based on the beliefs and assumptions of the management of BB&T and the information available to management at the time that these disclosures were prepared. Factors that may cause actual results to differ materially from those contemplated by such forward-looking statements include, among others, the following:
| · |
general economic or business conditions, either nationally or regionally, may be less favorable than expected, resulting in, among other things, a deterioration in credit quality and/or a reduced demand for credit or other services; |
| · |
changes in the interest rate environment may reduce net interest margins and/or the volumes and values of loans made or held as well as the value of other financial assets held; |
| · |
competitive pressures among depository and other financial institutions may increase significantly; |
| · |
legislative or regulatory changes, including changes resulting from the adoption and implementation of the Dodd-Frank Wall Street Reform and Consumer Protection Act of 2010 (the “Dodd-Frank Act”) and changes in accounting standards, may adversely affect the businesses in which BB&T is engaged; |
| · |
local, state or federal taxing authorities may take tax positions that are adverse to BB&T; |
| · |
reduction in BB&T’s credit ratings; |
| · |
adverse changes may occur in the securities markets; |
| · |
competitors of BB&T may have greater financial resources and develop products that enable them to compete more successfully than BB&T and may be subject to different regulatory standards than BB&T; |
| · |
costs or difficulties related to the integration of the businesses of BB&T and its merger partners may be greater than expected; |
| · |
unpredictable natural or other disasters could have an adverse effect on BB&T in that such events could materially disrupt its operations or the ability or willingness of its customers to access the financial services offered by BB&T; |
| · |
expected cost savings associated with completed mergers and acquisitions may not be fully realized or realized within the expected time frames; and |
| · |
deposit attrition, customer loss and/or revenue loss following completed mergers and acquisitions may be greater than expected. |
Risk Factors Related to BB&T’s Business
Changes in national, regional and local economic conditions could lead to higher loan charge-offs and reduce BB&T’s net income and growth.
BB&T’s business is subject to periodic fluctuations based on national, regional and local economic conditions. These fluctuations are not predictable, cannot be controlled, and may have a material adverse impact on the
4
Table of Contents
Company’s operations and financial condition even if other favorable events occur. BB&T’s banking operations are locally oriented and community-based. Accordingly, the Company expects to continue to be dependent upon local business conditions as well as conditions in the local residential and commercial real estate markets it serves. For example, an increase in unemployment, a decrease in real estate values or increases in interest rates, as well as other factors, could weaken the economies of the communities BB&T serves. Weakness in BB&T’s market area could depress the Company’s earnings and consequently its financial condition because:
| · |
customers may not want or need BB&T’s products or services; |
| · |
borrowers may not be able or willing to repay their loans; |
| · |
the value of the collateral securing loans to borrowers may decline; and |
| · |
the quality of BB&T’s loan portfolio may decline. |
Any of the latter three scenarios could require the Company to charge off a higher percentage of loans and/or increase provisions for credit losses, which would reduce the Company’s net income. For example, beginning in 2007 and continuing through much of 2010, BB&T experienced increasing credit deterioration due to ongoing challenges in the residential real estate markets. This period of credit deterioration combined with flat to declining real estate values resulted in increasing loan charge-offs and higher provisions for credit losses, which negatively impacted BB&T’s net income.
On August 14, 2009, Branch Bank entered into an agreement with the Federal Deposit Insurance Corporation (“FDIC”) to acquire certain assets and assume substantially all of the deposits and certain liabilities of Colonial Bank, an Alabama state-chartered bank headquartered in Montgomery, Alabama (“Colonial”). As a result, Branch Bank acquired a significant portfolio of loans from Colonial. Although Branch Bank marked down the acquired loan portfolio to estimated fair value, there is no assurance that the acquired loans will not suffer further deterioration in value resulting in additional charge-offs to this loan portfolio. Fluctuations in national, regional and local economic conditions, including those related to local residential real estate, commercial real estate and construction markets may increase the level of charge-offs on the loan portfolio that was acquired in the acquisition of Colonial and correspondingly reduce BB&T’s net income. These fluctuations are not predictable, cannot be controlled and may have a material adverse impact on BB&T’s operations and financial condition even if other favorable events occur. Although Branch Bank entered into loss sharing agreements with the FDIC, which provide that a significant portion of losses related to specified loan portfolios that were acquired in connection with the acquisition of Colonial will be borne by the FDIC, Branch Bank is not protected from all losses resulting from charge-offs with respect to those specified loan portfolios. Additionally, the loss sharing agreements have limited terms; therefore, any charge-off of related losses that Branch Bank experiences after the term of the loss sharing agreements will not be reimbursed by the FDIC and will negatively impact BB&T’s net income. In connection with the acquisition of Colonial, Branch Bank also acquired certain loan portfolios that are not subject to the loss sharing agreements. Any charge-offs related to these loan portfolios will be borne by Branch Bank in full and would also negatively impact BB&T’s net income.
Weakness in the markets for residential or commercial real estate, including the secondary residential mortgage loan markets, could reduce BB&T’s net income and profitability.
Since 2007, softening residential housing markets, increasing delinquency and default rates, and increasingly volatile and constrained secondary credit markets have been negatively impacting the mortgage industry. BB&T’s financial results have been adversely affected by changes in real estate values, primarily in Georgia, Florida and metro Washington, D.C., with some deterioration in the coastal areas of the Carolinas. Decreases in real estate values have adversely affected the value of property used as collateral for loans and investments in BB&T’s portfolio. The poor economic conditions experienced in 2007 through 2010 resulted in decreased demand for real estate loans, and BB&T’s net income and profits have suffered as a result.
The declines in home prices in many markets across the U.S., including a number of markets in BB&T’s banking footprint (primarily in Georgia, Florida, and metro Washington, D.C., with some deterioration in the coastal areas of the Carolinas), along with the reduced availability of mortgage credit, also has resulted in increases in delinquencies and losses in BB&T’s portfolio of loans related to residential real estate, including its acquisition, development and construction loan portfolio. Further declines in home prices within BB&T’s banking
5
Table of Contents
footprint (including markets that to date have not experienced significant declines) coupled with the continued impact of the economic recession and high unemployment levels could drive losses beyond the levels provided for in BB&T’s allowance for loan losses. In that event, BB&T’s future earnings would be adversely affected.
Significant ongoing disruption in the secondary market for residential mortgage loans has limited the market for and liquidity of most mortgage loans other than conforming Fannie Mae, Freddie Mac and Ginnie Mae loans. The effects of ongoing mortgage market challenges, combined with the ongoing correction in residential real estate market prices and reduced levels of home sales has resulted in price reductions in single family home values, adversely affecting the value of collateral securing mortgage loans held and mortgage loan originations. Continued declines in real estate values and home sales volumes within BB&T’s banking footprint, and financial stress on borrowers as a result of job losses, or other factors, could have further adverse effects on borrowers that result in higher delinquencies and greater charge-offs in future periods, which would adversely affect BB&T’s financial condition and results of operations.
The Colonial acquisition has increased Branch Bank’s commercial real estate and construction loan portfolio, which have a greater credit risk than residential mortgage loans.
With the acquisition of the Colonial loan portfolio, the commercial real estate loan and construction loan portfolios have become a larger portion of Branch Bank’s total loan portfolio than it was prior to the Colonial acquisition. This type of lending is generally considered to have more complex credit risks than traditional single-family residential lending, because the principal is concentrated in a limited number of loans with repayment dependent on the successful operation of the related real estate or construction project. Consequently, these loans are more sensitive to the current adverse conditions in the real estate market and the general economy. These loans are generally less predictable, more difficult to evaluate and monitor, and collateral may be more difficult to dispose of in a market decline. However, the negative economic aspects of these risks are substantially reduced as a result of the FDIC loss sharing agreements.
Increases in FDIC insurance premiums and changes to deposit insurance assessment methodologies may adversely affect BB&T’s net income and profitability.
During 2008 and continuing in 2010, higher levels of bank failures have dramatically increased resolution costs of the FDIC and depleted the deposit insurance fund. In addition, the FDIC instituted two temporary programs to further insure customer deposits at FDIC insured banks: deposit accounts are now insured up to $250,000 per customer (up from $100,000) and noninterest-bearing transactional accounts are currently fully insured (unlimited coverage). These programs have placed additional stress on the deposit insurance fund. In order to maintain a strong funding position and restore reserve ratios of the deposit insurance fund, the FDIC has increased assessment rates of insured institutions. On November 12, 2009, the FDIC adopted a rule that required banks to prepay three years’ worth of estimated deposit insurance premiums by December 31, 2009. BB&T is generally unable to control the amount of premiums that the Company is required to pay for FDIC insurance. The Dodd-Frank Act also imposes additional assessments and costs with respect to deposits, requiring the FDIC to impose deposit insurance assessments based on total assets rather than total deposits, as well as making permanent the increase of deposit insurance to $250,000 and providing for full insurance of non-interest bearing transaction accounts beginning December 31, 2010, for two years. For additional information regarding changes with respect to deposit insurance assessments, see “Regulatory Considerations” below. These announced increases, legislative and regulatory changes and any future increases or required prepayments of FDIC insurance premiums may adversely impact BB&T’s earnings and financial condition. If there are additional bank or financial institution failures, or the cost of resolving prior failures exceeds expectations, the Company may be required to pay even higher FDIC premiums than the recently increased levels.
Market developments may adversely affect BB&T’s industry, business and results of operations.
Significant declines in the housing market, with falling home prices and increasing foreclosures and unemployment, have resulted in significant write-downs of asset values by many financial institutions, including government-sponsored entities and major commercial and investment banks. These write-downs, initially of mortgage-backed securities but spreading to credit default swaps and other derivative securities, caused many financial institutions to seek additional capital, to merge with larger and stronger institutions and, in some cases,
6
Table of Contents
to fail. BB&T has produced quarterly earnings during 2009 and 2010; however, during this time BB&T has experienced significant challenges, its credit quality has deteriorated and its net income and results of operations have been adversely impacted. Reflecting concern about the stability of the financial markets generally and the strength of counterparties, many lenders and institutional investors have reduced, and in some cases, ceased to provide funding to borrowers including other financial institutions. Although to date BB&T has performed relatively well during the financial crisis and current economic recovery as compared with the Company’s peers and several of the largest financial institutions, BB&T is part of the financial system and a systemic lack of available credit, a lack of confidence in the financial sector, increased volatility in the financial markets and/or reduced business activity could materially adversely affect BB&T’s business, financial condition and results of operations.
The capital and credit markets have experienced unprecedented levels of volatility, which could jeopardize BB&T’s overall liquidity and capitalization.
During the economic downturn, the capital and credit markets experienced extended volatility and disruption. In some cases, the markets produced downward pressure on stock prices and credit capacity for certain issuers without regard to those issuers’ underlying financial strength. If these levels of market disruption and volatility continue, worsen or abate and then arise at a later date, BB&T’s ability to access capital could be materially impaired. BB&T’s inability to access the capital markets could constrain the Company’s ability to make new loans, to meet the Company’s existing lending commitments and, ultimately jeopardize the Company’s overall liquidity and capitalization.
BB&T’s liquidity could be impaired by an inability to access the capital markets, an unforeseen outflow of cash or a reduction in the credit ratings for BB&T or its subsidiaries.
Liquidity is essential to BB&T’s businesses. Due to circumstances that BB&T may be unable to control, such as a general market disruption or an operational problem that affects third parties or BB&T, BB&T’s liquidity could be impaired by an inability to access the capital markets or an unforeseen outflow of cash.
BB&T’s credit ratings are also important to its liquidity. The major credit rating agencies downgraded BB&T’s credit ratings during 2009 and 2010. These rating agencies regularly evaluate BB&T and its subsidiaries, and their ratings are based on a number of factors, including the financial strength of BB&T and its subsidiaries, as well as factors not entirely within BB&T’s control, including conditions affecting the financial services industry generally. In light of the difficulties in the financial services industry and the housing and financial markets, there can be no assurance that BB&T will maintain its current ratings. A reduction in BB&T’s credit ratings could adversely affect BB&T’s liquidity and competitive position, increase its borrowing costs, limit its access to the capital markets or trigger unfavorable contractual obligations.
The soundness of other financial institutions could adversely affect BB&T.
Financial services institutions are interrelated as a result of trading, clearing, counterparty, or other relationships. BB&T has exposure to many different industries and counterparties, and BB&T and certain of its subsidiaries routinely execute transactions with counterparties in the financial services industry, including brokers and dealers, commercial banks, investment banks, mutual and hedge funds, and other institutional clients. Many of these transactions expose the Company to credit risk in the event of default of its counterparty or client. In addition, the Company’s credit risk may be exacerbated when collateral is liquidated at prices not sufficient to recover the full amount of the loan or derivative exposure due BB&T. These types of losses could materially and adversely affect BB&T’s results of operations or financial condition.
Changes in interest rates may have an adverse effect on BB&T’s profitability.
BB&T’s earnings and financial condition are dependent to a large degree upon net interest income, which is the difference between interest earned from loans and investments and interest paid on deposits and borrowings. The narrowing of interest rate spreads, meaning the difference between interest rates earned on loans and investments and the interest rates paid on deposits and borrowings, could adversely affect BB&T’s earnings and financial condition. The Company cannot control or predict with certainty changes in interest rates. Regional and
7
Table of Contents
local economic conditions, competitive pressures and the policies of regulatory authorities, including monetary policies of the Federal Reserve Board, affect interest income and interest expense. The Company has ongoing policies and procedures designed to manage the risks associated with changes in market interest rates. However, changes in interest rates still may have an adverse effect on BB&T’s profitability. For example, high interest rates could adversely affect the Company’s mortgage banking business because higher interest rates could cause customers to apply for fewer mortgage refinancings or purchase mortgages.
Changes in banking laws could have a material adverse effect on BB&T.
BB&T is extensively regulated under federal and state banking laws and regulations that are intended primarily for the protection of depositors, federal deposit insurance funds and the banking system as a whole. In addition, the Company is subject to changes in federal and state laws as well as changes in banking and credit regulations, and governmental economic and monetary policies. BB&T cannot predict whether any of these changes may adversely and materially affect the Company. The current regulatory environment for financial institutions entails significant potential increases in compliance requirements and associated costs, including those related to consumer credit, with a focus on mortgage lending. For example, the enactment of the Dodd-Frank Act represents a significant overhaul of many aspects of the regulation of the financial services industry, which could result in higher compliance costs and otherwise materially adversely affect BB&T’s business, financial condition or results of operations. See “Regulatory Considerations” below and the immediately following risk factor for additional information regarding the Dodd-Frank Act and its potential impact upon BB&T and its subsidiaries.
Federal and state banking regulators also possess broad powers to take supervisory actions as they deem appropriate. These supervisory actions may result in higher capital requirements, higher insurance premiums and limitations on BB&T’s activities that could have a material adverse effect on the Company’s business and profitability.
The passage of the Dodd-Frank Act may result in lower revenues, higher costs and ratings downgrades.
On July 21, 2010, President Obama signed into law the Dodd-Frank Act. The Dodd-Frank Act represents a significant overhaul of many aspects of the regulation of the financial services industry, addressing, among other things, systemic risk, capital adequacy, deposit insurance assessments, consumer financial protection, interchange fees, derivatives, lending limits, and changes among the bank regulatory agencies. Many of these provisions are subject to further study, rule making, and the discretion of regulatory bodies, such as the Financial Stability Oversight Council, which will regulate the systemic risk of the financial system. Due to BB&T’s size, the Company will be designated as “systemically significant” to the financial health of the U.S. economy and, as a result, may be subject to additional regulations. BB&T cannot predict the effect that compliance with the Dodd-Frank Act or any implementing regulations will have on BB&T’s businesses or its ability to pursue future business opportunities. Additional regulations resulting from the Dodd-Frank Act may materially adversely affect BB&T’s business, financial condition or results of operations. See “Regulatory Considerations” below for additional information regarding the Dodd-Frank Act and its impact upon BB&T and its subsidiaries.
The provisions of the Dodd Frank Act restricting bank interchange fees, and any rules promulgated thereunder, may negatively impact BB&T’s revenues and earnings.
Under the Dodd-Frank Act, the Federal Reserve must adopt rules regarding the interchange fees that may be charged with respect to electronic debit transactions, to take effect one year after enactment. The limits to be placed on debit interchange fees may significantly reduce BB&T’s debit card interchange revenues. Interchange fees, or “swipe” fees, are charges that merchants pay to BB&T and other credit card companies and card-issuing banks for processing electronic payment transactions. The Dodd-Frank Act provides the Federal Reserve with authority over interchange fees received or charged by a card issuer, requires that fees must be “reasonable and proportional” to the costs of processing such transactions. Although final rules have not yet been adopted, this provision of the Dodd-Frank Act and the applicable rules ultimately promulgated thereunder are expected to cause significant reductions in future card-fee revenues generated by BB&T, while also creating meaningful compliance costs. See “Regulatory Considerations” below for additional information regarding the limits on interchange fees imposed under the Dodd-Frank Act.
8
Table of Contents
Recently enacted consumer protection regulations related to automated overdraft payment programs could adversely affect BB&T’s business operations, net income and profitability.
The Federal Reserve and FDIC recently enacted consumer protection regulations related to automated overdraft payment programs offered by financial institutions, which are described below under the heading “Regulatory Considerations—Automated Overdraft Payment Regulation.” BB&T has implemented, and is in the process of further implementing, changes to its business practices relating to overdraft payment programs in order to comply with these regulations.
For the years ended December 31, 2010 and December 31, 2009, Branch Bank’s overdraft and insufficient funds fees have represented a significant amount of non-interest fees collected by Branch Bank. Implementing the changes required by these regulations will decrease the amount of fees Branch Bank receives for automated overdraft payment services and adversely impact BB&T’s non-interest income. Complying with these regulations has resulted in increased operational costs for BB&T and Branch Bank, which may continue to rise. In addition, BB&T may be placed at a competitive disadvantage to the extent that its competitors are not subject to the FDIC’s automated overdraft payment program regulations. The actual impact of these regulations in future periods could vary due to a variety of factors, including changes in customer behavior, economic conditions and other factors, which could adversely affect BB&T’s business operations, net income and profitability.
BB&T may be subject to more stringent capital requirements which could diminish its ability to pay dividends or require the Company to reduce its operations.
The Dodd-Frank Act requires federal banking agencies to establish more stringent risk-based capital requirements and leverage limits applicable to banks and bank holding companies. Under the legislation, federal banking agencies are required to develop capital requirements that address systemically risky activities. The effect of these capital rules will disallow trust preferred securities from counting as Tier 1 capital at the holding company level for entities with greater than $15 billion in assets, with a three-year phase-in period beginning on January 1, 2013. These requirements, and any other new regulations, including those that may be imposed as a result of the requirements established by the Basel Committee on Banking Supervision, could adversely affect BB&T’s ability to pay dividends, or could require BB&T to reduce business levels or to raise capital, including ways that may adversely affect its results of operations or financial condition.
BB&T may experience significant competition in its market area, which may reduce the Company’s customer base.
There is intense competition among commercial banks in BB&T’s market area. In addition, BB&T competes with other providers of financial services, such as savings and loan associations, credit unions, consumer finance companies, securities firms, insurance companies, commercial finance and leasing companies, the mutual funds industry, full-service brokerage firms and discount brokerage firms, some of which are subject to less extensive regulations than BB&T is with respect to the products and services they provide.
Some of BB&T’s larger competitors, including certain national banks that have a significant presence in BB&T’s market area, may have greater capital and resources than BB&T, may have higher lending limits and may offer products and services not offered by BB&T. Although BB&T remains strong, stable and well capitalized, management cannot predict the reaction of customers and other third parties with which BB&T conducts business with respect to the strength of BB&T relative to its competitors, including its larger competitors. Any potential adverse reactions to BB&T’s financial condition or status in the marketplace, as compared to its competitors, could limit BB&T’s ability to attract and retain customers and to compete for new business opportunities. The inability to attract and retain customers or to effectively compete for new business may have a material and adverse effect on BB&T’s financial condition and results of operations.
BB&T also experiences competition from a variety of institutions outside of the Company’s market area. Some of these institutions conduct business primarily over the Internet and may thus be able to realize certain cost savings and offer products and services at more favorable rates and with greater convenience to the customer who can pay bills and transfer funds directly without going through a bank. This “disintermediation” could result in the loss of fee income, as well as the loss of customer deposits and income generated from those deposits. In addition, changes in consumer spending and saving habits could adversely affect BB&T’s operations, and the Company may be unable to timely develop competitive new products and services in response to these changes.
9
Table of Contents
Maintaining or increasing BB&T’s market share may depend on lowering prices and market acceptance of new products and services.
BB&T’s success depends, in part, on its ability to adapt its products and services to evolving industry standards. There is increasing pressure to provide products and services at lower prices. Lower prices can reduce BB&T’s net interest margin and revenues from its fee-based products and services. In addition, the widespread adoption of new technologies, including internet banking services, mobile phone applications and advanced ATM functionality could require BB&T to make substantial expenditures to modify or adapt its existing products and services. Also, these and other capital investments in BB&T’s business may not produce expected growth in earnings anticipated at the time of the expenditure. BB&T may not be successful in introducing new products and services, achieving market acceptance of its products and services, anticipating or reacting to consumers’ changing technological preferences or developing and maintaining loyal customers.
BB&T has expanded operations into new geographic areas as a result of the Colonial acquisition, and the inability to continue to effectively compete in these new markets could adversely affect BB&T’s business.
Portions of the market areas served by Colonial, including market areas in Alabama, Florida and Texas, are areas in which BB&T historically conducted limited or no banking activities. Although BB&T has completed the operational and systems integration associated with the assets acquired in the Colonial transaction, BB&T must continue to effectively integrate these new markets to retain and expand the business previously conducted by Colonial. While BB&T management believes it has to date competed effectively in these new markets, the ability to strengthen and further enhance market presence will remain dependent upon BB&T’s ability to understand the local market and competitive dynamics and identify and retain certain employees from Colonial who know their markets better than BB&T.
Acts or threats of terrorism and political or military actions taken by the United States or other governments could adversely affect general economic or industry conditions.
Geopolitical conditions may affect BB&T’s earnings. Acts or threats of terrorism and political or military actions taken by the United States or other governments in response to terrorism, or similar activity, could adversely affect general economic or industry conditions.
Unpredictable catastrophic events could have a material adverse effect on BB&T.
The occurrence of catastrophic events such as hurricanes, tropical storms, earthquakes, pandemic disease, windstorms, floods, severe winter weather (including snow, freezing water, ice storms and blizzards), fires and other catastrophes could adversely affect BB&T’s consolidated financial condition or results of operations. Unpredictable natural and other disasters could have an adverse effect on the Company in that such events could materially disrupt its operations or the ability or willingness of its customers to access the financial services offered by BB&T. The Company’s property and casualty insurance operations also expose it to claims arising out of catastrophes. The incidence and severity of catastrophes are inherently unpredictable. Although the Company carries insurance to mitigate its exposure to certain catastrophic events, these events could nevertheless reduce BB&T’s earnings and cause volatility in its financial results for any fiscal quarter or year and have a material adverse effect on BB&T’s financial condition and/or results of operations.
BB&T faces significant operational risks related to activities, which could expose it to negative publicity, litigation and/or regulatory action.
BB&T is exposed to many types of risks, including operational, reputational, legal and compliance risk, the risk of fraud or theft by employees or outsiders, unauthorized transactions by employees or operational errors, including clerical or record-keeping errors or those resulting from faulty or disabled computer or telecommunications systems. Negative public opinion can result from BB&T’s actual or alleged conduct in any number of activities, including lending practices, corporate governance and acquisitions, activities related to asset sales and balance sheet management and from actions taken by government regulators and community organizations in response to those activities. Negative public opinion can adversely affect BB&T’s ability to attract and keep customers and can expose it to litigation and regulatory action.
10
Table of Contents
Because the nature of the financial services business involves a high volume of transactions, certain errors may be repeated or compounded before they are discovered and successfully rectified. BB&T’s necessary dependence upon automated systems to record and process its transaction volume may further increase the risk that technical flaws or employee tampering or manipulation of those systems will result in losses that are difficult to detect. BB&T also may be subject to disruptions of its operating systems arising from events that are wholly or partially beyond its control (for example, computer viruses or electrical or telecommunications outages), which may give rise to disruption of service to customers and to financial loss or liability. BB&T is further exposed to the risk that its external vendors may be unable to fulfill their contractual obligations (or will be subject to the same risk of fraud or operational errors by their respective employees as is BB&T) and to the risk that BB&T’s (or its vendors’) business continuity and data security systems prove to be inadequate.
BB&T’s reported financial results are impacted by management’s selection of accounting methods and certain assumptions and estimates.
BB&T’s accounting policies and methods are fundamental to the way the Company records and reports its financial condition and results of operations. The Company’s management must exercise judgment in selecting and applying many of these accounting policies and methods so they comply with generally accepted accounting principles and reflect management’s judgment of the most appropriate manner to report BB&T’s financial condition and results. In some cases, management must select the accounting policy or method to apply from two or more alternatives, any of which may be reasonable under the circumstances, yet may result in the Company reporting materially different results than would have been reported under a different alternative.
Certain accounting policies are critical to presenting BB&T’s financial condition and results. They require management to make difficult, subjective or complex judgments about matters that are uncertain. Materially different amounts could be reported under different conditions or using different assumptions or estimates. These critical accounting policies include: the allowance for credit losses; the determination of fair value for financial instruments; the valuation of goodwill and other intangible assets; the accounting for pension and postretirement benefits and the accounting for income taxes. Because of the uncertainty of estimates involved in these matters, the Company may be required to do one or more of the following: significantly increase the allowance for credit losses and/or sustain credit losses that are significantly higher than the reserve provided; recognize significant impairment on its financial instruments, goodwill and other intangible asset balances; or significantly increase its liabilities for taxes or pension and post retirement benefits.
Prior to its acquisition, Colonial was the subject of several regulatory investigations and a criminal investigation and these investigations, which are ongoing, may require significant resources and management attention.
Prior to its acquisition, Colonial was the subject of a federal criminal investigation relating to the bank’s mortgage warehouse lending division and related irregularities. Colonial also received subpoenas from the Special Inspector General for the Troubled Asset Relief Program and the SEC. Although the assets and liabilities that the FDIC determined are related to alleged fraudulent or criminal activities were excluded from the acquisition of Colonial, BB&T has cooperated with the authorities as appropriate (and expects to continue to do so), including providing information about Colonial that is now in BB&T’s possession. These efforts may be costly and may divert the attention of management.
BB&T’s business could suffer if it fails to attract and retain skilled people.
BB&T’s success depends, in large part, on its ability to attract and retain key people. Competition for the best people in most activities in which the Company engages can be intense. The Dodd-Frank Act provides for the implementation of a variety of corporate governance and compensation practices applicable to all public companies, including BB&T, which may impact certain of BB&T’s executive officers and employees. These provisions include, but are not limited to, requiring companies to “claw back” incentive compensation under certain circumstances, provide stockholders the opportunity to cast a non-binding vote on executive compensation, to consider the independence of compensation advisors and new executive compensation disclosure
11
Table of Contents
requirements. Such provisions with respect to compensation, in addition to other competitive pressures, may have an adverse effect on the ability of BB&T to attract and retain skilled personnel, resulting in BB&T not being able to hire the best people or to retain them.
BB&T relies on other companies to provide certain key components of its business infrastructure.
Third party vendors provide certain key components of BB&T’s business infrastructure such as internet connections, network access and mutual fund distribution. While BB&T has selected these third party vendors carefully, its does not control their operations. Any problems caused by these third parties, including those which result from their failure to provide services for any reason or their poor performance of services, could adversely affect BB&T’s ability to deliver products and services to its customers and otherwise to conduct its business. Replacing these third party vendors could also entail significant delay and expense.
Significant litigation could have a material adverse effect on BB&T.
BB&T faces legal risks in its business, and the volume of claims and amount of damages and penalties claimed in litigation and regulatory proceedings against financial institutions remain high. Substantial legal liability or significant regulatory action against BB&T may have material adverse financial effects or cause significant reputational harm to BB&T, which in turn could seriously harm BB&T’s business prospects.
BB&T faces systems failure risks as well as security risks, including “hacking” and “identity theft.”
The computer systems and network infrastructure BB&T and others use could be vulnerable to unforeseen problems. These problems may arise in both the Company’s internally developed systems and the systems of its third-party service providers. The Company’s operations are dependent upon its ability to protect computer equipment against damage from fire, power loss or telecommunication failure. Any damage or failure that causes an interruption in the Company’s operations could adversely affect BB&T’s business and financial results. In addition, the Company’s computer systems and network infrastructure present security risks, and could be susceptible to hacking or identity theft.
Differences in interpretation of tax laws and regulations may adversely impact BB&T’s financial statements.
Local, state or federal tax authorities may interpret tax laws and regulations differently than BB&T and challenge tax positions that BB&T has taken on its tax returns. This may result in differences in the treatment of revenues, deductions or credits, and/or differences in the timing of these items. The differences in treatment may result in the payment of additional taxes, interest or penalties that could have a material adverse effect on BB&T’s performance.
Changes in accounting standards could materially impact BB&T’s financial statements.
From time to time accounting standards setters change the financial accounting and reporting standards that govern the preparation of BB&T’s financial statements. These changes can be hard to predict and can materially impact how the Company records and reports its financial condition and results of operations. In some cases, the Company could be required to apply a new or revised standard retroactively, resulting in changes to previously reported financial results, or a cumulative charge to retained earnings.
BB&T may not be able to successfully integrate bank or nonbank mergers and acquisitions.
Difficulties may arise in the integration of the business and operations of bank holding companies, banks and other nonbank entities BB&T acquires and, as a result, the Company may not be able to achieve the cost savings and synergies that it expects will result from such transactions. Achieving cost savings is dependent on consolidating certain operational and functional areas, eliminating duplicative positions and terminating certain agreements for outside services. Additional operational savings are dependent upon the integration of the acquired or merged entity’s businesses with BB&T or one of BB&T’s subsidiaries, the conversion of core operating systems, data systems and products and the standardization of business practices. Complications or difficulties in the conversion of the core operating systems, data systems and products may result in the loss of customers, damage to BB&T’s reputation within the financial services industry, operational problems, one-time
12
Table of Contents
costs currently not anticipated or reduced cost savings resulting from such mergers or acquisitions. Annual cost savings in each such transaction may be materially less than anticipated if the holding company, bank merger or nonbank merger or acquisition is delayed unexpectedly, the integration of operations is delayed beyond what is anticipated or the conversion to a single data system is not accomplished on a timely basis.
Difficulty in integrating an acquired company may cause the Company not to realize expected revenue increases, cost savings, increases in geographic or product presence and/or other projected benefits from the acquisition. The integration could result in higher than expected deposit attrition, loss of key employees, disruption of BB&T’s businesses or the businesses of the acquired company, or otherwise adversely affect the Company’s ability to maintain relationships with customers and employees or achieve the anticipated benefits of the acquisition. Also, the negative effect of any divestitures required by regulatory authorities in acquisitions or business combinations may be greater than expected.
BB&T may not receive the regulatory approvals required to complete a bank merger.
BB&T must generally receive federal and/or state regulatory approvals before it can acquire a bank or bank holding company. In determining whether to approve a proposed bank acquisition, bank regulators will consider, among other factors, the effect of the acquisition on competition, financial condition and future prospects, including current and projected capital ratios and levels, the competence, experience and integrity of management and record of compliance with laws and regulations, the convenience and needs of the communities to be served, including the acquiring institution’s record of compliance under the Community Reinvestment Act, and the effectiveness of the acquiring institution in combating money laundering activities. In addition, BB&T cannot be certain when or if, or on what terms and conditions, any required regulatory approvals will be granted. In specific cases the Company may be required to sell banks or branches, or take other actions as a condition to receiving regulatory approval.
BB&T’s stock price can be volatile.
BB&T’s stock price can fluctuate widely in response to a variety of factors including:
| · |
actual or anticipated variations in quarterly operating results; |
| · |
recommendations by securities analysts; |
| · |
new technology used, or services offered, by competitors; |
| · |
significant acquisitions or business combinations, strategic partnerships, joint ventures or capital commitments by or involving the Company or the Company’s competitors; |
| · |
failure to integrate acquisitions or realize anticipated benefits from acquisitions; |
| · |
operating and stock price performance of other companies that investors deem comparable to BB&T; |
| · |
news reports relating to trends, concerns and other issues in the financial services industry; |
| · |
changes in government regulations, accounting standards and tax laws; and |
| · |
geopolitical conditions such as acts or threats of terrorism or military conflicts. |
General market fluctuations, industry factors and general economic and political conditions and events, such as economic slowdowns or recessions, interest rate changes, credit loss trends, or currency fluctuations could also cause BB&T’s stock price to decrease regardless of the Company’s operating results.
Operating Subsidiaries
At December 31, 2010, the principal operating subsidiaries of BB&T included the following:
| · |
Branch Banking and Trust Company, Winston-Salem, North Carolina |
| · |
BB&T Financial, FSB, Columbus, Georgia |
| · |
Scott & Stringfellow, LLC, Richmond, Virginia |
13
Table of Contents
| · |
Clearview Correspondent Services, LLC, Richmond, Virginia |
| · |
Regional Acceptance Corporation, Greenville, North Carolina |
| · |
American Coastal Insurance Company, Davie, Florida |
| · |
Sterling Capital Management, LLC, Charlotte, North Carolina |
Branch Bank, BB&T’s largest subsidiary, was chartered in 1872 and is the oldest bank headquartered in North Carolina. Branch Bank provides a wide range of banking and trust services for retail and commercial clients in its geographic markets, including small and mid-size businesses, public agencies, local governments and individuals, through 1,782 offices (as of December 31, 2010) located in North Carolina, Virginia, Florida, Georgia, Maryland, South Carolina, Alabama, Kentucky, West Virginia, Tennessee, Texas, Washington D.C and Indiana. Branch Bank’s principal operating subsidiaries include:
| · |
BB&T Equipment Finance Corporation, based in Charlotte, North Carolina, which provides loan and lease financing to commercial and small businesses; |
| · |
BB&T Investment Services, Inc., a registered broker-dealer located in Charlotte, North Carolina, which offers clients non-deposit investment alternatives, including discount brokerage services, equities, fixed-rate, variable-rate and index annuities, mutual funds, government and municipal bonds, and money market funds; |
| · |
BB&T Insurance Services, Inc., headquartered in Raleigh, North Carolina, which offers property and casualty, life, health, employee benefits, commercial general liability, surety, title and other insurance products through its agency network; |
| · |
Stanley, Hunt, DuPree & Rhine, Inc., (a division of Branch Bank) with dual headquarters in Greensboro, North Carolina, and Greenville, South Carolina, which offers flexible benefit plans, and investment advisory, actuarial and benefit consulting services; |
| · |
Prime Rate Premium Finance Corporation, Inc., located in Florence, South Carolina, and its subsidiary AFCO Credit Corporation, headquartered in Pittsburgh, Pennsylvania, which provide insurance premium financing to clients in the United States and Canada; |
| · |
Grandbridge Real Estate Capital, LLC, based in Charlotte, North Carolina, which specializes in arranging and servicing commercial mortgage loans; |
| · |
Lendmark Financial Services, Inc., located in Covington, Georgia, which offers alternative consumer loans to clients unable to meet Branch Bank’s normal credit underwriting guidelines; |
| · |
CRC Insurance Services, Inc., based in Birmingham, Alabama, which is a wholesale insurance broker authorized to do business nationwide; and |
| · |
McGriff, Seibels & Williams, Inc., based in Birmingham, Alabama, which is authorized to do business nationwide and specializes in providing insurance products on an agency basis to large commercial and energy clients, including many Fortune 500 companies. |
BB&T FSB is a federal savings bank. BB&T FSB provides services to clients throughout the United States and was formed to help improve the operating efficiency of certain business activities for subsidiaries which are national in scope. In addition to credit card lending, the following businesses operate as either subsidiaries or divisions of BB&T FSB:
| · |
Sheffield Financial (a division of BB&T FSB), based in Clemmons, North Carolina, which specializes in loans to small commercial lawn care businesses across the country for the purchase of outdoor power equipment and loans to individuals for power sport and leisure equipment; and |
| · |
MidAmerica Gift Certificate Company, which specializes in the issuance and sale of retail giftcards through a nationwide network of authorized agents. |
14
Table of Contents
Major Nonbank Subsidiaries
BB&T also has a number of nonbank subsidiaries, including:
| · |
Scott & Stringfellow, LLC, which is a registered investment banking and full-service brokerage firm that provides services in retail brokerage, equity and debt underwriting, investment advice, corporate finance and equity research; and facilitates the origination, trading and distribution of fixed-income securities and equity products in both the public and private capital markets. It also has a public finance department that provides investment banking, financial advisory services and debt underwriting services to a variety of regional taxable and tax-exempt issuers. Scott & Stringfellow’s investment banking and corporate and public finance areas conduct business as BB&T Capital Markets; |
| · |
Clearview Correspondent Services, LLC is a broker-dealer providing correspondent clearing services to other broker-dealers and entities involved in the securities industry. As a correspondent clearing firm, it provides clearing services to affiliated and unaffiliated broker-dealers; |
| · |
Regional Acceptance Corporation, which specializes in indirect financing for consumer purchases of primarily mid-model and late-model used automobiles; |
| · |
American Coastal Insurance Company, an admitted Florida specialty insurance company that underwrites property insurance risks for commercial condominium or cooperative associations; and |
| · |
Sterling Capital Management, LLC, a registered investment advisor and the advisor to the BB&T Funds (the BB&T Funds were renamed Sterling Capital Funds in February 2011), provides tailored investment management solutions to meet the specific needs and objectives of individual and institutional clients through a full range of investment strategies, including domestic and international equity, alternative investment products and strategies, and fixed income investing. |
Services
BB&T’s subsidiaries offer a variety of services targeted to retail and commercial clients. BB&T’s objective is to offer clients a full array of products to meet all their financial needs.
|
Retail: |
Commercial: |
|
|
Bankcard lending |
Asset management | |
|
Consumer finance |
Association services | |
|
Home equity lending |
Capital markets services | |
|
Home mortgage lending |
Commercial deposit services | |
|
Insurance |
Commercial finance | |
|
Investment brokerage services |
Commercial middle market lending | |
|
Mobile/online banking |
Commercial mortgage lending | |
|
Payment solutions |
Institutional trust services | |
|
Sales finance |
Insurance | |
|
Small business lending |
Insurance premium finance | |
|
Wealth management/private banking |
International banking services | |
| Leasing | ||
| Merchant services | ||
| Mortgage warehouse lending | ||
| Payment solutions | ||
| Real estate lending | ||
| Supply chain management | ||
| Venture capital |
15
Table of Contents
The following table reflects BB&T’s deposit market share and branch locations by state.
Table 1
BB&T Deposit Market Share and Branch Locations by State
|
% of
BB&T's Deposits (2) |
Deposit
Market Share Rank (2) |
Number of
Branches (3) |
||||||||||
|
North Carolina (1) |
23 | % | 2nd | 359 | ||||||||
|
Virginia |
20 | 4th | 392 | |||||||||
|
Florida |
15 | 5th | 271 | |||||||||
|
Georgia |
11 | 5th | 169 | |||||||||
|
Maryland |
7 | 7th | 130 | |||||||||
|
South Carolina |
6 | 3rd | 115 | |||||||||
|
West Virginia |
5 | 1st | 78 | |||||||||
|
Kentucky |
4 | 4th | 89 | |||||||||
|
Alabama |
4 | 5th | 87 | |||||||||
|
Tennessee |
3 | 6th | 56 | |||||||||
|
Texas |
1 | 51st | 22 | |||||||||
|
Washington, D.C. |
1 | 7th | 12 | |||||||||
| (1) | Excludes home office deposits. |
| (2) | Source: FDIC.gov—data as of June 30, 2010. |
| (3) | As of December 31, 2010. Excludes 2 branches in Indiana. |
Executive Overview
Significant accomplishments in 2010
In the opinion of BB&T’s management, the Corporation’s most significant accomplishments during 2010 were as follows (amounts include the impact of acquisitions where applicable):
| · |
Achieved outstanding client service and client loyalty scores based on independent survey |
| · |
Average client deposits increased 9.2% |
| · |
Produced fully taxable-equivalent revenue growth of 5.8%, a record $9.4 billion |
| · |
Successfully executed the systems conversion of Colonial, the largest acquisition in BB&T’s history |
| · |
Maintained safety, soundness and profitability through the recession |
| · |
Successfully implemented nonperforming asset disposition strategy |
| · |
Enhanced risk management structure |
| · |
Maintained a strong dividend payout |
Challenges
BB&T’s business has become more dynamic and complex in recent years. Consequently, management has annually evaluated and, as necessary, adjusted the Corporation’s business strategy in the context of the current operating environment. During this process, management considers the current financial condition and performance of the Company and its expectations for future economic activity, both on a national and local market scale. The achievement of BB&T’s key strategic objectives and established long-term financial goals is subject to many uncertainties and challenges. In the opinion of management, the challenges that are most relevant and likely to have a near term impact on performance are presented below:
| · |
Economic impact from deepest global recession in decades |
| · |
Unprecedented disruption and significantly increased risk in financial markets |
16
Table of Contents
| · |
Effectively managing through the credit cycle |
| · |
Residential real estate risk / risk of deterioration spreading to other asset classes |
| · |
Intense competition for best credits within the financial services industry |
| · |
Cost and risk associated with the regulatory initiatives |
| · |
Over-capacity in financial services industry |
Overview of Significant Events and Financial Results
The operating environment for financial holding companies continued to be difficult during 2010, as the economy continued to deal with the aftermath of the deepest global recession in decades. BB&T continued to perform relatively well compared to peers and executed on a number of initiatives to ensure that the Company emerges from the credit cycle stronger.
During the second quarter of 2010, management implemented a comprehensive nonperforming asset disposition strategy with a goal of more aggressively reducing BB&T’s exposure to nonperforming loans and foreclosed properties and to reduce or eliminate any delay in exiting the credit cycle. The strategy was implemented during the second quarter of 2010 as management believed that pricing for distressed assets had improved. This strategy continued throughout the third and fourth quarters and into 2011. As a result of the strategy, nonperforming assets, excluding covered foreclosed property, declined from a peak of $4.4 billion at March 31, 2010, to $4.0 billion as of year-end.
Management also undertook several initiatives during 2010 to strengthen BB&T’s balance sheet. In the second quarter of 2010, management executed on a deleveraging strategy to better position BB&T’s balance sheet for a rising rate environment and achieve a better mix of earning assets. In connection with this strategy, management reduced the balance sheet by approximately $8 billion through the sale of securities. During the third and fourth quarters of 2010, management executed a strategy to further de-risk the available-for-sale securities portfolio. The de-risking strategy was aimed at further reducing the duration of the securities portfolio and reducing the risk of charges to other comprehensive income in a rising rate environment. In addition, management sold approximately $400 million of non-agency mortgage-backed securities to reduce the potential for future credit losses. These strategies were the primary driver in generating net securities gains during 2010.
Early in the third quarter, the Dodd-Frank Act was signed into law. This legislation represents one of the more significant legislative actions to affect the financial services industry. While many of the provisions of the legislation will have minimal or no financial impact to BB&T, certain aspects are likely to result in higher costs and reduced revenues in the near term. Over the longer-term, management expects that changes in products and services offered will minimize or eliminate many of the negative financial impacts to BB&T. For further discussion of the more significant items included in the Dodd-Frank Act refer to the section titled “Regulatory Considerations.”
During the fourth quarter of 2010, the Corporation acquired the remaining 30% ownership interest in Sterling Capital Management, LLC and merged it with its existing investment advisor BB&T Asset Management, Inc. The merger provides improved operational efficiencies and enhanced client service.
Consolidated net income for 2010 totaled $854 million, a decrease of $23 million, or 2.6%, compared to $877 million earned during 2009. Consolidated net income available to common shareholders for 2010 totaled $816 million, an increase of $87 million, or 11.9%, compared to $729 million earned during 2009. Net income available to common shareholders for 2009 included a reduction of $124 million related to the U.S. Treasury’s preferred stock investment in BB&T. On a diluted per common share basis, earnings for 2010 were $1.16, compared to $1.15 for 2009. BB&T’s results of operations for 2010 produced a return on average assets of .54% and a return on average common shareholders’ equity of 4.85% compared to prior year ratios of .56% and 4.93%, respectively.
BB&T generated record revenues totaling $9.4 billion, on a tax-equivalent basis, for 2010, which was up 5.8% compared to 2009. This was primarily due to growth of 9.9% in fully taxable-equivalent net interest income. The growth in net interest income was the result of expansion in the net interest margin from 3.66% in 2009 to 4.03% in 2010. This improvement reflects higher yields on assets acquired in the Colonial acquisition and lower deposit costs.
17
Table of Contents
Credit costs remained high during 2010. BB&T recorded a $2.6 billion provision for credit losses in 2010 compared to a $2.8 billion provision for credit losses recorded during 2009. Net charge-offs for 2010 totaled $2.5 billion compared to $1.8 billion for 2009. Net charge-offs for 2010 included $605 million related to the nonperforming assets disposition strategy. In addition, foreclosed property expenses were $747 million in 2010 compared to $356 million in 2009. However, nonperforming assets, excluding covered assets, declined 9.6% over the last three quarters of 2010 due to the successful execution of BB&T’s nonperforming asset disposition strategy.
BB&T’s total assets at December 31, 2010 were $157.1 billion, a decrease of $8.7 billion, or 5.2%, compared to December 31, 2009. Total loans and leases at December 31, 2010 were $107.3 billion, an increase of $1.1 billion, or 1.0%, compared to the balance at year-end 2009. Securities available for sale decreased $10.1 billion compared to December 31, 2009, primarily due to the deleveraging strategy executed during the second quarter of 2010.
Total client deposits at December 31, 2010 were $100.0 billion, a decrease of $6.7 billion, or 6.3%, from December 31, 2009. Total deposits, which include wholesale deposit sources, totaled $107.2 billion at December 31, 2010, a decrease of $7.8 billion, or 6.7%, compared to December 31, 2009. The decrease in client deposits was a result of a decrease of $11.0 billion, or 34.0%, in certificates of deposit as more expensive deposits were not renewed. BB&T has seen an improvement in the deposit mix with noninterest-bearing accounts representing 19.2% of total deposits at December 31, 2010, compared with 16.5% at December 31, 2009.
Total shareholders’ equity increased 1.6% compared to December 31, 2009. BB&T’s common equity increased primarily as a result of retained earnings. The Tier 1 common ratio was 9.1% at December 31, 2010. In addition, the Tier 1 risk-based capital and total risk-based capital ratios were 11.8% and 15.5% at December 31, 2010, respectively. BB&T’s risk-based and tangible capital ratios remain well above regulatory standards for well-capitalized banks. As of December 31, 2010, measures of tangible capital were not required by the regulators and, therefore, were considered non-GAAP measures. Please refer to the section titled “Capital” herein for a discussion of how BB&T calculates and uses these measures in the evaluation of the Company.
Competition
The financial services industry is highly competitive and dramatic change continues to occur in all aspects of the Company’s business. The ability of nonbank financial entities to provide services previously reserved for commercial banks has intensified competition. BB&T’s subsidiaries compete actively with national, regional and local financial services providers, including banks, thrifts, securities dealers, mortgage bankers, finance companies and insurance companies. Competition among providers of financial products and services continues to increase, with consumers having the opportunity to select from a growing variety of traditional and nontraditional alternatives. The industry continues to consolidate, which affects competition by eliminating some regional and local institutions, while strengthening the franchises of acquirers. In addition, many financial services entities are experiencing significant challenges as a result of the economic crisis, resulting in bank and thrift failures and significant intervention from the U.S. Government. For additional information concerning markets, BB&T’s competitive position and business strategies, and recent government interventions see “Market Area”, “General Business Development” and “Regulatory Considerations” below.
Market Area
BB&T’s primary market area for its banking operations consists of North and South Carolina, Virginia, Maryland, Georgia, eastern Tennessee, West Virginia, Kentucky, Florida, Alabama and Washington, D.C. In addition, BB&T has a smaller banking presence in Texas and Indiana. The Texas market represents a new market for BB&T to expand its banking operations with entry occurring in connection with the Colonial acquisition. The markets that BB&T operates have a diverse employment base and primarily consists of manufacturing, general services, agricultural, wholesale/retail trade, technology, government and financial services. BB&T believes its current market area will support growth in assets and deposits in the future. Management strongly believes that BB&T’s community bank approach to providing client service is a competitive advantage that strengthens the Corporation’s ability to effectively provide financial products and services to businesses and individuals in its markets.
18
Table of Contents
General Business Development
BB&T is a regional financial holding company. BB&T has maintained a long-term focus on a strategy that includes expanding and diversifying the BB&T franchise in terms of revenues, profitability and asset size. This strategy has encompassed both organic growth and acquisitions of complementary banks and financial businesses. During the 1990’s and through 2003, BB&T’s growth resulted largely from mergers and acquisitions as the economics of business combinations were compelling. Since that time, BB&T has focused more on organic growth and strategic acquisitions, including the FDIC-assisted acquisition of Colonial.
Merger and Acquisition Strategy
BB&T’s growth in business, profitability and market share has historically been enhanced by strategic mergers and acquisitions. Management intends to remain disciplined and focused with regard to future merger and acquisition opportunities. BB&T will continue to assess bank and thrift acquisitions subject to market conditions and suitable candidates, primarily within BB&T’s existing footprint, and will pursue economically advantageous acquisitions of insurance agencies, specialized lending businesses, and fee income generating financial services businesses. BB&T’s acquisition strategy is focused on three primary objectives:
| · |
to pursue assisted and unassisted acquisitions of banks and thrifts with compatible cultures that will enhance BB&T’s community banking and customer delivery system; |
| · |
to acquire companies in niche markets that provide products or services that can be offered through the existing distribution system to BB&T’s current customer base; and |
| · |
to consider strategic nonbank acquisitions in markets that are economically feasible and provide positive long-term benefits. |
BB&T completed acquisitions of 33 community banks and thrifts, 80 insurance agencies and 32 nonbank financial services providers over the last fifteen years. In the long-term, BB&T expects to continue to take advantage of the consolidation in the financial services industry and expand and enhance its franchise through mergers and acquisitions. The consideration paid for these acquisitions may be in the form of cash, debt or BB&T common stock. The amount of consideration paid to complete these transactions may be in excess of the fair value of the underlying net assets acquired, which could have a dilutive effect on BB&T’s earnings. In addition, acquisitions often result in significant front-end charges against earnings. However, BB&T’s disciplined approach to mergers and acquisitions typically requires that acquisitions be accretive to earnings by year three, driven primarily by revenue enhancements and cost savings that are especially incident to in-market bank and thrift acquisitions.
Risk Management
In the normal course of business BB&T encounters inherent risk in its business activities. Risk is managed on a decentralized basis with risk decisions made as closely as possible to where the risk occurs. Centrally risk oversight is managed at the corporate level through oversight, policies and reporting. The principal types of inherent risk include compliance, credit, liquidity, market, operational, reputation and strategic risks.
Compliance risk
Compliance risk is the risk to earnings, capital, or reputation arising from violations of or noncompliance with current and changing laws, regulations, supervisory guidance, regulatory expectations, or the rules, standards, or codes of conduct of self regulatory organizations.
Credit risk
Credit risk is the risk to earnings or capital arising from the default, inability, or unwillingness of a borrower, obligor, or counterparty to meet the terms of any financial obligation with BB&T or otherwise perform as agreed. Credit risk exists in all activities where success depends on the performance of a borrower, obligor, or counterparty. Credit risk arises when BB&T funds are extended, committed, invested, or otherwise exposed through actual or implied contractual agreements, whether on or off the balance sheet. Credit risk also occurs when the credit quality of an issuer whose securities or other instruments the bank holds deteriorates. For additional information concerning BB&T’s management of credit risk, see the “Lending Activities” section below.
19
Table of Contents
Liquidity risk
Liquidity risk is the risk to ongoing operations arising from the inability to accommodate liability maturities, deposit withdrawals, fund asset growth, or meet contractual obligations when they come due. For additional information concerning BB&T’s management of liquidity risk, see the “Liquidity” section of “Management’s Discussion and Analysis” herein.
Market risk
Market risk is the risk to earnings or capital arising from changes in the market value of portfolios, securities, or other financial instruments due to changes in the level, volatility, or correlations among financial market rates or prices, including interest rates, foreign exchange rates, equity prices, commodity prices, or other relevant rates or prices. For additional information concerning BB&T’s management of market risk, see the “Market Risk” section of “Management’s Discussion and Analysis” herein.
Operational risk
Operational risk is the risk to earnings or capital arising from inadequate or failed internal processes, people and systems or from external events. This definition includes legal risk, which is the risk of loss arising from defective transactions, litigation or claims made, or the failure to adequately protect company-owned assets.
Reputation risk
Reputation risk is the risk to earnings, capital, enterprise value, the BB&T brand, and public confidence arising from negative publicity or public opinion, whether real or perceived, regarding BB&T’s business practices, products and services, transactions, or other activities undertaken by BB&T, its representatives, or its partners. Reputation risk may impact BB&T’s clients, employees, communities or shareholders, and is often a residual risk that arises when other risks are not managed properly.
Strategic risk
Strategic risk is the risk to earnings, capital, enterprise value, and to the achievement of BB&T’s Vision, Mission, Purpose, and business objectives that arises from BB&T’s business strategy, adverse business decisions, improper or ineffective implementation of decisions, or lack of responsiveness to changes in the business environment. Strategic risk is a function of the compatibility of BB&T’s strategic goals, the business strategies developed to achieve those goals, the resources deployed against these goals, and the quality of implementation.
Risk Governance
The management of risk has always been an enterprise-wide initiative at BB&T. It is part of BB&T’s mission statement that we manage risk to optimize the long-term return to shareholders, while providing a safe and sound investment.
The Chief Risk Officer leads the Risk Management Organization (“RMO”) which designs, organizes and manages the risk framework. The management of risk begins at the business level through risk identification and management programs. The RMO is responsible for ensuring effective risk management oversight, measurement, monitoring, reporting and consistency of controls.
Lending Activities
The primary goal of the BB&T lending function is to help clients achieve their financial goals by providing quality loan products that are fair to the client and profitable to the Corporation. Management believes that this purpose can best be accomplished by building strong, profitable client relationships over time, with BB&T becoming an important contributor to the prosperity and well-being of its clients. In addition to the importance placed on client knowledge and continuous involvement with clients, BB&T’s lending process incorporates the standards of a consistent company-wide credit culture and an in-depth local market knowledge. Furthermore, the Corporation employs strict underwriting criteria governing the degree of assumed risk and the diversity of the loan portfolio in terms of type, industry and geographical concentration. In this context, BB&T strives to meet the credit needs of businesses and consumers in its markets while pursuing a balanced strategy of loan profitability, loan growth and loan quality.
20
Table of Contents
The following table summarizes BB&T’s loan portfolio based on the regulatory classification of the portfolio, which focuses on the underlying loan collateral, and differs from internal classifications presented herein that focus on the primary purpose of the loan. Covered loans are included in their respective categories.
Table 2
Composition of Loan and Lease Portfolio
| December 31, | ||||||||||||||||||||
| 2010 | 2009 | 2008 | 2007 | 2006 | ||||||||||||||||
| (Dollars in millions) | ||||||||||||||||||||
|
Commercial, financial and agricultural loans |
$ | 20,490 | $ | 19,076 | $ | 17,489 | $ | 14,515 | $ | 11,061 | ||||||||||
|
Lease receivables |
1,158 | 1,092 | 1,315 | 1,651 | 2,249 | |||||||||||||||
|
Real estate—construction and land development loans |
10,969 | 15,353 | 18,012 | 19,474 | 17,553 | |||||||||||||||
|
Real estate—mortgage loans |
57,418 | 55,671 | 48,719 | 44,687 | 42,219 | |||||||||||||||
|
Consumer loans |
13,532 | 12,464 | 11,710 | 10,580 | 9,829 | |||||||||||||||
|
Total loans and leases held for investment |
103,567 | 103,656 | 97,245 | 90,907 | 82,911 | |||||||||||||||
|
Loans held for sale |
3,697 | 2,551 | 1,424 | 779 | 680 | |||||||||||||||
|
Total loans and leases |
$ | 107,264 | $ | 106,207 | $ | 98,669 | $ | 91,686 | $ | 83,591 | ||||||||||
BB&T’s loan portfolio is approximately 50% commercial and 50% retail by design, and is divided into six major categories—commercial, sales finance, revolving credit, direct retail, mortgage and specialized lending. In addition, BB&T has a portfolio of loans that were acquired in the Colonial acquisition that are covered by FDIC loss sharing agreements. BB&T lends to a diverse customer base that is substantially located within the Corporation’s primary market area. At the same time, the loan portfolio is geographically dispersed throughout BB&T’s branch network to mitigate concentration risk arising from local and regional economic downturns.
The following discussion presents the principal types of lending conducted by BB&T and describes the underwriting procedures and overall risk management of BB&T’s lending function. The relative risk of each loan portfolio is presented in the “Asset Quality” section of “Management’s Discussion and Analysis of Financial Condition and Results of Operations” herein.
Underwriting Approach
Recognizing that the loan portfolio is a primary source of profitability and risk, proper loan underwriting is critical to BB&T’s long-term financial success. BB&T’s underwriting approach is designed to define acceptable combinations of specific risk-mitigating features that ensure credit relationships conform to BB&T’s risk philosophy. Provided below is a summary of the most significant underwriting criteria used to evaluate new loans and loan renewals:
| · |
Cash flow and debt service coverage —cash flow adequacy is a necessary condition of creditworthiness, meaning that loans not clearly supported by a borrower’s cash flow must be justified by secondary repayment sources. |
| · |
Secondary sources of repayment —alternative repayment funds are a significant risk-mitigating factor as long as they are liquid, can be easily accessed and provide adequate resources to supplement the primary cash flow source. |
| · |
Value of any underlying collateral —loans are generally secured by the asset being financed. Because an analysis of the primary and secondary sources of repayment is the most important factor, collateral, unless it is liquid, does not justify loans that cannot be serviced by the borrower’s normal cash flows. |
| · |
Overall creditworthiness of the customer, taking into account the customer’s relationships, both past and current, with other lenders —BB&T’s success depends on building lasting and mutually beneficial relationships with clients, which involves assessing their financial position and background. |
| · |
Level of equity invested in the transaction —in general, borrowers are required to contribute or invest a portion of their own funds prior to any loan advances. |
21
Table of Contents
Commercial Loan and Lease Portfolio
The commercial loan and lease portfolio represents the largest category of the Corporation’s total loan portfolio. BB&T’s commercial lending program is generally targeted to serve small-to-middle market businesses with sales of $250 million or less. In addition, BB&T’s Corporate Banking Group provides lending solutions to large corporate clients. Traditionally, lending to small and mid-sized businesses has been among BB&T’s strongest market segments.
Commercial and small business loans are primarily originated through BB&T’s branch network. In accordance with the Corporation’s lending policy, each loan undergoes a detailed underwriting process, which incorporates BB&T’s underwriting approach, procedures and evaluations described above. In addition, Branch Bank has adopted an internal maximum credit exposure lending limit of $245 million for a “best grade” credit, which is considerably below Branch Bank’s maximum legal lending limit. Commercial loans are typically priced with an interest rate tied to market indices, such as the prime rate and the London Interbank Offered Rate (“LIBOR”), or a fixed-rate. Commercial loans are individually monitored and reviewed for any possible deterioration in the ability of the client to repay the loan. Approximately 92% of BB&T’s commercial loans are secured by real estate, business equipment, inventories and other types of collateral. BB&T’s commercial leases consist of investments in various types of leveraged lease transactions.
Sales Finance Loan Portfolio
The sales finance category primarily includes secured indirect installment loans to consumers for the purchase of new and used automobiles, boats and recreational vehicles. Such loans are originated through approved franchised and independent dealers throughout the BB&T market area. These loans are relatively homogenous and no single loan is individually significant in terms of its size and potential risk of loss. Sales finance loans are subject to the same rigorous lending policies and procedures as described above for commercial loans and are underwritten with note amounts and credit limits that ensure consistency with the Corporation’s risk philosophy. In addition to its normal underwriting due diligence, BB&T uses application systems and “scoring systems” to help underwrite and manage the credit risk in its sales finance portfolio. Also included in the sales finance category are commercial lines, serviced by the Sales Finance Department, to finance dealer wholesale inventory (“Floor Plan Lines”) for resale to consumers. Floor Plan Lines are underwritten by commercial loan officers in compliance with the same rigorous lending policies described above for commercial loans. In addition, Floor Plan Lines are subject to intensive monitoring and oversight to ensure quality and to mitigate risk from fraud.
Revolving Credit Loan Portfolio
The revolving credit portfolio comprises the outstanding balances on credit cards and BB&T’s checking account overdraft protection product, Constant Credit. BB&T markets credit cards to its existing banking client base and does not solicit cardholders through nationwide programs or other forms of mass marketing. Such balances are generally unsecured and actively managed by BB&T FSB.
Direct Retail Loan Portfolio
The direct retail loan portfolio primarily consists of a wide variety of loan products offered through BB&T’s branch network. Various types of secured and unsecured loans are marketed to qualifying existing clients and to other creditworthy candidates in BB&T’s market area. The vast majority of direct retail loans are secured by first or second liens on residential real estate, and include both closed-end home equity loans and revolving home equity lines of credit. Direct retail loans are subject to the same rigorous lending policies and procedures as described above for commercial loans and are underwritten with note amounts and credit limits that ensure consistency with the Corporation’s risk philosophy.
Mortgage Loan Portfolio
BB&T is a large originator of residential mortgage loans, with originations in 2010 totaling $24.9 billion. Branch Bank offers various types of fixed- and adjustable-rate loans for the purpose of constructing, purchasing or refinancing residential properties. BB&T primarily originates conforming mortgage loans and higher quality
22
Table of Contents
jumbo and construction-to-permanent loans for owner-occupied properties. Conforming loans are loans that are underwritten in accordance with the underwriting standards set forth by the Federal National Mortgage Association (“Fannie Mae”) and the Federal Home Loan Mortgage Corporation (“Freddie Mac”). They are generally collateralized by one-to-four-family residential real estate, have loan-to-collateral value ratios of 80% or less, and are made to borrowers in good credit standing.
Risks associated with the mortgage lending function include interest rate risk, which is mitigated through the sale of a substantial portion of conforming fixed-rate loans in the secondary mortgage market and an effective mortgage servicing rights hedging process. Borrower risk is lessened through rigorous underwriting procedures and mortgage insurance. The right to service the loans and receive servicing income is generally retained when conforming loans are sold. Management believes that the retention of mortgage servicing is a primary relationship driver in retail banking and a vital part of management’s strategy to establish profitable long-term customer relationships and offer high quality client service. BB&T also purchases residential mortgage loans from correspondent originators. The loans purchased from third-party originators are subject to the same underwriting and risk-management criteria as loans originated internally.
Specialized Lending Portfolio
BB&T’s specialized lending portfolio consists of loans originated through six business units that provide specialty finance alternatives to consumers and businesses including: dealer-based financing of equipment for small businesses and consumers, commercial equipment leasing and finance, direct and indirect consumer finance, insurance premium finance, indirect subprime automobile finance, and full-service commercial mortgage banking. BB&T offers these services to bank clients as well as nonbank clients within and outside BB&T’s primary geographic market area.
BB&T’s specialized lending subsidiaries adhere to the same overall underwriting approach as the commercial and consumer lending portfolio and also utilize automated credit scoring to assist with underwriting the credit risk. The majority of these loans are relatively homogenous and no single loan is individually significant in terms of its size and potential risk of loss. The majority of the loans are secured by real estate, automobiles, equipment or unearned insurance premiums. As of December 31, 2010, included in the specialized lending portfolio are loans to subprime borrowers of approximately $3.1 billion, or 2.9% of the total BB&T loan and lease portfolio. Of these, approximately $336 million are residential real estate loans and are included in the disclosures in Table 14-2 herein.
Covered Loan Portfolio
In connection with the FDIC-assisted acquisition of Colonial, BB&T acquired approximately $14.1 billion of loans that are covered by loss sharing agreements. BB&T recorded these loans at $9.6 billion, which represented their fair value on the acquisition date. The loans covered by loss sharing agreements are primarily commercial real estate loans and residential mortgage loans. Refer to Note 4 “Loans and Leases” in the “Notes to Consolidated Financial Statements” in this report for additional disclosures related to BB&T’s covered loans.
23
Table of Contents
The following table presents BB&T’s total loan portfolio based upon BB&T’s lines of business, as discussed herein, rather than upon regulatory reporting classifications:
Table 3
Composition of Loan and Lease Portfolio Based on Lines of Business
| December 31, | ||||||||||||||||||||
| 2010 | 2009 | 2008 | 2007 | 2006 | ||||||||||||||||
| (Dollars in millions) | ||||||||||||||||||||
|
Loans and leases, net of unearned income: |
||||||||||||||||||||
|
Commercial loans |
$ | 48,526 | $ | 49,445 | $ | 49,727 | $ | 43,685 | $ | 39,580 | ||||||||||
|
Leveraged leases |
360 | 375 | 753 | 1,185 | 1,720 | |||||||||||||||
|
Total commercial loans and leases |
48,886 | 49,820 | 50,480 | 44,870 | 41,300 | |||||||||||||||
|
Sales finance |
7,050 | 6,290 | 6,354 | 6,021 | 5,683 | |||||||||||||||
|
Revolving credit |
2,127 | 2,016 | 1,777 | 1,618 | 1,414 | |||||||||||||||
|
Direct retail |
13,749 | 14,283 | 15,454 | 15,691 | 15,312 | |||||||||||||||
|
Residential mortgage loans |
17,550 | 15,435 | 17,091 | 17,467 | 15,596 | |||||||||||||||
|
Specialized lending |
7,953 | 7,670 | 6,089 | 5,240 | 3,606 | |||||||||||||||
|
Other acquired loans |
58 | 123 | — | — | — | |||||||||||||||
|
Total loans and leases held for investment (excluding covered loans) |
97,373 | 95,637 | 97,245 | 90,907 | 82,911 | |||||||||||||||
|
Covered loans |
6,194 | 8,019 | — | — | — | |||||||||||||||
|
Total loans and leases held for investment |
103,567 | 103,656 | 97,245 | 90,907 | 82,911 | |||||||||||||||
|
Total loans held for sale |
3,697 | 2,551 | 1,424 | 779 | 680 | |||||||||||||||
|
Total loans and leases |
$ | 107,264 | $ | 106,207 | $ | 98,669 | $ | 91,686 | $ | 83,591 | ||||||||||
The following table reflects the scheduled maturities of commercial, financial and agricultural loans, as well as real estate construction loans:
Table 4
Selected Loan Maturities and Interest Sensitivity
| December 31, 2010 | ||||||||||||
|
Commercial,
Financial and Agricultural |
Real Estate:
Construction and Land Development Loans |
Total | ||||||||||
| (Dollars in millions) | ||||||||||||
|
Fixed rate: |
||||||||||||
|
1 year or less (1) |
$ | 1,821 | $ | 476 | $ | 2,297 | ||||||
|
1-5 years |
1,329 | 840 | 2,169 | |||||||||
|
After 5 years |
4,199 | 1,556 | 5,755 | |||||||||
|
Total |
7,349 | 2,872 | 10,221 | |||||||||
|
Variable rate: |
||||||||||||
|
1 year or less (1) |
5,732 | 3,055 | 8,787 | |||||||||
|
1-5 years |
4,828 | 3,690 | 8,518 | |||||||||
|
After 5 years |
2,581 | 1,352 | 3,933 | |||||||||
|
Total |
13,141 | 8,097 | 21,238 | |||||||||
|
Total loans and leases (2) |
$ | 20,490 | $ | 10,969 | $ | 31,459 | ||||||
| (1) | Includes loans due on demand. |
| (2) | The above table excludes: |
24
Table of Contents
|
(Dollars in
millions) |
||||
|
(i) consumer loans |
$ | 13,532 | ||
|
(ii) real estate mortgage loans |
57,418 | |||
|
(iii) loans held for sale |
3,697 | |||
|
(iv) lease receivables |
1,158 | |||
|
Total |
$ | 75,805 | ||
Scheduled repayments are reported in the maturity category in which the payment is due. Determinations of maturities are based upon contract terms. In accordance with regulatory reporting standards, variable rate loans that have reached a floor are reported as fixed-rate loans. BB&T’s credit policy typically does not permit automatic renewal of loans. At the scheduled maturity date (including balloon payment date), the customer generally must request a new loan to replace the matured loan and execute either a new note or note modification with rate, terms and conditions negotiated at that time.
Allowance for Loan and Lease Losses and Reserve for Unfunded Lending Commitments
The allowance for loan and lease losses is determined based on management’s best estimate of probable losses inherent in the portfolio at the balance sheet date. BB&T’s allowance is driven by existing conditions and observations, and reflects losses already incurred, even if not yet identifiable.
The Corporation determines the allowance based on an ongoing evaluation of its loan and lease portfolios. This evaluation is inherently subjective because it requires material estimates, including the amounts and timing of cash flows expected to be received on impaired loans. Those estimates may be susceptible to significant change. Increases to the allowance are made by charges to the provision for credit losses, which is reflected in the Consolidated Statements of Income. Loans or leases deemed to be uncollectible are charged against the allowance. Recoveries of previously charged-off amounts are credited to the allowance.
In addition to the allowance for loan and lease losses, BB&T also estimates probable losses related to binding unfunded lending commitments. The methodology to determine such losses is inherently similar to the methodology used in calculating the allowance for commercial loans, adjusted for factors specific to binding commitments, including the probability of funding and exposure at funding. The reserve for unfunded lending commitments is included in accounts payable and other liabilities on the Consolidated Balance Sheets. Changes to the reserve for unfunded lending commitments are made by charges or credits to the provision for credit losses.
While management uses the best information available to establish the allowance for loan and lease losses, future adjustments to the allowance or to the reserving methodology may be necessary if economic conditions differ substantially from the assumptions used in making the valuations.
Reserve Policy and Methodology
BB&T has developed a systematic methodology to determine its allowance for loan and lease losses that gives appropriate consideration to differences in the nature of its lending portfolio. A risk-based approach is used to estimate the allowance related to the commercial lending portfolio, which consists of commercial real estate, commercial and industrial (“C&I”) and certain specialized lending loans and leases. A delinquency-based approach is used to estimate the allowance related to the retail lending portfolio, which consists of direct retail lending, revolving credit, mortgage, sales finance and certain retail-oriented specialized lending loans. An expected cash flows approach is used to estimate the allowance related to loans acquired subsequent to December 31, 2008.
A portion of the Corporation’s allowance for loan and lease losses is not allocated to any specific category of loans. This unallocated portion of the allowance reflects management’s best estimate of the elements of imprecision inherent in the calculation of the overall allowance. Due to the subjectivity involved in determining the overall allowance, including the unallocated portion, the portion considered unallocated may fluctuate from period to period based on management’s evaluation of the factors affecting the assumptions used in calculating the allowance, including historical loss experience, current economic conditions, industry or borrower concentrations and the status of merged institutions. The unallocated portion of the allowance is available to absorb losses on any loan category or lending-related commitment. Management evaluates the adequacy of the allowance for loan and lease losses based on the combined total of the allocated and unallocated components.
25
Table of Contents
Commercial
The vast majority of loans in the commercial lending portfolio are assigned a “risk grade” at origination by the account officer and the assigned risk grade is subsequently reviewed and finalized by a credit officer. Credit Risk Review, a department that is independent of the loan administration functions, validates the risk grades of selected relationships through their loan review process. Loans are assigned risk grades based on an assessment of conditions that affect the borrower’s ability to meet contractual obligations under the loan agreement. This process includes reviewing borrowers’ financial information, historical payment experience, credit documentation, public information, and other information specific to each borrower. Risk grades are reviewed on an annual basis for all credit relationships with total credit exposure of $1 million or more, or at any point management becomes aware of information affecting the borrower’s ability to fulfill their obligations. For commercial clients where total credit exposure is less than $1 million, BB&T has developed an automated loan review system to identify and proactively manage accounts with a higher risk of loss. The “score” produced by this automated system is updated monthly.
BB&T’s internal risk ratings were correlated with Moody’s bond ratings by mapping the historical default rates by internal risk grade to those implied in the bond ratings. Investment grade includes all loans mapped to a “Baa” or higher rating. Near investment grade includes all loans mapped to a “Ba” rating. Noninvestment grade includes all loans mapped to a “B” or lower rating. BB&T’s commercial loan portfolio is predominately near- and non-investment grade because investment grade borrowers can access well developed capital markets alternatives to bank loans, including bonds and commercial paper. In addition, BB&T’s loan mix reflects our community banking focus, which results in a customer base comprising predominately small and private businesses. Because BB&T lends mostly to smaller businesses, the portfolio is very granular, with minimal individual name concentration. In contrast to most investment grade lending, BB&T is a secured lender and the vast majority of loans are well collateralized, which typically results in lower losses if a default occurs. Finally, the current mix reflects incomplete recovery from a heavily stressed economic environment.
On a quarterly basis, BB&T reviews all commercial lending relationships with outstanding debt of $2 million or more that have been classified as substandard or doubtful. While this review is largely focused on the borrower’s ability to repay the loan, BB&T also considers the capacity and willingness of a loan’s guarantors to support the debt service on the loan as a secondary source of repayment. When a guarantor exhibits the documented capacity and willingness to support the loan, BB&T may consider extending the loan maturity and/or temporarily deferring principal payments if the ultimate collection of both principal and interest is not in question. In these cases, BB&T may not deem the loan to be impaired due to the documented capacity and willingness of the guarantor to repay the loan. Loans are considered impaired when the borrower (or guarantor in certain circumstances) does not have the cash flow capacity or willingness to service the debt according to contractual terms, or it does not appear reasonable to assume that the borrower will continue to pay according to the contractual agreement. BB&T establishes a specific reserve for each loan that has been deemed impaired based on the criteria outlined above. The amount of the reserve is based on the present value of expected cash flows discounted at the loan’s effective interest rate, and/or the value of collateral. BB&T has also established a review process related to loans that have been deemed impaired based on their classification as a troubled debt restructuring (“restructuring”) and other impaired loans that are in commercial lending relationships with an outstanding debt of less than $2 million at the balance sheet date. In connection with this process, BB&T establishes reserves related to these loans that are calculated using an expected cash flow approach.
BB&T also maintains reserves for collective impairment that reflect an estimate of losses related to nonimpaired commercial loans as of the balance sheet date. Embedded loss estimates for BB&T’s commercial loan portfolio are based on estimated migration rates, which are estimated based on historical experience, and current risk mix as indicated by the risk grading process described above. Embedded loss estimates may be adjusted to reflect current economic conditions and current portfolio trends including credit quality, concentrations, aging of the portfolio, and significant policy and underwriting changes.
Retail
The majority of the allowance for loan and lease losses related to the retail lending portfolio is calculated on a collective basis using a delinquency-based approach. Embedded loss estimates for BB&T’s retail lending portfolio are based on estimated migration rates that are developed based on historical experience, and current risk mix as
26
Table of Contents
indicated by prevailing delinquency rates. These estimates may be adjusted to reflect current economic conditions and portfolio trends. The remaining portion of the allowance related to the retail lending portfolio relates to loans that have been deemed impaired based on their classification as a restructuring at the balance sheet date. BB&T establishes reserves related to these restructured loans using an expected cash flow approach.
Acquired Loans
For loans acquired in a business combination after December 31, 2008, BB&T has generally aggregated the purchased loans into pools of loans with common risk characteristics. In determining the allowance for loan and lease losses, BB&T performs an analysis each period to estimate the expected cash flows for each of the loan pools. To the extent that the expected cash flows of a loan pool have decreased since the acquisition date, BB&T establishes an allowance for loan loss.
The following table presents an estimated allocation of the allowance for loan and lease losses at the end of each of the past five years. This allocation of the allowance for loan and lease losses is calculated on an approximate basis and is not necessarily indicative of future losses or allocations. The entire amount of the allowance is available to absorb losses occurring in any category of loans and leases.
Table 5
Allocation of Allowance for Loan and Lease Losses by Category
| December 31, | ||||||||||||||||||||||||||||||||||||||||
| 2010 | 2009 | 2008 | 2007 | 2006 | ||||||||||||||||||||||||||||||||||||
| Amount |
% Loans
in each category |
Amount |
% Loans
in each category |
Amount |
% Loans
in each category |
Amount |
% Loans
in each category |
Amount |
% Loans
in each category |
|||||||||||||||||||||||||||||||
| (Dollars in millions) | ||||||||||||||||||||||||||||||||||||||||
|
Balances at end of period applicable to: |
||||||||||||||||||||||||||||||||||||||||
|
Commercial loans and leases |
$ | 1,536 | 47.1 | % | $ | 1,574 | 48.2 | % | $ | 912 | 51.9 | % | $ | 548 | 49.3 | % | $ | 475 | 49.8 | % | ||||||||||||||||||||
|
Sales finance |
47 | 6.8 | 77 | 6.1 | 55 | 6.5 | 58 | 6.6 | 58 | 6.9 | ||||||||||||||||||||||||||||||
|
Revolving credit |
109 | 2.1 | 127 | 1.9 | 94 | 1.8 | 70 | 1.8 | 67 | 1.7 | ||||||||||||||||||||||||||||||
|
Direct retail |
246 | 13.3 | 297 | 13.8 | 124 | 15.9 | 79 | 17.3 | 75 | 18.5 | ||||||||||||||||||||||||||||||
|
Residential mortgage loans |
298 | 17.0 | 131 | 14.9 | 91 | 17.6 | 25 | 19.2 | 21 | 18.8 | ||||||||||||||||||||||||||||||
|
Specialized lending |
198 | 7.7 | 264 | 7.4 | 238 | 6.3 | 1 71 | 5.8 | 139 | 4.3 | ||||||||||||||||||||||||||||||
|
Covered loans |
144 | 6.0 | — | 7.7 | — | — | — | — | — | — | ||||||||||||||||||||||||||||||
|
Unallocated |
130 | — | 130 | — | 60 | — | 53 | — | 53 | — | ||||||||||||||||||||||||||||||
|
Total allowance for loan and lease losses |
2,708 | 100.0 | % | 2,600 | 100.0 | % | 1,574 | 100.0 | % | 1,004 | 100.0 | % | 888 | 100.0 | % | |||||||||||||||||||||||||
|
Reserve for unfunded lending commitments |
47 | 72 | 33 | 11 | — | |||||||||||||||||||||||||||||||||||
|
Total allowance for credit losses |
$ | 2,755 | $ | 2,672 | $ | 1,607 | $ | 1,015 | $ | 888 | ||||||||||||||||||||||||||||||
Investment Activities
Branch Bank invests in securities as allowable under bank regulations. These securities may include obligations of the U.S. Treasury, U.S. government agencies, U.S. government-sponsored entities, including mortgage-backed securities, bank eligible obligations of any state or political subdivision, privately-issued mortgage-backed securities, structured notes, bank eligible corporate obligations, including corporate debentures, commercial paper, negotiable certificates of deposit, bankers acceptances, mutual funds and limited types of equity securities. Branch Bank also may deal in securities subject to the provisions of the Gramm-Leach-Bliley Act. Scott & Stringfellow, LLC, BB&T’s full-service brokerage and investment banking subsidiary, engages in the underwriting, trading and sales of equity and debt securities subject to the risk management policies of the Corporation.
BB&T’s investment activities are governed internally by a written, board-approved policy. The investment policy is carried out by the Corporation’s Market Risk and Liquidity Committee (“MRLC”), which meets
27
Table of Contents
regularly to review the economic environment and establish investment strategies. The MRLC also has much broader responsibilities, which are discussed in the “Market Risk Management” section in “Management’s Discussion and Analysis of Financial Condition and Results of Operations” herein.
Investment strategies are reviewed by the MRLC based on the interest rate environment, balance sheet mix, actual and anticipated loan demand, funding opportunities and the overall interest rate sensitivity of the Corporation. In general, the investment portfolio is managed in a manner appropriate to the attainment of the following goals: (i) to provide a sufficient margin of liquid assets to meet unanticipated deposit and loan fluctuations and overall funds management objectives; (ii) to provide eligible securities to secure public funds, trust deposits as prescribed by law and other borrowings; and (iii) to earn the maximum return on funds invested that is commensurate with meeting the requirements of (i) and (ii).
Funding Activities
Deposits are the primary source of funds for lending and investing activities, and their cost is the largest category of interest expense. Scheduled payments, as well as prepayments, and maturities from portfolios of loans and investment securities also provide a stable source of funds. Federal Home Loan Bank (“FHLB”) advances, other secured borrowings, Federal funds purchased and other short-term borrowed funds, as well as longer-term debt issued through the capital markets, all provide supplemental liquidity sources. BB&T’s funding activities are monitored and governed through BB&T’s overall asset/liability management process, which is further discussed in the “Market Risk Management” section in “Management’s Discussion and Analysis of Financial Condition and Results of Operations” herein. BB&T conducts its funding activities in compliance with all applicable laws and regulations. Following is a brief description of the various sources of funds used by BB&T. For further discussion relating to outstanding balances and balance fluctuations, refer to the “Deposits and Other Borrowings” section in “Management’s Discussion and Analysis of Financial Condition and Results of Operations” herein.
Deposits
Deposits are attracted principally from clients within BB&T’s branch network through the offering of a broad selection of deposit instruments to individuals and businesses, including noninterest-bearing checking accounts, interest-bearing checking accounts, savings accounts, money market deposit accounts, certificates of deposit and individual retirement accounts. Deposit account terms vary with respect to the minimum balance required, the time period the funds must remain on deposit and service charge schedules. Interest rates paid on specific deposit types are determined based on (i) the interest rates offered by competitors, (ii) the anticipated amount and timing of funding needs, (iii) the availability and cost of alternative sources of funding, and (iv) the anticipated future economic conditions and interest rates. Client deposits are attractive sources of funding because of their stability and relative cost. Deposits are regarded as an important part of the overall client relationship and provide opportunities to cross-sell other BB&T services. In addition, BB&T gathers a portion of its deposit base through wholesale funding products, which include negotiable certificates of deposit and Eurodollar deposits through the use of a Cayman branch facility. These sources of deposits represented approximately 7% of BB&T’s total deposits at both December 31, 2010 and December 31, 2009.
The following table provides information regarding the scheduled maturities of time deposits that are $100,000 and greater at December 31, 2010:
Table 6
Scheduled Maturities of Time Deposits $100,000 and Greater
December 31, 2010
(Dollars in millions)
| Maturity Schedule | ||||
|
Three months or less |
$ | 2,265 | ||
|
Over three through six months |
839 | |||
|
Over six through twelve months |
3,082 | |||
|
Over twelve months |
4,406 | |||
|
Total |
$ | 10,592 | ||
28
Table of Contents
Borrowed Funds
BB&T’s ability to borrow funds from nondeposit sources provides additional flexibility in meeting the liquidity needs of the Company. Short-term borrowings include Federal funds purchased, securities sold under repurchase agreements, master notes, short-term FHLB advances, U.S. Treasury tax and loan depository note accounts and other short-term borrowings. See Note 9 “Federal Funds Purchased, Securities Sold Under Agreements to Repurchase, and Short-Term Borrowed Funds” in the “Notes to Consolidated Financial Statements” herein for additional disclosures related to these types of borrowings.
BB&T also utilizes longer-term borrowings when management determines that the pricing and maturity options available through these sources create cost-effective options for funding asset growth and satisfying capital needs. BB&T’s long-term borrowings include long-term FHLB advances to Branch Bank, senior and subordinated debt issued by BB&T Corporation and Branch Bank, junior subordinated debt underlying trust preferred securities and capital leases. See Note 11 “Long-Term Debt” in the “Notes to Consolidated Financial Statements” herein for additional disclosures related to long-term borrowings.
Employees
At December 31, 2010, BB&T had approximately 31,400 full-time equivalent employees compared to approximately 32,400 full-time equivalent employees at December 31, 2009.
BB&T and its significant subsidiaries occupy headquarter offices that are either owned or operated under long-term leases. BB&T also owns free-standing operations centers, with its primary operations and information technology center located in Wilson, North Carolina. BB&T also owns or leases significant office space used as the Corporation’s headquarters in Winston-Salem, North Carolina. At December 31, 2010, Branch Bank operated 1,782 branch offices in North Carolina, South Carolina, Virginia, Maryland, Georgia, West Virginia, Tennessee, Kentucky, Alabama, Florida, Texas, Indiana and Washington, D.C. BB&T also operates numerous insurance agencies and other businesses that occupy facilities. Office locations are either owned or leased. Management believes that the premises occupied by BB&T and its subsidiaries are well-located and suitably equipped to serve as financial services facilities. See Note 6 “Premises and Equipment” in the “Notes to Consolidated Financial Statements” in this report for additional disclosures related to BB&T’s properties and other fixed assets.
Web Site Access to BB&T’s Filings with the Securities and Exchange Commission
All of BB&T’s electronic filings with the Securities and Exchange Commission (“SEC”), including the Annual Report on Form 10-K, Quarterly Reports on Form 10-Q, Current Reports on Form 8-K and amendments to these reports filed or furnished pursuant to Sections 13(a) or 15(d) of the Securities Exchange Act of 1934, as amended, are made available at no cost on the Corporation’s web site, www.BBT.com , through the Investor Relations link as soon as reasonably practicable after BB&T files such material with, or furnishes it to, the SEC. BB&T’s SEC filings are also available through the SEC’s web site at www.sec.gov .
Executive Officers of BB&T
|
Executive Officer |
Recent Work Experience |
Years of
Service |
Age | |||||||
|
Kelly S. King Chairman and Chief Executive Officer |
Chairman since January 2010. Chief Executive Officer since January 2009. Chief Operating Officer between June 2004 and December 2008. | 39 | 62 | |||||||
|
Christopher L. Henson Chief Operating Officer |
Chief Operating Officer since January 2009. Chief Financial Officer between July 2005 and December 2008. | 26 | 49 | |||||||
|
Daryl N. Bible Senior Executive Vice President and Chief Financial Officer |
Chief Financial Officer since January 2009. Assistant Chief Financial Officer between January 2008 and December 2008. Employed by U.S Bancorp for 24 years, serving as Treasurer for the final 10 years. | 3 | 49 | |||||||
29
Table of Contents
|
Executive Officer |
Recent Work Experience |
Years of
Service |
Age | |||||||
|
Ricky K. Brown Senior Executive Vice President and President, Community Banking |
President, Community Banking since July 2004. | 34 | 55 | |||||||
|
Barbara F. Duck Senior Executive Vice President and Enterprise Risk Manager |
Enterprise Risk Manager since July 2009. Electronic Delivery Channels Manager between July 2006 and June 2009. Risk Manager between June 2004 and June 2006. | 23 | 44 | |||||||
|
Donna C. Goodrich Senior Executive Vice President and Deposit Services Manager |
Deposit Services Manager since April 2004. | 25 | 48 | |||||||
|
Robert E. Greene Senior Executive Vice President and Administrative Group Manager |
Administrative Group Manager since August 2001. Risk Management Group Manager between July 2006 and June 2009. | 38 | 60 | |||||||
|
Clarke R. Starnes III Senior Executive Vice President and Chief Risk Officer |
Chief Risk Officer since July 2009. Chief Credit Officer between September 2008 and June 2009. Specialized Lending Manager between January 2000 and August 2008. | 29 | 51 | |||||||
|
Steven B. Wiggs Senior Executive Vice President and Chief Marketing Officer and Lending Group Manager |
Chief Marketing Officer since February 2005. Lending Group Manager since July 2009. | 32 | 53 | |||||||
|
C. Leon Wilson III Senior Executive Vice President and Operations Division Manager |
Operations Division Manager since July 1988. | 34 | 55 | |||||||
Equity Compensation Plan Information
The following table provides information concerning securities to be issued upon the exercise of outstanding equity-based awards, the weighted average price of such awards and the securities remaining available for future issuance as of December 31, 2010.
|
Plan Category |
(a)(1)
Number of securities to be issued upon exercise of outstanding options, warrants and rights |
(b)(1)
Weighted-average exercise price of outstanding options, warrants and rights |
(c)(1)(2)
Number of securities remaining available for future issuance under equity compensation plans (excluding securities reflected in (a)) |
|||||||||
|
Equity compensation plans approved by security holders |
57,857,286 | $ | 27.02 | 20,670,116 | ||||||||
|
Equity compensation plans not approved by security holders |
— | — | — | |||||||||
|
Total |
57,857,286 | 27.02 | 20,670,116 | |||||||||
| (1) | The table above does not include 116,631 options outstanding at December 31, 2010, at a weighted-average exercise price of $28.48, which are administered under First Virginia option plans that were assumed by BB&T in its acquisition by merger of First Virginia. No future options will be issued under the First Virginia plans. |
| (2) | All awards remaining available for future issuance will be issued under the terms of the BB&T Corporation 2004 Stock Incentive Plan, as amended by the Corporation’s shareholders at the 2009 Annual Meeting of Shareholders. |
30
Table of Contents
PERFORMANCE GRAPH
Set forth below is a graph comparing the total returns (assuming reinvestment of dividends) of BB&T Common Stock, the S&P 500 Index, and an Industry Peer Group Index. The graph assumes $100 invested on December 31, 2005 in BB&T Common Stock and in each of the indices. In 2010, the financial holding companies in the Industry Peer Group Index (the “Peer Group”) were Capital One Financial Corporation, Comerica Incorporated, Fifth-Third Bancorp, Huntington Bancshares, Incorporated, KeyCorp, M&T Bank Corporation, Marshall & Ilsley Corporation, PNC Financial Services Group, Inc., Regions Financial Corporation, SunTrust Banks, Inc., U.S. Bancorp and Zions Bancorporation. The Peer Group consists of financial and bank holding companies with assets between approximately $50 billion and $300 billion as of December 31, 2010.
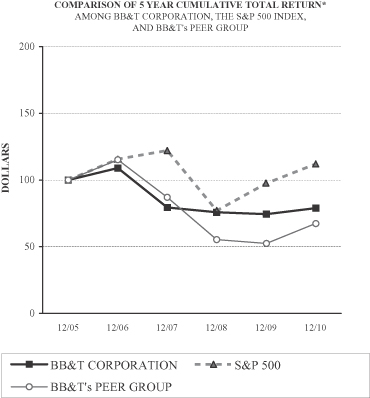
| * | $100 invested on 12/31/05 in stock or index, including reinvestment of dividends. Fiscal year ending December 31. |
| Cumulative Total Return | ||||||||||||||||||||||||
| 12/05 | 12/06 | 12/07 | 12/08 | 12/09 | 12/10 | |||||||||||||||||||
| BB&T CORPORATION | $ | 100.00 | $ | 108.92 | $ | 79.37 | $ | 75.94 | $ | 74.50 | $ | 78.92 | ||||||||||||
| S&P 500 | 100.00 | 115.79 | 122.16 | 77.10 | 97.50 | 112.19 | ||||||||||||||||||
| BB&T’s PEER GROUP | 100.00 | 115.24 | 87.07 | 55.37 | 52.56 | 67.50 | ||||||||||||||||||
31
Table of Contents
REGULATORY CONSIDERATIONS
The following discussion describes elements of an extensive regulatory framework applicable to bank holding companies, financial holding companies and banks and specific information about BB&T and its subsidiaries. Regulation of banks, bank holding companies and financial holding companies is intended primarily for the protection of depositors and the Deposit Insurance Fund (the “DIF”) rather than for the protection of shareholders and creditors. As described in more detail below, comprehensive reform of the legislative and regulatory landscape occurred during 2010 with the passage of the Dodd-Frank Wall Street Reform and Consumer Protection Act (the “Dodd-Frank Act”). In addition to banking laws, regulations and regulatory agencies, BB&T and its subsidiaries and affiliates are subject to various other laws and regulations and supervision and examination by other regulatory agencies, all of which directly or indirectly affect the operations and management of BB&T and its ability to make distributions to shareholders.
BB&T and its subsidiaries’ earnings are affected by general economic conditions, management policies, changes in state and federal laws and regulations and actions of various regulatory authorities, including those referred to in this section. Proposals to change the laws and regulations to which BB&T and its subsidiaries are subject are frequently introduced at both the federal and state levels. The likelihood and timing of any such changes and the impact such changes may have on BB&T and its subsidiaries are impossible to determine with any certainty. The description herein summarizes the significant state and federal laws to which BB&T and its subsidiaries currently are subject. To the extent statutory or regulatory provisions are described in this section, such descriptions are qualified in their entirety by reference to the particular statutory or regulatory provisions.
Financial Regulatory Reform
On July 21, 2010, President Obama signed the Dodd-Frank Act into law. The Dodd-Frank Act is extensive, complicated and comprehensive legislation that impacts practically all aspects of a banking organization, representing a significant overhaul of many aspects of the regulation of the financial services industry. Although many provisions remain subject to further rulemaking, the Dodd-Frank Act implements numerous and far-reaching changes that affect financial companies, including banks and bank holding companies such as BB&T, by, among other things:
| • |
Requiring regulation and oversight of large, systemically important financial institutions by establishing an interagency council on systemic risk and implementation of heightened prudential standards and regulation by the Board of Governors of the Federal Reserve System (the “Federal Reserve”) for systemically important financial institutions (including nonbank financial companies), as well as the implementation of the Federal Deposit Insurance Corporation (the “FDIC”) resolution procedures for liquidation of large financial companies to avoid market disruption; |
| • |
applying the same leverage and risk-based capital requirements that apply to insured depository institutions to most bank holding companies, savings and loan holding companies and systemically important nonbank financial companies; |
| • |
limiting the Federal Reserve’s emergency authority to lend to nondepository institutions to facilities with broad-based eligibility, and authorizing the FDIC to establish an emergency financial stabilization fund for solvent depository institutions and their holding companies, subject to the approval of Congress, the Secretary of the United States Department of the Treasury (the “U.S. Treasury”) and the Federal Reserve; |
| • |
centralizing responsibility for consumer financial protection by creating a new independent agency, the Consumer Financial Protection Bureau (“CFPB”), with responsibility for implementing, enforcing and examining for compliance with federal consumer financial laws; |
| • |
creating regimes for regulation of over-the-counter derivatives and non-admitted property and casualty insurers and reinsurers; |
| • |
requiring any interchange transaction fee charged for a debit transaction be “reasonable” and proportional to the cost incurred by the issuer for the transaction, the Federal Reserve is required to prescribe new regulations establishing such fee standards, eliminate exclusivity arrangements between |
32
Table of Contents
|
issuers and networks for debit card transactions and limit restrictions on merchant discounting for use of certain payment forms and minimum or maximum amount thresholds as a condition for acceptance of credit cards; |
| • |
transferring the functions of the Office of Thrift Supervision (“OTS”) relating to federal savings associations, including rulemaking authority, to the Comptroller of the Currency (“OCC”) within one year of the enactment date unless extended by up to six months by the Secretary of the U.S. Treasury; |
| • |
implementing regulation of hedge fund and private equity advisers by requiring such advisers to register with the SEC; |
| • |
providing for the implementation of corporate governance provisions for all public companies concerning proxy access and executive compensation; |
| • |
increasing the FDIC’s deposit insurance limits permanently to $250,000 for non-transaction accounts, providing for unlimited Federal deposit insurance on non-interest bearing demand transaction accounts at all insured depository institutions effective December 31, 2010 through December 31, 2012 and changing the assessment base as well as increasing the reserve ratio for the DIF to ensure the future strength of the DIF; and |
| • |
reforming regulation of credit rating agencies. |
Many of the provisions of the Dodd-Frank Act, including certain provisions described above are subject to further study, rulemaking, and the discretion of regulatory bodies. As hundreds of regulations called for by the Dodd-Frank Act are promulgated, BB&T will continue to evaluate the impact of any such regulations, such as changes in regulatory costs and fees, modifications to consumer products or disclosures required by the CFPB, the requirements of the enhanced supervision provisions, among others. Due to BB&T’s size, BB&T will be designated as “systemically significant” to the financial health of the U.S. economy and, as a result, may be subject to additional regulations by the Financial Stability Oversight Council (the “Council”), which will regulate the systemic risk of the financial system.
General
As a bank holding company and a financial holding company under federal law, BB&T is subject to regulation under the Bank Holding Company Act of 1956, as amended, (the “BHCA”) and the examination and reporting requirements of the Federal Reserve. Branch Bank and BB&T FSB are collectively referred to herein as the “Banks.” Branch Bank, a state-chartered commercial bank, is subject to regulation, supervision and examination by the North Carolina Commissioner of Banks. BB&T FSB, a federally chartered thrift institution, is subject to regulation, supervision and examination by the OTS, although under the recently enacted Dodd-Frank Act, the OTS’s functions relating to federally chartered thrift institutions are to be transferred to the OCC within one year of the July 21, 2010 date of enactment of the Dodd-Frank Act, unless otherwise extended by up to six months by the Secretary of the Treasury. Each of the Banks also is subject to regulation, supervision and examination by the FDIC.
State and federal law govern the activities in which the Banks engage, the investments they make and the aggregate amount of loans that may be granted to one borrower, although BB&T FSB is entitled to federal preemption of various state laws. Various consumer and compliance laws and regulations also affect the Banks’ operations. The Banks also are affected by the actions of the Federal Reserve as it attempts to control the monetary supply and credit availability in order to influence the economy.
In addition to federal and state banking laws and regulations, BB&T and certain of its subsidiaries and affiliates, including those that engage in securities underwriting, dealing, brokerage, investment advisory and insurance activities, are subject to other federal and state laws and regulations, and supervision and examination by other state and federal regulatory agencies and other regulatory authorities, including the SEC, the Financial Industry Regulatory Authority (the “FINRA”), the NYSE Euronext, Inc. (the “NYSE”), and various state insurance and securities regulators.
33
Table of Contents
Financial Holding Company Regulation
Under current federal law, a bank holding company, such as BB&T, may elect to become a financial holding company, which allows the holding company to offer customers virtually any type of service that is financial in nature or incidental thereto, including banking and activities closely related thereto, securities underwriting, insurance (both underwriting and agency) and merchant banking. In order to become and maintain its status as a financial holding company, a financial holding company and all of its affiliated depository institutions must be well-capitalized, well-managed, and have at least a satisfactory Community Reinvestment Act of 1977 (“CRA”) rating. If the Federal Reserve determines that a financial holding company is not well-capitalized or well-managed, the company has a period of time to come into compliance, but during the period of noncompliance, the Federal Reserve can place any limitations on the financial holding company that it believes to be appropriate. Furthermore, if the Federal Reserve determines that a financial holding company has not maintained a satisfactory CRA rating, the company will not be able to commence any new financial activities or acquire a company that engages in such activities, although the company will still be allowed to engage in activities closely related to banking and make investments in the ordinary course of conducting merchant banking activities. BB&T became a financial holding company on June 14, 2000, and currently satisfies the requirements to maintain its status as a financial holding company.
Most of the financial activities that are permissible for financial holding companies also are permissible for a “financial subsidiary” of one or more of the Banks, except for insurance underwriting, insurance company portfolio investments, real estate investments and development, and merchant banking, which must be conducted in a financial holding company. In order for these financial activities to be engaged in by a financial subsidiary of a bank, federal law requires the parent bank (and its sister-bank affiliates) to be well-capitalized and well-managed; the aggregate consolidated assets of all of that bank’s financial subsidiaries may not exceed the lesser of 45% of its consolidated total assets or $50 billion; the bank must have at least a satisfactory CRA rating; and, if that bank is one of the 100 largest national banks, it must meet certain financial rating or other comparable requirements.
Current federal law also establishes a system of functional regulation under which the Federal Reserve is the umbrella regulator for bank holding companies, but bank holding company affiliates are to be principally regulated by functional regulators such as the FDIC for state nonmember bank affiliates, the OTS for thrifts, the SEC for securities affiliates and state insurance regulators for insurance affiliates. Certain specific activities, including traditional bank trust and fiduciary activities may be conducted in the bank without the bank being deemed a “broker” or a “dealer” in securities for purposes of functional regulation. Although the states generally must regulate bank insurance activities in a nondiscriminatory manner, the states may continue to adopt and enforce rules that specifically regulate bank insurance activities in certain identifiable areas.
The Dodd-Frank Act establishes additional regulation for bank holding companies, which will generally apply to BB&T. The Council is required under the Dodd-Frank Act to monitor emerging risks to financial stability, recommend heightened prudential standards for large, interconnected financial companies and require certain non-bank financial companies to be supervised by the Federal Reserve if their activities are determined to pose a risk to financial stability.
The Dodd-Frank Act also imposes new prudential regulation on depository institutions and their holding companies. The law imposes new, more stringent standards and requirements with respect to (1) bank and nonbank acquisitions and mergers, (2) financial holding companies engaged in “financial activities,” (3) affiliate transactions and (4) proprietary trading, among other provisions.
Office of Thrift Supervision Regulation
As a federally chartered thrift, BB&T FSB is subject to regulation, supervision and examination by the OTS. In connection with the charter conversion of BB&T Bankcard Corporation to BB&T FSB, certain operating subsidiaries of BB&T and Branch Bank were transferred to BB&T FSB. Specifically, Sheffield Financial, LLC and MidAmerica Gift Certificate Company, which were previously direct operating subsidiaries of BB&T, became divisions or subsidiaries of BB&T FSB. BB&T Credit Services, Inc. and Liberty Mortgage Corporation (which ceased operations during 2010) were previously subsidiaries of Branch Bank and reorganized as subsidiaries of BB&T FSB. These organizational structure changes were made to optimize the operating efficiency of these
34
Table of Contents
divisions or subsidiaries and have no material impact on BB&T’s reportable segments. Oversight functions relating to federal savings associations, including rulemaking authority, are to be transferred under the Dodd-Frank Act to the OCC within one year of the July 21, 2010 date of enactment, unless extended by up to six months by the Secretary of the Treasury. Although the Dodd-Frank Act preserves federal thrift charters, the Comptroller of the Currency is required to appoint a new Deputy Comptroller who will be responsible for supervising and examining federal savings associations, effective as of the date the OTS is transferred to the OCC. The Dodd-Frank Act also eliminates the preemption of state consumer protection laws as applied to the operating subsidiaries of federally chartered thrifts, which may cause BB&T FSB to further reconsider its existing organizational structure and operations in the future.
Acquisitions
BB&T complies with numerous laws related to its acquisition activity. Under the BHCA, a bank holding company may not directly or indirectly acquire ownership or control of more than 5% of the voting shares or substantially all of the assets of any bank holding company or bank or merge or consolidate with another bank holding company without the prior approval of the Federal Reserve. Current federal law authorizes interstate acquisitions of banks and bank holding companies without geographic limitation. Furthermore, a bank headquartered in one state is authorized to merge with a bank headquartered in another state, subject to any state requirement that the target bank shall have been in existence and operating for a minimum period of time, not to exceed five years; and subject to certain deposit market-share limitations. After a bank has established branches in a state through an interstate merger transaction, the bank may establish and acquire additional branches at any location in the state where a bank headquartered in that state could have established or acquired branches under applicable federal or state law. These regulatory considerations are applicable to privately negotiated acquisition transactions.
In August 2009, Branch Bank acquired certain assets of Colonial, including a substantial majority of its loan portfolio, and assumed certain liabilities of Colonial from the FDIC, as receiver of Colonial. In connection with such FDIC-assisted transactions, acquirers will generally enter into purchase and assumption, loss-sharing and other agreements which may contain additional regulatory covenants or limitations. BB&T may from time to time explore acquisition opportunities, through both FDIC-assisted and unassisted transactions, as market conditions may warrant.
Other Safety and Soundness Regulations
The Federal Reserve has enforcement powers over bank holding companies and their nonbanking subsidiaries. The Federal Reserve has authority to prohibit activities that represent unsafe or unsound practices or constitute violations of law, rule, regulation, administrative order or written agreement with a federal regulator. These powers may be exercised through the issuance of cease and desist orders, civil money penalties or other actions.
There also are a number of obligations and restrictions imposed on bank holding companies and their depository institution subsidiaries by federal law and regulatory policy that are designed to reduce potential loss exposure to the depositors of such depository institutions and to the FDIC insurance fund in the event the depository institution is insolvent or is in danger of becoming insolvent. For example, under requirements of the Federal Reserve with respect to bank holding company operations, a bank holding company is required to serve as a source of financial strength to its subsidiary depository institutions and to commit financial resources to support such institutions in circumstances where it might not do so otherwise. In addition, the “cross-guarantee” provisions of federal law require insured depository institutions under common control to reimburse the FDIC for any loss suffered or reasonably anticipated by the DIF as a result of the insolvency of commonly controlled insured depository institutions or for any assistance provided by the FDIC to commonly controlled insured depository institutions in danger of failure. The FDIC may decline to enforce the cross-guarantee provision if it determines that a waiver is in the best interests of the DIF. The FDIC’s claim for reimbursement under the cross-guarantee provisions is superior to claims of shareholders of the insured depository institution or its holding company but is subordinate to claims of depositors, secured creditors and nonaffiliated holders of subordinated debt of the commonly controlled insured depository institution.
35
Table of Contents
Federal and state banking regulators also have broad enforcement powers over the Banks, including the power to impose fines and other civil and criminal penalties, and to appoint a conservator (with the approval of the Governor in the case of a North Carolina state bank) in order to conserve the assets of any such institution for the benefit of depositors and other creditors. The North Carolina Commissioner of Banks also has the authority to take possession of a North Carolina state bank in certain circumstances, including, among other things, when it appears that such bank has violated its charter or any applicable laws, is conducting its business in an unauthorized or unsafe manner, is in an unsafe or unsound condition to transact its business or has an impairment of its capital stock.
Payment of Dividends
BB&T Corporation is a legal entity separate and distinct from the Banks and its subsidiaries. The majority of BB&T’s revenue is from dividends paid to BB&T by Branch Bank. The Banks are subject to laws and regulations that limit the amount of dividends they can pay. In addition, BB&T and the Banks are subject to various regulatory restrictions relating to the payment of dividends, including requirements to maintain capital at or above regulatory minimums, and to remain “well-capitalized” under the prompt corrective action regulations summarized elsewhere in this section. Federal banking regulators have indicated that banking organizations should generally pay dividends only if (1) the organization’s net income available to common shareholders over the past year has been sufficient to fully fund the dividends and (2) the prospective rate of earnings retention appears consistent with the organization’s capital needs, asset quality and overall financial condition. In November 2010, the Federal Reserve released additional guidance re-emphasizing the Federal Reserve’s expectations concerning the processes that firms that participated in the Supervisory Capital Assessment Program (“SCAP”), like BB&T, should have in place to ensure that they hold adequate capital under adverse conditions to maintain ready access to funding. Any request by a bank holding company subject to SCAP, such as BB&T, to increase dividends on common stock, reinstate or increase repurchase programs or make other capital distributions will be evaluated based on the Federal Reserve’s assessment of capital adequacy.
North Carolina law states that, subject to certain capital requirements, the board of directors of a bank chartered under the laws of North Carolina may declare a dividend of as much of that bank’s undivided profits as the directors deem appropriate.
Capital
Each of the federal banking agencies, including the Federal Reserve, the FDIC and the OTS, has issued substantially similar risk-based and leverage capital guidelines applicable to banking organizations they supervise, including bank holding companies and banks. Under the risk-based capital requirements, BB&T and the Banks are each generally required to maintain a minimum ratio of total capital to risk-weighted assets (including certain off-balance sheet activities, such as standby letters of credit) of 8%. At least half of the total capital must be composed of common shareholders’ equity excluding the over- or underfunded status of postretirement benefit obligations, unrealized gains or losses on debt securities available for sale, unrealized gains on equity securities available for sale and unrealized gains or losses on cash flow hedges, net of deferred income taxes; plus certain mandatorily redeemable capital securities; less nonqualifying intangible assets net of applicable deferred income taxes and certain nonfinancial equity investments. This is called “Tier 1 capital.” The remainder may consist of qualifying subordinated debt, certain hybrid capital instruments, qualifying preferred stock and a limited amount of the allowance for credit losses. This is called “Tier 2 capital.” Tier 1 capital and Tier 2 capital combined are referred to as total regulatory capital.
The Federal Reserve requires bank holding companies that engage in trading activities to adjust their risk-based capital ratios to take into consideration market risks that may result from movements in market prices of covered trading positions in trading accounts, or from foreign exchange or commodity positions, whether or not in trading accounts, including changes in interest rates, equity prices, foreign exchange rates or commodity prices. Any capital required to be maintained under these provisions may consist of “Tier 3 capital” consisting of forms of short-term subordinated debt.
Each of the federal bank regulatory agencies, including the Federal Reserve, the FDIC and the OTS, also has established minimum leverage capital requirements for banking organizations. These requirements provide
36
Table of Contents
that banking organizations that meet certain criteria, including excellent asset quality, high liquidity, low interest rate exposure and good earnings, and that have received the highest regulatory rating must maintain a ratio of Tier 1 capital to total adjusted average assets of at least 3%. Institutions not meeting these criteria, as well as institutions with supervisory, financial or operational weaknesses, are expected to maintain a minimum Tier 1 capital to total adjusted average assets ratio at least 100 basis points above that stated minimum. Holding companies experiencing internal growth or making acquisitions are expected to maintain strong capital positions substantially above the minimum supervisory levels without significant reliance on intangible assets. The Federal Reserve also continues to consider a “tangible Tier 1 capital leverage ratio” (deducting all intangibles) and other indicators of capital strength in evaluating proposals for expansion or new activity.
In addition, the Federal Reserve, the FDIC and the OTS all have adopted risk-based capital standards that explicitly identify concentrations of credit risk and the risk arising from non-traditional activities, as well as an institution’s ability to manage these risks, as important factors to be taken into account by each agency in assessing an institution’s overall capital adequacy. The capital guidelines also provide that an institution’s exposure to a decline in the economic value of its capital due to changes in interest rates be considered by the agency as a factor in evaluating a banking organization’s capital adequacy. The agencies also require banks and bank holding companies to adjust their regulatory capital to take into consideration the risk associated with certain recourse obligations, direct credit subsidies, residual interest and other positions in securitized transactions that expose banking organizations to credit risk.
As part of the Dodd-Frank Act, provisions were added that require federal banking agencies to develop capital requirements that address systemically risky activities. The effect of these capital rules will disallow trust preferred securities from counting as Tier 1 capital at the holding company level for entities with greater than $15 billion in assets with a three-year phase-in period beginning on January 1, 2013.
In addition, in 2010, the Group of Governors and Heads of Supervisors of the Basel Committee on Banking Supervision, the oversight body of the Basel Committee, published its “calibrated” capital standards for major banking institutions (“Basel III”). Under these standards, when fully phased in on January 1, 2019, banking institutions will be required to maintain heightened Tier 1 common equity, Tier 1 capital and total capital ratios, as well as maintaining a “capital conservation buffer.” The Tier 1 common equity and Tier 1 capital ratio requirements will be phased in incrementally between January 1, 2013 and January 1, 2015; the deductions from common equity made in calculating Tier 1 common equity (for example, for mortgage servicing assets, deferred tax assets and investments in unconsolidated financial institutions) will be phased in incrementally over a four-year period commencing on January 1, 2014; and the capital conservation buffer will be phased in incrementally between January 1, 2016 and January 1, 2019. The Basel Committee also announced that a “countercyclical buffer” of 0% to 2.5% of common equity or other fully loss-absorbing capital “will be implemented according to national circumstances” as an “extension” of the conservation buffer. The final package of Basel III reforms were approved by the G20 leaders in November 2010 and are subject to individual adoption by member nations, including the United States. If the foregoing revised capital standards are adopted in their current form, BB&T estimates these standards would have a negligible impact on BB&T’s ability to comply with the revised regulatory capital ratios based on BB&T’s current understanding of the revisions to capital qualification.
The ratios of Tier 1 capital and total capital to risk-weighted assets, and Tier 1 capital to adjusted average assets of BB&T, Branch Bank and BB&T FSB as of December 31, 2010, are shown in the following table.
Table 7
Capital Adequacy Ratios of BB&T Corporation and Banks
December 31, 2010
|
Regulatory
Minimums |
Regulatory
Minimums to be Well- Capitalized |
BB&T |
Branch
Bank |
BB&T
FSB |
||||||||||||||||
|
Risk-based capital ratios: |
||||||||||||||||||||
|
Tier 1 capital |
4.0 | % | 6.0 | % | 11.8 | % | 13.0 | % | 15.0 | % | ||||||||||
|
Total risk-based capital |
8.0 | 10.0 | 15.5 | 15.5 | 16.3 | |||||||||||||||
|
Tier 1 leverage ratio |
3.0 | 5.0 | 9.1 | 9.9 | 14.3 | |||||||||||||||
37
Table of Contents
The federal banking agencies, including the Federal Reserve, the FDIC and the OTS, are required to take “prompt corrective action” in respect of depository institutions and their bank holding companies that do not meet minimum capital requirements. The law establishes five capital categories for insured depository institutions for this purpose: “well-capitalized,” “adequately capitalized,” “undercapitalized,” “significantly undercapitalized” and “critically undercapitalized.” To be considered “well-capitalized” under these standards, an institution must maintain a total risk-based capital ratio of 10% or greater; a Tier 1 risk-based capital ratio of 6% or greater; a leverage capital ratio of 5% or greater; and must not be subject to any order or written directive to meet and maintain a specific capital level for any capital measure.
BB&T, Branch Bank and BB&T FSB are all classified as “well-capitalized.” Federal law also requires the bank regulatory agencies to implement systems for “prompt corrective action” for institutions that fail to meet minimum capital requirements within the five capital categories, with progressively more severe restrictions on operations, management and capital distributions according to the category in which an institution is placed. Failure to meet capital requirements also may cause an institution to be directed to raise additional capital. Federal law also mandates that the agencies adopt safety and soundness standards relating generally to operations and management, asset quality and executive compensation, and authorizes administrative action against an institution that fails to meet such standards.
In addition to the “prompt corrective action” directives, failure to meet capital guidelines may subject a banking organization to a variety of other enforcement remedies, including additional substantial restrictions on its operations and activities, termination of deposit insurance by the FDIC and, under certain conditions, the appointment of a conservator or receiver.
Deposit Insurance Assessments
The deposits of the Banks are insured by the DIF of the FDIC up to the limits set forth under applicable law and are subject to the deposit insurance premium assessments of the DIF. The FDIC imposes a risk-based deposit premium assessment system, which was amended pursuant to the Federal Deposit Insurance Reform Act of 2005 (the “Reform Act”) and further amended by the Dodd-Frank Act. Under this system, as amended, the assessment rates for an insured depository institution vary according to the level of risk incurred in its activities. To arrive at an assessment rate for a banking institution, the FDIC places it in one of four risk categories determined by reference to its capital levels and supervisory ratings. In addition, in the case of those institutions in the lowest risk category, the FDIC further determines its assessment rate based on certain specified financial ratios or, if applicable, its long-term debt ratings. The assessment rate schedule can change from time to time, at the discretion of the FDIC, subject to certain limits. On November 12, 2009, the FDIC adopted a rule requiring banks to prepay three years’ worth of premiums to replenish the depleted insurance fund. The FDIC has published guidelines under the Reform Act on the adjustment of assessment rates for certain institutions. Under the current system, premiums are assessed quarterly. In addition, insured deposits have been required to pay a pro rata portion of the interest due on the obligations issued by the Financing Corporation (“FICO”) to fund the closing and disposal of failed thrift institutions by the Resolution Trust Corporation.
The Dodd-Frank Act imposes additional assessments and costs with respect to deposits. Under the Dodd-Frank Act, the FDIC is directed to impose deposit insurance assessments based on total assets rather than total deposits, as well as making permanent the increase of deposit insurance to $250,000 and providing for full insurance of non-interest bearing transaction accounts beginning December 31, 2010, for two years. The Federal Reserve is also directed to collect fees from systemically important companies to cover the costs associated with its supervisory and regulatory responsibilities with respect to such companies. In February 2011, the FDIC adopted a final rule on the deposit insurance assessment system. The rule is effective as of April 1, 2011 and revises the assessment system applicable to large banks, such as BB&T, to comply with Dodd-Frank and also includes a revised assessment rate process with the goal of differentiating insured depository institutions who pose greater risk to the DIF. The first assessments under the new rule will be payable in the third quarter of 2011.
38
Table of Contents
Consumer Protection Laws
In connection with their lending and leasing activities, each of the Banks is subject to a number of federal and state laws designed to protect borrowers and promote lending to various sectors of the economy and population. These laws include the Equal Credit Opportunity Act, the Fair Credit Reporting Act, the Truth in Lending Act, the Home Mortgage Disclosure Act, the Real Estate Settlement Procedures Act, and their respective state law counterparts.
The Dodd-Frank Act creates a new, independent federal agency, the CFPB, which is granted broad rulemaking, supervisory and enforcement powers under various federal consumer financial protection laws, including the laws referenced above and certain other statutes. The CFPB will have examination and primary enforcement authority with respect to depository institutions with $10 billion or more in assets. Smaller institutions will be subject to rules promulgated by the CFPB but will continue to be examined and supervised by federal banking regulators for consumer compliance purposes. The CFPB will have authority to prevent unfair, deceptive or abusive practices in connection with the offering of consumer financial products. The Dodd-Frank Act authorizes the CFPB to establish certain minimum standards for the origination of residential mortgages including a determination of the borrower’s ability to repay. In addition, the Dodd-Frank Act will allow borrowers to raise certain defenses to foreclosure if they receive any loan other than a “qualified mortgage” as defined by the CFPB. The Dodd-Frank Act permits states to adopt consumer protection laws and standards that are more stringent than those adopted at the federal level and, in certain circumstances, permits state attorneys general to enforce compliance with both the state and federal laws and regulations
The Dodd-Frank Act also requires the Federal Reserve to adopt rules regarding the interchange fees that may be charged with respect to electronic debit transactions. The limits to be placed on debit interchange fees may significantly reduce BB&T’s debit card interchange revenues. Interchange fees, or “swipe” fees, are charges that merchants pay to BB&T and other credit card companies and card-issuing banks for processing electronic payment transactions. The Dodd-Frank Act provides the Federal Reserve with authority over interchange fees received or charged by a card issuer, requiring that fees must be “reasonable and proportional” to the costs of processing such transactions. Although final rules have not yet been adopted, this provision of the Dodd-Frank Act and the applicable rules ultimately promulgated thereunder are expected to cause significant reductions in future card-fee revenues generated by BB&T, while also creating meaningful compliance costs.
Federal law currently contains extensive customer privacy protection provisions. Under these provisions, a financial institution must provide to its customers, at the inception of the customer relationship and annually thereafter, the institution’s policies and procedures regarding the handling of customers’ nonpublic personal financial information. These provisions also provide that, except for certain limited exceptions, an institution may not provide such personal information to unaffiliated third parties unless the institution discloses to the customer that such information may be so provided and the customer is given the opportunity to opt out of such disclosure. Federal law makes it a criminal offense, except in limited circumstances, to obtain or attempt to obtain customer information of a financial nature by fraudulent or deceptive means.
The CRA requires the Banks’ primary federal bank regulatory agency, the FDIC for Branch Bank and the OTS for BB&T FSB, to assess the bank’s record in meeting the credit needs of the communities served by each Bank, including low- and moderate-income neighborhoods and persons. Institutions are assigned one of four ratings: “Outstanding,” “Satisfactory,” “Needs to Improve” or “Substantial Noncompliance.” This assessment is reviewed for any bank that applies to merge or consolidate with or acquire the assets or assume the liabilities of an insured depository institution, or to open or relocate a branch office. The CRA record of each subsidiary bank of a financial holding company, such as BB&T, also is assessed by the Federal Reserve in connection with any acquisition or merger application.
Automated Overdraft Payment Regulation
The Federal Reserve and FDIC have recently enacted consumer protection regulations related to automated overdraft payment programs offered by financial institutions. In November 2009, the Federal Reserve amended its Regulation E to prohibit financial institutions, including BB&T, from charging consumers fees for paying
39
Table of Contents
overdrafts on automated teller machine and one-time debit card transactions, unless a consumer consents, or opts in, to the overdraft service for those types of transactions. The Regulation E amendments also require financial institutions to provide consumers with a notice that explains the financial institution’s overdraft services, including the fees associated with the service and the consumer’s choices. BB&T has completed its implementation of the changes as required by the Regulation E amendments.
In November 2010, the FDIC supplemented the Regulation E amendments by requiring FDIC-supervised institutions, including Branch Bank, to implement additional changes relating to automated overdraft payment programs by July 1, 2011. The most significant of these changes require financial institutions to monitor overdraft payment programs for “excessive or chronic” customer use and undertake “meaningful and effective” follow-up action with customers that overdraw their accounts more than six times during a rolling 12-month period. The additional guidance also imposes daily limits on overdraft charges, requires institutions to review and modify check-clearing procedures, prominently distinguish account balances from available overdraft coverage amounts and requires increased board and management oversight regarding overdraft payment programs. Branch Bank has already begun to implement many of the changes required by the FDIC guidance, and is working to implement others in advance of the July 1, 2011 compliance date.
USA Patriot Act
The USA Patriot Act of 2001 (the “Patriot Act”) contains anti-money laundering measures affecting insured depository institutions, broker-dealers and certain other financial institutions. The Patriot Act includes the International Money Laundering Abatement and Financial Anti-Terrorism Act of 2001 (the “IMLAFA”). The IMLAFA requires such financial institutions to implement policies and procedures to combat money laundering and the financing of terrorism and grants the Secretary broad authority to establish regulations and to impose requirements and restrictions on financial institutions’ operations. In addition, the Patriot Act requires the federal bank regulatory agencies to consider the effectiveness of a financial institution’s anti-money laundering activities when reviewing bank mergers and bank holding company acquisitions. The Treasury Department has issued a number of regulations implementing the Patriot Act, which impose obligations on financial institutions to maintain appropriate policies, procedures and controls to detect, prevent and report money laundering and terrorist financing. The obligations of financial institutions under the Patriot Act have increased, and may continue to increase. The increase in obligations of financial institutions has resulted in increased costs for BB&T, which may continue to rise, and also may subject BB&T to additional liability.
Sarbanes-Oxley Act of 2002
The Sarbanes-Oxley Act of 2002 (the “Sarbanes-Oxley Act”) comprehensively revised the laws affecting corporate governance, accounting obligations and corporate reporting for companies, such as BB&T, with equity or debt securities registered under the Securities Exchange Act of 1934, as amended. In particular, the Sarbanes-Oxley Act established: (1) requirements for audit committees, including independence, expertise, and responsibilities; (2) certification responsibilities for the Chief Executive Officer and the Chief Financial Officer with respect to the Company’s financial statements; (3) standards for auditors and regulation of audits; (4) disclosure and reporting obligations for reporting companies and their directors and executive officers; and (5) civil and criminal penalties for violation of the federal securities laws.
Future Laws, Regulations and Governmental Programs
Various laws, regulations and governmental programs affecting financial institutions and the financial industry are from time to time introduced in Congress or otherwise promulgated by regulatory agencies. Such measures may change the operating environment of BB&T and its subsidiaries in substantial and unpredictable ways. The nature and extent of future legislative, regulatory or other changes affecting financial institutions is very unpredictable at this time.
Other Regulatory Matters
BB&T and its subsidiaries and affiliates are subject to numerous examinations by federal and state banking regulators, as well as the SEC, the FINRA, the NYSE, various taxing authorities and various state insurance and securities regulators. BB&T and its subsidiaries have from time to time received requests for information
40
Table of Contents
from regulatory authorities in various states, including state insurance commissions and state attorneys general, securities regulators and other regulatory authorities, concerning their business and accounting practices. Such requests are considered incidental to the normal conduct of business.
Corporate Governance
Information with respect to BB&T’s Board of Directors, Executive Officers and corporate governance policies and principles is presented on BB&T’s web site, www.BBT.com , and includes:
| · |
BB&T’s Corporate Governance Guidelines |
| · |
BB&T’s Corporate Board of Directors |
| · |
Committees of the Corporate Board of Directors and Committee Charters |
| · |
BB&T’s Codes of Ethics for Directors, Senior Financial Officers and Employees |
| · |
Chief Executive Officer and Chief Financial Officer Certifications |
| · |
BB&T’s Executive Officers |
| · |
BB&T’s Policy and Procedures for Accounting and Legal Complaints |
BB&T intends to disclose any substantive amendments or waivers to the Codes of Ethics for Directors or Senior Financial Officers on BB&T’s web site at www.BBT.com/Investor .
NYSE Certification
The annual certification of BB&T’s Chief Executive Officer required to be furnished to the NYSE pursuant to Section 303A.12(a) of the NYSE Listed Company Manual was previously filed with the NYSE on May 26, 2010.
41
Table of Contents
MANAGEMENT’S DISCUSSION AND ANALYSIS OF
FINANCIAL CONDITION AND RESULTS OF OPERATIONS
Overview
The following discussion and analysis of the consolidated financial condition and consolidated results of operations of BB&T Corporation and its subsidiaries for each of the three years in the period ended December 31, 2010, and related financial information, are presented in conjunction with the consolidated financial statements and related notes to assist in the evaluation of BB&T’s 2010 performance.
Reclassifications
In certain circumstances, reclassifications have been made to prior period information to conform to the 2010 presentation. Such reclassifications had no effect on previously reported shareholders’ equity or net income.
Critical Accounting Policies
The accounting and reporting policies of BB&T Corporation and its subsidiaries are in accordance with accounting principles generally accepted in the United States of America and conform to the accounting and reporting guidelines prescribed by bank regulatory authorities. BB&T’s financial position and results of operations are affected by management’s application of accounting policies, including estimates, assumptions and judgments made to arrive at the carrying value of assets and liabilities and amounts reported for revenues and expenses. Different assumptions in the application of these policies could result in material changes in BB&T’s consolidated financial position and/or consolidated results of operations and related disclosures. The more critical accounting and reporting policies include BB&T’s accounting for the allowance for loan and lease losses and reserve for unfunded lending commitments, determining fair value of financial instruments, intangible assets and other purchase accounting related adjustments associated with mergers and acquisitions, costs and benefit obligations associated with BB&T’s pension and postretirement benefit plans, and income taxes. Understanding BB&T’s accounting policies is fundamental to understanding BB&T’s consolidated financial position and consolidated results of operations. Accordingly, BB&T’s significant accounting policies and changes in accounting principles and effects of new accounting pronouncements are discussed in detail in Note 1 in the “Notes to Consolidated Financial Statements.”
The following is a summary of BB&T’s critical accounting policies that are highly dependent on estimates, assumptions and judgments. These critical accounting policies are reviewed with the Audit Committee of BB&T’s Board of Directors on a periodic basis.
Allowance for Loan and Lease Losses and Reserve for Unfunded Lending Commitments
It is the policy of BB&T to maintain an allowance for loan and lease losses and a reserve for unfunded lending commitments that represent management’s best estimate of probable credit losses inherent in the portfolio at the balance sheet date. Estimates for loan and lease losses are determined by analyzing historical loan and lease losses, historical loan and lease migration to charge-off experience, current trends in delinquencies and charge-offs, expected cash flows on purchased loans, current assessment of problem loan and lease administration, the results of regulatory examinations, and changes in the size, composition and risk assessment of the loan and lease portfolio. For restructured loans, re-default expectations and estimated slower prepayment speeds are incorporated in the determination of the allowance for loan and lease losses. Also included in management’s estimates for loan and lease losses are considerations with respect to the impact of current economic events, the outcomes of which are uncertain. These events may include, but are not limited to, fluctuations in overall interest rates, political conditions, legislation that may directly or indirectly affect the banking industry and economic conditions affecting specific geographical areas and industries in which BB&T conducts business. The methodology used to determine an estimate for the reserve for unfunded lending commitments is inherently similar to the methodology used in calculating the allowance for loans and leases adjusted for factors specific to binding commitments, including the probability of funding and exposure at the time of funding. A detailed discussion of the methodology used in determining the allowance for loan and lease losses and the reserve for unfunded lending commitments is included in the “Overview and Description of Business—Allowance for Loan and Lease Losses and Reserve for Unfunded Lending Commitments.”
42
Table of Contents
Fair Value of Financial Instruments
A significant portion of BB&T’s assets and certain liabilities are financial instruments carried at fair value. This includes securities available for sale, trading securities, derivatives, certain loans held for sale, residential mortgage servicing rights, certain short-term borrowings and venture capital investments. At December 31, 2010, the percentage of total assets and total liabilities measured at fair value was 18.5% and less than 1%, respectively. The vast majority of assets and liabilities carried at fair value are based on either quoted market prices or market prices for similar instruments. At December 31, 2010, 7.6% of assets measured at fair value were based on significant unobservable inputs. This is approximately 1% of BB&T’s total assets. See Note 19 “Fair Value Disclosures” in the “Notes to Consolidated Financial Statements” herein for additional disclosures regarding the fair value of financial instruments.
Securities
The fair values for available-for-sale and trading securities are generally based upon quoted market prices or observable market prices for similar instruments. BB&T generally utilizes a third-party pricing service in determining the fair value of its securities portfolio. The pricing service uses observable inputs when available including benchmark yields, reported trades, broker-dealer quotes, issuer spreads, benchmark securities, bids and offers. These values take into account recent market activity as well as other market observable data such as interest rate, spread and prepayment information. When market observable data is not available, which generally occurs due to the lack of liquidity for certain securities, the valuation of the security is subjective and may involve substantial judgment by management. As of December 31, 2010, BB&T had approximately $1.1 billion of available-for-sale securities, which is less than 1% of total assets, valued using unobservable inputs. This total includes $954 million of non-agency mortgage-backed securities that are covered by a loss sharing agreement with the FDIC and $126 million of auction-rate securities. BB&T periodically reviews available-for-sale securities with an unrealized loss. An unrealized loss exists when the current fair value of an individual security is less than its amortized cost basis. The purpose of the review is to consider the length of time and the extent to which the market value of a security has been below its amortized cost. The primary factors BB&T considers in determining whether an impairment is other-than-temporary are long term expectations and recent experience regarding principal and interest payments, and BB&T’s intent to sell and whether it is more likely than not that the Company would be required to sell those securities before the anticipated recovery of the amortized cost basis.
Mortgage Servicing Rights
BB&T has a significant mortgage loan servicing portfolio and related mortgage servicing rights (“MSRs”). BB&T has two primary classes of MSRs for which it separately manages the economic risk: residential and commercial. Residential MSRs are primarily carried at fair value with changes in fair value recorded as a component of mortgage banking income each period. BB&T uses various derivative instruments to mitigate the income statement effect of changes in fair value, due to changes in valuation inputs and assumptions, of its residential MSRs. MSRs do not trade in an active, open market with readily observable prices. While sales of MSRs do occur, the precise terms and conditions typically are not readily available. Accordingly, BB&T estimates the fair value of residential MSRs using an option adjusted spread (“OAS”) valuation model to project MSR cash flows over multiple interest rate scenarios, which are then discounted at risk-adjusted rates. The OAS model considers portfolio characteristics, contractually specified servicing fees, prepayment assumptions, delinquency rates, late charges, other ancillary revenue, costs to service and other economic factors. BB&T reassesses and periodically adjusts the underlying inputs and assumptions in the OAS model to reflect market conditions and assumptions that a market participant would consider in valuing the MSR asset. When available, fair value estimates and assumptions are compared to observable market data and to recent market activity and actual portfolio experience. Due to the nature of the valuation inputs, MSRs are classified within Level 3 of the valuation hierarchy. The value of MSRs is significantly affected by mortgage interest rates available in the marketplace, which influence mortgage loan prepayment speeds. In general, during periods of declining interest rates, the value of MSRs declines due to increasing prepayments attributable to increased mortgage-refinance activity. Conversely, during periods of rising interest rates, the value of MSRs generally increases due to reduced refinance activity. Commercial MSRs are carried at lower of cost or market and amortized over the estimated period that servicing income is expected to be received based on projections of the amount and timing of estimated future cash flows. The amount and timing of servicing asset amortization is updated based on actual
43
Table of Contents
results and updated projections. In addition, BB&T has approximately $11 million of residential MSRs that are valued at the lower of cost or market. These MSRs are associated with government sponsored programs that have prepayment assumptions that are difficult to model, which make it difficult to hedge the associated risk. Please refer to Note 8 “Loan Servicing” in the “Notes to Consolidated Financial Statements” for quantitative disclosures reflecting the effect that changes in management’s assumptions would have on the fair value of MSRs.
Loans Held for Sale
BB&T originates certain mortgage loans to be sold to investors that are carried at fair value. The fair value is primarily based on quoted market prices for securities backed by similar types of loans. Changes in the fair value are recorded as a component of mortgage banking income while mortgage loan origination costs for loans held for sale for which the Corporation elected the Fair Value Option are recognized in noninterest expense when incurred. The changes in fair value of these assets are largely driven by changes in interest rates subsequent to loan funding and changes in the fair value of servicing associated with the mortgage loan held for sale. BB&T uses various derivative instruments to mitigate the economic effect of changes in fair value of the underlying loans.
In addition, as of December 31, 2010, BB&T held $521 million of nonaccrual commercial loans accounted for at the lower of cost or market in the loans held for sale portfolio. These loans were originated as loans held for investment and transferred to the loans held for sale portfolio based on management’s nonperforming asset disposition strategy.
Derivative Assets and Liabilities
BB&T uses derivatives to manage various financial risks. The fair values of derivative financial instruments are determined based on quoted market prices, dealer quotes and internal pricing models that are primarily sensitive to market observable data. BB&T mitigates the credit risk by subjecting counterparties to credit reviews and approvals similar to those used in making loans and other extensions of credit. In addition, certain counterparties are required to provide collateral to BB&T when their unsecured loss positions exceed certain negotiated limits. The fair value of interest rate lock commitments, which are related to mortgage loan commitments, is based on quoted market prices adjusted for commitments that BB&T does not expect to fund and includes the value attributable to the net servicing fee.
Venture Capital and Similar Investments
BB&T has venture capital and similar investments that are carried at fair value. Changes in the fair value of these investments are recorded in other noninterest income each period. In many cases there are no observable market values for these investments and therefore management must estimate the fair value based on a comparison of the operating performance of the company to multiples in the marketplace for similar entities. This analysis requires significant judgment and actual values in a sale could differ materially from those estimated. As of December 31, 2010, BB&T had $266 million of venture capital investments, which is less than 1% of total assets.
Intangible Assets
BB&T’s mergers and acquisitions are accounted for using the acquisition method of accounting. Under the acquisition method, BB&T is required to record the assets acquired, including identified intangible assets, and liabilities assumed at their fair value, which often involves estimates based on third party valuations, such as appraisals, or internal valuations based on discounted cash flow analyses or other valuation techniques, all of which are inherently subjective. The amortization of identified intangible assets is based upon the estimated economic benefits to be received, which is also subjective. Acquisitions typically result in goodwill, which is subject to ongoing periodic impairment tests based on the fair value of net assets acquired compared to their carrying value. Please refer to Note 1 “Summary of Significant Accounting Policies” in the “Notes to Consolidated Financial Statements” for a description of BB&T’s impairment testing process. The major assumptions used in the impairment testing process include the estimated future cash flows of each business unit and discount rates. Discount rates are unique to each business unit and are based upon the cost of capital specific to the industry in which the business unit operates. Management evaluated the sensitivity of the significant assumptions in its impairment analysis including consideration of a 10% change in estimated future cash flows or the discount rate for each reporting unit. After giving appropriate consideration to all available information, management determined that no impairment of goodwill would have been incurred. However, as a result of the
44
Table of Contents
challenging economic environment, the excess of the fair value over the carrying value of several reporting units has narrowed. A continuing period of depressed market conditions, or further market deterioration, may result in impairment of goodwill in the future.
Pension and Postretirement Benefit Obligations
BB&T offers various pension plans and postretirement benefit plans to employees. The calculation of the obligations and related expenses under these plans requires the use of actuarial valuation methods and assumptions. Actuarial assumptions used in the determination of future values of plan assets and liabilities are subject to management judgment and may differ significantly if different assumptions are used. The discount rate assumption used to measure the postretirement benefit obligations is set by reference to published high-quality bond indices, as well as certain hypothetical spot-rate yield curves. These yield curves were constructed from the underlying bond price and yield data collected as of the plan’s measurement date and are represented by a series of annualized, individual discount rates with durations ranging from six months to thirty years. Each discount rate in the curve was derived from an equal weighting of the double A or higher bond universe, apportioned into distinct maturity groups. For durations where no bond maturities were available, the discount rates for these maturities were extrapolated based on historical relationships from observable data in similar markets. These indices and hypothetical curves give only an indication of the appropriate discount rate because the cash flows of the bonds comprising the indices and curves do not match the projected benefit payment stream of the plan precisely. For this reason, we also consider the individual characteristics of the plan, such as projected cash flow patterns and payment durations, when setting the discount rate. Management evaluated the sensitivity changes in the expected return on plan assets and the discount rate would have on pension expense for 2011. A decrease of 25 basis points in the discount rate would result in an additional pension expense of approximately $12 million for 2011. Based on the balance of plan assets on December 31, 2010, a decrease of one percent in the expected return on plan assets would result in an increase of approximately $25 million in pension expense for 2011. Please refer to Note 15 “Benefit Plans” in the “Notes to Consolidated Financial Statements” for disclosures related to BB&T’s benefit plans.
Income Taxes
The calculation of BB&T’s income tax provision is complex and requires the use of estimates and judgments. As part of the Company’s analysis and implementation of business strategies, consideration is given to the tax laws and regulations that apply to the specific facts and circumstances for any tax position under evaluation. For tax positions that are uncertain in nature, management determines whether the tax position is more likely than not to be sustained upon examination. For tax positions that meet this threshold, management then estimates the amount of the tax benefit to recognize in the financial statements. Management closely monitors tax developments in order to evaluate the effect they may have on the Company’s overall tax position and the estimates and judgments used in determining the income tax provision and records adjustments as necessary.
Analysis of Financial Condition
A summary of the more significant fluctuations in balance sheet accounts is presented below.
For the year ended December 31, 2010, BB&T’s average assets totaled $159.7 billion, an increase of $4.5 billion, or 2.9%, compared to the 2009 average of $155.2 billion, primarily reflecting growth in average loans and leases and the FDIC loss share receivable. Average loans and leases for 2010 were up $2.6 billion, or 2.6%, from 2009 and average FDIC loss share receivable increased $1.0 billion compared to 2009. The growth in average loans and leases included $3.9 billion in average covered loans as a result of the Colonial acquisition, which was completed on August 14, 2009. Average investment securities decreased $3.6 billion, or 11.6%, compared to 2009 due to the deleveraging strategy, which was completed during the second quarter of 2010. Total earning assets averaged $135.3 billion in 2010, a decrease of $335 million, or .2%, compared to 2009. These averages and growth rates include the effects of acquisitions.
BB&T’s average deposits totaled $106.8 billion, reflecting growth of $4.4 billion, or 4.3%, compared to 2009. The growth in average deposits includes growth of 9.2% from client sources and a decline of 44.2% in wholesale deposit products. The favorable change was primarily due to the additional deposits assumed in the Colonial acquisition.
45
Table of Contents
Short-term borrowings include Federal funds purchased, securities sold under repurchase agreements, master notes, short-term bank notes, treasury tax and loan deposit notes payable and other short-term borrowings. Average short-term borrowings totaled $9.0 billion for the year ended December 31, 2010, a decrease of $3.5 billion, or 27.8%, from 2009. BB&T also has used long-term debt for a significant portion of its funding needs. Long-term debt includes Federal Home Loan Bank (“FHLB”) advances, other secured borrowings by Branch Bank, capital securities issued by unconsolidated trusts and senior and subordinated debt issued by the Corporation and Branch Bank. Average long-term debt totaled $21.7 billion for the year ended December 31, 2010, an increase of $2.6 billion, or 13.5%, compared to 2009.
The compound annual rate of growth in average total assets for the five-year period ended December 31, 2010, was 8.8%. Over the same five-year period, average loans and leases increased at a compound annual rate of 7.9%, average securities increased at a compound annual rate of 7.1%, and average deposits grew at a compound annual rate of 8.7%. These balance sheet growth rates include the effect of acquisitions, as well as internal growth.
For more detailed discussions concerning the causes of these fluctuations, please refer to the sections that follow.
Securities Available for Sale
The securities portfolio provides earnings and liquidity, and is managed as part of the overall asset and liability management process to optimize net interest income and reduce exposure to interest rate risk. Management has historically emphasized investments with duration of five years or less to provide flexibility in managing the balance sheet in changing interest rate environments. Management believes that having the vast majority of its investment securities in the available-for-sale portfolio allows flexibility in the management of the overall investment portfolio, consistent with the objectives of optimizing profitability, mitigating interest rate risk, supporting capital and providing liquidity.
The following table provides information regarding the composition of BB&T’s available-for-sale securities portfolio for the years presented:
Table 8
Composition of Securities Portfolio
| December 31, | ||||||||||||
| 2010 | 2009 | 2008 | ||||||||||
| (Dollars in millions) | ||||||||||||
|
Securities available for sale: |
||||||||||||
|
U.S. government-sponsored entities (GSE) |
$ | 103 | $ | 2,035 | $ | 1,333 | ||||||
|
Mortgage-backed securities issued by GSE |
18,344 | 26,670 | 27,430 | |||||||||
|
States and political subdivisions |
1,909 | 2,107 | 2,077 | |||||||||
|
Non-agency mortgage-backed securities |
515 | 1,022 | 1,098 | |||||||||
|
Equity and other securities |
759 | 218 | 426 | |||||||||
|
Covered securities |
1,539 | 1,201 | — | |||||||||
|
Total securities available for sale |
$ | 23,169 | $ | 33,253 | $ | 32,364 | ||||||
Total securities available for sale decreased 30.3% from year-end 2009 to year-end 2010, to $23.2 billion at December 31, 2010. The decline during 2010 primarily reflects the deleveraging strategy executed during the second quarter of 2010 as discussed below. Total securities available for sale increased $889 million in 2009 compared to 2008. The increase primarily reflects the additional securities acquired in the Colonial acquisition.
Mortgage-backed securities issued by government-sponsored entities comprised 79.2% of the total available-for-sale securities portfolio at year-end 2010. The duration of the mortgage-backed securities was 3.10 years at December 31, 2010 compared to 3.37 years at December 31, 2009. As of December 31, 2010, the available-for-sale securities portfolio also includes $1.5 billion of securities that were acquired from the FDIC as
46
Table of Contents
part of the Colonial acquisition. These securities are covered by FDIC loss sharing agreements and include $1.2 billion of non-agency mortgage-backed securities and $304 million of municipal securities. The duration of the entire available-for-sale portfolio at December 31, 2010 was 3.97 years compared to 4.40 years at December 31, 2009. The duration of the securities portfolio excludes equity securities, auction rate securities, and certain non-agency mortgage-backed securities that were acquired in the Colonial acquisition.
In 2010, management executed two major strategies to strengthen the balance sheet. In the second quarter of 2010, management executed a deleveraging strategy to better position BB&T’s balance sheet for a rising rate environment and achieve a better mix of earning assets. In connection with this strategy, management reduced the balance sheet by approximately $8 billion through the sale of securities. During the third and fourth quarters of 2010, management executed a strategy to further de-risk the available-for-sale securities portfolio. The de-risking strategy was aimed at further reducing the duration of the securities portfolio and reducing the risk of charges to other comprehensive income in a rising rate environment. Also to further protect against the risk of a rising rate environment, management replaced a portion of the securities sold with floating-rate securities. As of December 31, 2010, approximately 28% of the available-for-sale securities portfolio was floating rate. In addition, management sold approximately $400 million of non-agency mortgage-backed securities to reduce the potential for future credit losses. These strategies were the primary driver in generating net securities gains during 2010. Primarily in connection with these strategies, BB&T sold a total of $31.3 billion in available-for-sale securities during 2010, which produced net securities gains of $585 million. In addition, BB&T recognized $31 million in charges for other-than-temporary impairment related to BB&T’s portfolio of non-agency mortgage-backed securities.
In 2009, BB&T sold approximately $17.1 billion of available-for-sale securities and realized net gains totaling $240 million. In addition, BB&T recorded $41 million of other-than-temporary impairments related to certain debt and equity securities. During the first quarter of 2009, BB&T took advantage of an opportunity to shorten the duration of its securities portfolio and realize gains in certain mortgage-backed securities issued by U.S. government-sponsored entities. While these mortgage-backed securities had higher yields, they had a longer duration and government efforts to drive down mortgage rates increased the risk of early prepayment. The majority of the proceeds from these sales were reinvested in similar securities with shorter durations early in the second quarter of 2009.
During 2008, BB&T sold approximately $21.0 billion of available-for-sale securities and realized net gains totaling $211 million. In addition, BB&T recorded $104 million of other-than-temporary impairments related to certain debt and equity securities.
On December 31, 2010, BB&T held certain investment securities having continuous unrealized loss positions for more than 12 months. As of December 31, 2010, the unrealized losses on these securities totaled $260 million. All of these losses were in non-agency mortgage-backed and municipal securities. At December 31, 2010, all of the available-for-sale debt securities in an unrealized loss position, excluding those covered by FDIC loss sharing agreements, were investment grade with the exception of (a) bonds with an amortized cost of $3 million from one issuer of auction rate securities; (b) two municipal bonds with an amortized cost of $8 million; and (c) eight non-agency mortgage-backed securities with an amortized cost of $556 million. At December 31, 2010, the total unrealized loss on these non-investment grade securities was $116 million. All of the non-investment grade securities referenced above were initially investment grade and have been downgraded since purchase.
BB&T monitors the credit ratings of all of its debt securities on an ongoing basis. When an investment security is rated lower than investment grade, the security is evaluated for potential credit impairment. Based on its evaluation at December 31, 2010, BB&T determined that certain of the non-investment grade non-agency mortgage-backed securities had credit losses evident and recognized other-than-temporary impairments related to these securities. BB&T’s evaluation of the other debt securities with continuous unrealized losses indicated that there were no credit losses evident. Furthermore, as of the date of the evaluation, BB&T did not intend to sell, and determined that it was more likely than not that the Company would not be required to sell these debt securities before the anticipated recovery of the amortized cost basis. See the “Summary Analysis Supporting Conclusions” section included in Note 3 “Securities” in the “Notes to Consolidated Financial Statements” herein for additional disclosures related to BB&T’s evaluation of securities for other-than-temporary impairment.
47
Table of Contents
The following table presents BB&T’s securities portfolio at December 31, 2010, segregated by major category with ranges of maturities and average yields disclosed.
Table 9
Securities
| December 31, 2010 | ||||||||
| Fair Value |
Weighted
Average Yield (1) |
|||||||
| (Dollars in millions) | ||||||||
| U.S. government-sponsored entities (GSE): | ||||||||
|
Within one year |
$ | 50 | 0.06 | % | ||||
|
One to five years |
50 | 4.36 | ||||||
|
Five to ten years |
1 | 2.70 | ||||||
|
After ten years |
2 | 4.08 | ||||||
|
Total |
103 | 2.22 | ||||||
| Mortgage-backed securities issued by GSE (2): | ||||||||
|
One to five years |
4 | 6.74 | ||||||
|
Five to ten years |
331 | 3.18 | ||||||
|
After ten years |
18,009 | 1.84 | ||||||
|
Total |
18,344 | 1.86 | ||||||
| Obligations of states and political subdivisions (3): | ||||||||
|
Within one year |
10 | 6.97 | ||||||
|
One to five years |
5 | 7.32 | ||||||
|
Five to ten years |
94 | 6.90 | ||||||
|
After ten years |
1,787 | 6.57 | ||||||
|
Total |
1,896 | 6.59 | ||||||
| Non-agency mortgage-backed securities (2): | ||||||||
|
One to five years |
1 | 3.71 | ||||||
|
Five to ten years |
2 | 5.93 | ||||||
|
After ten years |
512 | 5.90 | ||||||
|
Total |
515 | 5.90 | ||||||
| Other securities: | ||||||||
|
One to five years |
5 | 5.33 | ||||||
|
Five to ten years |
8 | 6.49 | ||||||
|
After ten years |
591 | 1.31 | ||||||
|
Total |
604 | 1.41 | ||||||
| Covered securities (2): | ||||||||
|
Five to ten years |
196 | 5.48 | ||||||
|
After ten years |
1,343 | 13.21 | ||||||
|
Total |
1,539 | 11.99 | ||||||
| Securities with no stated maturity (4) | 168 | 2.16 | ||||||
|
Total available-for-sale securities |
$ | 23,169 | 2.89 | % | ||||
| (1) | Yields on tax-exempt securities are calculated on a taxable-equivalent basis using the statutory federal income tax rate of 35%. Yields for available-for-sale securities are calculated based on the amortized cost of the securities. |
| (2) | For purposes of the maturity table, mortgage-backed securities, which are not due at a single maturity date, have been included in maturity groupings based on the contractual maturity. The expected life of mortgage- backed securities will differ from contractual maturities because borrowers may have the right to call or prepay the underlying mortgage loans with or without call or prepayment penalties. |
48
Table of Contents
| (3) | Weighted-average yield excludes the effect of pay-fixed swaps hedging municipal securities. |
| (4) | Securities with no stated maturity include equity investments that totaled $155 million and certain municipal investments that totaled $13 million. |
The fully taxable-equivalent (“FTE”) yield on the total securities portfolio was 3.89% for the year ended December 31, 2010 compared to 4.41% for the prior year. The yield on mortgage-backed securities issued by government-sponsored entities decreased from 4.14% to 3.24%, the FTE yield on state and municipal securities decreased from 5.67% last year to 5.49% in the current year and the yield on U.S. government-sponsored entity securities decreased from 3.86% in 2009 to 3.67% in 2010. The decrease in the annualized FTE yield on the average securities portfolio was primarily the result of reinvesting securities sales into securities with shorter durations and lower yields. Partially offsetting these declines, the FTE yield benefited from the securities acquired in the Colonial transaction, which were outstanding for the full year 2010 compared to a partial year in 2009.
Loans and Leases
BB&T emphasizes commercial lending to small and medium-sized businesses, consumer lending, mortgage lending and specialized lending with an overall goal of maximizing the profitability of the loan portfolio while maintaining strong asset quality. The various categories of loan products offered by BB&T are discussed under “Lending Activities” in the “Overview and Description of Business” section herein. BB&T is a full-service lender with approximately one-half of its loan portfolio to businesses and one-half to individual consumers. BB&T’s loan portfolio, excluding loans held for sale, decreased slightly compared to year-end 2009. This decrease includes a decline of $1.8 billion in covered loans acquired as part of the Colonial transaction. All covered loans are covered by one of the FDIC loss sharing agreements as further discussed in Note 2 to the consolidated financial statements. Average total loans and leases for 2010 increased $2.6 billion, or 2.6%, compared to 2009. The growth in the average loan portfolio included an increase of $5.3 billion as a result of the Colonial acquisition during 2009.
The following table presents BB&T’s average loans for the years ended December 31, 2010 and 2009, segregated by major category:
Table 10
Composition of Average Loans and Leases
| Years Ended December 31, | ||||||||||||||||
| 2010 | 2009 | |||||||||||||||
| Balance | % of total | Balance | % of total | |||||||||||||
| (Dollars in millions) | ||||||||||||||||
|
Commercial loans and leases |
$ | 48,777 | 46.6 | % | $ | 50,074 | 48.9 | % | ||||||||
|
Direct retail loans |
13,948 | 13.3 | 14,730 | 14.4 | ||||||||||||
|
Sales finance loans |
6,766 | 6.5 | 6,392 | 6.3 | ||||||||||||
|
Revolving credit loans |
2,032 | 1.9 | 1,855 | 1.8 | ||||||||||||
|
Mortgage loans |
15,965 | 15.2 | 15,927 | 15.6 | ||||||||||||
|
Specialized lending loans |
7,778 | 7.4 | 7,141 | 7.0 | ||||||||||||
|
Other acquired loans |
85 | .1 | 52 | .1 | ||||||||||||
|
Total average loans and leases held for investment (excluding covered loans) |
95,351 | 91.0 | 96,171 | 94.1 | ||||||||||||
|
Covered loans |
7,059 | 6.7 | 3,144 | 3.1 | ||||||||||||
|
Total average loans and leases held for investment |
102,410 | 97.7 | 99,315 | 97.2 | ||||||||||||
|
Loans held for sale |
2,377 | 2.3 | 2,831 | 2.8 | ||||||||||||
|
Total average loans and leases |
$ | 104,787 | 100.0 | % | $ | 102,146 | 100.0 | % | ||||||||
Average commercial loans and leases decreased $1.3 billion, or 2.6%, in 2010 as compared to 2009. The decline in the commercial portfolio is largely a result of lower commercial real estate balances, as management has intentionally lowered its exposures to commercial real estate lending during the economic downturn. BB&T’s residential, acquisition and development portfolio held for investment declined $2.4 billion in the past year to $3.4
49
Table of Contents
billion at December 31, 2010. This decline has been somewhat offset by increases in commercial and industrial lending. Management has added a number of new producers in the corporate and middle-market banking area in an effort to increase commercial and industrial lending to better diversify the loan portfolio and capitalize on the strength of BB&T’s balance sheet during the economic downturn. During the fourth quarter of 2010, commercial and industrial loans increased an annualized 6.9% compared to the third quarter of 2010.
Average direct retail loans declined 5.3% in 2010 due to continuing difficulties in the residential real estate market, which decreased demand for home equity loan products. Average sales finance loans and average revolving credit reflected growth rates of 5.9% and 9.5% during 2010, respectively. BB&T concentrates its efforts on the highest quality borrowers in both of these product markets.
Average mortgage loans held for investment increased slightly compared to 2009. Management views mortgage loans as an integral part of BB&T’s relationship-based credit culture. BB&T is a large originator of residential mortgage loans, with 2010 originations of $24.9 billion. A majority of the mortgage loans originated were sold in the secondary market during 2010. During the third quarter of 2010, management made the decision to retain a portion of its 10 to 15 year fixed- and variable-rate production.
Average loans held by BB&T’s specialized lending subsidiaries increased $637 million, or 8.9%, compared to 2009. The growth in the specialized lending portfolio was primarily in nonprime automobile loans and small ticket finance.
The average annualized FTE yield for 2010 for the total loan portfolio was 5.88% compared to 5.49% for the prior year. The 39 basis point increase in the FTE yield on the loan portfolio was primarily due to the acquired loans from the Colonial transaction, which have produced higher yields due to better than expected performance.
In the normal course of business, residential acquisition, development and construction, commercial construction or commercial land/development loan agreements may include an interest reserve account at inception. An interest reserve allows the borrower to add interest charges to the outstanding loan balance during the construction period. Interest reserves provide an effective means to address the cash flow characteristics of a real estate construction loan. Loan agreements containing an interest reserve generally require more equity to be contributed by the borrower to the construction project at inception. Loans with interest reserves are subject to substantially similar underwriting standards as loans without interest reserves.
Loans with interest reserves are closely monitored through physical inspections, reconciliation of draw requests, review of rent rolls and operating statements and quarterly portfolio reviews performed by senior management. When appropriate, extensions, renewals and restructurings of loans with interest reserves are approved after giving consideration to the project’s status, the borrower’s financial condition, and the collateral protection based on current market conditions. In connection with the extension, renewal or restructuring of a loan with an interest reserve, additional interest reserves may be funded by the client, partially funded by the client and BB&T, or fully provided by BB&T. Typically, interest reserves provided by BB&T are secured by additional collateral and are limited to more conservative advance rates on the pledged collateral. These loans must also be supported by an analysis of the client’s willingness and capacity to service the debt.
Interest that has been added to the balance of a loan through the use of an interest reserve is recognized as income only if the collectability of the remaining contractual principal and interest payments is reasonably assured. If a loan with interest reserves is in default and deemed uncollectible, interest is no longer funded through the interest reserve. Interest previously recognized from interest reserves generally is not reversed against current income when a construction loan with interest reserves is placed on nonaccrual status.
At December 31, 2010, approximately $1.2 billion of BB&T’s construction loan portfolio have active interest reserves (i.e. current funding of interest charges through a reserve) compared to $2.4 billion at December 31, 2009. Interest income related to loans with active interest reserves was approximately $49 million and represents less than 1% of total interest income for the year ended December 31, 2010.
50
Table of Contents
Asset Quality and Credit Risk Management
BB&T has established the following general practices to manage credit risk:
| · |
limiting the amount of credit that individual lenders may extend to a borrower; |
| · |
establishing a process for credit approval accountability; |
| · |
careful initial underwriting and analysis of borrower, transaction, market and collateral risks; |
| · |
ongoing servicing of individual loans and lending relationships; |
| · |
continuous monitoring of the portfolio, market dynamics and the economy; and |
| · |
periodically reevaluating the bank’s strategy and overall exposure as economic, market and other relevant conditions change. |
BB&T’s lending strategy focuses on relationship based lending within its markets. BB&T has continued to work with its clients that have experienced financial difficulties throughout the economic recession. During the second quarter of 2010, management implemented a comprehensive nonperforming asset disposition strategy with a goal of more aggressively reducing BB&T’s exposure to nonperforming loans and foreclosed properties and to reduce or eliminate any delay in exiting the credit cycle. The strategy was implemented during the second quarter of 2010 as management believed that pricing for distressed assets had improved. This strategy continued throughout the third and fourth quarters and into 2011.
The implementation of the nonperforming asset disposition strategy included the identification of problem assets that were transferred from loans held for investment to loans held for sale. In connection with the strategy, management transferred loans with a book value of approximately $1.9 billion to loans held for sale during 2010. This included $1.5 billion of commercial loans, which were primarily in the residential, acquisition and development and other commercial real estate portfolios, and $388 million of residential mortgage loans. Net charge-offs of $605 million were recorded upon transfer to loans held for sale. This included $141 million related to residential mortgage loans and $464 million for commercial loans. BB&T also recognized $90 million of losses and additional writedowns related to commercial loans held for sale during 2010. As of December 31, 2010, there remained $521 million of nonaccrual commercial loans held for sale. These loans were carried at average prices that are consistent with actual sales results. Management expects that these loans will be disposed of in the first half of 2011.
51
Table of Contents
The following table summarizes asset quality information for the past five years.
Table 11
Asset Quality
| December 31, | ||||||||||||||||||||
| 2010 | 2009 | 2008 | 2007 | 2006 | ||||||||||||||||
| (Dollars in millions) | ||||||||||||||||||||
|
Nonaccrual loans and leases |
$ | 2,149 | $ | 2,658 | $ | 1,396 | $ | 496 | $ | 254 | ||||||||||
|
Foreclosed property |
1,301 | 1,509 | 617 | 194 | 89 | |||||||||||||||
|
Nonaccrual loans held for sale |
521 | 5 | — | — | — | |||||||||||||||
|
Nonperforming assets (excluding covered assets) (1)(2)(3) |
$ | 3,971 | $ | 4,172 | $ | 2,013 | $ | 690 | $ | 343 | ||||||||||
|
Loans 90 days or more past due and still accruing (excluding covered loans) (4)(5)(6) |
$ | 295 | $ | 311 | $ | 424 | $ | 222 | $ | 100 | ||||||||||
|
Loans 30-89 days past due (excluding covered loans) (4)(7)(8) |
$ | 1,408 | $ | 1,663 | $ | 2,022 | $ | 1,348 | $ | 947 | ||||||||||
|
Asset Quality Ratios (including covered loans and foreclosed property) |
||||||||||||||||||||
|
Loans 30-89 days past due and still accruing as a percentage of total loans and leases |
1.65 | % | 1.93 | % | 2.05 | % | 1.47 | % | 1.13 | % | ||||||||||
|
Loans 90 days or more past due and still accruing as a percentage of total loans and leases |
1.34 | 1.60 | .43 | .24 | .12 | |||||||||||||||
|
Nonperforming loans and leases as a percentage of total loans and leases |
2.49 | 2.51 | 1.42 | .54 | .30 | |||||||||||||||
|
Total nonperforming assets as a percentage of: |
||||||||||||||||||||
|
Total assets |
2.73 | 2.61 | 1.32 | .52 | .28 | |||||||||||||||
|
Loans and leases plus foreclosed property |
3.94 | 4.02 | 2.03 | .75 | .41 | |||||||||||||||
|
Net charge-offs as a percentage of average loans and leases |
2.41 | 1.74 | .89 | .38 | .27 | |||||||||||||||
|
Allowance for loan and lease losses as a percentage of loans and leases held for investment |
2.62 | 2.51 | 1.62 | 1.10 | 1.07 | |||||||||||||||
|
Ratio of allowance for loan and lease losses to: |
||||||||||||||||||||
|
Net charge-offs |
1.07 | x | 1.47 | x | 1.85 | x | 2.97 | x | 4.12 | x | ||||||||||
|
Nonperforming loans and leases |
1.26 | .98 | 1.13 | 2.03 | 3.50 | |||||||||||||||
|
Asset Quality Ratios (excluding covered loans and foreclosed property) (9) |
||||||||||||||||||||
|
Loans 30-89 days past due and still accruing as a percentage of total loans and leases |
1.39 | % | 1.69 | % | 2.05 | % | 1.47 | % | 1.13 | % | ||||||||||
|
Loans 90 days or more past due and still accruing as a percentage of total loans and leases |
.29 | .32 | .43 | .24 | .12 | |||||||||||||||
|
Nonperforming loans and leases as a percentage of total loans and leases |
2.64 | 2.71 | 1.42 | .54 | .30 | |||||||||||||||
|
Total nonperforming assets as a percentage of: |
||||||||||||||||||||
|
Total assets |
2.64 | 2.65 | 1.32 | .52 | .28 | |||||||||||||||
|
Loans and leases plus foreclosed property |
3.88 | 4.18 | 2.03 | .75 | .41 | |||||||||||||||
|
Net charge-offs as a percentage of average loans and leases |
2.59 | 1.79 | .89 | .38 | .27 | |||||||||||||||
|
Allowance for loan and lease losses as a percentage of loans and leases held for investment |
2.63 | 2.72 | 1.62 | 1.10 | 1.07 | |||||||||||||||
|
Ratio of allowance for loans and losses to: |
||||||||||||||||||||
|
Net charge-offs |
1.01 | x | 1.47 | x | 1.85 | x | 2.97 | x | 4.12 | x | ||||||||||
|
Nonperforming loans and leases held for investment |
1.19 | .98 | 1.13 | 2.03 | 3.50 | |||||||||||||||
| (1) | Covered and other acquired loans are considered to be performing due to the application of the accretion method. Covered loans that are contractually past due are noted in the footnotes below. |
| (2) | Excludes nonaccrual mortgage loans that are government guaranteed totaling $55 million, $17 million, $6 million, and $6 million as of December 31, 2009, December 31, 2008, December 31, 2007 and December 31, 2006, respectively. BB&T revised its nonaccrual policy related to FHA/VA guaranteed loans during 2010. The change in policy resulted in a decrease in nonaccrual mortgage loans and an increase in mortgage loans 90 days past due and still accruing of approximately $79 million. |
52
Table of Contents
| (3) | Excludes foreclosed real estate totaling $313 million and $160 million as of December 31, 2010 and December 31, 2009, respectively, that are covered by FDIC loss sharing agreements. |
| (4) | Excludes mortgage loans guaranteed by GNMA that BB&T does not have the obligation to repurchase. |
| (5) | Excludes loans past due 90 days or more that are covered by FDIC loss sharing agreements totaling $1.1 billion and $1.4 billion at December 31, 2010 and December 31, 2009, respectively. |
| (6) | Excludes mortgage loans past due 90 days or more that are government guaranteed totaling $153 million, $8 million, $7 million, $1 million and $2 million at December 31, 2010, December 31, 2009, December 31, 2008, December 31, 2007 and December 31, 2006, respectively. |
| (7) | Excludes loans totaling $363 million and $391 million past due 30-89 days at December 31, 2010 and December 31, 2009, respectively, that are covered by FDIC loss sharing agreements. |
| (8) | Excludes mortgage loans past due 30-89 days that are government guaranteed totaling $83 million, $23 million, $25 million, $7 million and $5 million at December 31, 2010, December 31, 2009, December 31, 2008, December 31, 2007 and December 31, 2006, respectively. |
| (9) | These asset quality ratios have been adjusted to remove the impact of covered loans and covered foreclosed property. Appropriate adjustments to the numerator and denominator have been reflected in the calculation of these ratios. Management believes the inclusion of acquired loans in certain asset quality ratios that include nonperforming assets, past due loans or net charge-offs in the numerator or denominator results in distortion of these ratios and they may not be comparable to other periods presented or to other portfolios that were not impacted by purchase accounting. |
Substantially all of the loans acquired in the Colonial acquisition are covered by loss sharing agreements with the FDIC, whereby the FDIC reimburses BB&T for the majority of the losses incurred. In addition, all of the loans acquired were recorded at fair value as of the acquisition date without regard to the loss sharing agreements. Loans were evaluated and assigned to loan pools based on common risk characteristics. The determination of the fair value of the loans resulted in a significant write-down in the carrying amount of the loans, which was assigned to an accretable or nonaccretable balance, with the accretable balance being recognized as interest income over the remaining term of the loan. In accordance with the acquisition method of accounting, there was no allowance brought forward on any of the acquired loans, as the credit losses evident in the loans were included in the determination of the fair value of the loans at the acquisition date and are represented by the nonaccretable balance. The majority of the nonaccretable balance is expected to be received from the FDIC in connection with the loss sharing agreements and is recorded as a separate asset from the covered loans and reflected on the Consolidated Balance Sheets. As a result, all of the loans acquired in the Colonial acquisition were considered to be accruing loans as of the acquisition date. In accordance with regulatory reporting standards, covered loans that are contractually past due will continue to be reported as past due and still accruing based on the number of days past due.
Given the significant amount of acquired loans that are past due but still accruing, BB&T believes the inclusion of these loans in certain asset quality ratios including “Loans 30-89 days past due and still accruing as a percentage of total loans and leases,” “Loans 90 days or more past due and still accruing as a percentage of total loans and leases,” “Nonperforming loans and leases as a percentage of total loans and leases” and certain other asset quality ratios that reflect nonperforming assets in the numerator or denominator (or both) results in significant distortion to these ratios. In addition, because charge-offs related to the acquired loans are recorded against the nonaccretable balance, the net charge-off ratio including the acquired loans is lower for portfolios that have significant amounts of acquired loans. The inclusion of these loans in the asset quality ratios described above could result in a lack of comparability across quarters or years, and could negatively impact comparability with other portfolios that were not impacted by acquisition accounting. BB&T believes that the presentation of asset quality measures excluding covered loans and related amounts from both the numerator and denominator provides better perspective into underlying trends related to the quality of its loan portfolio. Accordingly, the asset quality measures in Table 11 present asset quality information both on a consolidated basis as well as excluding the covered assets and related amounts.
Consistent with BB&T’s belief that the presentation of certain asset quality measures excluding the impact of covered loans is more meaningful, certain information reflected in Tables 12-1, 12-2, 14-1, 14-2 and 14-3 has been adjusted to exclude the impact of covered loans and foreclosed property. These adjustments have been identified and explained in the footnotes to each table.
53
Table of Contents
Nonperforming assets consist of foreclosed real estate, repossessions, nonaccrual loans and certain restructured loans, which totaled $4.3 billion at December 31, 2010 (or $4.0 billion excluding covered foreclosed property), compared to $4.3 billion (or $4.2 billion excluding covered foreclosed property) at December 31, 2009. After peaking in the first quarter of 2010, nonperforming assets excluding covered foreclosed property declined $423 million in the last three quarters of 2010 as BB&T continued to successfully implement its nonperforming asset disposition strategy. As a percentage of loans and leases plus foreclosed property, nonperforming assets were 3.94% at December 31, 2010 (or 3.88% excluding covered loans and foreclosed property) compared with 4.02% (or 4.18% excluding covered loans and foreclosed property) at December 31, 2009.
Past due loans still accruing decreased 13.7% compared to the level at year-end 2009. Loans 90 days or more past due and still accruing interest, excluding covered loans and government guaranteed mortgage loans, totaled $295 million at December 31, 2010, compared with $311 million at year-end 2009. Loans 30-89 days past due, excluding covered loans and government guaranteed mortgage loans, totaled $1.4 billion at December 31, 2010, which was also a decline compared with $1.7 billion at year-end 2009.
54
Table of Contents
The following table summarizes nonperforming assets and past due loans by loan type for the past three years.
Table 12-1
Summary of Nonperforming Assets and Past Due Loans
| December 31, | ||||||||||||
| 2010 | 2009 | 2008 | ||||||||||
| (Dollars in millions) | ||||||||||||
|
Nonaccrual loans and leases (1) |
||||||||||||
|
Commercial loans and leases |
$ | 1,426 | $ | 1,651 | $ | 845 | ||||||
|
Direct retail |
191 | 197 | 89 | |||||||||
|
Sales finance |
6 | 7 | 7 | |||||||||
|
Mortgage (2) |
466 | 707 | 358 | |||||||||
|
Specialized lending |
60 | 96 | 97 | |||||||||
|
Total nonaccrual loans and leases held for investment |
2,149 | 2,658 | 1,396 | |||||||||
|
Nonaccrual loans held for sale |
521 | 5 | — | |||||||||
|
Foreclosed real estate |
1,259 | 1,451 | 538 | |||||||||
|
Other foreclosed property |
42 | 58 | 79 | |||||||||
|
Total nonperforming assets (3) |
$ | 3,971 | $ | 4,172 | $ | 2,013 | ||||||
|
Nonaccrual loans and leases as a percentage of total loans and leases (4) |
||||||||||||
|
Commercial loans and leases |
1.41 | % | 1.68 | % | .85 | % | ||||||
|
Direct retail |
.19 | .20 | .09 | |||||||||
|
Sales finance |
.01 | .01 | .01 | |||||||||
|
Mortgage |
.45 | .71 | .37 | |||||||||
|
Specialized lending |
.06 | .10 | .10 | |||||||||
|
Nonaccrual loans held for sale |
.52 | .01 | — | |||||||||
|
Total nonaccrual loans and leases as a percentage of loans and leases (5) |
2.64 | % | 2.71 | % | 1.42 | % | ||||||
|
Loans 90 days or more past due and still accruing interest (6) |
||||||||||||
|
Commercial loans and leases |
$ | 20 | $ | 7 | $ | 86 | ||||||
|
Direct retail |
76 | 82 | 117 | |||||||||
|
Sales finance |
27 | 30 | 26 | |||||||||
|
Revolving credit |
20 | 25 | 23 | |||||||||
|
Mortgage (7) |
143 | 150 | 158 | |||||||||
|
Specialized lending |
6 | 12 | 14 | |||||||||
|
Other acquired loans |
3 | 5 | — | |||||||||
|
Total loans 90 days or more past due and still accruing interest (8) |
$ | 295 | $ | 311 | $ | 424 | ||||||
|
Total loans 90 days or more past due and still accruing interest as a percentage of total loans and leases (4) |
||||||||||||
|
Commercial loans and leases |
.02 | % | .01 | % | .09 | % | ||||||
|
Direct retail |
.07 | .08 | .12 | |||||||||
|
Sales finance |
.03 | .03 | .03 | |||||||||
|
Revolving credit |
.02 | .03 | .02 | |||||||||
|
Mortgage |
.14 | .15 | .16 | |||||||||
|
Specialized lending |
.01 | .01 | .01 | |||||||||
|
Other acquired loans |
— | .01 | — | |||||||||
|
Total loans 90 days or more past due and still accruing interest as a percentage of total loans and leases (9) |
.29 | % | .32 | % | .43 | % | ||||||
|
Loans 30-89 days past due (6) |
||||||||||||
|
Commercial loans and leases |
$ | 315 | $ | 377 | $ | 594 | ||||||
|
Direct retail |
189 | 216 | 270 | |||||||||
|
Sales finance |
95 | 126 | 146 | |||||||||
|
Revolving credit |
28 | 32 | 34 | |||||||||
|
Mortgage (10) |
532 | 600 | 665 | |||||||||
|
Specialized lending |
248 | 306 | 313 | |||||||||
|
Other acquired loans |
1 | 6 | — | |||||||||
|
Total loans 30-89 days past due (11) |
$ | 1,408 | $ | 1,663 | $ | 2,022 | ||||||
|
Total loans 30-89 days past due as a percentage of total loans and leases (4) |
||||||||||||
|
Commercial loans and leases |
.31 | % | .38 | % | .60 | % | ||||||
|
Direct retail |
.19 | .22 | .27 | |||||||||
|
Sales finance |
.09 | .13 | .15 | |||||||||
|
Revolving credit |
.03 | .03 | .03 | |||||||||
|
Mortgage |
.53 | .61 | .68 | |||||||||
|
Specialized lending |
.24 | .31 | .32 | |||||||||
|
Other acquired loans |
— | .01 | — | |||||||||
|
Total loans 30-89 days past due as a percentage of total loans and leases (12) |
1.39 | % | 1.69 | % | 2.05 | % | ||||||
55
Table of Contents
| (1) | Covered and other acquired loans are considered to be performing due to the application of the accretion method. Covered loans that are contractually past due are noted in the footnotes below. |
| (2) | Excludes nonaccrual mortgage loans that are government guaranteed totaling $55 million and $17 million as of December 31, 2009 and December 31, 2008, respectively. BB&T revised its nonaccrual policy related to FHA/VA guaranteed loans during 2010. The change in policy resulted in a decrease in nonaccrual mortgage loans and an increase in mortgage loans 90 days past due and still accruing of approximately $79 million. |
| (3) | Excludes foreclosed real estate totaling $313 million and $160 million as of December 31, 2010 and December 31, 2009, respectively, that are covered by FDIC loss sharing agreements. |
| (4) | These asset quality ratios have been adjusted to remove the impact of covered loans and covered foreclosed property. Appropriate adjustments to the numerator and denominator have been reflected in the calculation of these ratios. Management believes the inclusion of acquired loans in certain asset quality ratios that include nonperforming assets, past due loans or net charge-offs in the numerator or denominator results in distortion of these ratios and they may not be comparable to other periods presented or to other portfolios that were not impacted by purchase accounting. |
| (5) | Including loans covered by FDIC loss sharing agreements, nonaccrual loans and leases as a percentage of total loans and leases were 2.49% and 2.51%, as of December 31, 2010 and December 31, 2009, respectively. |
| (6) | Excludes mortgage loans guaranteed by GNMA that BB&T does not have the obligation to repurchase. |
| (7) | Excludes mortgage loans past due 90 days or more that are government guaranteed totaling $153 million, $8 million and $7 million at December 31, 2010, December 31, 2009 and December 31, 2008, respectively. |
| (8) | Excludes loans past due 90 days or more that are covered by FDIC loss sharing agreements totaling $1.1 billion and $1.4 billion at December 31, 2010 and December 31, 2009, respectively. |
| (9) | Including loans covered by FDIC loss sharing agreements, loans past due 90 days or more and still accruing as a percentage of total loans and leases were 1.34% and 1.60% as of December 31, 2010 and December 31, 2009, respectively. |
| (10) | Excludes mortgage loans past due 30-89 days that are government guaranteed totaling $83 million, $23 million and $25 million at December 31, 2010, December 31, 2009 and December 31, 2008, respectively. |
| (11) | Excludes loans totaling $363 million and $391 million past due 30-89 days at December 31, 2010 and December 31, 2009, respectively, that are covered by FDIC loss sharing agreements. |
| (12) | Including loans covered by FDIC loss sharing agreements, loans past due 30-89 days as a percentage of total loans and leases were 1.65% and 1.93% as of December 31, 2010 and December 31, 2009, respectively. |
Table 12-2
Troubled Debt Restructurings
| December 31, 2010 | ||||||||||||||||||||||||||||
| Current Status |
Past Due 30-89 Days |
Past Due 90+ Days |
Total | |||||||||||||||||||||||||
| (Dollars in millions) | ||||||||||||||||||||||||||||
|
Performing restructurings: (1) (2) (3) |
||||||||||||||||||||||||||||
|
Commercial loans |
$ | 637 | 97.0 | % | $ | 20 | 3.0 | % | $ | — | — | % | $ | 657 | ||||||||||||||
|
Direct retail loans |
129 | 91.5 | 10 | 7.1 | 2 | 1.4 | 141 | |||||||||||||||||||||
|
Sales finance loans |
— | — | 1 | 20.0 | 4 | 80.0 | 5 | |||||||||||||||||||||
|
Revolving credit loans |
48 | 77.4 | 8 | 12.9 | 6 | 9.7 | 62 | |||||||||||||||||||||
|
Residential mortgage loans (4) |
454 | 77.6 | 108 | 18.5 | 23 | 3.9 | 585 | |||||||||||||||||||||
|
Specialized lending loans |
23 | 88.5 | 3 | 11.5 | — | — | 26 | |||||||||||||||||||||
|
Total performing restructurings |
1,291 | 87.5 | 150 | 10.2 | 35 | 2.4 | 1,476 | |||||||||||||||||||||
|
Nonperforming restructurings (5) |
132 | 27.6 | 60 | 12.5 | 287 | 59.9 | 479 | |||||||||||||||||||||
|
Total restructurings |
$ | 1,423 | 72.8 | $ | 210 | 10.6 | $ | 322 | 16.5 | $ | 1,955 | |||||||||||||||||
| (1) | Excludes restructured covered and other acquired loans accounted for under the accretion method. |
| (2) | Past due performing restructurings are included in past due disclosures. |
| (3) | Excludes restructured mortgage loans that are government guaranteed totaling $14 million included in loans held for sale. |
| (4) | Excludes restructured mortgage loans that are government guaranteed totaling $115 million. |
| (5) | Nonperforming restructurings are included in nonaccrual loan disclosures. |
Troubled debt restructurings (“restructurings”) generally occur when a borrower is experiencing, or is expected to experience, financial difficulties in the near-term. As a result, BB&T will work with the borrower to prevent further difficulties, and ultimately to improve the likelihood of recovery on the loan. To facilitate this process, a concessionary modification that would not otherwise be considered may be granted resulting in classification of the loan as a restructuring. Restructurings can involve loans remaining on nonaccrual, moving to nonaccrual, or continuing on accruing status, depending on the individual facts and circumstances of the borrower. In circumstances where the restructuring involves charging off a portion of the loan balance, BB&T typically classifies these restructurings as nonaccrual. With respect to commercial restructurings, an analysis of the credit evaluation, in conjunction with an evaluation of the borrower’s performance prior to the restructuring, are considered when evaluating the borrower’s ability to meet the restructured terms of the loan agreement. Restructured nonaccrual loans may be returned to accrual status based on a current, well-documented credit evaluation of the borrower’s financial condition and prospects for repayment under the modified terms. This
56
Table of Contents
evaluation must include consideration of the borrower’s sustained historical repayment performance for a reasonable period (generally a minimum of six months) prior to the date on which the loan is returned to accrual status. Sustained historical repayment performance for a reasonable time prior to the restructuring may be taken into account.
In connection with consumer loan restructurings, a nonperforming loan will be returned to accruing status when current as to principal and interest and upon a sustained historical repayment performance (generally a minimum of six months).
BB&T’s performing restructured loans, excluding government guaranteed mortgage loans, totaled $1.5 billion at December 31, 2010, an increase of $406 million compared with December 31, 2009. The majority of BB&T’s commercial lending loan modifications that are considered restructurings involve an extension of the term of the loan without a corresponding adjustment to the risk premium reflected in the interest rate. BB&T does not typically lower the interest rate and rarely forgives principal or interest as part of a commercial loan modification. In addition, BB&T frequently obtains additional collateral or guarantor support when modifying such loans. For commercial loans, performing restructured loans totaled $657 million at December 31, 2010. These loans are typically residential acquisition, development and construction loans where BB&T has extended the maturity of the loan for less than one year without a sufficient corresponding increase in the interest rate, or principal payments have been deferred to assist the borrower. The majority of BB&T’s mortgage and consumer loan modifications that are considered restructurings involve a reduction in the interest rate to a below market rate and/or an increase in the term of the loan without a corresponding adjustment to the risk premium reflected in the interest rate. These modifications rarely result in the forgiveness of principal or interest.
Allowance for Loan and Lease Losses and Reserve for Unfunded Lending Commitments
The allowance for loan and lease losses and the reserve for unfunded lending commitments compose BB&T’s allowance for credit losses. The allowance for credit losses totaled $2.8 billion at December 31, 2010, an increase of 3.1% compared to $2.7 billion at the end of 2009. The allowance for loan and lease losses, as a percentage of loans and leases held for investment, was 2.62% at December 31, 2010 (or 2.63% excluding covered loans), compared to 2.51% (or 2.72% excluding covered loans) at year-end 2009. The decline in the allowance as a percentage of loans held for investment, excluding covered loans, reflects the improvement in the overall quality of the loan portfolio. Please refer to Note 5 “Allowance for Loan and Lease Losses and Reserve for Unfunded Lending Commitments” in the “Notes to Consolidated Financial Statements” for additional disclosures.
Information relevant to BB&T’s allowance for loan and lease losses for the last five years is presented in the following tables. Table 13-1 is presented using regulatory classifications, which focuses on the underlying loan collateral, and differs from internal classifications presented herein that focus on the lines of business that generate the loans. Table 13-2 is presented based upon the lines of business, as discussed herein.
57
Table of Contents
Table 13-1
Analysis of Allowance for Credit Losses
| December 31, | ||||||||||||||||||||
| 2010 | 2009 | 2008 | 2007 | 2006 | ||||||||||||||||
| (Dollars in millions) | ||||||||||||||||||||
|
Balance, beginning of period |
$ | 2,672 | $ | 1,607 | $ | 1,015 | $ | 888 | $ | 830 | ||||||||||
|
Provision for credit losses (excluding covered loans) |
2,494 | 2,811 | 1,445 | 448 | 240 | |||||||||||||||
|
Provision for covered loans |
144 | — | — | — | — | |||||||||||||||
|
Charge-offs: |
||||||||||||||||||||
|
Commercial, financial and agricultural |
(198 | ) | (214 | ) | (94 | ) | (40 | ) | (32 | ) | ||||||||||
|
Real estate |
(2,075 | ) | (1,157 | ) | (427 | ) | (93 | ) | (46 | ) | ||||||||||
|
Consumer |
(376 | ) | (477 | ) | (383 | ) | (264 | ) | (194 | ) | ||||||||||
|
Lease receivables |
(9 | ) | (14 | ) | (13 | ) | (8 | ) | (5 | ) | ||||||||||
|
Total charge-offs |
(2,658 | ) | (1,862 | ) | (917 | ) | (405 | ) | (277 | ) | ||||||||||
|
Recoveries: |
||||||||||||||||||||
|
Commercial, financial and agricultural |
22 | 16 | 10 | 11 | 12 | |||||||||||||||
|
Real estate |
53 | 24 | 8 | 8 | 7 | |||||||||||||||
|
Consumer |
53 | 48 | 47 | 47 | 41 | |||||||||||||||
|
Lease receivables |
2 | 1 | 1 | 1 | 1 | |||||||||||||||
|
Total recoveries |
130 | 89 | 66 | 67 | 61 | |||||||||||||||
|
Net charge-offs |
(2,528 | ) | (1,773 | ) | (851 | ) | (338 | ) | (216 | ) | ||||||||||
|
Other changes |
(27 | ) | 27 | (2 | ) | 17 | 34 | |||||||||||||
|
Balance, end of period |
$ | 2,755 | $ | 2,672 | $ | 1,607 | $ | 1,015 | $ | 888 | ||||||||||
|
Average loans and leases (1) |
$ | 104,787 | $ | 102,146 | $ | 95,195 | $ | 87,952 | $ | 79,313 | ||||||||||
|
Net charge-offs as a percentage of average loans and leases (1) (2) |
2.41 | % | 1.74 | % | .89 | % | .38 | % | .27 | % | ||||||||||
| (1) | Loans and leases are net of unearned income, net deferred loan fees and cost and include loans held for sale. |
| (2) | The net charge-off rate for 2010 and 2009 was 2.59% and 1.79%, respectively, excluding the effect of average loans covered by the FDIC loss sharing agreements. |
58
Table of Contents
Table 13-2
Analysis of Allowance for Credit Losses by Lines of Business
| December 31, | ||||||||||||||||||||
| 2010 | 2009 | 2008 | 2007 | 2006 | ||||||||||||||||
| (Dollars in millions) | ||||||||||||||||||||
| Allowance For Credit Losses | ||||||||||||||||||||
|
Beginning balance |
$ | 2,672 | $ | 1,607 | $ | 1,015 | $ | 888 | $ | 830 | ||||||||||
|
Provision for credit losses |
||||||||||||||||||||
|
(excluding covered loans) |
2,494 | 2,811 | 1,445 | 448 | 240 | |||||||||||||||
|
Provision for covered loans |
144 | — | — | — | — | |||||||||||||||
|
Charge-offs |
||||||||||||||||||||
|
Commercial loans and leases (1) |
(1,508 | ) | (720 | ) | (276 | ) | (65 | ) | (37 | ) | ||||||||||
|
Direct retail loans |
(338 | ) | (349 | ) | (156 | ) | (72 | ) | (48 | ) | ||||||||||
|
Sales finance loans |
(48 | ) | (72 | ) | (59 | ) | (31 | ) | (21 | ) | ||||||||||
|
Revolving credit loans |
(118 | ) | (127 | ) | (79 | ) | (47 | ) | (45 | ) | ||||||||||
|
Mortgage loans (2) |
(394 | ) | (280 | ) | (96 | ) | (10 | ) | (6 | ) | ||||||||||
|
Specialized lending |
(252 | ) | (314 | ) | (251 | ) | (180 | ) | (120 | ) | ||||||||||
|
Total charge-offs |
(2,658 | ) | (1,862 | ) | (917 | ) | (405 | ) | (277 | ) | ||||||||||
|
Recoveries |
||||||||||||||||||||
|
Commercial loans and leases (1) |
37 | 21 | 16 | 17 | 15 | |||||||||||||||
|
Direct retail loans |
33 | 19 | 12 | 13 | 12 | |||||||||||||||
|
Sales finance loans |
9 | 9 | 7 | 8 | 8 | |||||||||||||||
|
Revolving credit loans |
16 | 12 | 11 | 12 | 11 | |||||||||||||||
|
Mortgage loans (2) |
4 | 5 | 1 | — | 1 | |||||||||||||||
|
Specialized lending |
31 | 23 | 19 | 17 | 14 | |||||||||||||||
|
Total recoveries |
130 | 89 | 66 | 67 | 61 | |||||||||||||||
|
Net charge-offs |
(2,528 | ) | (1,773 | ) | (851 | ) | (338 | ) | (216 | ) | ||||||||||
|
Other changes |
(27 | ) | 27 | (2 | ) | 17 | 34 | |||||||||||||
|
Ending balance |
$ | 2,755 | $ | 2,672 | $ | 1,607 | $ | 1,015 | $ | 888 | ||||||||||
| (1) | Includes net charge-offs of $464 million in commercial loans and leases during 2010 in connection with BB&T’s NPA disposition strategy. |
| (2) | Includes net charge-offs of $141 million in mortgage loans during 2010 in connection with BB&T’s NPA disposition strategy. |
59
Table of Contents
The following tables provide further details regarding BB&T’s commercial real estate lending, residential mortgage and consumer home equity portfolios as of December 31, 2010.
Table 14-1
Real Estate Lending Portfolio Credit Quality and Geographic Distribution
Commercial Real Estate Loan Portfolio (1) (2)
| As of / For the Period Ended December 31, 2010 | ||||||||||||||||
|
Residential Acquisition, Development, and Construction
|
Builder /
Construction |
Land / Land
Development |
Condos /
Townhomes |
Total
ADC |
||||||||||||
| (Dollars in millions, except average loan and average client size) | ||||||||||||||||
|
Total loans outstanding |
$ | 948 | $ | 2,263 | $ | 186 | $ | 3,397 | ||||||||
|
Average loan size (in thousands) |
220 | 502 | 1,012 | 378 | ||||||||||||
|
Average client size (in thousands) |
549 | 828 | 2,312 | 744 | ||||||||||||
|
Nonaccrual loans and leases as a percentage of category |
18.19 | % | 14.61 | % | 5.24 | % | 15.09 | % | ||||||||
|
Gross charge-offs as a percentage of category: |
||||||||||||||||
|
Year-to-Date |
7.85 | 16.84 | 8.89 | 13.86 | ||||||||||||
|
Quarter-to-Date |
8.44 | 13.15 | 5.25 | 11.40 | ||||||||||||
| As of / For the Period Ended December 31, 2010 | ||||||||||||||||
|
Gross Charge-Offs as a Percentage of
Outstandings |
||||||||||||||||
|
ADC by State of Origination |
Total
Outstandings |
Nonaccrual as a
Percentage of Outstandings |
Year-to-Date | Quarter-to-Date | ||||||||||||
| (Dollars in millions) | ||||||||||||||||
|
North Carolina |
$ | 1,541 | 14.86 | % | 8.40 | % | 11.54 | % | ||||||||
|
Virginia |
614 | 5.45 | 7.35 | 6.31 | ||||||||||||
|
South Carolina |
315 | 16.62 | 13.15 | 12.40 | ||||||||||||
|
Georgia |
278 | 21.83 | 33.07 | 22.47 | ||||||||||||
|
Florida |
177 | 24.07 | 30.57 | 22.97 | ||||||||||||
|
Washington, D.C. |
113 | 21.04 | 20.37 | 2.06 | ||||||||||||
|
Tennessee |
100 | 18.60 | 13.53 | 14.49 | ||||||||||||
|
West Virginia |
79 | 7.91 | 14.39 | 2.67 | ||||||||||||
|
Kentucky |
76 | 17.09 | 17.87 | .45 | ||||||||||||
|
Maryland |
59 | 5.54 | 3.05 | 4.86 | ||||||||||||
|
Alabama |
44 | 68.07 | 19.10 | 5.58 | ||||||||||||
|
Other |
1 | — | — | — | ||||||||||||
|
Total |
$ | 3,397 | 15.09 | % | 13.86 | % | 11.40 | % | ||||||||
| As of / For the Period Ended December 31, 2010 | ||||||||||||||||
|
Other Commercial Real Estate Loans (3) |
Commercial
Construction |
Commercial
Land/ Development |
Permanent
Income Producing Properties |
Total Other
Commercial Real Estate |
||||||||||||
| (Dollars in millions, except average loan and average client size) | ||||||||||||||||
|
Total loans outstanding |
$ | 952 | $ | 1,408 | $ | 9,091 | $ | 11,451 | ||||||||
|
Average loan size (in thousands) |
1,018 | 652 | 503 | 541 | ||||||||||||
|
Average client size (in thousands) |
1,488 | 773 | 761 | 793 | ||||||||||||
|
Nonaccrual loans and leases as a percentage of category |
1.98 | % | 10.50 | % | 2.62 | % | 3.53 | % | ||||||||
|
Gross charge-offs as a percentage of category: |
||||||||||||||||
|
Year-to-Date |
2.11 | 9.11 | 3.02 | 3.83 | ||||||||||||
|
Quarter-to-Date |
1.27 | 7.23 | 3.70 | 3.94 | ||||||||||||
60
Table of Contents
| As of / For the Period Ended December 31, 2010 | ||||||||||||||||
|
Gross Charge-Offs as a Percentage of
Outstandings |
||||||||||||||||
|
Other Commercial Real Estate Loans
|
Total
Outstandings |
Nonaccrual as a
Percentage of Outstandings |
Year-to-Date | Quarter-to-Date | ||||||||||||
| (Dollars in millions) | ||||||||||||||||
|
North Carolina |
$ | 3,520 | 2.55 | % | 2.70 | % | 1.89 | % | ||||||||
|
Virginia |
1,866 | 1.04 | 1.16 | 1.18 | ||||||||||||
|
Georgia |
1,776 | 7.01 | 6.68 | 9.54 | ||||||||||||
|
South Carolina |
911 | 3.79 | 3.41 | 9.68 | ||||||||||||
|
Florida |
740 | 11.47 | 12.85 | 6.51 | ||||||||||||
|
Washington, D.C. |
660 | 3.01 | 3.71 | 4.39 | ||||||||||||
|
Maryland |
579 | .54 | .12 | .45 | ||||||||||||
|
Kentucky |
453 | 1.01 | 1.44 | .16 | ||||||||||||
|
West Virginia |
413 | .76 | 1.15 | .36 | ||||||||||||
|
Tennessee |
344 | 4.61 | 5.60 | 3.68 | ||||||||||||
|
Alabama |
90 | 5.77 | 4.09 | 4.01 | ||||||||||||
|
Other |
99 | — | 1.68 | — | ||||||||||||
|
Total |
$ | 11,451 | 3.53 | % | 3.83 | % | 3.94 | % | ||||||||
| (1) | Commercial real estate loans (“CRE”) are defined as loans to finance non-owner occupied real property where the primary repayment source is the sale or rental/lease of the real property. Definition is based on internal classification. Excludes covered loans and in process items. |
| (2) | Includes net charge-offs and average balances related to loans transferred to held for sale while they were held for investment. Loans transferred to held for sale are excluded from total loans outstanding. As of December 31, 2010, there were $239 million ADC loans and $168 million other CRE loans held for sale. All of the held for sale ADC and Other CRE loans are on nonaccrual status. |
| (3) | C&I loans secured by real property are excluded. |
The residential acquisition, development and construction (“ADC”) loan portfolio totaled $3.4 billion at December 31, 2010, a decrease of $2.4 billion from December 31, 2009. This portfolio continues to represent the largest concentration of credit quality issues. The decline in the portfolio reflects management’s efforts to work through the problem credits in this portfolio. Management has established a target size of between $2 billion and $3 billion for the ADC portfolio. As a percentage of loans held for investment, ADC nonaccruals were 15.09% at year-end 2010, compared to 13.63% at year-end 2009. The allowance for loan and lease losses that is assigned to the ADC portfolio was 13.8% as of December 31, 2010, compared to 14.1% as of year-end 2009. The gross charge-off rate for the ADC portfolio was 13.86% for 2010 compared to 5.71% for 2009. For the fourth quarter of 2010, the annualized gross charge-off rate was 11.40% compared to 24.11% for the third quarter of 2010. The other commercial real estate portfolio, which is largely office buildings, hotels, warehouses, apartments, rental houses, and shopping centers, totaled $11.5 billion at December 31, 2010. The components of the portfolio that are experiencing the most stress relate to land development and hotel properties. As a percentage of loans, other commercial real estate nonaccruals were 3.53% at December 31, 2010, compared with 2.70% at December 31, 2009. The gross charge-off rate for the other commercial real estate portfolio was 3.83% in 2010 compared to .76% for 2009. For the fourth quarter of 2010, the annualized gross charge-off rate was 3.94% compared to 8.11% for the third quarter of 2010. The increased charge-off rates in the ADC and other commercial real estate portfolios during 2010 include the impact of the additional charge-offs on loans transferred to loans held for sale as part of the NPA disposition strategy. The vast majority of those losses were recorded in the third quarter of 2010.
61
Table of Contents
Table 14-2
Real Estate Lending Portfolio Credit Quality and Geographic Distribution
Residential Mortgage Portfolio (1)
| As of / For the Period Ended December 31, 2010 | ||||||||||||||||||||
|
Residential Mortgage Loans |
Prime | ALT-A |
Construction/
Permanent |
Subprime (2) | Total | |||||||||||||||
| (Dollars in millions, except average loan size) | ||||||||||||||||||||
|
Total loans outstanding |
$ | 14,629 | $ | 2,123 | $ | 551 | $ | 482 | $ | 17,785 | ||||||||||
|
Average loan size (in thousands) |
194 | 310 | 323 | 61 | 194 | |||||||||||||||
|
Average refreshed credit score (3) |
722 | 694 | 714 | 573 | 714 | |||||||||||||||
|
Percentage that are first mortgages |
100 | % | 100 | % | 99 | % | 82 | % | 99 | % | ||||||||||
|
Average loan to value at origination |
74 | 68 | 73 | 74 | 74 | |||||||||||||||
|
Nonaccrual loans and leases as a percentage of category |
1.77 | 6.67 | 7.95 | 8.18 | 2.72 | |||||||||||||||
|
Gross charge-offs as a percentage of category: |
||||||||||||||||||||
|
Year-to-Date |
1.73 | 4.75 | 4.68 | 8.04 | 2.50 | |||||||||||||||
|
Quarter-to-Date |
1.04 | 2.66 | 2.56 | 5.41 | 1.42 | |||||||||||||||
| As of / For the Period Ended December 31, 2010 | ||||||||||||||||
|
Gross Charge-Offs as a Percentage of
Outstandings |
||||||||||||||||
|
Residential Mortgage Loans by State |
Total
Outstandings |
Nonaccrual as a
Percentage of Outstandings |
Year-to-Date | Quarter-to-Date | ||||||||||||
| (Dollars in millions) | ||||||||||||||||
|
North Carolina |
$ | 4,319 | 2.02 | % | 1.19 | % | .75 | % | ||||||||
|
Virginia |
3,070 | 2.06 | 1.65 | .74 | ||||||||||||
|
Florida |
2,296 | 5.79 | 6.85 | 4.20 | ||||||||||||
|
Maryland |
1,735 | 2.30 | 2.20 | 1.10 | ||||||||||||
|
Georgia |
1,641 | 2.93 | 3.30 | 2.68 | ||||||||||||
|
South Carolina |
1,631 | 3.33 | 2.40 | 1.17 | ||||||||||||
|
Kentucky |
456 | 1.35 | .48 | .33 | ||||||||||||
|
West Virginia |
368 | 1.37 | .75 | .49 | ||||||||||||
|
Texas |
364 | .42 | .16 | — | ||||||||||||
|
Tennessee |
346 | 2.70 | 1.19 | .87 | ||||||||||||
|
Alabama |
230 | 1.64 | 2.70 | .32 | ||||||||||||
|
Washington, D.C. |
211 | 2.29 | .69 | .48 | ||||||||||||
|
Other |
1,118 | 2.51 | 2.14 | .73 | ||||||||||||
|
Total |
$ | 17,785 | 2.72 | % | 2.50 | % | 1.42 | % | ||||||||
Applicable ratios are annualized.
| (1) | Excludes mortgage loans held for sale, covered loans, mortgage loans guaranteed by GNMA that BB&T does not have the obligation to repurchase and in process items. |
| (2) | Includes $336 million in loans originated by Lendmark Financial Services, which are disclosed as a part of the specialized lending category. |
| (3) | Weighted based on outstanding balance. |
The residential mortgage loan portfolio, as presented in Table 14-2, totaled $17.8 billion as of December 31, 2010, an increase of $2.1 billion from December 31, 2009. As a percentage of loans, residential mortgage loan nonaccruals were 2.72% at December 31, 2010, compared with 4.94% at December 31, 2009. The gross charge-off rate for the residential mortgage loan portfolio was 2.50% in 2010 compared to 1.79% for 2009. For the fourth quarter of 2010, the annualized gross charge-off rate was 1.42% compared to 1.34% for the third quarter of 2010. The improvement in nonaccrual loans primarily reflects the sale of nonperforming mortgage loans during the second quarter of 2010, which resulted in additional charge-offs as previously discussed.
62
Table of Contents
Table 14-3
Real Estate Lending Portfolio Credit Quality and Geographic Distribution
Direct Retail 1-4 Family and Lot/Land Real Estate Portfolio (1)
| As of / For the Period Ended December 31, 2010 | ||||||||||||||||
|
Direct Retail 1-4 Family and Lot/Land Real Estate Loans & Lines |
Residential
Lot/Land Loans |
Home Equity
Loans |
Home Equity
Lines |
Total | ||||||||||||
| (Dollars in millions, except average loan size) | ||||||||||||||||
|
Total loans outstanding |
$ | 1,363 | $ | 5,854 | $ | 5,513 | $ | 12,730 | ||||||||
|
Average loan size (in thousands) (2) |
59 | 44 | 36 | 41 | ||||||||||||
|
Average refreshed credit score (3) |
721 | 722 | 762 | 746 | ||||||||||||
|
Percentage that are first mortgages |
100 | % | 76 | % | 28 | % | 58 | % | ||||||||
|
Average loan to value at origination |
79 | 63 | 64 | 65 | ||||||||||||
|
Nonaccrual loans and leases as a percentage of category |
5.91 | 1.37 | .47 | 1.46 | ||||||||||||
|
Gross charge-offs as a percentage of category: |
||||||||||||||||
|
Year-to-Date |
8.01 | 1.58 | 1.52 | 2.32 | ||||||||||||
|
Quarter-to-Date |
8.87 | 1.64 | 1.62 | 2.43 | ||||||||||||
| As of / For the Period Ended December 31, 2010 | ||||||||||||||||
|
Gross Charge-Offs as a Percentage of
Outstandings |
||||||||||||||||
|
Direct Retail 1-4 Family and Lot/Land Real
|
Total
Outstandings |
Nonaccrual as a
Percentage of Outstandings |
Year-to-Date | Quarter-to-Date | ||||||||||||
| (Dollars in millions) | ||||||||||||||||
|
North Carolina |
$ | 4,374 | 1.72 | % | 2.18 | % | 2.32 | % | ||||||||
|
Virginia |
2,869 | .79 | 1.31 | 1.22 | ||||||||||||
|
South Carolina |
1,223 | 1.98 | 2.59 | 2.97 | ||||||||||||
|
Georgia |
1,025 | 1.66 | 3.89 | 4.23 | ||||||||||||
|
Maryland |
811 | .92 | 2.19 | 1.98 | ||||||||||||
|
West Virginia |
773 | 1.28 | .93 | .75 | ||||||||||||
|
Florida |
626 | 2.26 | 6.77 | 7.80 | ||||||||||||
|
Kentucky |
564 | 1.36 | .70 | .82 | ||||||||||||
|
Tennessee |
349 | 1.88 | 4.27 | 3.35 | ||||||||||||
|
Washington, D.C. |
81 | .92 | 4.20 | 6.00 | ||||||||||||
|
Other |
35 | 1.45 | 1.16 | 1.50 | ||||||||||||
|
Total |
$ | 12,730 | 1.46 | % | 2.32 | % | 2.43 | % | ||||||||
Applicable ratios are annualized.
| (1) | Direct retail 1-4 family and lot/land real estate loans are originated through the BB&T branching network. Excludes covered loans and in process items. |
| (2) | Home equity lines without an outstanding balance are excluded from this calculation. |
| (3) | Based on number of accounts. |
The direct retail consumer real estate loan portfolio, as presented in Table 14-3, totaled $12.7 billion as of December 31, 2010, a decrease of $663 million from December 31, 2009. This portfolio includes residential lot/land loans, home equity loans and home equity lines, which are primarily originated through the branch network. As a percentage of loans, direct retail consumer real estate nonaccruals were 1.46% at December 31, 2010, compared to 1.44% at December 31, 2009. The gross charge-off rate for the direct retail consumer real estate loan portfolio was 2.32% in 2010 compared to 2.19% for 2009. For the fourth quarter of 2010, the annualized gross charge-off rate was 2.43% compared to 2.24% for the third quarter of 2010.
The residential lot/land loan component of this portfolio experienced the highest loss rates during 2010. The amount of the allowance allocated for the residential lot/land portfolio was 7.3% as of December 31, 2010. This component of the portfolio declined $360 million, or 20.9%, during 2010.
63
Table of Contents
Deposits and Other Borrowings
Client deposits generated through the BB&T banking network are the largest source of funds used to support asset growth. Total deposits at December 31, 2010, were $107.2 billion, a decrease of $7.8 billion, or 6.7%, compared to year-end 2009. The decrease in deposits during 2010 was driven by an $11.0 billion, or 34.0%, decrease in client certificates of deposit. Other client deposits, which include money market deposit accounts, savings accounts, individual retirement accounts and other time deposits increased by $1.9 billion, or 3.7%, compared to year-end 2009 and noninterest-bearing deposits increased by $1.7 billion, or 8.9%, from the prior year. The overall decrease is primarily due to redemptions of wholesale deposits and higher rate certificates of deposit in connection with BB&T’s balance sheet deleveraging, as well as the sale of approximately $850 million of Nevada deposits acquired in the Colonial acquisition. For the year ended December 31, 2010, total deposits averaged $106.8 billion, an increase of $4.4 billion, or 4.3%, compared to 2009. The increase in average deposits was primarily the result of a $6.1 billion, or 13.6%, increase in average other client deposits, and a $3.4 billion, or 20.5%, increase in average noninterest-bearing deposits. These increases were partially offset by a decrease in other interest-bearing deposits of $4.1 billion compared to the prior year. The increase in average deposits included the impact of Colonial, which was acquired in August 2009.
The following table presents BB&T’s average deposits for the years ended December 31, 2010 and 2009, segregated by major category:
Table 15
Composition of Average Deposits
| Years Ended December 31, | ||||||||||||||||
| 2010 | 2009 | |||||||||||||||
| Balance |
% of
total |
Balance |
% of
total |
|||||||||||||
| (Dollars in millions) | ||||||||||||||||
|
Noninterest-bearing deposits |
$ | 19,742 | 18.5 | % | $ | 16,387 | 16.0 | % | ||||||||
|
Interest checking |
3,703 | 3.5 | 2,831 | 2.8 | ||||||||||||
|
Other client deposits |
51,239 | 47.9 | 45,107 | 44.1 | ||||||||||||
|
Client certificates of deposit |
26,872 | 25.2 | 28,702 | 28.0 | ||||||||||||
|
Total client deposits |
101,556 | 95.1 | 93,027 | 90.9 | ||||||||||||
|
Other interest-bearing deposits |
5,217 | 4.9 | 9,354 | 9.1 | ||||||||||||
|
Total average deposits |
$ | 106,773 | 100.0 | % | $ | 102,381 | 100.0 | % | ||||||||
The overall mix of deposits continued to improve in 2010. Average client deposits grew 9.2% due to strong growth in noninterest-bearing and other client deposits, which was aided by the Colonial acquisition, while reliance on other interest-bearing deposits declined. BB&T has been successful in attracting new business and individual accounts by emphasizing the strength of BB&T’s franchise.
The average rate paid on interest-bearing deposits dropped to 1.05% during 2010, from 1.48% in 2009. The average cost for interest-bearing deposits declined during 2010 as management was able to reduce its reliance on relatively higher rate CDs. The average rates paid on the various categories of interest-bearing deposits also decreased as follows: CDs decreased to 1.97% in the current year from 2.60% in 2009; other client deposits decreased to .64% in the current year from .88% in 2009; interest checking decreased to .30% in 2010 from .39% in 2009; and other interest-bearing deposits decreased to .92% in 2010 from 1.23% in 2009.
BB&T also uses various types of short-term borrowings in meeting funding needs. While client deposits remain the primary source for funding loan originations, management uses short-term borrowings as a supplementary funding source for loan growth and other balance sheet management purposes. Short-term borrowings were 5.7% of total funding on average in 2010 as compared to 8.0% in 2009. See Note 9 “Federal Funds Purchased, Securities Sold Under Agreements to Repurchase and Short-Term Borrowed Funds” in the “Notes to Consolidated Financial Statements” herein for further disclosure. The types of short-term borrowings used by the Corporation include Federal funds purchased, which was .4% of total short-term borrowings, and
64
Table of Contents
securities sold under repurchase agreements, which was 21.0% of short-term borrowings at year-end 2010. Master notes, which are short-term borrowings issued to BB&T’s clients, represented 14.2% of total short-term borrowings at December 31, 2010. Unsecured bank notes, bank obligations collateralized by municipal securities, U.S. Treasury tax and loan deposit notes and borrowings under the treasury auction facility are also used to meet short-term funding needs and represented the remaining 64.4% of these types of funding sources as of December 31, 2010. Short-term borrowings at the end of 2010 were $5.7 billion, a decrease of $2.4 billion, or 30.0% compared to year-end 2009. Average short-term borrowings totaled $9.0 billion during 2010 compared to $12.5 billion last year, a decrease of 27.8%. The decline in the balances during 2010 primarily reflect the balance sheet deleveraging strategy that was executed during the second quarter of 2010 and strong growth in client deposits which has reduced the Corporation’s reliance on short term funding. The rates paid on average short-term borrowings declined from .50% in 2009 to .28% during 2010. At December 31, 2010, the targeted Federal funds rate was a range of zero percent to .25%.
The following table summarizes certain pertinent information for the past three years with respect to BB&T’s short-term borrowings:
Table 16
Federal Funds Purchased, Securities Sold Under
Agreements to Repurchase and Short-Term Borrowed Funds
|
As of / For the Year Ended
December 31, |
||||||||||||
| 2010 | 2009 | 2008 | ||||||||||
| (Dollars in millions) | ||||||||||||
| Securities Sold Under Agreements to Repurchase | ||||||||||||
|
Maximum outstanding at any month-end during the year |
$ | 2,299 | $ | 2,635 | $ | 2,929 | ||||||
|
Balance outstanding at end of year |
1,189 | 2,197 | 2,929 | |||||||||
|
Average outstanding during the year |
1,620 | 2,259 | 2,314 | |||||||||
|
Average interest rate during the year |
.85 | % | .96 | % | 2.40 | % | ||||||
|
Average interest rate at end of year |
.96 | .69 | 1.41 | |||||||||
| Federal Funds Purchased and Short-term Borrowed Funds | ||||||||||||
|
Maximum outstanding at any month-end during the year |
$ | 10,486 | $ | 17,436 | $ | 13,346 | ||||||
|
Balance outstanding at end of year |
4,484 | 5,909 | 7,859 | |||||||||
|
Average outstanding during the year |
7,402 | 10,232 | 8,266 | |||||||||
|
Average interest rate during the year |
.10 | % | .35 | % | 2.17 | % | ||||||
|
Average interest rate at end of year |
.32 | .21 | .67 | |||||||||
BB&T also uses long-term debt to provide both funding and, to a lesser extent, regulatory capital. Long-term debt was 13.6% of total funding on average during 2010 and 12.3% in 2009. See Note 11 “Long-Term Debt” in the “Notes to Consolidated Financial Statements” herein for further disclosure. Long-term debt at December 31, 2010, totaled $21.7 billion, an increase of 1.7% from year-end 2009. The increase in long-term debt was primarily due to the issuance of $500 million of senior notes, with an interest rate of 3.95% due April 2016. For the year ended December 31, 2010, average long-term debt increased $2.6 billion, or 13.5%, compared to the average for 2009. The increase in average long-term debt reflects the current year issuance of $500 million and various issuances of long-term debt completed during 2009. BB&T’s long-term debt consists primarily of FHLB advances, which composed 47.1% of total outstanding long-term debt at December 31, 2010; senior notes of BB&T Corporation, which composed 15.2% of the year-end balance; subordinated notes of BB&T Corporation, which composed 13.6% of the year-end balance; and junior subordinated debt to unconsolidated trusts issued by the Corporation, which composed 15.0% of total outstanding long-term debt at December 31, 2010. The remaining long-term debt primarily consists of both unsecured senior and subordinated borrowings by Branch Bank. FHLB advances are cost-effective long-term funding sources that provide BB&T with the flexibility to structure the debt in a manner that aids in the management of interest rate risk and liquidity. The average rate paid on long-term debt increased from 3.73% during 2009 to 3.96% during 2010.
Liquidity needs are a primary consideration in evaluating funding sources. BB&T’s strategy is to maintain funding flexibility in order that the Corporation may react rapidly to opportunities that may become available in
65
Table of Contents
the marketplace. BB&T will continue to focus on traditional core funding strategies, supplemented as needed by the types of borrowings discussed above. See “Liquidity” herein for additional discussion.
Shareholders’ Equity
Shareholders’ equity totaled $16.5 billion at December 31, 2010, an increase of $257 million, or 1.6%, from year-end 2009. BB&T’s book value per common share at December 31, 2010 was $23.67, compared to $23.47 at December 31, 2009.
Shareholders’ equity increased $400 million due to BB&T’s earnings available to common shareholders retained after dividends declared. In addition, shareholders’ equity increased $189 million as a result of the issuance of additional shares and other transactions in connection with BB&T’s equity-based compensation plans, 401(k) plan and dividend reinvestment plan. These increases were partially offset by a decline of $330 million in other comprehensive income, which principally relates to decreases in the fair values of available-for-sale securities, including the impact of the FDIC loss sharing agreement, and changes in cash flow hedges and pension obligations.
BB&T’s tangible shareholders’ equity available to common shareholders was $10.7 billion at December 31, 2010, an increase of $752 million, or 7.6%, compared to December 31, 2009. BB&T’s tangible book value per common share at December 31, 2010 was $15.43 compared to $14.44 at December 31, 2009. As of December 31, 2010, measures of tangible capital were not required by the regulators and, therefore, were considered non-GAAP measures. Please refer to the section titled “Capital” herein for a discussion of how BB&T calculates and uses these measures in the evaluation of the Company.
Analysis of Results of Operations
Consolidated net income for 2010 totaled $854 million. Net income available to common shareholders totaled $816 million, which generated basic earnings per common share of $1.18 and diluted earnings per common share of $1.16. Net income for 2009 was $877 million and net income available to common shareholders totaled $729 million. Net income for 2008 totaled $1.53 billion and net income available to common shareholders totaled $1.50 billion. Basic earnings per common share were $1.16 in 2009 and $2.73 in 2008, while diluted earnings per common share were $1.15 and $2.71 for 2009 and 2008, respectively.
Two important and commonly used measures of bank profitability are return on average assets (net income as a percentage of average total assets) and return on average common shareholders’ equity (net income available to common shareholders as a percentage of average common shareholders’ equity). BB&T’s returns on average assets were .54%, .56%, and 1.12% for the years ended December 31, 2010, 2009 and 2008, respectively. The returns on average common shareholders’ equity were 4.85%, 4.93%, and 11.44% for the last three years.
Net Interest Income
Net interest income is BB&T’s primary source of revenue. Net interest income is influenced by a number of factors, including the volume, mix and maturity of interest-earning assets and interest-bearing liabilities and the interest rates earned and paid thereon. The difference between rates earned on interest-earning assets and the cost of the supporting funds (with an adjustment made to tax-exempt items to provide comparability with taxable items, i.e. the “FTE” adjustment) is measured by the net interest margin. The accompanying table presents the dollar amount of changes in interest income and interest expense, and distinguishes between the changes related to increases or decreases in average outstanding balances of interest-earning assets and interest-bearing liabilities (volume), and the changes related to increases or decreases in average interest rates on such assets and liabilities (rate). Changes attributable to both volume and rate have been allocated proportionately.
For 2010, net interest income on an FTE-adjusted basis totaled $5.5 billion, compared with $5.0 billion in 2009 and $4.3 billion in 2008. Net interest income increased 9.9% in 2010 compared to 2009. The increase in net interest income during 2010 resulted primarily from higher yields from the covered loan and securities portfolios, which were outstanding for the full year of 2010 compared to a partial year for 2009. In addition, the covered loan portfolio’s yield increased during 2010 as a result of improved expectations of cash flows from the original
66
Table of Contents
estimates. On a quarterly basis, management estimates the total expected cash flows from the loans acquired. Based on these assessments during 2010, the total expected cash flows increased, which resulted in additional accretion that is reflected in interest income. The additional accretion recognized from the assessments is significantly offset by lower noninterest income due to the provisions of the FDIC loss sharing agreements. Net interest income for 2010 also benefitted from lower funding costs, as management grew noninterest bearing deposits and was able to reduce higher costs certificates and other interest-bearing liabilities. Net interest income increased 14.9% in 2009 compared to 2008 due primarily to earning asset growth, which helped offset declines in yields due to a lower rate environment, lower funding costs and higher yields on the covered loan and securities portfolios.
The FTE-adjusted net interest margin is the primary measure used in evaluating the gross profit margin from the portfolios of earning assets. The FTE-adjusted net interest margin was 4.03% in 2010, 3.66% in 2009 and 3.58% in 2008. During 2010, the average yield on interest earning assets increased 19 basis points compared to the average yield during 2009, while the average cost of funds over the same time period decreased 21 basis points. The improvement in the net interest margin during 2010 was primarily due to the higher yield assets acquired in the Colonial acquisition and lower funding costs. The improvement in the net interest margin during 2009 was primarily due to successfully managing liability costs and wider spreads on assets.
67
Table of Contents
Table 17
FTE Net Interest Income and Rate / Volume Analysis
Years Ended December 31, 2010, 2009 and 2008
| 2010 vs. 2009 | 2009 vs. 2008 | |||||||||||||||||||||||||||||||||||||||||||||||||||||||||||
| Average Balances | Yield / Rate | Income / Expense |
Increase
(Decrease) |
Change due to |
Increase
(Decrease) |
Change due to | ||||||||||||||||||||||||||||||||||||||||||||||||||||||
| 2010 | 2009 | 2008 | 2010 | 2009 | 2008 | 2010 | 2009 | 2008 | Rate | Volume | Rate | Volume | ||||||||||||||||||||||||||||||||||||||||||||||||
| (Dollars in millions) | ||||||||||||||||||||||||||||||||||||||||||||||||||||||||||||
| Assets | ||||||||||||||||||||||||||||||||||||||||||||||||||||||||||||
|
Securities, at amortized cost (1): |
||||||||||||||||||||||||||||||||||||||||||||||||||||||||||||
|
U.S. government-sponsored entities (GSE) |
$ | 568 | $ | 1,400 | $ | 4,539 | 3.67 | % | 3.86 | % | 4.86 | % | $ | 21 | $ | 54 | $ | 221 | $ | (33 | ) | $ | (2 | ) | (31 | ) | $ | (167 | ) | $ | (39 | ) | $ | (128 | ) | |||||||||||||||||||||||||
|
Mortgage-backed securities issued by GSE |
22,310 | 25,419 | 14,708 | 3.24 | 4.14 | 4.94 | 723 | 1,052 | 727 | (329 | ) | (211 | ) | (118 | ) | 325 | (133 | ) | 458 | |||||||||||||||||||||||||||||||||||||||||
|
States and political subdivisions |
2,047 | 2,218 | 1,841 | 5.49 | 5.67 | 6.33 | 112 | 126 | 116 | (14 | ) | (5 | ) | (9 | ) | 10 | (13 | ) | 23 | |||||||||||||||||||||||||||||||||||||||||
|
Non-agency mortgage-backed securities |
1,174 | 1,447 | 1,642 | 5.87 | 5.82 | 5.81 | 69 | 84 | 95 | (15 | ) | 1 | (16 | ) | (11 | ) | — | (11 | ) | |||||||||||||||||||||||||||||||||||||||||
|
Other securities |
313 | 302 | 672 | 2.16 | 3.90 | 5.50 | 7 | 12 | 37 | (5 | ) | (5 | ) | — | (25 | ) | (9 | ) | (16 | ) | ||||||||||||||||||||||||||||||||||||||||
|
Covered securities |
1,198 | 440 | — | 11.84 | 11.35 | — | 142 | 50 | — | 92 | 2 | 90 | 50 | — | 50 | |||||||||||||||||||||||||||||||||||||||||||||
|
Total securities |
27,610 | 31,226 | 23,402 | 3.89 | 4.41 | 5.11 | 1,074 | 1,378 | 1,196 | (304 | ) | (220 | ) | (84 | ) | 182 | (194 | ) | 376 | |||||||||||||||||||||||||||||||||||||||||
|
Other earning assets (2) |
2,933 | 2,293 | 2,255 | .55 | .79 | 3.05 | 17 | 18 | 69 | (1 | ) | (6 | ) | 5 | (51 | ) | (53 | ) | 2 | |||||||||||||||||||||||||||||||||||||||||
|
Loans and leases, net of unearned income (1)(3)(4) |
||||||||||||||||||||||||||||||||||||||||||||||||||||||||||||
|
Commercial loans and leases |
48,777 | 50,074 | 47,557 | 4.23 | 4.21 | 5.50 | 2,063 | 2,110 | 2,617 | (47 | ) | 8 | (55 | ) | (507 | ) | (640 | ) | 133 | |||||||||||||||||||||||||||||||||||||||||
|
Direct retail loans |
13,948 | 14,730 | 15,580 | 5.29 | 5.47 | 6.47 | 737 | 806 | 1,008 | (69 | ) | (27 | ) | (42 | ) | (202 | ) | (150 | ) | (52 | ) | |||||||||||||||||||||||||||||||||||||||
|
Sales finance loans |
6,766 | 6,392 | 6,216 | 5.87 | 6.46 | 6.62 | 397 | 413 | 412 | (16 | ) | (39 | ) | 23 | 1 | (10 | ) | 11 | ||||||||||||||||||||||||||||||||||||||||||
|
Revolving credit loans |
2,032 | 1,855 | 1,664 | 8.74 | 9.51 | 10.95 | 178 | 176 | 182 | 2 | (15 | ) | 17 | (6 | ) | (25 | ) | 19 | ||||||||||||||||||||||||||||||||||||||||||
|
Mortgage loans |
15,965 | 15,927 | 17,327 | 5.38 | 5.72 | 6.00 | 859 | 911 | 1,039 | (52 | ) | (54 | ) | 2 | (128 | ) | (46 | ) | (82 | ) | ||||||||||||||||||||||||||||||||||||||||
|
Specialized lending |
7,778 | 7,141 | 5,509 | 11.46 | 11.51 | 12.89 | 892 | 822 | 710 | 70 | (4 | ) | 74 | 112 | (82 | ) | 194 | |||||||||||||||||||||||||||||||||||||||||||
|
Other acquired loans |
85 | 52 | — | 16.43 | 10.81 | — | 14 | 6 | — | 8 | 4 | 4 | 6 | — | 6 | |||||||||||||||||||||||||||||||||||||||||||||
|
Total loans and leases held for investment (excluding covered loans) |
95,351 | 96,171 | 93,853 | 5.39 | 5.45 | 6.36 | 5,140 | 5,244 | 5,968 | (104 | ) | (127 | ) | 23 | (724 | ) | (953 | ) | 229 | |||||||||||||||||||||||||||||||||||||||||
|
Covered loans |
7,059 | 3,144 | — | 13.22 | 7.39 | — | 933 | 232 | — | 701 | 272 | 429 | 232 | — | 232 | |||||||||||||||||||||||||||||||||||||||||||||
|
Total loans and leases held for investment |
102,410 | 99,315 | 93,853 | 5.93 | 5.51 | 6.36 | 6,073 | 5,476 | 5,968 | 597 | 145 | 452 | (492 | ) | (953 | ) | 461 | |||||||||||||||||||||||||||||||||||||||||||
|
Loans held for sale |
2,377 | 2,831 | 1,342 | 3.80 | 4.81 | 5.92 | 90 | 136 | 80 | (46 | ) | (26 | ) | (20 | ) | 56 | (17 | ) | 73 | |||||||||||||||||||||||||||||||||||||||||
|
Total loans and leases |
104,787 | 102,146 | 95,195 | 5.88 | 5.49 | 6.35 | 6,163 | 5,612 | 6,048 | 551 | 119 | 432 | (436 | ) | (970 | ) | 534 | |||||||||||||||||||||||||||||||||||||||||||
|
Total earning assets |
135,330 | 135,665 | 120,852 | 5.36 | 5.17 | 6.05 | 7,254 | 7,008 | 7,313 | 246 | (107 | ) | 353 | (305 | ) | (1,217 | ) | 912 | ||||||||||||||||||||||||||||||||||||||||||
|
Non-earning assets |
24,328 | 19,517 | 16,029 | |||||||||||||||||||||||||||||||||||||||||||||||||||||||||
|
Total assets |
$ | 159,658 | $ | 155,182 | $ | 136,881 | ||||||||||||||||||||||||||||||||||||||||||||||||||||||
| Liabilities and Shareholders' Equity | ||||||||||||||||||||||||||||||||||||||||||||||||||||||||||||
|
Interest-bearing deposits: |
||||||||||||||||||||||||||||||||||||||||||||||||||||||||||||
|
Interest-checking |
$ | 3,703 | $ | 2,831 | $ | 2,376 | .30 | .39 | 1.19 | 11 | 11 | 28 | — | (3 | ) | 3 | (17 | ) | (22 | ) | 5 | |||||||||||||||||||||||||||||||||||||||
|
Other client deposits |
51,239 | 45,107 | 36,676 | .64 | .88 | 1.67 | 326 | 398 | 612 | (72 | ) | (118 | ) | 46 | (214 | ) | (335 | ) | 121 | |||||||||||||||||||||||||||||||||||||||||
|
Client certificates of deposits |
26,872 | 28,702 | 26,908 | 1.97 | 2.60 | 3.66 | 531 | 747 | 985 | (216 | ) | (172 | ) | (44 | ) | (238 | ) | (301 | ) | 63 | ||||||||||||||||||||||||||||||||||||||||
|
Other interest-bearing deposits |
5,217 | 9,354 | 9,810 | .92 | 1.23 | 2.71 | 49 | 115 | 266 | (66 | ) | (23 | ) | (43 | ) | (151 | ) | (139 | ) | (12 | ) | |||||||||||||||||||||||||||||||||||||||
|
Total interest-bearing deposits |
87,031 | 85,994 | 75,770 | 1.05 | 1.48 | 2.50 | 917 | 1,271 | 1,891 | (354 | ) | (316 | ) | (38 | ) | (620 | ) | (797 | ) | 177 | ||||||||||||||||||||||||||||||||||||||||
|
Federal funds purchased, securities sold under repurchase agreements and short-term borrowed funds (1) |
9,022 | 12,491 | 10,580 | .28 | .50 | 2.44 | 26 | 63 | 258 | (37 | ) | (23 | ) | (14 | ) | (195 | ) | (235 | ) | 40 | ||||||||||||||||||||||||||||||||||||||||
|
Long-term debt |
21,653 | 19,085 | 19,839 | 3.96 | 3.73 | 4.25 | 856 | 711 | 843 | 145 | 46 | 99 | (132 | ) | (100 | ) | (32 | ) | ||||||||||||||||||||||||||||||||||||||||||
|
Total interest-bearing liabilities |
117,706 | 117,570 | 106,189 | 1.53 | 1.74 | 2.82 | 1,799 | 2,045 | 2,992 | (246 | ) | (293 | ) | 47 | (947 | ) | (1,132 | ) | 185 | |||||||||||||||||||||||||||||||||||||||||
|
Noninterest-bearing deposits |
19,742 | 16,387 | 13,061 | |||||||||||||||||||||||||||||||||||||||||||||||||||||||||
|
Other liabilities |
5,324 | 4,987 | 4,098 | |||||||||||||||||||||||||||||||||||||||||||||||||||||||||
|
Shareholders' equity |
16,886 | 16,238 | 13,533 | |||||||||||||||||||||||||||||||||||||||||||||||||||||||||
|
Total liabilities and shareholders' equity |
$ | 159,658 | $ | 155,182 | $ | 136,881 | ||||||||||||||||||||||||||||||||||||||||||||||||||||||
|
Average interest rate spread |
3.83 | % | 3.43 | % | 3.23 | % | ||||||||||||||||||||||||||||||||||||||||||||||||||||||
|
Net interest margin/net interest income |
4.03 | % | 3.66 | % | 3.58 | % | $ | 5,455 | $ | 4,963 | $ | 4,321 | $ | 492 | $ | 186 | $ | 306 | $ | 642 | $ | (85 | ) | $ | 727 | |||||||||||||||||||||||||||||||||||
|
Taxable-equivalent adjustment |
$ | 135 | $ | 119 | $ | 83 | ||||||||||||||||||||||||||||||||||||||||||||||||||||||
| (1) | Yields are stated on a fully taxable-equivalent basis assuming tax rates in effect for the periods presented. |
| (2) | Includes Federal funds sold, securities purchased under resale agreements or similar arrangements, interest-bearing deposits with banks, trading securities, FHLB stock and other earning assets. |
| (3) | Loan fees, which are not material for any of the periods shown, have been included for rate calculation purposes. |
| (4) | Nonaccrual loans have been included in the average balances. |
68
Table of Contents
Provision for Credit Losses
A provision for credit losses is charged against earnings in order to maintain an allowance for loan and lease losses and a reserve for unfunded lending commitments that reflects management’s best estimate of probable losses inherent in the credit portfolios at the balance sheet date. The amount of the provision is based on continuing assessments of nonperforming and “watch list” loans and associated unfunded credit commitments, analytical reviews of loss experience in relation to outstanding loans and funded credit commitments, loan charge-offs, nonperforming asset trends and management’s judgment with respect to current and expected economic conditions and their impact on the loan portfolio and outstanding unfunded credit commitments. The methodology used is described in the “Overview and Description of Business” section under the heading “Allowance for Loan and Lease Losses and Reserve for Unfunded Credit Commitments.” The provision for credit losses recorded by BB&T in 2010 was $2.6 billion, compared with $2.8 billion in 2009 and $1.4 billion in 2008.
The provision for credit losses decreased 6.2% during 2010 while total loans and leases held for investment was relatively flat compared to the balance outstanding at the end of 2009. Included in the provision for credit losses during 2010 was $144 million related to covered loans. The provision for credit losses recorded for covered loans reflects lower expected cash flows on certain loan pools compared to the original estimates. Approximately 80% of this provision for credit losses is offset through a credit to noninterest income based on the provisions of the FDIC loss sharing agreements. Net charge-offs were 2.41% of average loans and leases (or 2.59% excluding covered loans) for 2010 compared to 1.74% of average loans and leases (or 1.79% excluding covered loans) during 2009. The allowance for loan and lease losses was 2.62% of loans and leases held for investment (or 2.63% excluding covered loans) and was 1.26x total nonaccrual loans and leases held for investment (or 1.19x excluding covered loans) at year-end 2010, compared to 2.51% (or 2.72% excluding covered loans) and .98x, respectively, at December 31, 2009. The decrease in the provision for credit losses during 2010 compared to 2009 was primarily due to the improving economic outlook that began to materialize in the latter part of 2010. The 94.5% increase in the provision for credit losses during 2009 compared to 2008 was primarily driven by ongoing challenges in residential real estate markets and the overall economy with the largest concentration of credit issues occurring in Georgia, Florida, and metro Washington D.C., with some deterioration in the coastal areas of the Carolinas. Additional disclosures related to BB&T’s real estate lending by product type and geographic distribution can be found in Table 14 herein.
Noninterest Income
Noninterest income has become, and will continue to be, a significant contributor to BB&T’s financial success. Noninterest income includes insurance income, service charges on deposit accounts, mortgage banking income, investment banking and brokerage fees and commissions, trust and investment advisory revenues, gains and losses on securities transactions, and commissions and fees derived from other activities. Noninterest income as a percentage of total FTE revenues totaled 42.0% for 2010. Exceeding 40% on this measure has been a management objective for several years. Management continues to focus on diversifying its sources of revenue to further reduce BB&T’s reliance on traditional spread-based interest income, as fee-based activities are a relatively stable revenue source during periods of changing interest rates.
69
Table of Contents
The following table provides a breakdown of BB&T’s noninterest income:
Table 18
Noninterest Income
| Years Ended December 31, | % Change | |||||||||||||||||||
|
2010
v. 2009 |
2009
v. 2008 |
|||||||||||||||||||
| 2010 | 2009 | 2008 | ||||||||||||||||||
| (Dollars in millions) | ||||||||||||||||||||
|
Insurance income |
$ | 1,041 | $ | 1,047 | $ | 928 | (.6 | )% | 12.8 | % | ||||||||||
|
Service charges on deposits |
618 | 690 | 673 | (10.4 | ) | 2.5 | ||||||||||||||
|
Mortgage banking income |
521 | 658 | 275 | (20.8 | ) | 139.3 | ||||||||||||||
|
Investment banking and brokerage fees and commissions |
352 | 346 | 354 | 1.7 | (2.3 | ) | ||||||||||||||
|
Other nondeposit fees and commissions |
270 | 229 | 189 | 17.9 | 21.2 | |||||||||||||||
|
Checkcard fees |
274 | 227 | 201 | 20.7 | 12.9 | |||||||||||||||
|
Bankcard fees and merchant discounts |
177 | 156 | 151 | 13.5 | 3.3 | |||||||||||||||
|
Trust and investment advisory revenues |
159 | 139 | 147 | 14.4 | (5.4 | ) | ||||||||||||||
|
Income from bank-owned life insurance |
123 | 97 | 84 | 26.8 | 15.5 | |||||||||||||||
|
FDIC loss share income, net |
(116 | ) | 14 | — | NM | 100.0 | ||||||||||||||
|
Securities gains, net |
554 | 199 | 107 | 178.4 | 86.0 | |||||||||||||||
|
Other income, net |
(16 | ) | 132 | 88 | (112.1 | ) | 50.0 | |||||||||||||
|
Total noninterest income |
$ | 3,957 | $ | 3,934 | $ | 3,197 | .6 | % | 23.1 | % | ||||||||||
NM—not meaningful
Overall noninterest income was up slightly in 2010 compared to 2009. The growth in 2010 primarily was a result of an increase in securities gains offset by lower revenues from BB&T’s mortgage banking operations, lower noninterest income from the FDIC loss share receivable, reduced service charges on deposit accounts and lower revenues from other noninterest income sources. During 2009, noninterest income grew 23.1% as a result of increased revenues from almost all of BB&T’s fee-based businesses, with the exception of small declines in investment banking and brokerage fees and commissions and trust and investment advisory revenues. The major categories of noninterest income and fluctuations in these amounts are discussed in the following paragraphs. These fluctuations reflect the impact of acquisitions.
Income from BB&T’s insurance agency/brokerage operations was the largest source of noninterest income. Insurance income was down slightly in 2010. Insurance commissions declined $29 million during 2010 reflecting continued softness in the industry’s pricing for premiums, which was partially offset by an increase of $23 million in insurance income from underwriting activities. The decline in insurance commissions was primarily related to property and casualty insurance. Internal growth, combined with the expansion of BB&T’s insurance agency network through acquisitions resulted in growth of 12.8% in 2009. The increase in commission income during 2009 was primarily related to commissions for property and casualty insurance, which increased $77 million primarily due to acquisitions. In addition, employee benefit commissions and other insurance fees increased $14 million and $11 million, respectively.
Service charges on deposit accounts represent BB&T’s second largest category of noninterest revenue. Service charge revenue declined $72 million, or 10.4% during 2010. Service charge revenue increased $17 million, or 2.5%, during 2009. The decrease in 2010 was largely a result of a decline in overdraft fees as a result of recent changes to BB&T’s overdraft policies during 2010 that were partially in response to new regulation. The 2009 increase was primarily a result of the acquisition of Colonial and growth in transaction accounts.
Income from mortgage banking activities includes gains and losses from the sale of mortgage loans, revenue from servicing mortgage loans, valuation adjustments for mortgage servicing rights, mortgage servicing rights-related derivative gains/losses and the amortization or realization of expected mortgage servicing rights cash flows.
70
Table of Contents
Mortgage banking income totaled $521 million, $658 million and $275 million during 2010, 2009 and 2008, respectively. The following table provides a breakdown of the various components of mortgage banking income and related statistical information:
Table 19
Mortgage Banking Income and Related Statistical Information
|
As of / For the Years
Ended December 31, |
% Change | |||||||||||||||||||
|
2010
v. 2009 |
2009
v. 2008 |
|||||||||||||||||||
|
Mortgage Banking Income |
2010 | 2009 | 2008 | |||||||||||||||||
| (Dollars in millions) | ||||||||||||||||||||
|
Residential Mortgage Banking: |
||||||||||||||||||||
|
Residential mortgage production income |
$ | 301 | $ | 457 | $ | 127 | (34.1 | )% | 259.8 | % | ||||||||||
|
Residential Mortgage Servicing: |
||||||||||||||||||||
|
Residential mortgage servicing fees |
226 | 190 | 145 | 18.9 | 31.0 | |||||||||||||||
|
Residential mortgage servicing rights (decrease) increase in fair value due to change in valuation inputs or
|
(139 | ) | 190 | (220 | ) | |||||||||||||||
|
Mortgage servicing rights hedging gains (losses) |
196 | (98 | ) | 262 | ||||||||||||||||
|
Net |
57 | 92 | 42 | (38.0 | ) | 119.0 | ||||||||||||||
|
Realization of expected residential mortgage servicing rights cash flows |
(129 | ) | (126 | ) | (94 | ) | 2.4 | 34.0 | ||||||||||||
|
Total residential mortgage servicing income |
154 | 156 | 93 | (1.3 | ) | 67.7 | ||||||||||||||
|
Total residential mortgage banking income |
455 | 613 | 220 | (25.8 | ) | 178.6 | ||||||||||||||
|
Commercial Mortgage Banking: |
||||||||||||||||||||
|
Commercial mortgage banking revenues |
84 | 63 | 69 | 33.3 | (8.7 | ) | ||||||||||||||
|
Amortization of commercial mortgage servicing rights |
(18 | ) | (18 | ) | (14 | ) | — | 28.6 | ||||||||||||
|
Total commercial mortgage banking income |
66 | 45 | 55 | 46.7 | (18.2 | ) | ||||||||||||||
|
Total mortgage banking income |
$ | 521 | $ | 658 | $ | 275 | (20.8 | ) | 139.3 | |||||||||||
|
As of / For the Years
Ended December 31, |
% Change | |||||||||||||||||||
|
2010
v. 2009 |
2009
v. 2008 |
|||||||||||||||||||
|
Mortgage Banking Statistical Information |
2010 | 2009 | 2008 | |||||||||||||||||
| (Dollars in millions) | ||||||||||||||||||||
|
Residential mortgage originations |
$ | 24,866 | $ | 28,183 | $ | 16,438 | (11.8 | )% | 71.5 | % | ||||||||||
|
Residential mortgage loans serviced for others |
61,791 | 54,523 | 40,677 | 13.3 | 34.0 | |||||||||||||||
|
Residential mortgage loan sales |
19,100 | 25,773 | 13,405 | (25.9 | ) | 92.3 | ||||||||||||||
|
Commercial mortgage originations |
3,085 | 2,342 | 3,717 | 31.7 | (37.0 | ) | ||||||||||||||
|
Commercial mortgage loans serviced for others |
24,057 | 24,253 | 23,902 | (.8 | ) | 1.5 | ||||||||||||||
| (1) | Includes a $1 million decrease due to a valuation adjustment for MSRs carried at the lower of cost or market during the twelve months ended December 31, 2010. |
Mortgage banking income decreased $137 million, or 20.8%, during 2010, following a record year in 2009. Residential mortgage production income declined $156 million compared with 2009 due to lower gains on sales in the current year, as originations declined and the proportion of loans sold decreased due to a decision in the third quarter of 2010 to retain a portion of 10 to 15 year fixed- and adjustable-rate mortgage production. Residential mortgage servicing income was relatively flat in 2010 compared to 2009, as growth in servicing fees of $36 million from an increase in the size of the loan servicing portfolio was offset by a $35 million unfavorable net change in the valuation for mortgage servicing rights and related economic hedging activities. Commercial mortgage banking income was up $21 million, or 46.7%, in 2010 due to improved market conditions. Mortgage banking income increased $383 million, or 139.3%, during 2009. This increase includes the net change in the mortgage servicing rights valuation, which resulted in an increase of $50 million compared to 2008. Mortgage banking income for 2008 included certain one-time items associated with the implementation of fair value accounting
71
Table of Contents
standards that benefited results by approximately $23 million. Excluding the impact of these items, mortgage banking income in 2009 increased $356 million compared to 2008. The growth in mortgage banking income in 2009 is primarily attributable to record production revenues from residential mortgage banking operations, generated by $28.2 billion in mortgage loan originations during 2009 compared to $16.4 billion during 2008.
Investment banking and brokerage fees and commissions increased $6 million, or 1.7%, compared to 2009. The increase in 2010 was largely driven by record fourth quarter performance as market conditions improved and BB&T Capital Markets, a division of Scott & Stringfellow, brought more equity and fixed income deals to market.
Other nondeposit fees and commissions, including bankcard fees and merchant discounts and checkcard fees increased $109 million, or 17.8%, during 2010 compared to 2009. During 2009, these categories increased $71 million, or 13.1%, compared to 2008. The increases in 2010 and 2009 included additional checkcard fees of $47 million and $26 million, respectively, as clients continued to show a preference for utilizing electronic forms of payment rather than traditional paper checks, as well as the impact of the additional clients from Colonial. Bankcard fees also grew $21 million in 2010 compared to 2009 and $5 million in 2009 compared to 2008. The increased bankcard fees in 2010 were the result of higher volumes and improving market conditions. The growth for 2010 and 2009 in other nondeposit fees and commissions largely reflects additional revenues from commercial lending-related activities.
Trust and investment advisory revenues are based on the types of services provided as well as the overall value of the assets managed, which is affected by stock market conditions. During 2010, trust and investment advisory revenues increased by $20 million, or 14.4%, compared to 2009, primarily due to fee increases and improved market conditions. During 2009, trust and investment advisory revenues decreased by $8 million, or 5.4%, compared to 2008.
BB&T recognized $554 million in net securities gains during 2010 compared to net gains of $199 million and $107 million during 2009 and 2008, respectively. The net securities gains recognized in 2010 included $585 million of net gains realized from securities sales and $31 million of losses as a result of other-than-temporary impairments. The large increase in securities gains during 2010 reflects the results of the balance sheet deleveraging strategy that was executed during the second quarter of 2010 and the de-risking of the investment portfolio that began during the third quarter of 2010 and was completed in the fourth quarter. The net securities gains recognized in 2009 and 2008 included $240 million and $211 million, respectively, of net gains from securities sales and $41 million and $104 million of losses, respectively, as a result of other-than-temporary impairments.
Income from the FDIC loss share receivable primarily reflects changes to the amounts expected to be recovered under the FDIC loss sharing agreements. During 2010, covered loans experienced better performance than originally anticipated resulting in additional interest income. A significant portion of that increase was offset by a $232 million reduction in noninterest income. This decrease in income was partially offset by an increase of $116 million, which reflected approximately 80% of the provision for credit losses recorded on covered loans.
Other income, including income from bank-owned life insurance, decreased $122 million in 2010 compared to 2009, primarily due to a $90 million increase in losses and write-downs on nonperforming commercial loans that were transferred to the loans held for sale portfolio in connection with management’s nonperforming asset disposition strategy. Trading gains at Scott & Stringfellow declined $25 million. Also, the prior year included a $27 million gain on the sale of BB&T’s payroll processing business. The increase of $57 million in 2009 compared to 2008 was primarily due to a $74 million increase in the value of various financial assets isolated for the purpose of providing post-employment benefits. The increase in the value of these assets is neutral to net income as these gains relate to participant’s accounts and increase personnel expense because they relate to the amount of benefits that will be paid in the future. In addition, trading gains at Scott & Stringfellow increased $25 million compared to 2008 and BB&T recognized a gain of $27 million on the sale of BB&T’s payroll processing business. These increases were partially offset by $80 million in gains in 2008 related to BB&T’s ownership interest and sale of Visa, Inc. stock.
72
Table of Contents
The ability to generate significant amounts of noninterest revenue in the future will be important to the continued financial success of BB&T. Through its subsidiaries, BB&T will continue to focus on asset management, mortgage banking, trust, insurance, investment banking and brokerage services, as well as other fee-producing products and services. BB&T plans to continue to pursue acquisitions of additional financial services companies, including insurance agencies and other fee income producing businesses as a means of expanding fee-based revenues. Also, among BB&T’s principal strategies following the acquisition of a financial institution is the cross-sell of noninterest income generating products and services to the acquired institution’s client base. Management expects that noninterest income excluding securities gains will be relatively flat in 2011 as a result of revenue challenges due to regulatory changes that are currently in effect or proposed to take effect during 2011. Management has estimated that noninterest revenue sources at risk as a result of various regulatory initiatives, including the Durbin Amendment and overdraft policy changes are in the range of $450 million on an annual run rate basis beginning in 2012. To date, management has implemented or identified changes in products and fees to offset approximately half of the potential lost revenue and is continuing to evaluate the Company’s product offerings in an effort to eliminate, as much as possible, the negative financial impacts of these regulatory changes.
Noninterest Expense
Noninterest expense totaled $5.7 billion in 2010, $4.9 billion in 2009 and $3.9 billion in 2008. Noninterest expense includes certain merger-related and restructuring charges recorded during the years 2010, 2009 and 2008 as noted in Table 21 below. These amounts totaled $69 million in 2010, $38 million in 2009 and $15 million in 2008. Additional disclosures related to these merger-related and restructuring charges are presented in “Merger-Related and Restructuring Charges.” The table below shows the components of noninterest expense and the discussion that follows explains the composition of certain categories and the factors that caused them to change in 2010 and 2009.
73
Table of Contents
Table 20
Noninterest Expense
| Years Ended December 31, | % Change | |||||||||||||||||||
|
2010
v. 2009 |
2009
v. 2008 |
|||||||||||||||||||
| 2010 | 2009 | 2008 | ||||||||||||||||||
| (Dollars in millions) | ||||||||||||||||||||
|
Salaries and wages |
$ | 2,153 | $ | 2,000 | $ | 1,863 | 7.7 | % | 7.4 | % | ||||||||||
|
Pension and other employee benefits |
463 | 517 | 338 | (10.4 | ) | 53.0 | ||||||||||||||
|
Total personnel expenses |
2,616 | 2,517 | 2,201 | 3.9 | 14.4 | |||||||||||||||
|
Foreclosed property expense |
747 | 356 | 79 | 109.8 | NM | |||||||||||||||
|
Net occupancy expense on bank premises |
378 | 366 | 310 | 3.3 | 18.1 | |||||||||||||||
|
Furniture and equipment expense |
230 | 213 | 199 | 8.0 | 7.0 | |||||||||||||||
|
Total occupancy and equipment expenses |
608 | 579 | 509 | 5.0 | 13.8 | |||||||||||||||
|
Professional services |
334 | 262 | 204 | 27.5 | 28.4 | |||||||||||||||
|
Regulatory charges |
211 | 230 | 30 | (8.3 | ) | NM | ||||||||||||||
|
Loan processing expenses |
180 | 135 | 125 | 33.3 | 8.0 | |||||||||||||||
|
Amortization of intangibles |
122 | 114 | 100 | 7.0 | 14.0 | |||||||||||||||
|
Software |
117 | 94 | 74 | 24.5 | 27.0 | |||||||||||||||
|
Merger-related and restructuring charges, net |
69 | 38 | 15 | 81.6 | 153.3 | |||||||||||||||
|
Deposit related expense |
61 | 53 | 49 | 15.1 | 8.2 | |||||||||||||||
|
Telephone |
50 | 47 | 42 | 6.4 | 11.9 | |||||||||||||||
|
Advertising and public relations |
50 | 31 | 50 | 61.3 | (38.0 | ) | ||||||||||||||
|
Travel and transportation |
48 | 39 | 52 | 23.1 | (25.0 | ) | ||||||||||||||
|
Other marketing expense |
43 | 33 | 46 | 30.3 | (28.3 | ) | ||||||||||||||
|
Supplies |
33 | 35 | 40 | (5.7 | ) | (12.5 | ) | |||||||||||||
|
Operational losses |
12 | 60 | 17 | (80.0 | ) | NM | ||||||||||||||
|
Other noninterest expenses |
369 | 308 | 278 | 19.8 | 10.8 | |||||||||||||||
|
Total noninterest expense |
$ | 5,670 | $ | 4,931 | $ | 3,911 | 15.0 | % | 26.1 | % | ||||||||||
NM—not meaningful
The 15.0% and 26.1% increases in total noninterest expense during 2010 and 2009 were primarily due to increases in personnel costs, foreclosed property expense and professional services. In addition, 2009 reflects a significant increase in regulatory charges as a result of increased FDIC insurance premiums. The increases during 2010 and 2009 were impacted by the acquisitions of Colonial during 2009 and several nonbank financial services companies during 2008 through 2009.
Total personnel expense is the largest component of noninterest expense and includes salaries and wages, as well as pension and other employee benefit costs. Total personnel expense increased $99 million, or 3.9%, in 2010. This increase was primarily driven by increases in salaries and wages of $153 million which includes the impact of acquisitions. This increase was partially offset by a $54 million decrease in pension plan expense. The decrease in pension expense was largely a result of an increase in the value of pension assets during 2009, which resulted in an increase in the estimated return on plan assets and a decrease in the amortization of net actuarial losses for 2010. The 2009 increase of 14.4% was partially driven by increases in salaries and wages of $137 million which included the impact of acquisitions. Other post-employment benefits expense and pension plan expense also increased $67 million and $66 million, respectively. The increase in pension expense was largely the result of a reduction in the discount rate, and an increase in the amortization of net actuarial losses. The increase in other post employment benefits expense was due to increases in the value of participant’s accounts and was offset by a similar increase in noninterest income. In addition, health care and other welfare expenses were higher by $36 million. Additional disclosures relating to BB&T’s benefit plans can be found in Note 15 “Benefit Plans” in the “Notes to Consolidated Financial Statements.”
Foreclosed property expense increased $391 million in 2010. Foreclosed property expense increased $277 million in 2009. The increases in 2010 and 2009 were primarily due to rising maintenance costs, valuation
74
Table of Contents
adjustments and sales of foreclosed property. Maintenance cost on foreclosed properties increased by $60 million and $67 million in 2010 and 2009, respectively, compared to the prior year, while valuation adjustments, including losses from sales of properties, increased by $331 million and $206 million in 2010 and 2009, respectively. BB&T’s inventory of foreclosed property decreased by $192 million in 2010 after increasing by $913 million during 2009. The decline in inventory during 2010 reflects management’s more aggressive efforts to liquidate properties and improving markets for distressed assets.
Net occupancy and equipment expense increased $29 million, or 5.0%, in 2010. During 2009, net occupancy and equipment expense increased by $70 million, or 13.8%. The increases in 2010 and 2009 were largely a result of increased rent expense related to the Colonial acquisition.
Professional services expense increased $72 million, or 27.5%, in 2010. The increase in 2010 included a $30 million increase in legal fees primarily associated with problem loan and other credit related items. In addition, other professional services increased $42 million during 2010 related to various management initiatives. Professional services expense increased $58 million during 2009, which included $26 million in higher legal costs primarily due to credit related items and $32 million for other professional services.
Regulatory charges declined by $19 million in 2010 after an increase of $200 million in 2009. The increase in 2009 was a result of higher FDIC insurance expense, which increased $201 million. The higher FDIC insurance expense reflects increased premiums charged by the FDIC as one step the FDIC has taken to insure adequate funding to resolve failed institutions. In addition to the higher premiums, the FDIC also levied a special assessment of $68 million in the second quarter of 2009. The FDIC also required that insured depository institutions prepay three years of assessments on December 31, 2009. BB&T’s prepayment was $608 million and will be expensed as incurred over the three-year period based on the actual FDIC assessment calculation.
Loan processing expenses increased $45 million during 2010 compared to 2009. The 2010 increase includes additional costs related to the Colonial acquisition and a $23 million increase for losses and reserves related to future repurchases from BB&T’s investor owned servicing portfolio. BB&T has experienced an increase in repurchase activity in 2010, with $107 million of loan repurchases and indemnification payments in the current year compared with $33 million for the full year 2009. While these levels have increased, they remain modest compared to the industry. During 2009, loan processing expenses increased $10 million, primarily due to the Colonial acquisition.
Other noninterest expenses increased $122 million, or 14.3%, compared to 2009, which reflected an increase of $89 million, or 11.7%, compared to 2008. The increase included the impact of $41 million in gains on the extinguishment of debt that were realized during 2009. In addition, merger-related and restructuring charges and software expense increased $31 million and $23 million, respectively, from the prior year. The increase in merger-related charges was primarily due to costs incurred in connection with the Colonial systems conversion. These increases were partially offset by a decline of $48 million in operational losses compared to the prior year. The 2009 increase was primarily the result of increases in merger-related and restructuring charges and software expense of $23 million and $20 million, respectively. In addition, the increase for 2009 included $43 million of additional operational losses compared to 2008. The increases for 2010 and 2009 were impacted by acquisitions completed during 2009. Please refer to Table 20 for additional detail on fluctuations in other categories of noninterest expense.
Merger-Related and Restructuring Charges
BB&T recorded certain merger-related and restructuring charges during the years 2010, 2009 and 2008. These charges are reflected in BB&T’s Consolidated Statements of Income as a category of noninterest expense. Please Refer to Note 2 “Business Combinations” in the “Notes to Consolidated Financial Statements” for a summary of mergers and acquisitions consummated during the three years ended December 31, 2010.
During 2010, BB&T recorded $69 million of merger-related and restructuring charges. These amounts were primarily associated with the acquisition of Colonial and related systems conversions. The 2009 net merger-related and restructuring charges of $38 million were primarily associated with the acquisition of Colonial. During 2008, BB&T recorded merger-related and restructuring charges of $15 million. These expenses were primarily associated with the acquisitions of insurance agencies and other merger-related and restructuring activities.
75
Table of Contents
The following table presents the components of merger-related and restructuring charges included in noninterest expenses. This table includes changes to previously recorded merger-related accruals and period expenses for merger-related items that must be expensed as incurred. Items that are required to be expensed as incurred include certain expenses associated with systems conversions, data processing, training and other costs.
Table 21
Summary of Merger-Related and Restructuring Charges
|
Years Ended
December 31, |
||||||||||||
| 2010 | 2009 | 2008 | ||||||||||
| (Dollars in millions) | ||||||||||||
|
Severance and personnel-related |
$ | 11 | $ | 17 | $ | 5 | ||||||
|
Occupancy and equipment |
28 | 1 | 3 | |||||||||
|
Other |
30 | 20 | 7 | |||||||||
|
Total |
$ | 69 | $ | 38 | $ | 15 | ||||||
Severance and personnel-related costs or credits include severance, employee retention, payments related to change-in-control provisions of employment contracts, outplacement services and other benefits associated with employee termination or reversals of previously estimated amounts, which typically occur in corporate support and data processing functions. Occupancy and equipment charges or credits represent merger-related and restructuring costs or gains associated with lease terminations, obsolete equipment write-offs, and the sale of duplicate facilities and equipment. Credits may result if obsolete properties or equipment are sold for more than originally estimated. Other merger-related and restructuring charges or credits include expenses necessary to convert and combine the acquired branches and operations of merged companies, direct media advertising related to the acquisitions, asset and supply inventory write-offs, litigation accruals, and other similar charges.
Merger-related and restructuring accruals are established when the costs are incurred or once all requirements for a plan to dispose of certain business functions have been approved by management. In general, a major portion of accrued costs are utilized in conjunction with or immediately following the systems conversion, when most of the duplicate positions are eliminated and the terminated employees begin to receive severance. Other accruals are utilized over time based on the sale, closing or disposal of duplicate facilities or equipment or the expiration of lease contracts. Merger and restructuring accruals are re-evaluated periodically and adjusted as necessary. The remaining accruals at December 31, 2010 are expected to be utilized during 2011, unless they relate to specific contracts that expire in later years. The following tables present a summary of activity with respect to BB&T’s merger and restructuring accruals. These tables include costs reflected as expenses, as presented in the table above, and certain accruals recorded through purchase accounting adjustments.
| Merger-related and Restructuring Accrual Activity | ||||||||||||||||||||
| (Dollars in millions) | ||||||||||||||||||||
|
Balance
January 1, 2009 |
Merger-
related and restructuring charges |
Utilized |
Other,
net |
Balance
December 31, 2009 |
||||||||||||||||
|
Severance and personnel-related |
$ | 7 | $ | 17 | $ | (18 | ) | $ | — | $ | 6 | |||||||||
|
Occupancy and equipment |
6 | 1 | (2 | ) | (2 | ) | 3 | |||||||||||||
|
Other |
11 | 20 | (28 | ) | 3 | 6 | ||||||||||||||
|
Total |
$ | 24 | $ | 38 | $ | (48 | ) | $ | 1 | $ | 15 | |||||||||
|
Balance
January 1, 2010 |
Merger-
related and restructuring charges |
Utilized |
Other,
net |
Balance
December 31, 2010 |
||||||||||||||||
|
Severance and personnel-related |
$ | 6 | $ | 11 | $ | (14 | ) | $ | (1 | ) | $ | 2 | ||||||||
|
Occupancy and equipment |
3 | 28 | (25 | ) | — | 6 | ||||||||||||||
|
Other |
6 | 30 | (31 | ) | (3 | ) | 2 | |||||||||||||
|
Total |
$ | 15 | $ | 69 | $ | (70 | ) | $ | (4 | ) | $ | 10 | ||||||||
76
Table of Contents
Provision for Income Taxes
BB&T’s provision for income taxes totaled $115 million for 2010, a decrease of $44 million, or 27.7%, compared to 2009. The decline in the provision for income taxes during 2010 was largely due to lower pre-tax income, higher federal tax credits and higher tax-exempt income. The provision for income taxes totaled $159 million in 2009 and $550 million in 2008. The decline in the provision for income taxes during 2009 was also primarily due to lower pre-tax income and higher federal tax credits and tax exempt income. The variances in the provision for income taxes during 2010 and 2009 were also affected by the treatment of leveraged lease transactions as discussed below. BB&T’s effective tax rates for the years ended 2010, 2009 and 2008 were 11.9%, 15.3% and 26.5%, respectively. A reconciliation of the effective tax rate to the statutory tax rate is included in Note 14 “Income Taxes” in the “Notes to Consolidated Financial Statements” herein.
BB&T has extended credit to, and invested in, the obligations of states and municipalities and their agencies, and has made other investments and loans that produce tax-exempt income. The income generated from these investments together with certain other transactions that have favorable tax treatment have reduced BB&T’s overall effective tax rate from the statutory rate in 2010, 2009 and 2008.
BB&T continually monitors and evaluates the potential impact of current events and circumstances on the estimates and assumptions used in the analysis of its income tax positions and, accordingly, BB&T’s effective tax rate may fluctuate in the future. On a periodic basis, BB&T evaluates its income tax positions based on tax laws and regulations and financial reporting considerations, and records adjustments as appropriate. This evaluation takes into consideration the status of current taxing authorities’ examinations of BB&T’s tax returns, recent positions taken by the taxing authorities on similar transactions, if any, and the overall tax environment in relation to tax-advantaged transactions. Accordingly, the results of these examinations may alter the timing or amount of taxable income or deductions or the allocation of income among tax jurisdictions. In February 2010, BB&T received a statutory notice of deficiency from the IRS for tax years 2002-2007 asserting a liability for taxes, penalties and interest of approximately $892 million related to the disallowance of foreign tax credits and other deductions claimed by a deconsolidated subsidiary in connection with a financing transaction. Management has consulted with outside counsel and continues to believe that BB&T’s treatment of this transaction was in compliance with applicable tax laws and regulations. BB&T paid the disputed tax, penalties and interest in the first quarter of 2010 and filed a lawsuit seeking a refund in the U.S. Court of Federal Claims in March 2010. Management believes the Company’s current reserves for this matter are adequate, although the final outcome is uncertain. Final resolution of this matter is not expected to occur within the next twelve months. Various years remain subject to examination by state taxing authorities. Please refer to Note 14 “Income Taxes” in the “Notes to Consolidated Financial Statements” herein for additional disclosures related to BB&T’s unresolved tax issues related to tax examinations by the IRS and other taxing authorities.
During the fourth quarter of 2008, BB&T agreed to treat its leveraged leases in accordance with the IRS’s proposal that, among other things, allows 20% of deductions, imputes interest income and deems the remaining transactions to be terminated as of December 31, 2008. As a result of this settlement, BB&T recognized pre-tax interest from the IRS of $93 million, or $60 million after-tax, which is reflected as a reduction in tax expense. As a result of changes in the timing of tax payments, a recalculation of each transaction was required that resulted in a $67 million charge to interest income and a corresponding $24 million tax benefit. As part of the IRS proposal, all gains on leases terminated prior to December 31, 2010 are treated as nontaxable. During 2009, BB&T terminated a number of leveraged lease transactions, which resulted in tax benefits of $18 million.
The effective management of market risk is essential to achieving BB&T’s strategic financial objectives. As a financial institution, BB&T’s most significant market risk exposure is interest rate risk; however, market risk also includes product liquidity risk, price risk and volatility risk. The primary objectives of interest rate risk management are to minimize any adverse effect that changes in interest rates may have on net interest income, and to offset the risk of price changes for certain assets recorded at fair value. These are accomplished through active management of asset and liability portfolios with a focus on the strategic pricing of asset and liability accounts and management of appropriate maturity mixes of assets and liabilities. The goal of these activities is the development of appropriate maturity and repricing opportunities in BB&T’s portfolios of assets and liabilities
77
Table of Contents
that will produce consistent net interest income during periods of changing interest rates. BB&T’s Market Risk and Liquidity Committee monitors loan, investment and liability portfolios to ensure comprehensive management of interest rate risk. These portfolios are analyzed for proper fixed-rate and variable-rate mixes under various interest rate scenarios.
BB&T’s interest rate sensitivity is illustrated in the following table. The table reflects rate-sensitive positions at December 31, 2010, and is not necessarily indicative of positions on other dates. The carrying amounts of interest rate sensitive assets and liabilities are presented in the periods in which they next reprice to market rates or mature and are aggregated to show the interest rate sensitivity gap. To reflect anticipated prepayments, certain asset and liability categories are shown in the table using estimated cash flows rather than contractual cash flows.
Table 22
Interest Rate Sensitivity Gap Analysis
December 31, 2010
|
Within
One Year |
One to
Three Years |
Three to
Five Years |
After
Five Years |
Total | ||||||||||||||||
| (Dollars in millions) | ||||||||||||||||||||
| Assets | ||||||||||||||||||||
|
Securities and other interest-earning assets (1)(4) |
$ | 10,172 | $ | 2,508 | $ | 1,815 | $ | 11,356 | $ | 25,851 | ||||||||||
|
Federal funds sold and securities purchased under resale agreements or similar arrangements |
327 | — | — | — | 327 | |||||||||||||||
|
Loans and leases (2) |
72,910 | 16,052 | 7,425 | 10,877 | 107,264 | |||||||||||||||
| Total interest-earning assets | 83,409 | 18,560 | 9,240 | 22,233 | 133,442 | |||||||||||||||
| Liabilities | ||||||||||||||||||||
|
Client time deposits |
15,826 | 7,708 | 2,239 | 240 | 26,013 | |||||||||||||||
|
Other client deposits with no stated maturity (3) |
24,394 | 10,700 | 3,880 | 14,420 | 53,394 | |||||||||||||||
|
Other interest-bearing deposits (4) |
6,057 | 1,112 | — | — | 7,169 | |||||||||||||||
|
Federal funds purchased, securities sold under repurchase agreements and Short-term borrowed funds |
5,673 | — | — | — | 5,673 | |||||||||||||||
|
Long-term debt (4) |
6,691 | 1,512 | 501 | 13,026 | 21,730 | |||||||||||||||
| Total interest-bearing liabilities | 58,641 | 21,032 | 6,620 | 27,686 | 113,979 | |||||||||||||||
| Asset-liability gap | $ | 24,768 | $ | (2,472 | ) | $ | 2,620 | $ | (5,453 | ) | ||||||||||
| Cumulative interest rate sensitivity gap | $ | 24,768 | $ | 22,296 | $ | 24,916 | $ | 19,463 | ||||||||||||
| (1) | Securities based on amortized cost. |
| (2) | Loans and leases include loans held for sale and are net of unearned income. |
| (3) | Projected runoff of deposits that do not have a contractual maturity date was computed based upon decay rate assumptions developed by bank regulators to assist banks in addressing FDICIA rule 305. |
| (4) | The maturity periods have been adjusted to reflect the impact of hedging strategies. |
The asset/liability management process is designed to achieve relatively stable net interest margins and assure liquidity by coordinating the volumes, maturities or repricing opportunities of earning assets, deposits and borrowed funds. It is the responsibility of the Market Risk and Liquidity Committee to determine and achieve the most appropriate volume and mix of earning assets and interest-bearing liabilities, as well as to ensure an adequate level of liquidity and capital, within the context of corporate performance goals. The Market Risk and Liquidity Committee also sets policy guidelines and establishes long-term strategies with respect to interest rate risk exposure and liquidity. The Market Risk and Liquidity Committee meets regularly to review BB&T’s interest rate risk and liquidity positions in relation to present and prospective market and business conditions, and adopts funding and balance sheet management strategies that are intended to ensure that the potential impact on earnings and liquidity as a result of fluctuations in interest rates is within acceptable standards.
78
Table of Contents
BB&T uses a variety of financial instruments to manage various financial risks. These instruments, commonly referred to as derivatives, primarily consist of interest-rate swaps, swaptions, caps, floors, collars, financial forward and futures contracts, when-issued securities and options written and purchased. A derivative is a financial instrument that derives its cash flows, and therefore its value, by reference to an underlying instrument, index or referenced interest rate. BB&T uses derivatives primarily to manage risk related to securities, business loans, Federal funds purchased, other overnight funding, long-term debt, mortgage servicing rights, mortgage banking operations and certificates of deposit. BB&T also uses derivatives to facilitate transactions on behalf of its clients. BB&T’s derivatives produced benefits to net interest income of $175 million during 2010, $209 million during 2009 and $101 million in 2008. The fluctuations in benefits to net interest income from derivative activities between 2010 and 2009 were primarily the result of benefits received on interest rate swaps on commercial loans.
Derivative contracts are written in amounts referred to as notional amounts. Notional amounts only provide the basis for calculating payments between counterparties and do not represent amounts to be exchanged between parties, and are not a measure of financial risk. On December 31, 2010, BB&T had derivative financial instruments outstanding with notional amounts totaling $65.4 billion. The estimated net fair value of open contracts was a loss of $69 million at December 31, 2010.
See Note 20 “Derivative Financial Instruments” in the “Notes to Consolidated Financial Statements” herein for additional disclosures.
Impact of Inflation and Changing Interest Rates
The majority of BB&T’s assets and liabilities are monetary in nature and, therefore, differ greatly from most commercial and industrial companies that have significant investments in fixed assets or inventories. Fluctuations in interest rates and actions of the Federal Reserve Board to regulate the availability and cost of credit have a greater effect on a financial institution’s profitability than do the effects of higher costs for goods and services. Through its balance sheet management function, which is monitored by the Market Risk and Liquidity Committee, management believes that BB&T is positioned to respond to changing needs for liquidity, changes in interest rates and inflationary trends.
Management uses Interest Sensitivity Simulation Analysis (“Simulation”) to measure the sensitivity of projected earnings to changes in interest rates. The Simulation model projects net interest income and interest rate risk for a rolling two-year period of time. Simulation takes into account the current contractual agreements that BB&T has made with its customers on deposits, borrowings, loans, investments and commitments to enter into those transactions. Furthermore, the Simulation considers the impact of expected customer behavior. Management monitors BB&T’s interest sensitivity by means of a computer model that incorporates the current volumes, average rates earned and paid, and scheduled maturities and payments of asset and liability portfolios, together with multiple scenarios of projected prepayments, repricing opportunities and anticipated volume growth. Using this information, the model projects earnings based on projected portfolio balances under multiple interest rate scenarios. This level of detail is needed to simulate the effect that changes in interest rates and portfolio balances may have on the earnings of BB&T. This method is subject to the accuracy of the assumptions that underlie the process, but management believes that it provides a better illustration of the sensitivity of earnings to changes in interest rates than other analyses such as static or dynamic gap. In addition to Simulation analysis, BB&T uses Economic Value of Equity (“EVE”) analysis to focus on changes in capital given potential changes in interest rates. This measure also allows BB&T to analyze interest rate risk that falls outside the analysis window contained in the Simulation model. The EVE model is a discounted cash flow of the entire portfolio of BB&T’s assets, liabilities, and derivatives instruments. The difference in the present value of assets minus the present value of liabilities is defined as the economic value of BB&T’s equity.
The asset/liability management process requires a number of key assumptions. Management determines the most likely outlook for the economy and interest rates by analyzing external factors, including published economic projections and data, the effects of likely monetary and fiscal policies, as well as any enacted or prospective regulatory changes. BB&T’s current and prospective liquidity position, current balance sheet volumes and projected growth, accessibility of funds for short-term needs and capital maintenance are also considered. This data is combined with various interest rate scenarios to provide management with the information necessary to analyze interest sensitivity and to aid in the development of strategies to reach performance goals.
79
Table of Contents
The following table shows the effect that the indicated changes in interest rates would have on net interest income as projected for the next twelve months under the “most likely” interest rate scenario incorporated into the Simulation model. Key assumptions in the preparation of the table include prepayment speeds of mortgage-related assets, cash flows and maturities of derivative financial instruments, loan volumes and pricing, deposit sensitivity, customer preferences and capital plans. The resulting change in interest sensitive income reflects the level of sensitivity that interest sensitive income has in relation to changing interest rates.
Table 23
Interest Sensitivity Simulation Analysis
|
Interest Rate Scenario |
Annualized Hypothetical Percentage Change in Net Interest Income |
|||||||
|
Linear Change in Prime Rate |
Prime Rate |
|||||||
|
December 31, |
December 31, |
|||||||
|
2010 |
2009 |
2010 |
2009 |
|||||
|
2.00% |
5.25% | 5.25% | 4.19% | 1.60% | ||||
|
1.00 |
4.25 | 4.25 | 1.97 | .59 | ||||
|
No Change |
3.25 | 3.25 | — | — | ||||
|
(.25) |
3.00 | 3.00 | (.34) | .38 | ||||
The Market Risk and Liquidity Committee has established parameters measuring interest sensitivity that prescribe a maximum negative impact on net interest income of 2% for the next 12 months for a linear change of 100 basis points over four months followed by a flat interest rate scenario for the remaining eight month period, and a maximum negative impact of 4% for a linear change of 200 basis points over eight months followed by a flat interest rate scenario for the remaining four month period. In the event that the results of the Simulation model fall outside the established parameters, management will make recommendations to the Market Risk and Liquidity Committee on the most appropriate response given the current economic forecast. Management currently only modeled a 25 basis point decline because larger declines would have resulted in a Federal funds rate of less than zero.
The following table shows the effect that the indicated changes in interest rates would have on EVE as projected under the “most likely” interest rate scenario incorporated into the EVE model. Key assumptions in the preparation of the table include prepayment speeds of mortgage-related assets, cash flows and maturities of derivative financial instruments, loan volumes and pricing, and deposit sensitivity. The resulting change in the economic value of equity reflects the level of sensitivity that EVE has in relation to changing interest rates.
Table 24
Economic Value of Equity (“EVE”) Simulation Analysis
|
Change in Rates |
EVE/Assets |
Hypothetical Percentage
|
||||||
|
December 31, |
December 31, |
|||||||
|
2010 |
2009 |
2010 |
2009 |
|||||
|
2.00% |
8.7% | 7.3% | 18.8% | .6% | ||||
|
1.00 |
8.1 | 7.3 | 10.7 | .6 | ||||
|
No Change |
7.3 | 7.2 | — | — | ||||
|
(.25) |
7.1 | 7.2 | (3.4) | (.5) | ||||
Liquidity
Liquidity represents BB&T’s continuing ability to meet funding needs, primarily deposit withdrawals, timely repayment of borrowings and other liabilities, and funding of loan commitments. In addition to the level of liquid assets, such as trading securities and securities available for sale, many other factors affect the ability to meet liquidity needs, including access to a variety of funding sources, maintaining borrowing capacity in national money markets, growing core deposits, the repayment of loans and the capability to securitize or package loans for sale.
80
Table of Contents
The purpose of the Parent Company is to serve as the capital financing vehicle for the operating subsidiaries. The assets of the Parent Company consist primarily of cash on deposit with Branch Bank, equity investments in subsidiaries, advances to subsidiaries, accounts receivable from subsidiaries, and other miscellaneous assets. The principal obligations of the Parent Company are principal and interest on master notes, long-term debt, and redeemable capital securities. The main sources of funds for the Parent Company are dividends and management fees from subsidiaries, repayments of advances to subsidiaries, and proceeds from the issuance of long-term debt and master notes. The primary uses of funds by the Parent Company are for investments in subsidiaries, advances to subsidiaries, dividend payments to shareholders, retirement of common stock and interest and principal payments due on long-term debt and master notes.
The primary source of funds used for Parent Company cash requirements was dividends received from subsidiaries, which totaled $666 million during 2010. In addition, the Parent Company issued $500 million of senior notes during 2010. Funds raised through master note agreements with commercial clients are placed in a note receivable at Branch Bank primarily for its use in meeting short-term funding needs and, to a lesser extent, to support the short-term temporary cash needs of the Parent Company. At December 31, 2010 and 2009, master note balances totaled $806 million and $1.0 billion, respectively.
The Parent Company had six issues of senior notes outstanding totaling $3.3 billion and five issues of subordinated notes outstanding totaling $3.0 billion at December 31, 2010. In addition, as of December 31, 2010, the Parent Company had $3.3 billion of junior subordinated debentures outstanding to unconsolidated trusts. Please refer to Note 11 “Long-Term Debt” in the “Notes to Consolidated Financial Statements” for additional information with respect to these senior notes, subordinated notes and junior subordinated debentures.
Branch Bank has several major sources of funding to meet its liquidity requirements, including access to capital markets through issuance of senior or subordinated bank notes and institutional certificates of deposit, access to the FHLB system, dealer repurchase agreements and repurchase agreements with commercial clients, participation in the Treasury, Tax and Loan program with the Federal Reserve Bank, access to the overnight and term Federal funds markets, use of a Cayman branch facility, access to retail brokered certificates of deposit and a borrower in custody program with the Federal Reserve Bank for the discount window. As of December 31, 2010, BB&T has approximately $25 billion of secured borrowing capacity, which represents approximately 201% of one year wholesale funding maturities.
81
Table of Contents
BB&T’s and Branch Bank’s ability to raise funding at competitive prices is affected by the rating agencies’ views of BB&T’s and Branch Bank’s credit quality, liquidity, capital and earnings. Management meets with the rating agencies on a routine basis to discuss the current outlook for BB&T and Branch Bank. The ratings for BB&T and Branch Bank by the four major rating agencies are detailed in the table below.
Table 25
Credit Ratings of BB&T Corporation and Branch Bank
December 31, 2010
| S&P | Moody’s | Fitch | DBRS | |||||||||||
| BB&T Corp. | ||||||||||||||
|
Commercial Paper |
A-1 | P-1 | F1 | R-1(low) | ||||||||||
|
Issuer |
A | A2 | A+ | A(high) | ||||||||||
|
LT/Senior debt |
A | A2 | A+ | A(high) | ||||||||||
|
Subordinated debt |
A- | A3 | A | A | ||||||||||
|
Trust Preferred Securities |
BBB | Baa1 | A- | A | ||||||||||
| Branch Bank | ||||||||||||||
|
Bank financial strength |
A+/A-1 | B- | B | NA | ||||||||||
|
Long term deposits |
A+ | A1 | AA- | AA(low) | ||||||||||
|
LT/Senior unsecured bank notes |
A+ | A1 | A+ | AA(low) | ||||||||||
|
Other long term senior obligations |
A+ | A1 | A+ | AA(low) | ||||||||||
|
Other short term senior obligations |
A-1 | P-1 | F1 | R-1(middle) | ||||||||||
|
Short term bank notes |
A-1 | P-1 | F1 | R-1(middle) | ||||||||||
|
Short term deposits |
A-1 | P-1 | F1+ | R-1(middle) | ||||||||||
|
Subordinated bank notes |
A | A2 | A | A(high) | ||||||||||
| Ratings Outlook: | ||||||||||||||
| Credit Trend | Stable | Stable | Stable | Stable | ||||||||||
BB&T, Branch Bank and BB&T FSB have Contingency Funding Plans (“CFPs”) designed to ensure that liquidity sources are sufficient to meet their ongoing obligations and commitments, particularly in the event of a liquidity contraction. The CFPs are designed to examine and quantify the organization’s liquidity under various “stress” scenarios. Additionally, the CFPs provide a framework for management and other critical personnel to follow in the event of a liquidity contraction or in anticipation of such an event. The CFPs address authority for activation and decision making, liquidity options and the responsibilities of key departments in the event of a liquidity contraction.
Management believes current sources of liquidity are adequate to meet BB&T’s current requirements and plans for continued growth. See Note 6 “Premises and Equipment,” Note 11 “Long-Term Debt” and Note 16 “Commitments and Contingencies” in the “Notes to Consolidated Financial Statements” for additional information regarding outstanding balances of sources of liquidity and contractual commitments and obligations.
82
Table of Contents
Contractual Obligations, Commitments, Contingent Liabilities, Off-Balance Sheet Arrangements, and Related Party Transactions
The following table presents, as of December 31, 2010, BB&T’s significant fixed and determinable contractual obligations by payment date. The payment amounts represent those amounts contractually due to the recipient. The table excludes liabilities recorded where management cannot reasonably estimate the timing of any payments that may be required in connection with these liabilities. Further discussion of the nature of each obligation is included in Note 16 “Commitments and Contingencies” in the “Notes to Consolidated Financial Statements.”
Table 26
Contractual Obligations and Other Commitments
December 31, 2010
| Total |
Less than
One Year |
1 to 3
Years |
3 to 5
Years |
After 5
Years |
||||||||||||||||
| (Dollars in millions) | ||||||||||||||||||||
| Contractual Cash Obligations | ||||||||||||||||||||
|
Long-term debt |
$ | 21,730 | $ | 2,143 | $ | 3,166 | $ | 2,191 | $ | 14,230 | ||||||||||
|
Operating leases |
1,232 | 149 | 259 | 220 | 604 | |||||||||||||||
|
Commitments to fund affordable housing investments |
334 | 155 | 131 | 47 | 1 | |||||||||||||||
|
Venture capital commitments |
185 | 83 | 72 | 30 | — | |||||||||||||||
|
Time deposits |
33,182 | 21,883 | 8,820 | 2,239 | 240 | |||||||||||||||
|
Total contractual cash obligations |
$ | 56,663 | $ | 24,413 | $ | 12,448 | $ | 4,727 | $ | 15,075 | ||||||||||
BB&T’s significant commitments include certain investments in affordable housing and historic building rehabilitation projects throughout its market area. BB&T enters into such arrangements as a means of supporting local communities and recognizes tax credits relating to these investments. At December 31, 2010, BB&T’s investments in such projects totaled $1.2 billion, which includes outstanding commitments of $334 million. BB&T typically acts as a limited partner in these investments and does not exert control over the operating or financial policies of the partnerships. Branch Bank typically provides financing during the construction and development of the properties; however, permanent financing is generally obtained from independent third parties upon completion of a project. As of December 31, 2010, BB&T had $135 million in loan commitments outstanding related to these projects, of which $36 million had been funded. BB&T’s risk exposure relating to such commitments is generally limited to the amount of investments and loan commitments made. Please refer to Note 1 “Summary of Significant Accounting Policies” in the “Notes to Consolidated Financial Statements” for further discussion of these investments in limited partnerships.
In addition, BB&T enters into derivative contracts to manage various financial risks. A derivative is a financial instrument that derives its cash flows, and therefore its value, by reference to an underlying instrument, index or referenced interest rate. Derivative contracts are carried at fair value on the Consolidated Balance Sheets with the fair value representing the net present value of expected future cash receipts or payments based on market interest rates as of the balance sheet date. Derivative contracts are written in amounts referred to as notional amounts, which only provide the basis for calculating payments between counterparties and are not a measure of financial risk. Therefore, the derivative liabilities recorded on the balance sheet as of December 31, 2010 do not represent the amounts that may ultimately be paid under these contracts. Further discussion of derivative instruments is included in Note 1 “Summary of Significant Accounting Policies” and Note 20 “Derivative Financial Instruments” in the “Notes to Consolidated Financial Statements.”
In the ordinary course of business, BB&T indemnifies its officers and directors to the fullest extent permitted by law against liabilities arising from litigation. BB&T also issues standard representation and warranties in underwriting agreements, merger and acquisition agreements, loan sales, brokerage activities and other similar arrangements. Counterparties in many of these indemnifications provide similar indemnifications to BB&T. Although these agreements often do not specify limitations, BB&T does not believe that any payments related to these guarantees would materially change the financial condition or results of operations of BB&T.
83
Table of Contents
BB&T holds public funds in certain states that do not require 100% collateralization on public fund bank deposits. In these states, should the failure of another public fund depository institution result in a loss for the public entity, the resulting shortfall would have to be absorbed on a pro-rata basis by the remaining financial institutions holding public funds in that state.
BB&T has investments and future funding commitments to certain venture capital funds. As of December 31, 2010, BB&T had investments of $266 million related to these ventures and future funding commitments of $185 million. BB&T’s risk exposure relating to such commitments is generally limited to the amount of investments and future funding commitments made.
Merger and acquisition agreements of businesses other than financial institutions occasionally include additional incentives to the acquired entities to offset the loss of future cash flows previously received through ownership positions. Typically, these incentives are based on the acquired entity’s contribution to BB&T’s earnings compared to agreed-upon amounts. When offered, these incentives are typically issued for terms of three to five years. As certain provisions of these agreements do not specify dollar limitations, it is not possible to quantify the maximum exposure resulting from these agreements.
As a member of the Federal Home Loan Bank of Atlanta (“FHLB”), BB&T is required to maintain a minimum investment in capital stock. The board of directors of the FHLB can increase the minimum investment requirements in the event it has concluded that additional capital is required to allow it to meet its own regulatory capital requirements. Any increase in the minimum investment requirements outside of specified ranges requires the approval of the Federal Housing Finance Agency. Because the extent of any obligation to increase BB&T’s investment in the FHLB depends entirely upon the occurrence of a future event, potential future payments to the FHLB are not determinable.
In the normal course of business, BB&T is also a party to financial instruments to meet the financing needs of clients and to mitigate exposure to interest rate risk. Such financial instruments include commitments to extend credit and certain contractual agreements, including standby letters of credit and financial guarantee arrangements. Further discussion of these commitments is included in Note 16 “Commitments and Contingencies” in the “Notes to Consolidated Financial Statements.”
BB&T’s significant commitments and obligations are summarized in the accompanying table. Not all of the commitments presented in the table will be used thus the actual cash requirements are likely to be significantly less than the amounts reported.
Table 27
Summary of Significant Commitments
December 31, 2010
(Dollars in millions)
|
Lines of credit |
$ | 14,486 | ||
|
Letters of credit and financial guarantees written |
7,291 | |||
|
Other commitments (1) |
22,431 | |||
|
Total significant commitments |
$ | 44,208 | ||
| (1) | Other commitments include unfunded business loan commitments, unfunded overdraft protection on demand deposit accounts and other unfunded commitments to lend. |
Related Party Transactions
The Corporation may extend credit to certain officers and directors in the ordinary course of business. These loans are made under substantially the same terms as comparable third-party lending arrangements and are in compliance with applicable banking regulations.
Capital
The maintenance of appropriate levels of capital is a management priority and is monitored on a regular basis. BB&T’s principal goals related to the maintenance of capital are to provide adequate capital to support
84
Table of Contents
BB&T’s comprehensive risk profile, preserve a sufficient capital base from which to support future growth, provide a competitive return to shareholders, comply with regulatory standards and achieve optimal credit ratings for BB&T and its subsidiaries.
Management regularly monitors the capital position of BB&T on a consolidated basis. In this regard, management’s overriding policy is to maintain capital at levels that will result in BB&T being classified as “well-capitalized” for regulatory purposes and to maintain sufficient capital relative to the Corporation’s level of risk. Secondarily, it is management’s intent to maintain consolidated capital levels that result in regulatory risk-based capital ratios that are generally comparable with BB&T’s peers of similar size, complexity and risk profile. Management particularly monitors and intends to maintain the following minimum capital ratios:
Table 28
BB&T’s Internal Capital Guidelines
|
Tier 1 Capital Ratio |
8.50 | % | ||
|
Total Capital Ratio |
12.00 | % | ||
|
Tier 1 Leverage Capital Ratio |
7.00 | % | ||
|
Tangible Capital Ratio |
5.50 | % | ||
|
Tier 1 Common Equity Ratio |
7.00 | % |
Payments of cash dividends to BB&T’s shareholders and repurchases of common shares are the methods used to manage any excess capital generated. In addition, management closely monitors the Parent Company’s double leverage ratio (investments in subsidiaries as a percentage of shareholders’ equity) with the intention of maintaining the ratio below 125.0%. The active management of the subsidiaries’ equity capital, as described above, is the process used to manage this important driver of Parent Company liquidity and is a key element in the management of BB&T’s capital position.
The capital of BB&T’s subsidiaries is regularly monitored to determine if the levels that management believes are the most beneficial and efficient for their operations are maintained. Management intends to maintain capital at Branch Bank and BB&T FSB at levels that will result in these subsidiaries being classified as “well-capitalized” for regulatory purposes. Secondarily, it is management’s intent to maintain Branch Bank’s capital at levels that result in regulatory risk-based capital ratios that are generally comparable with peers of similar size, complexity and risk profile. If the capital levels of Branch Bank increase above these guidelines, excess capital may be transferred to the Parent Company, subject to regulatory and other operating considerations, in the form of special dividend payments.
While nonrecurring events or management decisions may result in the Corporation temporarily falling below its minimum guidelines for one or more of these ratios, it is management’s intent through capital planning to return to these targeted minimums within a reasonable period of time. Such temporary decreases below these minimums are not considered an infringement of BB&T’s overall capital policy provided the Corporation and Branch Bank remain “well-capitalized.”
Capital Adequacy and Resources
Financial holding companies and their banking subsidiaries are subject to regulatory requirements with respect to risk-based capital adequacy. Capital adequacy is an important indicator of financial stability and performance.
Risk-based capital ratios measure capital as a percentage of a combination of risk-weighted balance sheet and off-balance sheet risk. The risk-weighted values of both balance sheet and off-balance sheet items are determined in accordance with risk factors specified by Federal bank regulatory pronouncements. As of December 31, 2010, federal bank regulators did not prescribe measures of tangible capital and, therefore, these measures were considered non-GAAP. BB&T uses the Tier 1 common equity definition used in the SCAP assessment to calculate measures of tangible capital and Tier 1 common capital. BB&T’s management uses these measures to assess the quality of capital and believes that investors may find them useful in their analysis of the Corporation. These capital measures are not necessarily comparable to similar capital measures that may be presented by other companies.
Tier 1 capital is calculated as common shareholders’ equity, excluding the over- or underfunded status of postretirement benefit obligations, unrealized gains or losses on debt securities available for sale, unrealized gains on equity securities available for sale and unrealized gains or losses on cash flow hedges, net of deferred income taxes; plus certain mandatorily redeemable capital securities, less nonqualifying intangible assets, net of
85
Table of Contents
applicable deferred income taxes, and certain nonfinancial equity investments. Tier 2 capital may consist of qualifying subordinated debt, certain hybrid capital instruments, qualifying preferred stock and a limited amount of the allowance for credit losses. Tier 1 capital and Tier 2 capital combined are referred to as total regulatory capital. Tier 1 capital is required to be at least 4% of risk-weighted assets, and total capital must be at least 8% of risk-weighted assets, with one half of the minimum consisting of Tier 1 capital.
Current provisions of the Dodd-Frank Act will result in the elimination, over a manageable period of time, of certain capital securities from inclusion in Tier 1 capital. BB&T currently has approximately $3.2 billion of capital securities that qualify as Tier 1 capital. In addition, as discussed in the section titled “Regulatory Considerations”, the regulators are currently evaluating the adoption of new Basel III capital standards. Based on a review of the proposed standards, management believes it will meet the required capital levels. As of December 31, 2010, management’s current projection of Tier 1 common under Basel III was 7.5%.
In addition to the risk-based capital measures described above, regulators have also established minimum leverage capital requirements for banking organizations. The minimum required Tier 1 leverage ratio ranges from 3% to 5% depending upon Federal bank regulatory agency evaluations of an organization’s overall safety and soundness. BB&T’s regulatory and tangible capital ratios are set forth in the following table.
Table 29
Capital—Components and Ratios
| December 31, | ||||||||
| 2010 | 2009 | |||||||
| (Dollars in millions) | ||||||||
|
Risk-based: |
||||||||
|
Tier 1 |
11.8 | % | 11.5 | % | ||||
|
Total |
15.5 | 15.8 | ||||||
|
Leverage capital |
9.1 | 8.5 | ||||||
| Non-GAAP capital measures (1) | ||||||||
|
Tangible common equity as a percentage of tangible assets |
7.1 | 6.2 | ||||||
|
Tier 1 common equity as a percentage of risk-weighted assets |
9.1 | 8.5 | ||||||
| Calculations of Tier 1 common equity and tangible assets and related measures: | ||||||||
|
Tier 1 equity |
$ | 13,959 | $ | 13,456 | ||||
|
Less: |
||||||||
|
Qualifying restricted core capital elements |
3,248 | 3,497 | ||||||
|
Tier 1 common equity |
$ | 10,711 | $ | 9,959 | ||||
|
Total assets |
$ | 157,081 | $ | 165,764 | ||||
|
Less: |
||||||||
|
Intangible assets, net of deferred taxes |
6,391 | 6,553 | ||||||
|
Plus: |
||||||||
|
Pre-tax regulatory adjustments for accumulated OCI |
636 | 806 | ||||||
|
Tangible assets |
$ | 151,326 | $ | 160,017 | ||||
|
Total risk-weighted assets (2) |
$ | 118,131 | $ | 117,167 | ||||
| Tangible common equity as a percentage of tangible assets | 7.1 | % | 6.2 | % | ||||
| Tier 1 common equity as a percentage of risk-weighted assets | 9.1 | 8.5 | ||||||
|
Tier 1 common equity |
$ | 10,711 | $ | 9,959 | ||||
|
Outstanding shares at end of period |
694,381 | 689,750 | ||||||
| Tangible book value per common share | $ | 15.43 | $ | 14.44 | ||||
| (1) | Tangible common equity and Tier 1 common equity ratios are non-GAAP measures. BB&T uses the Tier 1 common equity definition used in the SCAP assessment to calculate these ratios. BB&T's management uses these measures to assess the quality of capital and believes that investors may find them useful in their analysis of the Corporation. These capital measures are not necessarily comparable to similar capital measures that may be presented by other companies. |
86
Table of Contents
| (2) | Risk-weighted assets are determined based on regulatory capital requirements. Under the regulatory framework for determining risk-weighted assets each asset class is assigned a risk-weighting of 0%, 20%, 50% or 100% based on the underlying risk of the specific asset class. In addition, off balance sheet exposures are first converted to a balance sheet equivalent amount and subsequently assigned to one of the four risk-weightings. |
As further described below and reflected in the table, BB&T has entered into a transaction involving the issuance of capital securities (“Capital Securities”) by a Delaware statutory trust formed by the Company (the “Trust”). Simultaneously with the closing of this transaction, BB&T entered into a replacement capital covenant (the “Replacement Capital Covenant”) for the benefit of persons that buy, hold or sell a specified series of long-term indebtedness of the Company or its largest depository institution subsidiary (the “Specified Debt”). The Replacement Capital Covenant provides that neither BB&T nor any of its subsidiaries (including the Trust) will repay, redeem or purchase any of the Capital Securities and the securities held by the Trust (the “Other Securities”), as applicable, on or before the date specified in the Replacement Capital Covenant, with certain limited exceptions, except to the extent that, during the 180 days prior to the date of that repayment, redemption or purchase, the Company has received proceeds from the sale of qualifying securities that (i) have equity-like characteristics that are the same as, or more equity-like than, the applicable characteristics of the Capital Securities or Other Securities, as applicable, at the time of repayment, redemption or purchase, and (ii) the Company has obtained the prior approval of the Federal Reserve Board, if such approval is then required by the Federal Reserve Board.
The following table identifies the (i) closing date for the transaction, (ii) issuer, (iii) series of Capital Securities issued, (iv) Other Securities, and (v) applicable Specified Debt.
|
Closing
|
Issuer |
Capital Securities |
Other Securities |
Specified Debt |
||||
|
6/12/07 |
BB&T Capital Trust IV and BB&T Corporation | BB&T Capital Trust IV’s $600,000,000 Fixed to Floating Rate Capital Securities | Company’s $600,010,000 Fixed to Floating Rate Junior Subordinated Debentures due 2077 | Company’s 6.75% junior subordinated debentures due 2036 underlying the 6.75% capital securities of BB&T Capital Trust II |
Common Stock and Dividends
BB&T’s ability to pay dividends is primarily dependent on earnings from operations, the adequacy of capital and the availability of liquid assets for distribution. BB&T’s ability to generate liquid assets for distribution is dependent on the ability of Branch Bank to pay dividends to the Parent Company. The payment of cash dividends is an integral part of providing a competitive return on shareholders’ investments. The Corporation’s policy is to accomplish this while retaining sufficient capital to support future growth and to meet regulatory requirements. Management has established a guideline that during normal economic conditions the common dividend payout ratio will be between 30% and 50% of basic earnings per share. BB&T’s common dividend payout ratio, computed by dividing dividends declared per common share by basic earnings per common share, was 50.85% in 2010 compared to 79.31% in 2009. BB&T’s payout ratio was higher in 2009 due to lower earnings during the worst part of the economic recession and a higher dividend-rate in the first quarter of 2009. The dividend was reduced to its current quarterly rate in the second quarter of 2009. Decreasing the dividend at that time was necessary due to the continuing poor economic conditions and preserved approximately $725 million of capital per year based on the shares outstanding at the time of the decision. BB&T has paid a cash dividend to shareholders every year since 1903. A discussion of dividend restrictions is included in Note 17 “Regulatory Requirements and Other Restrictions” in the “Notes to Consolidated Financial Statements” and in the “Regulatory Considerations” section.
BB&T’s common stock is traded on the New York Stock Exchange (“NYSE”) under the symbol “BBT”. BB&T’s common stock was held by approximately 355,000 shareholders at December 31, 2010 compared to approximately 381,000 at December 31, 2009. The accompanying table, “Quarterly Summary of Market Prices and Dividends Paid on Common Stock,” sets forth the quarterly high and low trading prices and closing sales prices for BB&T’s common stock and the dividends paid per share of common stock for each of the last eight quarters.
87
Table of Contents
Table 30
Quarterly Summary of Market Prices and Cash Dividends Declared on Common Stock
| 2010 | 2009 | |||||||||||||||||||||||||||||||
| Sales Prices |
Cash
Dividends Declared |
Sales Prices |
Cash
Dividends Declared |
|||||||||||||||||||||||||||||
| High | Low | Last | High | Low | Last | |||||||||||||||||||||||||||
|
Quarter Ended: |
||||||||||||||||||||||||||||||||
|
March 31 |
$ | 32.93 | $ | 25.40 | $ | 32.39 | $ | .15 | $ | 27.72 | $ | 12.90 | $ | 16.92 | $ | .47 | ||||||||||||||||
|
June 30 |
35.72 | 26.18 | 26.31 | .15 | 28.67 | 16.27 | 21.98 | .15 | ||||||||||||||||||||||||
|
September 30 |
28.69 | 21.72 | 24.08 | .15 | 29.81 | 19.83 | 27.24 | .15 | ||||||||||||||||||||||||
|
December 31 |
27.57 | 22.15 | 26.29 | .15 | 28.66 | 23.75 | 25.37 | .15 | ||||||||||||||||||||||||
|
Year |
$ | 35.72 | $ | 21.72 | $ | 26.29 | $ | .60 | $ | 29.81 | $ | 12.90 | $ | 25.37 | $ | .92 | ||||||||||||||||
Share Repurchases
BB&T has periodically repurchased shares of its own common stock. In accordance with North Carolina law, repurchased shares cannot be held as treasury stock, but revert to the status of authorized and unissued shares upon repurchase.
On June 27, 2006, BB&T’s Board of Directors granted authority under a plan (the “2006 Plan”) for the repurchase of up to 50 million shares of BB&T’s common stock as needed for general corporate purposes. The 2006 Plan also authorizes the repurchase of the remaining shares from the previous authorization. The 2006 Plan remains in effect until all the authorized shares are repurchased unless modified by the Board of Directors. No shares were repurchased in connection with the 2006 Plan during 2010, 2009 and 2008.
Table 31
Share Repurchase Activity
| 2010 | ||||||||||||||||
|
Total Shares
Repurchased (1) |
Average
Price Paid Per Share (2) |
Total Shares Purchased
Pursuant to Publicly-Announced Plan |
Maximum Remaining
Number of Shares Available for Repurchase Pursuant to Publicly-Announced Plan |
|||||||||||||
| (Shares in Thousands) | ||||||||||||||||
| October 1-31 | 6 | $ | 24.24 | — | 44,139 | |||||||||||
| November 1-30 | 2 | 24.12 | — | 44,139 | ||||||||||||
| December 1-31 | 5 | 24.31 | — | 44,139 | ||||||||||||
|
Total |
13 | 24.24 | — | 44,139 | ||||||||||||
| (1) | Repurchases reflect shares exchanged or surrendered in connection with the exercise of equity-based awards under BB&T’s equity-based compensation plans. |
| (2) | Excludes commissions. |
Segment Results
BB&T’s operations are divided into seven reportable business segments: Community Banking, Residential Mortgage Banking, Sales Finance, Specialized Lending, Insurance Services, Financial Services and Treasury. These operating segments have been identified based primarily on BB&T’s organizational structure. See Note 22 “Operating Segments” in the “Notes to Consolidated Financial Statements” herein for additional disclosures related to BB&T’s operating segments, the internal accounting and reporting practices used to manage these segments and financial disclosures for these segments. Fluctuations in noninterest income and noninterest expense incurred directly by the segments are more fully discussed in the “Noninterest Income” and “Noninterest Expense” sections of this discussion and analysis.
88
Table of Contents
Community Banking
The Community Banking network had 1,782 banking offices at the end of 2010, a decrease of 75 offices compared to 1,857 banking offices at December 31, 2009. The decrease in offices resulted primarily from the closing of overlapping banking offices related to the acquisition of Colonial.
Community Banking had solid organic deposit growth during 2010, while the loan portfolios declined slightly due to weak economic conditions and the lack of strong demand for lending products. Net income attributable to Community Banking decreased $211 million, or 47.1%, to $237 million compared to 2009, primarily as a result of foreclosed property expenses, as well as problem loan administration expense. Comparing 2009 to 2008, net income in Community Banking decreased $604 million, or 57.4% to $448 million.
Net interest income for Community Banking totaled $3.8 billion in 2010 compared to $3.6 billion in 2009. Growth in net interest income was primarily due to an increase of $137 million in net interest income from clients and an increase of $72 million in net funds transfer pricing (“FTP”) provided to Community Banking during 2010. The increase in net interest income from clients in 2010 was primarily due to improvements in the deposit mix specifically related to a decrease in client certificates of deposits. The increase in net interest income as a result of the improvement in deposit mix was partially offset by the impact of historically low interest rates, as well as elevated nonaccrual balances, on interest income from loans. Net interest income earned for 2009 rose by $394 million, or 12.2%, compared to 2008. The increase in the net interest income was primarily due to higher FTP provided to Community Banking during 2009.
The economic provision for loan and lease losses declined by $82 million, or 4.4%, to $1.8 billion in 2010 compared to 2009, reflecting improvement in the outlook on credit quality. The economic provision for loan and lease losses increased $1.0 billion, or 123.1%, from 2008 to 2009. The increase during 2009 reflected deterioration in the residential acquisition and development portfolio.
Noninterest income in Community Banking decreased $25 million, or 2.0%, to $1.3 billion in 2010, primarily due to lower overdraft fees, along with losses on commercial loans held for sale, partially offset by increases in checkcard fees, bankcard fees and merchant discounts and account analysis fees. In 2009, noninterest income increased $41 million, or 3.3%, driven primarily by the Colonial acquisition, which contributed $44 million in noninterest income to Community Banking. Noninterest income allocated from other segments, which is reflected as intersegment net referral fees (“referral fees”), declined by $53 million, or 11.5% in 2010, primarily due to lower referrals for residential mortgage lending as originations slowed. Noninterest income allocated from other segments of $461 million in 2009 was $207 million, or 81.5% higher than 2008, driven primarily by higher referrals for mortgage lending.
Noninterest expenses incurred by Community Banking during 2010 increased $427 million, or 20.5%, to $2.5 billion compared to 2009. The increase was primarily due to foreclosed property expenses and problem loan administration expense, along with increases in compensation, fringe benefit, and FDIC insurance costs. Comparing 2009 to 2008, noninterest expenses increased $535 million, or 34.7%. The acquisition of the Colonial branches created $160 million of additional noninterest expense in 2009 for Community Banking. The remaining increase of $375 million was primarily due to the increase in foreclosed property expenses and FDIC insurance premiums. Allocated corporate expenses increased $128 million, or 18.3%, to $827 million in 2010, primarily due to increases in loan administration expense, IT services and operations. Comparing 2009 to 2008, allocated corporate expenses declined by $1 million, or 0.1%.
Total identifiable assets for Community Banking decreased $2.4 billion in 2010, or 3.9%, to $60.4 billion, compared to a decrease of $2.0 billion, or 3.1%, in 2009. The loan portfolios declined due to the sale of specific nonperforming commercial loans, the general economic conditions, and lack of strong demand for lending products during 2010.
Residential Mortgage Banking
BB&T’s mortgage originations totaled $24.9 billion in 2010, down 11.7% from a record $28.2 billion in 2009. BB&T’s residential mortgage servicing portfolio, which includes portfolio loans on BB&T’s balance sheet and
89
Table of Contents
loans serviced for third parties, totaled $83.6 billion at year-end 2010 compared to $73.6 billion at December 31, 2009. The Residential Mortgage Banking segment experienced a net loss of $46 million in 2010, compared to net income of $206 million in 2009. This decline was primarily due to a significant increase in the economic provision for loan and lease losses. Net income in 2009 increased by $76 million, or 58.5%, as a result of strong growth in loan originations during the year.
Net interest income for the Residential Mortgage Banking segment totaled $326 million in 2010, down 5.0%, compared to $343 million in 2009. Net interest income in 2009 was up 13.2% compared to 2008. The decrease in net interest income in 2010 was primarily the result of a decline in average portfolio loan balances. The increase in net interest income in 2009 was primarily the result of growth in the loans held for sale portfolio and associated lower funding costs.
The economic provision for loan and lease losses was $570 million for 2010, up $237 million, or 71.2%, compared to $333 million in 2009. Growth in the provision reflected higher losses in 2010, including $141 million of net charge-offs as a result of the sale of problem loans in connection with management’s nonperforming asset disposition strategy.
Noninterest income in the Residential Mortgage Banking segment declined $150 million, or 24.7%, to $457 million in 2010. This decrease is due to lower residential mortgage production revenues compared to a record year in 2009. Noninterest income was up $383 million, or 171.0%, in 2009 compared to 2008. Higher mortgage originations, as well as improved economic hedge performance of the mortgage servicing asset, were primary responsible for this increase. Noninterest expenses incurred in 2010 within the Residential Mortgage Banking segment increased $23 million, or 18.0%, to $151 million compared to 2009, primarily reflecting higher foreclosed property expense, as well as an increase in provision expense associated with loan repurchases. Noninterest expenses for 2009 were up $44 million, or 52.4%, as compared to 2008, primarily due to higher incentives related to strong sales performance, as well as higher loan origination costs.
Total identifiable assets of $22.2 billion for the Residential Mortgage Banking segment increased $3.1 billion, or 16.4%. This followed a slight decrease in identifiable assets in 2009. Increases in mortgage loans were due to growth in loans held for investment by year-end 2010.
Sales Finance
Net income from the Sales Finance segment was $37 million in 2010, up from a net loss of $12 million in 2009. This increase is primarily attributable to growth in average loan balances and a significantly lower economic provision for loan and lease losses. Net income for 2008 was $19 million.
Net interest income from the Sales Finance segment increased by $22 million, or 17.6%, to $147 million in 2010 compared to 2009. The increase in net interest income was primarily due to record loan production and an improved net interest margin during a lower interest rate environment. During 2009, net interest income increased by $5 million, or 4.2%, to $125 million compared to 2008. This increase was due to growth in the indirect recreational and marine vehicle portfolio, as well as the acquisition of an indirect automobile loan portfolio in mid-2009.
The economic provision for loan and lease losses of $34 million was down 62.2% in 2010 after a 125.0% increase to $90 million in 2009. The decrease in 2010 reflects lower loan loss rates as a result of lower early defaults and improved auction results.
The Sales Finance segment was assessed referral fees of $13 million in 2010 and 2009 to compensate Community Banking for services. Noninterest expenses incurred within the Sales Finance segment increased by only 3.2% to $32 million in 2010 due to slowing problem loan-related activities after increasing 10.7% during 2009. Allocated corporate expenses decreased by $3 million, or 25.0%, in 2010 compared to previous years.
Total identifiable assets for the Sales Finance segment of $6.8 billion increased $683 million, or 11.1%, compared to 2009, reflecting the strong growth in lending activities coming off of a prior year increase of $14 million, or 0.2%.
90
Table of Contents
Specialized Lending
BB&T’s Specialized Lending segment continued to expand during 2010 through strong organic growth and significantly lower loan and lease losses. Net income from the Specialized Lending segment was $226 million for 2010, up 425.6% compared to 2009. The increase in net income was driven by improved credit performance in the segment’s consumer lending and equipment finance businesses and strong growth in net interest income. Net income in 2009 of $43 million was up $23 million, or 115.0%, compared to 2008, primarily due to organic loan growth and asset portfolio purchases during the year.
Net interest income totaled $712 million in 2010, an increase of 17.7% compared to 2009. Comparing 2009 to 2008, net interest income increased 21.2% to $605 million. The growth in net interest income in 2010 was a result of strong portfolio growth and expansion in the net interest margin. Net interest income growth in 2009 was primarily driven by growth in the commercial insurance premium finance and consumer subprime auto loan portfolios. Average loans for the Specialized Lending segment grew by $637 million, or 8.9%, to $7.8 billion in 2010 compared to 2009. Average loan growth for the segment was $1.6 billion, or 29.6%, in 2009 compared to 2008.
The economic provision for loan and lease losses totaled $155 million in 2010, a decrease of $177 million, or 53.3%, compared to 2009. Comparing 2009 to 2008, the economic provision for loan and lease losses increased $31 million, or 10.3%. The decline in the provision for 2010 was primarily attributable to improved credit performance in the subprime auto loan and equipment finance portfolios. Due to the overall higher credit risk profiles of some of the clients of Specialized Lending, loss rates are expected to be higher than conventional bank lending. Loss rates are also affected by shifts in the portfolio mix of the underlying subsidiaries.
Noninterest income produced by the Specialized Lending segment totaled $143 million in 2010, an increase of $24 million, or 20.2%, compared to 2009. Comparing 2009 to 2008, noninterest income increased $3 million, or 2.6%. Noninterest expenses incurred within the Specialized Lending segment in 2010 totaled $293 million, an increase of $8 million, or 2.8%, compared to 2009. Comparing 2009 to 2008, noninterest expenses totaled $285 million, an increase of $40 million, or 16.3%. The increases in noninterest expenses incurred within the Specialized Lending segment were driven by internal growth.
Total identifiable assets for the Specialized Lending segment of $8.6 billion increased $413 million, or 5.1%, between 2009 and 2010 due primarily to organic growth. Comparing 2009 to 2008, total identifiable assets increased $1.6 billion, or 24.2%.
Insurance Services
Net income from the Insurance Services segment was $112 million in 2010, a decline of $16 million, or 12.5%, from 2009. Insurance Services continues to be impacted by both the weak economy and a decline in insurance premium pricing, which has resulted in lower commission revenues and has increased pressure on brokerage operating margins. Comparing 2009 to 2008, net income grew $21 million, or 19.6%.
Noninterest income produced by the Insurance Services segment totaled $1.0 billion during 2010 and 2009. There were no acquisitions completed in 2010. Comparing 2009 to 2008, noninterest income increased $125 million, or 13.8%.
Noninterest expenses incurred within the Insurance Services segment increased $17 million, or 2.2%, in 2010 to $790 million compared to 2009. This increase was due to higher operating costs, including increased insurance contract commissions paid to outside agents and brokers and increased legal costs compared to 2009. Comparing 2009 to 2008, noninterest expenses increased $75 million, or 10.7%.
Financial Services
Net income from the Financial Services segment declined by $1 million, or 0.6%, to $159 million in 2010. The decrease from 2009 is primarily attributable to the $27 million pre-tax gain realized in 2009 on the sale of BB&T’s payroll processing business. Adjusted for this 2009 one-time gain, the Financial Services segment’s net income was up $16 million, or 10.9%. In 2010, the Financial Services segment experienced positive results from Corporate Banking loan and deposit growth and strong growth in assets under management in Sterling Capital and the
91
Table of Contents
Wealth Management Division. Additionally, Investment Services expanded their number of investment counselors in 2010, contributing to strong revenue growth for their business, especially in the new markets associated with the Colonial acquisition. Comparing 2009 to 2008, net income increased $74 million, or 86.0%, based on an expansion of Corporate Banking initiatives, as well as strong performance from capital markets activities and brokerage operations.
Net interest income for the Financial Services segment totaled $127 million in 2010, a decrease of $3 million, or 2.3%, compared to 2009. Comparing 2009 to 2008, net interest income increased $52 million, or 66.7%. The decrease in net interest income during 2010 was attributable to lower fixed-income revenue for Scott & Stringfellow that was partially offset by strong organic loan growth in Corporate Banking. Corporate Banking was also the strongest driver in the overall increase in net interest income for 2009.
Noninterest income in the Financial Services segment in 2010 totaled $657 million, down $17 million, or 2.5%, compared to $674 million earned during 2009. This decrease in 2010 is primarily attributed to the $27 million gain realized in 2009 on the sale of BB&T’s payroll processing business. BB&T Capital Partners had strong revenue growth in 2010 related to maturing investments in its private equity and mezzanine funds. Additionally, Sterling Capital and the Wealth Management Division had strong noninterest income growth in 2010, with assets under management growing as a result of improved market conditions and business initiatives. Noninterest income increased by $45 million, or 7.2%, between 2008 and 2009. The revenue increase in 2009 was attributable to the gain on the sale of BB&T’s payroll processing business and strong performances from the Wealth Management Division and Capital Market’s Fixed Income sales and trading activities. Noninterest expenses of $533 million incurred by Financial Services in 2010 declined $10 million compared to 2009, after declining $9 million in the prior year.
Treasury
The Treasury segment is responsible for managing the liquidity position for the Corporation, investing excess funds, and managing interest rate risk. Net income from the Treasury segment of $163 million for 2010 was down $67 million, or 29.1%, from 2009. Net income in the Treasury segment is subject to fluctuations based on the interest sensitivity of the Corporation’s balance sheet, the purchases and sales of securities, and the issuance and retirement of funding vehicles. For 2009, net income of $230 million was down $177 million, or 43.5% from 2008.
Net interest income in the Treasury segment can vary due to changing needs of the Corporation, including the size of the investment portfolio, the need for wholesale funding, and income received from derivatives used to hedge the balance sheet. Net interest expense for the Treasury segment was $467 million in 2010 compared to net interest expense of $59 million in 2009. Net interest expense for 2010 consisted of $156 million of net interest income and $623 million of net interest expense from the FTP charge. For 2009, net interest income for the Treasury segment consisted of $630 million of net interest income and $689 million of net interest expense from the FTP charge.
During 2010, noninterest income earned by the Treasury segment totaled $643 million, an increase of 97.2%, compared to $326 million earned during 2009. Noninterest income during 2010 included $578 million in gains on the sale of securities, an increase of $339 million compared to $239 million of gains in 2009. These gains were partially offset by other-than-temporary-impairment (“OTTI”) write downs of $31 million in 2010 and $7 million in 2009. For 2008, noninterest income within the Treasury segment totaled $265 million, and included net gains on the sale of securities of $233 million and OTTI of $54 million.
The income tax benefit allocated to the Treasury segment during 2010 was $11 million compared to a provision for income taxes of $28 million in 2009 and $157 million in 2008. The changes in the taxes allocated to the Treasury segment are a combination of changes in the level of pre-tax income and tax-exempt income.
As of December 31, 2010, total identifiable assets in the Treasury segment were $27.8 billion, a decrease of $8.8 billion, or 24.0%, from the prior year. This followed a decrease of $835 million, or 2.2%, in 2009 compared to 2008. The decrease in assets in 2010 reflects the implementation of a de-risking strategy whereby the portfolio size was decreased through sales of securities and duration in the portfolio was reduced.
92
Table of Contents
Fourth Quarter Results
Consolidated net income available to common shareholders for the fourth quarter of 2010 of $208 million was up 12.4% compared to $185 million earned during the same period in 2009. On a diluted per common share basis, earnings for the fourth quarter of 2010 were $.30, up 11.1% compared to $.27 for the same period in 2009. BB&T’s results of operations for the fourth quarter of 2010 produced an annualized return on average assets of .54% and an annualized return on average common shareholders’ equity of 4.88% compared to prior year ratios of .47% and 4.52%, respectively.
Total fully taxable-equivalent revenues were $2.3 billion for the fourth quarter of 2010, up slightly compared to the fourth quarter of 2009. The increase in total revenues was driven by higher net interest income, as the net interest margin for the fourth quarter of 2010 improved 24 basis points compared to the fourth quarter of 2009. The improvement in the net interest margin reflects higher yields on loans acquired in the Colonial acquisition and lower deposit costs. Interest income on covered and other acquired assets increased $128 million, the majority of which is offset in the FDIC loss-share income. Net interest income increased at a slower pace due to a decline in average earning assets of $6.9 billion as a result of the balance sheet deleverage strategy that was executed in the second quarter of 2010. Noninterest income was down slightly compared to the fourth quarter of 2009, as higher net securities gains of $100 million were offset by a decrease of $43 million in service charges on deposit accounts and $62 million of losses and writedowns on commercial loans held for sale.
Management completed its strategy to de-risk the investment securities portfolio during the fourth quarter of 2010. In anticipation of rising rates, management sold approximately $6.1 billion of agency mortgage-backed securities and replaced them with shorter duration and floating rate securities. In addition, management sold approximately $400 million of non-agency mortgage-backed securities to reduce the potential for future credit losses.
The provision for credit losses, excluding covered loans, for the fourth quarter of 2010 declined $182 million, or 25.1%, compared to the fourth quarter of 2009, as improving credit resulted in lower provision expense. The provision for covered loans increased $100 million, which was offset by a corresponding $80 million increase in FDIC loss share income. Net-charge-offs for the fourth quarter of 2010 were $50 million higher than the fourth quarter of 2009, partially due to $26 million in charge-offs recognized as a result of the continuing NPA disposition strategy. Overall, the level of nonperforming assets and loan delinquencies were improving and the outlook for future credit losses is better.
A $15 million provision for income taxes was recorded for the fourth quarter of 2010 compared to $13 million for the fourth quarter of 2009. This resulted in an effective tax rate for the fourth quarter of 2010 of 6.5% compared to 6.3% for the prior year’s fourth quarter.
The accompanying table, “Quarterly Financial Summary—Unaudited,” presents condensed information relating to quarterly periods in the years ended December 31, 2009 and 2008.
93
Table of Contents
Quarterly Financial Summary—Unaudited
| 2010 | 2009 | |||||||||||||||||||||||||||||||
|
Fourth
Quarter |
Third
Quarter |
Second
Quarter |
First
Quarter |
Fourth
Quarter |
Third
Quarter |
Second
Quarter |
First
Quarter |
|||||||||||||||||||||||||
| (Dollars in millions, except per share data) | ||||||||||||||||||||||||||||||||
| Consolidated Summary of Operations: | ||||||||||||||||||||||||||||||||
|
Interest income |
$ | 1,755 | $ | 1,762 | $ | 1,819 | $ | 1,779 | $ | 1,820 | $ | 1,745 | $ | 1,640 | $ | 1,679 | ||||||||||||||||
|
Interest expense |
423 | 448 | 459 | 465 | 497 | 508 | 502 | 533 | ||||||||||||||||||||||||
|
Provision for credit losses |
643 | 770 | 650 | 575 | 725 | 709 | 701 | 676 | ||||||||||||||||||||||||
|
Securities gains (losses), net |
99 | 239 | 219 | (3 | ) | (1 | ) | 31 | 19 | 150 | ||||||||||||||||||||||
|
Other noninterest income |
865 | 871 | 820 | 847 | 971 | 909 | 974 | 881 | ||||||||||||||||||||||||
|
Noninterest expense |
1,421 | 1,408 | 1,500 | 1,341 | 1,361 | 1,320 | 1,181 | 1,069 | ||||||||||||||||||||||||
|
Provision for income taxes (1) |
15 | 27 | 25 | 48 | 13 | (9 | ) | 41 | 114 | |||||||||||||||||||||||
|
Net income |
217 | 219 | 224 | 194 | 194 | 157 | 208 | 318 | ||||||||||||||||||||||||
|
Noncontrolling interest |
9 | 9 | 14 | 6 | 9 | 5 | 4 | 6 | ||||||||||||||||||||||||
|
Dividends and accretion on preferred stock |
— | — | — | — | — | — | 83 | 41 | ||||||||||||||||||||||||
|
Net income available to common shareholders |
$ | 208 | $ | 210 | $ | 210 | $ | 188 | $ | 185 | $ | 152 | $ | 121 | $ | 271 | ||||||||||||||||
|
Basic earnings per common share |
$ | .30 | $ | .30 | $ | .30 | $ | .27 | $ | .27 | $ | .23 | $ | .20 | $ | .48 | ||||||||||||||||
|
Diluted earnings per common share |
$ | .30 | $ | .30 | $ | .30 | $ | .27 | $ | .27 | $ | .23 | $ | .20 | $ | .48 | ||||||||||||||||
| Selected Average Balances: | ||||||||||||||||||||||||||||||||
|
Assets |
$ | 159,464 | $ | 155,666 | $ | 159,786 | $ | 163,807 | $ | 164,719 | $ | 157,451 | $ | 148,496 | $ | 149,876 | ||||||||||||||||
|
Securities, at amortized cost |
25,988 | 23,277 | 28,309 | 32,989 | 33,351 | 31,511 | 29,510 | 30,500 | ||||||||||||||||||||||||
|
Loans and leases (2) |
105,946 | 104,755 | 103,964 | 104,468 | 105,869 | 103,334 | 99,577 | 99,724 | ||||||||||||||||||||||||
|
Total earning assets |
134,929 | 130,983 | 135,374 | 140,138 | 141,875 | 137,176 | 131,156 | 132,331 | ||||||||||||||||||||||||
|
Deposits |
105,592 | 103,505 | 107,060 | 111,031 | 113,622 | 107,310 | 94,385 | 93,934 | ||||||||||||||||||||||||
|
Federal funds purchased, securities sold under repurchase agreements and short-term debt |
9,446 | 7,355 | 9,105 | 10,207 | 8,584 | 9,964 | 14,732 | 16,804 | ||||||||||||||||||||||||
|
Long-term debt |
21,890 | 21,833 | 21,660 | 21,221 | 21,232 | 19,867 | 17,755 | 17,436 | ||||||||||||||||||||||||
|
Total interest-bearing liabilities |
115,901 | 112,594 | 118,479 | 123,995 | 124,616 | 119,752 | 111,429 | 114,346 | ||||||||||||||||||||||||
|
Shareholders’ equity |
16,951 | 17,035 | 16,925 | 16,627 | 16,336 | 15,537 | 16,683 | 16,406 | ||||||||||||||||||||||||
| (1) | Fourth quarter and third quarter 2009 include credits of $7 million and $12 million, respectively, to the provision for income taxes related to non-taxable gains on the sale of leveraged leases. |
| (2) | Loans and leases are net of unearned income and include loans held for sale. |
94
Table of Contents
SIX YEAR FINANCIAL SUMMARY AND SELECTED RATIOS (1)
(Dollars in millions, except per share data, shares in thousands)
| As of / For the Years Ended December 31, |
Five Year
Compound Growth Rate |
|||||||||||||||||||||||||||
| 2010 | 2009 | 2008 | 2007 | 2006 | 2005 | |||||||||||||||||||||||
| Summary of Operations | ||||||||||||||||||||||||||||
|
Interest income |
$ | 7,115 | $ | 6,884 | $ | 7,207 | $ | 7,894 | $ | 6,893 | $ | 5,506 | 5.3 | % | ||||||||||||||
|
Interest expense |
1,795 | 2,040 | 2,969 | 4,014 | 3,185 | 1,981 | (2.0 | ) | ||||||||||||||||||||
|
Net interest income |
5,320 | 4,844 | 4,238 | 3,880 | 3,708 | 3,525 | 8.6 | |||||||||||||||||||||
|
Provision for credit losses |
2,638 | 2,811 | 1,445 | 448 | 240 | 217 | 64.8 | |||||||||||||||||||||
|
Net interest income after provision for credit losses |
2,682 | 2,033 | 2,793 | 3,432 | 3,468 | 3,308 | (4.1 | ) | ||||||||||||||||||||
|
Noninterest income |
3,957 | 3,934 | 3,197 | 2,774 | 2,521 | 2,326 | 11.2 | |||||||||||||||||||||
|
Noninterest expense |
5,670 | 4,931 | 3,911 | 3,624 | 3,511 | 3,163 | 12.4 | |||||||||||||||||||||
|
Income before income taxes |
969 | 1,036 | 2,079 | 2,582 | 2,478 | 2,471 | (17.1 | ) | ||||||||||||||||||||
|
Provision for income taxes |
115 | 159 | 550 | 836 | 945 | 813 | (32.4 | ) | ||||||||||||||||||||
|
Net income |
854 | 877 | 1,529 | 1,746 | 1,533 | 1,658 | (12.4 | ) | ||||||||||||||||||||
|
Noncontrolling interest |
38 | 24 | 10 | 12 | 5 | 4 | 56.9 | |||||||||||||||||||||
|
Dividends and accretion on preferred stock |
— | 124 | 21 | — | — | — | NM | |||||||||||||||||||||
|
Net income available to common shareholders |
$ | 816 | $ | 729 | $ | 1,498 | $ | 1,734 | $ | 1,528 | $ | 1,654 | (13.2 | ) | ||||||||||||||
| Per Common Share | ||||||||||||||||||||||||||||
|
Average shares outstanding: |
||||||||||||||||||||||||||||
|
Basic |
692,489 | 629,583 | 548,847 | 547,184 | 539,140 | 546,916 | 4.8 | |||||||||||||||||||||
|
Diluted |
701,039 | 635,619 | 552,498 | 551,755 | 543,891 | 551,380 | 4.9 | |||||||||||||||||||||
|
Earnings: |
||||||||||||||||||||||||||||
|
Basic |
$ | 1.18 | $ | 1.16 | $ | 2.73 | $ | 3.17 | $ | 2.84 | $ | 3.02 | (17.1 | ) | ||||||||||||||
|
Diluted |
1.16 | 1.15 | 2.71 | 3.14 | 2.81 | 3.00 | (17.3 | ) | ||||||||||||||||||||
|
Cash dividends declared |
.60 | .92 | 1.87 | 1.80 | 1.64 | 1.49 | (16.6 | ) | ||||||||||||||||||||
|
Book value |
23.67 | 23.47 | 23.16 | 23.14 | 21.69 | 20.49 | 2.9 | |||||||||||||||||||||
| Average Balances | ||||||||||||||||||||||||||||
|
Securities, at amortized cost |
$ | 27,610 | $ | 31,226 | $ | 23,402 | $ | 21,731 | $ | 20,110 | $ | 19,571 | 7.1 | |||||||||||||||
|
Loans and leases (2) |
104,787 | 102,146 | 95,195 | 87,952 | 79,313 | 71,517 | 7.9 | |||||||||||||||||||||
|
Other assets |
27,261 | 21,810 | 18,284 | 16,737 | 14,905 | 13,524 | 15.1 | |||||||||||||||||||||
|
Total assets |
$ | 159,658 | $ | 155,182 | $ | 136,881 | $ | 126,420 | $ | 114,328 | $ | 104,612 | 8.8 | |||||||||||||||
|
Deposits |
$ | 106,773 | $ | 102,381 | $ | 88,831 | $ | 83,501 | $ | 77,230 | $ | 70,346 | 8.7 | |||||||||||||||
|
Long-term debt |
21,653 | 19,085 | 19,839 | 18,045 | 14,628 | 11,959 | 12.6 | |||||||||||||||||||||
|
Other liabilities |
14,346 | 17,478 | 14,678 | 12,659 | 10,939 | 11,171 | 5.1 | |||||||||||||||||||||
|
Shareholders’ equity |
16,886 | 16,238 | 13,533 | 12,215 | 11,531 | 11,136 | 8.7 | |||||||||||||||||||||
|
Total liabilities and shareholders’ equity |
$ | 159,658 | $ | 155,182 | $ | 136,881 | $ | 126,420 | $ | 114,328 | $ | 104,612 | 8.8 | |||||||||||||||
| Period-End Balances | ||||||||||||||||||||||||||||
|
Total assets |
$ | 157,081 | $ | 165,764 | $ | 152,015 | $ | 132,618 | $ | 121,351 | $ | 109,170 | 7.5 | |||||||||||||||
|
Loans and leases (2) |
107,264 | 106,207 | 98,669 | 91,686 | 83,591 | 75,023 | 7.4 | |||||||||||||||||||||
|
Deposits |
107,213 | 114,965 | 98,613 | 86,766 | 80,971 | 74,282 | 7.6 | |||||||||||||||||||||
|
Long-term debt |
21,730 | 21,376 | 18,032 | 18,693 | 15,904 | 13,119 | 10.6 | |||||||||||||||||||||
|
Shareholders’ equity |
16,498 | 16,241 | 16,081 | 12,664 | 11,826 | 11,201 | 8.1 | |||||||||||||||||||||
| Selected Ratios | ||||||||||||||||||||||||||||
|
Rate of return on: |
||||||||||||||||||||||||||||
|
Average total assets |
.54 | % | .56 | % | 1.12 | % | 1.38 | % | 1.34 | % | 1.58 | % | ||||||||||||||||
|
Average common equity |
4.85 | 4.93 | 11.44 | 14.25 | 13.35 | 14.95 | ||||||||||||||||||||||
|
Average total equity |
5.06 | 5.40 | 11.30 | 14.30 | 13.30 | 14.89 | ||||||||||||||||||||||
|
Dividend payout |
50.85 | 79.31 | 68.50 | 56.78 | 57.75 | 49.34 | ||||||||||||||||||||||
|
Average equity to average assets |
10.58 | 10.46 | 9.89 | 9.66 | 10.09 | 10.65 | ||||||||||||||||||||||
| (1) | Amounts include the impact of the Colonial acquisition which was completed on August 14, 2009. |
| (2) | Loans and leases are net of unearned income and include loans held for sale. |
95
Table of Contents
Management’s Report on Internal Control Over Financial Reporting
Management of BB&T is responsible for establishing and maintaining adequate internal control over financial reporting as defined in Rule 13a-15(f) of the Securities Exchange Act of 1934 as amended (the Exchange Act). The Corporation’s internal control over financial reporting is a process designed to provide reasonable assurance regarding the reliability of financial reporting and the preparation of financial statements for external purposes in accordance with accounting principles generally accepted in the United States of America. BB&T’s internal control over financial reporting includes those policies and procedures that (1) pertain to the maintenance of records, that in reasonable detail, accurately and fairly reflect the transactions and disposition of the Corporation’s assets; (2) provide reasonable assurance that transactions are recorded as necessary to permit the preparation of the financial statements in accordance with generally accepted accounting principles and that receipts and expenditures of the Corporation are being made only in accordance with the authorizations of BB&T’s management and directors; and (3) provide reasonable assurance regarding prevention or timely detection of unauthorized acquisition, use or disposition of the Corporation’s assets that could have a material impact on the financial statements.
Because of its inherent limitations, internal control over financial reporting may not prevent or detect misstatements. Also, projections of any evaluation of effectiveness to future periods are subject to the risk that controls may become inadequate due to changes in conditions, or that the degree of compliance with the policies and procedures may deteriorate.
Under the supervision and with the participation of management, including the Chief Executive Officer and the Chief Financial Officer, the Corporation conducted an evaluation of the effectiveness of the internal control over financial reporting based on the framework in “Internal Control—Integrated Framework” promulgated by the Committee of Sponsoring Organizations of the Treadway Commission, commonly referred to as the “COSO” criteria. Based on this evaluation under the “COSO” criteria, management concluded that the internal control over financial reporting was effective as of December 31, 2010.
As of the end of the period covered by this report, the management of the Corporation, under the supervision and with the participation of the Corporation’s Chief Executive Officer and Chief Financial Officer, carried out an evaluation of the Corporation’s disclosure controls and procedures as defined in Rule 13a-15(e) of the Exchange Act. Based on that evaluation, the Chief Executive Officer and Chief Financial Officer concluded that the Corporation’s disclosure controls and procedures are effective.
There was no change in the Corporation’s internal control over financial reporting that occurred during the fourth quarter of 2010 that has materially affected or is likely to materially affect, the Corporation’s internal control over financial reporting.
The effectiveness of the internal control structure over financial reporting, as of December 31, 2010, has been audited by PricewaterhouseCoopers LLP, an independent registered public accounting firm, as stated in their report included on page 97, which expresses an unqualified opinion on the effectiveness of the Corporation’s internal control over financial reporting as of December 31, 2010.
96
Table of Contents
Report of Independent Registered Public Accounting Firm
To the Board of Directors and Shareholders of BB&T Corporation:
In our opinion, the accompanying consolidated balance sheets and the related consolidated statements of income, changes in shareholders’ equity and cash flows present fairly, in all material respects, the financial position of BB&T Corporation and its subsidiaries at December 31, 2010 and 2009, and the results of their operations and their cash flows for each of the three years in the period ended December 31, 2010 in conformity with accounting principles generally accepted in the United States of America. Also in our opinion, the Company maintained, in all material respects, effective internal control over financial reporting as of December 31, 2010, based on criteria established in Internal Control—Integrated Framework issued by the Committee of Sponsoring Organizations of the Treadway Commission (COSO). The Company’s management is responsible for these financial statements, for maintaining effective internal control over financial reporting and for its assessment of the effectiveness of internal control over financial reporting, included in Management’s Report on Internal Control Over Financial Reporting appearing on page 96. Our responsibility is to express opinions on these financial statements and on the Company’s internal control over financial reporting based on our integrated audits. We conducted our audits in accordance with the standards of the Public Company Accounting Oversight Board (United States). Those standards require that we plan and perform the audits to obtain reasonable assurance about whether the financial statements are free of material misstatement and whether effective internal control over financial reporting was maintained in all material respects. Our audits of the financial statements included examining, on a test basis, evidence supporting the amounts and disclosures in the financial statements, assessing the accounting principles used and significant estimates made by management, and evaluating the overall financial statement presentation. Our audit of internal control over financial reporting included obtaining an understanding of internal control over financial reporting, assessing the risk that a material weakness exists, and testing and evaluating the design and operating effectiveness of internal control based on the assessed risk. Our audits also included performing such other procedures as we considered necessary in the circumstances. We believe that our audits provide a reasonable basis for our opinions.
A company’s internal control over financial reporting is a process designed to provide reasonable assurance regarding the reliability of financial reporting and the preparation of financial statements for external purposes in accordance with generally accepted accounting principles. A company’s internal control over financial reporting includes those policies and procedures that (i) pertain to the maintenance of records that, in reasonable detail, accurately and fairly reflect the transactions and dispositions of the assets of the company; (ii) provide reasonable assurance that transactions are recorded as necessary to permit preparation of financial statements in accordance with generally accepted accounting principles, and that receipts and expenditures of the company are being made only in accordance with authorizations of management and directors of the company; and (iii) provide reasonable assurance regarding prevention or timely detection of unauthorized acquisition, use, or disposition of the company’s assets that could have a material effect on the financial statements.
Because of its inherent limitations, internal control over financial reporting may not prevent or detect misstatements. Also, projections of any evaluation of effectiveness to future periods are subject to the risk that controls may become inadequate because of changes in conditions, or that the degree of compliance with the policies or procedures may deteriorate.
/s/ PricewaterhouseCoopers LLP
Charlotte, North Carolina
February 25, 2011
97
Table of Contents
BB&T CORPORATION AND SUBSIDIARIES
December 31, 2010 and 2009
(Dollars in millions, except per share data, shares in thousands)
|
December 31,
2010 |
December 31,
2009 |
|||||||
| Assets | ||||||||
|
Cash and due from banks |
$ | 1,127 | $ | 1,584 | ||||
|
Interest-bearing deposits with banks |
931 | 667 | ||||||
|
Federal funds sold and securities purchased under resale agreements or similar arrangements |
327 | 398 | ||||||
|
Segregated cash due from banks |
309 | 270 | ||||||
|
Trading securities at fair value |
633 | 636 | ||||||
|
Securities available for sale at fair value ($1,539 and $1,201 covered by FDIC loss share at December 31, 2010 and December 31, 2009, respectively) |
23,169 | 33,253 | ||||||
|
Loans held for sale ($3,176 and $2,551 at fair value at December 31, 2010 and December 31, 2009, respectively) |
3,697 | 2,551 | ||||||
|
Loans and leases ($6,194 and $8,019 covered by FDIC loss share at December 31, 2010 and December 31, 2009, respectively) |
103,567 | 103,656 | ||||||
|
Allowance for loan and lease losses |
(2,708 | ) | (2,600 | ) | ||||
|
Loans and leases, net of allowance for loan and lease losses |
100,859 | 101,056 | ||||||
|
FDIC loss share receivable |
1,922 | 3,062 | ||||||
|
Premises and equipment |
1,840 | 1,583 | ||||||
|
Goodwill |
6,008 | 6,053 | ||||||
|
Core deposit and other intangible assets |
508 | 640 | ||||||
|
Residential mortgage servicing rights at fair value |
830 | 832 | ||||||
|
Other assets ($360 and $215 of foreclosed property and other assets covered by FDIC loss share at December 31, 2010 and December 31, 2009, respectively) |
14,921 | 13,179 | ||||||
|
Total assets |
$ | 157,081 | $ | 165,764 | ||||
| Liabilities and Shareholders’ Equity | ||||||||
|
Deposits: |
||||||||
|
Noninterest-bearing deposits |
$ | 20,637 | $ | 18,945 | ||||
|
Interest-bearing deposits |
86,576 | 96,020 | ||||||
|
Total deposits |
107,213 | 114,965 | ||||||
|
Federal funds purchased, securities sold under repurchase agreements and short-term borrowed funds |
5,673 | 8,106 | ||||||
|
Long-term debt |
21,730 | 21,376 | ||||||
|
Accounts payable and other liabilities |
5,967 | 5,076 | ||||||
|
Total liabilities |
140,583 | 149,523 | ||||||
|
Commitments and contingencies (Note 16) |
||||||||
|
Shareholders’ equity: |
||||||||
|
Common stock, $5 par |
3,472 | 3,449 | ||||||
|
Additional paid-in capital |
5,776 | 5,620 | ||||||
|
Retained earnings |
7,935 | 7,539 | ||||||
|
Accumulated other comprehensive loss, net of deferred income taxes of $(452) at December 31, 2010 and $(257) at December 31, 2009 |
(747 | ) | (417 | ) | ||||
|
Noncontrolling interest |
62 | 50 | ||||||
|
Total shareholders’ equity |
16,498 | 16,241 | ||||||
|
Total liabilities and shareholders’ equity |
$ | 157,081 | $ | 165,764 | ||||
|
Common shares outstanding |
694,381 | 689,750 | ||||||
|
Common shares authorized |
2,000,000 | 1,000,000 | ||||||
|
Preferred shares authorized |
5,000 | 5,000 | ||||||
The accompanying notes are an integral part of these consolidated financial statements.
98
Table of Contents
BB&T CORPORATION AND SUBSIDIARIES
Years Ended December 31, 2010, 2009 and 2008
(Dollars in millions, except per share data, shares in thousands)
| 2010 | 2009 | 2008 | ||||||||||
| Interest Income | ||||||||||||
|
Interest and fees on loans and leases |
$ | 6,080 | $ | 5,547 | $ | 6,003 | ||||||
|
Interest and dividends on securities |
1,019 | 1,319 | 1,135 | |||||||||
|
Interest on other earning assets |
16 | 18 | 69 | |||||||||
|
Total interest income |
7,115 | 6,884 | 7,207 | |||||||||
| Interest Expense | ||||||||||||
|
Interest on deposits |
917 | 1,271 | 1,891 | |||||||||
|
Interest on federal funds purchased, securities sold under repurchase agreements and short-term borrowed funds |
22 | 58 | 235 | |||||||||
|
Interest on long-term debt |
856 | 711 | 843 | |||||||||
|
Total interest expense |
1,795 | 2,040 | 2,969 | |||||||||
| Net Interest Income | 5,320 | 4,844 | 4,238 | |||||||||
|
Provision for credit losses |
2,638 | 2,811 | 1,445 | |||||||||
| Net Interest Income After Provision for Credit Losses | 2,682 | 2,033 | 2,793 | |||||||||
| Noninterest Income | ||||||||||||
|
Insurance income |
1,041 | 1,047 | 928 | |||||||||
|
Service charges on deposits |
618 | 690 | 673 | |||||||||
|
Mortgage banking income |
521 | 658 | 275 | |||||||||
|
Investment banking and brokerage fees and commissions |
352 | 346 | 354 | |||||||||
|
Checkcard fees |
274 | 227 | 201 | |||||||||
|
Other nondeposit fees and commissions |
270 | 229 | 189 | |||||||||
|
Bankcard fees and merchant discounts |
177 | 156 | 151 | |||||||||
|
Trust and investment advisory revenues |
159 | 139 | 147 | |||||||||
|
Income from bank-owned life insurance |
123 | 97 | 84 | |||||||||
|
FDIC loss share income, net |
(116 | ) | 14 | — | ||||||||
|
Other income, net |
(16 | ) | 132 | 88 | ||||||||
|
Securities gains, net |
||||||||||||
|
Realized gains, net |
585 | 240 | 211 | |||||||||
|
Other-than-temporary impairments |
(117 | ) | (172 | ) | (104 | ) | ||||||
|
Non-credit portion recognized in other comprehensive income |
86 | 131 | — | |||||||||
|
Total securities gains, net |
554 | 199 | 107 | |||||||||
|
Total noninterest income |
3,957 | 3,934 | 3,197 | |||||||||
| Noninterest Expense | ||||||||||||
|
Personnel expense |
2,616 | 2,517 | 2,201 | |||||||||
|
Foreclosed property expense |
747 | 356 | 79 | |||||||||
|
Occupancy and equipment expense |
608 | 579 | 509 | |||||||||
|
Professional services |
334 | 262 | 204 | |||||||||
|
Regulatory charges |
211 | 230 | 30 | |||||||||
|
Loan processing expenses |
180 | 135 | 125 | |||||||||
|
Amortization of intangibles |
122 | 114 | 100 | |||||||||
|
Software expense |
117 | 94 | 74 | |||||||||
|
Merger-related and restructuring charges, net |
69 | 38 | 15 | |||||||||
|
Other expenses |
666 | 606 | 574 | |||||||||
|
Total noninterest expense |
5,670 | 4,931 | 3,911 | |||||||||
| Earnings | ||||||||||||
|
Income before income taxes |
969 | 1,036 | 2,079 | |||||||||
|
Provision for income taxes |
115 | 159 | 550 | |||||||||
|
Net income |
854 | 877 | 1,529 | |||||||||
|
Noncontrolling interest |
38 | 24 | 10 | |||||||||
|
Dividends and accretion on preferred stock |
— | 124 | 21 | |||||||||
|
Net income available to common shareholders |
$ | 816 | $ | 729 | $ | 1,498 | ||||||
| Earnings Per Common Share | ||||||||||||
|
Basic |
$ | 1.18 | $ | 1.16 | $ | 2.73 | ||||||
|
Diluted |
$ | 1.16 | $ | 1.15 | $ | 2.71 | ||||||
|
Cash dividends declared |
$ | .60 | $ | .92 | $ | 1.87 | ||||||
| Weighted Average Shares Outstanding | ||||||||||||
|
Basic |
692,489 | 629,583 | 548,847 | |||||||||
|
Diluted |
701,039 | 635,619 | 552,498 | |||||||||
The accompanying notes are an integral part of these consolidated financial statements.
99
Table of Contents
BB&T CORPORATION AND SUBSIDIARIES
CONSOLIDATED STATEMENTS OF CHANGES IN SHAREHOLDERS’ EQUITY
Years Ended December 31, 2010, 2009 and 2008
(Dollars in millions, except per share data, shares in thousands)
|
Shares of
Common Stock |
Preferred
Stock |
Common
Stock |
Additional
Paid-In Capital |
Retained
Earnings |
Accumulated
Other Comprehensive Income (Loss) |
Noncontrolling
Interest |
Total
Shareholders’ Equity |
|||||||||||||||||||||||||
| Balance, January 1, 2008 | 545,955 | $ | — | $ | 2,730 | $ | 3,087 | $ | 6,919 | $ | (104 | ) | $ | 32 | $ | 12,664 | ||||||||||||||||
| Add (Deduct): | ||||||||||||||||||||||||||||||||
|
Comprehensive income (loss): |
||||||||||||||||||||||||||||||||
|
Net income |
— | — | — | — | 1,519 | — | 10 | 1,529 | ||||||||||||||||||||||||
|
Net change in other comprehensive income (loss) |
— | — | — | — | — | (628 | ) | — | (628 | ) | ||||||||||||||||||||||
|
Total comprehensive income (loss) (Note 13) |
— | — | — | — | 1,519 | (628 | ) | 10 | 901 | |||||||||||||||||||||||
|
Stock issued: |
||||||||||||||||||||||||||||||||
|
In purchase acquisitions (1) |
7,201 | — | 36 | 161 | — | — | — | 197 | ||||||||||||||||||||||||
|
In connection with stock option exercises and other employee benefits, net of cancellations |
2,219 | — | 11 | 52 | — | — | — | 63 | ||||||||||||||||||||||||
|
In connection with dividend reinvestment plan |
1,415 | — | 7 | 37 | — | — | — | 44 | ||||||||||||||||||||||||
|
In connection with private placement to BB&T pension plan |
2,458 | — | 12 | 41 | — | — | — | 53 | ||||||||||||||||||||||||
|
In connection with Capital Purchase Program |
— | 3,082 | — | — | — | — | — | 3,082 | ||||||||||||||||||||||||
|
Warrants issued in connection with Capital Purchase Program |
— | — | — | 52 | — | — | — | 52 | ||||||||||||||||||||||||
|
Cash dividends declared on common stock, $1.87 per share |
— | — | — | — | (1,028 | ) | — | — | (1,028 | ) | ||||||||||||||||||||||
|
Cash dividends accrued on preferred stock |
— | — | — | — | (21 | ) | — | — | (21 | ) | ||||||||||||||||||||||
|
Cumulative effect of adoption of accounting principles |
— | — | — | — | (8 | ) | — | — | (8 | ) | ||||||||||||||||||||||
|
Equity-based compensation expense |
— | — | — | 75 | — | — | — | 75 | ||||||||||||||||||||||||
|
Other, net |
— | — | — | 5 | — | — | 2 | 7 | ||||||||||||||||||||||||
| Balance, December 31, 2008 | 559,248 | $ | 3,082 | $ | 2,796 | $ | 3,510 | $ | 7,381 | $ | (732 | ) | $ | 44 | $ | 16,081 | ||||||||||||||||
| Add (Deduct): | ||||||||||||||||||||||||||||||||
|
Comprehensive income (loss): |
||||||||||||||||||||||||||||||||
|
Net income |
— | — | — | — | 853 | — | 24 | 877 | ||||||||||||||||||||||||
|
Net change in other comprehensive income (loss) |
— | — | — | — | — | 315 | — | 315 | ||||||||||||||||||||||||
|
Total comprehensive income (loss) (Note 13) |
— | — | — | — | 853 | 315 | 24 | 1,192 | ||||||||||||||||||||||||
|
Stock issued: |
||||||||||||||||||||||||||||||||
|
In purchase acquisitions (1) |
1,628 | — | 8 | 32 | — | — | — | 40 | ||||||||||||||||||||||||
|
In connection with stock option exercises and other employee benefits, net of cancellations |
463 | — | 2 | 4 | — | — | — | 6 | ||||||||||||||||||||||||
|
In connection with dividend reinvestment plan |
2,688 | — | 14 | 44 | — | — | — | 58 | ||||||||||||||||||||||||
|
In connection with 401(k) plan |
1,011 | — | 5 | 20 | — | — | — | 25 | ||||||||||||||||||||||||
100
Table of Contents
|
Shares of
Common Stock |
Preferred
Stock |
Common
Stock |
Additional
Paid-In Capital |
Retained
Earnings |
Accumulated
Other Comprehensive Income (Loss) |
Noncontrolling
Interest |
Total
Shareholders’ Equity |
|||||||||||||||||||||||||
|
In common stock offerings |
124,712 | $ | — | $ | 624 | $ | 2,014 | $ | — | $ | — | $ | — | $ | 2,638 | |||||||||||||||||
|
Redemption of preferred stock and warrant |
— | (3,134 | ) | — | (67 | ) | — | — | — | (3,201 | ) | |||||||||||||||||||||
|
Cash dividends declared on common stock, $.92 per share |
— | — | — | — | (570 | ) | — | — | (570 | ) | ||||||||||||||||||||||
|
Cash dividends accrued on preferred stock |
— | — | — | — | (73 | ) | — | — | (73 | ) | ||||||||||||||||||||||
|
Equity-based compensation expense |
— | — | — | 62 | — | — | — | 62 | ||||||||||||||||||||||||
|
Other, net |
— | 52 | — | 1 | (52 | ) | — | (18 | ) | (17 | ) | |||||||||||||||||||||
| Balance, December 31, 2009 | 689,750 | $ | — | $ | 3,449 | $ | 5,620 | $ | 7,539 | $ | (417 | ) | $ | 50 | $ | 16,241 | ||||||||||||||||
| Add (Deduct): | ||||||||||||||||||||||||||||||||
|
Comprehensive income (loss): |
||||||||||||||||||||||||||||||||
|
Net income |
— | — | — | — | 816 | — | 38 | 854 | ||||||||||||||||||||||||
|
Net change in other comprehensive income (loss) |
— | — | — | — | — | (330 | ) | — | (330 | ) | ||||||||||||||||||||||
|
Total comprehensive income (loss) (Note 13) |
— | — | — | — | 816 | (330 | ) | 38 | 524 | |||||||||||||||||||||||
|
Stock issued: |
||||||||||||||||||||||||||||||||
|
In purchase acquisitions (1) |
57 | — | — | 2 | — | — | — | 2 | ||||||||||||||||||||||||
|
In connection with stock option exercises and other employee benefits, net of cancellations |
1,667 | — | 8 | 24 | — | — | — | 32 | ||||||||||||||||||||||||
|
In connection with dividend reinvestment plan |
1,106 | — | 6 | 24 | — | — | — | 30 | ||||||||||||||||||||||||
|
In connection with 401(k) plan |
1,801 | — | 9 | 39 | — | — | — | 48 | ||||||||||||||||||||||||
|
Cash dividends declared on common stock, $.60 per share |
— | — | — | — | (416 | ) | — | — | (416 | ) | ||||||||||||||||||||||
|
Equity-based compensation expense |
— | — | — | 79 | — | — | — | 79 | ||||||||||||||||||||||||
|
Other, net |
— | — | — | (12 | ) | (4 | ) | — | (26 | ) | (42 | ) | ||||||||||||||||||||
| Balance, December 31, 2010 | 694,381 | $ | — | $ | 3,472 | $ | 5,776 | $ | 7,935 | $ | (747 | ) | $ | 62 | $ | 16,498 | ||||||||||||||||
| (1) | Includes shares issued as contingent consideration in years subsequent to the acquisition. |
The accompanying notes are an integral part of these consolidated financial statements.
101
Table of Contents
BB&T CORPORATION AND SUBSIDIARIES
Years Ended December 31, 2010, 2009 and 2008
(Dollars in millions)
| 2010 | 2009 | 2008 | ||||||||||
| Cash Flows From Operating Activities: | ||||||||||||
|
Net income |
$ | 854 | $ | 877 | $ | 1,529 | ||||||
|
Adjustments to reconcile net income to net cash provided by (used in) operating activities: |
||||||||||||
|
Provision for credit losses |
2,638 | 2,811 | 1,445 | |||||||||
|
Depreciation |
260 | 225 | 198 | |||||||||
|
Amortization of intangibles |
122 | 114 | 100 | |||||||||
|
Equity-based compensation |
79 | 62 | 75 | |||||||||
|
Discount accretion and premium amortization on long-term debt, net |
32 | 57 | 94 | |||||||||
|
Gain on sales of securities, net |
(554 | ) | (199 | ) | (107 | ) | ||||||
|
Net decrease (increase) in trading account securities |
3 | (260 | ) | 633 | ||||||||
|
Net increase in loans held for sale |
(620 | ) | (31 | ) | (591 | ) | ||||||
|
Net decrease in FDIC loss share receivable |
921 | — | — | |||||||||
|
Net writedowns on foreclosed property and other real estate held for sale |
576 | 253 | 47 | |||||||||
|
Net increase in other assets |
(2,006 | ) | (1,058 | ) | (2,264 | ) | ||||||
|
Net increase (decrease) in accounts payable and other liabilities |
689 | (3,390 | ) | 4,233 | ||||||||
|
(Increase) decrease in segregated cash due from banks |
(39 | ) | 109 | (171 | ) | |||||||
|
Other, net |
(57 | ) | (63 | ) | 132 | |||||||
|
Net cash provided by (used in) operating activities |
2,898 | (493 | ) | 5,353 | ||||||||
| Cash Flows From Investing Activities: | ||||||||||||
|
Proceeds from sales of securities available for sale |
31,334 | 17,074 | 21,044 | |||||||||
|
Proceeds from maturities, calls and paydowns of securities available for sale |
6,049 | 7,918 | 4,539 | |||||||||
|
Purchases of securities available for sale |
(26,598 | ) | (21,924 | ) | (36,234 | ) | ||||||
|
Originations and purchases of loans and leases, net of principal collected |
(4,594 | ) | (392 | ) | (7,894 | ) | ||||||
|
Net cash (paid) received for divestitures |
(832 | ) | 27 | — | ||||||||
|
Net cash (paid) acquired in business combinations |
(7 | ) | 4,475 | 311 | ||||||||
|
Purchases of premises and equipment |
(428 | ) | (174 | ) | (219 | ) | ||||||
|
Proceeds from sales of foreclosed property or other real estate held for sale |
967 | 404 | 143 | |||||||||
|
Other, net |
88 | (175 | ) | (13 | ) | |||||||
|
Net cash provided by (used in) investing activities |
5,979 | 7,233 | (18,323 | ) | ||||||||
| Cash Flows From Financing Activities: | ||||||||||||
|
Net (decrease) increase in deposits |
(6,843 | ) | (2,901 | ) | 11,325 | |||||||
|
Net (decrease) increase in federal funds purchased, securities sold under repurchase agreements and short-term borrowed funds |
(2,434 | ) | (2,756 | ) | 151 | |||||||
|
Proceeds from long-term debt |
500 | 3,758 | 5,436 | |||||||||
|
Repayment of long-term debt |
(336 | ) | (3,749 | ) | (6,867 | ) | ||||||
|
Net proceeds from common stock issued |
110 | 2,727 | 160 | |||||||||
|
Net proceeds from preferred stock issued |
— | — | 3,134 | |||||||||
|
Retirement of preferred stock and warrant |
— | (3,201 | ) | — | ||||||||
|
Cash dividends paid on common stock |
(415 | ) | (727 | ) | (1,019 | ) | ||||||
|
Cash dividends paid on preferred stock |
— | (93 | ) | — | ||||||||
|
Other, net |
277 | 111 | 273 | |||||||||
|
Net cash (used in) provided by financing activities |
(9,141 | ) | (6,831 | ) | 12,593 | |||||||
| Net Decrease in Cash and Cash Equivalents | (264 | ) | (91 | ) | (377 | ) | ||||||
| Cash and Cash Equivalents at Beginning of Year | 2,649 | 2,740 | 3,117 | |||||||||
| Cash and Cash Equivalents at End of Year | $ | 2,385 | $ | 2,649 | $ | 2,740 | ||||||
| Supplemental Disclosure of Cash Flow Information: | ||||||||||||
|
Cash paid during the year for: |
||||||||||||
|
Interest |
$ | 1,868 | $ | 2,126 | $ | 2,937 | ||||||
|
Income taxes |
972 | 431 | 730 | |||||||||
|
Noncash investing and financing activities: |
||||||||||||
|
Transfer of loans held for investment to loans held for sale |
1,604 | 731 | 668 | |||||||||
|
Transfer of loans to foreclosed property |
1,521 | 1,551 | 600 | |||||||||
|
Common stock issued in business combinations |
2 | 40 | 197 | |||||||||
The accompanying notes are an integral part of these consolidated financial statements.
102
Table of Contents
General
BB&T Corporation (“BB&T”, the “Company” or “Parent Company”) is a financial holding company organized under the laws of North Carolina. BB&T conducts operations through its principal bank subsidiary, Branch Banking and Trust Company (“Branch Bank”), a federally chartered thrift institution, BB&T Financial, FSB (“BB&T FSB”) and its nonbank subsidiaries.
The accounting and reporting policies of BB&T and its subsidiaries are in accordance with accounting principles generally accepted in the United States of America (“GAAP”). Additionally, where applicable, the policies conform to the accounting and reporting guidelines prescribed by bank regulatory authorities. The following is a summary of BB&T’s more significant accounting policies.
Nature of Operations
BB&T is a financial holding company headquartered in Winston-Salem, North Carolina. BB&T conducts its operations primarily through Branch Bank, which has branches in North Carolina, South Carolina, Virginia, Maryland, Georgia, West Virginia, Tennessee, Kentucky, Florida, Alabama, Indiana, Texas and Washington, D.C. Branch Bank provides a wide range of banking services to individuals and businesses, and offers a variety of loans to businesses and consumers. Such loans are made primarily to individuals residing in the market areas described above or to businesses located within BB&T’s geographic footprint. Branch Bank also markets a wide range of deposit services to individuals and businesses. Branch Bank offers, either directly, or through its subsidiaries, lease financing to businesses and municipal governments; factoring; discount brokerage services, annuities and mutual funds; life insurance, property and casualty insurance, health insurance and commercial general liability insurance on an agency basis and through a wholesale insurance brokerage operation; insurance premium financing; permanent financing arrangements for commercial real estate; loan servicing for third-party investors; direct consumer finance loans to individuals; trust and comprehensive wealth advisory services and association services. BB&T FSB and the direct nonbank subsidiaries of BB&T provide a variety of financial services including credit card lending, automobile lending, equipment financing, full-service securities brokerage, asset management and capital markets services.
Principles of Consolidation
The consolidated financial statements of BB&T include the accounts of BB&T Corporation and those subsidiaries that are majority owned by BB&T and over which BB&T exercises control. In consolidation, all significant intercompany accounts and transactions are eliminated. The results of operations of companies or assets acquired are included only from the dates of acquisition. All material wholly-owned and majority-owned subsidiaries are consolidated unless GAAP requires otherwise.
BB&T evaluates variable interests in entities for which voting interests are not an effective means of identifying controlling financial interests. Variable interests are those in which the value of the interest changes with the fair value of the net assets of the entity exclusive of variable interests. If the results of the evaluation indicate the existence of a primary beneficiary and the entity does not effectively disperse risks among the parties involved, that primary beneficiary is required to consolidate the entity. Likewise, if the evaluation indicates that the requirements for consolidation are not met and the entity has previously been consolidated, then the entity would be deconsolidated.
BB&T has variable interests in certain entities that were not required to be consolidated, including affordable housing partnership interests, historic tax credit partnerships and other partnership interests. Please refer to Note 16 for additional disclosures regarding BB&T’s significant variable interest entities.
BB&T accounts for unconsolidated partnership investments using the equity method of accounting. In addition to affordable housing partnerships, which represent the majority of unconsolidated investments in variable interest entities, BB&T also has investments and future funding commitments to venture capital and other entities. The maximum potential exposure to losses relative to investments in variable interest entities is
103
Table of Contents
generally limited to the sum of the outstanding balance, future funding commitments and any related loans to the entity. Loans to these entities are underwritten in substantially the same manner as are other loans and are generally secured.
BB&T has investments in certain entities for which BB&T does not have the controlling interest. For these investments, the Company records its interest using the equity method with its portion of income or loss being recorded in other noninterest income in the Consolidated Statements of Income. BB&T periodically evaluates these investments for impairment.
Reclassifications
Investments in Federal Home Loan Bank (“FHLB”) stock have been reclassified from securities available for sale to other assets in all periods presented. In certain other instances, amounts reported in prior years’ consolidated financial statements have been reclassified to conform to the current presentation. Such reclassifications had no effect on previously reported cash flows, shareholders’ equity or net income.
Use of Estimates in the Preparation of Financial Statements
The preparation of financial statements in conformity with accounting principles generally accepted in the United States of America requires management to make estimates and assumptions that affect the reported amounts of assets and liabilities and disclosure of contingent assets and liabilities as of the date of the financial statements and the reported amounts of revenues and expenses during the reporting periods. Actual results could differ from those estimates. Material estimates that are particularly susceptible to significant change include the determination of the allowance for loan and lease losses and the reserve for unfunded lending commitments, determination of fair value for financial instruments, valuation of goodwill, intangible assets and other purchase accounting related adjustments, benefit plan obligations and expenses, and tax assets, liabilities and expense.
Business Combinations
BB&T accounts for all business combinations using the acquisition method of accounting. Under this method of accounting, the accounts of an acquired entity are included with the acquirer’s accounts as of the date of acquisition with any excess of purchase price over the fair value of the net assets acquired (including identifiable intangibles) capitalized as goodwill.
To consummate an acquisition, BB&T typically issues common stock and/or pays cash, depending on the terms of the acquisition agreement. For acquisitions that occurred prior to January 1, 2009, the value of common shares issued was determined based on the market price of the securities issued over a reasonable period of time, not to exceed three days before and three days after the measurement date. For acquisitions occurring after December 31, 2008, the value of common shares issued is based upon the market price of the stock as of the closing of the acquisition.
In connection with mergers and acquisitions, BB&T typically issues options to purchase shares of its common stock in exchange for options outstanding of the acquired entities at the time the merger is completed. To the extent vested, the options are considered to be part of the purchase price paid. There is no change in the aggregate intrinsic value of the options issued compared to the intrinsic value of the options held immediately before the exchange, nor does the ratio of the exercise price per option to the market value per share change.
Cash and Cash Equivalents
Cash and cash equivalents include cash and due from banks, interest-bearing deposits with banks, Federal funds sold and securities purchased under resale agreements or similar arrangements. Cash and cash equivalents have maturities of three months or less. Accordingly, the carrying amount of such instruments is considered a reasonable estimate of fair value.
104
Table of Contents
Securities
At the date of purchase, BB&T classifies marketable investment securities as held to maturity, available for sale or trading. Interest income and dividends on securities are recognized in interest income on an accrual basis. Premiums and discounts on debt securities are amortized as an adjustment to interest income using the interest method.
Debt securities acquired where BB&T has both the intent and ability to hold to maturity are classified as held to maturity and reported at amortized cost.
Debt securities, which may be sold to meet liquidity needs arising from unanticipated deposit and loan fluctuations, changes in regulatory capital requirements, or unforeseen changes in market conditions, are classified as available for sale. Securities available for sale are reported at estimated fair value, with unrealized gains and losses reported as accumulated other comprehensive income or loss, net of deferred income taxes, in the shareholders’ equity section of the Consolidated Balance Sheets. Gains or losses realized from the sale of securities available for sale are determined by specific identification and are included in noninterest income.
BB&T evaluates each held to maturity and available-for-sale security in a loss position for other-than-temporary impairment. In its evaluation BB&T considers such factors as the length of time and the extent to which the market value has been below cost, long term expectations and recent experience regarding principal and interest payments, and BB&T’s intent to sell and whether it is more likely than not that the Company would be required to sell those securities before the anticipated recovery of the amortized cost basis. Beginning in 2009, in accordance with new accounting guidance for impairments of debt securities that are deemed to be other-than-temporary, the credit component of an other-than-temporary impairment loss is recognized in earnings and the non-credit component is recognized in accumulated other comprehensive income in situations where BB&T does not intend to sell the security and it is more-likely-than-not that BB&T will not be required to sell the security prior to recovery. Prior to January 1, 2009, unrealized losses (both the credit and non-credit components) on available-for-sale debt securities that were deemed to be other-than-temporary were included in current period earnings.
Trading account securities, which include both debt and equity securities, are reported at fair value. Unrealized market value adjustments, fees, and realized gains or losses from trading account activities (determined by specific identification) are included in noninterest income. Interest income on trading account securities is included in interest and dividends from securities.
Loans Held for Sale
BB&T accounts for new originations of prime residential mortgage and commercial mortgage loans held for sale at fair value. BB&T accounts for the derivatives used to economically hedge the loans held for sale at fair value. Held for investment loans that have been transferred to loans held for sale are carried at the lower of cost or market because these loans are not exchanged in an active market and BB&T does not hedge these assets.
The value for loans held for sale carried at fair value is primarily based on quoted market prices for securities backed by similar types of loans. Direct loan origination fees and costs related to loans held for sale and accounted for at fair value are not capitalized and recognized in earnings upon the sale of such loans, but rather are recorded as mortgage banking income in the case of the direct loan origination fees and primarily personnel expense in the case of the direct loan origination costs. Gains and losses on sales of mortgage loans are included in mortgage banking income. Gains and losses on sales of commercial loans held for sale are included in other noninterest income.
Loans and Leases
The Company’s accounting methods for loans differ depending on whether the loans are originated or acquired as a result of a business acquisition or purchased at a discount as a result of credit deterioration since the date of origination.
105
Table of Contents
Originated Loans and Leases
Loans and leases that management has the intent and ability to hold for the foreseeable future are reported at their outstanding principal balances net of any unearned income, charge-offs, unamortized fees and costs on originated loans and unamortized premiums or discounts on purchased loans. The net amount of nonrefundable loan origination fees and certain direct costs associated with the lending process are deferred and amortized to interest income over the contractual lives of the loans using methods which approximate the interest method. Discounts and premiums are amortized or accreted to interest income over the estimated life of the loans using methods that approximate the interest method. Commercial loans and substantially all installment loans accrue interest on the unpaid balance of the loans.
Lease receivables consist primarily of investments in leveraged lease transactions and direct financing leases on rolling stock, equipment and real property. Direct financing lease receivables are stated at the total amount of future minimum lease payments receivable plus estimated residual values and initial direct costs, less unearned income. Leveraged leases are also carried net of non-recourse debt. Income is recognized over the lives of the lease contracts using the interest method. BB&T also enters into operating leases as lessor. Operating lease equipment is carried at cost less accumulated depreciation and is depreciated to the estimated residual value using the straight-line method over the lesser of the lease term or projected economic life of the equipment. BB&T estimates the residual value at the inception of each lease. In addition, BB&T reviews residual values at least annually, and monitors the residual realizations at the end of the lease term. If the review of the estimated residual values indicates potential impairment and this decline is other-than-temporary, such impairment is recognized in current period earnings. Estimated residual values are evaluated using information that includes both internal and external appraisals and historical residual realization experience.
BB&T classifies all loans and leases past due when the payment of principal and interest based upon contractual terms is greater than 30 days delinquent. Charge-offs on commercial loans are recorded when available information confirms the loan is not fully collectible and the loss is reasonably quantifiable. Consumer loans are subject to mandatory charge-off at a specified delinquency date consistent with regulatory guidelines.
Purchased Loans
Loans acquired in a business acquisition after December 31, 2008 are recorded at their fair value at the acquisition date. Credit discounts are included in the determination of fair value; therefore, an allowance for loan losses is not recorded at the acquisition date.
In determining the acquisition date fair value of purchased loans, and in subsequent accounting, BB&T generally aggregates purchased loans into pools of loans with common risk characteristics. Expected cash flows at the acquisition date in excess of the fair value of loans are recorded as interest income over the life of the loans using a level yield method if the timing and amount of the future cash flows of the pool is reasonably estimable. Subsequent to the acquisition date, increases in cash flows over those expected at the acquisition date are recognized as interest income prospectively. Decreases in expected cash flows after the acquisition date are recognized by recording an allowance for loan losses.
Nonperforming Assets
Nonperforming assets include nonaccrual loans and leases and foreclosed property. Foreclosed property consists of real estate and other assets acquired as a result of customers’ loan defaults. BB&T’s policies related to when loans are placed on nonaccrual status conform to guidelines prescribed by bank regulatory authorities. The majority of commercial loans and leases are placed on nonaccrual status when it is probable that principal or interest is not fully collectible, or generally when principal or interest becomes 90 days past due, whichever occurs first. Specialized lending loans, which includes both consumer and commercial specialized lending loans, are placed on nonaccrual status generally when principal and interest becomes 90 days past due. Direct retail loans, mortgage and sales finance loans are placed on nonaccrual status at varying intervals, based on the type of product, generally when principal and interest becomes between 90 days and 180 days past due. Revolving credit loans are not placed on nonaccrual but are charged-off after they become 150 days past due, with unpaid fees and finance charges reversed against interest income.
Certain loans past due 90 days or more may remain on accrual status if management determines that it does not have concern over the collectibility of principal and interest. Generally, when loans are placed on nonaccrual status, accrued interest receivable is reversed against interest income in the current period. Interest payments
106
Table of Contents
received thereafter are applied as a reduction to the remaining principal balance as long as concern exists as to the ultimate collection of the principal. Loans and leases are generally removed from nonaccrual status when they become current as to both principal and interest and concern no longer exists as to the collectability of principal and interest.
Assets acquired as a result of foreclosure are carried at the lower of cost or net realizable value. Net realizable value equals fair value less estimated selling costs. Cost is determined based on the sum of unpaid principal, accrued but unpaid interest if not required to be reversed, and acquisition costs associated with the loan. Any excess of cost over net realizable value at the time of foreclosure is charged to the allowance for loan and lease losses. Generally, such properties are valued periodically and if the carrying value is greater than the net realizable value, a valuation reserve is established. Routine maintenance costs, declines in market value and net losses on disposal are included in other noninterest expense.
Restructurings
Troubled debt restructurings (“restructurings”) can involve loans remaining on nonaccrual, moving to nonaccrual, or continuing on accruing status, depending on the individual facts and circumstances of the borrower. In circumstances where the restructuring involves charging off a portion of the loan balance, BB&T typically classifies these restructurings as nonaccrual.
In connection with commercial restructurings, the decision to maintain a loan that has been restructured on accrual status is based on a current, well documented credit evaluation of the borrower’s financial condition and prospects for repayment under the modified terms. This evaluation includes consideration of the borrower’s current capacity to pay, which among other things may include a review of the borrower’s current financial statements, an analysis of global cash flow sufficient to pay all debt obligations, and an evaluation of secondary sources of payment from the client and any guarantors. This evaluation also includes an evaluation of the borrower’s current willingness to pay, which may include a review of past payment history, an evaluation of the borrower’s willingness to provide information on a timely basis, and consideration of offers from the borrower to provide additional collateral or guarantor support. The credit evaluation also reflects consideration of the borrower’s future capacity and willingness to pay, which may include evaluation of cash flow projections, consideration of the adequacy of collateral to cover all principal and interest and trends indicating improving profitability and collectability of receivables.
The evaluation of mortgage and consumer loans includes an evaluation of the client’s debt to income ratio, credit report, property value, loan vintage, and certain other client-specific factors that have impacted their ability to make timely principal and interest payments on the loan.
Restructured nonaccrual loans may be returned to accrual status based on a current, well-documented credit evaluation of the borrower’s financial condition and prospects for repayment under the modified terms. This evaluation must include consideration of the borrower’s sustained historical repayment performance for a reasonable period (generally a minimum of six months) prior to the date on which the loan is returned to accrual status. Sustained historical repayment performance for a reasonable time prior to the restructuring may be taken into account. In connection with retail restructurings, a nonperforming loan will be returned to accruing status when current as to principal and interest and upon a sustained historical repayment performance (generally a minimum of six months).
Allowance for Loan and Lease Losses and Reserve for Unfunded Lending Commitments
The allowance for loan and lease losses and reserve for unfunded lending commitments are management’s best estimate of probable credit losses inherent in the loan and lease portfolios and off-balance sheet lending commitments at the balance sheet date. The Company determines the allowance for loan and lease losses and the reserve for unfunded lending commitments based on an ongoing evaluation. This evaluation is inherently subjective because it requires material estimates, including the amounts and timing of cash flows expected to be received on impaired loans. Those estimates are susceptible to significant change. Changes to the allowance for loan and lease losses and the reserve for unfunded lending commitments are made by charges to the provision for credit losses, which is reflected in the Consolidated Statements of Income. Loans or lease balances deemed to be uncollectible are charged off against the allowance for loan and lease losses. Recoveries of amounts previously charged-off are credited to the allowance for loan and lease losses. The methodology used to determine the
107
Table of Contents
reserve for unfunded lending commitments is inherently similar to that used to determine the collective component of the allowance for loan and lease losses described above, adjusted for factors specific to binding commitments, including the probability of funding and exposure at default. While management uses the best information available to establish the allowance for loan and lease losses and the reserve for unfunded lending commitments, future adjustments may be necessary if economic conditions differ substantially from the assumptions used in computing the allowance or, if required by regulators, based upon information available to them at the time of their examinations.
Accounting standards require the presentation of certain disclosure information at the portfolio segment level, which represents the level at which an entity develops and documents a systematic methodology to determine its allowance for credit losses. BB&T concluded that its loan and lease portfolio comprises three portfolio segments; commercial, retail and covered and other acquired. The commercial portfolio segment includes commercial real estate, commercial and industrial (“C&I”) and certain specialized lending loans, and was identified based on the risk-based approach used to estimate the allowance for loan and lease losses for the vast majority of these loans. The retail portfolio segment includes direct retail lending, revolving credit, mortgage, sales finance and certain retail-oriented specialized lending loans, and was identified based on the delinquency-based approach used to estimate the allowance for these loans. The covered and other acquired portfolio segment was identified based on the expected cash flows approach used to estimate the allowance related to loans acquired subsequent to December 31, 2008.
A portion of the Corporation’s allowance for loan and lease losses is not allocated to any specific category of loans. This unallocated portion of the allowance reflects management’s best estimate of the elements of imprecision and estimation risk inherent in the calculation of the overall allowance. Due to the subjectivity involved in determining the overall allowance, including the unallocated portion, the portion considered unallocated may fluctuate from period to period based on management’s evaluation of the factors affecting the assumptions used in calculating the allowance, including historical loss experience, current economic conditions, industry or borrower concentrations and the status of merged institutions. The unallocated portion of the allowance is available to absorb losses on any loan category or lending-related commitment. Management evaluates the adequacy of the allowance for loan and lease losses based on the combined total of the allocated and unallocated components.
The following provides a description of BB&T’s accounting policies and methodologies related to each of its portfolio segments:
Commercial
The vast majority of loans in the commercial lending portfolio are assigned risk grades based on an assessment of conditions that affect the borrower’s ability to meet contractual obligations under the loan agreement. This process includes reviewing borrowers’ financial information, historical payment experience, credit documentation, public information, and other information specific to each borrower. Risk grades are reviewed on an annual basis for all credit relationships with total credit exposure of $1 million or more, or at any point management becomes aware of information affecting the borrower’s ability to fulfill their obligations. For commercial clients where total credit exposure is less than $1 million, BB&T has developed an automated loan review system to identify and proactively manage accounts with a higher risk of loss. The “score” produced by this automated system is updated monthly.
On a quarterly basis, BB&T reviews all commercial lending relationships with outstanding debt of $2 million or more that have been classified as substandard or doubtful. While this review is largely focused on the borrower’s ability to repay the loan, BB&T also considers the capacity and willingness of a loan’s guarantors to support the debt service on the loan as a secondary source of repayment. When a guarantor exhibits the documented capacity and willingness to support the loan, BB&T may consider extending the loan maturity and/or temporarily deferring principal payments if the ultimate collection of both principal and interest is not in question. In these cases, BB&T may not deem the loan to be impaired due to the documented capacity and willingness of the guarantor to repay the loan. Loans are considered impaired when the borrower (or guarantor in certain circumstances) does not have the cash flow capacity or willingness to service the debt according to contractual terms, or it does not appear reasonable to assume that the borrower will continue to pay according to the contractual agreement. BB&T establishes a specific reserve for each loan that has been deemed impaired based on the criteria outlined above. The amount of the reserve is based on the present value of expected cash
108
Table of Contents
flows discounted at the loan’s effective interest rate, and/or the value of collateral. BB&T has also established a review process related to restructurings and other impaired loans that are in commercial lending relationships with outstanding debt of less than $2 million at the balance sheet date. In connection with this process, BB&T establishes reserves related to these loans that are calculated using an expected cash flow approach.
BB&T also maintains reserves for collective impairment that reflect an estimate of losses related to nonimpaired commercial loans as of the balance sheet date. Embedded loss estimates for BB&T’s commercial loan portfolio are based on estimated migration rates, which are estimated based on historical experience, and current risk mix as indicated by the risk grading process described above. Embedded loss estimates may be adjusted to reflect current economic conditions and current portfolio trends including credit quality, concentrations, aging of the portfolio, and significant policy and underwriting changes.
Retail
The majority of the allowance for loan and lease losses related to the retail lending portfolio is calculated on a collective basis using a delinquency-based approach. Embedded loss estimates for BB&T’s retail lending portfolio are based on estimated migration rates that are developed based on historical experience, and current risk mix as indicated by prevailing delinquency rates. These estimates may be adjusted to reflect current economic conditions and current portfolio trends. The remaining portion of the allowance related to the retail lending portfolio relates to loans that have been deemed impaired based on their classification as a restructuring at the balance sheet date. BB&T establishes specific reserves related to these restructured loans using an expected cash flow approach.
Acquired Loans
For loans acquired in a business combination after December 31, 2008, BB&T has generally aggregated the purchased loans into pools of loans with common risk characteristics. In determining the allowance for loan and lease losses, BB&T performs an analysis each period to estimate the expected cash flows for each of the loan pools. To the extent that the expected cash flows of a loan pool have decreased since the acquisition date, BB&T establishes an allowance for loan losses.
Covered Assets and Related FDIC Loss Share Receivable
Assets subject to loss sharing agreements with the Federal Deposit Insurance Corporation (“FDIC”) are labeled “covered” on the balance sheet and include certain loans, securities and other assets.
The fair value of the reimbursement the Company expected to receive from the FDIC under those agreements was recorded in the FDIC loss share receivable at the date of acquisition on the Consolidated Balance Sheets. The fair value of the FDIC loss share receivable was estimated using a discounted cash flow methodology. The discount rate used in this calculation is determined using a risk-free yield curve plus a premium reflecting the uncertainty related to the timing of cash flows. The income statement effects of the FDIC loss share receivable is included in noninterest income and includes the accretion due to discounting and changes in expected reimbursements. Decreases in expected reimbursements are recognized in income prospectively consistent with the approach taken to recognize increases in cash flows on covered loans. Increases in expected reimbursements are recognized in income in the same period that the allowance for credit losses for the related loans is recognized.
Premises and Equipment
Premises, equipment, capital leases and leasehold improvements are stated at cost less accumulated depreciation or amortization. Land is stated at cost. In addition, purchased software and costs of computer software developed for internal use are capitalized provided certain criteria are met. Depreciation and amortization are computed principally using the straight-line method over the estimated useful lives of the related assets. Leasehold improvements are amortized on a straight-line basis over the lesser of the lease terms, including certain renewals that were deemed probable at lease inception, or the estimated useful lives of the improvements. Capitalized leases are amortized by the same methods as premises and equipment over the estimated useful lives or lease terms, whichever is less. Obligations under capital leases are amortized using the interest method to allocate payments between principal reduction and interest expense. Rent expense and rental income on operating leases is recorded using the straight-line method over the appropriate lease terms.
109
Table of Contents
Securities Sold Under Repurchase Agreements
Securities sold under repurchase agreements generally have maturities ranging from 1 day to 36 months. Securities sold under agreements to repurchase are reflected as collateralized borrowings on the Consolidated Balance Sheets and are record based on the amount of cash received in connection with the borrowing. The terms of repurchase agreements may require BB&T to provide additional collateral if the fair value of the securities underlying the borrowings declines during the term of the agreement.
Income Taxes
Deferred income taxes have been provided when different accounting methods have been used in determining income for income tax purposes and for financial reporting purposes. Deferred tax assets and liabilities are recognized based on future tax consequences attributable to differences arising from the financial statement carrying values of assets and liabilities and their tax bases. In the event of changes in the tax laws, deferred tax assets and liabilities are adjusted in the period of the enactment of those changes, with the cumulative effects included in the current year’s income tax provision.
Derivative Financial Instruments
A derivative is a financial instrument that derives its cash flows, and therefore its value, by reference to an underlying instrument, index or referenced interest rate. These instruments include interest rate swaps, caps, floors, collars, financial forwards and futures contracts, swaptions, when-issued securities, foreign exchange contracts and options written and purchased. BB&T uses derivatives primarily to manage economic risk related to securities, commercial loans, mortgage servicing rights and mortgage banking operations, Federal funds purchased, other time deposits, long-term debt and institutional certificates of deposit. BB&T also uses derivatives to facilitate transactions on behalf of its clients. The fair value of derivatives in a gain or loss position is included in other assets or liabilities, respectively, on the Consolidated Balance Sheets.
BB&T classifies its derivative financial instruments as either (1) a hedge of an exposure to changes in the fair value of a recorded asset or liability (“fair value hedge”), (2) a hedge of an exposure to changes in the cash flows of a recognized asset, liability or forecasted transaction (“cash flow hedge”), (3) a hedge of a net investment in a subsidiary, or (4) derivatives not designated as hedges. Changes in the fair value of derivatives not designated as hedges are recognized in current period earnings. BB&T has master netting agreements with the derivatives dealers with which it does business, but reflects gross gains and losses on the Consolidated Balance Sheets.
BB&T uses the long-haul method to assess hedge effectiveness. BB&T documents, both at inception and over the life of the hedge, at least quarterly, its analysis of actual and expected hedge effectiveness. This analysis includes techniques such as regression analysis and hypothetical derivatives to demonstrate that the hedge has been, and is expected to be, highly effective in off-setting corresponding changes in the fair value or cash flows of the hedged item. For cash flow hedges involving interest rate caps and collars, this analysis also includes consideration whether critical terms match, the strike price of the hedging option matches the specified level beyond (or within) which the entity’s exposure is being hedged, the hedging instrument’s inflows (outflows) at its maturity date completely offset the change in the hedged transaction’s cash flows for the risk being hedged and the hedging instrument can be exercised only on its contractual maturity date. For a qualifying fair value hedge, changes in the value of the derivatives that have been highly effective as hedges are recognized in current period earnings along with the corresponding changes in the fair value of the designated hedged item attributable to the risk being hedged. For a qualifying cash flow hedge, the portion of changes in the fair value of the derivatives that have been highly effective are recognized in other comprehensive income until the related cash flows from the hedged item are recognized in earnings. For qualifying cash flow hedges involving interest rate caps and collars, the initial fair value of the premium paid is allocated and recognized in the same future period that the hedged forecasted transaction impacts earnings.
For either fair value hedges or cash flow hedges, ineffectiveness may be recognized in noninterest income to the extent that changes in the value of the derivative instruments do not perfectly offset changes in the value of the hedged items. If the hedge ceases to be highly effective, BB&T discontinues hedge accounting and recognizes the changes in fair value in current period earnings. If a derivative that qualifies as a fair value or cash flow hedge is terminated or the designation removed, the realized or then unrealized gain or loss is recognized into income over the original hedge period (fair value hedge) or period in which the hedged item affects earnings (cash flow hedge). Immediate recognition in earnings is required upon sale or extinguishment of the hedged item (fair value hedge) or if it is probable that the hedged cash flows will not occur (cash flow hedge).
110
Table of Contents
Derivatives used to manage economic risk not designated as hedges primarily represent economic risk management instruments of mortgage servicing rights and mortgage banking operations, with gains or losses included in mortgage banking income. In connection with its mortgage banking activities, BB&T enters into loan commitments to fund residential mortgage loans at specified rates and for specified periods of time. To the extent that BB&T’s interest rate lock commitments relate to loans that will be held for sale upon funding, they are also accounted for as derivatives, with gains or losses included in mortgage banking income. Gains and losses on other derivatives used to manage economic risk are primarily associated with client derivative activity and included in other income.
Per Share Data
Basic net income per common share is computed by dividing net income available to common shareholders by the weighted average number of shares of common stock outstanding during the years presented. Diluted net income per common share is computed by dividing net income available to common shareholders by the weighted average number of shares of common stock, common stock equivalents and other potentially dilutive securities outstanding.
Goodwill and Other Intangible Assets
Goodwill represents the cost in excess of the fair value of net assets acquired (including identifiable intangibles) in transactions accounted for as acquisitions. BB&T allocates goodwill to the reporting unit(s) that receives significant benefits from the acquisition. Goodwill is not amortized over an estimated useful life, but rather is tested at least annually for impairment. BB&T performs its impairment testing in the fourth quarter of each year and more frequently if circumstances exist that indicate a possible reduction in the fair value of the business below its carrying value. BB&T measures impairment using the present value of estimated future cash flows. The analysis is based upon available information regarding expected future cash flows and discount rates. Discount rates are based upon the cost of capital specific to the industry in which the reporting unit operates. If the carrying value of the reporting unit exceeds its fair value, a second analysis is performed to measure the fair value of all assets and liabilities. If, based on the second analysis, it is determined that the fair value of the assets and liabilities of the reporting unit is less than the carrying value, BB&T would recognize impairment for the excess of carrying value over fair value.
Core deposit and other intangible assets include premiums paid for acquisitions of core deposits (“core deposit intangibles”) and other identifiable intangible assets. Intangible assets other than goodwill, which are determined to have finite lives, are amortized based upon the estimated economic benefits received.
Loan Securitizations
BB&T enters into loan securitization transactions related to most of its fixed-rate conforming mortgage loans. In connection with these transactions, loans are converted into mortgage-backed securities issued primarily by the Federal Home Loan Mortgage Corporation (“Freddie Mac”), the Federal National Mortgage Association (“Fannie Mae”) and the Government National Mortgage Association (“Ginnie Mae”), and are subsequently sold to third party investors. BB&T records loan securitizations as a sale when the transferred loans are legally isolated from its creditors and the other accounting criteria for a sale are met. Gains or losses recorded on loan securitizations are based in part on the net carrying amount of the loans sold, which is allocated between the loans sold and retained interests based on their relative fair values at the date of sale. BB&T generally retains the mortgage servicing on loans sold. Since quoted market prices are not typically available, BB&T estimates the fair value of these retained interests using modeling techniques to determine the net present value of expected future cash flows. Such models incorporate management’s best estimates of key variables, such as prepayment speeds and discount rates that would be used by market participants based on the risks involved. Gains and losses incurred on loans sold to third party investors are included in mortgage banking income in the Consolidated Statements of Income.
BB&T also periodically securitizes mortgage loans that it intends to hold for the foreseeable future and transfers the resulting securities to the securities available for sale portfolio. This is generally accomplished by exchanging the loans for mortgage-backed securities issued primarily by Freddie Mac. Since the transfers are not considered a sale, no gain or loss is recorded in conjunction with these transactions.
111
Table of Contents
Mortgage Servicing Rights
BB&T has two primary classes of mortgage servicing rights for which it separately manages the economic risks: residential and commercial. Residential mortgage servicing rights are recorded on the Consolidated Balance Sheets primarily at fair value with changes in fair value recorded as a component of mortgage banking income each period. Commercial mortgage servicing rights are recorded as other assets on the Consolidated Balance Sheets at the lower of cost or market and are amortized in proportion to, and over the estimated period, that net servicing income is expected to be received based on projections of the amount and timing of estimated future net cash flows. The amount and timing of estimated future net cash flows are updated based on actual results and updated projections. BB&T periodically evaluates its commercial mortgage servicing rights for impairment.
Equity-Based Compensation
BB&T maintains various equity-based compensation plans. These plans provide for the granting of stock options (incentive and nonqualified), stock appreciation rights, restricted stock, restricted stock units, performance units and performance shares to selected BB&T employees and directors. BB&T values share-based awards at the grant date fair value and recognizes the expense over the requisite service period taking into account retirement eligibility.
Changes in Accounting Principles and Effects of New Accounting Pronouncements
In June 2009, the Financial Accounting Standards Board (“FASB”) issued new guidance impacting Transfers and Servicing . The objective of this guidance is to improve the relevance, representational faithfulness, and comparability of the information that a reporting entity provides in its financial reports about a transfer of financial assets; the effects of a transfer on its financial position, financial performance, and cash flows; and a transferor’s continuing involvement in transferred financial assets. This guidance is effective for financial asset transfers occurring after December 31, 2009. The adoption of this guidance was not material to BB&T’s consolidated financial statements.
In June 2009, the FASB issued new guidance impacting Consolidation of variable interest entities. The objective of this guidance is to improve financial reporting by enterprises involved with variable interest entities and to provide more relevant and reliable information to users of financial statements. This guidance was effective as of January 1, 2010. The adoption of this guidance was not material to BB&T’s consolidated financial statements.
In February 2010, the FASB issued new guidance impacting Fair Value Measurements and Disclosures . The new guidance requires a gross presentation of purchases and sales of Level 3 activities and adds a new requirement to disclose transfers in and out of Level 1 and Level 2 measurements. The guidance related to the transfers between Level 1 and Level 2 measurements was effective for BB&T on January 1, 2010. The guidance that requires increased disaggregation of the level 3 activities is effective for BB&T on January 1, 2011. The new disclosures required by this guidance are included in Note 19 to these consolidated financial statements.
In March 2010, the FASB issued new guidance impacting Receivables . The new guidance clarifies that a modification to a loan that is part of a pool of loans that were acquired with deteriorated credit quality should not result in the removal of the loan from the pool. This guidance is effective for any modifications of loans accounted for within a pool in the first interim or annual reporting period ending after July 15, 2010. The adoption of this guidance was not material to BB&T’s consolidated financial statements.
In July 2010, the FASB issued new guidance impacting Receivables . The new guidance requires additional disclosures that will allow users to understand the nature of credit risk inherent in a company’s loan portfolios, how that risk is analyzed and assessed in arriving at the allowance for loan and lease losses, and changes and reasons for those changes in the allowance for loan and lease losses. The new disclosures that relate to information as of the end of the reporting period are required as of December 31, 2010. The disclosures related to activity that occurs during a reporting period are effective for reporting periods beginning on or after December 15, 2010, except for the disclosure requirements relating to troubled debt restructurings, which have been indefinitely delayed pending the outcome of the FASB’s deliberations related to the definition of a troubled debt restructuring.
112
Table of Contents
Financial Institution Acquisitions
Colonial Bank
On August 14, 2009, Branch Bank entered into a purchase and assumption agreement with the Federal Deposit Insurance Corporation (“FDIC”) to acquire certain assets and assume substantially all of the deposits and certain liabilities of Colonial Bank, an Alabama state-chartered bank headquartered in Montgomery, Alabama (“Colonial”). Colonial operated 357 locations in Florida, Alabama, Georgia, Texas and Nevada. Excluding the effects of purchase accounting adjustments, Branch Bank assumed approximately $19.2 billion of the deposits of Colonial. Additionally, Branch Bank purchased approximately $14.3 billion in loans, $165 million of other real estate owned (“OREO”) and $3.7 billion of investment securities. Including subsequent adjustments and the sale of Nevada deposits, approximately $484 million of goodwill and $170 million of identifiable intangibles were recorded in connection with the Colonial acquisition.
Branch Bank did not immediately acquire the real estate, banking facilities, furniture or equipment of Colonial as part of the purchase and assumption agreement. However, under the terms of the agreement, Branch Bank had the option through February 1, 2010 to acquire these assets from the FDIC at their fair market value as of the acquisition date. Prior to the exercise of this option, these banking facilities and equipment were leased from the FDIC on a month-to-month basis. During 2010, Branch Bank purchased real estate, banking facilities, furniture and equipment from the FDIC at a cost of approximately $210 million.
Branch Bank also had an option through February 1, 2010 to assume or repudiate certain lease agreements of Colonial. The repudiation or assumption of these lease agreements was finalized prior to the expiration of this option. The process to determine the fair value of the assumed lease obligations continued into the second quarter of 2010 during which BB&T recorded approximately $28 million of capital leases.
On January 15, 2010, BB&T sold certain Nevada branch locations and approximately $850 million in deposits that were acquired from Colonial.
In connection with the Colonial acquisition, Branch Bank entered into loss sharing agreements with the FDIC related to certain assets acquired. The terms of the loss sharing agreements are described in Note 16.
Haven Trust Bank
On December 12, 2008, BB&T acquired all the deposits and $61 million in assets of Haven Trust Bank of Duluth, Georgia through an agreement with the FDIC. Haven Trust Bank operated four branches with approximately $506 million in deposits.
Insurance and Other Non-bank Acquisitions
During 2009, BB&T acquired certain assets of an insurance premium finance business, one insurance agency and two commercial real estate servicing businesses. Including subsequent adjustments, approximately $38 million of goodwill and $26 million of identifiable intangibles were recorded in connection with these acquisitions. During 2008, BB&T acquired eleven insurance businesses and one nonbank financial services company. Including subsequent adjustments, approximately $252 million in goodwill and $155 million of identifiable intangible assets were recorded in connection with these transactions.
Merger and acquisition agreements of businesses other than financial institutions occasionally include additional incentives to the acquired entities to offset the loss of future cash flows previously received through ownership positions. Typically, these incentives are based on the acquired entity’s contribution to BB&T’s earnings compared to agreed-upon amounts. For transactions that occurred prior to January 1, 2009, such incentives will be charged to goodwill based on the terms of the agreement. When offered, these incentives are typically issued for terms of three to five years. As certain provisions of these agreements do not specify dollar limitations, it is not possible to quantify the maximum exposure resulting from these agreements.
113
Table of Contents
Merger-Related and Restructuring Activities
BB&T has incurred certain merger-related and restructuring expenses. Merger-related and restructuring expenses or credits include: severance and personnel-related costs or credits, which typically occur in corporate support and data processing functions; occupancy and equipment charges or credits, which relate to costs or gains associated with lease terminations, obsolete equipment write-offs, and the sale of duplicate facilities and equipment; and other merger-related and restructuring charges or credits, which include expenses necessary to convert and combine the acquired branches and operations of merged companies, direct media advertising related to the acquisitions, asset and supply inventory write-offs, investment banking advisory fees, and other similar charges. Merger-related and restructuring charges during 2010, 2009 and 2008 were $69 million, $38 million and $15 million, respectively.
At December 31, 2010 and 2009, there were $10 million and $15 million, respectively, of merger-related and restructuring accruals. Merger-related and restructuring accruals are established when the costs are incurred or once all requirements for a plan to dispose of certain business functions have been approved by management. In general, a major portion of accrued costs are utilized in conjunction with or immediately following the systems conversion, when most of the duplicate positions are eliminated and the terminated employees begin to receive severance. Other accruals are utilized over time based on the sale, closing or disposal of duplicate facilities or equipment or the expiration of lease contracts. Merger and restructuring accruals are re-evaluated periodically and adjusted as necessary. The remaining accruals at December 31, 2010 are expected to be utilized during 2011, unless they relate to specific contracts that expire in later years.
The amortized cost and approximate fair values of securities available for sale were as follows:
| December 31, 2010 | ||||||||||||||||
|
Amortized
Cost |
Gross
Unrealized |
Fair Value | ||||||||||||||
| Gains | Losses | |||||||||||||||
| (Dollars in millions) | ||||||||||||||||
| Securities available for sale: | ||||||||||||||||
|
U.S. government-sponsored entities (GSE) |
$ | 102 | $ | 1 | $ | — | $ | 103 | ||||||||
|
Mortgage-backed securities issued by GSE |
18,663 | 42 | 361 | 18,344 | ||||||||||||
|
States and political subdivisions |
2,051 | 19 | 161 | 1,909 | ||||||||||||
|
Non-agency mortgage-backed securities |
635 | — | 120 | 515 | ||||||||||||
|
Equity and other securities |
734 | 27 | 2 | 759 | ||||||||||||
|
Covered securities |
1,234 | 307 | 2 | 1,539 | ||||||||||||
|
Total securities available for sale |
$ | 23,419 | $ | 396 | $ | 646 | $ | 23,169 | ||||||||
| December 31, 2009 | ||||||||||||||||
|
Amortized
Cost |
Gross
Unrealized |
Fair Value | ||||||||||||||
| Gains | Losses | |||||||||||||||
| (Dollars in millions) | ||||||||||||||||
| Securities available for sale: | ||||||||||||||||
|
U.S. government-sponsored entities (GSE) |
$ | 2,090 | 5 | $ | 60 | $ | 2,035 | |||||||||
|
Mortgage-backed securities issued by GSE |
26,649 | 231 | 210 | 26,670 | ||||||||||||
|
States and political subdivisions |
2,176 | 56 | 125 | 2,107 | ||||||||||||
|
Non-agency mortgage-backed securities |
1,339 | — | 317 | 1,022 | ||||||||||||
|
Equity and other securities |
196 | 22 | — | 218 | ||||||||||||
|
Covered securities |
1,166 | 47 | 12 | 1,201 | ||||||||||||
|
Total securities available for sale |
$ | 33,616 | $ | 361 | $ | 724 | $ | 33,253 | ||||||||
114
Table of Contents
As of December 31, 2010, the fair value of covered securities included $1.2 billion of non-agency mortgage-backed securities and $304 million of municipal securities. As of December 31, 2009, the fair value of covered securities included $896 million of non-agency mortgage-backed securities and $305 million of municipal securities. All covered securities were acquired from Colonial and are covered by one of the FDIC loss sharing agreements. BB&T is restricted from selling these securities without prior approval from the FDIC.
At December 31, 2010 and 2009, securities with carrying values of approximately $19.3 billion and $22.6 billion, respectively, were pledged to secure municipal deposits, securities sold under agreements to repurchase, other borrowings, and for other purposes as required or permitted by law.
BB&T had certain investments in marketable debt securities and mortgage-backed securities issued by Fannie Mae and Freddie Mac that exceeded ten percent of shareholders’ equity at December 31, 2010. The Fannie Mae investments had total amortized cost and fair values of $9.4 billion and $9.3 billion, respectively, at December 31, 2010, while Freddie Mac investments had total amortized cost and fair values of $7.7 billion and $7.5 billion, respectively.
At December 31, 2010 and 2009, non-agency mortgage-backed securities primarily consisted of residential mortgage-backed securities.
The gross realized gains and losses and other than temporary impairments recognized in net income during 2010, 2009 and 2008 are reflected in the following table:
|
Years-Ended
December 31, |
||||||||||||
| 2010 | 2009 | 2008 | ||||||||||
| (Dollars in millions) | ||||||||||||
|
Gross gains |
$ | 607 | $ | 241 | $ | 244 | ||||||
|
Gross losses |
(22 | ) | (1 | ) | (33 | ) | ||||||
|
Net realized gains/(losses) |
585 | 240 | 211 | |||||||||
|
Other than temporary impairment (OTTI) recognized on non-agency
|
||||||||||||
|
Total OTTI on non-agency mortgage-backed securities |
(117 | ) | (133 | ) | — | |||||||
|
Non-credit portion recognized in other comprehensive income |
86 | 131 | — | |||||||||
|
Total OTTI on non-agency mortgage-backed securities recognized in net income |
(31 | ) | (2 | ) | — | |||||||
|
Total OTTI on equities and other securities recognized in net income |
— | (39 | ) | (104 | ) | |||||||
|
Total OTTI recognized in net income |
(31 | ) | (41 | ) | (104 | ) | ||||||
|
Securities gains, net |
$ | 554 | $ | 199 | $ | 107 | ||||||
The following table reflects the activity during 2010 related to credit losses on other-than-temporarily impaired non-agency mortgage-backed securities where a portion of the unrealized loss was recognized in other comprehensive income.
|
Year-Ended
December 31, 2010 |
||||
| (Dollars in millions) | ||||
|
Balance at beginning of period |
$ | 2 | ||
|
Credit losses on securities not previously considered other-than-temporarily impaired |
3 | |||
|
Credit losses on securities for which OTTI was previously recognized |
28 | |||
|
Reductions for securities sold during the period |
(3 | ) | ||
|
Balance at end of period |
$ | 30 | ||
115
Table of Contents
The amortized cost and estimated fair value of the debt securities portfolio at December 31, 2010, by contractual maturity, are shown in the accompanying table. The expected life of mortgage-backed securities will differ from contractual maturities because borrowers may have the right to call or prepay the underlying mortgage loans with or without call or prepayment penalties. For purposes of the maturity table, mortgage-backed securities, which are not due at a single maturity date, have been included in maturity groupings based on the contractual maturity.
| December 31, 2010 | ||||||||
| Available for Sale | ||||||||
|
Amortized
Cost |
Fair
Value |
|||||||
| (Dollars in millions) | ||||||||
| Debt Securities: | ||||||||
|
Due in one year or less |
$ | 60 | $ | 60 | ||||
|
Due after one year through five years |
63 | 65 | ||||||
|
Due after five years through ten years |
622 | 632 | ||||||
|
Due after ten years |
22,533 | 22,244 | ||||||
|
Total debt securities |
23,278 | 23,001 | ||||||
|
Total securities with no stated maturity |
141 | 168 | ||||||
|
Total securities |
$ | 23,419 | $ | 23,169 | ||||
The following tables reflect the gross unrealized losses and fair values of BB&T’s investments, aggregated by investment category and length of time that individual securities have been in a continuous unrealized loss position, at the dates presented.
| December 31, 2010 | ||||||||||||||||||||||||
| Less than 12 months | 12 months or more | Total | ||||||||||||||||||||||
|
Fair
Value |
Unrealized
Losses |
Fair
Value |
Unrealized
Losses |
Fair
Value |
Unrealized
Losses |
|||||||||||||||||||
| (Dollars in millions) | ||||||||||||||||||||||||
| Securities: | ||||||||||||||||||||||||
|
U.S. government-sponsored entities (GSE) |
$ | 50 | $ | — | $ | — | $ | — | $ | 50 | $ | — | ||||||||||||
|
Mortgage-backed securities issued by GSE |
15,438 | 361 | — | — | 15,438 | 361 | ||||||||||||||||||
|
States and political subdivisions |
694 | 21 | 735 | 140 | 1,429 | 161 | ||||||||||||||||||
|
Non-agency mortgage-backed securities |
— | — | 506 | 120 | 506 | 120 | ||||||||||||||||||
|
Equity and other securities |
535 | 2 | 2 | — | 537 | 2 | ||||||||||||||||||
|
Covered securities |
79 | 2 | — | — | 79 | 2 | ||||||||||||||||||
|
Total temporarily impaired securities |
$ | 16,796 | $ | 386 | $ | 1,243 | $ | 260 | $ | 18,039 | $ | 646 | ||||||||||||
116
Table of Contents
| December 31, 2009 | ||||||||||||||||||||||||
| Less than 12 months | 12 months or more | Total | ||||||||||||||||||||||
|
Fair
Value |
Unrealized
Losses |
Fair
Value |
Unrealized
Losses |
Fair
Value |
Unrealized
Losses |
|||||||||||||||||||
|
(Dollars in millions) |
||||||||||||||||||||||||
| Securities: | ||||||||||||||||||||||||
|
U.S. government-sponsored entities (GSE) |
$ | 1,843 | $ | 60 | $ | — | $ | — | $ | 1,843 | $ | 60 | ||||||||||||
|
Mortgage-backed securities issued by GSE |
16,338 | 210 | 114 | — | 16,452 | 210 | ||||||||||||||||||
|
States and political subdivisions |
409 | 65 | 274 | 60 | 683 | 125 | ||||||||||||||||||
|
Non-agency mortgage-backed securities |
181 | 66 | 825 | 251 | 1,006 | 317 | ||||||||||||||||||
|
Equity and other securities |
13 | — | 1 | — | 14 | — | ||||||||||||||||||
|
Covered securities |
94 | 12 | — | — | 94 | 12 | ||||||||||||||||||
|
Total temporarily impaired securities |
$ | 18,878 | $ | 413 | $ | 1,214 | $ | 311 | $ | 20,092 | $ | 724 | ||||||||||||
On December 31, 2010, BB&T held certain investment securities having continuous unrealized loss positions for more than 12 months. All of these losses were in non-agency mortgage-backed and municipal securities. At December 31, 2010, all of the available-for-sale debt securities in an unrealized loss position, excluding those covered by FDIC loss sharing agreements, were investment grade with the exception of (a) bonds with an amortized cost of $3 million from one issuer of auction rate securities; (b) two municipal bonds with an amortized cost of $8 million; and (c) eight non-agency mortgage-backed securities with an amortized cost of $556 million. At December 31, 2010, the total unrealized loss on these non-investment grade securities was $116 million. All of the non-investment grade securities referenced above were initially investment grade and have been downgraded since purchase.
BB&T monitors the credit ratings of all of its debt securities on an ongoing basis. When an investment security is rated lower than investment grade, the security is evaluated for potential credit impairment. Based on its evaluation at December 31, 2010, BB&T determined that certain of the non-investment grade non-agency mortgage-backed securities had credit losses evident and recognized other-than-temporary impairments related to these securities. BB&T’s evaluation of the other debt securities with continuous unrealized losses indicated that there were no credit losses evident. Furthermore, as of the date of the evaluation, BB&T did not intend to sell, and it was more likely than not that the Company would not be required to sell these debt securities before the anticipated recovery of the amortized cost basis. See the “Summary Analysis Supporting Conclusions” section below for further details regarding BB&T’s below investment grade securities with significant unrealized losses.
BB&T conducts periodic reviews to identify and evaluate each investment that has an unrealized loss for other-than-temporary impairment. An unrealized loss exists when the current fair value of an individual security is less than its amortized cost basis. Unrealized losses that are determined to be temporary in nature are recorded, net of tax, in accumulated other comprehensive income for available-for-sale securities.
Factors considered in determining whether a loss is temporary include:
| · |
The financial condition and near–term prospects of the issuer, including any specific events that may influence the operations of the issuer; |
| · |
BB&T’s intent to sell and whether it is more likely than not that the Company will be required to sell these debt securities before the anticipated recovery of the amortized cost basis; |
| · |
The length of the time and the extent to which the market value has been less than cost; |
| · |
Whether the decline in fair value is attributable to specific conditions, such as conditions in an industry or in a geographic area; |
| · |
Whether a debt security has been downgraded by a rating agency; |
| · |
Whether the financial condition of the issuer has deteriorated; |
| · |
The seniority of the security; |
117
Table of Contents
| · |
Whether dividends have been reduced or eliminated, or scheduled interest payments on debt securities have not been made; and |
| · |
Any other relevant available information. |
For certain U.S. mortgage-backed securities (and in particular for non-agency Alt-A, Prime and other mortgage-backed securities that have significant unrealized losses as a percentage of amortized cost), credit impairment is assessed using a cash flow model that estimates the cash flows on the underlying mortgage pools, using security-specific structure information. The model estimates cash flows from the underlying mortgage loan pools and distributes those cash flows to the various tranches of securities, considering the transaction structure and any subordination and credit enhancements that exist in each structure. The cash flow model projects the remaining cash flows using a number of assumptions, including default rates, prepayment rates and recovery rates (on foreclosed properties).
Management reviews the results of the cash flow model in conjunction with historical payment experience in its estimation of possible future credit losses. If management does not expect to recover the entire amortized cost basis of a mortgage-backed security, the Company records other-than-temporary impairment based on the amount of expected credit losses in the mortgage-backed security. The remaining amount of unrealized loss is recognized as a component of other comprehensive income.
Where a mortgage-backed security is not deemed to be credit impaired, management performs additional analysis to assess whether it intends to sell and it is more likely than not that the Company will be required to sell these debt securities before anticipated recovery of the amortized cost basis. In making this determination, BB&T considers its expected liquidity and capital needs, including its asset/liability management needs, forecasts, strategies and other relevant information.
Summary Analysis Supporting Conclusions
The following table presents a detailed analysis of non-investment grade securities with significant unrealized losses that are not covered by a loss sharing arrangement. The expected underlying collateral losses represent losses on the underlying mortgage pools supporting BB&T’s tranche. The benefits from subordination represent the amount of the expected losses the subordinate security holders are obligated to absorb prior to BB&T incurring a loss.
Non-investment grade securities with significant unrealized losses
December 31, 2010
(Dollars in millions)
|
Security |
Amortized
Cost |
Fair
Value |
Unrealized
Loss |
Credit Rating |
Expected Underlying
Collateral Losses (1) |
Benefit of
Subordination (1) |
||||||||||||||||||||
| Moody’s | S&P | Fitch | ||||||||||||||||||||||||
|
Securities with other-than-temporary impairment losses: |
|
|||||||||||||||||||||||||
|
RMBS 1 |
$ | 103 | $ | 72 | $ | (31 | ) | Caa3 | CC | $ | 16 | $ | 15 | |||||||||||||
|
RMBS 2 |
47 | 33 | (14 | ) | Ca | C | 7 | 3 | ||||||||||||||||||
|
RMBS 3 |
136 | 125 | (11 | ) | Caa3 | CC | 20 | 4 | ||||||||||||||||||
|
RMBS 4 |
109 | 74 | (35 | ) | CCC | C | 13 | 13 | ||||||||||||||||||
|
RMBS 5 |
52 | 42 | (10 | ) | Caa3 | CC | C | 6 | 3 | |||||||||||||||||
| (1) | Estimated underlying collateral losses and benefit of subordination are prior to amounts recorded as other-than-temporary impairment. |
118
Table of Contents
The following table provides a breakdown of BB&T’s loan portfolio as of December 31, 2010 and 2009:
| December 31, | ||||||||
| 2010 | 2009 | |||||||
| (Dollars in millions) | ||||||||
|
Loans and leases, net of unearned income: |
||||||||
|
Commercial |
$ | 48,886 | $ | 49,820 | ||||
|
Sales finance |
7,050 | 6,290 | ||||||
|
Revolving credit |
2,127 | 2,016 | ||||||
|
Direct retail |
13,749 | 14,283 | ||||||
|
Residential mortgage |
17,550 | 15,435 | ||||||
|
Specialized lending |
7,953 | 7,670 | ||||||
|
Other acquired |
58 | 123 | ||||||
|
Total loans and leases held for investment (excluding covered loans) |
97,373 | 95,637 | ||||||
|
Covered |
6,194 | 8,019 | ||||||
|
Total loans and leases held for investment (1) |
103,567 | 103,656 | ||||||
|
Loans held for sale |
3,697 | 2,551 | ||||||
|
Total loans and leases |
$ | 107,264 | $ | 106,207 | ||||
| (1) | Unearned income and net deferred loan fees and costs totaled $570 million and $580 million at December 31, 2010 and 2009, respectively. |
Covered loans represent loans acquired from the FDIC subject to one of the loss sharing agreements. Other acquired loans represent consumer loans acquired from the FDIC that are not subject to one of the loss sharing agreements.
BB&T evaluated purchased loans for impairment. Purchased loans with evidence of credit deterioration since origination and for which it is probable that all contractually required payments will not be collected are considered impaired. The following table reflects the carrying value of all purchased impaired and nonimpaired loans as of December 31, 2010 and 2009:
| December 31, 2010 | December 31, 2009 | |||||||||||||||||||||||
|
Purchased
Impaired Loans |
Purchased
Nonimpaired Loans |
Total |
Purchased
Impaired Loans |
Purchased
Nonimpaired Loans |
Total | |||||||||||||||||||
| (Dollars in millions) | ||||||||||||||||||||||||
|
Residential mortgage loans |
$ | 733 | $ | 713 | $ | 1,446 | $ | 826 | $ | 806 | $ | 1,632 | ||||||||||||
|
Commercial real estate loans |
2,031 | 1,982 | 4,013 | 2,732 | 2,574 | 5,306 | ||||||||||||||||||
|
Commercial loans |
91 | 644 | 735 | 94 | 987 | 1,081 | ||||||||||||||||||
|
Total covered loans |
2,855 | 3,339 | 6,194 | 3,652 | 4,367 | 8,019 | ||||||||||||||||||
|
Other acquired loans |
3 | 55 | 58 | 14 | 109 | 123 | ||||||||||||||||||
|
Total |
2,858 | 3,394 | 6,252 | 3,666 | 4,476 | 8,142 | ||||||||||||||||||
|
Allowance for loans losses |
(90 | ) | (54 | ) | (144 | ) | — | — | — | |||||||||||||||
|
Net |
$ | 2,768 | $ | 3,340 | $ | 6,108 | $ | 3,666 | $ | 4,476 | $ | 8,142 | ||||||||||||
119
Table of Contents
Changes in the carrying amount and accretable yield for purchased impaired and nonimpaired loans, excluding loans held for sale, were as follows for the years ended December 31, 2010 and 2009:
| December 31, 2010 | December 31, 2009 | |||||||||||||||||||||||||||||||
| Purchased Impaired | Purchased Nonimpaired | Purchased Impaired | Purchased Nonimpaired | |||||||||||||||||||||||||||||
|
Accretable
Yield |
Carrying
Amount of Loans |
Accretable
Yield |
Carrying
Amount of Loans |
Accretable
Yield |
Carrying
Amount of Loans |
Accretable
Yield |
Carrying
Amount of Loans |
|||||||||||||||||||||||||
| (Dollars in millions) | ||||||||||||||||||||||||||||||||
|
Balance at beginning of period |
$ | 889 | $ | 3,666 | $ | 1,301 | $ | 4,476 | $ | — | $ | — | $ | — | $ | — | ||||||||||||||||
|
Additions |
— | — | — | — | 997 | 3,820 | 1,427 | 4,885 | ||||||||||||||||||||||||
|
Accretion |
(459 | ) | 459 | (483 | ) | 483 | (108 | ) | 108 | (126 | ) | 126 | ||||||||||||||||||||
|
Reclassifications from nonaccretable balance, net |
405 | — | 793 | — | — | — | — | — | ||||||||||||||||||||||||
|
Payments received, net |
— | (1,267 | ) | — | (1,565 | ) | — | (262 | ) | — | (535 | ) | ||||||||||||||||||||
|
Balance at end of period |
$ | 835 | $ | 2,858 | $ | 1,611 | $ | 3,394 | $ | 889 | $ | 3,666 | $ | 1,301 | $ | 4,476 | ||||||||||||||||
As of August 14, 2009, the preliminary estimate of the contractually required payments receivable for all purchased impaired loans acquired in the Colonial transaction, including those covered and not covered under loss sharing agreements with the FDIC, were $8.3 billion, the cash flows expected to be collected were $4.8 billion including interest, and the estimated fair value of the loans was $3.8 billion. These amounts were determined based upon the estimated remaining life of the underlying loans, which includes the effects of estimated prepayments. The outstanding unpaid principal balance for all purchased impaired loans as of December 31, 2010 and 2009 was $3.8 billion and $5.7 billion, respectively.
For the purchased nonimpaired loans, excluding loans held for sale, the preliminary estimate as of the acquisition date of the contractually required payments receivable were $9.1 billion, the contractual cash flows not expected to be collected were $2.8 billion, and the estimated fair value of the loans was $4.9 billion. The difference between the carrying value of the purchased nonimpaired loans and the expected cash flows is being accreted to interest income over the remaining life of the loans. The outstanding unpaid principal balance for all purchased nonimpaired loans as of December 31, 2010 and 2009 was $5.0 billion and $6.6 billion, respectively.
At December 31, 2010 and 2009 none of the purchased loans were classified as nonperforming assets. Therefore, interest income, through accretion of the difference between the carrying amount of the loans and the expected cash flows, is being recognized on all purchased loans. The allowance for credit losses related to the purchased loans results from decreased expectations of future cash flows due to increased credit losses for certain acquired loan pools.
The following table provides details regarding BB&T’s investment in leveraged leases which are included in commercial loans and leases above:
| December 31, | ||||||||
| 2010 | 2009 | |||||||
| (Dollars in millions) | ||||||||
|
Rentals receivable (net of principal and interest on nonrecourse debt and head lease obligation) |
$ | 697 | $ | 750 | ||||
|
Unearned income |
(337 | ) | (375 | ) | ||||
|
Investment in leveraged leases, net of unearned income |
360 | 375 | ||||||
|
Deferred taxes arising from leveraged leases |
19 | 12 | ||||||
|
Net investment in leveraged leases |
$ | 379 | $ | 387 | ||||
BB&T had $72.1 billion in loans secured by real estate at December 31, 2010. However, these loans were not concentrated in any specific market or geographic area other than Branch Bank’s primary markets. Certain loans have been pledged as collateral for all outstanding Federal Home Loan Bank advances and certain other corporate purposes at December 31, 2010 and 2009.
120
Table of Contents
The following table provides a summary of BB&T’s nonperforming and past due loans:
| December 31, | ||||||||
| 2010 | 2009 | |||||||
| (Dollars in millions) | ||||||||
|
Nonaccrual loans and leases: (1)(2) |
||||||||
|
Held for investment (3) |
$ | 2,149 | $ | 2,658 | ||||
|
Held for sale |
521 | 5 | ||||||
|
Total nonaccrual loans and leases |
2,670 | 2,663 | ||||||
|
Foreclosed real estate |
1,259 | 1,451 | ||||||
|
Other foreclosed property |
42 | 58 | ||||||
|
Total foreclosed property (4) |
1,301 | 1,509 | ||||||
|
Total nonperforming assets (excluding covered assets) |
$ | 3,971 | $ | 4,172 | ||||
|
Loans 90 days or more past due and still accruing (excluding covered
|
$ | 295 | $ | 311 | ||||
| (1) | Covered and other acquired loans are considered to be performing due to the application of the accretion method. Covered loans that are contractually past due are noted in footnote (6) below. |
| (2) | Includes nonperforming restructurings totaling $479 million and $248 million at December 31, 2010 and 2009, respectively. |
| (3) | Excludes nonaccrual mortgage loans that are government guaranteed totaling $55 million at December 31, 2009. BB&T revised its policy related to government guaranteed mortgage loans during 2010 such that these loans remain 90 days past due and still accruing. |
| (4) | Excludes foreclosed real estate totaling $313 million and $160 million as of December 31, 2010 and 2009, respectively, that are covered by FDIC loss sharing agreements. |
| (5) | Excludes mortgage loans guaranteed by GNMA that BB&T does not have the obligation to repurchase. |
| (6) | Excludes loans past due 90 days or more that are covered by FDIC loss sharing agreements totaling $1.1 billion and $1.4 billion as of December 31, 2010 and 2009, respectively. |
| (7) | Excludes mortgage loans past due 90 days or more that are government guaranteed totaling $153 million and $8 million as of December 31, 2010 and 2009, respectively. |
During 2010, BB&T transferred $1.9 billion book value of nonperforming loans to loans held for sale, and recorded $605 million in net charge-offs.
The gross additional interest income that would have been earned if the loans and leases classified as nonaccrual had performed in accordance with the original terms was approximately $131 million, $115 million and $69 million in 2010, 2009 and 2008, respectively.
121
Table of Contents
The following table provides a summary of loans that continue to accrue interest under the terms of the restructuring (“performing restructurings”) and restructured loans that have been placed in nonaccrual status (“nonperforming restructurings”):
| December 31, | ||||||||
| 2010 | 2009 | |||||||
| (Dollars in millions) | ||||||||
|
Performing restructurings: (1)(2) |
||||||||
|
Commercial loans and leases |
$ | 657 | $ | 413 | ||||
|
Sales finance loans |
5 | — | ||||||
|
Revolving credit loans |
62 | 54 | ||||||
|
Direct retail loans |
141 | 132 | ||||||
|
Residential mortgage loans (3) |
585 | 471 | ||||||
|
Specialized lending loans |
26 | — | ||||||
|
Total performing restructurings |
1,476 | 1,070 | ||||||
|
Nonperforming restructurings (4)(5) |
479 | 248 | ||||||
|
Total restructurings (6) |
$ | 1,955 | $ | 1,318 | ||||
| (1) | Prior period amounts were revised in 2010 to reflect the retrospective application of more definitive regulatory guidance. |
| (2) | Excludes restructured mortgage loans that are government guaranteed totaling $14 million included in loans held for sale at December 31, 2010. |
| (3) | Excludes restructured mortgage loans that are government guaranteed totaling $115 million at December 31, 2010. |
| (4) | Nonperforming restructurings are included in nonaccrual loan disclosures. |
| (5) | Includes approximately $110 million of nonperforming restructurings included in loans held for sale at December 31, 2010. |
| (6) | All restructurings are considered impaired. The allowance for loan and lease losses attributable to these restructured loans totaled $324 million and $164 million at December 31, 2010 and 2009, respectively. |
BB&T had commitments totaling $90 million and $18 million at December 31, 2010 and 2009, respectively, to lend additional funds to clients with loans whose terms have been modified in restructurings.
An analysis of the allowance for credit losses for each of the past three years is presented in the following table:
|
Years Ended
December 31, |
||||||||||||
| 2010 | 2009 | 2008 | ||||||||||
| (Dollars in millions) | ||||||||||||
|
Beginning Balance |
$ | 2,672 | $ | 1,607 | $ | 1,015 | ||||||
|
Provision for credit losses |
2,638 | 2,811 | 1,445 | |||||||||
|
Loans and leases charged-off |
(2,658 | ) | (1,862 | ) | (917 | ) | ||||||
|
Recoveries of previous charge-offs |
130 | 89 | 66 | |||||||||
|
Net loans and leases charged-off |
(2,528 | ) | (1,773 | ) | (851 | ) | ||||||
|
Other changes, net |
(27 | ) | 27 | (2 | ) | |||||||
|
Ending Balance |
$ | 2,755 | $ | 2,672 | $ | 1,607 | ||||||
|
Allowance for loan and lease losses |
$ | 2,708 | $ | 2,600 | $ | 1,574 | ||||||
|
Reserve for unfunded lending commitments |
47 | 72 | 33 | |||||||||
|
Allowance for credit losses |
$ | 2,755 | $ | 2,672 | $ | 1,607 | ||||||
122
Table of Contents
The following tables provide a breakdown of the allowance for loan and lease losses and the recorded investment in loans based on the method for determining the allowance as of December 31, 2010:
| Allowance for Loan and Lease Losses | ||||||||||||||||
|
Individually
Evaluated for Impairment |
Collectively
Evaluated for Impairment |
Loans
Acquired With Deteriorated Credit Quality |
Total | |||||||||||||
| (Dollars in millions) | ||||||||||||||||
|
Commercial: |
||||||||||||||||
|
Commercial real estate—residential ADC |
$ | 75 | $ | 394 | $ | — | $ | 469 | ||||||||
|
Commercial real estate—other |
63 | 383 | — | 446 | ||||||||||||
|
Commercial and industrial |
96 | 525 | — | 621 | ||||||||||||
|
Specialized lending |
1 | 20 | — | 21 | ||||||||||||
|
Retail: |
||||||||||||||||
|
Direct retail lending |
26 | 220 | — | 246 | ||||||||||||
|
Revolving credit |
25 | 84 | — | 109 | ||||||||||||
|
Residential mortgage |
167 | 131 | — | 298 | ||||||||||||
|
Sales finance |
1 | 46 | — | 47 | ||||||||||||
|
Specialized lending |
2 | 175 | — | 177 | ||||||||||||
|
Covered and other acquired |
— | 54 | 90 | 144 | ||||||||||||
|
Unallocated |
— | 130 | — | 130 | ||||||||||||
|
Total |
$ | 456 | $ | 2,162 | $ | 90 | $ | 2,708 | ||||||||
| Loans and Leases | ||||||||||||||||
|
Individually
Evaluated for Impairment |
Collectively
Evaluated for Impairment |
Loans
Acquired With Deteriorated Credit Quality |
Total | |||||||||||||
| (Dollars in millions) | ||||||||||||||||
|
Commercial: |
||||||||||||||||
|
Commercial real estate—residential ADC |
$ | 684 | $ | 2,713 | $ | — | $ | 3,397 | ||||||||
|
Commercial real estate—other |
691 | 10,748 | — | 11,439 | ||||||||||||
|
Commercial and industrial |
708 | 33,342 | — | 34,050 | ||||||||||||
|
Specialized lending |
4 | 3,399 | — | 3,403 | ||||||||||||
|
Retail: |
||||||||||||||||
|
Direct retail lending |
177 | 13,572 | — | 13,749 | ||||||||||||
|
Revolving credit |
62 | 2,065 | — | 2,127 | ||||||||||||
|
Residential mortgage |
803 | 16,747 | — | 17,550 | ||||||||||||
|
Sales finance |
5 | 7,045 | — | 7,050 | ||||||||||||
|
Specialized lending |
24 | 4,526 | — | 4,550 | ||||||||||||
|
Covered and other acquired |
— | 3,394 | 2,858 | 6,252 | ||||||||||||
|
Total |
$ | 3,158 | $ | 97,551 | $ | 2,858 | $ | 103,567 | ||||||||
123
Table of Contents
BB&T monitors the credit quality of its commercial portfolio segment using internal risk ratings. These ratings have been correlated with bond ratings for similar instruments based on management’s judgment. BB&T assigns an internal risk rating at loan origination and reviews the relationship again on an annual basis or at any point management becomes aware of information affecting the borrower’s ability to fulfill their obligations. Refer to the Allowance for Loan and Lease Losses and Reserve for Unfunded Lending Commitments section of Note 1 for additional disclosures regarding BB&T’s significant policies.
BB&T monitors the credit quality of its retail portfolio segment based primarily on delinquency status, which is the primary factor considered in determining whether a retail loan should be classified as nonaccrual. Refer to the Nonperforming Assets section of Note 1 for additional disclosures regarding BB&T’s significant policies.
For the commercial portfolio segment, BB&T’s internal risk ratings were correlated with Moody’s bond ratings by mapping the historical default rates by internal risk grade to those implied in the bond ratings. Investment grade includes all loans mapped to a “Baa” or higher rating. Near investment grade includes all loans mapped to a “Ba” rating. Noninvestment grade includes all loans mapped to a “B” or lower rating. For the retail portfolio segment, nonperforming loans reflect loans in nonaccrual status.
The following tables illustrate the credit quality indicators associated with BB&T’s loans and leases as of December 31, 2010:
| Commercial | ||||||||||||||||||||
|
Commercial
Real Estate— Residential ADC |
Commercial
Real Estate— Other |
Commercial
& Industrial |
Specialized
Lending |
|||||||||||||||||
| (Dollars in millions) | ||||||||||||||||||||
|
Investment grade |
$ | 35 | $ | 687 | $ | 8,358 | $ | 2,070 | ||||||||||||
|
Near investment grade |
512 | 4,618 | 16,637 | 756 | ||||||||||||||||
|
Noninvestment grade |
2,850 | 6,134 | 9,055 | 577 | ||||||||||||||||
|
Total |
$ | 3,397 | $ | 11,439 | $ | 34,050 | $ | 3,403 | ||||||||||||
| Retail | ||||||||||||||||||||
|
Direct Retail
Lending |
Revolving
Credit |
Residential
Mortgage |
Sales
Finance |
Specialized
Lending |
||||||||||||||||
| (Dollars in millions) | ||||||||||||||||||||
|
Performing |
$ | 13,558 | $ | 2,127 | $ | 17,084 | $ | 7,044 | $ | 4,501 | ||||||||||
|
Nonperforming |
191 | — | 466 | 6 | 49 | |||||||||||||||
| $ | 13,749 | $ | 2,127 | $ | 17,550 | $ | 7,050 | $ | 4,550 | |||||||||||
124
Table of Contents
The following table represents an aging analysis of BB&T’s past due loans and leases as of December 31, 2010:
| Loans and Leases Excluding Covered (1) (2) | ||||||||||||||||||||||||
|
30-89 Days
Past Due |
90 Days Or More
Past Due |
Total Past
Due |
Current |
Total Loans And
Leases, Excluding Covered Loans |
90 Days Or More
Past Due and Still Accruing |
|||||||||||||||||||
| (Dollars in millions) | ||||||||||||||||||||||||
|
Commercial: |
||||||||||||||||||||||||
|
Commercial real estate—residential ADC |
$ | 166 | $ | 297 | $ | 463 | $ | 2,934 | $ | 3,397 | $ | 8 | ||||||||||||
|
Commercial real estate—other |
118 | 265 | 383 | 11,056 | 11,439 | 4 | ||||||||||||||||||
|
Commercial and industrial |
248 | 334 | 582 | 33,468 | 34,050 | 8 | ||||||||||||||||||
|
Specialized lending |
30 | 13 | 43 | 3,360 | 3,403 | 5 | ||||||||||||||||||
|
Retail: |
||||||||||||||||||||||||
|
Direct retail lending |
209 | 173 | 382 | 13,367 | 13,749 | 76 | ||||||||||||||||||
|
Revolving credit |
28 | 20 | 48 | 2,079 | 2,127 | 20 | ||||||||||||||||||
|
Residential mortgage (3) |
646 | 691 | 1,337 | 16,213 | 17,550 | 296 | ||||||||||||||||||
|
Sales finance |
96 | 32 | 128 | 6,922 | 7,050 | 27 | ||||||||||||||||||
|
Specialized lending |
219 | 50 | 269 | 4,281 | 4,550 | 1 | ||||||||||||||||||
|
Other acquired |
1 | 3 | 4 | 54 | 58 | 3 | ||||||||||||||||||
|
Total |
$ | 1,761 | $ | 1,878 | $ | 3,639 | $ | 93,734 | $ | 97,373 | $ | 448 | ||||||||||||
| (1) | Nonaccrual loans are included in this aging analysis based on their past due status. |
| (2) | Covered loans have been excluded from this aging analysis because they are covered by FDIC loss sharing agreements, and their related allowance is determined by loan pool performance due to the application of the accretion method. |
| (3) | Mortgage loans include $83 million in government guaranteed loans past due 30-89 days, and $153 million in government guaranteed loans past due greater than 90 days. |
125
Table of Contents
The following tables set forth certain information regarding BB&T’s impaired loans, excluding acquired impaired loans and loans held for sale, that were evaluated for specific reserves as of December 31, 2010 and 2009:
| December 31, 2010 | ||||||||||||
|
Recorded
Investment |
Unpaid
Principal Balance |
Related
Allowance |
||||||||||
| (Dollars in millions) | ||||||||||||
|
With No Related Allowance Recorded: |
||||||||||||
|
Commercial: |
||||||||||||
|
Commercial real estate—residential ADC |
$ | 200 | $ | 300 | $ | — | ||||||
|
Commercial real estate—other |
175 | 246 | — | |||||||||
|
Commercial and industrial |
196 | 267 | — | |||||||||
|
Retail: |
||||||||||||
|
Direct retail lending |
22 | 69 | — | |||||||||
|
Residential mortgage (1) |
25 | 50 | — | |||||||||
|
With An Allowance Recorded: |
||||||||||||
|
Commercial: |
||||||||||||
|
Commercial real estate—residential ADC |
484 | 556 | 75 | |||||||||
|
Commercial real estate—other |
516 | 565 | 63 | |||||||||
|
Commercial and industrial |
512 | 534 | 96 | |||||||||
|
Specialized lending |
4 | 4 | 1 | |||||||||
|
Retail: |
||||||||||||
|
Direct retail lending |
155 | 161 | 26 | |||||||||
|
Revolving credit |
62 | 61 | 25 | |||||||||
|
Residential mortgage (1) |
663 | 690 | 153 | |||||||||
|
Sales finance |
5 | 5 | 1 | |||||||||
|
Specialized lending |
24 | 24 | 2 | |||||||||
|
Total |
$ | 3,043 | $ | 3,532 | $ | 442 | ||||||
| (1) | Residential mortgage loans exclude $115 million in government guaranteed loans and related allowance of $14 million. |
|
December 31,
2009 (1) |
||||
| (Dollars in millions) | ||||
|
Total recorded investment—impaired loans |
$ | 2,305 | ||
|
Total recorded investment with no related valuation allowance |
$ | 611 | ||
|
Total recorded investment with related valuation allowance |
1,694 | |||
|
Allowance for loan and lease losses assigned to impaired loans |
(278 | ) | ||
|
Net carrying value—impaired loans |
$ | 2,027 | ||
| (1) | December 31, 2009 amounts have been revised from their originally reported amounts to reflect the retrospective application of more definitive regulatory guidance. |
126
Table of Contents
The following table represents the carrying value of BB&T’s loans and leases on nonaccrual status, including nonperforming restructurings:
| December 31, 2010 | ||||
| (Dollars in millions) | ||||
|
Commercial: |
||||
|
Commercial real estate—residential ADC |
$ | 513 | ||
|
Commercial real estate—other |
405 | |||
|
Commercial and industrial |
508 | |||
|
Specialized lending |
11 | |||
| 1,437 | ||||
|
Retail: |
||||
|
Direct retail lending |
191 | |||
|
Residential mortgage |
466 | |||
|
Sales finance |
6 | |||
|
Specialized lending |
49 | |||
| 712 | ||||
|
Total loans and leases held for investment on nonaccrual status |
$ | 2,149 | ||
A summary of premises and equipment is presented in the accompanying table:
| December 31, | ||||||||
| 2010 | 2009 | |||||||
| (Dollars in millions) | ||||||||
|
Land and land improvements |
$ | 495 | $ | 429 | ||||
|
Buildings and building improvements |
1,180 | 1,039 | ||||||
|
Furniture and equipment |
1,117 | 1,043 | ||||||
|
Leasehold improvements |
499 | 464 | ||||||
|
Construction in progress |
22 | 17 | ||||||
|
Capitalized leases on premises and equipment |
41 | 6 | ||||||
|
Total |
3,354 | 2,998 | ||||||
|
Less—accumulated depreciation and amortization |
(1,514 | ) | (1,415 | ) | ||||
|
Net premises and equipment |
$ | 1,840 | $ | 1,583 | ||||
Useful lives for premises and equipment are as follows: buildings and building improvements—40 years; furniture and equipment—5 to 10 years; leasehold improvements—estimated useful life or lease term, including certain renewals which were deemed probable at lease inception, whichever is less; and capitalized leases on premises and equipment—estimated useful life or remaining term of tenant lease, whichever is less.
BB&T has noncancelable leases covering certain premises and equipment. Many of the leases have one or more renewal options, generally for periods of two to five years. Total rent expense applicable to operating leases was $188 million, $210 million and $164 million for 2010, 2009 and 2008, respectively. Rental income from owned properties and subleases was $8 million, $7 million and $7 million for 2010, 2009 and 2008, respectively. Future minimum lease payments for operating leases for the five years subsequent to 2010 are $149 million, $135 million, $124 million, $114 million and $106 million. The payments for 2016 and later years total $604 million.
127
Table of Contents
The changes in the carrying amounts of goodwill attributable to each of BB&T’s operating segments for the years ended December 31, 2010 and 2009 are reflected in the table below. To date, there have been no goodwill impairments recorded by BB&T.
| Goodwill Activity by Operating Segment | ||||||||||||||||||||||||||||||||
|
Community
Banking |
Residential
Mortgage Banking |
Sales
Finance |
Specialized
Lending |
Insurance
Services |
Financial
Services |
All
Other |
Total | |||||||||||||||||||||||||
| (Dollars in millions) | ||||||||||||||||||||||||||||||||
|
Balance January 1, 2009 |
$ | 4,038 | $ | 7 | $ | 93 | $ | 98 | $ | 1,029 | $ | 192 | $ | 26 | $ | 5,483 | ||||||||||||||||
|
Acquired goodwill, net |
533 | — | — | 10 | 29 | — | — | 572 | ||||||||||||||||||||||||
|
Contingent consideration |
— | — | — | — | 2 | — | — | 2 | ||||||||||||||||||||||||
|
Other adjustments |
(2 | ) | — | — | 2 | (4 | ) | — | — | (4 | ) | |||||||||||||||||||||
|
Balance December 31, 2009 |
4,569 | 7 | 93 | 110 | 1,056 | 192 | 26 | 6,053 | ||||||||||||||||||||||||
|
Contingent consideration |
— | — | — | — | 9 | — | — | 9 | ||||||||||||||||||||||||
|
Other adjustments |
(50 | ) | — | — | (6 | ) | 2 | — | — | (54 | ) | |||||||||||||||||||||
|
Balance, December 31, 2010 |
$ | 4,519 | $ | 7 | $ | 93 | $ | 104 | $ | 1,067 | $ | 192 | $ | 26 | $ | 6,008 | ||||||||||||||||
The adjustments to goodwill during 2010 within the Community Banking segment (formerly “Banking Network”), reflect the finalization of valuations for certain assets and liabilities acquired in the Colonial acquisition.
The following table presents the gross carrying amounts and accumulated amortization for BB&T’s identifiable intangible assets subject to amortization at the dates presented:
| Identifiable Intangible Assets | ||||||||||||||||||||||||
| December 31, 2010 | December 31, 2009 | |||||||||||||||||||||||
|
Gross
Carrying Amount |
Accumulated
Amortization |
Net
Carrying Amount |
Gross
Carrying Amount |
Accumulated
Amortization |
Net
Carrying Amount |
|||||||||||||||||||
| (Dollars in millions) | ||||||||||||||||||||||||
|
Identifiable intangible assets: |
||||||||||||||||||||||||
|
Core deposit intangibles |
$ | 626 | $ | (438 | ) | $ | 188 | $ | 633 | $ | (375 | ) | $ | 258 | ||||||||||
|
Other (1) |
752 | (432 | ) | 320 | 755 | (373 | ) | 382 | ||||||||||||||||
|
Totals |
$ | 1,378 | $ | (870 | ) | $ | 508 | $ | 1,388 | $ | (748 | ) | $ | 640 | ||||||||||
| (1) | Other identifiable intangibles are primarily customer relationship intangibles. |
During the years ended December 31, 2010, 2009 and 2008, BB&T incurred $122 million, $114 million and $100 million, respectively, in pre-tax amortization expenses associated with core deposit intangibles and other intangible assets. At December 31, 2010, the weighted-average remaining life of core deposit intangibles and other identifiable intangibles was 8.9 years and 13.0 years, respectively.
Estimated amortization expense of identifiable intangible assets for each of the next five years total $98 million, $80 million, $65 million, $52 million and $43 million.
128
Table of Contents
Residential Mortgage Banking Activities
The following table includes a summary of residential mortgage loans managed or securitized and related delinquencies and net charge-offs:
| Years Ended December 31, | ||||||||
| 2010 | 2009 | |||||||
| (Dollars in millions) | ||||||||
|
Mortgage loans managed or securitized (1) |
$ | 23,692 | $ | 21,637 | ||||
|
Less: Loans securitized and transferred to securities available for sale |
4 | 60 | ||||||
|
Loans held for sale |
3,068 | 2,524 | ||||||
|
Covered mortgage loans |
1,446 | 1,632 | ||||||
|
Mortgage loans sold with recourse |
1,624 | 1,986 | ||||||
|
Mortgage loans held for investment |
$ | 17,550 | $ | 15,435 | ||||
|
Mortgage loans on nonaccrual status (2) |
$ | 466 | $ | 712 | ||||
|
Mortgage loans 90 days past due and still accruing interest (2) |
143 | 150 | ||||||
|
Mortgage loan net charge-offs |
390 | 275 | ||||||
| (1) | Balances exclude loans serviced for others, with no other continuing involvement. |
| (2) | Includes amounts related to residential mortgage loans held for sale and excludes amounts related to government guaranteed loans |
BB&T sold problem residential mortgages with a carrying value of $388 million during the year ended December 31, 2010 in connection with the nonperforming asset disposition strategy. BB&T recorded $141 million of net charge-offs related to these loans.
The unpaid principal balances of BB&T’s total residential mortgage servicing portfolio were $83.6 billion, $73.6 billion and $59.7 billion at December 31, 2010, 2009 and 2008, respectively. The unpaid principal balances of residential mortgage loans serviced for others consist primarily of agency conforming fixed-rate mortgage loans and totaled $61.8 billion, $54.5 billion and $40.7 billion at December 31, 2010, 2009 and 2008, respectively. Mortgage loans serviced for others are not included in loans on the accompanying Consolidated Balance Sheets.
During 2010, 2009 and 2008, BB&T sold residential mortgage loans from the held for sale portfolio with unpaid principal balances of $19.1 billion, $25.8 billion and $13.4 billion, respectively, and recognized pre-tax gains of $235 million, $357 million and $78 million, respectively, which were recorded in noninterest income as a component of mortgage banking income. BB&T retained the related mortgage servicing rights and receives servicing fees.
At December 31, 2010 and 2009, the approximate weighted average servicing fee was .35% and .37%, respectively, of the outstanding balance of the residential mortgage loans. The weighted average coupon interest rate on the portfolio of mortgage loans serviced for others was 5.26% and 5.57% at December 31, 2010 and 2009, respectively. BB&T recognized servicing fees of $226 million, $190 million and $145 million during 2010, 2009 and 2008, respectively, as a component of mortgage banking income.
At December 31, 2010, and 2009, BB&T had $1.6 billion and $2.0 billion, respectively, of residential mortgage loans sold with recourse liability. In the event of nonperformance by the borrower, BB&T has maximum recourse exposure of approximately $597 million and $667 million as of December 31, 2010 and 2009, respectively. At December 31, 2010 and 2009, BB&T has recorded $6 million of reserves related to these recourse exposures. Payments made to date have been immaterial.
129
Table of Contents
Residential mortgage servicing rights are recorded on the Consolidated Balance Sheets at fair value with changes in fair value recorded as a component of mortgage banking income in the Consolidated Statements of Income for each period. BB&T uses various derivative instruments to mitigate the income statement effect of changes in fair value, due to changes in valuation inputs and assumptions, of its residential mortgage servicing rights. The following is an analysis of the activity in BB&T’s residential mortgage servicing rights for the years ended December 31, 2010, 2009 and 2008:
|
Residential
Mortgage Servicing Rights Years Ended December 31, |
||||||||||||
| 2010 | 2009 | 2008 | ||||||||||
| (Dollars in millions) | ||||||||||||
|
Carrying value, January 1, |
$ | 832 | $ | 370 | $ | 472 | ||||||
|
Additions |
265 | 398 | 212 | |||||||||
|
Increase (decrease) in fair value: |
||||||||||||
|
Due to changes in valuation inputs or assumptions |
(138 | ) | 190 | (220 | ) | |||||||
|
Other changes (1) |
(129 | ) | (126 | ) | (94 | ) | ||||||
|
Carrying value, December 31, |
$ | 830 | $ | 832 | $ | 370 | ||||||
| (1) | Represents the realization of expected net servicing cash flows, expected borrower payments and the passage of time. |
BB&T uses assumptions and estimates in determining the fair value of mortgage servicing rights. These assumptions include prepayment speeds, servicing costs and Option Adjusted Spread commensurate with the risks involved and comparable to assumptions used by market participants to value and bid servicing rights available for sale in the market. At December 31, 2010, the sensitivity of the current fair value of the residential mortgage servicing rights to immediate 10% and 20% adverse changes in key economic assumptions are included in the accompanying table.
|
Residential
Mortgage Servicing Rights December 31, 2010 |
||||
| (Dollars in millions) | ||||
|
Fair value of residential mortgage servicing rights |
$ | 830 | ||
|
Composition of residential loans serviced for others: |
||||
|
Fixed-rate mortgage loans |
99 | % | ||
|
Adjustable-rate mortgage loans |
1 | |||
|
Total |
100 | % | ||
|
Weighted average life |
5.6 | yrs | ||
|
Prepayment speed |
12.7 | % | ||
|
Effect on fair value of a 10% increase |
$ | (40 | ) | |
|
Effect on fair value of a 20% increase |
(76 | ) | ||
|
Weighted average discount rate |
10.7 | % | ||
|
Effect on fair value of a 10% increase |
$ | (38 | ) | |
|
Effect on fair value of a 20% increase |
(73 | ) | ||
The sensitivity calculations above are hypothetical and should not be considered to be predictive of future performance. As indicated, changes in fair value based on adverse changes in assumptions generally cannot be extrapolated because the relationship of the change in assumption to the change in fair value may not be linear. Also, in this table, the effect of an adverse variation in a particular assumption on the fair value of the mortgage servicing rights is calculated without changing any other assumption; while in reality, changes in one factor may result in changes in another (for example, increases in market interest rates may result in lower prepayments), which may magnify or counteract the effect of the change.
130
Table of Contents
Commercial Mortgage Banking Activities
BB&T also arranges and services commercial real estate mortgages through Grandbridge Real Estate Capital, LLC (“Grandbridge”) the commercial mortgage banking subsidiary of Branch Bank. During the years ended December 31, 2010, 2009 and 2008, Grandbridge originated $3.1 billion, $2.3 billion and $3.7 billion, respectively, of commercial real estate mortgages, the majority of which were arranged for third party investors. As of December 31, 2010, 2009 and 2008, Grandbridge’s portfolio of commercial real estate mortgages serviced for others totaled $24.1 billion, $24.3 billion and $23.9 billion, respectively. Commercial real estate mortgage loans serviced for others are not included in loans on the accompanying Consolidated Balance Sheets. Grandbridge had $4.4 billion and $4.0 billion in loans serviced for others that were covered by recourse provisions at December 31, 2010 and 2009, respectively. At December 31, 2010 and 2009, Grandbridge’s maximum exposure to loss for these loans was approximately $1.2 billion and $1.1 billion, respectively. BB&T has recorded $19 million and $12 million of reserves related to these recourse exposures at December 31, 2010 and 2009, respectively.
Commercial mortgage servicing rights are recorded as other assets on the Consolidated Balance Sheets at lower of cost or market and amortized in proportion to and over the estimated period that net servicing income is expected to be received based on projections of the amount and timing of estimated future net cash flows. The following is an analysis of the activity in BB&T’s commercial mortgage servicing rights for the years ended December 31, 2010, 2009 and 2008:
|
Commercial Mortgage
Servicing Rights Years Ended December 31, |
||||||||||||
| 2010 | 2009 | 2008 | ||||||||||
| (Dollars in millions) | ||||||||||||
|
Carrying value, January 1, |
$ | 101 | $ | 98 | $ | 88 | ||||||
|
Additions |
20 | 21 | 23 | |||||||||
|
Purchases |
— | — | 1 | |||||||||
|
Amortization expense |
(18 | ) | (18 | ) | (14 | ) | ||||||
|
Carrying value, December 31, |
$ | 103 | $ | 101 | $ | 98 | ||||||
At December 31, 2010, the sensitivity of the current fair value of the capitalized commercial mortgage servicing rights to adverse changes in key economic assumptions are included in the accompanying table.
|
Commercial
Mortgage Servicing Rights December 31, 2010 |
||||
| (Dollars in millions) | ||||
|
Fair value of commercial mortgage servicing rights |
$ | 121 | ||
|
Weighted average life |
7.3 | yrs | ||
|
Prepayment speed |
.5 | % | ||
|
Effect on fair value of a 10% increase |
$ | (1 | ) | |
|
Effect on fair value of a 15% increase |
(1 | ) | ||
|
Weighted average discount rate |
12.4 | % | ||
|
Effect on fair value of a 25% increase |
$ | (9 | ) | |
|
Effect on fair value of a 50% increase |
(17 | ) | ||
The sensitivity calculations above are hypothetical and should not be considered to be predictive of future performance. As indicated, changes in fair value based on adverse changes in assumptions generally cannot be extrapolated because the relationship of the change in assumption to the change in fair value may not be linear. Also, in this table, the effect of an adverse variation in a particular assumption on the fair value of the mortgage servicing rights is calculated without changing any other assumption; while in reality, changes in one factor may result in changes in another (for example, increases in market interest rates may result in increased value of escrow deposits), which may magnify or counteract the effect of the change.
131
Table of Contents
| NOTE 9. | Federal Funds Purchased, Securities Sold Under Agreements to Repurchase and Short-Term Borrowed Funds |
Federal funds purchased, securities sold under agreements to repurchase and short-term borrowed funds are summarized as follows:
| December 31, | ||||||||
| 2010 | 2009 | |||||||
| (Dollars in millions) | ||||||||
|
Federal funds purchased |
$ | 23 | $ | 1,421 | ||||
|
Securities sold under agreements to repurchase |
1,189 | 2,197 | ||||||
|
Master notes |
806 | 1,004 | ||||||
|
Other short-term borrowed funds |
3,655 | 3,484 | ||||||
|
Total |
$ | 5,673 | $ | 8,106 | ||||
Federal funds purchased represent unsecured borrowings from other banks and generally mature daily. Securities sold under agreements to repurchase are borrowings collateralized primarily by securities of the U.S. government or its agencies. Master notes are unsecured, non-negotiable obligations of BB&T (variable rate commercial paper) that mature in 270 days or less. Other short-term borrowed funds include unsecured bank notes that mature in less than one year, bank obligations with a maturity of seven days that are collateralized by municipal securities, U.S. Treasury tax and loan deposit notes payable to the U.S. Treasury upon demand. In 2009, other short-term borrowed funds included U.S. Treasury tax and loan deposit notes payable to the U.S. Treasury for periods of less than one month and borrowings under the treasury auction facility
A summary of selected data related to Federal funds purchased, securities sold under agreements to repurchase and short-term borrowed funds follows:
|
As of
/
For the Year Ended December 31, |
||||||||||||
| 2010 | 2009 | 2008 | ||||||||||
| (Dollars in millions) | ||||||||||||
|
Maximum outstanding at any month-end during the year |
$ | 11,690 | $ | 19,917 | $ | 15,704 | ||||||
|
Balance outstanding at end of year |
5,673 | 8,106 | 10,788 | |||||||||
|
Average outstanding during the year |
9,022 | 12,491 | 10,580 | |||||||||
|
Average interest rate during the year |
.24 | % | .46 | % | 2.22 | % | ||||||
|
Average interest rate at end of year |
.46 | .34 | .87 | |||||||||
A summary of BB&T’s deposits is presented in the accompanying table:
| December 31, | ||||||||
| 2010 | 2009 | |||||||
| (Dollars in millions) | ||||||||
|
Deposits: |
||||||||
|
Noninterest-bearing deposits |
$ | 20,637 | $ | 18,945 | ||||
|
Interest checking |
4,050 | 3,420 | ||||||
|
Other client deposits |
54,040 | 52,097 | ||||||
|
Client certificates of deposit |
21,317 | 32,298 | ||||||
|
Other interest-bearing deposits |
7,169 | 8,205 | ||||||
|
Total deposits |
$ | 107,213 | $ | 114,965 | ||||
Time deposits that are $100,000 and greater totaled $10.6 billion and $17.2 billion at December 31, 2010 and 2009, respectively.
132
Table of Contents
Long-term debt comprised the following:
| December 31, | ||||||||
| 2010 | 2009 | |||||||
| (Dollars in millions) | ||||||||
| Parent Company | ||||||||
|
3.10% Senior Notes Due 2011 |
$ | 250 | $ | 250 | ||||
|
3.85% Senior Notes Due 2012 |
1,000 | 1,000 | ||||||
|
3.38% Senior Notes Due 2013 |
500 | 500 | ||||||
|
5.70% Senior Notes Due 2014 |
510 | 509 | ||||||
|
3.95% Senior Notes Due 2016 |
499 | — | ||||||
|
6.85% Senior Notes Due 2019 |
538 | 538 | ||||||
|
6.50% Subordinated Notes Due 2011 (1) |
610 | 610 | ||||||
|
4.75% Subordinated Notes Due 2012 (1) |
490 | 489 | ||||||
|
5.20% Subordinated Notes Due 2015 (1) |
932 | 932 | ||||||
|
4.90% Subordinated Notes Due 2017 (1) |
339 | 336 | ||||||
|
5.25% Subordinated Notes Due 2019 (1) |
586 | 586 | ||||||
| Branch Bank | ||||||||
|
Floating Rate Subordinated Notes Due 2016 (1)(2) |
350 | 350 | ||||||
|
Floating Rate Subordinated Notes Due 2017 (1)(2) |
261 | 261 | ||||||
|
4.875% Subordinated Notes Due 2013 (1) |
222 | 222 | ||||||
|
5.625% Subordinated Notes Due 2016 (1) |
386 | 386 | ||||||
| Federal Home Loan Bank Advances to Branch Bank (3) | ||||||||
|
Varying maturities to 2034 |
10,243 | 10,541 | ||||||
| Junior Subordinated Debt to Unconsolidated Trusts (4) | 3,269 | 3,269 | ||||||
| Other Long-Term Debt | 123 | 98 | ||||||
| Fair value hedge-related basis adjustments | 622 | 499 | ||||||
|
Total Long-Term Debt |
$ | 21,730 | $ | 21,376 | ||||
| (1) | Subordinated notes that qualify under the risk-based capital guidelines as Tier 2 supplementary capital, subject to certain limitations. |
| (2) | These floating-rate securities are based on LIBOR and had an effective rate of .61% as of December 31, 2010. |
| (3) | $800 million of these advances were swapped to a floating rate based on LIBOR. At December 31, 2010, the weighted average cost of these advances was 3.18% including the effect of the swapped portion, and the weighted average maturity was 6.2 years. |
| (4) | Securities that qualify under the risk-based capital guidelines as Tier 1 capital, subject to certain limitations. A summary of the significant terms of these securities are detailed in the following table. |
Excluding the capitalized leases set forth in Note 6, future debt maturities total $2.1 billion, $1.5 billion, $1.6 billion, $1.0 billion and $1.1 billion for the next five years. The maturities for 2016 and later years total $14.2 billion.
133
Table of Contents
Junior Subordinated Debt to Unconsolidated Trusts
The following table is a summary of the significant terms of outstanding Junior Subordinated Debt at December 31, 2010 as originated by BB&T and its subsidiaries and predecessor companies:
|
Issuer |
Issuance Date | December 31, | Stated Maturity | Final Maturity |
Interest
Rate |
Redemption
Period |
||||||||||||||||||||||
| 2010 | 2009 | |||||||||||||||||||||||||||
| (Dollars in millions) | ||||||||||||||||||||||||||||
|
BB&T Capital Trust I |
August 2005 | $ | 514 | $ | 514 | August 2035 | 5.85 | % | Anytime | |||||||||||||||||||
|
BB&T Capital Trust II |
June 2006 | 598 | 598 | June 2036 | 6.75 | Anytime | ||||||||||||||||||||||
|
BB&T Capital Trust IV (1) |
June 2007 | 600 | 600 | June 2057 | June 2077 | 6.82 | Anytime | |||||||||||||||||||||
|
BB&T Capital Trust V (2)(3) |
September 2008 | 450 | 450 | September 2063 | September 2068 | 8.95 | after 09/15/13 | |||||||||||||||||||||
|
BB&T Capital Trust VI (3) |
July 2009 | 575 | 575 | August 2064 | August 2069 | 9.60 | after 08/01/14 | |||||||||||||||||||||
|
BB&T Capital Trust VII |
October 2009 | 350 | 350 | November 2064 | November 2069 | 8.10 | after 11/01/14 | |||||||||||||||||||||
|
Mason-Dixon Capital Trust |
July 1997 | 21 | 21 | June 2027 | 10.07 | after 06/15/07 | ||||||||||||||||||||||
|
MainStreet Capital Trust I |
November 1997 | 48 | 48 | December 2027 | 8.90 | after 12/01/07 | ||||||||||||||||||||||
|
Premier Capital Trust I |
November 1997 | 30 | 30 | December 2027 | 9.00 | after 12/31/07 | ||||||||||||||||||||||
|
Main Street Banks Statutory Trust I |
November 2002 | 5 | 5 | November 2032 | Variable | after 11/15/07 | ||||||||||||||||||||||
|
Main Street Banks Statutory Trust II |
May 2003 | 46 | 46 | June 2033 | Variable | after 06/30/08 | ||||||||||||||||||||||
|
Coastal Financial Capital Trust I |
July 2003 | 15 | 15 | July 2033 | Variable | after 07/03/08 | ||||||||||||||||||||||
|
First Citizens Bancorp Statutory Trust I |
December 2003 | 10 | 10 | December 2033 | Variable | after 12/17/08 | ||||||||||||||||||||||
|
First Citizens Bancorp Statutory Trust II |
June 2005 | 7 | 7 | June 2035 | Variable | after 06/15/10 | ||||||||||||||||||||||
|
Total |
$ | 3,269 | $ | 3,269 | ||||||||||||||||||||||||
| (1) | These securities are fixed rate through June 12, 2037 and then switch to a floating rate based on LIBOR. |
| (2) | $360 million of this issuance was swapped to a floating rate based on LIBOR. At December 31, 2010, the effective rate on the swapped portion was 3.67% |
| (3) | These securities are fixed rate through initial maturity and then switch to a floating rate based on LIBOR if extended. |
Common Stock
The authorized common stock of BB&T consists of two billion shares with a $5 par value. There were 694 million and 690 million common shares issued and outstanding at December 31, 2010 and 2009, respectively.
Preferred Stock
The authorized preferred stock of BB&T consists of five million shares. At December 31, 2010 and December 31, 2009, there were no preferred shares outstanding.
Equity-Based Plans
At December 31, 2010, BB&T had options, restricted shares and restricted share units outstanding from the following equity-based compensation plans: the 2004 Stock Incentive Plan (“2004 Plan”), the 1995 Omnibus Stock Incentive Plan (“Omnibus Plan”), the Non-Employee Directors’ Stock Option Plan (“Directors’ Plan”), and plans assumed from acquired entities, which are described below. All plans generally allow for accelerated vesting of awards for holders who retire and have met all retirement eligibility requirements and in connection with certain other events. BB&T’s shareholders have approved all equity-based compensation plans with the exception of plans assumed from acquired companies. As of December 31, 2010, the 2004 Plan is the only plan that has shares available for future grants.
BB&T’s 2004 Plan is intended to assist the Corporation in recruiting and retaining employees, directors and independent contractors and to associate the interests of eligible participants with those of BB&T and its
134
Table of Contents
shareholders. At December 31, 2010, there were 24.0 million non-qualified and qualified stock options at prices ranging from $9.56 to $44.20 and 13.3 million restricted shares and restricted share units outstanding under the 2004 Plan. Options outstanding under the 2004 Plan have a ten year term and vest as follows: (1) options granted prior to 2010 generally vest over five years and (2) options granted during 2010 generally vest over four years. The restricted shares and restricted share units vest as follows: (1) awards granted prior to 2010 generally vest five years from the date of grant and (2) awards granted during 2010 generally vest four years from the date of grant. At December 31, 2010, there were 20.7 million shares available for future grants under the 2004 Plan.
BB&T’s Omnibus Plan was intended to allow BB&T to recruit and retain employees with ability and initiative and to align the employees’ interests with those of BB&T and its shareholders. At December 31, 2010, 20.4 million non-qualified and qualified stock options at prices ranging from $16.05 to $43.25 were outstanding. The stock options generally vest over 3 to 5 years and have a ten-year term.
The Directors’ Plan was intended to provide incentives to non-employee directors to remain on the Board of Directors and share in the profitability of BB&T. In 2005, the Directors’ Plan was amended and no future grants will be awarded in connection with this Plan. Directors are currently eligible to receive grants under the 2004 Plan. At December 31, 2010, options to purchase 233 thousand shares of common stock at prices ranging from $25.75 to $31.80 were outstanding pursuant to the Directors’ Plan.
BB&T also has equity-based plans outstanding as the result of assuming the plans of acquired companies. At December 31, 2010, there were 117 thousand stock options outstanding in connection with these plans, with option prices ranging from $26.16 to $29.54.
BB&T measures the fair value of each option award on the date of grant using the Black-Scholes option-pricing model with the following weighted average assumptions used for grants awarded in 2010, 2009 and 2008, respectively. Substantially all of BB&T’s option awards are granted in February of each year. Therefore, the assumptions noted below are weighted accordingly.
| Years Ended December 31, | ||||||||||||
| 2010 | 2009 | 2008 | ||||||||||
|
Assumptions: |
||||||||||||
|
Risk-free interest rate |
2.0 | % | 3.1 | % | 3.7 | % | ||||||
|
Dividend yield |
5.4 | 6.0 | 4.5 | |||||||||
|
Volatility factor |
36.0 | 29.1 | 15.5 | |||||||||
|
Expected life |
7.2 | yrs | 7.1 | yrs | 6.9 | yrs | ||||||
|
Fair value of options per share |
$ | 5.60 | $ | 2.59 | $ | 3.43 | ||||||
BB&T determines the assumptions used in the Black-Scholes option pricing model as follows: the risk-free interest rate is based on the U.S. Treasury yield curve in effect at the time of the grant; the dividend yield is based on the historical dividend yield of BB&T’s stock, adjusted to reflect the expected dividend yield over the expected life of the option; the volatility factor is based on the historical volatility of BB&T’s stock, adjusted to reflect the ways in which current information indicates that the future is reasonably expected to differ from the past; and the weighted-average expected life is based on the historical behavior of employees related to exercises, forfeitures and cancellations.
BB&T measures the fair value of restricted shares based on the price of BB&T’s common stock on the grant date and the fair value of restricted share units based on the price of BB&T’s common stock on the grant date less the present value of expected dividends that are foregone during the vesting period.
BB&T recorded $79 million, $62 million and $75 million in equity-based compensation in 2010, 2009 and 2008, respectively. In connection with this compensation expense, BB&T recorded an income tax benefit of $30 million, $24 million and $29 million in 2010, 2009 and 2008, respectively. The total intrinsic value of options exercised or restricted share units vested during 2010, 2009 and 2008 was $22 million, $6 million and $20 million, respectively. The total grant date fair value of equity-based awards that vested during 2010 was $39 million. As of December 31, 2010, there was $104 million of unrecognized compensation costs related to BB&T’s equity-based awards that is expected to be recognized over a weighted-average life of 3.0 years.
135
Table of Contents
The following table details the activity during 2010 related to stock options awarded by BB&T:
|
Year Ended
December 31, 2010 |
||||||||
| Options |
Wtd. Avg.
Exercise Price |
|||||||
|
Outstanding at beginning of period |
42,535,819 | $ | 35.40 | |||||
|
Granted |
4,657,121 | 27.74 | ||||||
|
Exercised |
(1,562,742 | ) | 22.99 | |||||
|
Forfeited or expired |
(940,067 | ) | 34.00 | |||||
|
Outstanding at end of period |
44,690,131 | 35.06 | ||||||
|
Exercisable at end of period |
32,670,568 | 36.84 | ||||||
The following tables summarize information about BB&T’s stock option awards as of December 31, 2010:
|
Range of
|
Options Outstanding | Options Exercisable | ||||||||||||||||||||||||||||
|
Number
Outstanding 12/31/10 |
Weighted-
Average Remaining Contractual Life (yrs) |
Weighted-
Average Exercise Price |
Number
Exercisable 12/31/10 |
Weighted-
Average Remaining Contractual Life (yrs) |
Weighted-
Average Exercise Price |
|||||||||||||||||||||||||
|
$ 9.56 |
to | $10.00 | 2,475 | .1 | $ | 9.56 | 2,475 | .1 | $ | 9.56 | ||||||||||||||||||||
|
10.01 |
to | 15.00 | 8,514 | .9 | 12.24 | 8,514 | .9 | 12.24 | ||||||||||||||||||||||
|
15.01 |
to | 25.00 | 2,960,361 | 7.9 | 17.51 | 727,331 | 7.5 | 18.17 | ||||||||||||||||||||||
|
25.01 |
to | 35.00 | 15,236,238 | 6.2 | 31.70 | 7,635,919 | 4.1 | 32.94 | ||||||||||||||||||||||
|
35.01 |
to | 44.20 | 26,482,543 | 3.8 | 38.96 | 24,296,329 | 3.6 | 38.63 | ||||||||||||||||||||||
| 44,690,131 | 4.9 | 35.06 | 32,670,568 | 3.8 | 36.84 | |||||||||||||||||||||||||
|
Range of Exercise Prices |
Options Expected to Vest | |||||||||||||||||||||||||||||
|
Number
Outstanding 12/31/10 |
Weighted-
Average Remaining Contractual Life (yrs) |
Weighted-
Average Exercise Price |
||||||||||||||||||||||||||||
|
$ 9.56 |
to |
$10.00 |
2,475 | .1 | $ | 9.56 | ||||||||||||||||||||||||
|
10.01 |
to |
15.00 |
8,514 | .9 | 12.24 | |||||||||||||||||||||||||
|
15.01 |
to |
25.00 |
2,490,702 | 7.9 | 17.55 | |||||||||||||||||||||||||
|
25.01 |
to |
35.00 |
13,688,667 | 6.0 | 31.75 | |||||||||||||||||||||||||
|
35.01 |
to |
44.20 |
25,475,869 | 3.7 | 38.83 | |||||||||||||||||||||||||
| 41,666,227 | 4.7 | 35.23 | ||||||||||||||||||||||||||||
The aggregate intrinsic value of options outstanding, options exercisable and options expected to vest at December 31, 2010 was $26 million, $6 million, and $22 million, respectively.
The following table details the activity during 2010 related to restricted shares and restricted share units awarded by BB&T:
|
Year Ended
December 31, 2010 |
||||||||
| Shares/Units |
Wtd. Avg.
Grant Date Fair Value |
|||||||
|
Nonvested at beginning of period |
10,861,433 | $ | 19.36 | |||||
|
Granted |
3,434,797 | 23.69 | ||||||
|
Vested |
(507,760 | ) | 29.73 | |||||
|
Forfeited |
(504,684 | ) | 19.97 | |||||
|
Nonvested at end of period |
13,283,786 | 20.06 | ||||||
136
Table of Contents
At December 31, 2010, BB&T’s restricted shares and restricted share units had a weighted-average life of 2.5 years. At December 31, 2010, management estimates that 12.0 million restricted shares and restricted share units will vest over a weighted-average life of 2.5 years.
Share Repurchase Activity
No shares of common stock were repurchased during 2010, 2009 and 2008. At December 31, 2010, BB&T was authorized to repurchase an additional 44 million shares under the June 27, 2006 Board of Directors’ authorization.
The balances in accumulated other comprehensive loss at December 31, 2010 and 2009 are shown in the following table.
| December 31, 2010 | December 31, 2009 | |||||||||||||||||||||||
|
Pre-Tax
Amount |
Deferred
Tax Expense (Benefit) |
After-Tax
Amount |
Pre-Tax
Amount |
Deferred
Tax Expense (Benefit) |
After-Tax
Amount |
|||||||||||||||||||
| (Dollars in millions) | ||||||||||||||||||||||||
|
Unrecognized net pension and postretirement costs |
$ | (587 | ) | $ | (219 | ) | $ | (368 | ) | $ | (447 | ) | $ | (169 | ) | $ | (278 | ) | ||||||
|
Unrealized net (losses) gains on cash flow hedges |
(75 | ) | (28 | ) | (47 | ) | 173 | 66 | 107 | |||||||||||||||
|
Unrealized net losses on securities available for sale |
(250 | ) | (93 | ) | (157 | ) | (363 | ) | (138 | ) | (225 | ) | ||||||||||||
|
FDIC's share of unrealized gains on securities available for sale under the loss share agreements (1) |
(281 | ) | (105 | ) | (176 | ) | (30 | ) | (11 | ) | (19 | ) | ||||||||||||
|
Foreign currency translation adjustment |
(6 | ) | (7 | ) | 1 | (7 | ) | (5 | ) | (2 | ) | |||||||||||||
|
Total |
$ | (1,199 | ) | $ | (452 | ) | $ | (747 | ) | $ | (674 | ) | $ | (257 | ) | $ | (417 | ) | ||||||
| (1) | Certain securities available for sale are covered by loss sharing agreements with the FDIC. These securities covered by the loss sharing agreements reflected a net unrealized pre-tax gain of $305 million and $35 million as of December 31, 2010 and 2009, respectively. The FDIC’s share of this net unrealized pre-tax gain, upon sale, would have been $281 million and $30 million as of December 31, 2010 and 2009, respectively, and was recorded as a reduction in other comprehensive income. |
As of December 31, 2010 and December 31, 2009, unrealized net losses on securities available for sale included $115 million and $114 million, respectively, of pre-tax losses related to other-than-temporarily impaired non-agency mortgage-backed securities where a portion of the loss was recognized in net income.
137
Table of Contents
The following tables reflect the components of total comprehensive income for the years ended December 31, 2010, 2009 and 2008.
| Year Ended December 31, 2010 | ||||||||||||
| Pre-Tax | Tax Effect | After-Tax | ||||||||||
| (Dollars in millions) | ||||||||||||
|
Comprehensive income: |
||||||||||||
|
Net income |
$ | 969 | $ | 115 | $ | 854 | ||||||
|
Other comprehensive income: |
||||||||||||
|
Unrealized net holding gains (losses) arising during the period on securities available for sale |
667 | 252 | 415 | |||||||||
|
Reclassification adjustment for losses (gains) on securities available for sale included in net income |
(554 | ) | (207 | ) | (347 | ) | ||||||
|
Net change in amounts attributable to the FDIC under the loss share |
(251 | ) | (94 | ) | (157 | ) | ||||||
|
Net change in unrecognized gains (losses) on cash flow hedges |
(248 | ) | (94 | ) | (154 | ) | ||||||
|
Net change in foreign currency translation adjustment |
1 | (2 | ) | 3 | ||||||||
|
Net change in pension and postretirement liability |
(140 | ) | (50 | ) | (90 | ) | ||||||
|
Total comprehensive income |
$ | 444 | $ | (80 | ) | $ | 524 | |||||
| Year Ended December 31, 2009 | ||||||||||||
| Pre-Tax | Tax Effect | After-Tax | ||||||||||
| (Dollars in millions) | ||||||||||||
|
Comprehensive income: |
||||||||||||
|
Net income |
$ | 1,036 | $ | 159 | $ | 877 | ||||||
|
Other comprehensive income: |
||||||||||||
|
Unrealized net holding gains (losses) arising during the period on securities available for sale |
353 | 130 | 223 | |||||||||
|
Reclassification adjustment for losses (gains) on securities available for sale included in net income |
(199 | ) | (75 | ) | (124 | ) | ||||||
|
Net change in amounts attributable to the FDIC under the loss share |
(30 | ) | (11 | ) | (19 | ) | ||||||
|
Net change in unrecognized gains (losses) on cash flow hedges |
97 | 38 | 59 | |||||||||
|
Net change in foreign currency translation adjustment |
2 | (5 | ) | 7 | ||||||||
|
Net change in pension and postretirement liability |
273 | 104 | 169 | |||||||||
|
Total comprehensive income |
$ | 1,532 | $ | 340 | $ | 1,192 | ||||||
| Year Ended December 31, 2008 | ||||||||||||
| Pre-Tax | Tax Effect | After-Tax | ||||||||||
| (Dollars in millions) | ||||||||||||
|
Comprehensive income: |
||||||||||||
|
Net income |
$ | 2,079 | $ | 550 | $ | 1,529 | ||||||
|
Other comprehensive income: |
||||||||||||
|
Unrealized net holding gains (losses) arising during the period on securities available for sale |
(365 | ) | (136 | ) | (229 | ) | ||||||
|
Reclassification adjustment for losses (gains) on securities available for sale included in net income |
(107 | ) | (40 | ) | (67 | ) | ||||||
|
Net change in unrecognized gains (losses) on cash flow hedges |
76 | 28 | 48 | |||||||||
|
Net change in foreign currency translation adjustment |
(12 | ) | — | (12 | ) | |||||||
|
Net change in pension and postretirement liability |
(593 | ) | (225 | ) | (368 | ) | ||||||
|
Total comprehensive income |
$ | 1,078 | $ | 177 | $ | 901 | ||||||
138
Table of Contents
The provision for income taxes comprised the following:
| Years Ended December 31, | ||||||||||||
| 2010 | 2009 | 2008 | ||||||||||
| (Dollars in millions) | ||||||||||||
|
Current expense: |
||||||||||||
|
Federal |
$ | 161 | $ | 302 | $ | 899 | ||||||
|
State |
18 | 15 | 89 | |||||||||
|
Foreign |
2 | 2 | — | |||||||||
|
Total current expense |
181 | 319 | 988 | |||||||||
|
Deferred expense (benefit): |
||||||||||||
|
Federal |
(65 | ) | (143 | ) | (406 | ) | ||||||
|
State |
(1 | ) | (17 | ) | (32 | ) | ||||||
|
Total deferred expense (benefit) |
(66 | ) | (160 | ) | (438 | ) | ||||||
|
Provision for income taxes |
$ | 115 | $ | 159 | $ | 550 | ||||||
The foreign income tax expense is related to income generated on assets controlled by a foreign subsidiary of Branch Bank.
The reasons for the difference between the provision for income taxes and the amount computed by applying the statutory Federal income tax rate to income before income taxes were as follows:
| Years Ended December 31, | ||||||||||||
| 2010 | 2009 | 2008 | ||||||||||
| (Dollars in millions) | ||||||||||||
|
Federal income taxes at statutory rate of 35% |
$ | 339 | $ | 362 | $ | 728 | ||||||
|
Increase (decrease) in provision for income taxes as a result of: |
||||||||||||
|
Addition to Federal tax reserves, net |
1 | 26 | 5 | |||||||||
|
State income taxes, net of Federal tax benefit |
11 | (2 | ) | 37 | ||||||||
|
Federal tax credits |
(105 | ) | (78 | ) | (54 | ) | ||||||
|
Interest on Federal tax refunds |
3 | (4 | ) | (66 | ) | |||||||
|
Tax exempt income |
(125 | ) | (108 | ) | (77 | ) | ||||||
|
LILO gains |
(2 | ) | (18 | ) | — | |||||||
|
Other, net |
(7 | ) | (19 | ) | (23 | ) | ||||||
|
Provision for income taxes |
$ | 115 | $ | 159 | $ | 550 | ||||||
|
Effective income tax rate |
11.9 | % | 15.3 | % | 26.5 | % | ||||||
BB&T has entered into certain transactions that have favorable tax treatment. These transactions include loans and investments that produce tax-exempt income and tax credits, reducing BB&T’s effective tax rate from the statutory rate. During the years ended December 31, 2010 and 2009, the sale of certain leveraged leases generated non-taxable gains that had a beneficial impact on the provision for income taxes that totaled $2 million and $18 million, respectively.
During the year ended December 31, 2008, BB&T agreed to treat its leveraged leases in accordance with the IRS’s proposal that, among other things, allowed 20% of deductions, imputed interest income and deemed the remaining transactions to be terminated for income tax purposes as of December 31, 2008. As a result of this settlement, BB&T recognized pre-tax interest from the IRS of $93 million, or $60 million after-tax, which is reflected as a reduction in tax expense and reduced BB&T’s effective tax rate for 2008. As a result of changes in the timing of tax payments, accounting standards required a recalculation of each leveraged lease transaction. These recalculations resulted in a $67 million charge to interest income and a corresponding $24 million tax benefit in 2008.
139
Table of Contents
The tax effects of temporary differences that gave rise to significant portions of the net deferred tax assets and liabilities are reflected in the table below. Net deferred tax assets are included in other assets on the “Consolidated Balance Sheets”.
| December 31, | ||||||||
| 2010 | 2009 | |||||||
| (Dollars in millions) | ||||||||
| Deferred tax assets: | ||||||||
|
Allowance for loan and lease losses |
$ | 1,003 | $ | 992 | ||||
|
Unrealized loss on securities available for sale |
198 | 149 | ||||||
|
Postretirement plans |
219 | 169 | ||||||
|
Equity-based compensation |
123 | 95 | ||||||
|
Loan/Securities basis difference |
165 | 195 | ||||||
|
OREO Writedown |
196 | 86 | ||||||
|
Other |
290 | 172 | ||||||
|
Total deferred tax assets |
2,194 | 1,858 | ||||||
| Deferred tax liabilities: | ||||||||
|
Lease financing |
(211 | ) | (175 | ) | ||||
|
Prepaid pension plan expense |
(360 | ) | (339 | ) | ||||
|
Loan fees & expenses |
(199 | ) | (182 | ) | ||||
|
Depreciation |
(78 | ) | (59 | ) | ||||
|
Identifiable intangible assets |
(107 | ) | (125 | ) | ||||
|
Loan servicing rights |
(218 | ) | (231 | ) | ||||
|
Unamortized FHLB loan prepayment fees |
(45 | ) | (55 | ) | ||||
|
Derivatives & hedging |
(68 | ) | (26 | ) | ||||
|
Other |
(52 | ) | (97 | ) | ||||
|
Total deferred tax liabilities |
(1,338 | ) | (1,289 | ) | ||||
|
Net deferred tax assets |
$ | 856 | $ | 569 | ||||
On a periodic basis, BB&T evaluates its income tax positions based on tax laws and regulations and financial reporting considerations, and records adjustments as appropriate. This evaluation takes into consideration the status of current taxing authorities’ examinations of BB&T’s tax returns, recent positions taken by the taxing authorities on similar transactions, if any, and the overall tax environment in relation to tax-advantaged transactions. Detailed below is a reconciliation of BB&T’s unrecognized tax benefits for the years ended December 31, 2010, 2009 and 2008. The amounts presented in the reconciliation are gross of any related tax benefits.
|
Unrecognized Tax
Benefits Years Ended December 31, |
||||||||||||
| 2010 | 2009 | 2008 | ||||||||||
| (Dollars in millions) | ||||||||||||
|
Beginning Balance |
$ | 179 | $ | 197 | $ | 219 | ||||||
|
Additions based on tax positions related to current year |
— | — | 12 | |||||||||
|
Additions (reductions) for tax positions of prior years |
— | 1 | (30 | ) | ||||||||
|
Settlements |
— | (16 | ) | — | ||||||||
|
Lapse of statute of limitations |
(1 | ) | (3 | ) | (4 | ) | ||||||
|
Total unrecognized current tax benefits |
178 | 179 | 197 | |||||||||
|
Additions based on unrecognized deferred tax benefits from business combinations |
114 | — | — | |||||||||
|
Ending Balance |
$ | 292 | $ | 179 | $ | 197 | ||||||
As of December 31, 2010, BB&T had $292 million of unrecognized Federal and state tax benefits that would have impacted the effective tax rate if recognized. In addition, the Company had $37 million and $36 million in liabilities for tax-related interest recorded on its Consolidated Balance Sheets at December 31, 2010 and 2009,
140
Table of Contents
respectively. Total interest, net of the Federal benefit, related to unrecognized tax benefits recognized in the 2010, 2009 and 2008 Consolidated Statements of Income was $1 million, $1 million and $4 million, respectively. BB&T classifies interest and penalties related to income taxes as a component of the provision for income taxes in the Consolidated Statements of Income.
The IRS has completed its Federal income tax examinations of BB&T through 2007. In connection with the settlement agreement with the IRS regarding its leveraged lease transactions, BB&T is entitled to Federal income tax refunds for tax years 1998-2006. During 2010, BB&T received Federal tax refunds including interest of approximately $379 million for tax years 1998-2006. In February 2010, BB&T received an IRS statutory notice of deficiency for tax years 2002-2007 asserting a liability for taxes, penalties and interest of approximately $892 million related to the disallowance of foreign tax credits and other deductions claimed by a deconsolidated subsidiary in connection with a financing transaction. Management has consulted with outside counsel and continues to believe that BB&T’s treatment of this transaction was in compliance with applicable tax laws and regulations. BB&T paid the disputed tax, penalties and interest, and filed a lawsuit seeking a refund in the U.S. Court of Federal Claims in March 2010. Management believes the Company’s current reserves for this matter are adequate, although the final outcome is uncertain. Final resolution of this matter is not expected to occur within the next twelve months. Various years remain subject to examination by state taxing authorities.
During the year ended December 31, 2010, BB&T finalized the tax basis valuation for the assets acquired from Colonial Bank. Based on this analysis, BB&T identified approximately $114 million in unrecognized tax benefits related to temporary differences that have been excluded from the deferred tax asset recognized at the acquisition date.
BB&T provides various benefit plans to substantially all employees, including employees of acquired entities. Employees of acquired entities generally participate in existing BB&T plans after consummation of the business combinations. The plans of acquired institutions are typically merged into the BB&T plans after consummation of the mergers, and, under these circumstances, credit is usually given to these employees for years of service at the acquired institution for vesting and eligibility purposes. The Colonial transaction, as an asset purchase, was handled differently from typical mergers. The retirement plans of Colonial were not assumed by BB&T, and as such, were not merged into the BB&T plans. Credit for years of service with Colonial, where given, was determined on a plan-by-plan basis with regard to the participation of former Colonial employees in BB&T’s plans.
The following table summarizes expenses (income) relating to employee retirement plans:
|
Years Ended
December 31, |
||||||||||||
| 2010 | 2009 | 2008 | ||||||||||
| (Dollars in millions) | ||||||||||||
|
Defined benefit plans |
$ | 22 | $ | 76 | $ | 9 | ||||||
|
Defined contribution and ESOP plans |
86 | 83 | 76 | |||||||||
|
Other |
18 | 26 | (38 | ) | ||||||||
|
Total expense related to retirement benefit plans |
$ | 126 | $ | 185 | $ | 47 | ||||||
Defined Benefit Retirement Plans
BB&T provides a defined benefit retirement plan qualified under the Internal Revenue Code that covers substantially all employees. Benefits are based on years of service, age at retirement and the employee’s compensation during the five highest consecutive years of earnings within the last ten years of employment.
In addition, supplemental retirement benefits are provided to certain key officers under supplemental defined benefit executive retirement plans, which are not qualified under the Internal Revenue Code. Although technically unfunded plans, a Rabbi Trust and insurance policies on the lives of the certain covered employees are available to finance future benefits.
141
Table of Contents
The following are the significant actuarial assumptions that were used to determine net periodic pension costs:
| December 31, | ||||||||
| 2010 | 2009 | |||||||
| Actuarial Assumptions | ||||||||
|
Weighted average assumed discount rate |
6.16 | % | 6.20 | % | ||||
|
Weighted average expected long-term rate of return on plan assets |
8.00 | 8.00 | ||||||
|
Assumed rate of annual compensation increases for the first two years |
2.50 | 2.50 | ||||||
|
Assumed rate of annual compensation increases thereafter |
4.50 | 4.50 | ||||||
The weighted average expected long-term rate of return on plan assets represents the average rate of return expected to be earned on plan assets over the period the benefits included in the benefit obligation are to be paid. In developing the expected rate of return, BB&T considers long-term compound annualized returns of historical market data for each asset category, as well as historical actual returns on the plan assets. Using this reference information, the Company develops forward-looking return expectations for each asset category and a weighted average expected long-term rate of return for the plan based on target asset allocations contained in BB&T’s Investment Policy Statement.
Financial data relative to the defined benefit pension plans is summarized in the following tables for the years indicated. The qualified pension plan prepaid asset is recorded on the Consolidated Balance Sheets as a component of other assets and the nonqualified pension plans accrued liability is recorded on the Consolidated Balance Sheets as a component of other liabilities. The data is calculated using an actuarial measurement date of December 31.
|
Years Ended
December 31, |
||||||||||||
| 2010 | 2009 | 2008 | ||||||||||
| (Dollars in millions) | ||||||||||||
| Net Periodic Pension Cost | ||||||||||||
|
Service cost |
$ | 83 | $ | 76 | $ | 69 | ||||||
|
Interest cost |
93 | 86 | 81 | |||||||||
|
Estimated return on plan assets |
(178 | ) | (144 | ) | (139 | ) | ||||||
|
Net amortization and other |
24 | 58 | (2 | ) | ||||||||
|
Net periodic pension cost |
22 | 76 | 9 | |||||||||
| Pre-Tax Amounts Recognized in Comprehensive Income (Loss) | ||||||||||||
|
Net actuarial loss (gain) |
133 | (228 | ) | 590 | ||||||||
|
Amortization of prior service cost |
1 | 2 | 4 | |||||||||
|
Amortization of net gain |
(25 | ) | (60 | ) | (2 | ) | ||||||
|
Net amount recognized in comprehensive income |
109 | (286 | ) | 592 | ||||||||
|
Total net periodic pension costs (income) recognized in total comprehensive income |
$ | 131 | $ | (210 | ) | $ | 601 | |||||
The following are the significant actuarial assumptions that were used to determine benefit obligations:
| December 31, | ||||||||
| 2010 | 2009 | |||||||
| Actuarial Assumptions | ||||||||
|
Weighted average assumed discount rate |
5.52 | % | 6.16 | % | ||||
|
Assumed long-term rate of annual compensation increases (1) |
4.50 | 4.50 | ||||||
| (1) | Represents the rate to be achieved by 2015 for the current year’s calculation and 2011 for the prior year’s calculation. |
142
Table of Contents
|
Qualified
Pension Plan |
Nonqualified
Pension Plans |
|||||||||||||||
|
Years Ended
December 31, |
Years Ended
December 31, |
|||||||||||||||
| 2010 | 2009 | 2010 | 2009 | |||||||||||||
| (Dollars in millions) | ||||||||||||||||
| Change in Projected Benefit Obligation | ||||||||||||||||
|
Projected benefit obligation, January 1, |
$ | 1,378 | $ | 1,260 | $ | 145 | $ | 140 | ||||||||
|
Service cost |
78 | 72 | 5 | 4 | ||||||||||||
|
Interest cost |
84 | 77 | 9 | 9 | ||||||||||||
|
Actuarial loss |
203 | 15 | 31 | — | ||||||||||||
|
Benefits paid |
(47 | ) | (46 | ) | (8 | ) | (8 | ) | ||||||||
|
Projected benefit obligation, December 31, |
$ | 1,696 | $ | 1,378 | $ | 182 | $ | 145 | ||||||||
|
Qualified
Pension Plan |
Nonqualified
Pension Plans |
|||||||||||||||
|
Years Ended
December 31, |
Years Ended
December 31, |
|||||||||||||||
| 2010 | 2009 | 2010 | 2009 | |||||||||||||
| (Dollars in millions) | ||||||||||||||||
| Change in Plan Assets | ||||||||||||||||
|
Fair value of plan assets, January 1, |
$ | 2,184 | $ | 1,371 | $ | — | $ | — | ||||||||
|
Actual return on plan assets |
279 | 387 | — | — | ||||||||||||
|
Employer contributions |
68 | 472 | 8 | 8 | ||||||||||||
|
Benefits paid |
(47 | ) | (46 | ) | (8 | ) | (8 | ) | ||||||||
|
Fair value of plan assets, December 31, |
2,484 | 2,184 | — | — | ||||||||||||
|
Funded status at end of year |
$ | 788 | $ | 806 | $ | (182 | ) | $ | (145 | ) | ||||||
|
Qualified
Pension Plan |
Nonqualified
Pension Plans |
|||||||||||||||
|
Years Ended
December 31, |
Years Ended
December 31, |
|||||||||||||||
| 2010 | 2009 | 2010 | 2009 | |||||||||||||
| (Dollars in millions) | ||||||||||||||||
|
Pre-Tax Amounts Recognized in Accumulated Other Comprehensive Income (Loss) |
||||||||||||||||
|
Prior service credit (cost) |
$ | 2 | $ | 2 | $ | (1 | ) | $ | — | |||||||
|
Net actuarial loss |
(523 | ) | (445 | ) | (50 | ) | (22 | ) | ||||||||
|
Net amount recognized |
$ | (521 | ) | $ | (443 | ) | $ | (51 | ) | $ | (22 | ) | ||||
The expected amortization of unrecognized prior service credit and unrecognized net actuarial losses for the qualified plan and nonqualified plans that are expected to be amortized from accumulated other comprehensive income (loss) into net periodic pension cost during 2011 are reflected in the following table:
|
Qualified
Pension Plan |
Nonqualified
Pension Plans |
|||||||
| (Dollars in millions) | ||||||||
| Expected Amortization for 2011 | ||||||||
|
Prior service credit |
$ | (1 | ) | $ | — | |||
|
Net actuarial loss |
28 | 4 | ||||||
|
Net amount to be amortized in 2011 |
$ | 27 | $ | 4 | ||||
The accumulated benefit obligation for the qualified plans totaled $1.5 billion and $1.2 billion at December 31, 2010 and 2009, respectively. For the nonqualified plans, the accumulated benefit obligation totaled $156 million and $133 million at December 31, 2010 and 2009, respectively.
143
Table of Contents
Employer contributions to the qualified pension plan are in amounts between the minimum required for funding standard accounts and the maximum amount deductible for federal income tax purposes. Management is not required to make a contribution to the qualified pension plan during 2011; however, management may make additional contributions during 2011 if deemed appropriate. For the nonqualified plans the employer contributions are based on benefit payments. The following table reflects the estimated benefit payments reflecting expected future service for the next five years and for the years 2016 through 2020.
|
Qualified
Pension Plan |
Nonqualified
Pension Plans |
|||||||
| (Dollars in millions) | ||||||||
|
Estimated Benefit Payments |
||||||||
|
2011 |
$ | 53 | $ | 9 | ||||
|
2012 |
59 | 9 | ||||||
|
2013 |
64 | 10 | ||||||
|
2014 |
70 | 10 | ||||||
|
2015 |
77 | 11 | ||||||
|
2016-2020 |
507 | 61 | ||||||
BB&T’s primary total return objective is to achieve returns that, over the long term, will fund retirement liabilities and provide for the desired plan benefits in a manner that satisfies the fiduciary requirements of the Employee Retirement Income Security Act. The plan assets have a long-term, indefinite time horizon that runs concurrent with the average life expectancy of the participants. As such, the Plan can assume a time horizon that extends well beyond a full market cycle, and can assume an above-average level of risk, as measured by the standard deviation of annual return. It is expected, however, that both professional investment management and sufficient portfolio diversification will smooth volatility and help to generate a reasonable consistency of return. The investments are broadly diversified among economic sector, industry, quality and size in order to reduce risk and to produce incremental return. Within approved guidelines and restrictions, investment managers have wide discretion over the timing and selection of individual investments.
BB&T periodically reviews its asset allocation and investment policy and makes changes to its target asset allocation. BB&T has established guidelines within each asset category to ensure the appropriate balance of risk and reward. The current target asset allocations for the plan assets, which were established in 2006, include a range of 35% to 45% for U.S. equity securities, 7% to 13% for international equity securities, 20% to 30% for fixed income securities, and 10% to 30% for alternative investments, which include real estate, hedge funds, private equities and commodities, with any remainder to be held in cash equivalents. In January 2009, the Compensation Committee amended the Statement of Investment Policies to revise the asset allocation strategy for the Plan and the Trust to have no additional commitments in hedge funds and commodities until further notice. Currently, the asset allocations of other plan asset classes may be outside of established parameters pending adoption of the new asset allocation strategy.
The fair value of BB&T’s pension plan assets at December 31, 2010 and 2009, by asset category are reflected in the following tables. The three level fair value hierarchy that describes the inputs used to measure these plan assets is defined in Note 19 “Fair Value Disclosures”.
| 12/31/10 | Fair Value Measurements for Plan Assets | |||||||||||||||
| Level 1 | Level 2 | Level 3 | ||||||||||||||
| (Dollars in millions) | ||||||||||||||||
| Plan assets: | ||||||||||||||||
|
U.S. equity securities (1) |
$ | 1,098 | $ | 1,098 | $ | — | $ | — | ||||||||
|
International equity securities (2) |
488 | 384 | 104 | — | ||||||||||||
|
Fixed income securities |
766 | 121 | 645 | — | ||||||||||||
|
Alternative investments |
124 | — | — | 124 | ||||||||||||
|
Total plan assets (3) |
$ | 2,476 | $ | 1,603 | $ | 749 | $ | 124 | ||||||||
| (1) | Included in U.S. equity securities is 3.615 million shares of BB&T common stock valued at $95 million at December 31, 2010. |
144
Table of Contents
| (2) | This category includes a common/commingled fund that is comprised of assets from several accounts, pooled together, to reduce management and administration costs. |
| (3) | The total fair value of plan assets excludes $8 million of accrued income at December 31, 2010. |
| 12/31/09 | Fair Value Measurements for Plan Assets | |||||||||||||||
| Level 1 | Level 2 | Level 3 | ||||||||||||||
| (Dollars in millions) | ||||||||||||||||
| Plan assets: | ||||||||||||||||
|
U.S. equity securities (1) |
$ | 977 | $ | 977 | $ | — | $ | — | ||||||||
|
International equity securities (2) |
442 | 332 | 110 | — | ||||||||||||
|
Fixed income securities |
641 | 111 | 530 | — | ||||||||||||
|
Alternative investments |
117 | — | 25 | 92 | ||||||||||||
|
Total plan assets (3) |
$ | 2,177 | $ | 1,420 | $ | 665 | $ | 92 | ||||||||
| (1) | Included in U.S. equity securities is 3.593 million shares of BB&T common stock valued at $92 million at December 31, 2009. |
| (2) | This category includes a common/commingled fund that is comprised of assets from several accounts, pooled together, to reduce management and administration costs. |
| (3) | The total fair value of plan assets excludes $7 million of accrued income at December 31, 2009. |
The following tables present the activity for Level 3 plan assets for the years ended December 31, 2010 and 2009.
|
Fair Value Measurements Using
Significant Unobservable Inputs |
||||
|
Alternative
Investments |
||||
| (Dollars in millions) | ||||
| Balance at January 1, 2010 | $ | 92 | ||
|
Actual return on plan assets |
9 | |||
|
Purchases, sales and settlements (1) |
23 | |||
| Balance at December 31, 2010 | $ | 124 | ||
| (1) | The net purchases in alternative investments during 2010 relates to investment commitments that existed prior to January 1, 2009. |
|
Fair Value Measurements Using
Significant Unobservable Inputs |
||||||||
|
U.S. Equity
Securities (1) |
Alternative
Investments |
|||||||
| (Dollars in millions) | ||||||||
| Balance at January 1, 2009 | $ | 61 | $ | 90 | ||||
|
Actual return on plan assets |
(12 | ) | 12 | |||||
|
Purchases, sales and settlements |
— | (10 | ) | |||||
|
Transfers in/out out of Level 3 |
(49 | ) | — | |||||
| Balance at December 31, 2009 | $ | — | $ | 92 | ||||
| (1) | Relates to shares of BB&T common stock that were restricted. These shares were transferred to Level 1 upon the lapse of the restriction. |
Postretirement Benefits Other than Pension
BB&T provides certain postretirement benefits. These benefits provide covered employees a subsidy for purchasing health care and life insurance. In 2004, BB&T changed its postretirement benefit to eliminate the subsidy for those employees retiring after December 31, 2004. BB&T also reduced the subsidy paid to employees who retired on or before December 31, 2004, were age 55 years or older, and had at least ten years of service. For those employees, the subsidy is based upon years of service of the employee at the time of retirement. The effect of the change in subsidy has been accounted for as a plan amendment and reduced the projected benefit obligation by $96 million, which is being amortized as a reduction of benefit costs over approximately 17 years. At
145
Table of Contents
December 31, 2010 and 2009, the projected benefit obligation was $65 million and $39 million, respectively. There are no plan assets assigned to the plan. Employer contributions to the plan are based on benefit payments. The estimated benefit payments for other postretirement benefits are $7 million, $6 million, $5 million, $5 million and $5 million for the next five years and $21 million for the years 2016 through 2020.
Defined Contribution Plans
BB&T offers a 401(k) Savings Plan and other defined contribution plans that permit employees to contribute from 1% to 50% of their cash compensation. For full-time employees who are 21 years of age or older with one year or more of service, BB&T makes matching contributions of up to 6% of the employee’s compensation. BB&T’s contribution to the 401(k) Savings Plan and nonqualified defined contribution plans totaled $83 million, $80 million and $73 million for the years ended December 31, 2010, 2009 and 2008, respectively. BB&T also offers defined contribution plans to certain employees of subsidiaries who do not participate in the 401(k) Savings Plan.
Other
There are various other employment contracts, deferred compensation arrangements and covenants not to compete with selected members of management and certain retirees.
BB&T utilizes a variety of financial instruments to meet the financing needs of clients and to reduce exposure to fluctuations in interest rates. These financial instruments include commitments to extend credit, letters of credit and financial guarantees and derivatives. BB&T also has commitments to fund certain affordable housing investments and contingent liabilities of certain sold loans. The following table presents the contractual or notional amount of these instruments:
|
Contract or Notional
Amount at December 31, |
||||||||
| 2010 | 2009 | |||||||
| (Dollars in millions) | ||||||||
|
Financial instruments whose contract amounts represent credit risk: |
||||||||
|
Commitments to extend, originate or purchase credit |
$ | 36,917 | $ | 36,130 | ||||
|
Letters of credit and financial guarantees written |
7,291 | 7,999 | ||||||
|
Financial instruments whose notional or contract amounts exceed the amount of credit risk: |
||||||||
|
Derivative financial instruments |
65,386 | 66,260 | ||||||
|
Commitments to fund low income housing investments |
334 | 371 | ||||||
|
Residential mortgage loans sold with recourse |
1,624 | 1,986 | ||||||
|
All other loans sold with recourse |
4,352 | 3,989 | ||||||
Commitments to extend, originate or purchase credit are primarily lines of credit to businesses and consumers and have specified rates and maturity dates. Many of these commitments also have adverse change clauses, which allow BB&T to cancel the commitment due to deterioration in the borrowers’ creditworthiness.
Letters of credit and financial guarantees written are unconditional commitments issued by BB&T to guarantee the performance of a customer to a third party. These guarantees are primarily issued to support public and private borrowing arrangements, including commercial paper issuance, bond financing and similar transactions, the majority of which are to tax exempt entities. The credit risk involved in the issuance of these guarantees is essentially the same as that involved in extending loans to clients and as such, the instruments are collateralized when necessary. As of December 31, 2010 and 2009, BB&T had issued letters of credit totaling $7.3 billion and $8.0 billion, respectively. The carrying amount of the liability for such guarantees was $41 million and $40 million at December 31, 2010 and 2009, respectively.
A derivative is a financial instrument that derives its cash flows, and therefore its value, by reference to an underlying instrument, index or referenced interest rate. For additional disclosures related to BB&T’s derivatives refer to Note 20.
146
Table of Contents
In the ordinary course of business, BB&T indemnifies its officers and directors to the fullest extent permitted by law against liabilities arising from pending litigation. BB&T also issues standard representations and warranties in underwriting agreements, merger and acquisition agreements, loan sales, brokerage activities and other similar arrangements. Counterparties in many of these indemnification arrangements provide similar indemnifications to BB&T. Although these agreements often do not specify limitations, BB&T does not believe that any payments related to these guarantees would materially change the financial condition or results of operations of BB&T.
Merger and acquisition agreements of businesses other than financial institutions occasionally include additional incentives to the acquired entities to offset the loss of future cash flows previously received through ownership positions. Typically, these incentives are based on the acquired entity’s contribution to BB&T’s earnings compared to agreed-upon amounts. When offered, these incentives are typically issued for terms of three to five years. As certain provisions of these agreements do not specify dollar limitations, it is not possible to quantify the maximum exposure resulting from these agreements.
In connection with the Colonial acquisition, Branch Bank entered into loss sharing agreements with the FDIC related to certain assets acquired. Pursuant to the terms of these loss sharing agreements, the FDIC’s obligation to reimburse Branch Bank for losses with respect to certain loans, OREO, certain investment securities and other assets (collectively, “covered assets”), begins with the first dollar of loss incurred. The terms of the loss sharing agreement with respect to certain non-agency mortgage-backed securities provides that Branch Bank will be reimbursed by the FDIC for 95% of any and all losses. All other covered assets are subject to a stated threshold of $5 billion that provides for the FDIC to reimburse Branch Bank for (1) 80% of losses incurred up to $5 billion and (2) 95% of losses in excess of $5 billion. Gains and recoveries on covered assets will offset losses, or be paid to the FDIC, at the applicable loss share percentage at the time of recovery. The loss sharing agreement applicable to single family residential mortgage loans provides for FDIC loss sharing and Branch Bank reimbursement to the FDIC, in each case as described above, for ten years. The loss sharing agreement applicable to commercial loans and other covered assets provides for FDIC loss sharing for five years and Branch Bank reimbursement to the FDIC for gains and recoveries for a total of eight years, in each case as described above.
The provisions of the loss sharing agreements may also require a payment by BB&T to the FDIC on October 15, 2019. On that date, BB&T is required to pay the FDIC 55% of the excess, if any, of (i) $1 billion over (ii) the sum of (A) 25% of the total net amounts paid to BB&T under both of the loss sharing agreements (i.e., BB&T’s payments received from the FDIC for losses, offset by BB&T’s payments made to the FDIC for recoveries) plus (B) 20% of the deemed total cost to BB&T of administering the assets covered under the loss sharing agreements other than shared loss securities. The deemed total cost to BB&T of administering the covered assets is the sum of 2% of the average of the principal amount of shared loss loans and shared loss assets (other than the shared loss securities) based on the beginning and end of year balances for each of the 10 years during which the shared loss agreements are in effect. In addition, any payments made by either party with respect to the securities with a 95% loss share will be excluded from this calculation.
BB&T invests in certain affordable housing and historic building rehabilitation projects throughout its market area as a means of supporting local communities, and receives tax credits related to these investments. BB&T typically acts as a limited partner in these investments and does not exert control over the operating or financial policies of the partnerships. Branch Bank typically provides financing during the construction and development of the properties; however, permanent financing is generally obtained from independent third parties upon completion of a project. As of December 31, 2010 and 2009, BB&T had investments of $1.2 billion and $1.1 billion, respectively, related to these projects, which are included as other assets on the Consolidated Balance Sheets. BB&T’s outstanding commitments to fund affordable housing investments totaled $334 million and $371 million at December 31, 2010 and 2009, respectively, which are included as other liabilities on the Consolidated Balance Sheets. As of December 31, 2010 and 2009, BB&T had outstanding loan commitments to these funds of $135 million and $165 million, respectively. Of these amounts, $36 million and $73 million had been funded at December 31, 2010 and 2009, respectively, and were included in loans and leases on the Consolidated Balance Sheets. BB&T’s maximum risk exposure related to these investments totaled $1.3 billion and $1.2 billion at December 31, 2010 and 2009, respectively.
147
Table of Contents
BB&T has sold certain mortgage-related loans that contain recourse provisions. These provisions generally require BB&T to reimburse the investor for a share of any loss that is incurred after the disposal of the property. At December 31, 2010 and 2009, BB&T had $1.6 billion and $2.0 billion, respectively, of residential mortgage loans sold with recourse. In the event of nonperformance by the borrower, BB&T has maximum recourse exposure of approximately $597 million and $667 million as of December 31, 2010 and 2009, respectively. In addition, BB&T has $4.4 billion and $4.0 billion in commercial loans serviced for others that were covered by recourse provisions at December 31, 2010 and 2009, respectively. As of December 31, 2010 and 2009, BB&T’s maximum exposure to loss for these loans is approximately $1.2 billion and $1.1 billion, respectively. BB&T has recorded $25 million and $18 million of reserves related to these recourse exposures at December 31, 2010 and 2009, respectively.
BB&T also issues standard representations and warranties related to mortgage loan sales to government-sponsored entities. Although these agreements often do not specify limitations, BB&T does not believe that any payments related to these warranties would materially change the financial condition or results of operations of BB&T. As of December 31, 2010, BB&T has recorded $15 million of reserves related to potential losses resulting from repurchases of loans sold.
BB&T has investments and future funding commitments to certain venture capital funds. As of December 31, 2010 and 2009, BB&T had investments of $266 million and $281 million related to these ventures, respectively. As of December 31, 2010 and 2009, BB&T had future funding commitments of $185 million and $183 million, respectively. BB&T’s risk exposure relating to such commitments is generally limited to the amount of investments and future funding commitments made.
The nature of the business of BB&T’s banking and other subsidiaries ordinarily results in a certain amount of claims, litigation, investigations and legal and administrative cases and proceedings, all of which are considered incidental to the normal conduct of business. BB&T believes it has meritorious defenses to the claims asserted against it in its currently outstanding legal proceedings and, with respect to such legal proceedings, intends to continue to defend itself vigorously, litigating or settling cases according to management’s judgment as to what is in the best interests of BB&T and its shareholders.
The Company is a defendant in three separate cases primarily challenging the Company’s daily ordering of debit transactions posted to customer checking accounts for the period from 2003 to 2010. The plaintiffs have requested class action treatment, however, no class has been certified. The court has denied motions by the Company to dismiss these cases and compel them to be submitted to individual arbitration. The Company has filed appeals in all three matters, which, if granted, would preclude class action treatment. Even if those appeals are denied, the Company believes it has meritorious defenses against these matters, including class certification. Because of these appeals, and because these cases are in the early stages and no damages have been specified, no specific loss or range of loss can be determined currently.
On at least a quarterly basis, BB&T assesses its liabilities and contingencies in connection with outstanding legal proceedings utilizing the latest information available. For those matters where it is probable that BB&T will incur a loss and the amount of the loss can be reasonably estimated, BB&T records a liability in its consolidated financial statements. These legal reserves may be increased or decreased to reflect any relevant developments on a quarterly basis. For other matters, where a loss is not probable or the amount of the loss is not estimable, BB&T has not accrued legal reserves. While the outcome of legal proceedings is inherently uncertain, based on information currently available, advice of counsel and available insurance coverage, BB&T’s management believes that its established legal reserves are adequate and the liabilities arising from BB&T’s legal proceedings will not have a material adverse effect on the consolidated financial position, consolidated results of operations or consolidated cash flows of BB&T. However, in the event of unexpected future developments, it is possible that the ultimate resolution of these matters, if unfavorable, may be material to BB&T’s consolidated financial position, consolidated results of operations or consolidated cash flows.
148
Table of Contents
Branch Bank and BB&T FSB are required by the Board of Governors of the Federal Reserve System to maintain reserve balances in the form of vault cash or deposits with the Federal Reserve Bank based on specified percentages of certain deposit types, subject to various adjustments. At December 31, 2010, the net reserve requirement amounted to $361 million.
Branch Bank is subject to laws and regulations that limit the amount of dividends it can pay. In addition, both BB&T and Branch Bank are subject to various regulatory restrictions relating to the payment of dividends, including requirements to maintain capital at or above regulatory minimums, and to remain “well-capitalized” under the prompt corrective action regulations. BB&T does not expect that any of these laws, regulations or policies will materially affect the ability of Branch Bank to pay dividends.
BB&T is subject to various regulatory capital requirements administered by the Federal banking agencies. Failure to meet minimum capital requirements can initiate certain mandatory—and possibly additional discretionary—actions by regulators that, if undertaken, could have a direct material effect on BB&T’s financial statements. Under capital adequacy guidelines and the regulatory framework for prompt corrective action, the Corporation must meet specific capital guidelines that involve quantitative measures of BB&T’s assets, liabilities and certain off-balance-sheet items calculated pursuant to regulatory directives. BB&T’s capital amounts and classification also are subject to qualitative judgments by the regulators about components, risk weightings and other factors. BB&T is in full compliance with these requirements. Banking regulations also identify five capital categories for insured depository institutions: well-capitalized, adequately capitalized, undercapitalized, significantly undercapitalized and critically undercapitalized. At December 31, 2010 and 2009, BB&T and Branch Bank were classified as “well capitalized”.
Quantitative measures established by regulation to ensure capital adequacy require BB&T to maintain minimum amounts and ratios of total and Tier 1 capital (as defined in the regulations) to risk-weighted assets (as defined), and of Tier 1 capital to average tangible assets (leverage ratio).
The following table provides summary information regarding regulatory capital for BB&T and Branch Bank as of December 31, 2010 and 2009:
| December 31, 2010 | December 31, 2009 | |||||||||||||||||||||||||||||||
| Actual Capital | Capital Requirements | Actual Capital | Capital Requirements | |||||||||||||||||||||||||||||
| Ratio | Amount | Minimum | Well-Capitalized | Ratio | Amount | Minimum | Well-Capitalized | |||||||||||||||||||||||||
| (Dollars in millions) | ||||||||||||||||||||||||||||||||
| Tier 1 Capital | ||||||||||||||||||||||||||||||||
|
BB&T |
11.8 | % | $ | 13,959 | $ | 4,725 | $ | 7,088 | 11.5 | % | $ | 13,456 | $ | 4,687 | $ | 7,030 | ||||||||||||||||
|
Branch Bank |
13.0 | 14,650 | 4,499 | 6,749 | 12.1 | 13,544 | 4,480 | 6,720 | ||||||||||||||||||||||||
| Total Capital | ||||||||||||||||||||||||||||||||
|
BB&T |
15.5 | 18,319 | 9,450 | 11,813 | 15.8 | 18,470 | 9,373 | 11,717 | ||||||||||||||||||||||||
|
Branch Bank |
15.5 | 17,417 | 8,998 | 11,248 | 14.6 | 16,404 | 8,960 | 11,200 | ||||||||||||||||||||||||
| Leverage Capital | ||||||||||||||||||||||||||||||||
|
BB&T |
9.1 | 13,959 | 6,134 | 7,667 | 8.5 | 13,456 | 6,322 | 7,903 | ||||||||||||||||||||||||
|
Branch Bank |
9.9 | 14,650 | 4,425 | 7,375 | 8.9 | 13,544 | 4,566 | 7,610 | ||||||||||||||||||||||||
As an approved seller/servicer, Branch Bank is required to maintain minimum levels of shareholders’ equity, as specified by various agencies, including the United States Department of Housing and Urban Development, Government National Mortgage Association, Federal Home Loan Mortgage Corporation and Federal National Mortgage Association. At December 31, 2010 and 2009, Branch Bank’s equity was above all required levels.
At December 31, 2010 and 2009, BB&T had segregated cash deposits totaling $309 million and $270 million, respectively. These deposits relate to monies held for the exclusive benefit of clients, primarily at BB&T’s broker/dealer subsidiaries.
149
Table of Contents
Parent Company
Condensed Balance Sheets
December 31, 2010 and 2009
| 2010 | 2009 | |||||||
| (Dollars in millions) | ||||||||
| Assets | ||||||||
|
Cash and due from banks |
$ | 212 | $ | 145 | ||||
|
Securities available for sale at fair value |
104 | 170 | ||||||
|
Investment in banking subsidiaries |
20,187 | 19,575 | ||||||
|
Investment in other subsidiaries |
1,485 | 1,736 | ||||||
|
Total investments in subsidiaries |
21,672 | 21,311 | ||||||
|
Advances to / receivables from banking subsidiaries |
3,065 | 2,817 | ||||||
|
Advances to / receivables from other subsidiaries |
2,213 | 2,259 | ||||||
|
Premises and equipment |
— | 4 | ||||||
|
Other assets |
331 | 267 | ||||||
|
Total assets |
$ | 27,597 | $ | 26,973 | ||||
| Liabilities and Shareholders’ Equity | ||||||||
|
Short-term borrowed funds |
$ | 806 | $ | 1,004 | ||||
|
Short-term borrowed funds due to subsidiaries |
3 | — | ||||||
|
Dividends payable |
104 | 103 | ||||||
|
Accounts payable and other liabilities |
124 | 142 | ||||||
|
Long-term debt |
6,254 | 5,899 | ||||||
|
Long-term debt due to subsidiaries |
3,808 | 3,584 | ||||||
|
Total liabilities |
11,099 | 10,732 | ||||||
|
Total shareholders’ equity |
16,498 | 16,241 | ||||||
|
Total liabilities and shareholders’ equity |
$ | 27,597 | $ | 26,973 | ||||
150
Table of Contents
Parent Company
Condensed Income Statements
Years Ended December 31, 2010, 2009 and 2008
| 2010 | 2009 | 2008 | ||||||||||
| (Dollars in millions) | ||||||||||||
| Income | ||||||||||||
|
Dividends from banking subsidiaries |
$ | 345 | $ | 459 | $ | 1,172 | ||||||
|
Dividends from other subsidiaries |
321 | 306 | 404 | |||||||||
|
Interest and other income from subsidiaries |
138 | 89 | 155 | |||||||||
|
Other income (loss) |
4 | 3 | (67 | ) | ||||||||
|
Total income |
808 | 857 | 1,664 | |||||||||
| Expenses | ||||||||||||
|
Interest expense |
445 | 302 | 273 | |||||||||
|
Other expenses |
38 | 16 | 32 | |||||||||
|
Total expenses |
483 | 318 | 305 | |||||||||
|
Income before income taxes and equity in undistributed earnings of subsidiaries |
325 | 539 | 1,359 | |||||||||
|
Income tax benefit |
60 | 42 | 76 | |||||||||
|
Income before equity in undistributed earnings of subsidiaries |
385 | 581 | 1,435 | |||||||||
|
Equity in undistributed earnings of subsidiaries in excess of dividends from subsidiaries |
469 | 296 | 94 | |||||||||
| Net income | 854 | 877 | 1,529 | |||||||||
|
Noncontrolling interests |
38 | 24 | 10 | |||||||||
|
Dividends and accretion on preferred stock |
— | 124 | 21 | |||||||||
| Net income available to common shareholders | $ | 816 | $ | 729 | $ | 1,498 | ||||||
151
Table of Contents
Parent Company
Condensed Statements of Cash Flows
Years Ended December 31, 2010, 2009 and 2008
| 2010 | 2009 | 2008 | ||||||||||
| (Dollars in millions) | ||||||||||||
| Cash Flows From Operating Activities: | ||||||||||||
|
Net income |
$ | 854 | $ | 877 | $ | 1,529 | ||||||
|
Adjustments to reconcile net income to net cash provided by operating activities: |
||||||||||||
|
Equity in earnings of subsidiaries in excess of dividends from subsidiaries |
(469 | ) | (296 | ) | (94 | ) | ||||||
|
Amortization of intangibles |
2 | 3 | 3 | |||||||||
|
Discount accretion and premium amortization |
5 | 2 | 4 | |||||||||
|
Loss on sales of securities |
— | 12 | 47 | |||||||||
|
Increase in other assets |
(147 | ) | (41 | ) | (38 | ) | ||||||
|
(Decrease) increase in accounts payable and accrued liabilities |
(24 | ) | 50 | 7 | ||||||||
|
Other, net |
(72 | ) | (28 | ) | 3 | |||||||
|
Net cash provided by operating activities |
149 | 579 | 1,461 | |||||||||
| Cash Flows From Investing Activities: | ||||||||||||
|
Proceeds from sales, calls and maturities of securities available for sale |
87 | 33 | 62 | |||||||||
|
Purchases of securities available for sale |
(8 | ) | (43 | ) | (161 | ) | ||||||
|
Investment in subsidiaries |
(113 | ) | (2,608 | ) | (3,102 | ) | ||||||
|
Advances to subsidiaries |
(37,341 | ) | (61,087 | ) | (38,168 | ) | ||||||
|
Proceeds from repayment of advances to subsidiaries |
37,028 | 61,345 | 37,242 | |||||||||
|
Net cash used in investing activities |
(347 | ) | (2,360 | ) | (4,127 | ) | ||||||
| Cash Flows From Financing Activities: | ||||||||||||
|
Net increase in long-term debt |
765 | 3,651 | 716 | |||||||||
|
Net decrease in short-term borrowed funds |
(198 | ) | (705 | ) | (88 | ) | ||||||
|
Net increase in advances from subsidiaries |
3 | — | — | |||||||||
|
Net proceeds from common stock issued |
110 | 2,727 | 160 | |||||||||
|
Retirement of preferred stock and warrant |
— | (3,201 | ) | — | ||||||||
|
Proceeds from preferred stock issuance |
— | — | 3,134 | |||||||||
|
Cash dividends paid on common and preferred stock |
(415 | ) | (820 | ) | (1,019 | ) | ||||||
|
Net cash provided by financing activities |
265 | 1,652 | 2,903 | |||||||||
|
Net Increase (Decrease) in Cash and Cash Equivalents |
67 | (129 | ) | 237 | ||||||||
|
Cash and Cash Equivalents at Beginning of Year |
145 | 274 | 37 | |||||||||
|
Cash and Cash Equivalents at End of Year |
$ | 212 | $ | 145 | $ | 274 | ||||||
152
Table of Contents
BB&T carries various assets and liabilities at fair value based on applicable accounting standards. In addition, BB&T has elected to account for prime residential mortgage and commercial mortgage loans originated as loans held for sale at fair value in accordance with applicable accounting standards (the “Fair Value Option”). BB&T also has certain loans held for sale that were originated as loans held for investment. These loans are carried at the lower of cost or market. Accounting standards define fair value as the exchange price that would be received on the measurement date to sell an asset or the price paid to transfer a liability in the principal or most advantageous market available to the entity in an orderly transaction between market participants. These standards also established a three level fair value hierarchy that describes the inputs that are used to measure assets and liabilities. Level 1 asset and liability fair values are based on quoted prices in active markets for identical assets and liabilities. Level 2 asset and liability fair values are based on observable inputs that include: quoted market prices for similar assets or liabilities; quoted market prices that are not in an active market; or other inputs that are observable in the market and can be corroborated by observable market data for substantially the full term of the assets or liabilities. Level 3 assets and liabilities are financial instruments whose value is calculated by the use of pricing models and/or discounted cash flow methodologies, as well as financial instruments for which the determination of fair value requires significant management judgment or estimation. These methodologies may result in a significant portion of the fair value being derived from unobservable data.
Assets and liabilities measured at fair value on a recurring basis, including financial instruments for which BB&T has elected the Fair Value Option are summarized below:
|
Fair Value Measurements for Assets and Liabilities
Measured on a Recurring Basis |
||||||||||||||||
| 12/31/2010 | Level 1 | Level 2 | Level 3 | |||||||||||||
| (Dollars in millions) | ||||||||||||||||
| Assets: | ||||||||||||||||
|
Trading securities |
$ | 633 | $ | 276 | $ | 346 | $ | 11 | ||||||||
|
Securities available for sale: |
||||||||||||||||
|
U.S. government-sponsored entities (GSE) |
103 | — | 103 | — | ||||||||||||
|
Mortgage-backed securities issued by GSE |
18,344 | — | 18,344 | — | ||||||||||||
|
States and political subdivisions |
1,909 | — | 1,790 | 119 | ||||||||||||
|
Non-agency mortgage-backed securities |
515 | — | 515 | — | ||||||||||||
|
Equity and other securities |
759 | 147 | 605 | 7 | ||||||||||||
|
Covered securities |
1,539 | — | 585 | 954 | ||||||||||||
|
Loans held for sale (1) |
3,176 | — | 3,176 | — | ||||||||||||
|
Residential mortgage servicing rights |
830 | — | — | 830 | ||||||||||||
|
Derivative assets: (2) |
||||||||||||||||
|
Interest rate contracts |
926 | 1 | 913 | 12 | ||||||||||||
|
Foreign exchange contracts |
7 | — | 7 | — | ||||||||||||
|
Venture capital and similar investments (2)(3) |
266 | — | — | 266 | ||||||||||||
|
Total assets |
$ | 29,007 | $ | 424 | $ | 26,384 | $ | 2,199 | ||||||||
| Liabilities: | ||||||||||||||||
|
Derivative liabilities: (2) |
||||||||||||||||
|
Interest rate contracts |
$ | 996 | $ | 10 | $ | 949 | $ | 37 | ||||||||
|
Foreign exchange contracts |
6 | — | 6 | — | ||||||||||||
|
Short-term borrowed funds (4) |
233 | — | 233 | — | ||||||||||||
|
Total liabilities |
$ | 1,235 | $ | 10 | $ | 1,188 | $ | 37 | ||||||||
153
Table of Contents
|
Fair Value Measurements for Assets and Liabilities
Measured on a Recurring Basis |
||||||||||||||||
| 12/31/2009 | Level 1 | Level 2 | Level 3 | |||||||||||||
| (Dollars in millions) | ||||||||||||||||
| Assets: | ||||||||||||||||
|
Trading securities |
$ | 636 | $ | 255 | $ | 288 | $ | 93 | ||||||||
|
Securities available for sale: |
||||||||||||||||
|
U.S. government-sponsored entities (GSE) |
2,035 | — | 2,035 | — | ||||||||||||
|
Mortgage-backed securities issued by GSE |
26,670 | — | 26,670 | — | ||||||||||||
|
States and political subdivisions |
2,107 | — | 1,897 | 210 | ||||||||||||
|
Non-agency mortgage-backed securities |
1,022 | — | 1,022 | — | ||||||||||||
|
Equity and other securities |
218 | 166 | 43 | 9 | ||||||||||||
|
Covered securities |
1,201 | — | 533 | 668 | ||||||||||||
|
Loans held for sale |
2,551 | — | 2,551 | — | ||||||||||||
|
Residential mortgage servicing rights |
832 | — | — | 832 | ||||||||||||
|
Derivative assets (2) |
983 | 1 | 975 | 7 | ||||||||||||
|
Venture capital and similar investments (2)(3) |
281 | — | — | 281 | ||||||||||||
|
Total assets |
$ | 38,536 | $ | 422 | $ | 36,014 | $ | 2,100 | ||||||||
| Liabilities: | ||||||||||||||||
|
Derivative liabilities (2) |
$ | 700 | $ | 5 | $ | 668 | $ | 27 | ||||||||
|
Short-term borrowed funds (4) |
295 | — | 295 | — | ||||||||||||
|
Total liabilities |
$ | 995 | $ | 5 | $ | 963 | $ | 27 | ||||||||
| (1) | Excludes loans held for sale carried at the lower of cost or market. |
| (2) | These amounts are reflected in other assets and other liabilities on the Consolidated Balance Sheets. |
| (3) | Based on an analysis of the nature and risks of these investments, BB&T has determined that presenting these investments as a single class is appropriate. |
| (4) | Short-term borrowed funds reflect securities sold short positions. |
The following discussion focuses on the valuation techniques and significant inputs used by BB&T in determining the Level 2 and Level 3 fair values of each significant class of assets and liabilities.
The fair values for available-for-sale and trading securities are generally based upon quoted market prices or observable market prices for similar instruments. BB&T generally utilizes a third-party pricing service in determining the fair value of its securities portfolio. The pricing service uses observable inputs when available including benchmark yields, reported trades, broker-dealer quotes, issuer spreads, benchmark securities, bids and offers. For certain security types, additional inputs may be used, or some inputs may not be applicable. BB&T performs a review of pricing on actual trades executed in order to validate the fair values provided by this pricing service. BB&T also analyzes available third-party market data for a sample of securities to further validate these fair values. When market observable data is not available, which generally occurs due to the lack of liquidity for certain securities, the valuation of the security is subjective and may involve substantial judgment by management.
Specific valuation techniques and inputs used in determining the fair value of each significant class of assets and liabilities follows:
Trading securities: Trading securities are composed of all types of debt and equity securities, but the majority consists of debt securities issued by the U.S. Treasury, U.S. government-sponsored entities, or states and political subdivisions. The valuation techniques used for these investments are more fully discussed below.
U.S. government-sponsored entities (GSE) and Mortgage-backed securities issued by GSE: These are debt securities issued by government sponsored entities. BB&T’s valuations are based on a market approach using observable inputs such as benchmark yields and securities, TBA prices, reported trades, issuer spreads, monthly payment information and collateral performance.
154
Table of Contents
States and political subdivisions: These are debt securities issued by states and political subdivisions. BB&T’s valuations are primarily based on a market approach using observable inputs such as benchmark yields, MSRB reported trades, material event notices and new issue data.
Non-agency mortgage-backed securities: BB&T’s valuation for these debt securities is based on a market approach using observable inputs such as benchmark yields and securities, TBA prices, reported trades, monthly payment information and collateral performance.
Equity and other securities: These securities consist primarily of equities, mutual funds and corporate bonds. These securities are valued based on a review of quoted market prices for identical and similar assets as well as through the various other inputs discussed previously.
Covered securities: Covered securities are covered by FDIC loss sharing agreements and consist of re-remic non-agency mortgage-backed securities and municipal securities. The covered state and political subdivision securities and certain non-agency mortgage-backed securities are valued in a manner similar to the approach described above for these asset classes. The re-remic non-agency mortgage-backed securities, which are categorized as Level 3, were valued based on broker dealer quotes that reflected certain unobservable market inputs.
Loans held for sale: BB&T originates certain mortgage loans to be sold to investors. These loans are carried at fair value based on BB&T’s election of the Fair Value Option. The fair value is primarily based on quoted market prices for securities backed by similar types of loans. The changes in fair value of these assets are largely driven by changes in interest rates subsequent to loan funding and changes in the fair value of servicing associated with the mortgage loan held for sale.
Residential mortgage servicing rights: BB&T estimates the fair value of residential mortgage servicing rights (“MSRs”) using an option adjusted spread (“OAS”) valuation model to project MSR cash flows over multiple interest rate scenarios, which are then discounted at risk-adjusted rates. The OAS model considers portfolio characteristics, contractually specified servicing fees, prepayment assumptions, delinquency rates, late charges, other ancillary revenue, costs to service and other economic factors. When available, fair value estimates and assumptions are compared to observable market data and to recent market activity and actual portfolio experience.
Derivative assets and liabilities: BB&T uses derivatives to manage various financial risks. The fair values of derivative financial instruments are determined based on quoted market prices, dealer quotes and internal pricing models that are primarily sensitive to market observable data. The fair value of interest rate lock commitments, which are related to mortgage loan commitments, is based on quoted market prices adjusted for commitments that BB&T does not expect to fund and includes the value attributable to the net servicing fee.
Venture capital and similar investments: BB&T has venture capital and similar investments that are carried at fair value. In many cases there are no observable market values for these investments and therefore management must estimate the fair value based on a comparison of the operating performance of the company to multiples in the marketplace for similar entities. This analysis requires significant judgment and actual values in a sale could differ materially from those estimated.
Short-term borrowed funds: Short-term borrowed funds represent debt securities sold short. These are entered into through BB&T’s brokerage subsidiary Scott & Stringfellow, LLC. These trades are executed as a hedging strategy for the purposes of supporting institutional and retail client trading activities.
155
Table of Contents
The tables below present a reconciliation for the years ended December 31, 2010, 2009 and 2008, respectively, for Level 3 assets and liabilities that are measured at fair value on a recurring basis.
| Fair Value Measurements Using Significant Unobservable Inputs | ||||||||||||||||||||||||||||
|
Year Ended
|
Trading |
States &
Political Subdivisions |
Equity &
Other Securities |
Covered
Securities |
Mortgage
Servicing Rights |
Net
Derivatives |
Venture
Capital and Similar Investments |
|||||||||||||||||||||
| (Dollars in millions) | ||||||||||||||||||||||||||||
| Balance at January 1, 2010 | $ | 93 | $ | 210 | $ | 9 | $ | 668 | $ | 832 | $ | (20 | ) | $ | 281 | |||||||||||||
|
Total realized and unrealized gains or losses: |
||||||||||||||||||||||||||||
|
Included in earnings: |
||||||||||||||||||||||||||||
|
Interest income |
— | — | — | 61 | — | — | — | |||||||||||||||||||||
|
Mortgage banking income |
— | — | — | — | (267 | ) | 246 | — | ||||||||||||||||||||
|
Other noninterest income |
(1 | ) | — | — | — | — | — | 35 | ||||||||||||||||||||
|
Included in other comprehensive income (loss) |
— | 12 | (1 | ) | 225 | — | — | — | ||||||||||||||||||||
|
Purchases, issuances and settlements |
(5 | ) | (87 | ) | (1 | ) | — | 265 | (251 | ) | (50 | ) | ||||||||||||||||
|
Transfers into Level 3 |
— | — | — | — | — | — | — | |||||||||||||||||||||
|
Transfers out of Level 3 |
(76 | ) | (16 | ) | — | — | — | — | — | |||||||||||||||||||
| Balance at December 31, 2010 | $ | 11 | $ | 119 | $ | 7 | $ | 954 | $ | 830 | $ | (25 | ) | $ | 266 | |||||||||||||
|
Net unrealized gains (losses) included in net income relating to assets and liabilities still held at December 31, 2010 |
$ | (2 | ) | $ | — | $ | — | $ | 61 | $ | (138 | ) | $ | (25 | ) | $ | 9 | |||||||||||
| Fair Value Measurements Using Significant Unobservable Inputs | ||||||||||||||||||||||||||||||||
|
Year Ended
|
Trading |
States &
Political Subdivisions |
Non-agency
mortgage- backed securities |
Equity &
Other Securities |
Covered
Securities |
Mortgage
Servicing Rights |
Net
Derivatives |
Venture
Capital and Similar Investments |
||||||||||||||||||||||||
| (Dollars in millions) | ||||||||||||||||||||||||||||||||
| Balance at January 1, 2009 | $ | 4 | $ | — | $ | 1,098 | $ | 1 | $ | — | $ | 370 | $ | 37 | $ | 182 | ||||||||||||||||
|
Total realized and unrealized gains or losses: |
||||||||||||||||||||||||||||||||
|
Included in earnings: |
||||||||||||||||||||||||||||||||
|
Interest income |
— | — | — | — | 20 | — | — | — | ||||||||||||||||||||||||
|
Mortgage banking income |
— | — | — | — | — | 64 | 222 | — | ||||||||||||||||||||||||
|
Other noninterest income |
(2 | ) | — | — | — | — | — | — | 6 | |||||||||||||||||||||||
|
Included in other comprehensive income (loss) |
— | (12 | ) | 142 | — | 19 | — | — | — | |||||||||||||||||||||||
|
Purchases, issuances and settlements |
91 | (6 | ) | (179 | ) | (1 | ) | (3 | ) | 398 | (259 | ) | 93 | |||||||||||||||||||
|
Transfers into Level 3 from Colonial acquisition |
— | — | — | — | 632 | — | (20 | ) | — | |||||||||||||||||||||||
|
Transfers in and/or out of Level 3 |
— | 228 | (1,061 | ) | 9 | — | — | — | — | |||||||||||||||||||||||
| Balance at December 31, 2009 | $ | 93 | $ | 210 | $ | — | $ | 9 | $ | 668 | $ | 832 | $ | (20 | ) | $ | 281 | |||||||||||||||
|
Net unrealized gains (losses) included in net income relating to assets and liabilities still held at December 31, 2009 |
$ | (3 | ) | $ | — | $ | — | $ | — | $ | 20 | $ | 190 | $ | (20 | ) | $ | (2 | ) | |||||||||||||
156
Table of Contents
| Fair Value Measurements Using Significant Unobservable Inputs | ||||||||||||||||||||
|
Year Ended December 31, 2008 |
Trading |
AFS
Securities |
Mortgage
Servicing Rights |
Net
Derivatives |
Venture
Capital and Similar Investments |
|||||||||||||||
| (Dollars in millions) | ||||||||||||||||||||
| Balance at January 1, 2008 | $ | 27 | $ | 9 | $ | 472 | $ | 2 | $ | 128 | ||||||||||
|
Total realized and unrealized gains or losses: |
||||||||||||||||||||
|
Included in earnings: |
||||||||||||||||||||
|
Securities gains (losses), net |
— | (35 | ) | — | — | — | ||||||||||||||
|
Mortgage banking income |
— | — | (314 | ) | 68 | — | ||||||||||||||
|
Other noninterest income |
(3 | ) | — | — | — | (8 | ) | |||||||||||||
|
Included in other comprehensive income (loss) |
— | (3 | ) | — | — | — | ||||||||||||||
|
Purchases, issuances and settlements |
(19 | ) | 5 | 212 | (33 | ) | 62 | |||||||||||||
|
Transfers in and/or out of Level 3 |
(1 | ) | 1,123 | — | — | — | ||||||||||||||
| Balance at December 31, 2008 | $ | 4 | $ | 1,099 | $ | 370 | $ | 37 | $ | 182 | ||||||||||
|
Net unrealized gains (losses) included in net income relating to assets and liabilities still held at December 31, 2008 |
$ | — | $ | — | $ | (220 | ) | $ | 37 | $ | (12 | ) | ||||||||
BB&T’s policy is to recognize transfers in and transfers out of Levels 1, 2 and 3 as of the end of the reporting period. During the year ended December 31, 2008, BB&T transferred certain non-agency mortgage-backed securities from Level 2 to Level 3 as a result of decreased market activity for these securities. These securities were transferred back to Level 2 during 2009 as the observable market activity increased. Conversely, during 2009, BB&T transferred certain trading and auction rate securities issued by state and political subdivisions into Level 3 from Level 2 as a result of decreased market activity for these types of securities. Included in transfers into Level 3 during 2009 are certain covered securities and net derivatives that were acquired in connection with the Colonial acquisition. There were no gains or losses recognized as a result of the transfers of securities between Level 2 and Level 3 during the years ended December 31, 2010, 2009 or 2008.
BB&T has investments in venture capital funds and other similar investments that are measured at fair value based on the investment’s net asset value. The significant investment strategies for these ventures are primarily equity and subordinated debt in privately-held middle market companies. The majority of these investments are not redeemable and have varying dates for which the underlying assets are expected to be liquidated by distribution through 2021. As of December 31, 2010, restrictions on the ability to sell the investments include, but are not limited to, consent of a majority member or general partner approval for transfer of ownership. There were no investments probable of sale for less than net asset value at December 31, 2010.
The net realized and unrealized gains (losses) reported for mortgage servicing rights assets includes a negative valuation adjustment of $138 million and the realization of expected residential mortgage servicing rights cash flows of $129 million for the year ended December 31, 2010. For the year ended December 31, 2009, the net realized and unrealized gains reported for mortgage servicing rights assets includes a positive valuation adjustment of $190 million less the realization of expected residential mortgage servicing rights cash flows of $126 million. For 2008, the net realized and unrealized losses reported for mortgage servicing rights assets are composed of a negative valuation adjustment of $220 million and the realization of expected residential mortgage servicing rights cash flows of $94 million. BB&T uses various derivative financial instruments to mitigate the income statement effect of changes in fair value. During 2010, 2009 and 2008 the derivative instruments produced gains of $196 million, losses of $98 million and gains of $262 million, respectively, which offset the valuation adjustments recorded.
157
Table of Contents
The following table details the fair value and unpaid principal balance of loans held for sale at December 31, 2010 and 2009 that were elected to be carried at fair value.
| December 31, | ||||||||||||||||||||||||
| 2010 | 2009 | |||||||||||||||||||||||
|
Fair
Value |
Aggregate
Unpaid Principal Balance |
Fair Value Less
Aggregate Unpaid Principal Balance |
Fair
Value |
Aggregate
Unpaid Principal Balance |
Fair Value
Less
Aggregate Unpaid Principal Balance |
|||||||||||||||||||
| (Dollars in millions) | ||||||||||||||||||||||||
|
Loans held for sale reported at fair value |
||||||||||||||||||||||||
|
Total (1)(2) |
$ | 3,176 | $ | 3,192 | $ | (16 | ) | $ | 2,551 | $ | 2,544 | $ | 7 | |||||||||||
|
Nonaccrual loans |
— | — | — | 5 | 6 | (1 | ) | |||||||||||||||||
|
Loans 90 days or more past due and still accruing interest |
1 | 1 | — | 2 | 2 | — | ||||||||||||||||||
| (1) | The change in fair value is reflected in mortgage banking income. |
| (2) | Excludes loans held for sale carried at the lower of cost or market. |
BB&T may be required, from time to time, to measure certain other financial assets at fair value on a nonrecurring basis. Assets measured at fair value on a nonrecurring basis for the years ended December 31, 2010 and 2009 that were still held on the balance sheet at December 31, 2010 and 2009 totaled $2.0 billion and $2.4 billion, respectively. The December 31, 2010 amount consists of $705 million of impaired loans, excluding covered loans, and $1.3 billion of foreclosed real estate, excluding covered foreclosed real estate, that were classified as Level 3 assets. The December 31, 2009 amount consists of $941 million of impaired loans, excluding covered loans, and $1.5 billion of foreclosed real estate, excluding covered foreclosed real estate, that were classified as Level 3 assets. During the years ended December 31, 2010 and 2009, BB&T recorded $602 million and $436 million, respectively, in losses related to write-downs of impaired loans and $496 million and $224 million, respectively, in losses related to write-downs of foreclosed real estate. These write-downs are generally based on the appraised value of the underlying collateral.
During 2010, BB&T transferred certain problem held for investment loans to loans held for sale. These loans were adjusted to the lower of cost or market on the date of transfer. As of December 31, 2010, approximately $521 million of loans held for sale are being valued on BB&T’s consolidated balance sheet at the lower of cost or market. Please refer to Note 4 for additional information about the value of the loans transferred and the amount of write-offs recorded.
Additionally, accounting standards require the disclosure of the estimated fair value of financial instruments that are not recorded at fair value. A financial instrument is defined as cash, evidence of an ownership interest in an entity or a contract that creates a contractual obligation or right to deliver or receive cash or another financial instrument from a second entity. For the financial instruments that BB&T does not record at fair value, estimates of fair value are made at a point in time, based on relevant market data and information about the financial instrument. Fair values are calculated based on the value of one trading unit without regard to any premium or discount that may result from concentrations of ownership of a financial instrument, possible tax ramifications, estimated transaction costs that may result from bulk sales or the relationship between various financial instruments. No readily available market exists for a significant portion of BB&T’s financial instruments. Fair value estimates for these instruments are based on current economic conditions, currency and interest rate risk characteristics, loss experience and other factors. Many of these estimates involve uncertainties and matters of significant judgment and cannot be determined with precision. Therefore, the calculated fair value estimates in many instances cannot be substantiated by comparison to independent markets and, in many cases, may not be realizable in a current sale of the instrument. In addition, changes in assumptions could significantly affect these fair value estimates. The following methods and assumptions were used by BB&T in estimating the fair value of these financial instruments.
Cash and cash equivalents and segregated cash due from banks : For these short-term instruments, the carrying amounts are a reasonable estimate of fair values.
158
Table of Contents
Loans receivable : The fair values for loans are estimated using discounted cash flow analyses, applying interest rates currently being offered for loans with similar terms and credit quality. The interest rates being offered by BB&T for new loans with similar terms and credit quality are reflective of credit risk and liquidity spreads inherent in an orderly transaction in the current market. For commercial loans and leases, internal credit risk models are used to adjust discount rates for risk migration and expected losses. For residential mortgage and other consumer loans, internal prepayment risk models are used to adjust contractual cash flows. Loans are aggregated into pools of similar terms and credit quality and discounted using a LIBOR based rate. The carrying amounts of accrued interest approximate fair values.
Deposit liabilities : The fair values for demand deposits, interest-checking accounts, savings accounts and certain money market accounts are, by definition, equal to the amount payable on demand at the reporting date. Fair values for certificates of deposit are estimated using a discounted cash flow calculation that applies current interest rates to aggregate expected maturities. In addition, nonfinancial instruments such as core deposit intangibles are not recorded at fair value. BB&T has developed long-term relationships with its customers through its deposit base and in the opinion of management, these items add significant value to BB&T.
Federal funds purchased, securities sold under repurchase agreements and short-term borrowed funds : The carrying amounts of Federal funds purchased, borrowings under repurchase agreements and short-term borrowed funds approximate their fair values.
Long-term debt : The fair values of long-term debt are estimated based on quoted market prices for the instrument if available, or for similar instruments if not available, or by using discounted cash flow analyses, based on BB&T’s current incremental borrowing rates for similar types of instruments.
Contractual commitments : The fair values of commitments are estimated using the fees charged to enter into similar agreements, taking into account the remaining terms of the agreements and the present creditworthiness of the counterparties. For fixed-rate loan commitments, fair values also consider the difference between current levels of interest rates and the committed rates. The fair values of guarantees and letters of credit are estimated based on the counterparties’ creditworthiness and average default rates for loan products with similar risks. The fair values of commitments to fund affordable housing investments are estimated using the net present value of future commitments.
The following is a summary of the carrying amounts and fair values of those financial assets and liabilities that BB&T has not recorded at fair value:
| December 31, | ||||||||||||||||
| 2010 | 2009 | |||||||||||||||
|
Carrying
Amount |
Fair Value |
Carrying
Amount |
Fair
Value |
|||||||||||||
| (Dollars in millions) | ||||||||||||||||
| Financial assets: | ||||||||||||||||
|
Loans and leases (1)(2) |
$ | 101,380 | $ | 100,360 | $ | 101,056 | $ | 100,794 | ||||||||
| Financial liabilities: | ||||||||||||||||
|
Deposits |
107,213 | 104,091 | 114,965 | 112,917 | ||||||||||||
|
Long-term debt |
21,730 | 22,733 | 21,376 | 21,018 | ||||||||||||
| (1) | Includes loans held for sale carried at the lower of cost or market. |
| (2) | The carrying value is net of the allowance for loan and lease losses. |
159
Table of Contents
The following is a summary of the notional or contractual amounts and fair values of BB&T’s off-balance sheet financial instruments as of the periods indicated:
| December 31, | ||||||||||||||||
| 2010 | 2009 | |||||||||||||||
|
Notional/
Contract Amount |
Fair
Value |
Notional/
Contract Amount |
Fair
Value |
|||||||||||||
| (Dollars in millions) | ||||||||||||||||
|
Contractual commitments: |
||||||||||||||||
|
Commitments to extend, originate or purchase credit |
$ | 36,917 | $ | 65 | $ | 36,130 | $ | 48 | ||||||||
|
Residential mortgage loans sold with recourse |
1,624 | 6 | 1,986 | 6 | ||||||||||||
|
Other loans sold with recourse |
4,352 | 19 | 3,989 | 12 | ||||||||||||
|
Letters of credit and financial guarantees written |
7,291 | 41 | 7,999 | 40 | ||||||||||||
|
Commitments to fund affordable housing investments |
334 | 316 | 371 | 357 | ||||||||||||
160
Table of Contents
The following tables set forth certain information concerning BB&T’s derivative financial instruments and related hedged items as of the periods indicated:
Derivative Classifications and Hedging Relationships
| December 31, 2010 | December 31, 2009 | |||||||||||||||||||||||||
|
Hedged Item or Transaction |
Notional
Amount |
Fair Value |
Notional
Amount |
Fair Value | ||||||||||||||||||||||
| Gain (1) | Loss (1) | Gain (1) | Loss (1) | |||||||||||||||||||||||
|
(Dollars in millions) |
||||||||||||||||||||||||||
|
Cash Flow Hedges (2): |
||||||||||||||||||||||||||
|
Interest rate contracts: |
||||||||||||||||||||||||||
|
Receive fixed swaps |
1 month Commercial loans |
$ | — | $ | — | $ | — | $ | 1,000 | $ | 28 | $ | — | |||||||||||||
|
Pay fixed swaps |
3 month LIBOR funding |
5,950 | 6 | (181 | ) | 4,300 | 38 | (26 | ) | |||||||||||||||||
|
Caps |
3 month LIBOR funding |
200 | — | — | 200 | — | — | |||||||||||||||||||
|
Total |
6,150 | 6 | (181 | ) | 5,500 | 66 | (26 | ) | ||||||||||||||||||
|
Net Investment Hedges: |
||||||||||||||||||||||||||
|
Foreign exchange contracts |
73 | — | (2 | ) | 73 | — | (1 | ) | ||||||||||||||||||
|
Total |
73 | — | (2 | ) | 73 | — | (1 | ) | ||||||||||||||||||
|
Fair Value Hedges: |
||||||||||||||||||||||||||
|
Interest rate contracts: |
||||||||||||||||||||||||||
|
Receive fixed swaps and option trades |
Long-term debt |
1,160 | 25 | — | 3,429 | 192 | (43 | ) | ||||||||||||||||||
|
Receive fixed swaps |
Long-term CD’s |
— | — | — | 328 | 2 | — | |||||||||||||||||||
|
Pay fixed swaps |
Commercial loans |
54 | — | — | — | — | — | |||||||||||||||||||
|
Pay fixed swaps |
Municipal securities |
355 | — | (75 | ) | 354 | — | (50 | ) | |||||||||||||||||
|
Total |
1,569 | 25 | (75 | ) | 4,111 | 194 | (93 | ) | ||||||||||||||||||
|
Not Designated as Hedges: |
||||||||||||||||||||||||||
|
Client-related and other risk management Interest rate contracts: |
||||||||||||||||||||||||||
|
Receive fixed swaps |
9,872 | 496 | (10 | ) | 10,004 | 392 | (32 | ) | ||||||||||||||||||
|
Pay fixed swaps |
9,514 | 12 | (530 | ) | 10,401 | 32 | (369 | ) | ||||||||||||||||||
|
Other swaps |
3,328 | 2 | (3 | ) | 7,014 | 3 | (3 | ) | ||||||||||||||||||
|
Option trades |
901 | 29 | (30 | ) | 1,583 | 28 | (29 | ) | ||||||||||||||||||
|
Futures contracts |
1,747 | 1 | — | 611 | — | — | ||||||||||||||||||||
|
Foreign exchange contracts |
436 | 7 | (4 | ) | 373 | 7 | (6 | ) | ||||||||||||||||||
|
Total |
25,798 | 547 | (577 | ) | 29,986 | 462 | (439 | ) | ||||||||||||||||||
|
Mortgage Banking |
||||||||||||||||||||||||||
|
Interest rate contracts: |
||||||||||||||||||||||||||
|
Receive fixed swaps |
11 | — | — | — | — | — | ||||||||||||||||||||
|
Pay fixed swaps |
35 | — | — | — | — | — | ||||||||||||||||||||
|
Interest rate lock commitments |
3,922 | 12 | (37 | ) | 3,028 | 5 | (19 | ) | ||||||||||||||||||
|
When issued securities, forward rate agreements and forward commitments |
7,717 | 106 | (27 | ) | 4,719 | 48 | (5 | ) | ||||||||||||||||||
|
Option trades |
400 | 11 | — | 540 | 12 | (5 | ) | |||||||||||||||||||
|
Futures contracts |
13 | 1 | — | 50 | — | (1 | ) | |||||||||||||||||||
|
Total |
12,098 | 130 | (64 | ) | 8,337 | 65 | (30 | ) | ||||||||||||||||||
|
Mortgage Servicing Rights |
||||||||||||||||||||||||||
|
Interest rate contracts: |
||||||||||||||||||||||||||
|
Receive fixed swaps |
3,225 | 13 | (61 | ) | 1,968 | — | (69 | ) | ||||||||||||||||||
|
Pay fixed swaps |
2,536 | 15 | (7 | ) | 654 | 4 | — | |||||||||||||||||||
|
Option trades |
6,095 | 192 | (11 | ) | 5,575 | 191 | (2 | ) | ||||||||||||||||||
|
Futures contracts |
4,260 | — | (10 | ) | 4,631 | 1 | (3 | ) | ||||||||||||||||||
|
When issued securities, forward rate agreements and forward commitments |
3,582 | 5 | (14 | ) | 5,425 | — | (37 | ) | ||||||||||||||||||
|
Total |
19,698 | 225 | (103 | ) | 18,253 | 196 | (111 | ) | ||||||||||||||||||
|
Total nonhedging derivatives |
57,594 | 902 | (744 | ) | 56,576 | 723 | (580 | ) | ||||||||||||||||||
|
Total Derivatives |
$ | 65,386 | $ | 933 | $ | (1,002 | ) | $ | 66,260 | $ | 983 | $ | (700 | ) | ||||||||||||
| (1) | Derivatives in a gain position are recorded as Other assets and derivatives in a loss position are recorded as Other liabilities on the Consolidated Balance Sheet. |
| (2) | Cash flow hedges are hedging the first unhedged forecasted settlements associated with the listed hedged item descriptions. |
161
Table of Contents
The Effect of Derivative Instruments on the Consolidated Statements of Income
Years Ended December 31, 2010 and 2009
| Effective Portion | Ineffective Portion | |||||||||||||||||||||||||||||||
|
Gain or (Loss)
Recognized in OCI |
Location of
Amounts Reclassified from AOCI into Income |
(Gain) or Loss
Reclassified from AOCI into Income |
Location of
Amounts Recognized in Income |
Gain or
(Loss) Recognized in Income (1) |
||||||||||||||||||||||||||||
| 2010 | 2009 | 2010 | 2009 | 2010 | 2009 | |||||||||||||||||||||||||||
| (Dollars in millions) | ||||||||||||||||||||||||||||||||
| Cash Flow Hedges | ||||||||||||||||||||||||||||||||
|
Interest rate contracts |
$ | (224 | ) | $ | 146 | Total interest income | $ | (44 | ) | $ | (86 | ) | Other noninterest income | $ | — | $ | 1 | |||||||||||||||
| Total interest expense | 20 | 37 | ||||||||||||||||||||||||||||||
| $ | (24 | ) | $ | (49 | ) | |||||||||||||||||||||||||||
| Net Investment Hedges | ||||||||||||||||||||||||||||||||
|
Foreign exchange contracts |
$ | (4 | ) | $ | (11 | ) | $ | — | $ | — | $ | — | $ | — | ||||||||||||||||||
| Effective Portion | Ineffective Portion | |||||||||||||||||||||||
|
Location of Amounts
Recognized in Income |
Gain or
(Loss) Recognized in Income |
Location of Amounts
Recognized in Income |
Gain or
(Loss) Recognized in Income (1) |
|||||||||||||||||||||
| 2010 | 2009 | 2010 | 2009 | |||||||||||||||||||||
| (Dollars in millions) | ||||||||||||||||||||||||
| Fair Value Hedges | ||||||||||||||||||||||||
|
Interest rate contracts |
Total interest expense | $ | 170 | $ | 177 | Other noninterest income | $ | (2 | ) | $ | 7 | |||||||||||||
|
Interest rate contracts |
Total interest income | (19 | ) | (17 | ) | |||||||||||||||||||
|
Total |
$ | 151 | $ | 160 | ||||||||||||||||||||
| Not Designated as Hedges | ||||||||||||||||||||||||
|
Client-related and other risk management |
||||||||||||||||||||||||
|
Interest rate contracts |
Other noninterest income | $ | 5 | $ | 22 | |||||||||||||||||||
|
Other derivatives |
Other noninterest income | — | (20 | ) | ||||||||||||||||||||
|
Foreign exchange contracts |
Other nondeposit fees | |||||||||||||||||||||||
| and commissions | 6 | (1 | ) | |||||||||||||||||||||
|
Mortgage Banking |
||||||||||||||||||||||||
|
Interest rate contracts |
Mortgage banking income (2) | 33 | 23 | |||||||||||||||||||||
|
Mortgage Servicing Rights |
||||||||||||||||||||||||
|
Interest rate contracts |
Mortgage banking income | 196 | (98 | ) | ||||||||||||||||||||
|
Total |
$ | 240 | $ | (74 | ) | |||||||||||||||||||
Note: All amounts for Other Comprehensive Income (OCI) and Accumulated Other Comprehensive Income (AOCI) are stated on a pre-tax basis.
| (1) | All gains and losses recognized in income relate to the ineffective portion of the change in the fair value of the derivative. No portion of the change in fair value of the derivative has been excluded from effectiveness testing. |
| (2) | Mortgage banking income includes amounts that were recorded as part of gain on the sale of loans attributable to the valuation impact of interest rate lock commitments. The impact was $27 million and $13 million in 2010 and 2009, respectively. |
BB&T uses a variety of derivative instruments to manage interest rate and foreign exchange risks. These instruments consist of interest-rate swaps, swaptions, caps, floors, collars, financial forward and futures contracts, when-issued securities, foreign exchange contracts and options written and purchased. A derivative is a financial instrument that derives its cash flows, and therefore its value, by reference to an underlying instrument, index or referenced interest rate. There are five areas of risk management: balance sheet management, mortgage banking operations, mortgage servicing rights, net investment in a foreign subsidiary and client-related and other risk management activities.
Cash Flow Hedges
BB&T’s floating rate business loans, Federal funds purchased, other overnight funding, FHLB advances, medium-term bank notes and long-term debt expose it to variability in cash flows for interest payments. The risk management objective for these floating rate assets and liabilities is to hedge the variability in the interest payments and receipts on future cash flows for forecasted transactions. These forecasted transactions include
162
Table of Contents
interest receipts on commercial loans and interest payments on 3 month LIBOR funding. All of BB&T’s current cash flow hedges are hedging exposure to variability in future cash flows for forecasted transactions related to the payment of variable interest on then existing financial instruments. At December 31, 2010 and 2009, the maximum length of time over which BB&T is hedging its exposure on such transactions is 6.6 years.
For a qualifying cash flow hedge, the portion of changes in the fair value of the derivatives that has been highly effective is recognized in other comprehensive income (loss) until the related cash flows from the hedged item are recognized in earnings. If a derivative designated as a cash flow hedge is terminated or ceases to be highly effective, the gain or loss in other comprehensive income (loss) is amortized to earnings over the period the forecasted hedged transactions impact earnings. If a hedged forecasted transaction is no longer probable of occurring during the forecast period or within a short period thereafter, hedge accounting is ceased and any gain or loss included in other comprehensive income (loss) is reported in earnings immediately. During the year ended December 31, 2010 and 2009, BB&T amortized approximately $24 million and $49 million of unrecognized pre-tax gains from accumulated other comprehensive income (loss) into net interest income.
At December 31, 2010, BB&T had $47 million of unrecognized losses on derivatives classified as cash flow hedges recorded in other comprehensive income (loss), compared to $107 million of unrecognized gains at December 31, 2009. The estimated amount to be reclassified from other comprehensive income (loss) into earnings during the next 12 months is a loss totaling approximately $30 million. This includes gains and losses related to hedges that were terminated early for which the forecasted transactions are still probable. The proceeds from these terminations were included in cash flows from financing activities.
All cash flow hedges were highly effective for the year ended December 31, 2010, and the change in fair value attributed to hedge ineffectiveness was not material.
Fair Value Hedges
BB&T’s fixed rate long term debt, certificates of deposit, FHLB advances, loan and municipal security assets result in exposure to losses in value as interest rates change. The risk management objective for hedging fixed rate assets and liabilities is to convert the fixed rate paid or received to a floating rate. BB&T accomplishes its risk management objective by hedging exposure to changes in fair value of fixed rate financial instruments primarily through the use of swaps. For a qualifying fair value hedge, changes in the value of the derivatives that have been highly effective as hedges are recognized in current period earnings along with the corresponding changes in the fair value of the designated hedged item attributable to the risk being hedged.
During the years ended December 31, 2010 and 2009, BB&T terminated certain fair value hedges primarily related to its long-term debt and received proceeds of $314 million and $131 million, respectively. When hedged debt/other financial instruments are retired or redeemed, the amounts associated with the hedge are included as a component of the gain or loss on termination. When a hedge is terminated but the hedged item remains outstanding, the proceeds from the termination of these hedges have been reflected as part of the carrying value of the underlying debt/other financial instrument and are being amortized to earnings over its remaining life. The proceeds from these terminations were included in cash flows from financing activities. During 2009, BB&T recognized $24 million in gains on debt retirement associated with previous hedges. There were no hedge unwinds associated with debt retirement during 2010. During the years ended December 31, 2010 and 2009, BB&T recognized pre-tax benefits of $64 million and $21 million respectively through reductions of interest expense from previous hedge unwinds.
Derivatives Not Designated As Hedges
Derivatives not designated as a hedge include those that are entered into as either balance sheet risk management instruments or to facilitate client needs. Balance sheet risk management hedges are those hedges that do not qualify to be treated as either a cash flow hedge, a fair value hedge or a foreign currency hedge for accounting purposes, but are necessary to economically manage the risk associated with an asset or liability.
This category of hedges includes derivatives that hedge mortgage banking operations and mortgage servicing rights (“MSRs”). For mortgage loans originated for sale, BB&T is exposed to changes in market rates
163
Table of Contents
and conditions subsequent to the interest rate lock and funding date. BB&T’s risk management strategy related to its interest rate lock commitment derivatives and loans held for sale includes using mortgage-based derivatives such as forward commitments and options in order to mitigate market risk. For MSRs, BB&T uses various derivative instruments to mitigate the income statement effect of changes in the fair value of its MSRs. For the year ended December 31, 2010, BB&T recorded a gain totaling $196 million related to these derivatives which was offset by a decrease in the carrying value of mortgage servicing assets totaling $138 million. For the year ended December 31, 2009, BB&T recognized a $98 million loss on these derivatives, which was offset by an increase in the carrying value of mortgage servicing assets that totaled $190 million.
BB&T also held, as risk management instruments, other derivatives not designated as hedges primarily to facilitate transactions on behalf of its clients, as well as activities related to balance sheet management.
Net Investment Hedges
In connection with a long term investment in a foreign subsidiary, BB&T is exposed to changes in the carrying value of its investment as a result of changes in the related foreign exchange rate. At December 31, 2010 and 2009, BB&T used derivatives to hedge the variability in the value of its $73 million investment. For net investment hedges, changes in value of qualifying hedges are deferred in other comprehensive income (loss) when the terms of the derivative match the notional and currency risk being hedged. At December 31, 2010 and 2009, accumulated other comprehensive income (loss) reflected unrecognized pre-tax losses totaling $11 million and $8 million, respectively, related to cumulative changes in the fair value of BB&T’s net investment hedge.
Derivatives Credit Risk
Credit risk related to derivatives arises when amounts receivable from a counterparty exceed those payable to the same counterparty. BB&T controls the risk of loss by subjecting counterparties to credit reviews and approvals similar to those used in making loans and other extensions of credit. In addition, certain counterparties are required to provide cash collateral to BB&T when their unsecured loss positions exceed certain negotiated limits. As of December 31, 2010 and 2009, BB&T had received cash collateral totaling $33 million and $82 million, respectively.
Consistent with BB&T’s policies related to requiring cash collateral, counterparties to derivative transactions may require BB&T to post cash collateral related to certain derivatives in a loss position. At December 31, 2010 and 2009, BB&T had posted collateral totaling $605 million and $138 million, respectively, related to derivatives in a loss position totaling $612 million and $188 million, respectively. In the event that BB&T’s credit ratings had been downgraded below investment grade, the amount of collateral posted would have increased by $10 million and $50 million as of December 31, 2010 and 2009, respectively.
As of December 31, 2010 and 2009, BB&T had $1 million and $26 million, respectively, of unsecured positions with derivative dealers. All of the derivative contracts to which BB&T is a party settle monthly, quarterly or semiannually. In the case of contracts with derivative dealers, BB&T only transacts with dealers that are national market makers with strong credit ratings. Further, BB&T has netting agreements with the dealers with which it does business. Because of these factors, BB&T’s credit risk exposure related to derivatives contracts at December 31, 2010 and 2009 was not material.
164
Table of Contents
The basic and diluted earnings per common share calculations are presented in the following table:
| Years Ended December 31, | ||||||||||||
| 2010 | 2009 | 2008 | ||||||||||
|
(Dollars in millions, except per share
data, shares in thousands) |
||||||||||||
| Basic Earnings Per Share: | ||||||||||||
|
Net income available to common shareholders |
$ | 816 | $ | 729 | $ | 1,498 | ||||||
|
Weighted average number of common shares |
692,489 | 629,583 | 548,847 | |||||||||
|
Basic earnings per share |
$ | 1.18 | $ | 1.16 | $ | 2.73 | ||||||
| Diluted Earnings Per Share: | ||||||||||||
|
Net income available to common shareholders |
$ | 816 | $ | 729 | $ | 1,498 | ||||||
|
Weighted average number of common shares |
692,489 | 629,583 | 548,847 | |||||||||
|
Add: |
||||||||||||
|
Effect of dilutive outstanding equity-based awards |
8,550 | 6,036 | 3,651 | |||||||||
|
Weighted average number of diluted common shares |
701,039 | 635,619 | 552,498 | |||||||||
|
Diluted earnings per share |
$ | 1.16 | $ | 1.15 | $ | 2.71 | ||||||
For the years ended December 31, 2010, 2009 and 2008, respectively, the number of antidilutive options was 36.8 million, 38.6 million and 33.5 million. In addition, BB&T had a warrant outstanding for 13.9 million shares as of December 31, 2008 that was antidilutive.
BB&T’s operations are divided into seven reportable business segments: Community Banking, Residential Mortgage Banking, Sales Finance, Specialized Lending, Insurance Services, Financial Services, and Treasury. These operating segments have been identified based on BB&T’s organizational structure. The segments require unique technology and marketing strategies and offer different products and services. While BB&T is managed as an integrated organization, individual executive managers are held accountable for the operations of these business segments.
BB&T measures and presents information for internal reporting purposes in a variety of different ways. The internal reporting system presently used by management in the planning and measuring of operating activities, as well as the system to which most managers are held accountable, is based on organizational structure.
BB&T emphasizes revenue growth by focusing on client service, sales effectiveness and relationship management. The segment results contained herein are presented based on internal management accounting policies that were designed to support these strategic objectives. Unlike financial accounting, there is no comprehensive authoritative body of guidance for management accounting equivalent to generally accepted accounting principles. The performance of the segments is not comparable with BB&T’s consolidated results or with similar information presented by any other financial institution. Additionally, because of the interrelationships of the various segments, the information presented is not indicative of how the segments would perform if they operated as independent entities.
The management accounting process uses various estimates and allocation methodologies to measure the performance of the operating segments. To determine financial performance for each segment, BB&T allocates capital, funding charges and credits, an economic provision for loan and lease losses, certain noninterest expenses and income tax provisions to each segment, as applicable. Also, to promote revenue growth and provide a basis for employee incentives, certain revenues of Residential Mortgage Banking, Sales Finance, Specialized Lending, Insurance Services, Financial Services and other segments are reflected in noninterest income in the individual segment results and also allocated to Community Banking and Financial Services. These allocated revenues are reflected in intersegment net referral fees and eliminated in Parent/Reconciling Items with the exception of
165
Table of Contents
certain Residential Mortgage Banking and Sales Finance referral fees to arrive at consolidated results. Allocation methodologies are subject to periodic adjustment as the internal management accounting system is revised and business or product lines within the segments change. Also, because the development and application of these methodologies is a dynamic process, the financial results presented may be periodically revised.
BB&T’s overall objective is to maximize shareholder value by optimizing return on equity and managing risk. Allocations of capital and the economic provision for loan and lease losses are designed to address this objective. Capital is assigned to each segment on an economic basis, using management’s assessment of the inherent risks associated with the segment. Capital allocations are made to cover the following risk categories: credit risk, liquidity risk, interest rate risk, market risk, operational risk and other business risks. Each segment is evaluated based on a risk-adjusted return on capital. Capital assignments are not equivalent to regulatory capital guidelines, and the total amount assigned to all segments typically varies from total consolidated shareholders’ equity.
The economic provision for loan and lease losses is also allocated to the relevant segments based on management’s assessment of the segments’ credit risks. Unlike the provision for loan and lease losses recorded pursuant to generally accepted accounting principles, the economic provision adjusts for the impact of expected credit losses over the effective lives of the related loans and leases. Any over or under allocated provision for loan and lease losses is reflected in Parent/Reconciling Items to arrive at consolidated results.
BB&T allocates expenses to the reportable segments based on various methodologies, including volume and amount of loans and deposits and the number of full-time equivalent employees. A portion of corporate overhead expense is not allocated, but is retained in corporate accounts and reflected as Parent/Reconciling Items in the accompanying tables. Income taxes are allocated to the various segments based on taxable income and statutory rates applicable to the segment.
BB&T utilizes a funds transfer pricing (“FTP”) system to eliminate the effect of interest rate risk from the segments’ net interest income because such risk is centrally managed within the Treasury segment. The FTP system credits or charges the segments with the economic value or cost of the funds the segments create or use. The FTP system provides a funds credit for sources of funds and a funds charge for the use of funds by each segment. The net FTP credit or charge, which includes intercompany interest income and expense, is reflected as net funds transfer pricing in the accompanying tables.
Community Banking
BB&T’s Community Banking segment serves individual and business clients by offering a variety of loan and deposit products and other financial services. The Community Banking segment is primarily responsible for serving client relationships, and, therefore, is credited with revenue from the Residential Mortgage Banking, Financial Services, Insurance Services, Specialized Lending, Sales Finance and other segments, which is reflected in net referral fees. Amortization and depreciation expense that has been allocated to the segment totaled $37 million, $38 million, and $81 million for 2010, 2009 and 2008, respectively. The decline in amortization and depreciation expense allocated to the Community Banking segment in 2009 is due to a change in methodology whereby the Community Banking segment no longer carries real estate assets. The expenses related to real estate assets including depreciation and amortization were moved to an allocated expense category contained in noninterest expenses.
Residential Mortgage Banking
The Residential Mortgage Banking segment retains and services mortgage loans originated by the Community Banking segment as well as those purchased from various correspondent originators. Mortgage loan products include fixed- and adjustable-rate government and conventional loans for the purpose of constructing, purchasing or refinancing residential properties. Substantially all of the properties are owner occupied. BB&T generally retains the servicing rights to all loans sold. The Residential Mortgage Banking segment earns interest on loans held in the warehouse and portfolio, fee income from the origination and servicing of mortgage loans and recognizes gains or losses from the sale of mortgage loans. The Community Banking segment receives an
166
Table of Contents
intersegment referral fee for the origination of loans and servicing rights, with a portion of the corresponding charge incurred by the Residential Mortgage Banking segment and the remaining charge incurred in the corporate office, which is reflected as part of Parent/Reconciling Items in the accompanying tables. Amortization and depreciation expense that has been allocated to the segment was not material for any of the years presented.
Sales Finance
BB&T’s Sales Finance segment primarily originates loans to consumers for the purchase of automobiles. Such loans are originated on an indirect basis through approved franchised and independent automobile dealers throughout the BB&T market area. Sales Finance also originates loans for the purchase of boats and recreational vehicles originated through dealers in BB&T’s market area. In addition, financing and servicing to dealers for their inventories is provided through a joint relationship between Sales Finance and Community Banking. Amortization and depreciation expense that has been allocated to the segment was not material for any of the years presented.
Specialized Lending
BB&T’s Specialized Lending segment consists of six business units that provide specialty finance alternatives to consumers and businesses including: dealer-based financing of equipment for both small businesses and consumers, equipment leasing, direct consumer finance, insurance premium finance, indirect sub-prime automobile finance, and full-service commercial mortgage banking. Bank clients as well as nonbank clients within and outside BB&T’s primary geographic market area are served by these companies. The Community Banking segment receives credit for referrals to these companies with the corresponding charge retained in the corporate office, which is reflected as part of Parent/Reconciling Items in the accompanying tables. Amortization and depreciation expense that has been allocated to the segment totaled $38 million, $37 million, and $28 million for 2010, 2009 and 2008, respectively.
Insurance Services
BB&T’s insurance agency / brokerage network is the 6 th largest in the world. BB&T Insurance Services provides property and casualty, life and health insurance to businesses and individuals. It also provides small business and corporate products, such as workers compensation and professional liability, as well as surety coverage and title insurance. In addition, the Insurance Services segment also underwrites a limited amount of property and casualty coverage. The Community Banking segment receives credit for insurance commissions on referred accounts, with the corresponding charge retained in the corporate office, which is reflected as part of Parent/Reconciling Items in the accompanying tables. Amortization and depreciation expense that has been allocated to the segment totaled $20 million, $21 million and $19 million for 2010, 2009 and 2008, respectively.
Financial Services
BB&T’s Financial Services segment provides personal trust administration, estate planning, investment counseling, wealth management, asset management, employee benefits services, corporate banking and corporate trust services to individuals, corporations, institutions, foundations and government entities. BB&T’s Financial Services segment also offers clients investment alternatives, including discount brokerage services, equities, fixed-rate and variable-rate annuities, mutual funds and governmental and municipal bonds through BB&T Investment Services, Inc., a subsidiary of Branch Bank. The Financial Services segment includes Scott & Stringfellow, LLC, a full-service brokerage and investment banking firm headquartered in Richmond, Virginia. Scott & Stringfellow provides services in retail brokerage, equity and debt underwriting, investment advice, corporate finance and equity research and facilitates the origination, trading and distribution of fixed-income securities and equity products in both the public and private capital markets. Scott & Stringfellow also has a public finance department that provides investment banking services, financial advisory services and municipal bond financing to a variety of regional taxable and tax-exempt issuers. Scott & Stringfellow’s investment banking and corporate and public finance areas conduct business as BB&T Capital Markets. The Financial Services segment includes BB&T Capital Partners that is a group of BB&T-sponsored private equity and mezzanine investment funds that invests in privately owned middle-market operating companies to facilitate growth or ownership transition while leveraging the Community Banking network for referrals and other bank services.
167
Table of Contents
The Financial Services segment also includes the Corporate Banking Division that originates and services large corporate relationships, syndicated lending relationships and client derivatives. The Community Banking segment receives an interoffice credit for referral fees, with the corresponding charge remaining in the corporate office, which is reflected as part of Parent/Reconciling Items in the accompanying tables. Amortization and depreciation expense that has been allocated to the segment totaled $6 million, $8 million, and $11 million for 2010, 2009 and 2008, respectively.
Treasury
BB&T’s Treasury segment is responsible for the management of the securities portfolios, overall balance sheet funding and liquidity, and overall management of interest rate risk. Amortization and depreciation expense that has been allocated to the segment was not material for any of the years presented.
All Other
All Other segments represent operating entities that do not meet the quantitative or qualitative thresholds for disclosure.
Parent/Reconciling Items
Parent/Reconciling Items reflect corporate support functions that have not been allocated to the business segments, merger-related charges or credits that are incurred as part of acquisition and conversion of acquired entities, nonrecurring charges that are considered to be unusual in nature or infrequent and not reflective of the normal operations of the segments, and intercompany eliminations including intersegment net referral fees.
The substantial majority of the loan portfolio acquired in the Colonial acquisition is covered by loss sharing agreements with the FDIC, and is managed outside of the Community Banking segment. The assets and related interest income from the portfolio are included in the Parent/Reconciling Items segment.
The following table discloses selected financial information with respect to BB&T’s reportable business segments for the years indicated:
168
Table of Contents
BB&T Corporation
Reportable Segments
Years Ended December 31, 2010, 2009 and 2008
| Community Banking |
Residential Mortgage
Banking |
Sales Finance | Specialized Lending | Insurance Services | ||||||||||||||||||||||||||||||||||||||||||||||||||||||||
| 2010 | 2009 | 2008 | 2010 | 2009 | 2008 | 2010 | 2009 | 2008 | 2010 | 2009 | 2008 | 2010 | 2009 | 2008 | ||||||||||||||||||||||||||||||||||||||||||||||
| (Dollars in millions) | ||||||||||||||||||||||||||||||||||||||||||||||||||||||||||||
|
Net interest income (expense) |
$ | 1,834 | $ | 1,697 | $ | 2,098 | $ | 980 | $ | 1,065 | $ | 1,156 | $ | 391 | $ | 409 | $ | 401 | $ | 896 | $ | 825 | $ | 711 | $ | 3 | $ | 5 | $ | 12 | ||||||||||||||||||||||||||||||
|
Net funds transfer pricing (FTP) |
2,003 | 1,931 | 1,136 | (654 | ) | (722 | ) | (853 | ) | (244 | ) | (284 | ) | (281 | ) | (184 | ) | (220 | ) | (212 | ) | (2 | ) | (3 | ) | (5 | ) | |||||||||||||||||||||||||||||||||
|
Net interest income (expense) and FTP |
3,837 | 3,628 | 3,234 | 326 | 343 | 303 | 147 | 125 | 120 | 712 | 605 | 499 | 1 | 2 | 7 | |||||||||||||||||||||||||||||||||||||||||||||
|
Economic provision for loan and lease losses |
1,792 | 1,874 | 840 | 570 | 333 | 134 | 34 | 90 | 40 | 155 | 332 | 301 | — | — | — | |||||||||||||||||||||||||||||||||||||||||||||
|
Noninterest income |
1,251 | 1,276 | 1,235 | 457 | 607 | 224 | 1 | 2 | 2 | 143 | 119 | 116 | 1,033 | 1,032 | 907 | |||||||||||||||||||||||||||||||||||||||||||||
|
Intersegment net referral fees (expense) |
408 | 461 | 254 | (125 | ) | (146 | ) | (96 | ) | (13 | ) | (13 | ) | (13 | ) | — | — | — | — | — | — | |||||||||||||||||||||||||||||||||||||||
|
Noninterest expense |
2,506 | 2,079 | 1,544 | 151 | 128 | 84 | 32 | 31 | 28 | 293 | 285 | 245 | 790 | 773 | 698 | |||||||||||||||||||||||||||||||||||||||||||||
|
Allocated corporate expenses |
827 | 699 | 700 | 11 | 11 | 10 | 9 | 12 | 11 | 42 | 40 | 37 | 59 | 51 | 42 | |||||||||||||||||||||||||||||||||||||||||||||
|
Income (loss) before income taxes |
371 | 713 | 1,639 | (74 | ) | 332 | 203 | 60 | (19 | ) | 30 | 365 | 67 | 32 | 185 | 210 | 174 | |||||||||||||||||||||||||||||||||||||||||||
|
Provision (benefit) for income taxes |
134 | 265 | 587 | (28 | ) | 126 | 73 | 23 | (7 | ) | 11 | 139 | 24 | 12 | 73 | 82 | 67 | |||||||||||||||||||||||||||||||||||||||||||
|
Segment net income (loss) |
$ | 237 | $ | 448 | $ | 1,052 | $ | (46 | ) | $ | 206 | $ | 130 | $ | 37 | $ | (12 | ) | $ | 19 | $ | 226 | $ | 43 | $ | 20 | $ | 112 | $ | 128 | $ | 107 | ||||||||||||||||||||||||||||
|
Identifiable segment assets (period end) |
$ | 60,414 | $ | 62,847 | $ | 64,842 | $ | 22,154 | $ | 19,040 | $ | 19,344 | $ | 6,814 | $ | 6,131 | $ | 6,117 | $ | 8,575 | $ | 8,162 | $ | 6,571 | $ | 1,215 | $ | 1,200 | $ | 1,253 | ||||||||||||||||||||||||||||||
| Financial Services | Treasury | All Other Segments (1) |
Parent/Reconciling
Items |
Total BB&T Corporation | ||||||||||||||||||||||||||||||||||||||||||||||||||||||||
| 2010 | 2009 | 2008 | 2010 | 2009 | 2008 | 2010 | 2009 | 2008 | 2010 | 2009 | 2008 | 2010 | 2009 | 2008 | ||||||||||||||||||||||||||||||||||||||||||||||
| (Dollars in millions) | ||||||||||||||||||||||||||||||||||||||||||||||||||||||||||||
|
Net interest income (expense) |
$ | 21 | $ | 11 | $ | 44 | $ | 156 | $ | 630 | $ | 300 | $ | 183 | $ | 157 | $ | 107 | $ | 856 | $ | 45 | $ | (591 | ) | $ | 5,320 | $ | 4,844 | $ | 4,238 | |||||||||||||||||||||||||||||
|
Net funds transfer pricing (FTP) |
106 | 119 | 34 | (623 | ) | (689 | ) | (19 | ) | (177 | ) | (189 | ) | (167 | ) | (225 | ) | 57 | 367 | — | — | — | ||||||||||||||||||||||||||||||||||||||
|
Net interest income (expense) and FTP |
127 | 130 | 78 | (467 | ) | (59 | ) | 281 | 6 | (32 | ) | (60 | ) | 631 | 102 | (224 | ) | 5,320 | 4,844 | 4,238 | ||||||||||||||||||||||||||||||||||||||||
|
Economic provision for loan and lease losses |
10 | 12 | 8 | — | — | — | 6 | 4 | 8 | 71 | 166 | 114 | 2,638 | 2,811 | 1,445 | |||||||||||||||||||||||||||||||||||||||||||||
|
Noninterest income |
657 | 674 | 629 | 643 | 326 | 265 | 49 | 38 | 30 | (277 | ) | (140 | ) | (211 | ) | 3,957 | 3,934 | 3,197 | ||||||||||||||||||||||||||||||||||||||||||
|
Intersegment net referral fees (expense) |
38 | 34 | 20 | — | — | — | — | — | — | (308 | ) | (336 | ) | (165 | ) | — | — | — | ||||||||||||||||||||||||||||||||||||||||||
|
Noninterest expense |
533 | 543 | 552 | 20 | 5 | (22 | ) | 65 | 71 | 24 | 1,280 | 1,016 | 758 | 5,670 | 4,931 | 3,911 | ||||||||||||||||||||||||||||||||||||||||||||
|
Allocated corporate expenses |
22 | 23 | 31 | 4 | 4 | 4 | (1 | ) | (2 | ) | (1 | ) | (973 | ) | (838 | ) | (834 | ) | — | — | — | |||||||||||||||||||||||||||||||||||||||
|
Income (loss) before income taxes |
257 | 260 | 136 | 152 | 258 | 564 | (15 | ) | (67 | ) | (61 | ) | (332 | ) | (718 | ) | (638 | ) | 969 | 1,036 | 2,079 | |||||||||||||||||||||||||||||||||||||||
|
Provision (benefit) for income taxes |
98 | 100 | 50 | (11 | ) | 28 | 157 | (55 | ) | (68 | ) | (48 | ) | (258 | ) | (391 | ) | (359 | ) | 115 | 159 | 550 | ||||||||||||||||||||||||||||||||||||||
|
Segment net income (loss) |
$ | 159 | $ | 160 | $ | 86 | $ | 163 | $ | 230 | $ | 407 | $ | 40 | $ | 1 | $ | (13 | ) | $ | (74 | ) | $ | (327 | ) | $ | (279 | ) | $ | 854 | $ | 877 | $ | 1,529 | ||||||||||||||||||||||||||
|
Identifiable segment assets (period end) |
$ | 3,144 | $ | 3,077 | $ | 3,136 | $ | 27,807 | $ | 36,603 | $ | 37,438 | $ | 6,952 | $ | 5,306 | $ | 4,843 | $ | 20,006 | $ | 23,398 | $ | 8,471 | $ | 157,081 | $ | 165,764 | $ | 152,015 | ||||||||||||||||||||||||||||||
| (1) | Includes financial data from subsidiaries below the quantitative and qualitative thresholds requiring disclosure. |
169
Table of Contents
SIGNATURES
Pursuant to the requirements of Section 13 or 15(d) of the Securities Exchange Act of 1934, the Registrant has duly caused this report to be signed on its behalf by the undersigned, thereunto duly authorized, as of February 25, 2011:
|
BB&T Corporation (Registrant) |
||
|
By: |
/s/ Kelly S. King |
|
|
Kelly S. King Chairman and Chief Executive Officer |
||
Pursuant to the requirements of the Securities Exchange Act of 1934, this report has been signed below by the following persons on behalf of the Registrant and in the capacities indicated as of February 25, 2011:
| /s/ Kelly S. King |
|
Kelly S. King Chairman and Chief Executive Officer (Principal Executive Officer) |
| /s/ Daryl N. Bible |
|
Daryl N. Bible Senior Executive Vice President and Chief Financial Officer (Principal Financial Officer) |
| /s/ Cynthia B. Powell |
|
Cynthia B. Powell Executive Vice President and Corporate Controller (Principal Accounting Officer) |
170
Table of Contents
A Majority of the Directors of the Registrant are included.
|
/s/ Kelly S. King Kelly S. King Chairman and Chief Executive Officer |
|
/s/ John A. Allison IV John A. Allison IV Director |
|
/s/ Jennifer S. Banner Jennifer S. Banner Director |
|
/s/ K. David Boyer, Jr. K. David Boyer Jr. Director |
|
/s/ Anna R. Cablik Anna R. Cablik Director |
|
/s/ Ronald E. Deal Ronald E. Deal Director |
|
/s/ J. Littleton Glover, Jr. J. Littleton Glover Jr. Director |
|
/s/ Jane P. Helm Jane P. Helm Director |
|
/s/ John P. Howe III, M.D. John P. Howe III, M.D. Director |
|
/s/ Valeria Lynch Lee Valeria Lynch Lee Director |
|
/s/ J. Holmes Morrison J. Holmes Morrison Director |
|
/s/ Nido R. Qubein Nido R. Qubein Director |
|
/s/ Thomas E. Skains Thomas E. Skains Director |
|
Thomas N. Thompson Director |
|
/s/ Stephen T. Williams Stephen T. Williams Director |
171
Table of Contents
EXHIBIT INDEX
|
Exhibit
|
Description |
Location |
||
|
2.1 |
Agreement and Plan of Reorganization dated as of July 29, 1994 and amended and restated as of October 22, 1994 between the Registrant and BB&T Financial Corporation. |
Incorporated herein by reference to Annex I of Form S-4 Registration Statement No. 33-56437. |
||
|
2.2 |
Plan of Merger as of July 29, 1994 as amended and restated on October 22, 1994 between the Registrant and BB&T Financial Corporation. |
Incorporated herein by reference to Annex II of Form S-4 Registration Statement No. 33-56437. |
||
|
2.3 |
Purchase and Assumption Agreement Whole Bank All Deposits, among the Federal Deposit Insurance Corporation, receiver of Colonial Bank, Montgomery, Alabama, the Federal Deposit Insurance Corporation and Branch Banking and Trust Company, dated as of August 14, 2009. |
Incorporated herein by reference to Exhibit 2.1 of the Current Report on Form 8-K, filed August 17, 2009. |
||
|
3(i) |
Articles of Incorporation of the Registrant, as Restated February 25, 2009 and amended May 10, 2010. |
Incorporated herein by reference to Exhibit 3 (i) of the Quarterly Report on Form 10-Q, filed August 9, 2010. |
||
|
3(ii) |
Bylaws of the Registrant, as amended February 22, 2011. |
Incorporated herein by reference to Exhibit 3(ii) of the Current Report on Form 8-K, filed February 23, 2011. |
||
|
4.1 |
Articles of Incorporation of the Registrant, as Restated February 25, 2009 and amended May 10, 2010, related to Junior Participating Preferred Stock. |
Incorporated herein by reference to Exhibit 3 (i) of the Quarterly Report on Form 10-Q, filed August 9, 2010. |
||
|
4.2 |
Articles of Incorporation of the Registrant, as Restated February 25, 2009 and amended May 10, 2010, related to Series C Preferred Stock. |
Incorporated herein by reference to Exhibit 3 (i) of the Quarterly Report on Form 10-Q, filed August 9, 2010. |
||
|
4.3 |
Indenture Regarding Senior Securities (including form of Senior Debt Security) between Registrant and U.S. Bank National Association (as successor in interest to State Street Bank and Trust Company), as trustee, dated as of May 24, 1996. |
Incorporated herein by reference to Exhibit 4(c) of Form S-3 Registration Statement No. 333-02899. |
||
|
4.4 |
First Supplemental Indenture, dated May 4, 2009, to the Indenture Regarding Senior Securities, dated as of May 24, 1996, between the Registrant and U.S. Bank National Association. |
Incorporated herein by reference to Exhibit 4.2 of the Current Report on Form 8-K, filed May 4, 2009. |
||
|
4.5 |
Indenture Regarding Subordinated Securities (including Form of Subordinated Debt Security) between the Registrant and U.S. Bank National Association (as successor in interest to State Street Bank and Trust Company), as trustee, dated as of May 24, 1996. |
Incorporated herein by reference to Exhibit 4(d) of Form S-3 Registration Statement No. 333-02899. |
||
|
4.6 |
First Supplemental Indenture, dated as of December 23, 2003, to the Indenture Regarding Subordinated Securities, dated as of May 24, 1996, between the Registrant and U.S. Bank National Association. |
Incorporated herein by reference to Exhibit 4.5 of the Annual Report on Form 10-K, filed February 27, 2009. |
||
Table of Contents
|
Exhibit
|
Description |
Location |
||
|
4.7 |
Second Supplemental Indenture, dated as of September 24, 2004, to the Indenture Regarding Subordinated Securities, dated as of May 24, 1996, between the Registrant and U.S. Bank National Association. |
Incorporated herein by reference to Exhibit 4.7 of the Annual Report on Form 10-K, filed February 26, 2010. |
||
|
4.8 |
Third Supplemental Indenture, dated May 4, 2009, to the Indenture Regarding Subordinated Securities, dated as of May 24, 1996, between the Registrant and U.S. Bank National Association. |
Incorporated herein by reference to Exhibit 4.6 of the Current Report on Form 8-K, filed May 4, 2009. |
||
|
10.1* |
BB&T Corporation Amended and Restated Non-Employee Directors’ Deferred Compensation and Stock Option Plan (amended and restated January 1, 2005). |
Incorporated herein by reference to Exhibit 10.1 of the Annual Report on Form 10-K, filed February 28, 2008. |
||
|
10.2* |
BB&T Corporation 1995 Omnibus Stock Incentive Plan (as amended and restated through February 25, 2003). |
Incorporated herein by reference to Exhibit 99 of Form S-8 Registration Statement No. 333-116502. |
||
|
10.3* |
2008 Declaration of Amendment to BB&T Corporation 1995 Omnibus Stock Incentive Plan. |
Incorporated herein by reference to Exhibit 10.2.a of the Annual Report on Form 10-K, filed February 27, 2009. |
||
|
10.4* |
409A Declaration of Amendment to BB&T Corporation 1995 Omnibus Stock Incentive Plan. |
Incorporated herein by reference to Exhibit 10.2.b of the Annual Report on Form 10-K, filed February 27, 2009. |
||
|
10.5*† |
Form of Employee Nonqualified Stock Option Agreement for the BB&T Corporation 1995 Omnibus Stock Incentive Plan, as amended and restated. |
Filed herewith. |
||
|
10.6* |
BB&T Corporation Amended and Restated 2004 Stock Incentive Plan, as amended (as amended through February 24, 2009). |
Incorporated herein by reference to the Appendix to the Proxy Statement for the 2009 Annual Meeting of Shareholders on Schedule 14A, filed March 13, 2009. |
||
|
10.7* |
Form of Restricted Stock Unit Agreement (Performance-Based Vesting Component) for Executive Officers under the BB&T Corporation Amended and Restated 2004 Stock Incentive Plan (June 2010 Performance Award). |
Incorporated herein by reference to Exhibit 10.1 of the Current Report on Form 8-K, filed June 25, 2010. |
||
|
10.8* |
Form of Performance Unit Award Agreement for the BB&T Corporation Amended and Restated 2004 Stock Incentive Plan (5-Year Vesting). |
Incorporated herein by reference to Exhibit 10.5 of the Annual Report on Form 10-K, filed February 28, 2008. |
||
|
10.9* |
Form of Performance Unit Award Agreement for the BB&T Corporation Amended and Restated 2004 Stock Incentive Plan (4-Year Vesting). |
Incorporated herein by reference to Exhibit 10.6 of the Quarterly Report on Form 10-Q, filed May 7, 2010. |
||
|
10.10* |
Form of Non-Employee Director Restricted Stock Unit Agreement for the BB&T Corporation Amended and Restated 2004 Stock Incentive Plan (5-Year Vesting). |
Incorporated herein by reference to Exhibit 10.6 of the Annual Report on Form 10-K, filed February 28, 2008. |
||
Table of Contents
|
Exhibit
|
Description |
Location |
||
|
10.11* |
Form of Non-Employee Director Restricted Stock Unit Agreement for the BB&T Corporation Amended and Restated 2004 Stock Incentive Plan (4-Year Vesting). |
Incorporated herein by reference to Exhibit 10.2 of the Quarterly Report on Form 10-Q, filed May 7, 2010. |
||
|
10.12* |
Form of Non-Employee Director Nonqualified Stock Option Agreement for the BB&T Corporation Amended and Restated 2004 Stock Incentive Plan (5-Year Vesting). |
Incorporated herein by reference to Exhibit 10.7 of the Annual Report on Form 10-K, filed February 28, 2008. |
||
|
10.13* |
Form of Non-Employee Director Nonqualified Stock Option Agreement for the BB&T Corporation Amended and Restated 2004 Stock Incentive Plan (4-Year Vesting). |
Incorporated herein by reference to Exhibit 10.3 of the Quarterly Report on Form 10-Q, filed May 7, 2010. |
||
|
10.14* |
Form of Employee Nonqualified Stock Option Agreement for the BB&T Corporation Amended and Restated 2004 Stock Incentive Plan (5-Year Vesting). |
Incorporated herein by reference to Exhibit 10.8 of the Annual Report on Form 10-K, filed February 28, 2008. |
||
|
10.15* |
Form of Employee Nonqualified Stock Option Agreement for the BB&T Corporation Amended and Restated 2004 Stock Incentive Plan (4-Year Vesting). |
Incorporated herein by reference to Exhibit 10.5 of the Quarterly Report on Form 10-Q, filed May 7, 2010. |
||
|
10.16* |
Form of Restricted Stock Unit Agreement for the BB&T Corporation Amended and Restated 2004 Stock Incentive Plan (5-Year Vesting). |
Incorporated herein by reference to Exhibit 10.1 of the Quarterly Report on Form 10-Q, filed May 8, 2009. |
||
|
10.17* |
Form of Restricted Stock Unit Agreement for the BB&T Corporation Amended and Restated 2004 Stock Incentive Plan (4-Year Vesting). |
Incorporated herein by reference to Exhibit 10.4 of the Quarterly Report on Form 10-Q, filed May 7, 2010. |
||
|
10.18* |
Form of Restricted Stock Unit Agreement (Performance Vesting Component) for the BB&T Corporation Amended and Restated 2004 Stock Incentive Plan (5-Year Vesting). |
Incorporated herein by reference to Exhibit 10.10 of the Annual Report on Form 10-K, filed February 28, 2008. |
||
|
10.19* |
BB&T Corporation Amended and Restated 1996 Short-term Incentive Plan. |
Incorporated herein by reference to Exhibit 10.11 of the Annual Report on Form 10-K, filed February 27, 2009. |
||
|
10.20* |
First Amendment to BB&T Corporation Short-term Incentive Plan (January 1, 2009 Restatement). |
Incorporated herein by reference to Exhibit 10.1 of the Quarterly Report on Form 10-Q, filed May 7, 2010. |
||
|
10.21*† |
Southern National Deferred Compensation Plan for Key Executives including amendments. |
Filed herewith. |
||
|
10.22* |
BB&T Corporation Target Pension Plan. |
Incorporated herein by reference to Exhibit 10.13 of the Annual Report on Form 10-K, filed February 27, 2009. |
||
|
10.23*† |
Amendment to the BB&T Corporation Target Pension Plan. |
Filed herewith. |
||
|
10.24* |
BB&T Corporation Non-Qualified Defined Benefit Plan. |
Incorporated herein by reference to Exhibit 10.14 of the Annual Report on Form 10-K, filed February 27, 2009. |
||
Table of Contents
|
Exhibit
|
Description |
Location |
||
|
10.25*† |
Amendment to the BB&T Corporation Non-Qualified Defined Benefit Plan. |
Filed herewith. |
||
|
10.26* |
BB&T Corporation Non-Qualified Defined Contribution Plan. |
Incorporated herein by reference to Exhibit 10.15 of the Annual Report on Form 10-K, filed February 27, 2009. |
||
|
10.27* |
BB&T Corporation Supplemental Defined Contribution Plan for Highly Compensated Employees. |
Incorporated herein by reference to Exhibit 10.16 of the Annual Report on Form 10-K, filed February 27, 2009. |
||
|
10.28* |
BB&T Corporation Non-Qualified Deferred Compensation Trust Amended and Restated effective November 1, 2001 (including amendments) |
Incorporated herein by reference to Exhibit 10.17 of the Annual Report on Form 10-K, filed February 28, 2008. |
||
|
10.29* |
2008 Amended and Restated Employment Agreement by and among BB&T Corporation, Branch Banking and Trust Co. and Kelly S. King. |
Incorporated herein by reference to Exhibit 10.20 of the Annual Report on Form 10-K, filed February 27, 2009. |
||
|
10.30* |
2008 Amended and Restated Employment Agreement by and among BB&T Corporation, Branch Banking and Trust Co. and Christopher L. Henson. |
Incorporated herein by reference to Exhibit 10.21 of the Annual Report on Form 10-K, filed February 27, 2009. |
||
|
10.31* |
2008 Amended and Restated Employment Agreement by and among BB&T Corporation, Branch Banking and Trust Co. and Daryl N. Bible. |
Incorporated herein by reference to Exhibit 10.22 of the Annual Report on Form 10-K, filed February 27, 2009. |
||
|
10.32* |
2008 Amended and Restated Employment Agreement by and among BB&T Corporation, Branch Banking and Trust Co. and Ricky K. Brown. |
Incorporated herein by reference to Exhibit 10.23 of the Annual Report on Form 10-K, filed February 27, 2009. |
||
|
10.33* |
2008 Amended and Restated Employment Agreement by and among BB&T Corporation, Branch Banking and Trust Co. and Barbara F. Duck. |
Incorporated herein by reference to Exhibit 10.24 of the Annual Report on Form 10-K, filed February 27, 2009. |
||
|
10.34* |
2008 Amended and Restated Employment Agreement by and among BB&T Corporation, Branch Banking and Trust Co. and Donna C. Goodrich. |
Incorporated herein by reference to Exhibit 10.25 of the Annual Report on Form 10-K, filed February 27, 2009. |
||
|
10.35* |
2008 Amended and Restated Employment Agreement by and among BB&T Corporation, Branch Banking and Trust Co. and Robert E. Greene. |
Incorporated herein by reference to Exhibit 10.26 of the Annual Report on Form 10-K, filed February 27, 2009. |
||
|
10.36* |
2008 Amended and Restated Employment Agreement by and among BB&T Corporation, Branch Banking and Trust Co. and Clarke R. Starnes, III. |
Incorporated herein by reference to Exhibit 10.27 of the Annual Report on Form 10-K, filed February 27, 2009. |
||
|
10.37* |
2008 Amended and Restated Employment Agreement by and among BB&T Corporation, Branch Banking and Trust Co. and Steven B. Wiggs. |
Incorporated herein by reference to Exhibit 10.28 of the Annual Report on Form 10-K, filed February 27, 2009. |
||
Table of Contents
|
Exhibit
|
Description |
Location |
||
|
10.38* |
2008 Amended and Restated Employment Agreement by and among BB&T Corporation, Branch Banking and Trust Co. and C. Leon Wilson, III. |
Incorporated herein by reference to Exhibit 10.29 of the Annual Report on Form 10-K, filed February 27, 2009. |
||
|
10.39* |
Death Benefit Only Plan, dated April 23, 1990, by and between Branch Banking and Trust Company (as successor to Southern National Bank of North Carolina) and L. Glenn Orr, Jr. |
Incorporated herein by reference to Registration Statement No. 33-33984. |
||
|
10.40* |
Settlement and Non-Compete Agreement, dated February 28, 1995, by and between BB&T Corporation (as successor to Southern National Corporation) and L. Glenn Orr, Jr. |
Incorporated herein by reference to Exhibit 10(b) of Form S-4 Registration Statement No. 33-56437. |
||
|
10.41* |
First Virginia Banks, Inc. Key Employee Salary Reduction Deferred Compensation Plan; First Virginia Banks, Inc. 1986 Key Employee Salary Reduction Deferred Compensation Plan. |
Incorporated herein by reference to Exhibit 10.36 of the Annual Report on Form 10-K, filed February 26, 2010. |
||
|
11 |
Statement re computation of earnings per share. |
Filed herewith as Note 21 to the consolidated financial statements. |
||
|
12† |
Statement re computation of ratios. |
Filed herewith. |
||
|
21† |
Subsidiaries of the Registrant. |
Filed herewith. |
||
|
22 |
Proxy Statement for the Annual Meeting of Shareholders. |
Future filing incorporated herein by reference pursuant to General Instruction G(3). |
||
|
23† |
Consent of Independent Registered Public Accounting Firm. |
Filed herewith. |
||
|
31.1 |
Certification of Chief Executive Officer pursuant to Rule 13a-14(a) or 15(d)-14(a) of the Exchange Act, as adopted pursuant to Section 302 of the Sarbanes-Oxley Act of 2002. |
Filed herewith. |
||
|
31.2 |
Certification of Chief Financial Officer pursuant to Rule 13a-14(a) or 15(d)-14(a) of the Exchange Act, as adopted pursuant to Section 302 of the Sarbanes-Oxley Act of 2002. |
Filed herewith. |
||
|
32.1 |
Chief Executive Officer Certification Pursuant to 18 U.S.C. Section 1350, as Adopted Pursuant to Section 906 of the Sarbanes-Oxley Act of 2002. |
Filed herewith. |
||
|
32.2 |
Chief Financial Officer Certification Pursuant to 18 U.S.C. Section 1350, as Adopted Pursuant to Section 906 of the Sarbanes-Oxley Act of 2002. |
Filed herewith. |
||
|
101.INS** |
XBRL Instance Document. |
Filed herewith. |
||
|
101.SCH** |
XBRL Taxonomy Extension Schema. |
Filed herewith. |
||
|
101.CAL** |
XBRL Taxonomy Extension Calculation Linkbase. |
Filed herewith. |
||
|
101.LAB** |
XBRL Taxonomy Extension Label Linkbase. |
Filed herewith. |
||
Table of Contents
|
Exhibit
|
Description |
Location |
||
|
101.PRE** |
XBRL Taxonomy Extension Presentation Linkbase. |
Filed herewith. |
||
|
101.DEF** |
XBRL Taxonomy Definition Linkbase. |
Filed herewith. |
||
| * | Management compensatory plan or arrangement. |
| ** | As provided in Rule 406T of Regulation S-T, this information is furnished and not filed for purposes of Sections 11 and 12 of the Securities Act of 1933 and Section 18 of the Securities Exchange Act of 1934 . |
| † | Exhibits intentionally not provided herein. |