TRUIST FINANCIAL CORP
10-Ks and 10-Qs
|
|
|
|
|
|
|
|
|
|
|
|
|
|
|
|
|
|
|
|
|
|
|
|
|
|
|
|
|
|
|
|
|
|
|
|
|
|
|
|
|
|
|
|
|
|
|
|
|
|
|
|
|
|
|
|
UNITED STATES
SECURITIES AND EXCHANGE COMMISSION
Washington, D.C. 20549
____________________________________________________
FORM 10-K
____________________________________________________
ANNUAL REPORT PURSUANT TO SECTION 13 OR 15(d)
OF THE SECURITIES EXCHANGE ACT OF 1934
For the fiscal year ended
December 31, 2016
Commission File Number: 1-10853
BB&T CORPORATION
(Exact name of registrant as specified in its charter)
|
North Carolina
|
56-0939887
|
|
(State or other jurisdiction of incorporation or organization)
|
(I.R.S. Employer Identification No.)
|
|
|
|
|
200 West Second Street
Winston-Salem, North Carolina
|
27101
|
|
(Address of principal executive offices)
|
(Zip Code)
|
|
Registrant’s telephone number, including area code: (336) 733-2000
|
|
____________________________________________________
Securities registered pursuant to Section 12(b) of the Act:
|
Title of each class
|
Name of each exchange on which registered
|
|
|
Common Stock, $5 par value
|
New York Stock Exchange
|
|
|
Depositary Shares each representing 1/1,000th interest in a share of Series D Non-Cumulative Perpetual Preferred Stock
|
New York Stock Exchange
|
|
|
Depositary Shares each representing 1/1,000th interest in a share of Series E Non-Cumulative Perpetual Preferred Stock
|
New York Stock Exchange
|
|
|
Depositary Shares each representing 1/1,000th interest in a share of Series F Non-Cumulative Perpetual Preferred Stock
|
New York Stock Exchange
|
|
|
Depositary Shares each representing 1/1,000th interest in a share of Series G Non-Cumulative Perpetual Preferred Stock
|
New York Stock Exchange
|
|
|
Depositary Shares each representing 1/1,000th interest in a share of Series H Non-Cumulative Perpetual Preferred Stock
|
New York Stock Exchange
|
|
Securities registered pursuant to Section 12(g) of the Act: None
Indicate by check mark if the registrant is a well-known seasoned issuer, as defined in Rule 405 of the Securities Act. Yes [X] No [ ]
Indicate by check mark if the registrant is not required to file reports pursuant to Section 13 or Section 15(d) of the Act. Yes [ ] No [X]
Indicate by check mark whether the registrant (1) has filed all reports required to be filed by Section 13 or 15(d) of the Securities Exchange Act of 1934 during the preceding 12 months (or for such shorter period that the registrant was required to file such reports), and (2) has been subject to such filing requirements for the past 90 days. Yes [X] No [ ]
Indicate by check mark whether the registrant has submitted electronically and posted on its corporate website, if any, every Interactive Data File required to be submitted and posted pursuant to Rule 405 of Regulation S-T (§232.405 of this chapter) during the preceding 12 months (or for such shorter period that the registrant was required to submit and post such files). Yes [X] No [ ]
Indicate by check mark if disclosure of delinquent filers pursuant to Item 405 of Regulation S-K is not contained herein, and will not be contained, to the best of registrant’s knowledge, in definitive proxy or information statements incorporated by references in Part III of this Form 10-K or any amendment to this Form 10-K. [ ]
Indicate by check mark whether the registrant is a large accelerated filer, an accelerated filer, a non-accelerated filer, or a smaller reporting company. See the definitions of "large accelerated filer," "accelerated filer" and "smaller reporting company" in Rule 12b-2 of the Exchange Act.
|
Large accelerated filer
|
X
|
|
Accelerated filer
|
|
|
|
|
|
|
|
|
Non-accelerated filer
|
|
(Do not check if a smaller reporting company)
|
Smaller reporting company
|
|
Indicate by check mark whether the registrant is a shell company (as defined in Rule 12b-2 of the Act). Yes [ ] No [X]
At
January 31, 2017
, the Company had
808,394,189
shares of its Common Stock, $5 par value, outstanding. As of June 30,
2016
, the aggregate market value of voting stock held by nonaffiliates of the Company was approximately
$28.9 billion
. Documents incorporated by reference: Portions of the definitive proxy statement relating to the registrant’s annual meeting of stockholders scheduled to be held on April 25, 2017 are incorporated by reference in this Form 10-K in response to Items 10, 11, 12, 13 and 14 of Part III.
|
BB&T CORPORATION
|
|||
|
Index
|
|||
|
December 31, 2016
|
|||
|
|
|
|
Page Nos.
|
|
PART I
|
|||
|
Item 1
|
|||
|
Item 1A
|
|||
|
Item 1B
|
Unresolved Staff Comments-(None to be reported)
|
|
|
|
Item 2
|
|||
|
Item 3
|
|||
|
Item 4
|
Mine Safety Disclosures-(Not applicable)
|
|
|
|
PART II
|
|||
|
Item 5
|
|||
|
Item 6
|
|||
|
Item 7
|
|||
|
Item 7A
|
|||
|
Item 8
|
Financial Statements and Supplementary Data
|
|
|
|
|
|||
|
|
|||
|
|
|||
|
|
|||
|
|
|||
|
|
|||
|
|
|||
|
|
Notes to Consolidated Financial Statements
|
|
|
|
|
|
||
|
|
|
Note 2.
Acquisitions and Divestitures
|
|
|
|
|
Note 3.
Securities
|
|
|
|
|
Note 4.
Loans and ACL
|
|
|
|
|
Note 5.
Premises and Equipment
|
|
|
|
|
||
|
|
|
Note 7.
Loan Servicing
|
|
|
|
|
Note 8.
Deposits
|
|
|
|
|
Note 9.
Long-Term Debt
|
|
|
|
|
Note 10.
Shareholders' Equity
|
|
|
|
|
Note 11.
AOCI
|
|
|
|
|
Note 12.
Income Taxes
|
|
|
|
|
Note 13.
Benefit Plans
|
|
|
|
|
Note 14.
Commitments and Contingencies
|
|
|
|
|
||
|
|
|
Note 16.
Parent Company Financial Statements
|
|
|
|
|
Note 17.
Fair Value Disclosures
|
|
|
|
|
Note 18.
Derivative Financial Instruments
|
|
|
|
|
Note 19.
Computation of EPS
|
|
|
|
|
Note 20.
Operating Segments
|
|
|
Item 9
|
Changes in and Disagreements with Accountants on Accounting and Financial Disclosure-(None to be reported)
|
||
|
Item 9A
|
|||
|
Item 9B
|
Other Information-(None to be reported)
|
|
|
|
PART III
|
|||
|
Item 10
|
Directors, Executive Officers and Corporate Governance
|
*
|
|
|
Item 11
|
Executive Compensation
|
*
|
|
|
Item 12
|
Security Ownership of Certain Beneficial Owners and Management and Related Stockholder Matters
|
*
|
|
|
Item 13
|
Certain Relationships and Related Transactions, and Director Independence
|
*
|
|
|
Item 14
|
Principal Accounting Fees and Services
|
*
|
|
|
PART IV
|
|||
|
Item 15
|
Exhibits, Financial Statement Schedules
|
|
|
|
|
Financial Statements-(see Listing in Item 8 above)
|
|
|
|
|
|||
|
|
Financial Statement Schedules-(None required)
|
|
|
|
Item 16
|
Form 10-K Summary-(None)
|
||
|
*
|
For information regarding executive officers, refer to "Executive Officers of BB&T" in Part I. The other information required by Item 10 is incorporated herein by reference to the information that appears under the headings "Proposal 1-Election of Directors," "Corporate Governance Matters," "Corporate Governance Matters-Board Committees, Membership and Attendance," "Audit Committee Report" and "Section 16(a) Beneficial Ownership Reporting Compliance" in the Registrant’s Proxy Statement for the
2017
Annual Meeting of Shareholders.
|
The information required by Item 11 is incorporated herein by reference to the information that appears under the headings "Compensation Discussion and Analysis," "Compensation of Executive Officers," "Compensation Committee Report on Executive Compensation," "Compensation Committee Interlocks and Insider Participation" and "Compensation of Directors" in the Registrant’s Proxy Statement for the
2017
Annual Meeting of Shareholders.
For information regarding the registrant’s securities authorized for issuance under equity compensation plans, refer to "Equity Compensation Plan Information" in Part II.
The other information required by Item 12 is incorporated herein by reference to the information that appears under the headings "Stock Ownership Information" in the Registrant’s Proxy Statement for the
2017
Annual Meeting of Shareholders.
The information required by Item 13 is incorporated herein by reference to the information that appears under the headings "Corporate Governance Matters-Director Independence" and "Transactions with Executive Officers and Directors" in the Registrant’s Proxy Statement for the
2017
Annual Meeting of Shareholders.
The information required by Item 14 is incorporated herein by reference to the information that appears under the headings "Fees to Auditors" and "Audit Committee Pre-Approval Policy" in the Registrant’s Proxy Statement for the
2017
Annual Meeting of Shareholders.
Glossary of Defined Terms
The following terms may be used throughout this Report, including the consolidated financial statements and related notes.
|
Term
|
|
Definition
|
|
2015 Repurchase Plan
|
|
Plan for the repurchase of up to 50 million shares of BB&T’s common stock
|
|
ACL
|
|
Allowance for credit losses
|
|
Acquired from FDIC
|
|
Assets of Colonial that were formerly covered under loss sharing agreements
|
|
AFS
|
|
Available-for-sale
|
|
Agency MBS
|
|
Mortgage-backed securities issued by a U.S. government agency or GSE
|
|
ALLL
|
|
Allowance for loan and lease losses
|
|
American Coastal
|
|
American Coastal Insurance Company
|
|
AOCI
|
|
Accumulated other comprehensive income (loss)
|
|
Basel III
|
|
Global regulatory standards on bank capital adequacy and liquidity published by the BCBS
|
|
BB&T
|
|
BB&T Corporation and subsidiaries
|
|
BCBS
|
|
Basel Committee on Bank Supervision
|
|
BHC
|
|
Bank holding company
|
|
BHCA
|
|
Bank Holding Company Act of 1956, as amended
|
|
Branch Bank
|
|
Branch Banking and Trust Company
|
|
BSA/AML
|
Bank Secrecy Act/Anti-Money Laundering
|
|
|
BU
|
|
Business Unit
|
|
CCAR
|
|
Comprehensive Capital Analysis and Review
|
|
CD
|
|
Certificate of deposit
|
|
CDI
|
|
Core deposit intangible assets
|
|
CEO
|
|
Chief Executive Officer
|
|
CET1
|
Common equity Tier 1
|
|
|
CFPB
|
|
Consumer Financial Protection Bureau
|
|
CISA
|
|
Cybersecurity Information Sharing Act
|
|
CMO
|
|
Collateralized mortgage obligation
|
|
Colonial
|
|
Collectively, certain assets and liabilities of Colonial Bank acquired by BB&T in 2009
|
|
Company
|
|
BB&T Corporation and subsidiaries (interchangeable with "BB&T" above)
|
|
CRA
|
|
Community Reinvestment Act of 1977
|
|
CRE
|
|
Commercial real estate
|
|
CRMC
|
|
Credit Risk Management Committee
|
|
CRO
|
|
Chief Risk Officer
|
|
CROC
|
|
Compliance Risk Oversight Committee
|
|
DIF
|
|
Deposit Insurance Fund administered by the FDIC
|
|
Dodd-Frank Act
|
|
Dodd-Frank Wall Street Reform and Consumer Protection Act
|
|
EITSC
|
|
Enterprise IT Steering Committee
|
|
EPS
|
|
Earnings per common share
|
|
EVE
|
|
Economic value of equity
|
|
Exchange Act
|
|
Securities Exchange Act of 1934, as amended
|
|
FASB
|
|
Financial Accounting Standards Board
|
|
FATCA
|
|
Foreign Account Tax Compliance Act
|
|
FDIC
|
|
Federal Deposit Insurance Corporation
|
|
FHA
|
|
Federal Housing Administration
|
|
FHC
|
|
Financial Holding Company
|
|
FHLB
|
|
Federal Home Loan Bank
|
|
FHLMC
|
|
Federal Home Loan Mortgage Corporation
|
|
FINRA
|
|
Financial Industry Regulatory Authority
|
|
FNMA
|
|
Federal National Mortgage Association
|
|
FRB
|
|
Board of Governors of the Federal Reserve System
|
|
FTP
|
|
Funds transfer pricing
|
|
GAAP
|
|
Accounting principles generally accepted in the United States of America
|
|
GNMA
|
|
Government National Mortgage Association
|
|
Grandbridge
|
|
Grandbridge Real Estate Capital, LLC
|
|
GSE
|
|
U.S. government-sponsored enterprise
|
|
HFI
|
|
Held for investment
|
1
|
Term
|
|
Definition
|
|
HMDA
|
|
Home Mortgage Disclosure Act
|
|
HTM
|
|
Held-to-maturity
|
|
HUD-OIG
|
|
Office of Inspector General, U.S. Department of Housing and Urban Development
|
|
IDI
|
|
Insured depository institution
|
|
IPV
|
|
Independent price verification
|
|
IRC
|
|
Internal Revenue Code
|
|
IRS
|
|
Internal Revenue Service
|
|
ISDA
|
|
International Swaps and Derivatives Association, Inc.
|
|
LCR
|
|
Liquidity Coverage Ratio
|
|
LHFS
|
|
Loans held for sale
|
|
LIBOR
|
|
London Interbank Offered Rate
|
|
MBS
|
|
Mortgage-backed securities
|
|
MRLCC
|
|
Market Risk, Liquidity and Capital Committee
|
|
MRMD
|
Model Risk Management Department
|
|
|
MSR
|
|
Mortgage servicing right
|
|
MSRB
|
Municipal Securities Rulemaking Board
|
|
|
National Penn
|
National Penn Bancshares, Inc., previously a Pennsylvania incorporated BHC, acquired April 1, 2016
|
|
|
NCCOB
|
North Carolina Office of the Commissioner of Banks
|
|
|
NIM
|
|
Net interest margin, computed on a taxable-equivalent basis
|
|
NM
|
Not meaningful
|
|
|
NPA
|
|
Nonperforming asset
|
|
NPL
|
|
Nonperforming loan
|
|
NYSE
|
|
NYSE Euronext, Inc.
|
|
OAS
|
|
Option adjusted spread
|
|
OCI
|
|
Other comprehensive income (loss)
|
|
ORMC
|
|
Operational Risk Management Committee
|
|
OTTI
|
|
Other-than-temporary impairment
|
|
Parent Company
|
|
BB&T Corporation, the parent company of Branch Bank and other subsidiaries
|
|
Patriot Act
|
|
Uniting and Strengthening America by Providing Appropriate Tools Required to Intercept and Obstruct Terrorism Act of 2001
|
|
PCI
|
|
Purchased credit impaired loans as well as assets of Colonial Bank acquired from the FDIC during 2009, which were formerly covered under loss sharing agreements
|
|
Re-REMICs
|
Re-securitizations of Real Estate Mortgage Investment Conduits
|
|
|
RMC
|
|
Risk Management Committee
|
|
RMO
|
|
Risk Management Organization
|
|
RSU
|
|
Restricted stock unit
|
|
RUFC
|
|
Reserve for unfunded lending commitments
|
|
S&P
|
|
Standard & Poor's
|
|
SBIC
|
|
Small Business Investment Company
|
|
SEC
|
|
Securities and Exchange Commission
|
|
Short-Term Borrowings
|
|
Federal funds purchased, securities sold under repurchase agreements and other short-term borrowed funds with original maturities of less than one year
|
|
Simulation
|
|
Interest sensitivity simulation analysis
|
|
Susquehanna
|
|
Susquehanna Bancshares, Inc., acquired by BB&T effective August 1, 2015
|
|
Swett & Crawford
|
CGSC North America Holdings Corporation, acquired by BB&T effective April 1, 2016
|
|
|
TBA
|
|
To be announced
|
|
TDR
|
|
Troubled debt restructuring
|
|
TE
|
Taxable-equivalent
|
|
|
U.S.
|
|
United States of America
|
|
U.S. Treasury
|
|
United States Department of the Treasury
|
|
UPB
|
|
Unpaid principal balance
|
|
VaR
|
|
Value-at-risk
|
|
VIE
|
|
Variable interest entity
|
2
Forward-Looking Statements
This Annual Report on Form 10-K contains "forward-looking statements" within the meaning of the Private Securities Litigation Reform Act of 1995, regarding the financial condition, results of operations, business plans and the future performance of BB&T that are based on the beliefs and assumptions of the management of BB&T and the information available to management at the time that these disclosures were prepared. Words such as "anticipates," "believes," "estimates," "expects," "forecasts," "intends," "plans," "projects," "may," "will," "should," "could," and other similar expressions are intended to identify these forward-looking statements. Such statements are subject to factors that could cause actual results to differ materially from anticipated results. Such factors include, but are not limited to, the following:
|
•
|
general economic or business conditions, either nationally or regionally, may be less favorable than expected, resulting in, among other things, a deterioration in credit quality and/or a reduced demand for credit, insurance or other services;
|
|
•
|
disruptions to the national or global financial markets, including the impact of a downgrade of U.S. government obligations by one of the credit ratings agencies, the economic instability and recessionary conditions in Europe, the potential exit of the United Kingdom from the European Union and the economic slowdown in China;
|
|
•
|
changes in the interest rate environment, including interest rate changes made by the FRB, as well as cash flow reassessments may reduce NIM and/or the volumes and values of loans made or held as well as the value of other financial assets held;
|
|
•
|
competitive pressures among depository and other financial institutions may increase significantly;
|
|
•
|
legislative, regulatory or accounting changes, including changes resulting from the adoption and implementation of the Dodd-Frank Act may adversely affect the businesses in which BB&T is engaged;
|
|
•
|
local, state or federal taxing authorities may take tax positions that are adverse to BB&T;
|
|
•
|
a reduction may occur in BB&T's credit ratings;
|
|
•
|
adverse changes may occur in the securities markets;
|
|
•
|
competitors of BB&T may have greater financial resources or develop products that enable them to compete more successfully than BB&T and may be subject to different regulatory standards than BB&T;
|
|
•
|
cybersecurity risks, including "denial of service," "hacking" and "identity theft," could adversely affect BB&T's business and financial performance or reputation, and BB&T could be liable for financial losses incurred by third parties due to breaches of data shared between financial institutions;
|
|
•
|
natural or other disasters, including acts of terrorism, could have an adverse effect on BB&T in that such events could materially disrupt BB&T's operations or the ability or willingness of customers to access the services BB&T offers;
|
|
•
|
costs related to the integration of the businesses of BB&T and its merger partners may be greater than expected;
|
|
•
|
failure to execute on strategic or operational plans, including the ability to successfully complete and/or integrate mergers and acquisitions or fully achieve expected cost savings or revenue growth associated with mergers and acquisitions within the expected time frames could adversely impact financial condition and results of operations;
|
|
•
|
significant litigation and regulatory proceedings could have a material adverse effect on BB&T;
|
|
•
|
unfavorable resolution of legal proceedings or other claims and regulatory and other governmental investigations or other inquiries could result in negative publicity, protests, fines, penalties, restrictions on BB&T's operations or ability to expand its business and other negative consequences, all of which could cause reputational damage and adversely impact BB&T's financial conditions and results of operations;
|
|
•
|
risks resulting from the extensive use of models;
|
|
•
|
risk management measures may not be fully effective;
|
|
•
|
deposit attrition, customer loss and/or revenue loss following completed mergers/acquisitions may exceed expectations;
|
|
•
|
higher than expected costs related to information technology infrastructure or a failure to successfully implement future system enhancements could adversely impact BB&T's financial condition and results of operations and could result in significant additional costs to BB&T;
|
|
•
|
widespread system outages, caused by the failure of critical internal systems or critical services provided by third parties, could adversely impact BB&T's financial condition and results of operations; and
|
|
•
|
the other risks and uncertainties detailed in Part I, Item 1A: Risk Factors in this Annual Report on Form 10-K.
|
Readers are cautioned not to place undue reliance on these forward-looking statements, which speak only as of the date of this report. Actual results may differ materially from those expressed in or implied by any forward-looking statement. Except to the extent required by applicable law or regulation, BB&T undertakes no obligation to revise or update publicly any forward-looking statements for any reason. Readers should, however, consult any further disclosures of a forward-looking nature BB&T may make in any subsequent Annual Reports on Form 10‑K, Quarterly Reports on Form 10‑Q, or Current Reports on Form 8‑K.
3
BB&T is a FHC headquartered in Winston-Salem, North Carolina. BB&T conducts its business operations primarily through its bank subsidiary, Branch Bank, and other nonbank subsidiaries.
Operating Subsidiaries
Branch Bank (Winston-Salem, North Carolina), BB&T’s largest subsidiary, was chartered in 1872 and is the oldest bank headquartered in North Carolina. Branch Bank provides a wide range of banking and trust services for retail and commercial clients in its geographic markets, including small and mid-size businesses, public agencies, local governments and individuals, through
2,196
offices (as of
December 31, 2016
). Branch Bank’s principal operating subsidiaries include:
|
•
|
BB&T Equipment Finance Corporation (Charlotte, North Carolina) provides loan and lease financing to commercial and small businesses;
|
|
•
|
BB&T Insurance Services, Inc. (Raleigh, North Carolina) offers property and casualty, life, health, employee benefits, commercial general liability, surety, title and other insurance products through its agency network;
|
|
•
|
BB&T Investment Services, Inc. (Charlotte, North Carolina) is a registered broker-dealer and offers clients non-deposit investment products, including discount brokerage services, equities, fixed-rate, variable-rate and index annuities, mutual funds, government and municipal bonds, and money market funds;
|
|
•
|
CRC Insurance Services, Inc. (Birmingham, Alabama) is a wholesale insurance broker authorized to do business nationwide;
|
|
•
|
Crump Life Insurance Services, Inc. (Roseland, New Jersey) is a wholesale insurance broker authorized to do business nationwide;
|
|
•
|
Grandbridge (Charlotte, North Carolina) specializes in arranging and servicing commercial mortgage loans;
|
|
•
|
McGriff, Seibels & Williams, Inc. (Birmingham, Alabama) is authorized to do business nationwide and specializes in providing insurance products on an agency basis to large commercial clients, including many Fortune 500 companies;
|
|
•
|
Prime Rate Premium Finance Corporation, Inc. (Florence, South Carolina) and its subsidiaries, which include AFCO Credit Corporation, provide insurance premium financing to clients in the United States and Canada; and
|
|
•
|
Susquehanna Commercial Finance, Inc. (Malvern, Pennsylvania) provides loans and lease financing to commercial and small businesses.
|
Major Nonbank Subsidiaries
BB&T also has a number of nonbank subsidiaries, including:
|
•
|
BB&T Securities, LLC (Richmond, Virginia) is a registered investment banking and full-service brokerage firm that provides services in retail brokerage, equity and debt underwriting, investment advice, corporate finance and equity research; and facilitates the origination, trading and distribution of fixed-income securities and equity products in both the public and private capital markets. BB&T Securities, LLC also provides correspondent clearing services to broker-dealers and entities involved in the securities industry;
|
|
•
|
Regional Acceptance Corporation (Greenville, North Carolina) specializes in nonprime, indirect financing for consumer purchases of primarily mid-model and late-model used automobiles; and
|
|
•
|
Sterling Capital Management, LLC (Charlotte, North Carolina) is a registered investment advisor, which provides tailored investment management solutions to meet the specific needs and objectives of individual and institutional clients through a full range of investment strategies.
|
4
Services
BB&T’s subsidiaries offer a variety of services targeted to retail and commercial clients. BB&T’s objective is to offer clients a full array of products to meet all their financial needs. BB&T’s insurance operations primarily consist of a wholesale/agency network.
|
|
Retail Services:
|
|
Commercial Services:
|
|
|
Asset management
|
|
Asset management
|
|
|
Automobile lending
|
|
Association services
|
|
|
Bankcard lending
|
|
Capital markets services
|
|
|
Consumer finance
|
|
Commercial deposit services
|
|
|
Home equity lending
|
|
Commercial finance
|
|
|
Home mortgage lending
|
|
Commercial middle market lending
|
|
|
Insurance
|
|
Commercial mortgage lending
|
|
|
Investment brokerage services
|
|
Corporate banking
|
|
Mobile/online banking
|
Floor plan lending
|
||
|
|
Payment solutions
|
|
Institutional trust services
|
|
|
Retail deposit services
|
|
Insurance
|
|
|
Sales finance
|
|
Insurance premium finance
|
|
|
Small business lending
|
|
International banking services
|
|
|
Wealth management/private banking
|
|
Leasing
|
|
|
|
Merchant services
|
|
|
|
|
|
Mortgage warehouse lending
|
|
|
|
Payment solutions
|
|
|
|
|
|
Private equity investments
|
|
|
|
|
Real estate lending
|
|
|
|
|
Supply chain management
|
Market Area
The following table reflects BB&T’s deposit market share and branch locations by state:
|
Table 1
|
|||||||
|
BB&T Deposit Market Share and Branch Locations by State
|
|||||||
|
|
% of BB&T's Deposits (2)
|
Deposit Market Share Rank (2)
|
Number of Branches (3)
|
||||
|
North Carolina (1)
|
20
|
%
|
2nd
|
352
|
|||
|
Virginia
|
16
|
|
4th
|
344
|
|||
|
Florida
|
12
|
|
6th
|
318
|
|||
|
Pennsylvania
|
10
|
|
4th
|
262
|
|||
|
Georgia
|
9
|
|
5th
|
155
|
|||
|
Maryland
|
7
|
|
6th
|
165
|
|||
|
South Carolina
|
6
|
|
3rd
|
111
|
|||
|
Kentucky
|
4
|
|
2nd
|
110
|
|||
|
Texas
|
4
|
|
14th
|
124
|
|||
|
West Virginia
|
4
|
|
1st
|
73
|
|||
|
Alabama
|
3
|
|
5th
|
84
|
|||
|
New Jersey
|
2
|
|
15th
|
33
|
|||
|
Tennessee
|
2
|
|
7th
|
48
|
|||
|
Washington, D.C.
|
1
|
|
9th
|
13
|
|||
__________________
|
(1)
|
Excludes home office deposits.
|
|
(2)
|
Source: FDIC.gov-data as of June 30,
2016
.
|
|
(3)
|
As of
December 31, 2016
. Excludes two branches in Indiana and two in Ohio.
|
5
BB&T operates in markets that have a diverse employment base covering numerous industries. Management strongly believes that BB&T’s community bank approach to providing client service is a competitive advantage that strengthens the Company’s ability to effectively provide financial products and services to businesses and individuals in its markets. Furthermore, BB&T believes its current market area will support growth in assets and deposits in the future.
Competition
The financial services industry is highly competitive and constantly evolving. BB&T’s subsidiaries compete actively with national, regional and local financial services providers, including banks, thrifts, securities dealers, mortgage bankers, finance companies and insurance companies. In recent years, competition has increased from institutions not subject to the same regulatory restrictions as domestic banks and BHCs. Consumers have the opportunity to select from a variety of traditional and nontraditional alternatives. The industry frequently sees merger activity, which affects competition by eliminating some regional and local institutions, while strengthening the franchises of acquirers. For additional information concerning markets, BB&T’s competitive position and business strategies and recent government interventions, see "Market Area" above and "General Business Development" below.
General Business Development
BB&T is a regional FHC and has maintained a long-term focus on a strategy that includes expansion of asset size and diversification in terms of revenues and sources of profitability. This strategy encompasses both organic growth and acquisitions of complementary banks and financial businesses.
Merger and Acquisition Strategy
BB&T’s growth in business, profitability and market share has historically been enhanced by strategic mergers and acquisitions. BB&T is not currently pursuing significant mergers or acquisitions, but BB&T will assess future opportunities, primarily within or contiguous to BB&T’s existing footprint, based on market conditions and may pursue economically advantageous acquisitions of insurance agencies, specialized lending businesses and fee income generating financial services businesses. BB&T’s acquisition strategy will focus on meeting the following criteria:
|
•
|
the organization must be a good fit with BB&T’s culture;
|
|
•
|
the acquisition must be strategically attractive – meaning that any bank acquisition should be in BB&T’s existing footprint to allow for cost savings and economies of scale or in contiguous states to provide market diversification, or the transaction must be otherwise strategically compelling;
|
|
•
|
any risk-related issues would need to be quantified and addressed; and
|
|
•
|
the transaction must meet BB&T’s financial criteria.
|
Regulatory actions, such as the orders more fully discussed in the "BSA/AML and Suspicious Activity" section below, can limit BB&T’s and Branch Bank’s ability to pursue mergers and acquisitions for a period of time and require new or additional regulatory approvals before engaging in certain other business activities.
On April 1, 2016, BB&T acquired National Penn for total consideration of $1.6 billion. National Penn had 126 financial centers, $10.1 billion of total assets and $6.6 billion of deposits. Also on April 1, 2016, BB&T purchased insurance broker Swett & Crawford from Cooper Gay Swett & Crawford for $461 million in cash.
During 2015, BB&T completed the purchases of Susquehanna Bancshares, Inc. and The Bank of Kentucky Financial Corporation. BB&T also acquired 41 retail branches in Texas from Citigroup. During 2014, BB&T purchased 21 retail branches in Texas from Citigroup. See the "Acquisitions and Divestitures" note in the "Notes to the Consolidated Financial Statements" for further information about these transactions.
6
Regulatory Considerations
The extensive regulatory framework applicable to financial institutions is intended primarily for the protection of depositors, the DIF and the stability of the financial system, rather than for the protection of shareholders and creditors. In addition to banking laws, regulations and regulatory agencies, BB&T is subject to various other laws, regulations, supervision and examination by other regulatory agencies, all of which directly or indirectly affect the operations and management of BB&T and its ability to make distributions to shareholders.
BB&T’s earnings are affected by general economic conditions, management policies, changes in state and federal laws and regulations and actions of various regulatory authorities, including those referred to in this section. Following the November 2016 election, the new administration and members of Congress have publicly disclosed proposals to change certain laws and regulations (e.g., pay ratio disclosure and the DOL fiduciary rule). Proposals to change the laws and regulations are frequently introduced at both the federal and state levels. The likelihood and timing of any such changes and the impact such changes may have on BB&T is impossible to determine with any certainty.
The description below summarizes the significant state and federal laws to which BB&T currently is subject. The descriptions are qualified in their entirety by reference to the particular statutory or regulatory provisions summarized. The descriptions below do not summarize any possible or proposed changes in current laws or regulations.
Financial Regulatory Reform
During the past several years, there has been a significant increase in regulatory oversight for U.S. financial services firms, primarily resulting from the Dodd-Frank Act. The Dodd-Frank Act is extensive, complex and comprehensive legislation that impacts practically all aspects of a banking organization. The Dodd-Frank Act has led to numerous and far-reaching changes that affect financial institutions.
Certain provisions of the Dodd-Frank Act and other laws are subject to further rulemaking, guidance and interpretation by the applicable federal regulators. BB&T will continue to evaluate the impact of any new regulations so promulgated, including changes in regulatory costs and fees, modifications to consumer products or disclosures required by the CFPB and the requirements of the enhanced supervision provisions, among others.
As a BHC and a FHC under federal law, BB&T is subject to regulation under the BHCA and the examination and reporting requirements of the FRB. Branch Bank, a North Carolina state-chartered commercial bank, is subject to regulation, supervision and examination by the NCCOB, the FDIC and the CFPB.
State and federal law govern the activities in which Branch Bank engages, the investments it makes and the aggregate amount of loans that may be granted to one borrower. Various consumer and compliance laws and regulations also affect its operations. Branch Bank is also affected by the actions of the FRB as it implements monetary policy.
In addition to federal and state banking laws and regulations, BB&T and certain of its subsidiaries and affiliates, including those that engage in securities underwriting, dealing, brokerage, investment advisory and insurance activities, are subject to other federal and state laws and regulations as well as supervision and examination by other federal and state regulatory agencies and other regulatory authorities, including the SEC, FINRA, NYSE.
FHC Regulation
Under current federal law, as a BHC, BB&T has elected to become a FHC, which allows it to offer customers virtually any type of service that is financial in nature or incidental thereto, including banking and activities closely related thereto, securities underwriting, insurance and merchant banking. In order to maintain its status as a FHC, BB&T and all of its affiliated IDIs must be well-capitalized and well-managed and have at least a satisfactory CRA rating. The FRB has responsibility for overseeing compliance with these requirements. If the FRB determines that a FHC is not well-capitalized or well-managed, the FHC has a period of time to comply, but during the period of noncompliance, the FRB can place any limitations on the FHC that it believes to be appropriate. Furthermore, if the FRB determines that a FHC has not maintained a satisfactory CRA rating, the FHC would not be able to commence any new financial activities or acquire a company that engages in such activities, although the FHC would still be allowed to engage in activities closely related to banking and make investments in the ordinary course of conducting banking activities.
7
Most of the financial activities that are permissible for FHCs also are permissible for a bank’s "financial subsidiary," except for insurance underwriting, insurance company portfolio investments, real estate investments and development, and merchant banking, which must be conducted by a FHC. In order for a financial subsidiary of a bank to engage in permissible financial activities, federal law requires the parent bank (and its sister-bank affiliates) to be well-capitalized and well-managed; the aggregate consolidated assets of all of that bank’s financial subsidiaries may not exceed the lesser of 45% of its consolidated total assets or $50 billion; the bank must have at least a satisfactory CRA rating; and, if that bank is one of the 100 largest national banks, it must meet certain financial rating or other comparable requirements.
Current federal law also establishes a system of functional regulation under which the FRB is the umbrella regulator for BHCs, but BHC affiliates are principally regulated by functional regulators such as the FDIC for state nonmember bank affiliates, the SEC for securities affiliates and state insurance regulators for insurance affiliates. Certain specific activities, including traditional bank trust and fiduciary activities, may be conducted in the bank without the bank being deemed a "broker" or a "dealer" in securities for purposes of functional regulation. Although states generally must regulate bank insurance activities in a nondiscriminatory manner, states may continue to adopt and enforce rules that specifically regulate bank insurance activities in certain identifiable areas.
Resolution Planning
FRB and FDIC regulations require "covered companies" such as BB&T and systemically important financial institutions such as Branch Bank to file, maintain and update plans for a rapid and orderly resolution in the event of material financial distress or failure (a "living will"). Both the FRB and the FDIC must review and evaluate BB&T’s and Branch Bank’s living wills and are authorized to impose restrictions on growth and activities or operations if deemed necessary. The public portions of the resolution plans are available in the Additional Disclosures section of the Investor Relations site at
bbt.investorroom.com/additional-disclosures
.
CCAR and Stress Test Requirements
FRB rules require BB&T to submit annual capital plans based on pre-defined stress scenarios. BB&T is also required to collect and report certain related data on a quarterly basis to allow the FRB to monitor progress against the annual capital plan. BB&T may pay dividends and repurchase stock only in accordance with a capital plan that has been reviewed by the FRB and that has not received any objections from the FRB. A capital distribution can only occur if, after giving effect to the distribution, all minimum regulatory capital ratios will be maintained, including a post-stress Basel III CET1 ratio of at least 4.5%. See
Table 32
for additional information about Basel III requirements. The FRB did not object to BB&T’s 2016 capital plan.
The FRB conducts an annual supervisory stress test and requires that BB&T conduct a separate mid-cycle stress test, file the results of such test with the FRB and publicly disclose details of the scenario and the impact on its capital. BB&T’s annual and mid-cycle stress test results are available on its website at
bbt.investorroom.com/additional-disclosures
.
The start date of the annual stress test cycle is January 1 of the following calendar year. The capital plan period starts July 1 of the following calendar year. A BHC can only make capital distributions as provided for in its capital plan.
The FDIC conducts an annual supervisory stress test and requires Branch Bank to conduct annual company-run stress tests. The FDIC has modified the "as-of" dates for financial data that covered banks with more than $10 billion in assets will use to perform their stress tests as well as the reporting dates and public disclosure dates of the annual stress tests. The revisions to the regulations became effective on January 1, 2016.
During January 2017, the FRB finalized a rule modifying the capital plan and stress testing rules for the 2017 cycle. The rule removes the qualitative assessment of CCAR for BHCs with total consolidated assets between $50 billion and $250 billion. For these entities, the rule also reduces certain reporting requirements. The rule also decreases the amount of capital that can be distributed by CCAR banks to shareholders outside of an approved capital plan without seeking prior approval from the FRB. Previously, if an entity did not receive an objection to its capital plan, it could distribute up to 1% of its tier 1 capital above the distributions in its capital plan. The rule reduces that amount to 0.25% of tier 1 capital. The rule also adds a blackout period in the second quarter of each year during which a firm cannot change its capital distribution. While no longer subject to the qualitative assessment, BB&T intends to maintain the processes and infrastructure to facilitate future compliance.
8
Acquisitions
BB&T complies with numerous laws related to its acquisition activity. Under the BHCA, a BHC may not directly or indirectly acquire ownership or control of more than 5% of the voting shares or substantially all of the assets of any BHC or bank or merge or consolidate with another BHC without the prior approval of the FRB.
Current federal law authorizes interstate acquisitions of banks and BHCs without geographic limitation, and a bank headquartered in one state is authorized to merge with a bank headquartered in another state, subject to market share limitations, regulatory approvals and any state requirement that the target bank shall have been in existence and operating for a minimum period of time. After a bank has established branches in a state through an interstate merger transaction, the bank may establish and acquire additional branches at any location in the state where a bank headquartered in that state could have established or acquired branches under applicable federal or state law. These regulatory considerations are applicable to privately negotiated acquisition transactions.
FRB rules prohibit a financial company from combining with another company if the ratio of the resulting company's liabilities exceeds 10% of the aggregate consolidated liabilities of all financial companies.
Other Safety and Soundness Regulations
The FRB has enforcement powers over BHCs and their nonbanking subsidiaries. The FRB has authority to prohibit activities that represent unsafe or unsound practices or constitute violations of law, rule, regulation, administrative order or written agreement with a federal regulator. These powers may be exercised through the issuance of cease and desist orders, civil money penalties or other actions.
There also are a number of obligations and restrictions imposed on BHCs and their IDI subsidiaries by federal law and regulatory policy that are designed to reduce potential loss exposure to depositors and the FDIC insurance fund in the event the IDI is insolvent or is in danger of becoming insolvent. For example, the FRB requires a BHC to serve as a source of financial strength to its subsidiary IDIs and to commit financial resources to support such institutions in circumstances where it might not do so otherwise. In addition, the "cross-guarantee" provisions of federal law require IDIs under common control to reimburse the FDIC for any loss suffered or reasonably anticipated by the DIF as a result of the insolvency or potential failure of commonly controlled IDIs. The FDIC’s claim for reimbursement under the cross-guarantee provisions is superior to claims of shareholders of the IDI or its holding company but is subordinate to claims of depositors, secured creditors and nonaffiliated holders of subordinated debt.
Banking regulators also have broad enforcement powers over Branch Bank, including the power to impose fines and other civil and criminal penalties, and to appoint a receiver in order to conserve the assets of Branch Bank for the benefit of depositors and other creditors. The NCCOB also has the authority to take possession of a North Carolina state bank in certain circumstances, including, among other things, when it appears that such bank has violated its charter or any applicable laws, is conducting its business in an unauthorized or unsafe manner, is in an unsafe or unsound condition to transact its business or has an impairment of its capital stock.
Payment of Dividends; Capital Requirements
The Parent Company is a legal entity separate and distinct from its subsidiaries. The majority of the Parent Company’s revenue is from dividends paid by Branch Bank, which are limited by laws and regulations. In addition, BB&T and Branch Bank are subject to various regulatory restrictions relating to the payment of dividends, including regulatory capital minimums and the requirement to remain "well-capitalized" under the prompt corrective action regulations summarized elsewhere in this section. Banking regulators have indicated that dividends should generally only be paid if (1) net income available to common shareholders over the past year has been sufficient to fully fund the dividends and (2) the prospective rate of earnings retention appears consistent with the organization’s capital needs, asset quality and overall financial condition. BB&T’s future capital actions will depend on the FRB’s review of BB&T’s annual capital plans.
North Carolina law states that, provided a bank does not make distributions that reduce its capital below its applicable required capital, the board of directors of a bank chartered under the laws of North Carolina may declare such distributions as the directors deem proper.
9
The federal banking agencies are required to take "prompt corrective action" in respect of financial institutions that do not meet minimum capital requirements. The law establishes five categories for this purpose: "well-capitalized," "adequately capitalized," "undercapitalized," "significantly undercapitalized" and "critically undercapitalized." To be considered "well-capitalized," an IDI must maintain minimum capital ratios and must not be subject to any order or written directive to meet and maintain a specific capital level for any capital measure. Additionally, failure to meet capital requirements may cause an institution to be directed to raise additional capital. Federal law further mandates that the agencies adopt safety and soundness standards generally relating to operations and management, asset quality and executive compensation, and authorizes administrative action against an institution that fails to meet such standards.
In addition, failure to meet capital guidelines may subject a banking organization to a variety of other enforcement remedies, including additional substantial restrictions on its operations and activities, termination of deposit insurance by the FDIC and, under certain conditions, the appointment of a conservator or receiver.
Basel III
The U.S. capital requirements follow the accord of the BCBS. The Company currently qualifies as a standardized approach banking organization under the FRB's Basel III capital framework rules. The rules stipulate the risk-based capital requirements applicable to BHCs and IDIs, define the components of capital and address other areas affecting banking institutions' regulatory capital ratios. The rules also address risk weights and other items affecting the denominator in banking institutions' regulatory capital ratios, and the rules use a more risk-sensitive approach than the pre-Basel III rules.
Institutions with greater than $250 billion in assets or $10 billion in foreign assets are considered advanced approaches banking organizations, which results in a more complex calculation of risk-weighted assets that includes an assessment of the impact of operational risk, among other differences. In addition, advanced approaches institutions have additional reporting requirements and must calculate capital under both the standardized approach and the advanced approaches and use the more conservative result. BB&T would become subject to these requirements upon exceeding either of the asset thresholds.
The Basel III rules, among other things, (1) include a capital measure referred to as CET1; (2) specify that Tier 1 capital consist of Tier 1 common equity and additional Tier 1 capital instruments meeting specified requirements; (3) define Tier 1 common equity narrowly by requiring that most deductions/adjustments to regulatory capital measures be made to Tier 1 common equity and not to the other components of capital; and (4) expand the scope of the deductions/adjustments from capital as compared to prior regulations.
The Basel III rules prescribe a standardized approach for risk weightings that generally range from 0% for U.S. government securities to 600% for certain equity exposures, with a maximum risk weight classification of 1,250% for certain securitizations. This results in higher risk weights for a variety of asset categories. In addition, the rules provide more advantageous risk weights for derivatives and repurchase-style transactions cleared through a qualifying central counterparty and increase the scope of eligible guarantors and eligible collateral for purposes of credit risk mitigation.
The Basel III rules also establish more conservative ratio levels for well-capitalized status. In addition to the minimum risk-based capital requirements, all banks must hold additional capital, referred to as the capital conservation buffer (which is in the form of common equity), to avoid being subject to limits on capital distributions and certain discretionary bonus payments to officers. The required amount of the capital conservation buffer will be phased-in annually through January 1, 2019.
Effective January 1, 2016, Branch Bank became subject to the capital conservation buffer, which requires calculation and public disclosure of the amount of the buffer, the eligible retained income and any limitations on distributions and discretionary bonuses resulting from the buffer, including the maximum payout amount for the quarter. The capital conservation buffer requirements do not currently result in any limitations on distributions or discretionary bonuses for Branch Bank.
See the "Liquidity" section in "Management's Discussion and Analysis of Financial Condition and Results of Operations" for additional information about BB&T's liquidity requirements.
See the "Capital" section in "Management's Discussion and Analysis of Financial Condition and Results of Operations" for additional information about BB&T's capital requirements.
10
HMDA Regulations
The CFPB has issued final rules changing the reporting requirements for lenders under the HMDA. The new rules expand the range of transactions subject to these requirements to include most securitized residential mortgage loans and credit lines. The rules also increase the overall amount of data required to be collected and submitted, including additional data points about the applicable loans and expanded data about the borrowers. BB&T will be required to begin collecting the expanded data on January 1, 2018.
FATCA
FATCA was enacted by Congress to target non-compliance by U.S. taxpayers using foreign accounts. FATCA requires foreign financial institutions to report to the IRS information about financial accounts held by U.S. taxpayers or by foreign entities in which U.S. taxpayers hold a substantial ownership interest. Foreign financial institutions not complying with the reporting requirements are subject to a 30% withholding tax on all U.S. sourced payments. BB&T is in compliance with the applicable requirements currently in effect. Beginning January 1, 2019, the regulations will be expanded to include sales of property that can produce certain types of U.S. source income.
Volcker Rule
The Volcker Rule prohibits IDIs and their affiliates from engaging in short-term proprietary trading of certain securities, derivatives, commodity futures and options for their own account. The rule provides certain exemptions and also clarifies that certain activities are not prohibited, including acting as agent, broker, or custodian. Banking entities were required to conform proprietary trading activities to the final rule by July 21, 2015.
The rule also imposes limits on certain relationships with hedge funds or private equity funds. The FRB extended the compliance deadline to July 21, 2017 for purposes of conforming investments in and relationships with certain funds that were in place prior to December 31, 2013. Complying with these requirements is not expected to have a material impact on BB&T's consolidated financial position, results of operations or cash flows.
DIF Assessments
Branch Bank’s deposits are insured by the DIF of the FDIC up to the limits set forth under applicable law. The FDIC imposes a risk-based deposit premium assessment system that determines assessment rates for an IDI based on an assessment rate calculator, which is based on a number of elements to measure the risk each IDI poses to the DIF. The assessment rate is applied to total average assets less tangible equity, as defined under the Dodd-Frank Act. The assessment rate schedule can change from time to time at the discretion of the FDIC, subject to certain limits. Under the current system, premiums are assessed quarterly.
The FDIC adopted a final rule that imposes a surcharge of 4.5 cents per $100 of the assessment base, after making certain adjustments, for banks with total assets of at least $10 billion. The surcharge became effective July 1, 2016 and will last for a period currently estimated by the FDIC to be two years but ending no later than December 31, 2018. If the DIF has not reached the required level at that time, then the FDIC will impose a special assessment on institutions with assets greater than $10 billion. The net effect of the new surcharge is estimated to increase BB&T's total annual assessment by an amount within the range of $40 million to $50 million, and the applicable portion is included in results for the third and fourth quarters of 2016.
Consumer Protection Laws and Regulations
In connection with its lending and leasing activities, Branch Bank is subject to a number of federal and state laws designed to protect borrowers and promote lending to various sectors of the economy and population. These laws include the Equal Credit Opportunity Act, the Fair Credit Reporting Act, the Truth in Lending Act, the Home Mortgage Disclosure Act, the Real Estate Settlement Procedures Act, and their respective state law counterparts.
11
CFPB
The CFPB has broad rulemaking, supervisory and enforcement powers under various federal consumer financial protection laws, including the laws referenced above, fair lending laws and certain other statutes. The CFPB has examination and primary enforcement authority with respect to depository institutions with $10 billion or more in assets, their service providers and certain non-depository entities such as debt collectors and consumer reporting agencies. The CFPB has authority to prevent unfair, deceptive or abusive practices in connection with the offering of consumer financial products.
The Dodd-Frank Act permits states to adopt consumer protection laws and standards that are more stringent than those adopted at the federal level and, in certain circumstances, permits state attorneys general to enforce compliance with both the state and federal laws and regulations.
The CFPB has concentrated much of its rulemaking efforts on a variety of mortgage-related topics required under the Dodd-Frank Act, including mortgage origination disclosures, minimum underwriting standards and ability to repay, high-cost mortgage lending, and servicing practices. The rules related to ability to repay, qualified mortgage standards and mortgage servicing became effective during 2014, while the escrow and loan originator compensation rules became effective during 2013.
A final rule integrating mortgage loan disclosures required by the Truth in Lending Act and the Real Estate Settlement and Procedures Act became effective during October 2015. The final rule consolidated four existing and separate disclosures required under these acts for closed-end credit transactions secured by real property into two forms with a view towards making the mortgage loan disclosures less confusing and more consumer friendly. Branch Bank delivered the functionality required to meet the effective date of October 3, 2015 for the new integrated disclosures.
As a result of these rules, BB&T transferred the management of certain home equity loans from direct retail lending within the Community Banking segment to the Residential Mortgage Banking segment during 2014.
Patriot Act
The Patriot Act is intended to strengthen the ability of U.S. law enforcement agencies and intelligence communities to cooperate in the prevention, detection and prosecution of international money laundering and the financing of terrorism. The Patriot Act contains anti-money laundering measures affecting IDIs, broker-dealers and certain other financial institutions. The Patriot Act includes the International Money Laundering Abatement and Financial Anti-Terrorism Act of 2001, which requires such financial institutions to implement policies and procedures to combat money laundering and the financing of terrorism and grants the Secretary of the U.S. Treasury broad authority to establish regulations and to impose requirements and restrictions on financial institutions’ operations. The Patriot Act imposes substantial obligations on financial institutions to maintain appropriate policies, procedures and processes to detect, prevent and report money laundering, terrorist financing and other financial crimes. Failure to comply with these regulations may result in fines, penalties, lawsuits, regulatory sanctions, reputation damage, or restrictions on business. In addition, the Patriot Act requires the federal bank regulatory agencies to consider the effectiveness of a financial institution’s anti-money laundering activities when reviewing bank mergers and BHC acquisitions.
BSA/AML and Suspicious Activity
BB&T is subject to several federal laws that are designed to combat money laundering, terrorist financing and transactions with persons, companies, or foreign governments designated by U.S. authorities. This category of laws includes the Bank Secrecy Act, the Money Laundering Control Act, and the Patriot Act.
During December 2016, Branch Bank entered into a consent order with the FDIC and the NCCOB and in January 2017, BB&T entered into a cease and desist order with the FRB and NCCOB. These orders call for corrective actions and enhancements to address certain internal control deficiencies within the BSA/AML Compliance Program. No criminal activity has been identified as the result of such deficiencies, and no financial penalty was levied. BB&T has already taken significant steps towards the improvement of its BSA/AML program, including:
|
•
|
additional investment into processes and system upgrades to strengthen anti-money laundering controls;
|
|
•
|
continued emphasis on education, training and the importance of compliance for all associates; and
|
|
•
|
the hiring and placement of a highly experienced BSA/AML professional to oversee these efforts.
|
12
BB&T expects to continue to devote significant resources to its BSA/AML program, particularly as risks persistently emerge and evolve and as regulatory expectations escalate.
BSA/AML laws and regulations obligate depository institutions and broker/dealers to verify their customers’ identity, conduct customer due diligence, report on suspicious activity, file reports of transactions in currency and conduct enhanced due diligence on certain accounts, individuals and businesses. Depository institutions and broker/dealers are required by their respective federal regulators to maintain policies and procedures in order to ensure compliance with the above obligations. Federal regulators regularly examine such policies and procedures to ensure their adequacy and effectiveness, and the frequency and extent of such examinations and the remedial actions resulting therefrom have been increasing. Non-compliance with BSA/AML laws or failure to maintain adequate policies and procedures can lead to significant monetary penalties and reputational damage, and federal regulators evaluate the effectiveness of an applicant in combating money laundering when determining whether to approve a bank merger, BHC acquisitions or other expansionary activity.
Privacy
Federal law contains extensive customer privacy protection provisions, including substantial customer privacy protections provided under the Financial Services Modernization Act of 1999 (commonly known as the Gramm-Leach-Bliley Act). Under these provisions, a financial institution must provide to its customers, at the inception of the customer relationship and annually thereafter, the institution’s policies and procedures regarding the handling of customers’ nonpublic personal financial information. During December 2015, Congress amended the Gramm-Leach-Bliley Act privacy provisions to include an exception under which if a financial institution meets certain conditions, it is not required to provide annual privacy notices to customers. In July 2016, the CFPB proposed a rule implementing this provision.
An institution may not provide customers’ nonpublic personal financial information to unaffiliated third parties unless the institution discloses to the customer that such information may be so provided and the customer is given the opportunity to opt out of such disclosure. Federal law makes it a criminal offense, except in limited circumstances, to obtain or attempt to obtain customer information by fraudulent or deceptive means.
CRA
The CRA requires Branch Bank’s primary federal bank regulatory agency, the FDIC, to assess the bank’s record in meeting the credit needs of the communities served by the bank, including low- and moderate-income neighborhoods and persons. Institutions are assigned one of four ratings: "Outstanding," "Satisfactory," "Needs to Improve" or "Substantial Noncompliance." This assessment is reviewed for any bank that applies to merge or consolidate with or acquire the assets or assume the liabilities of an IDI, or to open or relocate a branch office. The CRA record of each subsidiary bank of a FHC also is assessed by the FRB in connection with any acquisition or merger application.
Automated Overdraft Payment Regulation
There are federal consumer protection laws related to automated overdraft payment programs offered by financial institutions. The FRB prohibits financial institutions from charging consumers fees for paying overdrafts on automated teller machine and one-time debit card transactions, unless a consumer consents, or opts in, to the overdraft service. Financial institutions must also provide consumers with a notice that explains the financial institution’s overdraft services, including the associated fees and the consumer’s choices. In addition, FDIC-supervised institutions must monitor overdraft payment programs for "excessive or chronic" customer use and undertake "meaningful and effective" follow-up action with customers that overdraw their accounts more than six times during a rolling 12-month period. Financial institutions must also impose daily limits on overdraft charges, review and modify check-clearing procedures, prominently distinguish account balances from available overdraft coverage amounts and ensure board and management oversight regarding overdraft payment programs.
Pay Ratio Disclosure
The SEC has adopted amendments to require the disclosure of: (1) the median compensation amount of the annual total compensation of all employees of a registrant (excluding the CEO), (2) the annual total compensation of that registrant's CEO and (3) the ratio of the median of the annual total compensation of all employees (excluding the CEO) to the annual total compensation of the CEO. The rules require such information for the first fiscal year beginning on or after January 1, 2017.
13
DOL Fiduciary Rule
During April 2016, the DOL issued a final rule related to fiduciary standards in regards to the investing of clients' retirement assets. The final rule expands the definition of a fiduciary under the Employee Retirement Income Security Act of 1974. Those who provide investment advice to plans, plan sponsors, fiduciaries, plan participants, beneficiaries and IRAs and IRA owners must either avoid payments that create conflicts of interest or comply with the protective terms of an exemption issued by the DOL. Under new exemptions adopted with the rule, financial institutions will be obligated to acknowledge their status and the status of their individual advisers as "fiduciaries." Firms and advisers will be required to make prudent investment recommendations without regard to their own interests, or the interests of those other than the customer; charge only reasonable compensation; and make no misrepresentations to their customers regarding recommended investments. Additionally, the new rule requires certain disclosures to be made to the investor, and ongoing compliance must be monitored and documented. The requirements under the new rule will be phased in from April 10, 2017 to January 1, 2018. The estimated impact for 2017 of additional expense and reduced revenue ranges from $10 million to $15 million.
FDIC Recordkeeping Requirements
The FDIC has released a final rule to facilitate prompt payment of FDIC-insured deposits when large IDIs fail. The rule requires IDIs with two million or more deposit accounts to maintain complete and accurate data on each depositor's ownership interest by right and capacity and to develop the capability to calculate the insured and uninsured amounts for each deposit owner by ownership right and capacity. The requirements under the rule must be in place by April 1, 2020. This rule is expected to result in additional costs to BB&T; however, the amount has not been quantified.
Cybersecurity
Effective December 2015, the CISA is intended to improve cybersecurity in the U.S. by enhanced sharing of information about security threats among the U.S. government and private sector entities, including financial institutions. The CISA also authorizes companies to monitor their own systems notwithstanding any other provision of law, and allows companies to carry out defensive measures on their own systems from cyber attacks. The law includes liability protections for companies that share cyber threat information with third parties so long as such sharing activity is conducted in accordance with CISA.
Incentive-Based Compensation Arrangements
During May 2016, several financial regulators jointly issued a proposed rule designed to prohibit incentive-based compensation arrangements that could encourage inappropriate risks by providing excessive compensation or that could lead to a material financial loss. The proposed rule would require the applicable compensation arrangements to be considered against a number of factors, including a requirement that the arrangements contain both financial and non-financial measures of performance. In addition, the requirements would differ based on the size of the institution, and institutions with assets exceeding $50 billion would be subject to mandatory deferral, forfeiture/adjustment and clawback requirements for employees subject to the rule. BB&T is currently reviewing the proposed rule to determine the potential impact.
Other Regulatory Matters
BB&T is subject to examinations by federal and state banking regulators, as well as the SEC, the FINRA, the NYSE, various taxing authorities and various state insurance and securities regulators. BB&T periodically receives requests for information from regulatory authorities in various states, including state insurance commissions and state attorneys general, securities regulators and other regulatory authorities, concerning BB&T’s business and accounting practices. Such requests are considered incidental to the normal conduct of business.
Employees
For the quarter ended
December 31, 2016
, BB&T had approximately 37,500 full-time equivalent employees, compared to approximately 36,000 full-time equivalent employees for the quarter ended
December 31, 2015
.
14
Website Access to BB&T’s Filings with the SEC
BB&T’s electronic filings with the SEC, including the Annual Report on Form 10-K, Quarterly Reports on Form 10-Q, Current Reports on Form 8-K and amendments to these reports filed or furnished pursuant to Sections 13(a) or 15(d) of the Exchange Act, as amended, are made available at no cost in the Investor Relations section of the Company’s website,
BBT.com
, as soon as reasonably practicable after BB&T files such material with, or furnishes it to, the SEC. BB&T’s SEC filings are also available through the SEC’s website at
sec.gov
.
Corporate Governance
Information with respect to BB&T’s Board of Directors, Executive Officers and corporate governance policies and principles is presented on BB&T’s website,
BBT.com
, and includes:
|
•
|
Corporate Governance Guidelines
|
|
•
|
Corporate Board of Directors, including Biographical Information
|
|
•
|
Committees of the Corporate Board of Directors and Committee Charters
|
|
•
|
Codes of Ethics for Directors, Senior Financial Officers and Associates
|
|
•
|
Executive Officers, including Biographical Information
|
|
•
|
Policy and Procedures for Accounting, Securities and Legal Complaints, including Whistleblower Procedures
|
|
•
|
Statement of Political Activity
|
|
•
|
Corporate Social Responsibility Report
|
BB&T intends to disclose any substantive amendments or waivers to the Codes of Ethics for Directors or Senior Financial Officers on its website at
BBT.com
.
15
Executive Officers
|
Executive Officer
|
Recent Work Experience
|
Yrs of Service
|
Age
|
|||
|
Kelly S. King
|
Chairman since January 2010. Chief Executive Officer since January 2009.
|
44
|
68
|
|||
|
Chairman and Chief Executive Officer
|
|
|
||||
|
Christopher L. Henson
|
President since December 2016. Chief Operating Officer since January 2009.
|
32
|
55
|
|||
|
President and Chief Operating Officer
|
|
|
||||
|
Daryl N. Bible
|
Chief Financial Officer since January 2009.
|
9
|
55
|
|||
|
Senior Executive Vice President and
|
|
|
|
|||
|
Chief Financial Officer
|
|
|
|
|||
|
Clarke R. Starnes III
|
Chief Risk Officer since July 2009.
|
34
|
57
|
|||
|
Senior Executive Vice President and
|
|
|
|
|||
|
Chief Risk Officer
|
|
|
|
|||
|
W. Bennett Bradley
|
Chief Digital Officer since January 2016. President, Payment Solutions from September 2005 to December 2015.
|
31
|
55
|
|||
|
Senior Executive Vice President and
|
|
|
||||
|
Chief Digital Officer
|
|
|
||||
|
|
||||||
|
Barbara F. Duck
|
Chief Information Officer since July 2016. Data and Technology Services Manager from January 2016 to June 2016. Enterprise Risk Manager from July 2009 to December 2015.
|
29
|
50
|
|||
|
Senior Executive Vice President and
|
|
|
||||
|
Chief Information Officer
|
|
|
||||
|
Jim. D. Godwin
|
Deputy Chief Risk Officer since January 2016. Chief Operational Risk Officer from September 2012 to December 2015. Credit Risk Review Manager from May 2009 to September 2012.
|
21
|
48
|
|||
|
Senior Executive Vice President and
|
||||||
|
Deputy Chief Risk Officer
|
||||||
|
Donna C. Goodrich
|
Deposit, Payment and Operations Services Manager since January 2016. Deposit Services Manager from April 2004 to December 2015.
|
31
|
54
|
|||
|
Senior Executive Vice President and
|
|
|
||||
|
Deposit, Payment and Operations Services Manager
|
|
|
||||
|
Robert J. Johnson, Jr.
|
General Counsel, Secretary and Chief Corporate Governance Officer since August 2010.
|
12
|
44
|
|||
|
Senior Executive Vice President and
|
|
|
||||
|
General Counsel, Secretary and
|
||||||
|
Chief Corporate Governance Officer
|
||||||
|
Brant J. Standridge
|
Lending Group Manager since August 2016. Regional President in Texas from January 2015 to August 2016. Regional President in Georgia from November 2011 to December 2014. Regional President in Maryland from August 2009 to November 2011.
|
18
|
41
|
|||
|
Senior Executive Vice President and
|
||||||
|
Lending Group Manager
|
||||||
|
David H. Weaver
|
President Community Banking since December 2016. Community Banking Group Executive from 2010 to December 2016.
|
21
|
50
|
|||
|
Senior Executive Vice President and
|
|
|
||||
|
President Community Banking
|
||||||
|
Dontá L. Wilson
|
Chief Client Experience Officer since August 2016. Regional President in Georgia from December 2014 to July 2016. Regional President in Alabama from August 2009 to November 2014.
|
18
|
40
|
|||
|
Senior Executive Vice President and
|
||||||
|
Chief Client Experience Officer
|
||||||
|
W. Rufus Yates
|
President and CEO of BB&T Securities since January 2013. President and CEO of Scott & Stringfellow, LLC from 2009 through 2012.
|
30
|
59
|
|||
|
Senior Executive Vice President and
|
|
|
||||
|
Financial Services Manager
|
|
|
||||
16
The following discussion sets forth some of the more important risk factors that could materially affect BB&T’s financial condition and operations. When a risk factor spans several risk categories, the below risks have been listed by their primary risk category. Other factors that could affect the Company’s financial condition and operations are discussed in the "Forward-Looking Statements" section above. However, there may be additional risks that are not presently material or known, and factors besides those discussed below, or elsewhere in this or other reports that BB&T filed or furnished with the SEC, that also could adversely affect the Company.
Compliance Risk
Changes in banking laws could have a material adverse effect on BB&T.
BB&T is extensively regulated under federal and state banking laws and regulations that are intended primarily for the protection of depositors, the DIF and the banking system as a whole. In addition, BB&T is subject to changes in federal and state laws as well as changes in banking and credit regulations and governmental economic and monetary policies. Any of these changes could adversely and materially affect BB&T. The regulatory environment for financial institutions entails significant potential increases in compliance requirements and associated costs, including those related to consumer credit, with a focus on mortgage lending.
Federal and state banking regulators also possess broad powers to take supervisory actions as they deem appropriate. These supervisory actions may result in higher capital requirements, higher deposit insurance premiums and limitations on BB&T’s activities that could have a material adverse effect on its business and profitability.
For example, as discussed in "Regulatory Considerations" above, the FDIC adopted a final rule that imposes a DIF assessment surcharge for banks with total assets of at least $10 billion. The surcharge became effective July 1, 2016 and will last for a period currently estimated by the FDIC to be two years but ending no later than December 31, 2018. If the DIF has not reached the required level at that time, then the FDIC will impose a special assessment on institutions with assets greater than $10 billion. The net effect of the new surcharge is estimated to increase BB&T's total annual assessment by an amount ranging from$40 million to $50 million.
The Dodd-Frank Act, and its related rulemaking activities, may result in lower revenues, higher costs and ratings downgrades. In addition, failure to meet the FRB’s capital planning and adequacy requirements and liquidity requirements under the Dodd-Frank Act and other banking laws may limit the ability to pay dividends, pursue acquisitions and repurchase common stock.
The Dodd-Frank Act represents a significant overhaul of many aspects of the regulation of the financial services industry, addressing, among other things, systemic risk, capital adequacy, deposit insurance assessments, consumer financial protection, interchange fees, derivatives, lending limits, and changes among the bank regulatory agencies. Under Dodd-Frank, BB&T is deemed to be a "systemically important" institution. Federal agencies continue to implement the provisions of the Dodd-Frank Act. Many of these provisions remain subject to further rulemaking, guidance and interpretation by the applicable federal regulators. Additionally, the CFPB has finalized a number of significant rules that impact nearly every aspect of the lifecycle of a residential mortgage. These rules implement the Dodd-Frank Act amendments to the Equal Credit Opportunity Act, the Truth in Lending Act and the Real Estate Settlement Procedures Act. These rules have a direct impact on BB&T’s operations, as BB&T is both a mortgage originator and a servicer.
Due to BB&T’s size, it is subject to additional regulations such as the "living will" requirements relating to the rapid and orderly resolution of systemically important financial institutions in the event of material financial distress or failure. BB&T cannot predict the additional effects that compliance with the Dodd-Frank Act or any regulations will have on BB&T’s businesses or its ability to pursue future business opportunities. Additional regulations resulting from the Dodd-Frank Act may materially adversely affect BB&T’s business, financial condition or results of operations. See "Regulatory Considerations" for additional information regarding the Dodd-Frank Act and its impact upon BB&T.
17
BB&T is subject to enhanced capital requirements and may be subject to more stringent capital requirements, which could diminish its ability to pay dividends or require BB&T to reduce its operations.
The Dodd-Frank Act requires federal banking agencies to establish more stringent risk-based capital requirements and leverage limits applicable to banks and BHCs. The FRB approved final rules that established a new comprehensive capital framework for U.S. banking organizations and established a more conservative definition of capital. These requirements, known as Basel III, became effective on January 1, 2015, and as a result, BB&T became subject to enhanced minimum capital and leverage ratios. These requirements, and any other new regulations, including those that have been proposed but not yet implemented as a result of the requirements established by the BCBS, could adversely affect BB&T’s ability to pay dividends or raise capital, or could require BB&T to limit certain business activities, which may adversely affect its results of operations or financial condition. BB&T currently qualifies as a standardized approach banking organization under Basel III. Financial institutions with greater than $250 billion in assets or $10 billion in foreign assets are considered advanced approaches banking organizations, which are subject to a more complex calculation of RWA that includes an assessment of the impact of operational risk, among other requirements. BB&T is preparing to comply with the advanced approaches requirements, and these more stringent requirements, or BB&T’s failure to properly comply with them, could materially and adversely impact BB&T’s financial results and regulatory status once the requirements become applicable to BB&T. In addition, the costs associated with complying with more stringent capital requirements, such as the requirement to formulate and submit capital plans based on pre-defined stress scenarios on an annual basis, could have a material adverse effect on BB&T. See "Regulatory Considerations" for additional information regarding the capital requirements under the Dodd-Frank Act and Basel III.
For example, BB&T is subject to assessment by the FRB as part of the CCAR program. CCAR is an annual exercise by the FRB to ensure that institutions have forward-looking capital planning processes that account for their risks and sufficient capital to continue operations throughout times of economic and financial stress. BB&T cannot be certain that the FRB will have no objections to BB&T’s future capital plans submitted through the CCAR program. Failure to pass the CCAR review could adversely affect BB&T’s ability to pay dividends, enter into acquisitions and repurchase common stock.
BB&T is subject to extensive and expanding government regulation and supervision, which can lead to costly enforcement actions while increasing the cost of doing business and limiting BB&T’s ability to generate revenue.
The financial services industry is subject to intense scrutiny from bank supervisors in the examination process and aggressive enforcement of regulations on both the federal and state levels, particularly with respect to mortgage-related practices and other consumer compliance matters, as well as compliance with anti-money laundering, Bank Secrecy Act and Office of Foreign Assets Control efforts, and economic sanctions against certain foreign countries and nationals. Federal banking law grants substantial enforcement powers to federal banking regulators. This enforcement authority includes, among other things, the ability to assess significant civil or criminal monetary penalties, fines, or restitution; to issue cease and desist or removal orders; and to initiate injunctive actions against banking organizations and institution-affiliated parties. These enforcement actions may be initiated for violations of laws and regulations and unsafe or unsound practices. Failure to comply with these and other regulations, and supervisory expectations related thereto, may result in fines, penalties, lawsuits, regulatory sanctions, reputation damage or restrictions on business.
In addition, federal bank regulatory agencies are required to consider the effectiveness of a financial institution’s anti-money laundering activities and other regulatory compliance matters when reviewing bank mergers and BHC acquisitions and, consequently, non-compliance with the applicable regulations could materially impair BB&T’s ability to enter into or complete mergers and acquisitions.
For example, as discussed in "Regulatory Considerations" above, Branch Bank entered into a consent order with the FDIC and the NCCOB during December 2016 and BB&T entered into a cease and desist order with the FRB and NCCOB in January 2017. The orders call for corrective actions and enhancements to address certain internal control deficiencies within the BSA/AML Compliance Program. BB&T’s and Branch Bank’s ability to pursue mergers and acquisitions may be limited for a period of time.
For another example, as discussed in the "Loan Servicing" note in the "Notes to Consolidated Financial Statements," during 2014, BB&T received notice from the HUD-OIG that BB&T had been selected for an audit/survey to assess BB&T's compliance with FHA loan origination and quality control requirements. BB&T subsequently received subpoenas from the HUD-OIG and the Department of Justice seeking additional information regarding its lending practices in connection with loans insured by the FHA. During 2014, BB&T recognized an $85 million charge that was included in other expense on the Consolidated Statements of Income. During the third quarter of 2016, the Company paid $83 million to settle these matters pursuant to an agreement with the Department of Justice.
18
Differences in interpretation of tax laws and regulations and any potential resulting litigation may adversely impact BB&T’s financial statements.
Local, state or federal tax authorities may interpret tax laws and regulations differently than BB&T and challenge tax positions that BB&T has taken on its tax returns. This may result in differences in the treatment of revenues, deductions or credits and/or differences in the timing of these items. The differences in treatment may result in payment of additional taxes, interest or penalties that could have a material adverse effect on financial results. For example, as discussed in the "Income Taxes" note in the "Notes to Consolidated Financial Statements," during 2010, BB&T received an IRS statutory notice of deficiency for tax years 2002-2007 asserting a liability for taxes, penalties and interest of approximately $892 million. Related developments resulted in a $516 million charge during 2013. Potential developments in BB&T’s litigation or in similar cases could adversely affect BB&T’s financial position or results of operations.
Credit Risk
Changes in national, regional and local economic conditions and deterioration in the geographic and financial markets in which BB&T operates could lead to higher loan charge-offs and reduce net income and growth.
BB&T’s business is subject to fluctuations based on national, regional and local economic conditions, as well as conditions that may be specific to particular sectors or industries. These fluctuations are not predictable, cannot be controlled and may have a material adverse impact on BB&T’s operations and financial condition even if other favorable events occur. BB&T’s banking operations are primarily locally oriented and community-based. Accordingly, BB&T expects to continue to be dependent upon local business conditions as well as conditions in the local residential and CRE markets it serves. For example, an increase in unemployment, a decrease in real estate values or increases in interest rates, as well as other factors, could weaken the economies of the communities BB&T serves. Weakness in BB&T’s market area could depress its earnings and consequently its financial condition because:
|
•
|
customers may not want or need BB&T’s products or services;
|
|
•
|
borrowers may not be able or willing to repay their loans;
|
|
•
|
the value of the collateral securing loans to borrowers may decline; and
|
|
•
|
the quality of BB&T’s loan portfolio may decline.
|
Any of the latter three scenarios could require BB&T to charge off a higher percentage of loans and/or increase provisions for credit losses, which would reduce net income. For example, our loan portfolio includes loans for oilfield services, oil and gas exploration and production, and pipeline transportation of gas and crude oil. Oil prices have declined in recent years, which has had an adverse effect on some of our borrowers in this portfolio and on the value of the collateral securing some of these loans. If such downturn in the oil and gas industry continues, the cash flows of our customers in this industry could be adversely impacted, which could impair their ability to service any loans outstanding to them and/or reduce demand for loans. These factors could result in higher delinquencies and greater charge-offs in future periods, which could adversely affect our business, financial condition or results of operations.
A systemic lack of available credit, a lack of confidence in the financial sector, volatility in the financial markets and/or reduced business activity could materially adversely affect BB&T’s business, financial condition and results of operations.
Potential downgrades of U.S. government securities by one or more of the credit ratings agencies could have a material adverse effect on BB&T’s operations, earnings and financial condition.
A possible future downgrade of the sovereign credit ratings of the U.S. government and a decline in the perceived creditworthiness of U.S. government-related obligations could impact BB&T’s ability to obtain funding that is collateralized by affected instruments, as well as affect the pricing of that funding when it is available. A downgrade may also adversely affect the market value of such instruments. BB&T cannot predict if, when or how any changes to the credit ratings or perceived creditworthiness of these obligations will affect economic conditions. Such ratings actions could result in a significant adverse impact on BB&T. For example, BB&T’s securities portfolio consists largely of MBS issued by GSEs, such as FHLMC and FNMA. Among other things, a downgrade in the U.S. government’s credit rating could adversely impact the value of these securities and may trigger requirements that the Company post additional collateral for trades relative to these securities. A downgrade of the sovereign credit ratings of the U.S. government or the credit ratings of related institutions, agencies or instruments would significantly exacerbate the other risks to which BB&T is subject and any related adverse effects on its business, financial condition and results of operations.
19
The soundness of other financial institutions could adversely affect BB&T.
Financial services institutions are interrelated as a result of trading, clearing, counterparty or other relationships. BB&T has exposure to many different industries and counterparties, and BB&T and certain of its subsidiaries routinely execute transactions with counterparties in the financial services industry, including brokers and dealers, commercial banks, investment banks, mutual and hedge funds and other institutions. Many of these transactions expose BB&T to credit risk in the event of default of its counterparty. In addition, BB&T’s credit risk may be exacerbated when collateral is liquidated at prices not sufficient to recover the full amount of the loan or derivative exposure. These types of losses could materially and adversely affect BB&T’s results of operations or financial condition.
BB&T could be affected by the United Kingdom’s potential withdrawal from the European Union.
In June 2016, the United Kingdom electorate voted to leave the European Union. This referendum was advisory and does not have binding legal effect. In the event that the United Kingdom formally notifies the European Union of its intention to leave the union (commonly referred to as "Brexit"), then the terms of the United Kingdom’s withdrawal from, and future relationships with, the European Union will be negotiated, and legislation implementing the withdrawal must be enacted. The ultimate impact of Brexit and its effects on BB&T still remain uncertain and will depend on the terms of withdrawal and the post-Brexit relationships that the United Kingdom will negotiate with the European Union and other nations that are not a part of the European Union. Increased market volatility and further global economic deterioration resulting from Brexit, or concern about Brexit, could have significant adverse effects on BB&T's businesses, results of operations, financial condition, liquidity and capital. In addition, specific impacts from Brexit could include requirements that BB&T make certain changes to its operational model, business practices and regulatory authorizations in order to continue servicing customers across Europe; detrimental impacts on revenues and expenses; increased difficulties related to recruitment, retention, and mobility of certain European-based associates; and other adverse impacts on business operations.
Liquidity Risk
BB&T’s liquidity could be impaired by an inability to access the capital markets, an unforeseen outflow of cash or a reduction in the credit ratings for BB&T or its subsidiaries.
Liquidity is essential to BB&T’s businesses. When volatility or disruptions occur in the capital markets, BB&T’s ability to access capital could be materially impaired. Additionally, other factors outside of BB&T’s control, such as a general market disruption or an operational problem that affects third parties, could impair BB&T’s ability to access capital markets or create an unforeseen outflow of cash or deposits. BB&T’s inability to access the capital markets could constrain its ability to make new loans or meet its existing lending commitments and could ultimately jeopardize its overall liquidity and capitalization.
BB&T’s credit ratings are also important to its liquidity. Rating agencies regularly evaluate BB&T and its subsidiaries, and their ratings are based on a number of factors, including the financial strength of BB&T and its subsidiaries, as well as factors not entirely within BB&T’s control, including conditions affecting the financial services industry generally. As a result, there can be no assurance that BB&T will maintain its current ratings. A reduction in BB&T’s credit ratings could adversely affect BB&T’s liquidity and competitive position, increase its borrowing costs, limit its access to the capital markets or trigger unfavorable contractual obligations.
Market Risk
Instability in economic conditions and volatility in financial markets could have a material adverse effect on BB&T’s operations, earnings and financial condition.
The macroeconomic environment in the United States is susceptible to global events and volatility. The negative impact on economic conditions and global markets from foreign sovereign debt matters and other matters could adversely affect BB&T’s business, financial condition and liquidity. Domestic and global political activity, geopolitical matters, including international political unrest or disturbances, concerns over energy prices and economic instability or recession in certain regions could cause turmoil and volatility in the financial markets, which could reduce the value of BB&T’s assets or cause a reduction in liquidity that adversely impacts BB&T’s financial condition and results of operations.
20
The monetary, tax and other policies of governmental agencies, including the FRB, have a significant impact on market interest rates, and BB&T’s business and financial performance is impacted significantly by such interest rates.
BB&T’s businesses and earnings are affected by the fiscal and other policies adopted by various regulatory authorities of the U.S., non-U.S. governments and international agencies. The FRB regulates the supply of money and credit in the U.S. The federal policies determine in large part the cost of funds for lending and investing and the return earned on those loans and investments. The market impact from such policies can also materially decrease the value of certain of BB&T’s financial assets, most notably debt securities. Changes in the federal policies are beyond BB&T’s control and, consequently, the impact of these changes on BB&T’s activities and results of operations is difficult to predict.
Changes in interest rates may have an adverse effect on BB&T’s profitability.
BB&T’s earnings and financial condition are largely dependent on net interest income, which is the difference between interest earned from loans and investments and interest paid on deposits and borrowings. The narrowing of interest rate spreads could adversely affect BB&T’s earnings and financial condition. BB&T cannot control or predict with certainty changes in interest rates. Regional and local economic conditions, competitive pressures and the policies of regulatory authorities, including monetary policies of the FRB, affect interest income and interest expense. As discussed in "Market Risk Management – Interest Rate Market Risk (Other than Trading)," BB&T has ongoing policies and procedures designed to manage the risks associated with changes in market interest rates. However, changes in interest rates still may have an adverse effect on BB&T’s profitability. For example, rising interest rates could adversely affect BB&T’s mortgage banking business because higher interest rates could cause customers to apply for fewer mortgages. Similarly, rising interest rates would increase the required periodic payment for variable rate loans and may result in borrowers becoming unable to pay. Additionally, rising interest rates may increase the cost of BB&T’s deposits, which are a primary source of funding. BB&T is also subject to the risk of a negative interest rate scenario, which implies that a depositor would pay a premium for a financial institution to hold funds on deposit. In such a scenario, some depositors may choose to withdraw their deposits in lieu of paying an interest rate to BB&T to hold such deposits. Negative rates would also diminish the spreads on loans and securities. This scenario could have a material adverse effect on BB&T’s financial condition and results of operations.
Loss of deposits or a change in deposit mix could increase the Company’s funding costs.
Deposits are a low cost and stable source of funding. BB&T competes with banks and other financial institutions for deposits. Funding costs may increase because the Company may lose deposits and replace them with more expensive sources of funding, clients may shift their deposits into higher cost products or the Company may need to raise its interest rates to avoid losing deposits. Higher funding costs reduce the Company’s NIM, net interest income and net income.
Operational Risk
BB&T faces cybersecurity risks, including "denial of service attacks," "hacking" and "identity theft" that could result in the disclosure of confidential information, adversely affect BB&T’s business or reputation and create significant legal and financial exposure.
BB&T’s computer systems and network infrastructure are subject to security risks and could be susceptible to cyber attacks, such as denial of service attacks, hacking, terrorist activities or identity theft. Financial services institutions and companies engaged in data processing have reported breaches in the security of their websites or other systems, some of which have involved sophisticated and targeted attacks intended to obtain unauthorized access to confidential information, destroy data, disable or degrade service, or sabotage systems, often through the introduction of computer viruses or malware, cyber attacks
and other means. Denial of service attacks have been launched against a number of large financial services institutions, including BB&T. As a result of these attacks, the performance of BB&T’s website,
BBT.com
, was adversely affected, and in some instances customers were prevented from accessing BB&T’s website. BB&T expects to be subject to similar attacks in the future. While events to date primarily resulted in inconvenience, future cyber attacks could be more disruptive and damaging. Hacking and identity theft risks, in particular, could cause serious reputational harm. Cyber threats are rapidly evolving and BB&T may not be able to anticipate or prevent all such attacks. BB&T may incur increasing costs in an effort to minimize these risks and could be held liable for any security breach or loss.
21
Despite efforts to ensure the integrity of its systems, BB&T will not be able to anticipate all security breaches of these types, and BB&T may not be able to implement effective preventive measures against such security breaches. The techniques used by cyber criminals change frequently and can originate from a wide variety of sources, including outside groups such as external service providers, organized crime affiliates, terrorist organizations or hostile foreign governments. Those parties may also attempt to fraudulently induce associates, customers or other users of BB&T’s systems to disclose sensitive information in order to gain access to its data or that of its clients. These risks may increase in the future as the Company continues to increase its mobile-payment and other internet-based product offerings and expands its internal usage of web-based products and applications.
A successful penetration or circumvention of system security could cause serious negative consequences to BB&T, including disruption of operations, misappropriation of confidential information of BB&T or its customers, or damage to computer systems of BB&T or its customers and counterparties. A security breach could result in violations of applicable privacy and other laws, financial loss to BB&T or to its customers, loss of confidence in BB&T’s security measures, significant litigation exposure and harm to BB&T’s reputation, all of which could have a material adverse effect.
BB&T relies on its associates, systems and certain counterparties, and certain failures could materially adversely affect operations.
BB&T’s business is dependent on the ability to process, record and monitor a large number of complex transactions. The Company could be materially adversely affected if one or more of its associates causes a significant operational breakdown or failure, either as a result of human error or intentionally. Financial, accounting or other data processing systems may fail or have other significant shortcomings that materially adversely affect BB&T’s business. BB&T’s systems may not be able to handle certain scenarios, such as a negative interest rate environment. In addition, products, services and processes are continually changing and BB&T may not fully identify new operational risks that may arise from such changes. Any of these occurrences could diminish the ability to operate one or more BUs or result in potential liability to clients, increased operating expenses, higher litigation costs (including fines and sanctions), reputational damage, regulatory intervention or weaker competitive standing, any of which could be material to the Company.
If personal, confidential or proprietary information of clients were to be mishandled or misused, significant regulatory consequences, reputational damage and financial loss could occur. Such mishandling or misuse could include circumstances where, for example, such information was erroneously provided to parties who are not permitted to have the information, either through the fault of systems, associates, or counterparties, or where such information was intercepted or otherwise inappropriately taken by third parties.
BB&T may be subject to disruptions of its operating systems arising from events that are wholly or partially beyond its control, which may include, for example, security breaches; electrical or telecommunications outages; failures of computer servers or other damage to property or assets; natural disasters; health emergencies or pandemics; or events arising from political events, including terrorist acts. There can be no assurance that disaster recovery or other plans will fully mitigate all potential business continuity risks. Any failures or disruptions of systems or operations could impact BB&T’s ability to service its clients, which could adversely affect BB&T’s results of operations by subjecting BB&T to losses, litigation, regulatory fines or penalties or by requiring the expenditure of significant resources to correct the failure or disruption.
Significant litigation and regulatory proceedings could have a material adverse effect on BB&T.
BB&T faces significant litigation and regulatory proceedings in its business. The volume of claims and amount of damages and penalties claimed in litigation and regulatory proceedings against financial institutions remains high. Given the inherent uncertainties involved in litigation and regulatory proceedings, and the very large or indeterminate damages sought in some matters asserted against BB&T, there can be significant uncertainty as to the ultimate liability BB&T may incur from such matters. The finding, or even the assertion, of substantial legal liability or significant regulatory action against BB&T may have material adverse financial effects or cause significant reputational harm to BB&T, which in turn could seriously harm BB&T’s business prospects.
22
BB&T faces significant operational and other risks related to its activities, which could expose it to negative publicity, litigation and/or regulatory action.
BB&T is exposed to many types of risks, including operational, reputational, legal and compliance risk, the risk of fraud or theft by associates or outsiders (including identity and information theft), unauthorized transactions by associates or operational errors, including clerical or record-keeping errors or those resulting from faulty or disabled computer or telecommunications systems. Negative public opinion can result from BB&T’s actual or alleged conduct in any number of activities, including lending practices, corporate governance and acquisitions, activities related to asset sales and balance sheet management and from actions taken by government regulators and community organizations in response to those activities. Negative public opinion can adversely affect BB&T’s ability to attract and keep customers and can expose it to litigation and regulatory action.
Because the nature of the financial services industry involves a high volume of transactions, certain errors may be repeated or compounded before they are discovered and successfully rectified. BB&T’s necessary dependence upon automated systems to record and process its transaction volume may further increase the risk that technical flaws or associate tampering or manipulation of those systems will result in losses that are difficult to detect. BB&T also may be subject to disruptions of its operating systems arising from events that are wholly or partially beyond its control (for example, computer viruses or electrical or telecommunications outages), which may give rise to disruption of service to customers and to financial loss or liability. BB&T is further exposed to the risk that its external vendors may be unable to fulfill their contractual obligations (or will be subject to the same risk of fraud or operational errors by their respective employees as is BB&T) and to the risk that BB&T’s (or its vendors’) business continuity and data security systems prove to be inadequate.
BB&T relies on other companies to provide certain key components of its business infrastructure.
Third party vendors provide certain key components of BB&T’s business infrastructure such as internet connections, network access and certain transaction processing. While BB&T has selected these third party vendors carefully, it does not control their operations. Any failure by these third parties to perform or provide agreed upon goods and services for any reason, or their poor performance of services, could adversely affect BB&T’s ability to deliver products and services to its customers and otherwise conduct its business. Replacing these third party vendors could also entail significant delay and expense.
BB&T may not be able to successfully integrate mergers and acquisitions.
Difficulties may arise in the integration of the business and operations of BHCs, banks and non-bank entities that BB&T acquires and, as a result, BB&T may not be able to achieve the cost savings and synergies that it expects will result from such transactions. Achieving cost savings is dependent on consolidating certain operational and functional areas, eliminating duplicative positions and terminating certain agreements for outside services. Additional operational savings are dependent upon the integration of the acquired or merged entity’s businesses with BB&T or one of BB&T’s subsidiaries, the conversion of core operating systems, data systems and products and the standardization of business practices. Complications or difficulties in the conversion of core operating systems, data systems and products may result in the loss of customers, damage to BB&T’s reputation within the financial services industry, operational problems, one-time costs currently not anticipated or reduced cost savings resulting from such mergers or acquisitions. Annual cost savings in each such transaction may be materially less than anticipated if the merger or acquisition is delayed unexpectedly, the integration of operations is delayed beyond what is anticipated or the conversion to a single set of data systems is not accomplished on a timely basis.
Difficulty in integrating an acquired company may prevent BB&T from realizing expected revenue increases, cost savings, increases in geographic or product presence and/or other projected benefits from the acquisition. The integration could result in higher than expected deposit attrition, loss of key associates, disruption of BB&T’s businesses or the businesses of the acquired company, or otherwise adversely affect BB&T’s ability to maintain relationships with customers and associates or achieve the anticipated benefits of the acquisition. Also, the negative effect of any divestitures required by regulatory authorities in acquisitions or business combinations may be greater than expected. As a result of these and other factors, BB&T could incur losses on acquired assets and increased expenses resulting from the failure to successfully integrate an acquired company, which could adversely impact its financial condition or results of operations.
23
BB&T may not be able to successfully implement future information technology system enhancements, which could adversely affect BB&T’s business operations and profitability.
BB&T invests significant resources in information technology system enhancements in order to provide functionality and security at an appropriate level. BB&T may not be able to successfully implement and integrate future system enhancements, which could adversely impact the ability to provide timely and accurate financial information in compliance with legal and regulatory requirements, which could result in sanctions from regulatory authorities. Such sanctions could include fines and suspension of trading in BB&T stock, among others. In addition, future system enhancements could have higher than expected costs and/or result in operating inefficiencies, which could increase the costs associated with the implementation as well as ongoing operations.
Failure to properly utilize system enhancements that are implemented in the future could result in impairment charges that adversely impact BB&T’s financial condition and results of operations and could result in significant costs to remediate or replace the defective components. In addition, BB&T may incur significant training, licensing, maintenance, consulting and amortization expenses during and after systems implementations, and any such costs may continue for an extended period of time.
BB&T is investing significant resources in a new commercial loan system. BB&T may not be able to successfully implement and integrate the new commercial loan system, which could adversely impact the ability to provide timely and accurate financial information in compliance with legal and regulatory requirements, which could result in sanctions and fines from regulatory authorities. The implementation could extend past the expected timing and/or result in operating inefficiencies, which could increase the costs associated with the implementation as well as ongoing operations. Failure to implement part or all of the system could result in impairment charges that adversely impact BB&T’s financial condition and results of operations and could result in significant costs to remediate or replace the defective components. In addition, BB&T may incur significant training, licensing, maintenance, consulting and amortization expenses during and after the implementation, and any such costs may continue for an extended period of time.
There are risks resulting from the extensive use of models in BB&T’s business.
BB&T relies on quantitative models to measure risks and to estimate certain financial values. Models may be used in such processes as determining the pricing of various products, grading loans and extending credit, measuring interest rate and other market risks, predicting or estimating losses, assessing capital adequacy and calculating economic and regulatory capital levels, as well as to estimate the value of financial instruments and balance sheet items. Poorly designed or implemented models present the risk that BB&T’s business decisions based on information incorporating model output would be adversely affected due to the inadequacy of that information. Also, information BB&T provides to the public or to its regulators based on poorly designed or implemented models could be inaccurate or misleading. Some of the decisions that the regulators make, including those related to capital distributions to BB&T’s shareholders, could be affected adversely due to the perception that the quality of the models used to generate the relevant information is insufficient.
BB&T’s risk management measures may not be fully effective.
Management of risk, including compliance, credit, liquidity, market, operational, reputation and strategic risks, requires policies and procedures to properly record and verify a large number of transactions and events. BB&T’s risk management measures may not be fully effective in identifying and mitigating its risk exposure in all market environments or against all types of risk, including risks that are unidentified or unanticipated, even if the models for assessing risk are properly designed and implemented. Some of BB&T’s methods of managing risk are based upon its use of observed historical market behavior and management's judgment. These methods may not accurately predict future exposures, which could be significantly greater than the historical measures indicate. In addition, credit risk is inherent in the financial services business. BB&T’s ability to assess the creditworthiness of its customers may be impaired if the models and approaches it uses to select, manage and underwrite consumer and commercial customers become less predictive of future charge-offs.
BB&T's set of risk monitoring and risk mitigation techniques, and the judgments that accompany their application, cannot anticipate every economic and financial outcome or the timing of such outcomes. BB&T may, therefore, incur losses in the course of its risk management or investing activities.
24
Strategic and Other Risk
BB&T may experience significant competition from new or existing competitors, which may reduce its customer base or cause it to lower prices for its products and services in order to maintain market share.
There is intense competition among commercial banks in BB&T’s market area. In addition, BB&T competes with other providers of financial services, such as savings and loan associations, credit unions, consumer finance companies, securities firms, insurance companies, commercial finance and leasing companies, the mutual funds industry, full-service brokerage firms and discount brokerage firms, some of which are subject to less extensive regulations than BB&T is with respect to the products and services they provide. BB&T’s success depends, in part, on its ability to adapt its products and services to evolving industry standards and customer expectations. There is increasing pressure to provide products and services at lower prices. Lower prices can reduce BB&T’s NIM and revenues from its fee-based products and services.
In addition, the adoption of new technologies by competitors, including internet banking services, mobile applications and advanced ATM functionality could require BB&T to make substantial expenditures to modify or adapt its existing products and services. Also, these and other capital investments in BB&T’s business may not produce expected growth in earnings anticipated at the time of the expenditure. BB&T may not be successful in introducing new products and services, achieving market acceptance of its products and services, anticipating or reacting to consumers’ changing technological preferences or developing and maintaining loyal customers. In addition, BB&T could lose market share to the shadow banking system or other non-traditional banking organizations.
Some of BB&T’s larger competitors, including certain national banks that have a significant presence in BB&T’s market area, may have greater capital and resources than BB&T, may have higher lending limits and may offer products and services not offered by BB&T. Any potential adverse reactions to BB&T’s financial condition or status in the marketplace, as compared to its competitors, could limit BB&T’s ability to attract and retain customers and to compete for new business opportunities. The inability to attract and retain customers or to effectively compete for new business may have a material and adverse effect on BB&T’s financial condition and results of operations.
BB&T also experiences competition from nonbank companies inside and outside of its market area and, in some cases, from companies other than those traditionally considered financial sector participants. In particular, technology companies have begun to focus on the financial sector and offer software and products primarily over the Internet, with an increasing focus on mobile device delivery. These companies generally are not subject to the comparable regulatory burdens as financial institutions and may accordingly realize certain cost savings and offer products and services at more favorable rates and with greater convenience to the customer. For example, a number of companies offer bill pay and funds transfer services that allow customers to avoid using a bank. Technology companies are generally positioned and structured to quickly adapt to technological advances and directly focus resources on implementing those advances. This competition could result in the loss of fee income and customer deposits and related income. In addition, changes in consumer spending and saving habits could adversely affect BB&T’s operations, and the Company may be unable to develop competitive and timely new products and services in response. As the pace of technology and change advance, continuous innovation is expected to exert long-term pressure on the financial services industry.
BB&T may not be able to complete future acquisitions.
BB&T must generally satisfy a number of meaningful conditions before it can complete an acquisition of another bank or BHC, including federal and/or state regulatory approvals. In determining whether to approve a proposed bank or BHC acquisition, bank regulators will consider, among other factors, the effect of the acquisition on competition, financial condition and future prospects, including current and projected capital ratios and levels, the competence, experience and integrity of management and record of compliance with laws and regulations, the convenience and needs of the communities to be served, including the acquiring institution’s record of compliance under the CRA, the effectiveness of the acquiring institution in combating money laundering activities and protests from various stakeholders of both BB&T and its acquisition partner. Also, under the Dodd-Frank Act, U.S. regulators must now take systemic risk into account when evaluating whether to approve a potential acquisition transaction involving a large financial institution like BB&T. BB&T cannot be certain when or if, or on what terms and conditions, any required regulatory approvals will be granted. In specific cases, BB&T may be required to sell banks or branches, or take other actions as a condition to receiving regulatory approval. An inability to satisfy other conditions necessary to consummate an acquisition transaction, such as third-party litigation, a judicial order blocking the transaction or lack of shareholder approval, could also prevent BB&T from completing an announced acquisition.
25
Catastrophic events could have a material adverse effect on BB&T.
The occurrence of catastrophic events such as hurricanes, tropical storms, tornados, winter storms and other large scale catastrophes could adversely affect BB&T’s financial condition or results of operations. BB&T has operations and customers along the Gulf and Atlantic coasts as well as other parts of the southeastern United States, which could be adversely impacted by hurricanes and other severe weather in those regions. Unpredictable natural and other disasters could have an adverse effect on BB&T in that such events could materially disrupt its operations or the ability or willingness of its customers to access the financial services offered by BB&T. These events could reduce BB&T’s earnings and cause volatility in its financial results for any fiscal quarter or year and have a material adverse effect on BB&T’s financial condition and/or results of operations.
BB&T leases its headquarters at 200 West Second Street, Winston-Salem, North Carolina 27101 and owns or leases other significant office space in the vicinity of its headquarters. BB&T owns or leases free-standing operations centers, with its primary operations and information technology centers located in various locations in the southeastern and mid-Atlantic United States. Offices are either owned or operated under long-term leases. BB&T operates retail branches and other offices in a number of states, primarily concentrated in the southeastern and mid-Atlantic United States. See
Table 1
for a list of BB&T’s branches by state. BB&T also operates numerous insurance agencies and other businesses that occupy facilities throughout the U.S. and Canada. Management believes that the premises are well-located and suitably equipped to serve as financial services facilities. See the "Premises and Equipment" note in the "Notes to Consolidated Financial Statements" in this report for additional disclosures related to properties and other fixed assets.
BB&T’s common stock is traded on the NYSE under the symbol "BBT." The common stock was held by approximately 450,000 shareholders at
December 31, 2016
compared to approximately 384,000 shareholders at
December 31, 2015
. The following table sets forth the quarterly high and low trading prices and closing sales prices for BB&T’s common stock and the cash dividends declared per share of common stock for each of the last eight quarters.
|
Table 2
|
||||||||||||||||||||||||||||||||
|
Quarterly Summary of Market Prices and Cash Dividends Declared on Common Stock
|
||||||||||||||||||||||||||||||||
|
|
2016
|
2015
|
||||||||||||||||||||||||||||||
|
|
Sales Prices
|
Cash Dividends Declared
|
Sales Prices
|
Cash Dividends Declared
|
||||||||||||||||||||||||||||
|
|
High
|
Low
|
Close
|
High
|
Low
|
Close
|
||||||||||||||||||||||||||
|
Quarter Ended:
|
|
|
|
|
|
|
|
|
||||||||||||||||||||||||
|
March 31
|
$
|
37.03
|
|
$
|
29.95
|
|
$
|
33.27
|
|
$
|
0.27
|
|
$
|
40.17
|
|
$
|
34.95
|
|
$
|
38.99
|
|
$
|
0.24
|
|
||||||||
|
June 30
|
37.02
|
|
32.22
|
|
35.61
|
|
0.28
|
|
41.70
|
|
37.33
|
|
40.31
|
|
0.27
|
|
||||||||||||||||
|
September 30
|
38.81
|
|
33.72
|
|
37.72
|
|
0.30
|
|
41.90
|
|
34.73
|
|
35.60
|
|
0.27
|
|
||||||||||||||||
|
December 31
|
47.85
|
|
37.40
|
|
47.02
|
|
0.30
|
|
39.47
|
|
34.24
|
|
37.81
|
|
0.27
|
|
||||||||||||||||
|
Year
|
47.85
|
|
29.95
|
|
47.02
|
|
$
|
1.15
|
|
41.90
|
|
34.24
|
|
37.81
|
|
$
|
1.05
|
|
||||||||||||||
The stock price reached an all-time high during the first quarter of 2017.
26
Common Stock, Dividends and Share Repurchases
BB&T’s ability to pay dividends is primarily dependent on earnings from operations, the adequacy of capital and the availability of liquid assets for distribution and is subject to the FRB not objecting to its capital plan. BB&T’s ability to generate liquid assets for distribution is dependent on the ability of Branch Bank to pay dividends to the Parent Company. The payment of cash dividends is an integral part of providing a competitive return on shareholders’ investments. The Company’s policy is to accomplish this while retaining sufficient capital to support future growth and to meet regulatory requirements. Management has established a guideline that the common dividend payout ratio (computed by dividing common stock dividends by net income available to common shareholders) will be between 30% and 50% during normal economic conditions. BB&T’s common dividend payout ratio was
40.9%
in
2016
compared to
40.8%
in
2015
and 34.3% in 2014. BB&T has paid a cash dividend to shareholders every year since 1903. BB&T expects common dividend declarations, if declared, to occur in January, April, July and October with payment dates on or about the first of March, June, September and December. A discussion of dividend restrictions is included in the "Regulatory Requirements and Other Restrictions" note in the "Notes to Consolidated Financial Statements" and in the "Regulatory Considerations" section.
Share Repurchases
BB&T has periodically repurchased shares of its own common stock. In accordance with North Carolina law, repurchased shares cannot be held as treasury stock, but revert to the status of authorized and unissued shares upon repurchase.
The 2015 Repurchase Plan, announced on June 25, 2015, allows for the repurchase up to 50 million shares of the Company's common stock. Repurchases under the 2015 Repurchase Plan may be effected through open market purchases or privately negotiated transactions. The timing and exact amount of repurchases will be consistent with the Company's capital plan and subject to various factors, including the Company's capital position, liquidity, financial performance, alternative uses of capital, stock trading price and general market conditions, and may be suspended at any time. The 2015 Repurchase Plan does not have an expiration date. Shares that are repurchased pursuant to the 2015 Repurchase Plan constitute authorized but unissued shares of the Company and are therefore available for future issuances.
On July 26, 2016, the Company announced that the Board of Directors authorized up to $640 million of share repurchases over a one-year period beginning with the third quarter of 2016. The Company completed $160 million of share repurchases during each of the third and fourth quarters of 2016. On December 20, 2016, the Company announced that the Board of Directors also authorized an additional $200 million of share repurchases through an accelerated share repurchase program, which resulted in the retirement of 3.4 million shares during the fourth quarter of 2016 and concluded in January 2017 with approximately 910,000 additional shares being retired.
Management's guideline for the total payout ratio (computed by dividing the sum of common stock dividends declared and share repurchases, excluding shares repurchased in connection with equity awards, by net income available to common shareholders) is that it will range between 30% and 80% during normal economic conditions. The total payout ratio was
64.0%
,
40.8%
and 34.3% in
2016
,
2015
and 2014, respectively. BB&T may consider higher total distributions based on its capital position, earnings and prevailing economic conditions.
|
Table 3
|
|||||||||||||
|
Share Repurchase Activity
|
|||||||||||||
|
|
Total Shares Repurchased (1)
|
Average Price Paid Per Share (2)
|
Total Shares Purchased Pursuant to Publicly-Announced Plan
|
Maximum Remaining Number of Shares Available for Repurchase Pursuant to Publicly-Announced Plan
|
|||||||||
|
|
(shares in thousands)
|
||||||||||||
|
October 2016
|
1,959
|
|
$
|
39.07
|
|
1,955
|
|
43,751
|
|
||||
|
November 2016
|
2,156
|
|
39.00
|
|
2,145
|
|
41,606
|
|
|||||
|
December 2016
|
3,409
|
|
46.68
|
|
3,375
|
|
38,231
|
|
|||||
|
Total
|
7,524
|
|
42.50
|
|
7,475
|
|
|
|
|||||
__________________
|
(1)
|
Includes shares exchanged or surrendered in connection with the exercise of equity-based awards under BB&T’s equity-based compensation plans.
|
|
(2)
|
Excludes commissions. For the December 2016 period, the average price paid per share includes the final average price of $46.68 per share used to determine the total shares repurchased under the accelerated share repurchase program upon its conclusion in January 2017.
|
27
Preferred Stock
See "Shareholders’ Equity" note in the "Notes to Consolidated Financial Statements" for information about preferred stock.
Equity Compensation Plan Information
The following table provides information concerning securities to be issued upon the exercise of outstanding equity-based awards as of
December 31, 2016
.
|
Table 4
|
||||||||
|
Equity Compensation Plan Information
|
||||||||
|
Plan Category
|
(a)(1)
Number of securities to be issued upon exercise of outstanding options, warrants and rights
|
(b)(2)
Weighted-average exercise price of outstanding options, warrants and rights
|
(c)(3)
Number of securities remaining available for future issuance under equity compensation plans (excluding securities reflected in (a))
|
|||||
|
Approved by security holders
|
24,548,547
|
|
$33.35
|
16,626,809
|
|
|||
|
Not approved by security holders (4)
|
—
|
|
—
|
—
|
|
|||
|
Total
|
24,548,547
|
|
33.35
|
16,626,809
|
|
|||
__________________
|
(1)
|
Includes 13,184,898 RSUs.
|
|
(2)
|
Excludes RSUs because they do not have an exercise price.
|
|
(3)
|
All awards remaining available for future issuance will be issued under the terms of the 2012 Incentive Plan.
|
|
(4)
|
Excludes 432,061 options outstanding with a weighted average exercise price of $37.42 for plans that BB&T will not make future awards under and were assumed in mergers and acquisitions.
|
Performance Graphs
The following graphs compare the cumulative total returns (assuming concurrent $100 investments at the beginning of each period and reinvestment of dividends) of BB&T common stock, the S&P 500 Index, and an industry peer group. The companies in the peer group were Comerica Incorporated, Fifth-Third Bancorp, Huntington Bancshares, Incorporated, KeyCorp, M&T Bank Corporation, PNC Financial Services Group, Inc., Regions Financial Corporation, SunTrust Banks, Inc., U.S. Bancorp, Wells Fargo & Company and Zions Bancorporation.

28

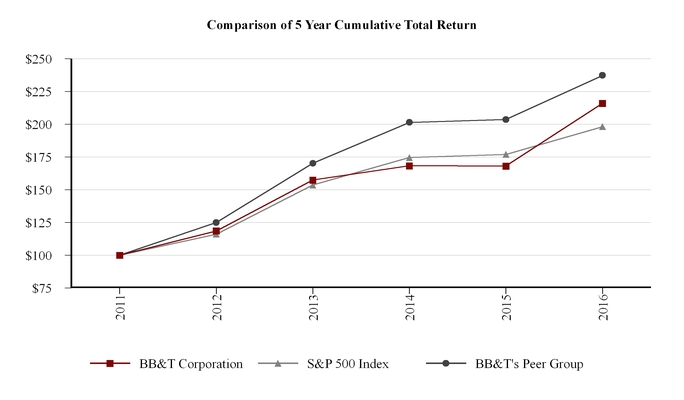
|
|
As of / Through December 31,
|
Cumulative Total Return Through December 31, 2016
|
||||||||||||||||||||||||||||||
|
|
Invested
|
Cumulative Total Return
|
||||||||||||||||||||||||||||||
|
|
2011
|
2012
|
2013
|
2014
|
2015
|
2016
|
10 Year
|
20 Year
|
||||||||||||||||||||||||
|
BB&T Corporation
|
$
|
100.00
|
|
$
|
118.57
|
|
$
|
157.37
|
|
$
|
168.22
|
|
$
|
168.05
|
|
$
|
215.90
|
|
$
|
153.49
|
|
$
|
504.75
|
|
||||||||
|
S&P 500 Index
|
100.00
|
|
115.99
|
|
153.54
|
|
174.54
|
|
176.94
|
|
198.09
|
|
195.72
|
|
438.79
|
|
||||||||||||||||
|
BB&T's Peer Group
|
100.00
|
|
124.93
|
|
170.20
|
|
201.35
|
|
203.51
|
|
237.25
|
|
154.50
|
|
508.27
|
|
||||||||||||||||
29
|
|
||||||||||||||||||||
|
|
As of/ For the Year Ended December 31,
|
|||||||||||||||||||
|
|
2016
|
2015
|
2014
|
2013
|
2012
|
|||||||||||||||
|
(Dollars in millions, except per share data, shares in thousands)
|
||||||||||||||||||||
|
Summary Income Statement:
|
|
|
|
|
|
|||||||||||||||
|
Revenue-TE (1)
|
$
|
10,953
|
|
$
|
9,757
|
|
|
$
|
9,373
|
|
|
$
|
9,798
|
|
|
$
|
9,979
|
|
||
|
Less: TE adjustment (2)
|
160
|
|
146
|
|
143
|
|
146
|
|
149
|
|
||||||||||
|
Revenue-reported (1)
|
10,793
|
|
9,611
|
|
9,230
|
|
9,652
|
|
9,830
|
|
||||||||||
|
Provision for credit losses
|
572
|
|
428
|
|
251
|
|
592
|
|
1,057
|
|
||||||||||
|
Noninterest expense
|
6,721
|
|
6,266
|
|
5,852
|
|
5,777
|
|
5,828
|
|
||||||||||
|
Income before income taxes
|
3,500
|
|
|
2,917
|
|
|
3,127
|
|
|
3,283
|
|
|
2,945
|
|
||||||
|
Provision for income taxes
|
1,058
|
|
794
|
|
921
|
|
1,553
|
|
892
|
|
||||||||||
|
Net income
|
2,442
|
|
|
2,123
|
|
|
2,206
|
|
|
1,730
|
|
|
2,053
|
|
||||||
|
Noncontrolling interest
|
16
|
|
39
|
|
75
|
|
50
|
|
49
|
|
||||||||||
|
Dividends and accretion on preferred stock
|
167
|
|
148
|
|
148
|
|
117
|
|
63
|
|
||||||||||
|
Net income available to common shareholders
|
2,259
|
|
|
1,936
|
|
|
1,983
|
|
|
1,563
|
|
|
1,941
|
|
||||||
|
Per Common Share:
|
|
|
|
|
|
|
|
|
||||||||||||
|
Basic EPS
|
$
|
2.81
|
|
$
|
2.59
|
|
$
|
2.76
|
|
$
|
2.22
|
|
$
|
2.78
|
|
|||||
|
Diluted EPS
|
2.77
|
|
2.56
|
|
2.72
|
|
2.19
|
|
2.74
|
|
||||||||||
|
Cash dividends declared
|
1.15
|
|
1.05
|
|
0.95
|
|
0.92
|
|
0.80
|
|
||||||||||
|
Common equity
|
33.14
|
|
31.66
|
|
30.09
|
|
28.48
|
|
27.17
|
|
||||||||||
|
Average Balances:
|
|
|
|
|
|
|
|
|
||||||||||||
|
Total assets
|
$
|
218,945
|
|
$
|
197,347
|
|
$
|
185,095
|
|
$
|
181,282
|
|
$
|
178,592
|
|
|||||
|
Securities (3)
|
46,279
|
|
42,103
|
|
40,541
|
|
36,772
|
|
36,334
|
|
||||||||||
|
Loans and leases (4)
|
141,759
|
|
127,802
|
|
118,830
|
|
117,527
|
|
113,733
|
|
||||||||||
|
Deposits
|
157,469
|
|
138,498
|
|
129,077
|
|
128,555
|
|
127,617
|
|
||||||||||
|
Long-term debt
|
22,791
|
|
23,343
|
|
22,210
|
|
19,301
|
|
20,651
|
|
||||||||||
|
Shareholders' equity
|
29,355
|
|
25,871
|
|
23,954
|
|
21,860
|
|
19,435
|
|
||||||||||
|
Period-End Balances:
|
|
|
|
|
|
|
|
|
||||||||||||
|
Total assets
|
$
|
219,276
|
|
$
|
209,947
|
|
$
|
186,834
|
|
$
|
183,043
|
|
$
|
184,469
|
|
|||||
|
Securities (3)
|
43,606
|
|
43,827
|
|
41,147
|
|
40,205
|
|
38,731
|
|
||||||||||
|
Loans and leases (4)
|
145,038
|
|
136,986
|
|
121,307
|
|
117,139
|
|
118,364
|
|
||||||||||
|
Deposits
|
160,234
|
|
149,124
|
|
129,040
|
|
127,475
|
|
133,075
|
|
||||||||||
|
Long-term debt
|
21,965
|
|
23,769
|
|
23,312
|
|
21,493
|
|
19,114
|
|
||||||||||
|
Shareholders' equity
|
29,926
|
|
27,340
|
|
24,377
|
|
22,780
|
|
21,193
|
|
||||||||||
|
Selected Ratios:
|
|
|
|
|
|
|
||||||||||||||
|
NIM
|
3.39
|
%
|
3.32
|
%
|
3.42
|
%
|
3.68
|
%
|
3.91
|
%
|
||||||||||
|
Rate of return on:
|
|
|
|
|
|
|
||||||||||||||
|
Average total assets
|
1.12
|
|
1.08
|
|
1.19
|
|
0.95
|
|
1.15
|
|
||||||||||
|
Average common equity
|
8.57
|
|
8.34
|
|
9.32
|
|
8.07
|
|
10.52
|
|
||||||||||
|
Average total shareholders' equity
|
7.70
|
|
8.21
|
|
9.21
|
|
7.91
|
|
10.56
|
|
||||||||||
|
Average total shareholders' equity to average total assets
|
13.41
|
|
13.11
|
|
12.94
|
|
12.06
|
|
10.88
|
|
||||||||||
__________________
|
(1)
|
Revenue is defined as net interest income plus noninterest income.
|
|
(2)
|
TE adjustment is based on the marginal income tax rates for the periods presented.
|
|
(3)
|
Excludes trading securities. HTM securities at amortized cost. AFS securities at fair value.
|
|
(4)
|
Loans and leases are net of unearned income and include LHFS.
|
30
Executive Overview
Overview of Significant Events and Financial Results
Net income available to common shareholders totaled
$2.3 billion
for
2016
, a
16.7%
increase from the prior year. On a diluted per common share basis, earnings for
2016
were
$2.77
, compared to
$2.56
for
2015
. BB&T’s results of operations for
2016
produced a return on average assets of
1.12%
and a return on average common shareholders’ equity of
8.57%
compared to prior year ratios of
1.08%
and
8.34%
, respectively. These results include merger-related and restructuring charges of $171 million for
2016
compared to $165 million for 2015. Net interest income and noninterest income were both higher following acquisition activity in 2015 and 2016. Noninterest expense was higher due to increases in headcount and locations, primarily the result of the acquisitions, and the provision for credit losses increased due to higher provisions largely related to energy credits.
On April 1, 2016, BB&T acquired National Penn for total consideration of $1.6 billion, which consisted of approximately $555 million in cash and the remainder in common stock. National Penn had 126 financial centers, $10.1 billion of total assets and $6.6 billion of deposits. Also on April 1, 2016, BB&T purchased insurance broker CGSC North America Holdings Corporation ("Swett & Crawford") from Cooper Gay Swett & Crawford for $461 million in cash.
During the third quarter of 2016, Branch Bank entered into an agreement with the FDIC that terminated the loss share agreements related to Colonial. Branch Bank made a payment of approximately $230 million to the FDIC as consideration for the early termination. As a result, the FDIC loss share receivable/payable associated with the indemnification by the FDIC was eliminated and pre-tax expense of $18 million was recognized during the third quarter of 2016. No future loss sharing or gain sharing will occur related to the Colonial acquisition.
During the third quarter of 2016, the Company reached an agreement with the U.S. Department of Justice that settled certain legacy mortgage matters involving the origination of mortgage loans insured by the FHA. The Company had previously recorded an $85 million reserve in 2014 in connection with this matter. Pursuant to the agreement, the Company paid $83 million and separately received a recovery of $71 million, resulting in a net benefit of $73 million for the third quarter of 2016.
Additionally, during the third quarter of 2016, the Company made a $50 million charitable contribution.
During the fourth quarter, BB&T recognized $34 million of pre-tax charges for securities duration adjustments and hedge ineffectiveness, which were primarily due to higher interest rates. Also impacting the fourth quarter earnings was a $31 million release of mortgage repurchase reserves, which was primarily driven by lower anticipated loan repurchase requests.
BB&T’s revenue for
2016
was $10.8 billion. On a TE basis, revenue was $11.0 billion, which represents an increase of $1.2 billion compared to
2015
. Net interest income on a TE basis was $743 million higher than the prior year, which reflects a $753 million increase in interest income and a $10 million increase in interest expense. Noninterest income increased
$453 million
for the year, driven by improvements in FDIC loss share income, higher insurance income primarily from the acquisition of Swett and Crawford, higher securities gains and losses, and increases in other categories of income that include the impact of the Susquehanna and National Penn acquisitions.
NIM was 3.39% for 2016, compared to 3.32% for the prior year. Average earning assets increased $18.6 billion, or 10.8%, while average interest-bearing liabilities increased $11.3 billion, or 9.3%, both of which were primarily driven by acquisitions. The annualized TE yield on the total loan portfolio for 2016 was
4.30%
, up four basis points compared to the prior year. The annualized TE yield on the average securities portfolio was
2.33%
, down three basis points compared to the prior year primarily due to securities duration adjustments.
The provision for credit losses was
$572 million
, compared to
$428 million
for the prior year. This increase reflects the higher provisions largely related to energy credits.
NPAs increased $101 million compared to
2015
. This included a $160 million increase in NPLs primarily within commercial lending, and a $59 million decrease in foreclosed real estate and other property. Net charge-offs for
2016
were $532 million, compared to $436 million for the prior year. The ratio of the ALLL to net charge-offs was 2.80x for
2016
, compared to 3.36x in
2015
.
31
Noninterest expense increased
$455 million
primarily due to higher personnel expense, which was primarily the result of acquisition activity. Other categories of noninterest expense reflected higher costs due to the impact of acquisitions. Partially offsetting these increases were lower losses from the extinguishment of debt, as 2015 included a $172 million charge compared to a small gain in 2016. In addition to the impact from acquisitions, regulatory charges reflect the FDIC surcharge assessed against large banks that was implemented in the third quarter of 2016.
BB&T’s total assets at
December 31, 2016
were
$219.3 billion
, an increase of
$9.3 billion
compared to
December 31, 2015
. This includes a
$7.4 billion
increase in loans and leases HFI due to acquisitions and organic growth. Commercial and industrial loans were up
$3.3 billion
, CRE-income producing properties loans were up
$1.1 billion
and direct retail lending loans were up
$952 million
. Sales finance loans increased
$940 million
, primarily due to portfolio acquisitions. Mortgage loans declined
$612 million
due to management’s continuing decision to sell substantially all conforming mortgage loan production, partially offset by acquisition activity. The fair value of AFS securities totaled
$26.9 billion
at
December 31, 2016
, compared to
$25.3 billion
at
December 31, 2015
. The amortized cost of HTM securities was
$16.7 billion
at
December 31, 2016
compared to
$18.5 billion
in the prior year. Goodwill, CDI and other intangible assets were also higher as the result of acquisitions.
Total deposits at
December 31, 2016
were
$160.2 billion
, an increase of
$11.1 billion
from the prior year. Noninterest-bearing deposits increased
$5.0 billion
, interest checking increased
$4.9 billion
and money market and savings increased
$4.4 billion
. Time deposits declined
$3.2 billion
. The overall growth in lower-cost deposits reflects acquisition activity and continued organic growth. The average cost of interest-bearing deposits for
2016
was
0.23%
, a decline of one basis point compared to the prior year.
Total shareholders’ equity increased
$2.6 billion
, or
9.5%
, compared to the prior year. This increase was the result of net income in excess of dividends totaling
$1.4 billion
, a $450 million issuance of preferred stock and $1.3 billion of common stock issued (primarily for National Penn), partially offset by $520 million of share repurchases. BB&T’s Tier 1 risk-based capital and total risk-based capital ratios at
December 31, 2016
were
12.0%
and
14.1%
, respectively, compared to
11.8%
and
14.3%
at
December 31, 2015
, respectively. The CET1 ratio was
10.2%
at
December 31, 2016
compared to
10.3%
at
December 31, 2015
.
Subsequent to year end, BB&T terminated $2.9 billion (par value) of higher-cost FHLB advances resulting in a loss on early extinguishment of debt totaling $392 million.
Current Political Environment
Over the past several years, BB&T has made substantial investments and incurred significant costs related to personnel, infrastructure and other items in response to increased regulations. While the impact of any relief is uncertain, the new U.S. administration has stated its intention to potentially alleviate part of the regulatory burden on financial institutions. In addition, income tax reform is being considered that may potentially reduce federal corporate income tax rates. If enacted, this reduction may result in deferred tax assets and liabilities being repriced. Since BB&T is in a net deferred tax asset position, the impact from this repricing would be an income tax provision. However, our effective income tax rate would be reduced prospectively.
Key Challenges
BB&T’s business is dynamic and complex. Consequently, management annually evaluates and, as necessary, adjusts the Company’s business strategy in the context of the current operating environment. During this process, management considers the current financial condition and performance of the Company and its expectations for future economic activity from both a national and local market perspective. The achievement of key strategic objectives and established long-term financial goals is subject to many uncertainties and challenges. In the opinion of management, the challenges that are most relevant and likely to have a near term impact on performance are presented below:
|
•
|
Intense competition within the financial services industry given the challenge in growing assets during a period of sustained low interest rates.
|
|
•
|
New technologies and evolving consumer preferences will put pressure on market share and customer loyalty.
|
|
•
|
Global economic and geopolitical risk, including potential financial system instability and ramifications of sovereign debt issues.
|
|
•
|
Cost and risk associated with regulatory reform and initiatives and IT projects.
|
32
In addition, certain other challenges and unforeseen events could have a near term impact on BB&T’s financial condition and results of operations. See the section titled "Forward-Looking Statements" for additional examples of such challenges.
Net Interest Income and NIM
Net interest income is BB&T’s primary source of revenue. Net interest income is influenced by a number of factors, including the volume, mix and maturity of interest-earning assets and interest-bearing liabilities and the interest rates earned and paid thereon. The difference between rates earned on interest-earning assets and the cost of funds (with a TE adjustment made to tax-exempt items to provide comparability with taxable items) is measured by the NIM.
2016
compared to
2015
For
2016
, net interest income on a TE basis totaled
$6.5 billion
, an increase of $743 million or
12.9%
compared to the prior year. The increase reflects higher interest income due to acquisitions and organic loan growth, partially offset by lower yields on new loans and securities and runoff in the loan portfolio acquired from the FDIC. Interest expense increased slightly, reflecting higher balances from acquisitions, partially offset by improvement in the mix of funding sources.
The NIM is the primary measure used in evaluating the gross profit margin from the portfolios of earning assets. The NIM was 3.39% in 2016 compared with 3.32% in 2015. The increase in the NIM reflects higher yields on loans and improved funding mix, partially offset by lower yields on securities. The average annualized TE yield for total loans and leases was 4.30% for 2016, compared to 4.26% for the prior year. The increase was primarily due to acquisitions, partially offset by lower yields on new loan originations and the runoff of higher yielding loans acquired from the FDIC. The TE yield on the total securities portfolio was 2.33% for the year ended December 31, 2016, compared to 2.36% for the prior year.
The average rate paid on interest-bearing deposits for 2016 dropped to 0.23%, from 0.24% in 2015. This improvement was driven by changes in mix, with time deposits representing a lower percentage of interest-bearing deposits at December 31, 2016.
The rate paid on average short-term borrowings was 0.35% in 2016, compared to 0.15% in 2015. The increase in the rate on short-term borrowings reflects the federal funds target rate increase from December 2015. The average rate on long-term debt was 2.13% during 2016, flat compared to the prior year. At December 31, 2016, the targeted Federal funds rate was a range of 0.50% to 0.75%.
2015
compared to
2014
For 2015, net interest income on a TE basis totaled $5.7 billion, an increase of $221 million or 4.0% compared to the prior year. The increase reflects higher interest income due to acquisitions and organic loan growth, partially offset by lower yields on new loans and securities and runoff in the loan portfolio acquired from the FDIC. Interest expense declined, reflecting lower rates and improvement in the mix of funding sources. The average cost of interest-bearing deposits declined two basis points to 0.24%, reflecting reductions in time deposits and growth in interest checking and money market and savings. The average cost of long-term debt declined from 2.36% to 2.13%, primarily due to the early extinguishment of $2.0 billion of higher-cost FHLB advances during the last two years.
The NIM was 3.32% in 2015 compared with 3.42% in 2014. The decline in the NIM reflects lower yields on loans and securities, partially offset by the lower funding costs described above. The average annualized TE yield for total loans and leases was 4.26% for 2015, compared to 4.42% for the prior year. The decrease was primarily due to lower yields on new loan originations and the runoff of higher yielding loans acquired from the FDIC, partially offset by acquisition impact. The TE yield on the total securities portfolio was 2.36% for the year ended December 31, 2015, compared to 2.45% for the prior year.
The average rate paid on interest-bearing deposits for 2015 dropped to 0.24%, from 0.26% in 2014. This improvement was driven by changes in mix, with time deposits representing a lower percentage of interest-bearing deposits at December 31, 2015.
The rate paid on average short-term borrowings was 0.15% in 2015, compared to 0.13% in 2014. The average rate on long-term debt during 2015 was 2.13%, compared to 2.36% for the prior year. This decline reflects the previously mentioned early extinguishment of higher-cost FHLB advances.
33
|
Table 5
|
|||||||||||||||||||||||||||||||||||||||||||||||||||||||||
|
TE Net Interest Income and Rate / Volume Analysis (1)
|
|||||||||||||||||||||||||||||||||||||||||||||||||||||||||
|
Year Ended December 31, 2016, 2015 and 2014
|
|||||||||||||||||||||||||||||||||||||||||||||||||||||||||
|
|
2016 vs. 2015
|
2015 vs. 2014
|
|||||||||||||||||||||||||||||||||||||||||||||||||||||||
|
|
Average Balances (7)
|
Yield/Rate
|
Income/Expense
|
Incr.
|
Change due to
|
Incr.
|
Change due to
|
||||||||||||||||||||||||||||||||||||||||||||||||||
|
|
2016
|
2015
|
2014
|
2016
|
2015
|
2014
|
2016
|
2015
|
2014
|
(Decr.)
|
Rate
|
Vol.
|
(Decr.)
|
Rate
|
Vol.
|
||||||||||||||||||||||||||||||||||||||||||
|
|
(Dollars in millions)
|
||||||||||||||||||||||||||||||||||||||||||||||||||||||||
|
Assets
|
|
|
|
|
|
|
|
|
|
|
|
|
|
|
|
|
|
|
|
|
|
|
|
|
|
||||||||||||||||||||||||||||||||
|
Total securities, at amortized cost: (2)
|
|
|
|
|
|
|
|
|
|
|
|
|
|
|
|
|
|
|
|
|
|
|
|
|
|
||||||||||||||||||||||||||||||||
|
U.S. Treasury
|
$
|
3,061
|
|
$
|
2,650
|
|
$
|
1,969
|
|
1.67
|
%
|
1.58
|
%
|
1.51
|
%
|
$
|
51
|
|
$
|
42
|
|
$
|
30
|
|
$
|
9
|
|
$
|
2
|
|
$
|
7
|
|
$
|
12
|
|
$
|
1
|
|
$
|
11
|
|
|||||||||||||||
|
GSE
|
3,601
|
|
5,338
|
|
5,516
|
|
2.13
|
|
2.13
|
|
2.10
|
|
77
|
|
113
|
|
116
|
|
(36
|
)
|
—
|
|
(36
|
)
|
(3
|
)
|
2
|
|
(5
|
)
|
|||||||||||||||||||||||||||
|
Agency MBS
|
36,658
|
|
30,683
|
|
29,504
|
|
2.05
|
|
1.98
|
|
2.00
|
|
750
|
|
605
|
|
589
|
|
145
|
|
22
|
|
123
|
|
16
|
|
(5
|
)
|
21
|
|
|||||||||||||||||||||||||||
|
States and political subdivisions
|
2,361
|
|
2,204
|
|
2,122
|
|
5.20
|
|
5.65
|
|
5.80
|
|
123
|
|
125
|
|
124
|
|
(2
|
)
|
(11
|
)
|
9
|
|
1
|
|
(4
|
)
|
5
|
|
|||||||||||||||||||||||||||
|
Non-agency MBS
|
534
|
|
751
|
|
883
|
|
14.56
|
|
13.51
|
|
14.23
|
|
78
|
|
102
|
|
126
|
|
(24
|
)
|
7
|
|
(31
|
)
|
(24
|
)
|
(6
|
)
|
(18
|
)
|
|||||||||||||||||||||||||||
|
Other
|
64
|
|
477
|
|
547
|
|
1.87
|
|
1.31
|
|
1.43
|
|
—
|
|
7
|
|
8
|
|
(7
|
)
|
1
|
|
(8
|
)
|
(1
|
)
|
(1
|
)
|
—
|
|
|||||||||||||||||||||||||||
|
Total securities
|
46,279
|
|
42,103
|
|
40,541
|
|
2.33
|
|
2.36
|
|
2.45
|
|
1,079
|
|
994
|
|
993
|
|
85
|
|
21
|
|
64
|
|
1
|
|
(13
|
)
|
14
|
|
|||||||||||||||||||||||||||
|
Other earning assets (3)
|
3,202
|
|
2,768
|
|
1,881
|
|
1.64
|
|
1.39
|
|
2.13
|
|
53
|
|
38
|
|
40
|
|
15
|
|
(2
|
)
|
7
|
|
(2
|
)
|
(17
|
)
|
15
|
|
|||||||||||||||||||||||||||
|
Loans and leases, net of unearned income: (4)(5)
|
|
|
|
|
|
|
|
|
|
|
|
|
|
|
|
|
|
|
|
|
|
|
|
|
|||||||||||||||||||||||||||||||||
|
Commercial:
|
|
|
|
|
|
|
|
|
|
|
|
|
|
|
|
|
|
|
|
|
|
|
|
|
|||||||||||||||||||||||||||||||||
|
Commercial and industrial
|
50,623
|
|
44,648
|
|
39,537
|
|
3.33
|
|
3.21
|
|
3.35
|
|
1,687
|
|
1,434
|
|
1,325
|
|
253
|
|
55
|
|
198
|
|
109
|
|
(57
|
)
|
166
|
|
|||||||||||||||||||||||||||
|
CRE-income producing properties
|
14,379
|
|
11,806
|
|
10,489
|
|
3.73
|
|
3.66
|
|
3.49
|
|
536
|
|
432
|
|
366
|
|
104
|
|
8
|
|
96
|
|
66
|
|
35
|
|
31
|
|
|||||||||||||||||||||||||||
|
CRE-construction and development
|
3,742
|
|
3,196
|
|
2,616
|
|
3.71
|
|
3.57
|
|
3.51
|
|
139
|
|
114
|
|
92
|
|
25
|
|
5
|
|
20
|
|
22
|
|
7
|
|
15
|
|
|||||||||||||||||||||||||||
|
Dealer floor plan
|
1,295
|
|
1,068
|
|
985
|
|
2.08
|
|
1.85
|
|
1.87
|
|
27
|
|
20
|
|
18
|
|
7
|
|
3
|
|
4
|
|
2
|
|
—
|
|
2
|
|
|||||||||||||||||||||||||||
|
Direct retail lending (6)
|
11,796
|
|
9,375
|
|
8,249
|
|
4.27
|
|
4.07
|
|
4.10
|
|
503
|
|
381
|
|
338
|
|
122
|
|
20
|
|
102
|
|
43
|
|
(1
|
)
|
44
|
|
|||||||||||||||||||||||||||
|
Sales finance
|
9,914
|
|
9,975
|
|
9,022
|
|
3.12
|
|
2.86
|
|
2.80
|
|
310
|
|
286
|
|
253
|
|
24
|
|
26
|
|
(2
|
)
|
33
|
|
6
|
|
27
|
|
|||||||||||||||||||||||||||
|
Revolving credit
|
2,521
|
|
2,406
|
|
2,385
|
|
8.77
|
|
8.76
|
|
8.70
|
|
221
|
|
211
|
|
208
|
|
10
|
|
—
|
|
10
|
|
3
|
|
1
|
|
2
|
|
|||||||||||||||||||||||||||
|
Residential mortgage (6)
|
30,184
|
|
30,252
|
|
31,528
|
|
4.05
|
|
4.15
|
|
4.20
|
|
1,224
|
|
1,255
|
|
1,325
|
|
(31
|
)
|
(28
|
)
|
(3
|
)
|
(70
|
)
|
(16
|
)
|
(54
|
)
|
|||||||||||||||||||||||||||
|
Other lending subsidiaries
|
14,277
|
|
12,291
|
|
10,848
|
|
8.22
|
|
8.68
|
|
9.08
|
|
1,173
|
|
1,067
|
|
985
|
|
106
|
|
(59
|
)
|
165
|
|
82
|
|
(45
|
)
|
127
|
|
|||||||||||||||||||||||||||
|
PCI
|
1,063
|
|
1,083
|
|
1,613
|
|
19.55
|
|
16.57
|
|
17.22
|
|
208
|
|
179
|
|
278
|
|
29
|
|
32
|
|
(3
|
)
|
(99
|
)
|
(10
|
)
|
(89
|
)
|
|||||||||||||||||||||||||||
|
Total loans and leases HFI
|
139,794
|
|
126,100
|
|
117,272
|
|
4.31
|
|
4.27
|
|
4.42
|
|
6,028
|
|
5,379
|
|
5,188
|
|
649
|
|
62
|
|
587
|
|
191
|
|
(80
|
)
|
271
|
|
|||||||||||||||||||||||||||
|
LHFS
|
1,965
|
|
1,702
|
|
1,558
|
|
3.34
|
|
3.63
|
|
4.19
|
|
66
|
|
62
|
|
65
|
|
4
|
|
(5
|
)
|
9
|
|
(3
|
)
|
(9
|
)
|
6
|
|
|||||||||||||||||||||||||||
|
Total loans and leases
|
141,759
|
|
127,802
|
|
118,830
|
|
4.30
|
|
4.26
|
|
4.42
|
|
6,094
|
|
5,441
|
|
5,253
|
|
653
|
|
57
|
|
596
|
|
188
|
|
(89
|
)
|
277
|
|
|||||||||||||||||||||||||||
|
Total earning assets
|
191,240
|
|
172,673
|
|
161,252
|
|
3.78
|
|
3.75
|
|
3.90
|
|
7,226
|
|
6,473
|
|
6,286
|
|
753
|
|
76
|
|
667
|
|
187
|
|
(119
|
)
|
306
|
|
|||||||||||||||||||||||||||
|
Nonearning assets
|
27,705
|
|
24,674
|
|
23,843
|
|
|
|
|
|
|
|
|
|
|
|
|
|
|
|
|
|
|
|
|||||||||||||||||||||||||||||||||
|
Total assets
|
$
|
218,945
|
|
$
|
197,347
|
|
$
|
185,095
|
|
|
|
|
|
|
|
|
|
|
|
|
|
|
|
|
|
|
|
||||||||||||||||||||||||||||||
|
Liabilities and Shareholders’ Equity
|
|
|
|
|
|
|
|
|
|
|
|
|
|
|
|
|
|
|
|
|
|||||||||||||||||||||||||||||||||||||
|
Interest-bearing deposits:
|
|
|
|
|
|
|
|
|
|
|
|
|
|
|
|
|
|
|
|
|
|
|
|
|
|||||||||||||||||||||||||||||||||
|
Interest checking
|
$
|
27,595
|
|
$
|
22,092
|
|
$
|
18,731
|
|
0.14
|
|
0.08
|
|
0.07
|
|
$
|
39
|
|
$
|
18
|
|
$
|
13
|
|
$
|
21
|
|
$
|
16
|
|
$
|
5
|
|
$
|
5
|
|
$
|
2
|
|
$
|
3
|
|
|||||||||||||||
|
Money market and savings
|
62,966
|
|
56,592
|
|
49,728
|
|
0.20
|
|
0.19
|
|
0.15
|
|
123
|
|
107
|
|
74
|
|
16
|
|
5
|
|
11
|
|
33
|
|
22
|
|
11
|
|
|||||||||||||||||||||||||||
|
Time deposits
|
16,619
|
|
16,405
|
|
22,569
|
|
0.51
|
|
0.66
|
|
0.67
|
|
85
|
|
107
|
|
151
|
|
(22
|
)
|
(23
|
)
|
1
|
|
(44
|
)
|
(1
|
)
|
(43
|
)
|
|||||||||||||||||||||||||||
|
Foreign office deposits - interest-bearing
|
1,034
|
|
593
|
|
722
|
|
0.38
|
|
0.12
|
|
0.07
|
|
4
|
|
1
|
|
1
|
|
3
|
|
2
|
|
1
|
|
—
|
|
—
|
|
—
|
|
|||||||||||||||||||||||||||
|
Total interest-bearing deposits
|
108,214
|
|
95,682
|
|
91,750
|
|
0.23
|
|
0.24
|
|
0.26
|
|
251
|
|
233
|
|
239
|
|
18
|
|
—
|
|
18
|
|
(6
|
)
|
23
|
|
(29
|
)
|
|||||||||||||||||||||||||||
|
Short-term borrowings
|
2,554
|
|
3,221
|
|
3,421
|
|
0.35
|
|
0.15
|
|
0.13
|
|
9
|
|
5
|
|
5
|
|
4
|
|
5
|
|
(1
|
)
|
—
|
|
—
|
|
—
|
|
|||||||||||||||||||||||||||
|
Long-term debt
|
22,791
|
|
23,343
|
|
22,210
|
|
2.13
|
|
2.13
|
|
2.36
|
|
485
|
|
497
|
|
525
|
|
(12
|
)
|
—
|
|
(12
|
)
|
(28
|
)
|
(54
|
)
|
26
|
|
|||||||||||||||||||||||||||
|
Total interest-bearing liabilities
|
133,559
|
|
122,246
|
|
117,381
|
|
0.56
|
|
0.60
|
|
0.65
|
|
745
|
|
735
|
|
769
|
|
10
|
|
5
|
|
5
|
|
(34
|
)
|
(31
|
)
|
(3
|
)
|
|||||||||||||||||||||||||||
|
Noninterest-bearing deposits
|
49,255
|
|
42,816
|
|
37,327
|
|
|
|
|
|
|
|
|
|
|
|
|
|
|
|
|
|
|
|
|
|
|
|
|||||||||||||||||||||||||||||
|
Other liabilities
|
6,776
|
|
6,414
|
|
6,433
|
|
|
|
|
|
|
|
|
|
|
|
|
|
|
|
|
|
|
|
|
|
|
|
|||||||||||||||||||||||||||||
|
Shareholders’ equity
|
29,355
|
|
25,871
|
|
23,954
|
|
|
|
|
|
|
|
|
|
|
|
|
|
|
|
|
|
|
|
|
|
|
|
|||||||||||||||||||||||||||||
|
Total liabilities and shareholders’ equity
|
$
|
218,945
|
|
$
|
197,347
|
|
$
|
185,095
|
|
|
|
|
|
|
|
|
|
|
|
|
|
|
|
|
|
|
|
|
|
|
|
||||||||||||||||||||||||||
|
Average interest rate spread
|
|
|
|
|
|
|
3.22
|
%
|
3.15
|
%
|
3.25
|
%
|
|
|
|
|
|
|
|
|
|
|
|
|
|
|
|
|
|
||||||||||||||||||||||||||||
|
NIM / net interest income
|
|
|
|
|
3.39
|
%
|
3.32
|
%
|
3.42
|
%
|
$
|
6,481
|
|
$
|
5,738
|
|
$
|
5,517
|
|
$
|
743
|
|
$
|
71
|
|
$
|
662
|
|
$
|
221
|
|
$
|
(88
|
)
|
$
|
309
|
|
||||||||||||||||||||
|
TE adjustment
|
|
|
|
|
|
|
|
|
$
|
160
|
|
$
|
146
|
|
$
|
143
|
|
|
|
|
|
|
|
|
|
|
|
|
|
||||||||||||||||||||||||||||
__________________
|
(1)
|
Yields are stated on a TE basis utilizing the marginal income tax rates for the periods presented. The change in interest not solely due to changes in yield/rate or volume has been allocated on a pro-rata basis based on the absolute dollar amount of each.
|
|
(2)
|
Total securities include AFS and HTM securities.
|
|
(3)
|
Includes Federal funds sold, securities purchased under resale agreements or similar arrangements, interest-bearing deposits with banks, trading securities, FHLB stock and other earning assets.
|
|
(4)
|
Loan fees, which are not material for any of the periods shown, are included for rate calculation purposes.
|
|
(5)
|
NPLs are included in the average balances.
|
|
(6)
|
Excludes basis adjustments for fair value hedges.
|
34
Provision for Credit Losses
2016
compared to
2015
The provision for credit losses was
$572 million
in
2016
, compared to
$428 million
in the prior year. The increase in the provision for credit losses was driven by other lending subsidiaries and commercial and industrial loans, which reflects higher net charge-offs in these portfolios. The ratio of the ALLL to net charge-offs was
2.80x
for
2016
, compared to
3.36x
for
2015
.
Net charge-offs were
0.38%
of average loans and leases held for investment for
2016
, compared to
0.35%
of average loans and leases held for investment during
2015
. Net charge-offs were
$532 million
for
2016
compared to
$436 million
in
2015
. Net charge-offs increased by $59 million in the other lending subsidiaries portfolio, driven by an increase in loss severity associated with used car values and loan growth. Commercial and industrial net charge-offs increased $44 million, primarily due to the energy portfolio.
2015
compared to
2014
The provision for credit losses was $428 million in 2015, an increase of $177 million compared to the prior year. The increase in the provision for credit losses reflects allowance releases on loan sales in the prior year and stabilization in credit trends after an extended period of improvements. The ratio of the ALLL to net charge-offs was 3.36x for 2015, compared to 2.74x for 2014. During the prior year, loan sales resulted in a combined $66 million in gains recognized through the release of the ALLL.
Net charge-offs were 0.35% of average loans and leases held for investment for 2015, compared to 0.46% of average loans and leases held for investment during 2014. Net charge-offs declined $102 million, or 19.0%, with improvement across several loan portfolios led by commercial and industrial loans, which declined $45 million, and residential mortgage-nonguaranteed, which declined $38 million.
Noninterest Income
Noninterest income is a significant contributor to BB&T’s financial results. Management focuses on diversifying its sources of revenue to further reduce BB&T’s reliance on traditional spread-based interest income, as certain fee-based activities are a relatively stable revenue source during periods of changing interest rates.
|
Table 6
|
||||||||||||||||||
|
Noninterest Income
|
||||||||||||||||||
|
Year Ended December 31,
|
% Change
|
|||||||||||||||||
|
|
2016 vs. 2015
|
2015 vs. 2014
|
||||||||||||||||
|
|
2016
|
2015
|
2014
|
|||||||||||||||
|
|
(Dollars in millions)
|
|
|
|||||||||||||||
|
Insurance income
|
$
|
1,713
|
|
$
|
1,596
|
|
$
|
1,643
|
|
7.3
|
%
|
(2.9
|
)%
|
|||||
|
Service charges on deposits
|
664
|
|
631
|
|
632
|
|
5.2
|
|
(0.2
|
)
|
||||||||
|
Mortgage banking income
|
463
|
|
455
|
|
395
|
|
1.8
|
|
15.2
|
|
||||||||
|
Investment banking and brokerage fees and commissions
|
408
|
|
398
|
|
387
|
|
2.5
|
|
2.8
|
|
||||||||
|
Trust and investment advisory revenues
|
266
|
|
240
|
|
221
|
|
10.8
|
|
8.6
|
|
||||||||
|
Bankcard fees and merchant discounts
|
237
|
|
218
|
|
207
|
|
8.7
|
|
5.3
|
|
||||||||
|
Checkcard fees
|
195
|
|
174
|
|
163
|
|
12.1
|
|
6.7
|
|
||||||||
|
Operating lease income
|
137
|
|
124
|
|
95
|
|
10.5
|
|
30.5
|
|
||||||||
|
Income from bank-owned life insurance
|
123
|
|
113
|
|
110
|
|
8.8
|
|
2.7
|
|
||||||||
|
FDIC loss share income, net
|
(142
|
)
|
(253
|
)
|
(343
|
)
|
(43.9
|
)
|
(26.2
|
)
|
||||||||
|
Securities gains (losses), net
|
46
|
|
(3
|
)
|
(3
|
)
|
NM
|
|
—
|
|
||||||||
|
Other income
|
362
|
|
326
|
|
349
|
|
11.0
|
|
(6.6
|
)
|
||||||||
|
Total noninterest income
|
$
|
4,472
|
|
$
|
4,019
|
|
$
|
3,856
|
|
11.3
|
|
4.2
|
|
|||||
2016
compared to
2015
Noninterest income was a record
$4.5 billion
for
2016
, an increase of
$453 million
compared to
2015
. This increase was across all categories and primarily reflects the impact from acquisitions.
35
Income from BB&T’s insurance agency/brokerage operations was the largest source of noninterest income in
2016
. Insurance income totaled
$1.7 billion
for
2016
, an increase of
$117 million
compared to
2015
. The increase was largely the result of the acquisition of Swett and Crawford on April 1, 2016, which was partially offset by the impact from selling American Coastal in 2015.
FDIC loss share income improved by $111 million, primarily due to the termination of the loss sharing agreements during the third quarter of 2016.
Other income totaled
$362 million
for
2016
, an increase of
$36 million
from
2015
. This increase is primarily due to the $26 million loss on sale of American Coastal during the second quarter of 2015, $19 million for client derivatives revenues and $10 million of trading gains. These increases were partially offset by lower partnerships and other investment income, which was the result of an opportunistic sale that resulted in a $28 million gain during the third quarter of 2015.
2015
compared to
2014
Noninterest income was $4.0 billion for 2015, an increase of $163 million compared to 2014. This increase was driven by improved FDIC loss share income, higher mortgage banking income and higher operating lease income, partially offset by lower insurance income and lower other income.
FDIC loss share income improved by $90 million, primarily due to a $58 million reduction in negative accretion related to credit losses on covered loans and a $20 million change in the offset to the provision for covered loans.
Mortgage banking income increased $60 million, primarily due to higher volume and $17 million of higher MSR valuation adjustments.
Operating lease income increased $29 million, primarily due to a larger leasing portfolio size as this business has continued to demonstrate steady growth.
Income from BB&T’s insurance agency/brokerage operations was the largest source of noninterest income in 2015. Insurance income totaled $1.6 billion for 2015, a decline of $47 million compared to 2014. The second quarter sale of American Coastal resulted in a $79 million decline in insurance income, which was partially offset by higher volume in the property and casualty business.
Other income totaled $326 million for 2015, a decline of $23 million from 2014. This decline is primarily due to the $26 million loss on sale of American Coastal during the second quarter of 2015 and $18 million of lower income related to assets for certain post-employment benefits (which is offset in personnel expense). These declines were partially offset by higher partnerships and other investment income, which was the result of an opportunistic sale that resulted in a $28 million gain during the third quarter of 2015.
36
Noninterest Expense
The following table provides a breakdown of BB&T’s noninterest expense:
|
Table 7
|
||||||||||||||||||
|
Noninterest Expense
|
||||||||||||||||||
|
Year Ended December 31,
|
% Change
|
|||||||||||||||||
|
|
2016 vs. 2015
|
2015 vs. 2014
|
||||||||||||||||
|
|
2016
|
2015
|
2014
|
|||||||||||||||
|
|
(Dollars in millions)
|
|
|
|||||||||||||||
|
Personnel expense
|
$
|
3,964
|
|
$
|
3,469
|
|
$
|
3,180
|
|
14.3
|
%
|
9.1
|
%
|
|||||
|
Occupancy and equipment expense
|
786
|
|
708
|
|
682
|
|
11.0
|
|
3.8
|
|
||||||||
|
Software expense
|
224
|
|
192
|
|
174
|
|
16.7
|
|
10.3
|
|
||||||||
|
Outside IT services
|
186
|
|
135
|
|
115
|
|
37.8
|
|
17.4
|
|
||||||||
|
Amortization of intangibles
|
150
|
|
105
|
|
91
|
|
42.9
|
|
15.4
|
|
||||||||
|
Regulatory charges
|
145
|
|
101
|
|
106
|
|
43.6
|
|
(4.7
|
)
|
||||||||
|
Professional services
|
102
|
|
130
|
|
139
|
|
(21.5
|
)
|
(6.5
|
)
|
||||||||
|
Loan-related expense
|
95
|
|
150
|
|
267
|
|
(36.7
|
)
|
(43.8
|
)
|
||||||||
|
Merger-related and restructuring charges, net
|
171
|
|
165
|
|
46
|
|
3.6
|
|
NM
|
|
||||||||
|
Loss (gain) on early extinguishment of debt
|
(1
|
)
|
172
|
|
122
|
|
(100.6
|
)
|
41.0
|
|
||||||||
|
Other expense
|
899
|
|
939
|
|
930
|
|
(4.3
|
)
|
1.0
|
|
||||||||
|
Total noninterest expense
|
$
|
6,721
|
|
$
|
6,266
|
|
$
|
5,852
|
|
7.3
|
|
7.1
|
|
|||||
2016
compared to
2015
Noninterest expense totaled
$6.7 billion
for
2016
, an increase of
$455 million
from
2015
. This increase was primarily driven by higher personnel expense.
Personnel expense is the largest component of noninterest expense and includes salaries, wages and incentives, as well as pension and other employee benefit costs. Personnel expense totaled
$4.0 billion
, a
$495 million
increase compared to
2015
. This increase was driven by a $284 million increase in salaries, which was primarily due to additional headcount from acquisitions. Incentives expense was higher $110 million due to performance against targets and acquisitions. Personnel expense also increased due to a $48 million increase in pension expense that reflects higher amortization, service and interest costs. Additionally, personnel expense reflects a $26 million increase in payroll taxes as a result of higher salaries and incentives.
Loss on early extinguishment of debt was down $173 million for
2016
, as the prior year included a loss of $172 million, compared to a small gain for 2016.
Occupancy and equipment expense totaled
$786 million
for
2016
, compared to
$708 million
for
2015
. The increase reflects the acquisition activity. Software expense was higher $32 million compared to 2015, primarily reflecting higher depreciation on recent investments.
Outside IT services expense totaled $186 million for 2016, compared to $135 million in the prior year. This increase was due to higher costs related to projects.
Loan-related expense totaled
$95 million
for
2016
, a decrease of
$55 million
compared to the prior year. This decrease is largely the result of a release of $31 million in reserves during the fourth quarter of 2016, which was primarily driven by lower anticipated loan repurchase requests.
Regulatory charges totaled $145 million for 2016, an increase of $44 million compared to the prior year. This increase reflects the impact from acquisitions and the surcharge assessed to large banks, which was implemented in the third quarter of 2016.
Other expense decreased $40 million primarily due to a net benefit of $73 million in the third quarter related to the settlement of certain legacy mortgage matters involving the origination of mortgage loans insured by the FHA. In addition, business referral expense decreased $16 million primarily due to the sale of American Coastal in the prior year. Partially offsetting these decreases was a $50 million charitable contribution that was also made in the third quarter.
37
2015
compared to
2014
Noninterest expense totaled $6.3 billion for 2015, an increase of $414 million from 2014. This increase was driven by higher personnel expense, merger-related and restructuring charges and loss on early extinguishment of debt, partially offset by lower loan-related expense.
Personnel expense totaled $3.5 billion, a $289 million increase compared to 2014. This increase was driven by a $114 million increase in salaries, which was primarily due to additional headcount from acquisitions. Personnel expense also increased due to a $74 million increase in pension expense that reflects higher amortization, service and interest costs, partially offset by the estimated return on higher plan assets. Additionally, personnel expense reflects a $50 million increase in employee medical and insurance benefits and a $32 million increase in incentives.
Merger-related and restructuring charges totaled $165 million, an increase of $119 million compared to 2014. This increase was primarily related to the Susquehanna acquisition, with additional amounts related to The Bank of Kentucky and the planned acquisition of National Penn.
Loss on early extinguishment of debt was $172 million for 2015, compared to $122 million for 2014. The combined debt extinguishments for the two years totaled $2.0 billion of FHLB advances with a weighted average interest rate of 4.5%.
Occupancy and equipment expense totaled $708 million for 2015, compared to $682 million for 2014. The increase reflects the acquisition activity occurring during the year.
Loan-related expense totaled $150 million for 2015, a decrease of $117 million compared to the prior year. This decrease is largely the result of lower claims and charge-offs in the current year, as well as charges recorded in the prior year of $33 million related to the FHA-insured loan origination process and $27 million related to a review of mortgage lending processes.
Merger-Related and Restructuring Charges
BB&T has incurred certain merger-related and restructuring charges, which are reflected in BB&T’s Consolidated Statements of Income as a category of noninterest expense. Merger-related and restructuring expenses or credits include:
|
•
|
severance and personnel-related costs or credits, which typically occur in corporate support and data processing functions;
|
|
•
|
occupancy and equipment charges or credits, which relate to costs or gains associated with lease terminations, obsolete equipment write-offs and the sale of duplicate facilities and equipment;
|
|
•
|
professional services, which relate to investment banking advisory fees and other consulting services pertaining to the transaction;
|
|
•
|
systems conversion and related charges, which represent costs to integrate the acquired entity’s information technology systems; and
|
|
•
|
other merger-related and restructuring charges or credits, which include expenses necessary to convert and combine the acquired branches and operations of merged companies, direct media advertising related to the acquisitions, asset and supply inventory write-offs, and other similar charges.
|
Merger-related and restructuring accruals are established when the costs are incurred or once all requirements for a plan to dispose of certain business functions have been approved by management. In general, a major portion of accrued costs are utilized in conjunction with or immediately following the systems conversion, when most of the duplicate positions are eliminated and the terminated employees begin to receive severance. Other accruals are utilized over time based on the sale, closing or disposal of duplicate facilities or equipment or the expiration of lease contracts. Merger and restructuring accruals are re-evaluated periodically and adjusted as necessary. The remaining accruals at December 31, 2016 are generally expected to be utilized within one year, unless they relate to specific contracts that expire later.
38
The following table presents a summary of activity with respect to merger-related and restructuring accruals:
|
Table 8
|
||||||||||||||||||||||||||||||||
|
Merger-related and Restructuring Accrual Activity
|
||||||||||||||||||||||||||||||||
|
|
Year Ended December 31, 2016
|
Year Ended December 31, 2015
|
||||||||||||||||||||||||||||||
|
|
Beginning Balance
|
Expense
|
Utilized
|
Ending Balance
|
Beginning Balance
|
Expense
|
Utilized
|
Ending Balance
|
||||||||||||||||||||||||
|
|
(Dollars in millions)
|
|||||||||||||||||||||||||||||||
|
Severance and personnel-related
|
$
|
26
|
|
$
|
51
|
|
$
|
(52
|
)
|
$
|
25
|
|
$
|
2
|
|
$
|
60
|
|
$
|
(36
|
)
|
$
|
26
|
|
||||||||
|
Occupancy and equipment
|
11
|
|
49
|
|
(39
|
)
|
21
|
|
7
|
|
16
|
|
(12
|
)
|
11
|
|
||||||||||||||||
|
Professional services
|
13
|
|
14
|
|
(26
|
)
|
1
|
|
17
|
|
34
|
|
(38
|
)
|
13
|
|
||||||||||||||||
|
Systems conversion and related costs
|
—
|
|
27
|
|
(26
|
)
|
1
|
|
—
|
|
25
|
|
(25
|
)
|
—
|
|
||||||||||||||||
|
Other adjustments
|
2
|
|
30
|
|
(31
|
)
|
1
|
|
5
|
|
30
|
|
(33
|
)
|
2
|
|
||||||||||||||||
|
Total
|
$
|
52
|
|
$
|
171
|
|
$
|
(174
|
)
|
$
|
49
|
|
$
|
31
|
|
$
|
165
|
|
$
|
(144
|
)
|
$
|
52
|
|
||||||||
The 2016 costs primarily reflect the acquisitions of National Penn and Swett & Crawford, while the 2015 activities were largely related to Susquehanna.
Provision for Income Taxes
BB&T’s provision for income taxes totaled
$1.1 billion
,
$794 million
and $921 million for
2016
,
2015
and
2014
, respectively. BB&T’s effective tax rates for the years ended
2016
,
2015
and
2014
were
30.2%
,
27.2%
and 29.5%, respectively. The differences in the effective tax rates for
2016
,
2015
and
2014
were primarily due to adjustments for uncertain tax positions.
BB&T has extended credit to and invested in the obligations of states and municipalities and their agencies and has made other investments and loans that produce tax-exempt income. The income generated from these investments, together with certain other transactions that have favorable tax treatment, have reduced BB&T’s overall effective tax rate from the statutory rate in all periods presented.
Refer to the "Income Taxes" note in the "Notes to Consolidated Financial Statements" for a reconciliation of the effective tax rate to the statutory tax rate and a discussion of uncertain tax positions and other tax matters.
Segment Results
See the note titled "Operating Segments" in the "Notes to Consolidated Financial Statements" for additional disclosures related to BB&T’s operating segments, the internal accounting and reporting practices used to manage these segments and financial disclosures for these segments.
Fluctuations in noninterest income and noninterest expense incurred directly by the segments are more fully discussed in the "Noninterest Income" and "Noninterest Expense" sections above. The operating results for Susquehanna and National Penn were included in Other, Treasury and Corporate prior to their systems conversions in mid-November 2015 and mid-July 2016, respectively. Post-conversion results are included in the segments that received the various lines of business, with the majority going to Community Banking.
Effective January 2017, several business activities were realigned within the segments as discussed in the "Operating Segments" note in the "Notes to Consolidated Financial Statements." The following discussion is based upon segment results before realignment.
2016 compared to 2015
Community Banking
Community Banking had 2,196 banking offices at the end of 2016, an increase of 57 offices compared to December 31, 2015. The increase in offices was primarily driven by the acquisition of 126 branches with the acquisition of National Penn, partially offset by the consolidation of nearby financial centers and the closure of certain lower volume branches.
Community Banking net income was $1.3 billion in 2016, an increase of $304 million, or 31.7%, compared to 2015, primarily driven by acquisitions.
39
Segment net interest income increased $728 million, driven by acquisition activity, deposit growth and higher funding spreads on deposits. Noninterest income increased $61 million, primarily due to higher service charges on deposits, checkcard fees and bankcard and merchant services fees.
The allocated provision for credit losses decreased $31 million, primarily the result of lower net charge-offs. Noninterest expense increased $226 million driven by higher personnel, occupancy and equipment expense, amortization of intangibles and allocated corporate expense all of which increased primarily due to acquisition activity.
Residential Mortgage Banking
Residential Mortgage Banking net income was $264 million in 2016, an increase of $24 million, or 10.0%, compared to 2015. Mortgage originations totaled $20.7 billion in 2016, an increase of $2.6 billion compared to $18.1 billion in 2015. BB&T’s residential mortgage servicing portfolio, which includes both retained loans and loans serviced for others, totaled $121.6 billion at the end of 2016, compared to $122.2 billion at December 31, 2015.
Segment net interest income decreased $9 million, primarily the result of lower interest rates on new loans. Noninterest income decreased $11 million driven by lower gains on residential mortgage loan production and sales.
The allocated provision for credit losses increased $36 million driven by a decline in the rate of improvement in credit trends compared to the prior year. Noninterest expense decreased $110 million driven by the previously discussed settlement of FHA-insured mortgage loan matters in the current year, a decline in foreclosure related expenses, the release of $31 million in repurchase reserves during the fourth quarter of 2016 and a decline in professional services, which was partially offset by higher personnel expense.
Dealer Financial Services
Dealer Financial Services net income was $174 million in 2016, essentially flat compared to 2015.
Segment net interest income increased $41 million, primarily due to the addition of Susquehanna’s consumer auto leasing business and growth in the Regional Acceptance loan portfolio.
The allocated provision for credit losses increased $43 million, driven by higher net charge-offs in the Regional Acceptance loan portfolio due to an increase in loss severity associated with used car values and loan growth.
Dealer Financial Services grew average loans by $843 million, or 6.1%, compared to 2015 primarily as a result of the acquisition of Susquehanna’s consumer auto leasing business and growth in dealer floor plan and the Regional Acceptance loan portfolio.
Specialized Lending
Specialized Lending net income was $236 million in 2016, essentially flat compared to 2015.
Segment net interest income increased $56 million, primarily attributable to the addition of Susquehanna’s small business equipment finance group as well as growth in the small ticket dealer-based finance portfolio, partially offset by a decline in loan spreads. Noninterest income increased $37 million, driven by higher commercial mortgage banking income and operating lease income.
The allocated provision for credit losses increased $27 million, driven by higher net charge-offs in the commercial finance, small business equipment finance and small ticket dealer-based finance portfolios. Noninterest expense increased $46 million, primarily due to higher personnel expense, restructuring charges and depreciation of property under operating leases related to growth in the lease portfolio and asset write-downs. Allocated corporate expense increased by $18 million, primarily attributable to investments in the segment’s corporate support functions.
Specialized Lending grew average loans by $2.2 billion, or 14.9%, compared to 2015 as a result of the acquisition of Susquehanna’s small business equipment finance portfolio and strong growth in small ticket consumer, commercial mortgage, equipment finance, governmental finance loans and mortgage warehouse lending.
40
Insurance Holdings
Insurance Holdings net income was $154 million in 2016, a decrease of $28 million, or 15.4%, compared to 2015.
Noninterest income increased $118 million, which primarily reflects the acquisition of Swett and Crawford and higher property and casualty insurance, employee benefit commissions and life insurance, partially offset by the sale of American Coastal in the second quarter of 2015.
Noninterest expense increased $122 million, driven by higher personnel expense primarily attributable to the Swett and Crawford acquisition, partially offset by lower business referral and insurance claims expense driven by the sale of American Coastal. Amortization of intangibles increased $13 million due to the Swett and Crawford acquisition, while allocated corporate expense increased $12 million driven by acquisitions and additional information technology investments.
Financial Services
Financial Services net income was $318 million in 2016, essentially flat compared to 2015.
Segment net interest income increased $99 million, primarily driven by higher loan and deposit balances and higher funding spreads on deposits for both Corporate Banking and BB&T Wealth. Noninterest income increased $38 million, primarily driven by higher trust and investment advisory revenues, client derivatives revenues and investment banking and brokerage fees and commissions, partially offset by lower income from SBIC equity investments.
The allocated provision for credit losses increased $60 million, primarily driven by higher net charge-offs within the energy sector for the Corporate Banking loan portfolio. Noninterest expense increased $70 million compared to the prior year, primarily due to higher personnel expense and restructuring charges.
Financial Services continues to generate significant loan growth through expanded lending strategies, with Corporate Banking’s average loan balances increasing $2.1 billion, or 17.7%, compared to 2015, while BB&T Wealth’s average loan balances increased $213 million, or 14.3%. Corporate Banking’s average transaction account deposits grew $495 million, or 31.3%, while BB&T Wealth grew transaction account balances by $743 million, or 19.9%, and money market and savings balances by $808 million, or 10.5%, compared to 2015, partially attributable to the ongoing identification and servicing of wealth clients in the Community Bank. Client invested assets totaled $143.7 billion as of December 31, 2016, an increase of $13.1 billion, or 10.0%, compared to 2015.
Other, Treasury and Corporate
Other, Treasury and Corporate net income was $32 million in 2016, an increase of $25 million compared to 2015.
Segment net interest income decreased $185 million due to the inclusion of Susquehanna for a portion of the prior year, partially offset by growth in the securities portfolio and the inclusion of National Penn for part of 2016.
Noninterest income increased $208 million, which reflects improved FDIC loss share income primarily due to the third quarter early termination, securities gains on the investment portfolio and the prior year loss on sale of American Coastal.
Noninterest expense increased $58 million due to higher personnel, occupancy and equipment, IT professional services and software expense, as well as higher regulatory charges and charitable contributions. These increases were partially offset by the previously discussed loss on early extinguishment of debt in the prior year and the inclusion of Susquehanna for a portion of prior year. Allocated corporate expense decreased by $178 million compared to the prior year, reflecting increases in corporate expense allocated to the operating segments.
41
2015 compared to 2014
Community Banking
Community Banking had a network of 2,139 banking offices at the end of 2015, an increase of 300 offices compared to December 31, 2014. The increase in offices was primarily driven by the acquisition of 41 branches in Texas, 32 branches with the acquisition of The Bank of Kentucky and 245 branches with the acquisition of Susquehanna Bancshares, partially offset by the consolidation of nearby financial centers and the closure of certain lower volume branches within the BB&T branch network.
Community Banking net income was $960 million in 2015, an increase of $50 million, or 5.5%, compared to 2014. Net income results include the impact of acquisitions as described previously.
Segment net interest income increased $155 million, primarily driven by growth in commercial loans and direct retail loans due to organic growth and the acquisitions, partially offset by lower interest rates on new loans.
Noninterest income decreased $18 million driven by lower service charges on deposits, international factoring commissions and letter of credit fees. Intersegment net referral fee income increased $15 million driven by higher loan referrals to the Residential Mortgage Banking segment and higher capital markets referrals to the Financial Services segment.
The allocated provision for credit losses decreased $56 million as a result of lower commercial and retail loan net charge-offs. Noninterest expense increased $88 million driven by higher salary, incentive, pension and franchise tax expense as well as higher merger-related charges. The increase in salary expense reflects the acquisition activity. Allocated corporate expense increased $21 million driven by internal business initiatives.
Residential Mortgage Banking
Residential Mortgage Banking net income was $240 million in 2015, an increase of $36 million, or 17.6%, compared to 2014. Mortgage originations totaled $18.1 billion in 2015, an increase of $706 million compared to $17.4 billion in 2014. BB&T’s residential mortgage servicing portfolio, which includes both retained loans and loans serviced for others, totaled $122.2 billion at the end of 2015, compared to $122.3 billion at December 31, 2014.
Segment net interest income decreased $46 million, primarily the result of lower loans HFI balances reflecting the current strategy of selling substantially all conforming mortgage loan production, partially offset by higher credit spreads. Noninterest income increased $45 million, driven by higher gains on residential mortgage loan production and sales and an increase in net MSR income, primarily due to improved MSR hedging results.
The allocated provision for credit losses reflected a charge of $9 million in 2015, compared to a benefit of $107 million in 2014, partially attributable to stabilization in the rate of improvement in credit trends. Earlier period results reflect the impact of loan sales that generated a combined $66 million in gains through the release of the related ALLL. Noninterest expense decreased $177 million, primarily due to prior-year adjustments totaling $118 million relating to the previously discussed FHA-insured loan exposures and a $27 million prior-year charge related to a review of mortgage processes. The decrease in noninterest expense was also partially attributable to lower costs associated with repurchased loans.
Dealer Financial Services
Dealer Financial Services net income was $177 million in 2015, a decrease of $6 million, or 3.3%, compared to 2014.
Segment net interest income increased $53 million, primarily driven by growth in the Dealer Finance and Regional Acceptance loan portfolios, the inclusion of dealer floor plan loans in the segment results beginning in the first quarter of 2015 and the acquisition of Susquehanna’s consumer auto leasing business.
The allocated provision for credit losses increased $16 million, primarily due to higher charge-offs. Noninterest expense increased $37 million driven by higher personnel, professional services, loan-related expense and other expenses.
Dealer Financial Services grew average loans by $911 million, or 7.1%, compared to 2014 as a result of strong growth in the prime and nonprime auto lending businesses and the acquisition of Susquehanna’s consumer auto leasing business.
42
Specialized Lending
Specialized Lending net income was $235 million in 2015, an increase of $20 million, or 9.3%, compared to 2014.
Segment net interest income increased $44 million, driven by strong growth in small ticket consumer loans and the acquisition of Susquehanna’s small business equipment finance portfolio, partially offset by lower rates on new loans. Noninterest income increased $38 million driven by higher commercial mortgage and operating lease income.
The allocated provision for credit losses increased $7 million, primarily due to higher net charge-offs in the small ticket consumer and commercial finance loan portfolios. Noninterest expense increased $44 million, primarily due to higher personnel expense and higher depreciation of property under operating leases.
Specialized Lending grew average loans by $2.1 billion, or 16.1%, compared to 2014 as a result of strong growth in small ticket consumer, commercial mortgage and governmental finance loans and the acquisition of the small business equipment finance portfolio.
Insurance Holdings
Insurance Holdings net income was $182 million in 2015, a decrease of $51 million, or 21.9%, compared to 2014.
Insurance Holdings noninterest income of $1.6 billion decreased $55 million, which primarily reflects lower direct commercial property and casualty insurance premiums due to the previously discussed sale of American Coastal, partially offset by higher new and renewal commercial property and casualty insurance business.
Noninterest expense increased $1 million driven by higher salary, employee insurance and pension expense as well as higher merger-related charges, partially offset by lower business referral and insurance claims expense. Allocated corporate expenses increased $13 million primarily due to the centralization of certain corporate support functions during mid-2014.
Financial Services
Financial Services net income was $322 million in 2015, an increase of $40 million, or 14.2%, compared to 2014.
Segment net interest income increased $83 million, driven by Corporate Banking and BB&T Wealth loan and deposit growth, partially offset by lower rates on new loans. Noninterest income increased $70 million as a result of higher investment commissions and brokerage fees, trust and investment advisory fees, commercial unused commitment fees and income from SBIC private equity investments. Client invested assets totaled $130.6 billion as of December 31, 2015, an increase of $11.7 billion, or 9.8%, compared to 2014.
The allocated provision for credit losses increased $40 million as a result of the Corporate Banking loan growth, portfolio mix and risk expectations related to the energy sector. Noninterest expense increased $46 million compared to 2014, driven by higher salary, incentive, pension and professional services expense.
Financial Services generated strong loan growth, with Corporate Banking’s average loan balances increasing $2.8 billion, or 30.4%, compared to 2014, while BB&T Wealth’s average loan balances increased $367 million, or 32.7%. BB&T Wealth also grew transaction account balances by $595 million, or 21.5%, and money market and savings balances by $974 million, or 14.5%, compared to 2014.
Other, Treasury and Corporate
Other, Treasury and Corporate net income was $7 million in 2015 compared to net income of $179 million in 2014.
Segment net interest income decreased $71 million, driven by lower average PCI loan balances as well as lower yields on the securities portfolio, partially offset by higher funding spreads on deposits. Noninterest income increased $85 million, primarily due to improved FDIC loss share income, partially offset by the loss on the previously discussed sale of American Coastal.
The allocated provision for credit losses reflected a benefit of $10 million in 2015, compared to a benefit of $64 million in 2014, primarily due to a release in the RUFC in the earlier period driven by improvements related to the mix of unfunded lending exposures and a lower provision benefit for PCI loans.
43
Noninterest expense increased $361 million, driven by higher salary, employee insurance and pension expense, partially attributable to the Susquehanna acquisition, as well as higher IT professional services and software expense, franchise taxes, loss on early extinguishment of FHLB advances and merger-related charges. Intersegment net referral fee expenses decreased $22 million driven largely by higher mortgage loan referrals shared by other segments. Allocated corporate expense decreased $52 million compared to the earlier period as a result of higher expense allocations to the other segments related to internal business initiatives and the continued centralization of certain support functions into the respective allocated corporate centers.
Analysis of Financial Condition
Investment Activities
BB&T’s board-approved investment policy is carried out by the MRLCC, which meets regularly to review the economic environment and establish investment strategies. The MRLCC also has much broader responsibilities, which are discussed in the "Market Risk Management" section in "Management’s Discussion and Analysis of Financial Condition and Results of Operations."
Investment strategies are reviewed by the MRLCC based on the interest rate environment, balance sheet mix, actual and anticipated loan demand, funding opportunities and the overall interest rate sensitivity of the Company. In general, the goals of the investment portfolio are: (i) to provide a sufficient margin of liquid assets to meet unanticipated deposit and loan fluctuations and overall funds management objectives; (ii) to provide eligible securities to secure public funds, trust deposits as prescribed by law and other borrowings; and (iii) to earn an optimal return on funds invested commensurate with meeting the requirements of (i) and (ii) and consistent with our risk appetite.
Branch Bank invests in securities allowable under bank regulations. These securities may include obligations of the U.S. Treasury, U.S. government agencies, GSEs (including MBS), bank eligible obligations of any state or political subdivision, non-agency MBS, structured notes, bank eligible corporate obligations (including corporate debentures), commercial paper, negotiable CDs, bankers acceptances, mutual funds and limited types of equity securities. Branch Bank also may deal in securities subject to the provisions of the Gramm-Leach-Bliley Act. BB&T’s full-service brokerage and investment banking subsidiary engages in the underwriting, trading and sales of equity and debt securities subject to the risk management policies of the Company.
The following table provides information regarding the composition of the securities portfolio for the years presented:
|
Table 9
|
||||||||||||
|
Composition of Securities Portfolio
|
||||||||||||
|
|
December 31,
|
|||||||||||
|
|
2016
|
2015
|
2014
|
|||||||||
|
|
(Dollars in millions)
|
|||||||||||
|
AFS securities (at fair value):
|
|
|
|
|||||||||
|
U.S. Treasury
|
$
|
2,587
|
|
$
|
1,832
|
|
$
|
1,231
|
|
|||
|
GSE
|
180
|
|
51
|
|
—
|
|
||||||
|
Agency MBS
|
21,264
|
|
20,046
|
|
16,154
|
|
||||||
|
States and political subdivisions
|
2,205
|
|
2,375
|
|
2,286
|
|
||||||
|
Non-agency MBS
|
679
|
|
989
|
|
1,195
|
|
||||||
|
Other
|
11
|
|
4
|
|
41
|
|
||||||
|
Total AFS securities
|
26,926
|
|
|
25,297
|
|
|
20,907
|
|
||||
|
HTM securities (at amortized cost):
|
|
|
|
|
|
|
||||||
|
U.S. Treasury
|
1,098
|
|
1,097
|
|
1,096
|
|
||||||
|
GSE
|
2,197
|
|
5,045
|
|
5,394
|
|
||||||
|
Agency MBS
|
13,225
|
|
12,267
|
|
13,120
|
|
||||||
|
States and political subdivisions
|
110
|
|
63
|
|
22
|
|
||||||
|
Other
|
50
|
|
58
|
|
608
|
|
||||||
|
Total HTM securities
|
16,680
|
|
|
18,530
|
|
|
20,240
|
|
||||
|
Total securities
|
$
|
43,606
|
|
|
$
|
43,827
|
|
|
$
|
41,147
|
|
|
44
The securities portfolio totaled $43.6 billion at
December 31, 2016
, compared to $43.8 billion at
December 31, 2015
. The overall portfolio was relatively flat compared to the prior year, with a slight change in the mix between AFS and HTM as new purchases and reinvestments were directed to the AFS portfolio.
As of
December 31, 2016
, approximately 7.5% of the securities portfolio was variable rate, compared to 12.4% as of
December 31, 2015
. The effective duration of the securities portfolio was 4.8 years at
December 31, 2016
, compared to 4.0 years at the end of
2015
. The duration of the securities portfolio excludes equity securities and certain non-agency MBS acquired from the FDIC.
Agency MBS represented 79.1% of the total securities portfolio at year-end
2016
, compared to 73.7% as of prior year end.
BB&T transferred $517 million of HTM securities to AFS during the third quarter of 2015. These securities, which were sold by the end of the third quarter, represented investments in student loans for which there was a significant increase in risk weighting as a result of the implementation of Basel III.
Refer to the "Securities" note in the "Notes to Consolidated Financial Statements" for additional disclosures related to the evaluation of securities for OTTI.
45
The following table presents the securities portfolio at
December 31, 2016
, segregated by major category with ranges of maturities and average yields disclosed:
|
Table 10
|
||||||||||||||
|
Securities Yields By Major Category and Maturity
|
||||||||||||||
|
|
December 31, 2016
|
|||||||||||||
|
|
AFS
|
HTM
|
||||||||||||
|
|
Fair Value
|
Effective Yield (1)
|
Amortized Cost
|
Effective Yield (1)
|
||||||||||
|
|
(Dollars in millions)
|
|||||||||||||
|
U.S. Treasury:
|
|
|
|
|
||||||||||
|
Within one year
|
$
|
246
|
|
0.75
|
%
|
$
|
—
|
|
—
|
%
|
||||
|
One to five years
|
696
|
|
1.23
|
|
1,098
|
|
2.21
|
|
||||||
|
Five to ten years
|
1,645
|
|
1.40
|
|
—
|
|
—
|
|
||||||
|
Total
|
2,587
|
|
1.29
|
|
1,098
|
|
2.21
|
|
||||||
|
GSE:
|
|
|
|
|
|
|
|
|
||||||
|
One to five years
|
—
|
|
—
|
|
582
|
|
2.29
|
|
||||||
|
Five to ten years
|
167
|
|
1.49
|
|
1,615
|
|
2.18
|
|
||||||
|
After ten years
|
13
|
|
2.60
|
|
—
|
|
—
|
|
||||||
|
Total
|
180
|
|
1.57
|
|
2,197
|
|
2.21
|
|
||||||
|
Agency MBS: (2)
|
|
|
|
|
|
|
|
|
||||||
|
One to five years
|
4
|
|
3.69
|
|
—
|
|
—
|
|
||||||
|
Five to ten years
|
9
|
|
2.22
|
|
—
|
|
—
|
|
||||||
|
After ten years
|
21,251
|
|
1.99
|
|
13,225
|
|
2.26
|
|
||||||
|
Total
|
21,264
|
|
1.99
|
|
13,225
|
|
2.26
|
|
||||||
|
States and political subdivisions: (3)
|
|
|
|
|
|
|
|
|
||||||
|
Within one year
|
18
|
|
5.19
|
|
—
|
|
—
|
|
||||||
|
One to five years
|
318
|
|
5.91
|
|
3
|
|
2.12
|
|
||||||
|
Five to ten years
|
759
|
|
5.62
|
|
73
|
|
1.16
|
|
||||||
|
After ten years
|
1,110
|
|
6.33
|
|
34
|
|
1.45
|
|
||||||
|
Total
|
2,205
|
|
6.02
|
|
110
|
|
1.28
|
|
||||||
|
Non-agency MBS: (2)
|
|
|
|
|
|
|
|
|
||||||
|
After ten years
|
679
|
|
18.12
|
|
—
|
|
—
|
|
||||||
|
Total
|
679
|
|
18.12
|
|
—
|
|
—
|
|
||||||
|
Other:
|
|
|
|
|
|
|
|
|
||||||
|
Within one year
|
11
|
|
0.17
|
|
—
|
|
—
|
|
||||||
|
After ten years
|
—
|
|
—
|
|
50
|
|
2.16
|
|
||||||
|
Total
|
11
|
|
0.17
|
|
50
|
|
2.16
|
|
||||||
|
Total securities
|
$
|
26,926
|
|
2.66
|
|
$
|
16,680
|
|
2.24
|
|
||||
__________________
|
(1)
|
Yields represent interest computed using the effective interest method on a TE basis using marginal income tax rates and the amortized cost of the securities.
|
|
(2)
|
For purposes of the maturity table, MBS, which are not due at a single maturity date, have been included in maturity groupings based on the contractual maturity. The expected life of MBS will differ from contractual maturities because borrowers may have the right to call or prepay the underlying mortgage loans.
|
|
(3)
|
Weighted-average yield excludes the effect of pay-fixed swaps hedging municipal securities.
|
46
Lending Activities
The primary goal of the BB&T lending function is to help clients achieve their financial goals by providing quality loan products that are fair to the client and profitable to the Company. Management believes that this purpose can best be accomplished by building strong, profitable client relationships over time, with BB&T becoming an important contributor to the prosperity and well-being of its clients. In addition to the importance placed on client knowledge and continuous involvement with clients, BB&T’s lending process incorporates the standards of a consistent company-wide credit culture and an in-depth local market knowledge. Furthermore, the Company employs strict underwriting criteria governing the degree of assumed risk and the diversity of the loan portfolio in terms of type, industry and geographical concentration. In this context, BB&T strives to meet the credit needs of clients in its markets while pursuing a balanced strategy of loan profitability, loan growth and loan quality.
|
Table 11
|
||||||||||||||||||||
|
Quarterly Average Balances of Loans and Leases
|
||||||||||||||||||||
|
|
For the Three Months Ended
|
|||||||||||||||||||
|
|
12/31/2016
|
9/30/2016
|
6/30/2016
|
3/31/2016
|
12/31/2015
|
|||||||||||||||
|
|
(Dollars in millions)
|
|||||||||||||||||||
|
Commercial and industrial
|
$
|
51,306
|
|
$
|
51,508
|
|
$
|
51,646
|
|
$
|
48,013
|
|
$
|
48,047
|
|
|||||
|
CRE-income producing properties
|
14,566
|
|
14,667
|
|
14,786
|
|
13,490
|
|
13,264
|
|
||||||||||
|
CRE-construction and development
|
3,874
|
|
3,802
|
|
3,669
|
|
3,619
|
|
3,766
|
|
||||||||||
|
Dealer floor plan
|
1,367
|
|
1,268
|
|
1,305
|
|
1,239
|
|
1,164
|
|
||||||||||
|
Direct retail lending
|
12,046
|
|
11,994
|
|
12,031
|
|
11,107
|
|
10,896
|
|
||||||||||
|
Sales finance
|
10,599
|
|
9,339
|
|
9,670
|
|
10,049
|
|
10,533
|
|
||||||||||
|
Revolving credit
|
2,608
|
|
2,537
|
|
2,477
|
|
2,463
|
|
2,458
|
|
||||||||||
|
Residential mortgage
|
30,044
|
|
30,357
|
|
30,471
|
|
29,864
|
|
30,334
|
|
||||||||||
|
Other lending subsidiaries
|
14,955
|
|
14,742
|
|
13,961
|
|
13,439
|
|
13,281
|
|
||||||||||
|
PCI
|
974
|
|
1,052
|
|
1,130
|
|
1,098
|
|
1,070
|
|
||||||||||
|
Total loans and leases HFI
|
142,339
|
|
141,266
|
|
141,146
|
|
134,381
|
|
134,813
|
|
||||||||||
|
LHFS
|
2,230
|
|
2,423
|
|
1,951
|
|
1,247
|
|
1,377
|
|
||||||||||
|
Total loans and leases
|
$
|
144,569
|
|
$
|
143,689
|
|
$
|
143,097
|
|
$
|
135,628
|
|
$
|
136,190
|
|
|||||
Average loans held for investment for the
fourth
quarter of
2016
were
$142.3 billion
,
up $1.1 billion
compared to the
third quarter of 2016
. The increase was driven by sales finance loans. There was also modest growth in other lending subsidiaries loans, which was offset by a continued decline in residential mortgage loans.
Average sales finance loans
increased $1.3 billion
, primarily due to a $1.0 billion portfolio acquisition late in the third quarter of 2016 and a $1.9 billion portfolio acquisition in the fourth quarter. These increases were partially offset by the continued effects of dealer pricing structure changes implemented during 2015 and also reflect the continued runoff of the auto lease portfolio obtained in connection with the Susquehanna acquisition.
47
The following table excludes sales finance and retail other lending subsidiaries loans as the substantial majority of those loans have fixed interest rates:
|
Table 12
|
|||||||||||
|
Variable Rate Loans (Excluding PCI and LHFS)
|
|||||||||||
|
December 31, 2016
|
Outstanding Balance
|
Wtd. Avg. Contractual Rate
|
Wtd. Avg. Remaining Term
|
||||||||
|
|
(Dollars in millions)
|
||||||||||
|
Commercial:
|
|
|
|
||||||||
|
Commercial and industrial
|
$
|
35,851
|
|
2.60
|
%
|
3.0
|
|
yrs
|
|||
|
CRE-income producing properties
|
10,755
|
|
3.27
|
|
4.6
|
|
|||||
|
CRE-construction and development
|
3,597
|
|
3.56
|
|
2.7
|
|
|||||
|
Dealer floor plan (1)
|
1,413
|
|
2.08
|
|
NM
|
|
|||||
|
Other lending subsidiaries
|
797
|
|
2.70
|
|
1.8
|
|
|||||
|
Retail:
|
|
|
|
|
|
|
|||||
|
Direct retail lending (2)
|
9,945
|
|
3.72
|
|
8.4
|
|
|||||
|
Revolving credit
|
2,352
|
|
9.79
|
|
NM
|
|
|||||
|
Residential mortgage-nonguaranteed
|
5,805
|
|
3.50
|
|
24.6
|
|
|||||
|
Residential mortgage-government guaranteed
|
25
|
|
3.05
|
|
19.2
|
|
|||||
__________________
|
(1)
|
The weighted average remaining term for dealer floor plan is excluded as the balance primarily represents loans that are callable on demand.
|
|
(2)
|
Margin loans totaling $90 million have been excluded because they do not have a contractual end date and are callable on demand.
|
As of
December 31, 2016
, approximately $258 million of variable rate residential mortgage loans are currently in an interest-only phase. Approximately 94.8% of these balances will begin amortizing within the next three years. Variable rate residential mortgage loans typically reset every 12 months beginning after a 3 to 10 year fixed period, with an annual cap on rate changes ranging from 2.0% to 6.0%.
As of
December 31, 2016
, the direct retail lending portfolio includes $8.7 billion of variable rate home equity lines, $946 million of variable rate other lines of credit and $326 million of variable rate loans. Approximately $6.4 billion of the variable rate home equity lines is currently in the interest-only phase and approximately 8.5% of these balances will begin amortizing within the next three years. Approximately $788 million of the outstanding balance of variable rate other lines of credit is in the interest-only phase and 23.2% of these balances will begin amortizing within the next three years. Variable rate home equity lines and other lines of credit typically reset on a monthly basis.
BB&T monitors the performance of its home equity loans and lines secured by second liens similarly to other consumer loans and utilizes assumptions specific to these loans in determining the necessary ALLL. BB&T also receives notification when the first lien holder, whether BB&T or another financial institution, has initiated foreclosure proceedings against the borrower. When notified that the first lien is in the process of foreclosure, BB&T obtains valuations to determine if any additional charge-offs or reserves are warranted. These valuations are updated at least annually thereafter.
BB&T has limited ability to monitor the delinquency status of the first lien, unless the first lien is held or serviced by BB&T. As a result, using migration assumptions that are based on historical experience and adjusted for current trends, BB&T estimates the volume of second lien positions where the first lien is delinquent and adjusts the ALLL to reflect the increased risk of loss on these credits. Finally, BB&T also provides additional reserves to second lien positions when the estimated combined current loan to value ratio for the credit exceeds 100%. As of
December 31, 2016
, BB&T held or serviced the first lien on 31.5% of its second lien positions.
Scheduled repayments are reported in the maturity category in which the payment is due. Determinations of maturities are based on contract terms. BB&T’s credit policy typically does not permit automatic renewal of loans. At the scheduled maturity date (including balloon payment date), the customer generally must request a new loan to replace the matured loan and execute either a new note or note modification with rate, terms and conditions negotiated at that time.
48
BB&T lends to a diverse customer base that is substantially located within the Company’s primary market area. At the same time, the loan portfolio is geographically dispersed throughout BB&T’s branch network to mitigate concentration risk arising from local and regional economic downturns. Refer to the "Risk Management" section for a discussion of each of the loan portfolios and the credit risk management policies used to manage the portfolios.
The following table presents the loan portfolio based upon BB&T’s BUs:
|
Table 13
|
||||||||||||||||||||
|
Composition of Loan and Lease Portfolio
|
||||||||||||||||||||
|
|
December 31,
|
|||||||||||||||||||
|
|
2016
|
2015
|
2014
|
2013
|
2012
|
|||||||||||||||
|
|
(Dollars in millions)
|
|||||||||||||||||||
|
Commercial:
|
||||||||||||||||||||
|
Commercial and industrial
|
$
|
51,719
|
|
$
|
48,430
|
|
$
|
41,454
|
|
$
|
38,508
|
|
$
|
38,295
|
|
|||||
|
CRE-income producing properties
|
14,538
|
|
13,421
|
|
10,722
|
|
10,228
|
|
9,861
|
|
||||||||||
|
CRE-construction and development
|
3,819
|
|
3,732
|
|
2,735
|
|
2,382
|
|
2,861
|
|
||||||||||
|
Dealer floor plan
|
1,413
|
|
1,215
|
|
1,091
|
|
904
|
|
431
|
|
||||||||||
|
Other lending subsidiaries
|
7,691
|
|
6,795
|
|
5,356
|
|
4,502
|
|
4,138
|
|
||||||||||
|
Retail:
|
||||||||||||||||||||
|
Direct retail lending (1)
|
12,092
|
|
11,140
|
|
8,146
|
|
15,869
|
|
15,817
|
|
||||||||||
|
Sales finance
|
11,267
|
|
10,327
|
|
9,509
|
|
8,478
|
|
7,305
|
|
||||||||||
|
Revolving credit
|
2,655
|
|
2,510
|
|
2,460
|
|
2,403
|
|
2,330
|
|
||||||||||
|
Residential mortgage-nonguaranteed (1)
|
29,022
|
|
29,663
|
|
30,107
|
|
23,513
|
|
23,189
|
|
||||||||||
|
Residential mortgage-government guaranteed
|
899
|
|
870
|
|
983
|
|
1,135
|
|
1,083
|
|
||||||||||
|
Other lending subsidiaries
|
7,297
|
|
6,726
|
|
6,106
|
|
5,960
|
|
5,999
|
|
||||||||||
|
PCI
|
910
|
|
1,122
|
|
1,215
|
|
2,035
|
|
3,294
|
|
||||||||||
|
Total loans and leases HFI
|
143,322
|
|
|
135,951
|
|
|
119,884
|
|
|
115,917
|
|
|
114,603
|
|
||||||
|
LHFS
|
1,716
|
|
1,035
|
|
1,423
|
|
1,222
|
|
3,761
|
|
||||||||||
|
Total loans and leases
|
$
|
145,038
|
|
|
$
|
136,986
|
|
|
$
|
121,307
|
|
|
$
|
117,139
|
|
|
$
|
118,364
|
|
|
__________________
(1) During the first quarter of 2014, $8.3 billion of loans were transferred from direct retail lending to residential mortgage.
Loans and leases HFI were
$143.3 billion
at
December 31, 2016
, an increase of
$7.4 billion
compared to the prior year. This increase reflects the impact of the April 1, 2016 acquisition of National Penn, which contributed
$6.0 billion
in loans.
Commercial and industrial loans were up
$3.3 billion
, other lending subsidiaries loans were up
$1.5 billion
, CRE-income producing properties loans were up
$1.1 billion
and direct retail lending loans were up
$952 million
, all of which were primarily due to the acquisition of National Penn.
Sales finance loans were up
$940 million
over the prior year, primarily due to a $1.0 billion portfolio acquisition late in the third quarter of 2016 and a $1.9 billion portfolio acquisition during the fourth quarter. These increases were partially offset by the continued effects of dealer pricing structure changes implemented during 2015 and also reflect the continued runoff of the auto lease portfolio obtained in connection with the Susquehanna acquisition.
The
$612 million
decline in residential mortgage balances reflects the continuing strategy to sell conforming residential mortgage loan production.
The PCI loan portfolio, which totaled
$910 million
at
December 31, 2016
, continued to runoff during the year, partially offset by the addition of
$124 million
of PCI loans in connection with the National Penn acquisition.
The majority of loans are with clients in domestic market areas, which are primarily concentrated in the southeastern United States. International loans were immaterial as of
December 31, 2016
and
2015
.
49
|
Table 14
|
||||||||||||||||
|
Commercial Loan Maturities and Interest Sensitivity
|
||||||||||||||||
|
|
December 31, 2016
|
|||||||||||||||
|
|
1 Year or Less
|
Over 1 to 5 Years
|
After 5 Years
|
Total
|
||||||||||||
|
|
(Dollars in millions)
|
|||||||||||||||
|
Fixed rate:
|
|
|
|
|||||||||||||
|
Commercial and industrial
|
$
|
878
|
|
$
|
5,971
|
|
$
|
9,019
|
|
$
|
15,868
|
|
||||
|
CRE-income producing properties
|
353
|
|
2,338
|
|
1,092
|
|
3,783
|
|
||||||||
|
CRE-construction and development
|
28
|
|
128
|
|
66
|
|
222
|
|
||||||||
|
Other lending subsidiaries
|
2,531
|
|
2,881
|
|
1,482
|
|
6,894
|
|
||||||||
|
Total fixed rate
|
3,790
|
|
11,318
|
|
|
11,659
|
|
|
26,767
|
|
||||||
|
Variable rate:
|
|
|
|
|
|
|
||||||||||
|
Commercial and industrial
|
18,453
|
|
9,484
|
|
7,914
|
|
35,851
|
|
||||||||
|
CRE-income producing properties
|
1,086
|
|
5,786
|
|
3,883
|
|
10,755
|
|
||||||||
|
CRE-construction and development
|
1,128
|
|
1,830
|
|
639
|
|
3,597
|
|
||||||||
|
Dealer floor plan
|
1,413
|
|
—
|
|
—
|
|
1,413
|
|
||||||||
|
Other lending subsidiaries
|
57
|
|
631
|
|
109
|
|
797
|
|
||||||||
|
Total variable rate
|
22,137
|
|
17,731
|
|
|
12,545
|
|
|
52,413
|
|
||||||
|
Total commercial loans and leases
|
$
|
25,927
|
|
$
|
29,049
|
|
|
$
|
24,204
|
|
|
$
|
79,180
|
|
||
Asset Quality
The following discussion includes PCI loans, which are considered performing due to the application of the expected cash flows method and totaled
$910 million
at
December 31, 2016
and $1.1 billion in the prior year.
Potential problem loans include loans on nonaccrual status or past due as disclosed in
Table 16
. In addition, for the commercial portfolio segment, loans that are rated special mention or substandard performing are closely monitored by management as potential problem loans. Refer to the "Loans and ACL" note in the "Notes to Consolidated Financial Statements" for additional disclosures related to these potential problem loans.
TDRs generally occur when a borrower is experiencing, or is expected to experience, financial difficulties in the near-term. As a result, BB&T will work with the borrower to prevent further difficulties, and ultimately to improve the likelihood of recovery on the loan. To facilitate this process, a concessionary modification that would not otherwise be considered may be granted, resulting in classification of the loan as a TDR. Trial modifications are excluded from the following discussion because the specific types and amounts of concessions offered to borrowers frequently change between the trial modification and the permanent modification. Refer to the "Summary of Significant Accounting Policies" note in the "Notes to Consolidated Financial Statements" for additional policy information regarding TDRs.
50
The following table presents activity related to NPAs. Foreclosed real estate acquired from the FDIC is excluded for periods prior to the loss share termination.
|
Table 15
|
||||||||
|
Rollforward of NPAs
|
||||||||
|
|
Year Ended December 31,
|
|||||||
|
|
2016
|
2015
|
||||||
|
|
(Dollars in millions)
|
|||||||
|
Balance at beginning of year
|
$
|
686
|
|
$
|
726
|
|
||
|
New NPAs
|
1,716
|
|
1,266
|
|
||||
|
Advances and principal increases
|
253
|
|
85
|
|
||||
|
Disposals of foreclosed assets (1)
|
(516
|
)
|
(484
|
)
|
||||
|
Disposals of NPLs (2)
|
(302
|
)
|
(165
|
)
|
||||
|
Charge-offs and losses
|
(279
|
)
|
(246
|
)
|
||||
|
Payments
|
(586
|
)
|
(358
|
)
|
||||
|
Transfers to performing status
|
(179
|
)
|
(149
|
)
|
||||
|
Foreclosed real estate, included as a result of loss share termination
|
17
|
|
—
|
|
||||
|
Other, net
|
3
|
|
11
|
|
||||
|
Balance at end of year
|
$
|
813
|
|
$
|
686
|
|
||
__________________
|
(1)
|
Includes charge-offs and losses recorded upon sale of $210 million and $170 million for the year ended
December 31, 2016
and
2015
, respectively.
|
|
(2)
|
Includes charge-offs and losses recorded upon sale of $30 million and $17 million for the year ended
December 31, 2016
and
2015
, respectively.
|
NPAs, which include foreclosed real estate, repossessions and NPLs, totaled
$813 million
at
December 31, 2016
compared to
$712 million
(or $686 million excluding foreclosed real estate acquired from the FDIC) at
December 31, 2015
. This increase consisted of a $160 million increase in NPLs partially offset by a $59 million decrease in foreclosed real estate and other property.
The increase in NPLs is primarily due to commercial and industrial NPLs that were downgraded as a result of a review of shared national credits in the energy lending portfolio during the first quarter, partially offset by the sale of several energy-related credits during the year.
NPAs as a percentage of loans and leases plus foreclosed property were
0.57%
at
December 31, 2016
compared with
0.52%
at
December 31, 2015
.
51
The following tables summarize asset quality information for the past five years.
|
Table 16
|
||||||||||||||||||||
|
Asset Quality
|
||||||||||||||||||||
|
|
December 31,
|
|||||||||||||||||||
|
|
2016
|
2015
|
2014
|
2013
|
2012
|
|||||||||||||||
|
|
(Dollars in millions)
|
|||||||||||||||||||
|
Nonaccrual loans and leases:
|
|
|
|
|
|
|||||||||||||||
|
Commercial and industrial (1)
|
$
|
363
|
|
$
|
237
|
|
$
|
239
|
|
$
|
363
|
|
$
|
545
|
|
|||||
|
CRE-income producing properties
|
40
|
|
38
|
|
74
|
|
113
|
|
171
|
|
||||||||||
|
CRE-construction and development
|
17
|
|
13
|
|
26
|
|
51
|
|
170
|
|
||||||||||
|
Direct retail lending
|
63
|
|
43
|
|
48
|
|
109
|
|
132
|
|
||||||||||
|
Sales finance
|
6
|
|
7
|
|
5
|
|
5
|
|
7
|
|
||||||||||
|
Residential mortgage-nonguaranteed (2)
|
172
|
|
173
|
|
164
|
|
243
|
|
269
|
|
||||||||||
|
Residential mortgage-government guaranteed
|
—
|
|
—
|
|
2
|
|
—
|
|
—
|
|
||||||||||
|
Other lending subsidiaries
|
75
|
|
65
|
|
58
|
|
51
|
|
86
|
|
||||||||||
|
Total nonaccrual loans and leases (1)(2)
|
736
|
|
|
576
|
|
|
616
|
|
|
935
|
|
|
1,380
|
|
||||||
|
Foreclosed real estate
|
37
|
|
82
|
|
87
|
|
71
|
|
107
|
|
||||||||||
|
Foreclosed real estate-acquired from FDIC
|
13
|
|
26
|
|
56
|
|
121
|
|
254
|
|
||||||||||
|
Other foreclosed property
|
27
|
|
28
|
|
23
|
|
47
|
|
49
|
|
||||||||||
|
Total NPAs (1)(2)
|
$
|
813
|
|
|
$
|
712
|
|
|
$
|
782
|
|
|
$
|
1,174
|
|
|
$
|
1,790
|
|
|
|
Performing TDRs:
|
||||||||||||||||||||
|
Commercial and industrial
|
$
|
55
|
|
$
|
49
|
|
$
|
64
|
|
$
|
77
|
|
$
|
77
|
|
|||||
|
CRE-income producing properties
|
16
|
|
13
|
|
27
|
|
50
|
|
53
|
|
||||||||||
|
CRE-construction and development
|
9
|
|
16
|
|
30
|
|
39
|
|
35
|
|
||||||||||
|
Direct retail lending (3)
|
67
|
|
72
|
|
84
|
|
187
|
|
197
|
|
||||||||||
|
Sales finance
|
16
|
|
17
|
|
19
|
|
17
|
|
19
|
|
||||||||||
|
Revolving credit
|
29
|
|
33
|
|
41
|
|
48
|
|
56
|
|
||||||||||
|
Residential mortgage-nonguaranteed (3)(4)
|
332
|
|
288
|
|
261
|
|
785
|
|
769
|
|
||||||||||
|
Residential mortgage-government guaranteed
|
420
|
|
316
|
|
360
|
|
376
|
|
313
|
|
||||||||||
|
Other lending subsidiaries
|
226
|
|
178
|
|
164
|
|
126
|
|
121
|
|
||||||||||
|
Total performing TDRs (4)
|
$
|
1,170
|
|
$
|
982
|
|
$
|
1,050
|
|
$
|
1,705
|
|
$
|
1,640
|
|
|||||
|
Loans 90 days or more past due and still accruing:
|
|
|
|
|
|
|
|
|
|
|
||||||||||
|
Commercial and industrial
|
$
|
—
|
|
$
|
—
|
|
$
|
—
|
|
$
|
—
|
|
$
|
1
|
|
|||||
|
Direct retail lending
|
6
|
|
7
|
|
12
|
|
33
|
|
38
|
|
||||||||||
|
Sales finance
|
6
|
|
5
|
|
5
|
|
5
|
|
10
|
|
||||||||||
|
Revolving credit
|
12
|
|
10
|
|
9
|
|
10
|
|
16
|
|
||||||||||
|
Residential mortgage-nonguaranteed
|
79
|
|
55
|
|
83
|
|
69
|
|
91
|
|
||||||||||
|
Residential mortgage-government guaranteed
|
443
|
|
486
|
|
648
|
|
807
|
|
769
|
|
||||||||||
|
Other lending subsidiaries
|
—
|
|
—
|
|
—
|
|
5
|
|
10
|
|
||||||||||
|
PCI
|
90
|
|
114
|
|
188
|
|
304
|
|
442
|
|
||||||||||
|
Total loans 90 days or more past due and still accruing
|
$
|
636
|
|
$
|
677
|
|
|
$
|
945
|
|
|
$
|
1,233
|
|
|
$
|
1,377
|
|
||
|
Loans 30-89 days past due and still accruing:
|
|
|
|
|
|
|
|
|
|
|
||||||||||
|
Commercial and industrial
|
$
|
27
|
|
$
|
36
|
|
$
|
23
|
|
$
|
35
|
|
$
|
42
|
|
|||||
|
CRE-income producing properties
|
6
|
|
13
|
|
4
|
|
8
|
|
11
|
|
||||||||||
|
CRE-construction and development
|
2
|
|
9
|
|
1
|
|
2
|
|
3
|
|
||||||||||
|
Direct retail lending
|
60
|
|
58
|
|
41
|
|
132
|
|
145
|
|
||||||||||
|
Sales finance
|
76
|
|
72
|
|
62
|
|
56
|
|
56
|
|
||||||||||
|
Revolving credit
|
23
|
|
22
|
|
23
|
|
23
|
|
23
|
|
||||||||||
|
Residential mortgage-nonguaranteed
|
393
|
|
397
|
|
392
|
|
454
|
|
477
|
|
||||||||||
|
Residential mortgage-government guaranteed
|
132
|
|
78
|
|
82
|
|
92
|
|
89
|
|
||||||||||
|
Other lending subsidiaries
|
322
|
|
304
|
|
237
|
|
221
|
|
290
|
|
||||||||||
|
PCI
|
36
|
|
42
|
|
33
|
|
88
|
|
135
|
|
||||||||||
|
Total loans 30-89 days past due and still accruing
|
$
|
1,077
|
|
|
$
|
1,031
|
|
|
$
|
898
|
|
|
$
|
1,111
|
|
|
$
|
1,271
|
|
|
52
__________________
|
(1)
|
During 2016, approximately $191 million of nonaccrual energy-related loans were sold.
|
|
(2)
|
During 2014, approximately $121 million of nonaccrual residential mortgage loans were sold.
|
|
(3)
|
During 2014, approximately $94 million of performing TDRs were transferred from direct retail lending to residential mortgage.
|
|
(4)
|
During 2014, approximately $540 million of performing residential mortgage TDRs were sold.
|
BB&T’s performing TDRs totaled
$1.2 billion
at
December 31, 2016
, an increase of $188 million compared to the prior year. This increase includes a $148 million increase for residential mortgage loans, which was primarily the result of the permanent restructuring of certain mortgage loan modifications that successfully completed their trial periods and of implementing a change in the strategy of repurchasing loans from GNMA pools that BB&T has the right but not the obligation to repurchase.
Loans 90 days or more past due and still accruing interest totaled
$636 million
at
December 31, 2016
, compared with
$677 million
at prior year-end, a decline of $41 million. This decline includes a $43 million reduction for past due government guaranteed residential mortgage loans, which reflects general improvements in credit quality within that portfolio.
Loans 30-89 days past due totaled
$1.1 billion
at
December 31, 2016
, an increase of $46 million compared to the prior year, primarily due to higher loan balances.
|
Table 17
|
||||||||||||||
|
Asset Quality Ratios
|
||||||||||||||
|
|
As Of / For The Year Ended December 31,
|
|||||||||||||
|
|
2016
|
2015
|
2014
|
2013
|
2012
|
|||||||||
|
Asset Quality Ratios:
|
|
|
|
|
|
|||||||||
|
Loans 30-89 days past due and still accruing as a percentage of loans and leases HFI
|
0.75
|
%
|
0.76
|
%
|
0.75
|
%
|
0.96
|
%
|
1.11
|
%
|
||||
|
Loans 90 days or more past due and still accruing as a percentage of loans and leases HFI
|
0.44
|
|
0.50
|
|
0.79
|
|
1.06
|
|
1.20
|
|
||||
|
NPLs as a percentage of loans and leases HFI
|
0.51
|
|
0.42
|
|
0.51
|
|
0.81
|
|
1.20
|
|
||||
|
NPAs as a percentage of:
|
|
|
|
|
||||||||||
|
Total assets
|
0.37
|
|
0.34
|
|
0.42
|
|
0.64
|
|
0.97
|
|
||||
|
Loans and leases HFI plus foreclosed property
|
0.57
|
|
0.52
|
|
0.65
|
|
1.01
|
|
1.56
|
|
||||
|
Net charge-offs as a percentage of average loans and leases HFI
|
0.38
|
|
0.35
|
|
0.46
|
|
0.69
|
|
1.17
|
|
||||
|
ALLL as a percentage of loans and leases HFI
|
1.04
|
|
1.07
|
|
1.23
|
|
1.49
|
|
1.76
|
|
||||
|
Ratio of ALLL to:
|
|
|
|
|
|
|
||||||||
|
Net charge-offs
|
2.80
|
x
|
3.36
|
x
|
2.74
|
x
|
2.19
|
x
|
1.56
|
x
|
||||
|
NPLs
|
2.03
|
|
2.53
|
|
2.39
|
|
1.85
|
|
1.46
|
|
||||
|
Asset Quality Ratios (Excluding Government Guaranteed and PCI): (1)
|
|
|
|
|
|
|
|
|
|
|
||||
|
Loans 90 days or more past due and still accruing as a percentage of loans and leases HFI
|
0.07
|
%
|
0.06
|
%
|
0.09
|
%
|
0.11
|
%
|
0.15
|
%
|
||||
__________________
|
(1)
|
These asset quality ratios have been adjusted to remove the impact of government guaranteed and PCI assets. Appropriate adjustments to the numerator and denominator have been reflected in the calculation of these ratios.
|
53
The following table provides a summary of performing TDR activity:
|
Table 18
|
||||||||
|
Rollforward of Performing TDRs
|
||||||||
|
|
Year Ended December 31,
|
|||||||
|
|
2016
|
2015
|
||||||
|
|
(Dollars in millions)
|
|||||||
|
Balance at beginning of year
|
$
|
982
|
|
$
|
1,050
|
|
||
|
Inflows
|
681
|
|
448
|
|
||||
|
Payments and payoffs
|
(216
|
)
|
(224
|
)
|
||||
|
Charge-offs
|
(41
|
)
|
(44
|
)
|
||||
|
Transfers to nonperforming TDRs, net
|
(68
|
)
|
(85
|
)
|
||||
|
Removal due to the passage of time
|
(54
|
)
|
(31
|
)
|
||||
|
Non-concessionary re-modifications
|
—
|
|
(2
|
)
|
||||
|
Sold and transferred to LHFS
|
(114
|
)
|
(130
|
)
|
||||
|
Balance at end of year
|
$
|
1,170
|
|
$
|
982
|
|
||
Payments and payoffs include scheduled principal payments, prepayments and payoffs of amounts outstanding. Transfers to nonperforming TDRs represent loans that no longer meet the requirements necessary to reflect the loan in accruing status.
TDRs may be removed due to the passage of time if they: (1) did not include a forgiveness of principal or interest, (2) have performed in accordance with the modified terms (generally a minimum of six months), (3) were reported as a TDR over a year end reporting period, and (4) reflected an interest rate on the modified loan that was no less than a market rate at the date of modification. These loans were previously considered TDRs as a result of structural concessions such as extended interest-only terms or an amortization period that did not otherwise conform to normal underwriting guidelines.
In addition, certain loans may be removed from classification as a TDR as a result of a subsequent non-concessionary re-modification. Non-concessionary re-modifications represent TDRs that did not contain concessionary terms at the date of a subsequent renewal/modification and there was a reasonable expectation that the borrower would continue to comply with the terms of the loan subsequent to the date of the re-modification. A re-modification may be considered for such a re-classification if the loan has not had a forgiveness of principal or interest and the modified terms qualify as more than minor such that the re-modified loan is considered a new loan. Alternatively, such loans may be considered for reclassification in years subsequent to the date of the re-modification based on the passage of time as described in the preceding paragraph.
In connection with consumer loan TDRs, a NPL will be returned to accruing status when current as to principal and interest and upon a sustained historical repayment performance (generally a minimum of six months).
|
Table 19
|
|||||||||||||||||||||||||
|
Payment Status of TDRs
|
|||||||||||||||||||||||||
|
|
December 31, 2016
|
||||||||||||||||||||||||
|
|
Current
|
Past Due 30-89 Days
|
Past Due 90 Days Or More
|
Total
|
|||||||||||||||||||||
|
|
(Dollars in millions)
|
||||||||||||||||||||||||
|
Performing TDRs (1):
|
|
|
|
|
|
|
|
|
|||||||||||||||||
|
Commercial and industrial
|
$
|
55
|
|
100.0
|
%
|
$
|
—
|
|
—
|
%
|
$
|
—
|
|
—
|
%
|
$
|
55
|
|
|||||||
|
CRE-income producing properties
|
16
|
|
100.0
|
|
—
|
|
—
|
|
—
|
|
—
|
|
16
|
|
|||||||||||
|
CRE-construction and development
|
9
|
|
100.0
|
|
—
|
|
—
|
|
—
|
|
—
|
|
9
|
|
|||||||||||
|
Direct retail lending
|
64
|
|
95.5
|
|
3
|
|
4.5
|
|
—
|
|
—
|
|
67
|
|
|||||||||||
|
Sales finance
|
15
|
|
93.8
|
|
1
|
|
6.2
|
|
—
|
|
—
|
|
16
|
|
|||||||||||
|
Revolving credit
|
24
|
|
82.8
|
|
4
|
|
13.8
|
|
1
|
|
3.4
|
|
29
|
|
|||||||||||
|
Residential mortgage-nonguaranteed
|
259
|
|
78.0
|
|
47
|
|
14.2
|
|
26
|
|
7.8
|
|
332
|
|
|||||||||||
|
Residential mortgage-government guaranteed
|
170
|
|
40.5
|
|
73
|
|
17.4
|
|
177
|
|
42.1
|
|
420
|
|
|||||||||||
|
Other lending subsidiaries
|
188
|
|
83.2
|
|
38
|
|
16.8
|
|
—
|
|
—
|
|
226
|
|
|||||||||||
|
Total performing TDRs
|
800
|
|
68.4
|
|
166
|
|
14.2
|
|
204
|
|
17.4
|
|
1,170
|
|
|||||||||||
|
Nonperforming TDRs (2)
|
101
|
|
55.2
|
|
16
|
|
8.7
|
|
66
|
|
36.1
|
|
183
|
|
|||||||||||
|
Total TDRs
|
$
|
901
|
|
66.6
|
|
$
|
182
|
|
13.4
|
|
$
|
270
|
|
20.0
|
|
$
|
1,353
|
|
|||||||
__________________
|
(1)
|
Past due performing TDRs are included in past due disclosures.
|
|
(2)
|
Nonperforming TDRs are included in NPL disclosures.
|
54
ACL
Information related to the ACL is presented in the following table:
|
Table 20
|
||||||||||||||||||||
|
Analysis of ACL
|
||||||||||||||||||||
|
|
Year Ended December 31,
|
|||||||||||||||||||
|
|
2016
|
2015
|
2014
|
2013
|
2012
|
|||||||||||||||
|
|
(Dollars in millions)
|
|||||||||||||||||||
|
Beginning balance
|
$
|
1,550
|
|
$
|
1,534
|
|
$
|
1,821
|
|
$
|
2,048
|
|
$
|
2,285
|
|
|||||
|
Provision for credit losses (excluding PCI)
|
574
|
|
430
|
|
280
|
|
587
|
|
1,044
|
|
||||||||||
|
Provision for PCI loans
|
(2
|
)
|
(2
|
)
|
(29
|
)
|
5
|
|
13
|
|
||||||||||
|
Charge-offs:
|
|
|
|
|
|
|
|
|
|
|
||||||||||
|
Commercial and industrial
|
(128
|
)
|
(81
|
)
|
(131
|
)
|
(248
|
)
|
(337
|
)
|
||||||||||
|
CRE-income producing properties
|
(8
|
)
|
(20
|
)
|
(31
|
)
|
(74
|
)
|
(150
|
)
|
||||||||||
|
CRE-construction and development
|
(1
|
)
|
(4
|
)
|
(11
|
)
|
(58
|
)
|
(245
|
)
|
||||||||||
|
Direct retail lending (1)
|
(53
|
)
|
(54
|
)
|
(69
|
)
|
(148
|
)
|
(224
|
)
|
||||||||||
|
Sales finance
|
(29
|
)
|
(26
|
)
|
(23
|
)
|
(23
|
)
|
(26
|
)
|
||||||||||
|
Revolving credit
|
(69
|
)
|
(70
|
)
|
(71
|
)
|
(85
|
)
|
(81
|
)
|
||||||||||
|
Residential mortgage-nonguaranteed (1)
|
(35
|
)
|
(40
|
)
|
(82
|
)
|
(79
|
)
|
(135
|
)
|
||||||||||
|
Residential mortgage-government guaranteed
|
(5
|
)
|
(6
|
)
|
(2
|
)
|
(2
|
)
|
(1
|
)
|
||||||||||
|
Other lending subsidiaries
|
(358
|
)
|
(286
|
)
|
(269
|
)
|
(255
|
)
|
(225
|
)
|
||||||||||
|
PCI
|
(15
|
)
|
(1
|
)
|
(21
|
)
|
(19
|
)
|
(34
|
)
|
||||||||||
|
Total charge-offs
|
(701
|
)
|
|
(588
|
)
|
|
(710
|
)
|
|
(991
|
)
|
|
(1,458
|
)
|
||||||
|
Recoveries:
|
|
|
|
|
|
|
|
|
|
|
||||||||||
|
Commercial and industrial
|
40
|
|
37
|
|
42
|
|
47
|
|
17
|
|
||||||||||
|
CRE-income producing properties
|
8
|
|
7
|
|
14
|
|
20
|
|
9
|
|
||||||||||
|
CRE-construction and development
|
11
|
|
11
|
|
19
|
|
31
|
|
45
|
|
||||||||||
|
Direct retail lending (1)
|
26
|
|
29
|
|
29
|
|
38
|
|
36
|
|
||||||||||
|
Sales finance
|
12
|
|
9
|
|
9
|
|
9
|
|
10
|
|
||||||||||
|
Revolving credit
|
20
|
|
20
|
|
19
|
|
17
|
|
18
|
|
||||||||||
|
Residential mortgage-nonguaranteed (1)
|
3
|
|
3
|
|
7
|
|
3
|
|
3
|
|
||||||||||
|
Other lending subsidiaries
|
49
|
|
36
|
|
33
|
|
34
|
|
26
|
|
||||||||||
|
Total recoveries
|
169
|
|
|
152
|
|
|
172
|
|
|
199
|
|
|
164
|
|
||||||
|
Net charge-offs
|
(532
|
)
|
(436
|
)
|
(538
|
)
|
(792
|
)
|
(1,294
|
)
|
||||||||||
|
Other changes, net
|
9
|
|
24
|
|
—
|
|
(27
|
)
|
—
|
|
||||||||||
|
Ending balance
|
$
|
1,599
|
|
|
$
|
1,550
|
|
|
$
|
1,534
|
|
|
$
|
1,821
|
|
|
$
|
2,048
|
|
|
|
ALLL (excluding PCI loans)
|
$
|
1,445
|
|
$
|
1,399
|
|
$
|
1,410
|
|
$
|
1,618
|
|
$
|
1,890
|
|
|||||
|
Allowance for PCI loans
|
44
|
|
61
|
|
64
|
|
114
|
|
128
|
|
||||||||||
|
RUFC
|
110
|
|
90
|
|
60
|
|
89
|
|
30
|
|
||||||||||
|
Total ACL
|
$
|
1,599
|
|
|
$
|
1,550
|
|
|
$
|
1,534
|
|
|
$
|
1,821
|
|
|
$
|
2,048
|
|
|
__________________
|
(1)
|
During the first quarter of 2014, $8.3 billion of loans were transferred from direct retail lending to residential mortgage. Charge-offs and recoveries have been reflected in these line items based upon the date the loans were transferred.
|
The ACL consists of the ALLL, which is presented separately on the Consolidated Balance Sheets, and the RUFC, which is included in other liabilities on the Consolidated Balance Sheets. The ACL totaled
$1.6 billion
at
December 31, 2016
, an increase of $49 million compared to the prior year.
The ALLL amounted to
1.04%
of loans and leases held for investment at
December 31, 2016
, compared to
1.07%
at
December 31, 2015
. This decline is primarily due to the acquisitions of National Penn during 2016 and Susquehanna during 2015, which provided a total of $18.9 billion in loans and no related allowance as of the acquisition dates. The ratio of the ALLL to NPLs held for investment was
2.03x
at
December 31, 2016
compared to
2.53x
at
December 31, 2015
.
55
The energy portfolio totals approximately $1.2 billion and has allocated reserves of 11.7%. This portfolio does not include any offshore, second lien or mezzanine loans. The allowance includes the impact of the shared national credit review related to the energy lending portfolio.
Net charge-offs totaled
$532 million
for
2016
, compared to
$436 million
in
2015
. Net charge-offs as a percentage of average loans and leases were
0.38%
for
2016
, compared to
0.35%
in
2015
. Net charge-offs increased by $59 million in the other lending subsidiaries portfolio, driven by an increase in loss severity associated with used car values and loan growth. Commercial and industrial net charge-offs increased $44 million, primarily due to the energy portfolio.
Refer to the "Loans and ACL" note in the "Notes to Consolidated Financial Statements" for additional disclosures.
The following table presents an allocation of the ALLL at the end of each of the last five years. This allocation of the ALLL is calculated on an approximate basis and is not necessarily indicative of future losses or allocations. The entire amount of the allowance is available to absorb losses occurring in any category of loans and leases. During 2013, the balance in the unallocated ALLL was incorporated into the loan portfolio segments.
|
Table 21
|
|||||||||||||||||||||||||||||||||||
|
Allocation of ALLL by Category
|
|||||||||||||||||||||||||||||||||||
|
|
December 31,
|
||||||||||||||||||||||||||||||||||
|
|
2016
|
2015
|
2014
|
2013
|
2012
|
||||||||||||||||||||||||||||||
|
|
Amount
|
% Loans in each category
|
Amount
|
% Loans in each category
|
Amount
|
% Loans in each category
|
Amount
|
% Loans in each category
|
Amount
|
% Loans in each category
|
|||||||||||||||||||||||||
|
|
(Dollars in millions)
|
||||||||||||||||||||||||||||||||||
|
Balances at end of period applicable to:
|
|
|
|
|
|
|
|
|
|||||||||||||||||||||||||||
|
Commercial and industrial
|
$
|
500
|
|
36.1
|
%
|
$
|
466
|
|
35.8
|
%
|
$
|
422
|
|
34.6
|
%
|
$
|
454
|
|
33.2
|
%
|
$
|
470
|
|
33.4
|
%
|
||||||||||
|
CRE-income producing properties
|
117
|
|
10.1
|
|
135
|
|
9.9
|
|
162
|
|
8.9
|
|
149
|
|
8.8
|
|
170
|
|
8.6
|
|
|||||||||||||||
|
CRE-construction and development
|
25
|
|
2.7
|
|
37
|
|
2.7
|
|
48
|
|
2.3
|
|
76
|
|
2.1
|
|
134
|
|
2.5
|
|
|||||||||||||||
|
Dealer floor plan
|
11
|
|
1.0
|
|
8
|
|
0.9
|
|
10
|
|
0.9
|
|
8
|
|
0.8
|
|
2
|
|
0.4
|
|
|||||||||||||||
|
Direct retail lending (1)
|
103
|
|
8.4
|
|
105
|
|
8.2
|
|
110
|
|
6.8
|
|
209
|
|
13.7
|
|
300
|
|
13.8
|
|
|||||||||||||||
|
Sales finance
|
38
|
|
7.9
|
|
40
|
|
7.6
|
|
40
|
|
7.9
|
|
37
|
|
7.3
|
|
27
|
|
6.4
|
|
|||||||||||||||
|
Revolving credit
|
106
|
|
1.9
|
|
104
|
|
1.8
|
|
110
|
|
2.1
|
|
115
|
|
2.1
|
|
102
|
|
2.0
|
|
|||||||||||||||
|
Residential mortgage-nonguaranteed (1)
|
186
|
|
20.2
|
|
194
|
|
21.8
|
|
217
|
|
25.1
|
|
269
|
|
20.3
|
|
296
|
|
20.3
|
|
|||||||||||||||
|
Residential mortgage-government guaranteed
|
41
|
|
0.6
|
|
23
|
|
0.6
|
|
36
|
|
0.8
|
|
62
|
|
1.0
|
|
32
|
|
0.9
|
|
|||||||||||||||
|
Other lending subsidiaries
|
318
|
|
10.5
|
|
287
|
|
9.9
|
|
255
|
|
9.6
|
|
239
|
|
9.0
|
|
277
|
|
8.8
|
|
|||||||||||||||
|
PCI
|
44
|
|
0.6
|
|
61
|
|
0.8
|
|
64
|
|
1.0
|
|
114
|
|
1.7
|
|
128
|
|
2.9
|
|
|||||||||||||||
|
Unallocated
|
—
|
|
—
|
|
—
|
|
—
|
|
—
|
|
—
|
|
—
|
|
—
|
|
80
|
|
—
|
|
|||||||||||||||
|
Total ALLL
|
1,489
|
|
100.0
|
%
|
1,460
|
|
100.0
|
%
|
1,474
|
|
100.0
|
%
|
1,732
|
|
100.0
|
%
|
2,018
|
|
100.0
|
%
|
|||||||||||||||
|
RUFC
|
110
|
|
|
|
90
|
|
|
|
60
|
|
|
|
89
|
|
|
|
30
|
|
|
|
|||||||||||||||
|
Total ACL
|
$
|
1,599
|
|
|
|
|
|
$
|
1,550
|
|
|
|
|
|
$
|
1,534
|
|
|
|
|
|
$
|
1,821
|
|
|
|
|
|
$
|
2,048
|
|
||||
__________________
|
(1)
|
During the first quarter of 2014, $8.3 billion in loans were transferred from direct retail lending to residential mortgage.
|
FDIC Loss Share Receivable/Payable and Assets Acquired from the FDIC
In connection with the Colonial acquisition, Branch Bank entered into loss sharing agreements with the FDIC that outlined the terms and conditions under which the FDIC would reimburse Branch Bank for a portion of the losses incurred on certain loans, investment securities and other assets. The loss sharing provisions of the commercial loss sharing agreement expired during 2014 with the exception of certain gain sharing that was to be effective through September 30, 2017. The loss sharing provisions of the single family loss sharing agreement were to be effective through August 31, 2019.
56
During the third quarter of 2016, Branch Bank entered into an early termination agreement with the FDIC that terminated the loss share agreements. Branch Bank made a payment of approximately $230 million to the FDIC as consideration for the early termination of the loss share agreements. The early termination eliminates the FDIC loss share receivable/payable associated with the indemnification by the FDIC. As a result of the settlement, BB&T recognized pre-tax expense of $18 million during the third quarter of 2016 (resulting in total expense of $142 million for fiscal 2016), and no future loss sharing or gain sharing will occur related to the Colonial acquisition.
Funding Activities
Deposits are the primary source of funds for lending and investing activities. Scheduled payments, as well as prepayments, and maturities from portfolios of loans and investment securities also provide a stable source of funds. FHLB advances, other secured borrowings, Federal funds purchased and other short-term borrowed funds, as well as long-term debt issued through the capital markets, all provide supplemental liquidity sources. Funding activities are monitored and governed through BB&T’s overall asset/liability management process, which is further discussed in the "Market Risk Management" section in "Management’s Discussion and Analysis of Financial Condition and Results of Operations." The following section provides a brief description of the various sources of funds.
Deposits
Deposits are attracted principally from clients within BB&T’s branch network through the offering of a broad selection of deposit instruments to individuals and businesses, including noninterest-bearing checking accounts, interest-bearing checking accounts, savings accounts, money market deposit accounts, CDs and IRAs. Deposit account terms vary with respect to the minimum balance required, the time period the funds must remain on deposit and service charge schedules. Interest rates paid on specific deposit types are determined based on (i) the interest rates offered by competitors, (ii) the anticipated amount and timing of funding needs, (iii) the availability and cost of alternative sources of funding, and (iv) anticipated future economic conditions and interest rates. Deposits are attractive sources of funding because of their stability and relative cost.
Total deposits were
$160.2 billion
at
December 31, 2016
, an increase of
$11.1 billion
compared to year-end
2015
. This increase was driven by acquisition activity and organic growth. Noninterest-bearing deposits totaled
$50.7 billion
at
December 31, 2016
, an increase of
$5.0 billion
from
December 31, 2015
. The majority of the increase in noninterest-bearing deposits was attributable to business and personal deposits, which grew $3.8 billion (12.7%) and $1.3 billion (11.0%), respectively.
Interest checking increased
$4.9 billion
and money market and savings increased
$4.4 billion
during
2016
, while time deposits decreased
$3.2 billion
during 2016.
For the year ended
December 31, 2016
, total deposits averaged
$157.5 billion
, an increase of
$19.0 billion
compared to
2015
, primarily due to the acquisitions previously discussed. The cost of interest-bearing deposits was
0.23%
for
2016
, compared to
0.24%
for
2015
.
The following table presents the composition of average deposits for the last five quarters:
|
Table 22
|
||||||||||||||||||||
|
Quarterly Composition of Average Deposits
|
||||||||||||||||||||
|
|
For the Three Months Ended
|
|||||||||||||||||||
|
|
12/31/2016
|
9/30/2016
|
6/30/2016
|
3/31/2016
|
12/31/2015
|
|||||||||||||||
|
|
(Dollars in millions)
|
|||||||||||||||||||
|
Noninterest-bearing deposits
|
$
|
51,421
|
|
$
|
50,559
|
|
$
|
48,801
|
|
$
|
46,203
|
|
$
|
45,824
|
|
|||||
|
Interest checking
|
28,634
|
|
27,754
|
|
28,376
|
|
25,604
|
|
24,157
|
|
||||||||||
|
Money market and savings
|
63,884
|
|
64,335
|
|
63,195
|
|
60,424
|
|
61,431
|
|
||||||||||
|
Time deposits
|
15,693
|
|
15,818
|
|
18,101
|
|
16,884
|
|
16,981
|
|
||||||||||
|
Foreign office deposits - interest-bearing
|
486
|
|
1,037
|
|
1,865
|
|
752
|
|
98
|
|
||||||||||
|
Total average deposits
|
$
|
160,118
|
|
|
$
|
159,503
|
|
|
$
|
160,338
|
|
|
$
|
149,867
|
|
|
$
|
148,491
|
|
|
Average deposits for the
fourth
quarter of
2016
were
$160.1 billion
,
up $615 million
compared to the prior quarter.
Average noninterest-bearing deposits
increased $862 million
, primarily due to increases in commercial balances with smaller increases in public funds and personal balances.
57
Interest checking
increased $880 million
, primarily due to increases in personal and commercial balances.
Money market and savings
decreased $451 million
primarily due to commercial balances partially offset by increased personal balances.
Average time deposits
decreased $125 million
as decreases in IRAs and personal balances were partially offset by higher commercial balances.
Average foreign office deposits
decreased $551 million
due to lower overall funding needs.
Noninterest-bearing deposits represented
32.1%
of total average deposits for the
fourth
quarter, compared to
31.7%
for the prior quarter and
30.9%
a year ago. The cost of interest-bearing deposits was
0.22%
for the
fourth
quarter,
down one basis point
compared to the prior quarter.
|
Table 23
|
|||
|
Scheduled Maturities of Time Deposits $100,000 and Greater
|
|||
|
|
|
||
|
|
December 31, 2016
|
||
|
|
(Dollars in millions)
|
||
|
Three months or less
|
$
|
1,545
|
|
|
Over three through six months
|
558
|
|
|
|
Over six through twelve months
|
1,160
|
|
|
|
Over twelve months
|
2,131
|
|
|
|
Total
|
$
|
5,394
|
|
Short-Term Borrowings
BB&T also uses various types of short-term borrowings to meet funding needs. While deposits remain the primary source for funding loan originations, management uses short-term borrowings as a supplementary funding source for loan growth and other balance sheet management purposes. Short-term borrowings were 1.2% of total funding on average in
2016
as compared to 1.6% in
2015
. The types of short-term borrowings that have been, or may be, used by the Company include Federal funds purchased, securities sold under repurchase agreements, master notes, commercial paper, short-term bank notes and short-term FHLB advances. Short-term borrowings at the end of
2016
were
$1.4 billion
, compared to
$3.6 billion
at year-end
2015
. Average short-term borrowings totaled
$2.6 billion
during
2016
compared to
$3.2 billion
last year. The decrease in the average balance of short-term borrowings during
2016
primarily reflects an increase in deposits as a funding source.
The following table summarizes certain information for the past three years with respect to short-term borrowings:
|
Table 24
|
||||||||||||
|
Short-Term Borrowings
|
||||||||||||
|
|
As Of / For The Year Ended December 31,
|
|||||||||||
|
|
2016
|
2015
|
2014
|
|||||||||
|
|
(Dollars in millions)
|
|||||||||||
|
Securities Sold Under Agreements to Repurchase:
|
|
|
|
|||||||||
|
Maximum outstanding at any month-end during the year
|
$
|
2,265
|
|
$
|
1,327
|
|
$
|
1,073
|
|
|||
|
Balance outstanding at end of year
|
970
|
|
617
|
|
317
|
|
||||||
|
Average outstanding during the year
|
1,600
|
|
901
|
|
526
|
|
||||||
|
Average interest rate during the year
|
0.37
|
%
|
0.23
|
%
|
0.20
|
%
|
||||||
|
Average interest rate at end of year
|
0.52
|
|
0.70
|
|
0.18
|
|
||||||
|
Federal Funds Purchased and Short-Term Borrowed Funds:
|
|
|
|
|
|
|||||||
|
Maximum outstanding at any month-end during the year
|
$
|
3,003
|
|
$
|
4,041
|
|
$
|
4,405
|
|
|||
|
Balance outstanding at end of year
|
436
|
|
2,976
|
|
3,400
|
|
||||||
|
Average outstanding during the year
|
954
|
|
2,320
|
|
2,895
|
|
||||||
|
Average interest rate during the year
|
0.30
|
%
|
0.11
|
%
|
0.12
|
%
|
||||||
|
Average interest rate at end of year
|
0.71
|
|
0.32
|
|
0.08
|
|
||||||
58
Long-Term Debt
Long-term debt provides funding and, to a lesser extent, regulatory capital. During
2016
, long-term debt represented 10.4% of average total funding compared to 11.8% during
2015
. At
December 31, 2016
, long-term debt totaled
$22.0 billion
, a decrease of
$1.8 billion
compared to year-end
2015
. The decrease in long-term debt reflects the maturity and repayment of $5.8 billion of long-term debt, partially offset by new issuances of $3.9 billion. The average cost of long-term debt was
2.13%
in
2016
, flat compared to
2015
. See the "Long-Term Debt" note in the "Notes to Consolidated Financial Statements" for further disclosure.
FHLB advances represented 18.7% of total outstanding long-term debt at
December 31, 2016
, compared to 24.1% at
December 31, 2015
. Subsequent to year end, BB&T terminated $2.9 billion of higher-cost FHLB advances, resulting in a loss on early extinguishment of $392 million. The remainder of long-term debt is primarily issuances of senior and subordinated notes by BB&T and Branch Bank.
Shareholders’ Equity
Shareholders’ equity totaled
$29.9 billion
at
December 31, 2016
, an increase of
$2.6 billion
, or
9.5%
, from year-end
2015
. Book value per common share at
December 31, 2016
was
$33.14
, compared to
$31.66
at
December 31, 2015
.
The change in shareholders' equity reflects net income of $2.4 billion, net common stock issuances of $1.3 billion (primarily due to National Penn) and a preferred stock issuance for net proceeds of $450 million, partially offset by $520 million of share repurchases and common and preferred dividends totaling $1.1 billion.
Tangible book value per common share, which is a non-GAAP measure, at
December 31, 2016
was
$20.18
compared to
$19.82
at
December 31, 2015
. Refer to the section titled "Capital" for a discussion of how BB&T calculates and uses these measures in the evaluation of the Company.
Risk Management
BB&T has a strong and consistent risk culture, based on established risk values, which promotes predictable and consistent performance within an environment of open communication and effective challenge. The strong culture influences all associates in the organization daily and helps them evaluate whether risks are acceptable or unacceptable while making decisions that balance quality, profitability and growth appropriately. BB&T’s effective risk management framework establishes an environment which enables it to achieve superior performance relative to peers, ensures that BB&T is viewed among the safest of banks and assures the operational freedom to act on opportunities.
BB&T ensures that there is an appropriate return for the amount of risk taken, and that the expected return is in line with its strategic objectives and business plan. Risk-taking activities are evaluated and prioritized to identify those that present attractive risk-adjusted returns while preserving asset value. BB&T only undertakes risks that are understood and can be managed effectively. By managing risk well, BB&T ensures sufficient capital is available to maintain and grow core business operations in a safe and sound manner.
Regardless of financial gain or loss to the Company, associates are held accountable if they do not follow the established risk management policies and procedures. Compensation decisions take into account an associate’s adherence to, and successful implementation of, BB&T’s risk values. The compensation structure supports the Company’s core values and sound risk management practices in an effort to promote judicious risk-taking behavior.
BB&T’s risk culture encourages transparency and open dialogue between all levels in the performance of organizational functions, such as the development, marketing and implementation of a product or service.
BB&T has established a risk management framework based on a "three lines of defense" model:
|
•
|
First Line of Defense
: Risk management begins with the BUs, the point at which risk is originated and where risks must be managed. Business unit managers in the first line identify, assess, control and report their group’s risk profile compared to its approved risk limits.
|
59
|
•
|
Second Line of Defense
: The RMO provides independent oversight and guidance of risk-taking across the enterprise. The RMO aggregates, integrates, and correlates risk information into a holistic picture of the corporation’s risk profile and concentrations. The RMO establishes policies and limits and reports sources and amounts of risk to Executive Management and the Board of Directors.
|
|
•
|
Third Line of Defense
: Audit Services (BB&T’s internal audit function) evaluates the design and effectiveness of the risk management framework and its results. Results are reported to Executive Management and the Board of Directors according to Audit Services Policy.
|
The following chart depicts the three lines of defense model:
|
Risk Committees
|
Board of Directors
|
Executive Management
|
||
|
|
|
|
||
|
1st Line of Defense
|
2nd Line of Defense
|
3rd Line of Defense
|
||
|
Business Units
|
Risk Functions
|
Audit Services
|
||
|
|
|
|
||
|
Chief Risk Officer
|
||||
The CRO leads the RMO, which designs, organizes and manages BB&T’s risk management framework. The RMO is responsible for ensuring effective risk management oversight, measurement, monitoring, reporting and consistency. The CRO has direct access to the Board of Directors and Executive Management. The CRO is responsible for identifying and communicating in a timely manner to the CEO and the Board of Directors meaningful risks and significant instances when the RMO’s assessment of risk differs from that of a BU, significant instances when a BU is not adhering to the risk governance framework, and BB&T’s risk profile in relation to its risk appetite on at least a quarterly basis. In the event that the CRO and CEO’s assessment of risk were to differ or if the CEO were to not adhere to the risk management framework, the CRO would have the responsibility to report such matters to the Board of Directors.
The Executive Management-led enterprise risk committees provide oversight of the first and second lines of defense and communicate risk appetite and values to the RMO. The CRO and the enterprise risk committees approve policies, set risk limits and tolerances and monitor results.
The RMC, CRMC, ORMC, CROC and the MRLCC are the enterprise risk committees and provide oversight of the risks as described in the common risk language. Executive Management members participate in all five committees.
The risk management framework is composed of specialized risk functions focused on specific types of risk. The MRLCC, CRMC, CROC and ORMC provide oversight of market, liquidity, capital, credit, compliance, and operational risk while RMC provides a fully integrated view of all material risks across the company. The RMC provides oversight of all risks and its purpose is to review BB&T’s aggregate risk exposure, evaluate risk appetite, and evaluate risks not reviewed by other risk committees.
The RMC is responsible for taking a broad view of risk, incorporating information from all risk functions. This combination of broad and specific focus provides the most effective framework for the management of risk. The RMC is chaired by the CRO and its membership includes all members of Executive Management, the General Auditor (ex officio) and senior leaders from Financial Management, the RMO and other areas.
The principal types of inherent risk include compliance, credit, liquidity, market, operational, reputation and strategic risks.
Compliance risk
Compliance risk is the risk to current or anticipated earnings or capital arising from violations of laws, rules or regulations, or from non-conformance with prescribed practices, internal policies and procedures or ethical standards. This risk exposes BB&T to fines, civil money penalties, payment of damages and the voiding of contracts. Compliance risk can result in diminished reputation, reduced franchise or enterprise value, limited business opportunities and lessened expansion potential.
60
Credit risk
Credit risk is the risk to current or anticipated earnings or capital arising from the default, inability or unwillingness of a borrower, obligor, or counterparty to meet the terms of any financial obligation with BB&T or otherwise perform as agreed. Credit risk exists in all activities where success depends on the performance of a borrower, obligor, or counterparty. Credit risk arises when BB&T funds are extended, committed, invested, or otherwise exposed through actual or implied contractual agreements, whether on or off balance sheet. Credit risk also occurs when the credit quality of an issuer whose securities or other instruments the bank holds deteriorates.
BB&T has established the following general practices to manage credit risk:
|
•
|
limiting the amount of credit that individual lenders may extend to a borrower;
|
|
•
|
establishing a process for credit approval accountability;
|
|
•
|
careful initial underwriting and analysis of borrower, transaction, market and collateral risks;
|
|
•
|
ongoing servicing and monitoring of individual loans and lending relationships;
|
|
•
|
continuous monitoring of the portfolio, market dynamics and the economy; and
|
|
•
|
periodically reevaluating the bank’s strategy and overall exposure as economic, market and other relevant conditions change.
|
The following discussion presents the principal types of lending conducted by BB&T and describes the underwriting procedures and overall risk management of BB&T’s lending function.
Underwriting Approach
The loan portfolio is a primary source of profitability and risk, therefore, proper loan underwriting is critical to BB&T’s long-term financial success. BB&T’s underwriting approach is designed to define acceptable combinations of specific risk-mitigating features that ensure credit relationships conform to BB&T’s risk philosophy. Provided below is a summary of the most significant underwriting criteria used to evaluate new loans and loan renewals:
|
•
|
Cash flow and debt service coverage
—cash flow adequacy is a necessary condition of creditworthiness, meaning that loans must either be clearly supported by a borrower’s cash flow or, if not, must be justified by secondary repayment sources.
|
|
•
|
Secondary sources of repayment
—alternative repayment funds are a significant risk-mitigating factor as long as they are liquid, can be easily accessed and provide adequate resources to supplement the primary cash flow source.
|
|
•
|
Value of any underlying collateral
—loans are generally secured by the asset being financed. Because an analysis of the primary and secondary sources of repayment is the most important factor, collateral, unless it is liquid, does not justify loans that cannot be serviced by the borrower’s normal cash flows.
|
|
•
|
Overall creditworthiness of the customer, taking into account the customer’s relationships, both past and current, with BB&T and other lenders
—BB&T’s success depends on building lasting and mutually beneficial relationships with clients, which involves assessing their financial position and background.
|
|
•
|
Level of equity invested in the transaction
—in general, borrowers are required to contribute or invest a portion of their own funds prior to any loan advances.
|
Commercial Loan and Lease Portfolio
The commercial loan and lease portfolio represents the largest category of the Company’s total loan portfolio. BB&T’s commercial lending program is generally targeted to serve small-to-middle market businesses with sales of $250 million or less. In addition, BB&T’s Corporate Banking Group provides lending solutions to large corporate clients. Traditionally, lending to small and mid-sized businesses has been among BB&T’s strongest market segments.
61
Commercial and small business loans are primarily originated through BB&T’s Community Bank. In accordance with the Company’s lending policy, each loan undergoes a detailed underwriting process, which incorporates BB&T’s underwriting approach, procedures and evaluations described above. Commercial loans are typically priced with an interest rate tied to market indices, such as the prime rate or LIBOR. Commercial loans are individually monitored and reviewed for any possible deterioration in the ability of the client to repay the loan. Approximately 87.6% of BB&T’s commercial loans are secured by real estate, business equipment, inventories and other types of collateral.
Direct Retail Loan Portfolio
The direct retail loan portfolio primarily consists of a wide variety of loan products offered through BB&T’s branch network. Various types of secured and unsecured loans are marketed to qualifying existing clients and to other creditworthy candidates in BB&T’s market area. The vast majority of direct retail loans are revolving home equity lines of credit secured by first or second liens on residential real estate. Direct retail loans are subject to the same rigorous lending policies and procedures as described above for commercial loans and are underwritten with note amounts and credit limits that ensure consistency with the Company’s risk philosophy.
Sales Finance Loan Portfolio
The sales finance category primarily includes secured indirect installment loans to consumers for the purchase of new and used automobiles, boats and recreational vehicles. Such loans are originated through approved franchised and independent dealers throughout the BB&T market area. These loans are relatively homogeneous and no single loan is individually significant in terms of its size and potential risk of loss. Sales finance loans are subject to the same rigorous lending policies and procedures as described above for commercial loans and are underwritten with note amounts and credit limits that ensure consistency with the Company’s risk philosophy. In addition to its normal underwriting due diligence, BB&T uses application systems and "scoring systems" to help underwrite and manage the credit risk in its sales finance portfolio.
Revolving Credit Loan Portfolio
The revolving credit portfolio consists of the outstanding balances on credit cards and BB&T’s checking account overdraft protection product, Constant Credit. BB&T markets credit cards to its existing banking client base and does not solicit cardholders through nationwide programs or other forms of mass marketing. Such balances are generally unsecured and actively managed.
Residential Mortgage Loan Portfolio
Branch Bank offers various types of fixed- and adjustable-rate loans for the purpose of constructing, purchasing or refinancing residential properties. BB&T primarily originates conforming mortgage loans and higher quality jumbo and construction-to-permanent loans for owner-occupied properties. Conforming loans are loans that are underwritten in accordance with the underwriting standards set forth by FNMA and FHLMC. They are generally collateralized by one-to-four-family residential real estate, typically have loan-to-collateral value ratios of 80% or less at origination, and are made to borrowers in good credit standing.
Risks associated with the mortgage lending function include interest rate risk, which is mitigated through the sale of a substantial portion of conforming fixed-rate loans in the secondary mortgage market, and an effective MSR hedging process. Borrower risk is lessened through rigorous underwriting procedures and mortgage insurance. The right to service the loans and receive servicing income is generally retained when conforming loans are sold. Management believes that the retention of mortgage servicing is a relationship driver in retail banking and a part of management’s strategy to establish profitable long-term customer relationships and offer high quality client service. BB&T also purchases residential mortgage loans from correspondent originators. The loans purchased from third-party originators are subject to the same underwriting and risk-management criteria as loans originated internally.
62
Other Lending Subsidiaries Portfolio
BB&T’s other lending subsidiaries portfolio consists of loans originated through BUs that provide specialty finance alternatives to consumers and businesses including: dealer-based financing of equipment for small businesses and consumers, commercial equipment leasing and finance, insurance premium finance, indirect nonprime automobile finance, and full-service commercial mortgage banking. BB&T offers these services to bank clients as well as nonbank clients within and outside BB&T’s primary geographic market area.
BB&T’s other lending subsidiaries adhere to the same overall underwriting approach as the commercial and consumer lending portfolio and also utilize automated credit scoring to assist with underwriting credit risk. The majority of these loans are relatively homogeneous and no single loan is individually significant in terms of its size and potential risk of loss. The majority of the loans are secured by real estate, automobiles, equipment or unearned insurance premiums. As of
December 31, 2016
, the other lending subsidiaries portfolio includes loans to nonprime borrowers of approximately $3.4 billion.
PCI
The PCI balance includes loans acquired with credit deterioration subsequent to origination as well as loans that were formerly covered by loss sharing agreements. Refer to the "Loans and ACL" note in the "Notes to Consolidated Financial Statements" in this report for additional information.
Liquidity risk
Liquidity risk is the risk to current or anticipated earnings or capital that BB&T will be unable to meet its obligations as they come due because of an inability to liquidate assets or obtain adequate funding (funding liquidity risk) or that it cannot easily unwind or offset specific exposures without significantly lowering market prices because of inadequate market depth or market disruptions (market liquidity risk).
Market risk
Market risk is the risk to current or anticipated earnings or capital arising from changes in the market value of portfolios, securities, or other financial instruments. Market risk results from changes in the level, volatility or correlations among financial market rates or prices, including interest rates, foreign exchange rates, equity prices, commodity prices or other relevant rates or prices.
Interest rate risk results from differences between the timing of rate changes and the timing of cash flows (re-pricing risk); from changing rate relationships among different yield curves affecting bank activities (basis risk); from changing rate relationships across the spectrum of maturities (yield curve risk); and from interest-related options embedded in bank products (options risk).
For additional information concerning BB&T’s management of market risk, see the "Market Risk Management" section of "Management’s Discussion and Analysis of Financial Condition and Results of Operations."
Operational risk
Operational risk is the risk to current or anticipated earnings or capital arising from inadequate or failed internal processes, people and systems or from external events. This definition includes legal risk, which is the risk of loss arising from defective transactions, litigation or claims made, or the failure to adequately protect company-owned assets.
Cybersecurity
In recent years, cybersecurity has gained prominence within the financial services industry due to increases in the quantity and sophistication of cyber attacks, which include significant distributed denial-of-service and credential validation attacks, malicious code and viruses and attempts to breach the security of systems, which, in certain instances, have resulted in unauthorized access to customer account data.
63
BB&T has a number of complex information systems used for a variety of functions by customers, employees and vendors. In addition, third parties with which BB&T does business or that facilitate business activities (e.g., vendors, exchanges, clearing houses, central depositories and financial intermediaries) could also be sources of cybersecurity risk to BB&T, including with respect to breakdowns or failures of their systems, misconduct by the employees of such parties, or cyber attacks which could affect their ability to deliver a product or service to BB&T.
As a FHC, BB&T must adhere to the security requirements and expectations of the applicable regulatory agencies, which include requirements related to data privacy, systems availability and business continuity planning, among others. The regulatory agencies have established guidelines for the responsibilities of the Board of Directors and senior management, which include establishing policy, appointing and training personnel, implementing review and testing functions and ensuring an appropriate frequency of updates.
The primary responsibility for cybersecurity at BB&T lies with the Risk Committee of the Board of Directors, which has delegated the day-to-day operations to management via the RMC, ORMC and EITSC. The EITSC serves as the primary team responsible for monitoring and reporting on cybersecurity risks. The EITSC, which is led by the Chief Information Officer, provides a bi-monthly report on cybersecurity to executive management and provides other periodic cybersecurity reporting to the RMC and the ORMC. In addition, the Chief Information Officer and Chief Information Security Officer provide a quarterly Cyber Security Update to the Risk Committee or the full Board of Directors on a rotating basis. Annually, the EITSC provides a formal IT risk assessment and Information Security reports to the Risk Committee.
As a complement to the overall cybersecurity infrastructure, BB&T utilizes a number of internal training methods, both formally through mandatory courses and informally through written communications and other updates. Internal policies and procedures have been implemented to encourage the reporting of potential phishing attacks or other security risks. BB&T also uses third party services as part of its cybersecurity framework, and any such third parties are required to comply with BB&T’s policies regarding information security and confidentiality. BB&T also uses third party groups to assess and supplement the Company’s cybersecurity needs.
These cyber attacks have not, to date, resulted in any material disruption to BB&T’s operations or harm to its customers and have not had a material adverse effect on BB&T’s results of operations; however, there can be no assurance that a sophisticated cyber attack can be detected or thwarted.
Model Risk Management
Model risk is the risk to current or anticipated earnings or capital from decisions based on incorrect or misused model outputs. BB&T uses models for many purposes, including the valuation of financial positions and the measurement of risk. Valuation models are used to value certain financial instruments for which quoted prices may not be readily available. Valuation models are also used as inputs for VaR, regulatory capital, stress testing and the ACL. Models are owned by the applicable BUs, who are responsible for the development, implementation and use of their models. Oversight of these functions is performed by the MRMD, which is a component of the RMO. Once models have been approved, model owners are responsible for the maintenance of an appropriate operating environment and must monitor and evaluate the performance of the models on a recurring basis. Models are updated in response to changes in portfolio composition, industry and economic conditions, technological capabilities and other developments.
The MRMD utilizes internal validation analysts and managers with skill sets in predictive modeling to perform detailed reviews of model development, implementation and conceptual soundness. On certain occasions, the MRMD will also engage external parties to assist with validation efforts. The MRMD maintains documented quality assurance procedures that are used to confirm that validation analysts have completed the necessary field work in an auditable and complete fashion. The MRMD tracks issues that have been identified by validation analysts and engages with model owners to ensure their timely remediation. The MRMD presents model limitations and risks to management and the Board of Directors via model validation reports and regular meetings with the Model Risk Committee and the ORMC.
Reputation risk
Reputation risk is the risk to current or anticipated earnings, capital, enterprise value, the BB&T brand, and public confidence arising from negative publicity or public opinion, whether real or perceived, regarding BB&T’s business practices, products, services, transactions, or other activities undertaken by BB&T, its representatives, or its partners. A negative reputation may impair BB&T’s relationship with clients, associates, communities or shareholders, and it is often a residual risk that arises when other risks are not managed properly.
64
Strategic risk
Strategic risk is the risk to current or anticipated earnings, capital, enterprise value and the achievement of BB&T’s vision, mission, purpose and business objectives consistent with its values that arises from BB&T’s business strategy or potentially adverse business decisions, improper or ineffective implementation of business decisions or lack of responsiveness to changes in the banking industry and operating environment. Strategic risk is a function of BB&T’s strategic goals, business strategies, resources and quality of implementation. The responsibility for managing this risk rests with the Board of Directors, Executive Management and the Senior Leadership Team.
Market Risk Management
The effective management of market risk is essential to achieving BB&T’s strategic financial objectives. As a financial institution, BB&T’s most significant market risk exposure is interest rate risk in its balance sheet; however, market risk also includes product liquidity risk, price risk and volatility risk in BB&T’s BUs. The primary objectives of market risk management are to minimize any adverse effect that changes in market risk factors may have on net interest income, net income and capital and to offset the risk of price changes for certain assets recorded at fair value. At BB&T, market risk management also includes the enterprise-wide IPV function.
Interest Rate Market Risk (Other than Trading)
BB&T actively manages market risk associated with asset and liability portfolios with a focus on the strategic pricing of asset and liability accounts and management of appropriate maturity mixes of assets and liabilities. The goal of these activities is the development of appropriate maturity and repricing opportunities in BB&T’s portfolios of assets and liabilities that will produce reasonably consistent net interest income during periods of changing interest rates. These portfolios are analyzed for proper fixed-rate and variable-rate mixes under various interest rate scenarios.
The asset/liability management process is designed to achieve relatively stable NIM and assure liquidity by coordinating the volumes, maturities or repricing opportunities of earning assets, deposits and borrowed funds. Among other things, this process gives consideration to prepayment trends related to securities, loans and leases and certain deposits that have no stated maturity. Prepayment assumptions are developed using a combination of market data and internal historical prepayment experience for residential mortgage-related loans and securities, and internal historical prepayment experience for client deposits with no stated maturity and loans that are not residential mortgage related. These assumptions are subject to monthly review and adjustment, and are modified as deemed necessary to reflect changes in interest rates relative to the reference rate of the underlying assets or liabilities. On a monthly basis, BB&T evaluates the accuracy of its Simulation model, which includes an evaluation of its prepayment assumptions, to ensure that all significant assumptions inherent in the model appropriately reflect changes in the interest rate environment and related trends in prepayment activity. It is the responsibility of the MRLCC to determine and achieve the most appropriate volume and mix of earning assets and interest-bearing liabilities, as well as to ensure an adequate level of liquidity and capital, within the context of corporate performance goals. The MRLCC also sets policy guidelines and establishes long-term strategies with respect to interest rate risk exposure and liquidity. The MRLCC meets regularly to review BB&T’s interest rate risk and liquidity positions in relation to present and prospective market and business conditions, and adopts funding and balance sheet management strategies that are intended to ensure that the potential impacts on earnings and liquidity as a result of fluctuations in interest rates are within acceptable tolerance guidelines.
BB&T uses derivatives primarily to manage economic risk related to securities, commercial loans, MSRs and mortgage banking operations, long-term debt and other funding sources. BB&T also uses derivatives to facilitate transactions on behalf of its clients. As of
December 31, 2016
, BB&T had derivative financial instruments outstanding with notional amounts totaling
$75.3 billion
, with a net fair value loss of
$181 million
. See the "Derivative Financial Instruments" note in the "Notes to Consolidated Financial Statements" for additional disclosures.
The majority of BB&T’s assets and liabilities are monetary in nature and, therefore, differ greatly from most commercial and industrial companies that have significant investments in fixed assets or inventories. Fluctuations in interest rates and actions of the FRB to regulate the availability and cost of credit have a greater effect on a financial institution’s profitability than do the effects of higher costs for goods and services. Through its balance sheet management function, which is monitored by the MRLCC, management believes that BB&T is positioned to respond to changing needs for liquidity, changes in interest rates and inflationary trends.
65
Management uses the Simulation to measure the sensitivity of projected earnings to changes in interest rates. The Simulation projects net interest income and interest rate risk for a rolling two-year period of time. The Simulation takes into account the current contractual agreements that BB&T has made with its customers on deposits, borrowings, loans, investments and commitments to enter into those transactions. Furthermore, the Simulation considers the impact of expected customer behavior. Management monitors BB&T’s interest sensitivity by means of a model that incorporates the current volumes, average rates earned and paid, and scheduled maturities and payments of asset and liability portfolios, together with multiple scenarios that include projected prepayments, repricing opportunities and anticipated volume growth. Using this information, the model projects earnings based on projected portfolio balances under multiple interest rate scenarios. This level of detail is needed to simulate the effect that changes in interest rates and portfolio balances may have on the earnings of BB&T. This method is subject to the accuracy of the assumptions that underlie the process, but management believes that it provides a better illustration of the sensitivity of earnings to changes in interest rates than other analyses such as static or dynamic gap. In addition to the Simulation, BB&T uses EVE analysis to focus on projected changes in assets and liabilities given potential changes in interest rates. This measure also allows BB&T to analyze interest rate risk that falls outside the analysis window contained in the Simulation. The EVE model is a discounted cash flow of the portfolio of assets, liabilities, and derivative instruments. The difference in the present value of assets minus the present value of liabilities is defined as the economic value of equity.
The asset/liability management process requires a number of key assumptions. Management determines the most likely outlook for the economy and interest rates by analyzing external factors, including published economic projections and data, the effects of likely monetary and fiscal policies, as well as any enacted or prospective regulatory changes. BB&T’s current and prospective liquidity position, current balance sheet volumes and projected growth, accessibility of funds for short-term needs and capital maintenance are also considered. This data is combined with various interest rate scenarios to provide management with the information necessary to analyze interest sensitivity and to aid in the development of strategies to reach performance goals.
The following table shows the effect that the indicated changes in interest rates would have on net interest income as projected for the next twelve months assuming a gradual change in interest rates as described below. Key assumptions in the preparation of the table include prepayment speeds of mortgage-related and other assets, cash flows and maturities of derivative financial instruments, loan volumes and pricing, deposit sensitivity, customer preferences and capital plans. The resulting change in net interest income reflects the level of interest rate sensitivity that income has in relation to the investment, loan and deposit portfolios.
|
Table 25
|
|||||||||||||||
|
Interest Sensitivity Simulation Analysis
|
|||||||||||||||
|
Interest Rate Scenario
|
Annualized Hypothetical Percentage Change in Net Interest Income
|
||||||||||||||
|
Prime Rate
|
|||||||||||||||
|
Linear Change in Prime Rate
|
December 31,
|
December 31,
|
|||||||||||||
|
2016
|
2015
|
2016
|
2015
|
||||||||||||
|
Up 200
|
bps
|
5.75
|
%
|
5.50
|
%
|
3.13
|
%
|
2.23
|
%
|
||||||
|
Up 100
|
|
4.75
|
|
4.50
|
|
2.14
|
|
1.58
|
|
||||||
|
No Change
|
|
3.75
|
|
3.50
|
|
—
|
|
—
|
|
||||||
|
Down 25
|
|
3.50
|
|
3.25
|
|
(0.93
|
)
|
(0.69
|
)
|
||||||
The MRLCC has established parameters related to interest sensitivity that prescribe a maximum negative impact on net interest income under different interest rate scenarios. In the event the results of the Simulation model fall outside the established parameters, management will make recommendations to the MRLCC on the most appropriate response given the current economic forecast. The following parameters and interest rate scenarios are considered BB&T’s primary measures of interest rate risk:
|
•
|
Maximum negative impact on net interest income of 2% for the next 12 months assuming a 25 basis point change in interest rates each month for four months followed by a flat interest rate scenario for the remaining eight month period.
|
|
•
|
Maximum negative impact on net interest income of 4% for the next 12 months assuming a 25 basis point change in interest rates each month for eight months followed by a flat interest rate scenario for the remaining four month period.
|
66
If a parallel rate change of 200 basis points cannot be modeled due to a low level of rates, a proportional limit applies, and the maximum negative impact on net interest income is adjusted on a proportional basis. Regardless of the proportional limit, the negative risk exposure limit will be the greater of the 4% or the proportional limit.
Management has also established a maximum negative impact on net interest income of 4% for an immediate 100 basis points parallel change in rates and 8% for an immediate 200 basis points parallel change in rates. As noted above, management currently only models a negative 25 basis point decline, and the maximum negative impact on net interest income is adjusted on a proportional basis. Regardless of the proportional limit, the negative risk exposure limit will be the greater of 4% or the proportional limit. These "interest rate shock" limits are designed to create an outer band of acceptable risk based upon a significant and immediate change in rates.
Management also considers potential negative interest rate scenarios, which implies that a depositor would pay a premium for a financial institution to hold funds on deposit. In such a scenario, some depositors may choose to withdraw their deposits in lieu of paying an interest rate to BB&T to hold such deposits. As a result, management considers potential pricing and structure changes, such as the movement to a primarily fee-based deposit system. Negative rates would also diminish the spreads on loans and securities. As a result, management considers interest rate floors or rate index floors in loans to mitigate this risk. BB&T purchases both fixed and variable rate securities. The fixed rate securities would be beneficial in a negative interest rate environment.
Management must also consider how the balance sheet and interest rate risk position could be impacted by changes in balance sheet mix. Liquidity in the banking industry has been very strong during the current economic cycle. Much of this liquidity increase has been due to a significant increase in noninterest-bearing demand deposits. Consistent with the industry, Branch Bank has seen a significant increase in this funding source. The behavior of these deposits is one of the most important assumptions used in determining the interest rate risk position of BB&T. A loss of these deposits in the future would reduce the asset sensitivity of BB&T’s balance sheet as the Company increases interest-bearing funds to offset the loss of this advantageous funding source.
Beta represents the correlation between overall market interest rates and the rates paid by BB&T on interest-bearing deposits. BB&T applies an average beta of approximately 60% to its non-maturity interest bearing deposit accounts for determining its interest rate sensitivity. Non-maturity interest bearing deposit accounts include interest checking accounts, savings accounts, and money market accounts that do not have a contractual maturity. Due to current market conditions the actual deposit beta on non-maturity interest bearing deposits has been less than 15%; however, BB&T expects the beta to increase as rates continue to rise. BB&T regularly conducts sensitivity on other key variables to determine the impact they could have on the interest rate risk position. This allows BB&T to evaluate the likely impact on its balance sheet management strategies due to a more extreme variation in a key assumption than expected.
The following table shows the effect that the loss of demand deposits and an associated increase in managed rate deposits would have on BB&T’s interest-rate sensitivity position. For purposes of this analysis, BB&T modeled the incremental beta for the replacement of the lost demand deposits at 100%.
|
Table 26
|
||||||||||||
|
Deposit Mix Sensitivity Analysis
|
||||||||||||
|
Increase in Rates
|
Base Scenario at December 31, 2016 (1)
|
Results Assuming a Decrease in Noninterest-Bearing Demand Deposits
|
||||||||||
|
$1 Billion
|
$5 Billion
|
|||||||||||
|
Up 200
|
bps
|
3.13
|
%
|
2.92
|
%
|
2.07
|
%
|
|||||
|
Up 100
|
|
2.14
|
|
2.01
|
|
1.49
|
|
|||||
__________________
|
(1)
|
The base scenario is equal to the annualized hypothetical percentage change in net interest income at
December 31, 2016
as presented in the preceding table.
|
If rates increased 200 basis points, BB&T could absorb the loss of $14.8 billion, or 29.3%, of noninterest-bearing demand deposits and replace them with managed rate deposits with a beta of 100% before becoming neutral to interest rate changes.
67
The following table shows the effect that the indicated changes in interest rates would have on EVE. Key assumptions in the preparation of the table include prepayment speeds of mortgage-related and other assets, cash flows and maturities of derivative financial instruments, loan volumes and pricing and deposit sensitivity.
|
Table 27
|
||||||||||||||||
|
EVE Simulation Analysis
|
||||||||||||||||
|
|
|
EVE/Assets
|
Hypothetical Percentage Change in EVE
|
|||||||||||||
|
December 31,
|
December 31,
|
|||||||||||||||
|
Change in Rates
|
2016
|
2015
|
2016
|
2015
|
||||||||||||
|
Up 200
|
bps
|
11.6
|
%
|
10.9
|
%
|
1.3
|
%
|
0.6
|
%
|
|||||||
|
Up 100
|
|
11.7
|
|
11.0
|
|
1.8
|
|
1.6
|
|
|||||||
|
No Change
|
|
11.5
|
|
10.8
|
|
—
|
|
—
|
|
|||||||
|
Down 25
|
|
11.3
|
|
10.7
|
|
(1.1
|
)
|
(1.1
|
)
|
|||||||
Market Risk from Trading Activities
BB&T also manages market risk from trading activities which consists of acting as a financial intermediary to provide its customers access to derivatives, foreign exchange and securities markets. Trading market risk is managed through the use of statistical and non-statistical risk measures and limits. BB&T utilizes a historical VaR methodology to measure and aggregate risks across its covered trading BUs. This methodology uses two years of historical data to estimate economic outcomes for a one-day time horizon at a 99% confidence level. The average 99% one-day VaR and the maximum daily VaR for the years ended
December 31, 2016
and
2015
were each less than $1 million. Market risk disclosures under Basel II.5 are available in the Additional Disclosures section of the Investor Relations site on
BBT.com
.
Liquidity
Liquidity represents the continuing ability to meet funding needs, including deposit withdrawals, timely repayment of borrowings and other liabilities, and funding of loan commitments. In addition to the level of liquid assets, such as cash, cash equivalents and AFS securities, many other factors affect the ability to meet liquidity needs, including access to a variety of funding sources, maintaining borrowing capacity in national money markets, growing core deposits, the repayment of loans and the ability to securitize or package loans for sale.
BB&T monitors the ability to meet customer demand for funds under both normal and stressed market conditions. In considering its liquidity position, management evaluates BB&T’s funding mix based on client core funding, client rate-sensitive funding and national markets funding. In addition, management also evaluates exposure to rate-sensitive funding sources that mature in one year or less. Management also measures liquidity needs against 30 days of stressed cash outflows for Branch Bank and BB&T. To ensure a strong liquidity position, management maintains a liquid asset buffer of cash on hand and highly liquid unpledged securities. BB&T follows the FRB's enhanced prudential standards for purposes of determining the liquid asset buffer. BB&T’s policy is to use the greater of 5% or a range of projected net cash outflows over a 30 day period. As of
December 31, 2016
and
2015
, BB&T’s liquid asset buffer was 12.6% and 13.5%, respectively, of total assets.
BB&T is considered to be a "modified LCR" holding company. BB&T would be subject to full LCR requirements if its assets were to increase above $250 billion or if it were to be considered internationally active. BB&T produces LCR calculations to effectively manage the position of High-Quality Liquid Assets and the balance sheet deposit mix to optimize BB&T's liquidity position. BB&T's LCR was approximately 121% at
December 31, 2016
, compared to the regulatory minimum for such entities of 90%, which puts BB&T in full compliance with the rule. The regulatory minimum increased to 100% on January 1, 2017. The LCR can experience volatility due to issues like maturing debt rolling into the 30 day measurement period, or client inflows and outflows. The daily change in BB&T’s LCR averaged less than 2% during 2016 with a maximum change of approximately 12%.
As noted above, BB&T is currently subject to the modified LCR requirement. BB&T routinely evaluates the impact of becoming subject to the full LCR requirement. This includes an evaluation of the changes to the balance sheet and investment strategy that would be necessary to comply with the requirement. Management does not currently expect the required changes to have a material impact on BB&T’s financial condition or results of operations.
68
On April 27, 2016, the OCC, the FRB and the FDIC released a notice of proposed rulemaking for the US version of the net stable funding ratio. Under the proposal, BB&T will be a "modified NSFR" holding company. BB&T would be subject to full NSFR requirements if it has $250 billion or more in assets or $10 billion or more in total on-balance sheet foreign exposure. BB&T is evaluating the information in the release but does not currently expect a material impact on its results of operations or financial condition. The proposed rule would become effective January 1, 2018.
Parent Company
The purpose of the Parent Company is to serve as the primary source of capital for the operating subsidiaries, with assets primarily consisting of cash on deposit with Branch Bank, equity investments in subsidiaries, advances to subsidiaries, accounts receivable from subsidiaries, and other miscellaneous assets. The principal obligations of the Parent Company are payments on long-term debt. The main sources of funds for the Parent Company are dividends and management fees from subsidiaries, repayments of advances to subsidiaries, and proceeds from the issuance of equity and long-term debt. The primary uses of funds by the Parent Company are for investments in subsidiaries, advances to subsidiaries, dividend payments to common and preferred shareholders, retirement of common stock and payments on long-term debt.
The primary source of funds used for Parent Company cash requirements was dividends received from subsidiaries. See the "Parent Company Financial Statements" note for additional information regarding dividends from subsidiaries and debt transactions.
Liquidity at the Parent Company is more susceptible to market disruptions. BB&T prudently manages cash levels at the Parent Company to cover a minimum of one year of projected contractual cash outflows which includes unfunded external commitments, debt service, preferred dividends and scheduled debt maturities without the benefit of any new cash infusions. Generally, BB&T maintains a significant buffer above the projected one year of contractual cash outflows. In determining the buffer, BB&T considers cash requirements for common and preferred dividends, unfunded commitments to affiliates, being a source of strength to its banking subsidiaries and being able to withstand sustained market disruptions that could limit access to the capital markets. As of
December 31, 2016
and
2015
, the Parent Company had 25 months and 36 months, respectively, of cash on hand to satisfy projected contractual cash outflows and 19 and 24 months, respectively, taking into account common stock dividends.
Branch Bank
BB&T carefully manages liquidity risk at Branch Bank. Branch Bank’s primary source of funding is customer deposits. Continued access to customer deposits is highly dependent on the confidence the public has in the stability of the bank and its ability to return funds to the client when requested. BB&T maintains a strong focus on its reputation in the market to ensure continued access to client deposits. BB&T integrates its risk appetite into its overall risk management framework to ensure the bank does not exceed its risk tolerance through its lending and other risk taking functions and thus risk becoming undercapitalized. BB&T believes that sufficient capital is paramount to maintaining the confidence of its depositors and other funds providers. BB&T has extensive capital management processes in place to ensure it maintains sufficient capital to absorb losses and maintain a highly capitalized position that will instill confidence in the bank and allow continued access to deposits and other funding sources. Branch Bank monitors many liquidity metrics at the bank including funding concentrations, diversification, maturity distribution, contingent funding needs and ability to meet liquidity requirements under times of stress.
Branch Bank has several major sources of funding to meet its liquidity requirements, including access to capital markets through issuance of senior or subordinated bank notes and institutional CDs, access to the FHLB system, dealer repurchase agreements and repurchase agreements with commercial clients, access to the overnight and term Federal funds markets, use of a Cayman branch facility, access to retail brokered CDs and a borrower in custody program with the FRB for the discount window. As of
December 31, 2016
, BB&T has approximately $77.3 billion of secured borrowing capacity, which represents approximately 11.7 times the amount of one year wholesale funding maturities.
The ability to raise funding at competitive prices is affected by the rating agencies’ views of the Parent Company’s and Branch Bank’s credit quality, liquidity, capital and earnings. Management meets with the rating agencies on a regular basis to discuss current outlooks. The ratings for BB&T and Branch Bank by the major rating agencies are detailed in the table below:
69
|
Table 28
|
|||||||
|
Credit Ratings of BB&T Corporation and Branch Bank
|
|||||||
|
December 31, 2016
|
|||||||
|
|
|
|
|
|
|
|
|
|
|
S&P
|
|
Moody's
|
|
Fitch
|
|
DBRS
|
|
BB&T Corporation:
|
|
|
|
|
|
|
|
|
Commercial Paper
|
A-2
|
|
N/A
|
|
F1
|
|
R-1(low)
|
|
Issuer
|
A-
|
|
A2
|
|
A+
|
|
A(high)
|
|
LT/Senior debt
|
A-
|
|
A2
|
|
A+
|
|
A(high)
|
|
Subordinated debt
|
BBB+
|
|
A2
|
|
A
|
|
A
|
|
|
|
|
|
|
|
|
|
|
Branch Bank:
|
|
|
|
|
|
|
|
|
Bank financial strength
|
N/A
|
|
N/A
|
|
a+
|
|
N/A
|
|
Long term deposits
|
N/A
|
|
Aa1
|
|
AA-
|
|
AA(low)
|
|
LT/Senior unsecured bank notes
|
A
|
|
A1
|
|
A+
|
|
AA(low)
|
|
Long term issuer
|
A
|
|
A1
|
|
A+
|
|
AA(low)
|
|
Other long term senior obligations
|
A
|
|
N/A
|
|
A+
|
|
AA(low)
|
|
Other short term senior obligations
|
A-1
|
|
N/A
|
|
F1
|
|
R-1(middle)
|
|
Short term bank notes
|
A-1
|
|
P-1
|
|
F1
|
|
R-1(middle)
|
|
Short term deposits
|
N/A
|
|
P-1
|
|
F1+
|
|
R-1(middle)
|
|
Subordinated bank notes
|
A-
|
|
A2
|
|
A
|
|
A(high)
|
|
|
|
|
|
|
|
|
|
|
Ratings Outlook:
|
|
|
|
|
|
|
|
|
Credit Trend
|
Stable
|
|
Stable
|
|
Stable
|
|
Stable
|
BB&T and Branch Bank have Contingency Funding Plans designed to ensure that liquidity sources are sufficient to meet their ongoing obligations and commitments, particularly in the event of a liquidity contraction. These plans are designed to examine and quantify the organization’s liquidity under various "stress" scenarios. Additionally, the plans provide a framework for management and other critical personnel to follow in the event of a liquidity contraction or in anticipation of such an event. The plans address authority for activation and decision making, liquidity options and the responsibilities of key departments in the event of a liquidity contraction. The liquidity options available to management could include seeking secured funding, asset sales, and under the most extreme scenarios, curtailing new loan originations.
Management believes current sources of liquidity are adequate to meet BB&T’s current requirements and plans for continued growth. See the "Premises and Equipment," "Long-Term Debt" and "Commitments and Contingencies" notes in the "Notes to Consolidated Financial Statements" for additional information regarding outstanding balances of sources of liquidity and contractual commitments and obligations.
Contractual Obligations, Commitments, Contingent Liabilities, Off-Balance Sheet Arrangements and Related Party Transactions
The following table presents, as of
December 31, 2016
, BB&T’s contractual obligations by payment date. The payment amounts represent those amounts contractually due to the recipient. The table excludes liabilities recorded where management cannot reasonably estimate the timing of any payments that may be required in connection with these liabilities. Further discussion of the nature of each obligation is included in the "Commitments and Contingencies" note in the "Notes to Consolidated Financial Statements."
70
|
Table 29
|
||||||||||||||||||||
|
Contractual Obligations and Other Commitments
|
||||||||||||||||||||
|
December 31, 2016
|
||||||||||||||||||||
|
|
Total
|
Less than 1 Year
|
1 to 3 Years
|
3 to 5 Years
|
After 5 Years
|
|||||||||||||||
|
(Dollars in millions)
|
||||||||||||||||||||
|
Long-term debt and capital leases
|
$
|
21,728
|
|
$
|
3,696
|
|
$
|
6,208
|
|
$
|
7,238
|
|
$
|
4,586
|
|
|||||
|
Operating leases
|
1,619
|
|
263
|
|
449
|
|
333
|
|
574
|
|
||||||||||
|
Commitments to fund affordable housing investments
|
738
|
|
470
|
|
233
|
|
15
|
|
20
|
|
||||||||||
|
Private equity and other investments commitments (1)
|
200
|
|
49
|
|
98
|
|
41
|
|
12
|
|
||||||||||
|
Time deposits
|
14,391
|
|
7,929
|
|
5,028
|
|
1,411
|
|
23
|
|
||||||||||
|
Contractual interest payments (2)
|
3,401
|
|
725
|
|
1,260
|
|
745
|
|
671
|
|
||||||||||
|
Purchase obligations (3)
|
968
|
|
522
|
|
356
|
|
58
|
|
32
|
|
||||||||||
|
Nonqualified benefit plan obligations (4)
|
1,204
|
|
15
|
|
33
|
|
38
|
|
1,118
|
|
||||||||||
|
Total contractual cash obligations
|
$
|
44,249
|
|
$
|
13,669
|
|
$
|
13,665
|
|
$
|
9,879
|
|
$
|
7,036
|
|
|||||
__________________
|
(1)
|
Based on estimated payment dates.
|
|
(2)
|
Includes accrued interest, future contractual interest obligations and the impact of hedges in a loss position. Other derivatives are excluded. Variable rate payments are based upon the rate in effect at
December 31, 2016
.
|
|
(3)
|
Represents obligations to purchase goods or services that are enforceable and legally binding. Many of the purchase obligations have terms that are not fixed and determinable and are included in the table above based upon the estimated timing and amount of payment. In addition, certain of the purchase agreements contain clauses that would allow BB&T to cancel the agreement with specified notice; however, that impact is not included in the table above.
|
|
(4)
|
Although technically unfunded plans, Rabbi Trusts and insurance policies on the lives of certain of the covered employees are available to finance future benefit plan payments.
|
BB&T’s commitments include investments in affordable housing and historic building rehabilitation projects throughout its market area and private equity funds. Refer to the "Summary of Significant Accounting Policies" note and the "Commitments and Contingencies" note in the "Notes to Consolidated Financial Statements" for further discussion of these commitments.
In addition, BB&T enters into derivative contracts to manage various financial risks. A derivative is a financial instrument that derives its cash flows, and therefore its value, by reference to an underlying instrument, index or referenced interest rate. Derivative contracts are carried at fair value on the Consolidated Balance Sheets with the fair value representing the net present value of expected future cash receipts or payments based on market interest rates as of the balance sheet date. Derivative contracts are written in amounts referred to as notional amounts, which only provide the basis for calculating payments between counterparties and are not a measure of financial risk. Therefore, the derivative liabilities recorded on the balance sheet as of
December 31, 2016
do not represent the amounts that may ultimately be paid under these contracts. Further discussion of derivative instruments is included in the "Summary of Significant Accounting Policies" note and the "Derivative Financial Instruments" note in the "Notes to Consolidated Financial Statements."
In the ordinary course of business, BB&T indemnifies its officers and directors to the fullest extent permitted by law against liabilities arising from litigation. BB&T also issues standard representation and warranties in underwriting agreements, merger and acquisition agreements, loan sales, brokerage activities and other similar arrangements. Counterparties in many of these indemnifications provide similar indemnifications to BB&T. Although these agreements often do not specify limitations, BB&T does not believe that any payments related to these guarantees would materially change the financial condition or results of operations of BB&T.
BB&T holds public funds in certain states that do not require 100% collateralization on public fund bank deposits. In these states, should the failure of another public fund depository institution result in a loss for the public entity, the resulting shortfall would have to be absorbed on a pro-rata basis by the remaining financial institutions holding public funds in that state.
As a member of the FHLB, BB&T is required to maintain a minimum investment in capital stock. The board of directors of the FHLB can increase the minimum investment requirements in the event it has concluded that additional capital is required to allow it to meet its own regulatory capital requirements. Any increase in the minimum investment requirements outside of specified ranges requires the approval of the Federal Housing Finance Agency. Because the extent of any obligation to increase BB&T’s investment in the FHLB depends entirely upon the occurrence of a future event, potential future payments to the FHLB are not determinable.
71
In the normal course of business, BB&T is also a party to financial instruments to meet the financing needs of clients and to mitigate exposure to interest rate risk. Such financial instruments include commitments to extend credit and certain contractual agreements, including standby letters of credit and financial guarantee arrangements. Further discussion of BB&T’s commitments is included in the "Commitments and Contingencies" note and the "Fair Value Disclosures" note in the "Notes to Consolidated Financial Statements."
|
Table 30
|
||||||||||||
|
Mortgage Indemnification, Recourse and Repurchase Reserves Activity (1)
|
||||||||||||
|
|
Year Ended December 31,
|
|||||||||||
|
|
2016
|
2015
|
2014
|
|||||||||
|
|
(Dollars in millions)
|
|||||||||||
|
Balance, at beginning of period
|
$
|
79
|
|
$
|
94
|
|
$
|
72
|
|
|||
|
Payments
|
(2
|
)
|
(5
|
)
|
(23
|
)
|
||||||
|
Expense
|
(37
|
)
|
(15
|
)
|
45
|
|
||||||
|
Acquisitions
|
—
|
|
5
|
|
—
|
|
||||||
|
Balance, at end of period
|
$
|
40
|
|
$
|
79
|
|
$
|
94
|
|
|||
__________________
|
(1)
|
Excludes the FHA-insured mortgage loan reserve of $85 million established during 2014 and settled in 2016.
|
Related Party Transactions
The Company may transact with its officers, directors and other related parties in the ordinary course of business. These transactions include substantially the same terms as comparable third-party arrangements and are in compliance with applicable banking regulations.
Capital
The maintenance of appropriate levels of capital is a management priority and is monitored on a regular basis. BB&T’s principal goals related to the maintenance of capital are to provide adequate capital to support BB&T’s risk profile consistent with the Board-approved risk appetite, provide financial flexibility to support future growth and client needs, comply with relevant laws, regulations, and supervisory guidance, achieve optimal credit ratings for BB&T and its subsidiaries and provide a competitive return to shareholders.
Management regularly monitors the capital position of BB&T on both a consolidated and bank level basis. In this regard, management’s overriding policy is to maintain capital at levels that are in excess of the capital targets, which are above the regulatory "well capitalized" levels. Management has implemented stressed capital ratio minimum targets to evaluate whether capital ratios calculated with planned capital actions are likely to remain above minimums specified by the FRB for the annual CCAR. Breaches of stressed minimum targets prompt a review of the planned capital actions included in BB&T’s capital plan.
|
Table 31
|
||||||
|
BB&T's Capital Targets
|
||||||
|
|
Operating
|
Stressed
|
||||
|
CET1 to risk-weighted assets
|
8.5
|
%
|
6.0
|
%
|
||
|
Tier 1 capital to risk-weighted assets
|
10.0
|
|
7.5
|
|
||
|
Total capital to risk-weighted assets
|
12.0
|
|
9.5
|
|
||
|
Leverage ratio
|
8.0
|
|
5.5
|
|
||
|
Tangible common equity ratio
|
6.0
|
|
4.0
|
|
||
72
|
Table 32
|
|||||||||||||||||||||
|
Capital Requirements Under Basel III
|
|||||||||||||||||||||
|
|
Minimum Capital
|
Well-Capitalized
|
Minimum Capital Plus Capital Conservation Buffer
|
BB&T Target
|
|||||||||||||||||
|
|
2016
|
2017
|
2018
|
2019 (1)
|
|||||||||||||||||
|
CET1 to risk-weighted assets
|
4.5
|
%
|
6.5
|
%
|
5.125
|
%
|
5.750
|
%
|
6.375
|
%
|
7.000
|
%
|
8.5
|
%
|
|||||||
|
Tier 1 capital to risk-weighted assets
|
6.0
|
|
8.0
|
|
6.625
|
|
7.250
|
|
7.875
|
|
8.500
|
|
10.0
|
|
|||||||
|
Total capital to risk-weighted assets
|
8.0
|
|
10.0
|
|
8.625
|
|
9.250
|
|
9.875
|
|
10.500
|
|
12.0
|
|
|||||||
|
Leverage ratio
|
4.0
|
|
5.0
|
|
N/A
|
|
N/A
|
|
N/A
|
|
N/A
|
|
8.0
|
|
|||||||
|
(1)
|
BB&T's goal is to maintain capital levels above the 2019 requirements.
|
Payments of cash dividends and repurchases of common shares are the methods used to manage any excess capital generated. In addition, management closely monitors the Parent Company’s double leverage ratio (investments in subsidiaries as a percentage of shareholders’ equity). The active management of the subsidiaries’ equity capital, as described above, is the process used to manage this important driver of Parent Company liquidity and is a key element in the management of BB&T’s capital position.
Management intends to maintain capital at Branch Bank at levels that will result in classification as "well-capitalized" for regulatory purposes. Secondarily, it is management’s intent to maintain Branch Bank’s capital at levels that result in regulatory risk-based capital ratios that are generally comparable with peers of similar size, complexity and risk profile. If the capital levels of Branch Bank increase above these guidelines, excess capital may be transferred to the Parent Company in the form of special dividend payments, subject to regulatory and other operating considerations.
While nonrecurring events or management decisions may result in the Company temporarily falling below its operating minimum guidelines for one or more of these ratios, it is management’s intent through capital planning to return to these targeted operating minimums within a reasonable period of time. Such temporary decreases below the operating minimums shown above are not considered an infringement of BB&T’s overall capital policy, provided a return above the minimums is forecast to occur within a reasonable time period.
BB&T regularly performs stress testing on its capital levels and is required to periodically submit the company’s capital plans to the banking regulators. The FRB did not object to the Company’s
2016
capital plan, and the
2017
capital plan is expected to be submitted during April
2017
. Management’s capital deployment plan in order of preference is to focus on 1) organic growth, 2) dividends and 3) acquisitions and/or share repurchases depending on opportunities in the marketplace and our interest and ability to proceed with acquisitions.
Risk-based capital ratios, which include Tier 1 Capital, Total Capital and Tier 1 Common Equity, are calculated based on regulatory guidance related to the measurement of capital and risk-weighted assets.
Branch Bank's capital ratios are presented in the following table:
|
Table 33
|
||||||
|
Capital Ratios - Branch Bank
|
||||||
|
December 31,
|
||||||
|
|
2016
|
2015
|
||||
|
CET1 to risk-weighted assets
|
11.5
|
%
|
11.3
|
%
|
||
|
Tier 1 capital to risk-weighted assets
|
11.5
|
|
11.3
|
|
||
|
Total capital to risk-weighted assets
|
13.6
|
|
13.4
|
|
||
|
Leverage ratio
|
9.6
|
|
9.3
|
|
||
73
BB&T's capital ratios are presented in the following table:
|
Table 34
|
||||||||
|
Capital Ratios - BB&T Corporation
|
||||||||
|
December 31,
|
||||||||
|
|
2016
|
2015
|
||||||
|
|
(Dollars in millions, except per share data, shares in thousands)
|
|||||||
|
Risk-based:
|
|
|
||||||
|
CET1
|
10.2
|
%
|
10.3
|
%
|
||||
|
Tier 1
|
12.0
|
|
11.8
|
|
||||
|
Total
|
14.1
|
|
14.3
|
|
||||
|
Leverage capital
|
10.0
|
|
9.8
|
|
||||
|
Non-GAAP capital measures (1):
|
|
|
|
|
||||
|
Tangible common equity per common share
|
$
|
20.18
|
|
$
|
19.82
|
|
||
|
Calculations of tangible common equity (1):
|
|
|
||||||
|
Total shareholders' equity
|
$
|
29,926
|
|
$
|
27,340
|
|
||
|
Less:
|
|
|||||||
|
Preferred stock
|
3,053
|
|
2,603
|
|
||||
|
Noncontrolling interests
|
45
|
|
34
|
|
||||
|
Intangible assets
|
10,492
|
|
9,234
|
|
||||
|
Tangible common equity
|
$
|
16,336
|
|
$
|
15,469
|
|
||
|
Risk-weighted assets
|
$
|
176,138
|
|
$
|
166,611
|
|
||
|
Common shares outstanding at end of period
|
809,475
|
|
780,337
|
|
||||
__________________
|
(1)
|
Tangible common equity and related ratios are non-GAAP measures. Management uses these measures to assess the quality of capital and believes that investors may find them useful in their analysis of the Company. These capital measures are not necessarily comparable to similar capital measures that may be presented by other companies.
|
The Company’s estimated CET1 ratio using the Basel III standardized approach on a fully phased-in basis was 10.0% at
December 31, 2016
and 2015.
During April 2016, BB&T's Board of Directors approved a $0.01 increase in the quarterly dividend. During July 2016, BB&T's Board of Directors approved an additional $0.02 increase in the quarterly dividend, which increased the amount of the quarterly dividend to $0.30.
The Board of Directors also authorized cumulative share buybacks of up to $640 million beginning during the third quarter of 2016. Pursuant to this authorization, the Company completed $160 million of share repurchases during the third quarter of 2016 and $160 million of share repurchases during the fourth quarter of 2016. The Board of Directors also approved an additional $200 million of share repurchases through an accelerated share repurchase program that began in December and resulted in the retirement of 3.4 million shares. The program concluded in January 2017 with approximately 910,000 additional shares being retired. The conclusion of the program in January does not impact capital as the full cost was charged to equity in the fourth quarter. The total payout ratio was 64.0% for the year ended December 31, 2016.
74
|
Table 35
|
||||||||||||||||||||||||||||||||
|
Quarterly Financial Summary
–
Unaudited
|
||||||||||||||||||||||||||||||||
|
|
2016
|
2015
|
||||||||||||||||||||||||||||||
|
|
Fourth Quarter
|
Third Quarter
|
Second Quarter
|
First Quarter
|
Fourth Quarter
|
Third Quarter
|
Second Quarter
|
First Quarter
|
||||||||||||||||||||||||
|
|
(Dollars in millions, except per share data)
|
|||||||||||||||||||||||||||||||
|
Consolidated Summary of Operations:
|
|
|
|
|
|
|
|
|
||||||||||||||||||||||||
|
Interest income
|
$
|
1,745
|
|
$
|
1,795
|
|
$
|
1,805
|
|
$
|
1,721
|
|
$
|
1,695
|
|
$
|
1,650
|
|
$
|
1,489
|
|
$
|
1,493
|
|
||||||||
|
Interest expense
|
180
|
|
185
|
|
188
|
|
192
|
|
191
|
|
186
|
|
177
|
|
181
|
|
||||||||||||||||
|
Provision for credit losses
|
129
|
|
148
|
|
111
|
|
184
|
|
129
|
|
103
|
|
97
|
|
99
|
|
||||||||||||||||
|
Noninterest income
|
1,162
|
|
1,164
|
|
1,130
|
|
1,016
|
|
1,015
|
|
988
|
|
1,019
|
|
997
|
|
||||||||||||||||
|
Noninterest expense
|
1,668
|
|
1,711
|
|
1,797
|
|
1,545
|
|
1,597
|
|
1,594
|
|
1,653
|
|
1,422
|
|
||||||||||||||||
|
Provision for income taxes
|
287
|
|
273
|
|
252
|
|
246
|
|
251
|
|
222
|
|
80
|
|
241
|
|
||||||||||||||||
|
Net income
|
643
|
|
|
642
|
|
587
|
|
570
|
|
542
|
|
533
|
|
501
|
|
547
|
|
|||||||||||||||
|
Noncontrolling interest
|
7
|
|
—
|
|
3
|
|
6
|
|
3
|
|
4
|
|
10
|
|
22
|
|
||||||||||||||||
|
Preferred stock dividends
|
44
|
|
43
|
|
43
|
|
37
|
|
37
|
|
37
|
|
37
|
|
37
|
|
||||||||||||||||
|
Net income available to common shareholders
|
$
|
592
|
|
$
|
599
|
|
$
|
541
|
|
$
|
527
|
|
$
|
502
|
|
$
|
492
|
|
$
|
454
|
|
$
|
488
|
|
||||||||
|
Basic EPS
|
$
|
0.73
|
|
$
|
0.74
|
|
$
|
0.67
|
|
$
|
0.67
|
|
$
|
0.64
|
|
$
|
0.64
|
|
$
|
0.63
|
|
$
|
0.68
|
|
||||||||
|
Diluted EPS
|
$
|
0.72
|
|
$
|
0.73
|
|
$
|
0.66
|
|
$
|
0.67
|
|
$
|
0.64
|
|
$
|
0.64
|
|
$
|
0.62
|
|
$
|
0.67
|
|
||||||||
|
Selected Average Balances:
|
|
|
|
|
|
|
|
|
||||||||||||||||||||||||
|
Assets
|
$
|
220,165
|
|
$
|
222,065
|
|
$
|
223,399
|
|
$
|
210,102
|
|
$
|
209,217
|
|
$
|
203,531
|
|
$
|
189,033
|
|
$
|
187,297
|
|
||||||||
|
Securities, at amortized cost
|
44,881
|
|
47,152
|
|
48,510
|
|
44,580
|
|
43,468
|
|
43,048
|
|
40,727
|
|
41,133
|
|
||||||||||||||||
|
Loans and leases (1)
|
144,569
|
|
143,689
|
|
143,097
|
|
135,628
|
|
136,190
|
|
132,499
|
|
122,056
|
|
120,235
|
|
||||||||||||||||
|
Total earning assets
|
192,574
|
|
193,909
|
|
194,822
|
|
183,612
|
|
183,151
|
|
178,464
|
|
165,428
|
|
163,367
|
|
||||||||||||||||
|
Deposits
|
160,118
|
|
159,503
|
|
160,338
|
|
149,867
|
|
148,491
|
|
143,837
|
|
131,868
|
|
129,531
|
|
||||||||||||||||
|
Short-term borrowings
|
2,373
|
|
2,128
|
|
2,951
|
|
2,771
|
|
2,698
|
|
3,572
|
|
3,080
|
|
3,539
|
|
||||||||||||||||
|
Long-term debt
|
21,563
|
|
23,428
|
|
23,272
|
|
22,907
|
|
24,306
|
|
23,394
|
|
22,616
|
|
23,043
|
|
||||||||||||||||
|
Total interest-bearing liabilities
|
132,633
|
|
134,500
|
|
137,760
|
|
129,342
|
|
129,671
|
|
126,650
|
|
116,062
|
|
116,412
|
|
||||||||||||||||
|
Shareholders' equity
|
30,054
|
|
29,916
|
|
29,610
|
|
27,826
|
|
27,378
|
|
26,612
|
|
24,888
|
|
24,566
|
|
||||||||||||||||
__________________
|
(1)
|
Loans and leases are net of unearned income and include LHFS.
|
Fourth Quarter Results
Consolidated net income available to common shareholders for the fourth quarter of
2016
totaling
$592 million
was up
17.9%
compared to
$502 million
earned during the same period in
2015
. On a diluted per common share basis, earnings for the fourth quarter of
2016
were
$0.72
, up
12.5%
compared to
$0.64
for the same period in
2015
. BB&T’s results of operations for the fourth quarter of
2016
produced an annualized return on average assets of
1.16%
and an annualized return on average common shareholders’ equity of
8.75%
, compared to prior year ratios of
1.03%
and
8.06%
, respectively. These results include merger-related and restructuring charges of $13 million and $50 million, respectively.
Total revenues on a TE basis were $2.8 billion for the fourth quarter of
2016
, up 8.3% compared to the earlier quarter. This increase was driven by a $147 million increase in noninterest income, largely the result of acquisitions.
Net interest margin was
3.32%
, compared to
3.35%
for the earlier quarter. Average earning assets increased
$9.4 billion
, or
5.1%
, while average interest-bearing liabilities increased $3.0 billion, both of which were primarily driven by acquisition activity. The annualized yield on the total loan portfolio for the fourth quarter was 4.24%, a decrease of seven basis points compared to the earlier quarter, which primarily reflects the impact of lower rates on new production and runoff of loans acquired from the FDIC. The annualized fully taxable-equivalent yield on the average securities portfolio for the fourth quarter was
2.13%
, compared to 2.30% for the earlier period. This decline was primarily due to securities duration adjustments during 2016.
The average annualized cost of interest-bearing deposits was
0.22%
, down two basis points compared to the earlier quarter. The average annualized rate paid on long-term debt was
2.16%
, compared to
2.11%
for the earlier quarter. This increase was primarily due to lower benefits from hedging.
75
Excluding acquired from FDIC and PCI loans, the provision for credit losses was $133 million, compared to $128 million in the earlier quarter. Net charge-offs for the fourth quarter of
2016
, excluding loans acquired from the FDIC and PCI, totaled $136 million, compared to $130 million for the earlier quarter.
The $147 million increase in noninterest income was driven by higher insurance income, FDIC loss share income, investment banking and brokerage fees and commissions and other income.
Noninterest expense was
$1.7 billion
for the fourth quarter of
2016
, an increase of $71 million compared to the earlier quarter. This increase was primarily driven by higher personnel expense, which was partially offset by declines in loan-related expense and merger-related and restructuring charges.
The provision for income taxes was
$287 million
for the fourth quarter of
2016
, compared to
$251 million
for the earlier quarter. This produced an effective tax rate for the fourth quarter of
2016
of 30.9%, compared to 31.7% for the earlier quarter.
Reclassifications
In certain circumstances, reclassifications have been made to prior period information to conform to the current presentation. Such reclassifications had no effect on previously reported shareholders’ equity or net income.
Critical Accounting Policies
The accounting and reporting policies of BB&T are in accordance with GAAP and conform to the accounting and reporting guidelines prescribed by bank regulatory authorities. The financial position and results of operations are affected by management’s application of accounting policies, including estimates, assumptions and judgments made to arrive at the carrying value of assets and liabilities and amounts reported for revenues and expenses. Different assumptions in the application of these policies could result in material changes in the consolidated financial position and/or consolidated results of operations and related disclosures. Understanding BB&T’s accounting policies is fundamental to understanding the consolidated financial position and consolidated results of operations. Accordingly, BB&T’s significant accounting policies and changes in accounting principles and effects of new accounting pronouncements are discussed in detail in the "Summary of Significant Accounting Policies" note in the "Notes to Consolidated Financial Statements."
The following is a summary of BB&T’s critical accounting policies that are highly dependent on estimates, assumptions and judgments. These critical accounting policies are reviewed with the Audit Committee of the Board of Directors on a periodic basis.
ACL
BB&T’s policy is to maintain an ALLL and a RUFC that represent management’s best estimate of probable credit losses inherent in the loan and lease portfolios and off-balance sheet lending commitments at the balance sheet date. Estimates for loan and lease losses are determined by analyzing historical loan and lease losses, historical loan and lease migration to charge-off experience, current trends in delinquencies and charge-offs, expected cash flows on purchased loans, current assessment of impaired loans and leases, the results of regulatory examinations and changes in the size, composition and risk assessment of the loan and lease portfolio. As part of this process, BB&T develops a series of loss estimate factors, which are modeled projections of the frequency, timing and severity of losses. These loss estimate factors are based on historical loss experience, economic and political environmental considerations and any other data that management believes will provide evidence about the collectability of outstanding loan and lease amounts. The following table summarizes the loss estimate factors used to determine the ALLL:
|
Loss Estimate Factor
|
|
Description
|
|
Loss Frequency
|
|
Indicates the likelihood of a borrower defaulting on a loan
|
|
Loss Severity
|
|
Indicates the amount of estimated loss at the time of default
|
76
For collectively evaluated loans, the ALLL is determined by multiplying the loan exposure estimated at the time of default by the loss frequency and loss severity factors. For individually evaluated loans, the ALLL is determined through review of data specific to the borrower. For TDRs, default expectations and estimated slower prepayment speeds that are specific to each of the restructured loan populations are incorporated in the determination of the ALLL. Also included in management’s estimates for loan and lease losses are considerations with respect to the impact of current economic events, the outcomes of which are uncertain. These events may include, but are not limited to, fluctuations in overall interest rates, political conditions, legislation that may directly or indirectly affect the banking industry and economic conditions affecting specific geographical areas and industries in which BB&T conducts business.
The methodology used to determine an estimate for the RUFC is inherently similar to the methodology used in calculating the ALLL adjusted for factors specific to binding commitments, including the probability of funding and exposure at the time of funding. A detailed discussion of the methodology used in determining the ALLL and the RUFC is included in the "Summary of Significant Accounting Policies" note in the "Notes to Consolidated Financial Statements."
Fair Value of Financial Instruments
The vast majority of assets and liabilities carried at fair value are based on either quoted market prices or market prices for similar instruments. See the "Fair Value Disclosures" note in the "Notes to Consolidated Financial Statements" for additional disclosures regarding the fair value of financial instruments.
Securities
BB&T generally utilizes a third-party pricing service in determining the fair value of its AFS and trading securities. Fair value measurements are derived from market-based pricing matrices that were developed using observable inputs that include benchmark yields, benchmark securities, reported trades, offers, bids, issuer spreads and broker quotes. Management performs procedures to evaluate the accuracy of the fair values provided by the third-party service provider. These procedures, which are performed independent of the responsible BU, include comparison of pricing information received from the third party pricing service to other third party pricing sources, review of additional information provided by the third party pricing service and other third party sources for selected securities and back-testing to compare the price realized on security sales to the daily pricing information received from the third party pricing service. The IPV committee, which provides oversight to BB&T’s enterprise-wide IPV function, is responsible for oversight of the comparison of pricing information received from the third party pricing service to other third party pricing sources, approving tolerance limits determined by IPV for price comparison exceptions, reviewing significant changes to pricing and valuation policies and reviewing and approving the pricing decisions made on any illiquid and hard-to-price securities. When market observable data is not available, which generally occurs due to the lack of liquidity for certain securities, the valuation of the security is subjective and may involve substantial judgment by management.
BB&T periodically reviews AFS securities with an unrealized loss. An unrealized loss exists when the current fair value of an individual security is less than its amortized cost basis. The purpose of the review is to consider the length of time and the extent to which the market value of a security has been below its amortized cost. The primary factors BB&T considers in determining whether an impairment is other-than-temporary are long-term expectations and recent experience regarding principal and interest payments and BB&T’s intent to sell and whether it is more likely than not that the Company would be required to sell those securities before the anticipated recovery of the amortized cost basis.
MSRs
BB&T has two primary classes of MSRs for which it separately manages the economic risks: residential and commercial. Both classes of MSRs are recorded on the Consolidated Balance Sheets primarily at fair value with changes in fair value recorded as a component of mortgage banking income. Derivative instruments are used to mitigate the income statement effect of changes in fair value due to changes in valuation inputs and assumptions of the MSRs.
MSRs do not trade in an active, open market with readily observable prices. While sales of MSRs do occur, the precise terms and conditions typically are not readily available. Accordingly, BB&T estimates the fair value of residential MSRs using a stochastic OAS valuation model to project MSR cash flows over multiple interest rate scenarios, which are then discounted at risk-adjusted rates. The OAS model considers portfolio characteristics, contractually specified servicing fees, prepayment assumptions, delinquency rates, late charges, other ancillary revenue, costs to service and other economic factors. BB&T reassesses and periodically adjusts the underlying inputs and assumptions in the OAS model to reflect market conditions and assumptions that a market participant would consider in valuing the MSR asset.
77
Fair value estimates and assumptions are compared to industry surveys, recent market activity, actual portfolio experience and, when available, observable market data. Due to the nature of the valuation inputs, MSRs are classified within Level 3 of the valuation hierarchy. The value of residential MSRs is significantly affected by mortgage interest rates available in the marketplace, which influence mortgage loan prepayment speeds. In general, during periods of declining interest rates, the value of MSRs declines due to increasing prepayments attributable to increased mortgage-refinance activity. Conversely, during periods of rising interest rates, the value of MSRs generally increases due to reduced refinance activity. BB&T typically hedges against market value changes in the MSRs. Refer to the "Loan Servicing" note in the "Notes to Consolidated Financial Statements" for quantitative disclosures reflecting the effect that changes in management’s assumptions would have on the fair value of MSRs.
Prior to January 1, 2016, commercial MSRs were carried at the lower of cost or market and amortized over the estimated period that servicing income was expected to be received based on projections of the amount and timing of estimated future cash flows. Effective January 1, 2016, BB&T adopted the fair value method for commercial MSRs to facilitate hedging against changes in the fair value of the MSR asset. The impact of this adoption was not material. Commercial MSRs are valued using a cash flow valuation model that calculates the present value of estimated future net servicing cash flows. BB&T considers actual and expected loan prepayment rates, discount rates, servicing costs and other economic factors that are determined based on current market conditions. Compared to residential MSRs, commercial MSR prepayments tend to be significantly lower, subject to the level of prevailing commercial mortgage rates. Commercial loans tend to have prepayment penalty clauses, and some of the loans may be defeased or assumable. As a result, unlike for residential MSRs, BB&T does not employ a stochastic interest rate model for valuation of commercial MSRs.
LHFS
BB&T originates certain mortgage loans for sale to investors that are carried at fair value. The fair value is primarily based on quoted market prices for securities backed by similar types of loans. Changes in the fair value are recorded as a component of mortgage banking income, while the related origination costs are recognized in noninterest expense when incurred. The changes in fair value are largely driven by changes in interest rates subsequent to loan funding and changes in the fair value of servicing associated with the LHFS. BB&T uses various derivative instruments to mitigate the economic effect of changes in fair value of the underlying loans.
Derivative Assets and Liabilities
BB&T uses derivatives to manage various financial risks. BB&T mitigates the credit risk by subjecting counterparties to credit reviews and approvals similar to those used in making loans and other extensions of credit. In addition, certain counterparties are required to provide collateral to BB&T when their unsecured loss positions exceed certain negotiated limits. The fair values of derivative financial instruments are determined based on quoted market prices and internal pricing models that use market observable data. The fair value of interest rate lock commitments, which are related to mortgage loan commitments, is based on quoted market prices adjusted for commitments that BB&T does not expect to fund and includes the value attributable to the net servicing fee.
Intangible Assets
The acquisition method of accounting requires that acquired assets and liabilities are recorded at their fair values. This often involves estimates based on third party valuations or internal valuations based on discounted cash flow analyses or other valuation techniques, which are inherently subjective. The amortization of identified intangible assets is based upon the estimated economic benefits to be received, which is also subjective. Acquisitions typically result in goodwill, which is subject to ongoing periodic impairment tests based on the fair values of the reporting units to which the acquired goodwill relates. Refer to the "Summary of Significant Accounting Policies" note in the "Notes to Consolidated Financial Statements" for a description of the impairment testing process. Management considers the sensitivity of the significant assumptions in its impairment analysis including consideration of a 10% change in estimated future cash flows or the discount rate for each reporting unit.
78
Pension and Postretirement Benefit Obligations
BB&T offers various pension plans and postretirement benefit plans to employees. Calculation of the obligations and related expenses under these plans requires the use of actuarial valuation methods and assumptions, which are subject to management judgment and may differ significantly if different assumptions are used. The discount rate assumption used to measure the postretirement benefit obligations is set by reference to a high-quality (AA-rated or higher) corporate bond yield curve and the individual characteristics of the plans such as projected cash flow patterns and payment durations. Management evaluated the sensitivity changes that the expected return on plan assets and the discount rate would have on pension expense. A decrease of 25 basis points in the discount rate would result in additional pension expense of approximately $29 million for
2017
, while a decrease of 100 basis points in the expected return on plan assets would result in an increase of approximately $53 million in pension expense for
2017
. Refer to the "Benefit Plans" note in the "Notes to Consolidated Financial Statements" for disclosures related to the benefit plans.
Income Taxes
The calculation of BB&T’s income tax provision is complex and requires the use of estimates and judgments. As part of the Company’s analysis and implementation of business strategies, consideration is given to the tax laws and regulations that apply to the specific facts and circumstances for any tax position under evaluation. For tax positions that are uncertain in nature, management determines whether the tax position is more likely than not to be sustained upon examination. For tax positions that meet this threshold, management then estimates the amount of the tax benefit to recognize in the financial statements. Management closely monitors tax developments in order to evaluate the effect they may have on the Company’s overall tax position and the estimates and judgments used in determining the income tax provision and records adjustments as necessary.
79
Management’s Report on Internal Control Over Financial Reporting and Evaluation of Disclosure Controls and Procedures
Management of BB&T is responsible for establishing and maintaining adequate internal control over financial reporting as defined in Rule 13a-15(f) of the Exchange Act. The Company’s internal control over financial reporting is a process designed to provide reasonable assurance regarding the reliability of financial reporting and the preparation of financial statements for external purposes in accordance with GAAP. BB&T’s internal control over financial reporting includes those policies and procedures that (1) pertain to the maintenance of records, that in reasonable detail, accurately and fairly reflect the transactions and disposition of the Company’s assets; (2) provide reasonable assurance that transactions are recorded as necessary to permit the preparation of the financial statements in accordance with GAAP and that receipts and expenditures of the Company are being made only in accordance with the authorizations of BB&T’s management and directors; and (3) provide reasonable assurance regarding prevention or timely detection of unauthorized acquisition, use or disposition of the Company’s assets that could have a material impact on the financial statements.
Because of its inherent limitations, internal control over financial reporting may not prevent or detect misstatements. Also, projections of any evaluation of effectiveness to future periods are subject to the risk that controls may become inadequate due to changes in conditions, or that the degree of compliance with the policies and procedures may deteriorate.
Under the supervision and with the participation of management, including the Chief Executive Officer and the Chief Financial Officer, the Company conducted an evaluation of the effectiveness of the internal control over financial reporting based on the framework in "Internal Control—Integrated Framework (2013)" promulgated by the Committee of Sponsoring Organizations of the Treadway Commission, commonly referred to as the "COSO" criteria. Based on this evaluation under the COSO criteria, management concluded that the internal control over financial reporting was effective as of
December 31, 2016
.
As of the end of the period covered by this report, the management of the Company, under the supervision and with the participation of the Company’s Chief Executive Officer and Chief Financial Officer, carried out an evaluation of the Company’s disclosure controls and procedures as defined in Rule 13a-15(e) of the Exchange Act. Based on that evaluation, the Chief Executive Officer and Chief Financial Officer concluded that the Company’s disclosure controls and procedures are effective.
There was no change in the Company’s internal control over financial reporting that occurred during the fourth quarter of
2016
that has materially affected, or is likely to materially affect, the Company’s internal control over financial reporting.
The effectiveness of the Company’s internal control over financial reporting as of
December 31, 2016
has been audited by PricewaterhouseCoopers LLP, an independent registered public accounting firm, as stated in their accompanying report, which expresses an unqualified opinion on the effectiveness of the Company’s internal control over financial reporting as of
December 31, 2016
.
80
Report of Independent Registered Public Accounting Firm
To the Board of Directors and Shareholders of BB&T Corporation:
In our opinion, the accompanying consolidated balance sheets and the related consolidated statements of income, comprehensive income, changes in shareholders’ equity and cash flows present fairly, in all material respects, the financial position of BB&T Corporation and its subsidiaries at
December 31, 2016
and
2015
, and the results of their operations and their cash flows for each of the years in the three-year period ended
December 31, 2016
in conformity with accounting principles generally accepted in the United States of America. Also in our opinion, the Company maintained, in all material respects, effective internal control over financial reporting as of
December 31, 2016
, based on criteria established in
Internal Control—Integrated Framework
(2013) issued by the Committee of Sponsoring Organizations of the Treadway Commission (COSO). The Company’s management is responsible for these financial statements, for maintaining effective internal control over financial reporting and for its assessment of the effectiveness of internal control over financial reporting, included in the accompanying Management’s Report on Internal Control Over Financial Reporting. Our responsibility is to express opinions on these financial statements and on the Company’s internal control over financial reporting based on our integrated audits. We conducted our audits in accordance with the standards of the Public Company Accounting Oversight Board (United States). Those standards require that we plan and perform the audits to obtain reasonable assurance about whether the financial statements are free of material misstatement and whether effective internal control over financial reporting was maintained in all material respects. Our audits of the financial statements included examining, on a test basis, evidence supporting the amounts and disclosures in the financial statements, assessing the accounting principles used and significant estimates made by management, and evaluating the overall financial statement presentation. Our audit of internal control over financial reporting included obtaining an understanding of internal control over financial reporting, assessing the risk that a material weakness exists, and testing and evaluating the design and operating effectiveness of internal control based on the assessed risk. Our audits also included performing such other procedures as we considered necessary in the circumstances. We believe that our audits provide a reasonable basis for our opinions.
A company’s internal control over financial reporting is a process designed to provide reasonable assurance regarding the reliability of financial reporting and the preparation of financial statements for external purposes in accordance with generally accepted accounting principles. A company’s internal control over financial reporting includes those policies and procedures that (i) pertain to the maintenance of records that, in reasonable detail, accurately and fairly reflect the transactions and dispositions of the assets of the company; (ii) provide reasonable assurance that transactions are recorded as necessary to permit preparation of financial statements in accordance with generally accepted accounting principles, and that receipts and expenditures of the company are being made only in accordance with authorizations of management and directors of the company; and (iii) provide reasonable assurance regarding prevention or timely detection of unauthorized acquisition, use, or disposition of the company’s assets that could have a material effect on the financial statements.
Because of its inherent limitations, internal control over financial reporting may not prevent or detect misstatements. Also, projections of any evaluation of effectiveness to future periods are subject to the risk that controls may become inadequate because of changes in conditions, or that the degree of compliance with the policies or procedures may deteriorate.
/s/ PricewaterhouseCoopers LLP
Greensboro, North Carolina
February 21, 2017
81
|
BB&T CORPORATION AND SUBSIDIARIES
|
||||||||
|
CONSOLIDATED BALANCE SHEETS
|
||||||||
|
(Dollars in millions, except per share data, shares in thousands)
|
||||||||
|
|
December 31,
|
|||||||
|
|
2016
|
2015
|
||||||
|
Assets
|
|
|
||||||
|
Cash and due from banks
|
$
|
1,897
|
|
$
|
2,123
|
|
||
|
Interest-bearing deposits with banks
|
1,895
|
|
1,435
|
|
||||
|
Federal funds sold and securities purchased under resale agreements or similar arrangements
|
144
|
|
153
|
|
||||
|
Restricted cash
|
488
|
|
456
|
|
||||
|
AFS securities at fair value
|
26,926
|
|
25,297
|
|
||||
|
HTM securities (fair value of $16,546 and $18,519 at December 31, 2016 and 2015 respectively)
|
16,680
|
|
18,530
|
|
||||
|
LHFS at fair value
|
1,716
|
|
1,035
|
|
||||
|
Loans and leases
|
143,322
|
|
135,951
|
|
||||
|
ALLL
|
(1,489
|
)
|
(1,460
|
)
|
||||
|
Loans and leases, net of ALLL
|
141,833
|
|
134,491
|
|
||||
|
Premises and equipment
|
2,107
|
|
2,007
|
|
||||
|
Goodwill
|
9,638
|
|
8,548
|
|
||||
|
CDI and other intangible assets
|
854
|
|
686
|
|
||||
|
MSRs at fair value
|
1,052
|
|
880
|
|
||||
|
Other assets
|
14,046
|
|
14,306
|
|
||||
|
Total assets
|
$
|
219,276
|
|
$
|
209,947
|
|
||
|
Liabilities and Shareholders’ Equity
|
|
|
||||||
|
Deposits:
|
|
|
||||||
|
Noninterest-bearing deposits
|
$
|
50,697
|
|
$
|
45,695
|
|
||
|
Interest-bearing deposits
|
109,537
|
|
103,429
|
|
||||
|
Total deposits
|
160,234
|
|
149,124
|
|
||||
|
Short-term borrowings
|
1,406
|
|
3,593
|
|
||||
|
Long-term debt
|
21,965
|
|
23,769
|
|
||||
|
Accounts payable and other liabilities
|
5,745
|
|
6,121
|
|
||||
|
Total liabilities
|
189,350
|
|
182,607
|
|
||||
|
Commitments and contingencies (Note 14)
|
|
|
||||||
|
Shareholders’ equity:
|
|
|
||||||
|
Preferred stock, $5 par, liquidation preference of $25,000 per share
|
3,053
|
|
2,603
|
|
||||
|
Common stock, $5 par
|
4,047
|
|
3,902
|
|
||||
|
Additional paid-in capital
|
9,104
|
|
8,365
|
|
||||
|
Retained earnings
|
14,809
|
|
13,464
|
|
||||
|
AOCI, net of deferred income taxes
|
(1,132
|
)
|
(1,028
|
)
|
||||
|
Noncontrolling interests
|
45
|
|
34
|
|
||||
|
Total shareholders’ equity
|
29,926
|
|
27,340
|
|
||||
|
Total liabilities and shareholders’ equity
|
$
|
219,276
|
|
$
|
209,947
|
|
||
|
Common shares outstanding
|
809,475
|
|
780,337
|
|
||||
|
Common shares authorized
|
2,000,000
|
|
2,000,000
|
|
||||
|
Preferred shares outstanding
|
126
|
|
107
|
|
||||
|
Preferred shares authorized
|
5,000
|
|
5,000
|
|
||||
The accompanying notes are an integral part of these consolidated financial statements.
82
|
BB&T CORPORATION AND SUBSIDIARIES
|
||||||||||||
|
CONSOLIDATED STATEMENTS OF INCOME
|
||||||||||||
|
(Dollars in millions, except per share data, shares in thousands)
|
||||||||||||
|
|
Year Ended December 31,
|
|||||||||||
|
|
2016
|
2015
|
2014
|
|||||||||
|
Interest Income
|
|
|
|
|||||||||
|
Interest and fees on loans and leases
|
$
|
5,985
|
|
$
|
5,347
|
|
$
|
5,163
|
|
|||
|
Interest and dividends on securities
|
1,029
|
|
941
|
|
939
|
|
||||||
|
Interest on other earning assets
|
52
|
|
39
|
|
40
|
|
||||||
|
Total interest income
|
7,066
|
|
6,327
|
|
6,142
|
|
||||||
|
Interest Expense
|
|
|
|
|||||||||
|
Interest on deposits
|
251
|
|
233
|
|
239
|
|
||||||
|
Interest on short-term borrowings
|
9
|
|
4
|
|
4
|
|
||||||
|
Interest on long-term debt
|
485
|
|
498
|
|
525
|
|
||||||
|
Total interest expense
|
745
|
|
735
|
|
768
|
|
||||||
|
Net Interest Income
|
6,321
|
|
5,592
|
|
5,374
|
|
||||||
|
Provision for credit losses
|
572
|
|
428
|
|
251
|
|
||||||
|
Net Interest Income After Provision for Credit Losses
|
5,749
|
|
5,164
|
|
5,123
|
|
||||||
|
Noninterest Income
|
|
|
|
|||||||||
|
Insurance income
|
1,713
|
|
1,596
|
|
1,643
|
|
||||||
|
Service charges on deposits
|
664
|
|
631
|
|
632
|
|
||||||
|
Mortgage banking income
|
463
|
|
455
|
|
395
|
|
||||||
|
Investment banking and brokerage fees and commissions
|
408
|
|
398
|
|
387
|
|
||||||
|
Trust and investment advisory revenues
|
266
|
|
240
|
|
221
|
|
||||||
|
Bankcard fees and merchant discounts
|
237
|
|
218
|
|
207
|
|
||||||
|
Checkcard fees
|
195
|
|
174
|
|
163
|
|
||||||
|
Operating lease income
|
137
|
|
124
|
|
95
|
|
||||||
|
Income from bank-owned life insurance
|
123
|
|
113
|
|
110
|
|
||||||
|
FDIC loss share income, net
|
(142
|
)
|
(253
|
)
|
(343
|
)
|
||||||
|
Other income
|
362
|
|
326
|
|
349
|
|
||||||
|
Securities gains (losses), net
|
|
|
|
|||||||||
|
Gross realized gains
|
46
|
|
41
|
|
7
|
|
||||||
|
Gross realized losses
|
—
|
|
(40
|
)
|
(4
|
)
|
||||||
|
OTTI charges
|
—
|
|
(2
|
)
|
(23
|
)
|
||||||
|
Non-credit portion recognized in OCI
|
—
|
|
(2
|
)
|
17
|
|
||||||
|
Total securities gains (losses), net
|
46
|
|
(3
|
)
|
(3
|
)
|
||||||
|
Total noninterest income
|
4,472
|
|
4,019
|
|
3,856
|
|
||||||
|
Noninterest Expense
|
|
|
|
|||||||||
|
Personnel expense
|
3,964
|
|
3,469
|
|
3,180
|
|
||||||
|
Occupancy and equipment expense
|
786
|
|
708
|
|
682
|
|
||||||
|
Software expense
|
224
|
|
192
|
|
174
|
|
||||||
|
Outside IT services
|
186
|
|
135
|
|
115
|
|
||||||
|
Amortization of intangibles
|
150
|
|
105
|
|
91
|
|
||||||
|
Regulatory charges
|
145
|
|
101
|
|
106
|
|
||||||
|
Professional services
|
102
|
|
130
|
|
139
|
|
||||||
|
Loan-related expense
|
95
|
|
150
|
|
267
|
|
||||||
|
Merger-related and restructuring charges, net
|
171
|
|
165
|
|
46
|
|
||||||
|
Loss (gain) on early extinguishment of debt
|
(1
|
)
|
172
|
|
122
|
|
||||||
|
Other expense
|
899
|
|
939
|
|
930
|
|
||||||
|
Total noninterest expense
|
6,721
|
|
6,266
|
|
5,852
|
|
||||||
|
Earnings
|
|
|
|
|||||||||
|
Income before income taxes
|
3,500
|
|
2,917
|
|
3,127
|
|
||||||
|
Provision for income taxes
|
1,058
|
|
794
|
|
921
|
|
||||||
|
Net income
|
2,442
|
|
2,123
|
|
2,206
|
|
||||||
|
Noncontrolling interests
|
16
|
|
39
|
|
75
|
|
||||||
|
Dividends on preferred stock
|
167
|
|
148
|
|
148
|
|
||||||
|
Net income available to common shareholders
|
$
|
2,259
|
|
$
|
1,936
|
|
$
|
1,983
|
|
|||
|
Basic EPS
|
$
|
2.81
|
|
$
|
2.59
|
|
$
|
2.76
|
|
|||
|
Diluted EPS
|
$
|
2.77
|
|
$
|
2.56
|
|
$
|
2.72
|
|
|||
|
Cash dividends declared per share
|
$
|
1.15
|
|
$
|
1.05
|
|
$
|
0.95
|
|
|||
|
Basic weighted average shares outstanding
|
804,680
|
|
748,010
|
|
718,140
|
|
||||||
|
Diluted weighted average shares outstanding
|
814,916
|
|
757,765
|
|
728,372
|
|
||||||
The accompanying notes are an integral part of these consolidated financial statements.
83
|
BB&T CORPORATION AND SUBSIDIARIES
|
||||||||||||
|
CONSOLIDATED STATEMENTS OF COMPREHENSIVE INCOME
|
||||||||||||
|
(Dollars in millions)
|
||||||||||||
|
|
Year Ended December 31,
|
|||||||||||
|
|
2016
|
2015
|
2014
|
|||||||||
|
Net Income
|
$
|
2,442
|
|
$
|
2,123
|
|
$
|
2,206
|
|
|||
|
OCI, Net of Tax:
|
|
|
|
|||||||||
|
Change in unrecognized net pension and postretirement costs
|
(41
|
)
|
(97
|
)
|
(323
|
)
|
||||||
|
Change in unrealized net gains (losses) on cash flow hedges
|
(9
|
)
|
(29
|
)
|
(56
|
)
|
||||||
|
Change in unrealized net gains (losses) on AFS securities
|
(225
|
)
|
(186
|
)
|
194
|
|
||||||
|
Change in FDIC's share of unrealized gains/losses on AFS securities
|
169
|
|
38
|
|
28
|
|
||||||
|
Other, net
|
2
|
|
(3
|
)
|
(1
|
)
|
||||||
|
Total OCI
|
(104
|
)
|
(277
|
)
|
(158
|
)
|
||||||
|
Total comprehensive income
|
$
|
2,338
|
|
$
|
1,846
|
|
$
|
2,048
|
|
|||
|
Income Tax Effect of Items Included in OCI:
|
|
|
|
|
||||||||
|
Change in unrecognized net pension and postretirement costs
|
$
|
(20
|
)
|
$
|
(59
|
)
|
$
|
(192
|
)
|
|||
|
Change in unrealized net gains (losses) on cash flow hedges
|
(4
|
)
|
(18
|
)
|
(34
|
)
|
||||||
|
Change in unrealized net gains (losses) on AFS securities
|
(130
|
)
|
(120
|
)
|
117
|
|
||||||
|
Change in FDIC 's share of unrealized gains/losses on AFS securities
|
98
|
|
25
|
|
17
|
|
||||||
|
Other, net
|
1
|
|
3
|
|
2
|
|
||||||
The accompanying notes are an integral part of these consolidated financial statements.
84
|
BB&T CORPORATION AND SUBSIDIARIES
|
|||||||||||||||||||||||||||||||
|
CONSOLIDATED STATEMENTS OF CHANGES IN SHAREHOLDERS’ EQUITY
|
|||||||||||||||||||||||||||||||
|
(Dollars in millions, shares in thousands)
|
|||||||||||||||||||||||||||||||
|
|
Shares of Common Stock
|
Preferred Stock
|
Common Stock
|
Additional Paid-In Capital
|
Retained Earnings
|
AOCI
|
Noncontrolling Interests
|
Total Shareholders' Equity
|
|||||||||||||||||||||||
|
Balance, January 1, 2014
|
706,620
|
|
$
|
2,603
|
|
$
|
3,533
|
|
$
|
6,172
|
|
$
|
11,015
|
|
$
|
(593
|
)
|
$
|
50
|
|
$
|
22,780
|
|
||||||||
|
Add (Deduct):
|
|
|
|
|
|
|
|
|
|||||||||||||||||||||||
|
Net income
|
—
|
|
—
|
|
—
|
|
—
|
|
2,131
|
|
—
|
|
75
|
|
2,206
|
|
|||||||||||||||
|
Net change in AOCI
|
—
|
|
—
|
|
—
|
|
—
|
|
—
|
|
(158
|
)
|
—
|
|
(158
|
)
|
|||||||||||||||
|
Stock transactions:
|
|
|
|
|
|
|
|
|
|
|
|||||||||||||||||||||
|
Issued in connection with equity awards
|
15,321
|
|
—
|
|
76
|
|
233
|
|
—
|
|
—
|
|
—
|
|
309
|
|
|||||||||||||||
|
Shares repurchased in connection with equity awards
|
(2,287
|
)
|
—
|
|
(11
|
)
|
(74
|
)
|
—
|
|
—
|
|
—
|
|
(85
|
)
|
|||||||||||||||
|
Excess tax benefits in connection with equity awards
|
—
|
|
—
|
|
—
|
|
49
|
|
—
|
|
—
|
|
—
|
|
49
|
|
|||||||||||||||
|
Issued in connection with dividend reinvestment plan
|
391
|
|
—
|
|
2
|
|
13
|
|
—
|
|
—
|
|
—
|
|
15
|
|
|||||||||||||||
|
Issued in connection with 401(k) plan
|
653
|
|
—
|
|
3
|
|
22
|
|
—
|
|
—
|
|
—
|
|
25
|
|
|||||||||||||||
|
Cash dividends declared on common stock
|
—
|
|
—
|
|
—
|
|
—
|
|
(681
|
)
|
—
|
|
—
|
|
(681
|
)
|
|||||||||||||||
|
Cash dividends declared on preferred stock
|
—
|
|
—
|
|
—
|
|
—
|
|
(148
|
)
|
—
|
|
—
|
|
(148
|
)
|
|||||||||||||||
|
Equity-based compensation expense
|
—
|
|
—
|
|
—
|
|
102
|
|
—
|
|
—
|
|
—
|
|
102
|
|
|||||||||||||||
|
Other, net
|
—
|
|
—
|
|
—
|
|
—
|
|
—
|
|
—
|
|
(37
|
)
|
(37
|
)
|
|||||||||||||||
|
Balance, December 31, 2014
|
720,698
|
|
2,603
|
|
3,603
|
|
6,517
|
|
12,317
|
|
(751
|
)
|
88
|
|
24,377
|
|
|||||||||||||||
|
Add (Deduct):
|
|
|
|
|
|
|
|
|
|||||||||||||||||||||||
|
Net income
|
—
|
|
—
|
|
—
|
|
—
|
|
2,084
|
|
—
|
|
39
|
|
2,123
|
|
|||||||||||||||
|
Net change in AOCI
|
—
|
|
—
|
|
—
|
|
—
|
|
—
|
|
(277
|
)
|
—
|
|
(277
|
)
|
|||||||||||||||
|
Stock transactions:
|
|
|
|
|
|
|
|
|
|
|
|||||||||||||||||||||
|
Issued in business combination
|
54,000
|
|
—
|
|
270
|
|
1,918
|
|
—
|
|
—
|
|
—
|
|
2,188
|
|
|||||||||||||||
|
Issued in connection with equity awards
|
6,995
|
|
—
|
|
35
|
|
79
|
|
—
|
|
—
|
|
—
|
|
114
|
|
|||||||||||||||
|
Shares repurchased in connection with equity awards
|
(1,356
|
)
|
—
|
|
(6
|
)
|
(46
|
)
|
—
|
|
—
|
|
—
|
|
(52
|
)
|
|||||||||||||||
|
Excess tax benefits in connection with equity awards
|
—
|
|
—
|
|
—
|
|
11
|
|
—
|
|
—
|
|
—
|
|
11
|
|
|||||||||||||||
|
Purchase of additional ownership interest in AmRisc, LP
|
—
|
|
—
|
|
—
|
|
(219
|
)
|
—
|
|
—
|
|
(3
|
)
|
(222
|
)
|
|||||||||||||||
|
Cash dividends declared on common stock
|
—
|
|
—
|
|
—
|
|
—
|
|
(789
|
)
|
—
|
|
—
|
|
(789
|
)
|
|||||||||||||||
|
Cash dividends declared on preferred stock
|
—
|
|
—
|
|
—
|
|
—
|
|
(148
|
)
|
—
|
|
—
|
|
(148
|
)
|
|||||||||||||||
|
Equity-based compensation expense
|
—
|
|
—
|
|
—
|
|
106
|
|
—
|
|
—
|
|
—
|
|
106
|
|
|||||||||||||||
|
Other, net
|
—
|
|
—
|
|
—
|
|
(1
|
)
|
—
|
|
—
|
|
(90
|
)
|
(91
|
)
|
|||||||||||||||
|
Balance, December 31, 2015
|
780,337
|
|
2,603
|
|
3,902
|
|
8,365
|
|
13,464
|
|
(1,028
|
)
|
34
|
|
27,340
|
|
|||||||||||||||
|
Add (Deduct):
|
|
|
|
|
|
|
|
|
|||||||||||||||||||||||
|
Net income
|
—
|
|
—
|
|
—
|
|
—
|
|
2,426
|
|
—
|
|
16
|
|
2,442
|
|
|||||||||||||||
|
Net change in AOCI
|
—
|
|
—
|
|
—
|
|
—
|
|
—
|
|
(104
|
)
|
—
|
|
(104
|
)
|
|||||||||||||||
|
Stock transactions:
|
|
|
|
|
|
|
|
|
|||||||||||||||||||||||
|
Issued in business combinations
|
31,665
|
|
—
|
|
158
|
|
905
|
|
—
|
|
—
|
|
—
|
|
1,063
|
|
|||||||||||||||
|
Issued in connection with equity awards
|
10,311
|
|
—
|
|
51
|
|
204
|
|
—
|
|
—
|
|
—
|
|
255
|
|
|||||||||||||||
|
Shares repurchased in connection with equity awards
|
(1,070
|
)
|
—
|
|
(5
|
)
|
(30
|
)
|
—
|
|
—
|
|
—
|
|
(35
|
)
|
|||||||||||||||
|
Excess tax benefits in connection with equity awards
|
—
|
|
—
|
|
—
|
|
7
|
|
—
|
|
—
|
|
—
|
|
7
|
|
|||||||||||||||
|
Issued in connection with preferred stock offering
|
—
|
|
450
|
|
—
|
|
—
|
|
—
|
|
—
|
|
—
|
|
450
|
|
|||||||||||||||
|
Repurchase of common stock pursuant to Board approved plans
|
(11,768
|
)
|
—
|
|
(59
|
)
|
(461
|
)
|
—
|
|
—
|
|
—
|
|
(520
|
)
|
|||||||||||||||
|
Cash dividends declared on common stock
|
—
|
|
—
|
|
—
|
|
—
|
|
(925
|
)
|
—
|
|
—
|
|
(925
|
)
|
|||||||||||||||
|
Cash dividends declared on preferred stock
|
—
|
|
—
|
|
—
|
|
—
|
|
(167
|
)
|
—
|
|
—
|
|
(167
|
)
|
|||||||||||||||
|
Equity-based compensation expense
|
—
|
|
—
|
|
—
|
|
115
|
|
—
|
|
—
|
|
—
|
|
115
|
|
|||||||||||||||
|
Other, net
|
—
|
|
—
|
|
—
|
|
(1
|
)
|
11
|
|
—
|
|
(5
|
)
|
5
|
|
|||||||||||||||
|
Balance, December 31, 2016
|
809,475
|
|
$
|
3,053
|
|
$
|
4,047
|
|
$
|
9,104
|
|
$
|
14,809
|
|
$
|
(1,132
|
)
|
$
|
45
|
|
$
|
29,926
|
|
||||||||
The accompanying notes are an integral part of these consolidated financial statements.
85
|
BB&T CORPORATION AND SUBSIDIARIES
|
||||||||||||
|
CONSOLIDATED STATEMENTS OF CASH FLOWS
|
||||||||||||
|
(Dollars in millions)
|
||||||||||||
|
|
Year Ended December 31,
|
|||||||||||
|
|
2016
|
2015
|
2014
|
|||||||||
|
Cash Flows From Operating Activities:
|
|
|
|
|||||||||
|
Net income
|
$
|
2,442
|
|
$
|
2,123
|
|
$
|
2,206
|
|
|||
|
Adjustments to reconcile net income to net cash from operating activities:
|
|
|
|
|||||||||
|
Provision for credit losses
|
572
|
|
428
|
|
251
|
|
||||||
|
Adjustment to income tax provision
|
(6
|
)
|
(107
|
)
|
(39
|
)
|
||||||
|
Depreciation
|
405
|
|
356
|
|
333
|
|
||||||
|
Loss (gain) on early extinguishment of debt
|
(1
|
)
|
172
|
|
122
|
|
||||||
|
Amortization of intangibles
|
150
|
|
105
|
|
91
|
|
||||||
|
Equity-based compensation expense
|
115
|
|
106
|
|
102
|
|
||||||
|
(Gain) loss on securities, net
|
(46
|
)
|
3
|
|
3
|
|
||||||
|
Net change in operating assets and liabilities:
|
|
|
|
|||||||||
|
LHFS
|
(644
|
)
|
422
|
|
(201
|
)
|
||||||
|
Trading securities
|
432
|
|
(698
|
)
|
(101
|
)
|
||||||
|
Other assets
|
(568
|
)
|
(493
|
)
|
346
|
|
||||||
|
Accounts payable and other liabilities
|
186
|
|
263
|
|
(4
|
)
|
||||||
|
Cash paid to terminate FDIC loss share agreements
|
(230
|
)
|
—
|
|
—
|
|
||||||
|
Other, net
|
(135
|
)
|
235
|
|
101
|
|
||||||
|
Net cash from operating activities
|
2,672
|
|
2,915
|
|
3,210
|
|
||||||
|
Cash Flows From Investing Activities:
|
|
|
|
|||||||||
|
Proceeds from sales of AFS securities
|
4,612
|
|
6,302
|
|
1,309
|
|
||||||
|
Proceeds from maturities, calls and paydowns of AFS securities
|
5,888
|
|
5,064
|
|
3,915
|
|
||||||
|
Purchases of AFS securities
|
(10,033
|
)
|
(12,698
|
)
|
(3,685
|
)
|
||||||
|
Proceeds from maturities, calls and paydowns of HTM securities
|
7,022
|
|
3,791
|
|
1,866
|
|
||||||
|
Purchases of HTM securities
|
(5,124
|
)
|
(2,557
|
)
|
(4,030
|
)
|
||||||
|
Originations and purchases of loans and leases, net of principal collected
|
(2,757
|
)
|
(2,984
|
)
|
(5,041
|
)
|
||||||
|
Net cash received (paid) for acquisitions and divestitures
|
(785
|
)
|
1,055
|
|
1,025
|
|
||||||
|
Other, net
|
495
|
|
389
|
|
626
|
|
||||||
|
Net cash from investing activities
|
(682
|
)
|
(1,638
|
)
|
(4,015
|
)
|
||||||
|
Cash Flows From Financing Activities:
|
|
|
|
|||||||||
|
Net change in deposits
|
4,507
|
|
2,506
|
|
337
|
|
||||||
|
Net change in short-term borrowings
|
(3,581
|
)
|
(982
|
)
|
(421
|
)
|
||||||
|
Proceeds from issuance of long-term debt
|
3,878
|
|
2,272
|
|
5,510
|
|
||||||
|
Repayment of long-term debt
|
(5,849
|
)
|
(2,433
|
)
|
(3,912
|
)
|
||||||
|
Net cash from common stock transactions
|
(293
|
)
|
73
|
|
298
|
|
||||||
|
Net proceeds from preferred stock issued
|
450
|
|
—
|
|
—
|
|
||||||
|
Cash dividends paid on common stock
|
(925
|
)
|
(789
|
)
|
(666
|
)
|
||||||
|
Cash dividends paid on preferred stock
|
(167
|
)
|
(148
|
)
|
(148
|
)
|
||||||
|
Other, net
|
215
|
|
(390
|
)
|
(33
|
)
|
||||||
|
Net cash from financing activities
|
(1,765
|
)
|
109
|
|
965
|
|
||||||
|
Net Change in Cash and Cash Equivalents
|
225
|
|
1,386
|
|
160
|
|
||||||
|
Cash and Cash Equivalents at Beginning of Period
|
3,711
|
|
2,325
|
|
2,165
|
|
||||||
|
Cash and Cash Equivalents at End of Period
|
$
|
3,936
|
|
$
|
3,711
|
|
$
|
2,325
|
|
|||
|
Supplemental Disclosure of Cash Flow Information:
|
|
|
|
|||||||||
|
Cash paid during the period for:
|
|
|
|
|||||||||
|
Interest
|
$
|
775
|
|
$
|
734
|
|
$
|
765
|
|
|||
|
Income taxes
|
844
|
|
655
|
|
322
|
|
||||||
|
Noncash investing and financing activities:
|
|
|
|
|||||||||
|
Transfers of loans to foreclosed assets
|
487
|
|
532
|
|
547
|
|
||||||
|
Transfers of loans HFI to LHFS
|
263
|
|
153
|
|
684
|
|
||||||
|
Stock issued in acquisitions
|
1,063
|
|
2,188
|
|
—
|
|
||||||
|
Purchase of additional interest in AmRisc, LP
|
—
|
|
216
|
|
—
|
|
||||||
|
Transfer of HTM securities to AFS
|
—
|
|
517
|
|
—
|
|
||||||
The accompanying notes are an integral part of these consolidated financial statements.
86
General
See the Glossary of Defined Terms at the beginning of this Report for terms used throughout the consolidated financial statements and related notes of this Form 10-K.
The accounting and reporting policies are in accordance with GAAP. Additionally, where applicable, the policies conform to the accounting and reporting guidelines prescribed by bank regulatory authorities. The following is a summary of the more significant accounting policies.
Nature of Operations
BB&T is a FHC organized under the laws of North Carolina. BB&T conducts operations through a bank subsidiary, Branch Bank, and nonbank subsidiaries. Branch Bank’s offices are concentrated primarily in the southeastern and mid-Atlantic United States. BB&T provides a wide range of banking services to individuals, businesses and municipalities. BB&T offers a variety of loans and lease financing to individuals and entities primarily within BB&T’s geographic footprint, including insurance premium financing; permanent CRE financing arrangements; loan servicing for third-party investors; direct consumer finance loans to individuals; credit card lending; automobile financing; factoring and equipment financing. BB&T also markets a wide range of other services, including deposits; discount and full service brokerage, annuities and mutual funds; life insurance, property and casualty insurance, health insurance and commercial general liability insurance on an agency basis and through a wholesale insurance brokerage operation; merchant services; trust and retirement services; comprehensive wealth advisory services; asset management and capital markets services.
Principles of Consolidation
The consolidated financial statements include the accounts of BB&T Corporation and those subsidiaries that are majority owned by BB&T or over which BB&T exercises control. Intercompany accounts and transactions are eliminated in consolidation. The results of operations of companies or assets acquired are included from the dates of acquisition. All material wholly-owned and majority-owned subsidiaries are consolidated unless GAAP requires otherwise.
BB&T holds investments in certain legal entities that are considered VIEs. VIEs are legal entities in which equity investors do not have sufficient equity at risk for the entity to independently finance its activities, or as a group, the holders of the equity investment at risk lack the power through voting or similar rights to direct the activities of the entity that most significantly impact its economic performance, or do not have the obligation to absorb the expected losses of the entity or the right to receive expected residual returns of the entity. Consolidation of a VIE is required if a reporting entity is the primary beneficiary of the VIE.
Investments in VIEs are evaluated to determine if BB&T is the primary beneficiary. This evaluation gives appropriate consideration to the design of the entity and the variability that the entity was designed to pass along, the relative power of each party, and to BB&T’s relative obligation to absorb losses or receive residual returns of the entity, in relation to such obligations and rights held by each party. During 2015, BB&T disposed of its variable interests in its Tender Option Bond program trusts, which allowed for tax-advantaged financing of certain debt instruments issued by tax-exempt entities. BB&T was considered the primary beneficiary of the Tender Option Bond program trusts, resulting in the consolidation of their assets and liabilities in prior years. BB&T also has variable interests in certain entities that were not required to be consolidated, including affordable housing and other partnership interests. Refer to the "Commitments and Contingencies" note for additional disclosures regarding BB&T’s significant VIEs.
BB&T accounts for unconsolidated partnerships and certain other investments using the equity method of accounting. BB&T records its portion of income or loss in other noninterest income in the Consolidated Statements of Income. These investments are periodically evaluated for impairment. BB&T also has investments in, and future funding commitments to, private equity investments, which are accounted for based on BB&T’s ownership and control rights specific to each investment.
Reclassifications
Certain amounts reported in prior periods’ consolidated financial statements have been reclassified to conform to the current presentation. Such reclassifications had no effect on previously reported cash flows, shareholders’ equity or net income.
87
Use of Estimates in the Preparation of Financial Statements
The preparation of financial statements in conformity with GAAP requires management to make estimates and assumptions that affect the reported amounts of assets and liabilities and disclosure of contingent assets and liabilities as of the date of the financial statements and the reported amounts of revenues and expenses during the reporting periods. Actual results could differ from those estimates. Material estimates that are particularly susceptible to significant change include the determination of the ACL, determination of fair value for financial instruments, valuation of goodwill, intangible assets and other purchase accounting related adjustments, benefit plan obligations and expenses, and tax assets, liabilities and expense.
Business Combinations
BB&T accounts for business combinations using the acquisition method of accounting. The accounts of an acquired entity are included as of the date of acquisition, and any excess of purchase price over the fair value of the net assets acquired is capitalized as goodwill.
BB&T typically issues common stock and/or pays cash for an acquisition, depending on the terms of the acquisition agreement. The value of common shares issued is determined based on the market price of the stock as of the closing of the acquisition.
Cash and Cash Equivalents
Cash and cash equivalents include cash and due from banks, interest-bearing deposits with banks and Federal funds sold and securities purchased under resale agreements or similar arrangements. Cash and cash equivalents have maturities of three months or less. Accordingly, the carrying amount of such instruments is considered a reasonable estimate of fair value.
Restricted Cash
Restricted cash primarily represents amounts posted as collateral for derivatives in a loss position.
Securities
Marketable investment securities are classified as HTM, AFS or trading. Interest income and dividends on securities are recognized in income on an accrual basis. Premiums and discounts on debt securities are amortized as an adjustment to interest income using the effective interest method. For MBS, prepayment speeds are evaluated quarterly in order to determine the estimated lives of the securities. When the estimated lives of MBS are changed, the amortization of premiums or discounts is adjusted with a corresponding charge or credit to interest income as if the current estimated lives had been applied since the acquisition of the securities.
Debt securities are classified as HTM when BB&T has both the intent and ability to hold the securities to maturity. These securities are reported at amortized cost.
Debt securities that may be sold to meet liquidity needs arising from unanticipated deposit and loan fluctuations, changes in regulatory capital requirements or unforeseen changes in market conditions are classified as AFS. AFS securities are reported at estimated fair value, with unrealized gains and losses reported in AOCI, net of deferred income taxes, in the shareholders’ equity section of the Consolidated Balance Sheets. Gains or losses realized from the sale of AFS securities are determined by specific identification and are included in noninterest income.
Each HTM and AFS security in a loss position is evaluated for OTTI. BB&T considers such factors as the length of time and the extent to which the fair value has been below amortized cost, long term expectations and recent experience regarding principal and interest payments, BB&T’s intent to sell and whether it is more likely than not that the Company would be required to sell those securities before the anticipated recovery of the amortized cost basis. The credit component of an OTTI loss is recognized in earnings and the non-credit component is recognized in AOCI in situations where BB&T does not intend to sell the security and it is more-likely-than-not that BB&T will not be required to sell the security prior to recovery. Subsequent to recognition of OTTI, an increase in expected cash flows is recognized as a yield adjustment over the remaining expected life of the security based on an evaluation of the nature of the increase.
88
Trading account securities, which include both debt and equity securities, are reported at fair value and included in other assets in the Consolidated Balance Sheets. Unrealized fair value adjustments, fees, and realized gains or losses from trading account activities (determined by specific identification) are included in noninterest income. Interest income on trading account securities is included in interest on other earning assets.
LHFS
BB&T accounts for new originations of residential and commercial mortgage LHFS at fair value. BB&T accounts for the derivatives used to economically hedge the LHFS at fair value. The fair value of LHFS is primarily based on quoted market prices for securities collateralized by similar types of loans. Direct loan origination fees and costs related to LHFS are not capitalized and are recorded as mortgage banking income in the case of the direct loan origination fees and primarily personnel expense in the case of the direct loan origination costs. Gains and losses on sales of residential mortgage loans are included in mortgage banking income. Gains and losses on sales of commercial LHFS are included in other noninterest income.
BB&T sells a significant portion of its fixed-rate commercial and conforming residential mortgage loan originations, which are typically converted into MBS by FHLMC, FNMA and GNMA and subsequently sold to other third party investors. BB&T records these transactions as a sale when the transferred loans are legally isolated from BB&T’s creditors and the other accounting criteria for a sale are met. Gains or losses recorded on these transactions are based on the net carrying amount of the loans sold and the fair value of related mortgage servicing, which BB&T generally retains on loans sold. Since quoted market prices are not typically available, BB&T estimates the fair value of these retained interests using modeling techniques to determine the net present value of expected future cash flows. Such models incorporate management’s best estimates of key variables, such as prepayment speeds, servicing costs and discount rates, that would be used by market participants based on the risks involved.
Loans and Leases
The Company’s accounting methods for loans differ depending on whether the loans are originated or purchased, and if purchased, whether or not the loans reflect credit deterioration since the date of origination such that it is probable at the date of acquisition that BB&T will be unable to collect all contractually required payments.
Originated Loans and Leases
Loans and leases that management has the intent and ability to hold for the foreseeable future are reported at their outstanding principal balances net of any unearned income, charge-offs, and unamortized fees and costs. The net amount of nonrefundable loan origination fees and certain direct costs associated with the lending process are deferred and amortized to interest income over the contractual lives of the loans using the effective interest method.
BB&T classifies loans and leases as past due when the payment of principal and interest based upon contractual terms is greater than
30 days
delinquent or if one payment is past due. When commercial loans are placed on nonaccrual status as described below, a charge-off is recorded, as applicable, to decrease the carrying value of such loans to the estimated recoverable amount. Retail loans are subject to mandatory charge-off at a specified delinquency date consistent with regulatory guidelines. As such, retail loans are subject to collateral valuation and charge-off, as applicable, when they are moved to nonaccrual status as described below.
Purchased Loans
Purchased loans are recorded at their fair value at the acquisition date. Credit discounts are included in the determination of fair value; therefore, an ALLL is not recorded at the acquisition date.
Purchased loans are evaluated upon acquisition and classified as either purchased impaired or purchased non-impaired. PCI loans reflect credit deterioration since origination such that it is probable at acquisition that BB&T will be unable to collect all contractually required payments. For PCI loans, expected cash flows at the acquisition date in excess of the fair value of loans are recorded as interest income over the life of the loans using a level yield method if the timing and amount of the future cash flows is reasonably estimable. Subsequent to the acquisition date, increases in cash flows over those expected at the acquisition date are recognized prospectively as interest income. Decreases in expected cash flows due to credit deterioration are recognized by recording an ALLL. For purchased non-impaired loans, the difference between the fair value and UPB of the loan at the acquisition date is amortized or accreted to interest income over the contractual life of the loans using the effective interest method. In the event of prepayment, the remaining unamortized amount is recognized in interest income.
89
TDRs
Modifications to a borrower’s debt agreement are considered TDRs if a concession is granted for economic or legal reasons related to a borrower’s financial difficulties that otherwise would not be considered. TDRs are undertaken in order to improve the likelihood of recovery on the loan and may take the form of modifications made with the stated interest rate lower than the current market rate for new debt with similar risk, other modifications to the structure of the loan that fall outside of normal underwriting policies and procedures, or in certain limited circumstances forgiveness of principal or interest. Modifications of PCI loans that are part of a pool accounted for as a single asset are not considered TDRs. TDRs can involve loans remaining on nonaccrual, moving to nonaccrual, or continuing on accruing status, depending on the individual facts and circumstances of the borrower. In circumstances where the TDR involves charging off a portion of the loan balance, BB&T typically classifies these TDRs as nonaccrual.
In connection with commercial TDRs, the decision to maintain a loan that has been restructured on accrual status is based on a current, well documented credit evaluation of the borrower’s financial condition and prospects for repayment under the modified terms. This evaluation includes consideration of the borrower’s current capacity to pay, which among other things may include a review of the borrower’s current financial statements, an analysis of cash flow available to pay debt obligations, and an evaluation of secondary sources of payment from the client and any guarantors. This evaluation also includes an evaluation of the borrower’s current willingness to pay, which may include a review of past payment history, an evaluation of the borrower’s willingness to provide information on a timely basis, and consideration of offers from the borrower to provide additional collateral or guarantor support. The credit evaluation may also include review of cash flow projections, consideration of the adequacy of collateral to cover all principal and interest and trends indicating improving profitability and collectability of receivables.
The evaluation of mortgage and retail loans includes an evaluation of the client’s debt to income ratio, credit report, property value, loan vintage, and certain other client-specific factors that impact their ability to make timely principal and interest payments on the loan.
Nonaccrual commercial TDRs may be returned to accrual status based on a current, well-documented credit evaluation of the borrower’s financial condition and prospects for repayment under the modified terms. This evaluation must include consideration of the borrower’s sustained historical repayment performance for a reasonable period (generally a minimum of
six months
) prior to the date on which the loan is returned to accrual status. Sustained historical repayment performance for a reasonable time prior to the TDR may be taken into account. In connection with retail TDRs, a NPL will be returned to accruing status when current as to principal and interest and upon a sustained historical repayment performance (generally a minimum of
six months
).
TDR classification may be removed for a loan upon the occurrence of a non-concessionary subsequent modification that is at market terms and within current underwriting guidelines.
NPAs
NPAs include NPLs and foreclosed property. Foreclosed property consists of real estate and other assets acquired as a result of customers’ loan defaults. BB&T’s policies for placing loans on nonaccrual status conform to guidelines prescribed by bank regulatory authorities. The majority of commercial loans and leases are placed on nonaccrual status when it is probable that principal or interest is not fully collectible, or generally when principal or interest becomes
90 days
past due, whichever occurs first. Other lending subsidiaries’ loans, which includes both retail and commercial loans, are placed on nonaccrual status generally when principal and interest becomes
90 days
past due. Direct retail, mortgage and sales finance loans are placed on nonaccrual status at varying intervals, based on the type of product, generally when principal and interest becomes between
90 days
and
120 days
past due. PCI loans are considered to be performing due to the application of the expected cash flows method.
Residential mortgage NPLs secured by 1-4 family properties are generally charged down to the fair value of the collateral securing the loan less costs to sell upon becoming
120 days
past due, unless the shortfall is covered by private mortgage insurance. Nonperforming residential mortgage TDRs generally incur charge-offs at
120 days
. If a known loss is identified prior to these time periods, the applicable charge-off occurs immediately. BB&T recognizes charge-offs on government guaranteed NPLs to the extent that the carrying value of the NPL exceeds the guaranteed amount.
90
During the fourth quarter of 2015, BB&T implemented a residential mortgage and direct retail lending policy change to move loans to nonaccrual status at
120 days
past due instead of
180 days
.
Charge-offs are recorded on revolving credit loans after they become
180 days
past due and commercial bank card balances after they become
90 days
past due. Unpaid fees and finance charges are reversed against interest income in the period in which the charge-off occurs. Other retail loans not secured by 1-4 family properties are charged down to the fair value of the collateral securing the loan less costs to sell upon becoming between
90
and
120 days
past due, depending on the type of loan.
Secured retail loans discharged through bankruptcy are charged down to the fair value of the related collateral, and the remaining balance is placed on nonaccrual status.
Certain past due loans may remain on accrual status if management determines that it does not have concern over the collectability of principal and interest. Generally, when loans are placed on nonaccrual status, accrued interest receivable is reversed against interest income in the current period and amortization of deferred loan fees and expenses is suspended. Interest payments received thereafter are applied as a reduction to the remaining principal balance as long as concern exists as to the ultimate collection of the principal. Nonaccrual mortgage loans are accounted for using the cash basis. Loans and leases are generally removed from nonaccrual status when they become current as to both principal and interest and concern no longer exists as to the collectability of principal and interest.
Assets acquired as a result of foreclosure are subsequently carried at the lower of cost or net realizable value. Net realizable value equals fair value less estimated selling costs. Any excess of cost over net realizable value at the time of foreclosure is charged to the ALLL. NPAs are subject to periodic revaluations of the collateral underlying impaired loans and foreclosed real estate. The periodic revaluations are generally based on the appraised value of the property and may include additional liquidity adjustments based upon the expected retention period. BB&T’s policies require that valuations be updated at least annually and that upon foreclosure, the valuation must not be more than
six months
old, otherwise an updated appraisal is required. Routine maintenance costs, other costs of ownership, subsequent declines in fair value and net losses on disposal are included in foreclosed property expense.
ACL
The ACL includes the ALLL and the RUFC. The ACL represents management’s best estimate of probable credit losses inherent in the loan and lease portfolios and off-balance sheet lending commitments at the balance sheet date. Estimates for loan and lease losses are determined by analyzing historical loan and lease losses, historical loan and lease migration to charge-off experience, current trends in delinquencies and charge-offs, expected cash flows on PCI loans, current assessment of impaired loans and leases, the results of regulatory examinations and changes in the size, composition and risk assessment of the loan and lease portfolio. As part of this process, BB&T develops a series of loss estimate factors, which are modeled projections of the frequency, timing and severity of losses. Changes to the ACL are made by charges to the provision for credit losses, which is reflected in the Consolidated Statements of Income. Loan or lease balances deemed to be uncollectible are charged off against the ALLL. Recoveries of amounts previously charged off are credited to the ALLL. The methodology used to determine the RUFC is inherently similar to that used to determine the collectively evaluated component of the ALLL, adjusted for factors specific to binding commitments, including the probability of funding and exposure at default. While management uses the best information available to establish the ACL, future adjustments may be necessary if economic conditions differ substantially from the assumptions used in computing the ACL or, if required by regulators based upon information available to them at the time of their examinations.
Accounting standards require the presentation of certain disclosure information at the portfolio segment level, which represents the level at which an entity develops and documents a systematic methodology to determine its ACL. BB&T concluded that its loan and lease portfolio consists of three portfolio segments; commercial, retail and PCI. The commercial portfolio segment was identified based on the risk-based approach used to estimate the ALLL for the vast majority of these loans. The retail portfolio segment was identified based on the delinquency-based approach used to estimate the ALLL. The PCI portfolio segment was identified based on the expected cash flows approach used to estimate the ALLL. See the "Loans and ACL" note for additional information about the classes of financing receivables included within each of these loan portfolio segments.
The entire amount of the ACL is available to absorb losses on any loan category or lending-related commitment.
91
The following provides a description of accounting policies and methodologies related to each of the portfolio segments:
Commercial
The vast majority of loans in the commercial lending portfolio are assigned risk ratings based on an assessment of conditions that affect the borrower’s ability to meet contractual obligations under the loan agreement. This process includes reviewing borrowers’ financial information, historical payment experience, credit documentation, public information, and other information specific to each borrower. Risk ratings are reviewed on an annual basis for all credit relationships with total credit exposure of
$1 million
or more, or at any point management becomes aware of information affecting the borrowers’ ability to fulfill their obligations.
|
Risk Rating
|
|
Description
|
||
|
Pass
|
|
Loans not considered to be problem credits
|
||
|
Special Mention
|
|
Loans that have a potential weakness deserving management’s close attention
|
||
|
Substandard
|
|
Loans for which a well-defined weakness has been identified that may put full collection of contractual cash flows at risk
|
||
For commercial clients with total credit exposure less than
$1 million
, BB&T has developed an automated loan review system to identify and proactively manage accounts with a higher risk of loss. The "score" produced by this automated system is updated monthly.
To establish a reserve, BB&T's policy is to review all commercial lending relationships with an outstanding nonaccrual balance of
$3 million
or more. While this review is largely focused on the borrower’s ability to repay the loan, BB&T also considers the capacity and willingness of a loan’s guarantors to support the debt service on the loan as a secondary source of repayment. When a guarantor exhibits the documented capacity and willingness to support the loan, BB&T may consider extending the loan maturity and/or temporarily deferring principal payments if the ultimate collection of both principal and interest is not in question. In these cases, BB&T may deem the loan to not be impaired due to the documented capacity and willingness of the guarantor to repay the loan. Loans are considered impaired when the borrower (or guarantor in certain circumstances) does not have the cash flow capacity or willingness to service the debt according to contractual terms, or it does not appear reasonable to assume that the borrower will continue to pay according to the contractual agreement. BB&T establishes a specific reserve for each loan that has been deemed impaired based on the criteria outlined above. The amount of the reserve is based on the present value of expected cash flows discounted at the loan’s effective interest rate and/or the value of collateral, net of costs to sell. In addition, BB&T reviews any collateral-dependent commercial loan balances between
$1 million
and
$3 million
to establish a specific reserve based on the underlying collateral value, net of costs to sell.
BB&T also has a review process related to TDRs and other commercial impaired loans. In connection with this process, BB&T establishes reserves related to these loans that are calculated using an expected cash flow approach. These discounted cash flow analyses incorporate adjustments to future cash flows that reflect management’s best estimate of the default risk related to TDRs based on a combination of historical experience and management judgment.
BB&T also maintains reserves for collective impairment that reflect an estimate of losses related to non-impaired commercial loans as of the balance sheet date. Embedded loss estimates for BB&T’s commercial loan portfolio are based on estimated migration rates, which are based on historical experience, and current risk mix as indicated by the risk grading or scoring process described above. Embedded loss estimates may be adjusted to reflect current economic conditions and current portfolio trends including credit quality, concentrations, aging of the portfolio, and significant policy and underwriting changes.
Retail
The majority of the ALLL related to the retail lending portfolio is calculated on a collective basis using delinquency status, which is the primary factor considered in determining whether a retail loan should be classified as nonaccrual. Embedded loss estimates for BB&T’s retail lending portfolio are based on estimated migration rates that are developed based on historical experience, and current risk mix as indicated by prevailing delinquency rates. These estimates may be adjusted to reflect current economic conditions and current portfolio trends. The remaining portion of the ALLL related to the retail lending portfolio relates to loans that have been deemed impaired based on their classification as a TDR at the balance sheet date. BB&T establishes specific reserves related to these TDRs using an expected cash flow approach. The ALLL for retail TDRs is based on discounted cash flow analyses that incorporate adjustments to future cash flows that reflect management’s best estimate of the default risk related to TDRs based on a combination of historical experience and management judgment.
92
PCI
PCI loans (including all loans acquired in an FDIC-assisted transaction) are aggregated into loan pools based upon common risk characteristics. The ALLL for each loan pool is based on an analysis that is performed each period to estimate the expected cash flows. To the extent that the expected cash flows of a loan pool have decreased due to credit deterioration, BB&T establishes an ALLL.
Assets Acquired from the FDIC and Related FDIC Loss Share Receivable/Payable
Certain loans, securities and other assets were acquired from the FDIC in connection with the Colonial transaction and were previously divided between two loss sharing agreements, the single family loss share agreement and the commercial loss share agreement. During 2014, the loss sharing provisions related to the commercial loss share agreement expired, but certain gain/recovery sharing was to occur through September 2017. During the third quarter of 2016, the loss share agreements were terminated. Refer to the "Securities" note and the "Loans and ACL" note for additional information. The FDIC loss share receivable included amounts related to net reimbursements that were expected to be received from the FDIC and was included in other assets on the Consolidated Balance Sheets for periods prior to the termination. The recognized amounts related to expected future payments to the FDIC, including any amounts that resulted from the aggregate loss calculation, were included in accounts payable and other liabilities for periods prior to the termination.
The income statement effect of the changes in the FDIC loss share receivable/payable included the accretion due to discounting and changes in expected net reimbursements. Decreases in expected net reimbursements, including the amounts expected to be paid to the FDIC as a result of the aggregate loss calculation, were recognized in income prospectively over the term of the loss share agreements consistent with the approach taken to recognize increases in cash flows on acquired loans. Increases in expected reimbursements were recognized in income in the same period that the provision for credit losses for the related loans was recognized. Subsequent to the recognition of ALLL related to specific assets, any decrease in expected net reimbursement was recognized in income in the same period that the provision for loan losses for the related loans was released.
Premises and Equipment
Premises, equipment, capital leases and leasehold improvements are stated at cost less accumulated depreciation and amortization. Land is stated at cost. In addition, purchased software and costs of computer software developed for internal use are capitalized provided certain criteria are met. Depreciation and amortization are computed principally using the straight-line method over the estimated useful lives of the related assets. Leasehold improvements are amortized on a straight-line basis over the lesser of the lease terms, including certain renewals that were deemed probable at lease inception, or the estimated useful lives of the improvements. Capitalized leases are amortized using the same methods as premises and equipment over the estimated useful lives or lease terms, whichever is less. Obligations under capital leases are amortized using the effective interest method to allocate payments between principal reduction and interest expense. Rent expense and rental income on operating leases is recorded using the straight-line method over the appropriate lease terms.
Bank-Owned Life Insurance
Life insurance policies on certain directors, officers, and employees, for which BB&T is the owner and beneficiary are stated at the cash surrender value within other assets in the Consolidated Balance Sheet. Changes in cash surrender value and proceeds from insurance benefits are recorded in income from bank-owned life insurance in the Consolidated Statements of Income.
Income Taxes
Deferred income taxes have been provided when different accounting methods have been used in determining income for income tax purposes and for financial reporting purposes. Deferred tax assets and liabilities are recognized based on future tax consequences attributable to differences between the financial statement carrying values of assets and liabilities and their tax bases. In the event of changes in the tax laws, deferred tax assets and liabilities are adjusted in the period of the enactment of those changes, with the cumulative effects included in the current year’s income tax provision. Net deferred tax assets are included in other assets, and net deferred tax liabilities are included in accounts payable and other liabilities, in the Consolidated Balance Sheets.
Interest and penalties related to income taxes are recognized as a component of the provision for income taxes in the Consolidated Statements of Income.
93
Derivative Financial Instruments
A derivative is a financial instrument that derives its cash flows, and therefore its value, by reference to an underlying instrument, index or referenced interest rate. These instruments include interest rate swaps, caps, floors, collars, financial forwards and futures contracts, swaptions, when-issued securities, foreign exchange contracts and options written and purchased. BB&T uses derivatives primarily to manage economic risk related to securities, commercial loans, MSRs and mortgage banking operations, long-term debt and other funding sources. BB&T also uses derivatives to facilitate transactions on behalf of its clients. The fair value of derivatives in a gain or loss position is included in other assets or liabilities, respectively, on the Consolidated Balance Sheets. Cash collateral posted for derivative instruments in a loss position is included in restricted cash on the Consolidated Balance Sheets.
BB&T classifies its derivative financial instruments as either (1) a fair value hedge - hedge of an exposure to changes in the fair value of a recorded asset or liability, (2) a cash flow hedge - hedge of an exposure to changes in the cash flows of a recognized asset, liability or forecasted transaction, (3) a hedge of a net investment in a subsidiary, or (4) derivatives not designated as hedges. Changes in the fair value of derivatives not designated as hedges are recognized in current period earnings. BB&T has master netting agreements with the derivatives dealers with which it does business, but BB&T presents gross assets and liabilities on the Consolidated Balance Sheets.
BB&T uses the long-haul method to assess hedge effectiveness. At inception and at least quarterly over the life of the hedge, BB&T documents its analysis of actual and expected hedge effectiveness. This analysis includes techniques such as regression analysis and hypothetical derivatives to demonstrate that the hedge has been, and is expected to be, highly effective in off-setting corresponding changes in the fair value or cash flows of the hedged item. For a qualifying fair value hedge, changes in the value of the derivatives that have been highly effective as hedges are recognized in current period earnings along with the corresponding changes in the fair value of the designated hedged item attributable to the risk being hedged. For a qualifying cash flow hedge, changes in the fair value of the derivatives that have been highly effective are recognized in OCI until the related cash flows from the hedged item are recognized in earnings.
For either fair value hedges or cash flow hedges, ineffectiveness may be recognized to the extent that changes in the value of the derivative instruments do not perfectly offset changes in the value of the hedged items. If the hedge ceases to be highly effective, BB&T discontinues hedge accounting and recognizes the interim changes in fair value in current period earnings. If a derivative that qualifies as a fair value or cash flow hedge is terminated or de-designated, the cumulative changes in value are recognized in income over the life of the hedged item (fair value hedge) or in the period in which the hedged item affects earnings (cash flow hedge). Immediate recognition in earnings is required upon sale or extinguishment of the hedged item (fair value hedge) or if it is probable that the hedged cash flows will not occur (cash flow hedge).
Derivatives used to manage economic risk not designated as hedges are primarily economic risk management instruments used to manage economic risk from MSRs and mortgage banking operations, with gains or losses included in mortgage banking income. In connection with its mortgage banking activities, BB&T enters into loan commitments to fund residential mortgage loans at specified rates and for specified periods of time. To the extent that BB&T’s interest rate lock commitments relate to loans that will be held for sale upon funding, they are also accounted for as derivatives, with gains or losses included in mortgage banking income. Gains and losses on other derivatives used to manage economic risk are primarily associated with client derivative activity and are included in other income.
Credit risk resulting from derivatives arises when amounts receivable from a counterparty exceed those payable to the same counterparty, taking into account posted collateral. The risk of loss with respect to over-the-counter derivatives, eligible margin loans and repurchase-style transactions is addressed by subjecting counterparties to a credit review and approval process similar to the process in making loans or other extensions of credit and/or by requiring collateral.
Derivative dealer counterparties operate under agreements to provide cash and/or highly liquid securities on a daily basis for unsecured credit exposure beyond negotiated limits, while client derivatives that are associated with loans are cross-collateralized with the loan.
BB&T only transacts with dealer counterparties that are national market makers with strong credit standings and requires liquid collateral (cash or government securities) to secure credit exposure. Due to these factors, the fair value of derivatives with dealer counterparties is primarily based on the interest rate mark of each trade. The fair value of interest rate derivatives with clients includes a credit valuation adjustment.
94
Collateral obtained to secure margin loans includes equities, corporate and municipal securities, and repurchase-style transactions are generally secured by government and agency securities. The value of collateral for margin loans and repurchase-style transactions is monitored daily with settlement required when changes in value exceed established limits by counterparty. Due to the liquid nature of collateral, the frequency of transactions and collateral monitoring, a reserve for credit loss is established only when a risk of loss is identified.
Goodwill and Other Intangible Assets
Goodwill represents the cost in excess of the fair value of net assets acquired (including identifiable intangibles) in transactions accounted for as business combinations. BB&T allocates goodwill to the reporting unit(s) that receives significant benefits from the acquisition. Goodwill is tested at least annually for impairment as of October 1st each year and more frequently if circumstances exist that indicate a possible reduction in the fair value of the business below its carrying value. BB&T measures impairment using the present value of estimated future cash flows. Discount rates are based upon the cost of capital specific to the industry in which the reporting unit operates. If the carrying value of the reporting unit exceeds its fair value, a second analysis is performed to measure the fair value of all assets and liabilities. If, based on the second analysis, it is determined that the fair value of the assets and liabilities of the reporting unit is less than the carrying value, BB&T would recognize impairment for the excess of carrying value over fair value.
CDI and other intangible assets include premiums paid for acquisitions of core deposits and other identifiable intangible assets. Intangible assets other than goodwill, which are determined to have finite lives, are amortized based upon the estimated economic benefits received.
MSRs
BB&T has two primary classes of MSRs for which it separately manages the economic risks: residential and commercial. Both classes of MSRs are recorded on the Consolidated Balance Sheets primarily at fair value with changes in fair value recorded as a component of mortgage banking income. Various derivative instruments are used to mitigate the income statement effect of changes in fair value due to changes in valuation inputs and assumptions of the MSRs.
Equity-Based Compensation
BB&T maintains various equity-based compensation plans that provide for the granting of stock options (incentive and nonqualified), stock appreciation rights, restricted stock, RSUs, performance units and performance shares to selected employees and directors. BB&T values share-based awards at the grant date fair value and recognizes the expense over the requisite service period taking into account retirement eligibility.
Pension and Postretirement Benefit Obligations
BB&T offers various pension plans and postretirement benefit plans to employees. Calculation of the obligations and related expenses under these plans requires the use of actuarial valuation methods and assumptions. The discount rate assumption used to measure the postretirement benefit obligations is set by reference to a high quality corporate bond yield curve and the individual characteristics of the plan such as projected cash flow patterns and payment durations. The expected long-term rate of return on assets is based on the expected returns for each major asset class in which the plan invests, adjusted for the weight of each asset class in the target mix.
Insurance Income
Insurance commission revenue is generally recognized at the later of the billing date or the effective date of the related insurance policies. Insurance premiums from underwriting activities are recognized as income over the policy term. The portion of premiums that will be earned in the future is deferred and included in accounts payable and other liabilities in the Consolidated Balance Sheets.
Segments
Segment results are presented based on internal management accounting policies that were designed to support BB&T’s strategic objectives. The Other, Treasury and Corporate segment includes financial data from subsidiaries below the quantitative and qualitative thresholds requiring disclosure. Refer to the "Operating Segments" note for additional disclosures.
95
Changes in Accounting Principles and Effects of New Accounting Pronouncements
Standards Adopted During
Year Ended December 31, 2016
- BB&T adopted the following guidance effective January 1,
2016
(unless otherwise specified), none of which were material to the consolidated financial statements:
Derivatives and Hedging
(adopted March 2016)
-
clarified that derivative instrument novations do not require dedesignation of the related hedging relationship provided that all other hedge accounting criteria continue to be met.
Fair Value Measurement
-
eliminated the requirement to classify in the fair value hierarchy any investments for which fair value is measured at net asset value per share using the practical expedient.
Internal-Use Software
- requires the software license element of a cloud computing arrangement be accounted for consistent with the acquisition of other software licenses; otherwise, the arrangement should be accounted for as a service contract.
Debt Issuance Costs
-
requires that debt issuance costs related to a recognized debt liability be presented in the balance sheet as a direct deduction from the carrying amount of that debt liability.
Consolidation
-
provides an additional requirement for a limited partnership or similar entity to qualify as a voting interest entity, amending the criteria for consolidating such an entity and eliminating the deferral provided under previous guidance for investment companies. In addition, the new guidance amends the criteria for evaluating fees paid to a decision maker or service provider as a variable interest and amends the criteria for evaluating the effect of fee arrangements and related parties on a VIE primary beneficiary determination.
Standards Adopted Subsequent to
December 31, 2016
or Not Yet Adopted
- the adoption of the guidance was not material, or for standards not yet adopted is not expected to be material, to the consolidated financial statements unless otherwise specified:
Stock Compensation
(adopted January 1, 2017)
-
eliminates the concept of additional paid-in capital pools for equity-based awards and requires that the related excess tax benefits and tax deficiencies be classified as an operating activity in the statement of cash flows. The guidance also allows entities to make a one-time policy election to account for forfeitures when they occur, instead of accruing compensation cost based on the number of awards expected to vest. Additionally, the guidance changes the requirement for an award to qualify for equity classification by permitting tax withholding up to the maximum statutory tax rate instead of the minimum statutory tax rate. Cash paid by an employer when directly withholding shares for tax withholding purposes should be classified as a financing activity in the Statement of Cash Flows. The Company has elected to account for forfeitures of equity-based awards when they occur.
Investments
(adopted January 1, 2017)
-
eliminates the requirement to retroactively adjust the financial statements when a change in ownership or influence causes an existing investment to qualify for the equity method of accounting. Also requires the investor to add the cost of acquiring the additional interest in the investee to the current basis of the investor's previously held interest and adopt the equity method of accounting as of the date the investment becomes qualified for equity method accounting.
Derivatives and Hedging
(adopted January 1, 2017) - clarifies that an exercise contingency does not need to be evaluated to determine whether it relates to interest rates and credit risk in an embedded derivative analysis. An entity performing the assessment will be required to assess the embedded call or put options solely in accordance with the pre-existing decision sequence.
Business Combinations
(adopted January 1, 2017) -
provides clarification on the definition of a business and provides criteria to aid in the assessment of whether an integrated set of assets and activities constitutes a business.
Statement of Cash Flows
-
requires restricted cash and restricted cash equivalents to be included with cash and cash equivalents when reconciling the beginning-of-period and end-of-period total amounts shown on the statement of cash flows. This guidance is effective for fiscal years beginning after December 15, 2017 and interim periods within those fiscal years. The adoption of this guidance will only affect the Consolidated Statements of Cash Flows.
96
Statement of Cash Flows
-
clarifies the classification within the statement of cash flows for certain transactions, including debt extinguishment costs, zero-coupon debt, contingent consideration related to business combinations, insurance proceeds, equity method distributions and beneficial interests in securitizations. The guidance also clarifies that cash flows with aspects of multiple classes of cash flows or that cannot be separated by source or use should be classified based on the activity that is likely to be the predominant source or use of cash flows for the item. This guidance is effective for fiscal years beginning after December 15, 2017 and interim periods within those fiscal years.
Liabilities
-
requires companies to recognize breakage on prepaid stored-value products in accordance with the recently issued guidance on
Revenue from Contracts with Customers
. This guidance is effective for fiscal years beginning after December 15, 2017 and interim periods within those fiscal years.
Revenue from Contracts with Customers
-
requires an entity to recognize revenue to depict the transfer of promised goods or services to customers in an amount that reflects the consideration to which the company expects to be entitled in exchange for those goods or services. The guidance is effective for interim and annual reporting periods beginning after December 15, 2017. Because the guidance does not apply to revenue associated with financial instruments, including loans and securities, the new guidance is not expected to have a material impact on the components of the Consolidated Statement of Income most closely associated with financial instruments, including securities gains/losses and interest income. The Company is currently evaluating this guidance to determine the impact on other components of noninterest income.
Financial Instruments
-
requires the majority of equity investments to be measured at fair value with changes in fair value recognized in net income, excluding equity investments that are consolidated or accounted for under the equity method of accounting. The new guidance allows equity investments without readily determinable fair values to be measured at cost minus impairment, with a qualitative assessment required to identify impairment. For financial instruments recorded at amortized cost, the new guidance requires public companies to use exit prices to measure the fair value for disclosure purposes, eliminates the disclosure requirements related to measurement assumptions and requires separate presentation of financial assets and liabilities based on form and measurement category. In addition, for liabilities measured at fair value under the fair value option, the changes in fair value due to changes in instrument-specific credit risk should be recognized in OCI. This guidance is effective for fiscal years beginning after December 15, 2017 and interim periods within those fiscal years.
Leases
-
requires lessees to recognize assets and liabilities related to certain operating leases on the balance sheet. The new guidance also requires additional disclosures by lessees and contains targeted changes to accounting by lessors. This guidance is effective for fiscal years beginning after December 15, 2018 and interim periods within those fiscal years. Upon adoption, the Company expects to report higher assets and liabilities as a result of including additional leases on the Consolidated Balance Sheet.
Credit Losses
-
replaces the incurred loss impairment methodology in current GAAP with an expected credit loss methodology and requires consideration of a broader range of information to determine credit loss estimates. Financial assets measured at amortized cost will be presented at the net amount expected to be collected by using an allowance for credit losses. Purchased credit deteriorated loans will receive an allowance account for expected credit losses at the acquisition date that represents a component of the purchase price allocation. Credit losses relating to AFS debt securities will be recorded through an allowance for expected credit losses, with such allowance limited to the amount by which fair value is below amortized cost. An allowance will be established for estimated credit losses on HTM securities. This guidance is effective for fiscal years beginning after December 15, 2019 and interim periods within those fiscal years. Upon adoption, the Company expects that the ACL will likely be materially higher; however, the Company is still in the process of determining the magnitude of the increase and its impact on the Consolidated Financial Statements.
Intangibles—Goodwill and Other
-
simplifies the measurement of goodwill impairment. An entity will no longer perform a hypothetical purchase price allocation to measure goodwill impairment. Instead, impairment will be measured using the difference between the carrying amount and the fair value of the reporting unit. This guidance is effective for impairment tests in fiscal years beginning after December 15, 2019 and interim periods within those fiscal years.
97
On April 1, 2016, BB&T acquired all of the outstanding stock of National Penn, which conducted its business operations primarily through its bank subsidiary, National Penn Bank, which was merged into Branch Bank. National Penn operated other subsidiaries in Pennsylvania, New Jersey and Maryland to provide a wide range of retail and commercial banking and financial products and services. National Penn also operated a trust and investment company, an asset management company and a property and casualty insurance brokerage company. National Penn had
126
banking offices as of the acquisition date. BB&T acquired National Penn in order to increase BB&T’s market share in these areas.
The acquisition of National Penn constituted a business combination. Accordingly, the assets acquired and liabilities assumed are presented at their fair values in the table below. The determination of fair value requires management to make estimates about discount rates, future expected cash flows, market conditions and other future events that are highly subjective in nature and subject to change. These fair value estimates are considered preliminary and are subject to change for up to one year after the closing date of the acquisition as additional information becomes available. Immaterial amounts of the intangible assets recognized are deductible for income tax purposes.
|
|
National Penn
|
|||||||
|
|
UPB
|
Fair Value
|
||||||
|
|
(Dollars in millions)
|
|||||||
|
Assets acquired:
|
|
|
||||||
|
Cash, due from banks and federal funds sold
|
|
$
|
216
|
|
||||
|
Securities
|
|
2,499
|
|
|||||
|
Loans and leases:
|
||||||||
|
Commercial and industrial
|
$
|
2,817
|
|
2,596
|
|
|||
|
CRE-income producing properties
|
1,450
|
|
1,202
|
|
||||
|
CRE-construction and development
|
165
|
|
127
|
|
||||
|
Direct retail lending
|
801
|
|
767
|
|
||||
|
Revolving credit
|
7
|
|
7
|
|
||||
|
Residential mortgage
|
1,217
|
|
1,004
|
|
||||
|
Sales finance
|
166
|
|
162
|
|
||||
|
PCI
|
181
|
|
124
|
|
||||
|
Total loans and leases
|
$
|
6,804
|
|
5,989
|
|
|||
|
Goodwill
|
|
795
|
|
|||||
|
CDI
|
|
67
|
|
|||||
|
Other assets
|
|
503
|
|
|||||
|
Total assets acquired
|
|
10,069
|
|
|||||
|
Liabilities assumed:
|
|
|
||||||
|
Deposits:
|
|
|
||||||
|
Noninterest-bearing deposits
|
|
1,209
|
|
|||||
|
Interest-bearing deposits
|
|
5,420
|
|
|||||
|
Total deposits
|
|
6,629
|
|
|||||
|
Debt
|
|
1,756
|
|
|||||
|
Other liabilities
|
|
66
|
|
|||||
|
Total liabilities assumed
|
|
8,451
|
|
|||||
|
Consideration paid
|
$
|
1,618
|
|
|||||
|
Cash paid
|
|
$
|
555
|
|
||||
|
Fair value of common stock issued, including replacement equity awards
|
|
1,063
|
|
|||||
The purchase price allocation for this acquisition has not been finalized. The following is a description of the methods used to determine the fair values of significant assets and liabilities.
Cash, due from banks and federal funds sold:
The carrying amount of these assets is a reasonable estimate of fair value based on the short-term nature of these assets.
Securities:
Fair values for securities are based on quoted market prices, where available. If quoted market prices are not available, fair value estimates are based on observable inputs including quoted market prices for similar instruments, quoted market prices that are not in an active market or other inputs that are observable in the market. In the absence of observable inputs, fair value is estimated based on pricing models and/or discounted cash flow methodologies.
98
Loans and leases:
Fair values for loans were based on a discounted cash flow methodology that considered factors including the type of loan and related collateral, classification status, fixed or variable interest rate, term of loan, amortization status and current discount rates. Loans were grouped together according to similar characteristics and were treated in the aggregate when applying various valuation techniques. The discount rates used for loans are based on current market rates for new originations of comparable loans and include adjustments for liquidity concerns. The discount rate does not include a factor for credit losses as that has been included as a reduction to the estimated cash flows.
CDI:
This intangible asset represents the value of the relationships with deposit customers. The fair value was estimated based on a discounted cash flow methodology that gave appropriate consideration to expected customer attrition rates, cost of the deposit base, reserve requirements and the net maintenance cost attributable to customer deposits. The CDI is being amortized over
10 years
based upon the estimated economic benefits received.
Deposits:
The fair values used for the demand and savings deposits by definition equal the amount payable on demand at the acquisition date. The fair values for time deposits are estimated using a discounted cash flow calculation that applies interest rates currently being offered to the contractual interest rates on such time deposits.
Debt:
The fair values of long-term debt instruments are estimated based on quoted market prices for the instrument if available, or for similar instruments if not available, or by using discounted cash flow analyses, based on current incremental borrowing rates for similar types of instruments.
Other Acquisitions and Divestitures
On April 1, 2016, BB&T purchased insurance broker Swett & Crawford from Cooper Gay Swett & Crawford for
$461 million
in cash. The purchase price allocation for this acquisition has not been finalized. Refer to the “Goodwill and Other Intangible Assets” note in the "Notes to Consolidated Financial Statements" for additional information.
See BB&T's Annual Report on Form 10-K for the year ended December 31, 2015 for additional information related to the following transactions.
During the third quarter of 2015, BB&T acquired Susquehanna Bancshares, Inc., resulting in the addition of
$18.3 billion
in assets and
$14.1 billion
in deposits. Susquehanna had
245
financial centers in Pennsylvania, Maryland, New Jersey and West Virginia.
During the second quarter of 2015, BB&T acquired The Bank of Kentucky, which provided
$2.0 billion
in assets,
$1.6 billion
in deposits and
32
financial centers.
During the second quarter of 2015, BB&T purchased additional ownership interest in AmRisc, LP from the noncontrolling owners in exchange for cash and full ownership of American Coastal, which resulted in a net charge to equity.
During the first quarter of 2015, BB&T acquired
41
financial centers in Texas, which provided
$238 million
in assets and
$1.9 billion
in deposits.
99
|
|
Amortized Cost
|
Gross Unrealized
|
Fair Value
|
|||||||||||||
|
December 31, 2016
|
Gains
|
Losses
|
||||||||||||||
|
|
(Dollars in millions)
|
|||||||||||||||
|
AFS securities:
|
|
|
|
|
||||||||||||
|
U.S. Treasury
|
$
|
2,669
|
|
$
|
2
|
|
$
|
84
|
|
$
|
2,587
|
|
||||
|
GSE
|
190
|
|
—
|
|
10
|
|
180
|
|
||||||||
|
Agency MBS
|
21,819
|
|
13
|
|
568
|
|
21,264
|
|
||||||||
|
States and political subdivisions
|
2,198
|
|
56
|
|
49
|
|
2,205
|
|
||||||||
|
Non-agency MBS
|
446
|
|
233
|
|
—
|
|
679
|
|
||||||||
|
Other
|
11
|
|
—
|
|
—
|
|
11
|
|
||||||||
|
Total AFS securities
|
$
|
27,333
|
|
$
|
304
|
|
$
|
711
|
|
$
|
26,926
|
|
||||
|
HTM securities:
|
|
|
|
|||||||||||||
|
U.S. Treasury
|
$
|
1,098
|
|
$
|
20
|
|
$
|
—
|
|
$
|
1,118
|
|
||||
|
GSE
|
2,197
|
|
14
|
|
30
|
|
2,181
|
|
||||||||
|
Agency MBS
|
13,225
|
|
40
|
|
180
|
|
13,085
|
|
||||||||
|
States and political subdivisions
|
110
|
|
—
|
|
—
|
|
110
|
|
||||||||
|
Other
|
50
|
|
2
|
|
—
|
|
52
|
|
||||||||
|
Total HTM securities
|
$
|
16,680
|
|
$
|
76
|
|
$
|
210
|
|
$
|
16,546
|
|
||||
|
|
Amortized Cost
|
Gross Unrealized
|
Fair Value
|
|||||||||||||
|
December 31, 2015
|
Gains
|
Losses
|
||||||||||||||
|
|
(Dollars in millions)
|
|||||||||||||||
|
AFS securities:
|
|
|
|
|
||||||||||||
|
U.S. Treasury
|
$
|
1,836
|
|
$
|
2
|
|
$
|
6
|
|
$
|
1,832
|
|
||||
|
GSE
|
51
|
|
—
|
|
—
|
|
51
|
|
||||||||
|
Agency MBS
|
20,463
|
|
22
|
|
439
|
|
20,046
|
|
||||||||
|
States and political subdivisions
|
2,312
|
|
103
|
|
40
|
|
2,375
|
|
||||||||
|
Non-agency MBS
|
683
|
|
306
|
|
—
|
|
989
|
|
||||||||
|
Other
|
4
|
|
—
|
|
—
|
|
4
|
|
||||||||
|
Total AFS securities
|
$
|
25,349
|
|
$
|
433
|
|
$
|
485
|
|
$
|
25,297
|
|
||||
|
HTM securities:
|
|
|
|
|
||||||||||||
|
U.S. Treasury
|
$
|
1,097
|
|
$
|
22
|
|
$
|
—
|
|
$
|
1,119
|
|
||||
|
GSE
|
5,045
|
|
16
|
|
98
|
|
4,963
|
|
||||||||
|
Agency MBS
|
12,267
|
|
70
|
|
22
|
|
12,315
|
|
||||||||
|
States and political subdivisions
|
63
|
|
—
|
|
—
|
|
63
|
|
||||||||
|
Other
|
58
|
|
2
|
|
1
|
|
59
|
|
||||||||
|
Total HTM securities
|
$
|
18,530
|
|
$
|
110
|
|
$
|
121
|
|
$
|
18,519
|
|
||||
During the third quarter of 2016, Branch Bank entered into an early termination agreement with the FDIC that terminated the loss share agreements. As a result of the settlement, no future loss sharing or gain sharing will occur related to the Colonial acquisition. The accounting for the affected securities has not changed; however, these securities have been classified into their respective categories and prior periods have been revised to conform to the current presentation.
During 2015, BB&T transferred
$517 million
of HTM securities to AFS. These securities, which were sold in 2015, represented securities collateralized by student loans for which there was a significant increase in risk weighting as a result of the implementation of Basel III.
Certain investments in marketable debt securities and MBS issued by FNMA and FHLMC exceeded 10% of shareholders’ equity at
December 31, 2016
. The FNMA investments had total amortized cost and fair value of
$13.9 billion
and
$13.6 billion
, respectively. The FHLMC investments had total amortized cost and fair value of
$7.8 billion
and
$7.6 billion
, respectively.
100
The following table reflects changes in credit losses on securities with OTTI where a portion of the unrealized loss was recognized in OCI. Assets acquired from the FDIC were excluded from this table prior to the termination of the loss share agreements.
|
|
Year Ended December 31,
|
|||||||||||
|
|
2016
|
2015
|
2014
|
|||||||||
|
|
(Dollars in millions)
|
|||||||||||
|
Balance at beginning of period
|
$
|
42
|
|
$
|
64
|
|
$
|
78
|
|
|||
|
Credit losses on securities without previous OTTI
|
—
|
|
—
|
|
6
|
|
||||||
|
Credit losses on securities for which OTTI was previously recognized
|
—
|
|
4
|
|
—
|
|
||||||
|
Reductions for securities sold/settled during the period
|
(21
|
)
|
(22
|
)
|
(17
|
)
|
||||||
|
Credit recoveries through yield
|
(1
|
)
|
(4
|
)
|
(3
|
)
|
||||||
|
Included as a result of loss share termination
|
1
|
|
—
|
|
—
|
|
||||||
|
Balance at end of period
|
$
|
21
|
|
$
|
42
|
|
$
|
64
|
|
|||
The amortized cost and estimated fair value of the securities portfolio by contractual maturity are shown in the following table. The expected life of MBS may differ from contractual maturities because borrowers have the right to prepay the underlying mortgage loans with or without prepayment penalties.
|
|
AFS
|
HTM
|
||||||||||||||
|
December 31, 2016
|
Amortized Cost
|
Fair Value
|
Amortized Cost
|
Fair Value
|
||||||||||||
|
|
(Dollars in millions)
|
|||||||||||||||
|
Due in one year or less
|
$
|
275
|
|
$
|
275
|
|
$
|
—
|
|
$
|
—
|
|
||||
|
Due after one year through five years
|
1,013
|
|
1,018
|
|
1,683
|
|
1,703
|
|
||||||||
|
Due after five years through ten years
|
2,670
|
|
2,580
|
|
1,688
|
|
1,672
|
|
||||||||
|
Due after ten years
|
23,375
|
|
23,053
|
|
13,309
|
|
13,171
|
|
||||||||
|
Total debt securities
|
$
|
27,333
|
|
$
|
26,926
|
|
$
|
16,680
|
|
$
|
16,546
|
|
||||
The following tables present the fair values and gross unrealized losses of investments based on the length of time that individual securities have been in a continuous unrealized loss position:
|
|
Less than 12 months
|
12 months or more
|
Total
|
|||||||||||||||||||||
|
December 31, 2016
|
Fair Value
|
Unrealized Losses
|
Fair Value
|
Unrealized Losses
|
Fair Value
|
Unrealized Losses
|
||||||||||||||||||
|
|
(Dollars in millions)
|
|||||||||||||||||||||||
|
AFS securities:
|
|
|
|
|
|
|
||||||||||||||||||
|
U.S. Treasury
|
$
|
2,014
|
|
$
|
84
|
|
$
|
—
|
|
$
|
—
|
|
$
|
2,014
|
|
$
|
84
|
|
||||||
|
GSE
|
180
|
|
10
|
|
—
|
|
—
|
|
180
|
|
10
|
|
||||||||||||
|
Agency MBS
|
14,842
|
|
342
|
|
5,138
|
|
226
|
|
19,980
|
|
568
|
|
||||||||||||
|
States and political subdivisions
|
365
|
|
7
|
|
314
|
|
42
|
|
679
|
|
49
|
|
||||||||||||
|
Total
|
$
|
17,401
|
|
$
|
443
|
|
$
|
5,452
|
|
$
|
268
|
|
$
|
22,853
|
|
$
|
711
|
|
||||||
|
HTM securities:
|
|
|
|
|
|
|
|
|
|
|
|
|
||||||||||||
|
GSE
|
$
|
1,762
|
|
$
|
30
|
|
$
|
—
|
|
$
|
—
|
|
$
|
1,762
|
|
$
|
30
|
|
||||||
|
Agency MBS
|
7,717
|
|
178
|
|
305
|
|
2
|
|
8,022
|
|
180
|
|
||||||||||||
|
Total
|
$
|
9,479
|
|
$
|
208
|
|
|
$
|
305
|
|
$
|
2
|
|
$
|
9,784
|
|
$
|
210
|
|
|||||
101
|
|
Less than 12 months
|
12 months or more
|
Total
|
|||||||||||||||||||||
|
December 31, 2015
|
Fair Value
|
Unrealized Losses
|
Fair Value
|
Unrealized Losses
|
Fair Value
|
Unrealized Losses
|
||||||||||||||||||
|
|
(Dollars in millions)
|
|||||||||||||||||||||||
|
AFS securities:
|
|
|
|
|
|
|
||||||||||||||||||
|
U.S. Treasury
|
$
|
1,211
|
|
$
|
6
|
|
$
|
—
|
|
$
|
—
|
|
$
|
1,211
|
|
$
|
6
|
|
||||||
|
Agency MBS
|
12,052
|
|
199
|
|
5,576
|
|
240
|
|
17,628
|
|
439
|
|
||||||||||||
|
States and political subdivisions
|
64
|
|
1
|
|
329
|
|
39
|
|
393
|
|
40
|
|
||||||||||||
|
Total
|
$
|
13,327
|
|
$
|
206
|
|
$
|
5,905
|
|
$
|
279
|
|
$
|
19,232
|
|
$
|
485
|
|
||||||
|
HTM securities:
|
|
|
|
|
|
|
|
|
|
|
|
|
||||||||||||
|
GSE
|
$
|
2,307
|
|
$
|
41
|
|
$
|
1,743
|
|
$
|
57
|
|
$
|
4,050
|
|
$
|
98
|
|
||||||
|
Agency MBS
|
3,992
|
|
21
|
|
124
|
|
1
|
|
4,116
|
|
22
|
|
||||||||||||
|
Other
|
56
|
|
1
|
|
—
|
|
—
|
|
56
|
|
1
|
|
||||||||||||
|
Total
|
$
|
6,355
|
|
$
|
63
|
|
$
|
1,867
|
|
$
|
58
|
|
$
|
8,222
|
|
$
|
121
|
|
||||||
Periodic reviews are conducted to identify and evaluate each investment with an unrealized loss for OTTI. An unrealized loss exists when the current fair value of an individual security is less than its amortized cost basis. Unrealized losses that are determined to be temporary in nature are recorded, net of tax, in AOCI for AFS securities. The unrealized losses on GSE securities and agency MBS were the result of increases in market interest rates compared to the date the securities were acquired rather than the credit quality of the issuers.
Cash flow modeling is used to evaluate non-agency MBS in an unrealized loss position for potential credit impairment. These models give consideration to long-term macroeconomic factors applied to current security default rates, prepayment rates and recovery rates and security-level performance. At
December 31, 2016
, there were
no
non-agency MBS with other than temporary credit impairment.
At
December 31, 2016
, the majority of the unrealized loss on municipal securities was the result of fair value hedge basis adjustments that are a component of amortized cost. Municipal securities in an unrealized loss position are evaluated for credit impairment through a qualitative analysis of issuer performance and the primary source of repayment. At
December 31, 2016
, the evaluation of municipal securities did not indicate any municipal securities with other than temporary credit impairment.
During the third quarter of 2016, Branch Bank entered into an early termination agreement with the FDIC that terminated the loss share agreements. As a result, the assets acquired from the FDIC are no longer covered by loss sharing. The accounting for the related loans is unaffected by the termination, and these loans will continue to be carried in PCI.
During the third quarter of 2016, a sales finance portfolio totaling
$1.0 billion
was acquired. During the fourth quarter of 2016, a sales finance portfolio totaling
$1.9 billion
was acquired.
During the first quarter of 2014, approximately
$8.3 billion
of nonguaranteed, closed-end, first and second lien position residential mortgage loans, along with the related allowance, were transferred from direct retail lending to residential mortgage to facilitate compliance with a series of new rules related to mortgage servicing associated with first and second lien position mortgages collateralized by real estate.
During the third quarter of 2014, approximately
$550 million
of loans, which were primarily performing residential mortgage TDRs, with a related ALLL of
$57 million
were sold for a gain of
$42 million
. During the fourth quarter of 2014, approximately
$140 million
of loans, which were primarily residential mortgage NPLs, with a related ALLL of
$19 million
were sold for a gain of
$24 million
. Both gains were recognized as reductions to the provision for credit losses.
102
|
|
Accruing
|
|
|
|||||||||||||||||
|
December 31, 2016
|
Current
|
30-89 Days Past Due
|
90 Days Or More Past Due
|
Nonaccrual
|
Total
|
|||||||||||||||
|
|
(Dollars in millions)
|
|||||||||||||||||||
|
Commercial:
|
|
|
|
|
|
|||||||||||||||
|
Commercial and industrial
|
$
|
51,329
|
|
$
|
27
|
|
$
|
—
|
|
$
|
363
|
|
$
|
51,719
|
|
|||||
|
CRE-income producing properties
|
14,492
|
|
6
|
|
—
|
|
40
|
|
14,538
|
|
||||||||||
|
CRE-construction and development
|
3,800
|
|
2
|
|
—
|
|
17
|
|
3,819
|
|
||||||||||
|
Dealer floor plan
|
1,413
|
|
—
|
|
—
|
|
—
|
|
1,413
|
|
||||||||||
|
Other lending subsidiaries
|
7,660
|
|
21
|
|
—
|
|
10
|
|
7,691
|
|
||||||||||
|
Retail:
|
|
|
||||||||||||||||||
|
Direct retail lending
|
11,963
|
|
60
|
|
6
|
|
63
|
|
12,092
|
|
||||||||||
|
Revolving credit
|
2,620
|
|
23
|
|
12
|
|
—
|
|
2,655
|
|
||||||||||
|
Residential mortgage-nonguaranteed
|
28,378
|
|
393
|
|
79
|
|
172
|
|
29,022
|
|
||||||||||
|
Residential mortgage-government guaranteed
|
324
|
|
132
|
|
443
|
|
—
|
|
899
|
|
||||||||||
|
Sales finance
|
11,179
|
|
76
|
|
6
|
|
6
|
|
11,267
|
|
||||||||||
|
Other lending subsidiaries
|
6,931
|
|
301
|
|
—
|
|
65
|
|
7,297
|
|
||||||||||
|
PCI
|
784
|
|
36
|
|
90
|
|
—
|
|
910
|
|
||||||||||
|
Total
|
$
|
140,873
|
|
$
|
1,077
|
|
$
|
636
|
|
$
|
736
|
|
$
|
143,322
|
|
|||||
|
|
Accruing
|
|
|
|||||||||||||||||
|
December 31, 2015
|
Current
|
30-89 Days Past Due
|
90 Days Or More Past Due
|
Nonaccrual
|
Total
|
|||||||||||||||
|
|
(Dollars in millions)
|
|||||||||||||||||||
|
Commercial:
|
|
|
|
|
|
|||||||||||||||
|
Commercial and industrial
|
$
|
48,157
|
|
$
|
36
|
|
$
|
—
|
|
$
|
237
|
|
$
|
48,430
|
|
|||||
|
CRE-income producing properties
|
13,370
|
|
13
|
|
—
|
|
38
|
|
13,421
|
|
||||||||||
|
CRE-construction and development
|
3,710
|
|
9
|
|
—
|
|
13
|
|
3,732
|
|
||||||||||
|
Dealer floor plan
|
1,215
|
|
—
|
|
—
|
|
—
|
|
1,215
|
|
||||||||||
|
Other lending subsidiaries
|
6,771
|
|
18
|
|
—
|
|
6
|
|
6,795
|
|
||||||||||
|
Retail:
|
|
|
|
|
|
|
|
|
|
|
||||||||||
|
Direct retail lending
|
11,032
|
|
58
|
|
7
|
|
43
|
|
11,140
|
|
||||||||||
|
Revolving credit
|
2,478
|
|
22
|
|
10
|
|
—
|
|
2,510
|
|
||||||||||
|
Residential mortgage-nonguaranteed
|
29,038
|
|
397
|
|
55
|
|
173
|
|
29,663
|
|
||||||||||
|
Residential mortgage-government guaranteed
|
306
|
|
78
|
|
486
|
|
—
|
|
870
|
|
||||||||||
|
Sales finance
|
10,243
|
|
72
|
|
5
|
|
7
|
|
10,327
|
|
||||||||||
|
Other lending subsidiaries
|
6,381
|
|
286
|
|
—
|
|
59
|
|
6,726
|
|
||||||||||
|
PCI
|
966
|
|
42
|
|
114
|
|
—
|
|
1,122
|
|
||||||||||
|
Total
|
$
|
133,667
|
|
$
|
1,031
|
|
$
|
677
|
|
$
|
576
|
|
$
|
135,951
|
|
|||||
The following tables present the carrying amount of loans by risk rating. PCI loans are excluded because their related ALLL is determined by loan pool performance.
|
December 31, 2016
|
Commercial & Industrial
|
CRE-Income Producing Properties
|
CRE-Construction and Development
|
Dealer Floor Plan
|
Other Lending Subsidiaries
|
|||||||||||||||
|
|
(Dollars in millions)
|
|||||||||||||||||||
|
Commercial:
|
|
|
|
|
|
|||||||||||||||
|
Pass
|
$
|
49,921
|
|
$
|
14,061
|
|
$
|
3,718
|
|
$
|
1,404
|
|
$
|
7,604
|
|
|||||
|
Special mention
|
314
|
|
124
|
|
38
|
|
—
|
|
33
|
|
||||||||||
|
Substandard-performing
|
1,121
|
|
313
|
|
46
|
|
9
|
|
44
|
|
||||||||||
|
Nonperforming
|
363
|
|
40
|
|
17
|
|
—
|
|
10
|
|
||||||||||
|
Total
|
$
|
51,719
|
|
$
|
14,538
|
|
$
|
3,819
|
|
$
|
1,413
|
|
$
|
7,691
|
|
|||||
103
|
December 31, 2016
|
Direct Retail Lending
|
Revolving Credit
|
Residential Mortgage
|
Sales Finance
|
Other Lending Subsidiaries
|
|||||||||||||||
|
|
(Dollars in millions)
|
|||||||||||||||||||
|
Retail:
|
|
|
|
|
|
|||||||||||||||
|
Performing
|
$
|
12,029
|
|
$
|
2,655
|
|
$
|
29,749
|
|
$
|
11,261
|
|
$
|
7,232
|
|
|||||
|
Nonperforming
|
63
|
|
—
|
|
172
|
|
6
|
|
65
|
|
||||||||||
|
Total
|
$
|
12,092
|
|
$
|
2,655
|
|
$
|
29,921
|
|
$
|
11,267
|
|
$
|
7,297
|
|
|||||
|
December 31, 2015
|
Commercial & Industrial
|
CRE-Income Producing Properties
|
CRE-Construction and Development
|
Dealer Floor Plan
|
Other Lending Subsidiaries
|
|||||||||||||||
|
|
(Dollars in millions)
|
|||||||||||||||||||
|
Commercial:
|
|
|
|
|
|
|||||||||||||||
|
Pass
|
$
|
46,760
|
|
$
|
12,940
|
|
$
|
3,619
|
|
$
|
1,195
|
|
$
|
6,757
|
|
|||||
|
Special mention
|
305
|
|
166
|
|
29
|
|
6
|
|
3
|
|
||||||||||
|
Substandard-performing
|
1,128
|
|
277
|
|
71
|
|
14
|
|
29
|
|
||||||||||
|
Nonperforming
|
237
|
|
38
|
|
13
|
|
—
|
|
6
|
|
||||||||||
|
Total
|
$
|
48,430
|
|
$
|
13,421
|
|
$
|
3,732
|
|
$
|
1,215
|
|
$
|
6,795
|
|
|||||
|
December 31, 2015
|
Direct Retail Lending
|
Revolving Credit
|
Residential Mortgage
|
Sales Finance
|
Other Lending Subsidiaries
|
|||||||||||||||
|
|
(Dollars in millions)
|
|||||||||||||||||||
|
Retail:
|
|
|
|
|
|
|||||||||||||||
|
Performing
|
$
|
11,097
|
|
$
|
2,510
|
|
$
|
30,360
|
|
$
|
10,320
|
|
$
|
6,667
|
|
|||||
|
Nonperforming
|
43
|
|
—
|
|
173
|
|
7
|
|
59
|
|
||||||||||
|
Total
|
$
|
11,140
|
|
$
|
2,510
|
|
$
|
30,533
|
|
$
|
10,327
|
|
$
|
6,726
|
|
|||||
The following tables present a summary of activity in the ACL:
|
Year Ended December 31, 2016
|
Beginning Balance
|
Charge-Offs
|
Recoveries
|
Provision (Benefit)
|
Other
|
Ending Balance
|
||||||||||||||||||
|
|
(Dollars in millions)
|
|||||||||||||||||||||||
|
Commercial:
|
|
|
|
|
|
|
||||||||||||||||||
|
Commercial and industrial
|
$
|
466
|
|
$
|
(128
|
)
|
$
|
40
|
|
$
|
122
|
|
—
|
|
$
|
500
|
|
|||||||
|
CRE-income producing properties
|
135
|
|
(8
|
)
|
8
|
|
(18
|
)
|
—
|
|
117
|
|
||||||||||||
|
CRE-construction and development
|
37
|
|
(1
|
)
|
11
|
|
(22
|
)
|
—
|
|
25
|
|
||||||||||||
|
Dealer floor plan
|
8
|
|
—
|
|
—
|
|
3
|
|
—
|
|
11
|
|
||||||||||||
|
Other lending subsidiaries
|
22
|
|
(22
|
)
|
6
|
|
23
|
|
—
|
|
29
|
|
||||||||||||
|
Retail:
|
|
|
|
|
|
|
|
|
|
|
||||||||||||||
|
Direct retail lending
|
105
|
|
(53
|
)
|
26
|
|
25
|
|
—
|
|
103
|
|
||||||||||||
|
Revolving credit
|
104
|
|
(69
|
)
|
20
|
|
51
|
|
—
|
|
106
|
|
||||||||||||
|
Residential mortgage-nonguaranteed
|
194
|
|
(35
|
)
|
3
|
|
24
|
|
—
|
|
186
|
|
||||||||||||
|
Residential mortgage-government guaranteed
|
23
|
|
(5
|
)
|
—
|
|
23
|
|
—
|
|
41
|
|
||||||||||||
|
Sales finance
|
40
|
|
(29
|
)
|
12
|
|
15
|
|
—
|
|
38
|
|
||||||||||||
|
Other lending subsidiaries
|
265
|
|
(336
|
)
|
43
|
|
317
|
|
—
|
|
289
|
|
||||||||||||
|
PCI
|
61
|
|
(15
|
)
|
—
|
|
(2
|
)
|
—
|
|
44
|
|
||||||||||||
|
ALLL
|
1,460
|
|
(701
|
)
|
169
|
|
561
|
|
—
|
|
1,489
|
|
||||||||||||
|
RUFC
|
90
|
|
—
|
|
—
|
|
11
|
|
9
|
|
110
|
|
||||||||||||
|
ACL
|
$
|
1,550
|
|
$
|
(701
|
)
|
$
|
169
|
|
$
|
572
|
|
$
|
9
|
|
$
|
1,599
|
|
||||||
104
|
Year Ended December 31, 2015
|
Beginning Balance
|
Charge-Offs
|
Recoveries
|
Provision (Benefit)
|
Other
|
Ending Balance
|
||||||||||||||||||
|
|
(Dollars in millions)
|
|||||||||||||||||||||||
|
Commercial:
|
|
|
|
|
|
|
||||||||||||||||||
|
Commercial and industrial
|
$
|
421
|
|
$
|
(81
|
)
|
$
|
37
|
|
$
|
89
|
|
$
|
—
|
|
$
|
466
|
|
||||||
|
CRE-income producing properties
|
162
|
|
(20
|
)
|
7
|
|
(14
|
)
|
—
|
|
135
|
|
||||||||||||
|
CRE-construction and development
|
48
|
|
(4
|
)
|
11
|
|
(18
|
)
|
—
|
|
37
|
|
||||||||||||
|
Dealer floor plan
|
10
|
|
—
|
|
—
|
|
(2
|
)
|
—
|
|
8
|
|
||||||||||||
|
Other lending subsidiaries
|
21
|
|
(9
|
)
|
3
|
|
7
|
|
—
|
|
22
|
|
||||||||||||
|
Retail:
|
|
|
|
|
|
|
|
|
|
|
|
|
||||||||||||
|
Direct retail lending
|
110
|
|
(54
|
)
|
29
|
|
20
|
|
—
|
|
105
|
|
||||||||||||
|
Revolving credit
|
110
|
|
(70
|
)
|
20
|
|
44
|
|
—
|
|
104
|
|
||||||||||||
|
Residential mortgage-nonguaranteed
|
217
|
|
(40
|
)
|
3
|
|
14
|
|
—
|
|
194
|
|
||||||||||||
|
Residential mortgage-government guaranteed
|
36
|
|
(6
|
)
|
—
|
|
(7
|
)
|
—
|
|
23
|
|
||||||||||||
|
Sales finance
|
40
|
|
(26
|
)
|
9
|
|
17
|
|
—
|
|
40
|
|
||||||||||||
|
Other lending subsidiaries
|
235
|
|
(277
|
)
|
33
|
|
274
|
|
—
|
|
265
|
|
||||||||||||
|
PCI
|
64
|
|
(1
|
)
|
—
|
|
(2
|
)
|
—
|
|
61
|
|
||||||||||||
|
ALLL
|
1,474
|
|
(588
|
)
|
152
|
|
422
|
|
—
|
|
1,460
|
|
||||||||||||
|
RUFC
|
60
|
|
—
|
|
—
|
|
6
|
|
24
|
|
90
|
|
||||||||||||
|
ACL
|
$
|
1,534
|
|
$
|
(588
|
)
|
$
|
152
|
|
$
|
428
|
|
$
|
24
|
|
$
|
1,550
|
|
||||||
|
Year Ended December 31, 2014
|
Beginning Balance
|
Charge-Offs
|
Recoveries
|
Provision (Benefit)
|
Other
|
Ending Balance
|
||||||||||||||||||
|
|
(Dollars in millions)
|
|||||||||||||||||||||||
|
Commercial:
|
|
|
|
|
|
|
||||||||||||||||||
|
Commercial and industrial
|
$
|
454
|
|
$
|
(131
|
)
|
$
|
42
|
|
$
|
56
|
|
$
|
—
|
|
$
|
421
|
|
||||||
|
CRE-income producing properties
|
149
|
|
(31
|
)
|
14
|
|
30
|
|
—
|
|
162
|
|
||||||||||||
|
CRE-construction and development
|
76
|
|
(11
|
)
|
19
|
|
(36
|
)
|
—
|
|
48
|
|
||||||||||||
|
Dealer floor plan
|
8
|
|
—
|
|
—
|
|
2
|
|
—
|
|
10
|
|
||||||||||||
|
Other lending subsidiaries
|
15
|
|
(8
|
)
|
3
|
|
11
|
|
—
|
|
21
|
|
||||||||||||
|
Retail:
|
|
|
|
|
|
|
|
|
|
|
|
|
||||||||||||
|
Direct retail lending
|
209
|
|
(69
|
)
|
29
|
|
26
|
|
(85
|
)
|
110
|
|
||||||||||||
|
Revolving credit
|
115
|
|
(71
|
)
|
19
|
|
47
|
|
—
|
|
110
|
|
||||||||||||
|
Residential mortgage-nonguaranteed
|
269
|
|
(82
|
)
|
7
|
|
(62
|
)
|
85
|
|
217
|
|
||||||||||||
|
Residential mortgage-government guaranteed
|
62
|
|
(2
|
)
|
—
|
|
(24
|
)
|
—
|
|
36
|
|
||||||||||||
|
Sales finance
|
37
|
|
(23
|
)
|
9
|
|
17
|
|
—
|
|
40
|
|
||||||||||||
|
Other lending subsidiaries
|
224
|
|
(261
|
)
|
30
|
|
242
|
|
—
|
|
235
|
|
||||||||||||
|
PCI
|
114
|
|
(21
|
)
|
—
|
|
(29
|
)
|
—
|
|
64
|
|
||||||||||||
|
ALLL
|
1,732
|
|
(710
|
)
|
172
|
|
280
|
|
—
|
|
1,474
|
|
||||||||||||
|
RUFC
|
89
|
|
—
|
|
—
|
|
(29
|
)
|
—
|
|
60
|
|
||||||||||||
|
ACL
|
$
|
1,821
|
|
$
|
(710
|
)
|
$
|
172
|
|
$
|
251
|
|
$
|
—
|
|
$
|
1,534
|
|
||||||
105
The following table provides a summary of loans that are collectively evaluated for impairment.
|
|
December 31, 2016
|
December 31, 2015
|
||||||||||||||
|
|
Recorded Investment
|
Related ALLL
|
Recorded Investment
|
Related ALLL
|
||||||||||||
|
|
(Dollars in millions)
|
|||||||||||||||
|
Commercial:
|
|
|
|
|
||||||||||||
|
Commercial and industrial
|
$
|
51,253
|
|
$
|
463
|
|
$
|
48,110
|
|
$
|
439
|
|
||||
|
CRE-income producing properties
|
14,455
|
|
112
|
|
13,339
|
|
127
|
|
||||||||
|
CRE-construction and development
|
3,787
|
|
21
|
|
3,697
|
|
32
|
|
||||||||
|
Dealer floor plan
|
1,413
|
|
11
|
|
1,215
|
|
8
|
|
||||||||
|
Other lending subsidiaries
|
7,678
|
|
28
|
|
6,789
|
|
21
|
|
||||||||
|
Retail:
|
|
|
|
|
||||||||||||
|
Direct retail lending
|
12,011
|
|
93
|
|
11,055
|
|
93
|
|
||||||||
|
Revolving credit
|
2,626
|
|
95
|
|
2,477
|
|
91
|
|
||||||||
|
Residential mortgage-nonguaranteed
|
28,488
|
|
136
|
|
29,199
|
|
153
|
|
||||||||
|
Residential mortgage-government guaranteed
|
466
|
|
8
|
|
553
|
|
1
|
|
||||||||
|
Sales finance
|
11,251
|
|
37
|
|
10,308
|
|
39
|
|
||||||||
|
Other lending subsidiaries
|
7,057
|
|
249
|
|
6,534
|
|
235
|
|
||||||||
|
PCI
|
910
|
|
44
|
|
1,122
|
|
61
|
|
||||||||
|
Total
|
$
|
141,395
|
|
$
|
1,297
|
|
$
|
134,398
|
|
$
|
1,300
|
|
||||
The following tables set forth certain information regarding impaired loans, excluding PCI and LHFS, that were individually evaluated for reserves.
|
As Of / For The Year Ended December 31, 2016
|
Recorded Investment
|
UPB
|
Related ALLL
|
Average Recorded Investment
|
Interest Income Recognized
|
|||||||||||||||
|
|
(Dollars in millions)
|
|||||||||||||||||||
|
With no related ALLL recorded:
|
|
|
|
|
|
|||||||||||||||
|
Commercial:
|
|
|
|
|
|
|||||||||||||||
|
Commercial and industrial
|
$
|
201
|
|
$
|
225
|
|
$
|
—
|
|
$
|
217
|
|
$
|
1
|
|
|||||
|
CRE-income producing properties
|
25
|
|
27
|
|
—
|
|
16
|
|
—
|
|
||||||||||
|
CRE-construction and development
|
10
|
|
11
|
|
—
|
|
8
|
|
—
|
|
||||||||||
|
Dealer floor plan
|
—
|
|
—
|
|
—
|
|
—
|
|
—
|
|
||||||||||
|
Other lending subsidiaries
|
4
|
|
6
|
|
—
|
|
6
|
|
—
|
|
||||||||||
|
Retail:
|
||||||||||||||||||||
|
Direct retail lending
|
13
|
|
38
|
|
—
|
|
12
|
|
1
|
|
||||||||||
|
Residential mortgage-nonguaranteed
|
94
|
|
141
|
|
—
|
|
97
|
|
4
|
|
||||||||||
|
Residential mortgage-government guaranteed
|
3
|
|
3
|
|
—
|
|
3
|
|
—
|
|
||||||||||
|
Sales finance
|
1
|
|
2
|
|
—
|
|
1
|
|
—
|
|
||||||||||
|
Other lending subsidiaries
|
4
|
|
9
|
|
—
|
|
4
|
|
—
|
|
||||||||||
|
With an ALLL recorded:
|
||||||||||||||||||||
|
Commercial:
|
||||||||||||||||||||
|
Commercial and industrial
|
265
|
|
269
|
|
37
|
|
259
|
|
5
|
|
||||||||||
|
CRE-income producing properties
|
58
|
|
61
|
|
5
|
|
68
|
|
2
|
|
||||||||||
|
CRE-construction and development
|
22
|
|
22
|
|
4
|
|
22
|
|
1
|
|
||||||||||
|
Dealer floor plan
|
—
|
|
—
|
|
—
|
|
—
|
|
—
|
|
||||||||||
|
Other lending subsidiaries
|
9
|
|
9
|
|
1
|
|
5
|
|
—
|
|
||||||||||
|
Retail:
|
||||||||||||||||||||
|
Direct retail lending
|
68
|
|
69
|
|
10
|
|
71
|
|
4
|
|
||||||||||
|
Revolving credit
|
29
|
|
29
|
|
11
|
|
31
|
|
1
|
|
||||||||||
|
Residential mortgage-nonguaranteed
|
440
|
|
451
|
|
50
|
|
383
|
|
16
|
|
||||||||||
|
Residential mortgage-government guaranteed
|
430
|
|
431
|
|
33
|
|
360
|
|
14
|
|
||||||||||
|
Sales finance
|
15
|
|
15
|
|
1
|
|
16
|
|
1
|
|
||||||||||
|
Other lending subsidiaries
|
236
|
|
239
|
|
40
|
|
206
|
|
32
|
|
||||||||||
|
Total
|
$
|
1,927
|
|
$
|
2,057
|
|
$
|
192
|
|
$
|
1,785
|
|
$
|
82
|
|
|||||
106
|
December 31, 2015
|
Recorded Investment
|
UPB
|
Related ALLL
|
Average Recorded Investment
|
Interest Income Recognized
|
|||||||||||||||
|
|
(Dollars in millions)
|
|||||||||||||||||||
|
With no related ALLL recorded:
|
|
|
|
|
|
|||||||||||||||
|
Commercial:
|
|
|
|
|
|
|||||||||||||||
|
Commercial and industrial
|
$
|
129
|
|
$
|
164
|
|
$
|
—
|
|
$
|
95
|
|
$
|
1
|
|
|||||
|
CRE-income producing properties
|
8
|
|
13
|
|
—
|
|
17
|
|
—
|
|
||||||||||
|
CRE-construction and development
|
8
|
|
11
|
|
—
|
|
10
|
|
—
|
|
||||||||||
|
Dealer floor plan
|
—
|
|
—
|
|
—
|
|
2
|
|
—
|
|
||||||||||
|
Other lending subsidiaries
|
2
|
|
3
|
|
—
|
|
—
|
|
—
|
|
||||||||||
|
Retail:
|
|
|
|
|
|
|
|
|
|
|
||||||||||
|
Direct retail lending
|
11
|
|
40
|
|
—
|
|
12
|
|
1
|
|
||||||||||
|
Residential mortgage-nonguaranteed
|
103
|
|
153
|
|
—
|
|
99
|
|
4
|
|
||||||||||
|
Residential mortgage-government guaranteed
|
5
|
|
5
|
|
—
|
|
3
|
|
—
|
|
||||||||||
|
Sales finance
|
1
|
|
2
|
|
—
|
|
1
|
|
—
|
|
||||||||||
|
Other lending subsidiaries
|
4
|
|
8
|
|
—
|
|
3
|
|
—
|
|
||||||||||
|
With an ALLL recorded:
|
|
|
|
|
|
|
|
|
|
|
||||||||||
|
Commercial:
|
|
|
|
|
|
|||||||||||||||
|
Commercial and industrial
|
191
|
|
194
|
|
27
|
|
223
|
|
5
|
|
||||||||||
|
CRE-income producing properties
|
74
|
|
77
|
|
8
|
|
96
|
|
3
|
|
||||||||||
|
CRE-construction and development
|
27
|
|
27
|
|
5
|
|
36
|
|
1
|
|
||||||||||
|
Dealer floor plan
|
—
|
|
—
|
|
—
|
|
1
|
|
—
|
|
||||||||||
|
Other lending subsidiaries
|
4
|
|
5
|
|
1
|
|
6
|
|
—
|
|
||||||||||
|
Retail:
|
|
|
|
|
|
|
|
|
|
|
||||||||||
|
Direct retail lending
|
74
|
|
75
|
|
12
|
|
79
|
|
4
|
|
||||||||||
|
Revolving credit
|
33
|
|
33
|
|
13
|
|
36
|
|
1
|
|
||||||||||
|
Residential mortgage-nonguaranteed
|
361
|
|
368
|
|
41
|
|
354
|
|
15
|
|
||||||||||
|
Residential mortgage-government guaranteed
|
312
|
|
312
|
|
22
|
|
323
|
|
13
|
|
||||||||||
|
Sales finance
|
18
|
|
18
|
|
1
|
|
19
|
|
1
|
|
||||||||||
|
Other lending subsidiaries
|
188
|
|
190
|
|
30
|
|
179
|
|
28
|
|
||||||||||
|
Total
|
$
|
1,553
|
|
$
|
1,698
|
|
$
|
160
|
|
$
|
1,594
|
|
$
|
77
|
|
|||||
Trial modifications are excluded from the following disclosures because the specific types and amounts of concessions offered to borrowers frequently change between the trial modification and the permanent modification. The following table provides a summary of TDRs, all of which are considered impaired.
|
|
December 31,
|
|||||||
|
|
2016
|
2015
|
||||||
|
|
(Dollars in millions)
|
|||||||
|
Performing TDRs:
|
|
|
||||||
|
Commercial:
|
|
|
||||||
|
Commercial and industrial
|
$
|
55
|
|
$
|
49
|
|
||
|
CRE-income producing properties
|
16
|
|
13
|
|
||||
|
CRE-construction and development
|
9
|
|
16
|
|
||||
|
Direct retail lending
|
67
|
|
72
|
|
||||
|
Revolving credit
|
29
|
|
33
|
|
||||
|
Residential mortgage-nonguaranteed
|
332
|
|
288
|
|
||||
|
Residential mortgage-government guaranteed
|
420
|
|
316
|
|
||||
|
Sales finance
|
16
|
|
17
|
|
||||
|
Other lending subsidiaries
|
226
|
|
178
|
|
||||
|
Total performing TDRs
|
1,170
|
|
982
|
|
||||
|
Nonperforming TDRs (also included in NPL disclosures)
|
183
|
|
146
|
|
||||
|
Total TDRs
|
$
|
1,353
|
|
$
|
1,128
|
|
||
|
ALLL attributable to TDRs
|
$
|
146
|
|
$
|
126
|
|
||
107
The following table summarizes the primary reason loan modifications were classified as TDRs and includes newly designated TDRs as well as modifications made to existing TDRs. Balances represent the recorded investment at the end of the quarter in which the modification was made. Rate modifications in this table include TDRs made with below market interest rates that also include modifications of loan structures.
|
|
Year Ended December 31,
|
|||||||||||||||||||||||||||||||||||
|
|
2016
|
2015
|
2014
|
|||||||||||||||||||||||||||||||||
|
Type of Modification
|
Type of Modification
|
Type of Modification
|
||||||||||||||||||||||||||||||||||
|
|
Rate
|
Structure
|
ALLL Impact
|
Rate
|
Structure
|
ALLL Impact
|
Rate
|
Structure
|
ALLL Impact
|
|||||||||||||||||||||||||||
|
|
(Dollars in millions)
|
|||||||||||||||||||||||||||||||||||
|
Commercial:
|
|
|
|
|
|
|
|
|
|
|||||||||||||||||||||||||||
|
Commercial and industrial
|
$
|
112
|
|
$
|
128
|
|
$
|
3
|
|
$
|
99
|
|
$
|
45
|
|
$
|
2
|
|
$
|
112
|
|
$
|
48
|
|
$
|
4
|
|
|||||||||
|
CRE-income producing properties
|
21
|
|
17
|
|
—
|
|
9
|
|
15
|
|
—
|
|
18
|
|
18
|
|
—
|
|
||||||||||||||||||
|
CRE-construction and development
|
7
|
|
11
|
|
—
|
|
8
|
|
25
|
|
1
|
|
25
|
|
22
|
|
—
|
|
||||||||||||||||||
|
Retail:
|
|
|
|
|
|
|
|
|
|
|
|
|
|
|
|
|
|
|
||||||||||||||||||
|
Direct retail lending
|
19
|
|
1
|
|
—
|
|
16
|
|
4
|
|
4
|
|
32
|
|
4
|
|
6
|
|
||||||||||||||||||
|
Revolving credit
|
17
|
|
—
|
|
4
|
|
16
|
|
—
|
|
4
|
|
24
|
|
—
|
|
4
|
|
||||||||||||||||||
|
Residential mortgage-nonguaranteed
|
129
|
|
54
|
|
10
|
|
88
|
|
37
|
|
9
|
|
127
|
|
36
|
|
16
|
|
||||||||||||||||||
|
Residential mortgage-government guaranteed
|
335
|
|
—
|
|
18
|
|
189
|
|
—
|
|
7
|
|
282
|
|
—
|
|
12
|
|
||||||||||||||||||
|
Sales finance
|
—
|
|
7
|
|
—
|
|
—
|
|
10
|
|
1
|
|
1
|
|
14
|
|
3
|
|
||||||||||||||||||
|
Other lending subsidiaries
|
169
|
|
—
|
|
21
|
|
129
|
|
—
|
|
17
|
|
130
|
|
—
|
|
17
|
|
||||||||||||||||||
The pre-default balance for modifications that experienced a payment default that had been classified as TDRs during the previous 12 months was
$73 million
,
$81 million
and
$78 million
for the twelve months ended
December 31, 2016
,
2015
and
2014
, respectively. Payment default is defined as movement of the TDR to nonaccrual status, foreclosure or charge-off, whichever occurs first.
Changes in the carrying value and accretable yield of PCI loans are presented in the following table:
|
|
December 31, 2016
|
December 31, 2015
|
||||||||||||||||||||||||||||||
|
|
Purchased Impaired
|
Purchased Nonimpaired
|
Purchased Impaired
|
Purchased Nonimpaired
|
||||||||||||||||||||||||||||
|
|
Accretable Yield
|
Carrying Value
|
Accretable Yield
|
Carrying Value
|
Accretable Yield
|
Carrying Value
|
Accretable Yield
|
Carrying Value
|
||||||||||||||||||||||||
|
|
(Dollars in millions)
|
|||||||||||||||||||||||||||||||
|
Balance at beginning of period
|
$
|
189
|
|
$
|
700
|
|
$
|
176
|
|
$
|
422
|
|
$
|
134
|
|
$
|
579
|
|
$
|
244
|
|
$
|
636
|
|
||||||||
|
Additions
|
36
|
|
124
|
|
—
|
|
—
|
|
98
|
|
402
|
|
—
|
|
—
|
|
||||||||||||||||
|
Accretion
|
(134
|
)
|
134
|
|
(73
|
)
|
73
|
|
(89
|
)
|
89
|
|
(89
|
)
|
89
|
|
||||||||||||||||
|
Payments received, net
|
—
|
|
(344
|
)
|
—
|
|
(199
|
)
|
—
|
|
(370
|
)
|
—
|
|
(303
|
)
|
||||||||||||||||
|
Other, net
|
162
|
|
—
|
|
52
|
|
—
|
|
46
|
|
—
|
|
21
|
|
—
|
|
||||||||||||||||
|
Balance at end of period
|
$
|
253
|
|
$
|
614
|
|
$
|
155
|
|
$
|
296
|
|
$
|
189
|
|
$
|
700
|
|
$
|
176
|
|
$
|
422
|
|
||||||||
|
Outstanding UPB at end of period
|
|
|
$
|
910
|
|
|
|
$
|
423
|
|
|
|
$
|
1,063
|
|
|
|
$
|
587
|
|
||||||||||||
The following table presents additional information about BB&T’s loans and leases:
|
|
December 31,
|
|||||||
|
|
2016
|
2015
|
||||||
|
|
(Dollars in millions)
|
|||||||
|
Unearned income, discounts and net deferred loan fees and costs, excluding PCI
|
$
|
396
|
|
$
|
598
|
|
||
|
Residential mortgage loans in process of foreclosure
|
366
|
|
229
|
|
||||
108
A summary of premises and equipment is presented in the accompanying table:
|
|
Estimated Useful Life
|
December 31,
|
||||||||
|
|
2016
|
2015
|
||||||||
|
|
(Years)
|
(Dollars in millions)
|
||||||||
|
Land and land improvements
|
|
$
|
611
|
|
$
|
596
|
|
|||
|
Buildings and building improvements
|
40
|
1,628
|
|
1,503
|
|
|||||
|
Furniture and equipment
|
3 - 15
|
1,121
|
|
1,030
|
|
|||||
|
Leasehold improvements
|
|
791
|
|
721
|
|
|||||
|
Construction in progress
|
|
62
|
|
122
|
|
|||||
|
Capitalized leases on premises and equipment
|
|
66
|
|
67
|
|
|||||
|
Total
|
|
4,279
|
|
4,039
|
|
|||||
|
Accumulated depreciation and amortization
|
|
(2,172
|
)
|
(2,032
|
)
|
|||||
|
Net premises and equipment
|
|
$
|
2,107
|
|
$
|
2,007
|
|
|||
The following table excludes assets related to the lease financing business.
|
|
Year Ended December 31,
|
|||||||||||
|
|
2016
|
2015
|
2014
|
|||||||||
|
|
(Dollars in millions)
|
|||||||||||
|
Rent expense applicable to operating leases
|
$
|
278
|
|
$
|
245
|
|
$
|
227
|
|
|||
|
Rental income from owned properties and subleases
|
8
|
|
7
|
|
7
|
|
||||||
|
|
Year Ended December 31,
|
|
||||||||||||||||||||||
|
|
2017
|
2018
|
2019
|
2020
|
2021
|
Thereafter
|
||||||||||||||||||
|
|
(Dollars in millions)
|
|||||||||||||||||||||||
|
Future minimum lease payments for operating leases
|
$
|
263
|
|
$
|
239
|
|
$
|
210
|
|
$
|
179
|
|
$
|
154
|
|
$
|
574
|
|
||||||
The changes in the carrying amounts of goodwill attributable to BB&T’s operating segments are reflected in the table below. There have been
no
goodwill impairments recorded to date.
|
|
Community Banking
|
Residential Mortgage Banking
|
Dealer Financial Services
|
Specialized Lending
|
Insurance Holdings
|
Financial Services
|
Total
|
|||||||||||||||||||||
|
|
(Dollars in millions)
|
|||||||||||||||||||||||||||
|
Goodwill, January 1, 2014
|
$
|
4,924
|
|
$
|
7
|
|
$
|
111
|
|
$
|
88
|
|
$
|
1,492
|
|
$
|
192
|
|
$
|
6,814
|
|
|||||||
|
Acquired goodwill, net
|
29
|
|
—
|
|
—
|
|
—
|
|
12
|
|
—
|
|
41
|
|
||||||||||||||
|
Contingent consideration
|
—
|
|
—
|
|
—
|
|
—
|
|
14
|
|
—
|
|
14
|
|
||||||||||||||
|
Other adjustments
|
(319
|
)
|
319
|
|
—
|
|
—
|
|
—
|
|
—
|
|
—
|
|
||||||||||||||
|
Goodwill, December 31, 2014
|
4,634
|
|
326
|
|
111
|
|
88
|
|
1,518
|
|
192
|
|
6,869
|
|
||||||||||||||
|
Acquired goodwill, net
|
1,501
|
|
43
|
|
—
|
|
155
|
|
16
|
|
11
|
|
1,726
|
|
||||||||||||||
|
American Coastal sale
|
—
|
|
—
|
|
—
|
|
—
|
|
(49
|
)
|
—
|
|
(49
|
)
|
||||||||||||||
|
Other adjustments
|
5
|
|
—
|
|
—
|
|
—
|
|
(3
|
)
|
—
|
|
2
|
|
||||||||||||||
|
Goodwill, December 31, 2015
|
6,140
|
|
369
|
|
111
|
|
243
|
|
1,482
|
|
203
|
|
8,548
|
|
||||||||||||||
|
Acquired goodwill, net
|
753
|
|
39
|
|
—
|
|
2
|
|
270
|
|
9
|
|
1,073
|
|
||||||||||||||
|
Other adjustments
|
139
|
|
8
|
|
—
|
|
(132
|
)
|
—
|
|
2
|
|
17
|
|
||||||||||||||
|
Goodwill, December 31, 2016
|
$
|
7,032
|
|
$
|
416
|
|
$
|
111
|
|
$
|
113
|
|
$
|
1,752
|
|
$
|
214
|
|
$
|
9,638
|
|
|||||||
During 2014, the transfer of closed-end, first and second lien position residential mortgage loans from Community Banking to Residential Mortgage Banking resulted in a reallocation of the related goodwill, which is included in other adjustments in the above table.
During 2015, BB&T sold American Coastal, which resulted in the allocation and write-off of goodwill from the Insurance Holdings segment.
During 2016, the valuations and purchase price allocation for Susquehanna were finalized and are included in other adjustments in the above table.
109
The acquisition of Swett & Crawford provided goodwill of
$269 million
and identifiable intangible assets of
$224 million
. The identifiable intangible assets are being amortized over a weighted average term of
13
years based upon the estimated economic benefits received. Approximately
$135 million
of the goodwill and identifiable intangible assets is deductible for tax purposes.
The following table presents information for identifiable intangible assets subject to amortization:
|
|
|
December 31, 2016
|
December 31, 2015
|
|||||||||||||||||||||||
|
|
Wtd. Avg. Remaining Life
|
Gross Carrying Amount
|
Accumulated Amortization
|
Net Carrying Amount
|
Gross Carrying Amount
|
Accumulated Amortization
|
Net Carrying Amount
|
|||||||||||||||||||
|
|
(Years)
|
(Dollars in millions)
|
||||||||||||||||||||||||
|
CDI
|
7.9
|
$
|
970
|
|
$
|
(710
|
)
|
$
|
260
|
|
$
|
903
|
|
$
|
(634
|
)
|
$
|
269
|
|
|||||||
|
Other, primarily customer relationship intangibles
|
13.0
|
1,415
|
|
(821
|
)
|
594
|
|
1,164
|
|
(747
|
)
|
417
|
|
|||||||||||||
|
Total
|
|
$
|
2,385
|
|
$
|
(1,531
|
)
|
|
$
|
854
|
|
|
$
|
2,067
|
|
$
|
(1,381
|
)
|
$
|
686
|
|
|||||
|
|
Year Ended December 31,
|
|||||||||||||||||||
|
|
2017
|
2018
|
2019
|
2020
|
2021
|
|||||||||||||||
|
|
(Dollars in millions)
|
|||||||||||||||||||
|
Estimated amortization expense of identifiable intangibles
|
$
|
141
|
|
$
|
123
|
|
$
|
104
|
|
$
|
87
|
|
$
|
74
|
|
|||||
Residential Mortgage Banking Activities
The following tables summarize residential mortgage banking activities. BB&T manages its own residential mortgage loans, including PCI loans.
|
|
December 31,
|
|||||||
|
|
2016
|
2015
|
||||||
|
|
(Dollars in millions)
|
|||||||
|
UPB of residential mortgage and home equity loan servicing portfolio
|
$
|
121,639
|
|
$
|
122,169
|
|
||
|
UPB of residential mortgage loans serviced for others (primarily agency conforming fixed rate)
|
90,325
|
|
91,132
|
|
||||
|
Mortgage loans sold with recourse
|
578
|
|
702
|
|
||||
|
Maximum recourse exposure from mortgage loans sold with recourse liability
|
282
|
|
326
|
|
||||
|
Indemnification, recourse and repurchase reserves
|
40
|
|
79
|
|
||||
|
FHA-insured mortgage loan reserve
|
—
|
|
85
|
|
||||
During 2014, HUD-OIG notified BB&T that it had been selected for an audit/survey to assess compliance with FHA loan origination and quality control requirements. BB&T subsequently received subpoenas from the HUD-OIG and the Department of Justice seeking additional information regarding its lending practices in connection with loans insured by the FHA. During 2014, BB&T recognized an
$85 million
charge that was included in other expense on the Consolidated Statements of Income. During the third quarter of 2016, BB&T paid
$83 million
to settle these matters pursuant to an agreement with the Department of Justice. In addition, the Company separately received recoveries of
$71 million
, resulting in a net benefit of
$73 million
, which was included in other expense on the Consolidated Statements of Income.
During 2014, BB&T recognized a
$33 million
adjustment related to the indemnification reserves for mortgage loans sold, which represents an increase in estimated losses that may be incurred on FHA-insured mortgage loans that have not yet defaulted. During 2016, BB&T released
$31 million
of mortgage repurchase reserves, which was primarily driven by lower anticipated loan repurchase requests. These adjustments were included in loan-related expense on the Consolidated Statements of Income.
Payments made to date for recourse exposure on residential mortgage loans sold with recourse liability have been immaterial.
110
|
As Of / For The Year Ended December 31,
|
||||||||||||
|
|
2016
|
2015
|
2014
|
|||||||||
|
|
(Dollars in millions)
|
|||||||||||
|
UPB of residential mortgage loans sold from the LHFS portfolio
|
$
|
15,675
|
|
$
|
14,764
|
|
$
|
13,400
|
|
|||
|
Pre-tax gains recognized on mortgage loans sold and held for sale
|
139
|
|
148
|
|
110
|
|
||||||
|
Servicing fees recognized from mortgage loans serviced for others
|
268
|
|
273
|
|
275
|
|
||||||
|
Approximate weighted average servicing fee on the outstanding balance of residential mortgage loans serviced for others
|
0.28
|
%
|
0.29
|
%
|
0.29
|
%
|
||||||
|
Weighted average interest rate on mortgage loans serviced for others
|
4.03
|
|
4.12
|
|
4.20
|
|
||||||
The following table presents a roll forward of the carrying value of residential MSRs recorded at fair value:
|
|
Year Ended December 31,
|
|||||||||||
|
|
2016
|
2015
|
2014
|
|||||||||
|
|
(Dollars in millions)
|
|||||||||||
|
Carrying value, beginning of year
|
$
|
880
|
|
$
|
844
|
|
$
|
1,047
|
|
|||
|
Additions
|
146
|
|
156
|
|
141
|
|
||||||
|
Change in fair value due to changes in valuation inputs or assumptions:
|
|
|
|
|||||||||
|
Prepayment speeds
|
13
|
|
91
|
|
(219
|
)
|
||||||
|
Weighted average OAS
|
10
|
|
(52
|
)
|
—
|
|
||||||
|
Servicing costs
|
2
|
|
(25
|
)
|
(2
|
)
|
||||||
|
Realization of expected net servicing cash flows, passage of time and other
|
(136
|
)
|
(134
|
)
|
(123
|
)
|
||||||
|
Carrying value, end of year
|
$
|
915
|
|
$
|
880
|
|
$
|
844
|
|
|||
|
Gains (losses) on derivative financial instruments used to mitigate the income statement effect of changes in fair value
|
$
|
32
|
|
$
|
32
|
|
$
|
251
|
|
|||
The sensitivity of the fair value of the residential MSRs to changes in key assumptions is included in the accompanying table:
|
|
December 31, 2016
|
December 31, 2015
|
||||||||||||||||||
|
|
Range
|
Weighted Average
|
Range
|
Weighted Average
|
||||||||||||||||
|
|
Min
|
Max
|
Min
|
Max
|
||||||||||||||||
|
|
(Dollars in millions)
|
|||||||||||||||||||
|
Prepayment speed
|
7.5
|
%
|
8.4
|
%
|
8.1
|
%
|
8.1
|
%
|
9.0
|
%
|
8.7
|
%
|
||||||||
|
Effect on fair value of a 10% increase
|
$
|
(28
|
)
|
|
|
$
|
(29
|
)
|
||||||||||||
|
Effect on fair value of a 20% increase
|
(54
|
)
|
|
|
(56
|
)
|
||||||||||||||
|
OAS
|
9.8
|
%
|
10.2
|
%
|
10.0
|
%
|
10.3
|
%
|
10.6
|
%
|
10.4
|
%
|
||||||||
|
Effect on fair value of a 10% increase
|
|
|
|
|
$
|
(33
|
)
|
|
|
|
|
$
|
(33
|
)
|
||||||
|
Effect on fair value of a 20% increase
|
|
|
|
|
(64
|
)
|
|
|
|
|
(63
|
)
|
||||||||
|
Composition of loans serviced for others:
|
|
|
|
|
|
|
|
|
|
|
|
|
||||||||
|
Fixed-rate residential mortgage loans
|
|
|
|
|
99.1
|
%
|
|
|
|
|
99.2
|
%
|
||||||||
|
Adjustable-rate residential mortgage loans
|
|
|
|
|
0.9
|
|
|
|
|
|
0.8
|
|
||||||||
|
Total
|
|
|
|
|
100.0
|
%
|
|
|
|
|
100.0
|
%
|
||||||||
|
Weighted average life (in years)
|
|
|
|
|
7.0
|
|
|
|
|
|
6.8
|
|
||||||||
The sensitivity calculations above are hypothetical and should not be considered to be predictive of future performance. As indicated, changes in fair value based on adverse changes in assumptions generally cannot be extrapolated because the relationship of the change in assumption to the change in fair value may not be linear. Also, in the above table, the effect of an adverse variation in a particular assumption on the fair value of the MSRs is calculated without changing any other assumption; while in reality, changes in one factor may result in changes in another, which may magnify or counteract the effect of the change.
111
Commercial Mortgage Banking Activities
CRE mortgage loans serviced for others are not included in loans and leases on the accompanying Consolidated Balance Sheets. The following table summarizes commercial mortgage banking activities for the periods presented:
|
|
December 31,
|
|||||||
|
|
2016
|
2015
|
||||||
|
|
(Dollars in millions)
|
|||||||
|
UPB of CRE mortgages serviced for others
|
$
|
29,333
|
|
$
|
28,163
|
|
||
|
CRE mortgages serviced for others covered by recourse provisions
|
4,240
|
|
4,198
|
|
||||
|
Maximum recourse exposure from CRE mortgages sold with recourse liability
|
1,272
|
|
1,259
|
|
||||
|
Recorded reserves related to recourse exposure
|
7
|
|
7
|
|
||||
|
Originated CRE mortgages during the year
|
7,145
|
|
7,012
|
|
||||
|
Commercial MSRs at fair value
|
137
|
|
—
|
|
||||
Effective January 1, 2016, the Company adopted the fair value option for commercial MSRs, which are included in MSRs at fair value on the Consolidated Balance Sheets, to facilitate hedging against changes in the fair value of the MSR asset. Prior to adoption, commercials MSRs were included in other assets. The impact of the adoption was immaterial.
|
|
December 31,
|
|||||||
|
|
2016
|
2015
|
||||||
|
|
(Dollars in millions)
|
|||||||
|
Noninterest-bearing deposits
|
$
|
50,697
|
|
$
|
45,695
|
|
||
|
Interest checking
|
30,263
|
|
25,410
|
|
||||
|
Money market and savings
|
64,883
|
|
60,461
|
|
||||
|
Time deposits
|
14,391
|
|
17,558
|
|
||||
|
Total deposits
|
$
|
160,234
|
|
$
|
149,124
|
|
||
|
Time deposits $100,000 and greater
|
$
|
5,394
|
|
$
|
7,562
|
|
||
|
Time deposits $250,000 and greater
|
2,179
|
|
3,497
|
|
||||
The following table reflects the carrying amounts at
December 31, 2016
and
2015
, and the related maturity dates, contractual rate and effective interest rates at
December 31, 2016
:
|
|
Stated Rate
|
Effective Rate
|
December 31,
|
||||||||||||||||||
|
|
Maturity
|
Min
|
Max
|
2016
|
2015
|
||||||||||||||||
|
|
(Dollars in millions)
|
||||||||||||||||||||
|
BB&T Corporation
|
|||||||||||||||||||||
|
Fixed rate senior notes
|
2017
|
to
|
2024
|
1.45
|
%
|
6.85
|
%
|
2.33
|
%
|
$
|
7,600
|
|
$
|
7,831
|
|
||||||
|
Floating rate senior notes
|
2018
|
2020
|
1.55
|
|
1.82
|
|
1.67
|
|
1,898
|
|
1,050
|
|
|||||||||
|
Fixed rate subordinated notes
|
2017
|
2022
|
3.95
|
|
5.25
|
|
1.53
|
|
1,338
|
|
1,382
|
|
|||||||||
|
Branch Bank
|
|||||||||||||||||||||
|
Fixed rate senior notes
|
2017
|
2021
|
1.00
|
|
2.85
|
|
1.80
|
|
4,209
|
|
4,071
|
|
|||||||||
|
Floating rate senior notes
|
2019
|
1.42
|
|
1.42
|
|
1.48
|
|
250
|
|
375
|
|
||||||||||
|
Fixed rate subordinated notes
|
2025
|
2026
|
3.63
|
|
3.80
|
|
3.48
|
|
2,138
|
|
2,562
|
|
|||||||||
|
Floating rate subordinated notes
|
2017
|
1.22
|
|
1.22
|
|
3.73
|
|
262
|
|
612
|
|
||||||||||
|
FHLB advances (5.5 years weighted average maturity at December 31, 2016)
|
2017
|
2034
|
—
|
|
6.38
|
|
4.20
|
|
4,118
|
|
5,732
|
|
|||||||||
|
Other long-term debt
|
|
|
152
|
|
154
|
|
|||||||||||||||
|
Total long-term debt
|
|
|
$
|
21,965
|
|
$
|
23,769
|
|
|||||||||||||
The effective rates above reflect the impact of hedges and issuance costs. Subordinated notes with a remaining maturity of one year or greater qualify under the risk-based capital guidelines as Tier 2 supplementary capital, subject to certain limitations.
112
Subsequent to year end, BB&T terminated FHLB advances totaling
$2.9 billion
of par value, which resulted in a pre-tax loss on early extinguishment of debt totaling
$392 million
. During 2015, BB&T terminated FHLB advances totaling
$931 million
, which resulted in a pre-tax loss on early extinguishment of debt totaling
$172 million
. During 2014, BB&T terminated FHLB advances totaling
$1.1 billion
, resulting in a pre-tax loss on early extinguishment of debt totaling
$122 million
.
|
|
Year Ended December 31,
|
Thereafter
|
||||||||||||||||||||||
|
|
2017
|
2018
|
2019
|
2020
|
2021
|
|||||||||||||||||||
|
|
(Dollars in millions)
|
|||||||||||||||||||||||
|
Future debt maturities
|
$
|
3,696
|
|
$
|
2,223
|
|
$
|
3,985
|
|
$
|
3,357
|
|
$
|
3,881
|
|
$
|
4,586
|
|
||||||
Preferred Stock
The following table presents a summary of the non-cumulative perpetual preferred stock as of
December 31, 2016
:
|
Preferred Stock Issue
|
Issuance Date
|
Earliest Redemption Date
|
Liquidation Amount
|
Carrying Amount
|
Dividend Rate
|
||||||||||
|
|
|
|
(Dollars in millions)
|
|
|||||||||||
|
Series D
|
5/1/2012
|
5/1/2017
|
$
|
575
|
|
$
|
559
|
|
5.850
|
%
|
|||||
|
Series E
|
7/31/2012
|
8/1/2017
|
1,150
|
|
1,120
|
|
5.625
|
|
|||||||
|
Series F
|
10/31/2012
|
11/1/2017
|
450
|
|
437
|
|
5.200
|
|
|||||||
|
Series G
|
5/1/2013
|
6/1/2018
|
500
|
|
487
|
|
5.200
|
|
|||||||
|
Series H
|
3/9/2016
|
6/1/2021
|
465
|
|
450
|
|
5.625
|
|
|||||||
|
|
|
|
$
|
3,140
|
|
$
|
3,053
|
|
|
||||||
Dividends on the preferred stock, if declared, accrue and are payable quarterly, in arrears. For each issuance, BB&T issued depositary shares, each of which represents a fractional ownership interest in a share of the Company’s preferred stock. The preferred stock has no stated maturity and redemption is solely at the option of the Company in whole, but not in part, upon the occurrence of a regulatory capital treatment event, as defined. In addition, the preferred stock may be redeemed in whole or in part, on any dividend payment date after
five years
from the date of issuance. Under current rules, any redemption of the preferred stock is subject to prior approval of the FRB. The preferred stock is not subject to any sinking fund or other obligations of the Company.
Equity-Based Compensation Plans
At
December 31, 2016
, options, restricted shares and RSUs were outstanding from equity-based compensation plans that have been approved by shareholders and plans assumed from acquired entities. Those plans are intended to assist the Company in recruiting and retaining employees, directors and independent contractors and to associate the interests of eligible participants with those of BB&T and its shareholders.
The majority of outstanding awards and awards available to be issued relate to plans that allow for accelerated vesting of awards for holders who retire and have met all retirement eligibility requirements or in connection with certain other events. Until vested, certain of these awards are subject to forfeiture under specified circumstances.
The following table provides a summary of the equity-based compensation plans:
|
December 31, 2016
|
||||
|
Shares available for future grants (in thousands)
|
16,627
|
|
||
|
Vesting period, awards granted prior to 2010
|
5.0
|
|
yrs
|
|
|
Vesting period, awards granted after 2009 (minimum years)
|
1.0
|
|
||
|
Vesting period, awards granted after 2009 (maximum years)
|
5.0
|
|
||
|
Option term
|
10.0
|
|
||
The fair value of RSUs is based on the common stock price on the grant date less the present value of expected dividends that will be foregone during the vesting period. The fair value of options is measured on the grant date using the Black-Scholes option-pricing model. Substantially all awards are granted in February of each year. Grants to non-executive employees primarily consist of RSUs.
113
A summary of selected data related to equity-based compensation costs follows:
|
|
Year Ended December 31,
|
|||||||||||
|
|
2016
|
2015
|
2014
|
|||||||||
|
|
(Dollars in millions)
|
|||||||||||
|
Equity-based compensation expense
|
$
|
115
|
|
$
|
106
|
|
$
|
102
|
|
|||
|
Income tax benefit from equity-based compensation expense
|
43
|
|
40
|
|
39
|
|
||||||
|
Intrinsic value of options exercised and RSUs that vested during the year
|
159
|
|
170
|
|
280
|
|
||||||
|
Grant date fair value of equity-based awards that vested during the year
|
98
|
|
115
|
|
113
|
|
||||||
|
|
|
December 31,
|
||||||||||
|
|
|
2016
|
2015
|
|||||||||
|
|
|
(Dollars in millions)
|
||||||||||
|
Unrecognized compensation cost related to equity-based awards
|
|
|
$
|
109
|
|
$
|
103
|
|
||||
|
Weighted-average life over which compensation cost is expected to be recognized (years)
|
2.3
|
|
2.2
|
|
||||||||
The following tables present the activity during
2016
related to equity-based compensation awards:
|
|
Options
|
Wtd. Avg. Exercise Price Per Share
|
Aggregate Intrinsic Value
|
Wtd. Avg. Remaining Contractual Life
|
||||||||||
|
|
(Dollars in millions, except per share data, shares in thousands)
|
|||||||||||||
|
Outstanding at January 1, 2016
|
20,577
|
|
$
|
34.89
|
|
|
|
|||||||
|
Replacement awards granted in connection with acquisitions
|
566
|
|
36.12
|
|
|
|
||||||||
|
Granted
|
610
|
|
32.10
|
|
|
|
||||||||
|
Exercised
|
(7,101
|
)
|
34.87
|
|
|
|
||||||||
|
Forfeited or expired
|
(2,856
|
)
|
40.64
|
|
|
|
||||||||
|
Outstanding at December 31, 2016
|
11,796
|
|
33.42
|
|
$
|
166
|
|
3.47
|
yrs
|
|||||
|
Exercisable at December 31, 2016
|
11,023
|
|
33.36
|
|
156
|
|
3.11
|
|||||||
|
Exercisable and expected to vest at December 31, 2016
|
11,755
|
|
33.42
|
|
166
|
|
3.46
|
|||||||
|
Restricted Shares/Units
|
Wtd. Avg. Grant Date Fair Value
|
||||||
|
|
(Shares in thousands)
|
||||||
|
Nonvested at January 1, 2016
|
11,824
|
|
$
|
29.81
|
|
||
|
Granted
|
5,235
|
|
27.49
|
|
|||
|
Vested
|
(3,150
|
)
|
27.76
|
|
|||
|
Forfeited
|
(393
|
)
|
29.74
|
|
|||
|
Nonvested at December 31, 2016
|
13,516
|
|
29.39
|
|
|||
|
Expected to vest at December 31, 2016
|
12,384
|
|
29.39
|
|
|||
Share Repurchase Activity
During 2016, the Company repurchased
$320 million
shares of common stock, which represented
8.4 million
shares, through open market purchases. In addition, the Company commenced a
$200 million
accelerated share repurchase program, which resulted in the retirement of
3.4 million
shares during the fourth quarter of 2016 and concluded in January 2017 with approximately
910,000
additional shares being retired. The conclusion of the program in January does not impact shareholders' equity as the full cost was recognized in the fourth quarter. These repurchases were made pursuant to the 2015 Repurchase Plan, and the repurchased shares revert to the status of authorized and unissued shares upon repurchase. At
December 31, 2016
, BB&T had remaining authorization to repurchase up to
38.2 million
shares of common stock under the 2015 Repurchase Plan.
No
shares of common stock were repurchased pursuant to repurchase plans during
2015
or
2014
.
114
|
Year Ended December 31, 2016
|
Unrecognized Net Pension and Postretirement Costs
|
Unrealized Net Gains (Losses) on Cash Flow Hedges
|
Unrealized Net Gains (Losses) on AFS Securities
|
FDIC's Share of Unrealized (Gains) Losses on AFS Securities
|
Other, net
|
Total
|
||||||||||||||||||
|
|
(Dollars in millions)
|
|||||||||||||||||||||||
|
AOCI balance, January 1, 2016
|
$
|
(723
|
)
|
$
|
(83
|
)
|
$
|
(34
|
)
|
$
|
(169
|
)
|
$
|
(19
|
)
|
$
|
(1,028
|
)
|
||||||
|
OCI before reclassifications, net of tax
|
(91
|
)
|
(16
|
)
|
(201
|
)
|
148
|
|
1
|
|
(159
|
)
|
||||||||||||
|
Amounts reclassified from AOCI:
|
|
|
|
|
|
|
||||||||||||||||||
|
Personnel expense
|
80
|
|
—
|
|
—
|
|
—
|
|
—
|
|
80
|
|
||||||||||||
|
Interest income
|
—
|
|
—
|
|
7
|
|
—
|
|
1
|
|
8
|
|
||||||||||||
|
Interest expense
|
—
|
|
11
|
|
—
|
|
—
|
|
—
|
|
11
|
|
||||||||||||
|
FDIC loss share income, net
|
—
|
|
—
|
|
—
|
|
33
|
|
—
|
|
33
|
|
||||||||||||
|
Securities (gains) losses, net
|
—
|
|
—
|
|
(46
|
)
|
—
|
|
—
|
|
(46
|
)
|
||||||||||||
|
Total before income taxes
|
80
|
|
11
|
|
(39
|
)
|
33
|
|
1
|
|
86
|
|
||||||||||||
|
Less: Income taxes
|
30
|
|
4
|
|
(15
|
)
|
12
|
|
—
|
|
31
|
|
||||||||||||
|
Net of income taxes
|
50
|
|
7
|
|
(24
|
)
|
21
|
|
1
|
|
55
|
|
||||||||||||
|
Net change in AOCI
|
(41
|
)
|
(9
|
)
|
(225
|
)
|
169
|
|
2
|
|
(104
|
)
|
||||||||||||
|
AOCI balance, December 31, 2016
|
$
|
(764
|
)
|
$
|
(92
|
)
|
$
|
(259
|
)
|
$
|
—
|
|
$
|
(17
|
)
|
$
|
(1,132
|
)
|
||||||
|
Year Ended December 31, 2015
|
Unrecognized Net Pension and Postretirement Costs
|
Unrealized Net Gains (Losses) on Cash Flow Hedges
|
Unrealized Net Gains (Losses) on AFS Securities
|
FDIC's Share of Unrealized (Gains) Losses on AFS Securities
|
Other, net
|
Total
|
||||||||||||||||||
|
|
(Dollars in millions)
|
|||||||||||||||||||||||
|
AOCI balance, January 1, 2015
|
$
|
(626
|
)
|
$
|
(54
|
)
|
$
|
152
|
|
$
|
(207
|
)
|
$
|
(16
|
)
|
$
|
(751
|
)
|
||||||
|
OCI before reclassifications, net of tax
|
(139
|
)
|
(81
|
)
|
(206
|
)
|
19
|
|
(9
|
)
|
(416
|
)
|
||||||||||||
|
Amounts reclassified from AOCI:
|
|
|
|
|
|
|
|
|
|
|
|
|||||||||||||
|
Personnel expense
|
67
|
|
—
|
|
—
|
|
—
|
|
—
|
|
67
|
|
||||||||||||
|
Interest income
|
—
|
|
—
|
|
29
|
|
—
|
|
9
|
|
38
|
|
||||||||||||
|
Interest expense
|
—
|
|
83
|
|
—
|
|
—
|
|
—
|
|
83
|
|
||||||||||||
|
FDIC loss share income, net
|
—
|
|
—
|
|
—
|
|
31
|
|
—
|
|
31
|
|
||||||||||||
|
Securities (gains) losses, net
|
—
|
|
—
|
|
3
|
|
—
|
|
—
|
|
3
|
|
||||||||||||
|
Total before income taxes
|
67
|
|
83
|
|
32
|
|
31
|
|
9
|
|
222
|
|
||||||||||||
|
Less: Income taxes
|
25
|
|
31
|
|
12
|
|
12
|
|
3
|
|
83
|
|
||||||||||||
|
Net of income taxes
|
42
|
|
52
|
|
20
|
|
19
|
|
6
|
|
139
|
|
||||||||||||
|
Net change in AOCI
|
(97
|
)
|
(29
|
)
|
(186
|
)
|
38
|
|
(3
|
)
|
(277
|
)
|
||||||||||||
|
AOCI balance, December 31, 2015
|
$
|
(723
|
)
|
$
|
(83
|
)
|
$
|
(34
|
)
|
$
|
(169
|
)
|
$
|
(19
|
)
|
$
|
(1,028
|
)
|
||||||
|
Year Ended December 31, 2014
|
Unrecognized Net Pension and Postretirement Costs
|
Unrealized Net Gains (Losses) on Cash Flow Hedges
|
Unrealized Net Gains (Losses) on AFS Securities
|
FDIC's Share of Unrealized (Gains) Losses on AFS Securities
|
Other, net
|
Total
|
||||||||||||||||||
|
|
(Dollars in millions)
|
|||||||||||||||||||||||
|
AOCI balance, January 1, 2014
|
$
|
(303
|
)
|
$
|
2
|
|
$
|
(42
|
)
|
$
|
(235
|
)
|
$
|
(15
|
)
|
$
|
(593
|
)
|
||||||
|
OCI before reclassifications, net of tax
|
(334
|
)
|
(107
|
)
|
207
|
|
—
|
|
(5
|
)
|
(239
|
)
|
||||||||||||
|
Amounts reclassified from AOCI:
|
|
|
|
|
|
|
|
|
|
|
|
|||||||||||||
|
Personnel expense
|
17
|
|
—
|
|
—
|
|
—
|
|
—
|
|
17
|
|
||||||||||||
|
Interest income
|
—
|
|
—
|
|
(24
|
)
|
—
|
|
6
|
|
(18
|
)
|
||||||||||||
|
Interest expense
|
—
|
|
82
|
|
—
|
|
—
|
|
—
|
|
82
|
|
||||||||||||
|
FDIC loss share income, net
|
—
|
|
—
|
|
—
|
|
45
|
|
—
|
|
45
|
|
||||||||||||
|
Securities (gains) losses, net
|
—
|
|
—
|
|
3
|
|
—
|
|
—
|
|
3
|
|
||||||||||||
|
Total before income taxes
|
17
|
|
82
|
|
(21
|
)
|
45
|
|
6
|
|
129
|
|
||||||||||||
|
Less: Income taxes
|
6
|
|
31
|
|
(8
|
)
|
17
|
|
2
|
|
48
|
|
||||||||||||
|
Net of income taxes
|
11
|
|
51
|
|
(13
|
)
|
28
|
|
4
|
|
81
|
|
||||||||||||
|
Net change in AOCI
|
(323
|
)
|
(56
|
)
|
194
|
|
28
|
|
(1
|
)
|
(158
|
)
|
||||||||||||
|
AOCI balance, December 31, 2014
|
$
|
(626
|
)
|
$
|
(54
|
)
|
$
|
152
|
|
$
|
(207
|
)
|
$
|
(16
|
)
|
$
|
(751
|
)
|
||||||
115
The components of the income tax provision are as follows:
|
|
Year Ended December 31,
|
|||||||||||
|
|
2016
|
2015
|
2014
|
|||||||||
|
|
(Dollars in millions)
|
|||||||||||
|
Current expense:
|
|
|
|
|||||||||
|
Federal
|
$
|
959
|
|
$
|
585
|
|
$
|
706
|
|
|||
|
State
|
97
|
|
99
|
|
81
|
|
||||||
|
Total current expense
|
1,056
|
|
684
|
|
787
|
|
||||||
|
Deferred expense:
|
|
|
|
|
|
|
||||||
|
Federal
|
(14
|
)
|
99
|
|
122
|
|
||||||
|
State
|
16
|
|
11
|
|
12
|
|
||||||
|
Total deferred expense
|
2
|
|
110
|
|
134
|
|
||||||
|
Provision for income taxes
|
$
|
1,058
|
|
$
|
794
|
|
$
|
921
|
|
|||
The reasons for the difference between the provision for income taxes and the amount computed by applying the statutory Federal income tax rate to income before income taxes were as follows:
|
|
Year Ended December 31,
|
|||||||||||
|
|
2016
|
2015
|
2014
|
|||||||||
|
|
(Dollars in millions)
|
|||||||||||
|
Federal income taxes at statutory rate of 35%
|
$
|
1,225
|
|
$
|
1,021
|
|
$
|
1,094
|
|
|||
|
Increase (decrease) in provision for income taxes as a result of:
|
|
|
|
|
|
|||||||
|
State income taxes, net of federal tax benefit
|
73
|
|
72
|
|
61
|
|
||||||
|
Affordable housing projects proportional amortization
|
205
|
|
181
|
|
159
|
|
||||||
|
Affordable housing projects tax credits and other tax benefits
|
(279
|
)
|
(249
|
)
|
(221
|
)
|
||||||
|
Tax exempt income
|
(151
|
)
|
(129
|
)
|
(125
|
)
|
||||||
|
Adjustments for uncertain tax positions
|
(6
|
)
|
(107
|
)
|
(39
|
)
|
||||||
|
Other, net
|
(9
|
)
|
5
|
|
(8
|
)
|
||||||
|
Provision for income taxes
|
$
|
1,058
|
|
$
|
794
|
|
$
|
921
|
|
|||
|
Effective income tax rate
|
30.2
|
%
|
27.2
|
%
|
29.5
|
%
|
||||||
The tax effects of temporary differences that gave rise to deferred tax assets and liabilities are reflected in the table below:
|
|
December 31,
|
|||||||
|
|
2016
|
2015
|
||||||
|
|
(Dollars in millions)
|
|||||||
|
Deferred tax assets:
|
|
|
||||||
|
ALLL
|
$
|
564
|
|
$
|
553
|
|
||
|
Postretirement plans
|
451
|
|
431
|
|
||||
|
Net unrealized loss on AFS securities
|
155
|
|
124
|
|
||||
|
Equity-based compensation
|
124
|
|
129
|
|
||||
|
Reserves and expense accruals
|
238
|
|
255
|
|
||||
|
Investments in qualified affordable housing projects
|
116
|
|
110
|
|
||||
|
Other
|
317
|
|
292
|
|
||||
|
Total deferred tax assets
|
1,965
|
|
1,894
|
|
||||
|
Deferred tax liabilities:
|
|
|
|
|
||||
|
Prepaid pension plan expense
|
558
|
|
509
|
|
||||
|
MSRs
|
358
|
|
331
|
|
||||
|
Lease financing
|
587
|
|
663
|
|
||||
|
Loan fees and expenses
|
103
|
|
70
|
|
||||
|
Identifiable intangible assets
|
224
|
|
207
|
|
||||
|
Other
|
45
|
|
169
|
|
||||
|
Total deferred tax liabilities
|
1,875
|
|
1,949
|
|
||||
|
Net deferred tax asset (liability)
|
$
|
90
|
|
$
|
(55
|
)
|
||
116
On a periodic basis, BB&T evaluates its income tax positions based on tax laws and regulations and financial reporting considerations, and records adjustments as appropriate. This evaluation takes into consideration the status of current taxing authorities’ examinations of BB&T’s tax returns, recent positions taken by the taxing authorities on similar transactions and the overall tax environment in relation to tax-advantaged transactions. The following table presents changes in unrecognized tax benefits:
|
|
As of/ For the Year Ended December 31,
|
|||||||||||
|
|
2016
|
2015
|
2014
|
|||||||||
|
|
(Dollars in millions)
|
|||||||||||
|
Beginning balance of unrecognized tax benefits
|
$
|
426
|
|
$
|
503
|
|
$
|
644
|
|
|||
|
Additions based on tax positions related to current year
|
—
|
|
—
|
|
1
|
|
||||||
|
Additions (reductions) for tax positions of prior years
|
(5
|
)
|
(76
|
)
|
(34
|
)
|
||||||
|
Settlements
|
(420
|
)
|
(1
|
)
|
(17
|
)
|
||||||
|
Lapse of statute of limitations
|
—
|
|
(1
|
)
|
—
|
|
||||||
|
Unrecognized deferred tax benefits from acquisitions
|
—
|
|
1
|
|
(91
|
)
|
||||||
|
Ending balance of unrecognized tax benefits
|
$
|
1
|
|
$
|
426
|
|
$
|
503
|
|
|||
|
Unrecognized tax benefits that would have impacted effective rate if recognized
|
|
|
|
|
|
|||||||
|
Federal
|
$
|
—
|
|
$
|
422
|
|
$
|
497
|
|
|||
|
State
|
1
|
|
3
|
|
4
|
|
||||||
During 2010, BB&T received an IRS statutory notice of deficiency for tax years 2002-2007 related to the disallowance of foreign tax credits and other deductions claimed by a subsidiary in connection with a financing transaction. BB&T paid the disputed tax, penalties and interest during 2010 and filed a lawsuit seeking a refund in the U.S. Court of Federal Claims, which denied the claim. BB&T appealed the decision to the U.S. Court of Appeals for the Federal Circuit. During 2015, the appeals court overturned a portion of the earlier ruling, resulting in the recognition of a
$107 million
income tax benefit during 2015. The remainder of the decision was affirmed. BB&T filed a petition requesting the case be heard by the U.S. Supreme Court. During 2016, the U.S. Supreme Court declined to hear the case, which preserves the earlier ruling and effectively concluded this matter.
The Company had immaterial amounts accrued for tax-related interest and penalties at
December 31, 2016
and
$181 million
at
December 31, 2015
. The amount of net interest and penalties related to unrecognized tax benefits recognized in the Consolidated Statements of Income was a benefit of
$29 million
for
2015
.
The IRS has completed its Federal income tax examinations of BB&T through
2013
. Various years remain subject to examination by state taxing authorities.
Defined Benefit Retirement Plans
BB&T provides defined benefit retirement plans qualified under the IRC that covers most employees. Benefits are based on years of service, age at retirement and the employee's compensation during the
five
highest consecutive years of earnings within the last
ten years
of employment.
In addition, supplemental retirement benefits are provided to certain key officers under supplemental defined benefit executive retirement plans, which are not qualified under the IRC. Although technically unfunded plans, Rabbi Trusts and insurance policies on the lives of certain of the covered employees are available to finance future benefits.
The following actuarial assumptions were used to determine net periodic pension costs for the qualified pension plans:
|
|
December 31,
|
||||||||
|
|
2016
|
2015
|
2014
|
||||||
|
Weighted average assumed discount rate
|
4.68
|
%
|
4.27
|
%
|
5.10
|
%
|
|||
|
Weighted average expected long-term rate of return on plan assets
|
7.00
|
|
7.50
|
|
7.75
|
|
|||
|
Assumed long-term rate of annual compensation increases
|
4.50
|
|
4.50
|
|
5.00
|
|
|||
117
The weighted average expected long-term rate of return on plan assets represents the average rate of return expected to be earned on plan assets over the period the benefits included in the benefit obligation are to be paid. In developing the expected rate of return, BB&T considers long-term compound annualized returns of historical market data for each asset category, as well as historical actual returns on the plan assets. Using this reference information, the Company develops forward-looking return expectations for each asset category and a weighted average expected long-term rate of return for the plan based on target asset allocations contained in BB&T's Investment Policy Statement. For
2017
, the expected rate of return on plan assets is
7.0%
.
Financial data relative to qualified and nonqualified defined benefit pension plans is summarized in the following tables for the years indicated. On the Consolidated Balance Sheets, the qualified pension plan prepaid asset is recorded as a component of other assets and the nonqualified pension plans accrued liability is recorded as a component of other liabilities. The data is calculated using an actuarial measurement date of December 31.
|
|
Year Ended December 31,
|
|||||||||||
|
|
2016
|
2015
|
2014
|
|||||||||
|
|
(Dollars in millions)
|
|||||||||||
|
Net Periodic Pension Cost:
|
|
|
|
|||||||||
|
Service cost
|
$
|
186
|
|
$
|
176
|
|
$
|
138
|
|
|||
|
Interest cost
|
181
|
|
157
|
|
140
|
|
||||||
|
Estimated return on plan assets
|
(326
|
)
|
(327
|
)
|
(296
|
)
|
||||||
|
Net amortization and other
|
80
|
|
67
|
|
17
|
|
||||||
|
Net periodic benefit cost
|
121
|
|
73
|
|
(1
|
)
|
||||||
|
Pre-Tax Amounts Recognized in OCI:
|
|
|
|
|
|
|
||||||
|
Net actuarial loss (gain)
|
138
|
|
230
|
|
532
|
|
||||||
|
Net amortization
|
(80
|
)
|
(67
|
)
|
(17
|
)
|
||||||
|
Net amount recognized in OCI
|
58
|
|
163
|
|
515
|
|
||||||
|
Total net periodic pension costs (income) recognized in total comprehensive income, pre-tax
|
$
|
179
|
|
$
|
236
|
|
$
|
514
|
|
|||
The following actuarial assumptions were used to determine benefit obligations:
|
|
December 31,
|
|||||
|
|
2016
|
2015
|
||||
|
Weighted average assumed discount rate
|
4.43
|
%
|
4.68
|
%
|
||
|
Assumed rate of annual compensation increases
|
4.50
|
|
4.50
|
|
||
|
|
Qualified Plans
|
Nonqualified Plans
|
||||||||||||||
|
|
Year Ended December 31,
|
Year Ended December 31,
|
||||||||||||||
|
|
2016
|
2015
|
2016
|
2015
|
||||||||||||
|
|
(Dollars in millions)
|
|||||||||||||||
|
Projected benefit obligation, beginning of year
|
$
|
3,473
|
|
$
|
3,227
|
|
$
|
392
|
|
$
|
367
|
|
||||
|
Service cost
|
174
|
|
164
|
|
12
|
|
12
|
|
||||||||
|
Interest cost
|
163
|
|
141
|
|
18
|
|
16
|
|
||||||||
|
Actuarial (gain) loss
|
152
|
|
(164
|
)
|
15
|
|
(3
|
)
|
||||||||
|
Benefits paid
|
(94
|
)
|
(80
|
)
|
(11
|
)
|
(15
|
)
|
||||||||
|
Acquisitions
|
71
|
|
185
|
|
—
|
|
15
|
|
||||||||
|
Projected benefit obligation, end of year
|
$
|
3,939
|
|
$
|
3,473
|
|
$
|
426
|
|
$
|
392
|
|
||||
|
Accumulated benefit obligation, end of year
|
$
|
3,403
|
|
$
|
2,997
|
|
$
|
363
|
|
$
|
309
|
|
||||
118
|
|
Qualified Plans
|
Nonqualified Plans
|
||||||||||||||
|
|
Year Ended December 31,
|
Year Ended December 31,
|
||||||||||||||
|
|
2016
|
2015
|
2016
|
2015
|
||||||||||||
|
|
(Dollars in millions)
|
|||||||||||||||
|
Fair value of plan assets, beginning of year
|
$
|
4,369
|
|
$
|
4,223
|
|
$
|
—
|
|
$
|
—
|
|
||||
|
Actual return on plan assets
|
356
|
|
(70
|
)
|
—
|
|
—
|
|
||||||||
|
Employer contributions
|
360
|
|
126
|
|
11
|
|
15
|
|
||||||||
|
Benefits paid
|
(94
|
)
|
(80
|
)
|
(11
|
)
|
(15
|
)
|
||||||||
|
Acquisitions
|
53
|
|
170
|
|
—
|
|
—
|
|
||||||||
|
Fair value of plan assets, end of year
|
$
|
5,044
|
|
$
|
4,369
|
|
$
|
—
|
|
$
|
—
|
|
||||
|
Funded status at end of year
|
$
|
1,105
|
|
$
|
896
|
|
$
|
(426
|
)
|
$
|
(392
|
)
|
||||
The following are the pre-tax amounts recognized in AOCI:
|
|
Qualified Plans
|
Nonqualified Plans
|
||||||||||||||
|
|
Year Ended December 31,
|
Year Ended December 31,
|
||||||||||||||
|
|
2016
|
2015
|
2016
|
2015
|
||||||||||||
|
|
(Dollars in millions)
|
|||||||||||||||
|
Prior service credit (cost)
|
$
|
—
|
|
$
|
—
|
|
$
|
(1
|
)
|
$
|
(2
|
)
|
||||
|
Net actuarial loss
|
(1,095
|
)
|
(1,040
|
)
|
(135
|
)
|
(131
|
)
|
||||||||
|
Net amount recognized
|
$
|
(1,095
|
)
|
$
|
(1,040
|
)
|
$
|
(136
|
)
|
$
|
(133
|
)
|
||||
The following table presents the amount expected to be amortized from AOCI into net periodic pension cost during
2017
:
|
|
Qualified Plans
|
Nonqualified Plans
|
||||||
|
|
(Dollars in millions)
|
|||||||
|
Net actuarial loss
|
$
|
(66
|
)
|
$
|
(12
|
)
|
||
|
Net amount expected to be amortized in 2017
|
$
|
(66
|
)
|
$
|
(12
|
)
|
||
BB&T makes contributions to the qualified pension plan in amounts between the minimum required for funding and the maximum amount deductible for federal income tax purposes. BB&T made discretionary contributions of
$260 million
during the first quarter of
2017
. Management may make additional contributions in
2017
. For the nonqualified plans, the employer contributions are based on benefit payments.
The following table reflects the estimated benefit payments for the periods presented:
|
|
Qualified Plans
|
Nonqualified Plans
|
||||||
|
|
(Dollars in millions)
|
|||||||
|
2017
|
$
|
104
|
|
$
|
15
|
|
||
|
2018
|
115
|
|
16
|
|
||||
|
2019
|
125
|
|
17
|
|
||||
|
2020
|
137
|
|
18
|
|
||||
|
2021
|
149
|
|
20
|
|
||||
|
2022-2026
|
949
|
|
119
|
|
||||
BB&T's primary total return objective is to achieve returns that, over the long term, will fund retirement liabilities and provide for the desired plan benefits in a manner that satisfies the fiduciary requirements of the Employee Retirement Income Security Act of 1974. The plan assets have a long-term time horizon that runs concurrent with the average life expectancy of the participants. As such, the Plan can assume a time horizon that extends well beyond a full market cycle, and can assume an above-average level of risk, as measured by the standard deviation of annual return. It is expected, however, that both professional investment management and sufficient portfolio diversification will smooth volatility and help to generate a reasonable consistency of return. The investments are broadly diversified among economic sector, industry, quality and size in order to reduce risk and to produce incremental return. Within approved guidelines and restrictions, investment managers have wide discretion over the timing and selection of individual investments.
119
BB&T periodically reviews its asset allocation and investment policy and makes changes to its target asset allocation. BB&T has established guidelines within each asset category to ensure the appropriate balance of risk and reward. For the year ended
December 31, 2016
, the target asset allocations for the plan assets included a range of
30%
to
50%
for U.S. equity securities,
11%
to
18%
for international equity securities,
35%
to
53%
for fixed income securities, and
0%
to
14%
for alternative investments, which include real estate, hedge funds and private equities. The plan may hold up to
10%
of its assets in BB&T common stock.
The fair values of certain pension plan assets by asset category are reflected in the following table.
|
|
December 31, 2016
|
December 31, 2015
|
||||||||||||||||||||||
|
|
Total
|
Level 1
|
Level 2
|
Total
|
Level 1
|
Level 2
|
||||||||||||||||||
|
|
(Dollars in millions)
|
|||||||||||||||||||||||
|
Cash and cash-equivalents
|
$
|
179
|
|
$
|
179
|
|
$
|
—
|
|
$
|
266
|
|
$
|
266
|
|
$
|
—
|
|
||||||
|
U.S. equity securities
|
1,892
|
|
1,018
|
|
874
|
|
1,627
|
|
1,627
|
|
—
|
|
||||||||||||
|
International equity securities
|
839
|
|
165
|
|
674
|
|
712
|
|
614
|
|
98
|
|
||||||||||||
|
Fixed income securities
|
1,914
|
|
10
|
|
1,904
|
|
1,631
|
|
10
|
|
1,621
|
|
||||||||||||
|
Total
|
$
|
4,824
|
|
$
|
1,372
|
|
$
|
3,452
|
|
$
|
4,236
|
|
$
|
2,517
|
|
$
|
1,719
|
|
||||||
Investments measured at fair value using the net asset value per share or equivalent as a practical expedient are not required to be classified in the fair value hierarchy. The pension plan held alternative investments valued using net asset values totaling
$199 million
and
$115 million
at
December 31, 2016
and
2015
, respectively.
U.S. equity securities included
3.0 million
shares of BB&T common stock valued at
$113 million
at
December 31, 2015
. International equity securities include a common/commingled fund that consists of assets from several accounts, pooled together, to reduce management and administration costs. Total plan assets exclude accrued income of
$21 million
and
$18 million
at
December 31, 2016
and
2015
, respectively.
Defined Contribution Plans
BB&T offers a 401(k) Savings Plan and other defined contribution plans that permit employees to contribute from
1%
to
50%
of their cash compensation. For full-time employees who are
21 years
of age or older with
one year
or more of service, BB&T makes matching contributions of up to
6%
of the employee's compensation. BB&T's contribution expense for the 401(k) Savings Plan and nonqualified defined contribution plans totaled
$129 million
,
$114 million
and
$103 million
for the years ended
December 31, 2016
,
2015
and
2014
, respectively. Certain employees of subsidiaries participate in the 401(k) Savings Plan with different matching formulas.
Other Benefits
There are various other employment contracts, deferred compensation arrangements and covenants not to compete with selected members of management and certain retirees. These plans and their obligations are not material to the financial statements.
BB&T utilizes a variety of financial instruments to meet the financing needs of clients and to reduce exposure to fluctuations in interest rates. These financial instruments include commitments to extend credit, letters of credit and financial guarantees and derivatives. BB&T also has commitments to fund certain affordable housing investments and contingent liabilities related to certain sold loans.
Commitments to extend, originate or purchase credit are primarily lines of credit to businesses and consumers and have specified rates and maturity dates. Many of these commitments also have adverse change clauses, which allow BB&T to cancel the commitment due to deterioration in the borrowers’ creditworthiness.
120
|
December 31,
|
||||||||
|
|
2016
|
2015
|
||||||
|
|
(Dollars in millions)
|
|||||||
|
Letters of credit
|
$
|
2,786
|
|
$
|
3,033
|
|
||
|
Carrying amount of the liability for letters of credit
|
27
|
|
27
|
|
||||
|
Investments in affordable housing and historic building rehabilitation projects:
|
|
|
||||||
|
Carrying amount
|
1,719
|
|
1,629
|
|
||||
|
Amount of future funding commitments included in carrying amount
|
738
|
|
654
|
|
||||
|
Lending exposure
|
495
|
|
292
|
|
||||
|
Tax credits subject to recapture
|
413
|
|
355
|
|
||||
|
Private equity investments
|
362
|
|
289
|
|
||||
|
Future funding commitments to private equity investments
|
197
|
|
231
|
|
||||
Letters of credit and financial guarantees written are unconditional commitments issued by BB&T to guarantee the performance of a customer to a third party. These guarantees are primarily issued to support borrowing arrangements, including commercial paper issuance, bond financing and similar transactions, the majority of which are to tax exempt entities. The credit risk involved in the issuance of these guarantees is essentially the same as that involved in extending loans to clients and as such, the instruments are collateralized when necessary.
BB&T invests in certain affordable housing and historic building rehabilitation projects throughout its market area as a means of supporting local communities. BB&T receives tax credits related to these investments. BB&T typically acts as a limited partner in these investments and does not exert control over the operating or financial policies of the partnerships. BB&T typically provides financing during the construction and development of the properties; however, permanent financing is generally obtained from independent third parties upon completion of a project. Tax credits are subject to recapture by taxing authorities based on compliance features required to be met at the project level. BB&T’s maximum potential exposure to losses relative to investments in VIEs is generally limited to the sum of the outstanding balance, future funding commitments and any related loans to the entity. Loans to these entities are underwritten in substantially the same manner as are other loans and are generally secured.
BB&T has investments in and future funding commitments to certain private equity investments. The majority of these investments are private equity funds that are consolidated into BB&T's financial statements. The risk exposure relating to such commitments is generally limited to the amount of investments and future funding commitments made.
BB&T has sold certain mortgage-related loans that contain recourse provisions. These provisions generally require BB&T to reimburse the investor for a share of any loss that is incurred after the disposal of the property. BB&T also issues standard representations and warranties related to mortgage loan sales to GSEs. Refer to the "Loan Servicing" note in the "Notes to Consolidated Financial Statements" for additional disclosures related to these exposures.
In the ordinary course of business, BB&T indemnifies its officers and directors to the fullest extent permitted by law against liabilities arising from pending litigation. BB&T also issues standard representations and warranties in underwriting agreements, merger and acquisition agreements, loan sales, brokerage activities and other similar arrangements. Counterparties in many of these indemnification arrangements provide similar indemnifications to BB&T. Although these agreements often do not specify limitations, BB&T does not believe that any payments related to these guarantees would materially change the financial position or results of operations of BB&T.
Legal Proceedings
The nature of BB&T’s business ordinarily results in a certain amount of claims, litigation, investigations and legal and administrative cases and proceedings, all of which are considered incidental to the normal conduct of business. BB&T believes it has meritorious defenses to the claims asserted against it in its currently outstanding legal proceedings and, with respect to such legal proceedings, intends to continue to defend itself vigorously, litigating or settling cases according to management’s judgment as to what is in the best interests of BB&T and its shareholders.
121
On a regular basis, liabilities and contingencies in connection with outstanding legal proceedings are assessed utilizing the latest information available. For those matters where it is probable that BB&T will incur a loss and the amount of the loss can be reasonably estimated, a liability is recorded in the consolidated financial statements. These legal reserves may be increased or decreased to reflect any relevant developments on at least a quarterly basis. For other matters, where a loss is not probable or the amount of the loss is not estimable, legal reserves are not accrued. While the outcome of legal proceedings is inherently uncertain, based on information currently available, advice of counsel and available insurance coverage, management believes that the established legal reserves are adequate and the liabilities arising from legal proceedings will not have a material adverse effect on the consolidated financial position, consolidated results of operations or consolidated cash flows. However, in the event of unexpected future developments, it is possible that the ultimate resolution of these matters, if unfavorable, may be material to the consolidated financial position, consolidated results of operations or consolidated cash flows of BB&T.
Pledged Assets
Certain assets were pledged to secure municipal deposits, securities sold under agreements to repurchase, borrowings and borrowing capacity, subject to any applicable asset discount, at the FHLB and FRB as well as for other purposes as required or permitted by law. The following table provides the total carrying amount of pledged assets by asset type, of which the majority are pursuant to agreements that do not permit the other party to sell or repledge the collateral. Assets related to employee benefit plans have been excluded from the following table.
|
|
December 31,
|
|||||||
|
|
2016
|
2015
|
||||||
|
|
(Dollars in millions)
|
|||||||
|
Pledged securities
|
$
|
15,549
|
|
$
|
14,063
|
|
||
|
Pledged loans
|
75,015
|
|
69,070
|
|
||||
Branch Bank is required by the FRB to maintain reserve balances in the form of vault cash or deposits with the FRB based on specified percentages of certain deposit types, subject to various adjustments. At
December 31, 2016
, the net reserve requirement amounted to
$124 million
.
Branch Bank is subject to laws and regulations that limit the amount of dividends it can pay. In addition, both BB&T and Branch Bank are subject to various regulatory restrictions relating to the payment of dividends, including requirements to maintain capital at or above regulatory minimums, and to remain "well-capitalized" under the prompt corrective action regulations. BB&T does not expect that any of these laws, regulations or policies will materially affect the ability of Branch Bank to pay dividends.
BB&T is subject to various regulatory capital requirements administered by the Federal banking agencies. Failure to meet minimum capital requirements can initiate certain mandatory—and possibly additional discretionary—actions by regulators that, if undertaken, could have a direct material effect on the financial statements. Under capital adequacy guidelines and the regulatory framework for prompt corrective action, the Company must meet specific capital guidelines that involve quantitative measures of assets, liabilities and certain off-balance-sheet items calculated pursuant to regulatory directives. BB&T’s capital amounts and classification also are subject to qualitative judgments by the regulators about components, risk weightings and other factors. BB&T is in full compliance with these requirements. Banking regulations also identify five capital categories for IDIs: well-capitalized, adequately capitalized, undercapitalized, significantly undercapitalized and critically undercapitalized. At
December 31, 2016
and
2015
, BB&T and Branch Bank were classified as "well-capitalized," and management believes that no events or changes have occurred subsequent to year end that would change this designation.
Quantitative measures established by regulation to ensure capital adequacy require BB&T to maintain minimum amounts and ratios of total and Tier 1 capital (as defined in the regulations) to risk-weighted assets (as defined), and of Tier 1 capital to average tangible assets (leverage ratio).
Risk-based capital ratios, which include CET1, Tier 1 Capital and Total Capital, are calculated based on regulatory guidance related to the measurement of capital and risk-weighted assets.
122
|
|
December 31, 2016
|
December 31, 2015
|
||||||||||||||||||||||||||||
|
|
Actual Capital
|
Capital Requirements
|
Actual Capital
|
Capital Requirements
|
||||||||||||||||||||||||||
|
|
Ratio
|
Amount
|
Minimum
|
Well-Capitalized
|
Ratio
|
Amount
|
Minimum
|
Well-Capitalized
|
||||||||||||||||||||||
|
|
(Dollars in millions)
|
|||||||||||||||||||||||||||||
|
CET1 Capital:
|
|
|
|
|
|
|
|
|
||||||||||||||||||||||
|
BB&T
|
10.2
|
%
|
$
|
18,050
|
|
$
|
7,926
|
|
$
|
11,449
|
|
10.3
|
%
|
$
|
17,081
|
|
$
|
7,497
|
|
$
|
10,830
|
|
||||||||
|
Branch Bank
|
11.5
|
|
19,839
|
|
7,730
|
|
11,166
|
|
11.3
|
|
18,382
|
|
7,319
|
|
10,572
|
|
||||||||||||||
|
Tier 1 Capital:
|
|
|
|
|
|
|
|
|
|
|
||||||||||||||||||||
|
BB&T
|
12.0
|
|
21,102
|
|
10,568
|
|
14,091
|
|
11.8
|
|
19,682
|
|
9,997
|
|
13,329
|
|
||||||||||||||
|
Branch Bank
|
11.5
|
|
19,839
|
|
10,307
|
|
13,743
|
|
11.3
|
|
18,382
|
|
9,759
|
|
13,012
|
|
||||||||||||||
|
Total Capital:
|
|
|
|
|
|
|
|
|
|
|
|
|
|
|
|
|
||||||||||||||
|
BB&T
|
14.1
|
|
24,872
|
|
14,091
|
|
17,614
|
|
14.3
|
|
23,753
|
|
13,329
|
|
16,661
|
|
||||||||||||||
|
Branch Bank
|
13.6
|
|
23,289
|
|
13,743
|
|
17,179
|
|
13.4
|
|
21,859
|
|
13,012
|
|
16,265
|
|
||||||||||||||
|
Leverage Capital:
|
|
|
|
|
|
|
|
|
|
|
|
|
|
|
|
|
||||||||||||||
|
BB&T
|
10.0
|
|
21,102
|
|
8,460
|
|
10,576
|
|
9.8
|
|
19,682
|
|
8,062
|
|
10,077
|
|
||||||||||||||
|
Branch Bank
|
9.6
|
|
19,839
|
|
8,249
|
|
10,311
|
|
9.3
|
|
18,382
|
|
7,866
|
|
9,833
|
|
||||||||||||||
As an approved seller/servicer, Branch Bank is required to maintain minimum levels of capital, as specified by various agencies, including the U.S. Department of Housing and Urban Development, GNMA, FHLMC and FNMA. At
December 31, 2016
and
2015
, Branch Bank’s capital was above all required levels.
|
|
December 31,
|
|||||||
|
Parent Company - Condensed Balance Sheets
|
2016
|
2015
|
||||||
|
|
(Dollars in millions)
|
|||||||
|
Assets:
|
|
|
||||||
|
Cash and due from banks
|
$
|
21
|
|
$
|
109
|
|
||
|
Interest-bearing deposits with banks
|
7,094
|
|
7,383
|
|
||||
|
AFS securities at fair value
|
134
|
|
124
|
|
||||
|
HTM securities at amortized cost
|
1
|
|
3
|
|
||||
|
Investment in banking subsidiaries
|
28,444
|
|
25,823
|
|
||||
|
Investment in other subsidiaries
|
1,279
|
|
1,101
|
|
||||
|
Advances to / receivables from banking subsidiaries
|
850
|
|
—
|
|
||||
|
Advances to / receivables from other subsidiaries
|
2,981
|
|
3,086
|
|
||||
|
Other assets
|
131
|
|
211
|
|
||||
|
Total assets
|
$
|
40,935
|
|
$
|
37,840
|
|
||
|
Liabilities and Shareholders' Equity:
|
|
|
||||||
|
Short-term borrowed funds
|
$
|
46
|
|
$
|
105
|
|
||
|
Long-term debt
|
10,836
|
|
10,274
|
|
||||
|
Accounts payable and other liabilities
|
127
|
|
121
|
|
||||
|
Total liabilities
|
11,009
|
|
10,500
|
|
||||
|
Total shareholders' equity
|
29,926
|
|
27,340
|
|
||||
|
Total liabilities and shareholders' equity
|
$
|
40,935
|
|
$
|
37,840
|
|
||
123
|
|
Year Ended December 31,
|
|||||||||||
|
Parent Company - Condensed Income and Comprehensive Income Statements
|
2016
|
2015
|
2014
|
|||||||||
|
|
(Dollars in millions)
|
|||||||||||
|
Income:
|
|
|
|
|
||||||||
|
Dividends from banking subsidiaries
|
$
|
1,350
|
|
$
|
1,600
|
|
$
|
1,636
|
|
|||
|
Dividends from other subsidiaries
|
6
|
|
411
|
|
71
|
|
||||||
|
Interest and other income from subsidiaries
|
73
|
|
64
|
|
67
|
|
||||||
|
Other income
|
3
|
|
3
|
|
7
|
|
||||||
|
Total income
|
1,432
|
|
2,078
|
|
1,781
|
|
||||||
|
Expenses:
|
|
|
|
|
|
|||||||
|
Interest expense
|
160
|
|
165
|
|
148
|
|
||||||
|
Other expenses
|
56
|
|
103
|
|
55
|
|
||||||
|
Total expenses
|
216
|
|
268
|
|
203
|
|
||||||
|
Income before income taxes and equity in undistributed earnings of subsidiaries
|
1,216
|
|
1,810
|
|
1,578
|
|
||||||
|
Income tax benefit
|
38
|
|
40
|
|
43
|
|
||||||
|
Income before equity in undistributed earnings of subsidiaries
|
1,254
|
|
1,850
|
|
1,621
|
|
||||||
|
Equity in undistributed earnings of subsidiaries in excess of dividends from subsidiaries
|
1,188
|
|
273
|
|
585
|
|
||||||
|
Net income
|
2,442
|
|
2,123
|
|
2,206
|
|
||||||
|
Total OCI
|
(104
|
)
|
(277
|
)
|
(158
|
)
|
||||||
|
Total comprehensive income
|
$
|
2,338
|
|
$
|
1,846
|
|
$
|
2,048
|
|
|||
|
|
Year Ended December 31,
|
|||||||||||
|
Parent Company - Statements of Cash Flows
|
2016
|
2015
|
2014
|
|||||||||
|
|
(Dollars in millions)
|
|||||||||||
|
Cash Flows From Operating Activities:
|
|
|
|
|
||||||||
|
Net income
|
$
|
2,442
|
|
$
|
2,123
|
|
$
|
2,206
|
|
|||
|
Adjustments to reconcile net income to net cash from operating activities:
|
||||||||||||
|
Equity in earnings of subsidiaries in excess of dividends from subsidiaries
|
(1,188
|
)
|
(273
|
)
|
(585
|
)
|
||||||
|
Net change in operating assets and liabilities:
|
|
|
|
|
|
|
||||||
|
Other assets
|
41
|
|
88
|
|
27
|
|
||||||
|
Accounts payable and other liabilities
|
(42
|
)
|
(14
|
)
|
40
|
|
||||||
|
Other, net
|
(88
|
)
|
32
|
|
(86
|
)
|
||||||
|
Net cash from operating activities
|
1,165
|
|
1,956
|
|
1,602
|
|
||||||
|
Cash Flows From Investing Activities:
|
|
|
|
|
|
|||||||
|
Proceeds from sales, calls and maturities of AFS securities
|
27
|
|
49
|
|
25
|
|
||||||
|
Purchases of AFS securities
|
(31
|
)
|
(21
|
)
|
(124
|
)
|
||||||
|
Proceeds from maturities, calls and paydowns of HTM securities
|
2
|
|
27
|
|
16
|
|
||||||
|
Investment in subsidiaries
|
(85
|
)
|
—
|
|
(1
|
)
|
||||||
|
Advances to subsidiaries
|
(7,719
|
)
|
(7,461
|
)
|
(7,145
|
)
|
||||||
|
Proceeds from repayment of advances to subsidiaries
|
6,975
|
|
6,848
|
|
7,060
|
|
||||||
|
Net cash from acquisitions and divestitures
|
(254
|
)
|
(595
|
)
|
—
|
|
||||||
|
Net cash from investing activities
|
(1,085
|
)
|
(1,153
|
)
|
(169
|
)
|
||||||
|
Cash Flows From Financing Activities:
|
|
|
|
|
|
|||||||
|
Net change in short-term borrowings
|
—
|
|
(40
|
)
|
(34
|
)
|
||||||
|
Net change in long-term debt
|
476
|
|
(92
|
)
|
1,085
|
|
||||||
|
Net cash from common stock transactions
|
(293
|
)
|
73
|
|
298
|
|
||||||
|
Net proceeds from preferred stock issued
|
450
|
|
—
|
|
—
|
|
||||||
|
Cash dividends paid on common and preferred stock
|
(1,092
|
)
|
(937
|
)
|
(814
|
)
|
||||||
|
Other, net
|
2
|
|
(6
|
)
|
(4
|
)
|
||||||
|
Net cash from financing activities
|
(457
|
)
|
(1,002
|
)
|
531
|
|
||||||
|
Net Change in Cash and Cash Equivalents
|
(377
|
)
|
(199
|
)
|
1,964
|
|
||||||
|
Cash and Cash Equivalents at Beginning of Period
|
7,492
|
|
7,691
|
|
5,727
|
|
||||||
|
Cash and Cash Equivalents at End of Period
|
$
|
7,115
|
|
$
|
7,492
|
|
$
|
7,691
|
|
|||
124
The transfer of funds in the form of dividends, loans or advances from bank subsidiaries to the Parent Company is restricted. Federal law requires loans to the Parent Company or its affiliates to be secured and at market terms and generally limits loans to the Parent Company or an individual affiliate to
10%
of Branch Bank’s unimpaired capital and surplus. In the aggregate, loans to the Parent Company and all affiliates cannot exceed
20%
of the bank’s unimpaired capital and surplus.
Dividend payments to the Parent Company by Branch Bank are subject to regulatory review and statutory limitations and, in some instances, regulatory approval. In general, dividends from Branch Bank to the Parent Company are limited by rules which compare dividends to net income for regulatory-defined periods. Furthermore, dividends are restricted by regulatory minimum capital constraints.
Accounting standards define fair value as the exchange price that would be received on the measurement date to sell an asset or the price paid to transfer a liability in the principal or most advantageous market available to the entity in an orderly transaction between market participants, with a three level valuation input hierarchy.
The following tables present fair value information for assets and liabilities measured at fair value on a recurring basis.
|
December 31, 2016
|
Total
|
Level 1
|
Level 2
|
Level 3
|
||||||||||||
|
|
(Dollars in millions)
|
|||||||||||||||
|
Assets:
|
|
|
|
|
|
|
|
|
||||||||
|
Trading securities
|
$
|
748
|
|
$
|
324
|
|
$
|
424
|
|
$
|
—
|
|
||||
|
AFS securities:
|
|
|
||||||||||||||
|
U.S. Treasury
|
2,587
|
|
—
|
|
2,587
|
|
—
|
|
||||||||
|
GSE
|
180
|
|
—
|
|
180
|
|
—
|
|
||||||||
|
Agency MBS
|
21,264
|
|
—
|
|
21,264
|
|
—
|
|
||||||||
|
States and political subdivisions
|
2,205
|
|
—
|
|
2,205
|
|
—
|
|
||||||||
|
Non-agency MBS
|
679
|
|
—
|
|
172
|
|
507
|
|
||||||||
|
Other
|
11
|
|
8
|
|
3
|
|
—
|
|
||||||||
|
LHFS
|
1,716
|
|
—
|
|
1,716
|
|
—
|
|
||||||||
|
MSRs
|
1,052
|
|
—
|
|
—
|
|
1,052
|
|
||||||||
|
Derivative assets:
|
|
|
||||||||||||||
|
Interest rate contracts
|
814
|
|
—
|
|
807
|
|
7
|
|
||||||||
|
Foreign exchange contracts
|
8
|
|
—
|
|
8
|
|
—
|
|
||||||||
|
Private equity investments
|
362
|
|
—
|
|
—
|
|
362
|
|
||||||||
|
Total assets
|
$
|
31,626
|
|
$
|
332
|
|
$
|
29,366
|
|
$
|
1,928
|
|
||||
|
Liabilities:
|
|
|
|
|
|
|
|
|
||||||||
|
Derivative liabilities:
|
|
|
|
|
|
|
|
|
||||||||
|
Interest rate contracts
|
$
|
998
|
|
$
|
—
|
|
$
|
978
|
|
$
|
20
|
|
||||
|
Foreign exchange contracts
|
5
|
|
—
|
|
5
|
|
—
|
|
||||||||
|
Securities sold short
|
137
|
|
—
|
|
137
|
|
—
|
|
||||||||
|
Total liabilities
|
$
|
1,140
|
|
$
|
—
|
|
$
|
1,120
|
|
$
|
20
|
|
||||
125
|
December 31, 2015
|
Total
|
Level 1
|
Level 2
|
Level 3
|
||||||||||||
|
|
(Dollars in millions)
|
|||||||||||||||
|
Assets:
|
|
|
|
|
||||||||||||
|
Trading securities
|
$
|
1,180
|
|
$
|
311
|
|
$
|
869
|
|
$
|
—
|
|
||||
|
AFS securities:
|
|
|
|
|
|
|
|
|
||||||||
|
U.S. Treasury
|
1,832
|
|
—
|
|
1,832
|
|
—
|
|
||||||||
|
GSE
|
51
|
|
—
|
|
51
|
|
—
|
|
||||||||
|
Agency MBS
|
20,046
|
|
—
|
|
20,046
|
|
—
|
|
||||||||
|
States and political subdivisions
|
2,375
|
|
—
|
|
2,375
|
|
—
|
|
||||||||
|
Non-agency MBS
|
989
|
|
—
|
|
363
|
|
626
|
|
||||||||
|
Other
|
4
|
|
4
|
|
—
|
|
—
|
|
||||||||
|
LHFS
|
1,035
|
|
—
|
|
1,035
|
|
—
|
|
||||||||
|
MSRs
|
880
|
|
—
|
|
—
|
|
880
|
|
||||||||
|
Derivative assets:
|
|
|
|
|
||||||||||||
|
Interest rate contracts
|
964
|
|
—
|
|
956
|
|
8
|
|
||||||||
|
Foreign exchange contracts
|
6
|
|
—
|
|
6
|
|
—
|
|
||||||||
|
Private equity investments
|
289
|
|
—
|
|
—
|
|
289
|
|
||||||||
|
Total assets
|
$
|
29,651
|
|
$
|
315
|
|
$
|
27,533
|
|
$
|
1,803
|
|
||||
|
Liabilities:
|
|
|
|
|
|
|||||||||||
|
Derivative liabilities:
|
|
|
|
|
|
|||||||||||
|
Interest rate contracts
|
$
|
788
|
|
$
|
—
|
|
$
|
784
|
|
$
|
4
|
|
||||
|
Foreign exchange contracts
|
4
|
|
—
|
|
4
|
|
—
|
|
||||||||
|
Securities sold short
|
147
|
|
—
|
|
147
|
|
—
|
|
||||||||
|
Total liabilities
|
$
|
939
|
|
$
|
—
|
|
$
|
935
|
|
$
|
4
|
|
||||
The following discussion focuses on the valuation techniques and significant inputs for Level 2 and Level 3 assets and liabilities.
A third-party pricing service is generally utilized in determining the fair value of the securities portfolio. Management independently evaluates the fair values provided by the pricing service through comparisons to other external pricing sources, review of additional information provided by the pricing service and other third party sources for selected securities and back-testing to compare the price realized on any security sales to the daily pricing information received from the pricing service. Fair value measurements are derived from market-based pricing matrices that were developed using observable inputs that include benchmark yields, benchmark securities, reported trades, offers, bids, issuer spreads and broker quotes. As described by security type below, additional inputs may be used, or some inputs may not be applicable. In the event that market observable data was not available, which would generally occur due to the lack of an active market for a given security, the valuation of the security would be subjective and may involve substantial judgment by management.
Trading securities:
Trading securities include various types of debt and equity securities, primarily consisting of debt securities issued by the U.S. Treasury, GSEs, or states and political subdivisions. The valuation techniques used for these investments are more fully discussed below.
U.S. Treasury securities:
Treasury securities are valued using quoted prices in active over the counter markets.
GSE securities and agency MBS:
GSE pass-through securities are valued using market-based pricing matrices that reference observable inputs including benchmark TBA security pricing and yield curves that were estimated based on U.S. Treasury yields and certain floating rate indices. The pricing matrices for these securities may also give consideration to pool-specific data supplied directly by the GSE. GSE CMOs are valued using market-based pricing matrices that are based on observable inputs including offers, bids, reported trades, dealer quotes and market research reports, the characteristics of a specific tranche, market convention prepayment speeds and benchmark yield curves as described above.
States and political subdivisions:
These securities are valued using market-based pricing matrices that reference observable inputs including MSRB reported trades, issuer spreads, material event notices and benchmark yield curves.
126
Non-agency MBS:
Pricing matrices for these securities are based on observable inputs including offers, bids, reported trades, dealer quotes and market research reports, the characteristics of a specific tranche, market convention prepayment speeds and benchmark yield curves as described above. Non-agency MBS also include investments in Re-REMIC trusts that primarily hold non-agency MBS, which are valued based on broker pricing models that use baseline securities yields and tranche-level yield adjustments to discount cash flows modeled using market convention prepayment speed and default assumptions.
Other securities:
These securities consist primarily of mutual funds and corporate bonds. These securities are valued based on a review of quoted market prices for assets as well as through the various other inputs discussed previously.
LHFS:
Certain mortgage loans are originated to be sold to investors, which are carried at fair value. The fair value is primarily based on quoted market prices for securities backed by similar types of loans. The changes in fair value of these assets are largely driven by changes in interest rates subsequent to loan funding and changes in the fair value of servicing associated with the mortgage LHFS.
MSRs:
Residential MSRs are valued using an OAS valuation model to project cash flows over multiple interest rate scenarios, which are then discounted at risk-adjusted rates. The model considers portfolio characteristics, contractually specified servicing fees, prepayment assumptions, delinquency rates, late charges, other ancillary revenue, costs to service and other economic factors. Fair value estimates and assumptions are compared to industry surveys, recent market activity, actual portfolio experience and, when available, other observable market data. Commercial MSRs are valued using a cash flow valuation model that calculates the present value of estimated future net servicing cash flows. BB&T considers actual and expected loan prepayment rates, discount rates, servicing costs and other economic factors that are determined based on current market conditions.
Derivative assets and liabilities:
The fair values of derivatives are determined based on quoted market prices and internal pricing models that use market observable data. The fair values of interest rate lock commitments, which are related to mortgage loan commitments and are categorized as Level 3, are based on quoted market prices adjusted for commitments that are not expected to fund and include the value attributable to the net servicing fees.
Private equity investments:
Private equity investments are measured at fair value based on the investment’s net asset value. In many cases there are no observable market values for these investments and therefore management must estimate the fair value based on a comparison of the operating performance of the company to multiples in the marketplace for similar entities. This analysis requires significant judgment, and actual values in a sale could differ materially from those estimated.
Securities sold short:
Securities sold short represent debt securities sold short that are entered into as a hedging strategy for the purposes of supporting institutional and retail client trading activities.
The following tables summarize activity for Level 3 assets and liabilities:
|
Year Ended December 31, 2016
|
Non-agency MBS
|
MSRs
|
Net Derivatives
|
Private Equity Investments
|
||||||||||||
|
|
(Dollars in millions)
|
|||||||||||||||
|
Balance at January 1, 2016
|
$
|
626
|
|
$
|
880
|
|
$
|
4
|
|
$
|
289
|
|
||||
|
Total realized and unrealized gains (losses):
|
|
|
|
|
|
|
|
|
||||||||
|
Included in earnings:
|
|
|
|
|
|
|
|
|
||||||||
|
Interest income
|
25
|
|
—
|
|
—
|
|
—
|
|
||||||||
|
Mortgage banking income
|
—
|
|
63
|
|
97
|
|
—
|
|
||||||||
|
Other noninterest income
|
—
|
|
—
|
|
—
|
|
20
|
|
||||||||
|
Included in unrealized net holding gains (losses) in OCI
|
(45
|
)
|
—
|
|
—
|
|
—
|
|
||||||||
|
Purchases
|
—
|
|
—
|
|
—
|
|
106
|
|
||||||||
|
Issuances
|
—
|
|
146
|
|
82
|
|
—
|
|
||||||||
|
Sales
|
—
|
|
—
|
|
—
|
|
(38
|
)
|
||||||||
|
Settlements
|
(99
|
)
|
(160
|
)
|
(196
|
)
|
(15
|
)
|
||||||||
|
Adoption of fair value option for commercial MSRs
|
—
|
|
123
|
|
—
|
|
—
|
|
||||||||
|
Balance at December 31, 2016
|
$
|
507
|
|
$
|
1,052
|
|
$
|
(13
|
)
|
$
|
362
|
|
||||
|
Change in unrealized gains (losses) included in earnings for the period, attributable to assets and liabilities still held at December 31, 2016
|
$
|
25
|
|
$
|
63
|
|
$
|
(13
|
)
|
$
|
7
|
|
||||
127
|
Year Ended December 31, 2015
|
Non-agency MBS
|
MSRs
|
Net Derivatives
|
Private Equity Investments
|
||||||||||||
|
|
(Dollars in millions)
|
|||||||||||||||
|
Balance at January 1, 2015
|
$
|
745
|
|
$
|
844
|
|
$
|
17
|
|
$
|
329
|
|
||||
|
Total realized and unrealized gains (losses):
|
|
|
|
|
|
|
|
|
||||||||
|
Included in earnings:
|
|
|
|
|
|
|
|
|
||||||||
|
Interest income
|
23
|
|
—
|
|
—
|
|
—
|
|
||||||||
|
Mortgage banking income
|
—
|
|
10
|
|
87
|
|
—
|
|
||||||||
|
Other noninterest income
|
—
|
|
—
|
|
(6
|
)
|
49
|
|
||||||||
|
Included in unrealized net holding gains (losses) in OCI
|
(45
|
)
|
—
|
|
—
|
|
—
|
|
||||||||
|
Purchases
|
—
|
|
—
|
|
1
|
|
81
|
|
||||||||
|
Issuances
|
—
|
|
156
|
|
74
|
|
—
|
|
||||||||
|
Sales
|
—
|
|
—
|
|
—
|
|
(154
|
)
|
||||||||
|
Settlements
|
(97
|
)
|
(130
|
)
|
(169
|
)
|
(16
|
)
|
||||||||
|
Balance at December 31, 2015
|
$
|
626
|
|
$
|
880
|
|
$
|
4
|
|
$
|
289
|
|
||||
|
Change in unrealized gains (losses) included in earnings for the period, attributable to assets and liabilities still held at December 31, 2015
|
$
|
23
|
|
$
|
10
|
|
$
|
4
|
|
$
|
(2
|
)
|
||||
|
Year Ended December 31, 2014
|
Non-agency MBS
|
MSRs
|
Net Derivatives
|
Private Equity Investments
|
||||||||||||
|
|
(Dollars in millions)
|
|||||||||||||||
|
Balance at January 1, 2014
|
$
|
861
|
|
$
|
1,047
|
|
$
|
(11
|
)
|
$
|
291
|
|
||||
|
Total realized and unrealized gains (losses):
|
|
|
|
|
|
|
|
|
||||||||
|
Included in earnings:
|
|
|
|
|
|
|
|
|
||||||||
|
Interest income
|
33
|
|
—
|
|
—
|
|
—
|
|
||||||||
|
Mortgage banking income
|
—
|
|
(221
|
)
|
94
|
|
—
|
|
||||||||
|
Other noninterest income
|
—
|
|
—
|
|
(2
|
)
|
27
|
|
||||||||
|
Included in unrealized holding gains (losses) in OCI
|
(38
|
)
|
—
|
|
—
|
|
—
|
|
||||||||
|
Purchases
|
—
|
|
—
|
|
—
|
|
67
|
|
||||||||
|
Issuances
|
—
|
|
141
|
|
75
|
|
—
|
|
||||||||
|
Sales
|
—
|
|
—
|
|
—
|
|
(50
|
)
|
||||||||
|
Settlements
|
(111
|
)
|
(123
|
)
|
(139
|
)
|
(7
|
)
|
||||||||
|
Transfers into Level 3
|
—
|
|
—
|
|
—
|
|
1
|
|
||||||||
|
Balance at December 31, 2014
|
$
|
745
|
|
$
|
844
|
|
$
|
17
|
|
$
|
329
|
|
||||
|
Change in unrealized gains (losses) included in earnings for the period, attributable to assets and liabilities still held at December 31, 2014
|
$
|
33
|
|
$
|
(221
|
)
|
$
|
17
|
|
$
|
15
|
|
||||
BB&T’s policy is to recognize transfers between levels as of the end of a reporting period. Transfers in and out of Level 3 are shown in the preceding tables. There were no transfers between Level 1 and Level 2 during
2016
,
2015
or
2014
.
The non-agency MBS categorized as Level 3 represent ownership interest in various tranches of Re-REMIC trusts. These securities are valued at a discount, which is unobservable in the market, to the fair value of the underlying securities owned by the trusts. The Re-REMIC tranches do not have an active market and therefore are categorized as Level 3. At December 31, 2016, the fair value of the Re-REMIC non-agency MBS represented a discount of
14.1%
to the fair value of the underlying securities owned by the Re-REMIC trusts.
128
The majority of private equity investments are in SBIC qualified funds, which primarily focus on equity and subordinated debt investments in privately-held middle market companies. The majority of these VIE investments are not redeemable and distributions are received as the underlying assets of the funds liquidate. The timing of distributions, which are expected to occur on various dates through
2026
, is uncertain and dependent on various events such as recapitalizations, refinance transactions and ownership changes, among others. Excluding the investment of future funds, BB&T estimates these investments have a weighted average remaining life of approximately
two
years; however, the timing and amount of distributions may vary significantly. As of
December 31, 2016
, restrictions on the ability to sell the investments include, but are not limited to, consent of a majority member or general partner approval for transfer of ownership. BB&T’s investments are spread over numerous privately-held middle market companies, and thus the sensitivity to a change in fair value for any single investment is limited. The significant unobservable inputs for these investments are EBITDA multiples that ranged from
5
x to
13
x, with a weighted average of
8
x, at
December 31, 2016
.
The following table details the fair value and UPB of LHFS that were elected to be carried at fair value:
|
|
December 31, 2016
|
December 31, 2015
|
||||||||||||||||||||||
|
|
Fair Value
|
Aggregate UPB
|
Difference
|
Fair Value
|
Aggregate UPB
|
Difference
|
||||||||||||||||||
|
|
(Dollars in millions)
|
|||||||||||||||||||||||
|
LHFS reported at fair value
|
$
|
1,716
|
|
$
|
1,736
|
|
$
|
(20
|
)
|
$
|
1,035
|
|
$
|
1,023
|
|
$
|
12
|
|
||||||
Excluding government guaranteed, LHFS that were in nonaccrual status or 90 days or more past due and still accruing interest were not material at
December 31, 2016
.
The following table provides information about certain financial assets measured at fair value on a nonrecurring basis, which are primarily collateral dependent and may be subject to liquidity adjustments. The carrying values represent end of period values, which approximate the fair value measurements that occurred on the various measurement dates throughout the period. The valuation adjustments represent the amounts recorded during the period regardless of whether the asset is still held at period end. These assets are considered to be Level 3 assets (excludes PCI).
|
|
As Of / For the Year Ended
|
|||||||||||||||
|
|
December 31, 2016
|
December 31, 2015
|
||||||||||||||
|
|
Carrying Value
|
Valuation Adjustments
|
Carrying Value
|
Valuation Adjustments
|
||||||||||||
|
|
(Dollars in millions)
|
|||||||||||||||
|
Impaired loans
|
$
|
278
|
|
$
|
(89
|
)
|
$
|
149
|
|
$
|
(30
|
)
|
||||
|
Foreclosed real estate
|
50
|
|
(221
|
)
|
82
|
|
(190
|
)
|
||||||||
Refer to the "Acquisitions and Divestitures" note for fair value measurements related to acquisitions.
For financial instruments not recorded at fair value, estimates of fair value are based on relevant market data and information about the instrument. Values obtained relate to one trading unit without regard to any premium or discount that may result from concentrations of ownership, possible tax ramifications, estimated transaction costs that may result from bulk sales or the relationship between various instruments.
An active market does not exist for certain financial instruments. Fair value estimates for these instruments are based on current economic conditions, currency and interest rate risk characteristics, loss experience and other factors. Many of these estimates involve uncertainties and matters of significant judgment and cannot be determined with precision. Therefore, the fair value estimates in many instances cannot be substantiated by comparison to independent markets and, in many cases, may not be realizable in a current sale of the instrument. In addition, changes in assumptions could significantly affect these fair value estimates. The following assumptions were used to estimate the fair value of these financial instruments.
Cash and cash equivalents and restricted cash
: For these short-term instruments, the carrying amounts are a reasonable estimate of fair values.
HTM securities:
The fair values of HTM securities are based on a market approach using observable inputs such as benchmark yields and securities, TBA prices, reported trades, issuer spreads, current bids and offers, monthly payment information and collateral performance.
129
Loans receivable
: The fair values for loans are estimated using discounted cash flow analyses, applying interest rates currently being offered for loans with similar terms and credit quality, which are deemed to be indicative of orderly transactions in the current market. For commercial loans and leases, discount rates may be adjusted to address additional credit risk on lower risk grade instruments. For residential mortgage and other consumer loans, internal prepayment risk models are used to adjust contractual cash flows. Loans are aggregated into pools of similar terms and credit quality and discounted using a LIBOR based rate. The carrying amounts of accrued interest approximate fair values.
FDIC loss share receivable and payable
: The fair values of the receivable and payable were estimated using discounted cash flow analyses, applying a risk free interest rate that was adjusted for the uncertainty in the timing and amount of the cash flows. The expected cash flows to/from the FDIC related to loans were estimated using the same assumptions that were used in determining the accounting values for the related loans. The expected cash flows to/from the FDIC related to securities were based upon the fair value of the related securities and the payment that would be required if the securities were sold for that amount. The loss share agreements were not transferable and, accordingly, there was no market for the receivable or payable.
Deposit liabilities
: The fair values for demand deposits are equal to the amount payable on demand. Fair values for CDs are estimated using a discounted cash flow calculation that applies current interest rates to aggregate expected maturities. BB&T has developed long-term relationships with its deposit customers, commonly referred to as CDIs, that have not been considered in the determination of the deposit liabilities’ fair value.
Short-term borrowings
: The carrying amounts of short-term borrowings, excluding securities sold short, approximate their fair values.
Long-term debt
: The fair values of long-term debt instruments are estimated based on quoted market prices for the instrument if available, or for similar instruments if not available, or by using discounted cash flow analyses, based on current incremental borrowing rates for similar types of instruments.
Contractual commitments
: The fair values of commitments are estimated using the fees charged to enter into similar agreements, taking into account the remaining terms of the agreements and the present creditworthiness of the counterparties. The fair values of guarantees and letters of credit are estimated based on the counterparties’ creditworthiness and average default rates for loan products with similar risks. These respective fair value measurements are categorized within Level 3 of the fair value hierarchy. Retail lending commitments are assigned no fair value as BB&T typically has the ability to cancel such commitments by providing notice to the borrower.
Financial assets and liabilities not recorded at fair value are summarized below:
|
December 31, 2016
|
Carrying Amount
|
Total Fair Value
|
Level 2
|
Level 3
|
||||||||||||
|
|
(Dollars in millions)
|
|||||||||||||||
|
Financial assets:
|
|
|
|
|
||||||||||||
|
HTM securities
|
$
|
16,680
|
|
$
|
16,546
|
|
$
|
16,546
|
|
$
|
—
|
|
||||
|
Loans and leases HFI, net of ALLL
|
141,833
|
|
142,044
|
|
—
|
|
142,044
|
|
||||||||
|
Financial liabilities:
|
|
|
|
|
|
|
||||||||||
|
Deposits
|
160,234
|
|
160,403
|
|
160,403
|
|
—
|
|
||||||||
|
Long-term debt
|
21,965
|
|
22,423
|
|
22,423
|
|
—
|
|
||||||||
|
December 31, 2015
|
Carrying Amount
|
Total Fair Value
|
Level 2
|
Level 3
|
||||||||||||
|
|
(Dollars in millions)
|
|||||||||||||||
|
Financial assets:
|
|
|
|
|
||||||||||||
|
HTM securities
|
$
|
18,530
|
|
$
|
18,519
|
|
$
|
18,519
|
|
$
|
—
|
|
||||
|
Loans and leases HFI, net of ALLL
|
134,491
|
|
134,728
|
|
—
|
|
134,728
|
|
||||||||
|
FDIC loss share receivable
|
285
|
|
11
|
|
—
|
|
11
|
|
||||||||
|
Financial liabilities:
|
|
|
|
|
|
|||||||||||
|
Deposits
|
149,124
|
|
149,300
|
|
149,300
|
|
—
|
|
||||||||
|
FDIC loss share payable
|
685
|
|
676
|
|
—
|
|
676
|
|
||||||||
|
Long-term debt
|
23,769
|
|
24,206
|
|
24,206
|
|
—
|
|
||||||||
130
The following is a summary of selected information pertaining to off-balance sheet financial instruments:
|
|
December 31, 2016
|
December 31, 2015
|
||||||||||||||
|
|
Notional/Contract Amount
|
Fair Value
|
Notional/Contract Amount
|
Fair Value
|
||||||||||||
|
|
(Dollars in millions)
|
|||||||||||||||
|
Commitments to extend, originate or purchase credit
|
$
|
64,395
|
|
$
|
250
|
|
$
|
59,019
|
|
$
|
253
|
|
||||
|
Residential mortgage loans sold with recourse
|
578
|
|
7
|
|
702
|
|
8
|
|
||||||||
|
Other loans sold with recourse
|
4,240
|
|
7
|
|
4,198
|
|
7
|
|
||||||||
|
Letters of credit
|
2,786
|
|
27
|
|
3,033
|
|
27
|
|
||||||||
131
The following table presents the notional amount and estimated fair value of derivative instruments:
|
|
|
December 31, 2016
|
December 31, 2015
|
|||||||||||||||||||||||
|
|
Notional Amount
|
Fair Value
|
Notional Amount
|
Fair Value
|
||||||||||||||||||||||
|
|
Hedged Item or Transaction
|
Gain
|
Loss
|
Gain
|
Loss
|
|||||||||||||||||||||
|
|
|
(Dollars in millions)
|
||||||||||||||||||||||||
|
Cash flow hedges:
|
|
|
|
|
|
|
|
|||||||||||||||||||
|
Interest rate contracts:
|
|
|
|
|
|
|
|
|||||||||||||||||||
|
Pay fixed swaps
|
3 mo. LIBOR funding
|
$
|
7,050
|
|
$
|
—
|
|
$
|
(187
|
)
|
$
|
9,300
|
|
$
|
—
|
|
$
|
(214
|
)
|
|||||||
|
Fair value hedges:
|
|
|
|
|
|
|
|
|
|
|
|
|
|
|||||||||||||
|
Interest rate contracts:
|
|
|
|
|
|
|
|
|
|
|
|
|
|
|||||||||||||
|
Receive fixed swaps
|
Long-term debt
|
12,099
|
|
202
|
|
(100
|
)
|
13,092
|
|
329
|
|
(1
|
)
|
|||||||||||||
|
Options
|
Long-term debt
|
2,790
|
|
—
|
|
(1
|
)
|
—
|
|
—
|
|
—
|
|
|||||||||||||
|
Pay fixed swaps
|
Commercial loans
|
346
|
|
4
|
|
(2
|
)
|
207
|
|
—
|
|
(2
|
)
|
|||||||||||||
|
Pay fixed swaps
|
Municipal securities
|
231
|
|
—
|
|
(83
|
)
|
244
|
|
—
|
|
(94
|
)
|
|||||||||||||
|
Total
|
|
15,466
|
|
206
|
|
(186
|
)
|
13,543
|
|
329
|
|
(97
|
)
|
|||||||||||||
|
Not designated as hedges:
|
|
|
|
|
|
|
|
|
|
|
|
|
|
|||||||||||||
|
Client-related and other risk management:
|
|
|
|
|
|
|
|
|
|
|
|
|
||||||||||||||
|
Interest rate contracts:
|
|
|
|
|
|
|
|
|
|
|
|
|
|
|||||||||||||
|
Receive fixed swaps
|
|
9,989
|
|
235
|
|
(44
|
)
|
8,827
|
|
337
|
|
(1
|
)
|
|||||||||||||
|
Pay fixed swaps
|
|
10,263
|
|
43
|
|
(252
|
)
|
8,984
|
|
1
|
|
(363
|
)
|
|||||||||||||
|
Other swaps
|
|
1,086
|
|
2
|
|
(5
|
)
|
1,005
|
|
3
|
|
(6
|
)
|
|||||||||||||
|
Other
|
|
709
|
|
2
|
|
(2
|
)
|
601
|
|
1
|
|
(2
|
)
|
|||||||||||||
|
Forward commitments
|
5,972
|
|
29
|
|
(28
|
)
|
4,403
|
|
5
|
|
(4
|
)
|
||||||||||||||
|
Foreign exchange contracts
|
669
|
|
8
|
|
(5
|
)
|
513
|
|
6
|
|
(4
|
)
|
||||||||||||||
|
Total
|
|
28,688
|
|
319
|
|
(336
|
)
|
24,333
|
|
353
|
|
(380
|
)
|
|||||||||||||
|
Mortgage banking:
|
|
|
|
|
|
|
|
|
|
|
|
|
|
|||||||||||||
|
Interest rate contracts:
|
|
|
|
|
|
|
|
|
|
|
|
|
|
|||||||||||||
|
Interest rate lock commitments
|
2,219
|
|
7
|
|
(20
|
)
|
1,828
|
|
8
|
|
(4
|
)
|
||||||||||||||
|
When issued securities, forward rate agreements and forward commitments
|
3,657
|
|
51
|
|
(14
|
)
|
2,725
|
|
9
|
|
(5
|
)
|
||||||||||||||
|
Other
|
|
449
|
|
2
|
|
(1
|
)
|
677
|
|
4
|
|
—
|
|
|||||||||||||
|
Total
|
|
6,325
|
|
60
|
|
(35
|
)
|
5,230
|
|
21
|
|
(9
|
)
|
|||||||||||||
|
MSRs:
|
|
|
|
|
|
|
|
|
|
|
|
|
|
|||||||||||||
|
Interest rate contracts:
|
|
|
|
|
|
|
|
|
|
|
|
|
|
|||||||||||||
|
Receive fixed swaps
|
|
5,034
|
|
18
|
|
(236
|
)
|
2,343
|
|
79
|
|
(7
|
)
|
|||||||||||||
|
Pay fixed swaps
|
|
3,768
|
|
56
|
|
(7
|
)
|
2,329
|
|
4
|
|
(56
|
)
|
|||||||||||||
|
Options
|
|
5,710
|
|
160
|
|
(8
|
)
|
7,765
|
|
184
|
|
(24
|
)
|
|||||||||||||
|
When issued securities, forward rate agreements and forward commitments
|
3,210
|
|
3
|
|
(8
|
)
|
2,682
|
|
—
|
|
(5
|
)
|
||||||||||||||
|
Total
|
|
17,722
|
|
237
|
|
(259
|
)
|
15,119
|
|
267
|
|
(92
|
)
|
|||||||||||||
|
Total derivatives not designated as hedges
|
52,735
|
|
616
|
|
(630
|
)
|
44,682
|
|
641
|
|
(481
|
)
|
||||||||||||||
|
Total derivatives
|
$
|
75,251
|
|
822
|
|
(1,003
|
)
|
$
|
67,525
|
|
970
|
|
(792
|
)
|
||||||||||||
|
Gross amounts not offset in the Consolidated Balance Sheets:
|
|
|
|
|
|
|
|
|
|
|
||||||||||||||||
|
Amounts subject to master netting arrangements not offset due to policy election
|
(443
|
)
|
443
|
|
|
|
(391
|
)
|
391
|
|
||||||||||||||||
|
Cash collateral (received) posted
|
|
|
(119
|
)
|
450
|
|
|
|
(283
|
)
|
368
|
|
||||||||||||||
|
Net amount
|
|
|
$
|
260
|
|
$
|
(110
|
)
|
|
|
$
|
296
|
|
$
|
(33
|
)
|
||||||||||
132
The fair values of derivatives in a gain or loss position are presented on a gross basis in other assets or other liabilities, respectively, in the Consolidated Balance Sheets. Cash collateral posted for derivatives in a loss position is reported as restricted cash. Derivatives with dealer counterparties at both the bank and the parent company are governed by the terms of ISDA Master netting agreements and Credit Support Annexes. The ISDA Master agreements allow counterparties to offset trades in a gain against trades in a loss to determine net exposure and allows for the right of setoff in the event of either a default or an additional termination event. Credit Support Annexes govern the terms of daily collateral posting practices. Collateral practices mitigate the potential loss impact to affected parties by requiring liquid collateral to be posted on a scheduled basis to secure the aggregate net unsecured exposure. In addition to collateral, the right of setoff allows counterparties to offset net derivative values with a defaulting party against certain other contractual receivables from or obligations due to the defaulting party in determining the net termination amount.
No portion of the change in fair value of derivatives designated as hedges has been excluded from effectiveness testing. The ineffective portion was immaterial for all periods presented. The following table presents the effect of hedging derivative instruments on the consolidated statements of income:
|
|
Effective Portion
|
|||||||||||||||||||||||||
|
|
Pre-tax Gain (Loss) Recognized in OCI
|
Location of Amounts Reclassified from AOCI into Income
|
Pre-tax Gain (Loss) Reclassified from AOCI into Income
|
|||||||||||||||||||||||
|
Year Ended December 31
|
2016
|
2015
|
2014
|
2016
|
2015
|
2014
|
||||||||||||||||||||
|
|
(Dollars in millions)
|
|||||||||||||||||||||||||
|
Cash Flow Hedges:
|
|
|
|
|
|
|
|
|||||||||||||||||||
|
Interest rate contracts
|
$
|
(24
|
)
|
$
|
(130
|
)
|
$
|
(172
|
)
|
Total interest expense
|
$
|
(11
|
)
|
$
|
(83
|
)
|
$
|
(82
|
)
|
|||||||
|
|
|
|
|
|
||||||||||||||||||||||
|
|
|
|
|
Location of Amounts Recognized in Income
|
Pre-tax Gain (Loss) Recognized in Income
|
|||||||||||||||||||||
|
|
|
|
|
2016
|
2015
|
2014
|
||||||||||||||||||||
|
|
|
|
|
|
(Dollars in millions)
|
|||||||||||||||||||||
|
Fair Value Hedges:
|
|
|
|
|
|
|
|
|||||||||||||||||||
|
Interest rate contracts
|
|
|
|
Total interest income
|
$
|
(18
|
)
|
$
|
(20
|
)
|
$
|
(22
|
)
|
|||||||||||||
|
Interest rate contracts
|
|
|
|
Total interest expense
|
226
|
|
279
|
|
233
|
|
||||||||||||||||
|
Total
|
|
|
|
|
$
|
208
|
|
$
|
259
|
|
$
|
211
|
|
|||||||||||||
|
Not Designated as Hedges:
|
|
|
|
|
|
|
|
|
|
|||||||||||||||||
|
Client-related and other risk management:
|
|
|
|
|
|
|
|
|||||||||||||||||||
|
Interest rate contracts
|
|
|
Other income
|
$
|
52
|
|
$
|
27
|
|
$
|
18
|
|
||||||||||||||
|
Foreign exchange contracts
|
Other income
|
11
|
|
21
|
|
16
|
|
|||||||||||||||||||
|
Mortgage Banking:
|
|
|
|
|
|
|
|
|
|
|||||||||||||||||
|
Interest rate contracts
|
|
|
Mortgage banking income
|
8
|
|
7
|
|
(16
|
)
|
|||||||||||||||||
|
MSRs:
|
|
|
|
|
|
|
|
|
|
|||||||||||||||||
|
Interest rate contracts
|
|
|
Mortgage banking income
|
31
|
|
32
|
|
251
|
|
|||||||||||||||||
|
Total
|
|
|
|
|
$
|
102
|
|
$
|
87
|
|
$
|
269
|
|
|||||||||||||
133
The following table provides a summary of derivative strategies and the related accounting treatment:
|
|
|
Cash Flow Hedges
|
|
Fair Value Hedges
|
|
Derivatives Not Designated as Hedges
|
|
|
|
|
|
|
|
|
|
Risk exposure
|
|
Variability in cash flows of interest payments on floating rate business loans, overnight funding and various LIBOR funding instruments.
|
|
Losses in value on fixed rate long-term debt, CDs, FHLB advances, loans and state and political subdivision securities due to changes in interest rates.
|
|
Risk associated with an asset or liability, including mortgage banking operations and MSRs, or for client needs. Includes exposure to changes in market rates and conditions subsequent to the interest rate lock and funding date for mortgage loans originated for sale.
|
|
|
|
|
|
|
|
|
|
Risk management objective
|
|
Hedge the variability in the interest payments and receipts on future cash flows for forecasted transactions related to the first unhedged payments and receipts of variable interest.
|
|
Convert the fixed rate paid or received to a floating rate, primarily through the use of swaps.
|
|
For interest rate lock commitment derivatives and LHFS, use mortgage-based derivatives such as forward commitments and options to mitigate market risk. For MSRs, mitigate the income statement effect of changes in the fair value of the MSRs.
|
|
|
|
|
|
|
|
|
|
Treatment for portion that is highly effective
|
|
Recognized in AOCI until the related cash flows from the hedged item are recognized in earnings.
|
|
Recognized in current period income along with the corresponding changes in the fair value of the designated hedged item attributable to the risk being hedged.
|
|
Entire change in fair value recognized in current period income.
|
|
|
|
|
|
|
|
|
|
Treatment for portion that is ineffective
|
|
Recognized in current period income.
|
|
Recognized in current period income.
|
|
Not applicable
|
|
|
|
|
|
|
|
|
|
Treatment if hedge ceases to be highly effective or is terminated
|
|
Hedge is dedesignated. Effective changes in value that are recorded in AOCI before dedesignation are amortized to yield over the period the forecasted hedged transactions impact earnings.
|
|
If hedged item remains outstanding, termination proceeds are included in cash flows from financing activities and effective changes in value are reflected as part of the carrying value of the financial instrument and amortized to earnings over its estimated remaining life.
|
|
Not applicable
|
|
|
|
|
|
|
|
|
|
Treatment if transaction is no longer probable of occurring during forecast period or within a short period thereafter
|
|
Hedge accounting is ceased and any gain or loss in AOCI is reported in earnings immediately.
|
|
Not applicable
|
|
Not applicable
|
134
The following table presents information about BB&T's cash flow and fair value hedges:
|
|
December 31,
|
|||||||||
|
|
2016
|
2015
|
||||||||
|
|
(Dollars in millions)
|
|||||||||
|
Cash flow hedges:
|
|
|
|
|||||||
|
Net unrecognized after-tax loss on active hedges recorded in AOCI
|
$
|
(118
|
)
|
$
|
(134
|
)
|
||||
|
Net unrecognized after-tax gain on terminated hedges recorded in AOCI (to be recognized in earnings through 2022)
|
26
|
|
50
|
|
||||||
|
Estimated portion of net after-tax loss on active and terminated hedges to be reclassified from AOCI into earnings during the next 12 months
|
(4
|
)
|
(7
|
)
|
||||||
|
Maximum time period over which BB&T has hedged a portion of the variability in future cash flows for forecasted transactions excluding those transactions relating to the payment of variable interest on existing instruments
|
6
|
|
yrs
|
7
|
|
yrs
|
||||
|
Fair value hedges:
|
|
|
|
|
||||||
|
Unrecognized pre-tax net gain on terminated hedges (to be recognized as interest primarily through 2019)
|
$
|
169
|
|
$
|
138
|
|
||||
|
Portion of pre-tax net gain on terminated hedges to be recognized as a change in interest during the next 12 months
|
56
|
|
57
|
|
||||||
Derivatives Credit Risk – Dealer Counterparties
Credit risk related to derivatives arises when amounts receivable from a counterparty exceed those payable to the same counterparty. The risk of loss is addressed by subjecting dealer counterparties to credit reviews and approvals similar to those used in making loans or other extensions of credit and by requiring collateral. Dealer counterparties operate under agreements to provide cash and/or liquid collateral when unsecured loss positions exceed negotiated limits.
Derivative contracts with dealer counterparties settle on a monthly, quarterly or semiannual basis, with daily movement of collateral between counterparties required within established netting agreements. BB&T only transacts with dealer counterparties with strong credit standings.
Derivatives Credit Risk – Central Clearing Parties
Certain derivatives are cleared through central clearing parties that require initial margin collateral, as well as collateral for trades in a net loss position. Initial margin collateral requirements are established by central clearing parties on varying bases, with such amounts generally designed to offset the risk of non-payment. Initial margin is generally calculated by applying the maximum loss experienced in value over a specified time horizon to the portfolio of existing trades. The central clearing party used for TBA transactions does not post variation margin to the bank.
|
|
December 31,
|
||||||
|
|
2016
|
2015
|
|||||
|
|
(Dollars in millions)
|
||||||
|
Dealer Counterparties:
|
|
|
|||||
|
Cash collateral received from dealer counterparties
|
$
|
123
|
|
$
|
283
|
|
|
|
Derivatives in a net gain position secured by that collateral
|
123
|
|
301
|
|
|||
|
Unsecured positions in a net gain with dealer counterparties after collateral postings
|
4
|
|
18
|
|
|||
|
Cash collateral posted to dealer counterparties
|
138
|
|
156
|
|
|||
|
Derivatives in a net loss position secured by that collateral
|
144
|
|
161
|
|
|||
|
Additional collateral that would have been posted had BB&T's credit ratings dropped below investment grade
|
8
|
|
6
|
|
|||
|
Central Clearing Parties:
|
|
|
|
|
|||
|
Cash collateral, including initial margin, posted to central clearing parties
|
313
|
|
223
|
|
|||
|
Derivatives in a net loss position secured by that collateral
|
318
|
|
227
|
|
|||
|
Securities pledged to central clearing parties
|
119
|
|
207
|
|
|||
135
Basic and diluted EPS calculations are presented in the following table:
|
|
Year Ended December 31,
|
|||||||||||
|
|
2016
|
2015
|
2014
|
|||||||||
|
|
(Dollars in millions, except per share data, shares in thousands)
|
|||||||||||
|
Net income available to common shareholders
|
$
|
2,259
|
|
$
|
1,936
|
|
$
|
1,983
|
|
|||
|
Weighted average number of common shares
|
804,680
|
|
748,010
|
|
718,140
|
|
||||||
|
Effect of dilutive outstanding equity-based awards
|
10,236
|
|
9,755
|
|
10,232
|
|
||||||
|
Weighted average number of diluted common shares
|
814,916
|
|
757,765
|
|
728,372
|
|
||||||
|
Basic EPS
|
$
|
2.81
|
|
$
|
2.59
|
|
$
|
2.76
|
|
|||
|
Diluted EPS
|
$
|
2.77
|
|
$
|
2.56
|
|
$
|
2.72
|
|
|||
|
Anti-dilutive awards
|
5,609
|
|
8,620
|
|
14,333
|
|
||||||
BB&T's operations are divided into
six
reportable business segments that have been identified based on BB&T’s organizational structure. The segments require unique technology and marketing strategies and offer different products and services through a number of distinctly branded BUs. In addition, there is an Other, Treasury and Corporate segment. While BB&T is managed as an integrated organization, individual executive managers are held accountable for the operations of these business segments.
BB&T emphasizes revenue growth by focusing on client service, sales effectiveness and relationship management along with an organizational focus on referring clients between BUs. The business objective is to provide BB&T’s entire suite of products to our clients with the end goal of providing our clients the best financial experience in the marketplace. The segment results are presented based on internal management accounting policies that were designed to support these strategic objectives. Unlike financial accounting, there is no comprehensive authoritative body of guidance for management accounting equivalent to GAAP. The performance of the segments is not comparable with BB&T’s consolidated results or with similar information presented by any other financial institution. Additionally, because of the interrelationships of the various segments, the information presented is not indicative of how the segments would perform if they operated as independent entities.
The management accounting process uses various estimates and allocation methodologies to measure the performance of the operating segments. To determine financial performance for each segment, BB&T allocates capital, funding charges and credits, provisions for credit losses, certain noninterest expenses and income tax provisions to each segment, as applicable. To promote revenue growth, certain revenues are reflected in noninterest income in the individual segment results and also allocated to Community Banking and Financial Services. These allocated revenues are reflected in intersegment net referral fees and eliminated in Other, Treasury and Corporate. Additionally certain client groups of Community Banking have also been identified as clients of other BUs within the business segments. Periodically, existing clients within the Community Banking segment may be identified and assigned as wealth and private banking clients. At the time of identification, these clients’ loan and deposit balances are reported in the Financial Services segment from the time of assignment forward. The net interest income and associated net FTP associated with these customers’ loans and deposits is accounted for in Community Banking in the respective line categories of net interest income (expense) and net intersegment interest income (expense). For Commercial Finance and the Wealth Division, NIM and net intersegment interest income have been combined in the net intersegment interest income (expense) line with an appropriate offsetting amount to the Other, Treasury and Corporate line item to ensure consolidated totals reflect the Company’s total NIM for loans and deposits. Allocation methodologies are subject to periodic adjustment as the internal management accounting system is revised and business or product lines within the segments change. Also, because the development and application of these methodologies is a dynamic process, the financial results presented may be periodically revised.
BB&T utilizes an FTP system to eliminate the effect of interest rate risk from the segments’ net interest income because such risk is centrally managed within the Treasury function. The FTP system credits or charges the segments with the economic value or cost of the funds the segments create or use. The net FTP credit or charge, which includes intercompany interest income and expense, is reflected as net intersegment income (expense) in the accompanying tables.
136
The allocated provision for credit losses is also allocated to the relevant segments based on management’s assessment of the segments’ credit risks. The allocated provision is designed to achieve a high degree of correlation between the loan loss experience and the GAAP basis provision at the segment level, while at the same time providing management with a measure of operating performance that gives appropriate consideration to the risks inherent in each of the Company’s operating segments. Any over or under allocated provision for credit losses is reflected in Other, Treasury and Corporate to arrive at consolidated results.
BB&T allocates expenses to the reportable segments based on various methodologies, including volume and amount of loans and deposits and the number of full-time equivalent employees. Allocation systems are refined from time to time along with further identification of certain cost pools. These cost pools and refinements are implemented to provide for improved managerial reporting of cost to the appropriate business segments. A portion of corporate overhead expense is not allocated, but is retained in corporate accounts and reflected as Other, Treasury and Corporate in the accompanying tables. The majority of depreciation expense is recorded in support units and allocated to the segments as part of allocated corporate expense. Income taxes are allocated to the various segments based on taxable income and statutory rates applicable to the segment.
Community Banking
Community Banking serves individual and business clients by offering a variety of loan and deposit products and other financial services. Community Banking is primarily responsible for serving client relationships and, therefore, is credited with certain revenue from the Residential Mortgage Banking, Financial Services, Insurance Holdings, Specialized Lending, and other segments, which is reflected in net referral fees.
Residential Mortgage Banking
Residential Mortgage Banking retains and services mortgage loans originated by BB&T as well as those purchased from various correspondent originators. Mortgage loan products include fixed and adjustable rate government and conventional loans for the purpose of constructing, purchasing or refinancing residential properties. Substantially all of the properties are owner occupied. BB&T generally retains the servicing rights to loans sold. Residential Mortgage Banking earns interest on loans held in the warehouse and portfolio, earns fee income from the origination and servicing of mortgage loans and recognizes gains or losses from the sale of mortgage loans.
Dealer Financial Services
Dealer Financial Services originates loans to consumers on a prime and nonprime basis for the purchase of automobiles. Such loans are originated on an indirect basis through approved franchised and independent automobile dealers throughout the BB&T market area and nationally through Regional Acceptance Corporation. This segment also originates loans for the purchase of boats and recreational vehicles originated through dealers in BB&T’s market area. In addition, financing and servicing to dealers for their inventories is provided through a joint relationship between Dealer Financial Services and Community Banking.
Specialized Lending
Specialized Lending consists of BUs and subsidiaries that provide specialty finance products to consumers and businesses. The BUs include the Mortgage Warehouse Lending business and Governmental Finance. Mortgage Warehouse Lending provides short-term lending solutions to finance first-lien residential mortgage LHFS by independent mortgage companies. Governmental Finance provides tax-exempt financing to meet the capital project needs of local governments. Operating subsidiaries include BB&T Equipment Finance and BB&T Commercial Equipment Capital, which provide equipment leasing for large and small-to-middle market clients primarily within BB&T’s banking footprint; Sheffield Financial, a dealer-based financer of small ticket equipment for both businesses and consumers; Prime Rate Premium Finance Corporation, which includes AFCO and CAFO, insurance premium finance BUs that provide funding to businesses in the United States and Canada and to consumers in certain markets within BB&T’s banking footprint; and Grandbridge, a full-service commercial mortgage banking lender providing loans on a national basis. Branch Bank clients as well as nonbank clients within and outside BB&T’s primary geographic market area are served by these BUs. The Community Banking segment receives credit for referrals to these BUs with the corresponding charge retained as part of Other, Treasury and Corporate in the accompanying tables.
137
Insurance Holdings
BB&T's insurance agency / brokerage network is the sixth largest in the world. Insurance Holdings provides property and casualty, employee benefits and life insurance to businesses and individuals. It also provides small business and corporate services, such as workers compensation and professional liability, as well as surety coverage and title insurance. Community Banking and Financial Services receive credit for insurance commissions on referred accounts, with the corresponding charge retained in the corporate office, which is reflected as part of Other, Treasury and Corporate in the accompanying tables.
Financial Services
Financial Services provides personal trust administration, estate planning, investment counseling, wealth management, asset management, corporate retirement services, corporate banking and corporate trust services. Financial Services also offers clients investment alternatives, including discount brokerage services, equities, fixed-rate and variable-rate annuities, mutual funds and governmental and municipal bonds through BB&T Investment Services, Inc.
Financial Services includes BB&T Securities, a full-service brokerage and investment banking firm that provides services in retail brokerage, equity and debt underwriting and investment advice and facilitates the origination, trading and distribution of fixed-income securities and equity products in both the public and private capital markets. BB&T Securities also has a public finance department that provides investment banking services, financial advisory services and municipal bond financing to a variety of regional taxable and tax-exempt issuers.
Financial Services includes a group of consolidated SBIC private equity and mezzanine investment funds that invest in privately owned middle-market operating companies to facilitate growth or ownership transition. Financial Services also includes the Corporate Banking Division that originates and services large corporate relationships, syndicated lending relationships and client derivatives. Community Banking receives an interoffice credit for referral fees, with the corresponding charge reflected as part of Other, Treasury and Corporate in the accompanying tables. Also captured within the net intersegment interest income for Financial Services is the NIM for the loans and deposits associated with client relationships assigned to the Wealth Division that are housed in the Community Bank.
Other, Treasury and Corporate
Other, Treasury and Corporate is the combination of the Other segment that represents operating entities that do not meet the quantitative or qualitative thresholds for disclosure; BB&T’s Treasury function, which is responsible for the management of the securities portfolios, overall balance sheet funding and liquidity, and overall management of interest rate risk; the corporate support functions that have not been allocated to the business segments; certain merger-related charges or credits that are incurred as part of the acquisition and conversion of acquired entities; certain nonrecurring charges that are considered to be unusual in nature or infrequent and not reflective of the normal operations of the segments; and intercompany eliminations including intersegment net referral fees and net intersegment interest income (expense).
The investment balances and results related to affordable housing investments are included in the Other, Treasury and Corporate segment. PCI loans from the Colonial acquisition and related net interest income are also included in this segment. Performance results of bank acquisitions prior to system conversion are typically reported in this segment and on a post-conversion date are reported in the Community Banking segment.
Segment Realignment
Effective January 2017, several business activities were realigned within the segments. First, certain client relationships with
$218 million
of loans and
$2.0 billion
of deposits were no longer included in Financial Services and are only reported in Community Banking. Second, the Mortgage Warehouse Lending and Domestic Factoring businesses within Specialized Lending were moved to Residential Mortgage Banking and Other, Treasury and Corporate, respectively. Third, the International division was restructured with components integrated into Community Banking and Financial Services from Other, Treasury and Corporate. The following table presents segment results prior to the realignment.
138
|
|
Community Banking
|
Residential Mortgage Banking
|
Dealer Financial Services
|
Specialized Lending
|
||||||||||||||||||||||||||||||||||||||||||||
|
Year Ended December 31,
|
2016
|
2015
|
2014
|
2016
|
2015
|
2014
|
2016
|
2015
|
2014
|
2016
|
2015
|
2014
|
||||||||||||||||||||||||||||||||||||
|
|
(Dollars in millions)
|
|||||||||||||||||||||||||||||||||||||||||||||||
|
Net interest income (expense)
|
$
|
2,208
|
|
$
|
1,798
|
|
$
|
1,726
|
|
$
|
1,341
|
|
$
|
1,357
|
|
$
|
1,482
|
|
$
|
930
|
|
$
|
881
|
|
$
|
835
|
|
$
|
752
|
|
$
|
648
|
|
$
|
575
|
|
||||||||||||
|
Net intersegment interest income (expense)
|
1,589
|
|
1,271
|
|
1,188
|
|
(898
|
)
|
(905
|
)
|
(984
|
)
|
(161
|
)
|
(153
|
)
|
(160
|
)
|
(283
|
)
|
(235
|
)
|
(206
|
)
|
||||||||||||||||||||||||
|
Segment net interest income
|
3,797
|
|
3,069
|
|
2,914
|
|
443
|
|
452
|
|
498
|
|
769
|
|
728
|
|
675
|
|
469
|
|
413
|
|
369
|
|
||||||||||||||||||||||||
|
Allocated provision for credit losses
|
36
|
|
67
|
|
123
|
|
45
|
|
9
|
|
(107
|
)
|
296
|
|
253
|
|
237
|
|
70
|
|
43
|
|
36
|
|
||||||||||||||||||||||||
|
Noninterest income
|
1,227
|
|
1,166
|
|
1,184
|
|
344
|
|
355
|
|
310
|
|
2
|
|
—
|
|
2
|
|
297
|
|
260
|
|
222
|
|
||||||||||||||||||||||||
|
Intersegment net referral fees (expense)
|
153
|
|
135
|
|
120
|
|
1
|
|
2
|
|
2
|
|
—
|
|
—
|
|
—
|
|
—
|
|
—
|
|
—
|
|
||||||||||||||||||||||||
|
Noninterest expense
|
1,742
|
|
1,516
|
|
1,428
|
|
211
|
|
321
|
|
498
|
|
149
|
|
151
|
|
114
|
|
300
|
|
254
|
|
210
|
|
||||||||||||||||||||||||
|
Amortization of intangibles
|
74
|
|
39
|
|
29
|
|
—
|
|
—
|
|
—
|
|
—
|
|
—
|
|
—
|
|
5
|
|
4
|
|
5
|
|
||||||||||||||||||||||||
|
Allocated corporate expenses
|
1,337
|
|
1,225
|
|
1,204
|
|
107
|
|
93
|
|
91
|
|
45
|
|
38
|
|
31
|
|
81
|
|
63
|
|
62
|
|
||||||||||||||||||||||||
|
Income (loss) before income taxes
|
1,988
|
|
1,523
|
|
1,434
|
|
425
|
|
386
|
|
328
|
|
281
|
|
286
|
|
295
|
|
310
|
|
309
|
|
278
|
|
||||||||||||||||||||||||
|
Provision (benefit) for income taxes
|
724
|
|
563
|
|
524
|
|
161
|
|
146
|
|
124
|
|
107
|
|
109
|
|
112
|
|
74
|
|
74
|
|
63
|
|
||||||||||||||||||||||||
|
Segment net income (loss)
|
$
|
1,264
|
|
$
|
960
|
|
$
|
910
|
|
$
|
264
|
|
$
|
240
|
|
$
|
204
|
|
$
|
174
|
|
$
|
177
|
|
$
|
183
|
|
$
|
236
|
|
$
|
235
|
|
$
|
215
|
|
||||||||||||
|
Identifiable assets (period end)
|
$
|
73,640
|
|
$
|
68,250
|
|
$
|
55,495
|
|
$
|
33,473
|
|
$
|
33,407
|
|
$
|
34,463
|
|
$
|
16,556
|
|
$
|
15,130
|
|
$
|
12,821
|
|
$
|
19,976
|
|
$
|
18,243
|
|
$
|
15,671
|
|
||||||||||||
|
|
Insurance Holdings
|
Financial Services
|
Other, Treasury and Corporate (1)
|
Total BB&T Corporation
|
||||||||||||||||||||||||||||||||||||||||||||
|
|
2016
|
2015
|
2014
|
2016
|
2015
|
2014
|
2016
|
2015
|
2014
|
2016
|
2015
|
2014
|
||||||||||||||||||||||||||||||||||||
|
|
(Dollars in millions)
|
|||||||||||||||||||||||||||||||||||||||||||||||
|
Net interest income (expense)
|
$
|
3
|
|
$
|
2
|
|
$
|
2
|
|
$
|
260
|
|
$
|
219
|
|
$
|
187
|
|
$
|
827
|
|
$
|
687
|
|
$
|
567
|
|
$
|
6,321
|
|
$
|
5,592
|
|
$
|
5,374
|
|
||||||||||||
|
Net intersegment interest income (expense)
|
4
|
|
6
|
|
6
|
|
372
|
|
314
|
|
263
|
|
(623
|
)
|
(298
|
)
|
(107
|
)
|
—
|
|
—
|
|
—
|
|
||||||||||||||||||||||||
|
Segment net interest income
|
7
|
|
8
|
|
8
|
|
632
|
|
533
|
|
450
|
|
204
|
|
389
|
|
460
|
|
6,321
|
|
5,592
|
|
5,374
|
|
||||||||||||||||||||||||
|
Allocated provision for credit losses
|
—
|
|
—
|
|
—
|
|
126
|
|
66
|
|
26
|
|
(1
|
)
|
(10
|
)
|
(64
|
)
|
572
|
|
428
|
|
251
|
|
||||||||||||||||||||||||
|
Noninterest income
|
1,726
|
|
1,608
|
|
1,663
|
|
888
|
|
850
|
|
780
|
|
(12
|
)
|
(220
|
)
|
(305
|
)
|
4,472
|
|
4,019
|
|
3,856
|
|
||||||||||||||||||||||||
|
Intersegment net referral fees (expense)
|
—
|
|
—
|
|
—
|
|
23
|
|
22
|
|
15
|
|
(177
|
)
|
(159
|
)
|
(137
|
)
|
—
|
|
—
|
|
—
|
|
||||||||||||||||||||||||
|
Noninterest expense
|
1,312
|
|
1,190
|
|
1,189
|
|
753
|
|
683
|
|
637
|
|
2,104
|
|
2,046
|
|
1,685
|
|
6,571
|
|
6,161
|
|
5,761
|
|
||||||||||||||||||||||||
|
Amortization of intangibles
|
60
|
|
47
|
|
53
|
|
5
|
|
3
|
|
2
|
|
6
|
|
12
|
|
2
|
|
150
|
|
105
|
|
91
|
|
||||||||||||||||||||||||
|
Allocated corporate expenses
|
111
|
|
99
|
|
86
|
|
151
|
|
136
|
|
128
|
|
(1,832
|
)
|
(1,654
|
)
|
(1,602
|
)
|
—
|
|
—
|
|
—
|
|
||||||||||||||||||||||||
|
Income (loss) before income taxes
|
250
|
|
280
|
|
343
|
|
508
|
|
517
|
|
452
|
|
(262
|
)
|
(384
|
)
|
(3
|
)
|
3,500
|
|
2,917
|
|
3,127
|
|
||||||||||||||||||||||||
|
Provision (benefit) for income taxes
|
96
|
|
98
|
|
110
|
|
190
|
|
195
|
|
170
|
|
(294
|
)
|
(391
|
)
|
(182
|
)
|
1,058
|
|
794
|
|
921
|
|
||||||||||||||||||||||||
|
Segment net income (loss)
|
$
|
154
|
|
$
|
182
|
|
$
|
233
|
|
$
|
318
|
|
$
|
322
|
|
$
|
282
|
|
$
|
32
|
|
$
|
7
|
|
$
|
179
|
|
$
|
2,442
|
|
$
|
2,123
|
|
$
|
2,206
|
|
||||||||||||
|
Identifiable assets (period end)
|
$
|
3,463
|
|
$
|
2,804
|
|
$
|
2,965
|
|
$
|
17,451
|
|
$
|
16,650
|
|
$
|
12,887
|
|
$
|
54,717
|
|
$
|
55,463
|
|
$
|
52,532
|
|
$
|
219,276
|
|
$
|
209,947
|
|
$
|
186,834
|
|
||||||||||||
__________________
(1) Includes financial data from subsidiaries below the quantitative and qualitative thresholds requiring disclosure.
139
SIGNATURES
Pursuant to the requirements of Section 13 or 15(d) of the Exchange Act, the Registrant has duly caused this report to be signed on its behalf by the undersigned, thereunto duly authorized, as of
February 21, 2017
:
|
|
BB&T Corporation
|
|
|
|
(Registrant)
|
|
|
|
|
|
|
|
|
/s/ Kelly S. King
|
|
|
|
Kelly S. King
|
|
|
|
Chairman and Chief Executive Officer
|
Pursuant to the requirements of the Exchange Act, this report has been signed below by the following persons on behalf of the Registrant and in the capacities indicated as of
February 21, 2017
:
|
|
/s/ Kelly S. King
|
|
|
Kelly S. King
|
|
|
Chairman and Chief Executive Officer
|
|
|
(Principal Executive Officer)
|
|
|
|
|
|
/s/ Daryl N. Bible
|
|
|
Daryl N. Bible
|
|
|
Senior Executive Vice President and
|
|
|
Chief Financial Officer
|
|
|
(Principal Financial Officer)
|
|
|
|
|
|
/s/ Cynthia B. Powell
|
|
|
Cynthia B. Powell
|
|
|
Executive Vice President and
|
|
|
Corporate Controller
|
|
|
(Principal Accounting Officer)
|
140
A Majority of the Directors of the Registrant are included:
|
|
/s/ Kelly S. King
|
|
/s/ Thomas E. Skains
|
|
|
|
Kelly S. King
|
|
Thomas E. Skains
|
|
|
|
Chairman and Chief Executive Officer
|
|
Director
|
|
|
|
|
|
|
|
|
|
/s/ Jennifer S. Banner
|
|
/s/ Thomas N. Thompson
|
|
|
|
Jennifer S. Banner
|
|
Thomas N. Thompson
|
|
|
|
Director
|
|
Director
|
|
|
|
|
|
|
|
|
|
/s/ K. David Boyer, Jr.
|
|
|
|
|
|
K. David Boyer, Jr.
|
|
Stephen T. Williams
|
|
|
|
Director
|
|
Director
|
|
|
|
|
|
|
|
|
|
/s/ Anna R. Cablik
|
|
|
|
|
|
Anna R. Cablik
|
|
|
|
|
|
Director
|
|
|
|
|
|
|
|
|
|
|
|
/s/ James A. Faulkner
|
|
|
|
|
|
James A. Faulkner
|
|
|
|
|
|
Director
|
|
|
|
|
|
|
|
|
|
|
|
/s/ I. Patricia Henry
|
|
|
|
|
|
I. Patricia Henry
|
|
|
|
|
|
Director
|
|
|
|
|
|
|
|
|
|
|
|
/s/ Eric C. Kendrick
|
|
|
|
|
|
Eric C. Kendrick
|
|
|
|
|
|
Director
|
|
|
|
|
|
|
|
|
|
|
|
/s/ Dr. Louis B. Lynn
|
|
|
|
|
|
Dr. Louis B. Lynn
|
|
|
|
|
|
Director
|
|
|
|
|
|
|
|
|
|
|
|
/s/ Charles A. Patton
|
|
|
|
|
|
Charles A. Patton
|
|
|
|
|
|
Director
|
|
|
|
|
|
|
|
|
|
|
|
/s/ Nido R. Qubein
|
|
|
|
|
|
Nido R. Qubein
|
|
|
|
|
|
Director
|
|
|
|
|
|
|
|
|
|
|
|
/s/ William J. Reuter
|
|
|
|
|
|
William J. Reuter
|
|
|
|
|
|
Director
|
|
|
|
|
|
|
|
|
|
|
|
/s/ Tollie W. Rich, Jr.
|
|
|
|
|
|
Tollie W. Rich, Jr.
|
|
|
|
|
|
Director
|
|
|
|
|
|
|
|
|
|
|
/s/ Christine Sears
|
||||
|
Christine Sears
|
||||
|
Director
|
||||
141
EXHIBIT INDEX
|
Exhibit No.
|
|
Description
|
|
Location
|
|
|
2.1
|
|
|
Purchase and Assumption Agreement Whole Bank All Deposits, among the Federal Deposit Insurance Corporation, receiver of Colonial Bank, Montgomery, Alabama, the Federal Deposit Insurance Corporation and Branch Banking and Trust Company, dated as of August 14, 2009.
|
|
Incorporated herein by reference to Exhibit 2.1 of the Current Report on Form 8-K, filed August 17, 2009.
|
|
2.2
|
|
Termination agreement among Federal Deposit Insurance Corporation, receiver of Colonial Bank, Federal Deposit Insurance Corporation and Branch Banking & Trust Company dated as of September 14, 2016.
|
Incorporated herein by reference to Exhibit 10.1 of the Current Report on Form 8-K, filed September 15, 2016.
|
||
|
2.3
|
|
|
Agreement and Plan of Merger, dated as of November 11, 2014, by and between BB&T Corporation and Susquehanna Bancshares, Inc.
|
|
Incorporated herein by reference to Exhibit 2.1 of the Current Report on Form 8-K, filed November 17, 2014.
|
|
2.4
|
|
|
Agreement and Plan of Merger, dated as of August 17, 2015, by and between BB&T Corporation and National Penn Bancshares, Inc.
|
|
Incorporated herein by reference to Exhibit 2.1 of the Current Report on Form 8-K, filed August 20, 2015.
|
|
3(i)
|
|
|
Articles of Incorporation of the Registrant, as amended and restated April 30, 2014.
|
|
Incorporated herein by reference to Exhibit 3(i) of the Current Report on Form 8-K, filed May 2, 2014.
|
|
3(ii)
|
|
Articles of Amendment of the Registrant, dated as of March 4, 2016
|
Incorporated herein by reference to Exhibit 4.1 of the Current Report on Form 8-K, filed March 9, 2016.
|
||
|
3(iii)
|
|
|
Bylaws of the Registrant, as amended and restated December 20, 2016
|
|
Incorporated herein by reference to Exhibit 3.1 of the Current Report on Form 8-K, filed December 22, 2016.
|
|
4.1
|
|
|
Indenture Regarding Senior Securities (including form of Senior Debt Security) between Registrant and U.S. Bank National Association (as successor in interest to State Street Bank and Trust Company), as trustee, dated as of May 24, 1996.
|
|
Incorporated herein by reference to Exhibit 4(c) of Form S-3 Registration Statement No. 333-02899.
|
|
4.2
|
|
|
First Supplemental Indenture, dated May 4, 2009, to the Indenture Regarding Senior Securities, dated as of May 24, 1996, between the Registrant and U.S. Bank National Association.
|
|
Incorporated herein by reference to Exhibit 4.2 of the Current Report on Form 8-K, filed May 4, 2009.
|
|
4.3
|
|
|
Indenture Regarding Subordinated Securities (including Form of Subordinated Debt Security) between the Registrant and U.S. Bank National Association (as successor in interest to State Street Bank and Trust Company), as trustee, dated as of May 24, 1996.
|
|
Incorporated herein by reference to Exhibit 4(d) of Form S-3 Registration Statement No. 333-02899.
|
|
4.4
|
|
|
First Supplemental Indenture, dated as of December 23, 2003, to the Indenture Regarding Subordinated Securities, dated as of May 24, 1996, between the Registrant and U.S. Bank National Association.
|
|
Incorporated herein by reference to Exhibit 4.5 of the Annual Report on Form 10-K, filed February 27, 2009.
|
|
4.5
|
|
|
Second Supplemental Indenture, dated as of September 24, 2004, to the Indenture Regarding Subordinated Securities, dated as of May 24, 1996, between the Registrant and U.S. Bank National Association.
|
|
Incorporated herein by reference to Exhibit 4.7 of the Annual Report on Form 10-K, filed February 26, 2010.
|
|
4.6
|
|
|
Third Supplemental Indenture, dated May 4, 2009, to the Indenture Regarding Subordinated Securities, dated as of May 24, 1996, between the Registrant and U.S. Bank National Association.
|
|
Incorporated herein by reference to Exhibit 4.6 of the Current Report on Form 8-K, filed May 4, 2009.
|
|
10.1*
|
|
|
BB&T Corporation Amended and Restated Non-Employee Directors’ Deferred Compensation and Stock Option Plan (amended and restated January 1, 2005).
|
|
Incorporated herein by reference to Exhibit 10.1 of the Annual Report on Form 10-K, filed February 28, 2008.
|
|
10.2*
|
|
|
BB&T Corporation Amended and Restated 2004 Stock Incentive Plan, as amended (as amended through February 24, 2009).
|
|
Incorporated herein by reference to the Appendix to the Proxy Statement for the 2009 Annual Meeting of Shareholders on Schedule 14A, filed March 13, 2009.
|
|
10.3*
|
|
|
BB&T Corporation 2012 Incentive Plan
|
|
Incorporated herein by reference to the Appendix to the Proxy Statement for the 2012 Annual Meeting of Shareholders on Schedule 14A, filed March 12, 2012.
|
142
|
Exhibit No.
|
|
Description
|
|
Location
|
|
|
10.4*
|
|
|
Form of Restricted Stock Unit Agreement (Non-Employee Directors) for the BB&T 2012 Incentive Plan.
|
|
Incorporated herein by reference to Exhibit 10.1 of the Quarterly Report on Form 10-Q, filed April 27, 2015.
|
|
10.5*
|
|
|
Form of Non-Employee Director Restricted Stock Unit Agreement for the BB&T Corporation Amended and Restated 2004 Stock Incentive Plan (4-Year Vesting).
|
|
Incorporated herein by reference to Exhibit 10.2 of the Quarterly Report on Form 10-Q, filed May 7, 2010.
|
|
10.6*
|
|
|
Form of Non-Employee Director Nonqualified Stock Option Agreement for the BB&T Corporation Amended and Restated 2004 Stock Incentive Plan (5-Year Vesting).
|
|
Incorporated herein by reference to Exhibit 10.7 of the Annual Report on Form 10-K, filed February 28, 2008.
|
|
10.7*
|
|
|
Form of Non-Employee Director Nonqualified Stock Option Agreement for the BB&T Corporation Amended and Restated 2004 Stock Incentive Plan (4-Year Vesting).
|
|
Incorporated herein by reference to Exhibit 10.3 of the Quarterly Report on Form 10-Q, filed May 7, 2010.
|
|
10.8*
|
|
|
Form of Employee Nonqualified Stock Option Agreement for the BB&T Corporation Amended and Restated 2004 Stock Incentive Plan (5-Year Vesting).
|
|
Incorporated herein by reference to Exhibit 10.8 of the Annual Report on Form 10-K, filed February 28, 2008.
|
|
10.9*
|
|
|
Form of Employee Nonqualified Stock Option Agreement for the BB&T Corporation Amended and Restated 2004 Stock Incentive Plan (4-Year Vesting).
|
|
Incorporated herein by reference to Exhibit 10.5 of the Quarterly Report on Form 10-Q, filed May 7, 2010.
|
|
10.10*
|
|
|
Southern National Deferred Compensation Plan for Key Executives including amendments.
|
|
Incorporated herein by reference to Exhibit 10.21 of the Annual Report on Form 10-K, filed February 25, 2011.
|
|
10.11*
|
|
|
BB&T Non-Qualified Defined Benefit Plan (January 1, 2012 Restatement).
|
|
Incorporated herein by reference to Exhibit 10.11 of the Annual Report on Form 10-K, filed February 25, 2016.
|
|
10.12*
|
|
|
First Amendment to the BB&T Non-Qualified Defined Benefit Plan (January 1, 2012 Restatement).
|
|
Incorporated herein by reference to Exhibit 10.12 of the Annual Report on Form 10-K, filed February 25, 2016.
|
|
10.13*
|
|
|
Second Amendment to the BB&T Non-Qualified Defined Benefit Plan (January 1, 2012 Restatement).
|
|
Incorporated herein by reference to Exhibit 10.13 of the Annual Report on Form 10-K, filed February 25, 2016.
|
|
10.14*
|
|
|
BB&T Non-Qualified Defined Contribution Plan (January 1, 2012 Restatement).
|
|
Incorporated herein by reference to Exhibit 10.14 of the Annual Report on Form 10-K, filed February 25, 2016.
|
|
10.15*
|
|
|
BB&T Corporation Non-Qualified Deferred Compensation Trust (Amended and Restated Effective January 1, 2012).
|
|
Incorporated herein by reference to Exhibit 10.15 of the Annual Report on Form 10-K, filed February 25, 2016.
|
|
10.16*
|
|
|
Form of Employee Nonqualified Stock Option Agreement for the BB&T Corporation Amended and Restated 2004 Stock Incentive Plan (4-Year Vesting with Clawback Provision).
|
|
Incorporated herein by reference to Exhibit 10.1 of the Quarterly Report on Form 10-Q, filed May 4, 2012.
|
|
10.17*
|
|
|
Form of Employee Restricted Stock Unit Agreement for the BB&T Corporation Amended and Restated 2004 Stock Incentive Plan (4-Year Vesting with Clawback Provision).
|
|
Incorporated herein by reference to Exhibit 10.2 of the Quarterly Report on Form 10-Q, filed May 4, 2012.
|
|
10.18*
|
|
|
Form of Employee Nonqualified Stock Option Agreement for the BB&T Corporation 2012 Incentive Plan.
|
|
Incorporated herein by reference to Exhibit 10.1 of the Quarterly Report on Form 10-Q, filed May 2, 2013.
|
|
10.19*
|
|
|
Form of Nonqualified Option Agreement (Senior Executive) for the BB&T Corporation 2012 Incentive Plan.
|
|
Incorporated herein by reference to Exhibit 10.4 of the Quarterly Report on Form 10-Q, filed April 30, 2014.
|
|
10.20*
|
|
|
Form of Employee Restricted Stock Unit Agreement for the BB&T Corporation 2012 Incentive Plan.
|
|
Incorporated herein by reference to Exhibit 10.2 of the Quarterly Report on Form 10-Q, filed August 7, 2012.
|
|
10.21*
|
|
|
Form of Director Restricted Stock Unit Agreement for the BB&T Corporation 2012 Incentive Plan.
|
|
Incorporated herein by reference to Exhibit 10.2 of the Quarterly Report on Form 10-Q, filed May 2, 2013.
|
|
10.22*
|
|
|
Form of Restricted Stock Unit Agreement (Performance-Based Vesting Component) for Executive Officers under the BB&T Corporation 2012 Incentive Plan (2013 grants).
|
|
Incorporated herein by reference to Exhibit 10.3 of the Quarterly Report on Form 10-Q, filed May 2, 2013.
|
143
|
Exhibit No.
|
|
Description
|
|
Location
|
|
|
10.23*
|
|
|
Form of Restricted Stock Unit Agreement (Performance-Based Vesting Component)(Senior Executive) for the BB&T Corporation 2012 Incentive Plan.
|
|
Incorporated herein by reference to Exhibit 10.3 of the Quarterly Report on Form 10-Q, filed April 30, 2014.
|
|
10.24*
|
|
|
Form of Restricted Stock Unit Agreement (Tier 2 Employee) for the BB&T Corporation 2012 Incentive Plan.
|
|
Incorporated herein by reference to Exhibit 10.2 of the Quarterly Report on Form 10-Q, filed April 30, 2014.
|
|
10.25*
|
|
|
Form of LTIP Award Agreement for Executive Officers under the BB&T Corporation 2012 Incentive Plan (2013 – 2015 performance period).
|
|
Incorporated herein by reference to Exhibit 10.4 of the Quarterly Report on Form 10-Q, filed May 2, 2013.
|
|
10.26*
|
|
|
Form of LTIP Award Agreement for Executive Officers under the BB&T Corporation 2012 Incentive Plan (2014 – 2016 performance period).
|
|
Incorporated herein by reference to Exhibit 10.1 of the Quarterly Report on Form 10-Q, filed April 30, 2014.
|
|
10.27*
|
|
Form of LTIP Award Agreement for the BB&T Corporation 2012 Incentive Plan.
|
Incorporated herein by reference to Exhibit 10.1 of the Quarterly Report on Form 10-Q, filed April 29, 2016.
|
||
|
10.28*
|
|
Modification of 2016-2018 Long-Term Incentive Performance Award - Summary.
|
Incorporated herein by reference to Exhibit 10.1 of the Quarterly Report on Form 10-Q, filed July 27, 2016.
|
||
|
10.29*
|
|
|
Amended and Restated Employment Agreement by and among BB&T Corporation, Branch Banking and Trust Co. and Kelly S. King dated as of December 19, 2012.
|
|
Incorporated herein by reference to Exhibit 10.1 of the Current Report on Form 8-K, filed December 19, 2012.
|
|
10.30*
|
|
|
2008 Amended and Restated Employment Agreement by and among BB&T Corporation, Branch Banking and Trust Co. and Christopher L. Henson.
|
|
Incorporated herein by reference to Exhibit 10.21 of the Annual Report on Form 10-K, filed February 27, 2009.
|
|
10.31*
|
|
|
2008 Amended and Restated Employment Agreement by and among BB&T Corporation, Branch Banking and Trust Co. and Daryl N. Bible.
|
|
Incorporated herein by reference to Exhibit 10.22 of the Annual Report on Form 10-K, filed February 27, 2009.
|
|
10.32*
|
|
|
2008 Amended and Restated Employment Agreement by and among BB&T Corporation, Branch Banking and Trust Co. and Barbara F. Duck.
|
|
Incorporated herein by reference to Exhibit 10.24 of the Annual Report on Form 10-K, filed February 27, 2009.
|
|
10.33*
|
|
|
2008 Amended and Restated Employment Agreement by and among BB&T Corporation, Branch Banking and Trust Co. and Donna C. Goodrich.
|
|
Incorporated herein by reference to Exhibit 10.25 of the Annual Report on Form 10-K, filed February 27, 2009.
|
|
10.34*
|
|
|
2008 Amended and Restated Employment Agreement by and among BB&T Corporation, Branch Banking and Trust Co. and Clarke R. Starnes, III.
|
|
Incorporated herein by reference to Exhibit 10.27 of the Annual Report on Form 10-K, filed February 27, 2009.
|
|
10.35*
|
|
|
2012 Employment Agreement by and among BB&T Corporation, Branch Banking and Trust Co. and William R. Yates.
|
|
Incorporated herein by reference to Exhibit 10.2 of the Quarterly Report on Form 10-Q, filed November 2, 2012.
|
|
10.36*
|
|
|
2014 Employment Agreement by and among BB&T Corporation, Branch Banking and Trust Company and Robert J. Johnson, Jr.
|
|
Incorporated herein by reference to Exhibit 10.5 of the Quarterly Report on Form 10-Q, filed April 30, 2014.
|
|
10.37*
|
|
|
2016 Employment Agreement by and among BB&T Corporation, Branch Banking and Trust Company and W. Bennett Bradley.
|
|
Incorporated herein by reference to Exhibit 10.38 of the Annual Report on Form 10-K, filed February 25, 2016.
|
|
10.38*
|
|
|
2016 Employment Agreement by and among BB&T Corporation, Branch Banking and Trust Company and David H. Weaver.
|
|
Incorporated herein by reference to Exhibit 10.38 of the Annual Report on Form 10-K, filed February 25, 2016.
|
|
10.39*
|
|
2016 Employment Agreement by and among BB&T Corporation, Branch Banking and Trust Company and Jimmy D. Godwin.
|
Incorporated herein by reference to Exhibit 10.1 of the Quarterly Report on Form 10-Q, filed October 24, 2016.
|
||
|
10.40*
|
|
2016 Employment Agreement by and among BB&T Corporation, Branch Banking and Trust Company and Brant J. Standridge.
|
Incorporated herein by reference to Exhibit 10.2 of the Quarterly Report on Form 10-Q, filed October 24, 2016.
|
||
144
|
Exhibit No.
|
|
Description
|
|
Location
|
|
|
10.41*
|
|
2016 Employment Agreement by and among BB&T Corporation, Branch Banking and Trust Company and Dontá L. Wilson.
|
Incorporated herein by reference to Exhibit 10.3 of the Quarterly Report on Form 10-Q, filed October 24, 2016.
|
||
|
11
|
|
|
Statement re computation of earnings per share.
|
|
Filed herewith as Note 19 to the consolidated financial statements.
|
|
12†
|
|
|
Statement re computation of ratios.
|
|
Filed herewith.
|
|
21†
|
|
|
Subsidiaries of the Registrant.
|
|
Filed herewith.
|
|
23†
|
|
|
Consent of Independent Registered Public Accounting Firm.
|
|
Filed herewith.
|
|
31.1
|
|
|
Certification of Chief Executive Officer pursuant to Rule 13a-14(a) or 15(d)-14(a) of the Exchange Act, as adopted pursuant to Section 302 of the Sarbanes-Oxley Act of 2002.
|
|
Filed herewith.
|
|
31.2
|
|
|
Certification of Chief Financial Officer pursuant to Rule 13a-14(a) or 15(d)-14(a) of the Exchange Act, as adopted pursuant to Section 302 of the Sarbanes-Oxley Act of 2002.
|
|
Filed herewith.
|
|
32
|
|
|
Certification of Chief Executive Officer and Chief Financial Officer pursuant to 18 U.S.C. Section 1350, as adopted pursuant to Section 906 of the Sarbanes-Oxley Act of 2002.
|
|
Filed herewith.
|
|
101.CAL
|
|
|
XBRL Taxonomy Extension Calculation Linkbase.
|
|
Filed herewith.
|
|
101.DEF
|
|
|
XBRL Taxonomy Definition Linkbase.
|
|
Filed herewith.
|
|
101.INS
|
|
|
XBRL Instance Document.
|
|
Filed herewith.
|
|
101.LAB
|
|
|
XBRL Taxonomy Extension Label Linkbase.
|
|
Filed herewith.
|
|
101.PRE
|
|
|
XBRL Taxonomy Extension Presentation Linkbase.
|
|
Filed herewith.
|
|
101.SCH
|
|
|
XBRL Taxonomy Extension Schema.
|
|
Filed herewith.
|
|
|
|
|
|
|
|
|
|
|
|
*
|
Management compensatory plan or arrangement.
|
||
|
†
|
Exhibit filed with the SEC and available upon request.
|
||
145
TABLE OF CONTENTS
Item 1. BusinessItem 1A. Risk FactorsItem 2. PropertiesItem 5. Market For Registrant S Common Equity, Related Stockholder Matters and Issuer Purchases Of Equity SecuritiesItem 6. Selected Financial DataItem 7. Management S Discussion and Analysis Of Financial Condition and Results Of OperationsItem 9A. Controls and ProceduresItem 8. Financial Statements and Supplementary DataNote 1. Summary Of Significant Accounting PoliciesNote 2. Acquisitions and DivestituresNote 3. SecuritiesNote 4. Loans and AclNote 5. Premises and EquipmentNote 6. Goodwill and Other Intangible AssetsNote 7. Loan ServicingNote 8. DepositsNote 9. Long-term DebtNote 10. Shareholders EquityNote 11. AociNote 12. Income TaxesNote 13. Benefit PlansNote 14. Commitments and ContingenciesNote 15. Regulatory Requirements and Other RestrictionsNote 16. Parent Company Financial StatementsNote 17. Fair Value DisclosuresNote 18. Derivative Financial InstrumentsNote 19. Computation Of EpsNote 20. Operating Segments