TRUIST FINANCIAL CORP
10-Ks and 10-Qs
|
|
|
|
|
|
|
|
|
|
|
|
|
|
|
|
|
|
|
|
|
|
|
|
|
|
|
|
|
|
|
|
|
|
|
|
|
|
|
|
|
|
|
|
|
|
|
|
|
|
|
|
|
|
|
|
UNITED STATES
SECURITIES AND EXCHANGE COMMISSION
Washington, D.C. 20549
____________________________________________________
FORM
10-K
____________________________________________________
OF THE SECURITIES EXCHANGE ACT OF 1934
For the fiscal year ended
December 31, 2019
Commission File Number:
1-10853
(Exact name of registrant as specified in its charter)
|
|
|
||||||||||
| (State or other jurisdiction of incorporation or organization) | (I.R.S. Employer Identification No.) | ||||||||||
|
|
|||||||||||
|
|
|
|
|||||||||
| (Address of principal executive offices) | (Zip Code) | ||||||||||
| Registrant's telephone number, including area code: |
|
|
|||||||||
______________________________
Securities registered pursuant to Section 12(b) of the Act:
| Title of each class | Trading Symbol | Name of each exchange on which registered | ||||||||||||
|
|
|
|
||||||||||||
|
|
|
|
||||||||||||
|
|
|
|
||||||||||||
|
|
|
|
||||||||||||
|
|
|
|
||||||||||||
|
|
|
|
||||||||||||
Securities registered pursuant to Section 12(g) of the Act: None
Indicate by check mark if the registrant is a well-known seasoned issuer, as defined in Rule 405 of the Securities Act. Yes
☐
No
☒
Indicate by check mark if the registrant is not required to file reports pursuant to Section 13 or Section 15(d) of the Act. Yes
☐
No
☒
Indicate by check mark whether the registrant (1) has filed all reports required to be filed by Section 13 or 15(d) of the Securities Exchange Act of 1934 during the preceding 12 months (or for such shorter period that the registrant was required to file such reports), and (2) has been subject to such filing requirements for the past 90 days.
Yes
☒
No
☐
Indicate by check mark whether the registrant has submitted electronically every Interactive Data File required to be submitted pursuant to Rule 405 of Regulation S-T (§232.405 of this chapter) during the preceding 12 months (or for such shorter period that the registrant was required to submit such files).
Yes
☒
No
☐
Indicate by check mark if disclosure of delinquent filers pursuant to Item 405 of Regulation S-K is not contained herein, and will not be contained, to the best of registrant's knowledge, in definitive proxy or information statements incorporated by references in Part III of this Form 10-K or any amendment to this Form 10-K.
☒
Indicate by check mark whether the Registrant is a large accelerated filer, an accelerated filer, a non-accelerated filer, smaller reporting company, or an emerging growth company. See the definitions of "large accelerated filer," "accelerated filer," "smaller reporting company" and "emerging growth company" in Rule 12b-2 of the Exchange Act.
|
|
☒ | Accelerated filer | ☐ | |||||||||||
| Non-accelerated filer | ☐ | Smaller reporting company |
|
|||||||||||
| Emerging growth company |
|
|||||||||||||
If an emerging growth company, indicate by check mark if the registrant has elected not to use the extended transition period for complying with any new or revised financial accounting standards provided pursuant to Section 13(a) of the Exchange Act.
☐
Indicate by check mark whether the registrant is a shell company (as defined in Rule 12b-2 of the Act). Yes
☐
No
☒
At January 31, 2020, the Company had
1,342,769,369
shares of its common stock, $5 par value, outstanding. As of June 28, 2019, the aggregate market value of voting stock held by nonaffiliates of the Company was approximately $
37.5
billion. Documents incorporated by reference: Portions of the definitive proxy statement relating to the registrant's 2020 annual meeting of stockholders are incorporated by reference in this Form 10-K in response to Items 10, 11, 12, 13 and 14 of Part III.
| TABLE OF CONTENTS | ||||||||
| TRUIST FINANCIAL CORPORATION | ||||||||
| FORM 10-K | ||||||||
| December 31, 2019 | ||||||||
| Page No. | ||||||||
| PART I | ||||||||
| Glossary of Defined Terms | ||||||||
| Forward-Looking Statements | ||||||||
| Item 1 | Business | |||||||
| Item 1A | Risk Factors | |||||||
| Item 1B | Unresolved Staff Comments (None to be reported) | |||||||
| Item 2 | Properties | |||||||
| Item 3 | Legal Proceedings (see Note 16) | |||||||
| Item 4 | Mine Safety Disclosures (Not applicable) | |||||||
| PART II | ||||||||
| Item 5 |
Market for Registrant's Common Equity, Related Stockholder Matters and Issuer Purchases of Equity Securities
|
|||||||
| Item 6 | Selected Financial Data | |||||||
| Item 7 | Management's Discussion and Analysis of Financial Condition and Results of Operations | |||||||
| Item 7A | Quantitative and Qualitative Disclosures About Market Risk (see Market Risk Management) | |||||||
| Item 8 | Financial Statements and Supplementary Data | |||||||
| Quarterly Financial Summary | ||||||||
| Report of Independent Registered Public Accounting Firm | ||||||||
| Consolidated Balance Sheets | ||||||||
| Consolidated Statements of Income | ||||||||
| Consolidated Statements of Comprehensive Income | ||||||||
| Consolidated Statements of Changes in Shareholders' Equity | ||||||||
| Consolidated Statements of Cash Flows | ||||||||
| Notes to Consolidated Financial Statements | ||||||||
| Note 1. Basis of Presentation | ||||||||
| Note 2. Business Combinations | ||||||||
| Note 3. Securities Financing Activities | ||||||||
| Note 4. Investment Securities | ||||||||
| Note 5. Loans and ACL | ||||||||
| Note 6. Premises and Equipment | ||||||||
| Note 7. Goodwill and Other Intangible Assets | ||||||||
| Note 8. Loan Servicing | ||||||||
| Note 9. Other Assets and Liabilities | ||||||||
| Note 10. Deposits | ||||||||
| Note 11. Borrowings | ||||||||
| Note 12. Shareholders' Equity | ||||||||
| Note 13. AOCI | ||||||||
| Note 14. Income Taxes | ||||||||
| Note 15. Benefit Plans | ||||||||
| Note 16. Commitments and Contingencies | ||||||||
| Note 17. Regulatory Requirements and Other Restrictions | ||||||||
| Note 18. Fair Value Disclosures | ||||||||
| Note 19. Derivative Financial Instruments | ||||||||
| Note 20. Computation of EPS | ||||||||
| Note 21. Operating Segments | ||||||||
| Note 22. Parent Company Financial Information | ||||||||
| Item 9 | Changes in and Disagreements with Accountants on Accounting and Financial Disclosure (None to be reported) | |||||||
| Item 9A | Controls and Procedures | |||||||
| Item 9B | Other Information (None to be reported) | |||||||
| PART III | ||||||||
| Item 10 | Directors, Executive Officers and Corporate Governance | * | ||||||
| Item 11 | Executive Compensation | * | ||||||
| Item 12 | Security Ownership of Certain Beneficial Owners and Management and Related Stockholder Matters | * | ||||||
| Item 13 | Certain Relationships and Related Transactions, and Director Independence | * | ||||||
| Item 14 | Principal Accounting Fees and Services | * | ||||||
| PART IV | ||||||||
| Item 15 | Exhibits, Financial Statement Schedules | |||||||
| Financial Statements (see Listing in Item 8 above) | ||||||||
| Exhibits | ||||||||
| Financial Statement Schedules (None required) | ||||||||
| Item 16 | Form 10-K Summary (None) | |||||||
| * |
For information regarding executive officers, refer to "Executive Officers" in Part I. The other information required by Item 10 is incorporated herein by reference to the information that appears under the headings "Nominees for Election as Directors for a One-Year Term Expiring in 2021," "Nominating and Governance Committee Director Nominations," "Ethics at Truist," and "Audit Committee" in the Registrant's Proxy Statement for the 2020 Annual Meeting of Shareholders.
The information required by Item 11 is incorporated herein by reference to the information that appears under the headings "Compensation Discussion and Analysis," "Compensation of Executive Officers," "Compensation and Human Capital Committee Report on Executive Compensation," "Compensation and Human Capital Committee Interlocks and Insider Participation" and "Compensation of Directors" in the Registrant's Proxy Statement for the 2020 Annual Meeting of Shareholders. For information regarding the registrant's securities authorized for issuance under equity compensation plans, refer to "Equity Compensation Plan Information" in Part II herein. The other information required by Item 12 is incorporated herein by reference to the information that appears under the heading "Stock Ownership Information" in the Registrant's Proxy Statement for the 2020 Annual Meeting of Shareholders. The information required by Item 13 is incorporated herein by reference to the information that appears under the headings "Director Independence" and "Related Person Transactions" in the Registrant's Proxy Statement for the 2020 Annual Meeting of Shareholders. The information required by Item 14 is incorporated herein by reference to the information that appears under the headings "Fees to Independent Registered Public Accounting Firm" and "Audit Committee Pre-Approval Policy" in the Registrant's Proxy Statement for the 2020 Annual Meeting of Shareholders. |
|||||||
Glossary of Defined Terms
The following terms may be used throughout this report, including the consolidated financial statements and related notes.
| Term | Definition | ||||
|
ACL
|
Allowance for credit losses
|
||||
|
AFS
|
Available-for-sale
|
||||
|
Agency MBS
|
Mortgage-backed securities issued by a U.S. government agency or GSE
|
||||
|
ALLL
|
Allowance for loan and lease losses
|
||||
| ALM | Asset/Liability management | ||||
|
ARRC
|
Alternative Reference Rates Committee of the FRB and the Federal Reserve Bank of New York
|
||||
|
AOCI
|
Accumulated other comprehensive income (loss)
|
||||
| Basel III Rules | Rules issued by the FRB, OCC and FDIC on capital adequacy and liquidity requirements in the U.S for banking organizations. | ||||
|
BB&T
|
BB&T Corporation and subsidiaries (changed to "Truist Financial Corporation" effective with the Merger)
|
||||
|
BCBS
|
Basel Committee on Banking Supervision
|
||||
|
BHC
|
Bank holding company
|
||||
|
BHCA
|
Bank Holding Company Act of 1956, as amended
|
||||
|
Branch Bank
|
Branch Banking and Trust Company (changed to "Truist Bank" effective with the Merger)
|
||||
|
BSA/AML
|
Bank Secrecy Act/Anti-Money Laundering
|
||||
| Board | Truist's Board of Directors | ||||
|
BU
|
Business Unit
|
||||
|
C&CB
|
Corporate and Commercial Banking, an operating segment
|
||||
|
CB&W
|
Consumer Banking and Wealth, an operating segment
|
||||
|
CCAR
|
Comprehensive Capital Analysis and Review
|
||||
|
CD
|
Certificate of deposit
|
||||
|
CDI
|
Core deposit intangible | ||||
| CECL | Current expected credit loss model | ||||
|
CEO
|
Chief Executive Officer
|
||||
| CFTC | Commodity Futures Trading Commission | ||||
|
CFO
|
Chief Financial Officer
|
||||
|
CET1
|
Common equity tier 1
|
||||
| CIB | Corporate and Investment Banking | ||||
|
CFPB
|
Consumer Financial Protection Bureau
|
||||
|
CMO
|
Collateralized mortgage obligation
|
||||
|
Company
|
Truist Financial Corporation and its subsidiaries (interchangeable with "Truist" below), formerly BB&T Corporation
|
||||
|
CRA
|
Community Reinvestment Act of 1977
|
||||
|
CRE
|
Commercial real estate
|
||||
|
CRO
|
Chief Risk Officer
|
||||
| DC | Disclosure Committee | ||||
|
DIF
|
Deposit Insurance Fund administered by the FDIC
|
||||
|
Dodd-Frank Act
|
Dodd-Frank Wall Street Reform and Consumer Protection Act
|
||||
| DTA | Deferred tax asset | ||||
| DTL | Deferred tax liability | ||||
| EBPCC | Ethics, Business Practices, and Conduct Committee | ||||
| ECRPMC | Enterprise Credit Risk and Portfolio Management Committee | ||||
|
EGRRCPA
|
Economic Growth, Regulatory Relief, and Consumer Protection Act
|
||||
| ERC | Enterprise Risk Committee | ||||
| ERISA | Employee Retirement Income Security Act of 1974 | ||||
|
EPS
|
Earnings per common share
|
||||
|
EVE
|
Economic value of equity
|
||||
|
Exchange Act
|
Securities Exchange Act of 1934, as amended
|
||||
|
FASB
|
Financial Accounting Standards Board
|
||||
|
FDIC
|
Federal Deposit Insurance Corporation
|
||||
|
FHA
|
Federal Housing Administration
|
||||
|
FHC
|
Financial holding company
|
||||
|
FHLB
|
Federal Home Loan Bank
|
||||
|
FHLMC
|
Federal Home Loan Mortgage Corporation
|
||||
|
FINRA
|
Financial Industry Regulatory Authority
|
||||
|
FNMA
|
Federal National Mortgage Association
|
||||
Truist Financial Corporation 1
| Term | Definition | ||||
|
FRB
|
Board of Governors of the Federal Reserve System
|
||||
|
FTP
|
Funds transfer pricing
|
||||
|
GAAP
|
Accounting principles generally accepted in the United States of America
|
||||
| GLBA | Gramm-Leach-Bliley Act | ||||
|
GNMA
|
Government National Mortgage Association
|
||||
|
Grandbridge
|
Grandbridge Real Estate Capital, LLC
|
||||
|
GSE
|
U.S. government-sponsored enterprise
|
||||
|
HFI
|
Held for investment
|
||||
|
HMDA
|
Home Mortgage Disclosure Act
|
||||
|
HQLA
|
High-quality liquid assets
|
||||
| HRA | Health Reimbursement Account | ||||
|
HTM
|
Held-to-maturity
|
||||
|
IDI
|
Insured depository institution
|
||||
|
IH
|
Insurance Holdings, an operating segment
|
||||
|
IPV
|
Independent price verification
|
||||
|
IRC
|
Internal Revenue Code
|
||||
|
IRS
|
Internal Revenue Service
|
||||
|
ISDA
|
International Swaps and Derivatives Association, Inc.
|
||||
|
LCR
|
Liquidity Coverage Ratio
|
||||
|
LHFS
|
Loans held for sale
|
||||
|
LIBOR
|
London Interbank Offered Rate
|
||||
| LOCOM | Lower of cost or market | ||||
| Market Risk Rule |
Market risk capital requirements issued jointly by the OCC, U.S. Treasury, FRB, and FDIC
|
||||
|
MBS
|
Mortgage-backed securities
|
||||
| MD&A | Management's Discussion and Analysis of Financial Condition and Results of Operations | ||||
| Merger | Merger of BB&T and SunTrust effective December 6, 2019 | ||||
|
MRLCC
|
Market Risk, Liquidity and Capital Committee
|
||||
|
MRM
|
Model Risk Management
|
||||
|
MSR
|
Mortgage servicing right
|
||||
|
MSRB
|
Municipal Securities Rulemaking Board
|
||||
|
N/A
|
Not applicable | ||||
|
NCCOB
|
North Carolina Office of the Commissioner of Banks
|
||||
| NCF&P | National Consumer Finance and Payments | ||||
|
NIM
|
Net interest margin, computed on a TE basis
|
||||
|
NM
|
Not meaningful
|
||||
| NOL | Net operating loss | ||||
|
NPA
|
Nonperforming asset
|
||||
|
NPL
|
Nonperforming loan
|
||||
|
NSFR
|
Net stable funding ratio
|
||||
|
NYSE
|
New York Stock Exchange
|
||||
|
OAS
|
Option adjusted spread
|
||||
| OCC | Office of the Comptroller of the Currency | ||||
|
OCI
|
Other comprehensive income (loss)
|
||||
|
OFAC
|
U.S. Department of the Treasury's Office of Foreign Assets Control
|
||||
|
OPEB
|
Other post-employment benefit
|
||||
|
OREO
|
Other real estate owned
|
||||
|
OT&C
|
Other, Treasury and Corporate
|
||||
| OTC | Over-the-counter | ||||
|
OTTI
|
Other-than-temporary impairment
|
||||
|
Parent Company
|
Truist Financial Corporation, the parent company of Truist Bank and other subsidiaries
|
||||
|
Patriot Act
|
Uniting and Strengthening America by Providing Appropriate Tools Required to Intercept and Obstruct Terrorism Act of 2001
|
||||
|
PCI
|
Purchased credit impaired loans
|
||||
|
Peer Group
|
Financial holding companies included in the industry peer group index
|
||||
|
PSU
|
Performance share units | ||||
|
Re-REMICs
|
Re-securitizations of Real Estate Mortgage Investment Conduits
|
||||
|
Regions Insurance
|
Regions Insurance Group, acquired effective July 2, 2018 | ||||
|
RMO
|
Risk Risk Management Organization
|
||||
2 Truist Financial Corporation
| Term | Definition | ||||
|
ROU assets
|
Right-of-use assets
|
||||
| RSA | Restricted Stock Award | ||||
|
RSU
|
Restricted stock unit
|
||||
|
RUFC
|
Reserve for unfunded lending commitments
|
||||
|
S&P
|
Standard & Poor's
|
||||
|
SBIC
|
Small Business Investment Company
|
||||
|
SEC
|
Securities and Exchange Commission
|
||||
|
Short-Term Borrowings
|
Federal funds purchased, securities sold under repurchase agreements and other short-term borrowed funds with original maturities of less than one year
|
||||
| SOFR |
Secured Overnight Financing Rate
|
||||
| SunTrust |
SunTrust Banks, Inc.
|
||||
| Tailoring Rules |
The final rules changing the applicability thresholds for regulatory capital and liquidity requirements, issued by the OCC, FRB, and FDIC, together with the final rules changing the applicability thresholds for enhanced prudential standards issues by the FRB
|
||||
|
TBA
|
To be announced
|
||||
|
TDR
|
Troubled debt restructuring
|
||||
|
TE
|
Taxable-equivalent
|
||||
| TMC | Technology Management Committee | ||||
| TRS | Total Return Swap | ||||
|
Truist
|
Truist Financial Corporation and its subsidiaries (interchangeable with the "Company" above), formerly BB&T Corporation
|
||||
| Truist Bank | Truist Bank, formerly Branch Banking and Trust company | ||||
|
U.S.
|
United States of America
|
||||
|
U.S. Treasury
|
United States Department of the Treasury
|
||||
|
UPB
|
Unpaid principal balance
|
||||
| UTB | Unrecognized tax benefit | ||||
|
VaR
|
Value-at-risk
|
||||
| VEBA | Voluntary Employees' Beneficiary Association | ||||
| VIE |
Variable interest entity
|
||||
Truist Financial Corporation 3
Forward-Looking Statements
This Annual Report on Form 10-K contains "forward-looking statements" within the meaning of the Private Securities Litigation Reform Act of 1995, regarding the financial condition, results of operations, business plans and the future performance of Truist. Words such as "anticipates," "believes," "estimates," "expects," "forecasts," "intends," "plans," "projects," "may," "will," "should," “would," "could" and other similar expressions are intended to identify these forward-looking statements.
Forward-looking statements are not based on historical facts but instead represent management's expectations and assumptions regarding Truist's business, the economy and other future conditions. Such statements involve inherent uncertainties, risks and changes in circumstances that are difficult to predict. As such, Truist’s actual results may differ materially from those contemplated by forward-looking statements. While there can be no assurance that any list of risks and uncertainties or risk factors is complete, important factors that could cause actual results to differ materially from those contemplated by forward-looking statements include the following, without limitation, as well as the risks and uncertainties more fully discussed under Item 1A-Risk Factors:
|
•
|
risks and uncertainties relating to the Merger, including the ability to successfully integrate the companies or to realize the anticipated benefits of the Merger; | ||||
|
•
|
expenses relating to the Merger and integration of heritage BB&T and heritage SunTrust; | ||||
|
•
|
deposit attrition, client loss or revenue loss following completed mergers or acquisitions may be greater than anticipated; | ||||
|
•
|
changes in the interest rate environment, including the replacement of LIBOR as an interest rate benchmark, which could adversely affect Truist’s revenue and expenses, the value of assets and obligations, and the availability and cost of capital, cash flows, and liquidity; | ||||
|
•
|
volatility in mortgage production and servicing revenues, and changes in carrying values of Truist’s servicing assets and mortgages held for sale due to changes in interest rates; | ||||
|
•
|
management’s ability to effectively manage credit risk; | ||||
|
•
|
inability to access short-term funding or liquidity; | ||||
|
•
|
loss of client deposits, which could increase Truist’s funding costs; | ||||
|
•
|
changes in Truist’s credit ratings, which could increase the cost of funding or limit access to capital markets; | ||||
|
•
|
additional capital and liquidity requirements that will result from the Merger; | ||||
|
•
|
regulatory matters, litigation or other legal actions, which may result in, among other things, costs, fines, penalties, restrictions on Truist’s business activities, reputational harm, or other adverse consequences; | ||||
|
•
|
risks related to originating and selling mortgages, including repurchase and indemnity demands from purchasers related to representations and warranties on loans sold, which could result in an increase in the amount of losses for loan repurchases; | ||||
|
•
|
failure to execute on strategic or operational plans, including the ability to successfully complete and/or integrate mergers and acquisitions; | ||||
|
•
|
risks relating to Truist’s role as a servicer of loans, including an increase in the scope or costs of the services Truist is required to perform without any corresponding increase in Truist’s servicing fee, or a breach of Truist’s obligations as servicer; | ||||
|
•
|
negative public opinion, which could damage Truist’s reputation; | ||||
|
•
|
increased scrutiny regarding Truist’s consumer sales practices, training practices, incentive compensation design and governance; | ||||
|
•
|
competition from new or existing competitors, including increased competition from products and services offered by non-bank financial technology companies, may reduce Truist’s client base, cause Truist to lower prices for its products and services in order to maintain market share or otherwise adversely impact Truist’s businesses or results of operations; | ||||
|
•
|
Truist’s ability to introduce new products and services in response to industry trends or developments in technology that achieve market acceptance and regulatory approval; | ||||
|
•
|
Truist’s success depends on the expertise of key personnel, and if these individuals leave or change their roles without effective replacements Truist's operations and integration activities could be adversely impacted. This could be exacerbated as Truist continues to integrate the management teams of heritage BB&T and heritage SunTrust, or if the organization is unable to hire and retain qualified personnel; | ||||
|
•
|
legislative, regulatory or accounting changes may adversely affect the businesses in which Truist is engaged; | ||||
|
•
|
evolving regulatory standards, including with respect to capital and liquidity requirements, and results of regulatory examinations, may adversely affect Truist's financial condition and results of operations; | ||||
|
•
|
accounting policies and processes require management to make estimates about matters that are uncertain; | ||||
|
•
|
general economic or business conditions, either nationally or regionally, may be less favorable than expected, resulting in, among other things, slower deposit or asset growth, a deterioration in credit quality or a reduced demand for credit, insurance or other services; | ||||
|
•
|
risk management measures and management oversight functions may not identify or address risks adequately; | ||||
|
•
|
unfavorable resolution of legal proceedings or other claims or regulatory or other governmental investigations or inquiries could result in negative publicity, protests, fines, penalties, restrictions on Truist's operations or ability to expand its business or other negative consequences, all of which could cause reputational damage and adversely impact Truist's financial condition and results of operations; | ||||
|
•
|
competitors of Truist may have greater financial resources or develop products that enable them to compete more successfully than Truist and may be subject to different regulatory standards than Truist; | ||||
|
•
|
failure to maintain or enhance Truist’s competitive position with respect to technology, whether it fails to anticipate client expectations or because its technological developments fail to perform as desired or are not rolled out in a timely manner or for other reasons, may cause Truist to lose market share or incur additional expense; | ||||
|
•
|
fraud or misconduct by internal or external parties, which Truist may not be able to prevent, detect or mitigate; | ||||
|
•
|
operational or communications systems, including systems used by vendors or other external parties, may fail or may be the subject of a breach or cyber-attack that, if successful, could adversely impact Truist's financial condition and results of operations; | ||||
|
•
|
security risks, including denial of service attacks, hacking, social engineering attacks targeting Truist’s employees and clients, malware intrusion or data corruption attempts, and identity theft could result in the disclosure of confidential information, adversely affect Truist’s business or reputation or create significant legal or financial exposure; | ||||
|
•
|
natural or other disasters, including acts of terrorism and pandemics, could have an adverse effect on Truist, including a material disruption of Truist's operations or the ability or willingness of clients to access Truist's products and services; | ||||
|
•
|
widespread system outages, caused by the failure of critical internal systems or critical services provided by third parties could adversely impact Truist's financial condition and results of operations; and | ||||
|
•
|
depressed market values for Truist’s stock and adverse economic conditions sustained over a period of time may require a write down to goodwill. | ||||
4 Truist Financial Corporation
ITEM 1. BUSINESS
Truist is a banking organization headquartered in Charlotte, North Carolina. Truist conducts its business operations primarily through its bank subsidiary, Truist Bank, and other nonbank subsidiaries.
Merger with SunTrust
Effective December 6, 2019, the Company completed its previously announced Merger with SunTrust pursuant to an Agreement and Plan of Merger dated as of February 7, 2019 and amended as of June 14, 2019.
SunTrust offered a full line of financial services for consumers, businesses, corporations, institutions, and not-for-profit entities, both through branches (located primarily in Florida, Georgia, Virginia, North Carolina, Tennessee, Maryland, South Carolina, and the District of Columbia) and through other digital and national delivery channels. Additionally, SunTrust offered deposit, credit, mortgage banking, and trust and investment services to its clients through a selection of full, self and assisted-service channels. Other subsidiaries of SunTrust provided capital markets, securities brokerage, investment banking and wealth management services. SunTrust had 1,164 banking offices as of the Merger date. Refer to "Note 2. Business Combinations" for additional details related to the Merger.
Operating Subsidiaries
Truist Bank, Truist's largest subsidiary, was chartered in 1872 and is the oldest bank headquartered in North Carolina. Truist Bank provides a wide range of banking and trust services for consumer and commercial clients in its geographic markets, including small and mid-size businesses, corporations, public agencies, local governments and individuals, through 2,958 offices (as of December 31, 2019) and its digital platform.
Services
Truist's subsidiaries offer a variety of services to consumer and commercial clients. Truist's objective is to offer clients a full array of products to meet all of their financial needs.
| Table 1: Services | |||||||||||
| Consumer Services: | Commercial Services: | ||||||||||
| Asset management | Asset based lending | ||||||||||
| Automobile lending | Asset management | ||||||||||
| Bankcard lending | Association services | ||||||||||
| Consumer finance | Capital markets services | ||||||||||
| Home equity lending | Commercial deposit and treasury services | ||||||||||
| Home mortgage lending | Commercial finance | ||||||||||
| Insurance | Commercial middle market lending | ||||||||||
| Investment brokerage services | Commercial mortgage lending | ||||||||||
| Mobile/online banking | Corporate banking | ||||||||||
| Payment solutions | Floor plan lending | ||||||||||
| Private equity investments | Governmental finance | ||||||||||
| Retail deposit services | Institutional trust services | ||||||||||
| Small business lending | Insurance | ||||||||||
| Student lending | Insurance premium finance | ||||||||||
| Wealth management/private banking | International banking services | ||||||||||
| Investment banking services | |||||||||||
| Leasing | |||||||||||
| Merchant services | |||||||||||
| Mortgage warehouse lending | |||||||||||
| Treasury and payment solutions | |||||||||||
| Private equity investments | |||||||||||
| Real estate lending | |||||||||||
| Supply chain financing | |||||||||||
Truist Financial Corporation 5
Market Area
The following table reflects Truist's deposit market share and branch locations by state:
| Table 2: Deposit Market Share and Branch Locations by State | ||||||||||||||||||||
| % of Deposits (2) | Deposit Market Share Rank (2) | Number of Branches (3) | ||||||||||||||||||
| Georgia | 21 | % | 1st | 339 | ||||||||||||||||
| North Carolina (1) | 13 | 1st | 402 | |||||||||||||||||
| West Virginia | 2 | 1st | 54 | |||||||||||||||||
| Virginia | 14 | 2nd | 444 | |||||||||||||||||
| Maryland | 7 | 2nd | 241 | |||||||||||||||||
| South Carolina | 4 | 3rd | 129 | |||||||||||||||||
| Florida | 22 | 3rd | 672 | |||||||||||||||||
| Tennessee | 5 | 3rd | 148 | |||||||||||||||||
| Washington, D.C. | 2 | 5th | 32 | |||||||||||||||||
| Kentucky | 2 | 4th | 81 | |||||||||||||||||
| Alabama | 1 | 6th | 70 | |||||||||||||||||
| Pennsylvania | 4 | 9th | 203 | |||||||||||||||||
| Texas | 2 | 15th | 108 | |||||||||||||||||
| New Jersey | 1 | 19th | 26 | |||||||||||||||||
| Other states | NA | NA | 9 | |||||||||||||||||
(1) Excludes home office deposits.
(2) Source: FDIC.gov data as of June 30, 2019. Percentiles and rankings reflect combined data for SunTrust Bank and Branch Bank.
(3) As of December 31, 2019.
Truist operates in markets covering numerous industries. Management believes that Truist's community bank approach to providing client service is a competitive advantage that strengthens the Company's ability to effectively provide financial products and services to businesses and individuals in its markets. In addition, management has made significant investments in recent years to develop its digital platform and believes that its mobile and online applications are competitive in meeting clients' expectations. Furthermore, Truist believes its current market area will support growth in assets and deposits in the future.
Competition
The financial services industry is highly competitive and constantly evolving. Legislative, regulatory, economic, and technological changes as well as continued consolidation within the industry could result in additional competition from new and existing market participants. Truist's subsidiaries compete actively with national, regional and local financial services providers, including banks, thrifts, securities dealers, mortgage bankers, finance companies, financial technology companies and insurance companies. The ability of non-banking entities, including financial technology companies, to provide services previously limited to commercial banks has intensified competition. Non-banking entities are not subject to many of the same regulatory supervision and restrictions as banks and BHCs, and therefore, can often operate with greater flexibility and with lower cost and capital structures. In addition, the ability to access and use technology is an increasingly significant competitive factor in the financial services industry. Having the right technology is a critically important component to client satisfaction because it affects our ability to deliver the products and services that clients desire in a manner that they find convenient and attractive. Management believes that the Company is well positioned to compete and that its continued focus on touch and technology will engender trust among its current and future clients. For additional information concerning markets, Truist's competitive position and business strategies, see "Market Area" above and "General Business Development" in the discussion that follows.
General Business Development
Truist seeks to satisfy all of its clients' needs, enabling the Company to grow and diversify its sources of revenue and profitability. Truist's long-term strategy encompasses both organic growth and mergers or acquisitions of complimentary banks and financial institutions.
Merger and Acquisition Strategy
Truist's merger and acquisition strategy focuses on meeting the following criteria:
•
the organization must be a good fit with Truist's culture;
•
the merger or acquisition must be strategically attractive;
•
any risks must be identified and mitigation plans put in place to ensure any residual risks fall within Truist's risk appetite; and
•
the transaction must meet Truist's financial criteria.
6 Truist Financial Corporation
Truist's growth in business, profitability and market share has historically been enhanced by strategic mergers and acquisitions. Truist will assess future opportunities, primarily within or contiguous to Truist's existing footprint, based on market conditions and may, among other possibilities, pursue economically advantageous acquisitions of insurance agencies, certain lending businesses and fee income generating financial services businesses.
Regulatory Considerations
The regulatory framework applicable to banking organizations is intended primarily for the protection of depositors and the stability of the U.S. financial system, rather than for the protection of shareholders and creditors. In addition to banking laws and regulations, Truist is subject to various other laws and regulations, all of which directly or indirectly affect the operations and management of Truist and its ability to make distributions to shareholders. Truist and its subsidiaries are also subject to supervision and examination by multiple regulators.
Banking and other financial services statutes, regulations and policies are continually under review by Congress, state legislatures and federal and state regulatory agencies. In addition to laws and regulations, state and federal bank regulatory agencies may issue policy statements, interpretive letters and similar written guidance applicable to Truist and its subsidiaries. Any change in the statutes, regulations or regulatory policies applicable to Truist, including changes in their interpretation or implementation, could have a material effect on its business or organization.
Both the scope of the laws and regulations and the intensity of the supervision to which Truist is subject have increased in recent years, initially in response to the financial crisis, and more recently in light of other factors such as technological and market changes. Regulatory enforcement and fines have also increased across the banking and financial services sector. While the regulatory environment has entered a period of rebalancing of the post financial crisis framework, Truist expects that its business will remain subject to extensive regulation and supervision.
The descriptions below summarize certain significant state and federal laws to which Truist is subject. The descriptions are qualified in their entirety by reference to the particular statutory or regulatory provisions summarized. They do not summarize all possible or proposed changes in current laws or regulations and are not intended to be a substitute for the related statues or regulatory provisions.
General
As a BHC, Truist is subject to regulation under the BHCA and regulation, examination and supervision by the FRB. Truist Bank, a North Carolina state-chartered commercial bank that is not a member of the Federal Reserve System, is subject to regulation, supervision and examination by the NCCOB, the FDIC and the CFPB.
Examinations by Truist’s regulators consider not only compliance with applicable laws, regulations and supervisory policies of the agency, but also capital levels, asset quality, risk management effectiveness, the ability and performance of management and the board of directors, the effectiveness of internal controls, earnings, liquidity and various other factors.
The results of examination activity by any of Truist’s federal bank regulators potentially can result in the imposition of significant limitations on Truist’s activities and growth. These regulatory agencies generally have broad discretion to impose restrictions and limitations on the operations of a regulated entity and take enforcement action, including the imposition of substantial monetary penalties and nonmonetary requirements, against a regulated entity where the relevant agency determines, among other things, that the operations of the regulated entity or any of its subsidiaries fail to comply with applicable law or regulations, are conducted in an unsafe or unsound manner, or represent an unfair or deceptive act or practice. This supervisory framework, including the examination reports and supervisory ratings (which are not publicly available) of the agencies, could materially impact the conduct, growth and profitability of Truist’s operations.
In November 2018, the FRB finalized a new confidential rating system that applies to all BHCs with total consolidated assets of $100 billion or more, including Truist. Under this rating system, component ratings are assigned for capital planning and positions, liquidity risk management and positions, and governance and controls; a standalone composite rating will not be assigned. To be considered "well managed" under this rating system, a firm must be rated "broadly meets expectations" or "conditionally meets expectations" for each of its three component ratings.
Truist Bank is subject to state and federal laws, as well as various compliance regulations that govern its activities, the investments it makes, and the aggregate amount of loans that may be granted to one borrower.
Truist and certain of its subsidiaries and affiliates, including those that engage in derivatives transactions, securities underwriting, market making, brokerage, investment advisory and insurance activities, are subject to other federal and state laws and regulations as well as supervision and examination by other federal and state regulatory agencies and other regulatory authorities, including the SEC, CFTC, FINRA and the NYSE.
Truist Financial Corporation 7
FHC Regulation
Truist has elected to be treated as a FHC, which allows it to engage in a broader range of activities than would otherwise be permissible for a BHC, including activities that are financial in nature or incidental thereto, such as securities underwriting, insurance and merchant banking. In order to maintain its status as a FHC, Truist and all of its affiliated IDIs must be well-capitalized and well-managed and Truist Bank must have at least a satisfactory CRA rating. If the FRB determines that a FHC is not well-capitalized or well-managed, the FRB may impose corrective capital and managerial requirements on the FHC, and may place limitations on its ability to conduct all of the business activities that FHCs are generally permitted to conduct and its ability to make certain acquisitions. If the failure to meet these standards persists, a FHC may be required to divest its IDI subsidiaries, or cease all activities other than those activities that may be conducted by BHCs that are not FHCs. Furthermore, if an IDI subsidiary of a FHC has not maintained a satisfactory CRA rating, the FHC would not be able to commence any new financial activities or acquire a company that engages in such activities, although the FHC would still be allowed to engage in activities closely related to banking and make investments in the ordinary course of conducting banking activities.
Enhanced Prudential Standards and Regulatory Tailoring Rules
Certain U.S. BHCs are subject to enhanced prudential standards and early remediation requirements. As a result, Truist is subject to more stringent standards, including liquidity and capital requirements, leverage limits, stress testing, resolution planning, and risk management standards, than those applicable to smaller institutions. Certain larger banking organizations are subject to additional enhanced prudential standards.
For example, on June 14, 2018, the FRB finalized rules that establish single-counterparty credit limits for banking organizations with greater than $250 billion in total consolidated assets. Truist will be subject to these rules over a phase-in period and will be subject to a limit of 25% of Tier 1 capital for aggregate net credit exposures to any other unaffiliated counterparty.
In October 2019, the federal bank regulatory agencies finalized the Tailoring Rules, which adjust the thresholds at which certain regulatory requirements apply to large U.S. banking organizations based on size, complexity and other risk-based factors. Specifically, these rules establish four risk-based categories for determining applicability of enhanced prudential standards, capital and liquidity requirements for large U.S. banking organizations. These rules became effective December 31, 2019. Under these rules, Truist meets the criteria to be categorized as a Category III banking organization, which generally includes bank holding companies with greater than $250 billion, but less than $700 billion, in total consolidated assets, and less than $75 billion in certain risk-related exposures.
Resolution Planning
Truist and Truist Bank are required by statute and regulation to file, maintain and update plans for a rapid and orderly resolution in the event of material financial distress or failure. The FRB and the FDIC must review and evaluate Truist's resolution plan. The FRB and FDIC are authorized to impose restrictions on growth and activities or operations if the agencies determine that a resolution plan is not credible or would not facilitate a rapid and orderly resolution of the company under the U.S. Bankruptcy Code, and could require the banking organization to divest assets or take other actions if it did not submit an acceptable resolution plan within two years after any such restrictions were imposed.
In addition, Truist Bank is required by an FDIC regulation to file a separate bank level resolution plan. In April 2019, the FDIC issued an advanced notice of proposed rulemaking that would modify the content and frequency of resolution planning requirements for systemically important insured depository institutions. While this proposal did not include specific details regarding the content or frequency of future bank level resolution planning requirements, the FDIC indicated that the revised approach would establish tiered resolution planning requirements based on the size, complexity and other factors of applicable insured depository institutions. The FDIC Chairman has delayed the next round of submissions of resolution plans for IDIs until this rulemaking process has been completed; as a result, Truist Bank does not currently have an anticipated submission date for a resolution plan.
In October 2019, the FRB and FDIC finalized a joint rule that modifies certain resolution planning requirements for large BHCs. As a Category III banking organization, Truist will be required to submit a resolution plan every three years, with the first resolution plan under the new rule to be submitted by July 1, 2021. Later resolution plans under this rule will alternate between full resolution plans and targeted resolution plans.
8 Truist Financial Corporation
Capital Planning and Stress Testing Requirements
Truist must submit an annual capital plan to the FRB that reflects its projected financial performance under baseline and stressful macroeconomic conditions, and Truist must obtain non-objection from the FRB for capital distributions proposed in its capital plan in connection with the FRB’s annual CCAR process. Truist generally may pay dividends and interest on capital securities and repurchase or retire capital securities only in accordance with a capital plan that has been reviewed by the FRB and that has received a non-objection from the FRB.
The FRB’s CCAR framework and the Dodd-Frank Act stress testing framework require large BHCs such as Truist to conduct company-run stress tests and subject them to supervisory stress tests conducted by the FRB. Among other things, the company-run stress tests employ stress scenarios provided by the FRB and incorporate the Dodd-Frank Act capital actions, which are intended to normalize capital distributions across large U.S. BHCs. In addition, Truist is required to conduct annual stress tests using internally-developed scenarios. The FRB also conducts CCAR and Dodd-Frank Act supervisory stress tests employing stress scenarios and internal supervisory models. The results of these stress tests are used to inform the FRB’s objection or non-objection to those BHC's capital plans. As a Category III banking organization, Truist will be subject to supervisory stress testing on an annual basis and company-run stress testing on a biennial basis.
The FRB announced that BHCs that have adopted the CECL accounting standard in 2020 will be required to incorporate CECL into company-run stress tests starting in the 2020 cycle.
Truist is required to submit its next capital plan and the results of its own stress tests to the FRB by April 6, 2020. The FRB will announce the results of its supervisory stress tests by June 30, 2020. The capital plan period starts July 1 of the following calendar year.
In addition to stress testing for Truist, the FDIC requires Truist Bank to conduct annual company-run stress tests.
In April 2018, the FRB issued a proposal to integrate the annual capital planning and stress testing requirements with certain ongoing regulatory capital requirements for large BHCs. See the “Proposed Stress Buffer Requirements” section for additional discussion of this proposal.
Payment of Dividends
The Parent Company is a legal entity separate and distinct from its subsidiaries, and it depends in part upon dividends received from its direct and indirect subsidiaries, including Truist Bank, to fund its activities, including its ability to make capital distributions, such as paying dividends or repurchasing shares. Under federal law, there are various limitations on the extent to which Truist Bank can declare and pay dividends to the Parent Company, including those related to regulatory capital requirements, general regulatory oversight to prevent unsafe or unsound practices, and federal banking law requirements concerning the payment of dividends out of net profits, surplus, and available earnings. Certain contractual restrictions also may limit the ability of Truist Bank to pay dividends to the Parent Company. No assurances can be given that Truist Bank will, in any circumstances, pay dividends to the Parent Company.
The Parent Company’s ability to declare and pay dividends is similarly limited by federal banking law and FRB regulations and policy. The FRB has authority to prohibit BHCs from making capital distributions if they would be deemed to be an unsafe or unsound practice. The FRB has indicated generally that it may be an unsafe or unsound practice for BHCs to pay dividends unless a BHC’s net income is sufficient to fund the dividends and the expected rate of earnings retention is consistent with the organization’s capital needs, asset quality and overall financial condition. In addition, the Parent Company’s ability to make capital distributions, including paying dividends and repurchasing capital securities, is subject to the FRB’s non-objection to Truist’s capital plan as part of the FRB’s CCAR process discussed above in the “Capital Planning and Stress Testing Requirements” section.
North Carolina law provides that, as long as a bank does not make distributions that reduce its capital below its applicable required capital, the board of directors of a bank chartered under the laws of North Carolina may declare such distributions as the directors deem proper.
U.S. Basel III Capital Rules
Truist and Truist Bank are subject to certain risk-based capital and leverage ratio requirements under the Basel III Rules adopted by the FRB, for Truist, and by the FDIC, for Truist Bank. These quantitative calculations are minimums, and the FRB and FDIC may determine that a banking organization, based on its size, complexity, or risk profile, must maintain a higher level of capital in order to operate in a safe and sound manner. Failure to be well capitalized or to meet minimum capital requirements could result in certain mandatory and possible additional discretionary actions by regulators that, if undertaken, could have an adverse material effect on Truist’s operations or financial condition. Failure to be well capitalized or to meet minimum capital requirements could also result in restrictions on Truist’s or Truist Bank’s ability to pay dividends or otherwise distribute capital or to receive regulatory approval of applications.
Truist Financial Corporation 9
Under the Basel III Rules, Truist’s and Truist Bank’s assets, exposures, and certain off-balance sheet items are subject to risk weights used to determine the institutions’ risk-weighted assets. These risk-weighted assets are used to calculate the following minimum capital ratios for Truist and Truist Bank:
•
CET1 Risk-Based Capital Ratio, equal to the ratio of CET1 capital to risk-weighted assets. CET1 capital primarily includes common shareholders' equity subject to certain regulatory adjustments and deductions, including with respect to goodwill, intangible assets, certain deferred tax assets, and AOCI.
•
Tier 1 Risk-Based Capital Ratio, equal to the ratio of Tier 1 capital to risk-weighted assets. Tier 1 capital is primarily comprised of CET1 capital, perpetual preferred stock and certain qualifying capital instruments.
•
Total Risk-Based Capital Ratio, equal to the ratio of total capital, including CET1 capital, Tier 1 capital, and Tier 2 capital, to risk-weighted assets. Tier 2 capital primarily includes qualifying subordinated debt and qualifying ALLL. Tier 2 capital also includes, among other things, certain trust preferred securities.
In July 2019, the FDIC, the FRB and the OCC issued final rules that simplify the capital treatment of mortgage servicing assets, deferred tax assets arising from temporary differences that an institution could not realize through net operating loss carrybacks, and investments in the capital of unconsolidated financial institutions, as well as simplify the recognition and calculation of minority interests that are includable in regulatory capital, for non-advanced approaches banking organizations, including Truist and Truist Bank. Banking organizations may adopt these changes beginning on January 1, 2020, and must adopt these changes as of April 1, 2020. Truist has elected to implement these changes as of January 1, 2020 and anticipates an approximate 10 basis point reduction in CET1 and other risk-based capital ratios.
The Basel III Rules also require banking organizations to maintain a capital conservation buffer to avoid becoming subject to restrictions on capital distributions and certain discretionary bonus payments to management. The capital conservation buffer was at its fully phased-in level of 2.5% of risk-weighted assets throughout 2019. For certain large banking organizations, the capital conservation buffer could be supplemented by a countercyclical capital buffer of up to an additional 2.5% of risk-weighted assets. This buffer is currently set at zero. An FRB policy statement establishes the framework and factors the FRB would use in setting and adjusting the amount of the countercyclical capital buffer. Covered banking organizations would generally have 12 months after the announcement of any increase in the countercyclical capital buffer to meet the increased buffer requirement, unless the FRB determines to establish an earlier effective date. If the full countercyclical buffer amount is implemented, Truist and Truist Bank would be required to maintain a CET1 capital ratio of at least 9.5%, a Tier 1 capital ratio of at least 11%, and a Total capital ratio of at least 13% to avoid limitations on capital distributions and certain discretionary incentive compensation payments.
Certain large banking organizations with trading assets and liabilities above certain thresholds, including Truist, are subject to the Market Risk Rule and must adjust their risk-based capital ratios to reflect the market risk of their trading activities. Refer to the “Market Risk” section of the MD&A for additional disclosures related to market risk management.
In addition, Truist and Truist Bank are subject to a Tier 1 leverage ratio, equal to the ratio of Tier 1 capital to quarterly average assets (net of goodwill, certain other intangible assets, and certain other deductions). Category III banking organizations are also subject to a minimum 3.0% supplementary leverage ratio. The supplementary leverage ratio is calculated by dividing Tier 1 capital by total leverage exposure, which takes into account on-balance sheet assets as well as certain off-balance sheet items, including loan commitments and potential future exposure under derivative contracts.
The total minimum regulatory capital ratios and well-capitalized minimum ratios applicable to Category III banking organizations are reflected in the table below. The FRB has not yet revised the well-capitalized standard for BHCs to reflect the higher capital requirements imposed under the Basel III Rules. For purposes of certain FRB rules, including determining whether a BHC meets the requirements to be a FHC, BHCs, such as Truist, must maintain a Tier 1 Risk-Based Capital Ratio of 6.0% or greater and a Total Risk-Based Capital Ratio of 10.0% or greater. The FRB may require BHCs, including Truist, to maintain capital ratios substantially in excess of mandated minimum levels, depending upon general economic conditions and a BHC's particular condition, risk profile, and growth plans.
10 Truist Financial Corporation
The following table presents the minimum regulatory capital ratios, well-capitalized minimums, and minimum ratio plus capital conservation buffer:
| Table 3: Capital Requirements Under Basel III Rules | |||||||||||||||||
| Minimum Capital | Well Capitalized (1) | Minimum Capital Plus Capital Conservation Buffer (2) | |||||||||||||||
|
CET1 risk-based capital ratio:
|
|||||||||||||||||
| Truist | 4.5 | % | NA | 7.0 | % | ||||||||||||
| Truist Bank | 4.5 | 6.5 | % | 7.0 | |||||||||||||
| Tier 1 risk-based capital ratio: | |||||||||||||||||
| Truist | 6.0 | 6.0 | 8.5 | ||||||||||||||
| Truist Bank | 6.0 | 8.0 | 8.5 | ||||||||||||||
| Total risk-based capital ratio: | |||||||||||||||||
| Truist | 8.0 | 10.0 | 10.5 | ||||||||||||||
| Truist Bank | 8.0 | 10.0 | 10.5 | ||||||||||||||
| Leverage ratio: | |||||||||||||||||
| Truist | 4.0 | NA | N/A | ||||||||||||||
| Truist Bank | 4.0 | 5.0 | N/A | ||||||||||||||
| Supplementary leverage ratio: (3) | |||||||||||||||||
| Truist | 3.0 | NA | N/A | ||||||||||||||
| Truist Bank | 3.0 | NA | N/A | ||||||||||||||
(1)
Reflects the well-capitalized standard applicable to Truist under FRB regulations and the well-capitalized standard applicable to Truist Bank.
(2)
Reflects the fully phased-in capital conservation buffer of 2.5% applicable during 2019.
(3)
Truist and Truist Bank will become subject to the Supplementary leverage ratio effective January 1, 2020.
On December 21, 2018, the regulatory agencies issued a final rule that revises the agencies’ regulatory capital rules to reflect the impact of new accounting and reporting requirements under CECL. The rule identifies which allowances under the new current expected credit losses accounting standard would be eligible for inclusion in regulatory capital, provides banking organizations the option to phase in the day-one effects on regulatory capital that may result from the adoption of the new accounting standard over a three-year period, and amends certain regulatory disclosure requirements consistent with the new accounting standard.
Proposed Stress Buffer Requirements
On April 10, 2018, the FRB issued a proposal to create a single capital requirement by integrating its annual capital planning and stress testing requirements with certain ongoing regulatory capital requirements. The proposal, which would apply to certain bank holding companies, including Truist, would introduce a stress capital buffer and a stress leverage buffer and related changes to the capital planning and stress testing processes. For risk-based capital requirements, the stress capital buffer would replace the existing capital conservation buffer, which is 2.5% as of January 1, 2019. The stress capital buffer would equal the greater of (i) the maximum decline in Truist’s CET1 capital ratio under the severely adverse scenario over the supervisory stress test measurement period, plus the sum of the ratios of the dollar amount of its planned common stock dividends to its projected risk-weighted assets for each of the fourth through seventh quarters of the supervisory stress test projection period, or (ii) 2.5%. For the Tier 1 Leverage Ratio, the stressed leveraged buffer would equal the maximum decline in Truist’s Tier 1 Leverage Ratio under the severely adverse scenario over the supervisory stress test measurement period, plus the sum of the ratios of the dollar amount of its planned common stock dividends to its projected total leverage assets for each of the fourth through seventh quarters of the supervisory stress test projection period.
The proposal would make related changes to capital planning and stress testing processes for BHCs subject to the stress buffer requirements. In particular, the proposal would remove the 30% dividend payout ratio that has been used as a threshold for heightened supervisory scrutiny and would assume that BHCs maintain a constant level of assets and risk-weighted assets throughout the supervisory stress test projection period.
Truist Financial Corporation 11
Liquidity Requirements
Certain BHCs and their bank subsidiaries, including Truist and Truist Bank, are subject to a minimum LCR. The LCR is designed to ensure that BHCs have sufficient high-quality liquid assets to survive a significant liquidity stress event lasting for 30 calendar days. In June 2016, the federal banking regulators proposed a rule to implement the NSFR. The NSFR is designed to promote stable, longer-term funding of assets and business activities over a one-year time horizon and would apply to Truist and Truist Bank, if adopted. Under the Tailoring Rules, Truist and Truist Bank, as Category III banking organizations, will qualify for reduced LCR and proposed NSFR requirements calibrated at 85% of the full requirements.
Truist also is subject to FRB rules that require certain large BHCs to, among other things, conduct internal liquidity stress tests over a range of time horizons, maintain a buffer of highly liquid assets sufficient to meet projected net outflows under the BHC’s 30-day liquidity stress test, and maintain a contingency funding plan that meets certain requirements.
Prompt Corrective Action
The federal banking agencies are required to take "prompt corrective action" with respect to financial institutions that do not meet minimum capital requirements. The law establishes five categories for this purpose: "well-capitalized," "adequately capitalized," "undercapitalized," "significantly undercapitalized" and "critically undercapitalized." To be considered "well-capitalized," an IDI must maintain minimum capital ratios and must not be subject to any order or written directive to meet and maintain a specific capital level for any capital measure. An institution that fails to remain well-capitalized becomes subject to a series of restrictions that increase in severity as its capital condition weakens. Such restrictions may include a prohibition on capital distributions, restrictions on asset growth or restrictions on the ability to receive regulatory approval of applications. The regulations apply only to banks and not to BHCs. However, the FRB is authorized to take appropriate action at the holding company level, based on the undercapitalized status of the holding company’s subsidiary banking institutions. In certain instances relating to an undercapitalized banking institution, the BHC would be required to guarantee the performance of the undercapitalized subsidiary’s capital restoration plan and could be liable for civil money damages for failure to fulfill those guarantee commitments.
In addition, failure to meet capital requirements may cause an institution to be directed to raise additional capital. Federal law further mandates that the agencies adopt safety and soundness standards generally relating to operations and management, asset quality and executive compensation, and authorizes administrative action against an institution that fails to meet such standards. Failure to meet capital guidelines may subject a banking organization to a variety of other enforcement remedies, including additional substantial restrictions on its operations and activities, termination of deposit insurance by the FDIC and, under certain conditions, the appointment of a conservator or receiver.
Transactions with Affiliates
There are various legal restrictions on the extent to which Truist and its non-bank subsidiaries may borrow or otherwise engage in certain types of transactions with Truist Bank. Under the Federal Reserve Act and FRB regulations, Truist Bank and its subsidiaries are subject to quantitative and qualitative limits on extensions of credit, purchases of assets, and certain other transactions involving its non-bank affiliates. In addition, transactions between Truist Bank and its non-bank affiliates are required to be on arm’s length terms and must be consistent with standards of safety and soundness.
Acquisitions
Truist is subject to numerous laws that limit its acquisition activity. For example, under the BHCA, a BHC may not directly or indirectly acquire ownership or control of more than 5% of the voting shares or substantially all of the assets of any BHC or bank or merge or consolidate with another BHC without the prior approval of the FRB. The BHCA and other federal law enumerates the factors the FRB must consider when reviewing the merger of BHCs, the acquisition of banks or the acquisition of voting securities of a bank or BHC. These factors include the competitive effects of the proposal in the relevant geographic markets; the financial and managerial resources and future prospects of the companies and banks involved in the transaction; the effect of the transaction on the financial stability of the United States; the organizations’ compliance with anti-money laundering laws and regulations; the convenience and needs of the communities to be served; and the records of performance under the CRA of the IDIs involved in the transaction.
12 Truist Financial Corporation
Federal law authorizes interstate acquisitions of banks and BHCs without geographic limitation, and a bank headquartered in one state is authorized to merge with a bank headquartered in another state, subject to market share limitations, regulatory approvals and any state requirement that the target bank shall have been in existence and operating for a minimum period of time. The market share limitations impose conditions that the acquiring BHC, after and as a result of the acquisition, control no more than 10% of the total amount of deposits of IDIs in the U.S. and no more than 30%, or such lesser or greater percentage established by state law, of such deposits in applicable states. FRB rules also prohibit a FHC from combining with another company if the ratio of the resulting company's liabilities exceeds 10% of the aggregate consolidated liabilities of all financial companies.
After a bank has established branches in a state through an interstate merger transaction, the bank may establish and acquire additional branches at any location in the state where a bank headquartered in that state could have established or acquired branches under applicable federal or state law. These regulatory considerations are applicable to privately negotiated acquisition transactions.
Other Safety and Soundness Regulations
The FRB has supervisory and enforcement powers over BHCs and their nonbanking subsidiaries. The FRB has authority to prohibit activities that represent unsafe or unsound practices or constitute violations of law, rule, regulation, administrative order or written agreement with a federal regulator. These powers may be exercised through the issuance of confidential supervisory actions, cease and desist orders, civil monetary penalties or other actions.
There also are a number of obligations and restrictions imposed on BHCs and their IDI subsidiaries by federal law and regulatory policy that are designed to reduce potential loss exposure to depositors and the DIF in the event the IDI is insolvent or is in danger of becoming insolvent. For example, the FRB requires a BHC to serve as a source of financial strength to its subsidiary IDIs and to commit financial resources to support such institutions in circumstances where it might not do so otherwise.
Banking regulators also have broad supervisory and enforcement powers over Truist Bank, including the power to impose confidential supervisory actions, fines and other civil and criminal penalties, and to appoint a receiver in order to conserve the assets of Truist Bank for the benefit of depositors and other creditors. The NCCOB also has the authority to take possession of a North Carolina state bank in certain circumstances, including, among other things, when it appears that such bank has violated its charter or any applicable laws, is conducting its business in an unauthorized or unsafe manner, is in an unsafe or unsound condition to transact its business or has an impairment of its capital stock.
DIF Assessments
Truist Bank's deposits are insured by the FDIC up to the applicable limits, which is currently $250,000 per account ownership type. The FDIC imposes a risk-based deposit premium assessment system that determines assessment rates for an IDI based on an assessment rate calculator, which is based on a number of elements to measure the risk each IDI poses to the DIF. The assessment rate is applied to total average assets less tangible equity, as defined under the Dodd-Frank Act. The assessment rate schedule can change from time to time at the discretion of the FDIC, subject to certain limits. Under the current system, premiums are assessed quarterly.
In March 2016, the FDIC imposed a temporary surcharge for insured depository institutions with total assets of at least $10 billion, which took effect July 1, 2016 and ended on September 30, 2018. Truist incurred incremental regulatory charges of $63 million for 2018, $84 million for 2017 and $42 million for 2016 arising from the surcharge.
Consumer Protection Laws and Regulations
In connection with its lending and leasing activities, Truist Bank is subject to a number of federal and state laws designed to protect borrowers and promote lending to various sectors of the economy and population. The CFPB examines Truist and Truist Bank for compliance with a broad range of federal consumer financial laws and regulations, including the laws and regulations that relate to deposit products, credit card, mortgage, automobile, student and other consumer loans, and other consumer financial products and services offered. The consumer financial protection laws that are subject to the CFPB’s supervision and enforcement powers include, among others, the Truth in Lending Act, Truth in Savings Act, HMDA, FCRA, Electronic Funds Transfer Act, Real Estate Settlement Procedures Act, Fair Debt Collections Practices Act, Equal Credit Opportunity Act and Fair Housing Act. The CFPB also has authority to take enforcement actions to prevent and remedy acts and practices relating to consumer financial products and services that it deems to be unfair, deceptive or abusive, and to impose new disclosure requirements for any consumer financial product or service.
The CFPB may issue regulations that impact products and services offered by Truist or Truist Bank. The regulations could reduce the fees that Truist receives, alter the way Truist provides its products and services, or expose Truist to greater risk of private litigation or regulatory enforcement action. The CFPB may engage in rulemakings affecting prepaid cards, data on small business lending, HMDA, and payday, vehicle title, and certain high-cost installment loans.
Truist Financial Corporation 13
During November 2019, SunTrust Bank entered into a consent order with the FRB, relating to certain identified legacy compliance issues and validation of certain prior remediation actions of SunTrust regarding such identified issues. Truist has committed to cause Truist Bank, as successor to SunTrust Bank, to comply with the obligations in the order.
Patriot Act
The Patriot Act is intended to strengthen the ability of U.S. law enforcement agencies and intelligence communities to cooperate in the prevention, detection and prosecution of international money laundering and the financing of terrorism. The Patriot Act contains anti-money laundering measures affecting IDIs, broker-dealers and certain other financial institutions. The Patriot Act includes the International Money Laundering Abatement and Financial Anti-Terrorism Act of 2001, which requires such financial institutions to implement policies and procedures to combat money laundering and the financing of terrorism and grants the Secretary of the U.S. Treasury broad authority to establish regulations and to impose requirements and restrictions on financial institutions' operations. The Patriot Act imposes substantial obligations on financial institutions to maintain appropriate policies, procedures and processes to detect, prevent and report money laundering, terrorist financing and other financial crimes. Failure to comply with these regulations may result in fines, penalties, lawsuits, regulatory sanctions, reputation damage, or restrictions on business. In addition, the Patriot Act requires the federal bank regulatory agencies to consider the effectiveness of a financial institution's anti-money laundering activities when reviewing bank mergers and BHC acquisitions.
BSA/AML and Sanctions
Truist is subject to a number of anti-money laundering laws and regulations as a result of being a financial company headquartered in the United States. AML requirements are primarily derived from the Bank Secrecy Act, as amended by the the Patriot Act. These laws and regulations are designed to prevent the financial system from being used by criminals to hide illicit proceeds and to impede terrorists' ability to access and move funds used in support of terrorist activities. Among other things, BSA/AML laws and regulations require financial institutions to establish AML programs that meet certain standards, including, in some instances, expanded reporting, particularly in the area of suspicious transactions, and enhanced information gathering and recordkeeping requirements. Failure to comply with applicable laws and regulations or maintain adequate AML related controls can lead to significant monetary penalties and reputational damage.
During December 2016, Truist Bank entered into a consent order with the FDIC and the NCCOB and, in January 2017, Truist entered into a cease and desist order with the FRB and NCCOB, relating to certain internal control deficiencies within the BSA/AML Compliance Program. These orders have since been terminated with no money laundering activity identified and no financial penalties levied.
The U.S. Treasury's OFAC rules prohibit U.S. persons from engaging in financial transactions with certain individuals, entities, or countries, identified as "Specially Designated Nationals," such as terrorists and narcotics traffickers. These rules require the blocking of assets held by, and prohibit transfers of property to such individuals, entities or countries. Blocked assets, such as property or bank deposits, cannot be paid out, withdrawn, set off or transferred in any manner without a license from OFAC. Truist maintains an OFAC program designed to ensure compliance with OFAC requirements. Failure to comply with such requirements could subject Truist to serious legal and reputational consequences, including criminal penalties.
Privacy and Cyber Security
The FRB, FDIC and other bank regulatory agencies have adopted guidelines for safeguarding confidential, personal customer information. These guidelines require each financial institution, under the supervision and ongoing oversight of its board of directors or an appropriate committee thereof, to create, implement and maintain a comprehensive written information security program designed to ensure the security and confidentiality of customer information, protect against any anticipated threats or hazards to the security or integrity of such information and protect against unauthorized access to or use of such information that could result in substantial harm or inconvenience to any customer. In addition, various U.S. regulators, including the FRB and the SEC, have increased their focus on cyber security through guidance, examinations and regulations.
The GLBA requires financial institutions to implement policies and procedures regarding the disclosure of nonpublic personal information about consumers to non-affiliated third parties. In general, the statute requires explanations to consumers on policies and procedures regarding the disclosure of such nonpublic personal information and, except as otherwise required by law, prohibits disclosing such information except as provided in the banking subsidiary’s policies and procedures.
States are also increasingly proposing or enacting legislation that relates to data privacy and data protection such as the California Consumer Privacy Act which went into effect on January 1, 2020. Truist has undertaken significant efforts to comply with these laws and continues to assess their requirements and applicability to Truist. These laws and proposed legislation are still subject to revision or formal guidance and they may be interpreted or applied in a manner inconsistent with the Company's understanding.
14 Truist Financial Corporation
In addition, the promulgation in 2017 of the New York Department of Financial Services Cybersecurity Regulation and the National Association of Insurance Commissioners Insurance Data Security Model Law (which has been adopted by eight states as of February 2020) are driving significant cybersecurity compliance activities for Truist. Both of these regulations include phased compliance periods as well as attestation of compliance by Truist.
Like other lenders, Truist Bank uses credit bureau data in their underwriting activities. The Fair Credit Reporting Act regulates reporting information to credit bureaus, prescreening individuals for credit offers, sharing of information between affiliates, and using affiliate data for marketing purposes. Similar state laws may impose additional requirements on Truist Bank.
CRA
The CRA requires Truist Bank's primary federal bank regulatory agency, the FDIC, to assess the bank's record in meeting the credit needs of the communities served by the bank, including low- and moderate-income neighborhoods and persons. Institutions are assigned one of four ratings: "Outstanding," "Satisfactory," "Needs to Improve" or "Substantial Noncompliance." This assessment is considered for any bank that applies to merge or consolidate with or acquire the assets or assume the liabilities of an IDI, or to open or relocate a branch office. The CRA record of each subsidiary bank of a FHC also is assessed by the FRB in connection with reviewing any proposed acquisition or merger application. On December 12, 2019, the FDIC and OCC issued a proposed rule to overhaul the regulatory framework for evaluating banks' CRA performance.
Automated Overdraft Payment Regulation
There are federal consumer protection laws related to automated overdraft payment programs offered by financial institutions. The CFPB prohibits financial institutions from charging consumers fees for paying overdrafts on automated teller machine and one-time debit card transactions, unless a consumer consents, or opts in, to the overdraft service. Financial institutions must also provide consumers with a notice that explains the financial institution's overdraft services, including the associated fees and the consumer's choices. In addition, FDIC-supervised institutions must monitor overdraft payment programs for "excessive or chronic" client use and undertake "meaningful and effective" follow-up action with clients that overdraw their accounts more than six times during a rolling 12-month period. Financial institutions must also impose daily limits on overdraft charges, review and modify check-clearing procedures, prominently distinguish account balances from available overdraft coverage amounts and ensure board and management oversight regarding overdraft payment programs.
Volcker Rule
Truist is prohibited under the Volcker Rule from (i) engaging in proprietary trading for our own account, and (ii) having certain ownership interests in and relationships with covered private funds. The fundamental prohibitions of the Volcker Rule apply to banking entities of any size, including Truist and its affiliates. The Volcker Rule regulations contain exemptions or exclusions for market-making, hedging, underwriting, trading in U.S. government and agency obligations and also permit certain ownership interests in certain types of funds to be retained. They also permit the offering and sponsoring of funds under certain conditions. The Volcker Rule regulations impose significant compliance obligations on banking entities. Truist has put in place the compliance programs required by the Volcker Rule and has either divested or received extensions for any holdings in illiquid funds.
As of October 2019, the five regulatory agencies charged with implementing the Volcker Rule finalized amendments to the Volcker Rule’s proprietary trading and compliance provisions. These amendments tailor the Volcker Rule’s compliance requirements to the amount of a firm’s trading activity, revise the definition of trading account, clarify certain key provisions in the Volcker Rule, and modify the information companies are required to provide the federal agencies. Compliance with the amendments is required by January 1, 2021, with early adoption permitted.
In early 2020, the five federal agencies proposed additional amendments to the Volcker Rule related to the restrictions on ownership interests in and relationships with covered funds. Truist will continue to monitor these Volcker Rule-related developments and assess their impact on its operations as necessary. These requirements do not have a material impact on Truist's consolidated financial position, results of operations or cash flows.
Truist Financial Corporation 15
Regulatory Regime for Swaps
The Dodd-Frank Act established a comprehensive regulatory regime for the OTC swaps market, aimed at increasing transparency and reducing systemic risk in the derivatives markets, including requirements for central clearing, exchange trading, capital adequacy, margin, reporting, and recordkeeping. The Dodd-Frank Act requires that certain swap dealers and security-based swap dealers register with one or both of the SEC and CFTC, depending on the nature of the swaps business. Truist Bank provisionally registered with the CFTC as a swap dealer, subjecting Truist Bank to requirements under the CFTC’s regulatory regime, including trade reporting and record keeping requirements, margin requirements, business conduct requirements (including daily valuations, disclosure of material risks associated with swaps and disclosure of material incentives and conflicts of interest), and mandatory clearing and exchange trading requirements for certain standardized swaps designated by the CFTC. Truist Bank expects to register with the SEC as a security-based swap dealer in 2021. Such registration will subject Truist Bank’s security-based swaps business to requirements that are similar to the CFTC rules applicable to swap dealers, including trade reporting, business conduct standards, recordkeeping, margin, and potentially mandatory clearing and exchange requirements.
Truist Bank’s uncleared swaps and security-based swaps are subject to variation margin and initial margin requirements. The variation margin requirements are currently in effect and the initial margin requirements are phasing in over a period of four years, and will be fully phased-in on September 1, 2020, depending on the level of derivatives activity of the swap dealer and the relevant counterparty. Truist Bank’s derivatives business involving uncleared swaps is expected to become subject to initial margin requirements established by the FRB, which may subject Truist Bank to initial margin requirements that exceed current market practice.
Broker-Dealer and Investment Adviser Regulation
Truist’s broker-dealer and investment adviser subsidiaries are subject to regulation by the SEC. FINRA is the primary self-regulatory organization for Truist’s registered broker-dealer and investment adviser subsidiaries. Truist’s broker-dealer and investment adviser subsidiaries also are subject to additional regulation by states or local jurisdictions. The SEC and FINRA have active enforcement functions that oversee broker-dealers and investment advisers and can bring actions that result in fines, restitution, a limitation on permitted activities, disqualification to continue to conduct certain activities and an inability to rely on certain favorable exemptions. Certain types of infractions and violations also can affect Truist’s ability to expeditiously issue new securities into the capital markets. In addition, certain changes in the activities of a broker-dealer require approval from FINRA, and FINRA takes into account a variety of considerations in acting upon applications for such approval, including internal controls, capital levels, management experience and quality, prior enforcement and disciplinary history and supervisory concerns.
In June 2019, the SEC finalized Regulation Best Interest, which imposes a new standard of conduct on SEC-registered broker-dealers when making recommendations to retail customers. In addition, the SEC finalized a new summary disclosure form that broker-dealers and investment advisers must provide to retail customers. Truist’s broker-dealer and investment adviser subsidiaries must comply with these requirements, as applicable, as of June 2020.
FDIC Recordkeeping Requirements
To facilitate prompt payment of FDIC-insured deposits when large IDIs fail, FDIC rules require IDIs with two million or more deposit accounts to maintain complete and accurate data on each depositor's ownership interest by right and capacity and to develop the capability to calculate the insured and uninsured amounts for each deposit owner by ownership right and capacity. Compliance with the rule is required by April 1, 2020. In July 2019, the FDIC amended the rules related to recordkeeping requirements and timely deposit insurance determination to allow covered IDIs, such as Truist, an optional one-year extension of the original compliance deadline to April 1, 2021.
Incentive-Based Compensation Arrangements
During May 2016, several financial regulators jointly issued a proposed rule designed to prohibit incentive-based compensation arrangements that could encourage inappropriate risks by providing excessive compensation or that could lead to a material financial loss. The proposed rule would require the applicable compensation arrangements to be considered against a number of factors, including a requirement that the arrangements contain both financial and non-financial measures of performance. In addition, the requirements would differ based on the size of the institution, and institutions with assets exceeding $50 billion would be subject to mandatory deferral, forfeiture/adjustment and clawback requirements for employees subject to the rule.
16 Truist Financial Corporation
Other Regulatory Matters
Truist is subject to examinations by federal and state banking regulators, as well as the SEC, CFTC, FINRA, NYSE, various taxing authorities and various state insurance and securities regulators. Truist periodically receives requests for information from regulatory authorities in various states, including state insurance commissions and state attorneys general, securities regulators and other regulatory authorities, concerning Truist's business and accounting practices. Such requests are considered incidental to the normal conduct of business.
Employees
At December 31, 2019, Truist had approximately 59,000 employees.
Website Access to Truist's Filings with the SEC
Truist's electronic filings with the SEC, including the Annual Report on Form 10-K, Quarterly Reports on Form 10-Q, Current Reports on Form 8-K and amendments to these reports filed or furnished pursuant to Sections 13(a) or 15(d) of the Exchange Act, as amended, are made available at no cost in the Investor Relations section of the Company's website,
IR.Truist.com
, as soon as reasonably practicable after Truist files such material with, or furnishes it to, the SEC. Truist's SEC filings are also available through the SEC's website at
sec.gov
.
Corporate Governance
Information with respect to Truist's Board of Directors, Executive Officers and corporate governance policies and principles is presented on Truist's website,
IR.Truist.com.
Truist Financial Corporation 17
Executive Officers
| Executive Officer | Recent Work Experience | Years of Service | Age | |||||||||||||||||
| Kelly S. King | Chairman since January 2010. Chief Executive Officer since January 2009. | 47 | 71 | |||||||||||||||||
| Chairman and Chief Executive Officer | ||||||||||||||||||||
| William H. Rogers, Jr. | President and Chief Operating Officer since December 2019. Previously SunTrust Chairman and Chief Executive Officer since January 2012. | * | 62 | |||||||||||||||||
| President and Chief Operating Officer | ||||||||||||||||||||
| Daryl N. Bible | Chief Financial Officer since January 2009. | 12 | 58 | |||||||||||||||||
|
Senior Executive Vice President and Chief Financial Officer
|
||||||||||||||||||||
| Scott Case | Chief Information Officer since December 2019. Previously SunTrust Chief Information Officer since February 2018. Chief Information Officer at Ciox Health from 2017 to 2018. Chief Technology Officer of SunTrust Consumer Segment from 2015 to 2017. | * | 49 | |||||||||||||||||
|
Senior Executive Vice President and Chief Information Officer
|
||||||||||||||||||||
| Hugh S. (Beau) Cummins, III | Head of the Corporate and Institutional Group since December 2019. Previously SunTrust Co-Chief Operating Officer and Wholesale Segment Executive since February 2018. SunTrust Corporate Executive Vice President and Wholesale Segment Executive from 2017 to February 2018. SunTrust Commercial and Business Banking Executive from 2013 to 2017. | * | 57 | |||||||||||||||||
|
Senior Executive Vice President and Head of the Corporate and Institutional Group
|
||||||||||||||||||||
| Ellen M. Fitzsimmons | Chief Legal Officer and Head of Enterprise Diversity and HR since December 2019. Previously SunTrust General Counsel and Corporate Secretary since January 2018. General Counsel and Corporate Secretary of CSX Corporation from 2003 to 2017. | * | 59 | |||||||||||||||||
|
Senior Executive Vice President and Chief Legal Officer and Head of Enterprise Diversity and HR
|
||||||||||||||||||||
| Christopher L. Henson | Head of Banking and Insurance since December 2019. President from December 2016 to December 2019 and Chief Operating Officer from January 2009 to December 2019. | 35 | 58 | |||||||||||||||||
|
Senior Executive Vice President and Head of Banking and Insurance
|
||||||||||||||||||||
| Ellen Koebler | Deputy Chief Risk Officer since December 2019. Previously SunTrust Chief Risk Officer since January 2019. SunTrust Consumer Lending and Deposit Solutions Executive from 2016 to 2018. E*Trade Chief Risk Officer in 2016. SunTrust Chief Market Risk and Enterprise Analytics Officer from 2014 to 2016. | * | 50 | |||||||||||||||||
|
Senior Executive Vice President and Deputy Chief Risk Officer
|
||||||||||||||||||||
| Michael B. Maguire | Head of National Consumer Finance and Payments since December 2019. Previously SunTrust Enterprise Partnerships and Investments Executive. | * | 41 | |||||||||||||||||
|
Senior Executive Vice President and Head of National Consumer Finance & Payments
|
||||||||||||||||||||
| Joseph M. Thompson | Head of Truist Wealth since December 2019. Previously SunTrust Head of Private Wealth Management since August 2014. | * | 53 | |||||||||||||||||
|
Senior Executive Vice President and Head of Truist Wealth
|
||||||||||||||||||||
| Brant J. Standridge | Head of Retail Community Banking since December 2019. President, Retail Banking since January 2018. Lending Group Manager from August 2016 to December 2017. Regional President in Texas from January 2015 to August 2016. | 21 | 44 | |||||||||||||||||
|
Senior Executive Vice President and President, Retail Banking
|
||||||||||||||||||||
| Clarke R. Starnes III | Chief Risk Officer since July 2009. | 37 | 60 | |||||||||||||||||
|
Senior Executive Vice President and Chief Risk Officer
|
||||||||||||||||||||
| David H. Weaver | Head of Commercial Community Banking since December 2019. President, Community Banking since December 2016. Community Banking Group Executive from 2010 to December 2016. | 24 | 53 | |||||||||||||||||
|
Senior Executive Vice President and Head of Commercial Community Banking
|
||||||||||||||||||||
| Dontá L. Wilson | Chief Digital and Client Experience Officer since November 2018. Chief Client Experience Officer since August 2016. Regional President in Georgia from December 2014 to July 2016. | 21 | 43 | |||||||||||||||||
|
Senior Executive Vice President and Chief Digital and Client Experience Officer
|
||||||||||||||||||||
* Became an Executive Officer of Truist on December 6, 2019, upon the closing of the Merger.
18 Truist Financial Corporation
ITEM 1A. RISK FACTORS
The following discussion sets forth some of the more important risk factors that could materially affect Truist’s financial condition and operations. When a risk factor spans several risk categories, the risks have been listed by their primary risk category. The risks described are not all inclusive. Additional risks that are not presently known or risks deemed immaterial may have a material adverse effect on Truist's financial condition, results of operations, business and prospects.
Merger-related Risks
Truist may not be able to successfully integrate the companies or to realize the anticipated benefits of the Merger.
The Company was formed by the merger of BB&T and SunTrust on December 6, 2019. Truist anticipates further integration of systems, operations, and personnel of BB&T and SunTrust over the next several years.
The successful integration of BB&T’s and SunTrust’s operations will depend substantially on the Company’s ability to successfully consolidate operations, management teams, corporate cultures, systems and procedures and to eliminate redundancies and costs. Truist may encounter difficulties during integration, such as:
•
the loss of key employees and clients;
•
the disruption of operations and businesses;
•
inability to maintain and increase competitive presence;
•
loan, deposit, and revenue attrition;
•
inconsistencies in standards, control procedures and policies;
•
unexpected issues with planned branch and other facilities closures;
•
unexpected issues with costs, operations, personnel, technology; and
•
problems with the assimilation of new operations, sites or personnel.
Integration activities could divert resources from regular operations. In addition, general market and economic conditions or governmental actions affecting the financial industry generally may inhibit the Company’s successful integration of these entities.
BB&T and SunTrust merged with the expectation that the Merger would result in various synergies including, among other things, benefits relating to enhanced revenues, a strengthened and expanded market position for the combined organization, technology efficiencies, cost savings and operating efficiencies. Achieving the anticipated benefits of the merger is subject to a number of uncertainties, including whether the Company integrates the institutions in an efficient and effective manner, as well as general competitive factors in the marketplace. Failure to achieve or delays in achieving these anticipated benefits could result in a share price reduction as well as increased costs, decreases in the amount of expected revenues, and diversion of management’s time and energy and could materially and adversely affect the Company’s financial condition, results of operations, business and prospects.
Truist will continue to incur substantial expenses related to the merger and the integration.
There are a large number of processes, policies, procedures, operations, technologies and systems that must be integrated. In addition, the merger may increase the Company’s compliance and legal risks, including increased litigation or regulatory actions such as fines or restrictions related to the business practices or operations of the combined business.
While the Company has assumed that a certain level of expenses would be incurred, there are many factors beyond the Company’s control that could affect the total amount or the timing of the integration expenses. Moreover, many of the expenses that will be incurred are, by their nature, difficult to estimate accurately. These expenses could, particularly in the near term, exceed the expected savings from the elimination of duplicative expenses and the realization of economies of scale. The amount and timing of future charges to earnings as a result of merger or integration expenses are uncertain.
Truist Financial Corporation 19
Market Risks
Changes in interest rates could adversely affect revenue and expenses, the value of assets and liabilities, as well as the availability and cost of capital, cash flows and liquidity.
Truist’s balance sheet can be sensitive to movements in market interest rates and spreads as well as basis risk arising from the Company's ALM activities, which management must closely monitor. In addition to the impact of the general economy, changes in interest rates or in valuations in the debt or equity markets could directly impact the Company in one or more of the following ways:
•
The yield on earning assets and rates paid on interest-bearing liabilities may change in disproportionate ways; or
•
The value of financial instruments held could change adversely.
Regional and local economic conditions, competitive pressures and the policies of regulatory authorities affect interest income and interest expense. When interest rates rise, funding costs may rise faster than the yield the Company earns on assets, causing net interest margin to contract. Higher interest rates may also result in lower mortgage production income and elevated charge-offs in certain categories of the loan portfolio. Conversely, when interest rates fall, the yield the Company earns on assets may fall faster than the Company’s ability to lower rates paid on deposits or borrowings.
Certain investment securities, notably MBS, are very sensitive to changes in rates. Generally, when rates rise, prepayments will decrease and the duration of MBS will increase. Conversely, when rates fall, prepayments of principal and interest will increase and the duration of MBS will decrease.
The monetary and fiscal policies of the federal government and its agencies could have a material adverse effect on profitability.
Changes in monetary and fiscal policies, including FRB policies, can adversely affect profitability and cannot be controlled or predicted by the Company. FRB policies can:
•
significantly impact the cost of funds, as well as the return on assets, both of which can have an impact on interest income;
•
materially affect the value of financial assets;
•
adversely affect borrowers through higher debt servicing costs and potentially increase the risk that they may fail to repay their loan obligations; and
•
artificially inflate asset values during prolonged periods of accommodative policy, which could in turn cause volatile markets and rapidly declining collateral values.
Financial results, lending or other business activities could be materially affected by a deterioration of economic conditions.
A prolonged period of slow growth in the U.S. economy as a whole or in any regional markets that Truist serves, or any deterioration in economic conditions or the financial markets may disrupt or dampen the economy, which could materially adversely affect the Company’s financial condition and results.
If economic conditions deteriorate, the Company may see lower demand for loans by creditworthy clients, reducing the Company’s interest income. In addition, if unemployment levels increase or if real estate prices decrease, the Company would expect to incur higher charge-offs and may incur higher expenses in connection with adjustments to the reasonable and supportable forecasts used to estimate the allowance for credit losses in accordance with CECL requirements. These conditions may adversely affect not only consumer loan performance but also commercial and industrial and commercial real estate loans, especially for those businesses that rely on the health of industries or properties that may suffer from deteriorating economic conditions. The ability of these borrowers to repay their loans may be reduced, causing the Company to incur higher credit losses.
The deterioration of economic conditions also could adversely affect financial results for the Company’s fee-based businesses, including the Company’s insurance brokerage, wealth management, investment advisory, trading and investment banking businesses. Truist earns fee income from, among other activities, managing assets for clients and providing brokerage and other investment advisory and wealth management services. Investment management fees are often based on the value of assets under management and a decrease in the market prices of those assets could reduce the Company’s fee income. Changes in stock or fixed income market prices or client preferences could affect the trading activity of investors, reducing commissions and other fees earned from the Company’s brokerage business. Poor economic conditions and volatile or unstable financial markets would likely adversely affect the Company’s capital markets-related businesses.
20 Truist Financial Corporation
Instability in global economic conditions and geopolitical matters, as well as volatility in financial markets, could have a material adverse effect on the Company’s operations, earnings and financial condition.
Instability in global economic conditions and geopolitical matters, as well as volatility in financial markets, could have a material adverse effect on the Company’s operations, earnings and financial condition. The macroeconomic environment in the United States is susceptible to global events and volatility in financial markets. For example, trade negotiations between the U.S. and other nations remains uncertain and could adversely impact economic and market conditions for the Company and its clients and counterparties.
A negative change in economic conditions, the performance of foreign sovereign debt, changes of trade policies and other matters could adversely affect the Company’s business, financial condition and liquidity. Domestic and global political activity, geopolitical matters, including international political unrest or disturbances, terrorist activities, military conflicts, concerns over energy prices, trade wars and economic instability or recession in certain regions could cause volatility in the financial markets, undermine investor confidence or cause a contraction of available credit. Any of these could reduce the value of the Company’s assets or cause a reduction in liquidity that adversely impacts the Company’s financial condition and results of operations.
The replacement of LIBOR could adversely affect Truist’s profitability and financial condition.
LIBOR and certain other interest rate benchmarks are the subject of recent national, international and other regulatory guidance and proposals for reform. These reforms may cause such benchmarks to perform differently than in the past or have other consequences which cannot be predicted. The United Kingdom’s Financial Conduct Authority, which regulates LIBOR, has publicly announced that it intends to stop compelling banks to submit information to the administrator of LIBOR after 2021. The continuation of LIBOR cannot be guaranteed after 2021. Truist has LIBOR-based contracts that extend beyond 2021 included in loans and leases, securities, deposits, short-term borrowings, long-term debt and derivative financial instruments. While there is no consensus on what rate or rates may become accepted alternatives to LIBOR, a group of market participants convened by the FRB, the ARRC, has selected the SOFR as its recommended alternative to U.S. dollar LIBOR. The FRB of New York started to publish SOFR in April 2018. SOFR is a broad measure of the cost of overnight borrowings collateralized by U.S. Treasury securities.
If SOFR or another alternative reference rate becomes an accepted alternative to LIBOR, it may perform differently than LIBOR in response to changing market conditions. For example, SOFR could experience greater decreases during times of economic stress, which could require the Company to lend at lower rates at times when the Company’s borrowing costs are increasing.
The market transition away from LIBOR to alternative reference rates is complex and could have a range of adverse effects on the Company’s business, financial condition and results of operations. In particular, any such transition could:
•
adversely affect the interest rates received or paid on the revenue and expenses associated with or the value of the Company’s LIBOR-based assets and liabilities;
•
adversely affect the interest rates received or paid on the revenue and expenses associated with or the value of other securities or financial arrangements, given LIBOR’s role in determining market interest rates globally;
•
prompt inquiries or other actions from regulators in respect of the Company’s preparation and readiness for the replacement of LIBOR with an alternative reference rate; and
•
result in disputes, litigation or other actions with borrowers or counterparties about the interpretation and enforceability of certain fallback language in LIBOR-based contracts and securities.
The transition away from LIBOR to an alternative reference rate will require the transition to or development of appropriate systems, models and analytics to effectively transition the Company’s risk management and other processes from LIBOR-based products to those based on the applicable alternative reference rate, such as SOFR. Truist has developed a LIBOR transition team and project plan that outlines timelines and priorities to prepare its processes, systems and people to support this transition. Timelines and priorities include assessing the impact on the Company’s clients, as well as assessing system requirements for operational processes. There can be no guarantee that these efforts will successfully mitigate the operational risks associated with the transition away from LIBOR to an alternative reference rate.
The manner and impact of the transition from LIBOR to an alternative reference rate, as well as the effect of these developments on the Company’s funding costs, loan, investment and trading securities portfolios, and ALM and business, is uncertain.
Truist Financial Corporation 21
Credit Risks
The Company is subject to credit risk by lending or committing money, or entering into a letter of credit or other contract with a counterparty.
Truist incurs credit risk, which is the risk of losses if the Company’s borrowers do not repay loans or if the Company’s counterparties fail to perform according to the terms of their contracts. A number of products expose the Company to credit risk, including loans, leveraged loans, leases and lending commitments, derivatives, trading assets and assets held for sale. Changes in credit quality can have a significant impact on the Company’s earnings. The Company estimates and establishes reserves for credit risks and credit losses inherent in its determination of credit exposure (including unfunded credit commitments). This process, which is critical to the Company’s financial results and condition, requires difficult, subjective and complex judgments, considering both external and borrower-specific factors that might impair the ability of borrowers to repay their loans. As is the case with any such assessments, there is always the chance that the Company will fail to identify the proper factors or that the Company will fail to accurately estimate the impacts of factors identified.
Credit losses may exceed the amount of the Company’s reserves as a result of changing economic conditions, including falling real estate or commodity prices and higher unemployment or other factors such as changes in borrower behavior. There is no assurance that reserves will be sufficient to cover all incurred credit losses. In the event of significant deterioration in economic conditions, the Company may be required to increase reserves in future periods, which would reduce the Company’s earnings and potentially impact its capital.
The Company may have more credit risk and higher credit losses to the extent that loans are concentrated by loan type, industry segment, borrower type or location of the borrower or collateral.
The Company’s credit risk and credit losses can increase if the Company’s loans are concentrated in borrowers engaged in the same or similar activities or in borrowers who as a group may be uniquely or disproportionately affected by economic or market conditions. Deterioration in economic conditions, housing conditions or real estate values in these markets in which the Company operates could result in materially higher credit losses.
Liquidity Risks
Truist’s liquidity could be impaired by an inability to access short-term funding, an unforeseen outflow of cash or a reduction in the credit ratings for Truist or its subsidiaries.
Liquidity is essential to Truist’s businesses. When volatility or disruptions occur in the wholesale funding markets, the Company’s ability to access short-term liquidity could be materially impaired. In addition, other factors outside of the Company’s control, such as a general market disruption or an operational problem that affects third parties, could impair the Company’s ability to access short-term funding or create an unforeseen outflow of cash or deposits. The Company’s inability to access short-term funding or capital markets could constrain the Company’s ability to make new loans or meet existing lending commitments and could ultimately jeopardize the Company’s overall liquidity and capitalization.
Loss of deposits or a change in deposit mix could increase Truist’s funding costs.
Deposits are a low cost and stable source of funding. Truist competes with banks and other financial institutions for deposits and as a result, could risk losing deposits in the future or see an increase in costs associated with maintaining deposits. Clients may shift their deposits into higher cost products or the Company may need to raise interest rates to avoid deposit attrition. Funding costs may also increase if deposits lost are replaced with wholesale funding. Higher funding costs reduce Truist’s net interest margin, net interest income, and net income.
Truist relies on the mortgage secondary market and GSEs for some of the Company’s liquidity.
Truist sells a portion of the mortgage loans originated to reduce the Company’s retained credit risk and to provide funding capacity for originating additional loans. GSEs could limit their purchases of conforming loans due to capital constraints or other changes in their criteria for conforming loans (e.g., maximum loan amount or borrower eligibility). This potential reduction in purchases could limit the ability to fund new loans.
Proposals have been presented to reform the housing finance market in the U.S., including the role of the GSEs in the housing finance market. The extent and timing of any such regulatory reform of the housing finance market and the GSEs, as well as any effect on the Company’s business and financial results, are uncertain.
22 Truist Financial Corporation
Any reduction in the Company’s credit rating could increase the cost of the Company’s funding from the capital markets.
Ratings agencies regularly evaluate Truist and its subsidiaries. Ratings are based on a number of factors, including the financial strength of the Company as well as conditions affecting the financial services industry generally. Failure to maintain those ratings could adversely affect funding cost and increase the Company’s cost of capital. A credit downgrade might also affect the Company’s ability to attract or retain deposits from commercial and corporate clients. Additionally, the Company’s ability to conduct derivatives business with certain clients and counterparties could also be impacted and could trigger obligations to make cash or collateral payments to certain clients and counterparties.
The Parent Company has less access to funding sources and liquidity could be constrained if the bank becomes unable to pay dividends during a time of stress.
The Parent Company relies upon capital markets access and dividends from affiliates for funding and has less access to contingent sources than the Bank. If the Bank were subject to a financial stress, its dividends to the Parent Company could be reduced or eliminated in order to support Bank capital ratios or other regulatory requirements. This would increase the Parent Company’s reliance on capital markets at a time when spreads and funding costs are likely elevated due the stress impacting the Bank.
Compliance Risks
Truist is subject to extensive and evolving government regulation and supervision, which could increase the cost of doing business, limit Truist’s ability to make investments and generate revenue and lead to costly enforcement actions.
The banking and financial services industries are highly regulated. Truist is subject to supervision, regulation and examination by regulators, including the FRB, FDIC, NCCOB, SEC, CFTC, CFPB, FINRA and various state regulatory agencies. The statutory and regulatory framework governing Truist is generally intended to protect depositors, the DIF, clients, and the U.S. financial system as a whole, and not Truist’s debt holders or shareholders. Reform of the financial services industry resulting from the Dodd-Frank Act, including the EGRRCPA and other legislative, regulatory and technological changes, affect the Company’s operations.
These laws and regulations and Truist’s inability to act in certain instances without receiving prior regulatory approval affect Truist’s lending practices, capital structure, investment practices, dividend policy, ability to repurchase common stock and ability to pursue strategic acquisitions, among other activities. Changes to statutes, regulations or regulatory policies or their interpretation or implementation and the continued heightening of regulatory requirements could affect Truist in substantial and unpredictable ways. Federal and state banking regulators also possess broad powers to take supervisory actions as they deem appropriate. These supervisory actions may result in higher capital requirements, higher deposit insurance premiums and limitations on the Company’s activities that could have a material adverse effect on operations or profitability.
In recent years, both Congress and the federal banking regulators have engaged in a rebalancing of the post financial crisis legal and regulatory framework, particularly by tailoring enhanced prudential standards to the size, risk profile and complexity of the banking organization. It is possible that a new presidential administration and a new Congress could reconsider this rebalancing of the legal and regulatory framework and also impose significant new regulatory and supervisory burdens on the financial sector. Truist expects that its businesses will remain subject to extensive regulation and supervision regardless of who wins the Presidential and Congressional elections in 2020. Any potential new regulations or modifications to existing regulations would likely necessitate changes to Truist’s existing regulatory compliance and risk management infrastructure. Compliance with new regulations and supervisory initiatives, including those newly applicable as a result of the Merger may increase costs.
Truist is subject to heightened requirements under the enhanced prudential standards and expects increased supervisory scrutiny, including, for example, single counterparty credit limits, heightened expectations with respect to governance, risk management and internal controls and additional capital and liquidity requirements.
The financial services industry faces scrutiny from bank supervisors in the examination process and stringent enforcement of regulations on both the federal and state levels. Areas of focus in the recent past have been with respect to mortgage-related practices, student lending practices, sales practices and related incentive compensation programs and other consumer compliance matters, as well as compliance with BSA/AML requirements and sanctions compliance requirements as administered by the OFAC. For example, Truist Bank entered into a consent order with the FDIC and the NCCOB in December 2016 and Truist entered into a cease and desist order with the FRB and NCCOB in January 2017. Additionally, during November 2019, SunTrust Bank entered into a consent order in with the FRB. Current and future actions by regulators could impact Truist’s operations. See additional disclosures in the "Regulatory Considerations" section.
This heightened regulatory scrutiny or the results of an investigation or examination, may lead to additional regulatory investigations or enforcement actions. There is no assurance that those actions will not result in regulatory settlements or other enforcement actions against
Truist Financial Corporation 23
Truist. Furthermore, a single event involving a potential violation of law or regulation may give rise to numerous and overlapping investigations and proceedings, either by multiple federal and state agencies and officials in the United States or, in some instances, regulators and other governmental officials in foreign jurisdictions.
Federal law grants substantial enforcement powers to federal banking regulators and law enforcement agencies. This enforcement authority includes, among other things, the ability to assess significant civil or criminal monetary penalties, fines or restitution; to issue cease and desist or removal orders; and to initiate injunctive actions against banking organizations and institution-affiliated parties. These enforcement actions may be initiated for violations of laws and regulations and unsafe or unsound practices. Any future enforcement action could have a material adverse impact.
In some cases, governmental authorities have required criminal pleas or other extraordinary terms as part of such settlements, which could have significant consequences for a financial institution, including loss of clients, restrictions on the ability to access the capital markets and the inability to operate certain businesses or offer certain products for a period of time. Violations of laws and regulations or deemed deficiencies in risk management practices also may be incorporated into Truist’s confidential supervisory ratings. A downgrade in these ratings or these or other regulatory actions and settlements, could limit Truist’s ability to conduct expansionary activities for a period of time and require new or additional regulatory approvals before engaging in certain other business activities.
In addition, regulatory changes may reduce Truist’s revenues, limit the types of financial services and products it may offer, alter the investments it makes, affect the manner in which it operates its businesses, increase its litigation and regulatory costs should it fail to appropriately comply with new or modified laws and regulatory requirements and increase the ability of non-banks to offer competing financial services and products.
Truist is subject to regulatory capital and liquidity standards that affect the Company’s business, operations and ability to pay dividends or otherwise return capital to shareholders.
Truist is subject to regulatory capital and liquidity requirements established by the FRB and the FDIC. These regulatory capital and liquidity requirements are typically developed at an international level by the BCBS and then applied, with adjustments, in each country by the appropriate domestic regulatory bodies. Domestic regulatory agencies have the ability to apply stricter capital and liquidity standards than those developed by the BCBS. In several instances, the U.S. banking agencies have done so with respect to U.S. banking organizations.
Requirements to maintain specified levels of capital and liquidity and regulatory expectations as to the quality of the Company’s capital and liquidity may prevent the Company from taking advantage of opportunities in the best interest of shareholders or force the Company to take actions contrary to their interests. For example, Truist may be limited in its ability to pay or increase dividends or otherwise return capital to shareholders. In addition, these requirements may impact the amount and type of loans the Company is able to make. Truist may be constrained in its ability to expand, either organically or through mergers and acquisitions. These requirements may cause the Company to sell or refrain from acquiring assets where the capital requirements appear inconsistent with the assets’ underlying risks. In addition, liquidity standards require the Company to maintain holdings of highly liquid investments, thereby reducing the Company’s ability to invest in less liquid assets, even if more desirable from a balance sheet or interest rate risk management perspective.
As a Category III banking organization, Truist is subject to additional capital and liquidity requirements. Specifically, Truist will be subject to a supplementary leverage ratio, the countercyclical capital buffer (if deployed), a higher outflow rate for the LCR and heightened expectations about capital planning.
Regulatory capital and liquidity requirements receive periodic review and revision by the BCBS and the U.S. banking agencies. Changes to capital and liquidity requirements may require Truist or Truist Bank to maintain more or higher quality capital or greater liquidity and could increase some of the potential adverse effects described above.
The liquidity standards applicable to large U.S. banking organizations also are expected to be supplemented in the coming years. For example, in May 2016, the U.S. banking agencies proposed rules to implement the NSFR, which is designed to ensure that banking organizations maintain a stable, long-term funding profile in relation to their asset composition and off-balance sheet activities. The U.S. rules have not yet been finalized and more recent rule changes adjust the scope and effect of the originally-proposed U.S. rules. Thus, the potential impact of the NSFR remains unclear.
In addition to the regulatory capital and liquidity requirements applicable to Truist and Truist Bank, the Company’s broker-dealer subsidiaries are subject to capital requirements established by the SEC.
24 Truist Financial Corporation
Strategic and Reputational Risks
Truist is subject to certain risks related to originating and selling mortgages and may be required to repurchase mortgage loans or indemnify mortgage loan purchasers.
Truist is required to make customary representations and warranties to the purchaser about the mortgage loans and the manner in which they were originated when selling mortgage loans or loan securitizations. An increase in the number of repurchase and indemnity demands from purchasers related to representations and warranties on loans sold could result in an increase in the amount of losses for loan repurchases. Truist also bears a risk of loss from borrower defaults for multi-family commercial mortgage loans sold to FNMA.
In addition to repurchase claims from GSEs, Truist could be subject to indemnification claims from non-GSE purchasers of the Company’s loans. Claims could be made if Truist fails to conform to statements about the quality of the mortgage loans sold, the manner in which the loans were originated and underwritten or to comply with state and federal law.
Truist may not be able to complete future mergers or acquisitions.
The Company must generally satisfy a number of meaningful conditions before completing an acquisition of another bank or BHC, including federal and state regulatory approvals. In determining whether to approve a proposed bank or BHC acquisition, bank regulators will consider, among other factors, the effect of the acquisition on competition; financial condition and future prospects, including current and projected capital ratios and levels; the competence, experience and integrity of management; record of compliance with laws and regulations; the convenience and needs of the communities to be served, including the acquiring institution’s record of compliance under the CRA; the effectiveness of the acquiring institution in combating money laundering activities; and protests from various stakeholders. In addition, U.S. regulators must take systemic risk to the U.S. financial system into account when evaluating whether to approve a potential acquisition transaction involving a large financial institution like Truist. There is no certainty as to when or if or on what terms and conditions, any required regulatory approvals will be granted for any potential acquisition. In specific cases, Truist may be required to sell banks or branches or take other actions as a condition to receiving regulatory approval. An inability to satisfy other conditions necessary to consummate an acquisition transaction, such as third-party litigation, a judicial order blocking the transaction or lack of shareholder approval, could also prevent the Company from completing an announced acquisition.
Truist faces risks as a servicer of loans.
The Company acts as servicer and master servicer for mortgage loans included in securitizations and for unsecuritized mortgage loans owned by investors. As a servicer or master servicer for those loans, the Company has certain contractual obligations to the securitization trusts, investors or other third parties. As a servicer, Truist’s obligations include foreclosing on defaulted mortgage loans or, to the extent consistent with the applicable securitization or other investor agreement, considering alternatives to foreclosure such as loan modifications or short sales. In the Company’s capacity as a master servicer, obligations include overseeing the servicing of mortgage loans by the servicer. Generally, the Company’s servicing obligations are set by contract, for which the Company receives a contractual fee. However, GSEs can amend their servicing guidelines, which can increase the scope or costs of the services required without any corresponding increase in the Company’s servicing fee. Further, the CFPB has implemented national servicing standards which have increased the scope and costs of services which the Company is required to perform. In addition, there has been a significant increase in state laws that impose additional servicing requirements that increase the scope and cost of the Company’s servicing obligations. As a servicer, the Company also advances expenses on behalf of investors which it may be unable to collect.
A material breach of the Company’s obligations as servicer or master servicer may result in contract termination if the breach is not cured within a specified period of time following notice, which can generally be given by the securitization trustee or a specified percentage of security holders, causing the Company to lose servicing income. In addition, the Company may be required to indemnify the securitization trustee against losses from any failure by us, as a servicer or master servicer, to perform the Company’s servicing obligations or any act or omission on the Company’s part that involves willful misfeasance, bad faith or gross negligence. For certain investors and certain transactions, Truist may be contractually obligated to repurchase a mortgage loan or reimburse the investor for credit losses incurred on the loan as a remedy for servicing errors with respect to the loan. The Company may be subject to increased repurchase obligations as a result of claims made that the Company did not satisfy its obligations as a servicer or master servicer. The Company may also experience increased loss severity on repurchases, which may require a material increase to the Company’s repurchase reserve.
The Company has and may continue to receive indemnification requests related to the Company’s servicing of loans owned or insured by other parties, primarily GSEs. Typically, such a claim seeks to impose a compensatory fee on the Company for departures from GSE service levels. In most cases, this is related to delays in the foreclosure process. Additionally, the Company has received indemnification requests where an investor or insurer has suffered a loss due to a breach of the servicing agreement. While the number of such claims has been small, these could increase in the future.
Truist Financial Corporation 25
Truist has businesses other than banking that are subject to a variety of risks.
Truist is a diversified financial services company and this diversity subjects the Company’s earnings to a broader variety of risks and uncertainties. Other businesses in addition to banking that the Company operates include insurance, investment banking, securities underwriting and market making, loan syndications, investment management and advice and retail and wholesale brokerage services offered through the Company’s subsidiaries. These businesses entail significant market, operational, credit, compliance, technology, legal and other risks that could materially adversely impact the Company’s results of operations.
Negative public opinion could damage the Company’s reputation and adversely impact business and revenues.
Truist’s earnings and capital are subject to risks associated with negative public opinion. Negative public opinion could result from the Company’s actual or alleged conduct in any number of activities, including lending or sales practices, a breach of client or teammate information, the failure of any product or service sold to meet the Company’s clients’ expectations or applicable regulatory requirements, corporate governance and acquisitions or from actions taken by government regulators and community organizations in response to those activities. Negative public opinion could adversely affect the Company’s ability to attract and retain clients and personnel and can result in litigation and regulatory actions. Actual or alleged conduct by one of the Company’s businesses can result in negative public opinion about the Company’s other businesses. Actual or alleged conduct by another financial institution can result in negative public opinion about the financial services industry in general and, as a result, adversely affect Truist.
Scrutiny of the Company’s sales, training and incentive compensation practices could damage the Company’s reputation and adversely impact business and revenues.
The Company may face increased scrutiny of the Company’s consumer and other business sales practices, training practices, incentive compensation design and governance, and quality assurance and client complaint resolution practices. There can be no assurance that the Company’s processes and actions will meet regulatory standards or expectations. Findings from self-identified or regulatory reviews may require responsive actions, including increased investments in compliance systems and personnel or the payment of fines, penalties, increased regulatory assessments or client redress and may increase legal or reputational risk exposures.
Competition may reduce the Company’s client base or cause the Company to lower prices for products and services in order to maintain market share.
Truist operates in a highly competitive industry that could become even more competitive. Increased competition could arise from technological, legislative and regulatory changes, as well as from continued consolidation. There is intense competition among commercial banks in the Company’s market area. The Company also competes with other providers of financial services, such as savings and loan associations, credit unions, consumer finance companies, securities firms, insurance companies, commercial finance and leasing companies, the mutual funds industry, full-service brokerage firms and discount brokerage firms, some of which are subject to less extensive regulation than Truist. The Company’s success depends, in part, on the Company’s ability to adapt its products and services to evolving industry standards and client expectations. The widespread adoption of new technologies has required and will continue to require substantial investments to modify or adapt existing products and services or to develop new products and services. In addition, there is increasing pressure to provide products and services at lower prices, which reduce net interest income and noninterest income from fee-based products and services. The Company may not be successful in introducing new products and services in response to industry trends or developments in technology or those new products may not achieve market acceptance.
Legislative or regulatory changes also could lead to increased competition in the financial services sector if the regulatory burdens of the Company’s competitors are reduced relative to the requirements of the Company. For example, EGRRCPA and the Tailoring Rules reduce the regulatory burden of some of the Company’s smaller competitors, which could cause some of them to become more competitive or to more aggressively pursue expansion.
The adoption of new technologies by competitors, including internet banking services, mobile applications, advanced ATM functionality and cryptocurrencies could require the Company to make substantial expenditures to modify or adapt the Company’s existing products and services. These and other capital investments in the Company’s business may not produce expected growth in earnings anticipated at the time of the expenditure. The Company may not be successful in introducing new products and services, achieving market acceptance of new products and services, anticipating or reacting to consumers’ changing technological preferences or developing and maintaining loyal clients.
26 Truist Financial Corporation
Truist also competes with nonbank companies inside and outside of the Company’s market area and, in some cases, with companies other than those traditionally considered financial sector participants. In particular, technology companies are increasingly focusing on the financial sector, either in partnership with competitor banking organizations or on their own. These companies generally are not subject to the same regulatory burdens as financial institutions and may accordingly realize certain cost savings and offer products and services at more favorable rates and with greater convenience to the client. For example, a number of companies offer bill pay and funds transfer services that allow clients to bypass banks. Technology companies are generally positioned and structured to quickly adapt to technological advances and directly focus resources on implementing those advances. This competition could result in the loss of fee income, client deposits and related income. In addition, changes in consumer spending and saving habits could adversely affect the Company’s operations and Truist may be unable to develop competitive products and services in a timely manner. As the pace of technology and change advance, continuous innovation is expected to exert long-term pressure on the financial services industry.
Truist will continually encounter technological change and must effectively develop and implement new technology.
The financial services industry is undergoing rapid technological change with frequent introductions of new technology-driven products and services. Truist has invested in technology and connectivity to automate functions previously performed manually, to facilitate the ability of clients to engage in financial transactions and otherwise to enhance the client experience with respect to the Company’s products and services. On the retail side, technological changes include developments such as more sophisticated ATMs and expanded access to banking transactions through the internet, smart phones, tablets and other remote devices. Truist expects to make additional investments in innovation and technology to address technological disruption in the industry and improve client offerings and service. These changes allow the Company to better serve the Company’s clients and to reduce costs.
The Company’s continued success depends, in part, upon the Company’s ability to address clients’ needs by using technology to provide products and services that satisfy client demands, including demands for faster and more secure payment services, to create efficiencies in the Company’s operations and to integrate those offerings with legacy platforms or to update those legacy platforms. A failure to maintain or enhance the Company’s competitive position with respect to technology, whether because of a failure to anticipate client expectations, a failure in the performance of technological developments or an untimely roll out of developments, may cause the Company to lose market share or incur additional expense.
Operational Risks
Litigation may adversely affect the Company’s results.
The Company is subject to litigation in the course of business. Claims and legal actions, including supervisory actions by the Company’s regulators, could involve large monetary claims and significant defense costs. The outcome of litigation and regulatory matters as well as the timing of ultimate resolution are inherently difficult to predict.
Actual legal and other costs of resolving claims may be greater than the Company’s legal reserves. The ultimate resolution of a pending legal proceeding, depending on the remedy sought and granted, could materially adversely affect the Company’s results of operations and financial condition.
In addition, governmental authorities have, at times, sought criminal penalties against companies in the financial services sector for violations, and, at times, have required an admission of wrongdoing from financial institutions in connection with resolving such matters. Criminal convictions or admissions of wrongdoing in a settlement with the government can lead to greater exposure in civil litigation and reputational harm.
Substantial legal liability or significant regulatory action against the Company could have material adverse financial effects or cause significant reputational harm, which adversely impact the Company’s business prospects. Further, the Company may be exposed to substantial uninsured liabilities, which could adversely affect the Company’s results of operations and financial condition.
The Company may incur fines, penalties and other negative consequences from regulatory violations, including inadvertent or unintentional violations.
Truist maintains systems and procedures designed to ensure that it complies with applicable laws and regulations, but there can be no assurance that these will be effective. In addition to fines and penalties, the Company may suffer other negative consequences from regulatory violations including restrictions on certain activities, such as the Company’s mortgage business, which may affect the Company’s relationship with the GSEs and may also damage the Company’s reputation and this in turn might materially affect the Company’s business and results of operations.
Truist Financial Corporation 27
Further, some legal frameworks provide for the imposition of fines or penalties for noncompliance even when the noncompliance was inadvertent or unintentional and even when there were systems and procedures in place designed to ensure compliance. For example, Truist is subject to regulations issued by OFAC that prohibit financial institutions from participating in the transfer of property belonging to the governments of certain foreign countries and designated nationals of those countries. OFAC may impose penalties for inadvertent or unintentional violations even if reasonable processes are in place to prevent the violations. Courts may uphold significant additional penalties on financial institutions, even where the financial institution had already reimbursed the government or other counterparties for actual losses.
Truist relies on other companies to provide key components of the Company’s business infrastructure.
Third parties provide key components of the Company’s business infrastructure, such as banking services, data processing, business processes, internet connections and network access. Any disruption in such services provided by these third parties or any failure of these third parties to handle current or higher volumes of use could adversely affect the Company’s ability to deliver products and services to clients, to support teammates and otherwise to conduct business. Technological or financial difficulties of a third party service provider could adversely affect the Company’s business to the extent those difficulties result in the interruption or discontinuation of services provided by that party. Further, in some instances, the Company may be responsible for failures of such third parties to comply with government regulations. The Company may not be insured against all types of losses as a result of third party failures and insurance coverage may be inadequate to cover all losses resulting from system failures or other disruptions. Failures in the Company’s business infrastructure could interrupt the operations or increase the costs of doing business.
Truist depends on the expertise of key personnel. If these individuals leave or change their roles without effective replacements, operations may suffer.
The Company’s success depends, to a large degree, on the continued services of executive officers and other key personnel who have extensive experience in the industry. The Company’s business could be adversely impacted from the loss of key persons or failure to manage a smooth transition to new personnel. These risks may be exacerbated as the Company continues to integrate processes and systems subsequent to the Merger.
The Company may not be able to hire or retain additional qualified personnel and recruiting and compensation costs may increase as a result of changes in the marketplace, which may increase costs and adversely impact the Company’s ability to implement business strategies.
The Company’s success depends upon the ability to attract and retain highly motivated, well-qualified personnel. The Company faces significant competition in the recruitment of qualified employees. The Company’s ability to execute the Company’s business strategy and provide high quality service may suffer if the Company is unable to recruit or retain a sufficient number of qualified employees or if the costs of employee compensation or benefits increase substantially. The U.S. banking agencies have jointly issued comprehensive guidance designed to ensure that incentive compensation policies do not undermine the safety and soundness of banking organizations by encouraging employees to take imprudent risks. This guidance significantly affects the amount, form and context of incentive compensation to teammates. The FRB, FDIC, SEC and other federal regulatory agencies have jointly proposed rules which would affect incentive compensation. These rules, which have been pending for several years, if finalized, may result in additional costs and restrictions on the form of the Company’s incentive compensation.
The Company’s framework for managing risks may not be effective.
The Company’s risk management framework seeks to mitigate risk and loss. Truist has established policies, processes and procedures intended to identify, measure, monitor, report and analyze the types of risk to which the Company is subject, including liquidity, credit, market, operational, technology, reputational, legal, model and compliance risk, among others. However, the Company’s risk management measures may not be fully effective in identifying and mitigating the Company’s risk exposure in all market environments or against all types of risk, including risks that are unidentified or unanticipated, even if the models for assessing risk are properly designed and implemented. Some of the Company’s methods of managing risk are based upon the Company’s use of observed historical market behavior and management’s judgment. These methods may not accurately predict future exposures, which could be significantly greater than historical measures indicate. If the Company’s risk management framework proves ineffective, it could suffer unexpected losses and could be materially adversely affected.
28 Truist Financial Corporation
There are risks resulting from the extensive use of models in Truist's business, which may impact decisions made by management and regulators.
Truist relies on quantitative models to measure risks and to estimate certain financial values. Models may be used in such processes as determining the pricing of various products, grading loans and extending credit, measuring interest rate and other market risks, predicting or estimating losses, assessing capital adequacy and calculating economic and regulatory capital levels, as well as to estimate the value of financial instruments and balance sheet items.
Poorly designed or implemented models present the risk that Truist's business decisions based on information incorporating model output would be adversely affected due to the inadequacy of that information. Also, information Truist provides to the public or to its regulators based on poorly designed or implemented models could be inaccurate or misleading. Some of the decisions that the regulators make, including those related to capital distributions to Truist's shareholders, could be affected adversely due to the perception that the quality of the models used to generate the relevant information is insufficient.
The Company is at risk of increased losses from fraud.
Criminals committing fraud increasingly are using more sophisticated techniques and in some cases, are a part of larger criminal organizations, which allow them to be more effective. Fraudulent activity has taken many forms and escalates as more tools for accessing financial services emerge, such as real-time payments. Fraud schemes, including occurrences of employee fraud, information theft or other malfeasance, are broad and continuously evolving and include such things as debit card/credit card fraud, check fraud, mechanical devices attached to ATM machines, social engineering and phishing attacks to obtain personal information or impersonation of the Company’s clients through the use of falsified or stolen credentials.
In addition, individuals or business entities may properly identify themselves, yet seek to establish a business relationship for the purpose of perpetrating fraud. Increased deployment of technologies, such as chip card technology, defray and reduce aspects of fraud; however, criminals are turning to other sources to steal personally identifiable information, such as unaffiliated healthcare providers and government entities, in order to impersonate the consumer to commit fraud. Further, as a result of the increased sophistication of fraud activity, the Company has increased the Company’s spending on systems, resources and controls to detect and prevent fraud, as well as increased spending to provide certain credit monitoring and identity theft protection services to the Company’s consumer clients. This will result in continued ongoing investments in the future.
The Company’s operational or security systems or infrastructure or those of third parties, could fail or be breached, which could disrupt the Company’s business and adversely impact the Company’s results of operations, liquidity and financial condition, as well as cause legal or reputational harm.
The potential for operational risk exposure exists throughout the Company’s business and, as a result of the Company’s interactions with and reliance on third parties, is not limited to the Company’s own internal operational functions. The Company’s operational and security systems and infrastructure, including computer systems, data management and internal processes, as well as those of third parties, are integral to the Company’s performance. Truist relies on its teammates and third parties in the Company’s operations, who may expose the Company to risk as a result of human error, misconduct, malfeasance, or failure or breach of systems and infrastructure, including that of third parties. For example, the Company’s ability to conduct business may be adversely affected by any significant disruptions, including to third parties with whom the Company interacts with or relies upon.
The Company faces security risks, including denial of service attacks, hacking and social engineering attacks.
Attacks targeting the Company’s teammates and clients, malware intrusion or data corruption attempts and identity theft that could result in the disclosure of confidential information, adversely affect the Company’s business or reputation and create significant legal and financial exposure. The Company’s computer systems and network infrastructure and those of third parties are subject to security risks and susceptible to cyber-attacks, such as denial of service attacks, hacking, terrorist activities or identity theft. The Company’s business relies on the secure processing, transmission, storage and retrieval of confidential, proprietary and other information in the Company’s computer and data management systems and networks and in the computer and data management systems and networks of third parties. In addition, to access the Company’s network, products and services, the Company’s clients and other third parties may use personal mobile devices or computing devices that are outside of the Company’s network environment and are subject to their own cybersecurity risks.
Truist and Truist’s clients, regulators and other third parties, including other financial services institutions and companies engaged in data processing, have been subject to and are likely to continue to be the target of, cyber-attacks. Cyber-attacks are designed to expose security vulnerabilities in the Company’s systems or the systems of third parties or other security measures that could result in the unauthorized gathering, monitoring, misuse, release, loss or destruction of confidential, proprietary or sensitive information. A cyber-attack could also damage the Company’s systems by introducing material disruptions to the Company’s or the Company’s clients’ or other third parties’
Truist Financial Corporation 29
network access or business operations. As cyber threats continue to evolve, the Company may be required to expend significant additional resources to continue to modify or enhance the Company’s protective measures or to investigate and remediate any information security vulnerabilities or incidents. Despite efforts to ensure the integrity of the Company’s systems and implement controls, processes, policies and other protective measures, the Company may not be able to anticipate all security breaches, nor may the Company be able to implement sufficient preventive measures against such security breaches, which may result in material losses or consequences to Truist.
Cybersecurity risks for banking organizations have significantly increased in recent years in part because of the proliferation of new technologies and the use of the internet and telecommunications technologies to conduct financial transactions. For example, cybersecurity risks may increase in the future as Truist continues to expand its mobile-payment and internet-based product offerings and expand the Company’s internal usage of web-based products and applications. In addition, cybersecurity risks have significantly increased in recent years in part due to the increased sophistication and activities of organized crime affiliates, terrorist organizations, hostile foreign governments, disgruntled employees or vendors, activists and other external parties, including those involved in corporate espionage. Even the most advanced internal control environment may be vulnerable to compromise. Targeted social engineering attacks and “spear phishing” attacks are becoming more sophisticated and are extremely difficult to prevent. In such an attack, an attacker will attempt to fraudulently induce teammates, clients or other users of the Company’s systems to disclose sensitive information in order to gain access to the Company’s data or that of the Company’s clients. Persistent attackers may succeed in penetrating defenses given enough resources, time and motive. The techniques used by cyber criminals change frequently, may not be recognized until launched and may not be recognized until well after a breach has occurred. The risk of a security breach caused by a cyber-attack at a vendor or by unauthorized vendor access has also increased in recent years. In addition, the existence of cyber-attacks or security breaches at third-party vendors with access to the Company’s data may not be disclosed in a timely manner.
The Company also faces indirect technology, cybersecurity and other operational risks relating to clients and other third parties that the Company relies upon to facilitate or enable business activities, including, financial counterparties, regulators and providers of critical infrastructure such as internet access and electrical power. In addition, Truist faces cybersecurity and other operational risks relating to the Merger, including increased phishing attacks on teammates, increased network perimeter scanning by third parties searching for vulnerabilities and domain name squatting. Further, as a result of increasing consolidation, interdependence and complexity of financial entities and technology systems, a technology failure, cyber-attack or other information or security breach that significantly degrades, deletes, or compromises the systems or data of one or more financial entities could have a material impact on counterparties or other market participants. This consolidation, interconnectivity and complexity increases the risk of operational failure, on both individual and industry-wide bases, as disparate systems need to be integrated, often on an accelerated basis. Any third-party technology failure, cyber-attack, other information or security breach, termination, or constraint could, among other things, adversely affect the Company’s ability to conduct transactions, service the Company’s clients, manage the Company’s exposure to risk or expand the Company’s business.
Cyber-attacks or other information or security breaches, including those directed at third parties, may result in a material loss or have material consequences. Furthermore, the public perception that a cyber-attack on the Company’s systems has been successful, whether or not this perception is correct, may damage the Company’s reputation with clients and third parties with whom the Company does business. Hacking of personal information and identity theft risks, in particular, could cause serious reputational harm. A successful penetration or circumvention of system security could cause serious negative consequences, including loss of clients and business opportunities; costs associated with maintaining business relationships after an attack or breach; significant disruption to the Company’s operations and business; misappropriation, exposure or destruction of the Company’s confidential information, intellectual property, funds and those of the Company’s clients; or damage to the Company’s or the Company’s clients’ or third parties’ computers or systems and could result in a violation of applicable privacy laws and other laws. This could result in litigation exposure, regulatory fines, penalties, loss of confidence in the Company’s security measures, reputational damage, reimbursement or other compensatory costs, additional compliance costs, which could adversely impact the Company’s results of operations, liquidity and financial condition. In addition, the Company may not have adequate insurance coverage to compensate for losses from a cybersecurity event.
Natural disasters and other catastrophic events could have a material adverse impact on the Company’s operations or the Company’s financial condition and results.
The occurrence of catastrophic weather events or pandemics could adversely affect the Company’s financial condition or results of operations. Truist has significant operations and clients along the Gulf and Atlantic coasts as well as other regions of the U.S., which could be adversely impacted by hurricanes, tornadoes and other severe weather in those areas. Natural and other types of disasters could have an adverse impact on Truist's businesses in that such events could materially disrupt the Company’s operations or the ability or willingness of the Company’s clients to access the financial services offered, including adverse impacts on the Company’s borrowers to timely repay their loans and the value of any collateral held. These events could reduce the Company’s earnings and cause volatility in the Company’s financial results for any fiscal quarter or year and have a material adverse effect on the Company’s financial condition or results of operations.
30 Truist Financial Corporation
In addition, certain commercial and corporate borrowers may be affected by the recent outbreak of the coronavirus, which originated in Wuhan, Hubei Province, China but has been reported in other countries. These effects could include disruptions or restrictions in clients’ supply chains, closures of clients’ facilities or decreases in demand for clients’ products and services. If clients’ are adversely affected, or if the virus leads to a widespread health crisis that impacts economic growth, Truist's financial condition and results of operations could be adversely affected, despite having no direct operations in China.
Although Truist has business continuity plans and other safeguards in place, the Company’s operations and communications may be adversely affected by natural disasters or other catastrophic events and there can be no assurance that such business continuity plans will be effective.
Truist may be impacted by the soundness of other financial institutions.
The Company’s ability to engage in routine funding transactions could be adversely affected by the actions and commercial soundness of other financial institutions. Financial services institutions are interrelated as a result of trading, clearing, counterparty and other relationships. Truist has exposure to many different industries and counterparties and routinely executes transactions with counterparties in the financial industry, including brokers and dealers, central counterparties, commercial banks, investment banks, mutual and hedge funds and other institutional investors and clients. As a result, defaults by, or even rumors or questions about, one or more financial services institutions or the financial services industry generally, in the past have led to market-wide liquidity problems and could lead to losses or defaults by Truist or by other institutions. Many of these transactions expose the Company to credit risk in the event of default of the Company’s counterparty or client. In addition, the Company’s credit risk may be exacerbated when the collateral held by Truist cannot be liquidated or is liquidated at prices not sufficient to recover the full amount of the Company’s exposure. Any such losses could materially and adversely affect the Company’s results of operations and financial condition.
Truist depends on the accuracy and completeness of information about clients and counterparties.
In deciding whether to extend credit or enter into other transactions with clients and counterparties, Truist relies on the completeness and accuracy of representations made by and information furnished by or on behalf of clients and counterparties, including financial statements and other financial information. If the information provided is not accurate or complete, the Company’s decisions about extending credit or entering into other transactions with clients or counterparties could be adversely affected and the Company could suffer defaults, credit losses or other negative consequences as a result.
The Company’s accounting policies and processes are critical to how it reports the Company’s financial condition and results of operations. They require management to make estimates about matters that are uncertain.
Accounting policies and processes are fundamental to how the Company records and reports its financial condition and results of operations. Some of these policies require the use of estimates and assumptions that may affect the value of the Company’s assets or liabilities and financial results. Several of the Company’s accounting policies are critical because they require management to make difficult, subjective and complex judgments about matters that are inherently uncertain and because it is likely that materially different amounts would be reported under different conditions or using different assumptions. Pursuant to U.S. GAAP, the Company makes certain assumptions and estimates in preparing the Company’s financial statements, including in determining credit loss reserves, reserves related to litigation and the fair value of certain assets and liabilities, including amounts related to assets acquired, liabilities assumed and the value of goodwill, among other items. If assumptions or estimates underlying the Company’s financial statements are incorrect or are adjusted periodically, the Company may experience material losses.
Management has identified certain accounting policies as being critical because they require management’s judgment to ascertain the valuations of assets, liabilities, commitments and contingencies. A variety of factors could affect the realization of income and expense or the recognition of assets and liabilities in the Company's financial statements. Truist has established detailed policies and control procedures that are intended to ensure these critical accounting estimates and judgments are well controlled and applied consistently. In addition, the policies and procedures are intended to ensure that the process for changing methodologies occurs in an appropriate manner. Due to the uncertainty surrounding the Company’s judgments and the estimates pertaining to these matters, the Company cannot guarantee that adjustments to accounting policies or restatement of prior period financial statements will not be required.
Further, from time to time, the FASB and SEC change the financial accounting and reporting standards that govern the preparation of the Company’s financial statements. In addition, accounting standard setters and those who interpret the accounting standards may change or even reverse their previous interpretations or positions on how these standards should be applied. Changes in financial accounting and reporting standards and changes in current interpretations may be beyond the Company’s control, can be hard to predict and could materially affect how the Company reports its financial results and condition. In some cases, the Company could be required to apply a new or revised standard retroactively, resulting in the restatement of prior period financial statements.
Truist Financial Corporation 31
For example, in June 2016, the FASB issued an accounting standard related to credit losses, CECL. The standard requires companies to record, at the time of origination, credit losses expected throughout the life of certain financial assets, such as loans and unfunded commitments, as opposed to the current practice of recording losses when it is probable that a loss event has occurred. Truist adopted the credit loss standard on January 1, 2020 and recognized a one-time cumulative effect adjustment to the Company’s allowance for credit losses and retained earnings on that date.
Depressed market values for the Company’s stock and adverse economic conditions sustained over a period of time may require the Company to write down all or some portion of the Company’s goodwill.
Goodwill is periodically tested for impairment by comparing the fair value of each reporting unit to its carrying amount. If the fair value is greater than the carrying amount, then the reporting unit’s goodwill is deemed not to be impaired. The fair value of a reporting unit is impacted by the reporting unit’s expected financial performance and susceptibility to adverse economic, regulatory and legislative changes. The estimated fair values of the individual reporting units are assessed for reasonableness by reviewing a variety of indicators, including comparing these estimated fair values to the Company’s market capitalization over a reasonable period of time. While this comparison provides some relative market information about the estimated fair value of the reporting units, it is not determinative and needs to be evaluated in the context of the current economic environment. However, significant and sustained declines in the Company’s market capitalization could be an indication of potential goodwill impairment.
Certain banking laws and certain provisions of the Company’s articles of incorporation may have an anti-takeover effect.
Provisions of federal banking laws, including regulatory approval requirements, could make it difficult for a third party to acquire the Company, even if doing so would be perceived to be beneficial to the Company’s owners. Acquisition of certain amounts of any class of voting stock of a BHC or depository institution, including shares of the Company’s common stock, may create a rebuttable presumption that the acquirer “controls” the BHC or depository institution and thus, unless the acquirer is able to rebut this presumption, it would be subject to various laws and regulations applicable to BHC. Also, a BHC must obtain the prior approval of the FRB before, among other things, acquiring direct or indirect ownership or control of more than 5% of the voting shares of any bank, including Truist Bank.
There also are provisions in the Company’s amended and restated articles of incorporation and amended and restated bylaws, such as limitations on the ability to call a special meeting of the Company’s shareholders, that may be used to delay or block a takeover attempt. In addition, the Company’s Board will be authorized under the Company’s amended and restated articles of incorporation to issue shares of the Company’s preferred stock and to determine the rights, terms, conditions and privileges of such preferred stock, without shareholder approval. These provisions may effectively inhibit a non-negotiated merger or other business combination.
ITEM 2. PROPERTIES
Truist currently leases its headquarters building at 214 North Tryon Street, Charlotte, NC, 28202. On December 11, 2019, the Company announced its plan to purchase its headquarters building and the transaction is projected to close in the first half of 2020. Truist owns or leases free-standing operations centers, with its primary operations and information technology centers located in various locations in the Southeastern and Mid-Atlantic United States. Truist owns or leases retail branches and other offices in a number of states, primarily concentrated in the Southeastern and Mid-Atlantic United States. See Table 2 for a list of Truist's branches by state. Truist also operates numerous insurance agencies and other businesses that occupy facilities throughout the U.S. and Canada. Management believes that the premises are well-located and suitably equipped to serve as financial services facilities. See "Note 6. Premises and Equipment" for additional disclosures related to properties and other fixed assets.
32 Truist Financial Corporation
ITEM 5. MARKET FOR REGISTRANT'S COMMON EQUITY, RELATED STOCKHOLDER MATTERS AND ISSUER PURCHASES OF EQUITY SECURITIES
Truist's common stock is traded on the NYSE under the symbol "TFC." As of December 31, 2019, Truist's common stock was held by 97,193 registered shareholders.
Common Stock, Dividends and Share Repurchases
Truist's ability to pay dividends is primarily dependent on earnings from operations, the adequacy of capital and the availability of liquid assets for distribution and is subject to its capital plan receiving a non-objection from the FRB. Truist's ability to generate liquid assets for distribution is dependent on the ability of Truist Bank to pay dividends to the Parent Company. The payment of cash dividends is an integral part of providing a competitive return on shareholders' investments. The Company's policy is to accomplish this while retaining sufficient capital to support future growth and to meet regulatory requirements. Management has established a guideline that the common dividend payout ratio (computed by dividing common stock dividends by net income available to common shareholders) will be between 30% and 50% during normal economic conditions. Truist's common dividend payout ratio was 43.2% in 2019 compared to 39.3% in 2018 and 45.3% in 2017. Truist has paid a cash dividend to shareholders every year since 1903. Truist expects common dividend declarations, if declared, to occur in January, April, July and October with payment dates on or about the first of March, June, September and December. A discussion of dividend restrictions is included in "Note 17. Regulatory Requirements and Other Restrictions" and in the "Regulatory Considerations" section.
Share Repurchases
Truist has periodically repurchased shares of its own common stock. In accordance with North Carolina law, repurchased shares cannot be held as treasury stock, but revert to the status of authorized and unissued shares upon repurchase. Repurchases may be effected through open market purchases, privately negotiated transactions, trading plans established in accordance with SEC rules or other means. The timing and exact amount of repurchases will be consistent with the Company's capital plan and subject to various factors, including the Company's capital position, liquidity, financial performance, alternative uses of capital, stock trading price and general market conditions, and may be suspended at any time. Shares repurchased constitute authorized but unissued shares of the Company and are therefore available for future issuances. During 2019, the Company had no common stock repurchases. As previously communicated, Truist suspended its share repurchase program until capital ratios return to higher levels.
Management's guideline for the total payout ratio (computed by dividing the sum of common stock dividends declared and share repurchases, excluding shares repurchased in connection with equity awards, by net income available to common shareholders) is that it will range between 30% and 80% during normal economic conditions. Truist may consider higher total distributions based on its capital position, earnings and prevailing economic conditions. The total payout ratio was 43.2%, 78.7% and 117.9% in 2019, 2018 and 2017, respectively.
Preferred Stock
On July 29, 2019, the Company issued $1.7 billion of series N non-cumulative perpetual preferred stock. During the third quarter of 2019, the Company redeemed all outstanding 23,000 shares of series D and 46,000 shares of series E non-cumulative perpetual preferred stock, and the corresponding depositary shares representing fractional interests in each series for $1.7 billion. Upon closing of the Merger, each outstanding share of SunTrust perpetual preferred stock was converted into the right to receive one share of an applicable newly issued series of Truist preferred stock having substantially the same terms as such share of SunTrust preferred stock. The Company issued series I, J, K, L and M non-cumulative perpetual preferred stock with a total par and fair values of $2.0 billion on the Merger closing date. On February 10, 2020, the Company announced its intention to redeem all outstanding 5,000 shares of its perpetual preferred stock series K and the corresponding depositary shares representing fractional interests in each share for $500 million plus any unpaid dividends on March 16, 2020. See "Note 12. Shareholders' Equity" for information about preferred stock and "Note 2. Business Combinations" for additional information related to the Merger.
Truist Financial Corporation 33
Equity Compensation Plan Information
In connection with the Merger, each outstanding heritage SunTrust equity award granted under heritage SunTrust's equity compensation plans was converted into a corresponding award with respect to Company common stock, with the number of shares underlying such award (and, in the case of stock options, the applicable exercise price) adjusted based on the exchange ratio. Each such converted Company equity award will continue to be subject to the same terms and conditions as applied to the corresponding heritage SunTrust equity award, except that, in the case of heritage SunTrust performance stock unit awards, the number of shares underlying the converted Company equity award was determined based on actual performance through September 30, 2019 and target performance for the balance of the applicable performance period and such award will continue to vest after the Merger solely based on continued service. The following table provides information concerning securities to be issued upon the exercise of outstanding equity-based awards as of December 31, 2019:
| Table 4: Equity Compensation Plan Information | ||||||||||||||||||||
| Plan Category |
(a)(1)(2)
Number of securities to be issued upon exercise of outstanding options, warrants and rights |
(b)(3)
Weighted-average exercise price of outstanding options, warrants and rights |
(c)(4)
Number of securities remaining available for future issuance under equity compensation plans (excluding securities reflected in (a)) |
|||||||||||||||||
| Approved by security holders | 14,257,967 | $31.30 | 12,766,118 | |||||||||||||||||
| Not approved by security holders | 9,037,363 | 20.91 | 14,104,648 | |||||||||||||||||
| Total | 23,295,330 | 29.00 | 26,870,766 | |||||||||||||||||
(1) Includes 11,434,410 RSUs and PSUs in plans approved by security holders.
(2) Plans not approved by security holders consists of 829,920 options outstanding with a weighted average exercise price of $20.91 and 8,207,443 RSUs for plans that were assumed in mergers and acquisitions.
(3) Excludes RSUs and PSUs because they do not have an exercise price.
(4) Plans not approved by security holders consists of shares of common stock issuable pursuant to the 2012 Incentive Plan, as amended, in respect of shares reserved for issuance under the SunTrust Banks, Inc. 2018 Omnibus Incentive Compensation Plan, which share reserve was assumed by the Company on December 6, 2019 in connection with the Merger. Awards with respect to such shares may only be granted to heritage SunTrust teammates.
34 Truist Financial Corporation
Performance Graph
The following graph compares the cumulative total returns (assuming concurrent $100 investments at the beginning of each period and reinvestment of dividends) of Truist common stock, the S&P 500 Index and industry peer groups. The companies in the peer group are Bank of America Corporation, Citizens Financial Group, Fifth Third Bancorp, JPMorgan Chase & Co, KeyCorp, M&T Bank Corporation, PNC Financial Services Group, Inc., Regions Financial Corporation, U.S. Bancorp and Wells Fargo & Company. During the first quarter of 2019, Truist removed Comerica Incorporated and Zions Bancorporation, and added Bank of America Corporation and Capital One Financial Corporation. During the most recent update to the industry peer group, Truist removed Capital One Financial Corporation and Huntington Bancshares, Incorporated, and added JPMorgan Chase & Co.SunTrust Banks, Inc was removed from the Company's peer groups due to the Merger.
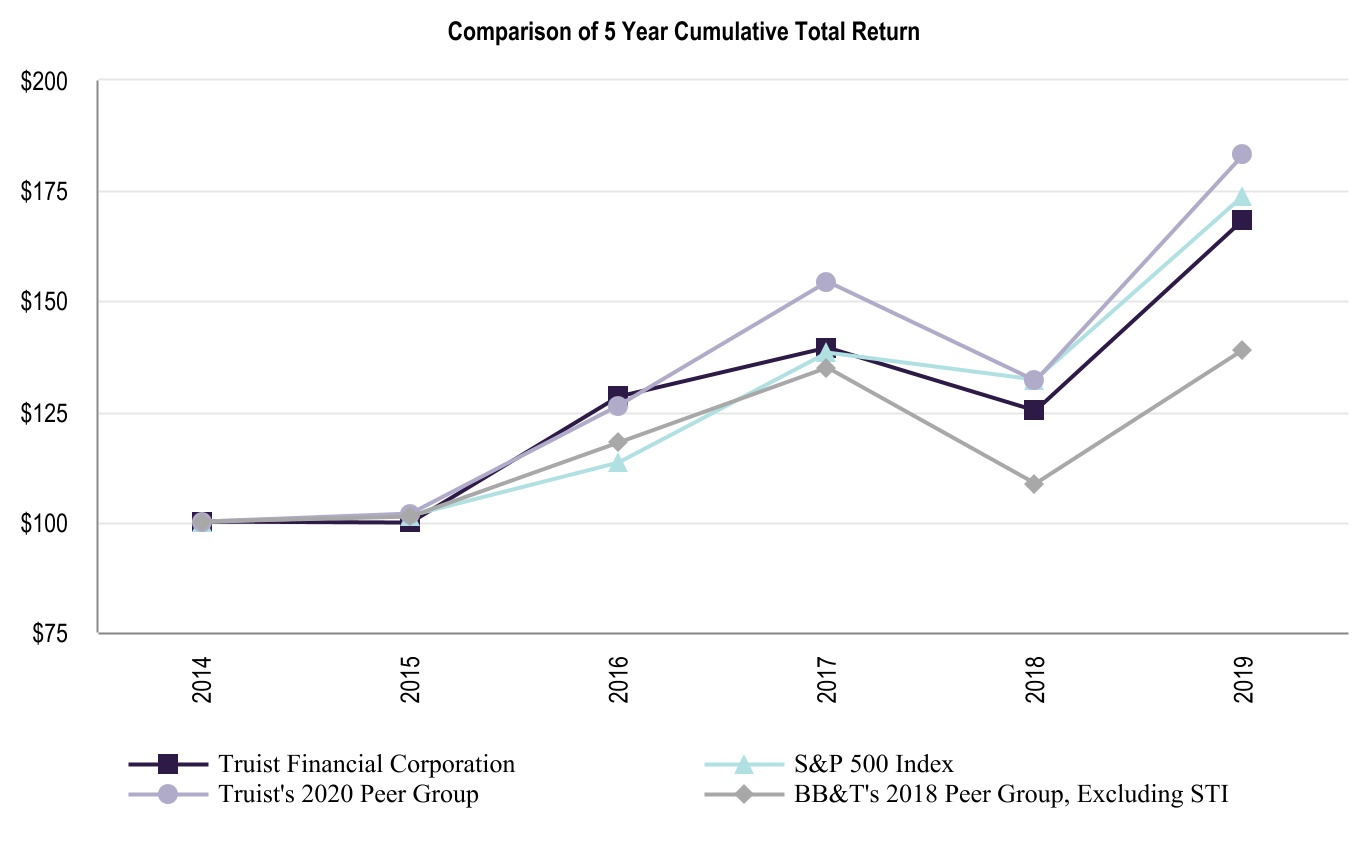
| As of / Through December 31, | |||||||||||||||||||||||||||||||||||
| Invested | Cumulative Total Return | ||||||||||||||||||||||||||||||||||
| 2014 | 2015 | 2016 | 2017 | 2018 | 2019 | ||||||||||||||||||||||||||||||
| Truist Financial Corporation | $ | 100.00 | $ | 99.90 | $ | 128.34 | $ | 139.48 | $ | 125.22 | $ | 168.45 | |||||||||||||||||||||||
| S&P 500 Index | 100.00 | 101.37 | 113.49 | 138.26 | 132.19 | 173.80 | |||||||||||||||||||||||||||||
| Truist's 2020 Peer Group | 100.00 | 101.80 | 126.25 | 154.43 | 131.85 | 183.21 | |||||||||||||||||||||||||||||
| BB&T's 2018 Peer Group, Excluding STI | 100.00 | 101.08 | 117.83 | 134.79 | 108.54 | 139.00 | |||||||||||||||||||||||||||||
Truist Financial Corporation 35
| ITEM 6. SELECTED FINANCIAL DATA | |||||||||||||||||||||||||||||
| As of/ For the Year Ended December 31, | |||||||||||||||||||||||||||||
| (Dollars in millions, except per share data, shares in thousands) | 2019 | 2018 | 2017 | 2016 | 2015 | ||||||||||||||||||||||||
| Summary Income Statement: | |||||||||||||||||||||||||||||
| Revenue -TE (1) | $ | 12,664 | $ | 11,654 | $ | 11,476 | $ | 10,953 | $ | 9,757 | |||||||||||||||||||
| Less: TE adjustment (2) | 96 | 96 | 159 | 160 | 146 | ||||||||||||||||||||||||
| Revenue-reported (1) | 12,568 | 11,558 | 11,317 | 10,793 | 9,611 | ||||||||||||||||||||||||
| Provision for credit losses | 615 | 566 | 547 | 572 | 428 | ||||||||||||||||||||||||
| Noninterest expense | 7,934 | 6,932 | 7,444 | 6,721 | 6,266 | ||||||||||||||||||||||||
| Income before income taxes | 4,019 | 4,060 | 3,326 | 3,500 | 2,917 | ||||||||||||||||||||||||
| Provision for income taxes | 782 | 803 | 911 | 1,058 | 794 | ||||||||||||||||||||||||
| Net income | 3,237 | 3,257 | 2,415 | 2,442 | 2,123 | ||||||||||||||||||||||||
| Noncontrolling interest | 13 | 20 | 21 | 16 | 39 | ||||||||||||||||||||||||
| Preferred stock dividends | 196 | 174 | 174 | 167 | 148 | ||||||||||||||||||||||||
| Net income available to common shareholders | 3,028 | 3,063 | 2,220 | 2,259 | 1,936 | ||||||||||||||||||||||||
| Per Common Share: | |||||||||||||||||||||||||||||
| Basic EPS | $ | 3.76 | $ | 3.96 | $ | 2.78 | $ | 2.81 | $ | 2.59 | |||||||||||||||||||
| Diluted EPS | 3.71 | 3.91 | 2.74 | 2.77 | 2.56 | ||||||||||||||||||||||||
| Cash dividends declared | 1.710 | 1.560 | 1.260 | 1.150 | 1.050 | ||||||||||||||||||||||||
| Common shareholders' equity | 45.66 | 35.46 | 34.01 | 33.14 | 31.66 | ||||||||||||||||||||||||
| Average Balances: | |||||||||||||||||||||||||||||
| Total assets | $ | 247,494 | $ | 222,273 | $ | 221,065 | $ | 218,945 | $ | 197,347 | |||||||||||||||||||
| Securities, at amortized cost (3) | 50,645 | 47,100 | 46,029 | 46,279 | 42,103 | ||||||||||||||||||||||||
| Loans and leases (4) | 161,604 | 146,417 | 144,075 | 141,759 | 127,802 | ||||||||||||||||||||||||
| Deposits | 173,269 | 157,483 | 159,241 | 157,469 | 138,498 | ||||||||||||||||||||||||
| Long-term debt | 24,756 | 23,755 | 21,660 | 22,791 | 23,343 | ||||||||||||||||||||||||
| Shareholders' equity | 34,108 | 29,743 | 30,001 | 29,355 | 25,871 | ||||||||||||||||||||||||
| Period-End Balances: | |||||||||||||||||||||||||||||
| Total assets | $ | 473,078 | $ | 225,697 | $ | 221,642 | $ | 219,276 | $ | 209,947 | |||||||||||||||||||
| Securities (5) | 74,727 | 45,590 | 47,574 | 43,606 | 43,827 | ||||||||||||||||||||||||
| Loans and leases (4) | 308,215 | 150,001 | 144,800 | 145,038 | 136,986 | ||||||||||||||||||||||||
| Deposits | 334,727 | 161,199 | 157,371 | 160,234 | 149,124 | ||||||||||||||||||||||||
| Long-term debt | 41,339 | 23,709 | 23,648 | 21,965 | 23,769 | ||||||||||||||||||||||||
| Shareholders' equity | 66,558 | 30,178 | 29,695 | 29,926 | 27,340 | ||||||||||||||||||||||||
| Selected Ratios: | |||||||||||||||||||||||||||||
| NIM | 3.42 | % | 3.46 | % | 3.46 | % | 3.39 | % | 3.32 | % | |||||||||||||||||||
| Rate of return on: | |||||||||||||||||||||||||||||
| Average total assets | 1.31 | 1.47 | 1.09 | 1.12 | 1.08 | ||||||||||||||||||||||||
| Average common shareholders' equity | 9.87 | 11.50 | 8.25 | 8.57 | 8.34 | ||||||||||||||||||||||||
| Average total shareholders' equity | 9.49 | 10.95 | 8.05 | 8.32 | 8.21 | ||||||||||||||||||||||||
|
Average total shareholders' equity to average total assets
|
13.78 | 13.38 | 13.57 | 13.41 | 13.11 | ||||||||||||||||||||||||
(1) Revenue is defined as net interest income plus noninterest income.
(2) TE adjustment is based on the federal income tax rate.
(3) Include AFS and HTM securities.
(4) Loans and leases are net of unearned income and include LHFS.
(5) Include AFS securities at fair value and HTM securities at amortized cost.
36 Truist Financial Corporation
ITEM 7. MANAGEMENT'S DISCUSSION AND ANALYSIS OF FINANCIAL CONDITION AND RESULTS OF OPERATIONS
Introduction
This MD&A is intended to assist readers in their analysis of the accompanying Consolidated Financial Statements and supplemental financial information. It should be read in conjunction with the Consolidated Financial Statements and accompanying Notes to the Consolidated Financial Statements in this Form 10-K, as well as with the other information contained in this document.
Executive Overview
Overview of Recent Events and Financial Results
Recent Events
Effective December 6, 2019, the Company completed the Merger. Upon closing, each SunTrust share was exchanged for 1.295 shares of BB&T stock. In connection with the Merger, the Company changed its name from BB&T Corporation to Truist Financial Corporation. Reported results for Truist reflect heritage BB&T prior to the completion of the Merger and results from both BB&T and SunTrust from the Merger closing date forward. Period end balances reflect the combined companies. Significant Merger updates include:
•
In July 2019, BB&T and SunTrust announced the Truist Bank Community Benefits Plan under which the combined company will lend or invest $60 billion to low and moderate-income borrowers and communities over a three-year period from 2020 to 2022.
•
In November 2019, the Department of Justice completed its anti-trust review and the Company received all remaining regulatory approvals. As a condition for the Merger, the Company announced an agreement to divest 30 SunTrust branches in North Carolina, Virginia and Georgia. The divestiture includes approximately $2.4 billion in deposits and approximately $400 million in loans.
•
On December 11, 2019, Truist announced its planned purchase of the new headquarters building, Hearst Tower, in Charlotte, NC. The deal is expected to close in the first half of 2020. The building will be renamed Truist Center.
•
In January 2020, Truist officially launched the Truist brand and visual identity, and Truist’s purpose: “Inspire and build better lives and communities,” along with its mission and values.
Financial Results
Net income available to common shareholders totaled $3.0 billion for 2019, a 1.1% decrease from the prior year. On a diluted per common share basis, earnings for 2019 were $3.71, compared to $3.91 for 2018. Truist's results of operations for 2019 produced a return on average assets of 1.31% and a return on average common shareholders' equity of 9.87% compared to prior year ratios of 1.47% and 11.50%, respectively. Results include merger-related and restructuring charges of $360 million ($285 million after-tax) for 2019 compared to $146 million ($111 million after-tax) for 2018. Additionally, the 2019 results include incremental operating expenses related to the Merger of $164 million ($127 million after-tax), securities losses of $116 million ($90 million after-tax), a reduction in net income available to common shareholders of $46 million arising from the redemption of preferred stock, partially offset by a $14 million after-tax net gain from the sale of residential mortgage loans.
Truist's revenue for 2019 was $12.6 billion. On a TE basis, revenue was $12.7 billion, which represents an increase of $1.0 billion compared to 2018. Net interest income on a TE basis was $7.4 billion, an increase of $631 million compared to the prior year, which reflects a $1.3 billion increase in interest income and a $658 million increase in interest expense. The increase in net interest income was due primarily to a $15.2 billion increase in average outstanding loans, a $3.5 billion increase in average securities coupled with a 19 basis point increase in earning asset yields.
NIM was 3.42% for 2019, down 4 basis points compared to the prior year. Average earning assets increased $20.6 billion or 10.5%, while average interest-bearing liabilities increased $17.6 billion, or 13.2%, and noninterest-bearing deposits increased $1.7 billion, or 3.1%. The annualized TE yield on the total loan portfolio for 2019 was 4.99%, up 22 basis points compared to the prior year. The annualized TE yield on the average securities portfolio was 2.62%, up 13 basis points compared to the prior year.
The provision for credit losses was $615 million, compared to $566 million for the prior year. Net charge-offs for 2019 were $634 million, compared to $524 million for the prior year. The ratio of the ALLL to net charge-offs was 2.44X for 2019, compared to 2.98X in 2018. NPAs increased $99 million year over year, including NPAs from the Merger of $107 million that are classified as LHFS, $63 million for loans HFI and $63 million for other nonperforming assets, offset by NPL sales.
Truist Financial Corporation 37
Noninterest income increased $379 million for the year, driven by improvements in the majority of categories, partially offset by securities losses of $116 million and a decrease in other income of $39 million. Approximately $217 million of the increase in noninterest income is due to the contribution from the Merger. Additional increases in noninterest income were primarily due to higher insurance income driven by improved production levels and the acquisition of Regions Insurance, as well as higher investment banking and trading income. Noninterest expense increased $1.0 billion for the year. Excluding merger-related and restructuring charges and other incremental operating expenses related to the Merger, noninterest expense increased $624 million. Approximately $400 million of the $624 million variance was the result of noninterest expense associated with merged operations. The residual variance was primarily due to an increase in personnel expense.
Truist's total assets at December 31, 2019 were $473.1 billion, an increase of $247.4 billion compared to December 31, 2018. The Merger contributed $235.7 billion in total assets, including $154.0 billion in loans and leases. Refer to "Note 2. Business Combinations" for additional details related to the opening balances from the Merger.
The Company has undertaken a number of strategic actions to enhance the credit quality and manage interest-rate sensitivity of its loan and lease portfolio. During the third quarter of 2019, management sold a $4.3 billion residential mortgage loan portfolio. This sale was followed by a number of balance sheet restructuring actions taken in the fourth quarter of 2019, including the transfer of:
•
$2.5 billion of residential mortgage loans to LHFS;
•
$356 million of commercial loans to LHFS as a result of a decision to exit a business; and
•
$381 million of mortgage, consumer and commercial loans to LHFS related to the forthcoming branch divestiture arising from the Merger.
In addition, $1.4 billion of commercial exposures, of which $516 million were funded, were included in the LHFS portfolio of SunTrust at the Merger date.
Additionally, during the fourth quarter of 2019, management sold $33.2 billion of securities in order to improve yield and reduce premium amortization risk and reinvested the proceeds primarily in securities to position the Company to meet the new tailored LCR requirements. The Company also transferred the securities previously classified as HTM to AFS in response to changes in regulatory capital rules.
Total deposits at December 31, 2019 were $334.7 billion, an increase of $173.5 billion from the prior year. The Merger contributed $170.7 billion in total deposits. The average cost of total deposits for 2019 was 0.64%, an increase of 23 basis points compared to the prior year. The average cost of interest-bearing deposits for 2019 was 0.93%, up 31 basis points compared to the prior year.
Total shareholders' equity was $66.6 billion at December 31, 2019, up $36.4 billion compared to the prior year. Equity issued in connection with the Merger was $33.5 billion and net income in excess of dividends paid was $1.8 billion. Additionally, the Company issued $1.7 billion of preferred stock during the year and redeemed a similar amount from two higher-cost issuances. In connection with the redemptions, net income available to common shareholders was reduced by $46 million to recognize the difference in the redemption price and the carrying value. Truist's Tier 1 risk-based capital and total risk-based capital ratios at December 31, 2019 were 10.8% and 12.6%, respectively, compared to 11.8% and 13.8% at December 31, 2018, respectively. The CET1 ratio was 9.5% at December 31, 2019 compared to 10.2% in the prior year.
Key Challenges
Truist's business is dynamic and complex. Consequently, management annually evaluates and, as necessary, adjusts the Company's business strategy in the context of the current operating environment. During this process, management considers the current financial condition and performance of the Company and its expectations for future economic activity from both a national and local market perspective. Achieving key strategic objectives and established long-term financial goals is subject to many uncertainties and challenges. In the opinion of management, the following challenges are the most likely to impact Truist’s near to medium term performance:
•
Achieving the potential benefits from the Merger, including anticipated synergies and cost savings;
•
Managing the integration of systems and operations, while safeguarding the Company against external threats;
•
Executing the Company’s “T3 strategy” by focusing on personal touch and technology to engender trust and provide distinctive, secure and successful client experiences;
•
Driving innovation and remaining attuned to evolving client preferences to succeed in an intensely competitive environment;
•
Retaining key personnel and activating the Company’s culture of striving to make things better for its clients, teammates and stakeholders; and
•
Navigating global economic and geopolitical risks and ensuring that the Company is well positioned for changes in the credit cycle.
In addition, certain other challenges and unforeseen events could have a near term impact on Truist's financial condition and results of operations. See the sections titled "Forward-Looking Statements" and "Risk Factors" for additional examples of such challenges.
38 Truist Financial Corporation
Analysis of Results of Operations
Net Interest Income and NIM
2019 compared to 2018
Net interest income on a TE basis was $7.4 billion for the year ended December 31, 2019, an increase of $631 million compared to the same period in 2018. Interest income increased $1.3 billion, which reflects both earning asset growth and higher earning asset yields. Interest expense increased $658 million due primarily to higher funding costs reflecting the lagged impact of 2018 increases in the federal funds rate.
Net interest margin was 3.42% for the year ended December 31, 2019, down four basis points compared to the same period of 2018. Loan yields during 2019 averaged 4.99%, up 22 basis points year over year. The increase was due primarily to the lagged effect of rate increases in 2018. The yield on the average securities portfolio for the year ended December 31, 2019 was 2.62%, up 13 basis points compared to the same period of 2018 aided by the portfolio restructurings during 2019.
Average earning assets for 2019 were $216.4 billion, up $20.6 billion compared to 2018, driven by an increase in total loans and leases of $15.2 billion and an increase in securities of $3.5 billion.
The average cost of total deposits for the year ended December 31, 2019 was 0.64%, up 23 basis points compared to 2018. The average cost of interest-bearing deposits was 0.93% in 2019, up 31 basis points compared to the prior year. The average rate on short-term borrowings and long-term debt increased 48 and 34 basis points, respectively, to 2.34% and 3.22% during 2019. Average interest-bearing liabilities were $151.0 billion for the year ended December 31, 2019, up $17.6 billion compared to 2018 driven by a $14.1 billion increase in interest-bearing deposits and a $2.5 billion increase in short-term borrowings.
Upon completion of the Merger, the merged SunTrust loan portfolio was marked to fair value in accordance with GAAP. The below table includes the associated fair value marks by loan category, together with the Company's current expectation for when half of each fair value mark will be accreted into interest income. Current period results reflect $141 million of loan mark accretion arising from the Merger. As discussed in "Note 2. Business Combinations", the Company's purchase price allocation is preliminary and related fair value estimates are subject to change. Loan mark accretion may vary from period to period based on prepayments, which may shorten or extend the expected lives of the related loans and leases.
| (Dollars in millions) | C&I | Commercial Other | Mortgage | Consumer Other | PCI | ||||||||||||||||||||||||
|
Fair value mark at Dec 6, 2019
|
$ | (1,668) | $ | (288) | $ | (1,292) | $ | (840) | $ | (425) | |||||||||||||||||||
| Expected half-life of purchase accounting accretion | 1-2 years | 2-3 years | 5-7 years | 2-3 years | Varies | ||||||||||||||||||||||||
The major components of net interest income and the related annualized yields as well as the variances between the periods caused by changes in interest rates versus changes in volumes are summarized below.
Truist Financial Corporation 39
| Table 5: Taxable-Equivalent Net Interest Income and Rate / Volume Analysis (1) | |||||||||||||||||||||||||||||||||||||||||||||||||||||||||||||||||||||||||||||||||||||||||
| 2019 vs. 2018 | 2018 vs. 2017 | ||||||||||||||||||||||||||||||||||||||||||||||||||||||||||||||||||||||||||||||||||||||||
|
Year Ended December 31,
(Dollars in millions) |
Average Balances (5) | Yield/Rate | Income/Expense |
Incr.
(Decr.) |
Change due to |
Incr.
(Decr.) |
Change due to | ||||||||||||||||||||||||||||||||||||||||||||||||||||||||||||||||||||||||||||||||||
| 2019 | 2018 | 2017 | 2019 | 2018 | 2017 | 2019 | 2018 | 2017 | Rate | Volume | Rate | Volume | |||||||||||||||||||||||||||||||||||||||||||||||||||||||||||||||||||||||||||||
| Assets | |||||||||||||||||||||||||||||||||||||||||||||||||||||||||||||||||||||||||||||||||||||||||
| Total securities, at amortized cost: (2) | |||||||||||||||||||||||||||||||||||||||||||||||||||||||||||||||||||||||||||||||||||||||||
| U.S. Treasury | $ | 2,644 | $ | 3,800 | $ | 4,179 | 2.01 | % | 1.89 | % | 1.71 | % | $ | 53 | $ | 72 | $ | 72 | $ | (19) | $ | 4 | $ | (23) | $ | — | $ | 7 | $ | (7) | |||||||||||||||||||||||||||||||||||||||||||||||||||||||||||
| GSE | 2,402 | 2,394 | 2,385 | 2.26 | 2.23 | 2.22 | 53 | 54 | 53 | (1) | (1) | — | 1 | 1 | — | ||||||||||||||||||||||||||||||||||||||||||||||||||||||||||||||||||||||||||
| Agency MBS | 44,710 | 39,559 | 37,250 | 2.59 | 2.45 | 2.26 | 1,161 | 969 | 841 | 192 | 59 | 133 | 128 | 74 | 54 | ||||||||||||||||||||||||||||||||||||||||||||||||||||||||||||||||||||||||||
| States and political subdivisions | 587 | 958 | 1,748 | 3.73 | 3.68 | 4.77 | 21 | 35 | 83 | (14) | — | (14) | (48) | (16) | (32) | ||||||||||||||||||||||||||||||||||||||||||||||||||||||||||||||||||||||||||
| Non-agency MBS | 269 | 349 | 411 | 14.05 | 11.93 | 18.80 | 38 | 42 | 77 | (4) | 7 | (11) | (35) | (25) | (10) | ||||||||||||||||||||||||||||||||||||||||||||||||||||||||||||||||||||||||||
| Other | 33 | 40 | 56 | 3.75 | 3.34 | 2.17 | 1 | 1 | 1 | — | — | — | — | — | — | ||||||||||||||||||||||||||||||||||||||||||||||||||||||||||||||||||||||||||
| Total securities | 50,645 | 47,100 | 46,029 | 2.62 | 2.49 | 2.45 | 1,327 | 1,173 | 1,127 | 154 | 69 | 85 | 46 | 41 | 5 | ||||||||||||||||||||||||||||||||||||||||||||||||||||||||||||||||||||||||||
| Interest earning trading assets | 1,277 | 633 | 1,477 | 2.02 | 3.82 | 1.68 | 26 | 24 | 25 | 2 | (15) | 17 | (1) | 19 | (20) | ||||||||||||||||||||||||||||||||||||||||||||||||||||||||||||||||||||||||||
| Other earning assets (3) | 2,888 | 1,618 | 2,007 | 2.89 | 2.63 | 1.43 | 83 | 43 | 28 | 40 | 5 | 35 | 15 | 21 | (6) | ||||||||||||||||||||||||||||||||||||||||||||||||||||||||||||||||||||||||||
| Loans and leases, net of unearned income: (4) | |||||||||||||||||||||||||||||||||||||||||||||||||||||||||||||||||||||||||||||||||||||||||
| Commercial and industrial | 67,435 | 59,663 | 57,994 | 4.25 | 3.98 | 3.59 | 2,868 | 2,374 | 2,080 | 494 | 169 | 325 | 294 | 233 | 61 | ||||||||||||||||||||||||||||||||||||||||||||||||||||||||||||||||||||||||||
| CRE | 17,651 | 16,994 | 16,349 | 4.79 | 4.67 | 4.11 | 849 | 798 | 672 | 51 | 21 | 30 | 126 | 98 | 28 | ||||||||||||||||||||||||||||||||||||||||||||||||||||||||||||||||||||||||||
| Commercial Construction | 4,061 | 4,441 | 4,148 | 5.23 | 4.79 | 3.98 | 208 | 209 | 165 | (1) | 19 | (20) | 44 | 33 | 11 | ||||||||||||||||||||||||||||||||||||||||||||||||||||||||||||||||||||||||||
| Lease financing | 2,443 | 1,917 | 1,726 | 3.44 | 3.19 | 2.82 | 84 | 61 | 49 | 23 | 5 | 18 | 12 | 6 | 6 | ||||||||||||||||||||||||||||||||||||||||||||||||||||||||||||||||||||||||||
| Residential mortgage | 31,668 | 29,932 | 29,140 | 4.08 | 4.05 | 4.02 | 1,291 | 1,212 | 1,170 | 79 | 9 | 70 | 42 | 9 | 33 | ||||||||||||||||||||||||||||||||||||||||||||||||||||||||||||||||||||||||||
| Residential home equity and direct | 12,716 | 11,860 | 12,163 | 5.97 | 5.41 | 4.79 | 759 | 641 | 582 | 118 | 70 | 48 | 59 | 74 | (15) | ||||||||||||||||||||||||||||||||||||||||||||||||||||||||||||||||||||||||||
| Indirect auto | 12,545 | 11,215 | 12,388 | 8.51 | 8.18 | 7.27 | 1,068 | 917 | 901 | 151 | 38 | 113 | 16 | 106 | (90) | ||||||||||||||||||||||||||||||||||||||||||||||||||||||||||||||||||||||||||
| Indirect other | 6,654 | 5,896 | 5,452 | 6.65 | 6.25 | 6.05 | 443 | 368 | 329 | 75 | 25 | 50 | 39 | 11 | 28 | ||||||||||||||||||||||||||||||||||||||||||||||||||||||||||||||||||||||||||
| Student | 460 | — | — | 5.20 | — | — | 24 | — | — | 24 | — | 24 | — | — | — | ||||||||||||||||||||||||||||||||||||||||||||||||||||||||||||||||||||||||||
| Credit card | 3,181 | 2,723 | 2,467 | 9.05 | 8.73 | 8.26 | 288 | 238 | 204 | 50 | 9 | 41 | 34 | 12 | 22 | ||||||||||||||||||||||||||||||||||||||||||||||||||||||||||||||||||||||||||
| PCI | 631 | 548 | 784 | 16.05 | 19.64 | 18.86 | 102 | 108 | 148 | (6) | (21) | 15 | (40) | 6 | (46) | ||||||||||||||||||||||||||||||||||||||||||||||||||||||||||||||||||||||||||
| Total loans and leases HFI | 159,445 | 145,189 | 142,611 | 5.01 | 4.77 | 4.42 | 7,984 | 6,926 | 6,300 | 1,058 | 344 | 714 | 626 | 588 | 38 | ||||||||||||||||||||||||||||||||||||||||||||||||||||||||||||||||||||||||||
| LHFS | 2,159 | 1,228 | 1,464 | 3.91 | 4.13 | 3.62 | 85 | 50 | 53 | 35 | (3) | 38 | (3) | 7 | (10) | ||||||||||||||||||||||||||||||||||||||||||||||||||||||||||||||||||||||||||
| Total loans and leases | 161,604 | 146,417 | 144,075 | 4.99 | 4.77 | 4.41 | 8,069 | 6,976 | 6,353 | 1,093 | 341 | 752 | 623 | 595 | 28 | ||||||||||||||||||||||||||||||||||||||||||||||||||||||||||||||||||||||||||
| Total earning assets | 216,414 | 195,768 | 193,588 | 4.39 | 4.20 | 3.89 | 9,505 | 8,216 | 7,533 | 1,289 | 400 | 889 | 683 | 676 | 7 | ||||||||||||||||||||||||||||||||||||||||||||||||||||||||||||||||||||||||||
| Nonearning assets | 31,080 | 26,505 | 27,477 | ||||||||||||||||||||||||||||||||||||||||||||||||||||||||||||||||||||||||||||||||||||||
| Total assets | $ | 247,494 | $ | 222,273 | $ | 221,065 | |||||||||||||||||||||||||||||||||||||||||||||||||||||||||||||||||||||||||||||||||||
| Liabilities and Shareholders' Equity | |||||||||||||||||||||||||||||||||||||||||||||||||||||||||||||||||||||||||||||||||||||||||
| Interest-bearing deposits: | |||||||||||||||||||||||||||||||||||||||||||||||||||||||||||||||||||||||||||||||||||||||||
| Interest-checking | $ | 31,592 | $ | 26,951 | $ | 28,033 | 0.62 | 0.43 | 0.25 | 197 | 116 | 70 | 81 | 59 | 22 | 46 | 49 | (3) | |||||||||||||||||||||||||||||||||||||||||||||||||||||||||||||||||||||||
| Money market and savings | 67,922 | 62,257 | 63,061 | 0.91 | 0.62 | 0.30 | 621 | 387 | 190 | 234 | 196 | 38 | 197 | 199 | (2) | ||||||||||||||||||||||||||||||||||||||||||||||||||||||||||||||||||||||||||
| Time deposits | 17,970 | 13,963 | 14,133 | 1.54 | 0.94 | 0.51 | 277 | 132 | 72 | 145 | 100 | 45 | 60 | 61 | (1) | ||||||||||||||||||||||||||||||||||||||||||||||||||||||||||||||||||||||||||
| Foreign office deposits - interest-bearing | 272 | 494 | 1,142 | 2.35 | 1.67 | 1.05 | 6 | 9 | 12 | (3) | 2 | (5) | (3) | 6 | (9) | ||||||||||||||||||||||||||||||||||||||||||||||||||||||||||||||||||||||||||
| Total interest-bearing deposits (6) | 117,756 | 103,665 | 106,369 | 0.93 | 0.62 | 0.32 | 1,101 | 644 | 344 | 457 | 357 | 100 | 300 | 315 | (15) | ||||||||||||||||||||||||||||||||||||||||||||||||||||||||||||||||||||||||||
| Short-term borrowings | 8,462 | 5,955 | 4,311 | 2.34 | 1.86 | 0.94 | 198 | 111 | 41 | 87 | 33 | 54 | 70 | 50 | 20 | ||||||||||||||||||||||||||||||||||||||||||||||||||||||||||||||||||||||||||
| Long-term debt | 24,756 | 23,755 | 21,660 | 3.22 | 2.88 | 2.10 | 797 | 683 | 454 | 114 | 84 | 30 | 229 | 182 | 47 | ||||||||||||||||||||||||||||||||||||||||||||||||||||||||||||||||||||||||||
| Total interest-bearing liabilities | 150,974 | 133,375 | 132,340 | 1.39 | 1.08 | 0.63 | 2,096 | 1,438 | 839 | 658 | 474 | 184 | 599 | 547 | 52 | ||||||||||||||||||||||||||||||||||||||||||||||||||||||||||||||||||||||||||
| Noninterest-bearing deposits (6) | 55,513 | 53,818 | 52,872 | ||||||||||||||||||||||||||||||||||||||||||||||||||||||||||||||||||||||||||||||||||||||
| Other liabilities | 6,899 | 5,337 | 5,852 | ||||||||||||||||||||||||||||||||||||||||||||||||||||||||||||||||||||||||||||||||||||||
| Shareholders' equity | 34,108 | 29,743 | 30,001 | ||||||||||||||||||||||||||||||||||||||||||||||||||||||||||||||||||||||||||||||||||||||
| Total liabilities and shareholders' equity | $ | 247,494 | $ | 222,273 | $ | 221,065 | |||||||||||||||||||||||||||||||||||||||||||||||||||||||||||||||||||||||||||||||||||
| Average interest-rate spread | 3.00 | % | 3.12 | % | 3.26 | % | |||||||||||||||||||||||||||||||||||||||||||||||||||||||||||||||||||||||||||||||||||
| NIM/net interest income | 3.42 | % | 3.46 | % | 3.46 | % | $ | 7,409 | $ | 6,778 | $ | 6,694 | $ | 631 | $ | (74) | $ | 705 | $ | 84 | $ | 129 | $ | (45) | |||||||||||||||||||||||||||||||||||||||||||||||||||||||||||||||||
| Taxable-equivalent adjustment | $ | 96 | $ | 96 | $ | 159 | |||||||||||||||||||||||||||||||||||||||||||||||||||||||||||||||||||||||||||||||||||
(1) Yields are stated on a TE basis utilizing federal tax rate. The change in interest not solely due to changes in rate or volume has been allocated on a pro-rata basis based on the absolute dollar amount of each.
(2) Total securities include AFS and HTM securities.
(3) Includes cash equivalents, interest-bearing deposits with banks, FHLB stock and other earning assets.
(4) Loan fees, which are not material for any of the periods shown, are included for rate calculation purposes. NPLs are included in the average balances.
(5) Excludes basis adjustments for fair value hedges.
(6) Total deposit costs were 0.64%, 0.41% and 0.22% for the years ended December 31, 2019, 2018 and 2017, respectively.
40 Truist Financial Corporation
Provision for Credit Losses
2019 compared to 2018
The provision for credit losses totaled $615 million for the year ended December 31, 2019, compared to $566 million for 2018. Net charge-offs for the year ended December 31, 2019 were $634 million, compared to $524 million for 2018.
Net charge-offs were 0.40% of average loans and leases for the year ended December 31, 2019, compared to 0.36% of average loans and leases for 2018. The increase in net charge-offs was primarily related to credit cards, indirect auto and CRE.
Noninterest Income
Noninterest income is a significant contributor to Truist's financial results. Management focuses on diversifying its sources of revenue to further reduce Truist's reliance on traditional spread-based interest income, as certain fee-based activities are a relatively stable revenue source during periods of changing interest rates.
| Table 6: Noninterest Income | |||||||||||||||||||||||||||||
| % Change | |||||||||||||||||||||||||||||
|
Year Ended December 31,
(Dollars in millions) |
2019 | 2018 | 2017 | 2019 vs. 2018 | 2018 vs. 2017 | ||||||||||||||||||||||||
| Insurance income | $ | 2,072 | $ | 1,852 | $ | 1,754 | 11.9 | % | 5.6 | % | |||||||||||||||||||
| Service charges on deposits | 762 | 712 | 706 | 7.0 | 0.8 | ||||||||||||||||||||||||
| Wealth management income | 715 | 660 | 594 | 8.3 | 11.1 | ||||||||||||||||||||||||
| Card and payment related fees | 555 | 522 | 501 | 6.3 | 4.2 | ||||||||||||||||||||||||
| Residential mortgage income | 285 | 258 | 309 | 10.5 | (16.5) | ||||||||||||||||||||||||
| Investment banking and trading income | 244 | 154 | 203 | 58.4 | (24.1) | ||||||||||||||||||||||||
| Operating lease income | 153 | 145 | 146 | 5.5 | (0.7) | ||||||||||||||||||||||||
| Income from bank-owned life insurance | 129 | 116 | 122 | 11.2 | (4.9) | ||||||||||||||||||||||||
| Lending related fees | 124 | 99 | 101 | 25.3 | (2.0) | ||||||||||||||||||||||||
| Commercial real estate related income | 116 | 100 | 106 | 16.0 | (5.7) | ||||||||||||||||||||||||
| Securities gains (losses), net | (116) | 3 | (1) | NM | NM | ||||||||||||||||||||||||
| Other income | 216 | 255 | 241 | (15.3) | 5.8 | ||||||||||||||||||||||||
| Total noninterest income | $ | 5,255 | $ | 4,876 | $ | 4,782 | 7.8 | 2.0 | |||||||||||||||||||||
2019 compared to 2018
Noninterest income for the year ended December 31, 2019 was $5.3 billion, up $379 million compared to 2018. Approximately $217 million of the increase was due to the contribution from the Merger.
Insurance income was $2.1 billion, up $220 million compared to 2018 due to higher production levels and insurance acquisitions, which contributed $80 million in 2019.
Investment banking and trading income was $244 million, up $90 million compared to 2018. Merged operations contributed $54 million and increased client derivative activities contributed $24 million towards the variance.
Residential mortgage income was $285 million, up $27 million compared to 2018 due to an increase in net MSRs valuation adjustments, partially offset by lower production-related revenues due to lower sales volumes prior to the Merger.
The increases in noninterest income were partially offset by $116 million in losses arising from the sale of $33.2 billion of securities.
Truist Financial Corporation 41
Noninterest Expense
The following table provides a breakdown of Truist's noninterest expense:
| Table 7: Noninterest Expense | |||||||||||||||||||||||||||||
| % Change | |||||||||||||||||||||||||||||
|
Year Ended December 31,
(Dollars in millions) |
2019 | 2018 | 2017 | 2019 vs. 2018 | 2018 vs. 2017 | ||||||||||||||||||||||||
| Personnel expense | $ | 4,833 | $ | 4,313 | $ | 4,226 | 12.1 | % | 2.1 | % | |||||||||||||||||||
| Net occupancy expense | 507 | 491 | 538 | 3.3 | (8.7) | ||||||||||||||||||||||||
| Professional fees and outside processing | 433 | 365 | 369 | 18.6 | (1.1) | ||||||||||||||||||||||||
| Software expense | 338 | 272 | 242 | 24.3 | 12.4 | ||||||||||||||||||||||||
| Equipment expense | 280 | 267 | 246 | 4.9 | 8.5 | ||||||||||||||||||||||||
| Marketing and customer development | 137 | 102 | 94 | 34.3 | 8.5 | ||||||||||||||||||||||||
| Depreciation - property under operating leases | 136 | 120 | 120 | 13.3 | — | ||||||||||||||||||||||||
| Loan-related expense | 123 | 108 | 130 | 13.9 | (16.9) | ||||||||||||||||||||||||
| Amortization of intangibles | 164 | 131 | 142 | 25.2 | (7.7) | ||||||||||||||||||||||||
| Regulatory costs | 81 | 134 | 153 | (39.6) | (12.4) | ||||||||||||||||||||||||
| Merger-related and restructuring charges, net | 360 | 146 | 115 | 146.6 | 27.0 | ||||||||||||||||||||||||
| Other expense | 542 | 483 | 677 | 12.2 | (28.7) | ||||||||||||||||||||||||
| Total noninterest expense | $ | 7,934 | $ | 6,932 | $ | 7,444 | 14.5 | (6.9) | |||||||||||||||||||||
2019 compared to 2018
Noninterest expense totaled $7.9 billion for the year ended December 31, 2019, an increase of $1.0 billion, or 14.5%, from 2018. Merger-related and restructuring expense was $360 million, up $214 million due primarily to the Merger and the decision to exit a business. Additionally, the year ended December 31, 2019 included $164 million of incremental operating expenses related to the Merger. Excluding these items, noninterest expense was up $624 million, of which approximately $400 million was due to noninterest expenses from the merged operations.
Personnel expense was $4.8 billion for the year ended December 31, 2019, an increase of $520 million compared to 2018. The increase includes $227 million related to personnel expenses of the merged operations and $123 million in incremental operating expenses related to the Merger as well as a $157 million increase in production-based and other incentives, including the impact from the Regions Insurance acquisition.
Marketing and customer development expense increased $35 million due to higher household growth initiative expenses and merged operations.
Amortization of intangibles increased $33 million primarily due to the new intangibles created in the Merger.
Other expense increased $59 million primarily due to the merged operations and higher pension expense.
The increases in noninterest expense were partially offset by a decrease in regulatory charges of $53 million due largely to the DIF reaching the targeted level.
42 Truist Financial Corporation
Merger-Related and Restructuring Charges
Truist has incurred certain merger-related and restructuring charges, which include:
•
severance and personnel-related costs or credits;
•
occupancy and equipment charges or credits, which relate to costs or gains associated with lease terminations, obsolete equipment write-offs and the sale of duplicate facilities and equipment;
•
professional services, which relate to legal and investment banking advisory fees and other consulting services pertaining to restructuring initiatives or transactions;
•
systems conversion and related charges, which represent costs to integrate the entity's information technology systems;
•
other merger-related and restructuring charges or credits, which include expenses necessary to convert and combine the acquired branches and operations of merged companies, direct media advertising related to the mergers and acquisitions, asset and supply inventory write-offs, and other similar charges; and
•
writes-offs related to exiting certain businesses.
Merger-related and restructuring accruals are established when the costs are incurred or once all requirements for a plan to dispose of or outsource certain business functions have been approved by management. Merger and restructuring accruals are re-evaluated periodically and adjusted as necessary. The remaining accruals at December 31, 2019 are generally expected to be utilized within one year, unless they relate to specific contracts that expire later.
The 2019 merger-related and restructuring costs primarily reflect higher charges as a result of the Merger, including costs for severance and other benefits and costs related to exiting facilities, while the 2018 costs primarily reflect branch closures and other restructuring initiatives.
The following table presents a summary of merger-related and restructuring charges and the related accruals:
| Table 8: Merger-Related and Restructuring Accrual Activity | |||||||||||||||||||||||||||||||||||||||||
| (Dollars in millions) | Accrual at Jan 1, 2018 | Expense | Utilized | Accrual at Dec 31, 2018 | Expense (2) | Utilized | Accrual at Dec 31, 2019 (2) | ||||||||||||||||||||||||||||||||||
| Severance and personnel-related | $ | 14 | $ | 61 | $ | (32) | $ | 43 | $ | 149 | $ | (146) | $ | 46 | |||||||||||||||||||||||||||
| Occupancy and equipment (1) | 20 | 63 | (60) | N/A | 13 | (13) | N/A | ||||||||||||||||||||||||||||||||||
| Professional services | — | 4 | (3) | 1 | 102 | (61) | 42 | ||||||||||||||||||||||||||||||||||
|
Systems conversion and related costs
|
— | 5 | (5) | — | 4 | (4) | — | ||||||||||||||||||||||||||||||||||
| Other adjustments | — | 13 | (13) | — | 92 | (91) | 1 | ||||||||||||||||||||||||||||||||||
| Total | $ | 34 | $ | 146 | $ | (113) | $ | 44 | $ | 360 | $ | (315) | $ | 89 | |||||||||||||||||||||||||||
(1) Certain lease reserves are no longer required as a result of new lease accounting guidance adopted in the first quarter of 2019. See additional information in "Note 1. Basis of Presentation."
(2) Includes $298 million of expense for 2019 and $76 million of accrued expenses at December 31, 2019, respectively, for the Merger.
Segment Results
Effective at the close of the Merger, several business activities were realigned within the segments. See "Note 21. Operating Segments" for additional disclosures related to Truist's operating segments, the internal accounting and reporting practices used to manage these segments and financial disclosures for these segments, including additional details related to results of operations.
| Table 9: Net Income by Reportable Segment | |||||||||||||||||||||||||||||
| % Change | |||||||||||||||||||||||||||||
|
Year Ended December 31,
(Dollars in millions) |
2019 | 2018 | 2017 | 2019 vs. 2018 | 2018 vs. 2017 | ||||||||||||||||||||||||
| Consumer Banking and Wealth | $ | 1,712 | $ | 1,488 | $ | 1,070 | 15.1 | % | 39.1 | % | |||||||||||||||||||
| Corporate and Commercial Banking | 1,841 | 1,546 | 1,170 | 19.1 | 32.1 | ||||||||||||||||||||||||
| Insurance Holdings | 319 | 253 | 161 | 26.1 | 57.1 | ||||||||||||||||||||||||
| Other, Treasury & Corporate | (635) | (30) | 14 | NM | NM | ||||||||||||||||||||||||
| Truist Financial Corporation | $ | 3,237 | $ | 3,257 | $ | 2,415 | (0.6) | 34.9 | |||||||||||||||||||||
Truist Financial Corporation 43
2019 compared to 2018
Consumer Banking and Wealth
Consumer Banking and Wealth had 2,958 banking offices at December 31, 2019, an increase of 1,079 offices compared to December 31, 2018. The increase in offices was driven primarily by the Merger, partially offset by the consolidation of nearby financial centers and closure of certain lower volume branches prior to the Merger.
Consumer Banking and Wealth net income was $1.7 billion, an increase of $224 million, or 15.1%, compared to 2018. Segment net interest income increased $577 million driven by average loan growth, higher funding spreads on deposits and the Merger. Noninterest income increased $161 million due primarily to an increase in service charges on deposits, wealth management income, checkcard fees and the Merger. Noninterest expense increased $449 million driven by higher personnel expense, amortization of intangibles, merger-related charges and allocated corporate expenses primarily attributable to the Merger, as well as higher operating charge-offs and pension expense, excluding service costs. The allocated provision for income taxes increased $58 million due primarily to higher pre-tax income.
Consumer Banking and Wealth average loans and leases HFI increased $6.9 billion, or 10.8%, compared to 2018 driven primarily by the Merger, mortgage warehouse loans and indirect auto loans. Average loan and leases HFI for mortgage, indirect auto, and home equity and direct lending increased $1.7 billion, or 5.8%, $1.3 billion, or 11.9%, and $891 million, or 7.5%, respectively.
Consumer Banking and Wealth average total deposits increased $8.4 billion, or 10.1%, compared to 2018 driven primarily by the Merger, money market and savings accounts, and noninterest-bearing deposits. Average noninterest-bearing deposits, money market and savings accounts, and time deposits increased $2.4 billion, or 14.0%, $4.0 billion, or 10.6%, and $1.3 billion, or 11.6%, respectively.
Client assets under administration totaled $349.7 billion as of December 31, 2019, an increase of $190.2 billion, or 119.2%, compared to 2018, primarily due to the Merger.
Corporate and Commercial Banking
Corporate and Commercial Banking net income was $1.8 billion for 2019, an increase of $295 million, or 19.1%, compared to 2018. Segment net interest income increased $302 million, driven by higher funding spreads on deposits, organic loan growth and the Merger, partially offset by lower credit spreads on loans. Noninterest income increased $161 million primarily due to the Merger and higher revenue from client derivatives, loan fees and gains on finance leases, partially offset by tax credit valuation adjustments and lower private equity investment income. Noninterest expense increased $190 million driven by higher personnel expense, merger-related charges, and amortization of intangibles primarily attributable to the Merger as well as lower credits for capitalized employee costs. The allocated provision for income taxes decreased $13 million primarily due to higher tax credits.
Corporate and Commercial Banking average loans and leases HFI increased $7.3 billion, or 9.3%, compared to 2018 driven primarily by the Merger and growth in corporate loans. Average loan and leases HFI for the Corporate and Institutional Group increased $5.4 billion, or 21.8%, driven primarily by commercial and industrial loans, and lease financing, while average loans and leases HFI for Commercial Community Banking increased $1.8 billion, or 3.5%, driven primarily by commercial and industrial loans.
Corporate and Commercial Banking average total deposits increased $4.3 billion, or 6.3%, compared to 2018 driven primarily by the Merger and Commercial Community Banking money market savings accounts. Average interest checking increased $3.7 billion, or 41.0%, and average money market and savings increased $981 million, or 4.2%, while average noninterest-bearing deposits declined $653 million, or 1.8%.
Insurance Holdings
Insurance Holdings net income was $319 million in 2019, an increase of $66 million, or 26.1%, compared to 2018. Noninterest income increased $240 million primarily due to the acquisition of Regions Insurance, which contributed $78 million, and organic growth in commercial property and casualty and life insurance commissions. Noninterest expense increased $162 million driven by higher salaries, commission-based incentives, the acquisition of Regions Insurance and merger-related and restructuring charges.
44 Truist Financial Corporation
Other, Treasury and Corporate
Other, Treasury and Corporate generated a net loss of $635 million in 2019, compared to a net loss of $30 million in 2018. Segment net interest income decreased $264 million driven by an increase in the net credit for funds provided to other operating segments, an increase in average balances and rates for long-term debt and short-term borrowings, partially offset by an increase in average balances and rates for securities. Noninterest income decreased $183 million due primarily to losses on the sale of securities and lower hedge and client derivative income, partially offset by an increase in income related to certain post-employment benefits. The allocated provision for credit losses increased $45 million driven primarily by an increase in the provision for unfunded commitments and purchased credit-impaired loans compared to 2018. Noninterest expense increased $201 million driven by the Merger, merger-related charges, lower credits for capitalized employee costs and an increase in expense related to certain post-retirement benefits, partially offset by lower restructuring charges. The benefit for income taxes increased $88 million due primarily to an increase in the pre-tax loss, partially offset by a lower tax benefit from discrete items compared to 2018.
Analysis of Financial Condition
Investment Activities
Truist Board-approved investment policy is carried out by the MRLCC, which meets regularly to review the economic environment and establish investment strategies. The MRLCC also has much broader responsibilities, which are discussed in the "Market Risk Management" section in MD&A.
Investment strategies are reviewed by the MRLCC based on the interest rate environment, balance sheet mix, actual and anticipated loan demand, funding opportunities and the overall interest rate sensitivity of the Company. In general, the goals of the investment portfolio are: (i) to provide a sufficient margin of liquid assets to meet unanticipated deposit and loan fluctuations and overall funds management objectives; (ii) to provide eligible securities to secure public funds, trust deposits and other borrowings; and (iii) to earn an optimal return on funds invested commensurate with meeting the requirements of (i) and (ii) and consistent with our risk appetite.
Truist Bank invests in securities allowable under bank regulations. These securities may include obligations of the U.S. Treasury, U.S. government agencies, GSEs (including MBS), bank eligible obligations of any state or political subdivision, non-agency MBS, structured notes, bank eligible corporate obligations (including corporate debentures), commercial paper, negotiable CDs, bankers acceptances, mutual funds and limited types of equity securities.
| Table 10: Composition of Securities Portfolio | |||||||||||
|
December 31,
(Dollars in millions) |
2019 | 2018 | |||||||||
| AFS securities (at fair value): | |||||||||||
| U.S. Treasury | $ | 2,276 | $ | 3,441 | |||||||
| GSE | 1,881 | 200 | |||||||||
| Agency MBS - residential | 68,236 | 19,426 | |||||||||
| Agency MBS - commercial | 1,341 | 729 | |||||||||
| States and political subdivisions | 585 | 701 | |||||||||
| Non-agency MBS | 368 | 505 | |||||||||
| Other | 40 | 36 | |||||||||
| Total AFS securities | 74,727 | 25,038 | |||||||||
| HTM securities (at amortized cost): | |||||||||||
| U.S. Treasury | — | 1,099 | |||||||||
| GSE | — | 2,199 | |||||||||
| Agency MBS - residential | — | 17,248 | |||||||||
| States and political subdivisions | — | 5 | |||||||||
| Other | — | 1 | |||||||||
| Total HTM securities | — | 20,552 | |||||||||
| Total securities | $ | 74,727 | $ | 45,590 | |||||||
The securities portfolio totaled $74.7 billion at December 31, 2019, compared to $45.6 billion at December 31, 2018. The increase in the securities portfolio was due primarily to the Merger, which contributed $31.0 billion in AFS securities. During the fourth quarter of 2019, the Company transferred the securities previously classified as HTM to AFS in response to changes in regulatory capital rules. Additionally, during the fourth quarter of 2019, the Company sold $33.2 billion of securities to improve yield and lower premium amortization risk resulting in $116 million in securities losses. The majority of the proceeds were reinvested in new securities to achieve the desired level of AFS securities for Truist.
Truist Financial Corporation 45
As of December 31, 2019, approximately 3.6% of the securities portfolio was variable rate, compared to 6.5% as of December 31, 2018. The effective duration of the securities portfolio excluding certain non-agency MBS was 4.7 years at December 31, 2019, compared to 4.8 years at December 31, 2018.
U.S. Treasury, GSE and Agency MBS represented 98.7% of the total securities portfolio as of December 31, 2019, compared to 97.3% as of the prior year end.
The following table presents the securities portfolio at December 31, 2019, segregated by major category of security holdings with ranges of maturities and average yields disclosed:
| Table 11: Securities Yields by Major Category and Maturity | ||||||||||||||
|
December 31, 2019
(Dollars in millions) |
AFS | |||||||||||||
| Fair Value | Effective Yield (1) | |||||||||||||
| U.S. Treasury: | ||||||||||||||
| Within one year | $ | 1,367 | 2.26 | % | ||||||||||
| One to five years | 893 | 1.46 | ||||||||||||
| Five to ten years | 16 | 1.73 | ||||||||||||
| Total | 2,276 | 1.94 | ||||||||||||
| GSE: | ||||||||||||||
| One to five years | 1,800 | 2.30 | ||||||||||||
| After ten years | 81 | 3.03 | ||||||||||||
| Total | 1,881 | 2.33 | ||||||||||||
| Agency MBS - residential: (2) | ||||||||||||||
| One to five years | 1 | 3.73 | ||||||||||||
| Five to ten years | 554 | 2.43 | ||||||||||||
| After ten years | 67,681 | 2.79 | ||||||||||||
| Total | 68,236 | 2.78 | ||||||||||||
| Agency MBS - commercial: (2) | ||||||||||||||
| One to five years | 1 | 2.80 | ||||||||||||
| Five to ten years | 10 | 2.86 | ||||||||||||
| After ten years | 1,330 | 2.64 | ||||||||||||
| Total | 1,341 | 2.64 | ||||||||||||
| States and political subdivisions: | ||||||||||||||
| Within one year | 35 | 3.40 | ||||||||||||
| One to five years | 100 | 3.29 | ||||||||||||
| Five to ten years | 226 | 3.57 | ||||||||||||
| After ten years | 224 | 3.71 | ||||||||||||
| Total | 585 | 3.57 | ||||||||||||
| Non-agency MBS: (2) | ||||||||||||||
| After ten years | 368 | 14.86 | ||||||||||||
| Other: | ||||||||||||||
| Within one year | 2 | 3.45 | ||||||||||||
| One to five years | 7 | 3.43 | ||||||||||||
| Five to ten years | 1 | 2.93 | ||||||||||||
| After ten years | 30 | 3.36 | ||||||||||||
| Total | 40 | 3.36 | ||||||||||||
| Total securities | $ | 74,727 | 2.81 | |||||||||||
(1) Yields represent interest computed under the effective interest method on a TE basis using the federal income tax rate and the amortized cost of the securities.
(2) For purposes of the maturity table, MBS, which are not due at a single maturity date, have been included in maturity groupings based on the contractual maturity. The expected life of MBS will differ from contractual maturities because borrowers may have the right to call or prepay the underlying mortgage loans.
46 Truist Financial Corporation
Lending Activities
Truist strives to meet the credit needs of its clients while pursuing a balanced strategy of loan profitability, loan growth and loan quality. Management believes that this purpose can best be accomplished by building strong client relationships over time and developing in-depth local market knowledge. Truist's lending process adheres to a consistent company-wide credit culture. The Company employs strict underwriting criteria governing the degree of risk assumed and the diversity of the loan portfolio in terms of type, industry and geographical concentration.
Truist lends to a diverse client base that is geographically dispersed to mitigate concentration risk arising from local and regional economic downturns. International loans were immaterial as of December 31, 2019 and 2018. The following discussion provides additional information on the Company's loan and lease portfolios. Refer to the "Risk Management" section for a discussion of the credit risk management policies used to manage the portfolios.
Commercial Loan and Lease Portfolio
Commercial loans and leases represent the largest category of the Company's loan and lease portfolio. C&CB generally targets small-to-middle market businesses with annual sales between $2 million and $500 million, while Truist's commercial banking provides lending solutions to large commercial clients. The commercial loan and lease portfolio consists of lending to public and private business clients and is composed of commercial and industrial, owner occupied, equipment leasing and financing and commercial real estate, as well as government and institutional financing.
In accordance with the Company's lending policy, each commercial loan undergoes a detailed underwriting process. Commercial loans are typically priced with an interest rate tied to market indices, such as the prime rate or LIBOR and are individually monitored and reviewed for deterioration in the ability of the client to repay the loan. The majority of Truist's commercial loans are secured by real estate, business equipment, inventories and other types of collateral.
Residential Mortgage Loan Portfolio
Truist Bank offers various types of fixed and adjustable-rate loans for the purpose of constructing, purchasing or refinancing residential properties. Truist primarily originates conforming mortgage loans and higher quality jumbo and construction-to-permanent loans for owner-occupied properties. Conforming loans are loans that are underwritten in accordance with the underwriting standards set forth by FNMA and FHLMC. They are generally collateralized by one-to-four-family residential real estate, typically have loan-to-collateral value ratios of 80% or less at origination, or have mortgage insurance as required by investors and are made to borrowers in good credit standing.
Risks associated with mortgage lending include interest rate risk, which is mitigated through the sale of a substantial portion of conforming fixed-rate loans in the secondary mortgage market, and an effective MSR hedging process. Credit risk is managed through rigorous underwriting procedures and mortgage insurance. The right to service the loans and receive servicing income is generally retained when conforming loans are sold. Management believes that the retention of mortgage servicing is a relationship driver in retail banking and a part of management's strategy to establish long-term client relationships and offer high quality client service. Truist also purchases residential mortgage loans from correspondent originators. The loans purchased from third-party originators are subject to substantially the same underwriting and risk-management criteria as loans originated internally.
Residential Home Equity and Direct Loan Portfolio
The residential home equity and direct loan portfolio is composed of a wide variety of secured and unsecured loans offered through Truist’s branch network, as well as loans originated by LightStream, Truist’s national online consumer lending division. Loans originated through the Truist branch network include revolving home equity lines of credit secured by first or second liens on residential real estate and certain other secured and unsecured lending marketed to qualifying clients and other creditworthy candidates in Truist’s market areas. LightStream provides fixed-rate, unsecured lending to consumers with strong credit through its proprietary online loan origination system.
Truist Financial Corporation 47
Indirect Auto Loan Portfolio
The indirect auto portfolio primarily includes secured indirect installment loans to consumers for the purchase of new and used automobiles. The indirect auto portfolio also includes nonprime and near prime automobile finance. Such loans are originated through approved franchised and independent dealers throughout the Truist market area and nationally through Regional Acceptance Corporation. These loans are relatively homogeneous and no single loan is individually significant in terms of its size and potential risk of loss. Indirect auto loans are subject to rigorous lending policies and procedures and are underwritten with note amounts and credit limits that are consistent with the Company's risk philosophy. In addition to its normal underwriting due diligence, Truist uses application systems and scoring systems to help underwrite and manage the credit risk in its indirect auto portfolio.
Indirect Other Loan Portfolio
The indirect other portfolio includes secured indirect installment loans to consumers for the purchase of new and used boats and recreational vehicles. The indirect other portfolio also includes small ticket consumer lending related to the purchase of power sports equipment. These loans are relatively homogeneous and no single loan is individually significant in terms of its size and potential risk of loss. These loans are subject to similar rigorous lending policies and procedures as the indirect auto loan portfolio. The indirect other loan portfolio also includes other indirect lending to consumers to finance home improvements, furniture purchases, and certain elective health-care services. These loans are originated in accordance with strict underwriting criteria as determined by Truist.
Student Loan Portfolio
The student loan portfolio is composed of securitized government-guaranteed student loans and certain private student loans originated by third parties. The government guarantee mitigates substantially all of the risk related to principal and interest repayment for this component of the portfolio. Private student loans are purchased from third-party originators with credit enhancements that partially mitigate the Company’s credit exposure.
Credit Card Loan Portfolio
The credit card portfolio consists of the outstanding balances on credit cards. Truist markets credit cards to its existing client base and does not solicit cardholders through nationwide programs or other forms of mass marketing. Such balances are generally unsecured and actively managed.
PCI
The PCI balance includes loans acquired with credit deterioration subsequent to origination as well as loans that were formerly covered by loss sharing agreements. Refer to "Note 5. Loans and ACL" for additional information.
The following table summarizes the loan portfolio:
| Table 12: Composition of Loans and Leases as of Period End | ||||||||||||||||||||||||||||||||
|
December 31,
(Dollars in millions) |
2019 | 2018 | 2017 | 2016 | 2015 | |||||||||||||||||||||||||||
| Commercial: | ||||||||||||||||||||||||||||||||
| Commercial and industrial | $ | 130,180 | $ | 61,935 | $ | 59,153 | $ | 57,739 | $ | 53,746 | ||||||||||||||||||||||
| CRE | 26,832 | 16,808 | 17,173 | 15,945 | 14,580 | |||||||||||||||||||||||||||
| Commercial construction | 6,205 | 4,252 | 4,090 | 3,819 | 3,732 | |||||||||||||||||||||||||||
| Lease financing | 6,122 | 2,018 | 1,911 | 1,677 | 1,535 | |||||||||||||||||||||||||||
| Consumer: | ||||||||||||||||||||||||||||||||
| Residential mortgage | 52,071 | 31,393 | 28,725 | 29,921 | 30,533 | |||||||||||||||||||||||||||
| Residential home equity and direct | 27,044 | 11,775 | 12,088 | 12,295 | 11,341 | |||||||||||||||||||||||||||
| Indirect auto | 24,442 | 11,282 | 11,641 | 13,342 | 12,139 | |||||||||||||||||||||||||||
| Indirect other | 11,100 | 6,143 | 5,594 | 5,222 | 4,914 | |||||||||||||||||||||||||||
| Student | 6,743 | — | — | — | — | |||||||||||||||||||||||||||
| Credit card | 5,619 | 2,941 | 2,675 | 2,452 | 2,309 | |||||||||||||||||||||||||||
| PCI | 3,484 | 466 | 651 | 910 | 1,122 | |||||||||||||||||||||||||||
| Total loans and leases HFI | 299,842 | 149,013 | 143,701 | 143,322 | 135,951 | |||||||||||||||||||||||||||
| LHFS | 8,373 | 988 | 1,099 | 1,716 | 1,035 | |||||||||||||||||||||||||||
| Total loans and leases | $ | 308,215 | $ | 150,001 | $ | 144,800 | $ | 145,038 | $ | 136,986 | ||||||||||||||||||||||
48 Truist Financial Corporation
Loans and leases HFI were $299.8 billion at December 31, 2019, an increase of $150.8 billion compared to 2018, which was driven primarily by the Merger. LHFS at December 31, 2019 were $8.4 billion, an increase of $7.4 billion compared to the prior year driven by the Merger as well as certain strategic actions which resulted in loans moving to LHFS. At December 31, 2019, there were $2.7 billion in LHFS measured on a nonrecurring basis primarily as a result of these strategic actions.
The Company has undertaken a number of strategic actions to enhance the credit quality and interest-rate sensitivity of its loan and lease portfolio. During the third quarter of 2019, management sold a $4.3 billion residential mortgage loan portfolio. This sale was followed by a number of balance sheet restructuring actions taken in the fourth quarter of 2019, including the transfer of:
•
$2.5 billion of residential mortgage loans to LHFS;
•
$356 million of commercial loans to LHFS as a result of a decision to exit a business; and
•
$381 million of mortgage, consumer and commercial loans to LHFS related to the forthcoming branch divestiture arising from the Merger.
In addition, $1.4 billion of commercial exposures, of which $516 million were funded, were included in the LHFS portfolio of SunTrust at the Merger date.
The Merger and the strategic actions highlighted above were the primary drivers of change across the entire loan portfolio. Additional changes include the following:
•
Commercial and industrial loans increased $1.2 billion due primarily to strong growth in a number of industry verticals and client segments including mortgage warehouse lending, premium finance, dealer floor plan and equipment finance.
•
Residential mortgage loans decreased $6.2 billion due to the transfer of loans to held for sale and a higher proportion of originations being sold rather than retained in the portfolio.
Scheduled repayments are reported in the maturity category in which the payment is due. Determinations of maturities are based on contractual terms. Truist's credit policy typically does not permit automatic renewal of loans. At the scheduled maturity date (including balloon payment date), the client generally must request a new loan to replace the matured loan and execute either a new note or note modification with rate, terms and conditions negotiated at that time.
| Table 13: Commercial Loan Maturities | ||||||||||||||||||||||||||
|
December 31, 2019
(Dollars in millions) |
1 Year or Less | Over 1 to 5 Years | After 5 Years | Total | ||||||||||||||||||||||
| Fixed rate: | ||||||||||||||||||||||||||
| Commercial and industrial | $ | 5,913 | $ | 11,570 | $ | 16,923 | $ | 34,406 | ||||||||||||||||||
| CRE | 489 | 2,418 | 2,689 | 5,596 | ||||||||||||||||||||||
| Commercial construction | 14 | 118 | 137 | 269 | ||||||||||||||||||||||
| Lease financing | 232 | 2,511 | 1,949 | 4,692 | ||||||||||||||||||||||
| Total fixed rate | 6,648 | 16,617 | 21,698 | 44,963 | ||||||||||||||||||||||
| Variable rate: | ||||||||||||||||||||||||||
| Commercial and industrial | 16,671 | 59,122 | 19,981 | 95,774 | ||||||||||||||||||||||
| CRE | 2,492 | 12,438 | 6,306 | 21,236 | ||||||||||||||||||||||
| Commercial construction | 1,869 | 3,618 | 449 | 5,936 | ||||||||||||||||||||||
| Lease financing | 34 | 685 | 711 | 1,430 | ||||||||||||||||||||||
| Total variable rate | 21,066 | 75,863 | 27,447 | 124,376 | ||||||||||||||||||||||
| Total commercial loans and leases | $ | 27,714 | $ | 92,480 | $ | 49,145 | $ | 169,339 | ||||||||||||||||||
Certain residential mortgage loans have an initial period where the borrower is only required to pay the periodic interest. After the interest-only period, the loan will require the payment of both interest and principal over the remaining term. The outstanding balances of variable rate residential mortgage loans in the interest-only phase were approximately $392 million and $64 million at December 31, 2019 and December 31, 2018, respectively.
Truist Financial Corporation 49
The following table presents the composition of average loans and leases for the most recent calendar quarters:
| Table 14: Composition of Average Loans and Leases | ||||||||||||||||||||||||||||||||
|
For the Three Months Ended
(Dollars in millions)
|
Dec 31, 2019 | Sep 30, 2019 | Jun 30, 2019 | Mar 31, 2019 | Dec 31, 2018 | |||||||||||||||||||||||||||
| Commercial: | ||||||||||||||||||||||||||||||||
| Commercial and industrial | $ | 81,853 | $ | 63,768 | $ | 62,563 | $ | 61,370 | $ | 60,553 | ||||||||||||||||||||||
| CRE | 19,896 | 17,042 | 16,854 | 16,786 | 16,914 | |||||||||||||||||||||||||||
| Commercial construction | 4,506 | 3,725 | 3,894 | 4,119 | 4,387 | |||||||||||||||||||||||||||
| Lease financing | 3,357 | 2,260 | 2,122 | 2,021 | 1,990 | |||||||||||||||||||||||||||
| Consumer: | ||||||||||||||||||||||||||||||||
| Residential mortgage | 34,824 | 28,410 | 32,066 | 31,370 | 31,103 | |||||||||||||||||||||||||||
| Residential home equity and direct | 15,810 | 11,650 | 11,687 | 11,681 | 11,790 | |||||||||||||||||||||||||||
| Indirect auto | 15,390 | 11,810 | 11,633 | 11,308 | 11,255 | |||||||||||||||||||||||||||
| Indirect other | 7,772 | 6,552 | 6,246 | 6,029 | 6,181 | |||||||||||||||||||||||||||
| Student | 1,825 | — | — | — | — | |||||||||||||||||||||||||||
| Credit card | 3,788 | 3,036 | 2,970 | 2,922 | 2,880 | |||||||||||||||||||||||||||
| PCI | 1,220 | 411 | 432 | 455 | 486 | |||||||||||||||||||||||||||
| Total average loans and leases HFI | $ | 190,241 | $ | 148,664 | $ | 150,467 | $ | 148,061 | $ | 147,539 | ||||||||||||||||||||||
Average loans held for investment for the fourth quarter of 2019 were $190.2 billion, up $41.6 billion compared to the third quarter of 2019, primarily due to the merged loans. The discussion below only highlights those portfolios where underlying performance was a meaningful driver of the variance.
Average commercial and industrial loans increased $18.1 billion, with the merged portfolio contributing $18.3 billion of the increase. Excluding the impact of the merged portfolio, commercial and industrial loans declined slightly compared to the prior quarter, as strong growth in mortgage warehouse lending, premium finance and equipment finance were more than offset by paydowns in the corporate banking portfolio.
Average residential mortgage loans held for investment increased $6.4 billion, primarily due to $7.3 billion of growth from the merged portfolio, partially offset by a decline due to the transfer of loans to held for sale and a higher proportion of loan originations being sold rather than retained in the portfolio.
Average indirect auto loans increased $3.6 billion over the prior quarter, driven by $3.3 billion of growth from the merged portfolio and $257 million of core portfolio growth.
50 Truist Financial Corporation
Asset Quality
The following tables summarize asset quality information for the past five years:
| Table 15: Asset Quality | ||||||||||||||||||||||||||||||||
|
December 31,
(Dollars in millions) |
2019 | 2018 | 2017 | 2016 | 2015 | |||||||||||||||||||||||||||
| NPAs: | ||||||||||||||||||||||||||||||||
| NPLs: | ||||||||||||||||||||||||||||||||
| Commercial and industrial | $ | 212 | $ | 200 | $ | 259 | $ | 369 | $ | 242 | ||||||||||||||||||||||
| CRE | 10 | 63 | 37 | 40 | 38 | |||||||||||||||||||||||||||
| Commercial construction | — | 2 | 8 | 17 | 13 | |||||||||||||||||||||||||||
| Lease financing | 8 | 3 | 1 | 4 | 1 | |||||||||||||||||||||||||||
| Residential mortgage | 55 | 119 | 129 | 172 | 173 | |||||||||||||||||||||||||||
| Residential home equity and direct | 67 | 53 | 64 | 63 | 43 | |||||||||||||||||||||||||||
| Indirect auto | 100 | 82 | 71 | 71 | 66 | |||||||||||||||||||||||||||
| Indirect other | 2 | — | 1 | — | — | |||||||||||||||||||||||||||
| Total NPLs HFI | 454 | 522 | 570 | 736 | 576 | |||||||||||||||||||||||||||
| Loans held for sale | 107 | — | — | — | — | |||||||||||||||||||||||||||
| Total nonaccrual loans and leases | 561 | 522 | 570 | 736 | 576 | |||||||||||||||||||||||||||
| Foreclosed real estate | 82 | 35 | 32 | 50 | 108 | |||||||||||||||||||||||||||
| Other foreclosed property | 41 | 28 | 25 | 27 | 28 | |||||||||||||||||||||||||||
| Total nonperforming assets | $ | 684 | $ | 585 | $ | 627 | $ | 813 | $ | 712 | ||||||||||||||||||||||
| Performing TDRs: (1) | ||||||||||||||||||||||||||||||||
| Commercial and industrial | $ | 47 | $ | 65 | $ | 50 | $ | 57 | $ | 50 | ||||||||||||||||||||||
| CRE | 6 | 8 | 11 | 16 | 13 | |||||||||||||||||||||||||||
| Commercial construction | 37 | 2 | 5 | 9 | 16 | |||||||||||||||||||||||||||
| Residential mortgage | 470 | 656 | 605 | 769 | 604 | |||||||||||||||||||||||||||
| Residential home equity and direct | 51 | 56 | 63 | 69 | 75 | |||||||||||||||||||||||||||
| Indirect auto | 333 | 299 | 274 | 234 | 188 | |||||||||||||||||||||||||||
| Indirect other | 5 | 6 | 7 | 6 | 6 | |||||||||||||||||||||||||||
| Credit card | 31 | 27 | 28 | 27 | 30 | |||||||||||||||||||||||||||
| Total performing TDRs | $ | 980 | $ | 1,119 | $ | 1,043 | $ | 1,187 | $ | 982 | ||||||||||||||||||||||
| Loans 90 days or more past due and still accruing: (1) | ||||||||||||||||||||||||||||||||
| Commercial and industrial | $ | 1 | $ | — | $ | 1 | $ | — | $ | — | ||||||||||||||||||||||
| CRE | — | — | 1 | — | — | |||||||||||||||||||||||||||
| Residential mortgage | 543 | $ | 405 | 465 | 522 | 541 | ||||||||||||||||||||||||||
| Residential home equity and direct | 9 | 8 | 6 | 6 | 7 | |||||||||||||||||||||||||||
| Indirect auto | 11 | 6 | 6 | 5 | 5 | |||||||||||||||||||||||||||
| Indirect other | 2 | — | — | 1 | — | |||||||||||||||||||||||||||
| Student | 188 | — | — | — | — | |||||||||||||||||||||||||||
| Credit card | 22 | 13 | 12 | 12 | 10 | |||||||||||||||||||||||||||
| PCI | 1,218 | 30 | 57 | 90 | 114 | |||||||||||||||||||||||||||
| Total loans 90 days or more past due and still accruing | $ | 1,994 | $ | 462 | $ | 548 | $ | 636 | $ | 677 | ||||||||||||||||||||||
| Loans 30-89 days past due and still accruing: (1) | ||||||||||||||||||||||||||||||||
| Commercial and industrial | $ | 94 | $ | 34 | $ | 41 | $ | 44 | $ | 53 | ||||||||||||||||||||||
| CRE | 5 | 4 | 8 | 6 | 13 | |||||||||||||||||||||||||||
| Commercial construction | 1 | 1 | — | 2 | 9 | |||||||||||||||||||||||||||
| Lease financing | 2 | 1 | 4 | 4 | 1 | |||||||||||||||||||||||||||
| Residential mortgage | 498 | 456 | 472 | 525 | 475 | |||||||||||||||||||||||||||
| Residential home equity and direct | 122 | 63 | 67 | 62 | 60 | |||||||||||||||||||||||||||
| Indirect auto | 560 | 390 | 373 | 347 | 331 | |||||||||||||||||||||||||||
| Indirect other | 85 | 46 | 39 | 30 | 27 | |||||||||||||||||||||||||||
| Student | 650 | — | — | — | — | |||||||||||||||||||||||||||
| Credit card | 56 | 26 | 21 | 21 | 20 | |||||||||||||||||||||||||||
| PCI | 140 | 23 | 27 | 36 | 42 | |||||||||||||||||||||||||||
| Total loans 30-89 days past due and still accruing | $ | 2,213 | $ | 1,044 | $ | 1,052 | $ | 1,077 | $ | 1,031 | ||||||||||||||||||||||
(1) Excludes loans held for sale.
Truist Financial Corporation 51
Nonperforming assets totaled $684 million at December 31, 2019, up $99 million compared to December 31, 2018. This increase was driven by merged loans, which included $107 million and $63 million of loans classified as HFS and HFI, respectively, and $63 million of other nonperforming assets. These increases were partially offset by a decrease in nonperforming residential mortgages loans as a result of loan sales.
Nonperforming loans and leases held for investment represented 0.15% of loans and leases HFI, down 20 basis points compared to December 31, 2018. The decline was due primarily to the impact of the merged nonperforming loans being accounted for on a pooled basis in PCI and the sale of nonperforming mortgage loans during the year. Upon adoption of CECL and the transition from pooled level accounting for PCI, nonperforming loans will be identified based on the loan-level characteristics and reported accordingly. There are approximately $500 million of PCI loans that would be classified as nonperforming as of December 31, 2019.
Performing TDRs were down $139 million compared to the prior year, which was driven by a decrease in residential mortgage loans due to the previously discussed sale that was partially offset by increases in commercial construction loans and indirect auto.
Loans 90 days or more past due and still accruing totaled $2.0 billion at December 31, 2019, up $1.5 billion compared to the prior year. This increase is a result of merged loans, including $1.2 billion of PCI loans, $193 million of government guaranteed residential mortgages and $188 million of government guaranteed student loans. The ratio of loans 90 days or more past due and still accruing as a percentage of loans and leases was 0.66% at December 31, 2019, an increase of 35 basis points from the prior year. Excluding government guaranteed and PCI loans, the ratio of loans 90 days or more past due and still accruing as a percentage of loans and leases was 0.03% at December 31, 2019, down from 0.04% at December 31, 2018.
Loans 30-89 days past due and still accruing totaled $2.2 billion at December 31, 2019, up $1.2 billion compared to the prior year, due primarily to the merged portfolio that added $1.2 billion. The ratio of loans 30-89 days or more past due and still accruing as a percentage of loans and leases was 0.74% at December 31, 2019, an increase of four basis points from the prior year. The primary driver of the increase is the addition of the merged guaranteed student loan portfolio.
Problem loans include NPLs and loans that are 90 days or more past due and still accruing as disclosed in Table 15. In addition, for the commercial portfolio segment, loans that are rated special mention or substandard performing are closely monitored by management as potential problem loans. Refer to "Note 5. Loans and ACL" for additional disclosures related to these potential problem loans.
| Table 16: Asset Quality Ratios | |||||||||||||||||||||||||||||
| As Of / For The Year Ended December 31, | 2019 | 2018 | 2017 | 2016 | 2015 | ||||||||||||||||||||||||
|
Loans 30-89 days past due and still accruing as a percentage of loans and leases HFI
|
0.74 | % | 0.70 | % | 0.73 | % | 0.75 | % | 0.76 | % | |||||||||||||||||||
|
Loans 90 days or more past due and still accruing as a percentage of loans and leases HFI
|
0.66 | 0.31 | 0.38 | 0.44 | 0.50 | ||||||||||||||||||||||||
|
NPLs as a percentage of loans and leases HFI
|
0.15 | 0.35 | 0.40 | 0.51 | 0.42 | ||||||||||||||||||||||||
| Nonperforming loans and leases as a percentage of loans and leases (1) | 0.18 | 0.35 | 0.40 | 0.51 | 0.42 | ||||||||||||||||||||||||
|
NPAs as a percentage of:
|
|||||||||||||||||||||||||||||
|
Total assets (1)
|
0.14 | 0.26 | 0.28 | 0.37 | 0.34 | ||||||||||||||||||||||||
|
Loans and leases HFI plus foreclosed property
|
0.19 | 0.39 | 0.44 | 0.57 | 0.52 | ||||||||||||||||||||||||
|
Net charge-offs as a percentage of average loans and leases HFI
|
0.40 | 0.36 | 0.38 | 0.38 | 0.35 | ||||||||||||||||||||||||
|
ALLL as a percentage of loans and leases HFI
|
0.52 | 1.05 | 1.04 | 1.04 | 1.07 | ||||||||||||||||||||||||
|
Ratio of ALLL to:
|
|||||||||||||||||||||||||||||
| Net charge-offs | 2.44x | 2.98x | 2.78x | 2.80x | 3.36x | ||||||||||||||||||||||||
| NPLs | 3.41x | 2.99x | 2.62x | 2.03x | 2.53x | ||||||||||||||||||||||||
|
Loans 90 days or more past due and still accruing as a percentage of loans and leases HFI (2)
|
0.03 | % | 0.04 | % | 0.05 | % | 0.07 | % | 0.06 | % | |||||||||||||||||||
Applicable ratios are annualized.
(1) Includes LHFS.
(2) This asset quality ratio has been adjusted to remove the impact of government guaranteed mortgage and student loans and PCI. Management believes the inclusion of such assets in this asset quality ratio results in distortion of this ratio such that it might not be reflective of asset collectability or might not be comparable to other periods presented or to other portfolios that do not have government guarantees or were not impacted by PCI accounting requirements.
52 Truist Financial Corporation
The following table presents activity related to NPAs:
| Table 17: Rollforward of NPAs | ||||||||||||||
| (Dollars in millions) | 2019 | 2018 | ||||||||||||
| Balance, January 1 | $ | 585 | $ | 627 | ||||||||||
| New NPAs | 1,499 | 1,184 | ||||||||||||
| Advances and principal increases | 143 | 400 | ||||||||||||
| Disposals of foreclosed assets (1) | (479) | (459) | ||||||||||||
| Disposals of NPLs (2) | (239) | (95) | ||||||||||||
| Charge-offs and losses | (295) | (243) | ||||||||||||
| Payments | (392) | (673) | ||||||||||||
| Transfers to performing status | (137) | (155) | ||||||||||||
| Other, net | (1) | (1) | ||||||||||||
| Ending balance, December 31 | $ | 684 | $ | 585 | ||||||||||
(1) Includes charge-offs and losses recorded upon sale of $228 million and $216 million for the year ended December 31, 2019 and 2018, respectively.
(2) Includes charge-offs and losses recorded upon sale of $39 million and $31 million for the year ended December 31, 2019 and 2018, respectively.
TDRs occur when a borrower is experiencing, or is expected to experience, financial difficulties in the near term and a concession has been granted to the borrower. As a result, Truist will work with the borrower to prevent further difficulties and seek to improve the likelihood of recovery on the loan. To facilitate this process, a concessionary modification that would not otherwise be considered may be granted, resulting in classification of the loan as a TDR.
TDRs identified by SunTrust prior to the Merger date are not included in Truist's TDR disclosure because all such loans were recorded at fair value and a new accounting basis was established as of the Merger. Subsequent modifications will be evaluated and recorded as TDRs in accordance with Truist's accounting policies.
The following table provides a summary of performing TDR activity:
| Table 18: Rollforward of Performing TDRs | ||||||||||||||
| (Dollars in millions) | 2019 | 2018 | ||||||||||||
| Balance, January 1 | $ | 1,119 | $ | 1,043 | ||||||||||
| Inflows | 641 | 510 | ||||||||||||
| Payments and payoffs | (199) | (169) | ||||||||||||
| Charge-offs | (67) | (63) | ||||||||||||
| Transfers to nonperforming TDRs | (77) | (69) | ||||||||||||
| Removal due to the passage of time | (18) | (32) | ||||||||||||
| Non-concessionary re-modifications | (8) | (6) | ||||||||||||
| Transferred to LHFS and/or sold | (411) | (95) | ||||||||||||
| Balance, December 31 | $ | 980 | $ | 1,119 | ||||||||||
Payments and payoffs include scheduled principal payments, prepayments and payoffs of amounts outstanding. Transfers to nonperforming TDRs represent loans that no longer meet the requirements necessary to reflect the loan in accruing status.
TDR classification may be removed due to the passage of time if the loan: (1) did not include a forgiveness of principal or interest, (2) has performed in accordance with the modified terms (generally a minimum of six months), (3) was reported as a TDR over a year-end reporting period, and (4) reflected an interest rate on the modified loan that was no less than a market rate at the date of modification. TDR classification may also be removed for an accruing loan upon the occurrence of a subsequent non-concessionary modification granted at market terms and within current underwriting guidelines.
In connection with consumer TDRs, a NPL will be returned to accruing status when current as to principal and interest and upon a sustained historical repayment performance (generally a minimum of six months).
Truist Financial Corporation 53
The following table provides further details regarding the payment status of TDRs outstanding at December 31, 2019:
| Table 19: Payment Status of TDRs (1) | ||||||||||||||||||||||||||||||||||||||||||||
|
December 31, 2019
(Dollars in millions) |
Current | Past Due 30-89 Days | Past Due 90 Days Or More | Total | ||||||||||||||||||||||||||||||||||||||||
| Performing TDRs: | ||||||||||||||||||||||||||||||||||||||||||||
| Commercial: | ||||||||||||||||||||||||||||||||||||||||||||
| Commercial and industrial | $ | 46 | 97.9 | % | $ | 1 | 2.1 | % | $ | — | — | % | $ | 47 | ||||||||||||||||||||||||||||||
| CRE | 6 | 100.0 | — | — | — | — | 6 | |||||||||||||||||||||||||||||||||||||
| Commercial construction | 37 | 100.0 | — | — | — | — | 37 | |||||||||||||||||||||||||||||||||||||
| Lease financing | — | — | — | — | — | — | — | |||||||||||||||||||||||||||||||||||||
| Consumer: | ||||||||||||||||||||||||||||||||||||||||||||
| Residential mortgage | 233 | 49.5 | 83 | 17.7 | 154 | 32.8 | 470 | |||||||||||||||||||||||||||||||||||||
| Residential home equity and direct | 49 | 96.1 | 2 | 3.9 | — | — | 51 | |||||||||||||||||||||||||||||||||||||
| Indirect auto | 266 | 79.9 | 67 | 20.1 | — | — | 333 | |||||||||||||||||||||||||||||||||||||
| Indirect other | 5 | 100.0 | — | — | — | — | 5 | |||||||||||||||||||||||||||||||||||||
| Student | — | — | — | — | — | — | — | |||||||||||||||||||||||||||||||||||||
| Credit card | 25 | 80.7 | 5 | 16.1 | 1 | 3.2 | 31 | |||||||||||||||||||||||||||||||||||||
| Total performing TDRs | 667 | 68.1 | 158 | 16.1 | 155 | 15.8 | 980 | |||||||||||||||||||||||||||||||||||||
| Nonperforming TDRs | 36 | 43.9 | 6 | 7.3 | 40 | 48.8 | 82 | |||||||||||||||||||||||||||||||||||||
| Total TDRs | $ | 703 | 66.2 | $ | 164 | 15.4 | $ | 195 | 18.4 | $ | 1,062 | |||||||||||||||||||||||||||||||||
(1)
Past due performing TDRs are included in past due disclosures and nonperforming TDRs are included in NPL disclosures.
Truist Financial Corporation 54
ACL
Activity related to the ACL is presented in the following tables:
| Table 20: Activity in ACL | |||||||||||||||||||||||||||||
|
Year ended December 31,
(Dollars in millions) |
2019 | 2018 | 2017 | 2016 | 2015 | ||||||||||||||||||||||||
| Balance, beginning of period | $ | 1,651 | $ | 1,609 | $ | 1,599 | $ | 1,550 | $ | 1,534 | |||||||||||||||||||
|
Provision for credit losses (excluding PCI loans)
|
616 | 583 | 562 | 574 | 430 | ||||||||||||||||||||||||
| Provision (benefit) for PCI loans | (1) | (17) | (15) | (2) | (2) | ||||||||||||||||||||||||
| Charge-offs: | |||||||||||||||||||||||||||||
| Commercial and industrial | (90) | (92) | (95) | (143) | (90) | ||||||||||||||||||||||||
| CRE | (33) | (10) | (8) | (8) | (21) | ||||||||||||||||||||||||
| Commercial construction | — | (3) | (2) | (1) | (3) | ||||||||||||||||||||||||
| Lease financing | (11) | (4) | (5) | (6) | — | ||||||||||||||||||||||||
| Residential mortgage | (21) | (21) | (47) | (40) | (46) | ||||||||||||||||||||||||
| Residential home equity and direct | (93) | (79) | (69) | (61) | (62) | ||||||||||||||||||||||||
| Indirect auto | (370) | (342) | (355) | (315) | (266) | ||||||||||||||||||||||||
| Indirect other | (62) | (49) | (47) | (51) | (37) | ||||||||||||||||||||||||
| Student | — | — | — | — | — | ||||||||||||||||||||||||
| Credit card | (109) | (76) | (68) | (61) | (62) | ||||||||||||||||||||||||
| PCI | — | (2) | (1) | (15) | (1) | ||||||||||||||||||||||||
| Total charge-offs | (789) | (678) | (697) | (701) | (588) | ||||||||||||||||||||||||
| Recoveries: | |||||||||||||||||||||||||||||
| Commercial and industrial | 25 | 39 | 36 | 44 | 38 | ||||||||||||||||||||||||
| CRE | 5 | 3 | 9 | 9 | 7 | ||||||||||||||||||||||||
| Commercial construction | 3 | 5 | 7 | 10 | 11 | ||||||||||||||||||||||||
| Lease financing | 1 | 1 | 2 | 2 | — | ||||||||||||||||||||||||
| Residential mortgage | 2 | 2 | 2 | 3 | 3 | ||||||||||||||||||||||||
| Residential home equity and direct | 30 | 25 | 27 | 28 | 31 | ||||||||||||||||||||||||
| Indirect auto | 52 | 49 | 46 | 44 | 36 | ||||||||||||||||||||||||
| Indirect other | 17 | 13 | 14 | 11 | 8 | ||||||||||||||||||||||||
| Student | — | — | — | — | — | ||||||||||||||||||||||||
| Credit card | 20 | 17 | 17 | 18 | 18 | ||||||||||||||||||||||||
| Total recoveries | 155 | 154 | 160 | 169 | 152 | ||||||||||||||||||||||||
| Net charge-offs | (634) | (524) | (537) | (532) | (436) | ||||||||||||||||||||||||
| Other | 257 | — | — | 9 | 24 | ||||||||||||||||||||||||
| Balance, end of period | $ | 1,889 | $ | 1,651 | $ | 1,609 | $ | 1,599 | $ | 1,550 | |||||||||||||||||||
| ALLL (excluding PCI loans) | $ | 1,541 | $ | 1,549 | $ | 1,462 | $ | 1,445 | $ | 1,399 | |||||||||||||||||||
| ALLL for PCI loans | 8 | 9 | 28 | 44 | 61 | ||||||||||||||||||||||||
| RUFC | 340 | 93 | 119 | 110 | 90 | ||||||||||||||||||||||||
| Total ACL | $ | 1,889 | $ | 1,651 | $ | 1,609 | $ | 1,599 | $ | 1,550 | |||||||||||||||||||
The ACL consists of the ALLL, which is presented separately on the Consolidated Balance Sheets, and the RUFC, which is included in Other liabilities on the Consolidated Balance Sheets. The ACL totaled $1.9 billion at December 31, 2019, up $238 million compared to December 31, 2018. The RUFC assumed in the Merger was $257 million.
Total charge-offs during the year totaled $789 million, up $111 million compared to the prior year. As a percentage of average loans and leases, annualized net charge-offs were 0.40 percent, up four basis points compared to the prior year.
The ALLL, excluding the allowance for PCI loans, was $1.5 billion, down $8 million compared to the prior year. The decrease in the ALLL was due primarily to the sale of residential mortgage loans during the year. As of December 31, 2019, the total ALLL was 0.52 percent of loans and leases held for investment. All of the merged loans were marked to fair value as of December 6, 2019 and therefore, there is no allowance related to these loans. Upon the adoption of CECL, an allowance will be established for all loans held for investment, with the portion related to non-PCI loans and leases charged to retained earnings.
Truist Financial Corporation 55
The ALLL was 3.41 times nonperforming loans and leases held for investment, compared to 2.99 times at December 31, 2018. At December 31, 2019, the ALLL was 2.44 times annualized net charge-offs, compared to 2.98 times at December 31, 2018.
The following table presents an allocation of the ALLL at the periods shown. This allocation of the ALLL is calculated on an approximate basis and is not necessarily indicative of future losses or allocations. The entire amount of the allowance is available to absorb losses occurring in any category of loans and leases.
| Table 21: Allocation of ALLL by Category | ||||||||||||||||||||||||||||||||||||||||||||||||||||||||||||||
| 2019 | 2018 | 2017 | 2016 | 2015 | ||||||||||||||||||||||||||||||||||||||||||||||||||||||||||
|
December 31,
(Dollars in millions) |
Amount | % Loans in each category | Amount | % Loans in each category | Amount | % Loans in each category | Amount | % Loans in each category | Amount | % Loans in each category | ||||||||||||||||||||||||||||||||||||||||||||||||||||
| Commercial and industrial | $ | 560 | 43.4 | % | $ | 546 | 41.4 | % | $ | 522 | 41.1 | % | $ | 530 | 40.4 | % | $ | 488 | 39.8 | % | ||||||||||||||||||||||||||||||||||||||||||
| CRE | 150 | 8.9 | 142 | 11.3 | 118 | 12.0 | 120 | 11.1 | 138 | 10.7 | ||||||||||||||||||||||||||||||||||||||||||||||||||||
| Commercial construction | 52 | 2.1 | 48 | 2.9 | 42 | 2.8 | 25 | 2.7 | 37 | 2.7 | ||||||||||||||||||||||||||||||||||||||||||||||||||||
| Lease financing | 10 | 2.0 | 11 | 1.4 | 9 | 1.3 | 7 | 1.2 | 5 | 1.1 | ||||||||||||||||||||||||||||||||||||||||||||||||||||
| Residential mortgage | 176 | 17.4 | 232 | 21.1 | 209 | 20.0 | 227 | 20.8 | 217 | 22.4 | ||||||||||||||||||||||||||||||||||||||||||||||||||||
| Residential home equity and direct | 107 | 9.0 | 104 | 7.9 | 113 | 8.4 | 111 | 8.6 | 113 | 8.3 | ||||||||||||||||||||||||||||||||||||||||||||||||||||
| Indirect auto | 304 | 8.2 | 298 | 7.6 | 296 | 8.1 | 273 | 9.3 | 252 | 8.9 | ||||||||||||||||||||||||||||||||||||||||||||||||||||
| Indirect other | 60 | 3.7 | 58 | 4.1 | 52 | 3.9 | 54 | 3.6 | 53 | 3.6 | ||||||||||||||||||||||||||||||||||||||||||||||||||||
| Student | — | 2.2 | — | — | — | — | — | — | — | — | ||||||||||||||||||||||||||||||||||||||||||||||||||||
| Credit card | 122 | 1.9 | 110 | 2.0 | 101 | 1.9 | 98 | 1.7 | 96 | 1.7 | ||||||||||||||||||||||||||||||||||||||||||||||||||||
| PCI | 8 | 1.2 | 9 | 0.3 | 28 | 0.5 | 44 | 0.6 | 61 | 0.8 | ||||||||||||||||||||||||||||||||||||||||||||||||||||
| Total ALLL | 1,549 | 100.0 | % | 1,558 | 100.0 | % | 1,490 | 100.0 | % | 1,489 | 100.0 | % | 1,460 | 100.0 | % | |||||||||||||||||||||||||||||||||||||||||||||||
| RUFC | 340 | 93 | 119 | 110 | 90 | |||||||||||||||||||||||||||||||||||||||||||||||||||||||||
| Total ACL | $ | 1,889 | $ | 1,651 | $ | 1,609 | $ | 1,599 | $ | 1,550 | ||||||||||||||||||||||||||||||||||||||||||||||||||||
Truist monitors the performance of its home equity loans and lines secured by second liens similarly to other consumer loans and utilizes assumptions specific to these loans in determining the necessary ALLL. Truist also receives notification when the first lien holder, whether Truist or another financial institution, has initiated foreclosure proceedings against the borrower. When notified that the first lien is in the process of foreclosure, Truist obtains valuations to determine if any additional charge-offs or reserves are warranted. These valuations are updated at least annually thereafter.
Truist has limited ability to monitor the delinquency status of the first lien, unless the first lien is held or serviced by Truist. As a result, using migration assumptions that are based on historical experience and adjusted for current trends, Truist estimates the volume of second lien positions where the first lien is delinquent and adjusts the ALLL to reflect the increased risk of loss on these credits. Finally, Truist also provides additional reserves for second lien positions when the estimated combined current loan to value ratio for the credit exceeds 100%. As of December 31, 2019, Truist held or serviced the first lien on 30.9% of its second lien positions.
56 Truist Financial Corporation
Other Assets
The components of other assets are presented in the following table:
| Table 22: Composition of Other Assets | |||||||||||
|
December 31,
(Dollars in millions) |
2019 | 2018 | |||||||||
| Bank-owned life insurance | $ | 6,383 | $ | 4,656 | |||||||
| Tax credit investments | 5,448 | 2,557 | |||||||||
| Lease assets | 4,978 | 1,375 | |||||||||
| Pension assets, net | 3,579 | 1,270 | |||||||||
| Accounts receivable | 2,418 | 1,116 | |||||||||
| Derivative assets | 2,053 | 249 | |||||||||
| Operating lease - right of use asset | 1,823 | — | |||||||||
| Accrued income | 1,807 | 745 | |||||||||
| Prepaid expenses | 1,254 | 602 | |||||||||
| Equity securities at fair value | 817 | 376 | |||||||||
| FHLB stock | 764 | 281 | |||||||||
| Other | 508 | 243 | |||||||||
| Total other assets | $ | 31,832 | $ | 13,470 | |||||||
Funding Activities
Deposits are the primary source of funds for the Company's lending and investing activities. Scheduled payments and maturities from portfolios of loans and investment securities also provide a stable source of funds. FHLB advances, other secured borrowings, Federal funds purchased and other short-term borrowed funds, as well as long-term debt issued through the capital markets, all provide supplemental liquidity sources. Funding activities are monitored and governed through Truist's overall ALM process under the governance and oversight of the MRLCC, which is further discussed in the "Market Risk Management" section in MD&A. The following section provides a brief description of the various sources of funds.
Truist Financial Corporation 57
Deposits
Deposits are obtained principally from individuals and businesses within Truist's branch network and include noninterest-bearing checking accounts, interest-bearing checking accounts, savings accounts, money market deposit accounts, CDs and IRAs. Deposit account terms vary with respect to the minimum balance required, the time period the funds must remain on deposit and service charge schedules. Interest rates paid on specific deposit types are determined based on (i) competitor deposit rates, (ii) the anticipated amount and timing of funding needs, (iii) the availability and cost of alternative sources of funding, and (iv) anticipated future economic conditions and interest rates. Deposits are attractive sources of funding because of their stability and relative cost.
Deposits totaled $334.7 billion at December 31, 2019, an increase of $173.5 billion from December 31, 2018, due primarily to the Merger, which contributed $170.7 billion of deposits.
The following table presents average deposits for the most recent calendar quarters:
| Table 23: Composition of Average Deposits | ||||||||||||||||||||||||||||||||
|
Three Months Ended
(Dollars in millions)
|
Dec 31, 2019 | Sep 30, 2019 | Jun 30, 2019 | Mar 31, 2019 | Dec 31, 2018 | |||||||||||||||||||||||||||
| Noninterest-bearing deposits | $ | 64,485 | $ | 52,500 | $ | 52,680 | $ | 52,283 | $ | 53,732 | ||||||||||||||||||||||
| Interest checking | 43,246 | 27,664 | 27,708 | 27,622 | 26,921 | |||||||||||||||||||||||||||
| Money market and savings | 79,903 | 64,920 | 63,394 | 63,325 | 62,261 | |||||||||||||||||||||||||||
| Time deposits | 23,058 | 16,643 | 15,730 | 16,393 | 14,682 | |||||||||||||||||||||||||||
| Foreign office deposits - interest-bearing | 24 | 265 | 379 | 422 | 246 | |||||||||||||||||||||||||||
| Total average deposits | $ | 210,716 | $ | 161,992 | $ | 159,891 | $ | 160,045 | $ | 157,842 | ||||||||||||||||||||||
Average deposits for the fourth quarter of 2019 were $210.7 billion, up $48.7 billion compared to the prior quarter, due primarily to the Merger.
Noninterest-bearing deposits represented 30.6% of total average deposits for the fourth quarter of 2019, compared to 32.4% for the prior quarter and 34.0% for the prior year quarter. The cost of average total deposits was 0.57% for the fourth quarter, down ten basis points compared to the prior quarter. The cost of average interest-bearing deposits was 0.82% for the fourth quarter, down 17 basis points compared to the prior quarter.
| Table 24: Scheduled Maturities of Time Deposits $100,000 and Greater | |||||
|
December 31, 2019
(Dollars in millions) |
|||||
| Three months or less | $ | 6,311 | |||
| Over three through six months | 3,504 | ||||
| Over six through twelve months | 4,455 | ||||
| Over twelve months | 4,937 | ||||
| Total | $ | 19,207 | |||
Borrowings
The types of short-term borrowings that have been, or may be, used by the Company include Federal funds purchased, securities sold under repurchase agreements, master notes, commercial paper, short-term bank notes and short-term FHLB advances. Short-term borrowings fluctuate based on the Company's funding needs. While deposits remain the primary source for funding loan originations, management uses short-term borrowings as a supplementary funding source for loan growth and other balance sheet management purposes. The following table summarizes certain information for the past three years with respect to short-term borrowings:
58 Truist Financial Corporation
| Table 25: Short-Term Borrowings | ||||||||||||||||||||
|
As Of / For The Year Ended December 31,
(Dollars in millions)
|
2019 | 2018 | 2017 | |||||||||||||||||
| Securities sold under agreements to repurchase: | ||||||||||||||||||||
| Maximum outstanding at any month-end during the year | $ | 1,969 | $ | 836 | $ | 1,923 | ||||||||||||||
| Balance outstanding at end of year | 1,969 | 251 | 483 | |||||||||||||||||
| Average outstanding during the year | 826 | 446 | 1,449 | |||||||||||||||||
| Average interest rate during the year | 2.01 | % | 1.35 | % | 0.70 | % | ||||||||||||||
| Average interest rate at end of year | 1.41 | 1.59 | 0.43 | |||||||||||||||||
| Federal funds purchased and short-term borrowed funds: | ||||||||||||||||||||
| Maximum outstanding at any month-end during the year | $ | 16,249 | $ | 9,063 | $ | 6,859 | ||||||||||||||
| Balance outstanding at end of year | 16,249 | 4,927 | 4,455 | |||||||||||||||||
| Average outstanding during the year | 7,636 | 5,509 | 2,862 | |||||||||||||||||
| Average interest rate during the year | 2.24 | % | 1.92 | % | 1.06 | % | ||||||||||||||
| Average interest rate at end of year | 1.75 | 2.49 | 1.34 | |||||||||||||||||
At December 31, 2019, short-term borrowings totaled $18.2 billion, an increase of $13.0 billion compared to December 31, 2018. Short-term borrowings of $6.8 billion were assumed as a result of the Merger. The remaining increase was due to increased liquidity in anticipation of the Merger. Average short-term borrowings were $8.5 billion, or 4.0% of total funding in 2019, as compared to $6.0 billion, or 3.1% in 2018.
Long-term debt provides funding and, to a lesser extent, regulatory capital, and primarily consists of senior and subordinated notes issued by Truist and Truist Bank. Long-term debt totaled $41.3 billion at December 31, 2019, an increase of $17.6 billion compared to December 31, 2018. Long-term debt of $19.5 billion was assumed as a result of the Merger. Truist's issuances of debt included $3.5 billion of senior notes and $650 million of subordinated notes, partially offset by maturities of $3.1 billion of senior notes and $586 million of subordinated notes. Truist Bank's issuances included $1.2 billion of senior notes and $750 million of subordinated notes, partially offset by maturities of $4.7 billion of senior notes. The average cost of long-term debt was 3.22% for the year ended December 31, 2019, up 34 basis points compared to the same period in 2018.
FHLB advances represented 10.0% of total outstanding long-term debt at December 31, 2019, compared to 7.4% at December 31, 2018. See "Note 11. Borrowings" for additional disclosures.
Shareholders' Equity
Total shareholders' equity was $66.6 billion at December 31, 2019, an increase of $36.4 billion from December 31, 2018. Equity issued in connection with the Merger was $33.5 billion. Truist issued $1.7 billion of preferred stock during the year and redeemed a similar amount from two higher-cost issuances. In connection with the redemptions, net income available to common shareholders was reduced by $46 million to recognize the difference in the redemption price and the carrying value. Other significant changes include net income of $3.2 billion and an increase in AOCI of $871 million, which was partially offset by $1.5 billion for common and preferred dividends. Truist's book value per common share at December 31, 2019 was $45.66, compared to $35.46 at December 31, 2018.
Risk Management
Truist maintains a comprehensive risk management framework supported by people, processes and systems to identify, measure, monitor, manage and report significant risks arising from its exposures and business activities. Effective risk management involves appropriately managing risk to optimize risk and return, operate in a safe and sound manner, and is designed to ensure compliance with applicable laws and regulations. The Company’s risk management framework is designed to ensure that business strategies and objectives are executed in alignment with its risk appetite.
Truist is committed to fostering a culture that supports transparency and escalation of risks across the organization. All teammates are responsible for upholding the Company’s purpose, mission, and values, and are encouraged to speak up if there is any activity or behavior that is inconsistent with the Company’s culture. The Truist code of ethics guides and unites the Company’s decision making and informs teammates on how to act in the absence of specific guidance.
Truist seeks an appropriate return for the risk taken in its business operations. Risk-taking activities are evaluated and prioritized to identify those that present attractive risk-adjusted returns, while preserving asset value and capital.
Compensation decisions take into account a teammate's adherence to, and successful implementation of, Truist's risk values and associated policies and procedures. The Company's compensation structure supports its core values and sound risk management practices in an effort to promote judicious risk-taking behavior.
Truist Financial Corporation 59
Truist employs a comprehensive change management program to manage the risks associated with integrating heritage BB&T and heritage SunTrust. The Board and Executive Leadership oversee the change management program, which is designed to ensure key decisions are reviewed and that there is appropriate oversight of integration activities.
Truist's purpose, mission and values are the foundation for the risk management framework utilized at Truist and therefore serve as the basis on which the risk appetite and risk strategy are built. Truist's RMO provides independent oversight and guidance for risk-taking across the enterprise. In keeping with the belief that consistent values drive long-term behaviors, Truist's RMO has established the following risk values which guide teammates’ day-to-day activities:
•
Managing risk is the responsibility of every teammate.
•
Proactively identifying risk and managing the inherent risks of their businesses is the responsibility of the business units.
•
Managing risk with a balanced approach which includes quality, profitability, and growth.
•
Measuring what is managed and managing what is measured.
•
Utilizing sound and consistent risk management practices.
•
Thoroughly analyzing risk quantitatively and qualitatively.
•
Realizing lower cost of capital from high quality risk management.
Truist places significant emphasis on risk management oversight and maintains a separate Board-level Risk Committee, which assists the Board in its oversight of the Company’s risk management function. The Committee is responsible for approving and periodically reviewing the Company’s risk management framework and risk management policies as well as monitoring the Company’s risk profile, approving risk appetite statements, and providing input to management regarding Truist's risk appetite and risk profile.
The RMO is led by the CRO and is responsible for overseeing the identification, measurement, monitoring, management and reporting of risk. The CRO has direct access to the Board to communicate any risk issues (current or emerging) as well as the performance of the risk management activities throughout the enterprise.
As illustrated below, the risk management framework is supported by three lines of defense. The following figure describes the roles of the three lines of defense:
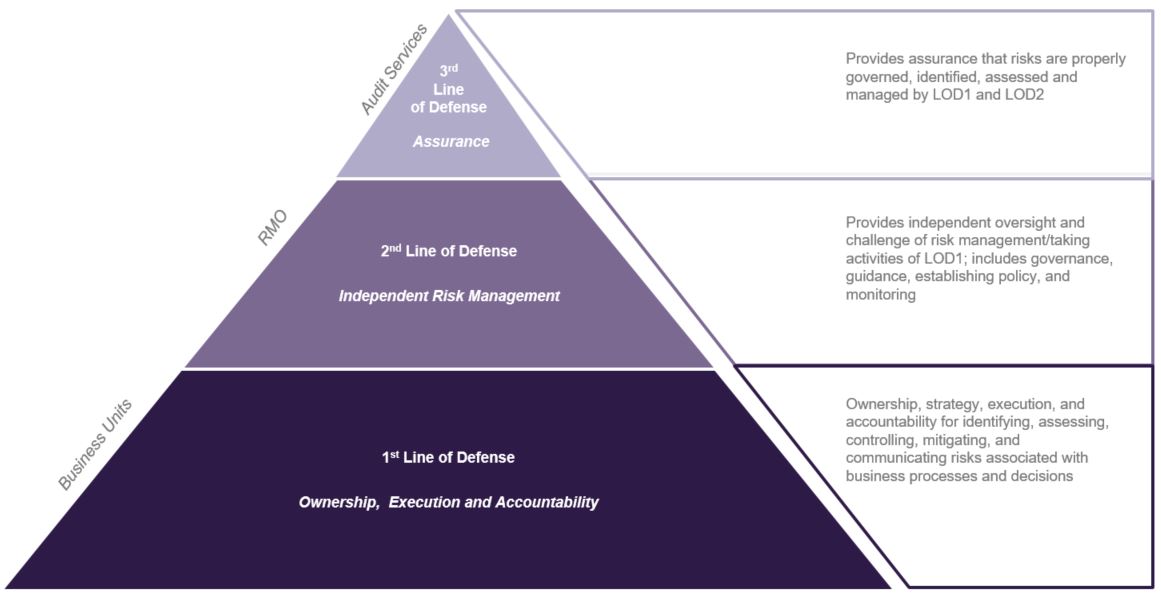
Truist’s Risk Governance framework is designed to provide comprehensive Board and Executive Leadership risk oversight, maintaining a committee governance structure that is designed to ensure alignment and execution of the risk management framework. The committee structure provides a mechanism to allow for efficient aggregation and escalation of risk information from the BUs up to the risk programs, Executive Leadership and ultimately the Board.
60 Truist Financial Corporation

The executive level committees include the ERC, ECRPMC, MRLCC, EBPCC, TMC and DC, each of which is chaired by a member of Executive Leadership. These committees provide oversight of each of the primary risk types.
The ERC establishes a fully integrated view of risks across the company, provides broad strategic oversight of all risk types, and oversees corporate-wide strategies for identifying, assessing, controlling, measuring, monitoring and reporting risk at the enterprise level.
The ERC is responsible for maintaining an effective risk management framework and monitoring its adoption and execution across the enterprise. The ERC is chaired by the CRO and its membership includes all members of Executive Leadership and the General Auditor.
The principal types of inherent risk include credit, liquidity, compliance, strategic and reputation, operational, and market risks. The following is a discussion of these risks.
Credit risk
Credit risk is the risk to current or anticipated earnings or capital arising from the default, inability or unwillingness of a borrower, obligor, or counterparty to meet the terms of any financial obligation to Truist or otherwise perform as agreed. Credit risk exists in all activities where success depends on the performance of a borrower, obligor, or counterparty. Credit risk arises when Truist funds are extended, committed, invested, or otherwise exposed through actual or implied contractual agreements, whether on or off-balance sheet. Credit risk increases when the credit quality of an issuer whose securities or other instruments the bank holds deteriorates.
Truist has established the following general practices to manage credit risk:
•
limiting the amount of credit that individual lenders may extend to a borrower;
•
establishing a process for credit approval accountability;
•
careful initial underwriting and analysis of borrower, transaction, market and collateral risks;
•
ongoing servicing and monitoring of individual loans and lending relationships;
•
continuous monitoring of the portfolio, market dynamics and the economy; and
•
periodically reevaluating the Company's strategy and overall exposure as economic, market and other relevant conditions change.
The following discussion describes the underwriting procedures and overall risk management of Truist's lending function.
Truist Financial Corporation 61
Underwriting Approach
The loan portfolio is a primary source of profitability and risk; therefore, proper loan underwriting is critical to Truist's long-term financial success. Truist's underwriting approach is designed to define acceptable combinations of specific risk-mitigating features that ensure credit relationships conform to Truist's risk philosophy. Provided below is a summary of the most significant underwriting criteria used to evaluate new loans and loan renewals:
•
Cash flow and debt service coverage -
cash flow adequacy is a necessary condition of creditworthiness, meaning that loans must either be clearly supported by a borrower's cash flow or, if not, must be justified by secondary repayment sources.
•
Secondary sources of repayment -
alternative repayment funds are a significant risk-mitigating factor as long as they are liquid, can be easily accessed, and provide adequate resources to supplement the primary cash flow source.
•
Value of any underlying collateral -
loans are generally secured by the asset being financed. Because an analysis of the primary and secondary sources of repayment is the most important factor, collateral, unless it is liquid, does not justify loans that cannot be serviced by the borrower's normal cash flows.
•
Overall creditworthiness of the client, taking into account the client's relationships, both past and current, with Truist and other lenders -
Truist's success depends on building lasting and mutually beneficial relationships with clients, which involves assessing their financial position and background.
•
Level of equity invested in the transaction -
in general, borrowers are required to contribute or invest a portion of their own funds prior to any loan advances.
Refer to the "Lending Activities" section in this MD&A for a discussion of each loan and lease portfolio.
Liquidity risk
Liquidity risk is the risk that (i) Truist will be unable to meet its obligations as they come due because of an inability to liquidate assets or obtain adequate funding (funding liquidity risk), or (ii) Truist cannot easily unwind or offset specific exposures without significantly lowering market prices because of inadequate market depth or market disruptions (market liquidity risk).
Compliance risk
Compliance risk is the risk to current or anticipated earnings or capital arising from violations of laws, rules or regulations, or from non-conformance with prescribed practices, internal policies and procedures or ethical standards. This risk exposes Truist to fines, civil monetary penalties, payment of damages and the voiding of contracts. Compliance risk can result in diminished reputation, reduced franchise or enterprise value, limited business opportunities and lessened expansion potential.
Operational risk
Operational risk is the risk to current or anticipated earnings or capital arising from inadequate or failed internal processes, people and systems or from external events. It includes legal risk, which is the risk of loss arising from defective transactions, litigation or claims made, or the failure to adequately protect company-owned assets. An operational loss occurs when an event results in a loss or reserve originating from operational risk.
Truist has developed and employs a risk taxonomy that further guides business functions in identifying, measuring, responding to, monitoring and reporting on possible operational losses to the organization. The risk taxonomy drives internal risk conversations and enables Truist to clearly and transparently communicate to external stakeholders the level of potential operational risk we face, both presently and in the future, and our position on managing it to acceptable levels.
Technology risk
Technology risk is the business risk associated with the use, ownership, operation, involvement, influence and adoption of information technology across the Company. Truist has defined and adopted a technology risk framework that provides the foundation for technology risk strategy, program and oversight and defines key objectives, operating model components, risk domains and capabilities to manage this risk.
Cybersecurity risk
Digital technology is constantly evolving, and new and unforeseen threats and actions by others may disrupt operations or result in losses beyond Truist’s risk control thresholds. Truist maintains a comprehensive risk-based information security / cybersecurity framework implemented through people, processes, and technology whereby Truist monitors and evaluates threats, events, and the performance of its business operations and continually adapts its risk mitigation activities accordingly.
62 Truist Financial Corporation
Truist's framework aligns with those of the National Institute of Standards and Technology, the International Standards Organization 27000 series, the IT Governance Institute, and the Control Objectives for Information and Related Technology, as well as conforms with the requirements and guidance from applicable regulatory authorities, including the Federal Financial Institutions Examination Council. In addition, Truist’s risk-based information security / cybersecurity framework, which includes internally and externally focused capabilities, drives the development and implementation of Truist’s holistic data security strategy that is designed to reduce risk while enabling Truist’s corporate business objectives.
Truist has built an organization with dedicated, skilled talent to sustain the cross-company partnerships needed to operationalize Truist’s cybersecurity strategy as well as to continue enhancing multilayered defenses pertaining to early and rapid cyber threat identification, detection, protection, response, and recovery by identifying and deploying advanced capabilities best suited to help proactively prevent and mitigate risk. Truist also participates in the federally recognized financial sector information sharing organization structure, known as the Financial Services Information Sharing and Analysis Center as a key part of Truist’s cyber threat intelligence and response programs, as well as other industry organizations and initiatives that promote industry best practices such as harmonized cybersecurity standards, cyber readiness, and secure consumer financial data sharing.
To further mitigate the risks presented by an evolving cyber threat landscape, Truist provides data protection guidance to clients through multiple print and digital channels as well as promotes data protection awareness and accountability through robust training for teammates. Truist conducts routine test simulation exercises which are scenario driven and simulate impacts and consequences developed through analysis of real-world technology incidents as well as known and anticipated cyber threats. These exercises are designed to assess the viability of Truist’s crisis response and management programs and provide the basis for continuous improvement. Truist also consults with third party data security experts.
Truist’s cybersecurity risk program is overseen by the Board and Executive Leadership. The Board devotes significant time and attention to its oversight of cyber security risk and approves related information security policies. Although Truist has invested substantial time and resources to manage and reduce cyber risk, it is not possible to completely eliminate this risk. Truist obtains cyber security insurance that protects against certain losses, expenses, and damages associated with cyber risk. See Item 1A, “Risk Factors,” for additional information regarding cybersecurity risk.
Model risk
Model risk is the risk to current or anticipated earnings or capital from decisions based on incorrect or misused model outputs. Truist uses models for many purposes, including the valuation of financial positions, estimation of credit losses, and the measurement of risk. Valuation models are used to value certain financial instruments for which quoted prices may not be readily available. Valuation models are also used as inputs for VaR, the estimation of VaR itself, regulatory capital, stress testing and the ACL. Models are owned by the applicable BUs, who are responsible for the development, implementation and use of their models. Oversight of these functions is performed by the MRM, which is a component of the RMO. Once models have been approved, model owners are responsible for the maintenance of an appropriate operating environment and must monitor and evaluate the performance of the models on a recurring basis. Models are updated in response to changes in portfolio composition, industry and economic conditions, technological capabilities and other developments.
MRM manages model risk in a holistic manner through a suite of model governance and model validation activities. The risk of each model is assessed and classified into various risk tiers. Additionally, MRM maintains an enterprise-wide model inventory containing relevant model information. Regarding model validation, MRM utilizes internal validation analysts and managers with skill sets in predictive modeling to perform detailed reviews of model development, implementation and conceptual soundness. On certain occasions, the MRM will also engage external parties to assist with validation efforts. Once in a production environment, MRM assesses a model’s performance on a periodic basis through ongoing monitoring reviews. MRM tracks issues that have been identified during model validation or through ongoing monitoring, and engages with model owners to ensure their timely remediation. MRM presents model limitations and risks to management and the Board of Directors via model validation reports and regular meetings with the Model Risk Management Committee.
Truist Financial Corporation 63
Strategic and reputation risk
Strategic risk is the risk of financial loss, diminished stakeholder confidence, or negative impact to human capital resulting from ineffective strategy setting and execution, adverse business decisions, or lack of responsiveness to changes in the banking industry and operating environment. Truist is committed to fulfilling its overall strategic objectives by selecting business strategies and operating businesses in a manner consistent with achieving profitability/earnings growth and maintaining strong confidence and trust with its key stakeholder constituencies.
Reputation risk is the risk to current or anticipated earnings, capital, enterprise value, the Truist brand, and public confidence arising from negative publicity or public opinion, whether real or perceived, regarding Truist's business practices, products, services, transactions, or other activities undertaken by Truist, its representatives, or its partners. A negative reputation may impair Truist's relationship with clients, associates, communities or shareholders, and it is often a residual risk that arises when other risks are not managed properly.
Market risk management
Market risk is the risk to current or anticipated earnings or capital arising from changes in the market value of portfolios, securities, or other financial instruments. Market risk results from changes in the level, volatility or correlations among financial market rates or prices, including interest rates, foreign exchange rates, equity prices, commodity prices or other relevant rates or prices.
Effective management of market risk is essential to achieving Truist's strategic financial objectives. Truist's most significant market risk exposure is to interest rate risk in its balance sheet; however, market risk also results from product liquidity risk, price risk and volatility risk in Truist's BUs. Interest rate risk results from differences between the timing of rate changes and the timing of cash flows (re-pricing risk); from changing rate relationships among different yield curves affecting bank activities (basis risk); from changing rate relationships across the spectrum of maturities (yield curve risk); and from interest-related options embedded in bank products (options risk).
The primary objectives of market risk management are to minimize adverse effects from changes in market risk factors on net interest income, net income and capital and to offset the risk of price changes for certain assets and liabilities recorded at fair value. At Truist, market risk management also includes the enterprise-wide IPV function.
Interest rate market risk (other than trading)
As a financial institution, Truist is exposed to interest rate risk both on its assets and on its liabilities. Since interest rate changes are out of the control of any private sector institution, Truist actively manages its interest rate risk with the strategic repricing of its assets and liabilities, taking into account the volumes, maturities and mix, with the goal of keeping net interest margin as stable as possible. Truist primarily uses three methods to measure and monitor its interest rate risk: (i) a model that simulates possible changes to net interest income over the next two years based on a set of assumptions; (ii) an analysis of interest rate shock scenarios; and (iii) a model that analyzes the economic value of equity based on changes in interest rates.
The simulation model takes into account assumptions about prepayment trends, using a combination of market data and internal historical experiences for deposits and loans, as well as scheduled maturities and payments and the likely outlook for the economy and interest rates. These assumptions are reviewed and adjusted monthly to reflect changes in market interest rates as compared to the rates of Truist’s assets and liabilities. The model also considers Truist's current and prospective liquidity position, current balance sheet volumes and projected growth, accessibility of funds for short-term needs and capital maintenance.
Deposit betas are an important assumption in the interest rate risk modeling process. Truist applies an average deposit beta (the difference between rates Truist pays and market rates) of approximately 60% to its non-maturity interest-bearing deposit accounts for determining its interest rate sensitivity. Non-maturity, interest-bearing deposit accounts include interest checking accounts, savings accounts and money market accounts that do not have a contractual maturity. Truist also regularly conducts sensitivity analyses on other key variables, including noninterest-bearing deposits, to determine the impact they could have on the interest rate risk position. The predictive value of the simulation model depends upon the accuracy of the assumptions, but management believes that it provides helpful data for the management of interest rate risk.
64 Truist Financial Corporation
The following table shows the effect that the indicated changes in interest rates would have on net interest income as projected for the next twelve months assuming a gradual change in interest rates as described below. The decrease in rate sensitivity versus the prior period is related to the Merger, alignment of modeling assumptions and recent balance sheet restructuring activities.
| Table 26: Interest Sensitivity Simulation Analysis | ||||||||||||||||||||||||||
| Interest Rate Scenario | Annualized Hypothetical Percentage Change in Net Interest Income | |||||||||||||||||||||||||
| Linear Change in Prime Rate (bps) | Prime Rate | |||||||||||||||||||||||||
| Dec 31, 2019 | Dec 31, 2018 | Dec 31, 2019 | Dec 31, 2018 | |||||||||||||||||||||||
| Up 100 | 5.75 | % | 6.50 | % | 0.95 | % | 1.22 | % | ||||||||||||||||||
| Up 50 | 5.25 | 6.00 | 0.75 | 0.65 | ||||||||||||||||||||||
| No Change | 4.75 | 5.50 | — | — | ||||||||||||||||||||||
| Down 50 | 4.25 | 5.00 | (1.18) | (1.30) | ||||||||||||||||||||||
| Down 100 | 3.75 | 4.50 | (1.72) | (3.17) | ||||||||||||||||||||||
Truist has established parameters related to interest rate sensitivity measures that prescribe a maximum impact on net interest income under different interest rate scenarios that would result in an escalation to the Board. The following parameters and interest rate scenarios are considered Truist's primary measures of interest rate risk:
•
Maximum impact on net interest income of 7.5% for the next 12 months assuming a 25 basis point change in interest rates each quarter for four quarters; and a
•
Maximum impact on net interest income of 10% for an immediate 100 basis point parallel change in rates.
This interest rate shock analysis is designed to create an outer bound of acceptable interest rate risk.
Truist also uses an EVE analysis to focus on longer-term projected changes in asset and liability values given potential changes in interest rates. This measure allows Truist to analyze interest rate risk that falls outside the simulation model parameters. The EVE model is a discounted cash flow of the portfolio of assets, liabilities and derivative instruments. The difference in the present value of assets minus the present value of liabilities is defined as EVE.
The following table shows the effect that the indicated changes in interest rates would have on EVE:
| Table 27: EVE Simulation Analysis | ||||||||||||||
| Change in Interest Rates (bps) | Hypothetical Percentage Change in EVE | |||||||||||||
| Dec 31, 2019 | Dec 31, 2018 | |||||||||||||
| Up 100 | (2.9) | % | (0.7) | % | ||||||||||
| No Change | — | — | ||||||||||||
| Down 100 | (3.0) | (6.2) | ||||||||||||
Truist uses derivatives primarily to manage interest rate risk related to securities, commercial loans, MSRs and mortgage banking operations, long-term debt and other funding sources. Truist also uses derivatives to facilitate transactions on behalf of its clients. As of December 31, 2019, Truist had derivative financial instruments outstanding with notional amounts totaling $315.9 billion, with a net fair value of $1.7 billion. See "Note 19. Derivative Financial Instruments" for additional disclosures.
LIBOR in its current form may no longer be available after 2021. Truist has LIBOR-based contracts that extend beyond 2021. To prepare for the possible transition to an alternative reference rate, management has formed a cross-functional project team to address the LIBOR transition. The project team has performed an assessment to identify the potential risks related to the transition from LIBOR to a new index. The project provides regular reports to the Board and Risk Management Committees.
The project team is reviewing contract fallback language for loans and leases and noted that certain contracts will need updated provisions for the transition and is coordinating with impacted lines of business to update LIBOR fallback language generally consistent with the ARRC recommendation. Truist is continuing to evaluate the impact on these contracts and other financial instruments, systems implications, hedging strategies, and other related operational and market risks. Market risks associated with this change are dependent on the alternative reference rates available and market conditions at transition. For a further discussion of the various risks associated with the potential cessation of LIBOR and the transition to alternative reference rates, refer to the section titled "Item 1A. Risk Factors."
Truist Financial Corporation 65
Market risk from trading activities
Truist also manages market risk associated with trading activities. Truist is a financial intermediary that provides its clients access to derivatives, foreign exchange and securities markets. Trading market risk is managed using a comprehensive risk management approach, which includes measuring risk using VaR, stress testing and sensitivity analysis. Risk metrics are monitored against limits on a daily basis at both trading desks and at the aggregate portfolio level to ensure exposures are in line with Truist's risk appetite.
Truist is subject to risk-based capital guidelines for market risk under the Market Risk Rule, issued jointly by the OCC, U.S. Treasury FRB and FDIC.
Covered trading positions
The trading portfolio of covered positions subject to the Market Risk Rule results primarily from market making and underwriting services for our clients, as well as associated risk mitigating hedging activity. The trading portfolio, measured in terms of VaR, consists primarily of four sub-portfolios of covered positions: (i) credit trading, (ii) fixed income securities, (iii) interest rate derivatives and (iv) equity derivatives. As a market maker, Truist’s trading portfolio also contains other sub-portfolios, including foreign exchange rate and commodity derivatives; however, these portfolios do not generate material trading risk exposures.
Valuation policies, procedures, and methodologies exist for all covered positions. Additionally, trading positions are subject to independent price verification. See "Note 19. Derivative Financial Instruments,” "Note 18. Fair Value Disclosures,” and “Critical Accounting Policies” herein for discussion of valuation policies, procedures and methodologies.
Securitizations
As of December 31, 2019, the aggregate market value of on-balance sheet securitization positions subject to the Market Risk Rule was $23 million, all of which were non-agency asset backed securities positions. Consistent with the Market Risk Rule requirements, the Company performs pre-purchase due diligence on each securitization position to identify the characteristics including, but not limited to, deal structure and the asset quality of the underlying assets, that materially affect valuation and performance. Securitization positions are subject to Truist’s comprehensive risk management framework, which includes daily monitoring against a full suite of limits. There were no off-balance sheet securitization positions during the reporting period.
Correlation trading positions
The trading portfolio of covered positions did not contain any correlation trading positions as of December 31, 2019 or 2018.
VaR-based measures
VaR measures the estimated potential loss at a specified confidence level and time horizon. Truist utilizes a historical VaR methodology to measure and aggregate risks across its covered trading positions. Following the Merger, Truist elected to migrate all covered positions to the heritage SunTrust VaR system and methodology. For an interim period, VaR for a subset of heritage BB&T positions, specifically those covered positions held in BB&T Securities, will be calculated using the heritage BB&T VaR system and methodology. As such, pending full integration, Truist will operate two historical VaR models and aggregate company-wide VaR will be determined additively with no benefit of diversification. For risk management purposes, the VaR calculation is based on a historical simulation approach and measures the potential trading losses using a one-day holding period at a one-tail, 99% confidence level. For Market Risk Rule purposes, the Company calculates VaR using a 10-day holding period and a 99% confidence level. Due to inherent limitations of the VaR methodology, such as the assumption that past market behavior is indicative of future market performance, VaR is only one of several tools used to measure and manage market risk. Other tools used to actively manage market risk include stress testing, profit and loss attribution, and stop loss limits.
66 Truist Financial Corporation
The trading portfolio’s VaR profile is influenced by a variety of factors, including the size and composition of the portfolio, market volatility and the correlation between different positions. The following table summarizes certain VaR-based measures. VaR measures at December 31, 2019 reflects the aggregate VaR measure of the Truist trading portfolio. Average VaR measures reflect heritage SunTrust after the Merger.
| Table 28: VaR-based Measures | |||||||||||||||||||||||
| 2019 | 2018 | ||||||||||||||||||||||
|
Year Ended December 31,
(Dollars in millions) |
10-Day Holding Period | 1-Day Holding Period | 10-Day Holding Period | 1-Day Holding Period | |||||||||||||||||||
| VaR-based Measures: | |||||||||||||||||||||||
| Maximum | $ | 9 | $ | 2 | $ | 2 | $ | 1 | |||||||||||||||
| Average | 1 | 1 | 1 | 1 | |||||||||||||||||||
| Minimum | — | — | — | — | |||||||||||||||||||
| Period-end | 7 | 2 | 1 | 1 | |||||||||||||||||||
| VaR by Risk Class: | |||||||||||||||||||||||
| Interest Rate Risk | 2 | 1 | |||||||||||||||||||||
| Credit Spread Risk | 3 | — | |||||||||||||||||||||
| Equity Price Risk | 2 | — | |||||||||||||||||||||
| Foreign Exchange Risk | — | — | |||||||||||||||||||||
| Portfolio Diversification | (5) | — | |||||||||||||||||||||
| Period-end | 2 | 1 | |||||||||||||||||||||
Stressed VaR-based measures
Stressed VaR, another component of market risk capital, is calculated using the same internal models as used for the VaR-based measure. Stressed VaR is calculated over a ten-day holding period at a one-tail, 99% confidence level and employs a historical simulation approach based on a continuous twelve-month historical window selected to reflect a period of significant financial stress for our trading portfolio. The following table summarizes Stressed VaR-based measures:
| Table 29: Stressed VaR-based Measures - 10 Day Holding Period | |||||||||||
|
Year Ended December 31,
(Dollars in millions) |
2019 | 2018 | |||||||||
| Maximum | $ | 33 | $ | 7 | |||||||
| Average | 5 | 5 | |||||||||
| Minimum | 2 | 3 | |||||||||
| Period-end | 28 | 5 | |||||||||
Specific risk measures
Specific risk is a measure of idiosyncratic risk that could result from risk factors other than broad market movements (e.g. default, event risks). The Market Risk Rule provides fixed risk weights under a standardized measurement method while also allowing a model-based approach, subject to regulatory approval. Truist utilizes the standardized measurement method to calculate the specific risk component of market risk regulatory capital. As such, incremental risk capital and comprehensive risk measure capital requirements do not apply.
VaR model backtesting
In accordance with the Market Risk Rule, the Company evaluates the accuracy of its VaR model through daily backtesting by comparing aggregate daily trading gains and losses (excluding fees, commissions, reserves, net interest income, and intraday trading) from covered positions with the corresponding daily VaR-based measures generated by the model. The number of company-wide VaR backtesting exceptions over the preceding twelve months is used to determine the multiplication factor for the VaR-based capital requirement under the Market Risk Rule. The capital multiplication factor increases from a minimum of three to a maximum of four, depending on the number of exceptions. There were two company-wide VaR backtesting exceptions during the twelve months ended December 31, 2019. In accordance with established policy and procedure, all company-wide VaR backtesting exceptions are thoroughly reviewed in the context of VaR model use and performance. There was no change in the capital multiplication factor over the preceding twelve months.
Truist Financial Corporation 67
Model risk management
Management's approach to the validation and evaluation of the accuracy of Truist's models, and associated processes, includes conceptual soundness, developmental and implementation testing as well as outcomes analysis, ongoing monitoring and maintenance performed by the various model developers, in conjunction with model owners.
MRM is responsible for the independent model validation of all decision tools and models including trading market risk models. The validation activities are conducted in accordance with MRM standards, which includes regulatory guidance related to the evaluation of model conceptual soundness, ongoing monitoring and outcomes analysis. As part of ongoing monitoring efforts, the performance of all trading risk models are reviewed regularly to preemptively address emerging developments in financial markets, assess evolving modeling approaches, and to identify potential model enhancement.
Stress testing
The Company uses a comprehensive range of stress testing techniques to help monitor risks across trading desks and to augment standard daily VaR and other risk limits reporting. The stress testing framework is designed to quantify the impact of extreme, but plausible, stress scenarios that could lead to large unexpected losses. Stress tests include simulations for historical repeats and hypothetical risk factor shocks. All trading positions within each applicable market risk category (interest rate risk, equity risk, foreign exchange rate risk, credit spread risk, and commodity price risk) are included in the Company's comprehensive stress testing framework. Management reviews stress testing scenarios on an ongoing basis and makes updates, as necessary, to ensure that both current and emerging risks are captured appropriately. Management also utilizes stress analyses to support the Company’s capital adequacy assessment standards. See the “Capital” section of this MD&A for additional discussion of capital adequacy.
Liquidity
Liquidity represents the continuing ability to meet funding needs, including deposit withdrawals, timely repayment of borrowings and other liabilities, and funding of loan commitments. In addition to the level of liquid assets, such as cash, cash equivalents and AFS securities, other factors affect the ability to meet liquidity needs, including access to a variety of funding sources, maintaining borrowing capacity in national money markets, growing core deposits, loan repayment and the ability to securitize or package loans for sale.
Truist monitors the ability to meet client demand for funds under both normal and stressed market conditions. In considering its liquidity position, management evaluates Truist's funding mix based on client core funding, client rate-sensitive funding and national markets funding. In addition, management evaluates exposure to rate-sensitive funding sources that mature in one year or less. Management also measures liquidity needs against 30 days of stressed cash outflows for Truist and Truist Bank. To ensure a strong liquidity position, and compliance with regulatory requirements, management maintains a liquid asset buffer of cash on hand and highly liquid unencumbered securities. As of December 31, 2019 and December 31, 2018, Truist's liquid asset buffer was 16.5% and 14.7%, respectively, of total assets.
LCR rules require large U.S. banking organizations to hold unencumbered high-quality liquid assets sufficient to withstand projected 30-day total net cash outflows, each as defined under the LCR rule. As of December 31, 2019, Truist is subject to modified LCR requirements. Truist's modified average LCR was 165% for the three months ended December 31, 2019, relative to the regulatory minimum for such entities of 100%. This represents the month-end results for heritage BB&T from October and November 2019 averaged with the merged Truist result for December 2019.
Under the Tailoring Rules, Truist is a Category III banking organization, and therefore is subject to a reduced tailored LCR requirement (85%) effective January 1, 2020 and will be subject to daily calculation beginning January 1, 2021. See additional disclosures in the "Regulatory Considerations" section in this MD&A.
Parent Company
The Parent Company serves as the primary source of capital for the operating subsidiaries. The Parent Company's assets consist primarily of cash on deposit with Truist Bank, equity investments in subsidiaries, advances to subsidiaries, and accounts receivable from subsidiaries. The principal obligations of the Parent Company are payments on long-term debt. The main sources of funds for the Parent Company are dividends and management fees from subsidiaries, repayments of advances to subsidiaries, and proceeds from the issuance of equity and long-term debt. The primary uses of funds by the Parent Company are investments in subsidiaries, advances to subsidiaries, dividend payments to common and preferred shareholders, retirement of common stock, and payments on long-term debt.
See "Note 22. Parent Company Financial Information" for additional information regarding dividends from subsidiaries and debt transactions.
68 Truist Financial Corporation
Access to funding at the Parent Company is more sensitive to market disruptions. Therefore, Truist prudently manages cash levels at the Parent Company to cover a minimum of one year of projected cash outflows which includes unfunded external commitments, debt service, common and preferred dividends and scheduled debt maturities, without the benefit of any new cash inflows. Truist maintains a significant buffer above the projected one year of cash outflows. In determining the buffer, Truist considers cash requirements for common and preferred dividends, unfunded commitments to affiliates, serving as a source of strength to Truist Bank, and being able to withstand sustained market disruptions that could limit access to the capital markets. At December 31, 2019 and December 31, 2018, the Parent Company had 29 months and 28 months, respectively, of cash on hand to satisfy projected contractual cash outflows, and 20 months and 19 months, respectively, when including the payment of common stock dividends.
Truist Bank
Truist carefully manages liquidity risk at Truist Bank. Truist Bank's primary source of funding is client deposits. Continued access to client deposits is highly dependent on public confidence in the stability of Truist Bank and its ability to return funds to clients when requested.
Truist Bank has several major sources of funding to meet its liquidity requirements, including access to capital markets through issuance of senior or subordinated bank notes and institutional CDs, FHLB advances, repurchase agreements, overnight and term Federal funds markets, retail brokered CDs, and the FRB discount window. At December 31, 2019, Truist Bank has approximately $121.8 billion of secured borrowing capacity, which represents approximately 3.4 times the amount of one year wholesale funding maturities.
The ability to raise funding at competitive prices is affected by the rating agencies' views of the Parent Company's and Truist Bank's credit quality, liquidity, capital and earnings. Management meets with the rating agencies on a regular basis to discuss current outlooks. The ratings for Truist and Truist Bank by the major rating agencies are detailed in the table below:
| Table 30: Credit Ratings of Truist Financial Corporation and Truist Bank | |||||||||||||||||||||||
| S&P | Moody's | Fitch | DBRS | ||||||||||||||||||||
| Truist Financial Corporation: | |||||||||||||||||||||||
| Commercial paper | A-2 | N/A | F1 | R-1(low) | |||||||||||||||||||
| Issuer | A- | A3 | A+ | A(high) | |||||||||||||||||||
| LT/senior debt | A- | A3 | A+ | A(high) | |||||||||||||||||||
| Subordinated debt | BBB+ | A3 | A | A | |||||||||||||||||||
| Preferred stock | BBB- | Baa2(hyb) | BBB- | BBB(high) | |||||||||||||||||||
| Truist Bank: | |||||||||||||||||||||||
| Long term deposits | N/A | Aa2 | AA- | AA(low) | |||||||||||||||||||
| LT/Senior unsecured bank notes | A | A2 | A+ | AA(low) | |||||||||||||||||||
| Other long term senior obligations | A | N/A | A+ | AA(low) | |||||||||||||||||||
| Other short term senior obligations | A-1 | N/A | F1 | R-1(middle) | |||||||||||||||||||
| Short term bank notes | A-1 | P-1 | F1 | R-1(middle) | |||||||||||||||||||
| Short term deposits | N/A | P-1 | F1+ | R-1(middle) | |||||||||||||||||||
| Subordinated bank notes | A- | A3 | A | A(high) | |||||||||||||||||||
| Ratings outlook: | |||||||||||||||||||||||
| Credit trend | Stable | Stable | Stable | Positive | |||||||||||||||||||
Truist has a contingency funding plan designed to ensure that liquidity sources are sufficient to meet ongoing obligations and commitments, particularly in the event of a liquidity contraction. This plan is designed to examine and quantify the organization's liquidity under various "stress" scenarios. Additionally, the plan provides a framework for management and other critical personnel to follow in the event of a liquidity contraction or in anticipation of such an event. The plan addresses authority for activation and decision making, liquidity options, and the responsibilities of key departments in the event of a liquidity contraction.
Management believes current sources of liquidity are adequate to meet Truist's current requirements and plans for continued growth. See "Note 9. Other Assets and Liabilities," "Note 11. Borrowings" and "Note 16. Commitments and Contingencies" for additional information regarding outstanding balances of sources of liquidity and contractual commitments and obligations.
Truist Financial Corporation 69
Contractual Obligations, Commitments, Contingent Liabilities and Off-Balance Sheet Arrangements
The following table presents Truist's contractual obligations by payment date as of December 31, 2019. The payment amounts represent amounts contractually due. The table excludes liabilities recorded where management cannot reasonably estimate the timing of any payments that may be required in connection with these liabilities. UTBs, which represent a reserve for tax positions taken or expected to be taken, which ultimately may not be sustained upon examination by taxing authorities, have been excluded from the table below since the ultimate amount and timing of any future tax settlements are uncertain. Refer to "Note 14. Income Taxes" for additional details related to UTBs.
| Table 31: Contractual Obligations and Other Commitments | ||||||||||||||||||||||||||||||||
|
December 31, 2019
(Dollars in millions) |
Total | Less than 1 Year | 1 to 3 Years | 3 to 5 Years | After 5 Years | |||||||||||||||||||||||||||
| Long-term debt and finance leases | $ | 41,362 | $ | 6,393 | $ | 15,873 | $ | 8,509 | $ | 10,587 | ||||||||||||||||||||||
| Operating leases | 2,366 | 375 | 711 | 517 | 763 | |||||||||||||||||||||||||||
| Commitments to fund affordable housing investments | 1,271 | 1,018 | 208 | 16 | 29 | |||||||||||||||||||||||||||
| Private equity and other investments commitments (1) | 577 | 319 | 133 | 100 | 25 | |||||||||||||||||||||||||||
| Time deposits | 35,896 | 29,397 | 5,349 | 1,052 | 98 | |||||||||||||||||||||||||||
| Contractual interest payments (2) | 4,615 | 1,384 | 1,692 | 973 | 566 | |||||||||||||||||||||||||||
| Purchase obligations (3) | 2,173 | 976 | 633 | 180 | 384 | |||||||||||||||||||||||||||
| Nonqualified benefit plan obligations (4) | 1,358 | 26 | 48 | 50 | 1,234 | |||||||||||||||||||||||||||
| Total contractual cash obligations | $ | 89,618 | $ | 39,888 | $ | 24,647 | $ | 11,397 | $ | 13,686 | ||||||||||||||||||||||
(1)
Based on estimated payment dates.
(2)
Includes accrued interest and future contractual interest obligations. Variable rate payments are based upon the rate in effect at December 31, 2019.
(3)
Represents obligations to purchase goods or services that are enforceable and legally binding. Many of the purchase obligations have terms that are not fixed and determinable and are included in the table above based upon the estimated timing and amount of payment. In addition, certain of the purchase agreements contain clauses that would allow Truist to cancel the agreement with specified notice; however, that impact is not included in the table above.
(4)
Although technically unfunded plans, rabbi trusts and insurance policies on the lives of certain of the covered employees are available to finance future benefit plan payments.
Truist's commitments include investments in affordable housing projects throughout its market area and private equity funds. Refer to "Note 1. Basis of Presentation" and "Note 16. Commitments and Contingencies" for further discussion of these commitments. In addition, Truist enters into derivative contracts to manage various financial risks. Further discussion of derivative instruments is included in "Note 1. Basis of Presentation" and "Note 19. Derivative Financial Instruments." Further discussion related to the nature of Truist's obligations is included in "Note 16. Commitments and Contingencies." Further discussion of Truist's commitments is included in "Note 16. Commitments and Contingencies" and "Note 18. Fair Value Disclosures."
Capital
The maintenance of appropriate levels of capital is a management priority and is monitored on a regular basis. Truist's principal goals related to the maintenance of capital are to provide adequate capital to support Truist's risk profile consistent with the Board-approved risk appetite, provide financial flexibility to support future growth and client needs, comply with relevant laws, regulations, and supervisory guidance, achieve optimal credit ratings for Truist and its subsidiaries and provide a competitive return to shareholders. Risk-based capital ratios, which include CET1 capital, Tier 1 capital and Total capital are calculated based on regulatory guidance related to the measurement of capital and risk-weighted assets.
70 Truist Financial Corporation
Truist regularly performs stress testing on its capital levels and is required to periodically submit the Company's capital plans and stress testing results to the banking regulators. Management regularly monitors the capital position of Truist on both a consolidated and bank-level basis. In this regard, management's overriding policy is to maintain capital at levels that are in excess of internal capital targets, which are above the regulatory "well capitalized" minimums. Management has implemented stressed capital ratio minimum targets to evaluate whether capital ratios calculated after the effect of alternative capital actions are likely to remain above minimums specified by the FRB for the annual CCAR process. Breaches of stressed minimum targets prompt a review of the planned capital actions included in Truist's capital plan.
| Table 32: Capital Requirements and Targets | ||||||||||||||||||||||||||
| Minimum Capital | Well Capitalized | Minimum Capital Plus Capital Conservation Buffer | Truist Targets (1) | |||||||||||||||||||||||
| Truist | Truist Bank | Operating (2) | Stressed | |||||||||||||||||||||||
|
CET1
|
4.5 | % | NA | 6.5 | % | 7.0 | % | 8.5 | % | 7.0 | % | |||||||||||||||
| Tier 1 capital | 6.0 | 6.0 | 8.0 | 8.5 | 10.0 | 8.5 | ||||||||||||||||||||
| Total capital | 8.0 | 10.0 | 10.0 | 10.5 | 12.0 | 10.5 | ||||||||||||||||||||
| Leverage ratio | 4.0 | NA | 5.0 | N/A | 8.0 | 7.0 | ||||||||||||||||||||
(1)
The Truist targets are subject to revision based on finalization of pending regulatory guidance and other strategic factors.
(2)
Truist's goal is to maintain capital levels above all regulatory minimums.
While nonrecurring events or management decisions may result in the Company temporarily falling below its operating minimum guidelines for one or more of these ratios, it is management's intent to return to these targeted operating minimums within a reasonable period of time through capital planning. Such temporary decreases below the operating minimums shown above are not considered an infringement of Truist's overall capital policy, provided a return above the minimums is forecasted to occur within a reasonable time period.
Payments of cash dividends and repurchases of common shares are the methods used to manage any excess capital generated. In addition, management closely monitors the Parent Company's double leverage ratio (investments in subsidiaries as a percentage of shareholders' equity). The active management of the subsidiaries' equity capital, as described above, is the process used to manage this important driver of Parent Company liquidity and is a key element in the management of Truist's capital position.
Management intends to maintain capital at Truist Bank at levels that will result in classification as "well-capitalized" for regulatory purposes. Secondarily, it is management's intent to maintain Truist Bank's capital at levels that result in regulatory risk-based capital ratios that are generally comparable with peers of similar size, complexity and risk profile. If the capital levels of Truist Bank increase above these guidelines, excess capital may be transferred to the Parent Company in the form of special dividend payments, subject to regulatory and other operating considerations.
Management's capital deployment plan in order of preference is to focus on (i) organic growth, (ii) dividends, and (iii) strategic opportunities and/or share repurchases depending on opportunities in the marketplace and Truist's interest and ability to proceed with acquisitions. Truist has suspended share repurchases until capital ratios return to higher levels.
Truist Bank's capital ratios are presented in the following table:
| Table 33: Capital Ratios - Truist Bank | ||||||||||||||
| December 31, | 2019 | 2018 | ||||||||||||
| CET1 to risk-weighted assets | 10.6 | % | 11.2 | % | ||||||||||
| Tier 1 capital to risk-weighted assets | 10.6 | 11.2 | ||||||||||||
| Total capital to risk-weighted assets | 12.0 | 13.2 | ||||||||||||
| Leverage ratio | 14.5 | 9.3 | ||||||||||||
Truist Financial Corporation 71
Truist's capital ratios are presented in the following table:
| Table 34: Capital Ratios - Truist Financial Corporation | ||||||||||||||
|
December 31,
(Dollars in millions, except per share data, shares in thousands) |
2019 | 2018 | ||||||||||||
| Risk-based: | ||||||||||||||
| CET1 capital to risk-weighted assets | 9.5 | % | 10.2 | % | ||||||||||
| Tier 1 capital to risk-weighted assets | 10.8 | 11.8 | ||||||||||||
| Total capital to risk-weighted assets | 12.6 | 13.8 | ||||||||||||
| Leverage ratio | 14.7 | 9.9 | ||||||||||||
| Non-GAAP capital measure (1): | ||||||||||||||
| Tangible common equity per common share | $ | 25.93 | $ | 21.89 | ||||||||||
| Calculation of tangible common equity (1): | ||||||||||||||
| Total shareholders' equity | $ | 66,558 | $ | 30,178 | ||||||||||
| Less: | ||||||||||||||
| Preferred stock | 5,102 | 3,053 | ||||||||||||
| Noncontrolling interests | 174 | 56 | ||||||||||||
| Goodwill and intangible assets, net of deferred taxes | 26,482 | 10,360 | ||||||||||||
| Tangible common equity | $ | 34,800 | $ | 16,709 | ||||||||||
| Risk-weighted assets | $ | 376,056 | $ | 181,260 | ||||||||||
| Common shares outstanding at end of period | 1,342,166 | 763,326 | ||||||||||||
(1)
Tangible common equity and related measures are non-GAAP measures that exclude the impact of intangible assets, net of deferred taxes, and their related amortization. These measures are useful for evaluating the performance of a business consistently, whether acquired or developed internally. Truist's management uses these measures to assess the quality of capital and returns relative to balance sheet risk and believes investors may find them useful in their analysis of the Corporation.
These capital measures are not necessarily comparable to similar capital measures that may be presented by other companies.
During 2019,Truist paid $1.3 billion in common stock dividends, which resulted in a total payout ratio of 43.2% for the year.
Truist's Board increased the dividend by $0.045 during 2019, which increased the amount of the quarterly dividend to $0.45 per share. As previously communicated, Truist suspended its share repurchase program until capital ratios return to higher levels.
72 Truist Financial Corporation
| Table 35: Quarterly Financial Summary – Unaudited | |||||||||||||||||||||||||||||||||||||||||||||||
| 2019 | 2018 | ||||||||||||||||||||||||||||||||||||||||||||||
| (Dollars in millions, except per share data) | Fourth Quarter | Third Quarter | Second Quarter | First Quarter | Fourth Quarter | Third Quarter | Second Quarter | First Quarter | |||||||||||||||||||||||||||||||||||||||
|
Consolidated summary of operations:
|
|||||||||||||||||||||||||||||||||||||||||||||||
| Interest income | $ | 2,812 | $ | 2,218 | $ | 2,206 | $ | 2,173 | $ | 2,136 | $ | 2,069 | $ | 1,994 | $ | 1,921 | |||||||||||||||||||||||||||||||
| Interest expense | 585 | 518 | 516 | 477 | 431 | 382 | 337 | 288 | |||||||||||||||||||||||||||||||||||||||
| Provision for credit losses | 171 | 117 | 172 | 155 | 146 | 135 | 135 | 150 | |||||||||||||||||||||||||||||||||||||||
| Noninterest income | 1,398 | 1,303 | 1,352 | 1,202 | 1,235 | 1,239 | 1,222 | 1,180 | |||||||||||||||||||||||||||||||||||||||
| Noninterest expense | 2,575 | 1,840 | 1,751 | 1,768 | 1,784 | 1,742 | 1,720 | 1,686 | |||||||||||||||||||||||||||||||||||||||
| Provision for income taxes | 153 | 218 | 234 | 177 | 205 | 210 | 202 | 186 | |||||||||||||||||||||||||||||||||||||||
| Net income | 726 | 828 | 885 | 798 | 805 | 839 | 822 | 791 | |||||||||||||||||||||||||||||||||||||||
| Noncontrolling interest | 5 | 3 | (1) | 6 | 7 | 7 | 3 | 3 | |||||||||||||||||||||||||||||||||||||||
| Preferred stock dividends | 19 | 90 | 44 | 43 | 44 | 43 | 44 | 43 | |||||||||||||||||||||||||||||||||||||||
|
Net income available to common shareholders
|
$ | 702 | $ | 735 | $ | 842 | $ | 749 | $ | 754 | $ | 789 | $ | 775 | $ | 745 | |||||||||||||||||||||||||||||||
| Basic EPS | $ | 0.76 | $ | 0.96 | $ | 1.10 | $ | 0.98 | $ | 0.99 | $ | 1.02 | $ | 1.00 | $ | 0.96 | |||||||||||||||||||||||||||||||
| Diluted EPS | $ | 0.75 | $ | 0.95 | $ | 1.09 | $ | 0.97 | $ | 0.97 | $ | 1.01 | $ | 0.99 | $ | 0.94 | |||||||||||||||||||||||||||||||
| Selected average balances: | |||||||||||||||||||||||||||||||||||||||||||||||
| Assets | $ | 302,059 | $ | 232,420 | $ | 229,249 | $ | 225,573 | $ | 223,625 | $ | 222,674 | $ | 221,344 | $ | 221,419 | |||||||||||||||||||||||||||||||
| Securities, at amortized cost | 60,699 | 48,900 | 46,115 | 46,734 | 46,610 | 46,299 | 47,145 | 48,374 | |||||||||||||||||||||||||||||||||||||||
| Loans and leases (1) | 193,641 | 152,042 | 151,557 | 148,790 | 148,457 | 147,489 | 145,752 | 143,906 | |||||||||||||||||||||||||||||||||||||||
| Total earning assets | 263,115 | 203,408 | 200,839 | 197,721 | 197,213 | 196,200 | 195,094 | 194,530 | |||||||||||||||||||||||||||||||||||||||
| Deposits | 210,716 | 161,992 | 159,891 | 160,045 | 157,842 | 157,271 | 157,676 | 157,138 | |||||||||||||||||||||||||||||||||||||||
| Short-term borrowings | 11,489 | 8,307 | 8,367 | 5,624 | 6,979 | 6,023 | 5,323 | 5,477 | |||||||||||||||||||||||||||||||||||||||
| Long-term debt | 29,888 | 22,608 | 23,233 | 23,247 | 23,488 | 24,211 | 23,639 | 23,677 | |||||||||||||||||||||||||||||||||||||||
|
Total interest-bearing liabilities
|
187,608 | 140,407 | 138,811 | 136,633 | 134,577 | 133,331 | 132,675 | 132,896 | |||||||||||||||||||||||||||||||||||||||
| Shareholders' equity | 41,740 | 32,744 | 31,301 | 30,541 | 29,965 | 29,887 | 29,585 | 29,528 | |||||||||||||||||||||||||||||||||||||||
(1) Loans and leases are net of unearned income and include LHFS.
Fourth Quarter Results
Total taxable-equivalent revenues were $3.7 billion for the fourth quarter of 2019, an increase of $686 million compared to the earlier quarter, which reflects an increase of $523 million in taxable-equivalent net interest income and an increase of $163 million in noninterest income.
Net interest margin was 3.41%, down eight basis points compared to the earlier quarter. Average earning assets increased $65.9 billion. The increase in average earning assets reflects a $45.2 billion increase in average total loans and leases and a $14.1 billion increase in average securities. Average interest earning trading assets and other earning assets increased $6.6 billion due to higher trading securities and interest-bearing balances at the Federal Reserve. Average interest-bearing liabilities increased $53.0 billion compared to the earlier quarter. Average interest-bearing deposits increased $42.1 billion, average long-term debt increased $6.4 billion and average short-term borrowings increased $4.5 billion. The yield on the total loan portfolio for the fourth quarter of 2019 was 4.91%, down five basis points compared to the earlier quarter, reflecting the impact of rate decreases, partially offset by the accretion from the merged loans. The yield on the average securities portfolio was 2.65 percent, up 12 basis points compared to the earlier period.
The average cost of total deposits was 0.57 percent, up five basis points compared to the earlier quarter. The average cost of interest-bearing deposits was 0.82 percent, up four basis points compared to the earlier quarter. The average rate on short-term borrowings was 2.15 percent, down three basis points compared to the earlier quarter. The average rate on long-term debt was 2.92 percent, down 27 basis points compared to the earlier quarter. The lower rates on long-term debt also reflect the amortization of the fair value mark on the assumed debt.
The provision for credit losses was $171 million, compared to $146 million for the earlier quarter. The increase in the provision for credit losses was primarily due to higher net-charge offs, partially offset by the residential mortgage loan sale in the current quarter. Net charge-offs for the fourth quarter of 2019 totaled $192 million compared to $143 million in the earlier quarter.
Noninterest income for the fourth quarter of 2019 increased $163 million compared to the earlier quarter. Excluding the net change in securities losses of $118 million and $22 million of losses recognized from the transfer of mortgage loans to held for sale, noninterest income increased $303 million. Approximately $217 million of the variance is due to the contribution from the merger. Insurance income increased $22 million due to higher production. The remaining increase is due to $42 million in income related to assets for certain post-employment benefits, which was offset by higher personnel expense.
Truist Financial Corporation 73
Noninterest expense for the fourth quarter of 2019 was up $791 million compared to the earlier quarter. Merger-related and restructuring charges and other incremental operating expenses related to the merger increased $147 million and $101 million, respectively. Excluding these charges, noninterest expense was up $543 million. Approximately $400 million of the remaining variance was the result of noninterest expenses associated with the merged operations.
Personnel expense increased $369 million compared to the earlier quarter. The increase was largely attributable to a $227 million impact from the merged operations, an $80 million increase in incremental operating expenses related to the merger, a $40 million increase for certain post-employment benefits that were offset by higher noninterest income, and a $29 million increase in production-based and other incentives. Amortization of intangibles increased $37 million, primarily due to the new intangibles created in the Merger.
The provision for income taxes was $153 million for the fourth quarter of 2019, compared to $205 million for the earlier quarter. This produced an effective tax rate for the fourth quarter of 2019 of 17.4%, compared to 20.3% for the earlier quarter. The decrease in the effective tax rate was primarily due to an increase in the realization of income tax credits and a decrease in earnings during the current quarter.
Reclassifications
In connection with the Merger, captions in the Consolidated Balance Sheets, Noninterest income and Noninterest expense in the Consolidated Statements of Income, loan categories and business activities within the segments were realigned. Amounts reported in prior periods' consolidated financial statements have been reclassified to conform to the current presentation. In certain other circumstances, reclassifications have been made to prior period information to conform to the current presentation. Such reclassifications had no effect on previously reported shareholders' equity or net income. Refer to "Note 1. Basis of Presentation" for additional discussion regarding reclassifications.
Critical Accounting Policies
The accounting and reporting policies of Truist are in accordance with GAAP and conform to the accounting and reporting guidelines prescribed by bank regulatory authorities. The financial position and results of operations are affected by management's application of accounting policies, including estimates, assumptions and judgments made to arrive at the carrying value of assets and liabilities and amounts reported for revenues and expenses. Different assumptions in the application of these policies could result in material changes in the consolidated financial position and/or consolidated results of operations and related disclosures. Understanding Truist's accounting policies is fundamental to understanding the consolidated financial position and consolidated results of operations. Accordingly, Truist's significant accounting policies and effects of new accounting pronouncements are discussed in detail in "Note 1. Basis of Presentation."
The following is a summary of Truist's critical accounting policies that are highly dependent on estimates, assumptions and judgments. These critical accounting policies are reviewed with the Audit Committee of the Board of Directors on a periodic basis.
ACL
Truist's policy is to maintain an ACL, which includes the ALLL and the RUFC, which represent management's best estimate of probable credit losses incurred in the loan and lease portfolios and off-balance sheet lending commitments at the balance sheet date. Estimates for loan and lease losses are determined by analyzing historical loan and lease losses, historical loan and lease migration to charge-off experience, current trends in delinquencies and charge-offs, changes in internal risk ratings, expected cash flows on PCI loans, current assessment of impaired loans and leases, the results of regulatory examinations and changes in the size, composition and risk assessment of the loan and lease portfolio. As part of the ACL estimation process, Truist develops a series of loss estimate factors, which are modeled projections of the frequency and severity of losses. These loss estimate factors are based on historical loss experience, economic and political environmental considerations and any other data that management believes will provide evidence about the collectability of outstanding loan and lease amounts. The following table summarizes the loss estimate factors used to determine the ALLL:
| Loss Estimate Factor | Description | |||||||
| Loss frequency | Indicates the likelihood of a borrower defaulting on a loan | |||||||
| Loss severity | Indicates the amount of estimated loss at the time of default | |||||||
74 Truist Financial Corporation
For collectively evaluated loans, the ALLL is determined by multiplying the loan exposure estimated at the time of default by the loss frequency and loss severity factors. For individually evaluated loans, the ALLL is determined through review of data specific to the borrower. For TDRs, default expectations and estimated prepayment speeds that are specific to each of the restructured loan populations are incorporated in the determination of the ALLL. Also included in management's estimates for loan and lease losses are considerations with respect to the impact of current economic events, the outcomes of which are uncertain. These events may include, but are not limited to, fluctuations in overall interest rates, political conditions, legislation that may directly or indirectly affect the banking industry and economic conditions affecting specific geographical areas and industries in which Truist conducts business.
The methodology used to determine an estimate for the RUFC is inherently similar to that used to determine the collectively evaluated component of the ALLL, adjusted for factors specific to binding commitments, including the probability of funding and exposure at default. A detailed discussion of the methodology used in determining the ACL is included in "Note 1. Basis of Presentation."
Fair Value of Financial Instruments
The vast majority of assets and liabilities carried at fair value on a recurring basis are based on either quoted market prices or market prices for similar instruments. Refer to "Note 18. Fair Value Disclosures" for additional disclosures regarding the fair value of financial instruments and "Note 2. Business Combinations" for additional disclosures regarding business combinations.
Securities
Truist generally utilizes a third-party pricing service in determining the fair value of its AFS investment securities, whereas trading securities are priced internally. Fair value measurements for investment securities are derived from market-based pricing matrices that were developed using observable inputs that include benchmark yields, benchmark securities, reported trades, offers, bids, issuer spreads and broker quotes. Management performs procedures to evaluate the fair values provided by the third-party service provider. These procedures, which are performed independent of the responsible BU, include comparison of pricing information received from the third party pricing service to other third-party pricing sources, review of additional information provided by the third-party pricing service and other third-party sources for selected securities and back-testing to compare the price realized on security sales to the daily pricing information received from the third-party pricing service. The IPV Committee, which provides oversight to Truist's enterprise-wide IPV function, is responsible for the comparison of pricing information received from the third-party pricing service or internally to other third-party pricing sources, approving tolerance limits determined by IPV for price comparison exceptions, reviewing significant changes to pricing and valuation policies and reviewing and approving the pricing decisions made on any illiquid and hard-to-price securities. When market observable data is not available, which generally occurs due to the lack of liquidity for certain securities, the valuation of the security is subjective and may involve substantial judgment by management.
Certain securities are less actively traded and quoted market prices may not be readily available. The determination of fair value may require benchmarking to similar instruments or performing a discounted cash flow analysis using estimates of future cash flows and prepayment, interest and default rates.
Truist periodically reviews AFS securities with an unrealized loss. An unrealized loss exists when the current fair value of an individual security is less than its amortized cost basis. The purpose of the review is to consider the length of time and the extent to which the market value of a security has been below its amortized cost. The primary factors Truist considers in determining whether an impairment is other-than-temporary are long-term expectations and recent experience regarding principal and interest payments and Truist's intent to sell and whether it is more likely than not that the Company would be required to sell those securities before the anticipated recovery of the amortized cost basis.
MSRs
Truist's primary class of MSRs for which it separately manages the economic risks relates to residential mortgages. Residential MSRs do not trade in an active, open market with readily observable prices. While sales of MSRs do occur, the precise terms and conditions typically are not readily available. Accordingly, Truist estimates the fair value of residential MSRs using a stochastic OAS valuation model to project residential MSR cash flows over multiple interest rate scenarios, which are then discounted at risk-adjusted rates. The OAS model considers portfolio characteristics, contractually-specified servicing fees, prepayment assumptions, delinquency rates, late charges, other ancillary revenue, costs to service and other economic factors. Truist reassesses and periodically adjusts the underlying inputs and assumptions in the OAS model to reflect market conditions and assumptions that a market participant would consider in valuing the residential MSR asset.
Truist Financial Corporation 75
Fair value estimates and assumptions are compared to industry surveys, recent market activity, actual portfolio experience and, when available, observable market data. Due to the nature of the valuation inputs, residential MSRs are classified within Level 3 of the valuation hierarchy. The value of residential MSRs is significantly affected by mortgage interest rates available in the marketplace, which influence mortgage loan prepayment speeds. In general, during periods of declining interest rates, the value of MSRs declines due to increasing prepayments attributable to increased mortgage-refinance activity. Conversely, during periods of rising interest rates, the value of residential MSRs generally increases due to reduced refinance activity. Truist typically hedges against market value changes in the residential MSRs. Refer to "Note 8. Loan Servicing" for quantitative disclosures reflecting the effect that changes in management's assumptions would have on the fair value of residential MSRs.
LHFS
Truist originates certain residential and commercial mortgage loans for sale to investors that are carried at fair value. The fair value is primarily based on quoted market prices for securities backed by similar types of loans. Changes in the fair value are recorded as components of residential mortgage income and commercial real estate related income, while the related origination costs are generally recognized in personnel expense when incurred. The changes in fair value are largely driven by changes in interest rates subsequent to loan funding and changes in the fair value of servicing associated with the LHFS. Truist uses various derivative instruments to mitigate the economic effect of changes in fair value of the underlying loans. LHFS also includes certain loans, generally carried at LOCOM, where management has committed to a formal plan of sale and the loans are available for immediate sale. Adjustments to reflect unrealized gains and losses resulting from changes in fair value, up to the original carrying amount, and realized gains and losses upon ultimate sale are classified as noninterest income. The fair value of these loans is estimated using observable market prices when available, although may also incorporate other unobservable inputs such as indicative bids or broker price opinions. Refer to “Note 1. Basis of Presentation" for further description of the Company’s accounting for LHFS.
Trading Loans
Truist elects to measure certain loans at fair value for financial reporting where fair value aligns with the underlying business purpose. Specifically, loans included within this classification include trading loans that are (i) purchased in connection with the Company’s TRS business, (ii) part of the loan sales and trading business within the C&CB segment, or (iii) backed by the SBA. Refer to “Note 16. Commitments and Contingencies,” and “Note 19. Derivative Financial Instruments,” for further discussion of the Company’s TRS business. The loans purchased in connection with the Company’s TRS and sales and trading businesses are primarily commercial and corporate leveraged loans valued based on quoted prices for identical or similar instruments in markets that are not active by a third-party pricing service. SBA loans are fully guaranteed by the U.S. government as to contractual principal and interest and there is sufficient observable trading activity upon which to base the estimate of fair value.
Derivative Assets and Liabilities
Truist uses derivatives to manage various financial risks and in a dealer capacity to facilitate client transactions. Truist mitigates credit risk by subjecting counterparties to credit reviews and approvals similar to those used in making loans and other extensions of credit. In addition, certain counterparties are required to provide collateral to Truist when their unsecured loss positions exceed certain negotiated limits. The fair values of derivative financial instruments are determined based on quoted market prices and internal pricing models that use market observable data for interest rates, foreign exchange, equity and credit. The fair value of interest rate lock commitments, which are related to mortgage loan commitments, is based on quoted market prices adjusted for commitments that Truist does not expect to fund and includes the value attributable to the net servicing fee.
Refer to “Note 19. Derivative Financial Instruments” for further information on the Company’s derivatives.
Purchased loans
The fair value for purchased loans in a business combination is based on a discounted cash flow methodology that considers credit loss expectations, market interest rates and other market factors such as liquidity from the perspective of a market participant. Loans are grouped together according to similar characteristics and are treated in the aggregate when applying various valuation techniques. The probability of default, loss given default and prepayment assumptions are key factors driving credit losses which are embedded into the estimated cash flows. These assumptions are informed by internal data on loan characteristics, historical loss experience, and current and forecasted economic conditions. The interest and liquidity component of the estimate is determined by discounting interest and principal cash flows through the expected life of each loan. The discount rates used for loans are based on current market rates for new originations of comparable loans and include adjustments for liquidity. The discount rate does not include a factor for credit losses as that has been included as a reduction to the estimated cash flows.
76 Truist Financial Corporation
Intangible Assets
The acquisition method of accounting requires that assets acquired and liabilities assumed in business combinations are recorded at their fair values. This often involves estimates based on third-party valuations or internal valuations based on discounted cash flow analyses or other valuation techniques, which are inherently subjective. The amortization of definite-lived intangible assets is based upon the estimated economic benefits to be received, which is also subjective. Business combinations also typically result in goodwill, which is subject to ongoing periodic impairment tests based on the fair values of the reporting units to which the acquired goodwill relates. Refer to "Note 1. Basis of Presentation" for a description of the impairment testing process. Management considers the sensitivity of the significant assumptions in its impairment analysis including consideration of changes in estimated future cash flows or the discount rate for each reporting unit. The discount rates used are based on current market rates.
Income Taxes
Truist is subject to income tax laws of the U.S., its states, and the municipalities in which it conducts business. In estimating the net amount due to or to be received from tax jurisdictions either currently or in the future, the Company assesses the appropriate tax treatment of transactions and filing positions after considering statutes, regulations, judicial precedent, and other pertinent information. The income tax laws are complex and subject to different interpretations by the taxpayer and the relevant government taxing authorities.
Significant judgment is required in determining the tax accruals and in evaluating our tax positions, including evaluating uncertain tax positions. Changes in the estimate of accrued taxes occur periodically due to changes in tax rates, interpretations of tax laws and new judicial guidance, the status of examinations by the tax authorities, and newly enacted statutory and regulatory guidance that could impact the relative merits and risks of tax positions. These changes, when they occur, impact tax expense and can materially affect operating results. Truist reviews tax positions quarterly and adjusts accrued taxes as new information becomes available.
Deferred income tax assets represent amounts available to reduce income taxes payable in future years. Such assets arise due to temporary differences between the financial reporting and the tax bases of assets and liabilities, as well as from NOL and tax credit carryforwards. The Company regularly evaluates the realizability of DTAs, recognizing a valuation allowance if, based on the weight of available evidence, it is more-likely-than-not that some portion or all of the DTA will not be realized. In determining whether a valuation allowance is necessary, the Company considers the level of taxable income in prior years to the extent that carrybacks are permitted under current tax laws, as well as estimates of future pre-tax and taxable income and tax planning strategies that would, if necessary, be implemented. Truist currently maintains a valuation allowance for certain state carryforwards and certain other state DTAs. For additional income tax information, refer to “Note 1. Basis of Presentation” and “Note 14. Income Taxes”.
Pension and Postretirement Benefit Obligations
Truist offers various pension plans and postretirement benefit plans to employees. Calculation of the obligations and related expenses under these plans requires the use of actuarial valuation methods and assumptions, which are subject to management judgment and may differ significantly if different assumptions are used. The discount rate assumption used to measure the postretirement benefit obligations is set by reference to a high-quality (AA-rated or higher) corporate bond yield curve and the individual characteristics of the plans such as projected cash flow patterns and payment durations. Management considered the sensitivity that changes in the expected return on plan assets and the discount rate would have on pension expense. For the Company’s qualified plans, a decrease of 25 basis points in the discount rate would result in additional pension expense of approximately $50 million for 2020, while a decrease of 100 basis points in the expected return on plan assets would result in an increase of approximately $126 million in pension expense for 2020. Refer to "Note 15. Benefit Plans" for disclosures related to the benefit plans.
Truist Financial Corporation 77
ITEM 9A. CONTROLS AND PROCEDURES
Management's Report on Internal Control over Financial Reporting and Evaluation of
Disclosure Controls and Procedures
Management’s Report on Internal Control over Financial Reporting
Management of Truist is responsible for establishing and maintaining adequate internal control over financial reporting as defined in Rule 13a-15(f) of the Exchange Act. The Company's internal control over financial reporting is a process designed to provide reasonable assurance regarding the reliability of financial reporting and the preparation of financial statements for external purposes in accordance with GAAP. Truist's internal control over financial reporting includes those policies and procedures that (1) pertain to the maintenance of records, that in reasonable detail, accurately and fairly reflect the transactions and disposition of the Company's assets; (2) provide reasonable assurance that transactions are recorded as necessary to permit the preparation of financial statements in accordance with GAAP and that receipts and expenditures of the Company are being made only in accordance with the authorizations of Truist's management and directors; and (3) provide reasonable assurance regarding prevention or timely detection of unauthorized acquisition, use or disposition of the Company's assets that could have a material impact on the financial statements.
Because of its inherent limitations, internal control over financial reporting may not prevent or detect misstatements. Also, projections of any evaluation of effectiveness to future periods are subject to the risk that controls may become inadequate due to changes in conditions, or that the degree of compliance with the policies and procedures may deteriorate.
Under the supervision and with the participation of management, including the Chief Executive Officer and the Chief Financial Officer, the Company conducted an evaluation of the effectiveness of the internal control over financial reporting based on the framework in Internal Control-Integrated Framework (2013) promulgated by the Committee of Sponsoring Organizations of the Treadway Commission, commonly referred to as the "COSO" criteria. Based on this evaluation under the COSO criteria, which excluded the operations of SunTrust as noted below, management concluded that the internal control over financial reporting was effective as of December 31, 2019.
In conducting the evaluation of the effectiveness of its internal control over financial reporting as of December 31, 2019, the Company has excluded the operations of SunTrust Banks, Inc. and its subsidiaries (“SunTrust”) as permitted by the guidance issued by the Office of the Chief Accountant of the Securities and Exchange Commission (not to extend more than one year beyond the date of the acquisition or for more than one annual reporting period). In conducting the evaluation of the effectiveness of its disclosure controls and procedures as of December 31, 2019, the Company has excluded those disclosure controls and procedures of SunTrust that are subsumed by internal control over financial reporting. The Merger was completed on December 6, 2019. As of and for the year ended December 31, 2019, heritage SunTrust's assets represented approximately 40 percent of the Company’s consolidated assets and its revenues represented approximately five percent of the Company’s consolidated revenues. See "Note 2. Business Combinations" for further discussion of the Merger and its impact on the Company’s consolidated financial statements.
The effectiveness of the Company's internal control over financial reporting as of December 31, 2019 has been audited by PricewaterhouseCoopers LLP, an independent registered public accounting firm, as stated in their accompanying report, which expresses an unqualified opinion on the effectiveness of the Company's internal control over financial reporting as of December 31, 2019.
Disclosure Controls and Procedures and Changes in Internal Control over Financial Reporting
As of the end of the period covered by this report, the management of the Company, under the supervision and with the participation of the Company's Chief Executive Officer and Chief Financial Officer, carried out an evaluation of the Company's disclosure controls and procedures as defined in Rule 13a-15(e) of the Exchange Act. Based on that evaluation, which excluded certain disclosure controls and procedures of SunTrust as noted above, the Chief Executive Officer and Chief Financial Officer concluded that the Company's disclosure controls and procedures were effective.
The Company is working to integrate SunTrust into its overall internal control over financial reporting processes. Except for changes made in connection with this integration of SunTrust, there was no change in the Company's internal control over financial reporting that occurred during the fourth quarter of 2019 that has materially affected, or is likely to materially affect, the Company's internal control over financial reporting.
78 Truist Financial Corporation
ITEM 8. FINANCIAL STATEMENTS AND SUPPLEMENTARY DATA
Report of Independent Registered Public Accounting Firm
To the Board of Directors and Shareholders of Truist Financial Corporation
Opinions on the Financial Statements and Internal Control over Financial Reporting
We have audited the accompanying consolidated balance sheets of Truist Financial Corporation and its subsidiaries (the “Company”) as of December 31, 2019 and 2018, and the related consolidated statements of income, comprehensive income, changes in shareholders’ equity and cash flows for each of the years in the three-year period ended December 31, 2019, including the related notes (collectively referred to as the “consolidated financial statements”). We also have audited the Company's internal control over financial reporting as of December 31, 2019 based on criteria established in Internal Control - Integrated Framework (2013) issued by the Committee of Sponsoring Organizations of the Treadway Commission (COSO).
In our opinion, the consolidated financial statements referred to above present fairly, in all material respects, the financial position of the Company as of December 31, 2019 and 2018, and the results of its operations and its cash flows for each of the years in the three-year period ended December 31, 2019 in conformity with accounting principles generally accepted in the United States of America. Also in our opinion, the Company maintained, in all material respects, effective internal control over financial reporting as of December 31, 2019, based on criteria established in Internal Control - Integrated Framework (2013) issued by COSO.
Basis for Opinions
The Company's management is responsible for these consolidated financial statements, for maintaining effective internal control over financial reporting, and for its assessment of the effectiveness of internal control over financial reporting, included in Management's Report on Internal Control over Financial Reporting appearing under Item 9A. Our responsibility is to express opinions on the Company’s consolidated financial statements and on the Company's internal control over financial reporting based on our audits. We are a public accounting firm registered with the Public Company Accounting Oversight Board (United States) (PCAOB) and are required to be independent with respect to the Company in accordance with the U.S. federal securities laws and the applicable rules and regulations of the Securities and Exchange Commission and the PCAOB.
We conducted our audits in accordance with the standards of the PCAOB. Those standards require that we plan and perform the audits to obtain reasonable assurance about whether the consolidated financial statements are free of material misstatement, whether due to error or fraud, and whether effective internal control over financial reporting was maintained in all material respects.
Our audits of the consolidated financial statements included performing procedures to assess the risks of material misstatement of the consolidated financial statements, whether due to error or fraud, and performing procedures that respond to those risks. Such procedures included examining, on a test basis, evidence regarding the amounts and disclosures in the consolidated financial statements. Our audits also included evaluating the accounting principles used and significant estimates made by management, as well as evaluating the overall presentation of the consolidated financial statements. Our audit of internal control over financial reporting included obtaining an understanding of internal control over financial reporting, assessing the risk that a material weakness exists, and testing and evaluating the design and operating effectiveness of internal control based on the assessed risk. Our audits also included performing such other procedures as we considered necessary in the circumstances. We believe that our audits provide a reasonable basis for our opinions.
As described in Management's Report on Internal Control over Financial Reporting, management has excluded SunTrust Banks, Inc. (SunTrust) from its assessment of internal control over financial reporting as of December 31, 2019 because SunTrust was acquired by the Company in a purchase business combination during 2019. We have also excluded SunTrust from our audit of internal control over financial reporting. SunTrust’s total assets and total revenues represent approximately 40% and 5%, respectively, of the related consolidated financial statement amounts as of and for the year ended December 31, 2019.
Truist Financial Corporation 79
Definition and Limitations of Internal Control over Financial Reporting
A company’s internal control over financial reporting is a process designed to provide reasonable assurance regarding the reliability of financial reporting and the preparation of financial statements for external purposes in accordance with generally accepted accounting principles. A company’s internal control over financial reporting includes those policies and procedures that (i) pertain to the maintenance of records that, in reasonable detail, accurately and fairly reflect the transactions and dispositions of the assets of the company; (ii) provide reasonable assurance that transactions are recorded as necessary to permit preparation of financial statements in accordance with generally accepted accounting principles, and that receipts and expenditures of the company are being made only in accordance with authorizations of management and directors of the company; and (iii) provide reasonable assurance regarding prevention or timely detection of unauthorized acquisition, use, or disposition of the company’s assets that could have a material effect on the financial statements.
Because of its inherent limitations, internal control over financial reporting may not prevent or detect misstatements. Also, projections of any evaluation of effectiveness to future periods are subject to the risk that controls may become inadequate because of changes in conditions, or that the degree of compliance with the policies or procedures may deteriorate.
Critical Audit Matters
The critical audit matters communicated below are matters arising from the current period audit of the consolidated financial statements that were communicated or required to be communicated to the audit committee and that (i) relate to accounts or disclosures that are material to the consolidated financial statements and (ii) involved our especially challenging, subjective, or complex judgments. The communication of critical audit matters does not alter in any way our opinion on the consolidated financial statements, taken as a whole, and we are not, by communicating the critical audit matters below, providing separate opinions on the critical audit matters or on the accounts or disclosures to which they relate.
Valuation of Certain Acquired Loans
As described in Note 2 to the consolidated financial statements, during 2019 the Company acquired SunTrust for consideration of $33.5 billion. In conjunction with this acquisition, acquired loans and leases were recorded at fair value of $154.0 billion. To determine the fair value of acquired loans, management used a discounted cash flow methodology that considered factors such as loan characteristics, discount rates, probability of default, loss given default, and prepayment assumptions.
The principal considerations for our determination that performing procedures relating to the valuation of certain acquired loans is a critical audit matter are (i) there was significant judgment by management to determine the fair value of acquired loans, which led to a high degree of auditor judgment and subjectivity in performing procedures relating to discount rates, probability of default, loss given default, and prepayment assumptions, (ii) significant audit effort was necessary to evaluate the evidence obtained relating to these assumptions, and (iii) the audit effort involved the use of professionals with specialized skill and knowledge to assist in performing these procedures.
Addressing the matter involved performing procedures and evaluating audit evidence in connection with forming our overall opinion on the consolidated financial statements. These procedures included testing the effectiveness of controls relating to the valuation of certain acquired loans, including controls over the discount rates, probability of default, loss given default, and prepayment assumptions used in the discounted cash flow methodology. These procedures also included, among others, (i) the involvement of professionals with specialized skill and knowledge to assist in developing independent ranges of fair value for certain acquired loans, including the development of independent assumptions for discount rates, probability of default, loss given default, and prepayment assumptions, (ii) comparison of management’s estimate to the independently developed ranges, and (iii) testing the completeness and accuracy of the underlying loan data provided by management that was used to develop these assumptions.
Valuation of Acquired Core Deposit Intangible Assets
As described in Note 2 to the consolidated financial statements, in connection with the Company’s acquisition of SunTrust, core deposit intangible (CDI) and other intangible assets were recorded at fair value of $2.5 billion. To estimate the fair value of acquired CDI assets, management used a discounted cash flow methodology that considered client attrition rates, discount rate, cost of the deposit base, reserve requirements, net maintenance cost, and an estimate of the cost associated with alternative funding sources.
The principal considerations for our determination that performing procedures relating to the valuation of acquired CDI assets is a critical audit matter are (i) there was significant judgment by management to determine the fair value of acquired CDI assets, which led to a high degree of auditor judgment and subjectivity in performing procedures relating to client attrition rates, (ii) significant audit effort was necessary to evaluate the evidence obtained relating to client attrition rates used in the valuation of CDI assets, and (iii) the audit effort involved the use of professionals with specialized skill and knowledge to assist in evaluating audit evidence obtained from these procedures.
80 Truist Financial Corporation
Addressing the matter involved performing procedures and evaluating audit evidence in connection with forming our overall opinion on the consolidated financial statements. These procedures included testing the effectiveness of controls relating to the valuation of CDI assets, including controls over the significant assumptions used in the CDI discounted cash flow methodology. These procedures also included, among others, testing management’s process for estimating the fair value of CDI assets, including testing the completeness and accuracy of the deposits data used in the valuation of acquired CDI assets. Procedures to test management’s process included the involvement of professionals with specialized skill and knowledge to evaluate the appropriateness of the valuation methods and the reasonableness of the client attrition rates used in the CDI discounted cash flows methodology. Evaluating the reasonableness of the client attrition rates included comparison to historical performance.
Allowance for Loan and Lease Losses – Collectively Evaluated Component
As described in Notes 1 and 5 to the consolidated financial statements, the allowance for loan and lease losses (ALLL) represents management’s estimate of probable credit losses incurred in the loan and lease portfolios at the balance sheet date. The collectively evaluated component of the ALLL was $1.4 billion as of December 31, 2019. The collectively evaluated component of the ALLL includes the development of a series of loss estimate factors, which are modeled projections of the frequency and severity of losses based on analyzing historical loan and lease losses as well as historical loan and lease migration to charge-off experience. The collectively evaluated component of the ALLL also includes estimates of the impact of current economic events, overall interest rates, political conditions, and the composition and risk assessment of the loan and lease portfolio.
The principal considerations for our determination that performing procedures relating to the collectively evaluated component of the ALLL is a critical audit matter are (i) there was significant judgment by management to determine the frequency and severity of losses, which led to a high degree of auditor judgment and subjectivity in performing procedures relating to the loss estimate factors, (ii) significant effort was necessary in performing audit procedures to evaluate the reasonableness of the loss estimate factors, specifically the frequency and severity of losses, and (iii) the audit effort involved the use of professionals with specialized skill and knowledge to assist in evaluating the audit evidence obtained from these procedures.
Addressing the matter involved performing procedures and evaluating audit evidence in connection with forming our overall opinion on the consolidated financial statements. These procedures included testing the effectiveness of controls relating to management’s determination of the ALLL, including controls over the development of the loss estimate factors. These procedures also included, among others, (i) testing management’s process for determining the ALLL, including the collectively evaluated component, (ii) the involvement of professionals with specialized skill and knowledge to assist in evaluating the model used in determining the assumptions for the frequency and severity of losses, and (iii) testing the reliability of historical loss data.
/s/ PricewaterhouseCoopers LLP
Charlotte, North Carolina
March 2, 2020
We have served as the Company's auditor since 2002.
Truist Financial Corporation 81
CONSOLIDATED BALANCE SHEETS
TRUIST FINANCIAL CORPORATION AND SUBSIDIARIES
|
December 31,
(Dollars in millions, except per share data, shares in thousands) |
2019 | 2018 | |||||||||
| Assets | |||||||||||
| Cash and due from banks | $ |
|
$ |
|
|||||||
| Interest-bearing deposits with banks |
|
|
|||||||||
| Securities borrowed or purchased under resale agreements |
|
|
|||||||||
| Trading assets |
|
|
|||||||||
| AFS securities at fair value |
|
|
|||||||||
| HTM securities (fair value of $20,047 at December 31, 2018) |
|
|
|||||||||
| LHFS (including $5,673 and $988 at fair value, respectively) |
|
|
|||||||||
| Loans and leases |
|
|
|||||||||
| ALLL |
(
|
(
|
|||||||||
| Loans and leases, net of ALLL |
|
|
|||||||||
| Premises and equipment |
|
|
|||||||||
| Goodwill |
|
|
|||||||||
| CDI and other intangible assets |
|
|
|||||||||
| MSRs (including $2,618 and $1,108 at fair value, respectively) |
|
|
|||||||||
| Other assets (including $3,310 and $1,015 at fair value, respectively) |
|
|
|||||||||
| Total assets | $ |
|
$ |
|
|||||||
| Liabilities | |||||||||||
| Noninterest-bearing deposits | $ |
|
$ |
|
|||||||
| Interest-bearing deposits |
|
|
|||||||||
| Short-term borrowings |
|
|
|||||||||
| Long-term debt |
|
|
|||||||||
| Other liabilities (including $1,440 and $392 at fair value, respectively) |
|
|
|||||||||
| Total liabilities |
|
|
|||||||||
| Shareholders' Equity | |||||||||||
| Preferred stock, $5 par value, liquidation preference of $25,000 per share |
|
|
|||||||||
| Common stock, $5 par value |
|
|
|||||||||
| Additional paid-in capital |
|
|
|||||||||
| Retained earnings |
|
|
|||||||||
| AOCI, net of deferred income taxes |
(
|
(
|
|||||||||
| Noncontrolling interests |
|
|
|||||||||
| Total shareholders' equity |
|
|
|||||||||
| Total liabilities and shareholders' equity | $ |
|
$ |
|
|||||||
| Common shares outstanding |
|
|
|||||||||
| Common shares authorized |
|
|
|||||||||
| Preferred shares outstanding |
|
|
|||||||||
| Preferred shares authorized |
|
|
|||||||||
The accompanying notes are an integral part of these consolidated financial statements.
82 Truist Financial Corporation
CONSOLIDATED STATEMENTS OF INCOME
TRUIST FINANCIAL CORPORATION AND SUBSIDIARIES
|
Year Ended December 31,
(Dollars in millions, except per share data; shares in thousands) |
2019 | 2018 | 2017 | ||||||||||||||
| Interest Income | |||||||||||||||||
| Interest and fees on loans and leases | $ |
|
$ |
|
$ |
|
|||||||||||
| Interest on securities |
|
|
|
||||||||||||||
| Interest on other earning assets |
|
|
|
||||||||||||||
| Total interest income |
|
|
|
||||||||||||||
| Interest Expense | |||||||||||||||||
| Interest on deposits |
|
|
|
||||||||||||||
| Interest on long-term debt |
|
|
|
||||||||||||||
| Interest on other borrowings |
|
|
|
||||||||||||||
| Total interest expense |
|
|
|
||||||||||||||
| Net Interest Income |
|
|
|
||||||||||||||
| Provision for credit losses |
|
|
|
||||||||||||||
| Net Interest Income After Provision for Credit Losses |
|
|
|
||||||||||||||
| Noninterest Income | |||||||||||||||||
| Insurance income |
|
|
|
||||||||||||||
| Service charges on deposits |
|
|
|
||||||||||||||
| Wealth management income |
|
|
|
||||||||||||||
| Card and payment related fees |
|
|
|
||||||||||||||
| Residential mortgage income |
|
|
|
||||||||||||||
| Investment banking and trading income |
|
|
|
||||||||||||||
| Operating lease income |
|
|
|
||||||||||||||
| Income from bank-owned life insurance |
|
|
|
||||||||||||||
| Lending related fees |
|
|
|
||||||||||||||
| Commercial real estate related income |
|
|
|
||||||||||||||
| Securities gains (losses) |
(
|
|
(
|
||||||||||||||
| Other income |
|
|
|
||||||||||||||
| Total noninterest income |
|
|
|
||||||||||||||
| Noninterest Expense | |||||||||||||||||
| Personnel expense |
|
|
|
||||||||||||||
| Net occupancy expense |
|
|
|
||||||||||||||
| Professional fees and outside processing |
|
|
|
||||||||||||||
| Software expense |
|
|
|
||||||||||||||
| Equipment expense |
|
|
|
||||||||||||||
| Marketing and customer development |
|
|
|
||||||||||||||
| Operating lease depreciation |
|
|
|
||||||||||||||
| Loan-related expense |
|
|
|
||||||||||||||
| Amortization of intangibles |
|
|
|
||||||||||||||
| Regulatory costs |
|
|
|
||||||||||||||
| Merger-related and restructuring charges |
|
|
|
||||||||||||||
| Loss (gain) on early extinguishment of debt |
|
|
|
||||||||||||||
| Other expense |
|
|
|
||||||||||||||
| Total noninterest expense |
|
|
|
||||||||||||||
| Earnings | |||||||||||||||||
| Income before income taxes |
|
|
|
||||||||||||||
| Provision for income taxes |
|
|
|
||||||||||||||
| Net income |
|
|
|
||||||||||||||
| Noncontrolling interests |
|
|
|
||||||||||||||
| Dividends on preferred stock |
|
|
|
||||||||||||||
| Net income available to common shareholders | $ |
|
$ |
|
$ |
|
|||||||||||
| Basic EPS | $ |
|
$ |
|
$ |
|
|||||||||||
| Diluted EPS | $ |
|
$ |
|
$ |
|
|||||||||||
| Basic weighted average shares outstanding |
|
|
|
||||||||||||||
| Diluted weighted average shares outstanding |
|
|
|
||||||||||||||
The accompanying notes are an integral part of these consolidated financial statements.
Truist Financial Corporation 83
CONSOLIDATED STATEMENTS OF COMPREHENSIVE INCOME
TRUIST FINANCIAL CORPORATION AND SUBSIDIARIES
|
Year Ended December 31,
(Dollars in millions) |
2019 | 2018 | 2017 | ||||||||||||||
| Net income | $ |
|
$ |
|
$ |
|
|||||||||||
| OCI, net of tax: | |||||||||||||||||
| Change in unrecognized net pension and postretirement costs |
|
(
|
(
|
||||||||||||||
| Change in unrealized net gains (losses) on cash flow hedges |
(
|
|
|
||||||||||||||
| Change in unrealized net gains (losses) on AFS securities |
|
(
|
(
|
||||||||||||||
| Other, net |
|
(
|
|
||||||||||||||
| Total OCI, net of tax |
|
(
|
(
|
||||||||||||||
| Total comprehensive income | $ |
|
$ |
|
$ |
|
|||||||||||
| Income Tax Effect of Items Included in OCI: | |||||||||||||||||
| Change in unrecognized net pension and postretirement costs | $ |
|
$ |
(
|
$ |
(
|
|||||||||||
| Change in unrealized net gains (losses) on cash flow hedges |
(
|
|
|
||||||||||||||
| Change in unrealized net gains (losses) on AFS securities |
|
(
|
(
|
||||||||||||||
| Other, net |
|
|
|
||||||||||||||
The accompanying notes are an integral part of these consolidated financial statements.
84 Truist Financial Corporation
CONSOLIDATED STATEMENTS OF CHANGES IN SHAREHOLDERS' EQUITY
TRUIST FINANCIAL CORPORATION AND SUBSIDIARIES
|
(Dollars in millions, shares in thousands) |
Shares of Common Stock | Preferred Stock | Common Stock | Additional Paid-In Capital | Retained Earnings | AOCI | Noncontrolling Interests | Total Shareholders' Equity | |||||||||||||||||||||||||||||||||||||||
| Balance, January 1, 2017 |
|
$ |
|
$ |
|
$ |
|
$ |
|
$ |
(
|
$ |
|
$ |
|
||||||||||||||||||||||||||||||||
| Add (Deduct): | |||||||||||||||||||||||||||||||||||||||||||||||
| Net income | — | — | — | — |
|
— |
|
|
|||||||||||||||||||||||||||||||||||||||
| OCI | — | — | — | — | — |
(
|
— |
(
|
|||||||||||||||||||||||||||||||||||||||
| Issued in connection with equity awards, net |
|
— |
|
|
— | — | — |
|
|||||||||||||||||||||||||||||||||||||||
| Repurchase of common stock |
(
|
— |
(
|
(
|
— | — | — |
(
|
|||||||||||||||||||||||||||||||||||||||
| Cash dividends declared on common stock | — | — | — | — |
(
|
— | — |
(
|
|||||||||||||||||||||||||||||||||||||||
| Cash dividends declared on preferred stock | — | — | — | — |
(
|
— | — |
(
|
|||||||||||||||||||||||||||||||||||||||
| Equity-based compensation expense | — | — | — |
|
— | — | — |
|
|||||||||||||||||||||||||||||||||||||||
| Reclassification of certain tax effects | — | — | — | — |
|
(
|
— | — | |||||||||||||||||||||||||||||||||||||||
| Other, net | — | — | — |
|
(
|
— |
(
|
(
|
|||||||||||||||||||||||||||||||||||||||
| Balance, December 31, 2017 |
|
$ |
|
$ |
|
$ |
|
$ |
|
$ |
(
|
$ |
|
$ |
|
||||||||||||||||||||||||||||||||
| Add (Deduct): | |||||||||||||||||||||||||||||||||||||||||||||||
| Net income | — | $ | — | $ | — | $ | — | $ |
|
$ | — | $ |
|
$ |
|
||||||||||||||||||||||||||||||||
| OCI | — | — | — | — | — |
(
|
— |
(
|
|||||||||||||||||||||||||||||||||||||||
| Issued in connection with equity awards, net |
|
— |
|
(
|
— | — | — |
(
|
|||||||||||||||||||||||||||||||||||||||
| Repurchase of common stock |
(
|
— |
(
|
(
|
— | — | — |
(
|
|||||||||||||||||||||||||||||||||||||||
| Cash dividends declared on common stock | — | — | — | — |
(
|
— | — |
(
|
|||||||||||||||||||||||||||||||||||||||
| Cash dividends declared on preferred stock | — | — | — | — |
(
|
— | — |
(
|
|||||||||||||||||||||||||||||||||||||||
| Equity-based compensation expense | — | — | — |
|
— | — | — |
|
|||||||||||||||||||||||||||||||||||||||
| Other, net | — | — | — |
(
|
— | — |
(
|
(
|
|||||||||||||||||||||||||||||||||||||||
| Balance, December 31, 2018 |
|
$ |
|
$ |
|
$ |
|
$ |
|
$ |
(
|
$ |
|
$ |
|
||||||||||||||||||||||||||||||||
| Add (Deduct): | |||||||||||||||||||||||||||||||||||||||||||||||
| Net income | — | $ | — | $ | — | $ | — | $ |
|
$ | — | $ |
|
$ |
|
||||||||||||||||||||||||||||||||
| OCI | — | — | — | — | — |
|
— |
|
|||||||||||||||||||||||||||||||||||||||
| Issued in business combination |
|
|
|
|
— | — | — |
|
|||||||||||||||||||||||||||||||||||||||
| Issued in connection with equity awards, net |
|
— |
|
(
|
— | — | — |
(
|
|||||||||||||||||||||||||||||||||||||||
| Issued in connection with preferred stock offerings | — |
|
— | — | — | — | — |
|
|||||||||||||||||||||||||||||||||||||||
| Redemption of preferred stock | — |
(
|
— | — |
(
|
— | — |
(
|
|||||||||||||||||||||||||||||||||||||||
| Cash dividends declared on common stock | — | — | — | — |
(
|
— | — |
(
|
|||||||||||||||||||||||||||||||||||||||
| Cash dividends declared on preferred stock | — | — | — | — |
(
|
— | — |
(
|
|||||||||||||||||||||||||||||||||||||||
| Equity-based compensation expense | — | — | — |
|
— | — | — |
|
|||||||||||||||||||||||||||||||||||||||
| Other, net | — | — | — |
|
(
|
— |
|
|
|||||||||||||||||||||||||||||||||||||||
| Balance, December 31, 2019 |
|
$ |
|
$ |
|
$ |
|
$ |
|
$ |
(
|
$ |
|
$ |
|
||||||||||||||||||||||||||||||||
The accompanying notes are an integral part of these consolidated financial statements.
Truist Financial Corporation 85
CONSOLIDATED STATEMENTS OF CASH FLOWS
TRUIST FINANCIAL CORPORATION AND SUBSIDIARIES
|
Year Ended December 31, (Dollars in millions) |
2019 | 2018 | 2017 | ||||||||||||||
| Cash Flows From Operating Activities: | |||||||||||||||||
| Net income | $ |
|
$ |
|
$ |
|
|||||||||||
| Adjustments to reconcile net income to net cash from operating activities: | |||||||||||||||||
| Provision for credit losses |
|
|
|
||||||||||||||
| Depreciation |
|
|
|
||||||||||||||
| Loss (gain) on early extinguishment of debt |
|
|
|
||||||||||||||
| Amortization of intangibles |
|
|
|
||||||||||||||
| Equity-based compensation expense |
|
|
|
||||||||||||||
| (Gain) loss on securities, net |
|
(
|
|
||||||||||||||
| Net change in operating assets and liabilities: | |||||||||||||||||
| LHFS |
(
|
|
|
||||||||||||||
| Pension asset |
(
|
|
(
|
||||||||||||||
| Trading assets |
|
|
|
||||||||||||||
| Other assets and other liabilities |
|
(
|
|
||||||||||||||
| Other, net |
|
(
|
(
|
||||||||||||||
| Net cash from operating activities |
|
|
|
||||||||||||||
| Cash Flows From Investing Activities: | |||||||||||||||||
| Proceeds from sales of AFS securities |
|
|
|
||||||||||||||
| Proceeds from maturities, calls and paydowns of AFS securities |
|
|
|
||||||||||||||
| Purchases of AFS securities |
(
|
(
|
(
|
||||||||||||||
| Proceeds from maturities, calls and paydowns of HTM securities |
|
|
|
||||||||||||||
| Purchases of HTM securities |
|
(
|
(
|
||||||||||||||
| Originations and purchases of loans and leases, net of sales and principal collected |
|
(
|
(
|
||||||||||||||
| Net cash received (paid) for mergers, acquisitions and divestitures |
|
(
|
|
||||||||||||||
| Other, net |
|
(
|
(
|
||||||||||||||
| Net cash from investing activities |
|
(
|
(
|
||||||||||||||
| Cash Flows From Financing Activities: | |||||||||||||||||
| Net change in deposits |
|
|
(
|
||||||||||||||
| Net change in short-term borrowings |
|
|
|
||||||||||||||
| Proceeds from issuance of long-term debt |
|
|
|
||||||||||||||
| Repayment of long-term debt |
(
|
(
|
(
|
||||||||||||||
| Repurchase of common stock |
|
(
|
(
|
||||||||||||||
| Net proceeds from preferred stock issued |
|
|
|
||||||||||||||
| Redemption of preferred stock |
(
|
|
|
||||||||||||||
| Cash dividends paid on common stock |
(
|
(
|
(
|
||||||||||||||
| Cash dividends paid on preferred stock |
(
|
(
|
(
|
||||||||||||||
| Other, net |
(
|
(
|
|
||||||||||||||
| Net cash from financing activities |
|
|
(
|
||||||||||||||
| Net Change in Cash and Cash Equivalents |
|
|
(
|
||||||||||||||
| Cash and Cash Equivalents, January 1 |
|
|
|
||||||||||||||
| Cash and Cash Equivalents, December 31 | $ |
|
$ |
|
$ |
|
|||||||||||
| Supplemental Disclosure of Cash Flow Information: | |||||||||||||||||
| Net cash paid (received) during the period for: | |||||||||||||||||
| Interest expense | $ |
|
$ |
|
$ |
|
|||||||||||
| Income taxes |
|
|
|
||||||||||||||
| Noncash investing activities: | |||||||||||||||||
| Transfers of loans to foreclosed assets |
|
|
|
||||||||||||||
| Transfer of loans HFI to LHFS |
|
|
|
||||||||||||||
| Stock issued in business combinations |
|
|
|
||||||||||||||
| Transfer of HTM securities to AFS |
|
|
|
||||||||||||||
The accompanying notes are an integral part of these consolidated financial statements.
86 Truist Financial Corporation
NOTE 1.
Basis of Presentation
Truist Financial Corporation is a purpose-driven financial services company committed to inspire and build better lives and communities. The Company serves approximately 10 million households with leading market share in many high-growth markets in the country and offers a wide range of services including retail, small business and commercial banking; asset management; capital markets; commercial real estate; corporate and institutional banking; insurance; mortgage; payments; and wealth management. Headquartered in Charlotte, North Carolina, Truist is the sixth-largest commercial bank in the U.S. The Company operates and measures business activity across three business segments: Consumer Banking and Wealth, Corporate and Commercial Banking, and Insurance Holdings. For additional information on the Company’s business segments, see "Note 21. Operating Segments.”
General
See the Glossary of Defined Terms at the beginning of this Report for terms used herein. The accounting and reporting policies are in accordance with GAAP. Additionally, where applicable, the policies conform to the accounting and reporting guidelines prescribed by bank regulatory authorities. The following is a summary of significant accounting policies.
Principles of Consolidation
The consolidated financial statements include the accounts of Truist Financial Corporation and those subsidiaries that are wholly or majority owned by Truist or over which Truist exercises control. Intercompany accounts and transactions are eliminated in consolidation. The results of operations of companies or assets acquired are included from the date of acquisition. Results of operations associated with entities or net assets sold are included through the date of disposition.
Truist holds investments in certain legal entities that are considered VIEs. VIEs are legal entities in which equity investors do not have sufficient equity at risk for the entity to independently finance its activities, or as a group, the holders of the equity investment at risk lack the power through voting or similar rights to direct the activities of the entity that most significantly impact its economic performance, or do not have the obligation to absorb the expected losses of the entity or the right to receive expected residual returns of the entity. Consolidation of a VIE is required if a reporting entity is the primary beneficiary of the VIE.
Investments in VIEs are evaluated to determine if Truist is the primary beneficiary. This evaluation gives appropriate consideration to the design of the entity and the variability that the entity was designed to create and pass along, the relative power of each party, and to Truist's relative obligation to absorb losses or receive residual returns of the entity. Truist has variable interests in certain entities that are not required to be consolidated, including affordable housing and other partnership interests. Refer to "Note 16. Commitments and Contingencies" for additional disclosures regarding Truist's VIEs.
Investments in entities for which the Company has the ability to exercise significant influence, but not control, over operating and financing decisions are accounted for using the equity method of accounting. These investments are included in Other assets in the Consolidated Balance Sheets at cost, adjusted to reflect the Company’s portion of income, loss, or dividends of the investee. Truist records its portion of income or loss in Other noninterest income in the Consolidated Statements of Income. These investments are periodically evaluated for impairment.
The Company reports any noncontrolling interests in its subsidiaries in the equity section of the Consolidated Balance Sheets and separately presents the income or loss attributable to the noncontrolling interest of a consolidated subsidiary in its Consolidated Statements of Income.
Truist Financial Corporation 87
Business Combinations
Truist accounts for business combinations using the acquisition method. The accounts of an acquired entity are included as of the date of acquisition, and any excess of purchase price over the fair value of the net assets acquired is capitalized as goodwill. See "Note 2. Business Combinations" for further discussion of the Merger and its impact on the Company’s consolidated financial statements.
Securities Financing Activities
The Company borrows securities and purchases securities under agreements to resell as part of its securities financing activities. On the acquisition date of these securities, the Company and related counterparty agree on the amount of collateral required to secure the principal amount loaned under these agreements. The Company monitors collateral values daily and calls for additional collateral to be provided as warranted under the respective agreements.
Trading Activities
Various trading assets and liabilities are used to accommodate the investment and risk management activities of the Company's clients. Product offerings to clients include debt securities, loans traded in the secondary market, equity securities, derivative contracts, and other similar financial instruments. The Company elects to apply fair value accounting to trading loans. Trading loans include: (i) loans held in connection with the Company's trading business primarily consisting of commercial and corporate leveraged loans; (ii) SBA loans guaranteed by the U.S. government; and (iii) loans made or acquired in connection with the Company’s TRS business. Other trading-related activities include acting as a market maker for certain debt and equity security transactions, derivative instrument transactions, and foreign exchange transactions. Trading assets and liabilities are measured at fair value with changes in fair value recognized within Noninterest income in the Company’s Consolidated Statements of Income. Interest income on trading account securities is included in Interest on other earning assets. For additional information on the Company’s trading activities, see "Note 16. Commitments and Contingencies" and “Note 18. Fair Value Disclosures.”
Investment Securities
The Company invests in various debt securities primarily as a store of liquidity and as part of the overall ALM process to optimize income and market performance over an entire interest rate cycle. Investments in debt securities that are not held for trading purposes are classified as HTM or AFS. Interest income on securities is recognized in income on an accrual basis. Premiums and discounts are amortized into interest income using the effective interest method over the contractual life of the security. As prepayments are received, a proportionate amount of the related premium or discount is recognized in income so that the effective interest rate on the remaining portion of the security continues unchanged.
Debt securities are classified as HTM when Truist has both the intent and ability to hold the securities to maturity. HTM securities are reported at amortized cost. During the fourth quarter of 2019, the Company transferred securities from HTM to AFS in response to changes in regulatory capital rules.
Debt securities that may be sold to meet liquidity needs arising from unanticipated deposit and loan fluctuations, changes in regulatory capital requirements or unforeseen changes in market conditions are classified as AFS. AFS securities are reported at estimated fair value, with unrealized gains and losses reported in AOCI, net of deferred income taxes, in the Shareholders' equity section of the Consolidated Balance Sheets. Gains or losses realized from the sale of AFS securities are determined by specific identification and are included in Noninterest income.
88 Truist Financial Corporation
Investment securities in an unrealized loss position are evaluated quarterly for other-than-temporary credit impairment. An unrealized loss exists when the current fair value of an individual security is less than its amortized cost basis. Truist considers such factors as the length of time and the extent to which the fair value has been below amortized cost, long term expectations and recent experience regarding principal and interest payments, Truist's intent to sell and whether it is more-likely-than-not that the Company would be required to sell those securities before the anticipated recovery of the amortized cost basis. Cash flow modeling is used to evaluate non-agency securities in an unrealized loss position for potential credit impairment. These models give consideration to long-term macroeconomic factors applied to current security default rates, prepayment rates and recovery rates, and security-level performance.
The credit component of an OTTI loss is recognized in earnings and the non-credit component is recognized in AOCI, net of tax, in situations where Truist does not intend to sell the security and it is more-likely-than-not that Truist will not be required to sell the security prior to recovery. Subsequent to recognition of OTTI, an increase in expected cash flows is recognized as a yield adjustment over the remaining expected life of the security based on an evaluation of the nature of the increase. For additional information on the Company’s investment securities, see "Note 4. Investment Securities,” and “Note 18. Fair Value Disclosures.”
Equity Securities
Equity securities that are not classified as trading assets or liabilities are recorded in Other assets on the Company’s Consolidated Balance Sheets. Equity securities with readily determinable fair values (marketable) are measured at fair value, with changes in the fair value recognized as a component of Noninterest income in the Company’s Consolidated Statements of Income. Marketable equity securities include mutual fund investments and other publicly traded equity securities. Dividends received from mutual fund investments, other marketable equity securities and FHLB stock are recognized within Interest income in the Consolidated Statements of Income. Equity securities that do not have readily determinable fair values (nonmarketable) are accounted for at cost minus impairment, if any, plus or minus changes resulting from observable price changes in orderly transactions for the identical or similar investment of the same issuer, also referred to as the measurement alternative. Any adjustments to the carrying value of these nonmarketable equity securities are recognized in Other noninterest income in the Company’s Consolidated Statements of Income. Nonmarketable equity securities include FHLB stock and other equity investments. For additional information on the Company’s equity securities, see "Note 18. Fair Value Disclosures.”
LHFS
LHFS includes residential and commercial mortgage loans that management intends to sell in the secondary market and other loans that management has an active plan to sell.
The Company elects to apply fair value accounting to substantially all residential and commercial mortgage loans that are originated with the intent to be sold in the secondary market. Direct loan origination fees associated with these loans are recorded as Residential mortgage and Commercial real estate related income. Direct loan origination costs are generally recorded in Personnel expense. The fair value of these loans is derived from observable current market prices when available and includes loan servicing value. When observable market prices are not available, the Company uses judgment and estimates fair value using internal models that reflect assumptions consistent with those that would be used by a market participant in estimating fair value.
First lien residential mortgage LHFS are transferred in conjunction with GNMA and GSE securitization transactions, whereby the loans are exchanged for cash or securities that are readily redeemable for cash with servicing rights retained. Net gains/losses on the sale of residential mortgage LHFS are recorded at inception of the associated interest rate lock commitments and reflect the change in value of the loans resulting from changes in interest rates from the time the Company enters into interest rate lock commitments with borrowers until the loans are sold, adjusted for pull through rates and excluding hedge transactions initiated to mitigate this market risk. Commercial mortgage LHFS are sold to FNMA and FHLMC and the Company also issues and sells GNMA commercial MBS backed by FHA insured loans. The loans and securities are exchanged for cash with servicing rights retained. Gains and losses on sales of residential and commercial mortgage loans are included in Residential mortgage and Commercial real estate income, respectively.
LHFS also includes specifically identified loans where management has committed to a formal plan of sale and the loans are available for immediate sale. These loans are generally recorded at LOCOM. Origination fees and costs for such loans are capitalized in the basis of the loan and are included in the calculation of realized gains and losses upon sale. Adjustments to reflect unrealized gains and losses resulting from changes in fair value and realized gains and losses upon ultimate sale of the loans are classified as Noninterest income in the Consolidated Statements of Income. The fair value of these loans is estimated using observable market prices when available, but may also incorporate consideration of other unobservable inputs such as indicative bids, broker price opinions or other information derived from internal or external data sources.
Truist Financial Corporation 89
Loans and Leases
The Company's accounting methods for loans differ depending on whether the loans are originated or purchased, and if purchased, whether or not the loans reflect credit deterioration since the date of origination such that it is probable at the date of acquisition that Truist will be unable to collect all contractually required payments.
Fair values for acquired loans were based on a discounted cash flow methodology that considered credit loss expectations, market interest rates and other market factors such as liquidity from the perspective of a market participant. Loans were grouped together according to similar characteristics and were treated in the aggregate when applying various valuation techniques. The probability of default, loss given default and prepayment assumptions were the key factors driving credit losses which were embedded into the estimated cash flows. These assumptions were informed by internal data on loan characteristics, historical loss experience, and current and forecasted economic conditions. The interest and liquidity component of the estimate was determined by discounting interest and principal cash flows through the expected life of each loan. The discount rates used for loans are based on current market rates for new originations of comparable loans and include adjustments for liquidity. The discount rate does not include a factor for credit losses as that has been included as a reduction to the estimated cash flows. All of the merged loans were marked to fair value as of the Merger date and therefore, there is no allowance related to these loans.
Originated Loans and Leases
Loans and leases that management has the intent and ability to hold for the foreseeable future or until maturity or payoff are reported at their outstanding principal balances net of any unearned income, charge-offs, and unamortized fees and costs. The net amount of nonrefundable loan origination fees and certain direct costs associated with the lending process are deferred and amortized to interest income over the contractual lives of the loans using the effective interest method.
Purchased Loans
Purchased loans are recorded at their fair value at the acquisition date. Credit discounts are included in the determination of fair value; therefore, an ALLL is not recorded at the acquisition date.
Purchased loans are evaluated upon acquisition and classified as either purchased impaired or purchased non-impaired. PCI loans reflect credit deterioration since origination such that it is probable at acquisition that Truist will be unable to collect all contractually required payments. For PCI loans, expected cash flows at the acquisition date in excess of the fair value of loans are recorded as interest income over the life of the loans using a level yield method if the timing and amount of the future cash flows is reasonably estimable. Subsequent to the acquisition date, increases in cash flows over those expected at the acquisition date are recognized prospectively as interest income. Decreases in expected cash flows due to credit deterioration are recognized by recording an ALLL. For purchased non-impaired loans, the difference between the fair value and UPB of the loan at the acquisition date is amortized or accreted to interest income over the contractual life of the loans using the effective interest method. In the event of prepayment, the remaining unamortized amount is recognized in interest income.
TDRs
Modifications to a borrower's debt agreement are considered TDRs if a concession is granted for economic or legal reasons related to a borrower's financial difficulties that otherwise would not be considered. TDRs are undertaken in order to improve the likelihood of recovery on the loan and may take the form of modifications that result in the stated interest rate being lower than the current market rate for new debt with similar risk, other modifications to the structure of the loan that fall outside of normal underwriting policies and procedures, or in certain limited circumstances forgiveness of principal or interest. A restructuring that results in only a delay in payments that is insignificant is not considered an economic concession. Modifications of PCI loans that are part of a pool accounted for as a single asset are not considered TDRs.
TDRs can involve loans remaining nonperforming, moving to nonperforming, or continuing on accruing status, depending on the individual facts and circumstances of the borrower and an evaluation as to whether the borrower will be able to repay the loan based on the modified terms. The evaluation of the borrower's ability to repay the loan is based on a current, well-documented credit analysis. In circumstances where the TDR involves charging off a portion of the loan balance, the Company classifies these TDRs as nonperforming.
90 Truist Financial Corporation
NPAs
NPAs include NPLs and foreclosed property. Foreclosed property consists of real estate and other assets acquired as a result of clients' loan defaults.
Truist's policies for placing loans on nonperforming status conform to guidelines prescribed by bank regulatory authorities. Truist classifies loans and leases as past due when the payment of principal and interest based upon contractual terms is greater than 30 days delinquent or if one payment is past due. The following table summarizes the delinquency thresholds that are used in evaluating nonperforming classification and the timing of charge-offs (PCI loans are considered to be performing due to the application of the expected cash flows method):
| (number of days) | Placed on Nonperforming (1) | Charged-off | ||||||||||||||||||||||||
| Commercial: | ||||||||||||||||||||||||||
| Commercial and industrial | 90 | (2) | 90 | (2) | ||||||||||||||||||||||
| CRE | 90 | (2) | 90 | (2) | ||||||||||||||||||||||
| Commercial construction | 90 | (2) | 90 | (2) | ||||||||||||||||||||||
| Lease financing | 90 | (2) | 90 | (2) | ||||||||||||||||||||||
| Consumer: | ||||||||||||||||||||||||||
| Residential mortgage (3) | 90 | to | 180 | 90 | to | 210 | ||||||||||||||||||||
| Residential home equity and direct (3) | 90 | to | 120 | 90 | to | 180 | ||||||||||||||||||||
| Indirect auto (3) | 90 | 120 | ||||||||||||||||||||||||
| Indirect other (3) | 90 | to | 120 | 120 | to | 180 | ||||||||||||||||||||
| Student (4) | NA | 120 | to | 180 | ||||||||||||||||||||||
| Credit card | NA | 90 | to | 180 | ||||||||||||||||||||||
(1) Loans may be returned to accrual status when they become current as to both principal and interest and concern no longer exists as to the collectability of principal and interest, generally indicated by 180 days of sustained payment performance.
(2) Or when it is probable that principal or interest is not fully collectible, whichever occurs first.
(3) Depends on product type, loss mitigation status, status of the government guarantee, if applicable, and certain other product-specific factors.
(4) Government guaranteed student loans are not placed on nonperforming status or charged-off regardless of delinquency status because collection of principal and interest is reasonably assured.
When commercial loans are placed on nonperforming status, a charge-off is recorded, if necessary, to decrease the carrying value of such loans to the estimated recoverable amount. Retail loans are subject to mandatory charge-off at a specified delinquency date consistent with regulatory guidelines.
Certain past due loans may remain on accrual status if management determines that it does not have concern over the collectability of principal and interest. Generally, when loans are placed on nonperforming status, accrued interest receivable is reversed against interest income in the current period and amortization of deferred loan fees and expenses is suspended. For commercial loans and certain consumer loans, payments received for interest and lending fees thereafter are applied as a reduction to the remaining principal balance as long as concern exists as to the ultimate collection of the principal.
Assets acquired as a result of foreclosure are subsequently carried at the lower of cost or net realizable value. Net realizable value equals fair value less estimated selling costs. Any excess of cost over net realizable value at the time of foreclosure is charged to the ALLL. NPAs are subject to periodic revaluations of the collateral underlying impaired loans and foreclosed real estate. The periodic revaluations are generally based on the appraised value of the property and may include additional liquidity adjustments based upon the expected retention period. Truist's policies require that valuations be updated at least annually and that upon foreclosure, the valuation must not be more than six months old, otherwise an update is required. Any subsequent changes in value as well as gains or losses from the disposition on these assets are recognized in Other noninterest expense in the Consolidated Statements of Income. For additional information on the Company’s loan and lease activities, see "Note 5. Loans and ACL.”
Truist Financial Corporation 91
ACL
The ACL includes the ALLL and the RUFC. The ACL represents management's estimate of probable credit losses incurred in the loan and lease portfolios and off-balance sheet lending commitments at the balance sheet date. Estimates for loan and lease losses are determined by analyzing historical loan and lease losses, historical loan and lease migration to charge-off experience, current trends in delinquencies and charge-offs, changes in internal risk ratings, expected cash flows on PCI loans, current assessment of impaired loans and leases, the results of regulatory examinations and changes in the size, composition and risk assessment of the loan and lease portfolio. As part of the ACL estimation process, Truist develops a series of loss estimate factors, which are modeled projections of the frequency and severity of losses. Changes to the ACL are made by charges to the Provision for credit losses, which is reflected in the Consolidated Statements of Income. Loan or lease balances deemed to be uncollectible are charged off against the ALLL. Recoveries of amounts previously charged off are credited to the ALLL.
The methodology used to determine the RUFC is inherently similar to that used to determine the collectively evaluated component of the ALLL, adjusted for factors specific to binding commitments, including the probability of funding and exposure at default. The RUFC is reported in Other liabilities on the Consolidated Balance Sheets and the provision associated with changes in the RUFC is recognized in the Provision for credit losses in the Consolidated Statements of Income.
While management uses the best information available to establish the ACL, future adjustments may be necessary if economic conditions differ substantially from the assumptions used in computing the ACL.
The portfolio segment level represents the level at which an entity develops and documents a systematic methodology to determine its ACL. Truist concluded that its loan and lease portfolio consists of four portfolio segments: commercial, consumer, credit card, and PCI. The commercial portfolio segment was identified based on the risk-based approach used to estimate the ALLL for the vast majority of these loans. The consumer portfolio segment was identified based on the delinquency-based approach used to estimate the ALLL. The credit card portfolio segment, which also uses a delinquency-based ALLL approach, was identified because of the unique nature of its lending arrangements. The PCI portfolio segment was identified based on the expected cash flows approach used to estimate the ALLL. See "Note 5. Loans and ACL" for additional information about the classes of financing receivables included within each of these loan portfolio segments.
The entire amount of the ACL is available to absorb losses on any loan category or lending-related commitment.
The following provides a description of accounting policies and methodologies related to each of the portfolio segments:
Commercial
The vast majority of loans in the commercial lending portfolio are assigned risk ratings based on an assessment of conditions that affect the borrower's ability to meet contractual obligations under the loan agreement. This process includes reviewing borrowers' financial information, historical payment experience, credit documentation, public information, and other information specific to each borrower. Risk ratings are reviewed on an annual basis, or more frequently for many relationships based on policy requirements regarding various risk characteristics. While this review is largely focused on the borrower's ability to repay the loan, Truist also considers the capacity and willingness of a loan's guarantors to support the debt service on the loan as a secondary source of repayment. When a guarantor exhibits the documented capacity and willingness to support the loan, Truist may consider extending the loan maturity and/or temporarily deferring principal payments if the ultimate collection of both principal and interest is not in question. In these cases, Truist may deem the loan to not be impaired due to the documented capacity and willingness of the guarantor to repay the loan. Loans are considered impaired when the borrower (or guarantor in certain circumstances) does not have the cash flow capacity or willingness to service the debt according to contractual terms, or it does not appear reasonable to assume that the borrower will continue to pay according to the contractual agreement. The following table summarizes risk ratings:
| Risk Rating | Description | ||||
| Pass | Loans not considered to be problem credits | ||||
| Special Mention | Loans that have a potential weakness deserving management's close attention | ||||
| Substandard | Loans for which a well-defined weakness has been identified that may put full collection of contractual cash flows at risk | ||||
Large commercial nonaccrual loans and commercial loans whose terms have been modified in a TDR are reviewed to determine the amount of specific allowance required in accordance with applicable accounting guidance. The specific allowance established for these loans is based on a thorough analysis of expected cash flows which typically includes assessing the most probable source of repayment, including the present value of the loan’s expected future cash flows, the loan’s estimated market value, or the estimated fair value of the underlying collateral, net of estimated selling costs. Any change in the present value attributable to the passage of time is recognized through the Provision for credit losses.
92 Truist Financial Corporation
Collectively evaluated allowances are established for loans and leases grouped into pools based on similar characteristics. In this process, allowance factors are based on an analysis of historical charge-off experience, expected loss factors derived from the Company's internal risk rating process, portfolio trends, and regional and national economic conditions. Other adjustments may be made to the ALLL after an assessment of internal and external influences on credit quality that may not be fully reflected in the historical loss or risk rating data. These influences may include elements such as changes in credit underwriting, concentration risk, macroeconomic conditions, and/or recent observable asset quality trends.
Consumer and Revolving Credit
The majority of the ALLL related to the consumer and revolving credit lending portfolios is calculated on a collective basis using delinquency status, which is the primary factor considered in determining whether a loan should be classified as nonperforming. Incurred loss estimates for Truist's consumer and revolving credit lending portfolios are based on estimated migration rates that are developed based on historical experience and current risk mix (e.g., prevailing delinquency rates). These estimates may be adjusted to reflect current economic conditions and current portfolio trends. The remaining portion of the ALLL related to the consumer and revolving credit lending portfolios relates to loans that have been deemed impaired based on their classification as a TDR at the balance sheet date. The ALLL for consumer and revolving credit TDRs is based on discounted cash flow analyses that incorporate adjustments to future cash flows that reflect management's best estimate of the default risk related to TDRs based on a combination of historical experience and management judgment.
PCI
PCI loans are aggregated into loan pools based upon common risk characteristics. The ALLL for each loan pool is based on an analysis that is performed to estimate the expected cash flows. To the extent that the expected cash flows of a loan pool have decreased due to credit deterioration, Truist establishes an ALLL.
Premises and Equipment
Premises, equipment, finance leases and leasehold improvements are stated at cost less accumulated depreciation and amortization. Depreciation and amortization are computed primarily using the straight-line method over the estimated useful lives of the related assets and is recorded within the corresponding Noninterest expense categories on the Consolidated Statements of Income. Leasehold improvements are amortized using the straight-line method over the shorter of the improvements’ estimated useful lives or the lease term.
Lessee operating and finance leases
Truist has operating and finance leases for data centers, corporate offices, branches, retail centers, and certain equipment, and determines if an arrangement is a lease at inception. Operating leases with an original lease term in excess of one year are included in Other assets and Other liabilities in the Consolidated Balance Sheets. Finance leases are included in Premises and equipment and Long-term debt in the Consolidated Balance Sheets.
ROU assets represent the right to use an underlying asset for the lease term and lease liabilities represent the obligation to make lease payments arising from the lease. Operating and finance lease assets and liabilities are recognized at the commencement date based on the present value of lease payments over the lease term. Operating lease costs are recorded in Net occupancy expense or Equipment expense based on the underlying asset. Truist uses an implicit interest rate in determining the present value of lease payments when readily determinable, and a collateralized incremental borrowing rate when an implicit rate is not available. Lease terms consider options to extend or terminate based on the determination of whether such renewal or termination options are deemed reasonably certain.
Lease agreements that contain non-lease components are generally accounted for as a single lease component. Variable costs, such as maintenance expenses, property and sales taxes, association dues and index based rate increases, are expensed as they are incurred.
Bank-Owned Life Insurance
Life insurance policies on certain current and former directors, officers and employees, for which Truist is the owner and beneficiary are stated at the cash surrender value within Other assets in the Consolidated Balance Sheets. Changes in cash surrender value and proceeds from insurance benefits are recorded in Income from bank-owned life insurance in the Consolidated Statements of Income.
Truist Financial Corporation 93
Income Taxes
The Company’s provision for income taxes is based on income and expense reported for financial statement purposes after adjustments for permanent differences such as interest income from lending to tax-exempt entities, tax credits, and amortization expense related to qualified affordable housing investments. In computing the provision for income taxes, the Company evaluates the technical merits of its income tax positions based on current legislative, judicial, and regulatory guidance. The deferral method of accounting is used on investments that generate investment tax credits, such that the investment tax credits are recognized as a reduction to the related investment. Additionally, the Company recognizes all excess tax benefits and deficiencies on employee share-based payments as a component of the Provision for income taxes in the Consolidated Statements of Income. These tax effects, generally determined upon the exercise of stock options or vesting of restricted stock, are treated as discrete items in the period in which they occur. The provision for income taxes does not reflect the tax effects of unrealized gains and losses and other income and expenses recorded in AOCI. For additional information related to the Company's unrealized gains and losses, see "Note 13. AOCI.”
DTAs and DTLs result from differences between the timing of the recognition of assets and liabilities for financial reporting purposes and for income tax purposes. These deferred assets and liabilities are measured using the enacted tax rates and laws that are expected to apply in the periods in which the DTAs or DTLs are expected to be realized. Subsequent changes in the tax laws require adjustment to these deferred assets and liabilities with the cumulative effect included in the Provision for income taxes for the period in which the change is enacted. A valuation allowance is recognized for a DTA, if based on the weight of available evidence, it is more likely than not that some portion or all of the DTA will not be realized.
Interest and penalties related to the Company’s tax positions are recognized as a component of the Provision for income taxes in the Consolidated Statements of Income. For additional information on the Company’s activities related to income taxes, see "Note 14. Income Taxes.”
Derivative Financial Instruments
The Company records derivative contracts at fair value in Other assets and Other liabilities on the Consolidated Balance Sheets. Accounting for changes in the fair value of a derivative depends upon whether or not it has been designated in a formal, qualifying hedging relationship.
Changes in the fair value of derivatives not designated in a hedging relationship are recognized within Noninterest income in the Consolidated Statements of Income. This includes derivatives that the Company enters into in a dealer capacity to facilitate client transactions and as a risk management tool to economically hedge certain identified risks associated with assets carried at fair value such as MSRs, along with certain interest rate lock commitments on residential mortgage and commercial loans that are a normal part of the Company’s operations. The Company also evaluates contracts, such as brokered deposits and debt, to determine whether any embedded derivatives are required to be bifurcated and separately accounted for as freestanding derivatives.
Certain derivatives used as risk management tools are designated as accounting hedges and are used to mitigate the Company’s exposure to changes in interest rates or other identified market risks. The Company prepares written hedge documentation for all derivatives which are designated as hedges of (i) changes in the fair value of a recognized asset or liability (fair value hedge) attributable to a specified risk or (ii) a forecasted transaction, such as the variability of cash flows to be received or paid related to a recognized asset or liability (cash flow hedge). The written hedge documentation includes identification of, among other items, the risk management objective, hedging instrument, hedged item and methodologies for assessing and measuring hedge effectiveness, along with support for management’s assertion that the hedge will be highly effective. Methodologies related to hedge effectiveness include (i) statistical regression analysis of changes in the cash flows of the actual derivative and hypothetical derivatives, or (ii) statistical regression analysis of changes in the fair values of the actual derivative and the hedged item. Prior to third quarter of 2019, the Company also used the shortcut method for hedges with matched terms that permitted the assumption of no ineffectiveness.
For designated hedging relationships, subsequent to the initial assessment of hedge effectiveness, the Company generally performs retrospective and prospective effectiveness testing using a qualitative approach on a quarterly basis.
94 Truist Financial Corporation
Below is a summary of the cash flow and fair value hedge programs utilized by Truist:
| Cash Flow Hedges | Fair Value Hedges | |||||||
| Risk exposure | Variability in cash flows of interest payments on floating rate loans, overnight funding and various LIBOR funding instruments. | Changes in value on fixed rate long-term debt, FHLB advances, loans and state and political subdivision securities due to changes in interest rates. | ||||||
| Risk management objective | Hedge the variability in the interest payments and receipts on future cash flows for forecasted transactions related to the first unhedged payments and receipts of variable interest due to changes in the contractually specified interest rate. | Convert the fixed rate paid or received to a floating rate, primarily through the use of swaps. | ||||||
| Treatment during the hedge period | Changes in value of the hedging instruments are recognized in AOCI until the related cash flows from the hedged item are recognized in earnings. The amount reclassified to earnings is recorded in the same line item as the earnings effect of the hedged item. | Changes in value of both the hedging instruments and the assets or liabilities being hedged are recognized in the income statement line item associated with the instrument being hedged. | ||||||
| Treatment if hedge ceases to be highly effective or is terminated | Hedge is dedesignated. Changes in value recorded in AOCI before dedesignation are amortized to yield over the period the forecasted hedged transactions impact earnings. | If hedged item remains outstanding, the basis adjustment that resulted from hedging is amortized into earnings over the lesser of the designated hedged period or the maturity date of the instrument, and cash flows from terminations are reported in the same category as the cash flows from the hedged item. | ||||||
| Treatment if transaction is no longer probable of occurring during forecast period or within a short period thereafter | Hedge accounting ceases and any gain or loss in AOCI is recognized in earnings immediately. | Not applicable | ||||||
Derivatives expose the Company to risk that the counterparty to the derivative contract does not perform as expected. The Company manages its exposures to counterparty credit risk associated with derivatives by entering into transactions with counterparties with defined exposure limits based on their credit quality and in accordance with established policies and procedures. All counterparties are reviewed regularly as part of the Company’s credit risk management practices and appropriate action is taken to adjust the exposure limits to certain counterparties as necessary. The Company’s derivative transactions are generally governed by ISDA agreements or other legally enforceable industry standard master netting agreements. In certain cases and depending on the nature of the underlying derivative transactions, bilateral collateral agreements are also utilized.
The Company and its subsidiaries are subject to OTC derivative clearing requirements, which require certain derivatives to be cleared through central clearing houses. These clearing houses require the Company to post initial and variation margin to mitigate the risk of non-payment, the latter of which is received or paid daily based on the net asset or liability of the contracts. Beginning in 2017, the Company adopted settlement to market treatment for the cash collateralizing derivative contracts with certain centrally cleared counterparties. Derivative balances with these counterparties are considered settled by the collateral, and the implementation of the settlement to market treatment was applied based on the effective date of rulebook changes made by the applicable counterparties.
When the Company has more than one outstanding derivative transaction with a single counterparty, and there exists a legal right of offset with that counterparty, the Company considers its exposure to the counterparty to be the net fair value of its derivative positions with that counterparty. If the net fair value is positive, then the corresponding asset value also reflects cash collateral held. Beginning in the second quarter of 2019, the Company adopted a policy to offset derivative transactions with a single counterparty as well as any cash collateral paid to and received from that counterparty for derivative contracts that are subject to ISDA or other legally enforceable netting arrangements and meet accounting guidance for offsetting treatment.
For additional information on the Company’s derivative activities, see "Note 18. Fair Value Disclosures” and "Note 19. Derivative Financial Instruments.”
Truist Financial Corporation 95
Goodwill and Other Intangible Assets
Goodwill represents the cost in excess of the fair value of net assets acquired (including identifiable intangibles) in transactions accounted for as business combinations. Truist allocates goodwill to the reporting unit(s) that are expected to benefit from the synergies of the business combination. Goodwill is tested at least annually for impairment as of October 1st of each year and more frequently if circumstances exist that indicate a possible reduction in the fair value of a reporting unit below its carrying value. If, after assessing all relevant events or circumstances, Truist concludes that it is more-likely-than-not that the fair value of a reporting unit is below its carrying value, then an impairment test is required. Truist may also elect to bypass the qualitative assessment and proceed directly to the impairment test. Truist measures impairment using the present value of estimated future cash flows. Discount rates are based upon the cost of capital specific to the industry in which the reporting unit operates. If the carrying value of the reporting unit exceeds its fair value, a second step is performed, which measures the amount of impairment by comparing the carrying amount of goodwill to its implied fair value.
MSRs
Truist has two classes of MSRs for which it separately manages the economic risks: residential and commercial. Both classes of MSRs are accounted for primarily at fair value with changes in fair value recorded in Residential mortgage income and Commercial real estate related income on the Consolidated Statements of Income. The fair value of servicing rights is impacted by a variety of factors, including prepayment assumptions, discount rates, delinquency rates, contractually-specified servicing fees, servicing costs, and underlying portfolio characteristics. These risks are hedged with various derivative instruments that are intended to mitigate the income statement effect to changes in fair value. The underlying assumptions and estimated values are corroborated by values received from independent third parties and comparisons to market transactions. For additional information on the Company’s servicing rights, see "Note 8. Loan Servicing.”
Fair Value Measurement
Fair value is defined as the price that would be received to sell an asset or paid to transfer a liability in an orderly transaction between market participants at the measurement date. Depending on the nature of the asset or liability, the Company uses various valuation techniques and assumptions when estimating fair value. The Company classifies inputs used in valuation techniques within the fair value hierarchy discussed in "Note 18. Fair Value Disclosures.”
When measuring assets and liabilities at fair value, the Company considers the principal or most advantageous market in which it would transact and considers assumptions that market participants would use when pricing the asset or liability. Assets and liabilities that are required to be measured at fair value on a recurring basis include trading securities, derivative instruments, AFS securities, and certain other equity securities. Assets and liabilities that the Company has elected to measure at fair value on a recurring basis include trading loans, loans originated to be sold and classified as LHFS, and residential and commercial MSRs. Other assets and liabilities are measured at fair value on a non-recurring basis, such as when assets are evaluated for impairment, the basis of accounting is lower of cost or market, or for disclosure purposes. Examples of these non-recurring fair value measurements include certain LHFS and loans and leases held for investment, OREO, certain cost or equity method investments, and intangible and long-lived assets. For additional information on the Company’s valuation of assets and liabilities held at fair value, see "Note 18. Fair Value Disclosures.”
Equity-Based Compensation
96 Truist Financial Corporation
Pension and Postretirement Benefit Obligations
Truist offers various pension plans and postretirement benefit plans to employees. Calculation of the obligations and related expenses under these plans requires the use of actuarial valuation methods and assumptions. The discount rate assumption used to measure the pension and postretirement benefit obligations is set by reference to a high quality corporate bond yield curve and the individual characteristics of the plan such as projected cash flow patterns and payment durations. The expected long-term rate of return on assets is based on the expected returns for each major asset class in which the plan invests, adjusted for the weight of each asset class in the target mix.
Revenue Recognition
In the ordinary course of business, the Company recognizes two primary types of revenue in its Consolidated Statements of Income, Interest income and Noninterest income. The Company’s principal source of revenue is interest income from loans and securities, which is recognized on an accrual basis using the effective interest method. For information on the Company’s policies for recognizing interest income on loans and securities, see the “Loans and Leases,” “LHFS,” “Trading Activities,” and “Investment Securities” sections within this Note.
Noninterest income includes revenue from various types of transactions and services provided to clients. The Company recognizes revenue from contracts with customers as performance obligations identified are satisfied. Performance obligations are typically satisfied in one year or less. We have elected the practical expedient to expense the incremental costs of obtaining a contract when incurred when the amortization period is one year or less. As of December 31, 2019, remaining performance obligations consisted primarily of insurance and investment banking services for contracts with an original expected length of one year or less.
Insurance income
Insurance commissions are received on the sale of insurance products as agent or broker, and revenue is recognized at a point in time upon the placement date of the insurance policies, representing the Company’s related performance obligations. Payment is normally received within the policy period. In addition to placement, Truist also provides insurance policy related risk management services. The Company’s execution of these risk management services represents its performance obligations. Revenue is recognized over time as these services are provided. Performance-based commissions are recognized when received or earlier when, upon consideration of past results and current conditions, the revenue is deemed not probable of reversal. Insurance commissions are included in the IH operating segment. Refer to “Note 21. Operating Segments” for information on segments results.
Transaction and service-based revenues
Transaction and service-based revenues include service charges on deposits, wealth management income, card and payment related fees, and investment banking income. Revenue is recognized at a point in time when the transactions occur or over time as services are performed over primarily monthly or quarterly periods. Payment is typically received in the period the transactions occur or, in some cases, within 90 days of the service period. Fees may be fixed or, where applicable, based on a percentage of transaction size or managed assets. These revenues, and their relationship to the Company’s operating segments, are further described by type below. Refer to “Note 21. Operating Segments” for information on segments results.
Service charges on deposits include account maintenance, cash and treasury management, wire transfers, ATM, overdraft and other deposit-related fees. The Company’s execution of the services related to these fees represents its performance obligations. Each of these performance obligations are either satisfied over time or at a point in time as the services are provided to the client. The Company is the principal when rendering these services. Payments for services provided are either withdrawn from client accounts as services are rendered or in the billing period following the completion of the service. The transaction price for each of these fees is based on the Company’s predetermined fee schedules. Service charges on deposits are recognized in the CB&W and C&CB operating segments.
Wealth management income includes trust and investment management income, retail investment and brokerage services, and investment advisory and other specialty wealth management fees. The Company’s execution of these services represents its related performance obligations. The Company generally recognizes trust and investment management and advisory revenue over time as services are rendered based on either a percentage of the market value of the assets under management or advisement, or fixed based on the services provided to the client. Fees are generally swept from the client’s account one billing period in arrears based on the prior period’s asset balances under management or advisement. The Company also offers selling and distribution services and earns commissions through the sale of annuity and mutual fund products, acting as agent in these transactions and recognizing revenue at a point in time when the client enters into an agreement with the product carrier. The Company may also receive trailing commissions and 12b-1 fees related to mutual fund and annuity products and recognizes this revenue in the period earned. Retail trade execution commissions are earned and recognized on the trade date with payment on the settlement date. Wealth management income is included in the CB&W operating segment.
Truist Financial Corporation 97
Card and payment related fees include interchange fees from credit and debit cards, merchant acquirer revenue, and other card related services. Interchange fees are earned by the Company each time a request for payment is initiated by a client at a merchant for which the Company transfers the funds on behalf of the client. Interchange rates are set by the payment network and are based on purchase volumes and other factors. Interchange fees are received daily and recognized at a point in time when the card transaction is processed, which represents the Company’s related performance obligation. The Company is considered an agent of the client and incurs costs with the payment network to facilitate the interchange with the merchant; therefore, the related payment network expense is recognized as a reduction of card fees. Truist also offers rewards and/or rebates to its client based on card usage. The costs associated with these programs are recognized as a reduction of card fees. Card and payment related fees are recognized in the CB&W and C&CB operating segments.
Investment banking and trading income includes securities underwriting fees, advisory fees, loan syndication fees, and trade execution services revenue. Underwriting fees are earned on the trade date when the Company, as a member of an underwriting syndicate, purchases the securities from the issuer and sells the securities to third party investors. Each member of the syndicate is responsible for selling its portion of the underwriting and is liable for the proportionate costs of the underwriting; therefore, the Company’s portion of underwriting revenue and expense is presented gross within noninterest income and noninterest expense. The transaction price is based on a percentage of the total transaction amount and payments are settled shortly after the trade date. Fees for merger and acquisition advisory services, including various activities such as business valuation, identification of potential targets or acquirers, and the issuance of fairness opinions, are generally earned and recognized by the Company when performance obligations are satisfied. The Company’s execution of the advisory services related to these fees represents its performance obligations. The Company is the principal when rendering these services. The transaction price is based on contractually specified terms agreed upon with the client for each advisory service. Loan syndication fees are typically recognized at the closing of a loan syndication transaction. Revenue related to corporate trade execution services is earned and recognized on the trade date with payment on the settlement date. Investment banking and trading income is included in the C&CB operating segment.
Earnings Per Share
Basic EPS is computed by dividing net income available to common shareholders by the weighted average number of common shares outstanding during each period. Diluted EPS is computed by dividing net income available to common shareholders by the weighted average number of common shares outstanding during each period, plus common share equivalents calculated for stock options, warrants, and restricted stock outstanding using the treasury stock method. For additional information on the Company’s EPS, see "Note 20. Computation of EPS.”
Related Party Transactions
The Company periodically enters into transactions with certain of its executive officers, directors, affiliates, trusts, and/or other related parties in its ordinary course of business. The Company is required to disclose material related party transactions, other than certain compensation and other arrangements entered into in the normal course of business. Information related to the Company’s relationships with VIEs and employee benefit plan arrangements is included in the Notes to the Consolidated Financial Statements in this Form 10-K.
Subsequent Events
The Company evaluated events that occurred between December 31, 2019 and the date the accompanying financial statements were issued, and there were no material events, other than those already discussed, that would require recognition in the Company’s Consolidated Financial Statements or disclosure in the accompanying Notes.
98 Truist Financial Corporation
Changes in Accounting Principles and Effects of New Accounting Pronouncements
| Standard | Description | Effects on the Financial Statements | ||||||
| Standard Adopted January 1, 2019 | ||||||||
| Leases | Requires lessees to recognize assets and liabilities related to certain operating leases on the balance sheet, requires additional disclosures by lessees, and contains targeted changes to accounting by lessors. | Truist established ROU assets of $860 million and lease liabilities of $997 million. The impact to equity, net of tax, was a reduction of $31 million. There was no material impact to its Consolidated Statements of Income. Truist adopted the guidance on a prospective basis and did not reassess whether any expired or existing contract contains a lease, the classification of leases or the initial direct costs. | ||||||
| Standards Adopted January 1, 2020 | ||||||||
| Credit Losses | Replaces the incurred loss impairment methodology with an expected credit loss methodology and requires consideration of a broader range of information to determine credit loss estimates. Financial assets measured at amortized cost will be presented at the net amount expected to be collected by using an allowance for credit losses. Purchased credit deteriorated loans will receive an allowance for expected credit losses. Any credit impairment on AFS debt securities for which the fair value is less than cost will be recorded through an allowance for expected credit losses. The standard also requires expanded disclosures related to credit losses and asset quality. |
Truist adopted this standard using the modified retrospective approach.
The adoption of this standard resulted in a $2.9 billion increase to the ACL and a $2.1 billion decrease to Retained earnings adjusted for deferred taxes and other impacts, which will be reflected in the Company's first quarter 2020 financial statements. The adoption of this standard did not have a material impact on the AFS securities portfolio. |
||||||
| Simplifying the Test for Goodwill Impairment | Simplifies the subsequent measurement of goodwill, by eliminating the second step from the goodwill impairment test. The amendments require an entity to perform its annual, or interim, goodwill impairment test by comparing the fair value of a reporting unit with its carrying amount. The standard requires an entity to recognize an impairment charge for the amount by which a reporting unit's carrying amount exceeds its fair value, with the loss limited to the total amount of goodwill allocated to that reporting unit. The standard must be applied on a prospective basis. | The standard does not currently have an impact on the Company’s consolidated financial statements; however, if subsequent to adoption, the carrying amount of a reporting unit exceeds its respective fair value, the Company would be required to recognize an impairment charge for the amount that the carrying value exceeds the fair value. | ||||||
NOTE 2.
Business Combinations
Effective December 6, 2019, the Company completed its previously announced Merger with SunTrust pursuant to an Agreement and Plan of Merger dated as of February 7, 2019 and amended as of June 14, 2019. Upon closing, each SunTrust share was exchanged for
1.295
shares of BB&T stock. At the closing, SunTrust merged with and into BB&T, with BB&T continuing as the surviving corporation. In connection with the Merger, the Company changed its name from BB&T Corporation to Truist Financial Corporation. Following the Merger, on December 7, 2019, SunTrust Bank, a wholly-owned subsidiary of SunTrust, merged with and into Branch Bank, with Branch Bank continuing as the surviving bank. In connection with the Merger, Branch Bank changed its name to Truist Bank. SunTrust was incorporated in the State of Georgia and its principal operating subsidiary was SunTrust Bank. The Truist Board of Directors consists of 22 directors with 11 members from each heritage Company's Board.
In connection with the Merger, certain equity awards held by SunTrust employees were converted into Truist equity awards, with the number of shares underlying such award adjusted based on the exchange ratio. Converted equity awards will continue to be subject to the same terms and conditions as applied to the corresponding SunTrust equity award, except that, in the case of SunTrust performance stock unit awards, the number of shares underlying the converted Company equity award was determined based on actual performance through September 30, 2019 and target performance for the balance of the applicable performance period and such award will continue to vest after the Merger solely based on service.
Upon closing, each outstanding share of perpetual preferred stock issued by SunTrust was converted into the right to receive one share of an applicable newly issued series of Truist preferred stock having substantially the same terms as such share of SunTrust preferred stock. The Company issued series I, J, K, L and M non-cumulative perpetual preferred stock with a total par and fair value of $
2.0
billion on the Merger closing date. Refer to "Note 12. Shareholders' Equity" for additional information related to the preferred share issuance.
Truist Financial Corporation 99
The following table presents additional information on merger consideration:
| (Dollars in millions, except per share data, shares in thousands) | Amount | ||||
| Common stock issued |
|
||||
| Share price on December 6, 2019 | $ |
|
|||
| Fair value of consideration for outstanding common stock | $ |
|
|||
| Fair value of consideration for preferred stock |
|
||||
| Consideration related to equity awards |
|
||||
| Cash in lieu of fractional shares |
|
||||
| Fair value of merger consideration | $ |
|
|||
The Merger has been accounted for as a business combination. Accordingly, the assets acquired and liabilities assumed are presented at their fair values as of the Merger date. The determination of fair value requires management to make estimates about discount rates, future expected cash flows, market conditions and other future events that are highly subjective in nature and subject to change. Due to the timing of the transaction closing date and the Company’s annual report on Form 10-K, the initial accounting for the business combination is incomplete and the Company’s purchase price allocation is considered preliminary. Fair value estimates related to the acquired assets and liabilities are subject to adjustment for up to one year after the closing date of the Merger as additional information becomes available. Valuations subject to change include, but are not limited to, loans, certain deposits, certain other assets, customer relationships, purchased credit card receivables and the core deposit intangible. Immaterial amounts of the intangible assets recognized are deductible for income tax purposes.
100 Truist Financial Corporation
The following table sets forth a preliminary allocation of merger consideration to the fair value of the identifiable tangible and intangible assets acquired and liabilities assumed of SunTrust:
| (Dollars in millions) | UPB | Fair Value | |||||||||
| Fair value of merger consideration | $ |
|
|||||||||
| Assets | |||||||||||
| Cash and due from banks |
|
||||||||||
| Interest-bearing deposits with banks |
|
||||||||||
| Securities borrowed or purchased under resale agreements |
|
||||||||||
| Trading assets |
|
||||||||||
| AFS securities |
|
||||||||||
| LHFS |
|
||||||||||
| Loans and leases: | |||||||||||
| Commercial and industrial | $ |
|
|
||||||||
| CRE |
|
|
|||||||||
| Commercial Construction |
|
|
|||||||||
| Commercial Leases |
|
|
|||||||||
| Mortgage Loans |
|
|
|||||||||
| Home Equity and Direct Lending |
|
|
|||||||||
| Indirect Auto |
|
|
|||||||||
| Indirect Other |
|
|
|||||||||
| Student Lending |
|
|
|||||||||
| Credit Card |
|
|
|||||||||
| PCI |
|
|
|||||||||
| Total loans and leases | $ |
|
|
||||||||
| Premises and equipment |
|
||||||||||
| CDI and other intangible assets |
|
||||||||||
| MSRs |
|
||||||||||
| Other assets |
|
||||||||||
| Total assets |
|
||||||||||
| Liabilities and Equity | |||||||||||
| Deposits |
(
|
||||||||||
| Short-term borrowings |
(
|
||||||||||
| Long-term debt |
(
|
||||||||||
| Other liabilities |
(
|
||||||||||
| Total liabilities |
(
|
||||||||||
| Noncontrolling interest |
(
|
||||||||||
| Less: Net assets |
|
||||||||||
| Goodwill | $ |
|
|||||||||
The following is a description of the methods used to determine the fair values of significant assets and liabilities.
Cash and cash equivalents; Interest-bearing deposits with banks, and Federal Funds sold and securities purchased under resale agreements:
The carrying amount of these assets is a reasonable estimate of fair value based on the short-term nature of these assets.
Trading assets and AFS Securities:
Fair values for trading and AFS securities are based on quoted market prices, where available. If quoted market prices are not available, fair value estimates are based on observable inputs including quoted market prices for similar instruments, quoted market prices that are not in an active market or other inputs that are observable in the market. In the absence of observable inputs, fair value is estimated based on pricing models and/or discounted cash flow methodologies. The majority of AFS securities were priced by third-party vendors whereas trading securities are priced internally. All securities are subject to IPV. Trading loans are valued primarily using quoted prices for similar instruments in active markets or quoted prices for identical or similar instruments in markets that are not active by a third-party pricing service.
LHFS:
The fair value is primarily based on quoted market prices for securities backed by similar types of loans, adjusted for servicing, interest rate risk, and credit risk.
Truist Financial Corporation 101
Loans and leases:
Fair values for loans were based on a discounted cash flow methodology that considered credit loss expectations, market interest rates and other market factors such as liquidity from the perspective of a market participant. Loans were grouped together according to similar characteristics and were treated in the aggregate when applying various valuation techniques. The probability of default, loss given default and prepayment assumptions were the key factors driving credit losses which were embedded into the estimated cash flows. These assumptions were informed by internal data on loan characteristics, historical loss experience, and current and forecasted economic conditions. The interest and liquidity component of the estimate was determined by discounting interest and principal cash flows through the expected life of each loan. The discount rates used for loans are based on current market rates for new originations of comparable loans and include adjustments for liquidity. The discount rates do not include a factor for credit losses as that has been included as a reduction to the estimated cash flows. All of the merged loans were marked to fair value as of the Merger date and therefore, there is no allowance related to these loans.
CDI:
This intangible asset represents the value of the relationships with certain deposit clients. The fair value was estimated based on a discounted cash flow methodology that gave appropriate consideration to expected client attrition rates, cost of the deposit base, reserve requirements, net maintenance cost attributable to client deposits and an estimate of the cost associated with alternative funding sources. The discount rates used for CDI assets are based on current market rates. The CDI is being amortized over 10 years based upon the estimated economic benefits received.
MSRs:
Residential MSRs are valued using an OAS valuation model to project cash flows over multiple interest rate scenarios, which are discounted at risk-adjusted rates. Commercial MSRs are valued using a cash flow valuation model that calculates the present value of estimated future net servicing cash flows.
Deposits:
The fair values used for the demand and savings deposits by definition equal the amount payable on demand at the Merger date. The fair values for time deposits are estimated using a discounted cash flow calculation that applies interest rates currently being offered to the contractual interest rates on such time deposits.
Short-term borrowings:
The carrying amounts of short-term borrowings are reasonable estimates of fair value based on the short-term nature of these liabilities. The fair value of securities sold short is determined in the same manner as trading securities.
Long-term debt
: The fair values of long-term debt instruments are estimated based on quoted market prices for the instrument if available, or for similar instruments if not available, or by using discounted cash flow analyses, based on current incremental borrowing rates for similar types of instruments.
Preferred stock:
The fair values of preferred stock are estimated based on quoted market prices for the instruments.
Branch Divestitures
In connection with the merger, on November 8, 2019, BB&T and SunTrust announced that, subject to closing and other customary closing conditions, First Horizon Bank, a wholly owned subsidiary of First Horizon National Corporation, entered into an agreement to acquire 30 branches located in North Carolina, Virginia and Georgia from SunTrust Bank, a wholly owned subsidiary of SunTrust, to satisfy regulatory requirements in connection with the Merger. There are approximately $400 million in loans and leases and $2.4 billion in deposits that will be divested as part of this transaction, which is expected to close in 2020.
Pro Forma Financial Information
The following table presents unaudited pro forma results as if the merger between BB&T and SunTrust occurred on January 1, 2018 and includes the impact of amortizing and accreting certain estimated purchase accounting adjustments such as intangible assets as well as fair value adjustments to loans, deposits, and long-term debt. Merger-related expenses that occurred at the effective date of the Merger or subsequent to the Merger are not reflected in the pro forma amounts. For the year ended December 31, 2019, the Company incurred $298 million of costs related to the Merger which were included in Merger-related and restructuring charges in the Consolidated Statements of Income, and consisted primarily of advisory, legal, banker, and accounting and consulting fees. These costs include $127 million of costs directly related to the transaction, which are reflected in the the year ended December 31, 2018 in the table below. Cost savings are not reflected in the pro forma amounts. The pro forma information does not necessarily reflect the results of operations that would have occurred had BB&T merged with SunTrust on January 1, 2018.
102 Truist Financial Corporation
|
(Dollars in millions) |
SunTrust Results from December 7, 2019 to December 31, 2019 | Unaudited Pro Forma Results for the Year End December 31, | |||||||||||||||
| 2019 | 2018 | ||||||||||||||||
| Net interest income | $ |
|
$ |
|
$ |
|
|||||||||||
| Noninterest income |
|
|
|
||||||||||||||
| Net income |
|
|
|
||||||||||||||
NOTE 3.
Securities Financing Activities
Securities purchased under resale agreements are primarily collateralized by U.S. government or agency securities and are carried at the amounts at which the securities will be subsequently sold, plus accrued interest. Securities borrowed are primarily collateralized by corporate securities. The Company borrows securities and purchases securities under agreements to resell as part of its securities financing activities. On the acquisition date of these securities, the Company and the related counterparty agree on the amount of collateral required to secure the principal amount loaned under these arrangements.
The following table presents securities borrowed or purchased under resale agreements:
|
December 31,
(Dollars in millions) |
2019 | 2018 | ||||||||||||
| Securities purchased under resale agreements | $ |
|
$ |
|
||||||||||
| Securities borrowed |
|
|
||||||||||||
| Total securities borrowed or purchased under resale agreements | $ |
|
$ |
|
||||||||||
For securities sold under agreements to repurchase, the Company would be obligated to provide additional collateral in the event of a significant decline in fair value of the collateral pledged. This risk is managed by monitoring the liquidity and credit quality of the collateral, as well as the maturity profile of the transactions. Refer to "Note 16. Commitments and Contingencies" for additional information related to pledged securities. Securities sold under agreements to repurchase are accounted for as secured borrowings.
The following table presents the Company’s related activity, by collateral type and remaining contractual maturity:
|
December 31,
(Dollars in millions) |
2019 | 2018 | |||||||||||||||||||||||||||||||||||||||
| Overnight and Continuous | Up to 30 days | 30-90 days | Total | Overnight and Continuous | Up to 30 days | Total | |||||||||||||||||||||||||||||||||||
| U.S. Treasury | $ |
|
$ |
|
$ |
|
$ |
|
$ |
|
$ |
|
$ |
|
|||||||||||||||||||||||||||
| GSE |
|
|
|
|
|
|
|
||||||||||||||||||||||||||||||||||
| Agency MBS - residential |
|
|
|
|
|
|
|
||||||||||||||||||||||||||||||||||
| Corporate and other debt securities |
|
|
|
|
|
|
|
||||||||||||||||||||||||||||||||||
| Total securities sold under agreements to repurchase | $ |
|
$ |
|
$ |
|
$ |
|
$ |
|
$ |
|
$ |
|
|||||||||||||||||||||||||||
At December 31, 2019 and 2018, there were no transactions subject to legally enforceable master netting arrangements that were eligible for balance sheet netting.
Truist Financial Corporation 103
NOTE 4.
Investment Securities
During the fourth quarter of 2019, the Company transferred all HTM securities to AFS securities in response to changes in regulatory capital rules. Additionally, during the fourth quarter of 2019, the Company sold $
33.2
billion of securities, primarily representing the portfolio from SunTrust, to improve yield and lower premium amortization risk.
The following tables summarize the Company's AFS and HTM securities:
|
December 31, 2019
(Dollars in millions) |
Amortized Cost | Gross Unrealized | Fair Value | |||||||||||||||||||||||
| Gains | Losses | |||||||||||||||||||||||||
| AFS securities: | ||||||||||||||||||||||||||
| U.S. Treasury | $ |
|
$ |
|
$ |
|
$ |
|
||||||||||||||||||
| GSE |
|
|
|
|
||||||||||||||||||||||
| Agency MBS - residential |
|
|
|
|
||||||||||||||||||||||
| Agency MBS - commercial |
|
|
|
|
||||||||||||||||||||||
| States and political subdivisions |
|
|
|
|
||||||||||||||||||||||
| Non-agency MBS |
|
|
|
|
||||||||||||||||||||||
| Other |
|
|
|
|
||||||||||||||||||||||
| Total AFS securities | $ |
|
$ |
|
$ |
|
$ |
|
||||||||||||||||||
|
December 31, 2018
(Dollars in millions) |
Amortized Cost | Gross Unrealized | Fair Value | |||||||||||||||||||||||
| Gains | Losses | |||||||||||||||||||||||||
| AFS securities: | ||||||||||||||||||||||||||
| U.S. Treasury | $ |
|
$ |
|
$ |
|
$ |
|
||||||||||||||||||
| GSE |
|
|
|
|
||||||||||||||||||||||
| Agency MBS - residential |
|
|
|
|
||||||||||||||||||||||
| Agency MBS - commercial |
|
|
|
|
||||||||||||||||||||||
| States and political subdivisions |
|
|
|
|
||||||||||||||||||||||
| Non-agency MBS |
|
|
|
|
||||||||||||||||||||||
| Other |
|
|
|
|
||||||||||||||||||||||
| Total AFS securities | $ |
|
$ |
|
$ |
|
$ |
|
||||||||||||||||||
| HTM securities: | ||||||||||||||||||||||||||
| U.S. Treasury | $ |
|
$ |
|
$ |
|
$ |
|
||||||||||||||||||
| GSE |
|
|
|
|
||||||||||||||||||||||
| Agency MBS - residential |
|
|
|
|
||||||||||||||||||||||
| States and political subdivisions |
|
|
|
|
||||||||||||||||||||||
| Other |
|
|
|
|
||||||||||||||||||||||
| Total HTM securities | $ |
|
$ |
|
$ |
|
$ |
|
||||||||||||||||||
Certain securities issued by FNMA and FHLMC exceeded 10% of shareholders' equity at December 31, 2019. The FNMA investments had total amortized cost and fair value of $
16.1
billion and $
16.2
billion, respectively. The FHLMC investments had total amortized cost and fair value of $
11.8
billion and $
11.9
billion, respectively.
104 Truist Financial Corporation
The amortized cost and estimated fair value of the securities portfolio by contractual maturity are shown in the following table. The expected life of MBS may differ from contractual maturities because borrowers may have the right to prepay their obligations with or without penalties.
| Amortized Cost | Fair Value | ||||||||||||||||||||||||||||||||||||||||||||||||||||||||||
|
December 31, 2019
(Dollars in millions) |
Due in one year or less | Due after one year through five years | Due after five years through ten years | Due after ten years | Total | Due in one year or less | Due after one year through five years | Due after five years through ten years | Due after ten years | Total | |||||||||||||||||||||||||||||||||||||||||||||||||
| AFS securities: | |||||||||||||||||||||||||||||||||||||||||||||||||||||||||||
| U.S. Treasury | $ |
|
$ |
|
$ |
|
$ |
|
$ |
|
$ |
|
$ |
|
$ |
|
$ |
|
$ |
|
|||||||||||||||||||||||||||||||||||||||
| GSE |
|
|
|
|
|
|
|
|
|
|
|||||||||||||||||||||||||||||||||||||||||||||||||
| Agency MBS - residential |
|
|
|
|
|
|
|
|
|
|
|||||||||||||||||||||||||||||||||||||||||||||||||
| Agency MBS - commercial |
|
|
|
|
|
|
|
|
|
|
|||||||||||||||||||||||||||||||||||||||||||||||||
| States and political subdivisions |
|
|
|
|
|
|
|
|
|
|
|||||||||||||||||||||||||||||||||||||||||||||||||
| Non-agency MBS |
|
|
|
|
|
|
|
|
|
|
|||||||||||||||||||||||||||||||||||||||||||||||||
| Other |
|
|
|
|
|
|
|
|
|
|
|||||||||||||||||||||||||||||||||||||||||||||||||
| Total AFS securities | $ |
|
$ |
|
$ |
|
$ |
|
$ |
|
$ |
|
$ |
|
$ |
|
$ |
|
$ |
|
|||||||||||||||||||||||||||||||||||||||
The following tables present the fair values and gross unrealized losses of investments based on the length of time that individual securities have been in a continuous unrealized loss position:
| Less than 12 months | 12 months or more | Total | |||||||||||||||||||||||||||||||||
|
December 31, 2019
(Dollars in millions) |
Fair Value | Unrealized Losses | Fair Value | Unrealized Losses | Fair Value | Unrealized Losses | |||||||||||||||||||||||||||||
| AFS securities: | |||||||||||||||||||||||||||||||||||
| U.S. Treasury | $ |
|
$ |
|
$ |
|
$ |
|
$ |
|
$ |
|
|||||||||||||||||||||||
| GSE |
|
|
|
|
|
|
|||||||||||||||||||||||||||||
| Agency MBS - residential |
|
|
|
|
|
|
|||||||||||||||||||||||||||||
| Agency MBS - commercial |
|
|
|
|
|
|
|||||||||||||||||||||||||||||
| States and political subdivisions |
|
|
|
|
|
|
|||||||||||||||||||||||||||||
| Total | $ |
|
$ |
|
$ |
|
$ |
|
$ |
|
$ |
|
|||||||||||||||||||||||
| Less than 12 months | 12 months or more | Total | |||||||||||||||||||||||||||||||||
|
December 31, 2018
(Dollars in millions) |
Fair Value | Unrealized Losses | Fair Value | Unrealized Losses | Fair Value | Unrealized Losses | |||||||||||||||||||||||||||||
| AFS securities: | |||||||||||||||||||||||||||||||||||
| U.S. Treasury | $ |
|
$ |
|
$ |
|
$ |
|
$ |
|
$ |
|
|||||||||||||||||||||||
| GSE |
|
|
|
|
|
|
|||||||||||||||||||||||||||||
| Agency MBS - residential |
|
|
|
|
|
|
|||||||||||||||||||||||||||||
| Agency MBS - commercial |
|
|
|
|
|
|
|||||||||||||||||||||||||||||
| States and political subdivisions |
|
|
|
|
|
|
|||||||||||||||||||||||||||||
| Total | $ |
|
$ |
|
$ |
|
$ |
|
$ |
|
$ |
|
|||||||||||||||||||||||
| HTM securities: | |||||||||||||||||||||||||||||||||||
| U.S. Treasury | $ |
|
$ |
|
$ |
|
$ |
|
$ |
|
$ |
|
|||||||||||||||||||||||
| GSE |
|
|
|
|
|
|
|||||||||||||||||||||||||||||
| Agency MBS - residential |
|
|
|
|
|
|
|||||||||||||||||||||||||||||
| Total | $ |
|
$ |
|
$ |
|
$ |
|
$ |
|
$ |
|
|||||||||||||||||||||||
Substantially all of the unrealized losses on the securities portfolio were the result of changes in market interest rates compared to the date the securities were acquired rather than the credit quality of the issuers or underlying loans. At December 31, 2019, the Company did not intend to sell these securities nor was it more-likely-than-not that the Company would be required to sell these securities before their anticipated recovery or maturity.
The following table presents gross securities gains and losses recognized in earnings:
|
Year Ended December 31,
(Dollars in millions) |
2019 | 2018 | 2017 | ||||||||||||||
| Gross realized gains | $ |
|
$ |
|
$ |
|
|||||||||||
| Gross realized losses |
(
|
(
|
(
|
||||||||||||||
| Securities gains (losses), net | $ |
(
|
$ |
|
$ |
(
|
|||||||||||
Truist Financial Corporation 105
NOTE 5.
Loans and ACL
The following tables present loans and leases HFI by aging category. Guaranteed loans are not placed on nonaccrual status regardless of delinquency because collection of principal and interest is reasonably assured by the government.
| Accruing | ||||||||||||||||||||||||||||||||
|
December 31, 2019
(Dollars in millions) |
Current | 30-89 Days Past Due | 90 Days Or More Past Due | Nonperforming | Total | |||||||||||||||||||||||||||
| Commercial: | ||||||||||||||||||||||||||||||||
| Commercial and industrial | $ |
|
$ |
|
$ |
|
$ |
|
$ |
|
||||||||||||||||||||||
| CRE |
|
|
|
|
|
|||||||||||||||||||||||||||
| Commercial construction |
|
|
|
|
|
|||||||||||||||||||||||||||
| Lease financing |
|
|
|
|
|
|||||||||||||||||||||||||||
| Consumer: | ||||||||||||||||||||||||||||||||
| Residential mortgage |
|
|
|
|
|
|||||||||||||||||||||||||||
| Residential home equity and direct |
|
|
|
|
|
|||||||||||||||||||||||||||
| Indirect auto |
|
|
|
|
|
|||||||||||||||||||||||||||
| Indirect other |
|
|
|
|
|
|||||||||||||||||||||||||||
| Student |
|
|
|
|
|
|||||||||||||||||||||||||||
| Credit card |
|
|
|
|
|
|||||||||||||||||||||||||||
| PCI |
|
|
|
|
|
|||||||||||||||||||||||||||
| Total | $ |
|
$ |
|
$ |
|
$ |
|
$ |
|
||||||||||||||||||||||
| Accruing | ||||||||||||||||||||||||||||||||
|
December 31, 2018
(Dollars in millions) |
Current | 30-89 Days Past Due | 90 Days Or More Past Due | Nonperforming | Total | |||||||||||||||||||||||||||
| Commercial: | ||||||||||||||||||||||||||||||||
| Commercial and industrial | $ |
|
$ |
|
$ |
|
$ |
|
$ |
|
||||||||||||||||||||||
| CRE |
|
|
|
|
|
|||||||||||||||||||||||||||
| Commercial construction |
|
|
|
|
|
|||||||||||||||||||||||||||
| Lease financing |
|
|
|
|
|
|||||||||||||||||||||||||||
| Consumer: | ||||||||||||||||||||||||||||||||
| Residential mortgage |
|
|
|
|
|
|||||||||||||||||||||||||||
| Residential home equity and direct |
|
|
|
|
|
|||||||||||||||||||||||||||
| Indirect auto |
|
|
|
|
|
|||||||||||||||||||||||||||
| Indirect other |
|
|
|
|
|
|||||||||||||||||||||||||||
| Credit card |
|
|
|
|
|
|||||||||||||||||||||||||||
| PCI |
|
|
|
|
|
|||||||||||||||||||||||||||
| Total | $ |
|
$ |
|
$ |
|
$ |
|
$ |
|
||||||||||||||||||||||
The Company has undertaken a number of strategic actions to enhance the credit quality and interest-rate sensitivity of its loan and lease portfolio. During the third quarter of 2019, management sold a $
4.3
billion residential mortgage loan portfolio. This sale was followed by a number of balance sheet restructuring actions taken in the fourth quarter of 2019, including the transfer of:
•
$
2.5
billion of residential mortgage loans to LHFS,
•
$
356
million of commercial loans to LHFS as a result of a decision to exit a business, and
•
$
381
million of mortgage, consumer and commercial loans to LHFS related to the forthcoming branch divestiture arising from the Merger.
106 Truist Financial Corporation
The following table presents the carrying amount of loans by risk rating and performing status. Student loans are excluded as there is nominal risk of credit loss due to government guarantees or other credit enhancements. PCI loans were excluded because their related ALLL is determined by loan pool performance and revolving credit loans were excluded as the loans are charged-off rather than reclassifying these loans to nonperforming:
| December 31, 2019 | December 31, 2018 | ||||||||||||||||||||||||||||||||||||||||||||||
| (Dollars in millions) | Commercial & Industrial | CRE | Commercial Construction | Lease Financing | Commercial & Industrial | CRE | Commercial Construction | Lease Financing | |||||||||||||||||||||||||||||||||||||||
| Commercial: | |||||||||||||||||||||||||||||||||||||||||||||||
| Pass | $ |
|
$ |
|
$ |
|
$ |
|
$ |
|
$ |
|
$ |
|
$ |
|
|||||||||||||||||||||||||||||||
| Special mention |
|
|
|
|
|
|
|
|
|||||||||||||||||||||||||||||||||||||||
| Substandard-performing |
|
|
|
|
|
|
|
|
|||||||||||||||||||||||||||||||||||||||
| Nonperforming |
|
|
|
|
|
|
|
|
|||||||||||||||||||||||||||||||||||||||
| Total | $ |
|
$ |
|
$ |
|
$ |
|
$ |
|
$ |
|
$ |
|
$ |
|
|||||||||||||||||||||||||||||||
| December 31, 2019 | December 31, 2018 | ||||||||||||||||||||||||||||||||||||||||||||||
| Residential Mortgage | Residential home equity and direct | Indirect auto | Indirect Other | Residential Mortgage | Residential home equity and direct | Indirect auto | Indirect Other | ||||||||||||||||||||||||||||||||||||||||
| Consumer: | |||||||||||||||||||||||||||||||||||||||||||||||
| Performing | $ |
|
$ |
|
$ |
|
|
$ |
|
$ |
|
$ |
|
$ |
|
||||||||||||||||||||||||||||||||
| Nonperforming |
|
|
|
|
|
|
|
|
|||||||||||||||||||||||||||||||||||||||
| Total | $ |
|
$ |
|
|
$ |
|
$ |
|
$ |
|
$ |
|
$ |
|
||||||||||||||||||||||||||||||||
ACL
The following tables present activity in the ACL:
| (Dollars in millions) | Balance at Jan 1, 2017 | Charge-Offs | Recoveries | Provision (Benefit) | Assumed in the Merger | Balance at Dec 31, 2017 | ||||||||||||||||||||||||||||||||
| Commercial: | ||||||||||||||||||||||||||||||||||||||
| Commercial and industrial | $ |
|
$ |
(
|
$ |
|
$ |
|
$ | — | $ |
|
||||||||||||||||||||||||||
| CRE |
|
(
|
|
(
|
— |
|
||||||||||||||||||||||||||||||||
| Commercial construction |
|
(
|
|
|
|
|||||||||||||||||||||||||||||||||
| Lease financing |
|
(
|
|
|
— |
|
||||||||||||||||||||||||||||||||
| Consumer: | ||||||||||||||||||||||||||||||||||||||
| Residential mortgage |
|
(
|
|
|
— |
|
||||||||||||||||||||||||||||||||
| Residential home equity and direct |
|
(
|
|
|
— |
|
||||||||||||||||||||||||||||||||
| Indirect auto |
|
(
|
|
|
— |
|
||||||||||||||||||||||||||||||||
| Indirect other |
|
(
|
|
|
— |
|
||||||||||||||||||||||||||||||||
| Credit card |
|
(
|
|
|
— |
|
||||||||||||||||||||||||||||||||
| PCI |
|
(
|
|
(
|
— |
|
||||||||||||||||||||||||||||||||
| ALLL |
|
(
|
|
|
— |
|
||||||||||||||||||||||||||||||||
| RUFC |
|
|
|
|
— |
|
||||||||||||||||||||||||||||||||
| ACL | $ |
|
$ |
(
|
$ |
|
$ |
|
$ | — | $ |
|
||||||||||||||||||||||||||
Truist Financial Corporation 107
| (Dollars in millions) | Balance at Jan 1, 2018 | Charge-Offs | Recoveries | Provision (Benefit) | Assumed in the Merger | Balance at Dec 31, 2018 | ||||||||||||||||||||||||||||||||
| Commercial: | ||||||||||||||||||||||||||||||||||||||
| Commercial and industrial | $ |
|
$ |
(
|
$ |
|
$ |
|
$ | — | $ |
|
||||||||||||||||||||||||||
| CRE |
|
(
|
|
|
— |
|
||||||||||||||||||||||||||||||||
| Commercial construction |
|
(
|
|
|
|
|||||||||||||||||||||||||||||||||
| Lease financing |
|
(
|
|
|
— |
|
||||||||||||||||||||||||||||||||
| Consumer: | ||||||||||||||||||||||||||||||||||||||
| Residential mortgage |
|
(
|
|
|
— |
|
||||||||||||||||||||||||||||||||
| Residential home equity and direct |
|
(
|
|
|
— |
|
||||||||||||||||||||||||||||||||
| Indirect auto |
|
(
|
|
|
— |
|
||||||||||||||||||||||||||||||||
| Indirect other |
|
(
|
|
|
— |
|
||||||||||||||||||||||||||||||||
| Credit card |
|
(
|
|
|
— |
|
||||||||||||||||||||||||||||||||
| PCI |
|
(
|
|
(
|
— |
|
||||||||||||||||||||||||||||||||
| ALLL |
|
(
|
|
|
— |
|
||||||||||||||||||||||||||||||||
| RUFC |
|
|
|
(
|
— |
|
||||||||||||||||||||||||||||||||
| ACL | $ |
|
$ |
(
|
$ |
|
$ |
|
$ | — | $ |
|
||||||||||||||||||||||||||
| (Dollars in millions) | Balance at Jan 1, 2019 | Charge-Offs | Recoveries | Provision (Benefit) | Assumed in the Merger | Balance at Dec 31, 2019 | ||||||||||||||||||||||||||||||||
| Commercial: | ||||||||||||||||||||||||||||||||||||||
| Commercial and industrial | $ |
|
$ |
(
|
$ |
|
$ |
|
$ | — | $ |
|
||||||||||||||||||||||||||
| CRE |
|
(
|
|
|
— |
|
||||||||||||||||||||||||||||||||
| Commercial construction |
|
|
|
|
|
|||||||||||||||||||||||||||||||||
| Lease financing |
|
(
|
|
|
— |
|
||||||||||||||||||||||||||||||||
| Consumer: | ||||||||||||||||||||||||||||||||||||||
| Residential mortgage |
|
(
|
|
(
|
— |
|
||||||||||||||||||||||||||||||||
| Residential home equity and direct |
|
(
|
|
|
— |
|
||||||||||||||||||||||||||||||||
| Indirect auto |
|
(
|
|
|
— |
|
||||||||||||||||||||||||||||||||
| Indirect other |
|
(
|
|
|
|
|||||||||||||||||||||||||||||||||
| Credit card |
|
(
|
|
|
— |
|
||||||||||||||||||||||||||||||||
| PCI |
|
|
|
(
|
— |
|
||||||||||||||||||||||||||||||||
| ALLL |
|
(
|
|
|
— |
|
||||||||||||||||||||||||||||||||
| RUFC |
|
|
|
(
|
|
|
||||||||||||||||||||||||||||||||
| ACL | $ |
|
$ |
(
|
$ |
|
$ |
|
$ |
|
$ |
|
||||||||||||||||||||||||||
The following table provides a summary of loans that are collectively evaluated for impairment:
| December 31, 2019 | December 31, 2018 | |||||||||||||||||||||||||
| (Dollars in millions) | Recorded Investment | Related ALLL | Recorded Investment | Related ALLL | ||||||||||||||||||||||
| Commercial: | ||||||||||||||||||||||||||
| Commercial and industrial | $ |
|
$ |
|
$ |
|
$ |
|
||||||||||||||||||
| CRE |
|
|
|
|
||||||||||||||||||||||
| Commercial construction |
|
|
|
|
||||||||||||||||||||||
| Lease financing |
|
|
|
|
||||||||||||||||||||||
| Consumer: | ||||||||||||||||||||||||||
| Residential mortgage |
|
|
|
|
||||||||||||||||||||||
| Residential home equity and direct |
|
|
|
|
||||||||||||||||||||||
| Indirect auto |
|
|
|
|
||||||||||||||||||||||
| Indirect other |
|
|
|
|
||||||||||||||||||||||
| Student |
|
|
|
|
||||||||||||||||||||||
| Credit card |
|
|
|
|
||||||||||||||||||||||
| PCI |
|
|
|
|
||||||||||||||||||||||
| Total | $ |
|
$ |
|
$ |
|
$ |
|
||||||||||||||||||
108 Truist Financial Corporation
The following tables set forth certain information regarding impaired loans, excluding PCI and LHFS, that were individually evaluated for impairment. These tables exclude guaranteed student loans and guaranteed residential mortgages for which there was nominal risk of principal loss due to the government guarantee or other credit enhancements.
| UPB | Recorded Investment | Related ALLL | Average Recorded Investment | Interest Income Recognized | |||||||||||||||||||||||||||||||
|
As of / For The Year Ended December 31, 2019
(Dollars in millions) |
Without an ALLL | With an ALLL | |||||||||||||||||||||||||||||||||
| Commercial: | |||||||||||||||||||||||||||||||||||
| Commercial and industrial | $ |
|
$ |
|
$ |
|
$ |
|
$ |
|
$ |
|
|||||||||||||||||||||||
| CRE |
|
|
|
|
|
|
|||||||||||||||||||||||||||||
| Commercial construction |
|
|
|
|
|
|
|||||||||||||||||||||||||||||
| Lease financing |
|
|
|
|
|
|
|||||||||||||||||||||||||||||
| Consumer: | |||||||||||||||||||||||||||||||||||
| Residential mortgage |
|
|
|
|
|
|
|||||||||||||||||||||||||||||
| Residential home equity and direct |
|
|
|
|
|
|
|||||||||||||||||||||||||||||
| Indirect auto |
|
|
|
|
|
|
|||||||||||||||||||||||||||||
| Indirect other |
|
|
|
|
|
|
|||||||||||||||||||||||||||||
| Credit card |
|
|
|
|
|
|
|||||||||||||||||||||||||||||
| Total | $ |
|
$ |
|
$ |
|
$ |
|
$ |
|
$ |
|
|||||||||||||||||||||||
| UPB | Recorded Investment | Related ALLL | Average Recorded Investment | Interest Income Recognized | |||||||||||||||||||||||||||||||
|
As of / For The Year Ended December 31, 2018
(Dollars in millions) |
Without an ALLL | With an ALLL | |||||||||||||||||||||||||||||||||
| Commercial: | |||||||||||||||||||||||||||||||||||
| Commercial and industrial | $ |
|
$ |
|
$ |
|
$ |
|
$ |
|
$ |
|
|||||||||||||||||||||||
| CRE |
|
|
|
|
|
|
|||||||||||||||||||||||||||||
| Commercial construction |
|
|
|
|
|
|
|||||||||||||||||||||||||||||
| Lease financing |
|
|
|
|
|
|
|||||||||||||||||||||||||||||
| Consumer: | |||||||||||||||||||||||||||||||||||
| Residential mortgage |
|
|
|
|
|
|
|||||||||||||||||||||||||||||
| Residential home equity and direct |
|
|
|
|
|
|
|||||||||||||||||||||||||||||
| Indirect auto |
|
|
|
|
|
|
|||||||||||||||||||||||||||||
| Indirect other |
|
|
|
|
|
|
|||||||||||||||||||||||||||||
| Credit card |
|
|
|
|
|
|
|||||||||||||||||||||||||||||
| Total | $ |
|
$ |
|
$ |
|
$ |
|
$ |
|
$ |
|
|||||||||||||||||||||||
TDRs
The following table presents a summary of TDRs, all of which are considered impaired:
|
December 31,
(Dollars in millions) |
2019 | 2018 | |||||||||
| Performing TDRs: | |||||||||||
| Commercial: | |||||||||||
| Commercial and industrial | $ |
|
$ |
|
|||||||
| CRE |
|
|
|||||||||
| Commercial construction |
|
|
|||||||||
| Consumer: | |||||||||||
| Residential mortgage |
|
|
|||||||||
| Residential home equity and direct |
|
|
|||||||||
| Indirect auto |
|
|
|||||||||
| Indirect other |
|
|
|||||||||
| Credit card |
|
|
|||||||||
| Total performing TDRs |
|
|
|||||||||
| Nonperforming TDRs (also included in NPL disclosures) |
|
|
|||||||||
| Total TDRs | $ |
|
$ |
|
|||||||
| ALLL attributable to TDRs | $ |
|
$ |
|
|||||||
Truist Financial Corporation 109
The primary reason loan modifications were classified as TDRs is summarized below. Balances represent the recorded investment at the end of the quarter in which the modification was made. Rate modifications consist of TDRs made with below market interest rates, including those that also have modifications of loan structures.
| 2019 | 2018 | 2017 | |||||||||||||||||||||||||||||||||||||||||||||||||||
|
Year Ended December 31,
(Dollars in millions) |
Type of Modification | ALLL Impact | Type of Modification | ALLL Impact | Type of Modification | ALLL Impact | |||||||||||||||||||||||||||||||||||||||||||||||
| Rate | Structure | Rate | Structure | Rate | Structure | ||||||||||||||||||||||||||||||||||||||||||||||||
| Newly designated TDRs: | |||||||||||||||||||||||||||||||||||||||||||||||||||||
| Commercial: | |||||||||||||||||||||||||||||||||||||||||||||||||||||
| Commercial and industrial | $ |
|
$ |
|
$ |
|
$ |
|
$ |
|
$ |
|
$ |
|
$ |
|
$ |
|
|||||||||||||||||||||||||||||||||||
| CRE |
|
|
|
|
|
|
|
|
|
||||||||||||||||||||||||||||||||||||||||||||
| Commercial construction |
|
|
|
|
|
|
|
|
|
||||||||||||||||||||||||||||||||||||||||||||
| Consumer: | |||||||||||||||||||||||||||||||||||||||||||||||||||||
| Residential mortgage |
|
|
|
|
|
|
|
|
|
||||||||||||||||||||||||||||||||||||||||||||
| Residential home equity and direct |
|
|
|
|
|
|
|
|
|
||||||||||||||||||||||||||||||||||||||||||||
| Indirect auto |
|
|
|
|
|
|
|
|
|
||||||||||||||||||||||||||||||||||||||||||||
| Indirect other |
|
|
|
|
|
|
|
|
|
||||||||||||||||||||||||||||||||||||||||||||
| Credit card |
|
|
|
|
|
|
|
|
|
||||||||||||||||||||||||||||||||||||||||||||
| Re-modification of previously designated TDRs |
|
|
|
|
|
|
|
|
|
||||||||||||||||||||||||||||||||||||||||||||
Charge-offs and forgiveness of principal and interest for TDRs were immaterial for all periods presented.
The pre-default balance for modifications that had been classified as TDRs during the previous 12 months that experienced a payment default was $78 million, $76 million and $104 million for the years ended December 31, 2019, 2018 and 2017, respectively. Payment default is defined as movement of the TDR to nonperforming status, foreclosure or charge-off, whichever occurs first.
NPLs and Foreclosed Property
The following table presents a summary of nonperforming assets and residential mortgage loans in the process of foreclosure:
|
December 31,
(Dollars in millions) |
2019 | 2018 | |||||||||
| Nonperforming loans and leases HFI | $ |
|
$ |
|
|||||||
| Nonperforming LHFS |
|
|
|||||||||
| Foreclosed real estate |
|
|
|||||||||
| Other foreclosed property |
|
|
|||||||||
| Total nonperforming assets | $ |
|
$ |
|
|||||||
| Residential mortgage loans in the process of foreclosure | $ |
|
$ |
|
|||||||
Unearned Income, Discounts and Net Deferred Loan Fees and Costs
The following table presents additional information about loans and leases:
|
December 31,
(Dollars in millions) |
2019 | 2018 | |||||||||
| Unearned income, discounts and net deferred loan fees and costs, excluding PCI | $ |
|
$ |
(
|
|||||||
PCI
The following table presents a summary of PCI loans arising from the Merger:
| (Dollars in millions) | December 6, 2019 | ||||
| Contractually required payments including interest | $ |
|
|||
| Less: nonaccretable difference |
(
|
||||
| Cash flows expected to be collected |
|
||||
| Less: accretable yield |
(
|
||||
| Fair value of acquired PCI loans | $ |
|
|||
110 Truist Financial Corporation
The following table presents a rollforward of the accretable yield and additional information on PCI loans:
| (Dollars in millions) | |||||
| Accretable yield balance at January 1, 2019 | $ |
|
|||
| Merger with SunTrust |
|
||||
| Accretion |
(
|
||||
| Reclassification (to) from nonaccretable difference |
|
||||
|
Accretable yield balance at December 31, 2019
|
$ |
|
|||
|
Unpaid principal balance at December 31, 2019
|
$ |
|
|||
NOTE 6.
Premises and Equipment
A summary of premises and equipment is presented in the accompanying table:
|
December 31,
(Dollars in millions) |
Estimated Useful Life | ||||||||||||||||||||||
| 2019 | 2018 | ||||||||||||||||||||||
| Land and land improvements | Indefinite | $ |
|
$ |
|
||||||||||||||||||
| Buildings and building improvements |
|
|
|
||||||||||||||||||||
| Furniture and equipment |
|
- |
|
|
|
||||||||||||||||||
| Leasehold improvements |
|
|
|||||||||||||||||||||
| Construction in progress |
|
|
|||||||||||||||||||||
| Finance leases |
|
|
|||||||||||||||||||||
| Total |
|
|
|||||||||||||||||||||
| Less: Accumulated depreciation |
(
|
(
|
|||||||||||||||||||||
| Net premises and equipment | $ |
|
$ |
|
|||||||||||||||||||
NOTE 7.
Goodwill and Other Intangible Assets
The changes in the carrying amount of goodwill attributable to operating segments are reflected in the table below. Based on the results of the impairment assessments, there were no impairments for the periods presented. Truist did not observe any factors that would more-likely-than-not reduce the fair value of a reporting unit below its respective carrying amount as of period-end. For 2019, the goodwill added for mergers and acquisitions primarily relates to the Merger. Effective at the close of the Merger, the operating segments were realigned and goodwill allocated to the new segments based on the relative fair value of the underlying reporting units, as applicable. Refer to "Note 2. Business Combinations" and "Note 21. Operating Segments" for additional information. For 2018, the goodwill added for mergers and acquisitions relates to the July 2, 2018, acquisition of Regions Insurance from Regions Financial Corporation, which resulted in $
201
million of goodwill and$
175
million of identifiable intangible assets in the IH segment.
| (Dollars in millions) | CB&W | C&CB | IH | Total | |||||||||||||||||||
| Goodwill, January 1, 2018 | $ |
|
$ |
|
$ |
|
$ |
|
|||||||||||||||
| Mergers and acquisitions |
|
|
|
|
|||||||||||||||||||
| Adjustments |
(
|
|
|
(
|
|||||||||||||||||||
| Goodwill, December 31, 2018 | $ |
|
$ |
|
$ |
|
$ |
|
|||||||||||||||
| Mergers and acquisitions |
|
|
|
|
|||||||||||||||||||
| Adjustments |
|
|
(
|
(
|
|||||||||||||||||||
| Goodwill, December 31, 2019 | $ |
|
$ |
|
$ |
|
$ |
|
|||||||||||||||
The following table, which excludes fully amortized intangibles, presents information for identifiable intangible assets:
| Weighted Average Remaining Amortization Period | 2019 | 2018 | ||||||||||||||||||||||||||||||||||||
|
December 31,
(Dollars in millions) |
Gross Carrying Amount | Accumulated Amortization | Net Carrying Amount | Gross Carrying Amount | Accumulated Amortization | Net Carrying Amount | ||||||||||||||||||||||||||||||||
| CDI | 10.3 years | $ |
|
$ |
(
|
$ |
|
$ |
|
$ |
(
|
$ |
|
|||||||||||||||||||||||||
|
Other, primarily client relationship intangibles
|
10.9 |
|
(
|
|
|
(
|
|
|||||||||||||||||||||||||||||||
| Total | $ |
|
$ |
(
|
$ |
|
$ |
|
$ |
(
|
$ |
|
||||||||||||||||||||||||||
Truist Financial Corporation 111
The estimated amortization expense of identifiable intangibles for the next five years and thereafter is presented as follows:
|
Year Ended December 31,
(Dollars in millions) |
|||||||||||||||||||||||||||||||||||
| 2020 | 2021 | 2022 | 2023 | 2024 | Thereafter | ||||||||||||||||||||||||||||||
| Estimated amortization expense | $ |
|
$ |
|
$ |
|
$ |
|
$ |
|
$ |
|
|||||||||||||||||||||||
NOTE 8.
Loan Servicing
The Company acquires servicing rights and retains servicing rights for certain of its sales or securitizations of residential mortgages and commercial loans. Servicing rights on residential and commercial mortgages are capitalized by the Company as MSRs on the Consolidated Balance Sheets. Income earned by the Company on its residential MSRs is derived primarily from contractually specified mortgage servicing fees and late fees, net of curtailment costs. Income earned by the Company on its commercial mortgage servicing rights is derived primarily from contractually specified servicing fees and other ancillary fees.
Residential Mortgage
Activities
The following tables summarize residential mortgage servicing activities:
|
December 31,
(Dollars in millions) |
2019 | 2018 | 2017 | |||||||||||||||||
| UPB of residential mortgage loan servicing portfolio | $ |
|
$ |
|
$ |
|
||||||||||||||
|
UPB of residential mortgage loans serviced for others, primarily agency conforming fixed rate
|
|
|
|
|||||||||||||||||
| Mortgage loans sold with recourse |
|
|
|
|||||||||||||||||
| Maximum recourse exposure from mortgage loans sold with recourse liability |
|
|
|
|||||||||||||||||
| Indemnification, recourse and repurchase reserves |
|
|
|
|||||||||||||||||
|
As of / For the Year Ended December 31,
(Dollars in millions) |
2019 | 2018 | 2017 | |||||||||||||||||
| UPB of residential mortgage loans sold from LHFS | $ |
|
$ |
|
$ |
|
||||||||||||||
| Pre-tax gains recognized on mortgage loans sold and held for sale |
|
|
|
|||||||||||||||||
| Servicing fees recognized from mortgage loans serviced for others |
|
|
|
|||||||||||||||||
|
Approximate weighted average servicing fee on the outstanding balance of residential mortgage loans serviced for others
|
|
% |
|
% |
|
% | ||||||||||||||
| Weighted average interest rate on mortgage loans serviced for others |
|
|
|
|||||||||||||||||
The following table presents a roll forward of the carrying value of residential MSRs recorded at fair value:
|
Year Ended December 31,
(Dollars in millions) |
2019 | 2018 | 2017 | |||||||||||||||||
| Residential MSRs, carrying value, January 1 | $ |
|
$ |
|
|
|||||||||||||||
| Merger |
|
|
|
|||||||||||||||||
| Other additions |
|
|
|
|||||||||||||||||
| Change in fair value due to changes in valuation inputs or assumptions: | ||||||||||||||||||||
| Prepayment speeds |
(
|
(
|
(
|
|||||||||||||||||
| OAS |
|
|
|
|||||||||||||||||
| Servicing costs |
|
|
|
|||||||||||||||||
| Realization of expected net servicing cash flows, passage of time and other |
(
|
(
|
(
|
|||||||||||||||||
| Residential MSRs, carrying value, December 31 | $ |
|
$ |
|
$ |
|
||||||||||||||
112 Truist Financial Corporation
The sensitivity of the fair value of the Company's residential MSRs to changes in key assumptions is presented in the following table:
| 2019 | 2018 | |||||||||||||||||||||||||||||||||||||
|
December 31,
(Dollars in millions) |
Range | Weighted Average | Range | Weighted Average | ||||||||||||||||||||||||||||||||||
| Min | Max | Min | Max | |||||||||||||||||||||||||||||||||||
| Prepayment speed |
|
% |
|
% |
|
% |
|
% |
|
% |
|
% | ||||||||||||||||||||||||||
| Effect on fair value of a 10% increase | $ |
(
|
$ |
(
|
||||||||||||||||||||||||||||||||||
| Effect on fair value of a 20% increase |
(
|
(
|
||||||||||||||||||||||||||||||||||||
| OAS |
|
% |
|
% |
|
% |
|
% |
|
% |
|
% | ||||||||||||||||||||||||||
| Effect on fair value of a 10% increase | $ |
(
|
$ |
(
|
||||||||||||||||||||||||||||||||||
| Effect on fair value of a 20% increase |
(
|
(
|
||||||||||||||||||||||||||||||||||||
| Composition of loans serviced for others: | ||||||||||||||||||||||||||||||||||||||
| Fixed-rate residential mortgage loans |
|
% |
|
% | ||||||||||||||||||||||||||||||||||
|
Adjustable-rate residential mortgage loans
|
|
|
||||||||||||||||||||||||||||||||||||
| Total |
|
% |
|
% | ||||||||||||||||||||||||||||||||||
| Weighted average life |
|
|
||||||||||||||||||||||||||||||||||||
The sensitivity calculations above are hypothetical and should not be considered to be predictive of future performance. As indicated, changes in fair value based on adverse changes in assumptions generally cannot be extrapolated because the relationship of the change in assumption to the change in fair value may not be linear. Also, in the above table, the effect of an adverse variation in one assumption on the fair value of the MSRs is calculated without changing any other assumption; while in reality, changes in one factor may result in changes in another, which may magnify or counteract the effect of the change. See "Note 18. Fair Value Disclosures" for additional information on the valuation techniques used.
Commercial Mortgage Activities
The following table summarizes commercial mortgage servicing activities for the periods presented:
|
December 31,
(Dollars in millions) |
2019 | 2018 | |||||||||
| UPB of CRE mortgages serviced for others | $ |
|
$ |
|
|||||||
| CRE mortgages serviced for others covered by recourse provisions |
|
|
|||||||||
| Maximum recourse exposure from CRE mortgages sold with recourse liability |
|
|
|||||||||
| Recorded reserves related to recourse exposure |
|
|
|||||||||
| CRE mortgages originated during the year-to-date period |
|
|
|||||||||
| Commercial MSRs at fair value |
|
|
|||||||||
Truist Financial Corporation 113
NOTE 9.
Other Assets and Liabilities
Lessee Operating and Finance Leases
The Company leases certain assets, consisting primarily of real estate, and assesses at contract inception whether a contract is, or contains, a lease. At December 31, 2019, the Company had an immaterial amount of operating leases that had not yet commenced. Operating lease costs were $
209
million for the year ended December 31, 2019.
The following table presents additional information on operating leases, and excludes assets related to the lease financing business:
|
December 31, 2019
(Dollars in millions) |
Operating Leases | Finance Leases | |||||||||
| ROU assets | $ |
|
$ |
|
|||||||
| Maturities of lease liabilities: | |||||||||||
| 2020 | $ |
|
$ |
|
|||||||
| 2021 |
|
|
|||||||||
| 2022 |
|
|
|||||||||
| 2023 |
|
|
|||||||||
| 2024 |
|
|
|||||||||
| Thereafter |
|
|
|||||||||
| Total lease payments |
|
|
|||||||||
| Less: imputed interest |
|
|
|||||||||
| Total lease liabilities | $ |
|
$ |
|
|||||||
| Weighted average remaining term |
|
|
|||||||||
| Weighted average discount rate |
|
% |
|
% | |||||||
Lessor Operating Leases
The Company’s two primary lessor businesses are equipment financing and structured real estate with income recorded in Operating lease income on the Consolidated Statements of Income.
The following table presents a summary of assets under operating leases and activity related to assets under operating leases. This table excludes subleases on assets included in premises and equipment.
| (Dollars in millions) | Dec 31, 2019 | |||||||
| Assets held under operating leases (1) | $ |
|
||||||
| Accumulated depreciation |
(
|
|||||||
| Net | $ |
|
||||||
(1) Includes certain land parcels subject to operating leases that have indefinite lives.
The residual value of assets no longer under operating leases was immaterial.
Bank-Owned Life Insurance
Bank-owned life insurance consists of life insurance policies held on certain employees for which the Company is the beneficiary. These policies provide the Company an efficient form of funding for retirement and other employee benefits costs. The carrying value of bank-owned life insurance was $
6.4
billion and $
4.7
billion at December 31, 2019 and 2018.
114 Truist Financial Corporation
NOTE 10.
Deposits
The composition of deposits is presented in the following table:
|
December 31,
(Dollars in millions) |
2019 | 2018 | ||||||||||||
| Noninterest-bearing deposits | $ |
|
$ |
|
||||||||||
| Interest-bearing deposits: | ||||||||||||||
| Interest checking |
|
|
||||||||||||
| Money market and savings |
|
|
||||||||||||
| Time deposits |
|
|
||||||||||||
| Total deposits | $ |
|
$ |
|
||||||||||
| Time deposits greater than $250,000 | $ |
|
$ |
|
||||||||||
The following table presents future time deposits maturities:
| Year Ended December 31, | Thereafter | |||||||||||||||||||||||||||||||||||||
| (Dollars in millions) | 2020 | 2021 | 2022 | 2023 | 2024 | |||||||||||||||||||||||||||||||||
| Future time deposit maturities | $ |
|
$ |
|
$ |
|
$ |
|
$ |
|
$ |
|
||||||||||||||||||||||||||
NOTE 11.
Borrowings
The following table presents a summary of short-term borrowings:
|
December 31,
(Dollars in millions) |
2019 | 2018 | ||||||||||||||||||||||||
| Carrying Amount | Interest Rate | Carrying Amount | Interest Rate | |||||||||||||||||||||||
| Federal funds purchased | $ |
|
|
% | $ |
|
|
% | ||||||||||||||||||
| Securities sold under agreements to repurchase |
|
|
|
|
||||||||||||||||||||||
| FHLB advances |
|
|
|
|
||||||||||||||||||||||
| Dealer collateral |
|
|
|
|
||||||||||||||||||||||
| Master notes |
|
|
|
|
||||||||||||||||||||||
| Other short-term borrowings |
|
|
|
|
||||||||||||||||||||||
| Total short-term borrowings | $ |
|
|
$ |
|
|
||||||||||||||||||||
The following table presents a summary of long-term debt:
| 2019 | 2018 | |||||||||||||||||||||||||||||||||||||||||||
|
December 31,
(Dollars in millions) |
Stated Rate | Effective Rate | Carrying Amount | Carrying Amount | ||||||||||||||||||||||||||||||||||||||||
| Maturity | Min | Max | ||||||||||||||||||||||||||||||||||||||||||
| Truist Financial Corporation: | ||||||||||||||||||||||||||||||||||||||||||||
| Fixed rate senior notes | 2020 | to | 2028 |
|
% |
|
% |
|
% | $ |
|
$ |
|
|||||||||||||||||||||||||||||||
| Floating rate senior notes | 2020 | 2022 |
|
|
|
|
|
|||||||||||||||||||||||||||||||||||||
| Fixed rate subordinated notes | 2022 | 2029 |
|
|
|
|
|
|||||||||||||||||||||||||||||||||||||
| Capital Notes | 2027 | 2028 |
|
|
|
|
|
|||||||||||||||||||||||||||||||||||||
| Structured Notes (1) | 2021 | 2026 |
|
|
||||||||||||||||||||||||||||||||||||||||
| Truist Bank: | ||||||||||||||||||||||||||||||||||||||||||||
| Fixed rate senior notes | 2020 | 2037 |
|
|
|
|
|
|||||||||||||||||||||||||||||||||||||
| Floating rate senior notes | 2020 | 2022 |
|
|
|
|
|
|||||||||||||||||||||||||||||||||||||
| Fixed rate subordinated notes | 2020 | 2029 |
|
|
|
|
|
|||||||||||||||||||||||||||||||||||||
|
FHLB advances (2)
|
2020 | 2034 |
|
|
|
|
|
|||||||||||||||||||||||||||||||||||||
| Other long-term debt (3) |
|
|
||||||||||||||||||||||||||||||||||||||||||
| Nonbank subsidiaries: | ||||||||||||||||||||||||||||||||||||||||||||
| Other long-term debt (4) |
|
|
||||||||||||||||||||||||||||||||||||||||||
| Total long-term debt | $ |
|
$ |
|
||||||||||||||||||||||||||||||||||||||||
(1) Consist of notes with various terms that include fixed or floating rate interest, or returns that are linked to an equity index.
(2) FHLB advances had a weighted average maturity of
1.8
years at December 31, 2019.
(3) Includes finance leases, tax credit investments, and other.
Truist Financial Corporation 115
The following table presents future debt maturities:
| Year Ended December 31, | Thereafter | |||||||||||||||||||||||||||||||||||||
| (Dollars in millions) | 2020 | 2021 | 2022 | 2023 | 2024 | |||||||||||||||||||||||||||||||||
| Future debt maturities (1) | $ |
|
$ |
|
$ |
|
$ |
|
$ |
|
$ |
|
||||||||||||||||||||||||||
(1) Amounts exclude imputed interest of $
23
million related to finance leases.
NOTE 12.
Shareholders' Equity
Preferred Stock
On July 29, 2019, the Company issued $
1.7
billion of series N non-cumulative perpetual preferred stock with a stated dividend rate of
4.800
% per annum for net proceeds of $
1.7
billion. The Company issued depositary shares, each of which represents a fractional ownership interest in a share of the
68,000
shares of the Company's series N preferred stock. The preferred stock has no stated maturity and redemption is solely at the option of the Company in whole, but not in part, upon the occurrence of a regulatory capital treatment event, as defined. In addition, the preferred stock may be redeemed in whole or in part, on any dividend payment date after September 1, 2024. Refer to the table below for additional details regarding the preferred shares and dividends.
During the third quarter of 2019, the Company redeemed all outstanding
23,000
shares of series D and
46,000
shares of series E non-cumulative perpetual preferred stock and the corresponding depositary shares representing fractional interests in each series for $
1.7
billion. Regular dividends on the redeemed shares were paid during the third quarter of 2019. In connection with the redemptions, net income available to common shareholders was reduced by $
46
million to recognize the difference in the redemption price and the carrying value.
Upon closing of the Merger, each outstanding share of SunTrust perpetual preferred stock was converted into the right to receive one share of an applicable newly issued series of Truist preferred stock having substantially the same terms as such share of SunTrust preferred stock. The Company issued series I, J, K, L and M non-cumulative perpetual preferred stock with a total par and fair value of $
2.0
billion on the Merger closing date. Refer to the table below for additional details regarding the preferred shares and dividends and "Note 2. Business Combinations" for additional information related to the Merger.
On February 10, 2020, the Company announced its intention to redeem all outstanding
5,000
shares of its perpetual preferred stock series K and the corresponding depositary shares representing fractional interests in each series for $
500
million plus any unpaid dividends on March 16, 2020. The preferred stock redemption is in accordance with the terms of the Company’s Articles of Amendment to its Restated Articles of Incorporation, effective as of December 6, 2019.
116 Truist Financial Corporation
The following table presents a summary of the non-cumulative perpetual preferred stock as of December 31, 2019:
|
Preferred Stock Issue
(Dollars in millions) |
Issuance Date | Earliest Redemption Date | Liquidation Amount | Carrying Amount | Dividend Rate | Dividend Payments | ||||||||||||||||||||||||||||||||||||||
| Series F | 10/31/2012 | 11/1/2017 | $ |
|
$ |
|
|
% | Quarterly | |||||||||||||||||||||||||||||||||||
| Series G | 5/1/2013 | 6/1/2018 |
|
|
|
Quarterly | ||||||||||||||||||||||||||||||||||||||
| Series H | 3/9/2016 | 6/1/2021 |
|
|
|
Quarterly | ||||||||||||||||||||||||||||||||||||||
| Series I | 12/6/2019 | (1) | 12/15/2024 |
|
|
|
(2) | Quarterly | ||||||||||||||||||||||||||||||||||||
| Series J | 12/6/2019 | (1) | 12/15/2024 |
|
|
|
(3) | Quarterly | ||||||||||||||||||||||||||||||||||||
| Series K | 12/6/2019 | (1) | 12/15/2019 |
|
|
|
(4) | Quarterly | ||||||||||||||||||||||||||||||||||||
| Series L | 12/6/2019 | (1) | 12/15/2024 |
|
|
|
(5) | Semi-annually | (8) | |||||||||||||||||||||||||||||||||||
| Series M | 12/6/2019 | (1) | 12/15/2027 |
|
|
|
(6) | Semi-annually | (8) | |||||||||||||||||||||||||||||||||||
| Series N | 7/29/2019 | 9/1/2024 |
|
|
|
(7) | Semi-annually | |||||||||||||||||||||||||||||||||||||
| Total | $ |
|
$ |
|
||||||||||||||||||||||||||||||||||||||||
(1) Converted security from previously issued SunTrust preferred stock.
(2) Dividend rate is the greater of 4.00% or 3-month LIBOR plus 0.530%.
(3) Dividend rate is the greater of 4.00% or 3-month LIBOR plus 0.645%.
(4) Dividend rate reset on December 15, 2019, and dividend rate is 3-month LIBOR plus 3.860%.
(5) Fixed dividend rate will reset on June 15, 2022, then dividend rate will be 3-month LIBOR plus 3.102%.
(6) Fixed dividend rate will reset on December 15, 2027, then dividend rate will be 3-month LIBOR plus 2.786%.
(7) Fixed dividend will reset on September 1, 2024, and on each following fifth anniversary of the reset date to the five-year U.S. Treasury rate plus 3.003%.
(8) Dividend payments become quarterly after dividend rate reset.
Dividends on the preferred stock are non-cumulative and payable when declared by the Company's Board or a duly authorized committee of the Board. The Company issued depositary shares, each of which represents a fractional ownership interest in a share of the Company's preferred stock. The preferred stock has no stated maturity and redemption is solely at the option of the Company in whole, but not in part, upon the occurrence of a regulatory capital treatment event, as defined. Under current rules, any redemption of the preferred stock is subject to prior approval of the FRB. The preferred stock is not subject to any sinking fund or other obligations of the Company.
Dividends
The following table presents the dividends declared related to common stock.
| Year Ended December 31, | 2019 | 2018 | 2017 | |||||||||||||||||
| Cash dividends declared per share | $ |
|
$ |
|
$ |
|
||||||||||||||
Share Repurchase Plan Activity
Truist Financial Corporation 117
NOTE 13.
AOCI
AOCI includes the after-tax change in unrecognized net costs related to defined benefit pension and OPEB plans as well as unrealized gains and losses on cash flow hedges and AFS securities.
|
(Dollars in millions) |
Pension and OPEB Costs | Cash Flow Hedges | AFS Securities | Other, net | Total | ||||||||||||||||||||||||
| AOCI balance, January 1, 2017 | $ |
(
|
$ |
(
|
$ |
(
|
$ |
(
|
$ |
(
|
|||||||||||||||||||
| OCI before reclassifications, net of tax |
(
|
|
(
|
|
(
|
||||||||||||||||||||||||
| Amounts reclassified from AOCI: | |||||||||||||||||||||||||||||
| Before tax |
|
|
(
|
|
|
||||||||||||||||||||||||
| Tax effect |
|
|
(
|
|
|
||||||||||||||||||||||||
|
Amounts reclassified, net of tax
|
|
|
(
|
|
|
||||||||||||||||||||||||
| Total OCI, net of tax |
(
|
|
(
|
|
(
|
||||||||||||||||||||||||
| Reclassification of certain tax effects |
(
|
(
|
(
|
(
|
(
|
||||||||||||||||||||||||
| AOCI balance, December 31, 2017 |
(
|
(
|
(
|
(
|
(
|
||||||||||||||||||||||||
| OCI before reclassifications, net of tax |
(
|
|
(
|
(
|
(
|
||||||||||||||||||||||||
| Amounts reclassified from AOCI: | |||||||||||||||||||||||||||||
| Before tax |
|
|
|
|
|
||||||||||||||||||||||||
| Tax effect |
|
|
|
|
|
||||||||||||||||||||||||
| Amounts reclassified, net of tax |
|
|
|
|
|
||||||||||||||||||||||||
| Total OCI, net of tax |
(
|
|
(
|
(
|
(
|
||||||||||||||||||||||||
| AOCI balance, December 31, 2018 |
(
|
(
|
(
|
(
|
(
|
||||||||||||||||||||||||
| OCI before reclassifications, net of tax |
(
|
(
|
|
|
|
||||||||||||||||||||||||
| Amounts reclassified from AOCI: | |||||||||||||||||||||||||||||
| Before tax |
|
|
|
|
|
||||||||||||||||||||||||
| Tax effect |
|
|
|
|
|
||||||||||||||||||||||||
| Amounts reclassified, net of tax |
|
|
|
|
|
||||||||||||||||||||||||
| Total OCI, net of tax |
|
(
|
|
|
|
||||||||||||||||||||||||
| AOCI balance, December 31, 2019 | $ |
(
|
$ |
(
|
$ |
|
$ |
(
|
$ |
(
|
|||||||||||||||||||
|
Primary income statement location of amounts reclassified from AOCI
|
Other expense | Net interest income | Net interest income | Net interest income | |||||||||||||||||||||||||
118 Truist Financial Corporation
NOTE 14.
Income Taxes
The components of the income tax provision are as follows:
|
Year Ended December 31,
(Dollars in millions)
|
2019 | 2018 | 2017 | |||||||||||||||||
| Current expense: | ||||||||||||||||||||
| Federal | $ |
|
$ |
|
$ |
|
||||||||||||||
| State |
|
|
|
|||||||||||||||||
| Total current expense |
|
|
|
|||||||||||||||||
| Deferred expense: | ||||||||||||||||||||
| Federal |
|
|
|
|||||||||||||||||
| State |
|
(
|
|
|||||||||||||||||
| Total deferred expense |
|
|
|
|||||||||||||||||
| Provision for income taxes | $ |
|
$ |
|
$ |
|
||||||||||||||
A reconciliation of the provision for income taxes at the statutory federal income tax rate to the Company’s actual provision for income taxes and actual effective tax rate is presented in the following table:
| 2019 | 2018 | 2017 | |||||||||||||||||||||||||||||||||
|
Year Ended December 31,
(Dollars in millions) |
Amount | % of Income Before Taxes | Amount | % of Income Before Taxes | Amount | % of Income Before Taxes | |||||||||||||||||||||||||||||
| Federal income taxes at statutory rate | $ |
|
|
% | $ |
|
|
% | $ |
|
|
% | |||||||||||||||||||||||
| Increase (decrease) in provision for income taxes as a result of: | |||||||||||||||||||||||||||||||||||
| State income taxes, net of federal tax benefit |
|
|
|
|
|
|
|||||||||||||||||||||||||||||
| Income tax credits, net of amortization |
(
|
(
|
(
|
(
|
(
|
(
|
|||||||||||||||||||||||||||||
| Tax-exempt interest |
(
|
(
|
(
|
(
|
(
|
(
|
|||||||||||||||||||||||||||||
| Federal tax reform impact |
|
|
(
|
(
|
(
|
(
|
|||||||||||||||||||||||||||||
| Other, net |
(
|
(
|
|
|
(
|
(
|
|||||||||||||||||||||||||||||
| Provision for income taxes | $ |
|
|
$ |
|
|
$ |
|
|
||||||||||||||||||||||||||
Truist Financial Corporation 119
Deferred income tax assets and liabilities result from differences between the timing of the recognition of assets and liabilities for financial reporting purposes and for income tax purposes. These assets and liabilities are measured using the enacted federal and state tax rates expected to apply in the periods in which the DTAs or DTLs are expected to be realized. The net deferred income tax liability is recorded in Other liabilities in the Consolidated Balance Sheets. The significant DTAs and DTLs, net of the federal impact for state taxes, are presented in the following table. Prior period amounts have been reclassified to conform to the current presentation.
|
December 31,
(Dollars in millions)
|
2019 | 2018 | ||||||||||||
| DTAs: | ||||||||||||||
| Loans | $ |
|
$ |
|
||||||||||
| Employee compensation and benefits |
|
|
||||||||||||
| ALLL |
|
|
||||||||||||
| Accruals and reserves |
|
|
||||||||||||
| Net unrealized losses in AOCI |
|
|
||||||||||||
| Operating lease liability |
|
|
||||||||||||
| Federal and state NOLs and other carryforwards |
|
|
||||||||||||
| Partnerships |
|
|
||||||||||||
| Other |
|
|
||||||||||||
| Total gross DTAs |
|
|
||||||||||||
| Valuation allowance |
(
|
|
||||||||||||
| Total DTAs net of valuation allowance |
|
|
||||||||||||
| DTLs: | ||||||||||||||
| Pension |
|
|
||||||||||||
| Equipment and auto leasing |
|
|
||||||||||||
| Goodwill and other intangible assets |
|
|
||||||||||||
| MSRs |
|
|
||||||||||||
| Loans |
|
|
||||||||||||
| ROU assets |
|
|
||||||||||||
| Premises and equipment |
|
|
||||||||||||
| Partnerships |
|
|
||||||||||||
| Other |
|
|
||||||||||||
| Total DTLs |
|
|
||||||||||||
| Net DTL | $ |
(
|
$ |
(
|
||||||||||
The DTAs include Federal and state NOLs and other state carryforwards that will expire, if not utilized, in varying amounts from 2020 to 2039. At December 31, 2019, the Company had a valuation allowance recorded against its state carryforwards and certain state DTAs of $
130
million. The increase in the valuation allowance is primarily due to the heritage SunTrust valuation allowance for certain state carryforwards.
The following table provides a rollforward of the Company's gross federal and state UTBs, excluding interest and penalties:
|
December 31,
(Dollars in millions) |
2019 | 2018 | ||||||||||||
| Balance, January 1 | $ |
|
$ |
|
||||||||||
| Increases in UTBs related to prior years |
|
|
||||||||||||
| Increases in UTBs related to the current year |
|
|
||||||||||||
| Decreases in UTBs related to settlements |
(
|
|
||||||||||||
| Balance, December 31 | $ |
|
$ |
|
||||||||||
The increase in UTBs related to prior years is primarily due to the Merger. The amount of UTBs that would favorably affect the Company's effective tax rate, if recognized, was $
99
million at December 31, 2019.
Interest and penalties related to UTBs are recorded in the Provision for income taxes in the Consolidated Statement of Income. The Company had a gross liability of $
11
million for interest and penalties related to its unrecognized tax benefits at December 31, 2019. The increase in the liability was primarily due to the Merger. During the year ended December 31, 2019, the Company recognized a gross expense of $
1
million related to interest and penalties on the UTBs.
120 Truist Financial Corporation
NOTE 15.
Benefit Plans
Defined Benefit Retirement Plans
Truist provides defined benefit retirement plans qualified under the IRC that cover most employees. Benefits are based on years of service, age at retirement and the employee's compensation during the five highest consecutive years of earnings within the last ten years of employment. The Company's retirement plans obtained through the Merger remained separate as of December 31, 2019.
In addition, supplemental retirement benefits are provided to certain key officers under supplemental defined benefit executive retirement plans, which are not qualified under the IRC. Although technically unfunded plans, Rabbi Trusts and insurance policies on the lives of certain of the covered employees are available to finance future benefits.
Active Retirement Plan
s
Financial data relative to qualified and nonqualified defined benefit pension plans is summarized in the following tables for the years indicated. On the Consolidated Balance Sheets, the qualified pension plan net asset is recorded as a component of Other assets and the nonqualified pension plans net liability is recorded as a component of Other liabilities. The data is calculated using an actuarial measurement date of December 31.
|
Year Ended December 31,
(Dollars in millions)
|
Location | 2019 | 2018 | 2017 | |||||||||||||||||||
| Net periodic pension cost: | |||||||||||||||||||||||
| Service cost | Personnel expense | $ |
|
$ |
|
$ |
|
||||||||||||||||
| Interest cost | Other expense |
|
|
|
|||||||||||||||||||
| Estimated return on plan assets | Other expense |
(
|
(
|
(
|
|||||||||||||||||||
| Net amortization and other | Other expense |
|
|
|
|||||||||||||||||||
| Net periodic benefit cost |
|
|
|
||||||||||||||||||||
| Pre-tax amounts recognized in OCI: | |||||||||||||||||||||||
| Prior service credit (cost) |
|
|
|
||||||||||||||||||||
| Net actuarial loss (gain) |
|
|
|
||||||||||||||||||||
| Net amortization |
(
|
(
|
(
|
||||||||||||||||||||
| Net amount recognized in OCI |
(
|
|
|
||||||||||||||||||||
|
Total net periodic pension costs (income) recognized in total comprehensive income, pre-tax
|
$ |
|
$ |
|
$ |
|
|||||||||||||||||
| Weighted average assumptions used to determine net periodic pension cost: | |||||||||||||||||||||||
| Discount rate |
|
% |
|
% |
|
% | |||||||||||||||||
| Expected long-term rate of return on plan assets |
|
|
|
||||||||||||||||||||
| Assumed long-term rate of annual compensation increases |
|
|
|
||||||||||||||||||||
The weighted average expected long-term rate of return on plan assets represents the average rate of return expected to be earned on plan assets over the period the benefits included in the benefit obligation are to be paid. In developing the expected rate of return, Truist considers long-term compound annualized returns of historical market data for each asset category, as well as historical actual returns on the plan assets. Using this reference information, the Company develops forward-looking return expectations for each asset category and a weighted average expected long-term rate of return for the plan based on target asset allocations contained in the Company's Investment Policy Statement. For 2020, the expected rate of return on plan assets is
6.9
%.
Truist Financial Corporation 121
Activity in the projected benefit obligation is presented in the following table:
|
Year Ended December 31,
(Dollars in millions)
|
Qualified Plan | Nonqualified Plans | |||||||||||||||||||||
| 2019 | 2018 | 2019 | 2018 | ||||||||||||||||||||
| Projected benefit obligation, January 1 | $ |
|
$ |
|
$ |
|
$ |
|
|||||||||||||||
| Service cost |
|
|
|
|
|||||||||||||||||||
| Interest cost |
|
|
|
|
|||||||||||||||||||
| Actuarial (gain) loss |
|
(
|
|
(
|
|||||||||||||||||||
| Benefits paid |
(
|
(
|
(
|
(
|
|||||||||||||||||||
| Acquisitions |
|
|
|
|
|||||||||||||||||||
| Projected benefit obligation, December 31 | $ |
|
$ |
|
$ |
|
$ |
|
|||||||||||||||
| Accumulated benefit obligation, December 31 | $ |
|
$ |
|
$ |
|
$ |
|
|||||||||||||||
|
Weighted average assumptions used to determine projected benefit obligations:
|
|||||||||||||||||||||||
| Weighted average assumed discount rate |
|
% |
|
% |
|
% |
|
% | |||||||||||||||
| Assumed rate of annual compensation increases |
|
|
|
|
|||||||||||||||||||
Effective December 31, 2017, the qualified defined benefit plan was amended and a portion of the accrued benefits of participants in the nonqualified plan were shifted to the qualified plan. Affected teammates continue to participate in the nonqualified plan for benefits earned in 2017 and later. In conjunction with this shift, a minimum benefit was established under the qualified plan which was discontinued at December 31, 2019.
Activity in plan assets is presented in the following table:
|
Year Ended December 31,
(Dollars in millions)
|
Qualified Plan | Nonqualified Plans | ||||||||||||||||||||||||
| 2019 | 2018 | 2019 | 2018 | |||||||||||||||||||||||
| Fair value of plan assets, January 1 | $ |
|
$ |
|
$ |
|
$ |
|
||||||||||||||||||
| Actual return on plan assets |
|
(
|
|
|
||||||||||||||||||||||
| Employer contributions |
|
|
|
|
||||||||||||||||||||||
| Benefits paid |
(
|
(
|
(
|
(
|
||||||||||||||||||||||
| Fair value of plan assets, December 31 | $ |
|
$ |
|
$ |
|
$ |
|
||||||||||||||||||
| Funded status, December 31 | $ |
|
$ |
|
$ |
(
|
$ |
(
|
||||||||||||||||||
The following are the pre-tax amounts recognized in AOCI:
|
Year Ended December 31,
(Dollars in millions)
|
Qualified Plan | Nonqualified Plans | ||||||||||||||||||||||||
| 2019 | 2018 | 2019 | 2018 | |||||||||||||||||||||||
| Prior service credit (cost) | $ |
(
|
$ |
(
|
$ |
|
$ |
|
||||||||||||||||||
| Net actuarial loss |
(
|
(
|
(
|
(
|
||||||||||||||||||||||
| Net amount recognized | $ |
(
|
$ |
(
|
$ |
(
|
$ |
(
|
||||||||||||||||||
The following table presents the amount expected to be amortized from AOCI into net periodic pension cost during 2020:
| (Dollars in millions) | Qualified Plan | Nonqualified Plans | ||||||||||||
| Net actuarial loss | $ |
(
|
$ |
(
|
||||||||||
| Prior service credit (cost) |
(
|
|
||||||||||||
| Net amount expected to be amortized | $ |
(
|
$ |
(
|
||||||||||
Truist makes contributions to the qualified pension plan in amounts between the minimum required for funding and the maximum amount deductible for federal income tax purposes. Truist made discretionary contributions of $
305
million during the first quarter of 2020. Management may make additional contributions in 2020. For the nonqualified plans, the employer contributions are based on benefit payments.
122 Truist Financial Corporation
The following table reflects the estimated benefit payments for the periods presented:
| (Dollars in millions) | Qualified Plan | Nonqualified Plans | ||||||||||||
| 2020 | $ |
|
$ |
|
||||||||||
| 2021 |
|
|
||||||||||||
| 2022 |
|
|
||||||||||||
| 2023 |
|
|
||||||||||||
| 2024 |
|
|
||||||||||||
| 2025-2029 |
|
|
||||||||||||
The Company's primary total return objective is to achieve returns that, over the long term, will fund retirement liabilities and provide for the desired plan benefits in a manner that satisfies the fiduciary requirements of the Employee Retirement Income Security Act of 1974. The plan assets have a long-term time horizon that runs concurrent with the average life expectancy of the participants. As such, the Plan can assume a time horizon that extends well beyond a full market cycle, and can assume an above-average level of risk, as measured by the standard deviation of annual return. The investments are broadly diversified among economic sector, industry, quality and size in order to reduce risk and to produce incremental return. Within approved guidelines and restrictions, investment managers have wide discretion over the timing and selection of individual investments.
Truist periodically reviews its asset allocation and investment policy and makes changes to its target asset allocation. Truist has established guidelines within each asset category to ensure the appropriate balance of risk and reward.
The fair values of pension plan assets by asset category for the qualified plan are reflected in the table below. Amounts carried using net asset values and accrued income are excluded from the table.
|
December 31,
(Dollars in millions)
|
Target Allocation | 2019 | 2018 | ||||||||||||||||||||||||||||||||||||||||||||
| Min | Max | Total | Level 1 | Level 2 | Total | Level 1 | Level 2 | ||||||||||||||||||||||||||||||||||||||||
| Cash and cash-equivalents | $ |
|
$ |
|
$ |
|
$ |
|
$ |
|
$ |
|
|||||||||||||||||||||||||||||||||||
| U.S. equity securities (1) |
|
% |
|
% |
|
|
|
|
|
|
|||||||||||||||||||||||||||||||||||||
| International equity securities |
|
|
|
|
|
|
|
|
|||||||||||||||||||||||||||||||||||||||
| Fixed income securities |
|
|
|
|
|
|
|
|
|||||||||||||||||||||||||||||||||||||||
| Total | $ |
|
$ |
|
$ |
|
$ |
|
$ |
|
$ |
|
|||||||||||||||||||||||||||||||||||
(1) The plan may hold up to 10% of its assets in Truist common stock.
International equity securities include a common/commingled fund that consists of assets from several accounts, pooled together, to reduce management and administration costs. Investments measured at fair value using the net asset value per share or equivalent as a practical expedient are not required to be classified in the fair value hierarchy. The plan held alternative investments valued using net asset values totaling $
341
million and $
274
million at December 31, 2019 and 2018, respectively.
Inactive Retirement Plan
s
The Company maintains a frozen and funded noncontributory qualified retirement plan, obtained from SunTrust in the Merger. The SunTrust retirement plan covers employees meeting certain service requirements. Benefits are based on salary and years of service. The plan includes a cash balance formula where personal pension accounts continue to be credited with interest each year.
The Company also maintains, as a result of the Merger, various frozen, unfunded, noncontributory nonqualified supplemental defined benefit pension plans that cover key officers and provide benefits based on salary and years of service.
Certain health care and life insurance benefits are provided to retired employees. At the option of the Company, retirees may continue certain health and life insurance benefits if they meet specific age and service requirements at the time of retirement. The health care plans are contributory with participant contributions adjusted annually, and the life insurance plans are noncontributory. Certain retiree health benefits are funded in a Retiree Health Trust. Additionally, certain retiree life insurance benefits are funded in a VEBA.
Truist Financial Corporation 123
Financial data relative to qualified and nonqualified defined benefit pension plans is summarized in the following tables.
|
Year Ended December 31,
(Dollars in millions) |
Location | 2019 | |||||||||
| Net periodic pension cost: | |||||||||||
| Interest cost | Other expense | $ |
|
||||||||
| Estimated return on plan assets | Other expense |
(
|
|||||||||
| Net periodic benefit cost (income) |
(
|
||||||||||
| Pre-tax amounts recognized in OCI: | |||||||||||
| Net actuarial loss (gain) |
(
|
||||||||||
| Net amount recognized in OCI |
(
|
||||||||||
| Total net periodic pension cost (income) recognized in total comprehensive income, pre-tax | $ |
(
|
|||||||||
| Weighted average assumptions used to determine net periodic pension cost: | |||||||||||
| Discount rate |
|
% | |||||||||
| Expected long-term rate of return on plan assets |
|
||||||||||
For 2020, the expected rate of return on plan assets is
6.9
%.
Activity in the projected benefit obligation is presented in the following table:
|
Year Ended December 31,
(Dollars in millions) |
Qualified Plan | Nonqualified Plans | |||||||||
| 2019 | 2019 | ||||||||||
| Projected benefit obligation, December 6 | $ |
|
$ |
|
|||||||
| Interest cost |
|
|
|||||||||
| Actuarial loss (gain) |
(
|
|
|||||||||
| Benefits paid |
(
|
|
|||||||||
| Special termination benefits |
|
|
|||||||||
| Projected benefit obligation, December 31 | $ |
|
$ |
|
|||||||
| Accumulated benefit obligation, December 31 | $ |
|
$ |
|
|||||||
| Weighted average assumptions used to determine projected benefit obligations: | |||||||||||
| Weighted average assumed discount rate |
|
% |
|
% | |||||||
Activity in plan assets is presented in the following table:
|
Year Ended December 31,
(Dollars in millions) |
Qualified Plan | Nonqualified Plans | ||||||||||||
| 2019 | 2019 | |||||||||||||
| Fair value of plan assets, December 6 | $ |
|
$ |
|
||||||||||
| Actual return on plan assets |
|
|
||||||||||||
| Employer contributions |
|
|
||||||||||||
| Benefits paid |
(
|
|
||||||||||||
| Fair value of plan assets, December 31 | $ |
|
$ |
|
||||||||||
| Funded status, December 31 | $ |
|
$ |
(
|
||||||||||
The following are the pre-tax amounts recognized in AOCI:
|
Year Ended December 31,
(Dollars in millions) |
Qualified Plan | Nonqualified Plans | ||||||||||||
| 2019 | 2019 | |||||||||||||
| Net actuarial (loss) gain | $ |
|
$ |
|
||||||||||
| Net amount recognized | $ |
|
$ |
|
||||||||||
124 Truist Financial Corporation
The following table reflects the estimated benefit payments for the periods presented:
| (Dollars in millions) | Qualified Plan | Nonqualified Plans | ||||||||||||
| 2020 | $ |
|
$ |
|
||||||||||
| 2021 |
|
|
||||||||||||
| 2022 |
|
|
||||||||||||
| 2023 |
|
|
||||||||||||
| 2024 |
|
|
||||||||||||
| 2025-2029 |
|
|
||||||||||||
The fair values of pension plan assets by asset category for the qualified plan are reflected in the table below.
|
December 31,
(Dollars in millions) |
Target Allocation | 2019 | |||||||||||||||||||||||||||
| Min | Max | Total | Level 1 | Level 2 | |||||||||||||||||||||||||
| Cash and cash-equivalents |
|
% |
|
% | $ |
|
$ |
|
$ |
|
|||||||||||||||||||
| U.S. equity securities |
|
|
|
|
|
||||||||||||||||||||||||
| International equity securities |
|
|
|
|
|
||||||||||||||||||||||||
| Fixed income securities |
|
|
|
|
|
||||||||||||||||||||||||
| Total | $ |
|
$ |
|
$ |
|
|||||||||||||||||||||||
Defined Contribution Plans
Truist offers a 401(k) Savings Plan and other defined contribution plans that permit employees to contribute up to
50
% of their cash compensation. For full-time employees who are
21
years of age or older with one year or more of service, Truist makes matching contributions of up to
6
% of the employee's compensation. The Company's contribution expense for the 401(k) Savings Plan and nonqualified defined contribution plans totaled $
152
million, $
141
million and $
133
million for the years ended December 31, 2019, 2018 and 2017, respectively. Certain employees of subsidiaries participate in the 401(k) Savings Plan with different matching formulas.
The heritage SunTrust 401(k) plan assumed in the Merger also provided for matching contributions of up to
6
% of the employee's compensation. SunTrust also maintained a deferred compensation plan for certain executives that was assumed in the Merger.
Equity-Based Compensation Plans
At December 31, 2019, RSAs, RSUs and PSUs were outstanding from equity-based compensation plans that have been approved by shareholders and plans assumed from acquired entities. Those plans are intended to assist the Company in recruiting and retaining employees, directors and independent contractors and to associate the interests of eligible participants with those of Truist and its shareholders.
The majority of outstanding awards and awards available to be issued relate to plans that allow for accelerated vesting of awards for holders who retire and have met all retirement eligibility requirements or in connection with certain other events. Until vested, certain of these awards are subject to forfeiture under specified circumstances.
The following table provides a summary of the equity-based compensation plans:
| December 31, 2019 | ||||||||
| Shares available for future grants (in thousands) |
|
|||||||
| Vesting period, minimum |
|
|||||||
| Vesting period, maximum |
|
|||||||
The fair value of RSUs and PSUs is based on the common stock price on the grant date less the present value of expected dividends that will be foregone during the vesting period. Substantially all awards are granted in February of each year. Grants to non-executive employees primarily consist of RSUs.
Truist Financial Corporation 125
A summary of selected data related to equity-based compensation costs follows:
|
As of / For the Year Ended December 31,
(Dollars in millions)
|
2019 | 2018 | 2017 | |||||||||||||||||
| Equity-based compensation expense | $ |
|
$ |
|
$ |
|
||||||||||||||
| Income tax benefit from equity-based compensation expense |
|
|
|
|||||||||||||||||
| Intrinsic value of options exercised, and RSUs and PSUs that vested during the year |
|
|
|
|||||||||||||||||
| Grant date fair value of equity-based awards that vested during the year |
|
|
|
|||||||||||||||||
| Unrecognized compensation cost related to equity-based awards |
|
|
|
|||||||||||||||||
| Weighted-average life over which compensation cost is expected to be recognized |
|
|
|
|||||||||||||||||
The following table presents the heritage BB&T activity related to awards of RSUs, PSUs and restricted shares:
| (Shares in thousands) | Units/Shares | Wtd. Avg. Grant Date Fair Value | ||||||||||||
| Nonvested at January 1, 2019 |
|
$ |
|
|||||||||||
| Granted |
|
|
||||||||||||
| Vested |
(
|
|
||||||||||||
| Forfeited |
(
|
|
||||||||||||
| Nonvested at December 31, 2019 |
|
|
||||||||||||
The following table presents the heritage SunTrust activity related to awards of RSUs and restricted shares. This table excludes an immaterial amount of stock options.
| (Shares in thousands) | Units/Shares | Wtd. Avg. Grant Date Fair Value | ||||||||||||
| Nonvested at December 6, 2019 |
|
$ |
|
|||||||||||
| Vested |
(
|
|
||||||||||||
| Nonvested at December 31, 2019 |
|
|
||||||||||||
Other Benefits
There are various other employment contracts, deferred compensation arrangements and non-compete covenants with selected members of management and certain retirees. These plans and their obligations are not material to the financial statements.
NOTE 16.
Commitments and Contingencies
Truist utilizes a variety of financial instruments to meet the financing needs of clients and to reduce exposure to fluctuations in interest rates. These financial instruments include commitments to extend credit, letters of credit and financial guarantees and derivatives. Truist also has commitments to fund certain affordable housing investments and contingent liabilities related to certain sold loans.
The Company invests in certain affordable housing projects throughout its market area as a means of supporting local communities. Truist receives tax credits related to these investments, for which the Company typically acts as a limited partner and therefore does not exert control over the operating or financial policies of the partnerships. Truist typically provides financing during the construction and development of the properties; however, permanent financing is generally obtained from independent third parties upon completion of a project. Tax credits are subject to recapture by taxing authorities based on compliance features required to be met at the project level. Truist's maximum potential exposure to losses relative to investments in VIEs is generally limited to the sum of the outstanding balance, future funding commitments and any related loans to the entity, exclusive of any potential tax recapture associated with the investments. Loans to these entities are underwritten in substantially the same manner as the Company's other loans and are generally secured.
Additionally, the Company invests in multi-family affordable housing partnership developments and other community development entities as a limited partner and/or a lender. The Company receives tax credits for its limited partner investments. The Company has determined that the majority of the related partnerships are VIEs. The Company has concluded that it is not the primary beneficiary of these investments. Truist uses the equity method of accounting for these investments.
126 Truist Financial Corporation
The Company also invests in entities that promote renewable energy sources as a limited partner. Tax credits received for these investments are recorded as a reduction to the carrying value of these investments. The Company has determined that these renewable energy tax credit partnerships are VIEs. The Company has concluded that it is not the primary beneficiary of these VIEs because it does not have the power to direct the activities that most significantly impact the VIEs' financial performance and therefore, it is not required to consolidate these VIEs. The Company’s maximum exposure to loss related to these investments is limited to its equity investments in these partnerships and any additional unfunded equity commitments.
Truist has investments in and future funding commitments related to private equity and certain other equity method investments. The majority of these investments are private equity funds that are consolidated in Truist's financial statements. The risk exposure relating to such commitments is generally limited to the amount of investments and future funding commitments made.
The following table summarizes certain tax credit, private equity, and certain other equity method investments:
|
December 31,
(Dollars in millions) |
Balance Sheet Location | 2019 | 2018 | |||||||||||
| Investments in affordable housing projects: | ||||||||||||||
| Carrying amount | Other assets | $ |
|
$ |
|
|||||||||
| Amount of future funding commitments included in carrying amount | Other liabilities |
|
|
|||||||||||
| Lending exposure |
|
|
||||||||||||
| Renewable energy investments: | ||||||||||||||
| Carrying amount | Other assets |
|
|
|||||||||||
| Amount of future funding commitments not included in carrying amount | N/A |
|
|
|||||||||||
| Private equity and certain other equity method investments: | ||||||||||||||
| Carrying amount | Other assets |
|
|
|||||||||||
| Amount of future funding commitments not included in carrying amount | N/A |
|
|
|||||||||||
The following table presents a summary of tax credits and amortization associated with the Company's tax credit investment activity:
|
Year Ended December 31,
(Dollars in millions) |
Income Statement Location | 2019 | 2018 | 2017 | ||||||||||||||||
| Tax credits: | ||||||||||||||||||||
| Investments in affordable housing projects | Provision for income taxes | $ |
|
$ |
|
$ |
|
|||||||||||||
| Other community development investments | Provision for income taxes |
|
|
|
||||||||||||||||
| Amortization and other changes in carrying amount: | ||||||||||||||||||||
| Investments in affordable housing projects | Provision for income taxes | $ |
|
$ |
|
$ |
|
|||||||||||||
| Other community development investments | Other noninterest income |
|
|
|
||||||||||||||||
| Renewable energy investments | Other noninterest income |
|
|
|
||||||||||||||||
Letters of Credit and Financial Guarantees
In the normal course of business, Truist utilizes certain financial instruments to meet the financing needs of clients and to mitigate exposure to risks. Such financial instruments include commitments to extend credit and certain contractual agreements, including standby letters of credit and financial guarantee arrangements.
Commitments to extend, originate or purchase credit are primarily lines of credit to businesses and consumers and have specified rates and maturity dates. Many of these commitments also have adverse change clauses, which allow Truist to cancel the commitment due to deterioration in the borrowers' creditworthiness. The fair values of commitments are estimated using the fees charged to enter into similar agreements, taking into account the remaining terms of the agreements and the present creditworthiness of the counterparties. The fair values of guarantees and letters of credit are estimated based on the counterparties' creditworthiness and average default rates for loan products with similar risks. Consumer lending and revolving credit commitments have an immaterial fair value as Truist typically has the ability to cancel such commitments.
Truist has sold certain mortgage-related loans that contain recourse provisions. These provisions generally require Truist to reimburse the investor for a share of any loss that is incurred after the disposal of the property. Truist also issues standard representations and warranties related to mortgage loan sales to GSEs. Refer to "Note 8. Loan Servicing" for additional disclosures related to these exposures.
Truist Financial Corporation 127
Letters of credit and financial guarantees are unconditional commitments issued by Truist to guarantee the performance of a client to a third party. These guarantees are primarily issued to support borrowing arrangements, including commercial paper issuance, bond financing and similar transactions. The credit risk involved in the issuance of these guarantees is essentially the same as that involved in extending loans to clients and, as such, the instruments are collateralized when necessary.
The following is a summary of selected notional amounts of off-balance sheet financial instruments:
|
December 31,
(Dollars in millions) |
2019 | 2018 | |||||||||
| Commitments to extend, originate or purchase credit | $ |
|
$ |
|
|||||||
| Residential mortgage loans sold with recourse |
|
|
|||||||||
| CRE mortgages serviced for others covered by recourse provisions |
|
|
|||||||||
| Letters of credit |
|
|
|||||||||
Total Return Swaps
Truist enters into derivative contracts to manage various financial risks. A derivative is a financial instrument that derives its cash flows, and therefore its value, by reference to an underlying instrument, index or referenced interest rate. Derivative contracts are carried at fair value on the Consolidated Balance Sheets with the fair value representing the net present value of expected future cash receipts or payments based on market interest rates as of the balance sheet date. Further discussion of derivative instruments is included in "Note 1. Basis of Presentation" and "Note 19. Derivative Financial Instruments."
The Company facilitates matched book TRS transactions on behalf of clients, whereby a VIE purchases reference assets identified by a client and the Company enters into a TRS with the VIE, with a mirror-image TRS facing the client. The TRS contract between the VIE and the Company hedges the Company's exposure to the TRS contract with its third party client. The Company provides senior financing to the VIE in the form of demand notes to fund the purchase of the reference assets. The TRS contracts pass through interest and other cash flows on the reference assets to the third party clients, along with exposing those clients to decreases in value on the assets and providing them with the rights to appreciation on the assets. The terms of the TRS contracts require the third parties to post initial margin collateral, as well as ongoing margin as the fair values of the underlying reference assets change.
The Company concluded that the VIEs should be consolidated because the Company has (i) the power to direct the activities that most significantly impact the economic performance of the VIE and (ii) the obligation to absorb losses, and the right to receive benefits, that could potentially be significant. At December 31, 2019, the Company’s Consolidated Balance Sheet reflected $
2.7
billion of assets and $
116
million of other liabilities of the VIEs. Assets at December 31, 2019 include $
2.6
billion in trading loans. The activities of the VIEs are restricted to buying and selling the reference assets and the risks/benefits of any such assets owned by the VIEs are passed to the third party clients via the TRS contracts.
For additional information on the Company’s TRS contracts and its involvement with these VIEs, see "Note 19. Derivative Financial Instruments.”
Other Commitments
Truist holds public funds in certain states that do not require 100% collateralization on public fund bank deposits. In these states, should the failure of another public fund depository institution result in a loss for the public entity, the resulting uncollateralized deposit shortfall would have to be absorbed on a pro-rata basis (based upon the public deposits held by each bank within the respective state) by the remaining financial institutions holding public funds in that state. Truist monitors deposits levels relative to the total public deposits held by all depository institutions within these states.
In the ordinary course of business, Truist indemnifies its officers and directors to the fullest extent permitted by law against liabilities arising from pending litigation. Truist also issues standard representations and warranties in underwriting agreements, merger and acquisition agreements, loan sales, brokerage activities and other similar arrangements. Counterparties in many of these indemnification arrangements provide similar indemnifications to Truist. Although these agreements often do not specify limitations, Truist does not believe that any payments related to these guarantees would materially change the financial position or results of operations of Truist.
As a member of the FHLB, Truist is required to maintain a minimum investment in capital stock. The board of directors of the FHLB can increase the minimum investment requirements in the event it has concluded that additional capital is required to allow it to meet its own regulatory capital requirements. Any increase in the minimum investment requirements outside of specified ranges requires the approval of the Federal Housing Finance Agency. Because the extent of any obligation to increase Truist's investment in the FHLB depends entirely upon the occurrence of a future event, potential future investments in the FLHB stock are not determinable.
128 Truist Financial Corporation
The Company entered into an agreement to purchase its new headquarters building in Charlotte, North Carolina for $
456
million. The purchase is projected to close in the first half of 2020.
Pledged Assets
Certain assets were pledged to secure municipal deposits, securities sold under agreements to repurchase, certain derivative agreements, and borrowings and borrowing capacity, subject to any applicable asset discount, at the FHLB and FRB as well as for other purposes as required or permitted by law. Assets pledged to the FHLB provide for secured borrowing access and FHLB letters of credit, which in turn can be used to secure various client deposits, including public fund relationships. The following table provides the total carrying amount of pledged assets by asset type. Excluding assets related to employee benefit plans, the majority of the agreements governing the pledged assets do not permit the other party to sell or repledge the collateral. Heritage SunTrust collateral previously pledged to the FRB of Atlanta was not pledged to the FRB of Richmond prior to year-end. Additional assets were pledged to the FRB of Richmond in the first quarter of 2020.
|
December 31,
(Dollars in millions) |
2019 | 2018 | ||||||||||||
| Pledged securities | $ |
|
$ |
|
||||||||||
| Pledged loans: | ||||||||||||||
| FRB |
|
|
||||||||||||
| FHLB |
|
|
||||||||||||
| Available borrowing capacity: | ||||||||||||||
| FRB |
|
|
||||||||||||
| FHLB |
|
|
||||||||||||
Litigation and Regulatory Matters
Truist and/or its subsidiaries are routinely parties to numerous legal proceedings, including private, civil litigations and regulatory investigations, arising from the ordinary conduct of its regular business activities. The matters range from individual actions involving a single plaintiff to class action lawsuits with multiple class members and can involve claims for substantial amounts. Investigations involve both formal and informal proceedings, by both governmental agencies and self-regulatory organizations. These legal proceedings are at varying stages of adjudication, arbitration or investigation and may consist of a variety of claims, including common law tort and contract claims and statutory antitrust, securities and consumer protection claims, and the ultimate resolution of any proceedings is uncertain and inherently difficult to predict. It is possible that the ultimate resolution of these matters, if unfavorable, may be material to the consolidated financial position, consolidated results of operations, or consolidated cash flows of Truist.
In accordance with the provisions of U.S. GAAP for contingencies, Truist establishes accruals for legal matters when potential losses associated with the actions become probable and the amount of loss can be reasonably estimated. There is no assurance that the ultimate resolution of these matters will not significantly exceed the amounts that Truist has currently accrued. On a quarterly basis, Truist evaluates its outstanding legal proceedings to assess litigation accruals and adjust such accruals upwards or downward, as appropriate, based on our best judgment after consultation with counsel and others, as warranted.
The Company estimates of reasonably possible losses, in excess of amounts accrued, range from
zero
to approximately $
210
million as of December 31, 2019. This estimated range is based upon currently available information and involves considerable judgment, given that claims often include significant legal uncertainties, damages alleged by plaintiffs are often unspecified or overstated, discovery may not have started or may not be complete, and material facts may be disputed or unsubstantiated, among other factors. In addition, the matters underlying this estimated range will change from time to time, and actual losses may vary significantly from this estimate. For the same reasons stated above, we do not believe that an estimate of reasonably possible losses can be made for certain matters and therefore such matters are not reflected in the range provided here.
The following is a description of certain legal proceedings for which Truist is involved:
Truist Financial Corporation 129
Bickerstaff v. SunTrust Bank
This class action case was filed in the Fulton County State Court on July 12, 2010, and an amended complaint was filed on August 9, 2010. Plaintiff asserts that all overdraft fees charged to his account which related to debit card and ATM transactions are actually interest charges and therefore subject to the usury laws of Georgia. Plaintiff has brought claims for violations of civil and criminal usury laws, conversion, and money had and received. On October 6, 2017, the trial court granted plaintiff's motion for class certification and defined the class as “Every Georgia citizen who had or has one or more accounts with SunTrust Bank and who, from July 12, 2006, to October 6, 2017 (i) had at least one overdraft of $500.00 or less resulting from an ATM or debit card transaction (the “Transaction”); (ii) paid any Overdraft Fees as a result of the Transaction; and (iii) did not receive a refund of those Fees.” The Company believes that the claims are without merit and is preparing for discovery to begin in the case.
NOTE 17.
Regulatory Requirements and Other Restrictions
Truist Bank is required by the FRB to maintain reserve balances in the form of vault cash or deposits with the FRB based on specified percentages of certain deposit types, subject to various adjustments. At December 31, 2019, the net reserve requirement was met with a combination of vault cash and balances held at the FRB.
Truist Bank is subject to laws and regulations that limit the amount of dividends it can pay. In addition, both Truist and Truist Bank are subject to various regulatory restrictions relating to the payment of dividends, including requirements to maintain capital at or above regulatory minimums, and to remain "well-capitalized" under the prompt corrective action regulations. Truist does not expect that any of these laws, regulations or policies will materially affect the ability of Truist Bank to pay dividends.
Truist is subject to various regulatory capital requirements administered by the Federal banking agencies. Failure to meet minimum capital requirements can initiate certain mandatory and possibly additional discretionary-actions by regulators that, if undertaken, could have a direct material effect on the financial statements. Under capital adequacy guidelines and the regulatory framework for prompt corrective action, the Company must meet specific capital guidelines that involve quantitative measures of assets, liabilities and certain off-balance-sheet items calculated pursuant to regulatory directives. Truist's capital amounts and classification also are subject to qualitative judgments by the regulators about components, risk weightings and other factors. Truist is in full compliance with these requirements. Banking regulations also identify five capital categories for IDIs: well-capitalized, adequately capitalized, undercapitalized, significantly undercapitalized and critically undercapitalized. At December 31, 2019 and 2018, Truist and Truist Bank were classified as "well-capitalized," and management believes that no events or changes have occurred subsequent to year end that would change this designation.
Quantitative measures established by regulation to ensure capital adequacy require Truist to maintain minimum ratios of CET1 ratio of
4.5
%, Tier 1 capital ratio of
6.0
%, Total capital to risk-weighted assets ratio of
8.0
%, and of Tier 1 capital to average tangible assets (leverage ratio) of
4.0
%. Truist and Truist Bank are also subject to a
2.5
% capital conservation buffer that became applicable on January 1, 2016 and was phased-in through December 31, 2018. The capital conservation buffer is an amount above the minimum levels designed to ensure that banks remain well-capitalized, even in adverse economic scenarios.
Risk-based capital ratios, which include CET1, Tier 1 capital and Total capital, are calculated based on regulatory guidance related to the measurement of capital and risk-weighted assets.
| 2019 | 2018 | |||||||||||||||||||||||||
|
December 31,
(Dollars in millions)
|
Ratio | Amount | Ratio | Amount | ||||||||||||||||||||||
| Truist Financial Corporation | ||||||||||||||||||||||||||
| CET1 |
|
% | $ |
|
|
% | $ |
|
||||||||||||||||||
| Tier 1 capital |
|
|
|
|
||||||||||||||||||||||
| Total capital |
|
|
|
|
||||||||||||||||||||||
| Leverage |
|
|
|
|
||||||||||||||||||||||
| Truist Bank | ||||||||||||||||||||||||||
| CET1 |
|
|
|
|
||||||||||||||||||||||
| Tier 1 capital |
|
|
|
|
||||||||||||||||||||||
| Total capital |
|
|
|
|
||||||||||||||||||||||
| Leverage |
|
|
|
|
||||||||||||||||||||||
130 Truist Financial Corporation
NOTE 18.
Fair Value Disclosures
Recurring Fair Value Measurements
Accounting standards define fair value as the exchange price that would be received on the measurement date to sell an asset or the price paid to transfer a liability in the principal or most advantageous market available to the entity in an orderly transaction between market participants, with a three level measurement hierarchy:
•
Level 1: Quoted prices for identical instruments in active markets
•
Level 2: Quoted prices for similar instruments in active markets; quoted prices for identical or similar instruments in markets that are not active; and model-derived valuations in which all significant inputs and significant value drivers are observable in active markets
•
Level 3: Valuations derived from valuation techniques in which one or more significant inputs or significant value drivers are unobservable
The following tables present fair value information for assets and liabilities measured at fair value on a recurring basis:
|
December 31, 2019
(Dollars in millions) |
Total | Level 1 | Level 2 | Level 3 | Netting Adjustments (1) | |||||||||||||||||||||||||||
| Assets: | ||||||||||||||||||||||||||||||||
| Trading assets: | ||||||||||||||||||||||||||||||||
| U.S. Treasury | $ |
|
$ |
|
$ |
|
$ |
|
$ | — | ||||||||||||||||||||||
| GSE |
|
|
|
|
— | |||||||||||||||||||||||||||
| Agency MBS - residential |
|
|
|
|
— | |||||||||||||||||||||||||||
| Agency MBS - commercial |
|
|
|
|
— | |||||||||||||||||||||||||||
| States and political subdivisions |
|
|
|
|
— | |||||||||||||||||||||||||||
| Non-agency MBS |
|
|
|
|
— | |||||||||||||||||||||||||||
| Corporate and other debt securities |
|
|
|
|
— | |||||||||||||||||||||||||||
| Loans |
|
|
|
|
— | |||||||||||||||||||||||||||
| Other |
|
|
|
|
— | |||||||||||||||||||||||||||
| Total trading assets |
|
|
|
|
— | |||||||||||||||||||||||||||
| AFS securities: | ||||||||||||||||||||||||||||||||
| U.S. Treasury |
|
|
|
|
— | |||||||||||||||||||||||||||
| GSE |
|
|
|
|
— | |||||||||||||||||||||||||||
| Agency MBS - residential |
|
|
|
|
— | |||||||||||||||||||||||||||
| Agency MBS - commercial |
|
|
|
|
— | |||||||||||||||||||||||||||
| States and political subdivisions |
|
|
|
|
— | |||||||||||||||||||||||||||
| Non-agency MBS |
|
|
|
|
— | |||||||||||||||||||||||||||
| Other |
|
|
|
|
— | |||||||||||||||||||||||||||
| Total AFS securities |
|
|
|
|
— | |||||||||||||||||||||||||||
| LHFS at fair value |
|
|
|
|
— | |||||||||||||||||||||||||||
| MSRs at fair value |
|
|
|
|
— | |||||||||||||||||||||||||||
| Other assets: | ||||||||||||||||||||||||||||||||
| Derivative assets |
|
|
|
|
(
|
|||||||||||||||||||||||||||
| Equity securities |
|
|
|
|
— | |||||||||||||||||||||||||||
| Private equity investments |
|
|
|
|
— | |||||||||||||||||||||||||||
| Total assets | $ |
|
$ |
|
$ |
|
$ |
|
$ |
(
|
||||||||||||||||||||||
| Liabilities: | ||||||||||||||||||||||||||||||||
| Derivative liabilities | $ |
|
$ |
|
$ |
|
$ |
|
$ |
(
|
||||||||||||||||||||||
| Securities sold short |
|
|
|
|
— | |||||||||||||||||||||||||||
| Total liabilities | $ |
|
$ |
|
$ |
|
$ |
|
$ |
(
|
||||||||||||||||||||||
Truist Financial Corporation 131
|
December 31, 2018
(Dollars in millions) |
Total | Level 1 | Level 2 | Level 3 | Netting Adjustments (1) | |||||||||||||||||||||||||||
| Assets: | ||||||||||||||||||||||||||||||||
| Trading assets | $ |
|
$ |
|
$ |
|
$ |
|
$ | — | ||||||||||||||||||||||
| AFS securities: | ||||||||||||||||||||||||||||||||
| U.S. Treasury |
|
|
|
|
— | |||||||||||||||||||||||||||
| GSE |
|
|
|
|
— | |||||||||||||||||||||||||||
| Agency MBS - residential |
|
|
|
|
— | |||||||||||||||||||||||||||
| Agency MBS - commercial |
|
|
|
|
— | |||||||||||||||||||||||||||
| States and political subdivisions |
|
|
|
|
— | |||||||||||||||||||||||||||
| Non-agency MBS |
|
|
|
|
— | |||||||||||||||||||||||||||
| Other |
|
|
|
|
— | |||||||||||||||||||||||||||
| Total AFS securities |
|
|
|
|
— | |||||||||||||||||||||||||||
| LHFS |
|
|
|
|
— | |||||||||||||||||||||||||||
| MSRs |
|
|
|
|
— | |||||||||||||||||||||||||||
| Other assets: | ||||||||||||||||||||||||||||||||
| Derivative assets |
|
|
|
|
|
|||||||||||||||||||||||||||
| Equity securities |
|
|
|
|
— | |||||||||||||||||||||||||||
| Private equity investments |
|
|
|
|
— | |||||||||||||||||||||||||||
| Total assets | $ |
|
$ |
|
$ |
|
$ |
|
$ |
|
||||||||||||||||||||||
| Liabilities: | ||||||||||||||||||||||||||||||||
| Derivative liabilities | $ |
|
$ |
|
$ |
|
$ |
|
$ |
|
||||||||||||||||||||||
| Securities sold short |
|
|
|
|
— | |||||||||||||||||||||||||||
| Total liabilities | $ |
|
$ |
|
$ |
|
$ |
|
$ |
|
||||||||||||||||||||||
The following discussion focuses on the valuation techniques and significant inputs for Level 2 and Level 3 assets and liabilities that are measured at fair value on a recurring basis.
Available for Sale and Trading Securities:
Securities accounted for at fair value include both the available-for-sale and trading portfolios. The Company uses prices obtained from pricing services, dealer quotes or recent trades to estimate the fair value of securities. The majority of AFS securities were priced by third-party vendors whereas trading securities are priced internally. All securities are subject to IPV. Management independently evaluates the fair values provided by the pricing service through comparisons to other external pricing sources, review of additional information provided by the pricing service and other third-party sources for selected securities and back-testing to compare the price realized on any security sales to the daily pricing information received from the pricing service. Fair value measurements are derived from market-based pricing matrices that were developed using observable inputs that include benchmark yields, benchmark securities, reported trades, offers, bids, issuer spreads and broker quotes. Security prices are also validated through actual cash settlement upon sale of a security. As described by security type below, additional inputs may be used, or some inputs may not be applicable. In the event that market observable data was not available, which would generally occur due to the lack of an active market for a given security, the valuation of the security would be subjective and may involve substantial judgment by management.
Trading loans:
The Company has elected to measure trading loans at fair value. Trading loans are valued primarily using quoted prices for similar instruments in active markets or quoted prices for identical or similar instruments in markets that are not active by a third-party pricing service. Trading loans include:
•
loans held in connection with the Company's trading business primarily consisting of commercial and corporate leveraged loans;
•
SBA loans guaranteed by the U.S. government; and
•
loans made or acquired in connection with the Company’s TRS business.
U.S. Treasury securities:
Treasury securities are valued using quoted prices in active over-the-counter markets.
132 Truist Financial Corporation
GSE securities and agency MBS:
GSE securities consist of debt obligations issued by HUD, the FHLB, and other agencies, as well as securities collateralized by loans that are guaranteed by the SBA, and thus, are backed by the full faith and credit of the U.S. government. Agency MBS includes pass-through securities and CMO issued by GSEs and U.S. government agencies, such as FNMA, FHLMC, and GNMA. Each security contains a guarantee by the issuing GSE or agency. GSE pass-through securities are valued using market-based pricing matrices that reference observable inputs including benchmark TBA security pricing and yield curves that were estimated based on U.S. Treasury yields and certain floating rate indices. The pricing matrices for these securities may also give consideration to pool-specific data supplied directly by the GSE. GSE CMOs are valued using market-based pricing matrices that are based on observable inputs including offers, bids, reported trades, dealer quotes and market research reports, the characteristics of a specific tranche, market convention prepayment speeds and benchmark yield curves as described above.
States and political subdivisions:
The Company’s investments in U.S. states and political subdivisions include obligations of county and municipal authorities and agency bonds, which are general obligations of the municipality or are supported by a specified revenue source. Holdings are geographically dispersed, with no significant concentrations in any one state or municipality. Additionally, all municipal obligations are highly rated or are otherwise collateralized by securities backed by the full faith and credit of the federal government. These securities are valued using market-based pricing matrices that reference observable inputs including MSRB reported trades, issuer spreads, material event notices and benchmark yield curves.
Non-agency MBS:
Non-agency MBS includes purchased interests in third-party securitizations that have a high investment grade rating, and the pricing matrices for these securities are based on observable inputs including offers, bids, reported trades, dealer quotes and market research reports, the characteristics of a specific tranche, market convention prepayment speeds and benchmark yield curves as described above; as such, these securities are classified as level 2. Non-agency MBS includes investments in Re-REMIC trusts that primarily hold non-agency MBS, which are valued based on broker pricing models that use baseline securities yields and tranche-level yield adjustments to discount cash flows using market convention prepayment speed and default assumptions. These investments are classified as level 3.
Other securities:
These securities consist primarily of corporate bonds and commercial paper. Corporate bonds are senior and subordinated debt obligations of domestic corporations. The Company acquires commercial paper that is generally short-term in nature and highly rated. These securities are valued based on a review of quoted market prices for similar assets as well as through the various other inputs discussed previously.
LHFS:
Certain mortgage loans that are originated to be sold to investors are carried at fair value. The fair value is primarily based on quoted market prices for securities backed by similar types of loans, adjusted for servicing, interest rate risk, and credit risk. The changes in fair value of these assets are largely driven by changes in interest rates subsequent to loan funding and changes in the fair value of servicing associated with the mortgage LHFS.
MSRs:
Residential MSRs are valued using an OAS valuation model to project cash flows over multiple interest rate scenarios and then are discounted at risk-adjusted rates. The model considers portfolio characteristics, contractually specified servicing fees, prepayment assumptions, delinquency rates, late charges, other ancillary revenue, costs to service and other economic factors. Fair value estimates and assumptions are compared to industry surveys, recent market activity, actual portfolio experience and, when available, other observable market data. Commercial MSRs are valued using a cash flow valuation model that calculates the present value of estimated future net servicing cash flows. The Company considers actual and expected loan prepayment rates, discount rates, servicing costs and other economic factors that are determined based on current market conditions. Refer to "Note 8. Loan Servicing" for additional discussion.
Equity securities:
Equity securities primarily consist of exchange-traded securities and are valued using quoted prices in active markets.
Derivative assets and liabilities:
The Company holds derivative instruments for both trading and risk management purposes. These include exchange-traded futures or option contracts, OTC swaps, options, forwards and interest rate lock commitments. The fair values of derivatives are determined based on quoted market prices and internal pricing models that use market observable assumptions for interest rates, foreign exchange, equity and credit. The fair values of interest rate lock commitments, which are related to mortgage loan commitments and are categorized as Level 3, are based on quoted market prices adjusted for commitments that are not expected to fund and include the value attributable to the net servicing fees. Funding rates are based on the Company’s historical data. The fair value attributable to servicing is based on discounted cash flows, and is impacted by prepayment assumptions, discount rates, delinquency rates, contractually-specified servicing fees, servicing costs and underlying portfolio characteristics.
Private equity investments:
In many cases there are no observable market values for these investments and therefore management must estimate the fair value based on a comparison of the operating performance of the investee to multiples in the marketplace for similar entities. This analysis requires significant judgment, and actual values in a sale could differ materially from those estimated.
Securities sold short:
Securities sold short represent debt securities sold short that are entered into as a hedging strategy for the purposes of supporting institutional and retail client trading activities.
Truist Financial Corporation 133
Activity for Level 3 assets and liabilities is summarized below:
|
(Dollars in millions) |
Trading Assets | Non-agency MBS | MSRs | Net Derivatives | Private Equity Investments | |||||||||||||||||||||||||||
| Balance at January 1, 2017 | $ |
|
$ |
|
$ |
|
$ |
(
|
$ |
|
||||||||||||||||||||||
| Total realized and unrealized gains (losses): | ||||||||||||||||||||||||||||||||
| Included in earnings |
|
|
|
|
|
|||||||||||||||||||||||||||
| Included in unrealized net holding gains (losses) in OCI |
|
(
|
|
|
|
|||||||||||||||||||||||||||
| Purchases |
|
|
|
|
|
|||||||||||||||||||||||||||
| Issuances |
|
|
|
|
|
|||||||||||||||||||||||||||
| Sales |
|
|
|
|
(
|
|||||||||||||||||||||||||||
| Settlements |
|
(
|
(
|
(
|
(
|
|||||||||||||||||||||||||||
| Transfers out of Level 3 |
|
|
|
|
(
|
|||||||||||||||||||||||||||
| Balance at December 31, 2017 |
|
|
|
|
|
|||||||||||||||||||||||||||
| Total realized and unrealized gains (losses): | ||||||||||||||||||||||||||||||||
| Included in earnings |
|
|
|
|
|
|||||||||||||||||||||||||||
| Purchases |
|
|
|
|
|
|||||||||||||||||||||||||||
| Issuances |
|
|
|
|
|
|||||||||||||||||||||||||||
| Sales |
(
|
|
|
|
(
|
|||||||||||||||||||||||||||
| Settlements |
|
(
|
(
|
(
|
(
|
|||||||||||||||||||||||||||
| Balance at December 31, 2018 |
|
|
|
|
|
|||||||||||||||||||||||||||
| Total realized and unrealized gains (losses): | ||||||||||||||||||||||||||||||||
| Included in earnings |
|
|
(
|
|
|
|||||||||||||||||||||||||||
| Included in unrealized net holding gains (losses) in OCI |
|
|
|
|
|
|||||||||||||||||||||||||||
| Purchases |
|
|
|
(
|
|
|||||||||||||||||||||||||||
| Issuances |
|
|
|
|
|
|||||||||||||||||||||||||||
| Sales |
(
|
|
(
|
|
(
|
|||||||||||||||||||||||||||
| Settlements |
|
(
|
(
|
(
|
(
|
|||||||||||||||||||||||||||
| Transfers into Level 3 |
|
|
|
(
|
|
|||||||||||||||||||||||||||
| Merger additions |
|
|
|
|
|
|||||||||||||||||||||||||||
| Balance at December 31, 2019 | $ |
|
$ |
|
$ |
|
$ |
|
$ |
|
||||||||||||||||||||||
| Change in unrealized gains (losses) included in earnings for the period, attributable to assets and liabilities still held at December 31, 2019 | $ |
|
$ |
|
$ |
(
|
$ |
|
$ |
|
||||||||||||||||||||||
|
Primary income statement location of realized gains (losses) included in earnings
|
Interest income | Interest income | Residential mortgage income and Commercial real estate related income | Residential mortgage income and Commercial real estate related income | Other income | |||||||||||||||||||||||||||
The non-agency MBS categorized as Level 3 represent ownership interests in various tranches of Re-REMIC trusts. These securities are valued at a discount, which is unobservable in the market, to the fair value of the underlying securities owned by the trusts. The Re-REMIC tranches do not have an active market and therefore are categorized as Level 3. At December 31, 2019, the fair value of Re-REMIC non-agency MBS represented a discount of
21.5
% to the fair value of the underlying securities owned by the Re-REMIC trusts.
The majority of private equity investments are in SBIC qualified funds, which primarily focus on equity and subordinated debt investments in privately-held middle market companies. The majority of these VIE investments are not redeemable and distributions are received as the underlying assets of the funds liquidate. The timing of distributions, which are expected to occur on various dates on an approximately ratable basis through 2029, is uncertain and dependent on various events such as recapitalizations, refinance transactions and ownership changes among others. As of December 31, 2019, restrictions on the ability to sell the investments include, but are not limited to, consent of a majority member or general partner approval for transfer of ownership. These investments are spread over numerous privately-held middle market companies, and thus the sensitivity to a change in fair value for any single investment is limited. The significant unobservable inputs for these investments are EBITDA multiples that ranged from
6
x to
13
x, with a weighted average of
9
x, at December 31, 2019.
Refer to "Note 8. Loan Servicing" for additional information on valuation techniques and inputs for MSRs.
134 Truist Financial Corporation
Fair Value Option
The following table details the fair value and UPB of LHFS that were elected to be measured at fair value. Trading loans, included in other trading assets, were also elected to be measured at fair value.
|
December 31,
(Dollars in millions) |
2019 | 2018 | ||||||||||||||||||||||||||||||||||||
| Fair Value | UPB | Difference | Fair Value | UPB | Difference | |||||||||||||||||||||||||||||||||
| Trading loans | $ |
|
$ |
|
$ |
(
|
$ |
|
$ |
|
$ |
|
||||||||||||||||||||||||||
| LHFS at fair value |
|
|
|
|
|
|
||||||||||||||||||||||||||||||||
Nonrecurring Fair Value Measurements
The following table provides information about certain assets measured at fair value on a nonrecurring basis. The carrying values represent end of period values, which approximate the fair value measurements that occurred on the various measurement dates throughout the period. The valuation adjustments represent the amounts recorded during the period regardless of whether the asset is still held at period end. These assets are considered to be Level 3 assets (excludes PCI).
| 2019 | 2018 | |||||||||||||||||||||||||
|
As of / For The Year Ended December 31,
(Dollars in millions) |
Carrying Value | Valuation Adjustments | Carrying Value | Valuation Adjustments | ||||||||||||||||||||||
| LHFS | $ |
|
$ |
(
|
$ |
|
$ |
|
||||||||||||||||||
| Impaired loans |
|
(
|
|
(
|
||||||||||||||||||||||
| Foreclosed real estate |
|
(
|
|
(
|
||||||||||||||||||||||
At December 31, 2019, LHFS consisted primarily of residential mortgages and commercial loans that were valued using market prices and measured at the lower of cost or market. Excluding government guaranteed loans, the Company held $
107
million in nonperforming LHFS at December 31, 2019. LHFS that were 90 days or more past due and still accruing interest were not material at December 31, 2019.
Impaired loans are primarily collateral dependent and may be subject to liquidity adjustments. Foreclosed real estate is measured at the lower of cost or fair value less costs to sell and consists primarily of residential homes, commercial properties, and vacant lots.
Financial Instruments Not Recorded at Fair Value
For financial instruments not recorded at fair value, estimates of fair value are based on relevant market data and information about the instrument. Values obtained relate to one trading unit without regard to any premium or discount that may result from concentrations of ownership, possible tax ramifications, estimated transaction costs that may result from bulk sales or the relationship between various instruments.
An active market does not exist for certain financial instruments. Fair value estimates for these instruments are based on current economic conditions, currency and interest rate risk characteristics, loss experience and other factors. Many of these estimates involve uncertainties and matters of significant judgment and cannot be determined with precision. Therefore, the fair value estimates in many instances cannot be substantiated by comparison to independent markets and, in many cases, may not be realizable in a current sale of the instrument. In addition, changes in assumptions could significantly affect these fair value estimates.
Financial assets and liabilities not recorded at fair value are summarized below:
| December 31, 2019 | December 31, 2018 | |||||||||||||||||||||||||
| (Dollars in millions) | Fair Value Hierarchy | Carrying Amount | Fair Value | Carrying Amount | Fair Value | |||||||||||||||||||||
| Financial assets: | ||||||||||||||||||||||||||
| HTM securities | Level 2 | $ |
|
$ |
|
$ |
|
$ |
|
|||||||||||||||||
| Loans and leases HFI, net of ALLL | Level 3 |
|
|
|
|
|||||||||||||||||||||
| Financial liabilities: | ||||||||||||||||||||||||||
| Time deposits | Level 2 |
|
|
|
|
|||||||||||||||||||||
| Long-term debt | Level 2 |
|
|
|
|
|||||||||||||||||||||
The carrying value of unfunded commitments, deferred non-yield related loan fees and standby letters of credit was $
373
million and $
119
million at December 31, 2019 and 2018, respectively.
Truist Financial Corporation 135
NOTE 19.
Derivative Financial Instruments
Impact of Derivatives on the Consolidated Balance Sheets
In the second quarter of 2019, the Company began applying the offsetting provisions for contracts that are covered by legally enforceable master netting agreements. Application of these provisions was not material to the Company's consolidated financial statements. Gross amounts are presented in the December 31, 2018 Consolidated Balance Sheet. The following table presents the gross notional amounts and estimated fair value of derivative instruments employed by the Company:
| December 31, 2019 | December 31, 2018 | |||||||||||||||||||||||||||||||||||||
| Notional Amount | Fair Value | Notional Amount | Fair Value | |||||||||||||||||||||||||||||||||||
| (Dollars in millions) | Assets | Liabilities | Assets | Liabilities | ||||||||||||||||||||||||||||||||||
| Cash flow hedges: | ||||||||||||||||||||||||||||||||||||||
| Interest rate contracts: | ||||||||||||||||||||||||||||||||||||||
| Swaps hedging 3 mo. LIBOR funding | $ |
|
$ |
|
$ |
|
$ |
|
$ |
|
$ |
|
||||||||||||||||||||||||||
| Fair value hedges: | ||||||||||||||||||||||||||||||||||||||
| Interest rate contracts: | ||||||||||||||||||||||||||||||||||||||
| Swaps hedging long-term debt |
|
|
(
|
|
|
(
|
||||||||||||||||||||||||||||||||
| Options hedging long-term debt |
|
|
(
|
|
|
(
|
||||||||||||||||||||||||||||||||
| Swaps hedging commercial loans |
|
|
|
|
|
|
||||||||||||||||||||||||||||||||
| Swaps hedging municipal securities |
|
|
|
|
|
|
||||||||||||||||||||||||||||||||
| Total |
|
|
(
|
|
|
(
|
||||||||||||||||||||||||||||||||
| Not designated as hedges: | ||||||||||||||||||||||||||||||||||||||
| Client-related and other risk management: | ||||||||||||||||||||||||||||||||||||||
| Interest rate contracts: | ||||||||||||||||||||||||||||||||||||||
| Swaps |
|
|
(
|
|
|
(
|
||||||||||||||||||||||||||||||||
| Options |
|
|
(
|
|
|
(
|
||||||||||||||||||||||||||||||||
| Forward commitments |
|
|
(
|
|
|
(
|
||||||||||||||||||||||||||||||||
| Other |
|
|
|
|
|
|
||||||||||||||||||||||||||||||||
| Equity contracts |
|
|
(
|
|
|
|
||||||||||||||||||||||||||||||||
| Credit contracts: | ||||||||||||||||||||||||||||||||||||||
| Loans and leases |
|
|
(
|
|
|
|
||||||||||||||||||||||||||||||||
| Risk participation agreements |
|
|
(
|
|
|
|
||||||||||||||||||||||||||||||||
| Total return swaps |
|
|
(
|
|
|
|
||||||||||||||||||||||||||||||||
| Foreign exchange contracts |
|
|
(
|
|
|
(
|
||||||||||||||||||||||||||||||||
| Commodity |
|
|
(
|
|
|
|
||||||||||||||||||||||||||||||||
| Total |
|
|
(
|
|
|
(
|
||||||||||||||||||||||||||||||||
| Mortgage banking: | ||||||||||||||||||||||||||||||||||||||
| Interest rate contracts: | ||||||||||||||||||||||||||||||||||||||
| Swaps |
|
|
|
|
|
|
||||||||||||||||||||||||||||||||
| Interest rate lock commitments |
|
|
(
|
|
|
|
||||||||||||||||||||||||||||||||
|
When issued securities, forward rate agreements and forward commitments
|
|
|
(
|
|
|
(
|
||||||||||||||||||||||||||||||||
| Other |
|
|
|
|
|
(
|
||||||||||||||||||||||||||||||||
| Total |
|
|
(
|
|
|
(
|
||||||||||||||||||||||||||||||||
| MSRs: | ||||||||||||||||||||||||||||||||||||||
| Interest rate contracts: | ||||||||||||||||||||||||||||||||||||||
| Swaps |
|
|
|
|
|
|
||||||||||||||||||||||||||||||||
| Options |
|
|
(
|
|
|
(
|
||||||||||||||||||||||||||||||||
|
When issued securities, forward rate agreements and forward commitments
|
|
|
(
|
|
|
|
||||||||||||||||||||||||||||||||
| Other |
|
|
|
|
|
|
||||||||||||||||||||||||||||||||
| Total |
|
|
(
|
|
|
(
|
||||||||||||||||||||||||||||||||
| Total derivatives not designated as hedges |
|
|
(
|
|
|
(
|
||||||||||||||||||||||||||||||||
| Total derivatives | $ |
|
|
(
|
$ |
|
|
(
|
||||||||||||||||||||||||||||||
| Gross amounts in the Consolidated Balance Sheets: | ||||||||||||||||||||||||||||||||||||||
|
Amounts subject to master netting arrangements
|
(
|
|
(
|
|
||||||||||||||||||||||||||||||||||
|
Cash collateral (received) posted for amounts subject to master netting arrangements
|
(
|
|
(
|
|
||||||||||||||||||||||||||||||||||
| Net amount | $ |
|
$ |
(
|
$ |
|
$ |
(
|
||||||||||||||||||||||||||||||
136 Truist Financial Corporation
The following table presents the offsetting of derivative instruments including financial instrument collateral related to legally enforceable master netting agreements. U.S. GAAP does not permit netting of such non-cash collateral balances in the consolidated balance sheet:
|
December 31, 2019
(Dollars in millions) |
Gross
Amount |
Amount
Offset |
Net Amount Presented in the Consolidated Balance Sheets | Held/Pledged Financial Instruments | Net Amount | ||||||||||||||||||||||||
| Derivative assets: | |||||||||||||||||||||||||||||
| Derivatives subject to master netting arrangement or similar arrangement | $ |
|
$ |
(
|
$ |
|
$ |
(
|
$ |
|
|||||||||||||||||||
| Derivatives not subject to master netting arrangement or similar arrangement |
|
|
|
(
|
|
||||||||||||||||||||||||
| Exchange traded derivatives |
|
(
|
|
|
|
||||||||||||||||||||||||
| Total derivative assets | $ |
|
$ |
(
|
$ |
|
$ |
(
|
$ |
|
|||||||||||||||||||
| Derivative liabilities: | |||||||||||||||||||||||||||||
| Derivatives subject to master netting arrangement or similar arrangement | $ |
(
|
$ |
|
$ |
(
|
$ |
|
$ |
(
|
|||||||||||||||||||
| Derivatives not subject to master netting arrangement or similar arrangement |
(
|
|
(
|
|
(
|
||||||||||||||||||||||||
| Exchange traded derivatives |
(
|
|
|
|
|
||||||||||||||||||||||||
| Total derivative liabilities | $ |
(
|
$ |
|
$ |
(
|
$ |
|
$ |
(
|
|||||||||||||||||||
The following table presents the carrying value of hedged items in fair value hedging relationships:
| December 31, 2019 | December 31, 2018 | |||||||||||||||||||||||||||||||||||||
| Hedge Basis Adjustment | Hedge Basis Adjustment | |||||||||||||||||||||||||||||||||||||
| (Dollars in millions) | Hedged Asset / Liability Basis | Items Currently Designated | Items No Longer Designated | Hedged Asset / Liability Basis | Items Currently Designated | Items No Longer Designated | ||||||||||||||||||||||||||||||||
| AFS securities | $ |
|
$ |
|
$ |
|
$ |
|
$ |
|
$ |
|
||||||||||||||||||||||||||
| Loans and leases |
|
|
|
|
|
(
|
||||||||||||||||||||||||||||||||
| Long-term debt |
|
|
|
|
(
|
|
||||||||||||||||||||||||||||||||
Impact of Derivatives on the Consolidated Statements of Income and Comprehensive Income
Derivatives Designated as Hedging Instruments under GAAP
No portion of the change in fair value of derivatives designated as hedges has been excluded from effectiveness testing.
The following table summarizes amounts related to cash flow hedges, which consist of interest rate contracts. Amounts presented for the year ended December 31, 2017 were not conformed to new hedge accounting guidance that was adopted in 2018.
| Year Ended December 31, | |||||||||||||||||
| (Dollars in millions) | 2019 | 2018 | 2017 | ||||||||||||||
| Pre-tax gain (loss) recognized in OCI: | |||||||||||||||||
| Deposits | $ |
(
|
$ |
|
|||||||||||||
| Short-term borrowings |
|
(
|
|||||||||||||||
| Long-term debt |
(
|
|
|||||||||||||||
| Total | $ |
(
|
$ |
|
$ |
|
|||||||||||
| Pre-tax gain (loss) reclassified from AOCI into interest expense: | |||||||||||||||||
| Deposits | $ |
(
|
$ |
(
|
|||||||||||||
| Short-term borrowings |
(
|
|
|||||||||||||||
| Long-term debt |
(
|
(
|
|||||||||||||||
| Total | $ |
(
|
$ |
(
|
$ |
(
|
|||||||||||
Truist Financial Corporation 137
The following table summarizes the impact on net interest income related to fair value hedges:
| Year Ended December 31, | |||||||||||||||||
| (Dollars in millions) | 2019 | 2018 | 2017 | ||||||||||||||
|
AFS securities:
|
|||||||||||||||||
| Amounts related to interest settlements | $ |
|
$ |
(
|
|||||||||||||
| Recognized on derivatives |
(
|
|
|||||||||||||||
|
Recognized on hedged items
|
|
(
|
|||||||||||||||
| Net income (expense) recognized |
(
|
(
|
$ |
(
|
|||||||||||||
| Loans and leases: | |||||||||||||||||
| Amounts related to interest settlements |
|
(
|
|||||||||||||||
| Recognized on derivatives |
(
|
(
|
|||||||||||||||
|
Recognized on hedged items
|
|
|
|||||||||||||||
| Net income (expense) recognized |
(
|
(
|
(
|
||||||||||||||
|
Long-term debt:
|
|||||||||||||||||
| Amounts related to interest settlements |
(
|
(
|
|||||||||||||||
| Recognized on derivatives |
|
(
|
|||||||||||||||
|
Recognized on hedged items
|
(
|
|
|||||||||||||||
| Net income (expense) recognized |
(
|
|
|
||||||||||||||
|
Net income (expense) recognized, total
|
$ |
(
|
$ |
|
$ |
|
|||||||||||
The following table presents information about the Company's cash flow and fair value hedges:
| (Dollars in millions) | Dec 31, 2019 | Dec 31, 2018 | ||||||||||||
| Cash flow hedges: | ||||||||||||||
| Net unrecognized after-tax gain (loss) on active hedges recorded in AOCI | $ |
|
$ |
(
|
||||||||||
|
Net unrecognized after-tax gain (loss) on terminated hedges recorded in AOCI (to be recognized in earnings through 2022)
|
(
|
(
|
||||||||||||
|
Estimated portion of net after-tax gain (loss) on active and terminated hedges to be reclassified from AOCI into earnings during the next 12 months
|
(
|
|
||||||||||||
|
Maximum time period over which Truist is hedging a portion of the variability in future cash flows for forecasted transactions excluding those transactions relating to the payment of variable interest on existing instruments
|
N/A |
|
||||||||||||
| Fair value hedges: | ||||||||||||||
|
Unrecognized pre-tax net gain (loss) on terminated hedges (to be recognized as interest primarily through 2030)
|
$ |
(
|
$ |
(
|
||||||||||
|
Portion of pre-tax net gain (loss) on terminated hedges to be recognized as a change in interest during the next 12 months
|
(
|
|
||||||||||||
Derivatives Not Designated as Hedging Instruments under GAAP
The Company also enters into derivatives that are not designated as accounting hedges under GAAP to economically hedge certain risks as well as in a trading capacity with its clients.
138 Truist Financial Corporation
The following table presents pre-tax gain (loss) recognized in income for derivative instruments not designated as hedges:
| Year Ended December 31, | ||||||||||||||||||||
| (Dollars in millions) | Income Statement Location | 2019 | 2018 | 2017 | ||||||||||||||||
| Client-related and other risk management: | ||||||||||||||||||||
| Interest rate contracts | Investment banking and trading income and other income | $ |
|
$ |
|
$ |
|
|||||||||||||
| Foreign exchange contracts | Investment banking and trading income |
(
|
|
|
||||||||||||||||
| Equity contracts | Investment banking and trading income and other income |
(
|
|
|
||||||||||||||||
| Credit contracts | Other income |
(
|
|
|
||||||||||||||||
| Mortgage banking: | ||||||||||||||||||||
| Interest rate contracts | Residential mortgage income |
(
|
|
(
|
||||||||||||||||
| Interest rate contracts | Commercial real estate related income |
(
|
|
|
||||||||||||||||
| MSRs: | ||||||||||||||||||||
| Interest rate contracts | Residential mortgage income |
|
(
|
|
||||||||||||||||
| Interest rate contracts | Commercial real estate related income |
|
(
|
|
||||||||||||||||
| Total | $ |
|
$ |
|
$ |
|
||||||||||||||
Credit Derivative Instruments
As part of the Company’s corporate investment banking business, the Company enters into contracts that are, in form or substance, written guarantees; specifically, CDS, risk participations and TRS. The Company accounts for these contracts as derivatives.
The Company has entered into TRS contracts on loans. The Company’s TRS business consists of matched trades, such that when the Company pays depreciation on one TRS, it receives the same amount on the matched TRS. To mitigate its credit risk, the Company typically receives initial margin from the counterparty upon entering into the TRS and variation margin if the fair value of the underlying reference assets deteriorates.
Truist has entered into risk participation agreements to share the credit exposure with other financial institutions on client-related interest rate derivative contracts. Under these agreements, the Company has guaranteed payment to a dealer counterparty in the event the dealer experiences a loss on the derivative, such as an interest rate swap, due to a failure to pay by the client, on that derivative. The Company manages its payment risk on its risk participations by monitoring the creditworthiness of the underlying client through the normal credit review process that the Company would have performed had it entered into a derivative directly with the obligors. At December 31, 2019, the remaining terms on these risk participations ranged from less than one year to 10 years. The potential future exposure represents the Company’s maximum estimated exposure to written risk participations, as measured by projecting a maximum value of the guaranteed derivative instruments based on scenario simulations and assuming 100% default by all obligors on the maximum value.
The following table presents additional information related to interest rate derivative risk participation agreements and total return swaps:
| (Dollars in millions) | Dec 31, 2019 | Dec 31, 2018 | |||||||||
| Risk participation agreements: | |||||||||||
|
Maximum potential amount of exposure
|
$ |
|
$ |
|
|||||||
| Total return swaps: | |||||||||||
| Cash collateral held |
|
|
|||||||||
Truist Financial Corporation 139
The following table summarizes collateral positions with counterparties:
| (Dollars in millions) | Dec 31, 2019 | Dec 31, 2018 | |||||||||
| Dealer and other counterparties: | |||||||||||
| Cash collateral received from counterparties | $ |
|
$ |
|
|||||||
| Derivatives in a net gain position secured by collateral received |
|
|
|||||||||
|
Unsecured positions in a net gain with counterparties after collateral postings
|
|
|
|||||||||
| Cash collateral posted to dealer counterparties |
|
|
|||||||||
| Derivatives in a net loss position secured by collateral received |
|
|
|||||||||
|
Additional collateral that would have been posted had the Company's credit ratings dropped below investment grade
|
|
|
|||||||||
| Central counterparties clearing: | |||||||||||
| Cash collateral, including initial margin, posted to central clearing parties |
|
|
|||||||||
| Derivatives in a net loss position |
|
|
|||||||||
| Securities pledged to central counterparties clearing |
|
|
|||||||||
NOTE 20.
Computation of EPS
Basic and diluted EPS calculations are presented in the following table:
|
Year Ended December 31,
(Dollars in millions, except per share data, shares in thousands) |
2019 | 2018 | 2017 | ||||||||||||||
| Net income available to common shareholders | $ |
|
$ |
|
$ |
|
|||||||||||
| Weighted average number of common shares |
|
|
|
||||||||||||||
| Effect of dilutive outstanding equity-based awards |
|
|
|
||||||||||||||
| Weighted average number of diluted common shares |
|
|
|
||||||||||||||
| Basic EPS | $ |
|
$ |
|
$ |
|
|||||||||||
| Diluted EPS | $ |
|
$ |
|
$ |
|
|||||||||||
| Anti-dilutive awards |
|
|
|
||||||||||||||
NOTE 21.
Operating Segments
Truist operates and measures business activity across
three
segments: Consumer Banking and Wealth, Corporate and Commercial Banking, and Insurance Holdings, with functional activities included in Other, Treasury, and Corporate. The Company's business segment structure is based on the manner in which financial information is evaluated by management as well as the products and services provided or the type of client served.
Effective at the close of the Merger, several business activities were realigned within the segments in order to better serve the Truist strategic vision. Grandbridge Real Estate Capital, LLC, BB&T Commercial Corporate Banking and Equipment and Government Finance have moved from the heritage Financial Services and Commercial Finance segment to the new Corporate and Commercial Banking segment. Additionally, Sterling Capital, BB&T Securities and Wealth and Retirement Services have moved from Financial Services and Commercial Finance to Wealth, which is now included in the broader Consumer Banking and Wealth segment. Refer to "Note 2. Business Combinations" for additional information related to the Merger.
Consumer Banking and Wealth
The CB&W segment is made up of five primary businesses:
•
Retail Community Banking provides services to individuals and business banking clients through an extensive network of traditional and in-store branches, ATMs, digital banking and through client care call centers. Financial products and services offered to individuals and small business clients include deposits and payments, loans and various fee-based services. Consumer Banking also serves as an entry point for clients and provides services for other businesses.
•
NCF&P provides a comprehensive set of technology-enabled lending solutions to individuals and small businesses through several national channels including LightStream, Sheffield, Truist Equipment Capital and certain FinTech partnerships. NCF&P also provides merchant services and payment processing solutions to business clients in the community bank.
•
Wealth provides a full array of wealth management products and professional services to individuals and institutional clients, including loans, deposits, brokerage, professional investment advisory and trust services to clients seeking active management of their financial resources. Institutional clients are served by the Institutional Investment Solutions business. Discount/online and full service brokerage products are offered to individual clients; additionally, investment advisory products and services are offered to
140 Truist Financial Corporation
clients through an SEC registered investment advisor. Wealth also includes GenSpring Family Office Advisory Services, LLC, which provides family office solutions to clients and their families to help them manage and sustain wealth across multiple generations, including family meeting facilitation, consolidated reporting, expense management, specialty asset management and business transition advice, as well as other wealth management disciplines.
•
Mortgage Banking offers residential mortgage products nationally through its retail and correspondent channels, the internet and by telephone. These products are either sold in the secondary market, typically with servicing rights retained, or held in the Company’s loan portfolio. Mortgage Banking also services loans held in the Company’s loan portfolio as well as those held by third-party investors. Mortgage also includes Mortgage Warehouse Lending, which provides short-term lending solutions to finance first-lien residential mortgage LHFS by independent mortgage companies.
•
Dealer Retail Services originates loans to individuals on a prime and nonprime basis for the purchase of automobiles. Such loans are originated on an indirect basis through approved franchised and independent automobile dealers throughout the Truist market area and nationally through Regional Acceptance Corporation. Additionally, Dealer Retail Services originates loans for the purchase of boats and other recreational vehicles through dealers in Truist’s market area.
Corporate and Commercial Banking
The C&CB segment is made up of four primary businesses and the Treasury Solutions product group:
•
Corporate and Investment Banking delivers a comprehensive range of strategic advisory, capital raising, risk management, financing, liquidity and investment solutions, with the goal of serving the needs of both public and private companies in the C&CB segment. Investment Banking and Corporate Banking teams within CIB serve clients across the nation, offering a full suite of traditional banking and investment banking products and services. Investment Banking serves select industry segments including consumer and healthcare, energy, technology, financial services, industrials, and media and communications. Corporate Banking serves clients across diversified industry sectors based on size, complexity, and frequency of capital markets issuance.
•
Commercial Community Banking offers an array of traditional banking products, including lending, cash management and investment banking solutions via CIB to commercial clients (generally clients with revenues between $5 million and $250 million), including not-for-profit organizations, governmental entities, healthcare and aging services and auto dealer financing (floor plan inventory financing). Local teams deliver these solutions along with the Company's industry expertise to commercial clients to help them achieve smart growth.
•
Commercial Real Estate provides a range of credit and deposit services as well as fee-based product offerings to privately held developers, operators, and investors in commercial real estate properties through its National Banking Division. Additionally, Commercial Real Estate offers tailored financing and equity investment solutions for community development and affordable housing projects, with particular expertise in Low Income Housing Tax Credits and New Market Tax Credits. Real Estate Corporate and Investment Banking targets relationships with publicly-traded and privately owned REITs.
•
Grandbridge Real Estate Capital, LLC is a fully integrated commercial mortgage investment banking company that originates commercial and multi-family real estate loans, services loan portfolios and provides asset and portfolio management as well as real estate brokerage services. Additionally, the Investor Services Group offers loan administration, special servicing, valuation and advisory services to third-party clients.
•
Treasury Solutions provides business clients in the C&CB and CB&W segments with services required to manage their payments and receipts, combined with the ability to manage and optimize their deposits across all aspects of their business. Treasury Solutions operates all electronic and paper payment types, including card, wire transfer, ACH, check and cash. It also provides clients the means to manage their accounts electronically online, both domestically and internationally.
Insurance Holdings
Truist’s IH segment is one of the largest insurance agency / brokerage networks in the world, providing property and casualty, employee benefits and life insurance to businesses and individuals. It also provides small business and corporate services, such as workers compensation and professional liability, as well as surety coverage and title insurance. IH also includes Prime Rate Premium Finance Corporation, which includes AFCO Credit Corporation and CAFO Holding Company, insurance premium finance subsidiaries that provide funding to businesses in the United States and Canada.
Other, Treasury & Corporate
OT&C includes management of the Company’s investment securities portfolio, long-term debt, derivative instruments used for balance sheet hedging, short-term liquidity and funding activities, balance sheet risk management and most real estate assets, as well as the Company's functional activities such as marketing, finance, enterprise risk, legal, enterprise technology and executive leadership, among others. Additionally, OT&C houses intercompany eliminations, including intersegment net referral fees and residual interest rate risk after segment allocations have taken place.
Truist Financial Corporation 141
Truist emphasizes revenue growth by focusing on client service, sales effectiveness and relationship management along with an organizational focus on referring clients between businesses. The objective is to provide Truist’s entire suite of products to our clients with the end goal of providing our clients the best financial experience in the marketplace. To promote revenue growth, revenues of certain products and services are reflected in the results of the segment providing those products and services and are also allocated to CB&W and C&CB. These allocated revenues between segments are reflected as net referral fees in noninterest income and eliminated in OT&C.
The segment results are presented based on internal management methodologies that were designed to support these strategic objectives. Unlike financial accounting, there is no comprehensive authoritative body of guidance for management accounting equivalent to GAAP. The performance of the segments is not comparable with Truist’s consolidated results or with similar information presented by any other financial institution. Additionally, because of the interrelationships between the various segments, the information presented is not indicative of how the segments would perform if they operated as independent entities.
Because business segment results are presented based on management accounting practices, the transition to the consolidated results prepared under U.S. GAAP creates certain differences, which are reflected as residuals in OT&C. Business segment reporting conventions include, but are not limited to, the items as detailed below.
Segment net interest income reflects matched maturity funds transfer pricing, which ascribes credits or charges based on the economic value or cost created by assets and liabilities of each segment. Residual differences between these credits and charges are captured in OT&C.
Noninterest income includes federal and state tax credits that are grossed up on a pre-tax equivalent basis, related primarily to certain community development investments. Corporate expense allocations, including overhead or functional expenses that are not directly charged to the segments, are allocated to segments based on various drivers (number of equivalent employees, number of accounts, square footage assigned, net revenue, etc.). Recoveries for these allocations are reported in OT&C.
Provision for credit losses represents net charge-offs by segment combined with an allocation to the segments for the provision attributable to each segment’s quarterly change in the ALLL. Provision for income taxes is calculated using a blended income tax rate for each segment and includes reversals of the noninterest income tax adjustments described above. The difference between the calculated provision for income taxes at the segment level and the consolidated provision for income taxes is reported in OT&C.
The application and development of management reporting methodologies is an active process and undergoes periodic enhancements. The implementation of these enhancements to the internal management reporting methodology may materially affect the results disclosed for each segment, with no impact on consolidated results. If significant changes to management reporting methodologies take place, the impact of these changes is quantified and prior period information is revised, when practicable.
The following table presents results by segment:
|
Year Ended December 31,
(Dollars in millions) |
CB&W | C&CB | IH | ||||||||||||||||||||||||||||||||||||||||||||||||||
| 2019 | 2018 | 2017 | 2019 | 2018 | 2017 | 2019 | 2018 | 2017 | |||||||||||||||||||||||||||||||||||||||||||||
| Net interest income (expense) | $ |
|
$ |
|
$ |
|
$ |
|
$ |
|
$ |
|
$ |
|
$ |
|
$ |
|
|||||||||||||||||||||||||||||||||||
| Net intersegment interest income (expense) |
|
|
|
(
|
(
|
|
(
|
(
|
(
|
||||||||||||||||||||||||||||||||||||||||||||
| Segment net interest income |
|
|
|
|
|
|
|
|
|
||||||||||||||||||||||||||||||||||||||||||||
| Allocated provision for credit losses |
|
|
|
|
|
|
|
|
|
||||||||||||||||||||||||||||||||||||||||||||
| Segment net interest income after provision |
|
|
|
|
|
|
|
|
|
||||||||||||||||||||||||||||||||||||||||||||
| Noninterest income |
|
|
|
|
|
|
|
|
|
||||||||||||||||||||||||||||||||||||||||||||
| Noninterest expense |
|
|
|
|
|
|
|
|
|
||||||||||||||||||||||||||||||||||||||||||||
| Income (loss) before income taxes |
|
|
|
|
|
|
|
|
|
||||||||||||||||||||||||||||||||||||||||||||
| Provision (benefit) for income taxes |
|
|
|
|
|
|
|
|
|
||||||||||||||||||||||||||||||||||||||||||||
| Segment net income (loss) | $ |
|
$ |
|
$ |
|
$ |
|
$ |
|
$ |
|
$ |
|
$ |
|
$ |
|
|||||||||||||||||||||||||||||||||||
| Identifiable assets (period end) | $ |
|
$ |
|
$ |
|
$ |
|
$ |
|
$ |
|
$ |
|
$ |
|
$ |
|
|||||||||||||||||||||||||||||||||||
142 Truist Financial Corporation
| OT&C (1) | Total | ||||||||||||||||||||||||||||||||||||||||||||||||||||
| 2019 | 2018 | 2017 | 2019 | 2018 | 2017 | ||||||||||||||||||||||||||||||||||||||||||||||||
| Net interest income (expense) | $ |
|
$ |
|
$ |
|
$ |
|
$ |
|
$ |
|
|||||||||||||||||||||||||||||||||||||||||
| Net intersegment interest income (expense) |
(
|
(
|
(
|
|
|
|
|||||||||||||||||||||||||||||||||||||||||||||||
| Segment net interest income |
(
|
|
|
|
|
|
|||||||||||||||||||||||||||||||||||||||||||||||
| Allocated provision for credit losses |
(
|
(
|
(
|
|
|
|
|||||||||||||||||||||||||||||||||||||||||||||||
| Segment net interest income after provision |
(
|
|
|
|
|
|
|||||||||||||||||||||||||||||||||||||||||||||||
| Noninterest income |
(
|
(
|
(
|
|
|
|
|||||||||||||||||||||||||||||||||||||||||||||||
| Noninterest expense |
|
|
|
|
|
|
|||||||||||||||||||||||||||||||||||||||||||||||
| Income (loss) before income taxes |
(
|
(
|
(
|
|
|
|
|||||||||||||||||||||||||||||||||||||||||||||||
| Provision (benefit) for income taxes |
(
|
(
|
(
|
|
|
|
|||||||||||||||||||||||||||||||||||||||||||||||
| Segment net income (loss) | $ |
(
|
$ |
(
|
$ |
|
$ |
|
$ |
|
$ |
|
|||||||||||||||||||||||||||||||||||||||||
| Identifiable assets (period end) | $ |
|
$ |
|
$ |
|
$ |
|
$ |
|
$ |
|
|||||||||||||||||||||||||||||||||||||||||
(1)
Includes financial data from business units below the quantitative and qualitative thresholds requiring disclosure.
Truist Financial Corporation 143
NOTE 22.
Parent Company Financial Information
|
Parent Company - Condensed Balance Sheets
(Dollars in millions)
|
December 31, | |||||||||||||
| 2019 | 2018 | |||||||||||||
| Assets: | ||||||||||||||
| Cash and due from banks | $ |
|
$ |
|
||||||||||
| Interest-bearing deposits with banks |
|
|
||||||||||||
| AFS securities at fair value |
|
|
||||||||||||
| Advances to / receivables from subsidiaries: | ||||||||||||||
| Banking |
|
|
||||||||||||
| Nonbank |
|
|
||||||||||||
| Total advances to / receivables from subsidiaries |
|
|
||||||||||||
| Investment in subsidiaries: | ||||||||||||||
| Banking |
|
|
||||||||||||
| Nonbank |
|
|
||||||||||||
| Total investment in subsidiaries |
|
|
||||||||||||
| Other assets |
|
|
||||||||||||
| Total assets | $ |
|
$ |
|
||||||||||
| Liabilities and Shareholders' Equity: | ||||||||||||||
| Short-term borrowings | $ |
|
$ |
|
||||||||||
| Long-term debt |
|
|
||||||||||||
| Other liabilities |
|
|
||||||||||||
| Total liabilities |
|
|
||||||||||||
| Total shareholders' equity |
|
|
||||||||||||
| Total liabilities and shareholders' equity | $ |
|
$ |
|
||||||||||
|
Parent Company - Condensed Income and Comprehensive Income Statements
(Dollars in millions)
|
Year Ended December 31, | |||||||||||||||||||
| 2019 | 2018 | 2017 | ||||||||||||||||||
| Income: | ||||||||||||||||||||
| Dividends from subsidiaries: | ||||||||||||||||||||
| Banking | $ |
|
$ |
|
$ |
|
||||||||||||||
| Nonbank |
|
|
|
|||||||||||||||||
| Total dividends from subsidiaries |
|
|
|
|||||||||||||||||
| Interest and other income from subsidiaries |
|
|
|
|||||||||||||||||
| Other income |
|
|
|
|||||||||||||||||
| Total income |
|
|
|
|||||||||||||||||
| Expenses: | ||||||||||||||||||||
| Interest expense |
|
|
|
|||||||||||||||||
| Other expenses |
|
|
|
|||||||||||||||||
| Total expenses |
|
|
|
|||||||||||||||||
|
Income before income taxes and equity in undistributed earnings of subsidiaries
|
|
|
|
|||||||||||||||||
| Income tax benefit |
|
|
|
|||||||||||||||||
| Income before equity in undistributed earnings of subsidiaries |
|
|
|
|||||||||||||||||
|
Equity in undistributed earnings of subsidiaries in excess of dividends from subsidiaries
|
|
|
|
|||||||||||||||||
| Net income |
|
|
|
|||||||||||||||||
| Total OCI |
|
(
|
(
|
|||||||||||||||||
| Total comprehensive income | $ |
|
$ |
|
$ |
|
||||||||||||||
144 Truist Financial Corporation
|
Parent Company - Statements of Cash Flows
(Dollars in millions)
|
Year Ended December 31, | |||||||||||||||||||
| 2019 | 2018 | 2017 | ||||||||||||||||||
| Cash Flows From Operating Activities: | ||||||||||||||||||||
| Net income | $ |
|
$ |
|
$ |
|
||||||||||||||
|
Adjustments to reconcile net income to net cash from operating activities:
|
||||||||||||||||||||
|
Equity in earnings of subsidiaries in excess of dividends from subsidiaries
|
(
|
(
|
(
|
|||||||||||||||||
| Other, net |
|
(
|
|
|||||||||||||||||
| Net cash from operating activities |
|
|
|
|||||||||||||||||
| Cash Flows From Investing Activities: | ||||||||||||||||||||
| Proceeds from maturities, calls, paydowns and sales of AFS securities |
|
|
|
|||||||||||||||||
| Purchases of AFS securities |
(
|
(
|
(
|
|||||||||||||||||
| Proceeds from maturities, calls and paydowns of HTM securities |
|
|
|
|||||||||||||||||
| Purchases of equity securities with readily determinable fair value |
(
|
|
|
|||||||||||||||||
| Investment in subsidiaries |
(
|
|
|
|||||||||||||||||
| Advances to subsidiaries |
(
|
(
|
(
|
|||||||||||||||||
| Proceeds from repayment of advances to subsidiaries |
|
|
|
|||||||||||||||||
| Net cash from acquisitions and divestitures |
|
|
|
|||||||||||||||||
| Other, net |
|
(
|
|
|||||||||||||||||
| Net cash from investing activities |
|
(
|
(
|
|||||||||||||||||
| Cash Flows From Financing Activities: | ||||||||||||||||||||
| Net change in short-term borrowings |
|
(
|
(
|
|||||||||||||||||
| Net change in long-term debt |
|
|
|
|||||||||||||||||
| Repurchase of common stock |
|
(
|
(
|
|||||||||||||||||
| Net proceeds from preferred stock issued |
|
|
|
|||||||||||||||||
| Repurchase of preferred stock |
(
|
|
|
|||||||||||||||||
| Cash dividends paid on common and preferred stock |
(
|
(
|
(
|
|||||||||||||||||
| Other, net |
(
|
(
|
|
|||||||||||||||||
| Net cash from financing activities |
(
|
(
|
(
|
|||||||||||||||||
| Net Change in Cash and Cash Equivalents |
|
|
(
|
|||||||||||||||||
| Cash and Cash Equivalents at Beginning of Period |
|
|
|
|||||||||||||||||
| Cash and Cash Equivalents End of Period | $ |
|
$ |
|
$ |
|
||||||||||||||
The transfer of funds in the form of dividends, loans or advances from bank subsidiaries to the Parent Company is restricted. Federal law requires loans to the Parent Company or its affiliates to be secured and at market terms and generally limits loans to the Parent Company or an individual affiliate to 10% of Truist Bank's unimpaired capital and surplus. In the aggregate, loans to the Parent Company and all affiliates cannot exceed 20% of the bank's unimpaired capital and surplus.
Dividend payments to the Parent Company by Truist Bank are subject to regulatory review and statutory limitations and, in some instances, regulatory approval. In general, dividends from Truist Bank to the Parent Company are limited by rules which compare dividends to net income for regulatory-defined periods. Furthermore, dividends are restricted by regulatory minimum capital constraints.
Truist Financial Corporation 145
ITEM 15. EXHIBITS, FINANCIAL STATEMENT SCHEDULES
| Exhibit No. | Description | Location | ||||||||||||
| 2.1 |
Agreement and Plan of Merger, dated as of February 7, 2019, by and between SunTrust Banks, Inc. and BB&T Corporation.
|
|||||||||||||
| 2.2 |
First Amendment to the Agreement and Plan of Merger, dated as of June 14, 2019, by and between SunTrust Banks, Inc. and BB&T Corporation.
|
|||||||||||||
| 3.1 | Articles of Incorporation of the Registrant, as amended and restated April 30, 2014. | |||||||||||||
| 3.2 | Articles of Amendment of the Registrant, dated as of March 4, 2016 | |||||||||||||
| 3.3 | Articles of Amendment of the Company with respect to 4.800% Series N Fixed Rate Reset Non-Cumulative Perpetual Preferred Stock filed July 24, 2019. | |||||||||||||
| 3.4 | Articles of Amendment of the Company with respect to Rollover Preferred Stock | |||||||||||||
| 3.5 | Articles of Amendment of the Registrant with respect to the change of the Registrant's name | |||||||||||||
| 3.6 | Bylaws of the Registrant, as amended and restated December 7, 2019. | |||||||||||||
| 4.1 | Indenture Regarding Senior Securities (including form of Senior Debt Security) between Registrant and U.S. Bank National Association (as successor in interest to State Street Bank and Trust Company), as trustee, dated as of May 24, 1996. | |||||||||||||
| 4.2 | First Supplemental Indenture, dated May 4, 2009, to the Indenture Regarding Senior Securities, dated as of May 24, 1996, between the Registrant and U.S. Bank National Association. | |||||||||||||
| 4.3 | Indenture Regarding Subordinated Securities (including Form of Subordinated Debt Security) between the Registrant and U.S. Bank National Association (as successor in interest to State Street Bank and Trust Company), as trustee, dated as of May 24, 1996. | |||||||||||||
| 4.4 | First Supplemental Indenture, dated as of December 23, 2003, to the Indenture Regarding Subordinated Securities, dated as of May 24, 1996, between the Registrant and U.S. Bank National Association. | |||||||||||||
| 4.5 | Second Supplemental Indenture, dated as of September 24, 2004, to the Indenture Regarding Subordinated Securities, dated as of May 24, 1996, between the Registrant and U.S. Bank National Association. | |||||||||||||
| 4.6 | Third Supplemental Indenture, dated May 4, 2009, to the Indenture Regarding Subordinated Securities, dated as of May 24, 1996, between the Registrant and U.S. Bank National Association. | |||||||||||||
| 4.7 | Deposit Agreement, dated as of July 29, 2019, between the Company and Computershare Inc. and Computershare Trust Company, N.A., jointly as depositary. | |||||||||||||
| 4.8 | Form of Depositary Receipt. | |||||||||||||
146 Truist Financial Corporation
| Exhibit No. | Description | Location | ||||||||||||
| 4.9 | Description of the Securities Registered Pursuant to Section 12 of the Securities Exchange Act of 1934 | |||||||||||||
|
Other instruments defining the rights of holders of long-term debt securities of Truist are omitted pursuant to Section (b)(4)(iii)(A) of Item 601 of Regulation S-K. Truist agrees to furnish copies of these instruments to the SEC upon request.
|
||||||||||||||
| 10.1* | BB&T Corporation Amended and Restated Non-Employee Directors' Deferred Compensation Plan (amended and restated January 1, 2005). | |||||||||||||
| 10.2* | BB&T Corporation Amended and Restated 2004 Stock Incentive Plan, as amended (as amended through February 24, 2009). | |||||||||||||
| 10.3* | BB&T Corporation 2012 Incentive Plan, as amended | |||||||||||||
| 10.4* | Form of Restricted Stock Unit Agreement (Non-Employee Directors) for the BB&T 2012 Incentive Plan (effective 2019). | |||||||||||||
| 10.5* | Form of Non-Employee Director Nonqualified Stock Option Agreement for the BB&T Corporation Amended and Restated 2004 Stock Incentive Plan (5-Year Vesting). | |||||||||||||
| 10.6* | Form of Non-Employee Director Nonqualified Stock Option Agreement for the BB&T Corporation Amended and Restated 2004 Stock Incentive Plan (4-Year Vesting). | |||||||||||||
| 10.7* | Form of Employee Nonqualified Stock Option Agreement for the BB&T Corporation Amended and Restated 2004 Stock Incentive Plan (5-Year Vesting). | |||||||||||||
| 10.8* | Form of Employee Nonqualified Stock Option Agreement for the BB&T Corporation Amended and Restated 2004 Stock Incentive Plan (4-Year Vesting). | |||||||||||||
| 10.9* | Southern National Deferred Compensation Plan for Key Executives including amendments. | |||||||||||||
| 10.10* | BB&T Non-Qualified Defined Benefit Plan (January 1, 2012 Restatement). | |||||||||||||
| 10.11* | First Amendment to the BB&T Non-Qualified Defined Benefit Plan (January 1, 2012 Restatement). | |||||||||||||
| 10.12* | Second Amendment to the BB&T Non-Qualified Defined Benefit Plan (January 1, 2012 Restatement). | |||||||||||||
| 10.13* | BB&T Non-Qualified Defined Contribution Plan (January 1, 2012 Restatement). | |||||||||||||
| 10.14* | BB&T Corporation Non-Qualified Deferred Compensation Trust (Amended and Restated Effective January 1, 2012). | |||||||||||||
| 10.15* | Form of Employee Nonqualified Stock Option Agreement for the BB&T Corporation Amended and Restated 2004 Stock Incentive Plan (4-Year Vesting with Clawback Provision). | |||||||||||||
Truist Financial Corporation 147
| Exhibit No. | Description | Location | ||||||||||||
| 10.16* | Form of Employee Nonqualified Stock Option Agreement for the BB&T Corporation 2012 Incentive Plan. | |||||||||||||
| 10.17* | Form of Nonqualified Option Agreement (Senior Executive) for the BB&T Corporation 2012 Incentive Plan. | |||||||||||||
| 10.18* | Form of Director Restricted Stock Unit Agreement for the BB&T Corporation 2012 Incentive Plan. | |||||||||||||
| 10.19* | Form of Restricted Stock Unit Agreement (Performance-Based Vesting Component)(Senior Executive) for the BB&T Corporation 2012 Incentive Plan. | |||||||||||||
| 10.20* | Form of LTIP Award Agreement for Executive Officers under the BB&T Corporation 2012 Incentive Plan (2014 – 2016 performance period). | |||||||||||||
| 10.21* | Form of LTIP Award Agreement for the BB&T Corporation 2012 Incentive Plan (effective 2019). | |||||||||||||
| 10.22* | Modification of 2016-2018 Long-Term Incentive Performance Award - Summary. | |||||||||||||
| 10.23* | Form of Performance Unit Award Agreement for the BB&T Corporation 2012 Incentive Plan (effective 2019). | |||||||||||||
| 10.24* | 2008 Amended and Restated Employment Agreement by and among BB&T Corporation, Branch Banking and Trust Co. and Christopher L. Henson. | |||||||||||||
| 10.25* | 2008 Amended and Restated Employment Agreement by and among BB&T Corporation, Branch Banking and Trust Co. and Daryl N. Bible. | |||||||||||||
| 10.26* | 2008 Amended and Restated Employment Agreement by and among BB&T Corporation, Branch Banking and Trust Co. and Barbara F. Duck. | |||||||||||||
| 10.27* | 2008 Amended and Restated Employment Agreement by and among BB&T Corporation, Branch Banking and Trust Co. and Donna C. Goodrich. | |||||||||||||
| 10.28* | 2008 Amended and Restated Employment Agreement by and among BB&T Corporation, Branch Banking and Trust Co. and Clarke R. Starnes, III. | |||||||||||||
| 10.29* | 2012 Employment Agreement by and among BB&T Corporation, Branch Banking and Trust Co. and William R. Yates. | |||||||||||||
| 10.30* | 2014 Employment Agreement by and among BB&T Corporation, Branch Banking and Trust Company and Robert J. Johnson, Jr. | |||||||||||||
| 10.31* | 2016 Employment Agreement by and among BB&T Corporation, Branch Banking and Trust Company and W. Bennett Bradley. | |||||||||||||
148 Truist Financial Corporation
| Exhibit No. | Description | Location | ||||||||||||
| 10.32* | 2016 Employment Agreement by and among BB&T Corporation, Branch Banking and Trust Company and David H. Weaver. | |||||||||||||
| 10.33* |
2016 Employment Agreement by and among BB&T Corporation, Branch Banking and Trust Company and Jimmy D. Godwin.
|
|||||||||||||
| 10.34* |
2016 Employment Agreement by and among BB&T Corporation, Branch Banking and Trust Company and Brant J. Standridge.
|
|||||||||||||
| 10.35* |
2016 Employment Agreement by and among BB&T Corporation, Branch Banking and Trust Company and Dontá L. Wilson.
|
|||||||||||||
| 10.36* | Amended and Restated Employment Agreement by and among BB&T Corporation, Branch Banking and Trust Co. and Kelly S. King dated as of February 7, 2019. | |||||||||||||
| 10.37* |
Form of Notice of Term Non-Renewal under Employment Agreements
|
|||||||||||||
| 10.38* | Form of Synergy Incentive Award Letter with each of Daryl N. Bible and Clarke R. Starnes, III | |||||||||||||
| 10.39* | Synergy Incentive Award Letter with Donna C. Goodrich | |||||||||||||
| 10.40* | Synergy Incentive Award Letter with Christopher L. Henson | |||||||||||||
| 10.41* | Form of First Amendment to Employment Agreement with each of Daryl N. Bible and Clarke R. Starnes, III | |||||||||||||
| 10.42* | Form of First Amendment to Employment Agreement with each of Donna C. Goodrich and Christopher L. Henson | |||||||||||||
| 10.43* | First Amendment to 2016 Employment Agreement with W. Bennett Bradley | |||||||||||||
| 10.44* | First Amendment to 2016 Employment Agreement with Jim. D. Godwin | |||||||||||||
| 10.45* | First Amendment to 2014 Employment Agreement with Robert J. Johnson, Jr. | |||||||||||||
| 10.46* | First Amendment to 2016 Employment Agreement with Brant J. Standridge | |||||||||||||
| 10.47* | First Amendment to 2016 Employment Agreement with David H. Weaver | |||||||||||||
Truist Financial Corporation 149
| Exhibit No. | Description | Location | ||||||||||||
| 10.48* | First Amendment to 2016 Employment Agreement with Dontá L. Wilson | |||||||||||||
| 10.49* | First Amendment to 2012 Employment Agreement with W. Rufus Yates | |||||||||||||
| 10.50* | Form of Synergy Incentive Award Letter with each of W. Bennett Bradley, Jim. D. Godwin, Robert J. Johnson, Jr. and W. Rufus Yates | |||||||||||||
| 10.51* | Form of Synergy Incentive Award Letter with each of Brant J. Standridge, David H. Weaver and Dontá L. Wilson | |||||||||||||
| 10.52* | SunTrust Banks, Inc. 2009 Stock Plan, as amended and restated as of August 11, 2015 | |||||||||||||
| 10.53* | Form of Nonqualified Stock Option Agreement | |||||||||||||
| 10.54* | Form of Performance-Vested Stock Option Agreement | |||||||||||||
| 10.55* | Form of Pro-Rata Nonqualified Stock Option Award Agreement | |||||||||||||
| 10.56* | Form of Non-Employee Director Restricted Stock Award Agreement | |||||||||||||
| 10.58* | Form of Non-Employee Director Restricted Stock Unit Award Agreement | |||||||||||||
| 10.59* | Form of Nonqualified Stock Option Award Agreement with clawback under the SunTrust Banks, Inc. 2009 Stock Plan | |||||||||||||
| 10.60* | Form of Restricted Stock Unit Agreement, 2016 Return on Tangible Common Equity | |||||||||||||
| 10.61* | Form of Restricted Stock Unit Agreement, 2016 Retention I | |||||||||||||
| 10.62* | Form of Restricted Stock Unit Agreement, 2016 Retention II | |||||||||||||
150 Truist Financial Corporation
| Exhibit No. | Description | Location | ||||||||||||
| 10.63* | Form of Restricted Stock Unit Award Agreement, 2016 ROTCE/TSR | |||||||||||||
| 10.64* | Form of Performance Vested Restricted Stock Unit Award Agreement, 2017, (ROTCE/TSR) | |||||||||||||
| 10.65* | Form of Time Vested Restricted Stock Unit Award Agreement, 2017, Type I (VIR) | |||||||||||||
| 10.66* | Form of Time Vested Restricted Stock Unit Award Agreement, 2017, Type II | |||||||||||||
| 10.67* | Form of Performance Vested Restricted Stock Unit Award Agreement, 2018, Type I | |||||||||||||
| 10.68* | Form of Time Vested Restricted Stock Unit Award Agreement, 2018, Type II | |||||||||||||
| 10.69* | Form of Time Vested Restricted Stock Unit Award Agreement, 2018, Type III | |||||||||||||
| 10.70* | Form of Time Vested Restricted Stock Unit Award Agreement, 2018, Type II | |||||||||||||
| 10.71 | Form of Time Vested Restricted Stock Unit Award Agreement, 2018, Type III | |||||||||||||
| 10.72* | Form of Time Vested Restricted Stock Unit Award Agreement, 2018, Type IV | |||||||||||||
| 10.73* | SunTrust Banks, Inc. ERISA Excess Retirement Plan, amended and restated effective as of January 1, 2011 | |||||||||||||
| 10.74* | Further amended by Amendment Number One, effective as of January 1, 2012 | |||||||||||||
| 10.75* | SunTrust Banks, Inc. ERISA Excess Retirement Plan, amended and restated effective as of January 1, 2011 | |||||||||||||
Truist Financial Corporation 151
| Exhibit No. | Description | Location | ||||||||||||
| 10.76* | Further amended by Amendment Number One, effective as of January 1, 2012 | |||||||||||||
| 10.77* | Executive Severance Plan, amended and restated January 1, 2019 | |||||||||||||
| 10.78* | SunTrust Banks, Inc. Deferred Compensation Plan, amended and restated effective as of January 1, 2015 | |||||||||||||
| 10.79* | SunTrust Banks, Inc. 401(k) Plan, amended and restated effective as of January 1, 2016 | |||||||||||||
| 10.80* | SunTrust Banks, Inc. 401(k) Plan Trust Agreement, amended and restated as of July 1, 2011 | |||||||||||||
| 10.81* | Master Agency Agreement, dated as of September 13, 2010 among SunTrust and SunTrust Robinson Humphrey, Inc. | |||||||||||||
| 10.82* | Amendment No. 1 to Master Agency Agreement | |||||||||||||
| 10.83* | The Agent Accession Letter, dated April 25, 2018, between SunTrust Banks, Inc. and Merrill Lynch, Pierce, Fenner & Smith Incorporated | |||||||||||||
| 10.84* | SunTrust Banks, Inc. 2018 Omnibus Incentive Compensation Plan | |||||||||||||
| 10.85* | Form of Non-employee Director Restricted Stock Award Agreement | |||||||||||||
| 10.86* | Form of Time-Vested Restricted Stock Unit Award Agreement, Type I | |||||||||||||
| 10.87* | Form of Time-Vested Restricted Stock Unit Award Agreement, Type II | |||||||||||||
| 10.88* | Form of Time-Vested Restricted Stock Unit Award Agreement, Type III | |||||||||||||
152 Truist Financial Corporation
| Exhibit No. | Description | Location | ||||||||||||
| 10.89* | Form of Time-Vested Restricted Stock Unit Award Agreement, Type IV | |||||||||||||
| 10.90* | 2019 Employment Agreement by and among BB&T Corporation, Branch Banking and Trust Company and William H. Rogers, Jr. | |||||||||||||
| 11 | Statement re computation of earnings per share. | |||||||||||||
| 21† | Subsidiaries of the Registrant. | |||||||||||||
| 23† | Consent of Independent Registered Public Accounting Firm. | |||||||||||||
| 31.1 | Certification of Chief Executive Officer pursuant to Rule 13a-14(a) or 15d-14(a) of the Exchange Act, as adopted pursuant to Section 302 of the Sarbanes-Oxley Act of 2002. | |||||||||||||
| 31.2 | Certification of Chief Financial Officer pursuant to Rule 13a-14(a) or 15d-14(a) of the Exchange Act, as adopted pursuant to Section 302 of the Sarbanes-Oxley Act of 2002. | |||||||||||||
| 32 | Certification of Chief Executive Officer and Chief Financial Officer pursuant to 18 U.S.C. Section 1350, as adopted pursuant to Section 906 of the Sarbanes-Oxley Act of 2002. | |||||||||||||
| 101.INS | XBRL Instance Document – the instance document does not appear in the interactive data file because its XBRL tags are embedded within the inline XBRL document. | Filed herewith. | ||||||||||||
| 101.SCH | XBRL Taxonomy Extension Schema. | Filed herewith. | ||||||||||||
| 101.CAL | XBRL Taxonomy Extension Calculation Linkbase. | Filed herewith. | ||||||||||||
| 101.LAB | XBRL Taxonomy Extension Label Linkbase. | Filed herewith. | ||||||||||||
| 101.PRE | XBRL Taxonomy Extension Presentation Linkbase. | Filed herewith. | ||||||||||||
| 101.DEF | XBRL Taxonomy Definition Linkbase. | Filed herewith. | ||||||||||||
| 104 | Cover Page Interactive Data File (formatted as inline XBRL with applicable taxonomy extension information contained in Exhibits101). | Filed herewith. | ||||||||||||
|
† Exhibit filed with the SEC and available upon request.
|
||||||||||||||
|
* Management compensatory plan or arrangement.
|
||||||||||||||
|
** Pursuant to Item 601(b)(2) of Regulation S-K, certain schedules and similar attachments have been omitted. The registrant hereby agrees to furnish a copy of any omitted schedule or similar attachment to the SEC upon request.
|
||||||||||||||
Truist Financial Corporation 153
SIGNATURES
Pursuant to the requirements of Section 13 or 15(d) of the Securities Exchange Act of 1934, the registrant has duly caused this report to be signed on its behalf by the undersigned, thereunto duly authorized, as of March 2, 2020:
| Truist Financial Corporation | ||||||||
| (Registrant) | ||||||||
| /s/ Kelly S. King | ||||||||
| Kelly S. King | ||||||||
| Chairman and Chief Executive Officer | ||||||||
Pursuant to the requirements of the Securities Exchange Act of 1934, this report has been signed below by the following persons on behalf of the registrant and in the capacities indicated:
| /s/ Kelly S. King | Chairman and Chief Executive Officer | March 2, 2020 | ||||||||||||
| Kelly S. King | ||||||||||||||
| /s/ William H. Rogers, Jr. | President and Chief Operating Officer | March 2, 2020 | ||||||||||||
| William H. Rogers, Jr. | ||||||||||||||
| /s/ Daryl N. Bible | Senior Executive Vice President and Chief Financial Officer | March 2, 2020 | ||||||||||||
| Daryl N. Bible | (Principal Financial Officer) | |||||||||||||
| /s/ Cynthia B. Powell | Executive Vice President and Corporate Controller | March 2, 2020 | ||||||||||||
| Cynthia B. Powell | (Principal Accounting Officer) | |||||||||||||
| /s/ Jennifer S. Banner | Director | March 2, 2020 | ||||||||||||
| Jennifer S. Banner | ||||||||||||||
| /s/ K. David Boyer, Jr. | Director | March 2, 2020 | ||||||||||||
| K. David Boyer, Jr. | ||||||||||||||
| /s/ Agnes Bundy Scanlan | Director | March 2, 2020 | ||||||||||||
| Agnes Bundy Scanlan | ||||||||||||||
| /s/ Anna R. Cablik | Director | March 2, 2020 | ||||||||||||
| Anna R. Cablik | ||||||||||||||
| /s/ Dallas S. Clement | Director | March 2, 2020 | ||||||||||||
| Dallas S. Clement | ||||||||||||||
| /s/ Paul D. Donahue | Director | March 2, 2020 | ||||||||||||
| Paul D. Donahue | ||||||||||||||
| Director | ||||||||||||||
| Paul R. Garcia | ||||||||||||||
| /s/ Patrick C. Graney III | Director | March 2, 2020 | ||||||||||||
| Patrick C. Graney III | ||||||||||||||
| /s/ Linnie M. Haynesworth | Director | March 2, 2020 | ||||||||||||
| Linnie M. Haynesworth | ||||||||||||||
| /s/ Easter A. Maynard | Director | March 2, 2020 | ||||||||||||
| Easter A. Maynard | ||||||||||||||
| /s/ Donna S. Morea | Director | March 2, 2020 | ||||||||||||
| Donna S. Morea | ||||||||||||||
| /s/ Charles A. Patton | Director | March 2, 2020 | ||||||||||||
| Charles A. Patton | ||||||||||||||
| /s/ Nido R. Qubein | Director | March 2, 2020 | ||||||||||||
| Nido R. Qubein | ||||||||||||||
154 Truist Financial Corporation
| /s/ David M. Racliffe | Director | March 2, 2020 | ||||||||||||
| David M. Racliffe | ||||||||||||||
| /s/ Frank P. Scruggs, Jr. | Director | March 2, 2020 | ||||||||||||
| Frank P. Scruggs, Jr. | ||||||||||||||
| /s/ Christine Sears | Director | March 2, 2020 | ||||||||||||
| Christine Sears | ||||||||||||||
| /s/ Thomas E. Skains | Director | March 2, 2020 | ||||||||||||
| Thomas E. Skains | ||||||||||||||
| /s/ Bruce L. Tanner | Director | March 2, 2020 | ||||||||||||
| Bruce L. Tanner | ||||||||||||||
| /s/ Thomas N. Thompson | Director | March 2, 2020 | ||||||||||||
| Thomas N. Thompson | ||||||||||||||
| /s/ Steven C. Voorhees | Director | March 2, 2020 | ||||||||||||
| Steven C. Voorhees | ||||||||||||||
TABLE OF CONTENTS
Item 1. BusinessItem 1A. Risk FactorsItem 2. PropertiesItem 5. Market For Registrant's Common Equity, Related Stockholder Matters and Issuer Purchases Of Equity SecuritiesItem 6. Selected Financial DataItem 7. Management's Discussion and Analysis Of Financial Condition and Results Of OperationsItem 9A. Controls and ProceduresItem 8. Financial Statements and Supplementary DataNote 1. Basis Of PresentationNote 2. Business CombinationsNote 3. Securities Financing ActivitiesNote 4. Investment SecuritiesNote 5. Loans and AclNote 6. Premises and EquipmentNote 7. Goodwill and Other Intangible AssetsNote 8. Loan ServicingNote 9. Other Assets and LiabilitiesNote 10. DepositsNote 11. BorrowingsNote 12. Shareholders' EquityNote 13. AociNote 14. Income TaxesNote 15. Benefit PlansNote 16. Commitments and ContingenciesNote 17. Regulatory Requirements and Other RestrictionsNote 18. Fair Value DisclosuresNote 19. Derivative Financial InstrumentsNote 20. Computation Of EpsNote 21. Operating SegmentsNote 22. Parent Company Financial InformationItem 15. Exhibits, Financial Statement Schedules