TRUIST FINANCIAL CORP
10-Ks and 10-Qs
|
|
|
|
|
|
|
|
|
|
|
|
|
|
|
|
|
|
|
|
|
|
|
|
|
|
|
|
|
|
|
|
|
|
|
|
|
|
|
|
|
|
|
|
|
|
|
|
|
|
|
|
|
|
|
|
UNITED STATES
SECURITIES AND EXCHANGE COMMISSION
Washington, D.C. 20549
_____________________________________________
FORM
10-Q
_____________________________________________
of the Securities Exchange Act of 1934
For the quarterly period ended:
September 30, 2020
Commission File Number:
1-10853
_____________________________
(Exact name of registrant as specified in its charter)
_____________________________________________
|
|
|
||||||||||
| (State or other jurisdiction of incorporation or organization) | (I.R.S. Employer Identification No.) | ||||||||||
|
|
|||||||||||
|
|
|
|
|||||||||
| (Address of principal executive offices) | (Zip Code) | ||||||||||
| Registrant's telephone number, including area code: |
|
|
|||||||||
_____________________________________________
Securities registered pursuant to Section 12(b) of the Act:
| Title of each class | Trading Symbol | Name of each exchange on which registered | ||||||||||||
|
|
|
|
||||||||||||
|
|
|
|
||||||||||||
|
|
|
|
||||||||||||
|
|
|
|
||||||||||||
|
|
|
|
||||||||||||
|
|
|
|
||||||||||||
|
|
|
|
||||||||||||
|
|
|
|
||||||||||||
Indicate by check mark whether the registrant (1) has filed all reports required to be filed by Section 13 or 15(d) of the Securities Exchange Act of 1934 during the preceding 12 months (or for such shorter period that the registrant was required to file such reports), and (2) has been subject to such filing requirements for the past 90 days.
Yes
☒
No
☐
Indicate by check mark whether the registrant has submitted electronically every Interactive Data File required to be submitted pursuant to Rule 405 of Regulation S-T (§232.405 of this chapter) during the preceding 12 months (or for such shorter period that the registrant was required to submit such files).
Yes
☒
No
☐
Indicate by check mark whether the registrant is a large accelerated filer, an accelerated filer, a non-accelerated filer, a smaller reporting company, or an emerging growth company. See the definitions of "large accelerated filer," "accelerated filer," "smaller reporting company" and "emerging growth company" in Rule 12b-2 of the Exchange Act.
|
|
☒ | Accelerated filer | ☐ | |||||||||||
| Non-accelerated filer | ☐ | Smaller reporting company |
|
|||||||||||
| Emerging growth company |
|
|||||||||||||
If an emerging growth company, indicate by check mark if the registrant has elected not to use the extended transition period for complying with any new or revised financial accounting standards provided pursuant to Section 13(a) of the Exchange Act.
☐
Indicate by check mark whether the registrant is a shell company (as defined in Rule 12b-2 of the Exchange Act). Yes
☐
No
☒
At September 30, 2020,
1,348,118,316
shares of the registrant's common stock, $5 par value, were outstanding.
| TABLE OF CONTENTS | ||||||||
| TRUIST FINANCIAL CORPORATION | ||||||||
| FORM 10-Q | ||||||||
| September 30, 2020 | ||||||||
| Page No. | ||||||||
| PART I - Financial Information | ||||||||
| Glossary of Defined Terms | ||||||||
| Forward-Looking Statements | ||||||||
| Item 1. | Financial Statements | |||||||
| Consolidated Balance Sheets (Unaudited) | ||||||||
| Consolidated Statements of Income (Unaudited) | ||||||||
| Consolidated Statements of Comprehensive Income (Unaudited) | ||||||||
| Consolidated Statements of Changes in Shareholders' Equity (Unaudited) | ||||||||
| Consolidated Statements of Cash Flows (Unaudited) | ||||||||
| Notes to Consolidated Financial Statements (Unaudited) | ||||||||
| Note 1. Basis of Presentation | ||||||||
| Note 2. Business Combinations | ||||||||
| Note 3. Securities Financing Activities | ||||||||
| Note 4. Investment Securities | ||||||||
| Note 5. Loans and ACL | ||||||||
| Note 6. Goodwill and Other Intangible Assets | ||||||||
| Note 7. Loan Servicing | ||||||||
| Note 8. Other Assets and Liabilities | ||||||||
| Note 9. Borrowings | ||||||||
| Note 10. Shareholders' Equity | ||||||||
| Note 11. AOCI | ||||||||
| Note 12. Income Taxes | ||||||||
| Note 13. Benefit Plans | ||||||||
| Note 14. Commitments and Contingencies | ||||||||
| Note 15. Fair Value Disclosures | ||||||||
| Note 16. Derivative Financial Instruments | ||||||||
| Note 17. Computation of EPS | ||||||||
| Note 18. Operating Segments | ||||||||
| Item 2. | Management's Discussion and Analysis of Financial Condition and Results of Operations | |||||||
| Item 3. | Quantitative and Qualitative Disclosures About Market Risk (see Market Risk Management in MD&A) | |||||||
| Item 4. | Controls and Procedures | |||||||
| PART II - Other Information | ||||||||
| Item 1. | Legal Proceedings | |||||||
| Item 1A. | Risk Factors | |||||||
| Item 2. | Unregistered Sales of Equity Securities and Use of Proceeds | |||||||
| Item 3. | Defaults Upon Senior Securities - (none) | |||||||
| Item 4. | Mine Safety Disclosures - (not applicable) | |||||||
| Item 5. | Other Information - (none to be reported) | |||||||
| Item 6. | Exhibits | |||||||
Glossary of Defined Terms
The following terms may be used throughout this report, including the consolidated financial statements and related notes.
| Term | Definition | ||||
|
ACL
|
Allowance for credit losses
|
||||
|
AFS
|
Available-for-sale
|
||||
|
Agency MBS
|
Mortgage-backed securities issued by a U.S. government agency or GSE
|
||||
|
ALLL
|
Allowance for loan and lease losses
|
||||
| ALM | Asset/Liability management | ||||
|
ARRC
|
Alternative Reference Rates Committee of the FRB and the Federal Reserve Bank of New York
|
||||
|
AOCI
|
Accumulated other comprehensive income (loss)
|
||||
| Basel III Rules | Rules issued by the FRB, OCC and FDIC on capital adequacy and liquidity requirements in the U.S for banking organizations. | ||||
|
BB&T
|
BB&T Corporation and subsidiaries (changed to "Truist Financial Corporation" effective with the Merger)
|
||||
|
BHC
|
Bank holding company
|
||||
| Board | Truist's Board of Directors | ||||
|
C&CB
|
Corporate and Commercial Banking, an operating segment
|
||||
| CARES Act | The Coronavirus Aid, Relief, and Economic Security Act | ||||
|
CB&W
|
Consumer Banking and Wealth, an operating segment
|
||||
|
CCAR
|
Comprehensive Capital Analysis and Review
|
||||
|
CD
|
Certificate of deposit
|
||||
|
CDI
|
Core deposit intangible | ||||
| CECL | Current expected credit loss model | ||||
|
CEO
|
Chief Executive Officer
|
||||
|
CFO
|
Chief Financial Officer
|
||||
|
CET1
|
Common equity tier 1
|
||||
| CIB | Corporate and Investment Banking | ||||
|
Company
|
Truist Financial Corporation and its subsidiaries (interchangeable with "Truist" below), formerly BB&T Corporation
|
||||
| COVID-19 | Coronavirus disease 2019 | ||||
|
CRE
|
Commercial real estate
|
||||
|
CRO
|
Chief Risk Officer
|
||||
|
EPS
|
Earnings per common share
|
||||
|
EVE
|
Economic value of equity
|
||||
|
Exchange Act
|
Securities Exchange Act of 1934, as amended
|
||||
|
FASB
|
Financial Accounting Standards Board
|
||||
|
FDIC
|
Federal Deposit Insurance Corporation
|
||||
|
FHA
|
Federal Housing Administration
|
||||
|
FHLB
|
Federal Home Loan Bank
|
||||
|
FHLMC
|
Federal Home Loan Mortgage Corporation
|
||||
|
FNMA
|
Federal National Mortgage Association
|
||||
|
FRB
|
Board of Governors of the Federal Reserve System
|
||||
|
GAAP
|
Accounting principles generally accepted in the United States of America
|
||||
| GDP | Gross Domestic Product | ||||
|
GNMA
|
Government National Mortgage Association
|
||||
|
Grandbridge
|
Grandbridge Real Estate Capital, LLC
|
||||
|
GSE
|
U.S. government-sponsored enterprise
|
||||
|
HFI
|
Held for investment
|
||||
|
HTM
|
Held-to-maturity
|
||||
|
IH
|
Insurance Holdings, an operating segment
|
||||
|
IPV
|
Independent price verification
|
||||
|
IRS
|
Internal Revenue Service
|
||||
|
LCR
|
Liquidity Coverage Ratio
|
||||
|
LHFS
|
Loans held for sale
|
||||
|
LIBOR
|
London Interbank Offered Rate
|
||||
| LOCOM | Lower of cost or market | ||||
| Market Risk Rule |
Market risk capital requirements issued jointly by the OCC, U.S. Treasury, FRB, and FDIC
|
||||
|
MBS
|
Mortgage-backed securities
|
||||
| MD&A | Management's Discussion and Analysis of Financial Condition and Results of Operations | ||||
| Merger | Merger of BB&T and SunTrust effective December 6, 2019 | ||||
Truist Financial Corporation 1
| Term | Definition | ||||
|
MRLCC
|
Market Risk, Liquidity and Capital Committee
|
||||
|
MRM
|
Model Risk Management
|
||||
|
MSR
|
Mortgage servicing right
|
||||
|
N/A
|
Not applicable | ||||
|
NIM
|
Net interest margin, computed on a TE basis
|
||||
|
NM
|
Not meaningful
|
||||
|
NPA
|
Nonperforming asset
|
||||
|
NPL
|
Nonperforming loan
|
||||
|
NSFR
|
Net stable funding ratio
|
||||
|
NYSE
|
New York Stock Exchange
|
||||
|
OAS
|
Option adjusted spread
|
||||
| OCC | Office of the Comptroller of the Currency | ||||
|
OCI
|
Other comprehensive income (loss)
|
||||
|
OPEB
|
Other post-employment benefit
|
||||
|
OREO
|
Other real estate owned
|
||||
|
OT&C
|
Other, Treasury and Corporate
|
||||
| OTC | Over-the-counter | ||||
|
Parent Company
|
Truist Financial Corporation, the parent company of Truist Bank and other subsidiaries
|
||||
|
PCD
|
Purchased credit deteriorated loans
|
||||
|
PCI
|
Purchased credit impaired loans
|
||||
| PPP | Paycheck Protection Program, established by the CARES Act | ||||
|
PSU
|
Performance share units | ||||
|
Re-REMICs
|
Re-securitizations of Real Estate Mortgage Investment Conduits
|
||||
|
ROU assets
|
Right-of-use assets
|
||||
| RSA | Restricted stock award | ||||
|
RSU
|
Restricted stock unit
|
||||
|
RUFC
|
Reserve for unfunded lending commitments
|
||||
|
SBIC
|
Small Business Investment Company
|
||||
|
SEC
|
Securities and Exchange Commission
|
||||
|
Short-Term Borrowings
|
Federal funds purchased, securities sold under repurchase agreements and other short-term borrowed funds with original maturities of less than one year
|
||||
| SOFR |
Secured Overnight Financing Rate
|
||||
| SCB | Stress Capital Buffer | ||||
| SunTrust |
SunTrust Banks, Inc.
|
||||
|
TDR
|
Troubled debt restructuring
|
||||
|
TE
|
Taxable-equivalent
|
||||
| TRS | Total Return Swap | ||||
|
Truist
|
Truist Financial Corporation and its subsidiaries (interchangeable with the "Company" above), formerly BB&T Corporation
|
||||
| Truist Bank | Truist Bank, formerly Branch Banking and Trust Company | ||||
|
U.S.
|
United States of America
|
||||
|
U.S. Treasury
|
United States Department of the Treasury
|
||||
|
UPB
|
Unpaid principal balance
|
||||
| VA |
United States Department of the Veterans Affairs
|
||||
|
VaR
|
Value-at-risk
|
||||
| VIE |
Variable interest entity
|
||||
2 Truist Financial Corporation
Forward-Looking Statements
This Quarterly Report on Form 10-Q contains "forward-looking statements" within the meaning of the Private Securities Litigation Reform Act of 1995, regarding the financial condition, results of operations, business plans and the future performance of Truist. Words such as "anticipates," "believes," "estimates," "expects," "forecasts," "intends," "plans," "projects," "may," "will," "should," “would," "could" and other similar expressions are intended to identify these forward-looking statements.
Forward-looking statements are not based on historical facts but instead represent management's expectations and assumptions regarding Truist's business, the economy and other future conditions. Such statements involve inherent uncertainties, risks and changes in circumstances that are difficult to predict. As such, Truist’s actual results may differ materially from those contemplated by forward-looking statements. While there can be no assurance that any list of risks and uncertainties or risk factors is complete, important factors that could cause actual results to differ materially from those contemplated by forward-looking statements include the following, without limitation, as well as the risks and uncertainties more fully discussed under Part II, Item 1A-Risk Factors and in Truist’s Form 10-K for the year ended December 31, 2019:
| • | the COVID-19 pandemic has disrupted the global economy, adversely impacted Truist’s financial condition and results of operations, including through increased expenses, reduced fee income and net interest margin and increases in the allowance for credit losses, and continuation of current conditions could worsen these impacts and also adversely affect Truist’s capital and liquidity position or cost of capital, impair the ability of borrowers to repay outstanding loans, cause an outflow of deposits, and impair goodwill or other assets; | ||||
| • | risks and uncertainties relating to the merger of BB&T and SunTrust ("Merger"), including the ability to successfully integrate the companies or to realize the anticipated benefits of the Merger; | ||||
| • | expenses relating to the Merger and integration of heritage BB&T and heritage SunTrust; | ||||
| • | deposit attrition, client loss or revenue loss following completed mergers or acquisitions may be greater than anticipated; | ||||
| • | changes in the interest rate environment, including the replacement of LIBOR as an interest rate benchmark, which could adversely affect Truist’s revenue and expenses, the value of assets and obligations, and the availability and cost of capital, cash flows, and liquidity; | ||||
| • | volatility in mortgage production and servicing revenues, and changes in carrying values of Truist’s servicing assets and mortgages held for sale due to changes in interest rates; | ||||
| • | management’s ability to effectively manage credit risk; | ||||
| • | inability to access short-term funding or liquidity; | ||||
| • | loss of client deposits, which could increase Truist’s funding costs; | ||||
| • | changes in Truist’s credit ratings, which could increase the cost of funding or limit access to capital markets; | ||||
| • | additional capital and liquidity requirements; | ||||
| • | regulatory matters, litigation or other legal actions, which may result in, among other things, costs, fines, penalties, restrictions on Truist’s business activities, reputational harm, or other adverse consequences; | ||||
| • | risks related to originating and selling mortgages, including repurchase and indemnity demands from purchasers related to representations and warranties on loans sold, which could result in an increase in the amount of losses for loan repurchases; | ||||
| • | failure to execute on strategic or operational plans, including the ability to successfully complete and/or integrate mergers and acquisitions; | ||||
| • | risks relating to Truist’s role as a servicer of loans, including an increase in the scope or costs of the services Truist is required to perform without any corresponding increase in Truist’s servicing fee, or a breach of Truist’s obligations as servicer; | ||||
| • | negative public opinion, which could damage Truist’s reputation; | ||||
| • | increased scrutiny regarding Truist’s consumer sales practices, training practices, incentive compensation design and governance; | ||||
| • | competition from new or existing competitors, including increased competition from products and services offered by non-bank financial technology companies, may reduce Truist’s client base, cause Truist to lower prices for its products and services in order to maintain market share or otherwise adversely impact Truist’s businesses or results of operations; | ||||
| • | Truist’s ability to introduce new products and services in response to industry trends or developments in technology that achieve market acceptance and regulatory approval; | ||||
| • | Truist’s success depends on the expertise of key personnel, and if these individuals leave or change their roles without effective replacements, Truist's operations and integration activities could be adversely impacted. This could be exacerbated as Truist continues to integrate the management teams of heritage BB&T and heritage SunTrust, or if the organization is unable to hire and retain qualified personnel; | ||||
| • | legislative, regulatory or accounting changes may adversely affect the businesses in which Truist is engaged; | ||||
| • | evolving regulatory standards, including with respect to capital and liquidity requirements, and results of regulatory examinations, may adversely affect Truist's financial condition and results of operations; | ||||
| • | accounting policies and processes require management to make estimates about matters that are uncertain; | ||||
| • | general economic or business conditions, either nationally or regionally, may be less favorable than expected, resulting in, among other things, slower deposit or asset growth, a deterioration in credit quality or a reduced demand for credit, insurance or other services; | ||||
| • | risk management oversight functions may not identify or address risks adequately; | ||||
| • | unfavorable resolution of legal proceedings or other claims or regulatory or other governmental investigations or inquiries could result in negative publicity, protests, fines, penalties, restrictions on Truist's operations or ability to expand its business or other negative consequences, all of which could cause reputational damage and adversely impact Truist's financial condition and results of operations; | ||||
| • | competitors of Truist may have greater financial resources or develop products that enable them to compete more successfully than Truist and may be subject to different regulatory standards than Truist; | ||||
| • | failure to maintain or enhance Truist’s competitive position with respect to technology, whether it fails to anticipate client expectations or because its technological developments fail to perform as desired or are not rolled out in a timely manner or for other reasons, may cause Truist to lose market share or incur additional expense; | ||||
| • | fraud or misconduct by internal or external parties, which Truist may not be able to prevent, detect or mitigate; | ||||
| • | operational or communications systems, including systems used by vendors or other external parties, may fail or may be the subject of a breach or cyber-attack that, if successful, could adversely impact Truist's financial condition and results of operations; | ||||
| • | security risks, including denial of service attacks, hacking, social engineering attacks targeting Truist’s employees and clients, malware intrusion or data corruption attempts, and identity theft could result in the disclosure of confidential information, adversely affect Truist’s business or reputation or create significant legal or financial exposure; | ||||
| • | natural or other disasters, including acts of terrorism and pandemics, could have an adverse effect on Truist, including a material disruption of Truist's operations or the ability or willingness of clients to access Truist's products and services; | ||||
| • | widespread system outages, caused by the failure of critical internal systems or critical services provided by third parties could adversely impact Truist's financial condition and results of operations; and | ||||
| • | depressed market values for Truist’s stock and adverse economic conditions sustained over a period of time may require a write down to goodwill. | ||||
Truist Financial Corporation 3
ITEM 1. FINANCIAL STATEMENTS
CONSOLIDATED BALANCE SHEETS
TRUIST FINANCIAL CORPORATION AND SUBSIDIARIES
|
Unaudited
(Dollars in millions, except per share data, shares in thousands) |
September 30, 2020 | December 31, 2019 | |||||||||
| Assets | |||||||||||
| Cash and due from banks | $ |
|
$ |
|
|||||||
| Interest-bearing deposits with banks |
|
|
|||||||||
| Securities borrowed or purchased under resale agreements |
|
|
|||||||||
| Trading assets at fair value |
|
|
|||||||||
| AFS securities at fair value |
|
|
|||||||||
| LHFS (including $5,369 and $5,673 at fair value, respectively) |
|
|
|||||||||
| Loans and leases |
|
|
|||||||||
| ALLL |
(
|
(
|
|||||||||
| Loans and leases, net of ALLL |
|
|
|||||||||
| Premises and equipment |
|
|
|||||||||
| Goodwill |
|
|
|||||||||
| CDI and other intangible assets |
|
|
|||||||||
| MSRs (including $1,991 and $2,618 at fair value, respectively) |
|
|
|||||||||
| Other assets (including $4,914 and $3,310 at fair value, respectively) |
|
|
|||||||||
| Total assets | $ |
|
$ |
|
|||||||
| Liabilities | |||||||||||
| Noninterest-bearing deposits | $ |
|
$ |
|
|||||||
| Interest-bearing deposits |
|
|
|||||||||
| Short-term borrowings (including $1,060 and $1,074 at fair value, respectively) |
|
|
|||||||||
| Long-term debt |
|
|
|||||||||
| Other liabilities (including $403 and $366 at fair value, respectively) |
|
|
|||||||||
| Total liabilities |
|
|
|||||||||
| Shareholders' Equity | |||||||||||
| Preferred stock, $5 par value, liquidation preference of $25,000 per share |
|
|
|||||||||
| Common stock, $5 par value |
|
|
|||||||||
| Additional paid-in capital |
|
|
|||||||||
| Retained earnings |
|
|
|||||||||
| AOCI, net of deferred income taxes |
|
(
|
|||||||||
| Noncontrolling interests |
|
|
|||||||||
| Total shareholders' equity |
|
|
|||||||||
| Total liabilities and shareholders' equity | $ |
|
$ |
|
|||||||
| Common shares outstanding |
|
|
|||||||||
| Common shares authorized |
|
|
|||||||||
| Preferred shares outstanding |
|
|
|||||||||
| Preferred shares authorized |
|
|
|||||||||
The accompanying notes are an integral part of these consolidated financial statements.
4 Truist Financial Corporation
CONSOLIDATED STATEMENTS OF INCOME
TRUIST FINANCIAL CORPORATION AND SUBSIDIARIES
|
Unaudited
(Dollars in millions, except per share data, shares in thousands) |
Three Months Ended September 30, | Nine Months Ended September 30, | ||||||||||||||||||||||||
| 2020 | 2019 | 2020 | 2019 | |||||||||||||||||||||||
| Interest Income | ||||||||||||||||||||||||||
| Interest and fees on loans and leases | $ |
|
$ |
|
$ |
|
$ |
|
||||||||||||||||||
| Interest on securities |
|
|
|
|
||||||||||||||||||||||
| Interest on other earning assets |
|
|
|
|
||||||||||||||||||||||
| Total interest income |
|
|
|
|
||||||||||||||||||||||
| Interest Expense | ||||||||||||||||||||||||||
| Interest on deposits |
|
|
|
|
||||||||||||||||||||||
| Interest on long-term debt |
|
|
|
|
||||||||||||||||||||||
| Interest on other borrowings |
|
|
|
|
||||||||||||||||||||||
| Total interest expense |
|
|
|
|
||||||||||||||||||||||
| Net Interest Income |
|
|
|
|
||||||||||||||||||||||
| Provision for credit losses |
|
|
|
|
||||||||||||||||||||||
| Net Interest Income After Provision for Credit Losses |
|
|
|
|
||||||||||||||||||||||
| Noninterest Income | ||||||||||||||||||||||||||
| Insurance income |
|
|
|
|
||||||||||||||||||||||
| Service charges on deposits |
|
|
|
|
||||||||||||||||||||||
| Wealth management income |
|
|
|
|
||||||||||||||||||||||
| Card and payment related fees |
|
|
|
|
||||||||||||||||||||||
| Residential mortgage income |
|
|
|
|
||||||||||||||||||||||
| Investment banking and trading income |
|
|
|
|
||||||||||||||||||||||
| Operating lease income |
|
|
|
|
||||||||||||||||||||||
| Income from bank-owned life insurance |
|
|
|
|
||||||||||||||||||||||
| Lending related fees |
|
|
|
|
||||||||||||||||||||||
| Commercial real estate related income |
|
|
|
|
||||||||||||||||||||||
| Securities gains (losses) |
|
|
|
|
||||||||||||||||||||||
| Other income (loss) |
|
|
|
|
||||||||||||||||||||||
| Total noninterest income |
|
|
|
|
||||||||||||||||||||||
| Noninterest Expense | ||||||||||||||||||||||||||
| Personnel expense |
|
|
|
|
||||||||||||||||||||||
| Net occupancy expense |
|
|
|
|
||||||||||||||||||||||
| Professional fees and outside processing |
|
|
|
|
||||||||||||||||||||||
| Software expense |
|
|
|
|
||||||||||||||||||||||
| Equipment expense |
|
|
|
|
||||||||||||||||||||||
| Marketing and customer development |
|
|
|
|
||||||||||||||||||||||
| Operating lease depreciation |
|
|
|
|
||||||||||||||||||||||
| Loan-related expense |
|
|
|
|
||||||||||||||||||||||
| Amortization of intangibles |
|
|
|
|
||||||||||||||||||||||
| Regulatory costs |
|
|
|
|
||||||||||||||||||||||
| Merger-related and restructuring charges |
|
|
|
|
||||||||||||||||||||||
| Loss (gain) on early extinguishment of debt |
|
|
|
|
||||||||||||||||||||||
| Other expense |
|
|
|
|
||||||||||||||||||||||
| Total noninterest expense |
|
|
|
|
||||||||||||||||||||||
| Earnings | ||||||||||||||||||||||||||
| Income before income taxes |
|
|
|
|
||||||||||||||||||||||
| Provision for income taxes |
|
|
|
|
||||||||||||||||||||||
| Net income |
|
|
|
|
||||||||||||||||||||||
| Noncontrolling interests |
|
|
|
|
||||||||||||||||||||||
| Net income available to the bank holding company |
|
|
|
|
||||||||||||||||||||||
| Dividends on preferred stock |
|
|
|
|
||||||||||||||||||||||
| Net income available to common shareholders | $ |
|
$ |
|
$ |
|
$ |
|
||||||||||||||||||
| Basic EPS | $ |
|
$ |
|
$ |
|
$ |
|
||||||||||||||||||
| Diluted EPS |
|
|
|
|
||||||||||||||||||||||
| Basic weighted average shares outstanding |
|
|
|
|
||||||||||||||||||||||
| Diluted weighted average shares outstanding |
|
|
|
|
||||||||||||||||||||||
The accompanying notes are an integral part of these consolidated financial statements.
Truist Financial Corporation 5
CONSOLIDATED STATEMENTS OF COMPREHENSIVE INCOME
TRUIST FINANCIAL CORPORATION AND SUBSIDIARIES
|
Unaudited
(Dollars in millions) |
Three Months Ended September 30, | Nine Months Ended September 30, | |||||||||||||||||||||
| 2020 | 2019 | 2020 | 2019 | ||||||||||||||||||||
| Net income | $ |
|
$ |
|
$ |
|
$ |
|
|||||||||||||||
| OCI, net of tax: | |||||||||||||||||||||||
| Change in unrecognized net pension and postretirement costs |
(
|
(
|
|
(
|
|||||||||||||||||||
| Change in unrealized net gains (losses) on cash flow hedges |
|
|
|
(
|
|||||||||||||||||||
| Change in unrealized net gains (losses) on AFS securities |
(
|
|
|
|
|||||||||||||||||||
| Other, net |
|
|
(
|
|
|||||||||||||||||||
| Total OCI, net of tax |
(
|
|
|
|
|||||||||||||||||||
| Total comprehensive income | $ |
|
$ |
|
$ |
|
$ |
|
|||||||||||||||
| Income Tax Effect of Items Included in OCI: | |||||||||||||||||||||||
| Change in unrecognized net pension and postretirement costs | $ |
(
|
$ |
(
|
$ |
|
$ |
|
|||||||||||||||
| Change in unrealized net gains (losses) on cash flow hedges |
|
|
|
(
|
|||||||||||||||||||
| Change in unrealized net gains (losses) on AFS securities |
(
|
|
|
|
|||||||||||||||||||
| Other, net |
|
(
|
|
|
|||||||||||||||||||
The accompanying notes are an integral part of these consolidated financial statements.
6 Truist Financial Corporation
CONSOLIDATED STATEMENTS OF CHANGES IN SHAREHOLDERS' EQUITY
TRUIST FINANCIAL CORPORATION AND SUBSIDIARIES
|
Unaudited
(Dollars in millions, shares in thousands) |
Shares of Common Stock | Preferred Stock | Common Stock | Additional Paid-In Capital | Retained Earnings | AOCI | Noncontrolling Interests | Total Shareholders' Equity | |||||||||||||||||||||||||||||||||||||||
| Balance, July 1, 2019 |
|
$ |
|
$ |
|
$ |
|
$ |
|
$ |
(
|
$ |
|
$ |
|
||||||||||||||||||||||||||||||||
| Net income | — | — | — | — |
|
— |
|
|
|||||||||||||||||||||||||||||||||||||||
| OCI | — | — | — | — | — |
|
— |
|
|||||||||||||||||||||||||||||||||||||||
| Issued in connection with equity awards, net |
|
— |
|
|
— | — | — |
|
|||||||||||||||||||||||||||||||||||||||
| Issued in connection with preferred stock offerings | — |
|
— | — | — | — | — |
|
|||||||||||||||||||||||||||||||||||||||
| Redemption of preferred stock | — |
(
|
— | — |
(
|
— | — |
(
|
|||||||||||||||||||||||||||||||||||||||
| Cash dividends declared on common stock | — | — | — | — |
(
|
— | — |
(
|
|||||||||||||||||||||||||||||||||||||||
| Cash dividends declared on preferred stock | — | — | — | — |
(
|
— | — |
(
|
|||||||||||||||||||||||||||||||||||||||
| Equity-based compensation expense | — | — | — |
|
— | — | — |
|
|||||||||||||||||||||||||||||||||||||||
| Other, net | — | — | — | — | — | — |
|
|
|||||||||||||||||||||||||||||||||||||||
| Balance, September 30, 2019 |
|
$ |
|
$ |
|
$ |
|
$ |
|
$ |
(
|
$ |
|
$ |
|
||||||||||||||||||||||||||||||||
| Balance, July 1, 2020 |
|
$ |
|
$ |
|
$ |
|
$ |
|
$ |
|
$ |
|
$ |
|
||||||||||||||||||||||||||||||||
| Net income | — | — | — | — |
|
— |
|
|
|||||||||||||||||||||||||||||||||||||||
| OCI | — | — | — | — | — |
(
|
— |
(
|
|||||||||||||||||||||||||||||||||||||||
| Issued in connection with equity awards, net |
|
— |
|
(
|
— | — | — |
(
|
|||||||||||||||||||||||||||||||||||||||
| Issued in connection with preferred stock offerings | — |
|
— | — | — | — | — |
|
|||||||||||||||||||||||||||||||||||||||
| Cash dividends declared on common stock | — | — | — | — |
(
|
— | — |
(
|
|||||||||||||||||||||||||||||||||||||||
| Cash dividends declared on preferred stock | — | — | — | — |
(
|
— | — |
(
|
|||||||||||||||||||||||||||||||||||||||
| Equity-based compensation expense | — | — | — |
|
— | — | — |
|
|||||||||||||||||||||||||||||||||||||||
| Other, net | — | — | — | — | — | — |
(
|
(
|
|||||||||||||||||||||||||||||||||||||||
| Balance, September 30, 2020 |
|
$ |
|
$ |
|
$ |
|
$ |
|
$ |
|
$ |
|
$ |
|
||||||||||||||||||||||||||||||||
| Balance, January 1, 2019 |
|
$ |
|
$ |
|
$ |
|
$ |
|
$ |
(
|
$ |
|
$ |
|
||||||||||||||||||||||||||||||||
| Net income | — | — | — | — |
|
— |
|
|
|||||||||||||||||||||||||||||||||||||||
| OCI | — | — | — | — | — |
|
— |
|
|||||||||||||||||||||||||||||||||||||||
| Issued in connection with equity awards, net |
|
— |
|
(
|
— | — | — |
(
|
|||||||||||||||||||||||||||||||||||||||
| Issued in connection with preferred stock offerings | — |
|
— | — | — | — | — |
|
|||||||||||||||||||||||||||||||||||||||
| Redemption of preferred stock | — |
(
|
— | — |
(
|
— | — |
(
|
|||||||||||||||||||||||||||||||||||||||
| Cash dividends declared on common stock | — | — | — | — |
(
|
— | — |
(
|
|||||||||||||||||||||||||||||||||||||||
| Cash dividends declared on preferred stock | — | — | — | — |
(
|
— | — |
(
|
|||||||||||||||||||||||||||||||||||||||
| Equity-based compensation expense | — | — | — |
|
— | — | — |
|
|||||||||||||||||||||||||||||||||||||||
| Other, net | — | — | — |
|
(
|
— |
|
(
|
|||||||||||||||||||||||||||||||||||||||
| Balance, September 30, 2019 |
|
$ |
|
$ |
|
$ |
|
$ |
|
$ |
(
|
$ |
|
$ |
|
||||||||||||||||||||||||||||||||
| Balance, January 1, 2020 |
|
$ |
|
$ |
|
$ |
|
$ |
|
$ |
(
|
$ |
|
$ |
|
||||||||||||||||||||||||||||||||
| Net income | — | — | — | — |
|
— |
|
|
|||||||||||||||||||||||||||||||||||||||
| OCI | — | — | — | — | — |
|
— |
|
|||||||||||||||||||||||||||||||||||||||
| Issued in connection with equity awards, net |
|
— |
|
(
|
(
|
— | — |
(
|
|||||||||||||||||||||||||||||||||||||||
| Issued in connection with preferred stock offerings | — |
|
— | — | — | — | — |
|
|||||||||||||||||||||||||||||||||||||||
| Redemption of preferred stock | — |
(
|
— | — |
|
— | — |
(
|
|||||||||||||||||||||||||||||||||||||||
| Cash dividends declared on common stock | — | — | — | — |
(
|
— | — |
(
|
|||||||||||||||||||||||||||||||||||||||
| Cash dividends declared on preferred stock | — | — | — | — |
(
|
— | — |
(
|
|||||||||||||||||||||||||||||||||||||||
| Equity-based compensation expense | — | — | — |
|
— | — | — |
|
|||||||||||||||||||||||||||||||||||||||
| Cumulative effect adjustment for new accounting standards | — | — | — | — |
(
|
— | — |
(
|
|||||||||||||||||||||||||||||||||||||||
| Other, net | — | — | — | — | — | — |
(
|
(
|
|||||||||||||||||||||||||||||||||||||||
| Balance, September 30, 2020 |
|
$ |
|
$ |
|
$ |
|
$ |
|
$ |
|
$ |
|
$ |
|
||||||||||||||||||||||||||||||||
The accompanying notes are an integral part of these consolidated financial statements.
Truist Financial Corporation 7
CONSOLIDATED STATEMENTS OF CASH FLOWS
TRUIST FINANCIAL CORPORATION AND SUBSIDIARIES
|
Unaudited
Nine Months Ended September 30, (Dollars in millions) |
2020 | 2019 | ||||||||||||
| Cash Flows From Operating Activities: | ||||||||||||||
| Net income | $ |
|
$ |
|
||||||||||
| Adjustments to reconcile net income to net cash from operating activities: | ||||||||||||||
| Provision for credit losses |
|
|
||||||||||||
| Depreciation |
|
|
||||||||||||
| Amortization of intangibles |
|
|
||||||||||||
| Equity-based compensation expense |
|
|
||||||||||||
| Securities gains (losses) |
(
|
|
||||||||||||
| Net change in operating assets and liabilities: | ||||||||||||||
| LHFS |
|
(
|
||||||||||||
| MSRs |
|
|
||||||||||||
| Pension asset |
(
|
(
|
||||||||||||
| Derivative assets and liabilities |
(
|
(
|
||||||||||||
| Trading assets |
|
(
|
||||||||||||
| Other assets and other liabilities |
(
|
(
|
||||||||||||
| Other, net |
(
|
|
||||||||||||
| Net cash from operating activities |
|
|
||||||||||||
| Cash Flows From Investing Activities: | ||||||||||||||
| Proceeds from sales of AFS securities |
|
|
||||||||||||
| Proceeds from maturities, calls and paydowns of AFS securities |
|
|
||||||||||||
| Purchases of AFS securities |
(
|
(
|
||||||||||||
| Proceeds from maturities, calls and paydowns of HTM securities |
|
|
||||||||||||
| Originations and purchases of loans and leases, net of sales and principal collected |
(
|
(
|
||||||||||||
| Net cash received (paid) for FHLB stock |
|
(
|
||||||||||||
| Net cash received (paid) for securities borrowed or purchased under resale agreements |
|
|
||||||||||||
| Net cash paid for premises and equipment |
(
|
(
|
||||||||||||
| Net cash received (paid) for mergers, acquisitions and divestitures |
(
|
(
|
||||||||||||
| Other, net |
|
|
||||||||||||
| Net cash from investing activities |
(
|
(
|
||||||||||||
| Cash Flows From Financing Activities: | ||||||||||||||
| Net change in deposits |
|
|
||||||||||||
| Net change in short-term borrowings |
(
|
|
||||||||||||
| Proceeds from issuance of long-term debt |
|
|
||||||||||||
| Repayment of long-term debt |
(
|
(
|
||||||||||||
| Net proceeds from preferred stock issued |
|
|
||||||||||||
| Redemption of preferred stock |
(
|
(
|
||||||||||||
| Cash dividends paid on common stock |
(
|
(
|
||||||||||||
| Cash dividends paid on preferred stock |
(
|
(
|
||||||||||||
| Net cash received (paid) for hedge unwinds |
|
(
|
||||||||||||
| Other, net |
(
|
(
|
||||||||||||
| Net cash from financing activities |
|
|
||||||||||||
| Net Change in Cash and Cash Equivalents |
|
(
|
||||||||||||
| Cash and Cash Equivalents, January 1 |
|
|
||||||||||||
| Cash and Cash Equivalents, September 30 | $ |
|
$ |
|
||||||||||
| Supplemental Disclosure of Cash Flow Information: | ||||||||||||||
| Net cash paid (received) during the period for: | ||||||||||||||
| Interest expense | $ |
|
$ |
|
||||||||||
| Income taxes |
|
|
||||||||||||
The accompanying notes are an integral part of these consolidated financial statements.
8 Truist Financial Corporation
NOTE 1.
Basis of Presentation
General
See the Glossary of Defined Terms at the beginning of this Report for terms used herein. These consolidated financial statements and notes are presented in accordance with the instructions for Form 10-Q and, therefore, do not include all information and notes necessary for a complete presentation of financial position, results of operations and cash flow activity required in accordance with GAAP. In the opinion of management, all normal recurring adjustments necessary for a fair statement of the consolidated financial position and consolidated results of operations have been made. The year-end consolidated balance sheet data was derived from audited financial statements but does not include all disclosures required by GAAP. The information contained in the financial statements and notes included in the Annual Report on Form 10-K for the year ended December 31, 2019 should be referred to in connection with these unaudited interim consolidated financial statements. The Company updated its accounting policies in connection with recently adopted accounting standards. There were no other significant changes to the Company’s accounting policies from those disclosed in the Annual Report on Form 10-K for the year ended December 31, 2019 that could have a material effect on the Company’s financial statements.
Reclassifications
Certain amounts reported in prior periods' consolidated financial statements have been reclassified to conform to the current presentation.
Use of Estimates in the Preparation of Financial Statements
The preparation of financial statements in conformity with GAAP requires management to make estimates and assumptions that affect the reported amounts of assets and liabilities and disclosure of contingent assets and liabilities as of the date of the financial statements and the reported amounts of revenues and expenses. Actual results could differ from those estimates. Material estimates that are particularly susceptible to significant change include the determination of the ACL; determination of fair value for financial instruments; valuation of MSRs; goodwill, intangible assets and other purchase accounting related adjustments; benefit plan obligations and expenses; and tax assets, liabilities and expense.
Investment Securities
The Company invests in various debt securities primarily for liquidity management purposes and as part of the overall ALM process to optimize income and market performance over an entire interest rate cycle. Investments in debt securities that are not held for trading purposes are classified as HTM or AFS. Truist does not currently have any securities classified as HTM.
Interest income on securities is recognized in income on an accrual basis. Premiums and discounts are amortized into interest income using the effective interest method over the contractual life of the security. As prepayments are received, a proportionate amount of the related premium or discount is recognized in income so that the effective interest rate on the remaining portion of the security continues unchanged.
AFS securities are reported at estimated fair value, with unrealized gains and losses reported in AOCI, net of deferred income taxes, in the Shareholders' equity section of the Consolidated Balance Sheets. Gains or losses realized from the sale of AFS securities are determined by specific identification and are included in noninterest income.
An unrealized loss exists when the current fair value of an individual security is less than its amortized cost basis. AFS debt securities in an unrealized loss position are evaluated at the balance sheet date to determine whether such losses are credit-related. Credit losses are measured on an individual basis and recognized in an ACL. Changes in expected credit losses are recognized in the Provision for credit losses in the Consolidated Statements of Income. Municipal securities are evaluated for impairment using a municipal bond credit scoring tool that leverages historical municipal market data to estimate probability of default and loss given default at the issuer level. U.S. Treasury securities, government guaranteed securities, and other securities issued by GSEs are either explicitly or implicitly guaranteed by the US government, are highly rated by rating agencies and have a long history of no credit losses. There was no ACL on the Company’s AFS debt securities at September 30, 2020.
Loans and Leases
The Company's accounting methods for loans differ depending on whether the loans are originated or purchased, and if purchased, whether or not the loans reflect credit deterioration since the date of origination such that at the date of acquisition there is more than an insignificant deterioration in credit.
Truist Financial Corporation 9
Originated Loans and Leases
Loans and leases that management has the intent and ability to hold for the foreseeable future or until maturity or payoff are reported at their outstanding principal balances net of any unearned income, charge-offs, and unamortized fees and costs. Interest and fees on loans and leases includes certain loan fees and deferred direct costs associated with the lending process recognized over the contractual lives of the loans using the effective interest method.
Purchased Loans
Purchased loans are recorded at their fair value at the acquisition date.
Fair values for purchased loans are based on a discounted cash flow methodology that considers credit loss expectations, market interest rates and other market factors such as liquidity from the perspective of a market participant. Loans are grouped together according to similar characteristics and treated in the aggregate when applying various valuation techniques. The probability of default, loss given default and prepayment assumptions are the key factors driving credit losses which are embedded into the estimated cash flows. These assumptions are informed by internal data on loan characteristics, historical loss experience, and current and forecasted economic conditions. The interest and liquidity component of the estimate are determined by discounting interest and principal cash flows through the expected life of the underlying loans. The discount rates used for loans are based on current market rates for new originations of comparable loans and include adjustments for liquidity. The discount rates do not include a factor for credit losses as that has been included as a reduction to the estimated cash flows.
Beginning January 1, 2020, purchased loans are evaluated upon acquisition and classified as either PCD, which indicates that the loan reflects more-than-insignificant deterioration in credit quality since origination, or non-PCD. Truist considers a variety of factors in connection with the identification of more-than-insignificant deterioration in credit quality, including but not limited to risk grades, delinquency, nonperforming status, previous troubled debt restructurings or bankruptcies and other qualitative factors that indicate deterioration in credit quality since origination.
For PCD loans, the initial estimate of expected credit losses is determined using the same methodology as other loans held for investment
and recognized as an adjustment to the acquisition price of the asset; thus, the sum of the loans’ purchase price and initial ALLL estimate represents the initial amortized cost basis. The difference between the initial amortized cost basis and the par value is the non-credit discount or premium. For non-PCD loans, the difference between the fair value and the par value is considered the fair value mark. The initial ALLL for non-PCD loans is recorded with a corresponding charge to the Provision for credit losses in the Consolidated Statements of Income. Subsequent changes in the ALLL related to PCD and non-PCD loans are recognized in the Provision for credit losses.
The non-credit discount or premium related to PCD loans, and the fair value mark on non-PCD loans, is amortized or accreted to Interest and fees on loans and leases over the contractual life of the loans using the effective interest method for amortizing loans, and using a straight-line approach for interest-only loans and loans with revolving privileges. In the event of prepayment, unamortized discounts or premiums are recognized in Interest and fees on loans and leases.
TDRs
Modifications to a borrower's debt agreement are considered TDRs if a concession is granted for economic or legal reasons related to a borrower's financial difficulties that otherwise would not be considered. TDRs are undertaken to improve the likelihood of recovery on the loan and may take the form of modifications made with the stated interest rate lower than the current market rate for new debt with similar risk, other modifications to the structure of the loan that fall outside of normal underwriting policies and procedures, or in certain limited circumstances, forgiveness of principal or interest. A restructuring that results in only a delay in payments that is insignificant is not considered an economic concession. In accordance with the CARES Act, Truist implemented loan modification programs in response to the COVID-19 pandemic in order to provide borrowers with flexibility with respect to repayment terms. Truist payment relief assistance includes forbearance, deferrals, extension and re-aging programs, along with certain other modification strategies. The Company elected the accounting policy in the CARES Act to not apply TDR accounting to loans modified for borrowers impacted by the COVID-19 pandemic. The Company applies this policy to loans modified in response to COVID-19 hardships that were less than 30 days past due at December 31, 2019, or in certain circumstances, at the time that the COVID-19 loan modification program was implemented, unless the loan was previously classified as a TDR.
TDRs can be classified as performing or nonperforming, depending on the individual facts and circumstances of the borrower and an evaluation as to whether the borrower will be able to repay the loan based on the modified terms. In circumstances where the TDR involves charging off a portion of the loan balance, Truist classifies these TDRs as nonperforming.
10 Truist Financial Corporation
The decision to maintain a commercial TDR on performing status is based on a current, well documented credit evaluation of the borrower's financial condition and prospects for repayment under the modified terms. This evaluation includes consideration of the borrower's current capacity to pay, which among other things may include a review of the borrower's current financial statements, an analysis of cash flow available to pay debt obligations, and an evaluation of secondary sources of payment from the borrower and any guarantors. This evaluation also includes an evaluation of the borrower's current willingness to pay, which may include a review of past payment history, an evaluation of the borrower's willingness to provide information on a timely basis, and consideration of offers from the borrower to provide additional collateral or guarantor support. The credit evaluation may also include review of cash flow projections, consideration of the adequacy of collateral to cover all principal and interest and trends indicating improving profitability and collectability of receivables.
The evaluation of mortgage and other consumer loans includes an evaluation of the client's debt-to-income ratio, credit report, property value and certain other client-specific factors that impact the clients’ ability to make timely principal and interest payments on the loan.
TDR classification may be removed due to the passage of time if the loan: (1) did not include a forgiveness of principal or interest, (2) has performed in accordance with the modified terms (generally a minimum of six consecutive months), (3) was reported as a TDR over a year-end reporting period, and (4) reflected an interest rate on the modified loan that was no less than a market rate at the date of modification. TDR classification may also be removed for an accruing loan upon the occurrence of a subsequent non-concessionary modification granted at market terms and within current underwriting guidelines.
NPAs
NPAs include NPLs and foreclosed property. Foreclosed property consists of real estate and other assets acquired as a result of clients' loan defaults.
Truist's policies for placing loans on nonperforming status conform to guidelines prescribed by bank regulatory authorities. Truist classifies loans and leases as past due when the payment of principal and interest based upon contractual terms is greater than 30 days delinquent or if one payment is past due. Payment deferrals granted as a result of the COVID-19 pandemic do not result in a loan becoming past due.
The following table summarizes the delinquency thresholds that are a factor used in evaluating nonperforming classification and the timing of charge-off evaluations:
| (number of days) | Placed on Nonperforming (1) | Evaluation for Charge-off | ||||||||||||||||||||||||
| Commercial: | ||||||||||||||||||||||||||
| Commercial and industrial |
|
(2) |
|
(2) | ||||||||||||||||||||||
| CRE |
|
(2) |
|
(2) | ||||||||||||||||||||||
| Commercial construction |
|
(2) |
|
(2) | ||||||||||||||||||||||
| Lease financing |
|
(2) |
|
(2) | ||||||||||||||||||||||
| Consumer: | ||||||||||||||||||||||||||
| Residential mortgage (3) |
|
to |
|
|
to |
|
||||||||||||||||||||
| Residential home equity and direct (3) |
|
to |
|
|
to |
|
||||||||||||||||||||
| Indirect auto (3) |
|
|
||||||||||||||||||||||||
| Indirect other (3) |
|
to |
|
|
to |
|
||||||||||||||||||||
| Student (4) (5) | NA |
|
to |
|
||||||||||||||||||||||
| Credit card (6) | NA |
|
to |
|
||||||||||||||||||||||
When commercial loans are placed on nonperforming status, a charge-off is recorded, as applicable, to decrease the carrying value of such loans to the estimated recoverable amount. Consumer and credit card loans are subject to charge-off at a specified delinquency date consistent with regulatory guidelines.
Truist Financial Corporation 11
Certain past due loans may remain on performing status if management determines that it does not have concern over the collectability of principal and interest. Generally, when loans are placed on nonperforming status, accrued interest receivable is reversed against interest income in the current period and amortization of deferred loan fees and expenses for originated loans, and fair value marks for purchased loans, is suspended. For commercial loans and certain consumer loans, payments received for interest and lending fees thereafter are applied as a reduction to the remaining principal balance as long as concern exists as to the ultimate collection of the principal. Interest income on nonperforming loans is recognized after the principal has been reduced to zero. If and when borrowers demonstrate the ability to repay a loan classified as nonperforming in accordance with its contractual terms, the loan may be returned to performing status upon meeting all regulatory, accounting and internal policy requirements.
Accrued interest is included in Other assets in the Consolidated Balance Sheets. Accrued interest receivable balances are not considered in connection with the ACL estimation process, as such amounts are generally reversed against interest income when the loan is placed in nonperforming status. Interest has been deferred on loans that have been provided payment relief assistance in connection with the CARES Act that based on management's best estimate may ultimately prove to be uncollectible.
Assets acquired as a result of foreclosure are initially recorded at fair value less estimated cost to sell and subsequently carried at the lower of cost or net realizable value. Net realizable value equals fair value less estimated selling costs. Any excess of cost over net realizable value at the time of foreclosure is charged to the ALLL. NPAs are subject to periodic revaluations of the collateral underlying impaired loans and foreclosed real estate. The periodic revaluations are generally based on the appraised value of the property and may include additional liquidity adjustments based upon the expected retention period. Truist's policies require that valuations be updated at least annually and that upon foreclosure, the valuation must not be more than six months old, otherwise an update is required. Any subsequent changes in value as well as gains or losses from the disposition of these assets are recognized in Other noninterest expense in the Consolidated Statements of Income. For additional information on the Company’s loan and lease activities, see "Note 5. Loans and ACL.”
ACL
The ACL includes the ALLL and RUFC. The ACL represents management's best estimate of expected future credit losses related to loan and lease portfolios and off-balance sheet lending commitments at the balance sheet date. The ALLL is a valuation account that is deducted from or added to the loans’ amortized cost basis to present the net amount expected to be collected on loans. The entire amount of the ACL is available to absorb losses on any loan category or lending-related commitment. Loan or lease balances deemed to be uncollectible are charged off against the ALLL. Expected recoveries of amounts previously charged off are incorporated into the ALLL estimate, with such amounts capped at the aggregate of amounts previously charged off. Changes to the ACL are made by charges to the Provision for credit losses, which is reflected in the Consolidated Statements of Income. The RUFC is recorded in Other liabilities on the Consolidated Balance Sheets.
Portfolio segments represent the level at which Truist develops and documents a systematic methodology to determine its ACL. Truist’s loan and lease portfolio consists of three portfolio segments; commercial, consumer and credit card. The expected credit loss models are generally developed one level below the portfolio segment level. In certain instances, loans are further disaggregated by similar risk characteristics, such as business sector, client type, funding type, type of collateral, whether loan payments are interest-only and whether interest rates are fixed or variable. Larger loans and leases that do not share similar risk characteristics or that are considered collateral-dependent are individually evaluated. For these loans, the ALLL is determined through review of data specific to the borrower and related collateral, if any. Such estimates may be based on current loss forecasts, an evaluation of the fair value of the underlying collateral or in certain circumstances the present value of expected cash flows discounted at the loan's effective interest as described further below. The commercial portfolio segment models use a risk rating approach to estimate the ALLL. The consumer and credit card models use a delinquency-based approach to estimate the ALLL. In addition to these quantitatively calculated components, the ALLL includes qualitatively calculated components.
Truist maintains a collectively calculated ALLL for loans with similar risk characteristics. The collectively calculated ALLL is estimated using relevant available information from internal and external sources relating to past events, current conditions, and reasonable and supportable forecasts. Truist maintains quantitative models to forecast expected credit losses. The credit loss forecasting models use portfolio balances, macroeconomic scenarios, portfolio composition and loan attributes as the primary inputs. Loss estimates are informed by historical loss experience adjusted for macroeconomic forecasts and current and expected portfolio risk characteristics. Expected losses are estimated through contractual maturity unless the borrower has a right to renew that is not cancellable or it is reasonably expected that the loan will be modified as a TDR.
12 Truist Financial Corporation
The Scenario Committee provides guidance, selection, and approval for enterprise-sanctioned macroeconomic scenarios, including the macroeconomic forecasts for use in the ACL process. Forecasted economic conditions are developed using third party macroeconomic scenarios adjusted based on management’s expectations over a reasonable and supportable forecast period of two years. Assumptions revert to long term historic averages gradually over a one year period. Macroeconomic factors used in estimating the expected losses vary by loan portfolio and include employment factors, estimated collateral values and market indicators as described by portfolio segment below. A qualitative allowance which incorporates management’s judgement is also included in the estimation of expected future loan and lease losses, including qualitative adjustments in circumstances where the model output is inconsistent with management’s expectations with respect to expected credit losses. This allowance is used to adjust for limitations in modeled results related to the current economic conditions and capture risks in the portfolio such as considerations with respect to the impact of current economic events, the outcomes of which are uncertain. These events may include, but are not limited to, political conditions, legislation that may directly or indirectly affect the banking industry and economic conditions affecting specific geographical areas and industries in which Truist conducts business.
The methodology for determining the RUFC is inherently similar to that used to determine the funded component of the ALLL and is measured over the period there is a contractual obligation to extend credit that is not unconditionally cancellable. The RUFC is adjusted for factors specific to binding commitments, including the probability of funding and exposure at default.
The ACL is monitored by the ACL Committee. The ACL Committee approves the ACL estimate and may recommend adjustments where necessary based on portfolio performance and other items that may impact credit risk.
The following provides a description of accounting policies, methodologies and credit quality indicators related to each of the portfolio segments:
Commercial
The majority of loans in the commercial lending portfolio are assigned risk ratings based on an assessment of conditions that affect the borrower's ability to meet contractual obligations under the loan agreement. This process includes reviewing borrowers' financial information, historical payment experience, credit documentation, public information, and other information specific to each borrower. Risk ratings are reviewed on an annual basis, or more frequently for many relationships based on the policy requirements regarding various risk characteristics. While this review is largely focused on the borrower's ability to repay the loan, Truist also considers the capacity and willingness of a loan's guarantors to support the loan as a secondary source of repayment. When a guarantor exhibits the documented capacity and willingness to support the loan, Truist may consider extending the loan maturity and/or temporarily deferring principal payments if the ultimate collection of both principal and interest is reasonably assured. In these cases, Truist may determine the loan is not impaired due to the documented capacity and willingness of the guarantor to repay the loan. Loans are considered impaired when the borrower (or guarantor in certain circumstances) does not have the cash flow capacity or willingness to service the debt according to contractual terms, or it does not appear reasonable to assume that the borrower will continue to pay according to the contractual agreement.
The following table summarizes risk ratings that Truist uses to monitor credit quality in its commercial portfolio:
| Risk Rating | Description | ||||
| Pass | Loans not considered to be problem credits | ||||
| Special Mention | Loans that have a potential weakness deserving management's close attention | ||||
| Substandard | Loans for which a well-defined weakness has been identified that may put full collection of contractual cash flows at risk | ||||
| Nonperforming | Loans for which full collection of principal and interest is not considered probable | ||||
Loans are generally pooled one level below the portfolio segment for the collectively calculated ALLL based on factors such as business sector, project and property type, line of business, collateral, loan type, obligor exposure, and risk grade or score. Commercial loss forecasting models are expected loss frameworks that use macroeconomic scenarios and current portfolio attributes as inputs. The models forecast probability of default, exposure at default and loss given default. The primary macroeconomic drivers for the commercial portfolios include unemployment trends, U.S. real GDP, corporate credit spreads, rental rates and property values.
Truist's policy is to review and individually evaluate the reserve for all nonperforming lending relationships and TDRs with an outstanding balance of $5 million or more, as such lending relationships do not typically share similar risk characteristics with others. Individually evaluated reserves are based on current forecasts, the present value of expected cash flows discounted at the loan's effective interest rate or the value of collateral, which is generally based on appraisals, recent sales of foreclosed properties and/or relevant property-specific market information. Truist has elected to measure expected credit losses on collateral-dependent loans based on the fair value of the collateral. Loans are considered collateral dependent when it is probable that Truist will be unable to collect principal and interest according to the contractual terms of the agreement and repayment is expected to be provided substantially by the sale or continued operation of the underlying collateral. Commercial loans are typically secured by real estate, business equipment, inventories and other types of collateral.
Truist Financial Corporation 13
Consumer and Credit Card
The majority of the ALLL related to the consumer and credit card lending portfolios is calculated on a collective basis. Loans are pooled one level below the portfolio segment for the collectively calculated ALLL based on factors such as collateral, loan type, line of business and sales channel. Consumer portfolio models are expected loss frameworks that use macroeconomic scenarios and current portfolio attributes as inputs. The models forecast probability of default, exposure at default and loss given default. The primary macroeconomic drivers for the consumer portfolios include unemployment trends, home price indices and used car prices.
Residential mortgages and revolving home equity lines of credit are generally collateralized by one-to-four-family residential real estate, typically have loan-to-collateral value ratios of 80% or less at origination, and are made to borrowers in good credit standing. The indirect auto and indirect other portfolios include secured indirect installment loans to consumers for the purchase of new and used automobiles, boats and recreational vehicles. The student loan portfolio is composed of government-guaranteed student loans and certain private student loans originated by third parties. The government guarantee mitigates substantially all of the risk related to principal and interest repayment for this component of the portfolio. Private student loans purchased from third-party originators with credit enhancements partially mitigate the Company’s credit exposure. The credit card portfolio and other arrangements within the indirect other and residential home equity and direct portfolios are generally unsecured and are actively managed.
Truist uses performing status to monitor credit quality in its consumer and credit card portfolios. Delinquency status is the primary factor considered in determining whether a loan should be classified as nonperforming.
The ALLL for loans classified as a TDR is based on analyses capturing the expected credit losses and the impact of the concession over the remaining life of the asset.
Expected recoveries for consumer and credit card loans are included in the estimation of the ALLL based on historical experience.
Changes in Accounting Principles and Effects of New Accounting Pronouncements
| Standard / Adoption Date | Description | Effects on the Financial Statements | ||||||
| Standards Adopted During the Current Year | ||||||||
|
Credit Losses /
January 1, 2020 |
Replaces the incurred loss impairment methodology with an expected credit loss methodology and requires consideration of a broader range of information to determine credit loss estimates. Financial assets measured at amortized cost are presented at the net amount expected to be collected by using an allowance for credit losses. Purchased credit deteriorated loans receive an allowance for expected credit losses. Any credit impairment on AFS debt securities for which the fair value is less than cost is recorded through an allowance for expected credit losses. The standard also requires expanded disclosures related to credit losses and asset quality. |
Truist adopted this standard using the modified retrospective approach.
The adoption of this standard resulted in a $3.1 billion increase to the ALLL and a $2.1 billion decrease to Retained earnings adjusted for deferred taxes and other impacts. A policy election was made to dissolve the existing PCI loan pools. The amortized cost basis of PCD assets was increased by $378 million at January 1, 2020, which reflects the initial estimate of credit losses for these assets. The remaining noncredit discount will be accreted to Interest and fee income on loans and leases over the contractual lives of the underlying assets using an effective interest method for amortizing loans and a straight-line approach for interest-only loans and loans with revolving privileges. The adoption of this standard did not have a material impact on the AFS securities portfolio. |
||||||
|
Simplifying the Test for Goodwill Impairment /
January 1, 2020 |
Simplifies the subsequent measurement of goodwill, by eliminating the second step from the goodwill impairment test. The amendments require an entity to perform its annual, or interim, goodwill impairment test by comparing the fair value of a reporting unit with its carrying amount. The standard requires an entity to recognize an impairment charge for the amount by which a reporting unit's carrying amount exceeds its fair value, with the loss limited to the total amount of goodwill allocated to that reporting unit. The standard must be applied on a prospective basis. | The standard does not currently have an impact on the Company’s consolidated financial statements; however, if subsequent to adoption, the carrying amount of a reporting unit exceeds its respective fair value, the Company would be required to recognize an impairment charge for the amount that the carrying value exceeds the fair value up to the amount of the goodwill assigned to the reporting unit. | ||||||
|
Reference Rate Reform /
March 12, 2020 |
Provides optional expedients and exceptions regarding the accounting for contract modifications, hedging relationships and other transactions affected by reference rate reform. The standard was issued March 12, 2020, is effective upon issuance and can be applied through December 31, 2022. | The application of this standard did not have a material impact to the Company's consolidated financial statements. The standard allows for certain practical expedients not yet elected by the Company, which may simplify the accounting for reference rate reform, if elected in the future. | ||||||
14 Truist Financial Corporation
NOTE 2.
Business Combinations
Effective December 6, 2019, the Company completed its Merger with SunTrust. The Merger was accounted for as a business combination. Accordingly, the assets acquired and liabilities assumed were recorded at their fair values as of the Merger date. The determination of fair value requires management to make estimates about discount rates, future expected cash flows, market conditions and other future events that are highly subjective in nature and subject to change. Fair value estimates related to the acquired assets and liabilities are subject to adjustment until all necessary information related to the valuation process has been received. Adjustments must be finalized within one year of the closing date of the Merger. The Company’s purchase price allocation is considered preliminary as certain estimates related to leveraged leases, premises and equipment, and certain other assets and liabilities are subject to continuing refinement. Immaterial amounts of the intangible assets recognized are deductible for income tax purposes. For additional information, see “Note 2. Business Combinations” of the Annual Report on Form 10-K for the year ended December 31, 2019.
The following table sets forth a preliminary allocation of Merger consideration to the fair value of the identifiable tangible and intangible assets acquired and liabilities assumed of SunTrust as of December 6, 2019:
| (Dollars in millions) | UPB | Fair Value | |||||||||
| Fair value of Merger consideration | $ |
|
|||||||||
| Assets | |||||||||||
| Cash and due from banks |
|
||||||||||
| Interest-bearing deposits with banks |
|
||||||||||
| Securities borrowed or purchased under resale agreements |
|
||||||||||
| Trading assets |
|
||||||||||
| AFS securities |
|
||||||||||
| LHFS |
|
||||||||||
| Loans and leases: | |||||||||||
| Commercial and industrial | $ |
|
|
||||||||
| CRE |
|
|
|||||||||
| Commercial Construction |
|
|
|||||||||
| Commercial Leases |
|
|
|||||||||
| Mortgage Loans |
|
|
|||||||||
| Home Equity and Direct Lending |
|
|
|||||||||
| Indirect Auto |
|
|
|||||||||
| Indirect Other |
|
|
|||||||||
| Student Lending |
|
|
|||||||||
| Credit Card |
|
|
|||||||||
| PCI |
|
|
|||||||||
| Total loans and leases | $ |
|
|
||||||||
| Premises and equipment |
|
||||||||||
| CDI and other intangible assets |
|
||||||||||
| MSRs |
|
||||||||||
| Other assets |
|
||||||||||
| Total assets |
|
||||||||||
| Liabilities and Equity | |||||||||||
| Deposits |
(
|
||||||||||
| Short-term borrowings |
(
|
||||||||||
| Long-term debt |
(
|
||||||||||
| Other liabilities |
(
|
||||||||||
| Total liabilities |
(
|
||||||||||
| Noncontrolling interest |
(
|
||||||||||
| Less: Net assets |
|
||||||||||
| Goodwill | $ |
|
|||||||||
For a description of the methods used to determine the fair values of significant assets and liabilities, see “Note 2. Business Combinations” of the Annual Report on Form 10-K for the year ended December 31, 2019.
Truist Financial Corporation 15
Branch Divestitures
In July 2020, Truist completed the divestiture of 30 branches to First Horizon Bank, a wholly owned subsidiary of First Horizon National Corporation, to satisfy regulatory requirements in connection with the Merger. The branches were located in North Carolina, Virginia and Georgia. There were $
425
million in loans and leases and $
2.2
billion in deposits divested as part of this transaction.
NOTE 3.
Securities Financing Activities
Securities purchased under resale agreements are primarily collateralized by U.S. government or agency securities and are carried at the amounts at which the securities will be subsequently sold, plus accrued interest. Securities borrowed are primarily collateralized by corporate securities. The Company borrows securities and purchases securities under agreements to resell as part of its securities financing activities. On the acquisition date of these securities, the Company and the related counterparty agree on the amount of collateral required to secure the principal amount loaned under these arrangements.
The following table presents securities borrowed or purchased under resale agreements:
| (Dollars in millions) | September 30, 2020 | December 31, 2019 | ||||||||||||
| Securities purchased under resale agreements | $ |
|
$ |
|
||||||||||
| Securities borrowed |
|
|
||||||||||||
| Total securities borrowed or purchased under resale agreements | $ |
|
$ |
|
||||||||||
For securities sold under agreements to repurchase, the Company would be obligated to provide additional collateral in the event of a significant decline in fair value of the collateral pledged. This risk is managed by monitoring the liquidity and credit quality of the collateral, as well as the maturity profile of the transactions. Refer to "Note 14. Commitments and Contingencies" for additional information related to pledged securities. Securities sold under agreements to repurchase are accounted for as secured borrowings.
The following table presents the Company’s related activity, by collateral type and remaining contractual maturity:
| September 30, 2020 | December 31, 2019 | |||||||||||||||||||||||||||||||||||||||||||
| (Dollars in millions) | Overnight and Continuous | Up to 30 days | Total | Overnight and Continuous | Up to 30 days | 30-90 days | Total | |||||||||||||||||||||||||||||||||||||
| U.S. Treasury | $ |
|
$ |
|
$ |
|
$ |
|
$ |
|
$ |
|
$ |
|
||||||||||||||||||||||||||||||
| GSE |
|
|
|
|
|
|
|
|||||||||||||||||||||||||||||||||||||
| Agency MBS - residential |
|
|
|
|
|
|
|
|||||||||||||||||||||||||||||||||||||
| Corporate and other debt securities |
|
|
|
|
|
|
|
|||||||||||||||||||||||||||||||||||||
| Total securities sold under agreements to repurchase | $ |
|
$ |
|
$ |
|
$ |
|
$ |
|
$ |
|
$ |
|
||||||||||||||||||||||||||||||
There were no securities financing transactions subject to legally enforceable master netting arrangements that were eligible for balance sheet netting for the periods presented.
16 Truist Financial Corporation
NOTE 4.
Investment Securities
The following tables summarize the Company's AFS securities:
|
September 30, 2020
(Dollars in millions) |
Amortized Cost | Gross Unrealized | Fair Value | |||||||||||||||||||||||
| Gains | Losses | |||||||||||||||||||||||||
| AFS securities: | ||||||||||||||||||||||||||
| U.S. Treasury | $ |
|
$ |
|
$ |
|
$ |
|
||||||||||||||||||
| GSE |
|
|
|
|
||||||||||||||||||||||
| Agency MBS - residential |
|
|
|
|
||||||||||||||||||||||
| Agency MBS - commercial |
|
|
|
|
||||||||||||||||||||||
| States and political subdivisions |
|
|
|
|
||||||||||||||||||||||
| Other |
|
|
|
|
||||||||||||||||||||||
| Total AFS securities | $ |
|
$ |
|
$ |
|
$ |
|
||||||||||||||||||
|
December 31, 2019
(Dollars in millions) |
Amortized Cost | Gross Unrealized | Fair Value | |||||||||||||||||||||||
| Gains | Losses | |||||||||||||||||||||||||
| AFS securities: | ||||||||||||||||||||||||||
| U.S. Treasury | $ |
|
$ |
|
$ |
|
$ |
|
||||||||||||||||||
| GSE |
|
|
|
|
||||||||||||||||||||||
| Agency MBS - residential |
|
|
|
|
||||||||||||||||||||||
| Agency MBS - commercial |
|
|
|
|
||||||||||||||||||||||
| States and political subdivisions |
|
|
|
|
||||||||||||||||||||||
| Non-agency MBS |
|
|
|
|
||||||||||||||||||||||
| Other |
|
|
|
|
||||||||||||||||||||||
| Total AFS securities | $ |
|
$ |
|
$ |
|
$ |
|
||||||||||||||||||
Certain securities issued by FNMA and FHLMC exceeded 10% of shareholders' equity at September 30, 2020. The FNMA investments had total amortized cost and fair value of $
18.9
billion and $
19.4
billion, respectively. The FHLMC investments had total amortized cost and fair value of $
16.2
billion and $
16.6
billion, respectively.
The amortized cost and estimated fair value of the securities portfolio by contractual maturity are shown in the following table. The expected life of MBS may differ from contractual maturities because borrowers may have the right to prepay their obligations with or without penalties.
| Amortized Cost | Fair Value | ||||||||||||||||||||||||||||||||||||||||||||||||||||||||||
|
September 30, 2020
(Dollars in millions) |
Due in one year or less | Due after one year through five years | Due after five years through ten years | Due after ten years | Total | Due in one year or less | Due after one year through five years | Due after five years through ten years | Due after ten years | Total | |||||||||||||||||||||||||||||||||||||||||||||||||
| AFS securities: | |||||||||||||||||||||||||||||||||||||||||||||||||||||||||||
| U.S. Treasury | $ |
|
$ |
|
$ |
|
$ |
|
$ |
|
$ |
|
$ |
|
$ |
|
$ |
|
$ |
|
|||||||||||||||||||||||||||||||||||||||
| GSE |
|
|
|
|
|
|
|
|
|
|
|||||||||||||||||||||||||||||||||||||||||||||||||
| Agency MBS - residential |
|
|
|
|
|
|
|
|
|
|
|||||||||||||||||||||||||||||||||||||||||||||||||
| Agency MBS - commercial |
|
|
|
|
|
|
|
|
|
|
|||||||||||||||||||||||||||||||||||||||||||||||||
| States and political subdivisions |
|
|
|
|
|
|
|
|
|
|
|||||||||||||||||||||||||||||||||||||||||||||||||
| Other |
|
|
|
|
|
|
|
|
|
|
|||||||||||||||||||||||||||||||||||||||||||||||||
| Total AFS securities | $ |
|
$ |
|
$ |
|
$ |
|
$ |
|
$ |
|
$ |
|
$ |
|
$ |
|
$ |
|
|||||||||||||||||||||||||||||||||||||||
Truist Financial Corporation 17
The following tables present the fair values and gross unrealized losses of investments based on the length of time that individual securities have been in a continuous unrealized loss position:
| Less than 12 months | 12 months or more | Total | |||||||||||||||||||||||||||||||||
|
September 30, 2020
(Dollars in millions) |
Fair Value | Unrealized Losses | Fair Value | Unrealized Losses | Fair Value | Unrealized Losses | |||||||||||||||||||||||||||||
| AFS securities: | |||||||||||||||||||||||||||||||||||
| Agency MBS - residential | $ |
|
$ |
|
$ |
|
$ |
|
$ |
|
$ |
|
|||||||||||||||||||||||
| Agency MBS - commercial |
|
|
|
|
|
|
|||||||||||||||||||||||||||||
| States and political subdivisions |
|
|
|
|
|
|
|||||||||||||||||||||||||||||
| Other |
|
|
|
|
|
|
|||||||||||||||||||||||||||||
| Total | $ |
|
$ |
|
$ |
|
$ |
|
$ |
|
$ |
|
|||||||||||||||||||||||
| Less than 12 months | 12 months or more | Total | |||||||||||||||||||||||||||||||||
|
December 31, 2019
(Dollars in millions) |
Fair Value | Unrealized Losses | Fair Value | Unrealized Losses | Fair Value | Unrealized Losses | |||||||||||||||||||||||||||||
| AFS securities: | |||||||||||||||||||||||||||||||||||
| U.S. Treasury | $ |
|
$ |
|
$ |
|
$ |
|
$ |
|
$ |
|
|||||||||||||||||||||||
| GSE |
|
|
|
|
|
|
|||||||||||||||||||||||||||||
| Agency MBS - residential |
|
|
|
|
|
|
|||||||||||||||||||||||||||||
| Agency MBS - commercial |
|
|
|
|
|
|
|||||||||||||||||||||||||||||
| States and political subdivisions |
|
|
|
|
|
|
|||||||||||||||||||||||||||||
| Total | $ |
|
$ |
|
$ |
|
$ |
|
$ |
|
$ |
|
|||||||||||||||||||||||
At September 30, 2020,
no
ACL was established for AFS securities. Substantially all of the unrealized losses on the securities portfolio were the result of changes in market interest rates compared to the date the securities were acquired rather than the credit quality of the issuers or underlying loans. The majority of the unrealized loss on states and political subdivisions securities was the result of fair value hedge basis adjustments that are a component of amortized cost.
The following table presents gross securities gains and losses recognized in earnings:
| (Dollars in millions) | Three Months Ended September 30, | Nine Months Ended September 30, | ||||||||||||||||||||||||
| 2020 | 2019 | 2020 | 2019 | |||||||||||||||||||||||
| Gross realized gains | $ |
|
$ |
|
$ |
|
$ |
|
||||||||||||||||||
| Gross realized losses |
|
|
(
|
(
|
||||||||||||||||||||||
| Securities gains (losses), net | $ |
|
$ |
|
$ |
|
$ |
|
||||||||||||||||||
For 2020, the realized gains primarily relate to the sales of non-agency and agency MBS in the second and third quarter, respectively.
18 Truist Financial Corporation
NOTE 5.
Loans and ACL
The following tables present loans and leases HFI by aging category. Government guaranteed loans are not placed on nonaccrual status regardless of delinquency because collection of principal and interest is reasonably assured. The past due status of loans that received a deferral under the CARES Act is generally frozen during the deferral period. In certain limited circumstances, accommodation programs result in the delinquency status being reset to current.
| Accruing | ||||||||||||||||||||||||||||||||
|
September 30, 2020
(Dollars in millions) |
Current | 30-89 Days Past Due | 90 Days Or More Past Due | Nonperforming | Total | |||||||||||||||||||||||||||
| Commercial: | ||||||||||||||||||||||||||||||||
| Commercial and industrial | $ |
|
$ |
|
$ |
|
$ |
|
$ |
|
||||||||||||||||||||||
| CRE |
|
|
|
|
|
|||||||||||||||||||||||||||
| Commercial construction |
|
|
|
|
|
|||||||||||||||||||||||||||
| Lease financing |
|
|
|
|
|
|||||||||||||||||||||||||||
| Consumer: | ||||||||||||||||||||||||||||||||
| Residential mortgage |
|
|
|
|
|
|||||||||||||||||||||||||||
| Residential home equity and direct |
|
|
|
|
|
|||||||||||||||||||||||||||
| Indirect auto |
|
|
|
|
|
|||||||||||||||||||||||||||
| Indirect other |
|
|
|
|
|
|||||||||||||||||||||||||||
| Student |
|
|
|
|
|
|||||||||||||||||||||||||||
| Credit card |
|
|
|
|
|
|||||||||||||||||||||||||||
| Total | $ |
|
$ |
|
$ |
|
$ |
|
$ |
|
||||||||||||||||||||||
| Accruing | ||||||||||||||||||||||||||||||||
|
December 31, 2019
(Dollars in millions) |
Current | 30-89 Days Past Due | 90 Days Or More Past Due | Nonperforming | Total | |||||||||||||||||||||||||||
| Commercial: | ||||||||||||||||||||||||||||||||
| Commercial and industrial | $ |
|
$ |
|
$ |
|
$ |
|
$ |
|
||||||||||||||||||||||
| CRE |
|
|
|
|
|
|||||||||||||||||||||||||||
| Commercial construction |
|
|
|
|
|
|||||||||||||||||||||||||||
| Lease financing |
|
|
|
|
|
|||||||||||||||||||||||||||
| Consumer: | ||||||||||||||||||||||||||||||||
| Residential mortgage |
|
|
|
|
|
|||||||||||||||||||||||||||
| Residential home equity and direct |
|
|
|
|
|
|||||||||||||||||||||||||||
| Indirect auto |
|
|
|
|
|
|||||||||||||||||||||||||||
| Indirect other |
|
|
|
|
|
|||||||||||||||||||||||||||
| Student |
|
|
|
|
|
|||||||||||||||||||||||||||
| Credit card |
|
|
|
|
|
|||||||||||||||||||||||||||
| PCI |
|
|
|
|
|
|||||||||||||||||||||||||||
| Total | $ |
|
$ |
|
$ |
|
$ |
|
$ |
|
||||||||||||||||||||||
Truist Financial Corporation 19
The following table presents the amortized cost basis of loans by origination year and credit quality indicator:
|
September 30, 2020
(Dollars in millions) |
Amortized Cost Basis by Origination Year | Revolving Credit | Loans Converted to Term | Other (1) | |||||||||||||||||||||||||||||||||||||||||||||||||||||||
| 2020 | 2019 | 2018 | 2017 | 2016 | Prior | Total | |||||||||||||||||||||||||||||||||||||||||||||||||||||
| Commercial: | |||||||||||||||||||||||||||||||||||||||||||||||||||||||||||
| Commercial and industrial: | |||||||||||||||||||||||||||||||||||||||||||||||||||||||||||
| Pass | $ |
|
$ |
|
$ |
|
$ |
|
$ |
|
$ |
|
$ |
|
$ |
|
$ |
(
|
$ |
|
|||||||||||||||||||||||||||||||||||||||
| Special mention |
|
|
|
|
|
|
|
|
|
|
|||||||||||||||||||||||||||||||||||||||||||||||||
| Substandard |
|
|
|
|
|
|
|
|
(
|
|
|||||||||||||||||||||||||||||||||||||||||||||||||
| Nonperforming |
|
|
|
|
|
|
|
|
(
|
|
|||||||||||||||||||||||||||||||||||||||||||||||||
| Total |
|
|
|
|
|
|
|
|
(
|
|
|||||||||||||||||||||||||||||||||||||||||||||||||
| CRE: | |||||||||||||||||||||||||||||||||||||||||||||||||||||||||||
| Pass |
|
|
|
|
|
|
|
|
(
|
|
|||||||||||||||||||||||||||||||||||||||||||||||||
| Special mention |
|
|
|
|
|
|
|
|
|
|
|||||||||||||||||||||||||||||||||||||||||||||||||
| Substandard |
|
|
|
|
|
|
|
|
|
|
|||||||||||||||||||||||||||||||||||||||||||||||||
| Nonperforming |
|
|
|
|
|
|
|
|
|
|
|||||||||||||||||||||||||||||||||||||||||||||||||
| Total |
|
|
|
|
|
|
|
|
(
|
|
|||||||||||||||||||||||||||||||||||||||||||||||||
| Commercial construction: | |||||||||||||||||||||||||||||||||||||||||||||||||||||||||||
| Pass |
|
|
|
|
|
|
|
|
|
|
|||||||||||||||||||||||||||||||||||||||||||||||||
| Special mention |
|
|
|
|
|
|
|
|
|
|
|||||||||||||||||||||||||||||||||||||||||||||||||
| Substandard |
|
|
|
|
|
|
|
|
|
|
|||||||||||||||||||||||||||||||||||||||||||||||||
| Nonperforming |
|
|
|
|
|
|
|
|
|
|
|||||||||||||||||||||||||||||||||||||||||||||||||
| Total |
|
|
|
|
|
|
|
|
|
|
|||||||||||||||||||||||||||||||||||||||||||||||||
| Lease financing: | |||||||||||||||||||||||||||||||||||||||||||||||||||||||||||
| Pass |
|
|
|
|
|
|
|
|
(
|
|
|||||||||||||||||||||||||||||||||||||||||||||||||
| Special mention |
|
|
|
|
|
|
|
|
|
|
|||||||||||||||||||||||||||||||||||||||||||||||||
| Substandard |
|
|
|
|
|
|
|
|
|
|
|||||||||||||||||||||||||||||||||||||||||||||||||
| Nonperforming |
|
|
|
|
|
|
|
|
(
|
|
|||||||||||||||||||||||||||||||||||||||||||||||||
| Total |
|
|
|
|
|
|
|
|
(
|
|
|||||||||||||||||||||||||||||||||||||||||||||||||
| Consumer: | |||||||||||||||||||||||||||||||||||||||||||||||||||||||||||
| Residential mortgage: | |||||||||||||||||||||||||||||||||||||||||||||||||||||||||||
| Performing |
|
|
|
|
|
|
|
|
|
|
|||||||||||||||||||||||||||||||||||||||||||||||||
| Nonperforming |
|
|
|
|
|
|
|
|
(
|
|
|||||||||||||||||||||||||||||||||||||||||||||||||
| Total |
|
|
|
|
|
|
|
|
|
|
|||||||||||||||||||||||||||||||||||||||||||||||||
| Residential home equity and direct: | |||||||||||||||||||||||||||||||||||||||||||||||||||||||||||
| Performing |
|
|
|
|
|
|
|
|
|
|
|||||||||||||||||||||||||||||||||||||||||||||||||
| Nonperforming |
|
|
|
|
|
|
|
|
|
|
|||||||||||||||||||||||||||||||||||||||||||||||||
| Total |
|
|
|
|
|
|
|
|
|
|
|||||||||||||||||||||||||||||||||||||||||||||||||
| Indirect auto: | |||||||||||||||||||||||||||||||||||||||||||||||||||||||||||
| Performing |
|
|
|
|
|
|
|
|
|
|
|||||||||||||||||||||||||||||||||||||||||||||||||
| Nonperforming |
|
|
|
|
|
|
|
|
(
|
|
|||||||||||||||||||||||||||||||||||||||||||||||||
| Total |
|
|
|
|
|
|
|
|
|
|
|||||||||||||||||||||||||||||||||||||||||||||||||
| Indirect other: | |||||||||||||||||||||||||||||||||||||||||||||||||||||||||||
| Performing |
|
|
|
|
|
|
|
|
|
|
|||||||||||||||||||||||||||||||||||||||||||||||||
| Nonperforming |
|
|
|
|
|
|
|
|
(
|
|
|||||||||||||||||||||||||||||||||||||||||||||||||
| Total |
|
|
|
|
|
|
|
|
|
|
|||||||||||||||||||||||||||||||||||||||||||||||||
| Student: | |||||||||||||||||||||||||||||||||||||||||||||||||||||||||||
| Performing |
|
|
|
|
|
|
|
|
(
|
|
|||||||||||||||||||||||||||||||||||||||||||||||||
| Nonperforming |
|
|
|
|
|
|
|
|
|
|
|||||||||||||||||||||||||||||||||||||||||||||||||
| Total |
|
|
|
|
|
|
|
|
(
|
|
|||||||||||||||||||||||||||||||||||||||||||||||||
| Credit card |
|
|
|
|
|
|
|
|
|
|
|||||||||||||||||||||||||||||||||||||||||||||||||
| Total | $ |
|
$ |
|
$ |
|
$ |
|
$ |
|
$ |
|
$ |
|
$ |
|
$ |
(
|
$ |
|
|||||||||||||||||||||||||||||||||||||||
20 Truist Financial Corporation
The following table presents the carrying amount of loans by risk rating and performing status. Student loans are excluded as there is nominal risk of credit loss due to government guarantees or other credit enhancements. PCI loans were excluded because their related ALLL is determined by loan pool performance, and credit card loans were excluded as these loans are charged-off rather than reclassified as nonperforming:
| December 31, 2019 | |||||||||||||||||||||||
| (Dollars in millions) | Commercial & Industrial | CRE | Commercial Construction | Lease Financing | |||||||||||||||||||
| Commercial: | |||||||||||||||||||||||
| Pass | $ |
|
$ |
|
$ |
|
$ |
|
|||||||||||||||
| Special mention |
|
|
|
|
|||||||||||||||||||
| Substandard |
|
|
|
|
|||||||||||||||||||
| Nonperforming |
|
|
|
|
|||||||||||||||||||
| Total | $ |
|
$ |
|
$ |
|
$ |
|
|||||||||||||||
| December 31, 2019 | |||||||||||||||||||||||
| Residential Mortgage | Residential home equity and direct | Indirect auto | Indirect Other | ||||||||||||||||||||
| Consumer: | |||||||||||||||||||||||
| Performing | $ |
|
$ |
|
$ |
|
$ |
|
|||||||||||||||
| Nonperforming |
|
|
|
|
|||||||||||||||||||
| Total | $ |
|
$ |
|
$ |
|
$ |
|
|||||||||||||||
ACL
The following tables present activity in the ACL:
| (Dollars in millions) | Balance at Jul 1, 2019 | Charge-Offs | Recoveries | Provision (Benefit) | Other | Balance at Sep 30, 2019 | ||||||||||||||||||||||||||||||||
| Commercial: | ||||||||||||||||||||||||||||||||||||||
| Commercial and industrial | $ |
|
$ |
(
|
$ |
|
$ |
|
$ |
|
$ |
|
||||||||||||||||||||||||||
| CRE |
|
(
|
|
(
|
|
|
||||||||||||||||||||||||||||||||
| Commercial construction |
|
|
|
|
|
|
||||||||||||||||||||||||||||||||
| Lease financing |
|
(
|
|
|
|
|
||||||||||||||||||||||||||||||||
| Consumer: | ||||||||||||||||||||||||||||||||||||||
| Residential mortgage |
|
(
|
|
(
|
|
|
||||||||||||||||||||||||||||||||
| Residential home equity and direct |
|
(
|
|
|
|
|
||||||||||||||||||||||||||||||||
| Indirect auto |
|
(
|
|
|
|
|
||||||||||||||||||||||||||||||||
| Indirect other |
|
(
|
|
|
|
|
||||||||||||||||||||||||||||||||
| Credit card |
|
(
|
|
|
|
|
||||||||||||||||||||||||||||||||
| PCI |
|
|
|
|
|
|
||||||||||||||||||||||||||||||||
| ALLL |
|
(
|
|
|
|
|
||||||||||||||||||||||||||||||||
| RUFC |
|
|
|
(
|
|
|
||||||||||||||||||||||||||||||||
| ACL | $ |
|
$ |
(
|
$ |
|
$ |
|
$ |
|
$ |
|
||||||||||||||||||||||||||
Truist Financial Corporation 21
| (Dollars in millions) | Balance at Jul 1, 2020 | Charge-Offs | Recoveries | Provision (Benefit) | Other (2) | Balance at Sep 30, 2020 | ||||||||||||||||||||||||||||||||
| Commercial: | ||||||||||||||||||||||||||||||||||||||
| Commercial and industrial | $ |
|
$ |
(
|
$ |
|
$ |
|
$ |
|
$ |
|
||||||||||||||||||||||||||
| CRE |
|
(
|
|
|
|
|
||||||||||||||||||||||||||||||||
| Commercial construction |
|
(
|
|
|
|
|
||||||||||||||||||||||||||||||||
| Lease financing |
|
(
|
|
|
|
|
||||||||||||||||||||||||||||||||
| Consumer: | ||||||||||||||||||||||||||||||||||||||
| Residential mortgage |
|
(
|
|
(
|
|
|
||||||||||||||||||||||||||||||||
| Residential home equity and direct |
|
(
|
|
|
|
|
||||||||||||||||||||||||||||||||
| Indirect auto |
|
(
|
|
|
|
|
||||||||||||||||||||||||||||||||
| Indirect other |
|
(
|
|
|
|
|
||||||||||||||||||||||||||||||||
| Student |
|
(
|
|
|
|
|
||||||||||||||||||||||||||||||||
| Credit card |
|
(
|
|
|
|
|
||||||||||||||||||||||||||||||||
| ALLL |
|
(
|
|
|
|
|
||||||||||||||||||||||||||||||||
| RUFC |
|
|
|
(
|
(
|
|
||||||||||||||||||||||||||||||||
| ACL | $ |
|
$ |
(
|
$ |
|
$ |
|
$ |
|
$ |
|
||||||||||||||||||||||||||
| (Dollars in millions) | Balance at Jan 1, 2019 | Charge-Offs | Recoveries | Provision (Benefit) | Other | Balance at Sep 30, 2019 | ||||||||||||||||||||||||||||||||
| Commercial: | ||||||||||||||||||||||||||||||||||||||
| Commercial and industrial | $ |
|
$ |
(
|
$ |
|
$ |
|
$ |
|
$ |
|
||||||||||||||||||||||||||
| CRE |
|
(
|
|
|
|
|
||||||||||||||||||||||||||||||||
| Commercial construction |
|
|
|
(
|
|
|
||||||||||||||||||||||||||||||||
| Lease financing |
|
(
|
|
|
|
|
||||||||||||||||||||||||||||||||
| Consumer: | ||||||||||||||||||||||||||||||||||||||
| Residential mortgage |
|
(
|
|
(
|
|
|
||||||||||||||||||||||||||||||||
| Residential home equity and direct |
|
(
|
|
|
|
|
||||||||||||||||||||||||||||||||
| Indirect auto |
|
(
|
|
|
|
|
||||||||||||||||||||||||||||||||
| Indirect other |
|
(
|
|
|
|
|
||||||||||||||||||||||||||||||||
| Credit card |
|
(
|
|
|
|
|
||||||||||||||||||||||||||||||||
| PCI |
|
|
|
(
|
|
|
||||||||||||||||||||||||||||||||
| ALLL |
|
(
|
|
|
|
|
||||||||||||||||||||||||||||||||
| RUFC |
|
|
|
(
|
|
|
||||||||||||||||||||||||||||||||
| ACL | $ |
|
$ |
(
|
$ |
|
$ |
|
$ |
|
$ |
|
||||||||||||||||||||||||||
| (Dollars in millions) | Balance at Jan 1, 2020 (1) | Charge-Offs | Recoveries | Provision (Benefit) | Other (2) | Balance at Sep 30, 2020 | ||||||||||||||||||||||||||||||||
| Commercial: | ||||||||||||||||||||||||||||||||||||||
| Commercial and industrial | $ |
|
$ |
(
|
$ |
|
$ |
|
$ |
|
$ |
|
||||||||||||||||||||||||||
| CRE |
|
(
|
|
|
|
|
||||||||||||||||||||||||||||||||
| Commercial construction |
|
(
|
|
|
|
|
||||||||||||||||||||||||||||||||
| Lease financing |
|
(
|
|
(
|
|
|
||||||||||||||||||||||||||||||||
| Consumer: | ||||||||||||||||||||||||||||||||||||||
| Residential mortgage |
|
(
|
|
|
|
|
||||||||||||||||||||||||||||||||
| Residential home equity and direct |
|
(
|
|
|
|
|
||||||||||||||||||||||||||||||||
| Indirect auto |
|
(
|
|
|
|
|
||||||||||||||||||||||||||||||||
| Indirect other |
|
(
|
|
|
|
|
||||||||||||||||||||||||||||||||
| Student |
|
(
|
|
|
|
|
||||||||||||||||||||||||||||||||
| Credit card |
|
(
|
|
|
|
|
||||||||||||||||||||||||||||||||
| PCI |
|
|
|
|
(
|
|
||||||||||||||||||||||||||||||||
| ALLL |
|
(
|
|
|
|
|
||||||||||||||||||||||||||||||||
| RUFC |
|
|
|
|
|
|
||||||||||||||||||||||||||||||||
| ACL | $ |
|
$ |
(
|
$ |
|
$ |
|
$ |
|
$ |
|
||||||||||||||||||||||||||
22 Truist Financial Corporation
The adoption of CECL increased the ALLL $
3.1
billion. The following discussion of the changes in the factors that influenced Truist’s ACL estimate and the reasons for those changes excludes the impact at adoption and certain other activity.
The commercial ALLL increased $
153
million and $
1.0
billion for the three and nine months ended September 30, 2020, respectively. The increase for the nine month period is primarily attributed to a more pessimistic outlook with respect to future economic conditions driven by the COVID-19 pandemic and specific consideration of the risks associated with exposures to certain industries, including oil and gas, hospitality, and lending to small businesses. The modest increase for the three month period reflects continued monitoring of clients’ financial position and associated re-grading actions as well as uncertainty related to performance after the expiration of relief packages.
The consumer ALLL increased $
15
million and $
214
million for the three and nine months ended September 30, 2020, respectively. The increase for the nine month period reflects the impact of the more pessimistic outlook described above, with the largest increases seen in the unsecured portfolios and the non-prime auto lending portfolio. The modest increase for the three month period reflects the uncertainty related to the pandemic and performance after the expiration of relief packages partially offset by the reduction in loan balances primarily in residential mortgage.
The ALLL for credit card decreased $
7
million and increased $
23
million for the three and nine months ended September 30, 2020, respectively. The decrease for the quarter reflects lower loan balances; the year-to-date increase reflects risks associated with COVID-19 and a more pessimistic economic outlook.
The RUFC decreased $
65
million and $
43
million for the three and nine months ended September 30, 2020, respectively. The net decrease reflects the reduction in the utilization estimate for conditionally cancellable commitments.
Truist’s ACL estimate represents management’s best estimate of expected credit losses related to the loan and lease portfolio, including unfunded commitments, at the balance sheet date. This estimate incorporates both quantitatively-derived output, as well as qualitative components that represent expected losses not otherwise captured by the models.
The quantitative models have been designed to estimate losses using macro-economic forecasts over a reasonable and supportable forecast period, which management has determined to be two years, followed by a reversion to long-term historical loss conditions over a one-year period. These macro-economic forecasts include a number of key economic variables utilized in loss forecasting that include, but are not limited to, unemployment trends, US real GDP, corporate credit spreads, rental rates, property values, home price indices and used car prices.
The primary economic forecast incorporates a third -party baseline forecast that is adjusted to reflect Truist’s interest rate outlook. Management also considered multiple third-party macro-economic forecasts that reflected a range of possible outcomes in order to capture uncertainty in the economic environment caused by the pandemic. The economic forecast shaping the ACL estimate at September 30, 2020 included an extended GDP recovery through the two-year reasonable and supportable forecast period with a high single-digit unemployment rate through the middle of 2021 followed by continued improvement through the remainder of the reasonable and supportable period.
Quantitative models have certain limitations with respect to estimating expected losses in times of rapidly changing macro-economic forecasts. As a result, management believes that the qualitative component of the ACL, which incorporates management’s expert judgment related to expected future credit losses, will continue to represent a significant portion of the ACL for the foreseeable future. The September 30, 2020 ACL estimate includes qualitative adjustments to adjust for limitations in modeled results with respect to forecasted economic conditions that are well outside of historic economic conditions used to develop the models and to give consideration to the impact of government relief programs, stimulus and client accommodations that are not directly considered in the quantitative models.
PCD Loan Activity
For PCD loans, the initial estimate of expected credit losses is recognized in the ALLL on the date of acquisition using the same methodology as other loans held for investment. The following table provides a summary of purchased student loans with credit deterioration at acquisition:
|
Nine Months Ended September 30, 2020
(Dollars in millions) |
||||||||
| Par value | $ |
|
||||||
| ALLL at acquisition |
(
|
|||||||
| Non-credit premium (discount) |
(
|
|||||||
| Purchase price | $ |
|
||||||
Truist Financial Corporation 23
Nonperforming and Impaired Loans
The following table provides a summary of nonperforming loans, excluding LHFS. Interest income recognized on nonperforming loans HFI was $
7
million for the three months ended September 30, 2020 and $
22
million for the nine months ended September 30, 2020.
| Recorded Investment | |||||||||||
|
September 30, 2020
(Dollars in millions) |
Without an ALLL | With an ALLL | |||||||||
| Commercial: | |||||||||||
| Commercial and industrial | $ |
|
$ |
|
|||||||
| CRE |
|
|
|||||||||
| Commercial construction |
|
|
|||||||||
| Lease financing |
|
|
|||||||||
| Consumer: | |||||||||||
| Residential mortgage |
|
|
|||||||||
| Residential home equity and direct |
|
|
|||||||||
| Indirect auto |
|
|
|||||||||
| Indirect other |
|
|
|||||||||
| Total | $ |
|
$ |
|
|||||||
The following table sets forth certain information regarding impaired loans, excluding PCI and LHFS, that were individually evaluated for impairment. This table excludes guaranteed student loans and guaranteed residential mortgages for which there was nominal risk of principal loss due to the government guarantee or other credit enhancements.
| UPB | Recorded Investment | Related ALLL | Average Recorded Investment | Interest Income Recognized | |||||||||||||||||||||||||||||||
|
As of / For The Year Ended December 31, 2019
(Dollars in millions) |
Without an ALLL | With an ALLL | |||||||||||||||||||||||||||||||||
| Commercial: | |||||||||||||||||||||||||||||||||||
| Commercial and industrial | $ |
|
$ |
|
$ |
|
$ |
|
$ |
|
$ |
|
|||||||||||||||||||||||
| CRE |
|
|
|
|
|
|
|||||||||||||||||||||||||||||
| Commercial construction |
|
|
|
|
|
|
|||||||||||||||||||||||||||||
| Lease financing |
|
|
|
|
|
|
|||||||||||||||||||||||||||||
| Consumer: | |||||||||||||||||||||||||||||||||||
| Residential mortgage |
|
|
|
|
|
|
|||||||||||||||||||||||||||||
| Residential home equity and direct |
|
|
|
|
|
|
|||||||||||||||||||||||||||||
| Indirect auto |
|
|
|
|
|
|
|||||||||||||||||||||||||||||
| Indirect other |
|
|
|
|
|
|
|||||||||||||||||||||||||||||
| Credit card |
|
|
|
|
|
|
|||||||||||||||||||||||||||||
| Total | $ |
|
$ |
|
$ |
|
$ |
|
$ |
|
$ |
|
|||||||||||||||||||||||
24 Truist Financial Corporation
TDRs
The following table presents a summary of TDRs:
| (Dollars in millions) | Sep 30, 2020 | Dec 31, 2019 | |||||||||
| Performing TDRs: | |||||||||||
| Commercial: | |||||||||||
| Commercial and industrial | $ |
|
$ |
|
|||||||
| CRE |
|
|
|||||||||
| Commercial construction |
|
|
|||||||||
| Lease financing |
|
|
|||||||||
| Consumer: | |||||||||||
| Residential mortgage |
|
|
|||||||||
| Residential home equity and direct |
|
|
|||||||||
| Indirect auto |
|
|
|||||||||
| Indirect other |
|
|
|||||||||
| Student |
|
|
|||||||||
| Credit card |
|
|
|||||||||
| Total performing TDRs |
|
|
|||||||||
| Nonperforming TDRs |
|
|
|||||||||
| Total TDRs | $ |
|
$ |
|
|||||||
| ALLL attributable to TDRs | $ |
|
$ |
|
|||||||
The primary reason loan modifications were classified as TDRs is summarized below. Balances represent the recorded investment at the end of the quarter in which the modification was made. Rate modifications consist of TDRs made with below market interest rates, including those that also have modifications of loan structures.
| As of / For the Three Months Ended September 30, 2020 | As of / For the Nine Months Ended September 30, 2020 | ||||||||||||||||||||||||||||||||||||||||||||||
| Type of Modification | Prior Quarter Loan Balance | ALLL at Period End | Type of Modification | Prior Quarter Loan Balance | ALLL at Period End | ||||||||||||||||||||||||||||||||||||||||||
| (Dollars in millions) | Rate | Structure | Rate | Structure | |||||||||||||||||||||||||||||||||||||||||||
| Newly designated TDRs: | |||||||||||||||||||||||||||||||||||||||||||||||
| Commercial: | |||||||||||||||||||||||||||||||||||||||||||||||
| Commercial and industrial | $ |
|
$ |
|
$ |
|
$ |
|
$ |
|
$ |
|
$ |
|
$ |
|
|||||||||||||||||||||||||||||||
| CRE |
|
|
|
|
|
|
|
|
|||||||||||||||||||||||||||||||||||||||
| Lease financing |
|
|
|
|
|
|
|
|
|||||||||||||||||||||||||||||||||||||||
| Consumer: | |||||||||||||||||||||||||||||||||||||||||||||||
| Residential mortgage |
|
|
|
|
|
|
|
|
|||||||||||||||||||||||||||||||||||||||
| Residential home equity and direct |
|
|
|
|
|
|
|
|
|||||||||||||||||||||||||||||||||||||||
| Indirect auto |
|
|
|
|
|
|
|
|
|||||||||||||||||||||||||||||||||||||||
| Indirect other |
|
|
|
|
|
|
|
|
|||||||||||||||||||||||||||||||||||||||
| Student |
|
|
|
|
|
|
|
|
|||||||||||||||||||||||||||||||||||||||
| Credit card |
|
|
|
|
|
|
|
|
|||||||||||||||||||||||||||||||||||||||
| Re-modification of previously designated TDRs |
|
|
|
|
|||||||||||||||||||||||||||||||||||||||||||
Truist Financial Corporation 25
| As of / For the Three Months Ended September 30, 2019 | As of / For the Nine Months Ended September 30, 2019 | ||||||||||||||||||||||||||||||||||||||||||||||
| Type of Modification | Prior Quarter Loan Balance | ALLL at Period End | Type of Modification | Prior Quarter Loan Balance | ALLL at Period End | ||||||||||||||||||||||||||||||||||||||||||
| (Dollars in millions) | Rate | Structure | Rate | Structure | |||||||||||||||||||||||||||||||||||||||||||
| Newly designated TDRs: | |||||||||||||||||||||||||||||||||||||||||||||||
| Commercial: | |||||||||||||||||||||||||||||||||||||||||||||||
| Commercial and industrial | $ |
|
$ |
|
$ |
|
$ |
|
$ |
|
$ |
|
$ |
|
$ |
|
|||||||||||||||||||||||||||||||
| CRE |
|
|
|
|
|
|
|
|
|||||||||||||||||||||||||||||||||||||||
| Consumer: | |||||||||||||||||||||||||||||||||||||||||||||||
| Residential mortgage |
|
|
|
|
|
|
|
|
|||||||||||||||||||||||||||||||||||||||
| Residential home equity and direct |
|
|
|
|
|
|
|
|
|||||||||||||||||||||||||||||||||||||||
| Indirect auto |
|
|
|
|
|
|
|
|
|||||||||||||||||||||||||||||||||||||||
| Indirect other |
|
|
|
|
|
|
|
|
|||||||||||||||||||||||||||||||||||||||
| Credit card |
|
|
|
|
|
|
|
|
|||||||||||||||||||||||||||||||||||||||
| Re-modification of previously designated TDRs |
|
|
|
|
|||||||||||||||||||||||||||||||||||||||||||
Charge-offs and forgiveness of principal and interest for TDRs were immaterial for all periods presented.
The re-default balance for modifications that had been classified as TDRs during the previous 12 months that experienced a payment default was $41 million and $19 million for the three months ended September 30, 2020 and 2019, respectively, and $80 million and $58 million for the nine months ended September 30, 2020 and 2019, respectively. Payment default is defined as movement of the TDR to nonperforming status, foreclosure or charge-off, whichever occurs first.
NPAs
The following table presents a summary of nonperforming assets and residential mortgage loans in the process of foreclosure.
| (Dollars in millions) | Sep 30, 2020 | Dec 31, 2019 | |||||||||
| Nonperforming loans and leases HFI (1) | $ |
|
$ |
|
|||||||
| Nonperforming LHFS |
|
|
|||||||||
| Foreclosed real estate |
|
|
|||||||||
| Other foreclosed property |
|
|
|||||||||
| Total nonperforming assets | $ |
|
$ |
|
|||||||
| Residential mortgage loans in the process of foreclosure | $ |
|
$ |
|
|||||||
Unearned Income, Discounts and Net Deferred Loan Fees and Costs
The following table presents additional information about loans and leases:
| (Dollars in millions) | Sep 30, 2020 | Dec 31, 2019 | |||||||||
| Unearned income, discounts and net deferred loan fees and costs, excluding PCI | $ |
|
$ |
|
|||||||
26 Truist Financial Corporation
NOTE 6.
Goodwill and Other Intangible Assets
The changes in the carrying amount of goodwill attributable to operating segments are reflected in the table below. The adjustments for 2020 include measurement period adjustments to the fair value of acquired assets and liabilities and the reallocation of net assets to the underlying reporting units. Adjustments to the fair value of acquired assets include a $
193
million reduction in the fair value mark for loans and leases and a $
202
million increase in CDI and other intangibles, each recorded to goodwill net of deferred taxes. The adjustments to CDI and other intangibles did not have a material impact to estimated amortization expense for the next five years. Adjustments to the reallocation of net assets to Truist's reporting units include updates to the estimated operating results, and the finalization of corporate expense allocations based on the various drivers that Truist applies in allocating such costs. Refer to “Note 2. Business Combinations” and “Note 18. Operating Segments” for additional information.
| (Dollars in millions) | CB&W | C&CB | IH | Total | |||||||||||||||||||
| Goodwill, January 1, 2019 | $ |
|
$ |
|
$ |
|
$ |
|
|||||||||||||||
| Mergers and acquisitions |
|
|
|
|
|||||||||||||||||||
| Adjustments |
|
|
(
|
(
|
|||||||||||||||||||
| Goodwill, December 31, 2019 | $ |
|
$ |
|
$ |
|
$ |
|
|||||||||||||||
| Mergers and acquisitions |
|
|
|
|
|||||||||||||||||||
| Adjustments |
|
(
|
|
(
|
|||||||||||||||||||
| Goodwill, September 30, 2020 | $ |
|
$ |
|
$ |
|
$ |
|
|||||||||||||||
The following table, which excludes fully amortized intangibles, presents information for identifiable intangible assets:
| September 30, 2020 | December 31, 2019 | ||||||||||||||||||||||||||||||||||
| (Dollars in millions) | Gross Carrying Amount | Accumulated Amortization | Net Carrying Amount | Gross Carrying Amount | Accumulated Amortization | Net Carrying Amount | |||||||||||||||||||||||||||||
| CDI | $ |
|
$ |
(
|
$ |
|
$ |
|
$ |
(
|
$ |
|
|||||||||||||||||||||||
|
Other, primarily client relationship intangibles
|
|
(
|
|
|
(
|
|
|||||||||||||||||||||||||||||
| Total | $ |
|
$ |
(
|
$ |
|
$ |
|
$ |
(
|
$ |
|
|||||||||||||||||||||||
Truist performed a qualitative assessment of current events and circumstances, including the continuing effects of the COVID-19 pandemic, concluding that it was not more-likely-than-not that the fair value of one or more of its reporting units is below its respective carrying amount as of September 30, 2020, and therefore no triggering event occurred that required a quantitative goodwill impairment test.
NOTE 7.
Loan Servicing
The Company acquires servicing rights and retains servicing rights for certain of its sales or securitizations of residential mortgages and commercial loans. Servicing rights on residential and commercial mortgages are capitalized by the Company as MSRs on the Consolidated Balance Sheets. Income earned by the Company on its residential MSRs is derived primarily from contractually specified mortgage servicing fees and late fees, net of curtailment costs. Income earned by the Company on its commercial mortgage servicing rights is derived primarily from contractually specified servicing fees and other ancillary fees.
Residential Mortgage
Activities
The following tables summarize residential mortgage servicing activities:
| (Dollars in millions) | Sep 30, 2020 | Dec 31, 2019 | ||||||||||||
| UPB of residential mortgage loan servicing portfolio | $ |
|
$ |
|
||||||||||
|
UPB of residential mortgage loans serviced for others, primarily agency conforming fixed rate
|
|
|
||||||||||||
| Mortgage loans sold with recourse |
|
|
||||||||||||
| Maximum recourse exposure from mortgage loans sold with recourse liability |
|
|
||||||||||||
| Indemnification, recourse and repurchase reserves |
|
|
||||||||||||
|
As of / For the Nine Months Ended September 30,
(Dollars in millions) |
2020 | 2019 | ||||||||||||
| UPB of residential mortgage loans sold from LHFS | $ |
|
$ |
|
||||||||||
| Pre-tax gains recognized on mortgage loans sold and held for sale |
|
|
||||||||||||
| Servicing fees recognized from mortgage loans serviced for others |
|
|
||||||||||||
|
Approximate weighted average servicing fee on the outstanding balance of residential mortgage loans serviced for others
|
|
% |
|
% | ||||||||||
| Weighted average interest rate on mortgage loans serviced for others |
|
|
||||||||||||
Truist Financial Corporation 27
The following table presents a roll forward of the carrying value of residential MSRs recorded at fair value:
|
Nine Months Ended September 30,
(Dollars in millions) |
2020 | 2019 | ||||||||||||
| Residential MSRs, carrying value, January 1 | $ |
|
$ |
|
||||||||||
| Additions |
|
|
||||||||||||
| Change in fair value due to changes in valuation inputs or assumptions: | ||||||||||||||
| Prepayment speeds |
(
|
(
|
||||||||||||
| OAS |
|
|
||||||||||||
| Realization of expected net servicing cash flows, passage of time and other |
(
|
(
|
||||||||||||
| Residential MSRs, carrying value, September 30 | $ |
|
$ |
|
||||||||||
The sensitivity of the fair value of the Company's residential MSRs to changes in key assumptions is presented in the following table:
| September 30, 2020 | December 31, 2019 | ||||||||||||||||||||||||||||||||||
| Range | Weighted Average | Range | Weighted Average | ||||||||||||||||||||||||||||||||
| (Dollars in millions) | Min | Max | Min | Max | |||||||||||||||||||||||||||||||
| Prepayment speed |
|
% |
|
% |
|
% |
|
% |
|
% |
|
% | |||||||||||||||||||||||
| Effect on fair value of a 10% increase | $ |
(
|
$ |
(
|
|||||||||||||||||||||||||||||||
| Effect on fair value of a 20% increase |
(
|
(
|
|||||||||||||||||||||||||||||||||
| OAS |
|
% |
|
% |
|
% |
|
% |
|
% |
|
% | |||||||||||||||||||||||
| Effect on fair value of a 10% increase | $ |
(
|
$ |
(
|
|||||||||||||||||||||||||||||||
| Effect on fair value of a 20% increase |
(
|
(
|
|||||||||||||||||||||||||||||||||
| Composition of loans serviced for others: | |||||||||||||||||||||||||||||||||||
| Fixed-rate residential mortgage loans |
|
% |
|
% | |||||||||||||||||||||||||||||||
|
Adjustable-rate residential mortgage loans
|
|
|
|||||||||||||||||||||||||||||||||
| Total |
|
% |
|
% | |||||||||||||||||||||||||||||||
| Weighted average life |
|
|
|||||||||||||||||||||||||||||||||
The sensitivity calculations above are hypothetical and should not be considered to be predictive of future performance. As indicated, changes in fair value based on adverse changes in assumptions generally cannot be extrapolated because the relationship of the change in assumption to the change in fair value may not be linear. Also, in the above table, the effect of an adverse variation in one assumption on the fair value of the MSRs is calculated without changing any other assumption; while in reality, changes in one factor may result in changes in another, which may magnify or counteract the effect of the change. See "Note 15. Fair Value Disclosures" for additional information on the valuation techniques used.
Commercial Mortgage Activities
The following table summarizes commercial mortgage servicing activities for the periods presented:
| (Dollars in millions) | Sep 30, 2020 | Dec 31, 2019 | |||||||||
| UPB of CRE mortgages serviced for others | $ |
|
$ |
|
|||||||
| CRE mortgages serviced for others covered by recourse provisions |
|
|
|||||||||
| Maximum recourse exposure from CRE mortgages sold with recourse liability |
|
|
|||||||||
| Recorded reserves related to recourse exposure |
|
|
|||||||||
| CRE mortgages originated during the year-to-date period |
|
|
|||||||||
| Commercial MSRs at fair value |
|
|
|||||||||
In the third quarter of 2020, the Company transferred certain servicing activities involving cancellable servicing rights to third parties, resulting in a decrease in the UPB of CRE mortgages serviced for others. This transfer did not materially impact commercial MSRs.
28 Truist Financial Corporation
NOTE 8.
Other Assets and Liabilities
Lessee Operating and Finance Leases
The Company leases certain assets, consisting primarily of real estate, and assesses at contract inception whether a contract is, or contains, a lease. At September 30, 2020, the Company had
$
37
million
of operating leases that had not yet commenced.
The following tables present additional information on leases, and excludes assets related to the lease financing businesses:
| September 30, 2020 | December 31, 2019 | ||||||||||||||||||||||
| (Dollars in millions) | Operating Leases | Finance Leases | Operating Leases | Finance Leases | |||||||||||||||||||
| ROU assets | $ |
|
$ |
|
$ |
|
$ |
|
|||||||||||||||
| Lease liabilities |
|
|
|
|
|||||||||||||||||||
| Weighted average remaining term |
|
|
|
|
|||||||||||||||||||
| Weighted average discount rate |
|
% |
|
% |
|
% |
|
% | |||||||||||||||
| Three Months Ended September 30, | Nine Months Ended September 30, | ||||||||||||||||||||||
| (Dollars in millions) | 2020 | 2019 | 2020 | 2019 | |||||||||||||||||||
| Operating lease costs | $ |
|
$ |
|
$ |
|
$ |
|
|||||||||||||||
Lessor Operating Leases
The Company’s two primary lessor businesses are equipment financing and structured real estate with income recorded in Operating lease income on the Consolidated Statements of Income.
The following table presents a summary of assets under operating leases and activity related to assets under operating leases. This table excludes subleases on assets included in premises and equipment.
| (Dollars in millions) | Sep 30, 2020 | Dec 31, 2019 | ||||||||||||
| Assets held under operating leases (1) | $ |
|
$ |
|
||||||||||
| Accumulated depreciation |
(
|
(
|
||||||||||||
| Net | $ |
|
$ |
|
||||||||||
The residual value of assets no longer under operating leases was immaterial.
Bank-Owned Life Insurance
Bank-owned life insurance consists of life insurance policies held on certain employees for which the Company is the beneficiary. These policies provide the Company an efficient form of funding for retirement and other employee benefits costs. The carrying value of bank-owned life insurance was $
6.5
billion at September 30, 2020 and $
6.4
billion December 31, 2019.
Truist Financial Corporation 29
NOTE 9.
Borrowings
The following table presents a summary of short-term borrowings:
| (Dollars in millions) | Sep 30, 2020 | Dec 31, 2019 | ||||||||||||
| Federal funds purchased | $ |
|
$ |
|
||||||||||
| Securities sold under agreements to repurchase |
|
|
||||||||||||
| FHLB advances |
|
|
||||||||||||
| Dealer collateral |
|
|
||||||||||||
| Master notes |
|
|
||||||||||||
| Other short-term borrowings |
|
|
||||||||||||
| Total short-term borrowings | $ |
|
$ |
|
||||||||||
The following table presents a summary of long-term debt:
| (Dollars in millions) | Sep 30, 2020 | Dec 31, 2019 | |||||||||
| Truist Financial Corporation: | |||||||||||
| Fixed rate senior notes | $ |
|
$ |
|
|||||||
| Floating rate senior notes |
|
|
|||||||||
| Fixed rate subordinated notes |
|
|
|||||||||
| Capital notes |
|
|
|||||||||
| Structured notes (1) |
|
|
|||||||||
| Truist Bank: | |||||||||||
| Fixed rate senior notes |
|
|
|||||||||
| Floating rate senior notes |
|
|
|||||||||
| Fixed rate subordinated notes |
|
|
|||||||||
|
FHLB advances
|
|
|
|||||||||
| Other long-term debt (2) |
|
|
|||||||||
| Nonbank subsidiaries: | |||||||||||
| Other long-term debt (3) |
|
|
|||||||||
| Total long-term debt | $ |
|
$ |
|
|||||||
30 Truist Financial Corporation
NOTE 10.
Shareholders' Equity
Common Stock Dividends
The following table presents the dividends declared related to common stock. For information related to preferred stock dividends, see “Note 12. Shareholders' Equity” of the Annual Report on Form 10-K for the year ended December 31, 2019.
| Three Months Ended September 30, | Nine Months Ended September 30, | |||||||||||||||||||||||||
| 2020 | 2019 | 2020 | 2019 | |||||||||||||||||||||||
| Cash dividends declared per share | $ |
|
$ |
|
$ |
|
$ |
|
||||||||||||||||||
Preferred Stock
On March 16, 2020, the Company redeemed all outstanding
5,000
shares of its perpetual preferred stock series K and the corresponding depositary shares representing fractional interests in each series for $
500
million plus any unpaid dividends. The preferred stock redemption was in accordance with the terms of the Company’s Articles of Amendment to its Articles of Incorporation, effective as of December 6, 2019.
During 2020, Truist issued a total of $
3.5
billion in preferred stock to further strengthen its capital position. With its first issuance on May 27, 2020, Truist issued $
575
million of series O non-cumulative perpetual preferred stock with a stated dividend rate of
5.250
% per annum for net proceeds of $
559
million. Dividends, if declared by the Board of Directors, are payable on the first day of March, June, September and December of each year, commencing on September 1, 2020. Truist issued depositary shares, each of which represents a 1/1,000th ownership interest in a share of the
23,000
shares of the Company's series O preferred stock. The preferred stock has no stated maturity and redemption is solely at the option of the Company in whole, but not in part, within 90 days following a regulatory capital treatment event, as defined in the prospectus. In addition, the preferred stock may be redeemed in whole or in part, on June 1, 2025, or on any dividend payment date thereafter.
On June 1, 2020, Truist issued $
1.0
billion of series P non-cumulative perpetual preferred stock in its second issuance during 2020 with a stated dividend rate of
4.950
% per annum for net proceeds of $
992
million. Dividends, if declared by the Board of Directors, are payable on the first day of June and December of each year, commencing on December 1, 2020. The dividend rate will reset on December 1, 2025, and on each following fifth anniversary of the reset date to the five-year U.S. Treasury rate plus 4.605%. Truist issued depositary shares, each of which represents a 1/25th fractional ownership interest in a share of the
40,000
shares of the Company's series P preferred stock. The preferred stock has no stated maturity and redemption is solely at the option of the Company in whole, but not in part, within 90 days following a regulatory capital treatment event, as defined in the prospectus. In addition, the preferred stock may be redeemed in whole or in part during the three-months prior to and including each reset date.
On June 19, 2020, Truist issued $
1.0
billion of series Q non-cumulative perpetual preferred stock in its third issuance during 2020 with a stated dividend rate of
5.100
% per annum for net proceeds of $
992
million. Dividends, if declared by the Board of Directors, are payable on the first day of March and September of each year, commencing on March 1, 2021. The dividend rate will reset on September 1, 2030, and on each following tenth anniversary of the reset date to the ten-year U.S. Treasury rate plus 4.349%. Truist issued depositary shares, each of which represents a 1/25th fractional ownership interest in a share of the
40,000
shares of the Company's series Q preferred stock. The preferred stock has no stated maturity and redemption is solely at the option of the Company in whole, but not in part, within 90 days following a regulatory capital treatment event, as defined in the prospectus. In addition, the preferred stock may be redeemed in whole or in part during the six-month period prior to and including the reset date.
On August 3, 2020, Truist issued $
925
million of series R non-cumulative perpetual preferred stock in its fourth issuance during 2020 with a stated dividend rate of
4.750
% per annum for net proceeds of $
907
million. Dividends, if declared by the Board of Directors, are payable on the first day of March, June, September and December of each year, commencing on December 1, 2020. Truist issued depositary shares, each of which represents a 1/1,000th ownership interest in a share of the
37,000
shares of the Company's series R preferred stock. The preferred stock has no stated maturity and redemption is solely at the option of the Company in whole, but not in part, within 90 days following a regulatory capital treatment event, as defined in the prospectus. In addition, the preferred stock may be redeemed in whole or in part, on September 1, 2025, or on any dividend payment date thereafter.
Truist Financial Corporation 31
NOTE 11.
AOCI
AOCI includes the after-tax change in unrecognized net costs related to defined benefit pension and OPEB plans as well as unrealized gains and losses on cash flow hedges and AFS securities.
|
Three Months Ended September 30, 2020 and 2019
(Dollars in millions) |
Pension and OPEB Costs | Cash Flow Hedges | AFS Securities | Other, net | Total | ||||||||||||||||||||||||
| AOCI balance, July 1, 2019 | $ |
(
|
$ |
(
|
$ |
|
$ |
(
|
$ |
(
|
|||||||||||||||||||
| OCI before reclassifications, net of tax |
(
|
|
|
|
|
||||||||||||||||||||||||
| Amounts reclassified from AOCI: | |||||||||||||||||||||||||||||
| Before tax |
|
|
|
|
|
||||||||||||||||||||||||
| Tax effect |
|
|
|
|
|
||||||||||||||||||||||||
| Amounts reclassified, net of tax |
|
|
|
|
|
||||||||||||||||||||||||
| Total OCI, net of tax |
(
|
|
|
|
|
||||||||||||||||||||||||
| AOCI balance, September 30, 2019 | $ |
(
|
$ |
(
|
$ |
|
$ |
(
|
$ |
(
|
|||||||||||||||||||
| AOCI balance, July 1, 2020 | $ |
(
|
$ |
(
|
$ |
|
$ |
(
|
$ |
|
|||||||||||||||||||
| OCI before reclassifications, net of tax |
(
|
|
(
|
|
(
|
||||||||||||||||||||||||
| Amounts reclassified from AOCI: | |||||||||||||||||||||||||||||
| Before tax |
|
|
|
|
|
||||||||||||||||||||||||
| Tax effect |
|
|
|
|
|
||||||||||||||||||||||||
| Amounts reclassified, net of tax |
|
|
|
|
|
||||||||||||||||||||||||
| Total OCI, net of tax |
(
|
|
(
|
|
(
|
||||||||||||||||||||||||
| AOCI balance, September 30, 2020 | $ |
(
|
$ |
(
|
$ |
|
$ |
(
|
$ |
|
|||||||||||||||||||
|
Nine Months Ended September 30, 2020 and 2019
(Dollars in millions) |
Pension and OPEB Costs | Cash Flow Hedges | AFS Securities | Other, net | Total | ||||||||||||||||||||||||
| AOCI balance, January 1, 2019 | $ |
(
|
$ |
(
|
$ |
(
|
$ |
(
|
$ |
(
|
|||||||||||||||||||
| OCI before reclassifications, net of tax |
(
|
(
|
|
|
|
||||||||||||||||||||||||
| Amounts reclassified from AOCI: | |||||||||||||||||||||||||||||
| Before tax |
|
|
(
|
|
|
||||||||||||||||||||||||
| Tax effect |
|
|
(
|
|
|
||||||||||||||||||||||||
| Amounts reclassified, net of tax |
|
|
(
|
|
|
||||||||||||||||||||||||
| Total OCI, net of tax |
(
|
(
|
|
|
|
||||||||||||||||||||||||
| AOCI balance, September 30, 2019 | $ |
(
|
$ |
(
|
$ |
|
$ |
(
|
$ |
(
|
|||||||||||||||||||
| AOCI balance, January 1, 2020 | $ |
(
|
$ |
(
|
$ |
|
$ |
(
|
$ |
(
|
|||||||||||||||||||
| OCI before reclassifications, net of tax |
(
|
|
|
(
|
|
||||||||||||||||||||||||
| Amounts reclassified from AOCI: | |||||||||||||||||||||||||||||
| Before tax |
|
|
(
|
|
(
|
||||||||||||||||||||||||
| Tax effect |
|
|
(
|
|
(
|
||||||||||||||||||||||||
| Amounts reclassified, net of tax |
|
|
(
|
|
(
|
||||||||||||||||||||||||
| Total OCI, net of tax |
|
|
|
(
|
|
||||||||||||||||||||||||
| AOCI balance, September 30, 2020 | $ |
(
|
$ |
(
|
$ |
|
$ |
(
|
$ |
|
|||||||||||||||||||
|
Primary income statement location of amounts reclassified from AOCI
|
Other expense | Net interest income | Securities gains (losses) and Net interest income | Net interest income | |||||||||||||||||||||||||
32 Truist Financial Corporation
NOTE 12.
Income Taxes
NOTE 13.
Benefit Plans
The components of net periodic benefit cost for defined benefit pension plans are summarized in the following table:
| Three Months Ended September 30, | Nine Months Ended September 30, | |||||||||||||||||||||||||
| (Dollars in millions) | Income Statement Location | 2020 | 2019 | 2020 | 2019 | |||||||||||||||||||||
| Service cost | Personnel expense | $ |
|
$ |
|
$ |
|
$ |
|
|||||||||||||||||
| Interest cost | Other expense |
|
|
|
|
|||||||||||||||||||||
| Estimated return on plan assets | Other expense |
(
|
(
|
(
|
(
|
|||||||||||||||||||||
| Amortization and other | Other expense |
|
|
|
|
|||||||||||||||||||||
| Net periodic (benefit) cost | $ |
|
$ |
|
$ |
|
$ |
|
||||||||||||||||||
Truist makes contributions to the qualified pension plans in amounts between the minimum required for funding and the maximum deductible for federal income tax purposes. Discretionary contributions totaling $
373
million were made to the Truist pension plan during the nine months ended September 30, 2020. There are no required contributions for the remainder of 2020.
NOTE 14.
Commitments and Contingencies
Truist utilizes a variety of financial instruments to meet the financing needs of clients and to reduce exposure to fluctuations in interest rates. These financial instruments include commitments to extend credit, letters of credit and financial guarantees and derivatives. Truist also has commitments to fund certain affordable housing investments and contingent liabilities related to certain sold loans.
Tax Credit and Certain Equity Investments
The Company invests in certain affordable housing projects throughout its market area as a means of supporting local communities. Truist receives tax credits related to these investments, for which the Company typically acts as a limited partner and therefore does not exert control over the operating or financial policies of the partnerships.
The following table summarizes certain tax credit, private equity, and certain other equity method investments.
| (Dollars in millions) | Balance Sheet Location | Sep 30, 2020 | Dec 31, 2019 | |||||||||||
| Investments in affordable housing projects: | ||||||||||||||
| Carrying amount | Other assets | $ |
|
$ |
|
|||||||||
| Amount of future funding commitments included in carrying amount | Other liabilities |
|
|
|||||||||||
| Lending exposure | NA |
|
|
|||||||||||
| Renewable energy investments: | ||||||||||||||
| Carrying amount | Other assets |
|
|
|||||||||||
| Amount of future funding commitments not included in carrying amount | NA |
|
|
|||||||||||
| Private equity and certain other equity method investments: | ||||||||||||||
| Carrying amount | Other assets |
|
|
|||||||||||
| Amount of future funding commitments not included in carrying amount | NA |
|
|
|||||||||||
Truist Financial Corporation 33
The following table presents a summary of tax credits and amortization associated with the Company's tax credit investment activity:
| Three Months Ended September 30, | Nine Months Ended September 30, | |||||||||||||||||||||||||
| (Dollars in millions) | Income Statement Location | 2020 | 2019 | 2020 | 2019 | |||||||||||||||||||||
| Tax credits: | ||||||||||||||||||||||||||
| Investments in affordable housing projects | Provision for income taxes | $ |
|
$ |
|
$ |
|
$ |
|
|||||||||||||||||
| Other community development investments | Provision for income taxes |
|
|
|
|
|||||||||||||||||||||
| Renewable energy investments | NA |
|
|
|
|
|||||||||||||||||||||
| Amortization and other changes in carrying amount: | ||||||||||||||||||||||||||
| Investments in affordable housing projects | Provision for income taxes | $ |
|
$ |
|
$ |
|
$ |
|
|||||||||||||||||
| Other community development investments | Other noninterest income |
|
|
|
|
|||||||||||||||||||||
| Renewable energy investments | Other noninterest income |
|
|
|
|
|||||||||||||||||||||
Letters of Credit and Financial Guarantees
In the normal course of business, Truist utilizes certain financial instruments to meet the financing needs of clients and to mitigate exposure to risks. Such financial instruments include commitments to extend credit and certain contractual agreements, including standby letters of credit and financial guarantee arrangements.
The following is a summary of selected notional amounts of off-balance sheet financial instruments:
| (Dollars in millions) | September 30, 2020 | December 31, 2019 | |||||||||
| Commitments to extend, originate or purchase credit | $ |
|
$ |
|
|||||||
| Residential mortgage loans sold with recourse |
|
|
|||||||||
| CRE mortgages serviced for others covered by recourse provisions |
|
|
|||||||||
| Letters of credit |
|
|
|||||||||
Total Return Swaps
The Company facilitates matched book TRS transactions on behalf of clients, whereby a VIE purchases reference assets identified by a client and the Company enters into a TRS with the VIE, with a mirror-image TRS facing the client. The Company provides senior financing to the VIE in the form of demand notes to fund the purchase of the reference assets. The TRS contracts pass through interest and other cash flows on the reference assets to the third party clients, along with exposing those clients to decreases in value on the assets and providing them with the rights to appreciation on the assets. The terms of the TRS contracts require the third parties to post initial margin collateral, as well as ongoing margin as the fair values of the underlying reference assets change.
The Company concluded that the VIEs should be consolidated because the Company has (i) the power to direct the activities that most significantly impact the economic performance of the VIE and (ii) the obligation to absorb losses, and the right to receive benefits, that could potentially be significant. At September 30, 2020, the Company’s Consolidated Balance Sheet reflected $
1.5
billion of assets and $
40
million of other liabilities of the VIEs. At December 31, 2019, the Company’s Consolidated Balance Sheet reflected $
2.7
billion of assets and $
116
million of other liabilities of the VIEs. Assets at September 30, 2020 and December 31, 2019 include $
1.4
billion and $
2.6
billion in trading loans, respectively. The activities of the VIEs are restricted to buying and selling the reference assets and the risks/benefits of any such assets owned by the VIEs are passed to the third party clients via the TRS contracts.
For additional information on the Company’s TRS contracts and its involvement with these VIEs, see "Note 16. Derivative Financial Instruments.”
34 Truist Financial Corporation
Pledged Assets
Certain assets were pledged to secure municipal deposits, securities sold under agreements to repurchase, certain derivative agreements, and borrowings or borrowing capacity, as well as for other purposes as required or permitted by law. Assets pledged to the FHLB and FRB are subject to applicable asset discounts when determining borrowing capacity. The Company obtains secured financing and letters of credit from the FRB and FHLB. The Company’s letters of credit from the FHLB can be used to secure various client deposits, including public fund relationships. Excluding assets related to employee benefit plans, the majority of the agreements governing the pledged assets do not permit the other party to sell or repledge the collateral. Additional assets were pledged to the FRB of Richmond in the first quarter of 2020 following the Merger.
The following table provides the total carrying amount of pledged assets by asset type.
| (Dollars in millions) | Sep 30, 2020 | Dec 31, 2019 | ||||||||||||
| Pledged securities | $ |
|
$ |
|
||||||||||
| Pledged loans: | ||||||||||||||
| FRB |
|
|
||||||||||||
| FHLB |
|
|
||||||||||||
| Unused borrowing capacity: | ||||||||||||||
| FRB |
|
|
||||||||||||
| FHLB |
|
|
||||||||||||
Litigation and Regulatory Matters
Truist and/or its subsidiaries are routinely parties to numerous legal proceedings, including private, civil litigation and regulatory investigations, arising from the ordinary conduct of its regular business activities. The matters range from individual actions involving a single plaintiff to class action lawsuits with multiple class members and can involve claims for substantial amounts. Investigations involve both formal and informal proceedings, by both governmental agencies and self-regulatory organizations. These legal proceedings are at varying stages of adjudication, arbitration or investigation and may consist of a variety of claims, including common law tort and contract claims and statutory antitrust, securities and consumer protection claims, and the ultimate resolution of any proceedings is uncertain and inherently difficult to predict. It is possible that the ultimate resolution of these matters, if unfavorable, may be material to the consolidated financial position, consolidated results of operations, or consolidated cash flows of Truist.
In accordance with the provisions of U.S. GAAP for contingencies, Truist establishes accruals for legal matters when potential losses associated with the actions become probable and the amount of loss can be reasonably estimated. There is no assurance that the ultimate resolution of these matters will not significantly exceed the amounts that Truist has currently accrued. On a quarterly basis, Truist evaluates its outstanding legal proceedings to assess litigation accruals and adjust such accruals upwards or downward, as appropriate, based on management’s best judgment after consultation with counsel and others, as warranted.
The Company’s estimate of reasonably possible losses, in excess of amounts accrued, ranges from
zero
to approximately $
200
million as of September 30, 2020. This estimated range is based upon currently available information and involves considerable judgment, given that claims often include significant legal uncertainties, damages alleged by plaintiffs are often unspecified or overstated, discovery may not have started or may not be complete, and material facts may be disputed or unsubstantiated, among other factors. In addition, the matters underlying this estimated range will change from time to time, and actual losses may vary significantly from this estimate. For the same reasons stated above, we do not believe that an estimate of reasonably possible losses can be made for certain matters and therefore such matters are not reflected in the range provided here.
The following is a description of certain legal proceedings in which Truist is involved:
Bickerstaff v. SunTrust Bank
This class action case was filed in the Fulton County State Court on July 12, 2010, and an amended complaint was filed on August 9, 2010. Plaintiff asserts that all overdraft fees charged to his account which related to debit card and ATM transactions are actually interest charges and therefore subject to the usury laws of Georgia. Plaintiff has brought claims for violations of civil and criminal usury laws, conversion, and money had and received. On October 6, 2017, the trial court granted plaintiff's motion for class certification and defined the class as “Every Georgia citizen who had or has one or more accounts with SunTrust Bank and who, from July 12, 2006, to October 6, 2017 (i) had at least one overdraft of $500.00 or less resulting from an ATM or debit card transaction (the “Transaction”); (ii) paid any Overdraft Fees as a result of the Transaction; and (iii) did not receive a refund of those Fees” and the granting of a certified class was affirmed on appeal. On April 8, 2020, the Company filed a motion seeking to narrow the scope of this class and on May 29, 2020, it filed a renewed motion to compel arbitration of the claims of some of the class members. Discovery has commenced. The Company believes that the claims are without merit.
Truist Financial Corporation 35
NOTE 15.
Fair Value Disclosures
Recurring Fair Value Measurements
Accounting standards define fair value as the price that would be received on the measurement date to sell an asset or the price paid to transfer a liability in the principal or most advantageous market available to the entity in an orderly transaction between market participants, with a three level measurement hierarchy:
•
Level 1: Quoted prices for identical instruments in active markets
•
Level 2: Quoted prices for similar instruments in active markets; quoted prices for identical or similar instruments in markets that are not active; and model-derived valuations in which all significant inputs are observable in active markets
•
Level 3: Valuations derived from valuation techniques in which one or more significant inputs are unobservable
The following tables present fair value information for assets and liabilities measured at fair value on a recurring basis:
|
September 30, 2020
(Dollars in millions) |
Total | Level 1 | Level 2 | Level 3 | Netting Adjustments (1) | |||||||||||||||||||||||||||
| Assets: | ||||||||||||||||||||||||||||||||
| Trading assets: | ||||||||||||||||||||||||||||||||
| U.S. Treasury | $ |
|
$ |
|
$ |
|
$ |
|
$ | — | ||||||||||||||||||||||
| GSE |
|
|
|
|
— | |||||||||||||||||||||||||||
| Agency MBS - residential |
|
|
|
|
— | |||||||||||||||||||||||||||
| States and political subdivisions |
|
|
|
|
— | |||||||||||||||||||||||||||
| Corporate and other debt securities |
|
|
|
|
— | |||||||||||||||||||||||||||
| Loans |
|
|
|
|
— | |||||||||||||||||||||||||||
| Other |
|
|
|
|
— | |||||||||||||||||||||||||||
| Total trading assets |
|
|
|
|
— | |||||||||||||||||||||||||||
| AFS securities: | ||||||||||||||||||||||||||||||||
| U.S. Treasury |
|
|
|
|
— | |||||||||||||||||||||||||||
| GSE |
|
|
|
|
— | |||||||||||||||||||||||||||
| Agency MBS - residential |
|
|
|
|
— | |||||||||||||||||||||||||||
| Agency MBS - commercial |
|
|
|
|
— | |||||||||||||||||||||||||||
| States and political subdivisions |
|
|
|
|
— | |||||||||||||||||||||||||||
| Other |
|
|
|
|
— | |||||||||||||||||||||||||||
| Total AFS securities |
|
|
|
|
— | |||||||||||||||||||||||||||
| LHFS at fair value |
|
|
|
|
— | |||||||||||||||||||||||||||
| MSRs at fair value |
|
|
|
|
— | |||||||||||||||||||||||||||
| Other assets: | ||||||||||||||||||||||||||||||||
| Derivative assets |
|
|
|
|
(
|
|||||||||||||||||||||||||||
| Equity securities |
|
|
|
|
— | |||||||||||||||||||||||||||
| Total assets | $ |
|
$ |
|
$ |
|
$ |
|
$ |
(
|
||||||||||||||||||||||
| Liabilities: | ||||||||||||||||||||||||||||||||
| Derivative liabilities | $ |
|
$ |
|
$ |
|
$ |
|
$ |
(
|
||||||||||||||||||||||
| Securities sold short |
|
|
|
|
— | |||||||||||||||||||||||||||
| Total liabilities | $ |
|
$ |
|
$ |
|
$ |
|
$ |
(
|
||||||||||||||||||||||
36 Truist Financial Corporation
|
December 31, 2019
(Dollars in millions) |
Total | Level 1 | Level 2 | Level 3 | Netting Adjustments (1) | |||||||||||||||||||||||||||
| Assets: | ||||||||||||||||||||||||||||||||
| Trading assets: | ||||||||||||||||||||||||||||||||
| U.S. Treasury | $ |
|
$ |
|
$ |
|
$ |
|
$ | — | ||||||||||||||||||||||
| GSE |
|
|
|
|
— | |||||||||||||||||||||||||||
| Agency MBS - residential |
|
|
|
|
— | |||||||||||||||||||||||||||
| Agency MBS - commercial |
|
|
|
|
— | |||||||||||||||||||||||||||
| States and political subdivisions |
|
|
|
|
— | |||||||||||||||||||||||||||
| Non-agency MBS |
|
|
|
|
— | |||||||||||||||||||||||||||
| Corporate and other debt securities |
|
|
|
|
— | |||||||||||||||||||||||||||
| Loans |
|
|
|
|
— | |||||||||||||||||||||||||||
| Other |
|
|
|
|
— | |||||||||||||||||||||||||||
| Total trading assets |
|
|
|
|
— | |||||||||||||||||||||||||||
| AFS securities: | ||||||||||||||||||||||||||||||||
| U.S. Treasury |
|
|
|
|
— | |||||||||||||||||||||||||||
| GSE |
|
|
|
|
— | |||||||||||||||||||||||||||
| Agency MBS - residential |
|
|
|
|
— | |||||||||||||||||||||||||||
| Agency MBS - commercial |
|
|
|
|
— | |||||||||||||||||||||||||||
| States and political subdivisions |
|
|
|
|
— | |||||||||||||||||||||||||||
| Non-agency MBS |
|
|
|
|
— | |||||||||||||||||||||||||||
| Other |
|
|
|
|
— | |||||||||||||||||||||||||||
| Total AFS securities |
|
|
|
|
— | |||||||||||||||||||||||||||
| LHFS |
|
|
|
|
— | |||||||||||||||||||||||||||
| MSRs |
|
|
|
|
— | |||||||||||||||||||||||||||
| Other assets: | ||||||||||||||||||||||||||||||||
| Derivative assets |
|
|
|
|
(
|
|||||||||||||||||||||||||||
| Equity securities |
|
|
|
|
— | |||||||||||||||||||||||||||
| Private equity investments |
|
|
|
|
— | |||||||||||||||||||||||||||
| Total assets | $ |
|
$ |
|
$ |
|
$ |
|
$ |
(
|
||||||||||||||||||||||
| Liabilities: | ||||||||||||||||||||||||||||||||
| Derivative liabilities | $ |
|
$ |
|
$ |
|
$ |
|
$ |
(
|
||||||||||||||||||||||
| Securities sold short |
|
|
|
|
— | |||||||||||||||||||||||||||
| Total liabilities | $ |
|
$ |
|
$ |
|
$ |
|
$ |
(
|
||||||||||||||||||||||
(1)
Refer to "Note 16. Derivative Financial Instruments" for additional discussion on netting adjustments.
During the second quarter of 2020, as a result of a change in control of the funds’ manager, the Company deconsolidated certain SBIC funds for which it had previously concluded that it was the primary beneficiary. Following the deconsolidation, the investments in SBIC funds are valued based on net asset value per unit, as provided by the fund manager as a practical expedient, which approximates the fair value, and have not been classified in the fair value hierarchy. The SBIC funds in which the Company invests primarily focus on equity and subordinated debt investments in privately-held middle market companies. The majority of these VIE investments are not redeemable and distributions are received as the underlying assets of the funds liquidate. The timing of distributions, which are expected to occur on various dates through 2030, is uncertain and dependent on various events such as recapitalizations, refinance transactions and ownership changes among others. As of September 30, 2020, restrictions on the ability to sell the investments include, but are not limited to, consent of a majority member or general partner approval for transfer of ownership. These investments are spread over numerous privately-held middle market companies, and thus the sensitivity to a change in fair value for any single investment is limited. At September 30, 2020, investments totaling $
281
million have been excluded from the table above as valued based on net asset value as a practical expedient.
For a description of the valuation techniques and significant inputs for Level 2 and Level 3 assets and liabilities that are measured at fair value on a recurring basis, see “Note 18. Fair Value Disclosures” of the Annual Report on Form 10-K for the year ended December 31, 2019.
Truist Financial Corporation 37
Activity for Level 3 assets and liabilities is summarized below:
|
Three Months Ended
(Dollars in millions) |
Trading Assets | Non-agency MBS | MSRs | Net Derivatives | Private Equity Investments | ||||||||||||||||||||||||
| Balance at July 1, 2019 | $ |
|
$ |
|
$ |
|
$ |
|
$ |
|
|||||||||||||||||||
| Total realized and unrealized gains (losses): | |||||||||||||||||||||||||||||
| Included in earnings |
|
|
(
|
|
|
||||||||||||||||||||||||
| Included in unrealized net holding gains (losses) in OCI |
|
(
|
|
|
|
||||||||||||||||||||||||
| Purchases |
|
|
|
(
|
|
||||||||||||||||||||||||
| Issuances |
|
|
|
|
|
||||||||||||||||||||||||
| Sales |
(
|
|
|
|
(
|
||||||||||||||||||||||||
| Settlements |
|
(
|
(
|
(
|
(
|
||||||||||||||||||||||||
| Balance at September 30, 2019 | $ |
|
$ |
|
$ |
|
$ |
|
$ |
|
|||||||||||||||||||
| Balance at July 1, 2020 | $ |
|
$ |
|
$ |
|
$ |
|
$ |
|
|||||||||||||||||||
| Total realized and unrealized gains (losses): | |||||||||||||||||||||||||||||
| Included in earnings |
|
|
(
|
|
|
||||||||||||||||||||||||
| Issuances |
|
|
|
|
|
||||||||||||||||||||||||
| Settlements |
|
|
(
|
(
|
— | ||||||||||||||||||||||||
| Balance at September 30, 2020 | $ |
|
$ |
|
$ |
|
$ |
|
$ |
|
|||||||||||||||||||
| Change in unrealized gains (losses) included in earnings for the period, attributable to assets and liabilities still held at September 30, 2020 | $ |
|
$ |
|
$ |
(
|
$ |
|
$ |
|
|||||||||||||||||||
|
Nine Months Ended September 30, 2020 and 2019
(Dollars in millions) |
Trading Assets | Non-agency MBS | MSRs | Net Derivatives | Private Equity Investments | ||||||||||||||||||||||||
| Balance at January 1, 2019 | $ |
|
$ |
|
$ |
|
$ |
|
$ |
|
|||||||||||||||||||
| Total realized and unrealized gains (losses): | |||||||||||||||||||||||||||||
| Included in earnings |
|
|
(
|
|
|
||||||||||||||||||||||||
| Included in unrealized net holding gains (losses) in OCI |
|
|
|
|
|
||||||||||||||||||||||||
| Purchases |
|
|
|
(
|
|
||||||||||||||||||||||||
| Issuances |
|
|
|
|
|
||||||||||||||||||||||||
| Sales |
(
|
|
|
|
(
|
||||||||||||||||||||||||
| Settlements |
|
(
|
(
|
(
|
(
|
||||||||||||||||||||||||
| Transfers into Level 3 |
|
|
|
(
|
|
||||||||||||||||||||||||
| Balance at September 30, 2019 | $ |
|
$ |
|
$ |
|
$ |
|
$ |
|
|||||||||||||||||||
| Balance at January 1, 2020 | $ |
|
$ |
|
$ |
|
$ |
|
$ |
|
|||||||||||||||||||
| Total realized and unrealized gains (losses): | |||||||||||||||||||||||||||||
| Included in earnings |
|
|
(
|
|
|
||||||||||||||||||||||||
| Included in unrealized net holding gains (losses) in OCI |
|
(
|
|
|
|
||||||||||||||||||||||||
| Purchases |
|
|
|
|
|
||||||||||||||||||||||||
| Issuances |
|
|
|
|
|
||||||||||||||||||||||||
| Sales |
|
(
|
|
|
|
||||||||||||||||||||||||
| Settlements |
|
(
|
(
|
(
|
(
|
||||||||||||||||||||||||
| Transfers out of level 3 and other |
|
|
|
|
(
|
||||||||||||||||||||||||
| Balance at September 30, 2020 | $ |
|
$ |
|
$ |
|
$ |
|
$ |
|
|||||||||||||||||||
| Change in unrealized gains (losses) included in earnings for the period, attributable to assets and liabilities still held at September 30, 2020 | $ |
|
$ |
|
$ |
(
|
$ |
|
$ |
|
|||||||||||||||||||
|
Primary income statement location of realized gains (losses) included in earnings
|
Net interest income | Gain on sale of securities | Residential mortgage income and Commercial real estate related income | Residential mortgage income and Commercial real estate related income | Other income | ||||||||||||||||||||||||
In the second quarter of 2020, Truist sold non-agency MBS previously categorized as Level 3 that represented ownership interests in various tranches of Re-REMIC trusts. These securities were valued at a discount, which was unobservable in the market, to the fair value of the underlying securities owned by the trusts. The Re-REMIC tranches did not have an active market and therefore were categorized as Level 3.
Refer to "Note 7. Loan Servicing" for additional information on valuation techniques and inputs for MSRs.
38 Truist Financial Corporation
Fair Value Option
The following table details the fair value and UPB of LHFS that were elected to be measured at fair value. Trading loans, included in other trading assets, were also elected to be measured at fair value.
| September 30, 2020 | December 31, 2019 | |||||||||||||||||||||||||||||||||||||
| (Dollars in millions) | Fair Value | UPB | Difference | Fair Value | UPB | Difference | ||||||||||||||||||||||||||||||||
| Trading loans | $ |
|
$ |
|
$ |
(
|
$ |
|
$ |
|
$ |
(
|
||||||||||||||||||||||||||
| LHFS at fair value |
|
|
|
|
|
|
||||||||||||||||||||||||||||||||
Nonrecurring Fair Value Measurements
The following table provides information about certain assets measured at fair value on a nonrecurring basis. The carrying values represent end of period values, which approximate the fair value measurements that occurred on the various measurement dates throughout the period. The valuation adjustments represent the amounts recorded during the period regardless of whether the asset is still held at period end. These assets are considered to be Level 3 assets (2019 excludes PCI).
| 2020 | 2019 | |||||||||||||||||||||||||
|
As of / For The Nine Months Ended September 30,
(Dollars in millions) |
Carrying Value | Valuation Adjustments | Carrying Value | Valuation Adjustments | ||||||||||||||||||||||
| LHFS | $ |
|
$ |
(
|
$ |
|
$ |
|
||||||||||||||||||
| Loans and leases |
|
(
|
|
(
|
||||||||||||||||||||||
| Foreclosed real estate and other foreclosed property |
|
(
|
|
(
|
||||||||||||||||||||||
At September 30, 2020, LHFS with valuation adjustments in the table above consisted primarily of residential mortgages and commercial loans that were valued using market prices and measured at the lower of cost or market. The table above excludes $
49
million of LHFS carried at cost at September 30, 2020 that did not require a valuation adjustment during the period. The remainder of LHFS is carried at fair value. Excluding government guaranteed loans, the Company held $
130
million in nonperforming LHFS at September 30, 2020 and $
107
million of nonperforming LHFS at December 31, 2019. LHFS that were 90 days or more past due and still accruing interest were not material at September 30, 2020.
Loans and leases are primarily collateral dependent and may be subject to liquidity adjustments. Refer to “Note 1. Basis of Presentation” for additional discussion of individually evaluated loans and leases. Foreclosed real estate and other foreclosed property is measured at the lower of cost or fair value less costs to sell and consists primarily of residential homes, commercial properties, vacant lots and automobiles.
Financial Instruments Not Recorded at Fair Value
For financial instruments not recorded at fair value, estimates of fair value are based on relevant market data and information about the instruments. Values obtained relate to trading without regard to any premium or discount that may result from concentrations of ownership, possible tax ramifications, estimated transaction costs that may result from bulk sales or the relationship between various instruments.
An active market does not exist for certain financial instruments. Fair value estimates for these instruments are based on current economic conditions and interest rate risk characteristics, loss experience and other factors. Many of these estimates involve uncertainties and matters of significant judgment and cannot be determined with precision. Therefore, the fair value estimates in many instances cannot be substantiated by comparison to independent markets. In addition, changes in assumptions could significantly affect these fair value estimates.
Financial assets and liabilities not recorded at fair value are summarized below:
| September 30, 2020 | December 31, 2019 | |||||||||||||||||||||||||
| (Dollars in millions) | Fair Value Hierarchy | Carrying Amount | Fair Value | Carrying Amount | Fair Value | |||||||||||||||||||||
| Financial assets: | ||||||||||||||||||||||||||
| Loans and leases HFI, net of ALLL | Level 3 | $ |
|
$ |
|
$ |
|
$ |
|
|||||||||||||||||
| Financial liabilities: | ||||||||||||||||||||||||||
| Time deposits | Level 2 |
|
|
|
|
|||||||||||||||||||||
| Long-term debt | Level 2 |
|
|
|
|
|||||||||||||||||||||
The carrying value of the RUFC, which approximates the fair value of unfunded commitments, was $
366
million and $
373
million at September 30, 2020 and December 31, 2019, respectively. The carrying value at December 31, 2019 includes deferred fees.
Truist Financial Corporation 39
NOTE 16.
Derivative Financial Instruments
Impact of Derivatives on the Consolidated Balance Sheets
The following table presents the gross notional amounts and estimated fair value of derivative instruments employed by the Company. Truist held
no
cash flow hedges as of September 30, 2020 and December 31, 2019 and
no
fair value hedges at September 30, 2020.
| September 30, 2020 | December 31, 2019 | ||||||||||||||||||||||||||||||||||
| Notional Amount | Fair Value | Notional Amount | Fair Value | ||||||||||||||||||||||||||||||||
| (Dollars in millions) | Assets | Liabilities | Assets | Liabilities | |||||||||||||||||||||||||||||||
| Fair value hedges: | |||||||||||||||||||||||||||||||||||
| Interest rate contracts: | |||||||||||||||||||||||||||||||||||
| Swaps hedging long-term debt | $ |
|
$ |
|
$ |
|
$ |
|
$ |
|
$ |
(
|
|||||||||||||||||||||||
| Options hedging long-term debt |
|
|
|
|
|
(
|
|||||||||||||||||||||||||||||
| Swaps hedging commercial loans |
|
|
|
|
|
|
|||||||||||||||||||||||||||||
| Total |
|
|
|
|
|
(
|
|||||||||||||||||||||||||||||
| Not designated as hedges: | |||||||||||||||||||||||||||||||||||
| Client-related and other risk management: | |||||||||||||||||||||||||||||||||||
| Interest rate contracts: | |||||||||||||||||||||||||||||||||||
| Swaps |
|
|
(
|
|
|
(
|
|||||||||||||||||||||||||||||
| Options |
|
|
(
|
|
|
(
|
|||||||||||||||||||||||||||||
| Forward commitments |
|
|
(
|
|
|
(
|
|||||||||||||||||||||||||||||
| Other |
|
|
|
|
|
|
|||||||||||||||||||||||||||||
| Equity contracts |
|
|
(
|
|
|
(
|
|||||||||||||||||||||||||||||
| Credit contracts: | |||||||||||||||||||||||||||||||||||
| Loans and leases |
|
|
(
|
|
|
(
|
|||||||||||||||||||||||||||||
| Risk participation agreements |
|
|
(
|
|
|
(
|
|||||||||||||||||||||||||||||
| Total return swaps |
|
|
(
|
|
|
(
|
|||||||||||||||||||||||||||||
| Foreign exchange contracts |
|
|
(
|
|
|
(
|
|||||||||||||||||||||||||||||
| Commodity |
|
|
(
|
|
|
(
|
|||||||||||||||||||||||||||||
| Total |
|
|
(
|
|
|
(
|
|||||||||||||||||||||||||||||
| Mortgage banking: | |||||||||||||||||||||||||||||||||||
| Interest rate contracts: | |||||||||||||||||||||||||||||||||||
| Swaps |
|
|
|
|
|
|
|||||||||||||||||||||||||||||
| Interest rate lock commitments |
|
|
(
|
|
|
(
|
|||||||||||||||||||||||||||||
|
When issued securities, forward rate agreements and forward commitments
|
|
|
(
|
|
|
(
|
|||||||||||||||||||||||||||||
| Other |
|
|
|
|
|
|
|||||||||||||||||||||||||||||
| Total |
|
|
(
|
|
|
(
|
|||||||||||||||||||||||||||||
| MSRs: | |||||||||||||||||||||||||||||||||||
| Interest rate contracts: | |||||||||||||||||||||||||||||||||||
| Swaps |
|
|
|
|
|
|
|||||||||||||||||||||||||||||
| Options |
|
|
|
|
|
(
|
|||||||||||||||||||||||||||||
|
When issued securities, forward rate agreements and forward commitments
|
|
|
|
|
|
(
|
|||||||||||||||||||||||||||||
| Other |
|
|
|
|
|
|
|||||||||||||||||||||||||||||
| Total |
|
|
|
|
|
(
|
|||||||||||||||||||||||||||||
| Total derivatives not designated as hedges |
|
|
(
|
|
|
(
|
|||||||||||||||||||||||||||||
| Total derivatives | $ |
|
|
(
|
$ |
|
|
(
|
|||||||||||||||||||||||||||
| Gross amounts in the Consolidated Balance Sheets: | |||||||||||||||||||||||||||||||||||
|
Amounts subject to master netting arrangements
|
(
|
|
(
|
|
|||||||||||||||||||||||||||||||
|
Cash collateral (received) posted for amounts subject to master netting arrangements
|
(
|
|
(
|
|
|||||||||||||||||||||||||||||||
| Net amount | $ |
|
$ |
(
|
$ |
|
$ |
(
|
|||||||||||||||||||||||||||
40 Truist Financial Corporation
The following table presents the offsetting of derivative instruments including financial instrument collateral related to legally enforceable master netting agreements and amounts held or pledged as collateral. U.S. GAAP does not permit netting of non-cash collateral balances in the consolidated balance sheet:
|
September 30, 2020
(Dollars in millions) |
Gross
Amount |
Amount
Offset |
Net Amount Presented in the Consolidated Balance Sheets | Held/Pledged Financial Instruments | Net Amount | ||||||||||||||||||||||||
| Derivative assets: | |||||||||||||||||||||||||||||
| Derivatives subject to master netting arrangement or similar arrangement | $ |
|
$ |
(
|
$ |
|
$ |
(
|
$ |
|
|||||||||||||||||||
| Derivatives not subject to master netting arrangement or similar arrangement |
|
|
|
(
|
|
||||||||||||||||||||||||
| Exchange traded derivatives |
|
(
|
|
|
|
||||||||||||||||||||||||
| Total derivative assets | $ |
|
$ |
(
|
$ |
|
$ |
(
|
$ |
|
|||||||||||||||||||
| Derivative liabilities: | |||||||||||||||||||||||||||||
| Derivatives subject to master netting arrangement or similar arrangement | $ |
(
|
$ |
|
$ |
(
|
$ |
|
$ |
(
|
|||||||||||||||||||
| Derivatives not subject to master netting arrangement or similar arrangement |
(
|
|
(
|
|
(
|
||||||||||||||||||||||||
| Exchange traded derivatives |
(
|
|
(
|
|
(
|
||||||||||||||||||||||||
| Total derivative liabilities | $ |
(
|
$ |
|
$ |
(
|
$ |
|
$ |
(
|
|||||||||||||||||||
|
December 31, 2019
(Dollars in millions) |
Gross
Amount |
Amount
Offset |
Net Amount Presented in the Consolidated Balance Sheets | Held/Pledged Financial Instruments | Net Amount | ||||||||||||||||||||||||
| Derivative assets: | |||||||||||||||||||||||||||||
| Derivatives subject to master netting arrangement or similar arrangement | $ |
|
$ |
(
|
$ |
|
$ |
(
|
$ |
|
|||||||||||||||||||
| Derivatives not subject to master netting arrangement or similar arrangement |
|
|
|
(
|
|
||||||||||||||||||||||||
| Exchange traded derivatives |
|
(
|
|
|
|
||||||||||||||||||||||||
| Total derivative assets | $ |
|
$ |
(
|
$ |
|
$ |
(
|
$ |
|
|||||||||||||||||||
| Derivative liabilities: | |||||||||||||||||||||||||||||
| Derivatives subject to master netting arrangement or similar arrangement | $ |
(
|
$ |
|
$ |
(
|
$ |
|
$ |
(
|
|||||||||||||||||||
| Derivatives not subject to master netting arrangement or similar arrangement |
(
|
|
(
|
|
(
|
||||||||||||||||||||||||
| Exchange traded derivatives |
(
|
|
|
|
|
||||||||||||||||||||||||
| Total derivative liabilities | $ |
(
|
$ |
|
$ |
(
|
$ |
|
$ |
(
|
|||||||||||||||||||
The following table presents the carrying value of hedged items in fair value hedging relationships:
| September 30, 2020 | December 31, 2019 | |||||||||||||||||||||||||||||||||||||
| Hedge Basis Adjustment | Hedge Basis Adjustment | |||||||||||||||||||||||||||||||||||||
| (Dollars in millions) | Hedged Asset / Liability Basis | Items Currently Designated | Discontinued Hedges | Hedged Asset / Liability Basis | Items Currently Designated | Discontinued Hedges | ||||||||||||||||||||||||||||||||
| AFS securities | $ |
|
$ |
|
$ |
|
$ |
|
$ |
|
$ |
|
||||||||||||||||||||||||||
| Loans and leases |
|
|
|
|
|
|
||||||||||||||||||||||||||||||||
| Long-term debt |
|
|
|
|
|
|
||||||||||||||||||||||||||||||||
Truist Financial Corporation 41
Impact of Derivatives on the Consolidated Statements of Income and Comprehensive Income
Derivatives Designated as Hedging Instruments under GAAP
No portion of the change in fair value of derivatives designated as hedges has been excluded from effectiveness testing.
The following table summarizes amounts related to cash flow hedges, which consist of interest rate contracts.
| Three Months Ended September 30, | Nine Months Ended September 30, | ||||||||||||||||||||||
| (Dollars in millions) | 2020 | 2019 | 2020 | 2019 | |||||||||||||||||||
| Pre-tax gain (loss) recognized in OCI: | |||||||||||||||||||||||
| Deposits | $ |
|
$ |
|
$ |
|
$ |
(
|
|||||||||||||||
| Short-term borrowings |
|
|
|
|
|||||||||||||||||||
| Long-term debt |
|
|
|
(
|
|||||||||||||||||||
| Total | $ |
|
$ |
|
$ |
|
$ |
(
|
|||||||||||||||
| Pre-tax gain (loss) reclassified from AOCI into interest expense: | |||||||||||||||||||||||
| Deposits | $ |
(
|
(
|
$ |
(
|
$ |
|
||||||||||||||||
| Short-term borrowings |
(
|
(
|
(
|
(
|
|||||||||||||||||||
| Long-term debt |
(
|
(
|
(
|
(
|
|||||||||||||||||||
| Total | $ |
(
|
$ |
(
|
$ |
(
|
$ |
(
|
|||||||||||||||
The following table summarizes the impact on net interest income related to fair value hedges:
| Three Months Ended September 30, | Nine Months Ended September 30, | ||||||||||||||||||||||
| (Dollars in millions) | 2020 | 2019 | 2020 | 2019 | |||||||||||||||||||
|
AFS securities:
|
|||||||||||||||||||||||
| Amounts related to interest settlements | $ |
|
$ |
|
$ |
|
$ |
|
|||||||||||||||
| Recognized on derivatives |
|
|
|
(
|
|||||||||||||||||||
|
Recognized on hedged items
|
(
|
(
|
(
|
|
|||||||||||||||||||
| Net income (expense) recognized |
(
|
(
|
(
|
(
|
|||||||||||||||||||
| Loans and leases: | |||||||||||||||||||||||
| Amounts related to interest settlements |
(
|
|
(
|
|
|||||||||||||||||||
| Recognized on derivatives |
|
|
(
|
(
|
|||||||||||||||||||
|
Recognized on hedged items
|
|
(
|
|
|
|||||||||||||||||||
| Net income (expense) recognized |
(
|
(
|
(
|
(
|
|||||||||||||||||||
|
Long-term debt:
|
|||||||||||||||||||||||
| Amounts related to interest settlements |
|
(
|
|
(
|
|||||||||||||||||||
| Recognized on derivatives |
(
|
|
|
|
|||||||||||||||||||
|
Recognized on hedged items
|
|
(
|
(
|
(
|
|||||||||||||||||||
| Net income (expense) recognized |
|
(
|
|
(
|
|||||||||||||||||||
|
Net income (expense) recognized, total
|
$ |
|
$ |
(
|
$ |
|
$ |
(
|
|||||||||||||||
The following table presents information about the Company's cash flow and fair value hedges:
| (Dollars in millions) | Sep 30, 2020 | Dec 31, 2019 | ||||||||||||
| Cash flow hedges: | ||||||||||||||
|
Net unrecognized after-tax gain (loss) on terminated hedges recorded in AOCI (to be recognized in earnings through 2022)
|
$ |
(
|
$ |
(
|
||||||||||
|
Estimated portion of net after-tax gain (loss) on active and terminated hedges to be reclassified from AOCI into earnings during the next 12 months
|
(
|
(
|
||||||||||||
| Fair value hedges: | ||||||||||||||
|
Unrecognized pre-tax net gain (loss) on terminated hedges (to be recognized as interest primarily through 2029)
|
$ |
|
$ |
(
|
||||||||||
|
Portion of pre-tax net gain (loss) on terminated hedges to be recognized as a change in interest during the next 12 months
|
|
(
|
||||||||||||
42 Truist Financial Corporation
Derivatives Not Designated as Hedging Instruments under GAAP
The Company also enters into derivatives that are not designated as accounting hedges under GAAP to economically hedge certain risks as well as in a trading capacity with its clients.
The following table presents pre-tax gain (loss) recognized in income for derivative instruments not designated as hedges:
| Three Months Ended September 30, | Nine Months Ended September 30, | |||||||||||||||||||||||||
| (Dollars in millions) | Income Statement Location | 2020 | 2019 | 2020 | 2019 | |||||||||||||||||||||
| Client-related and other risk management: | ||||||||||||||||||||||||||
| Interest rate contracts | Investment banking and trading income and other income | $ |
|
$ |
|
$ |
(
|
$ |
|
|||||||||||||||||
| Foreign exchange contracts | Investment banking and trading income and other income |
(
|
|
|
|
|||||||||||||||||||||
| Equity contracts | Investment banking and trading income and other income |
|
(
|
(
|
(
|
|||||||||||||||||||||
| Credit contracts | Investment banking and trading income and other income |
(
|
|
|
|
|||||||||||||||||||||
| Commodity contracts | Investment banking and trading income |
|
|
|
|
|||||||||||||||||||||
| Mortgage banking: | ||||||||||||||||||||||||||
| Interest rate contracts | Residential mortgage income |
(
|
(
|
(
|
(
|
|||||||||||||||||||||
| Interest rate contracts | Commercial real estate related income |
|
|
|
|
|||||||||||||||||||||
| MSRs: | ||||||||||||||||||||||||||
| Interest rate contracts | Residential mortgage income |
(
|
|
|
|
|||||||||||||||||||||
| Interest rate contracts | Commercial real estate related income |
|
|
|
|
|||||||||||||||||||||
| Total | $ |
(
|
$ |
|
$ |
|
$ |
|
||||||||||||||||||
Credit Derivative Instruments
As part of the Company’s corporate investment banking business, the Company enters into contracts that are, in form or substance, written guarantees; specifically, credit default swaps, risk participations and TRS. The Company accounts for these contracts as derivatives.
The Company has entered into TRS contracts on loans. To mitigate its credit risk, the Company typically receives initial margin from the counterparty upon entering into the TRS and variation margin if the fair value of the underlying reference assets deteriorates. For additional information on the Company’s TRS contracts, see "Note 14. Commitments and Contingencies.”
Truist has entered into risk participation agreements to share the credit exposure with other financial institutions on client-related interest rate derivative contracts. Under these agreements, the Company has guaranteed payment to a dealer counterparty in the event the dealer experiences a loss on the derivative, such as an interest rate swap, due to a failure to pay by the client, on that derivative. The Company manages its payment risk on its risk participations by monitoring the creditworthiness of the underlying client through the normal credit review process that the Company would have performed had it entered into a derivative directly with the obligors. At September 30, 2020, the remaining terms on these risk participations ranged from less than one year to 10 years. The potential future exposure represents the Company’s maximum estimated exposure to written risk participations, as measured by projecting a maximum value of the guaranteed derivative instruments based on scenario simulations and assuming 100% default by all obligors on the maximum value.
The following table presents additional information related to interest rate derivative risk participation agreements and total return swaps:
| (Dollars in millions) | Sep 30, 2020 | Dec 31, 2019 | |||||||||
| Risk participation agreements: | |||||||||||
|
Maximum potential amount of exposure
|
$ |
|
$ |
|
|||||||
| Total return swaps: | |||||||||||
| Cash collateral held |
|
|
|||||||||
Truist Financial Corporation 43
The following table summarizes collateral positions with counterparties:
| (Dollars in millions) | Sep 30, 2020 | Dec 31, 2019 | |||||||||
| Dealer and other counterparties: | |||||||||||
| Cash and other collateral received from counterparties | $ |
|
$ |
|
|||||||
| Derivatives in a net gain position secured by collateral received |
|
|
|||||||||
|
Unsecured positions in a net gain with counterparties after collateral postings
|
|
|
|||||||||
| Cash collateral posted to dealer counterparties |
|
|
|||||||||
| Derivatives in a net loss position secured by collateral |
|
|
|||||||||
|
Additional collateral that would have been posted had the Company's credit ratings dropped below investment grade
|
|
|
|||||||||
| Central counterparties clearing: | |||||||||||
| Cash collateral, including initial margin, posted to central clearing parties |
|
|
|||||||||
| Derivatives in a net loss position |
|
|
|||||||||
| Derivatives in a net gain position |
|
|
|||||||||
| Securities pledged to central counterparties clearing |
|
|
|||||||||
NOTE 17.
Computation of EPS
Basic and diluted EPS calculations are presented in the following table:
| Three Months Ended September 30, | Nine Months Ended September 30, | ||||||||||||||||||||||
| (Dollars in millions, except per share data, shares in thousands) | 2020 | 2019 | 2020 | 2019 | |||||||||||||||||||
| Net income available to common shareholders | $ |
|
$ |
|
$ |
|
$ |
|
|||||||||||||||
| Weighted average number of common shares |
|
|
|
|
|||||||||||||||||||
| Effect of dilutive outstanding equity-based awards |
|
|
|
|
|||||||||||||||||||
| Weighted average number of diluted common shares |
|
|
|
|
|||||||||||||||||||
| Basic EPS | $ |
|
$ |
|
$ |
|
$ |
|
|||||||||||||||
| Diluted EPS | $ |
|
$ |
|
$ |
|
$ |
|
|||||||||||||||
| Anti-dilutive awards |
|
|
|
|
|||||||||||||||||||
NOTE 18.
Operating Segments
Truist operates and measures business activity across
three
segments: Consumer Banking and Wealth, Corporate and Commercial Banking, and Insurance Holdings, with functional activities included in Other, Treasury, and Corporate. The Company's business segment structure is based on the manner in which financial information is evaluated by management as well as the products and services provided or the type of client served. For additional information, see "Note 21. Operating Segments" of the Annual Report on Form 10-K for the year ended December 31, 2019.
44 Truist Financial Corporation
The following table presents results by segment:
|
Three Months Ended September 30,
(Dollars in millions) |
CB&W | C&CB | IH | OT&C (1) | Total | ||||||||||||||||||||||||||||||||||||||||||||||||||||||
| 2020 | 2019 | 2020 | 2019 | 2020 | 2019 | 2020 | 2019 | 2020 | 2019 | ||||||||||||||||||||||||||||||||||||||||||||||||||
| Net interest income (expense) | $ |
|
$ |
|
$ |
|
$ |
|
$ |
|
$ |
|
$ |
|
$ |
|
$ |
|
$ |
|
|||||||||||||||||||||||||||||||||||||||
| Net intersegment interest income (expense) |
|
|
|
(
|
(
|
(
|
(
|
(
|
|
|
|||||||||||||||||||||||||||||||||||||||||||||||||
| Segment net interest income |
|
|
|
|
|
|
(
|
(
|
|
|
|||||||||||||||||||||||||||||||||||||||||||||||||
| Allocated provision for credit losses |
|
|
|
|
|
|
(
|
(
|
|
|
|||||||||||||||||||||||||||||||||||||||||||||||||
| Segment net interest income after provision |
|
|
|
|
|
|
(
|
(
|
|
|
|||||||||||||||||||||||||||||||||||||||||||||||||
| Noninterest income |
|
|
|
|
|
|
|
(
|
|
|
|||||||||||||||||||||||||||||||||||||||||||||||||
| Noninterest expense |
|
|
|
|
|
|
|
|
|
|
|||||||||||||||||||||||||||||||||||||||||||||||||
| Income (loss) before income taxes |
|
|
|
|
|
|
(
|
(
|
|
|
|||||||||||||||||||||||||||||||||||||||||||||||||
| Provision (benefit) for income taxes |
|
|
|
|
|
|
(
|
(
|
|
|
|||||||||||||||||||||||||||||||||||||||||||||||||
| Segment net income (loss) | $ |
|
$ |
|
$ |
|
$ |
|
$ |
|
$ |
|
$ |
(
|
$ |
(
|
$ |
|
$ |
|
|||||||||||||||||||||||||||||||||||||||
| Identifiable assets (period end) | $ |
|
$ |
|
$ |
|
$ |
|
$ |
|
$ |
|
$ |
|
$ |
|
$ |
|
$ |
|
|||||||||||||||||||||||||||||||||||||||
|
Nine Months Ended September 30,
(Dollars in millions) |
CB&W | C&CB | IH | OT&C (1) | Total | ||||||||||||||||||||||||||||||||||||||||||||||||||||||
| 2020 | 2019 | 2020 | 2019 | 2020 | 2019 | 2020 | 2019 | 2020 | 2019 | ||||||||||||||||||||||||||||||||||||||||||||||||||
| Net interest income (expense) | $ |
|
$ |
|
$ |
|
$ |
|
$ |
|
$ |
|
$ |
|
$ |
|
$ |
|
$ |
|
|||||||||||||||||||||||||||||||||||||||
| Net intersegment interest income (expense) |
|
|
(
|
(
|
(
|
(
|
(
|
(
|
|
|
|||||||||||||||||||||||||||||||||||||||||||||||||
| Segment net interest income |
|
|
|
|
|
|
(
|
(
|
|
|
|||||||||||||||||||||||||||||||||||||||||||||||||
| Allocated provision for credit losses |
|
|
|
|
|
|
|
(
|
|
|
|||||||||||||||||||||||||||||||||||||||||||||||||
| Segment net interest income after provision |
|
|
|
|
|
|
(
|
(
|
|
|
|||||||||||||||||||||||||||||||||||||||||||||||||
| Noninterest income |
|
|
|
|
|
|
|
(
|
|
|
|||||||||||||||||||||||||||||||||||||||||||||||||
| Noninterest expense |
|
|
|
|
|
|
|
|
|
|
|||||||||||||||||||||||||||||||||||||||||||||||||
| Income (loss) before income taxes |
|
|
|
|
|
|
(
|
(
|
|
|
|||||||||||||||||||||||||||||||||||||||||||||||||
| Provision (benefit) for income taxes |
|
|
|
|
|
|
(
|
(
|
|
|
|||||||||||||||||||||||||||||||||||||||||||||||||
| Segment net income (loss) | $ |
|
$ |
|
$ |
|
$ |
|
$ |
|
$ |
|
$ |
(
|
$ |
(
|
$ |
|
$ |
|
|||||||||||||||||||||||||||||||||||||||
| Identifiable assets (period end) | $ |
|
$ |
|
$ |
|
$ |
|
$ |
|
$ |
|
$ |
|
$ |
|
$ |
|
$ |
|
|||||||||||||||||||||||||||||||||||||||
(1)
Includes financial data from business units below the quantitative and qualitative thresholds requiring disclosure.
Truist Financial Corporation 45
ITEM 2. MANAGEMENT'S DISCUSSION AND ANALYSIS OF FINANCIAL CONDITION AND RESULTS OF OPERATIONS
Introduction
This MD&A is intended to assist readers in their analysis of the accompanying Consolidated Financial Statements and supplemental financial information. It should be read in conjunction with the Consolidated Financial Statements and accompanying Notes to the Consolidated Financial Statements in this Form 10-Q, other information contained in this document, as well as information contained in the December 31, 2019 Form 10-K.
Government Response to COVID-19
Congress, the FRB and the other U.S. state and federal financial regulatory agencies, as well as state legislatures and officials, have taken actions to mitigate disruptions to economic activity and financial stability resulting from COVID-19 and may continue to evolve such approaches and requirements in ways that further impact the business of the Company. The descriptions below summarize certain significant government actions taken in response to the COVID-19 pandemic. The descriptions are qualified in their entirety by reference to the particular statutory or regulatory provisions or government programs summarized.
The CARES Act
The CARES Act was signed into law on March 27, 2020 and subsequently has been amended several times. Among other provisions the CARES Act includes funding for the Small Business Administration to expand lending, relief from certain U.S. GAAP requirements to allow COVID-19-related loan modifications to not be categorized as troubled debt restructurings and a range of incentives to encourage deferment, forbearance or modification of loans. One of the key CARES Act programs is the PPP, which temporarily expands the Small Business Administration’s business loan guarantee program through August 8, 2020. PPP loans are available to a broader range of entities than ordinary Small Business Administration loans, require deferral of principal and interest repayment, and the loan may be forgiven in an amount equal to payroll costs and certain other expenses during either an eight-week or 24-week covered period.
The CARES Act contains additional protections for homeowners and renters of properties with federally backed mortgages, including a 60-day moratorium on the initiation of foreclosure proceedings beginning on March 18, 2020 and a 120-day moratorium on initiating eviction proceedings effective March 27, 2020. Borrowers of federally backed mortgages have the right under the CARES Act to request up to 360 days of forbearance on their mortgage payments if they experience financial hardship directly or indirectly due to the coronavirus-related public health emergency. FNMA, FHLMC, FHA and VA have extended their moratorium on foreclosures and evictions for single-family federally backed mortgages until at least December 31, 2020.
Also pursuant to the CARES Act, the U.S. Treasury has the authority to provide loans, guarantees and other investments in support of eligible businesses, states and municipalities affected by the economic effects of COVID-19. Some of these funds have been used to support the several FRB programs and facilities described below or additional programs or facilities that are established by the FRB under its Section 13(3) authority and meeting certain criteria.
FRB Actions
The FRB has taken a range of actions to support the flow of credit to households and businesses. For example, on March 15, 2020, the FRB reduced the target range for the federal funds rate to 0 to 0.25% and announced that it would increase its holdings of U.S. Treasury securities and agency mortgage-backed securities and begin purchasing agency commercial mortgage-backed securities. The FRB has also encouraged depository institutions to borrow from the discount window and has lowered the primary credit rate for such borrowing by 150 basis points while extending the term of such loans up to 90 days. Reserve requirements have been reduced to zero as of March 26, 2020.
In addition, the FRB has established, or has taken steps to establish, a range of facilities and programs to support the U.S. economy and U.S. marketplace participants in response to economic disruptions associated with COVID-19. Through these facilities and programs, the FRB, relying on its authority under Section 13(3) of the Federal Reserve Act, has taken steps to directly or indirectly purchase assets from, or make loans to, U.S. companies, financial institutions, municipalities and other market participants.
FRB facilities and programs established, or in the process of being established, include:
•
a PPP Liquidity Facility to provide financing related to PPP loans made by banks;
•
three Main Street Loan Facilities to purchase loan participations, under specified conditions, from banks lending to small and medium sized U.S. businesses;
•
a Primary Dealer Credit Facility to provide liquidity to primary dealers through a secured lending facility;
•
a Commercial Paper Funding Facility to purchase the commercial paper of certain U.S. issuers;
46 Truist Financial Corporation
•
a Primary Market Corporate Credit Facility to purchase corporate bonds directly from, or make loans directly to, eligible participants;
•
a Secondary Market Corporate Credit Facility to purchase corporate bonds trading in secondary markets, including from exchange-traded funds, that were issued by eligible participants;
•
a Term Asset-Backed Securities Loan Facility to make loans secured by asset-backed securities;
•
a Municipal Liquidity Facility to purchase bonds directly from U.S. state, city and county issuers; and
•
a Money Market Mutual Fund Liquidity Facility to purchase certain assets from, or make loans to, financial institutions providing financing to eligible money market mutual funds.
Regulatory Considerations
The regulatory framework applicable to banking organizations is intended primarily for the protection of depositors and the stability of the financial system, rather than for the protection of shareholders and creditors. Truist is subject to banking laws and regulations and various other laws and regulations, which affect the operations and management of Truist and its ability to make distributions to shareholders. Truist and its subsidiaries are also subject to supervision and examination by multiple regulators. Refer to Truist's Annual Report on Form 10-K for the year ended December 31, 2019 for additional disclosures with respect to significant laws and regulations affecting Truist.
The descriptions below summarize updates since the filing of the Annual Report on Form 10-K for the year ended December 31, 2019 to state and federal laws to, which Truist is subject. These descriptions do not summarize all possible or proposed changes in current laws or regulations and are not intended to be a substitute for the related statues or regulatory provisions.
Stress Capital Buffer and CCAR
The FRB has adopted a final rule that integrates its annual capital planning and stress testing requirements with existing regulatory capital requirements. For risk-based capital requirements, the stress capital buffer replaces the capital conservation buffer, which was 2.5% through September 30, 2020. Under the final rule, beginning in the 2020 CCAR cycle, the FRB will notify Truist of its SCB requirements, which is equal to the greater of (i) the difference between its starting and minimum projected CET1 capital ratios under the severely adverse scenario in the supervisory stress test, plus the sum of the dollar amount of Truist’s planned common stock dividends for each of the fourth through seventh quarters of the planning horizon as a percentage of risk-weighted assets, or (ii) 2.5%.
The final rule also makes related changes to the capital planning and stress testing process. Among other changes, the revised capital plan rule eliminates the assumption that Truist’s balance sheet assets would increase over the planning horizon. In addition, provided that Truist is otherwise in compliance with automatic restrictions on distributions under the FRB’s capital rules, Truist will no longer be required to seek prior approval to make capital distributions in excess of those included in its capital plan.
The FRB assigned Truist a SCB of 2.7%, which is effective from October 1, 2020 through September 30, 2021. Consistent with the FRB’s mandate across the industry, Truist will update and resubmit its capital plan in early November 2020 to reflect changes in financial markets and the macroeconomic outlook, and the FRB will conduct additional analysis each quarter to determine if adjustments to this response are appropriate.
The FRB also took several actions following its stress tests in light of the uncertainty caused by the COVID-19 pandemic. Specifically, for the third and fourth quarter of 2020, the FRB is requiring certain large banking organizations, including Truist, to suspend share repurchases, cap common dividends per share to the amount paid in the second quarter, and further limit dividends according to a formula based on recent income. The FRB is also requiring banks to re-evaluate their longer-term capital plans.
Revisions to Definition of Eligible Retained Income
The U.S. banking agencies have adopted a final rule altering the definition of eligible retained income in their respective capital rules. Under the new rule, eligible retained income is the greater of a firm’s (i) net income for the four preceding calendar quarters, net of any distributions and associated tax effects not already reflected in net income, and (ii) average net income over the preceding four quarters. This definition applies with respect to all of Truist’s capital requirements.
Current Expected Credit Losses Methodology
The U.S. banking agencies have adopted a final rule that permits banking organizations that implement CECL before the end of 2020 to elect to follow the three-year transition available under the prior rule or a new five-year transition to phase in the effects of CECL on regulatory capital. Under the five-year transition, the banking organization would defer for two years 100% of the day-one effect of adopting CECL and 25% of the cumulative increase in the allowance for credit losses since adoption of CECL. Following the first two years, the electing organization will phase out the aggregate capital effects over the next three years consistent with the transition in the original three-year transition rule. Truist has elected to use the five-year transition to phase in the impacts of CECL on regulatory capital.
Truist Financial Corporation 47
Supplementary Leverage Ratio
In response to the COVID-19 pandemic, the FRB has adopted an interim final rule that temporarily changes the supplementary leverage ratio to exclude U.S. Treasury securities and deposits at Federal Reserve Banks from the calculation of a firm’s leverage exposure. The interim final rule applies to BHCs, became effective April 1, 2020 and will remain in effect through March 31, 2021.
Loan modifications
In response to the COVID-19 pandemic, banking regulators have encouraged financial institutions to support borrowers impacted by COVID-19. Refer to “Note 1. Basis of Presentation” for Truist’s policy related to COVID-19 loan modifications.
CARES Act
In addition to authorizing several programs to provide loans, guarantees and other investments in support of eligible organizations, states and municipalities affected by the economic effects of the COVID-19 pandemic, the CARES Act also includes several measures that temporarily adjust existing laws or regulations. These include providing the FDIC with additional authority to guarantee the deposits of solvent insured depository institutions held in noninterest-bearing business transaction accounts to a maximum amount specified by the FDIC, reinstating the FDIC's Temporary Liquidity Guarantee Authority to guarantee debt obligations of solvent insured depository institutions or depository institution holding companies, and temporarily allowing the Treasury to fully guarantee money market mutual funds. The CARES Act also provides financial institutions with the option to suspend certain GAAP requirements for coronavirus-related loan modifications that would otherwise constitute troubled debt restructurings and further requires the federal banking agencies to defer to financial institutions’ determinations in making such suspensions. Refer to “Note 1. Basis of Presentation” for Truist’s policy related to COVID-19 loan modifications.
Volcker Rule
In June 2020, the five regulatory agencies charged with implementing the Volcker Rule finalized amendments to the Volcker Rule’s restrictions on ownership interests in and relationships with covered funds. Among other things, these amendments permit banking entities to have relationships with and offer additional financial services to additional types of funds and investment vehicles. These requirements are not expected to have a material impact on Truist's consolidated financial position, results of operations or cash flows.
NSFR Rule
The U.S. banking agencies have finalized a rule to implement the NSFR in the United States. The NSFR rule requires each of Truist and Truist Bank to maintain an amount of available stable funding, which is a weighted measure of a company’s funding sources over a one-year time horizon, calculated by applying standardized weightings to the company’s equity and liabilities based on their expected stability, that is no less than the amount of required stable funding, which is calculated by applying standardized weightings to assets, derivatives exposures and certain other items based on their liquidity characteristics. As a Category III banking organization, Truist and Truist Bank are subject to an NSFR requirement equal to 85% of the full requirement. These requirements will become effective as of July 1, 2021.
48 Truist Financial Corporation
Executive Overview
Overview of Significant Events and Financial Results
Recent Events
Effective December 6, 2019, the Company completed the Merger. Reported results for Truist reflect heritage BB&T prior to the completion of the Merger and results from both BB&T and SunTrust from the Merger closing date forward. As such, comparative income statement data in
this MD&A for 2019 is only for heritage BB&T. Significant Merger updates include:
•
In January 2020, Truist officially launched the Truist brand and visual identity, and Truist’s purpose: “Inspire and build better lives and communities,” along with its mission and values.
•
In March 2020, the purchase of the new Charlotte, NC headquarters building was completed and the building was renamed Truist Center.
•
Purchase accounting valuations for loans and intangibles were updated during 2020 resulting in a $193 million reduction in the fair value mark for loans, a $202 million increase in CDI and other intangibles and a $322 million reduction in goodwill.
•
In July 2020, Truist completed the previously announced divestiture of 30 branches with $425 million in loans and leases and $2.2 billion in deposits.
•
Completed the first major brand milestone in the client-facing conversion of Truist Securities.
•
Recently announced Truist Ventures, which is about building strategic partnerships and making investments in innovative companies and solutions.
•
Launched the “blended branch” pilot program, which is a key step towards closing branches that are very close to one another while continuing to take care of clients.
•
Truist remains committed to achieving $1.6 billion in net cost saves on a run rate basis by the fourth quarter of 2022, excluding changes in net pension costs for 2021 and 2022.
The Company is closely monitoring the COVID-19 pandemic and its effects on clients, counterparties and the financial markets in which the Company conducts business. The Company expects the effects of this health crisis, which include disruptions or restrictions in clients’ supply chains, closures of clients’ facilities or decreases in demand for clients’ products and services, to continue to adversely impact economic conditions. Also related to the health crisis, the U.S. has been operating under a presidential declared emergency since March 13, 2020, with various actions by the U.S. Congress and regulatory agencies. As a result of COVID-19, the Company experienced the decline of asset prices, reduction in interest rates, widening of credit spreads, borrower and counterparty credit deterioration and market volatility. Although the Company is unable to estimate the extent of the impact, the continuing pandemic and related global economic crisis is likely to adversely impact its future operating results.
Truist acted swiftly to support our clients, teammates and communities during the COVID-19 pandemic. The following are some significant actions related to our crisis response.
•
Truist funded extensive line draws for commercial clients to help them fund liquidity and working capital needs during the onset of the pandemic. Additionally, Truist created an online, automated process for the PPP and began to accept applications during the first weekend of the program. Truist Served as the fourth largest PPP lender based on gross fundings. The carrying value of PPP loans was $12.2 billion as of September 30, 2020.
•
Provided accommodations to commercial and consumer clients. Of clients that have exited accommodation programs, 98.0% of commercial clients, and 94.5% of consumer and credit card clients, respectively, are current on or have paid-off their loans.
•
Pledged $50 million in philanthropic support through the Truist Cares initiative that is providing aid for basic needs, medical supplies and financial hardship across the nation, as well as grants to Truist’s community partners to support and expand technology initiatives and programs for youth, seniors, small businesses and people to rebuild, restore and create thriving communities.
•
Provided support for clients through payment relief assistance, including payments deferrals, waiving certain fees and offering additional accommodations.
•
Implemented multiple strategies to keep teammates and clients safe, including temporarily limiting branch lobby access and the extensive use of drive-thrus. Approximately 90% of branches are open and unlocked, or open with controlled access. Truist continues to follow appropriate COVID-19 safety protocols, including proper social distancing. Additionally, alternative work assignments for certain teammates currently working remotely have been extended until January 31, 2021.
•
Provided support for teammates including additional paid time off, flexibility and family care benefits. Provided teammates who have base pay below $100,000 annually a one-time pre-tax bonus of $1,200 in March to recognize their ongoing commitment to our clients and help alleviate some of the financial pressures caused by the pandemic. Enabled alternative work strategies that allowed more than half of our teammates to work remotely. Temporarily paid an additional onsite special pay rate of $6.25 per hour or $50 per day for teammates required to work in offices.
Truist Financial Corporation 49
•
From mid-October to the end of 2020, Truist is providing teammates search tools for their in-home needs at no cost, including caregiver search tools, virtual academic support, child care priority and discounts, nanny placement services, elder care resources, and pet sitters and housekeepers. Additionally, eligible teammates will be eligible to receive a child care reimbursement of $50/day for a limited timeframe.
See Part II, Item 1A, “Risk Factors,” in this Form 10-Q for additional information regarding risks related to the effects of COVID-19.
Truist is committed to addressing racial and social inequity and has taken a number of actions to expand efforts towards advancing equity, economic empowerment and education for clients, communities and teammates, including:
•
Truist’s various foundations provided a donation of $40 million to help establish CornerSquare Community Capital, formed to support community development financial institutions focused on providing funding to racially and ethnically diverse small business owners, women and individuals in low- and moderate-income communities, with a particular focus on African American-owned small businesses. The $40 million contribution to CornerSquare Community Capital consisted of two $20 million contributions made through the Truist Foundation, Inc. and the Truist Charitable Fund. These amounts did not impact Truist Financial Corporation's earnings.
•
Implemented a Truist Bank Community Benefits Plan under which the Company will lend or invest $60 billion to low- and moderate-income borrowers and in low- and moderate-income communities over a three-year period.
•
As part of the Corporate Social Responsibility report, Truist announced its commitment to increasing the number of racially and ethnically diverse employees among senior leadership positions from approximately 12% to at least 15% in three years. Truist also committed to ensuring regular, ongoing pay equity reviews for teammates.
•
Hosted more than 260 “Days of Understanding” sessions to date touching over 24,500 teammates, with more scheduled this year, that are designed to encourage bold dialogue on real-world topics in an open, trusting environment.
•
Scheduled virtual town hall meetings and discussion forums for teammates to share candid, personal experiences.
•
Began hosting unconscious bias training with Executive Leadership, Executive Leadership’s directs and other leaders. A total 22 sessions have been completed or scheduled with over 300 leaders being trained.
•
Hosted more than 100 Business Resource Group events to date this year to bring teammates together and discuss a broad range of cultural topics to create awareness and understanding of different communities. Many of these events are celebrations of inclusion months, but we also host executive panels on pertinent topics to lead with empathy, including the racial injustices that have occurred.
•
CEO Kelly King signed the pledge with CEO Action for Diversity & Inclusion, the largest CEO-driven business commitment to advance diversity and inclusion in the workplace.
•
The entire Executive Leadership Team is part of the Truist Executive Inclusion and Diversity Council, which provides oversight and accountability.
•
To advance equity in a meaningful way, Truist launched a working group led by two members of our Executive Leadership Team and leaders of our African American Business Resource Group. Truist has also asked several community partners to help shape and guide its long-term actions.
•
Observed Juneteenth holiday.
Executive Leadership Changes
On June 30, 2020, Truist announced that Kimberly Moore-Wright, Chief Human Resources Officer, has been named to the Truist Executive Leadership team, effectively immediately. In December 2019, Moore-Wright was named Chief Human Resources Officer. Prior to that, Moore-Wright was the Director of Marketing and Digital Sales between January 2016 and November 2019 and the Director of Retail and Commercial Marketing Strategy between January 2012 and December 2015.
As part of the new reporting structure to elevate the areas of human resources and inclusion and diversity, both Moore-Wright and Ellen Fitzsimmons, Chief Legal Officer and Head of Enterprise Diversity, will report directly to the Chairman and CEO, Kelly King.
50 Truist Financial Corporation
Financial Results
Net income available to common shareholders for the third quarter of 2020 totaled $1.1 billion, up 45.3%, compared with the third quarter last year. On a diluted per common share basis, earnings for the third quarter of 2020 were $0.79, a decrease of $0.16 compared to the third quarter of 2019. Truist's results of operations for the third quarter of 2020 produced an annualized return on average assets of 0.91% and an annualized return on average common shareholders' equity of 6.87% compared to prior year returns of 1.41% and 10.04%, respectively. Results for the third quarter of 2020 included merger-related and restructuring charges of $236 million ($181 million after-tax), incremental operating expenses related to the Merger of $152 million ($115 million after-tax), securities gains of $104 million ($80 million after-tax) and a charitable contribution of $50 million ($38 million after-tax). Results for the third quarter of 2019 included $34 million ($26 million after-tax) of merger-related and restructuring charges, and $52 million ($40 million after-tax) of incremental operating expenses related to the Merger and an after-tax reduction in net income available to common shareholders of $46 million from the redemption of preferred stock.
Truist’s revenue for the third quarter of 2020 was $5.6 billion. On a TE basis, revenue was also $5.6 billion for the third quarter of 2020, an increase of $2.6 billion compared to the same period in 2019, reflecting an increase of $1.7 billion in TE net interest income and an increase of $907 million in noninterest income. The increase in revenue was primarily due to the Merger.
NIM was 3.10% for the third quarter of 2020, down 27 basis points compared to the prior year. Average earning assets increased $232.0 billion, as average loans and leases increased $163.6 billion and average securities increased $30.9 billion. In addition, average other earning assets increased $34.0 billion primarily due to higher interest bearing balances at the Federal Reserve. Average interest-bearing liabilities increased $155.0 billion and noninterest-bearing deposits increased $71.5 billion. The annualized TE yield on the total loan portfolio for the third quarter of 2020 was 4.04%, down 94 basis points compared to the prior year. The annualized TE yield on the average securities portfolio was 1.97%, down 63 basis points compared to the prior year. The average costs of interest-bearing liabilities was 0.35%, down 112 basis points compared to the prior year.
The provision for credit losses was $421 million compared to $117 million for the third quarter of 2019. The increase in the provision for credit losses reflects a modest build to the allowance for credit losses primarily due to monitoring of clients’ financial position and associated re-grading actions, as well as uncertainty related to performance after the expiration of relief packages and COVID-19, the impact of the Merger, and the effect of applying the CECL methodology in the current quarter compared to the incurred methodology in the prior year. Net charge-offs for the third quarter of 2020 totaled $326 million compared to $153 million in the prior year. Higher net charge-offs also contributed to the increase in the provision for credit losses and primarily reflect increases as a result of the Merger. The net charge-off rate for the current quarter of 0.42% of average loans and leases was up one basis point compared to the third quarter of 2019.
Noninterest income for the third quarter of 2020 increased $907 million compared to the earlier quarter. The current quarter includes $104 million of securities gains. Excluding the securities gains, noninterest income increased $803 million, with nearly all categories of noninterest income being impacted by the Merger. In addition to these impacts, insurance income increased $31 million due to strong production and premium growth and residential mortgage banking income was up due to strong production and refinance activity driven by the lower rate environment, partially offset by lower valuations of mortgage servicing rights. Service charges on deposits partially rebounded during the third quarter due to increased overdraft incident rates and reduced refunds and waivers to accommodate clients impacted by the COVID-19 pandemic.
Noninterest expense for the third quarter of 2020 was up $1.9 billion compared to the earlier quarter. Merger-related and restructuring charges and other incremental operating expenses related to the Merger increased $202 million and $100 million, respectively. In addition, the current quarter was impacted by a $50 million charitable contribution to the Truist Charitable Fund. Excluding the items mentioned above and the impact of an increase of $141 million of amortization expense for intangibles, adjusted noninterest expense was up $1.4 billion primarily reflecting the impact of the Merger. In addition to the impacts of the Merger, operating costs were elevated due to COVID-19, which resulted in an additional $26 million of expenses compared to the third quarter of 2019. This was primarily related to net occupancy costs for enhanced cleaning.
The provision for income taxes was $255 million for the third quarter of 2020, compared to $218 million for the earlier quarter. This produced an effective tax rate for the third quarter of 2020 of 18.3%, compared to 20.8% for the earlier quarter. The lower effective tax rate is primarily due to higher favorable permanent tax items and income tax credits earned in the current year.
Truist's total assets at September 30, 2020 were $499.2 billion, an increase of $26.1 billion compared to December 31, 2019. The increase in total assets was primarily driven by an increase of $17.9 billion in interest-bearing deposits with banks reflecting higher balances held at the Federal Reserve, an increase of $11.4 billion in AFS securities and a $3.9 billion increase in total loans and leases. These increases were partially offset by a $4.3 billion increase in the ALLL and a $1.1 billion decrease in trading assets.
Truist Financial Corporation 51
Total deposits at September 30, 2020 were $370.7 billion, an increase of $36.0 billion compared to December 31, 2019. The growth in deposits reflects solid growth in all non-time deposit products due to a flight to quality and the government stimulus programs, partially offset by a decline in time deposits primarily due to maturities of wholesale negotiable certificates of deposit and higher-cost personal and business accounts.
Asset quality ratios were relatively stable at September 30, 2020. As of September 30, 2020, nonperforming assets were 0.26% of total assets. The allowance for loan and lease loss coverage ratio was 5.22x nonperforming loans and leases held for investment, compared to 3.41x at December 31, 2019. The higher coverage ratio reflects the CECL adoption build, as well as a reserve build in 2020 in connection with COVID-19 and the economic downturn.
Truist maintained strong capital and liquidity. As of September 30, 2020, the CET1 ratio was 10.0% and the average LCR was 117%. During the nine months ended September 30, 2020, Truist issued $3.5 billion of preferred stock and redeemed $500 million of Series K preferred stock. The Company also issued $6.5 billion of senior and subordinated long-term debt. Truist declared common dividends of $0.450 per share during the third quarter of 2020. The dividend and total payout ratios for the third quarter of 2020 were 56.8%. In October 2020, Truist declared common dividends of $0.450 per share for the fourth quarter of 2020.
52 Truist Financial Corporation
Analysis of Results of Operations
Net Interest Income and NIM
Third Quarter 2020 compared to Third Quarter 2019
Net interest margin was 3.10%, down 27 basis points compared to the earlier quarter. Average earning assets increased $232.0 billion. The increase in average earning assets reflects a $163.6 billion increase in average total loans and leases and a $30.9 billion increase in average securities. Average other earning assets increased $34.0 billion primarily due to higher interest-earning balances at the Federal Reserve. Average interest-bearing liabilities increased $155.0 billion compared to the earlier quarter. Average interest-bearing deposits increased $138.8 billion, average long-term debt increased $18.3 billion and average short-term borrowings decreased $2.1 billion. The significant increases in earning assets and liabilities are primarily due to the Merger, as well as impacts from the COVID-19 pandemic and the resulting government stimulus programs.
The yield on the total loan portfolio for the third quarter of 2020 was 4.04%, down 94 basis points compared to the earlier quarter, reflecting the impact of rate decreases and deferred interest for loans granted an accommodation in connection with COVID-19, partially offset by purchase accounting accretion from merged loans. The yield on the average securities portfolio was 1.97%, down 63 basis points compared to the earlier quarter primarily due to lower yields on new purchases and higher premium amortization.
The average cost of total deposits was 0.10%, down 57 basis points compared to the earlier quarter, and the average cost of interest-bearing deposits was 0.15%, down 84 basis points compared to the earlier quarter. The average rate on short-term borrowings was 0.85%, down 170 basis points compared to the earlier quarter. The average rate on long-term debt was 1.48%, down 194 basis points compared to the earlier quarter. The lower rates on interest-bearing liabilities reflect the lower rate environment. The lower rates on long-term debt also reflect the amortization of the fair value mark on the assumed debt and the issuance of new long-term debt.
Nine Months of 2020 compared to Nine Months of 2019
The net interest margin was 3.26% for the nine months ended September 30, 2020, down 17 basis points compared to the earlier period. Average earning assets increased $231.3 billion, which primarily reflects a $165.8 billion increase in average total loans and leases, a $32.0 billion increase in average other earning assets, a $29.6 billion increase in average securities and a $3.8 billion increase in interest earning trading assets. The increase in average other earning assets primarily reflects higher interest-bearing balances at the Federal Reserve. Average interest-bearing liabilities increased $169.3 billion. Average interest-bearing deposits increased $140.7 billion, average long-term debt increased $24.6 billion and average short-term borrowings increased $3.9 billion. The significant increases in earnings assets and liabilities are primarily due to the Merger, as well as impacts from the COVID-19 pandemic and the resulting government stimulus programs.
The yield on the total loan portfolio for the nine months ended September 30, 2020 was 4.39%, down 64 basis points compared to the earlier period, reflecting the impact of rate decreases and deferred interest for loans granted an accommodation in connection with COVID-19, partially offset by purchase accounting accretion from merged loans. The yield on the average securities portfolio for the nine months ended September 30, 2020 was 2.31%, down 30 basis points compared to the earlier period primarily due lower yields on new purchases and higher premium amortization.
The average cost of total deposits was 0.27%, down 39 basis points compared to the earlier period. The average cost of interest-bearing deposits was 0.39%, down 60 basis points compared to the earlier period. The average rate on short-term borrowings was 1.46%, down 98 basis points compared to the earlier period. The average rate on long-term debt was 1.78%, down 157 basis points compared to the earlier period. The lower rates on interest-bearing liabilities reflect the lower rate environment. The lower rates on long-term debt also reflect the amortization of the fair value mark on the assumed debt and the issuance of new long-term debt.
As of September 30, 2020, the remaining unamortized fair value marks on the loan and lease portfolio, deposits and long-term debt were $2.7 billion, $26 million and $238 million, respectively. The remaining unamortized fair value mark on loans and leases consists of $1.2 billion for commercial loans and leases and $1.5 billion for consumer loans and leases. These amounts will be recognized over the remaining contractual lives of the underlying instruments or as prepayments occur.
The major components of net interest income and the related annualized yields as well as the variances between the periods caused by changes in interest rates versus changes in volumes are summarized below.
Truist Financial Corporation 53
| Table 1-1: Taxable-Equivalent Net Interest Income and Rate / Volume Analysis (1) | |||||||||||||||||||||||||||||||||||||||||||||||||||||
|
Three Months Ended September 30,
(Dollars in millions) |
Average Balances (5) | Annualized Yield/Rate | Income/Expense |
Incr.
(Decr.) |
Change due to | ||||||||||||||||||||||||||||||||||||||||||||||||
| 2020 | 2019 | 2020 | 2019 | 2020 | 2019 | Rate | Volume | ||||||||||||||||||||||||||||||||||||||||||||||
| Assets | |||||||||||||||||||||||||||||||||||||||||||||||||||||
| Total securities, at amortized cost: (2) | |||||||||||||||||||||||||||||||||||||||||||||||||||||
| U.S. Treasury | $ | 2,218 | $ | 2,240 | 1.78 | % | 2.04 | % | $ | 10 | $ | 11 | $ | (1) | $ | (1) | $ | — | |||||||||||||||||||||||||||||||||||
| GSE | 1,842 | 2,449 | 2.33 | 2.25 | 10 | 14 | (4) | — | (4) | ||||||||||||||||||||||||||||||||||||||||||||
| Agency MBS | 75,232 | 43,415 | 1.95 | 2.57 | 366 | 279 | 87 | (80) | 167 | ||||||||||||||||||||||||||||||||||||||||||||
| States and political subdivisions | 499 | 566 | 5.03 | 3.44 | 7 | 5 | 2 | 3 | (1) | ||||||||||||||||||||||||||||||||||||||||||||
| Non-agency MBS | — | 198 | — | 18.77 | — | 9 | (9) | (5) | (4) | ||||||||||||||||||||||||||||||||||||||||||||
| Other | 37 | 32 | 1.99 | 3.67 | 1 | — | 1 | 1 | — | ||||||||||||||||||||||||||||||||||||||||||||
| Total securities | 79,828 | 48,900 | 1.97 | 2.60 | 394 | 318 | 76 | (82) | 158 | ||||||||||||||||||||||||||||||||||||||||||||
| Interest earning trading assets | 4,056 | 668 | 3.23 | 2.02 | 32 | 3 | 29 | 3 | 26 | ||||||||||||||||||||||||||||||||||||||||||||
| Other earning assets (3) | 35,819 | 1,798 | 0.26 | 2.92 | 24 | 14 | 10 | (22) | 32 | ||||||||||||||||||||||||||||||||||||||||||||
| Loans and leases, net of unearned income: (4) | |||||||||||||||||||||||||||||||||||||||||||||||||||||
| Commercial and industrial | 143,452 | 63,768 | 3.02 | 4.18 | 1,087 | 671 | 416 | (229) | 645 | ||||||||||||||||||||||||||||||||||||||||||||
| CRE | 27,761 | 17,042 | 2.88 | 4.83 | 203 | 209 | (6) | (104) | 98 | ||||||||||||||||||||||||||||||||||||||||||||
| Commercial Construction | 6,861 | 3,725 | 3.26 | 5.11 | 55 | 47 | 8 | (22) | 30 | ||||||||||||||||||||||||||||||||||||||||||||
| Lease financing | 5,626 | 2,260 | 3.71 | 3.17 | 52 | 18 | 34 | 4 | 30 | ||||||||||||||||||||||||||||||||||||||||||||
| Residential mortgage | 51,500 | 28,410 | 4.47 | 4.02 | 576 | 285 | 291 | 35 | 256 | ||||||||||||||||||||||||||||||||||||||||||||
| Residential home equity and direct | 26,726 | 11,650 | 5.86 | 5.92 | 394 | 173 | 221 | (2) | 223 | ||||||||||||||||||||||||||||||||||||||||||||
| Indirect auto | 24,732 | 11,810 | 6.51 | 8.84 | 405 | 262 | 143 | (84) | 227 | ||||||||||||||||||||||||||||||||||||||||||||
| Indirect other | 11,530 | 6,552 | 7.05 | 6.61 | 204 | 110 | 94 | 8 | 86 | ||||||||||||||||||||||||||||||||||||||||||||
| Student | 7,446 | — | 4.30 | — | 80 | — | 80 | — | 80 | ||||||||||||||||||||||||||||||||||||||||||||
| Credit card | 4,810 | 3,036 | 9.03 | 9.18 | 109 | 71 | 38 | (1) | 39 | ||||||||||||||||||||||||||||||||||||||||||||
| PCI | — | 411 | — | 24.23 | — | 25 | (25) | — | (25) | ||||||||||||||||||||||||||||||||||||||||||||
| Total loans and leases HFI | 310,444 | 148,664 | 4.06 | 5.00 | 3,165 | 1,871 | 1,294 | (395) | 1,689 | ||||||||||||||||||||||||||||||||||||||||||||
| LHFS | 5,247 | 3,378 | 2.78 | 4.16 | 37 | 35 | 2 | (14) | 16 | ||||||||||||||||||||||||||||||||||||||||||||
| Total loans and leases | 315,691 | 152,042 | 4.04 | 4.98 | 3,202 | 1,906 | 1,296 | (409) | 1,705 | ||||||||||||||||||||||||||||||||||||||||||||
| Total earning assets | 435,394 | 203,408 | 3.34 | 4.38 | 3,652 | 2,241 | 1,411 | (510) | 1,921 | ||||||||||||||||||||||||||||||||||||||||||||
| Nonearning assets | 65,432 | 29,012 | |||||||||||||||||||||||||||||||||||||||||||||||||||
| Total assets | $ | 500,826 | $ | 232,420 | |||||||||||||||||||||||||||||||||||||||||||||||||
| Liabilities and Shareholders' Equity | |||||||||||||||||||||||||||||||||||||||||||||||||||||
| Interest-bearing deposits: | |||||||||||||||||||||||||||||||||||||||||||||||||||||
| Interest-checking | $ | 96,707 | $ | 27,664 | 0.06 | 0.67 | 15 | 47 | (32) | (71) | 39 | ||||||||||||||||||||||||||||||||||||||||||
| Money market and savings | 123,598 | 64,920 | 0.06 | 0.95 | 19 | 156 | (137) | (213) | 76 | ||||||||||||||||||||||||||||||||||||||||||||
| Time deposits | 27,940 | 16,643 | 0.89 | 1.62 | 62 | 67 | (5) | (39) | 34 | ||||||||||||||||||||||||||||||||||||||||||||
| Foreign office deposits - interest-bearing | — | 265 | — | 2.13 | — | 1 | (1) | — | (1) | ||||||||||||||||||||||||||||||||||||||||||||
| Total interest-bearing deposits (6) | 248,245 | 109,492 | 0.15 | 0.99 | 96 | 271 | (175) | (323) | 148 | ||||||||||||||||||||||||||||||||||||||||||||
| Short-term borrowings | 6,209 | 8,307 | 0.85 | 2.55 | 13 | 54 | (41) | (30) | (11) | ||||||||||||||||||||||||||||||||||||||||||||
| Long-term debt | 40,919 | 22,608 | 1.48 | 3.42 | 152 | 193 | (41) | (146) | 105 | ||||||||||||||||||||||||||||||||||||||||||||
| Total interest-bearing liabilities | 295,373 | 140,407 | 0.35 | 1.47 | 261 | 518 | (257) | (499) | 242 | ||||||||||||||||||||||||||||||||||||||||||||
| Noninterest-bearing deposits (6) | 123,966 | 52,500 | |||||||||||||||||||||||||||||||||||||||||||||||||||
| Other liabilities | 11,853 | 6,769 | |||||||||||||||||||||||||||||||||||||||||||||||||||
| Shareholders' equity | 69,634 | 32,744 | |||||||||||||||||||||||||||||||||||||||||||||||||||
| Total liabilities and shareholders' equity | $ | 500,826 | $ | 232,420 | |||||||||||||||||||||||||||||||||||||||||||||||||
| Average interest-rate spread | 2.99 | % | 2.91 | % | |||||||||||||||||||||||||||||||||||||||||||||||||
| NIM/net interest income | 3.10 | % | 3.37 | % | $ | 3,391 | $ | 1,723 | $ | 1,668 | $ | (11) | $ | 1,679 | |||||||||||||||||||||||||||||||||||||||
| Taxable-equivalent adjustment | $ | 29 | $ | 23 | |||||||||||||||||||||||||||||||||||||||||||||||||
(1) Yields are stated on a TE basis utilizing federal tax rate. The change in interest not solely due to changes in rate or volume has been allocated based on the pro-rata absolute dollar amount of each. Interest income includes certain fees, deferred costs and dividends.
(2) Total securities include AFS and HTM securities.
(3) Includes cash equivalents, interest-bearing deposits with banks, FHLB stock and other earning assets.
(4) Fees, which are not material for any of the periods shown, are included for rate calculation purposes. NPLs are included in the average balances.
(5) Excludes basis adjustments for fair value hedges.
(6) Total deposit costs were 0.10% and 0.67% for the three months ended September 30, 2020 and 2019, respectively.
54 Truist Financial Corporation
| Table 1-2: Taxable-Equivalent Net Interest Income and Rate / Volume Analysis (1) | |||||||||||||||||||||||||||||||||||||||||||||||||||||
|
Nine Months Ended September 30,
(Dollars in millions) |
Average Balances (5) | Annualized Yield/Rate | Income/Expense |
Incr.
(Decr.) |
Change due to | ||||||||||||||||||||||||||||||||||||||||||||||||
| 2020 | 2019 | 2020 | 2019 | 2020 | 2019 | Rate | Volume | ||||||||||||||||||||||||||||||||||||||||||||||
| Assets | |||||||||||||||||||||||||||||||||||||||||||||||||||||
| Total securities, at amortized cost: (2) | |||||||||||||||||||||||||||||||||||||||||||||||||||||
| U.S. Treasury | $ | 2,243 | $ | 2,731 | 1.86 | % | 2.03 | % | $ | 31 | $ | 41 | $ | (10) | $ | (3) | $ | (7) | |||||||||||||||||||||||||||||||||||
| GSE | 1,847 | 2,436 | 2.33 | 2.25 | 32 | 41 | (9) | 1 | (10) | ||||||||||||||||||||||||||||||||||||||||||||
| Agency MBS | 72,152 | 41,202 | 2.29 | 2.57 | 1,240 | 795 | 445 | (95) | 540 | ||||||||||||||||||||||||||||||||||||||||||||
| States and political subdivisions | 512 | 583 | 4.04 | 3.85 | 16 | 17 | (1) | 1 | (2) | ||||||||||||||||||||||||||||||||||||||||||||
| Non-agency MBS | 115 | 271 | 16.78 | 14.34 | 15 | 29 | (14) | 4 | (18) | ||||||||||||||||||||||||||||||||||||||||||||
| Other | 37 | 34 | 2.44 | 3.83 | 1 | 1 | — | — | — | ||||||||||||||||||||||||||||||||||||||||||||
| Total securities | 76,906 | 47,257 | 2.31 | 2.61 | 1,335 | 924 | 411 | (92) | 503 | ||||||||||||||||||||||||||||||||||||||||||||
| Interest earning trading assets | 4,695 | 910 | 3.85 | 2.20 | 135 | 15 | 120 | 18 | 102 | ||||||||||||||||||||||||||||||||||||||||||||
| Other earning assets (3) | 33,708 | 1,702 | 0.57 | 4.30 | 144 | 55 | 89 | (87) | 176 | ||||||||||||||||||||||||||||||||||||||||||||
| Loans and leases, net of unearned income: (4) | |||||||||||||||||||||||||||||||||||||||||||||||||||||
| Commercial and industrial | 142,731 | 62,576 | 3.47 | 4.28 | 3,710 | 2,006 | 1,704 | (442) | 2,146 | ||||||||||||||||||||||||||||||||||||||||||||
| CRE | 27,538 | 16,894 | 3.46 | 4.93 | 717 | 626 | 91 | (223) | 314 | ||||||||||||||||||||||||||||||||||||||||||||
| Commercial Construction | 6,673 | 3,912 | 3.92 | 5.26 | 192 | 151 | 41 | (47) | 88 | ||||||||||||||||||||||||||||||||||||||||||||
| Lease financing | 5,872 | 2,135 | 4.24 | 3.26 | 187 | 52 | 135 | 20 | 115 | ||||||||||||||||||||||||||||||||||||||||||||
| Residential mortgage | 52,288 | 30,604 | 4.53 | 4.05 | 1,778 | 930 | 848 | 121 | 727 | ||||||||||||||||||||||||||||||||||||||||||||
| Residential home equity and direct | 27,161 | 11,673 | 6.08 | 5.94 | 1,237 | 517 | 720 | 13 | 707 | ||||||||||||||||||||||||||||||||||||||||||||
| Indirect auto | 24,809 | 11,586 | 6.68 | 8.73 | 1,240 | 756 | 484 | (212) | 696 | ||||||||||||||||||||||||||||||||||||||||||||
| Indirect other | 11,255 | 6,277 | 7.19 | 6.60 | 606 | 310 | 296 | 30 | 266 | ||||||||||||||||||||||||||||||||||||||||||||
| Student | 7,622 | — | 4.75 | — | 271 | — | 271 | — | 271 | ||||||||||||||||||||||||||||||||||||||||||||
| Credit card | 5,097 | 2,976 | 9.34 | 9.05 | 356 | 203 | 153 | 7 | 146 | ||||||||||||||||||||||||||||||||||||||||||||
| PCI | — | 433 | — | 21.20 | — | 69 | (69) | — | (69) | ||||||||||||||||||||||||||||||||||||||||||||
| Total loans and leases HFI | 311,046 | 149,066 | 4.42 | 5.04 | 10,294 | 5,620 | 4,674 | (733) | 5,407 | ||||||||||||||||||||||||||||||||||||||||||||
| LHFS | 5,575 | 1,742 | 3.00 | 4.17 | 126 | 54 | 72 | (19) | 91 | ||||||||||||||||||||||||||||||||||||||||||||
| Total loans and leases | 316,621 | 150,808 | 4.39 | 5.03 | 10,420 | 5,674 | 4,746 | (752) | 5,498 | ||||||||||||||||||||||||||||||||||||||||||||
| Total earning assets | 431,930 | 200,677 | 3.72 | 4.44 | 12,034 | 6,668 | 5,366 | (913) | 6,279 | ||||||||||||||||||||||||||||||||||||||||||||
| Nonearning assets | 65,780 | 28,429 | |||||||||||||||||||||||||||||||||||||||||||||||||||
| Total assets | $ | 497,710 | $ | 229,106 | |||||||||||||||||||||||||||||||||||||||||||||||||
| Liabilities and Shareholders' Equity | |||||||||||||||||||||||||||||||||||||||||||||||||||||
| Interest-bearing deposits: | |||||||||||||||||||||||||||||||||||||||||||||||||||||
| Interest-checking | $ | 93,205 | $ | 27,665 | 0.28 | 0.64 | 199 | 132 | 67 | (106) | 173 | ||||||||||||||||||||||||||||||||||||||||||
| Money market and savings | 123,536 | 63,885 | 0.27 | 0.98 | 254 | 469 | (215) | (475) | 260 | ||||||||||||||||||||||||||||||||||||||||||||
| Time deposits | 32,157 | 16,256 | 1.10 | 1.57 | 265 | 190 | 75 | (70) | 145 | ||||||||||||||||||||||||||||||||||||||||||||
| Foreign office deposits - interest-bearing | — | 355 | — | 2.36 | — | 6 | (6) | — | (6) | ||||||||||||||||||||||||||||||||||||||||||||
| Total interest-bearing deposits (6) | 248,898 | 108,161 | 0.39 | 0.99 | 718 | 797 | (79) | (651) | 572 | ||||||||||||||||||||||||||||||||||||||||||||
| Short-term borrowings | 11,350 | 7,443 | 1.46 | 2.44 | 124 | 136 | (12) | (67) | 55 | ||||||||||||||||||||||||||||||||||||||||||||
| Long-term debt | 47,643 | 23,027 | 1.78 | 3.35 | 635 | 578 | 57 | (359) | 416 | ||||||||||||||||||||||||||||||||||||||||||||
| Total interest-bearing liabilities | 307,891 | 138,631 | 0.64 | 1.46 | 1,477 | 1,511 | (34) | (1,077) | 1,043 | ||||||||||||||||||||||||||||||||||||||||||||
| Noninterest-bearing deposits (6) | 110,375 | 52,489 | |||||||||||||||||||||||||||||||||||||||||||||||||||
| Other liabilities | 12,133 | 6,449 | |||||||||||||||||||||||||||||||||||||||||||||||||||
| Shareholders' equity | 67,311 | 31,537 | |||||||||||||||||||||||||||||||||||||||||||||||||||
| Total liabilities and shareholders' equity | $ | 497,710 | $ | 229,106 | |||||||||||||||||||||||||||||||||||||||||||||||||
| Average interest-rate spread | 3.08 | % | 2.98 | % | |||||||||||||||||||||||||||||||||||||||||||||||||
| NIM/net interest income | 3.26 | % | 3.43 | % | $ | 10,557 | $ | 5,157 | $ | 5,400 | $ | 164 | $ | 5,236 | |||||||||||||||||||||||||||||||||||||||
| Taxable-equivalent adjustment | $ | 97 | $ | 71 | |||||||||||||||||||||||||||||||||||||||||||||||||
(1) Yields are stated on a TE basis utilizing federal tax rate. The change in interest not solely due to changes in rate or volume has been allocated based on the pro-rata absolute dollar amount of each. Interest income includes certain fees, deferred costs and dividends.
(2) Total securities include AFS and HTM securities.
(3) Includes cash equivalents, interest-bearing deposits with banks, FHLB stock and other earning assets.
(4) Fees, which are not material for any of the periods shown, are included for rate calculation purposes. NPLs are included in the average balances.
(5) Excludes basis adjustments for fair value hedges.
(6) Total deposit costs were 0.27% and 0.66% for the nine months ended September 30, 2020 and 2019, respectively.
Truist Financial Corporation 55
Provision for Credit Losses
Third Quarter 2020 compared to Third Quarter 2019
The provision for credit losses was $421 million, compared to $117 million for the earlier quarter. The increase in the provision for credit losses reflects a modest build to the allowance for credit losses primarily due to monitoring of clients’ financial position and associated re-grading actions, as well as uncertainty related to performance after the expiration of relief packages and COVID-19, the impact of the Merger, and the effect of applying the CECL methodology in the current quarter compared to the incurred loss methodology in the earlier quarter. Net charge-offs for the third quarter of 2020 totaled $326 million compared to $153 million in the earlier quarter. Higher net charge-offs also contributed to the increase in the provision for credit losses and primarily reflect increases as a result of the Merger. The net charge-off rate for the current quarter of 0.42% was up one basis point compared to the third quarter of 2019.
Nine Months of 2020 compared to Nine Months of 2019
The provision for credit losses was $2.2 billion, compared to $444 million for the earlier period. The increase in the provision for credit losses
for the first nine months of 2020 reflects the significant builds to the allowance for credit losses in the first and second quarters of the year due to increased economic stress associated with the pandemic and specific consideration of its impact on certain industries, as well as uncertainty related to performance after the expiration of relief packages and COVID-19, the impact of the Merger, and the effect of applying the CECL methodology in the current period compared to the incurred loss methodology in the earlier period. Net charge-offs for the nine months ended September 30, 2020 were $914 million, compared to $442 million for the earlier period. Higher net charge-offs also contributed to the increase in the provision for credit losses and primarily reflect increases as a result of the Merger. The net charge-off rate of 0.39% for the nine months ended September 30, 2020 was down one basis point compared to the earlier period.
Noninterest Income
Noninterest income is a significant contributor to Truist's financial results. Management focuses on diversifying its sources of revenue to reduce Truist's reliance on traditional spread-based interest income, as certain fee-based activities are a relatively stable revenue source during periods of changing interest rates.
| Table 2: Noninterest Income | |||||||||||||||||||||||||||||||||||
| Three Months Ended September 30, | Nine Months Ended September 30, | ||||||||||||||||||||||||||||||||||
| (Dollars in millions) | 2020 | 2019 | % Change | 2020 | 2019 | % Change | |||||||||||||||||||||||||||||
| Insurance income | $ | 518 | $ | 487 | 6.4 | % | $ | 1,648 | $ | 1,563 | 5.4 | % | |||||||||||||||||||||||
| Service charges on deposits | 247 | 188 | 31.4 | 754 | 540 | 39.6 | |||||||||||||||||||||||||||||
| Wealth management income | 324 | 175 | 85.1 | 945 | 509 | 85.7 | |||||||||||||||||||||||||||||
| Card and payment related fees | 200 | 132 | 51.5 | 558 | 399 | 39.8 | |||||||||||||||||||||||||||||
| Residential mortgage income | 221 | 80 | 176.3 | 807 | 220 | NM | |||||||||||||||||||||||||||||
| Investment banking and trading income | 244 | 60 | NM | 636 | 135 | NM | |||||||||||||||||||||||||||||
| Operating lease income | 72 | 36 | 100.0 | 232 | 106 | 118.9 | |||||||||||||||||||||||||||||
| Income from bank-owned life insurance | 46 | 29 | 58.6 | 135 | 91 | 48.4 | |||||||||||||||||||||||||||||
| Lending related fees | 77 | 24 | NM | 210 | 77 | 172.7 | |||||||||||||||||||||||||||||
| Commercial real estate related income | 55 | 32 | 71.9 | 148 | 68 | 117.6 | |||||||||||||||||||||||||||||
| Securities gains (losses) | 104 | — | NM | 402 | — | NM | |||||||||||||||||||||||||||||
| Other income (loss) | 102 | 60 | 70.0 | 119 | 149 | (20.1) | |||||||||||||||||||||||||||||
| Total noninterest income | $ | 2,210 | $ | 1,303 | 69.6 | $ | 6,594 | $ | 3,857 | 71.0 | |||||||||||||||||||||||||
Third Quarter 2020 compared to Third Quarter 2019
Noninterest income for the third quarter of 2020 increased $907 million compared to the earlier quarter. The current quarter includes $104 million of securities gains. Excluding the securities gains, noninterest income increased $803 million, with nearly all categories of noninterest income being impacted by the Merger. In addition to the impacts from the Merger, insurance income increased $31 million due to strong production and premium growth and residential mortgage banking income was up due to strong production and refinance activity driven by the lower rate environment, partially offset by lower valuations of the mortgage servicing rights. Service charges on deposits partially rebounded during the third quarter due to increased overdraft incident rates and reduced refunds and waivers to accommodate clients impacted by the COVID-19 pandemic.
56 Truist Financial Corporation
Nine Months of 2020 compared to Nine Months of 2019
Noninterest income for the nine months ended September 30, 2020 increased $2.7 billion compared to the earlier period. The current period includes $402 million of net securities gains primarily from the sale of non-agency mortgage-backed securities in the second quarter of 2020 and agency mortgage-backed securities in the third quarter of 2020. Excluding the net securities gains, noninterest income increased $2.3 billion, with nearly all categories of noninterest income being impacted by the Merger. In addition to the impacts from the Merger, insurance income increased $85 million due to strong production and premium growth and residential mortgage banking income was up due to strong production and refinance activity driven by the lower rate environment, partially offset by lower valuations of the mortgage servicing rights. Service charges on deposits were up despite reduced overdraft incident rates and refunds and waivers to support clients impacted by the COVID-19 pandemic. Additionally, investment banking and trading income was up, but was negatively impacted by credit valuation adjustments on the derivatives portfolio primarily related to the decline in interest rates and widening of credit spreads. Other income decreased $30 million primarily due to less income from private equity investments.
Noninterest Expense
The following table provides a breakdown of Truist's noninterest expense:
| Table 3: Noninterest Expense | |||||||||||||||||||||||||||||||||||
| Three Months Ended September 30, | Nine Months Ended September 30, | ||||||||||||||||||||||||||||||||||
| (Dollars in millions) | 2020 | 2019 | % Change | 2020 | 2019 | % Change | |||||||||||||||||||||||||||||
| Personnel expense | $ | 2,058 | $ | 1,161 | 77.3 | % | $ | 6,038 | $ | 3,368 | 79.3 | % | |||||||||||||||||||||||
| Net occupancy expense | 233 | 122 | 91.0 | 697 | 360 | 93.6 | |||||||||||||||||||||||||||||
| Professional fees and outside processing | 323 | 102 | NM | 859 | 272 | NM | |||||||||||||||||||||||||||||
| Software expense | 221 | 77 | 187.0 | 647 | 220 | 194.1 | |||||||||||||||||||||||||||||
| Equipment expense | 127 | 64 | 98.4 | 363 | 197 | 84.3 | |||||||||||||||||||||||||||||
| Marketing and customer development | 75 | 36 | 108.3 | 215 | 92 | 133.7 | |||||||||||||||||||||||||||||
| Operating lease depreciation | 56 | 35 | 60.0 | 204 | 93 | 119.4 | |||||||||||||||||||||||||||||
| Loan-related expense | 59 | 26 | 126.9 | 177 | 81 | 118.5 | |||||||||||||||||||||||||||||
| Amortization of intangibles | 170 | 29 | NM | 513 | 93 | NM | |||||||||||||||||||||||||||||
| Regulatory costs | 34 | 20 | 70.0 | 93 | 57 | 63.2 | |||||||||||||||||||||||||||||
| Merger-related and restructuring charges | 236 | 34 | NM | 552 | 137 | NM | |||||||||||||||||||||||||||||
| Loss (gain) on early extinguishment of debt | — | — | — | 235 | — | NM | |||||||||||||||||||||||||||||
| Other expense | 163 | 134 | 21.6 | 471 | 389 | 21.1 | |||||||||||||||||||||||||||||
| Total noninterest expense | $ | 3,755 | $ | 1,840 | 104.1 | $ | 11,064 | $ | 5,359 | 106.5 | |||||||||||||||||||||||||
Third Quarter 2020 compared to Third Quarter 2019
Noninterest expense for the third quarter of 2020 was up $1.9 billion compared to the earlier quarter. Merger-related and restructuring charges and other incremental operating expenses related to the Merger increased $202 million and $100 million, respectively. In addition, the current quarter was impacted by a $50 million charitable contribution to the Truist Charitable Fund. Excluding the items mentioned above and the impact of an increase of $141 million of amortization expense for intangibles, adjusted noninterest expense was up $1.4 billion primarily reflecting the impact of the Merger. In addition to the impacts of the Merger, operating costs were elevated due to COVID-19, which resulted in an additional $26 million of expenses compared to the third quarter of 2019. This was primarily related to net occupancy costs for enhanced cleaning.
Nine Months of 2020 compared to Nine Months of 2019
Noninterest expense for the nine months ended September 30, 2020 was up $5.7 billion compared to the earlier period. Merger-related and restructuring charges and other incremental operating expenses related to the Merger increased $415 million and $292 million, respectively. In addition, the current period was impacted by $235 million of losses on the early extinguishment of long-term debt and a $50 million charitable contribution to the Truist Charitable Fund. Excluding the items mentioned above and the impact of an increase of $420 million of amortization expense for intangibles, noninterest expense was up $4.3 billion, primarily reflecting the impact of the Merger. In addition to the impacts of the Merger, operating costs were elevated due to COVID-19, which resulted in an additional $206 million of expenses compared to the earlier period. This was primarily related to additional on-site pay and bonuses for certain teammates, net occupancy costs for enhanced cleaning and teammate support expenses.
Truist Financial Corporation 57
Merger-Related and Restructuring Charges
The following table presents a summary of merger-related and restructuring charges and the related accruals:
| Table 4: Merger-Related and Restructuring Accrual Activity | |||||||||||||||||||||||||||||||||||||||||||||||
| Three Months Ended September 30, 2020 | Nine Months Ended September 30, 2020 | ||||||||||||||||||||||||||||||||||||||||||||||
| (Dollars in millions) | Accrual at Jul 1, 2020 | Expense | Utilized | Accrual at Sep 30, 2020 | Accrual at Jan 1, 2020 | Expense | Utilized | Accrual at Sep 30, 2020 | |||||||||||||||||||||||||||||||||||||||
| Severance and personnel-related | $ | 84 | $ | 37 | $ | (84) | $ | 37 | $ | 46 | $ | 172 | $ | (181) | $ | 37 | |||||||||||||||||||||||||||||||
| Occupancy and equipment | — | 78 | (78) | — | — | 126 | (126) | — | |||||||||||||||||||||||||||||||||||||||
| Professional services | 3 | 96 | (97) | 2 | 42 | 191 | (231) | 2 | |||||||||||||||||||||||||||||||||||||||
|
Systems conversion and related costs
|
— | 16 | (16) | — | — | 19 | (19) | — | |||||||||||||||||||||||||||||||||||||||
| Other adjustments | 1 | 9 | 4 | 14 | 1 | 44 | (31) | 14 | |||||||||||||||||||||||||||||||||||||||
| Total (1) | $ | 88 | $ | 236 | $ | (271) | $ | 53 | $ | 89 | $ | 552 | $ | (588) | $ | 53 | |||||||||||||||||||||||||||||||
(1) In connection with the Merger, the Company recognized $229 million of expense for the third quarter of 2020 and $525 million for the nine months ended September 30, 2020. At September 30, 2020, the Company had an accrual of $42 million related to the Merger. The remaining expense and accrual relate to activities other than the Merger.
Segment Results
See "Note 18. Operating Segments" herein, and "Note 21. Operating Segments" in Truist's Annual Report on Form 10-K for the year ended December 31, 2019, for additional disclosures related to Truist's reportable business segments, including additional details related to results of operations. Fluctuations in noninterest income and noninterest expense are more fully discussed in the Noninterest Income and Noninterest Expense sections above.
| Table 5: Net Income by Reportable Segment | |||||||||||||||||||||||||||||||||||
| Three Months Ended September 30, | Nine Months Ended September 30, | ||||||||||||||||||||||||||||||||||
| (Dollars in millions) | 2020 | 2019 | % Change | 2020 | 2019 | % Change | |||||||||||||||||||||||||||||
| Consumer Banking and Wealth | $ | 817 | $ | 465 | 75.7 | % | $ | 2,207 | $ | 1,322 | 66.9 | % | |||||||||||||||||||||||
| Corporate and Commercial Banking | 583 | 441 | 32.2 | 1,400 | 1,274 | 9.9 | |||||||||||||||||||||||||||||
| Insurance Holdings | 77 | 61 | 26.2 | 308 | 259 | 18.9 | |||||||||||||||||||||||||||||
| Other, Treasury & Corporate | (336) | (139) | 141.7 | (753) | (344) | 118.9 | |||||||||||||||||||||||||||||
| Truist Financial Corporation | $ | 1,141 | $ | 828 | 37.8 | $ | 3,162 | $ | 2,511 | 25.9 | |||||||||||||||||||||||||
Third Quarter 2020 compared to Third Quarter 2019
Consumer Banking and Wealth
CB&W serves individuals and small business clients by offering a variety of loan and deposit products, payment services, bankcard products and other financial services by connecting clients to a wide range of financial products and services. CB&W includes Retail Community Bank, which serves retail, premier and small business clients, delivering on the banking needs of all clients through a network of branches, ATMs and contact centers. CB&W includes Dealer Retail Services, which originates loans on an indirect basis to individuals for the purchase of automobiles, boats and recreational vehicles. Additionally, CB&W includes National Consumer Finance & Payments, which provides a comprehensive set of technology-enabled lending solutions to individuals and small businesses through several national channels, as well as merchant services and payment processing solutions to business clients. CB&W also includes Mortgage Banking, which offers residential mortgage products nationally through its retail and correspondent channels, the internet and by telephone. These products are either sold in the secondary market, primarily with servicing rights retained, or held in the Company’s loan portfolio. Mortgage Banking also services loans for other investors, in addition to loans held in the Company’s loan portfolio. Mortgage Banking also includes Mortgage Warehouse Lending, which provides short-term lending solutions to finance first-lien residential mortgage LHFS by independent mortgage companies. Wealth delivers investment management, financial planning, banking, fiduciary services and related solutions to institutions, affluent and high net worth individuals and families, with financial expertise and industry-specific insights in the medical, legal, sports and entertainment industries.
58 Truist Financial Corporation
CB&W net income was $817 million for the third quarter of 2020, an increase of $352 million compared to the earlier quarter. Segment net interest income increased $1.1 billion primarily due to the Merger. Noninterest income increased $414 million due to the Merger and higher residential mortgage production income as a result of the lower rate environment driving mortgage production through refinance activity, partially offset by lower residential mortgage servicing income driven by higher prepayment as a result of the lower rate environment and an MSR fair value adjustment in the current quarter. The allocated provision for credit losses increased $66 million primarily due to the Merger as well as increased economic stress associated with the pandemic. Noninterest expense increased $1.0 billion primarily due to operating expenses and amortization of intangibles related to the Merger.
CB&W average loans held for investment were up $73.9 billion for the third quarter of 2020 compared to the earlier quarter, primarily driven by the Merger. Average total deposits were up $132.0 billion for the third quarter of 2020 compared to the earlier quarter, primarily due to the Merger, along with reduced consumer spending and inflows from stimulus payments in the Retail Community Bank related to COVID-19.
Corporate and Commercial Banking
C&CB serves large, medium and small business clients by offering a variety of loan and deposit products and connecting clients to the combined organization’s broad array of financial services. C&CB includes Corporate and Investment Banking (“CIB”), which delivers a comprehensive range of strategic advisory, capital raising, risk management, financing, liquidity and investment solutions to both public and private companies in the C&CB segment and Wealth. Additionally, C&CB includes Commercial Community Banking, which offers an array of traditional banking products, including lending, cash management and investment banking to commercial clients via CIB. C&CB also includes Commercial Real Estate, which provides a range of credit and deposit services as well as fee-based product offerings to privately held developers, operators, and investors in commercial real estate properties. C&CB also includes Grandbridge Real Estate Capital, which is a fully integrated commercial mortgage banking company that originates commercial and multi-family real estate loans, services loan portfolios and provides asset and portfolio management as well as real estate brokerage services. Treasury Solutions, within C&CB, provides business clients across the organization with services required to manage their payments and receipts, combined with the ability to manage and optimize their deposits across all aspects of their business.
C&CB net income was $583 million for the third quarter of 2020, an increase of $142 million compared to the earlier quarter. Segment net interest income increased $636 million primarily due to the Merger. Noninterest income increased $338 million also primarily due to the Merger. The allocated provision for credit losses increased $297 million primarily due to the Merger as well as increased economic stress associated with the pandemic. Noninterest expense increased $505 million primarily due to operating expenses and amortization of intangibles related to the Merger in the current quarter.
C&CB average loans held for investment were up $87.7 billion for the third quarter of 2020 compared to the earlier quarter, primarily driven by the Merger coupled with PPP loan originations. Average total deposits were up $76.8 billion for the third quarter of 2020 compared to the earlier quarter, primarily due to the Merger, along with deposit inflows related to PPP loans, line draws and reduced spending from commercial clients.
Insurance Holdings
Truist’s IH segment is one of the largest insurance brokers in the world, providing property and casualty, employee benefits and life insurance to businesses and individuals. It also provides small business and corporate services, such as workers compensation and professional liability, as well as surety coverage and title insurance. In addition, IH provides premium financing for property and casualty insurance.
IH net income was $77 million for the third quarter of 2020, an increase of $16 million compared to the earlier quarter. Noninterest income increased $33 million primarily due to higher production. Noninterest expense increased $11 million primarily due to increased personnel expense, partially offset by lower travel and marketing expenses.
Other, Treasury & Corporate
Net income in OT&C can vary due to the changing needs of the Corporation, including the size of the investment portfolio, the need for wholesale funding and variability associated with derivatives used to hedge the balance sheet.
OT&C generated a net loss of $336 million in the third quarter of 2020, compared to a net loss of $139 million in the earlier quarter. Segment net interest income decreased $80 million. Noninterest income increased $122 million primarily due to the gain on sale of securities in the current quarter. The allocated provision for credit losses decreased $57 million primarily due to a reduction in the provision for unfunded commitments. Noninterest expense increased $396 million primarily due to operating expenses related to the Merger and higher Merger-related charges in the current quarter. The benefit for income taxes increased $100 million primarily due to a higher pre-tax loss.
Truist Financial Corporation 59
Nine Months of 2020 compared to Nine Months of 2019
Consumer Banking and Wealth
CB&W net income was $2.2 billion for the nine months ended September 30, 2020, an increase of $885 million compared to the same period of the prior year. Segment net interest income increased $3.4 billion primarily due to the Merger. Noninterest income increased $1.4 billion due to the Merger and higher residential mortgage income as a result of the lower rate environment driving mortgage production through refinance activity, partially offset by lower residential mortgage servicing income driven by higher prepayment as a result of the lower rate environment and an MSR fair value adjustment in the current year. The allocated provision for credit losses increased $520 million primarily due to the Merger, as well as increased economic stress associated with the pandemic. Noninterest expense increased $3.2 billion primarily due to operating expenses and amortization of intangibles related to the Merger and impacts from COVID-19 in the current year.
CB&W average loans held for investment were up $73.3 billion for the nine months ended September 30, 2020, compared to the prior year primarily due to the merged loans. Average total deposits were up $124.2 billion for the nine months ended September 30, 2020, compared to the prior year, primarily due to the merged deposits and reduced consumer spending in the current year related to COVID-19.
Corporate and Commercial Banking
C&CB net income was $1.4 billion for the nine months ended September 30, 2020, an increase of $126 million compared to the same period of the prior year. Segment net interest income increased $2.0 billion primarily due to the Merger. Noninterest income increased $931 million due to the Merger, partially offset by losses in trading income primarily related to the decline in interest rates and widening of credit spreads. The allocated provision for credit losses increased $1.2 billion primarily due to the Merger, as well as increased economic stress associated with the pandemic and increased losses. Noninterest expense increased $1.6 billion primarily due to operating expenses and amortization of intangibles related to the Merger in the current year.
C&CB average loans held for investment were up $88.7 billion for the nine months ended September 30, 2020, compared to the prior year primarily due to the merged loans and growth in commercial and industrial loans in the current year related to COVID-19. Average total deposits were up $70.7 billion for the nine months ended September 30, 2020, compared to the prior year, primarily due to the merged deposits, deposit inflows related to PPP loans, line draws and reduced spending from commercial clients.
Insurance Holdings
IH net income was $308 million for the nine months ended September 30, 2020, an increase of $49 million compared to the same period of the prior year. Noninterest income increased $103 million primarily due to higher production. Noninterest expense increased $38 million primarily due to commissions on higher production in the current year.
Other, Treasury and Corporate
OT&C generated a net loss of $753 million in the nine months ended September 30, 2020, compared to a net loss of $344 million in the same period of the prior year. Segment net interest income decreased $55 million. Noninterest income increased $306 million primarily due to the gain on sale of securities in the current year, partially offset by lower income related to certain post-employment benefits. The allocated provision for credit losses increased $35 million primarily due to the provision for unfunded commitments. Noninterest expense increased $847 million primarily due to the loss on early extinguishment of long-term debt, operating expenses related to the Merger, and higher Merger-related charges in the current year. The benefit for income taxes increased $222 million primarily due to a higher pre-tax loss.
60 Truist Financial Corporation
Analysis of Financial Condition
Investment Activities
The securities portfolio totaled $86.1 billion at September 30, 2020, compared to $74.7 billion at December 31, 2019. The increase was due primarily to an $11.8 billion increase in Agency MBS, offset partially by a $368 million decrease in Non-agency MBS. The increase in the Agency MBS portfolio includes the redeployment of approximately $5 billion of excess reserves at the Federal Reserve. During the second quarter of 2020, the Company sold Non-agency MBS and during the third quarter of 2020, the Company sold and reinvested $3.2 billion in residential Agency MBS. These sales were the primary drivers for the gains of $402 million for the nine months ended September 30, 2020.
As of September 30, 2020, approximately 3.0% of the securities portfolio was variable rate, compared to 3.6% as of December 31, 2019. The effective duration of the securities portfolio was 3.2 years at September 30, 2020, compared to 4.7 years at December 31, 2019.
U.S. Treasury, GSE and Agency MBS represented 99.3% of the total securities portfolio as of September 30, 2020, compared to 98.7% as of the prior year end.
Lending Activities
The following tables summarize the loans and leases HFI portfolio for each of the last five quarters:
| Table 6: Loans and Leases as of Period End | ||||||||||||||||||||||||||||||||
| (Dollars in millions) | Sep 30, 2020 | Jun 30, 2020 | Mar 31, 2020 | Dec 31, 2019 | Sep 30, 2019 | |||||||||||||||||||||||||||
| Commercial: | ||||||||||||||||||||||||||||||||
| Commercial and industrial | $ | 140,874 | $ | 147,141 | $ | 149,161 | $ | 130,180 | $ | 64,324 | ||||||||||||||||||||||
| CRE | 27,474 | 27,963 | 27,532 | 26,832 | 17,080 | |||||||||||||||||||||||||||
| Commercial construction | 6,772 | 6,891 | 6,630 | 6,205 | 3,804 | |||||||||||||||||||||||||||
| Lease financing | 5,493 | 5,783 | 5,984 | 6,122 | 2,356 | |||||||||||||||||||||||||||
| Consumer: | ||||||||||||||||||||||||||||||||
| Residential mortgage | 50,379 | 51,671 | 53,096 | 52,071 | 28,297 | |||||||||||||||||||||||||||
| Residential home equity and direct | 26,558 | 26,935 | 27,629 | 27,044 | 11,646 | |||||||||||||||||||||||||||
| Indirect auto | 25,269 | 24,509 | 25,146 | 24,442 | 11,871 | |||||||||||||||||||||||||||
| Indirect other | 11,527 | 11,592 | 10,980 | 11,100 | 6,590 | |||||||||||||||||||||||||||
| Student | 7,480 | 7,484 | 7,771 | 6,743 | — | |||||||||||||||||||||||||||
| Credit card | 4,801 | 4,856 | 5,300 | 5,619 | 3,058 | |||||||||||||||||||||||||||
| PCI | — | — | — | 3,484 | 387 | |||||||||||||||||||||||||||
| Total loans and leases HFI | $ | 306,627 | $ | 314,825 | $ | 319,229 | $ | 299,842 | $ | 149,413 | ||||||||||||||||||||||
Total loans and leases held for investment were $306.6 billion at September 30, 2020, compared to $299.8 billion at December 31, 2019. In connection with the adoption of CECL, all loans previously in the PCI portfolio transitioned to PCD loans and were transferred to their respective portfolios. The growth in the commercial and industrial portfolio was primarily due to PPP loans. During the first quarter of 2020 many commercial clients drew down lines of credit, but the majority of those were repaid in the second and third quarter of 2020 as the government programs were implemented in response to the pandemic and clients better understood their liquidity needs.
Truist Financial Corporation 61
The following table presents the composition of average loans and leases for each of the last five quarters:
| Table 7: Average Loans and Leases | ||||||||||||||||||||||||||||||||
|
For the Three Months Ended
(Dollars in millions)
|
Sep 30, 2020 | Jun 30, 2020 | Mar 31, 2020 | Dec 31, 2019 | Sep 30, 2019 | |||||||||||||||||||||||||||
| Commercial: | ||||||||||||||||||||||||||||||||
| Commercial and industrial | $ | 143,452 | $ | 152,991 | $ | 131,743 | $ | 81,853 | $ | 63,768 | ||||||||||||||||||||||
| CRE | 27,761 | 27,804 | 27,046 | 19,896 | 17,042 | |||||||||||||||||||||||||||
| Commercial construction | 6,861 | 6,748 | 6,409 | 4,506 | 3,725 | |||||||||||||||||||||||||||
| Lease financing | 5,626 | 5,922 | 6,070 | 3,357 | 2,260 | |||||||||||||||||||||||||||
| Consumer: | ||||||||||||||||||||||||||||||||
| Residential mortgage | 51,500 | 52,380 | 52,993 | 34,824 | 28,410 | |||||||||||||||||||||||||||
| Residential home equity and direct | 26,726 | 27,199 | 27,564 | 15,810 | 11,650 | |||||||||||||||||||||||||||
| Indirect auto | 24,732 | 24,721 | 24,975 | 15,390 | 11,810 | |||||||||||||||||||||||||||
| Indirect other | 11,530 | 11,282 | 10,950 | 7,772 | 6,552 | |||||||||||||||||||||||||||
| Student | 7,446 | 7,633 | 7,787 | 1,825 | — | |||||||||||||||||||||||||||
| Credit card | 4,810 | 4,949 | 5,534 | 3,788 | 3,036 | |||||||||||||||||||||||||||
| PCI | — | — | — | 1,220 | 411 | |||||||||||||||||||||||||||
| Total average loans and leases HFI | $ | 310,444 | $ | 321,629 | $ | 301,071 | $ | 190,241 | $ | 148,664 | ||||||||||||||||||||||
Average loans and leases held for investment for the third quarter of 2020 were $310.4 billion, down $11.2 billion compared to the second quarter of 2020 primarily due to a decline in the commercial portfolio.
The decline in the commercial portfolio was primarily in commercial and industrial loans and reflects the repayment of revolver usage. Within the commercial and industrial portfolio, Truist experienced growth in loans from mortgage warehouse lending due to the decline in rates and increased refinance activity, as well as growth in premium finance lending and equipment finance lending. Growth in these portfolios was partially offset by a decline in dealer floor plan lending.
Average consumer loans decreased $1.3 billion primarily due to refinance activity resulting in a decline in residential mortgages and residential home equity and direct loans. This was partially offset by an increase in indirect other loans due to demand for loans for recreational and power sports equipment.
COVID-19 Lending Activities
The CARES Act includes provisions that were designed to encourage financial institutions to support borrowers impacted by COVID-19. These modifications are generally not considered a TDR as disclosed in “Note 1. Basis of Presentation.” Truist payment relief assistance includes forbearance, deferrals, extension and re-aging programs, along with certain other modification strategies. The following table provides a summary of accommodations as of September 30, 2020:
| Table 8: Client Accommodations (1) | |||||||||||||||||||||||||||||
| Active Accommodations | Exited Accommodations | ||||||||||||||||||||||||||||
|
September 30, 2020
(Dollars in millions) |
Total Count | Outstanding Balance | Outstanding Balance | % Paid-off or Current (2) | Types of Accommodations | ||||||||||||||||||||||||
|
Commercial
|
1,056 | $ | 692 | $ | 21,479 | 98.0 | % | Clients may elect to defer loan or lease payments for up to 90 days without late fees being incurred but with finance charges continuing to accrue. | |||||||||||||||||||||
|
Consumer
|
164,303 | 6,113 | 6,062 | 94.3 | Clients may elect to defer loan payments for time periods that range from 30 to 90 days without late fees being incurred but with finance charges generally continuing to accrue. | ||||||||||||||||||||||||
|
Credit card
|
9,998 | 53 | 165 | 95.5 | Clients may elect to defer payments for up to 90 days without late fees being incurred but with financing charges accruing. In addition, Truist provided credit card clients with 5% cash back on qualifying card purchases for certain important basic needs. | ||||||||||||||||||||||||
| Total | 175,357 | $ | 6,858 | $ | 27,706 | ||||||||||||||||||||||||
(1) Excludes approximately 64,000 of active accommodations related to government guaranteed loans totaling approximately $3 billion.
(2) Calculated based on accommodation count.
62 Truist Financial Corporation
The CARES Act also created the PPP, which temporarily expands the Small Business Administration’s business loan guarantee program. Truist served as the fourth largest PPP lender based on gross fundings and carrying value of PPP loans was $12.2 billion as of September 30, 2020.
The following table provides a summary of the Company’s exposure related to loans that have exited accommodations:
| Table 9: Accommodations Exposure | |||||
|
September 30, 2020
(Dollars in billions) |
Exposure | ||||
|
Current
|
$ | 27,273 | |||
|
Past due and still accruing
|
229 | ||||
|
Nonperforming
|
204 | ||||
|
Total
|
$ | 27,706 | |||
The following table provides a summary of exposure to industries that management believes are most vulnerable in the current economic environment. These selected industry exposures represent 9.1% of loans held for investment at September 30, 2020. Of the $27.9 billion in selected industry exposures, $1.5 billion are PPP loans. Truist is actively managing these portfolios and will continue to make underwriting or risk acceptance adjustments as appropriate. These exposures decreased $2.2 billion, or 7.3% during the third quarter, primarily in Hotels, Resorts and Cruise Lines, as well as the Oil and Gas Portfolio. In addition, management is closely monitoring its leveraged lending and small secured real estate portfolios which comprised 2.8% and 1.5% of loans held for investment at September 30, 2020, respectfully. Leveraged loans and small secured real estate loans, which totaled $1.5 billion and $0.2 billion, respectively, as of September 30, 2020, are also included in the selected industry credit exposures. Leveraged lending loans decreased 9.5% during the third quarter.
| Table 10: Selected Credit Exposures | |||||||||||
|
September 30, 2020
(Dollars in billions) |
Outstanding Balance | Percentage of Loans HFI | |||||||||
|
Hotels, Resorts & Cruise Lines
|
$ | 6.8 | 2.2 | % | |||||||
| Senior Care | 6.0 | 2.0 | |||||||||
| Oil & Gas Portfolio | 5.2 | 1.7 | |||||||||
| Acute Care Facilities | 4.7 | 1.5 | |||||||||
| Restaurants | 2.9 | 1.0 | |||||||||
| Sensitive Retail | 2.3 | 0.7 | |||||||||
| Total | $ | 27.9 | 9.1 | % | |||||||
| Additional exposures (inclusive of above industries): | |||||||||||
| Leveraged lending | $ | 8.6 | 2.8 | % | |||||||
| Small secured real estate | 4.6 | 1.5 | |||||||||
Truist Financial Corporation 63
Asset Quality
The following tables summarize asset quality information for each of the last five quarters:
| Table 11: Asset Quality | ||||||||||||||||||||||||||||||||
| (Dollars in millions) | Sep 30, 2020 | Jun 30, 2020 | Mar 31, 2020 | Dec 31, 2019 | Sep 30, 2019 | |||||||||||||||||||||||||||
| NPAs: | ||||||||||||||||||||||||||||||||
| NPLs: | ||||||||||||||||||||||||||||||||
| Commercial and industrial | $ | 507 | $ | 428 | $ | 443 | $ | 212 | $ | 172 | ||||||||||||||||||||||
| CRE | 52 | 42 | 18 | 10 | 27 | |||||||||||||||||||||||||||
| Commercial construction | 7 | 13 | 2 | — | 2 | |||||||||||||||||||||||||||
| Lease financing | 32 | 56 | 27 | 8 | 2 | |||||||||||||||||||||||||||
| Residential mortgage | 205 | 198 | 248 | 55 | 106 | |||||||||||||||||||||||||||
| Residential home equity and direct | 180 | 192 | 170 | 67 | 56 | |||||||||||||||||||||||||||
| Indirect auto | 137 | 155 | 125 | 100 | 81 | |||||||||||||||||||||||||||
| Indirect other | 4 | 3 | 1 | 2 | 1 | |||||||||||||||||||||||||||
| Total NPLs HFI | 1,124 | 1,087 | 1,034 | 454 | 447 | |||||||||||||||||||||||||||
| Loans held for sale | 130 | 102 | 41 | 107 | — | |||||||||||||||||||||||||||
| Total nonaccrual loans and leases | 1,254 | 1,189 | 1,075 | 561 | 447 | |||||||||||||||||||||||||||
| Foreclosed real estate | 30 | 43 | 63 | 82 | 33 | |||||||||||||||||||||||||||
| Other foreclosed property | 30 | 20 | 39 | 41 | 29 | |||||||||||||||||||||||||||
| Total nonperforming assets | $ | 1,314 | $ | 1,252 | $ | 1,177 | $ | 684 | $ | 509 | ||||||||||||||||||||||
| TDRs: | ||||||||||||||||||||||||||||||||
| Performing TDRs: | ||||||||||||||||||||||||||||||||
| Commercial and industrial | $ | 84 | $ | 57 | $ | 65 | $ | 47 | $ | 69 | ||||||||||||||||||||||
| CRE | 36 | 22 | 7 | 6 | 6 | |||||||||||||||||||||||||||
| Commercial construction | 1 | 36 | 36 | 37 | 1 | |||||||||||||||||||||||||||
| Lease financing | 1 | 1 | 1 | — | — | |||||||||||||||||||||||||||
| Residential mortgage | 640 | 533 | 513 | 470 | 570 | |||||||||||||||||||||||||||
| Residential home equity and direct | 71 | 71 | 66 | 51 | 54 | |||||||||||||||||||||||||||
| Indirect auto | 336 | 342 | 350 | 333 | 324 | |||||||||||||||||||||||||||
| Indirect other | 5 | 4 | 5 | 5 | 4 | |||||||||||||||||||||||||||
| Student | 5 | 4 | 1 | — | — | |||||||||||||||||||||||||||
| Credit card | 38 | 37 | 35 | 31 | 29 | |||||||||||||||||||||||||||
| Total performing TDRs | $ | 1,217 | $ | 1,107 | $ | 1,079 | $ | 980 | $ | 1,057 | ||||||||||||||||||||||
| Nonperforming TDRs | 140 | 111 | 121 | 82 | 115 | |||||||||||||||||||||||||||
| Total TDRs | $ | 1,357 | $ | 1,218 | $ | 1,200 | $ | 1,062 | $ | 1,172 | ||||||||||||||||||||||
| Loans 90 days or more past due and still accruing: (1) | ||||||||||||||||||||||||||||||||
| Commercial and industrial | $ | 6 | $ | 9 | $ | 5 | $ | 1 | $ | — | ||||||||||||||||||||||
| CRE | 8 | 3 | 1 | — | — | |||||||||||||||||||||||||||
| Lease financing | — | 1 | — | — | — | |||||||||||||||||||||||||||
| Residential mortgage | 573 | 521 | 610 | 543 | 347 | |||||||||||||||||||||||||||
| Residential home equity and direct | 5 | 9 | 10 | 9 | 8 | |||||||||||||||||||||||||||
| Indirect auto | 8 | 10 | 11 | 11 | 9 | |||||||||||||||||||||||||||
| Indirect other | 3 | 3 | 2 | 2 | — | |||||||||||||||||||||||||||
| Student | 570 | 478 | 1,068 | 188 | — | |||||||||||||||||||||||||||
| Credit card | 24 | 38 | 41 | 22 | 15 | |||||||||||||||||||||||||||
| PCI | — | — | — | 1,218 | 24 | |||||||||||||||||||||||||||
| Total loans 90 days or more past due and still accruing | $ | 1,197 | $ | 1,072 | $ | 1,748 | $ | 1,994 | $ | 403 | ||||||||||||||||||||||
| Loans 30-89 days past due and still accruing: (1) | ||||||||||||||||||||||||||||||||
| Commercial and industrial | $ | 155 | $ | 282 | $ | 262 | $ | 94 | $ | 34 | ||||||||||||||||||||||
| CRE | 7 | 6 | 8 | 5 | 1 | |||||||||||||||||||||||||||
| Commercial construction | — | 1 | 16 | 1 | — | |||||||||||||||||||||||||||
| Lease financing | 9 | 10 | 8 | 2 | 1 | |||||||||||||||||||||||||||
| Residential mortgage | 796 | 703 | 679 | 498 | 432 | |||||||||||||||||||||||||||
| Residential home equity and direct | 103 | 108 | 156 | 122 | 56 | |||||||||||||||||||||||||||
| Indirect auto | 321 | 265 | 521 | 560 | 380 | |||||||||||||||||||||||||||
| Indirect other | 52 | 50 | 74 | 85 | 43 | |||||||||||||||||||||||||||
| Student | 666 | 442 | 593 | 650 | — | |||||||||||||||||||||||||||
| Credit card | 39 | 34 | 57 | 56 | 29 | |||||||||||||||||||||||||||
| PCI | — | — | — | 140 | 16 | |||||||||||||||||||||||||||
| Total loans 30-89 days past due and still accruing | $ | 2,148 | $ | 1,901 | $ | 2,374 | $ | 2,213 | $ | 992 | ||||||||||||||||||||||
(1) The past due status of loans that received a deferral under the CARES Act is generally frozen during the deferral period.
64 Truist Financial Corporation
Overall asset quality ratios were relatively stable at September 30, 2020 compared to June 30, 2020.
Nonperforming assets totaled $1.3 billion at September 30, 2020, up $62 million compared to June 30, 2020. Nonperforming loans and leases held for investment represented 0.37% of loans and leases held for investment, up 2 basis points compared to June 30, 2020. The increase in nonperforming loans held for investment is primarily in commercial and industrial loans, which was partially offset by a decline in commercial leases due to a charge-off on a PCD loan related to the implementation of CECL. Within the consumer portfolio, indirect automobile nonaccrual loans declined as some states lifted the moratorium on repossessions. Performing TDRs were up $110 million during the third quarter primarily in residential mortgage loans.
Loans 90 days or more past due and still accruing totaled $1.2 billion at September 30, 2020, up $125 million compared to the prior quarter. The increase was primarily in government guaranteed student loans as forbearance programs in connection with the CARES Act have ended. In addition, residential mortgage loans 90 days or more past due increased primarily due to the repurchase of delinquent government guaranteed loans. The ratio of loans 90 days or more past due and still accruing as a percentage of loans and leases was 0.39% at September 30, 2020, up five basis points from the prior quarter. Excluding government guaranteed loans, the ratio of loans 90 days or more past due and still accruing as a percentage of loans and leases was 0.03% at September 30, 2020, down one basis point from June 30, 2020.
Loans 30-89 days past due and still accruing totaled $2.1 billion at September 30, 2020, up $247 million compared to the prior quarter. Student loans 30-89 days past due increased $224 million, which almost entirely relates to government guaranteed loans as forbearance programs in connection with the CARES Act have ended. In addition, residential mortgage loans and indirect automobile loans increased, while commercial and industrial loans declined. The ratio of loans 30-89 days past due and still accruing as a percentage of loans and leases was 0.70% at September 30, 2020, up 10 basis points from the prior quarter.
Problem loans include NPLs and loans that are 90 days or more past due and still accruing as disclosed in Table 11. In addition, for the commercial portfolio segment, loans that are rated special mention or substandard performing are closely monitored by management as potential problem loans. Refer to "Note 5. Loans and ACL" for additional disclosures related to these potential problem loans.
| Table 12: Asset Quality Ratios | |||||||||||||||||||||||||||||
| As of / For the Three Months Ended | Sep 30, 2020 | Jun 30, 2020 | Mar 31, 2020 | Dec 31, 2019 | Sep 30, 2019 | ||||||||||||||||||||||||
|
Loans 30-89 days past due and still accruing as a percentage of loans and leases HFI
|
0.70 | % | 0.60 | % | 0.74 | % | 0.74 | % | 0.66 | % | |||||||||||||||||||
|
Loans 90 days or more past due and still accruing as a percentage of loans and leases HFI
|
0.39 | 0.34 | 0.55 | 0.66 | 0.27 | ||||||||||||||||||||||||
|
NPLs as a percentage of loans and leases HFI
|
0.37 | 0.35 | 0.32 | 0.15 | 0.30 | ||||||||||||||||||||||||
|
Nonperforming loans and leases as a percentage of loans and leases (1)
|
0.40 | 0.37 | 0.33 | 0.18 | 0.30 | ||||||||||||||||||||||||
|
NPAs as a percentage of:
|
|||||||||||||||||||||||||||||
|
Total assets (1)
|
0.26 | 0.25 | 0.23 | 0.14 | 0.22 | ||||||||||||||||||||||||
|
Loans and leases HFI plus foreclosed property
|
0.39 | 0.37 | 0.36 | 0.19 | 0.34 | ||||||||||||||||||||||||
|
Net charge-offs as a percentage of average loans and leases HFI
|
0.42 | 0.39 | 0.36 | 0.40 | 0.41 | ||||||||||||||||||||||||
|
ALLL as a percentage of loans and leases HFI
|
1.91 | 1.81 | 1.63 | 0.52 | 1.05 | ||||||||||||||||||||||||
|
Ratio of ALLL to:
|
|||||||||||||||||||||||||||||
| Net charge-offs | 4.52x | 4.49x | 4.76x | 2.03x | 2.59x | ||||||||||||||||||||||||
| NPLs | 5.22x | 5.24x | 5.04x | 3.41x | 3.52x | ||||||||||||||||||||||||
|
Loans 90 days or more past due and still accruing as a percentage of loans and leases HFI excluding PPP, other government guaranteed and PCI loans(2)
|
0.03 | % | 0.04 | % | 0.04 | % | 0.03 | % | 0.04 | % | |||||||||||||||||||
Applicable ratios are annualized.
(1) Includes LHFS.
(2) This asset quality ratio has been adjusted to remove the impact of government guaranteed mortgage and student loans and PCI, as applicable. Management believes the inclusion of such assets in this asset quality ratio results in distortion of this ratio such that it might not be reflective of asset collectability or might not be comparable to other periods presented or to other portfolios that do not have government guarantees or were not impacted by PCI accounting requirements.
Truist Financial Corporation 65
The following table presents activity related to NPAs:
| Table 13: Rollforward of NPAs | ||||||||||||||
| (Dollars in millions) | 2020 | 2019 | ||||||||||||
| Balance, January 1 | $ | 684 | $ | 585 | ||||||||||
| New NPAs (1) | 2,467 | 904 | ||||||||||||
| Advances and principal increases | 255 | 127 | ||||||||||||
| Disposals of foreclosed assets (2) | (333) | (354) | ||||||||||||
| Disposals of NPLs (3) | (521) | (120) | ||||||||||||
| Charge-offs and losses | (443) | (215) | ||||||||||||
| Payments | (553) | (312) | ||||||||||||
| Transfers to performing status | (258) | (106) | ||||||||||||
| Other, net | 16 | — | ||||||||||||
| Ending balance, September 30 | $ | 1,314 | $ | 509 | ||||||||||
(1) For 2020, includes approximately $500 million of loans previously classified as PCI that would have otherwise been nonperforming as of December 31, 2019.
(2) Includes charge-offs and losses recorded upon sale of $99 million and $165 million for the nine months ended September 30, 2020 and 2019, respectively.
(3) Includes charge-offs and losses recorded upon sale of $126 million and $20 million for the nine months ended September 30, 2020 and 2019, respectively.
TDRs occur when a borrower is experiencing, or is expected to experience, financial difficulties in the near term and a concession has been granted to the borrower. As a result, Truist works with borrowers to prevent further difficulties and to improve the likelihood of recovery on the loan. To facilitate this process, a concessionary modification that would not otherwise be considered may be granted, resulting in classification of the loan as a TDR. In accordance with the CARES Act, Truist implemented loan modification programs in response to the COVID-19 pandemic in order to provide borrowers with flexibility with respect to repayment terms. These loan modifications are generally not considered TDRs at the time of modification to the extent that the borrower was impacted by the COVID-19 pandemic and was less than 30 days past due at December 31, 2019, or in certain circumstances, at the time that the COVID-19 loan modification program was implemented, unless the loan was previously classified as a TDR.
TDRs identified by SunTrust prior to the Merger date are not included in Truist's TDR disclosure because all such loans were recorded at fair value and a new accounting basis was established as of the Merger date. Subsequent modifications will be evaluated for potential treatment as TDRs in accordance with Truist's accounting policies.
The following table provides a summary of performing TDR activity:
| Table 14: Rollforward of Performing TDRs | ||||||||||||||
| (Dollars in millions) | 2020 | 2019 | ||||||||||||
| Balance, January 1 | $ | 980 | $ | 1,119 | ||||||||||
| Inflows | 646 | 404 | ||||||||||||
| Payments and payoffs | (167) | (144) | ||||||||||||
| Charge-offs | (34) | (48) | ||||||||||||
| Transfers to nonperforming TDRs | (65) | (57) | ||||||||||||
| Removal due to the passage of time | (6) | (17) | ||||||||||||
| Non-concessionary re-modifications | (2) | (8) | ||||||||||||
| Transferred to LHFS and/or sold | (135) | (192) | ||||||||||||
| Balance, September 30 | $ | 1,217 | $ | 1,057 | ||||||||||
66 Truist Financial Corporation
The following table provides further details regarding the payment status of TDRs outstanding at September 30, 2020:
| Table 15: Payment Status of TDRs (1) | ||||||||||||||||||||||||||||||||||||||||||||
|
September 30, 2020
(Dollars in millions) |
Current | Past Due 30-89 Days | Past Due 90 Days Or More | Total | ||||||||||||||||||||||||||||||||||||||||
| Performing TDRs: | ||||||||||||||||||||||||||||||||||||||||||||
| Commercial: | ||||||||||||||||||||||||||||||||||||||||||||
| Commercial and industrial | $ | 84 | 100.0 | % | $ | — | — | % | $ | — | — | % | $ | 84 | ||||||||||||||||||||||||||||||
| CRE | 36 | 100.0 | — | — | — | — | 36 | |||||||||||||||||||||||||||||||||||||
| Commercial construction | 1 | 100.0 | — | — | — | — | 1 | |||||||||||||||||||||||||||||||||||||
| Lease financing | 1 | 100.0 | — | — | — | — | 1 | |||||||||||||||||||||||||||||||||||||
| Consumer: | ||||||||||||||||||||||||||||||||||||||||||||
| Residential mortgage | 376 | 58.8 | 114 | 17.8 | 150 | 23.4 | 640 | |||||||||||||||||||||||||||||||||||||
| Residential home equity and direct | 68 | 95.8 | 3 | 4.2 | — | — | 71 | |||||||||||||||||||||||||||||||||||||
| Indirect auto | 306 | 91.1 | 30 | 8.9 | — | — | 336 | |||||||||||||||||||||||||||||||||||||
| Indirect other | 5 | 100.0 | — | — | — | — | 5 | |||||||||||||||||||||||||||||||||||||
| Student | 5 | 100.0 | — | — | — | — | 5 | |||||||||||||||||||||||||||||||||||||
| Credit card | 34 | 89.5 | 3 | 7.9 | 1 | 2.6 | 38 | |||||||||||||||||||||||||||||||||||||
| Total performing TDRs | 916 | 75.3 | 150 | 12.3 | 151 | 12.4 | 1,217 | |||||||||||||||||||||||||||||||||||||
| Nonperforming TDRs | 72 | 51.5 | 23 | 16.4 | 45 | 32.1 | 140 | |||||||||||||||||||||||||||||||||||||
| Total TDRs | $ | 988 | 72.9 | $ | 173 | 12.7 | $ | 196 | 14.4 | $ | 1,357 | |||||||||||||||||||||||||||||||||
(1)
Past due performing TDRs are included in past due disclosures and nonperforming TDRs are included in NPL disclosures.
Truist Financial Corporation 67
ACL
Activity related to the ACL is presented in the following tables:
| Table 16: Activity in ACL | |||||||||||||||||||||||||||||||||||||||||
| For the Three Months Ended | For the Nine Months Ended | ||||||||||||||||||||||||||||||||||||||||
|
Quarters ended
(Dollars in millions) |
Sep 30, 2020 | Jun 30, 2020 | Mar 31, 2020 | Dec 31, 2019 | Sep 30, 2019 | 2020 | 2019 | ||||||||||||||||||||||||||||||||||
| Balance, beginning of period | $ | 6,133 | $ | 5,611 | $ | 1,889 | $ | 1,653 | $ | 1,689 | $ | 1,889 | $ | 1,651 | |||||||||||||||||||||||||||
| CECL adoption - impact to retained earnings before tax | — | — | 2,762 | — | — | 2,762 | — | ||||||||||||||||||||||||||||||||||
| CECL adoption - reserves on PCD assets | — | — | 378 | — | — | 378 | — | ||||||||||||||||||||||||||||||||||
| Provision for credit losses | 421 | 844 | 893 | 171 | 117 | 2,158 | 444 | ||||||||||||||||||||||||||||||||||
| Charge-offs: | |||||||||||||||||||||||||||||||||||||||||
| Commercial and industrial | (112) | (123) | (39) | (23) | (28) | (274) | (67) | ||||||||||||||||||||||||||||||||||
| CRE | (44) | (14) | (1) | (5) | (2) | (59) | (28) | ||||||||||||||||||||||||||||||||||
| Commercial construction | (19) | — | (3) | — | — | (22) | — | ||||||||||||||||||||||||||||||||||
| Lease financing | (44) | (4) | (2) | (9) | (1) | (50) | (2) | ||||||||||||||||||||||||||||||||||
| Residential mortgage | (4) | (35) | (11) | (8) | (3) | (50) | (13) | ||||||||||||||||||||||||||||||||||
| Residential home equity and direct | (52) | (65) | (68) | (25) | (24) | (185) | (68) | ||||||||||||||||||||||||||||||||||
| Indirect auto | (72) | (80) | (142) | (107) | (92) | (294) | (263) | ||||||||||||||||||||||||||||||||||
| Indirect other | (8) | (20) | (18) | (19) | (14) | (46) | (43) | ||||||||||||||||||||||||||||||||||
| Student | (6) | (6) | (8) | — | — | (20) | — | ||||||||||||||||||||||||||||||||||
| Credit card | (44) | (50) | (53) | (37) | (25) | (147) | (72) | ||||||||||||||||||||||||||||||||||
| Total charge-offs | (405) | (397) | (345) | (233) | (189) | (1,147) | (556) | ||||||||||||||||||||||||||||||||||
| Recoveries: | |||||||||||||||||||||||||||||||||||||||||
| Commercial and industrial | 20 | 21 | 17 | 6 | 5 | 58 | 19 | ||||||||||||||||||||||||||||||||||
| CRE | — | 4 | — | — | 3 | 4 | 5 | ||||||||||||||||||||||||||||||||||
| Commercial construction | 2 | 7 | 1 | 1 | — | 10 | 2 | ||||||||||||||||||||||||||||||||||
| Lease financing | 4 | — | — | — | 1 | 4 | 1 | ||||||||||||||||||||||||||||||||||
| Residential mortgage | 3 | 2 | 2 | 1 | — | 7 | 1 | ||||||||||||||||||||||||||||||||||
| Residential home equity and direct | 16 | 15 | 15 | 10 | 6 | 46 | 20 | ||||||||||||||||||||||||||||||||||
| Indirect auto | 22 | 18 | 23 | 13 | 12 | 63 | 39 | ||||||||||||||||||||||||||||||||||
| Indirect other | 4 | 7 | 7 | 5 | 3 | 18 | 12 | ||||||||||||||||||||||||||||||||||
| Student | — | 1 | — | — | — | 1 | — | ||||||||||||||||||||||||||||||||||
| Credit card | 8 | 6 | 8 | 5 | 6 | 22 | 15 | ||||||||||||||||||||||||||||||||||
| Total recoveries | 79 | 81 | 73 | 41 | 36 | 233 | 114 | ||||||||||||||||||||||||||||||||||
| Net charge-offs | (326) | (316) | (272) | (192) | (153) | (914) | (442) | ||||||||||||||||||||||||||||||||||
| Other | 1 | (6) | (39) | 257 | — | (44) | — | ||||||||||||||||||||||||||||||||||
| Balance, end of period | $ | 6,229 | $ | 6,133 | $ | 5,611 | $ | 1,889 | $ | 1,653 | $ | 6,229 | $ | 1,653 | |||||||||||||||||||||||||||
| ALLL (excluding PCD / PCI loans) | $ | 5,675 | $ | 5,408 | $ | 4,880 | $ | 1,541 | $ | 1,565 | |||||||||||||||||||||||||||||||
| ALLL for PCD / PCI loans | 188 | 294 | 331 | 8 | 8 | ||||||||||||||||||||||||||||||||||||
| RUFC | 366 | 431 | 400 | 340 | 80 | ||||||||||||||||||||||||||||||||||||
| Total ACL | $ | 6,229 | $ | 6,133 | $ | 5,611 | $ | 1,889 | $ | 1,653 | |||||||||||||||||||||||||||||||
The ACL totaled $6.2 billion at September 30, 2020, compared to $1.9 billion at December 31, 2019. The increase in the allowance for credit losses was primarily due to the adoption of CECL. Upon adoption, the Company recorded a $3.1 billion increase in the allowance for credit losses, including $2.8 billion that was charged to retained earnings before tax, and $378 million related to the gross up for PCD loans. The remaining increase in the allowance for credit losses primarily reflects deteriorated economic conditions. As of September 30, 2020, the allowance for loan and lease losses was 1.91% of loans and leases held for investment. The allowance for credit losses includes $5.9 billion for loans and leases and $366 million for the reserve for unfunded commitments.
At September 30, 2020, the allowance for loan and lease losses was 5.22 times nonperforming loans and leases held for investment, compared to 5.24 times at June 30, 2020. At September 30, 2020, the allowance for loan and lease losses was 4.52 times annualized net charge-offs, compared to 4.49 times at June 30, 2020.
68 Truist Financial Corporation
Net charge-offs during the third quarter totaled $326 million, up $10 million compared to the prior quarter. As a percentage of average loans and leases, annualized net charge-offs were 0.42%, up three basis points compared to the prior quarter. Current quarter net charge-offs includes $97 million of charge-offs related to the implementation of CECL, which required a gross-up of loan carrying values in connection with the establishment of an allowance on PCD loans. Management performed a comprehensive review of PCD assets during the third quarter and concluded in certain situations that a charge-off was required. Excluding these additional charge-offs, net charge-offs would have been an annualized 0.29% of average loans and leases for the third quarter of 2020, down 10 basis points compared to the prior quarter.
The following table presents an allocation of the ALLL. The entire amount of the allowance is available to absorb losses occurring in any category of loans and leases.
| Table 17: Allocation of ALLL by Category | ||||||||||||||||||||||||||||||||||||||
| September 30, 2020 | December 31, 2019 | |||||||||||||||||||||||||||||||||||||
| (Dollars in millions) | Amount | % ALLL in Each Category | % Loans in Each Category | Amount | % ALLL in Each Category | % Loans in Each Category | ||||||||||||||||||||||||||||||||
| Commercial and industrial | $ | 2,185 | 37.2 | % | 45.9 | % | $ | 560 | 36.1 | % | 43.4 | % | ||||||||||||||||||||||||||
| CRE | 502 | 8.6 | 9.0 | 150 | 9.7 | 8.9 | ||||||||||||||||||||||||||||||||
| Commercial construction | 134 | 2.3 | 2.2 | 52 | 3.4 | 2.1 | ||||||||||||||||||||||||||||||||
| Lease financing | 53 | 0.9 | 1.8 | 10 | 0.6 | 2.0 | ||||||||||||||||||||||||||||||||
| Residential mortgage | 424 | 7.2 | 16.4 | 176 | 11.4 | 17.4 | ||||||||||||||||||||||||||||||||
| Residential home equity and direct | 704 | 12.0 | 8.7 | 107 | 6.9 | 9.0 | ||||||||||||||||||||||||||||||||
| Indirect auto | 1,189 | 20.3 | 8.2 | 304 | 19.6 | 8.2 | ||||||||||||||||||||||||||||||||
| Indirect other | 222 | 3.8 | 3.8 | 60 | 3.9 | 3.7 | ||||||||||||||||||||||||||||||||
| Student | 130 | 2.2 | 2.4 | — | — | 2.2 | ||||||||||||||||||||||||||||||||
| Credit card | 320 | 5.5 | 1.6 | 122 | 7.9 | 1.9 | ||||||||||||||||||||||||||||||||
| PCI | — | — | — | 8 | 0.5 | 1.2 | ||||||||||||||||||||||||||||||||
| Total ALLL | 5,863 | 100.0 | % | 100.0 | % | 1,549 | 100.0 | % | 100.0 | % | ||||||||||||||||||||||||||||
| RUFC | 366 | 340 | ||||||||||||||||||||||||||||||||||||
| Total ACL | $ | 6,229 | $ | 1,889 | ||||||||||||||||||||||||||||||||||
Truist monitors the performance of its home equity loans and lines secured by second liens similarly to other consumer loans and utilizes assumptions specific to these loans in determining the necessary ALLL. Truist also receives notification when the first lien holder, whether Truist or another financial institution, has initiated foreclosure proceedings against the borrower. When notified that the first lien is in the process of foreclosure, Truist obtains valuations to determine if any additional charge-offs or reserves are warranted. These valuations are updated at least annually thereafter.
Truist has limited ability to monitor the delinquency status of the first lien, unless the first lien is held or serviced by Truist. As a result, using migration assumptions that are based on historical experience and adjusted for current trends, Truist estimates the volume of second lien positions where the first lien is delinquent and adjusts the ALLL to reflect the increased risk of loss on these credits. Finally, Truist also provides additional reserves for second lien positions when the estimated combined current loan to value ratio for the credit exceeds 100%. As of September 30, 2020, Truist held or serviced the first lien on 30.8% of its second lien positions.
Truist Financial Corporation 69
Other Assets
The components of other assets are presented in the following table:
| Table 18: Other Assets as of Period End | |||||||||||
| (Dollars in millions) | September 30, 2020 | December 31, 2019 | |||||||||
| Bank-owned life insurance | $ | 6,461 | $ | 6,383 | |||||||
| Tax credit and other private equity investments | 5,615 | 5,448 | |||||||||
| Prepaid pension assets | 3,996 | 3,579 | |||||||||
| Accounts receivable | 1,832 | 2,418 | |||||||||
| Derivative assets | 4,049 | 2,053 | |||||||||
| Leased assets and related assets | 1,808 | 1,897 | |||||||||
| ROU assets | 1,547 | 1,823 | |||||||||
| Accrued income | 1,938 | 1,807 | |||||||||
| Prepaid expenses | 1,194 | 1,254 | |||||||||
| Structured real estate | 836 | 987 | |||||||||
| Equity securities at fair value | 865 | 817 | |||||||||
| FHLB stock | 165 | 764 | |||||||||
| Other | 713 | 2,602 | |||||||||
| Total other assets | $ | 31,019 | $ | 31,832 | |||||||
Funding Activities
Deposits
The following table presents deposits for each of the last five quarters:
| Table 19: Deposits as of Period End | ||||||||||||||||||||||||||||||||
| (Dollars in millions) | Sep 30, 2020 | Jun 30, 2020 | Mar 31, 2020 | Dec 31, 2019 | Sep 30, 2019 | |||||||||||||||||||||||||||
| Noninterest-bearing deposits | $ | 124,297 | $ | 122,694 | $ | 97,618 | $ | 92,405 | $ | 52,667 | ||||||||||||||||||||||
| Interest checking | 98,694 | 99,005 | 92,950 | 85,492 | 27,723 | |||||||||||||||||||||||||||
| Money market and savings | 121,856 | 123,974 | 124,072 | 120,934 | 64,454 | |||||||||||||||||||||||||||
| Time deposits | 25,900 | 30,562 | 35,539 | 35,896 | 16,526 | |||||||||||||||||||||||||||
| Foreign office deposits - interest-bearing | — | — | — | — | 910 | |||||||||||||||||||||||||||
| Total deposits | $ | 370,747 | $ | 376,235 | $ | 350,179 | $ | 334,727 | $ | 162,280 | ||||||||||||||||||||||
Deposits totaled $370.7 billion at September 30, 2020, an increase of $36.0 billion from December 31, 2019. The growth in deposits reflects solid growth in all non-time deposit products due to a flight to quality and the government stimulus programs. Time deposits decreased primarily due to maturities of wholesale negotiable certificates of deposit and higher-cost personal and business accounts.
The following table presents average deposits for each of the last five quarters:
| Table 20: Average Deposits | ||||||||||||||||||||||||||||||||
|
Three Months Ended
(Dollars in millions)
|
Sep 30, 2020 | Jun 30, 2020 | Mar 31, 2020 | Dec 31, 2019 | Sep 30, 2019 | |||||||||||||||||||||||||||
| Noninterest-bearing deposits | $ | 123,966 | $ | 113,875 | $ | 93,135 | $ | 64,485 | $ | 52,500 | ||||||||||||||||||||||
| Interest checking | 96,707 | 97,863 | 85,008 | 43,246 | 27,664 | |||||||||||||||||||||||||||
| Money market and savings | 123,598 | 126,071 | 120,936 | 79,903 | 64,920 | |||||||||||||||||||||||||||
| Time deposits | 27,940 | 33,009 | 35,570 | 23,058 | 16,643 | |||||||||||||||||||||||||||
| Foreign office deposits - interest-bearing | — | — | — | 24 | 265 | |||||||||||||||||||||||||||
| Total average deposits | $ | 372,211 | $ | 370,818 | $ | 334,649 | $ | 210,716 | $ | 161,992 | ||||||||||||||||||||||
Average deposits for the third quarter of 2020 were $372.2 billion, an increase of $1.4 billion compared to the prior quarter. Average noninterest-bearing deposit growth was strong for the third quarter of 2020 due to a continuation of the flight to quality and the government stimulus programs. Average time deposits decreased primarily due to maturities of wholesale negotiable certificates of deposit and higher-cost personal and business accounts.
70 Truist Financial Corporation
Average noninterest-bearing deposits represented 33.3% of total deposits for the third quarter of 2020, compared to 30.7% for the prior quarter. The cost of average total deposits was 0.10% for the third quarter, down 12 basis points compared to the prior quarter. The cost of average interest-bearing deposits was 0.15% for the third quarter, down 17 basis points compared to the prior quarter.
In September 2020, the FDIC published data from the Annual Summary of Deposits as of June 30, 2020. Truist is the 6th largest commercial bank in the United States based on deposits and maintained a first or second market position in thirteen of the company's Top 20 MSAs.
Borrowings
At September 30, 2020, short-term borrowings totaled $6.2 billion, a decrease of $12.0 billion compared to December 31, 2019, due primarily to a decrease of $10.8 billion in short-term FHLB advances. These borrowing sources were replaced with strong deposit growth.
Average short-term borrowings were $6.2 billion, or 1.5% of total funding for the third quarter 2020, as compared to $8.3 billion, or 4.3% for the prior year quarter as these funding sources were largely replaced by the strong deposit growth.
Long-term debt provides funding and, to a lesser extent, regulatory capital, and primarily consists of senior and subordinated notes issued by Truist and Truist Bank. Long-term debt totaled $41.0 billion at September 30, 2020, a decrease of $331 million compared to December 31, 2019. During 2020, the Company issued $4.8 billion of senior notes with interest rates from 1.125% to 1.95% maturing in 2023 to 2030, $500 million in floating rate senior notes maturing in 2023 and $1.3 billion of subordinated notes with an interest rate of 2.25% maturing in 2030. These issuances were partially offset by the redemption of $3.7 billion of senior notes during 2020 and a decrease of $3.3 billion in long-term FHLB advances. The average cost of long-term debt was 1.78% for the nine months ended September 30, 2020, down 157 basis points compared to the same period in 2019. FHLB advances represented 2.1% of total outstanding long-term debt at September 30, 2020, compared to 10.0% at December 31, 2019. Truist entered into $20 billion of FHLB advances during the first quarter of 2020 to build liquidity and ensure the Company was able to meet the funding needs of its clients. As market conditions stabilized and deposits increased, these advances were redeemed during the second quarter of 2020 and the Company recognized a loss of $235 million on the early extinguishment of debt. The redemption of these advances will improve net interest income, the net interest margin and the leverage ratios.
In October 2020, Truist redeemed $300 million of floating rate senior bank notes due October 2021 and $600 million fixed-to-floating rate senior bank notes due October 2021.
Shareholders' Equity
Total shareholders' equity was $70.0 billion at September 30, 2020, an increase of $3.4 billion from December 31, 2019. This increase includes the issuance of $3.5 billion of preferred stock during the year, $3.2 billion in net income available to common shareholders and an increase of $1.3 billion in AOCI, which was partially offset by $2.1 billion related to the adoption of CECL and $2.0 billion for common and preferred dividends. In addition, Truist redeemed $500 million of its Series K preferred stock during 2020. Truist's book value per common share at September 30, 2020 was $45.86, compared to $45.66 at December 31, 2019.
Refer to "Note 10. Shareholders' Equity" for additional disclosures related to preferred stock issuances.
Risk Management
Truist maintains a comprehensive risk management framework supported by people, processes and systems to identify, measure, monitor, manage and report significant risks arising from its exposures and business activities. Effective risk management involves appropriately managing risk to optimize risk and return, and operate in a safe and sound manner while ensuring compliance with applicable laws and regulations. The Company’s risk management framework is designed to ensure that business strategies and objectives are executed in alignment with its risk appetite.
Truist is committed to fostering a culture that supports transparency and escalation of risks across the organization. All teammates are responsible for upholding the Company’s purpose, mission, and values, and are encouraged to speak up if there is any activity or behavior that is inconsistent with the Company’s culture. The Truist code of ethics guides the Company’s decision making and informs teammates on how to act in the absence of specific guidance.
Truist seeks an appropriate return for the risk taken in its business operations. Risk-taking activities are evaluated and prioritized to identify those that present attractive risk-adjusted returns, while preserving asset value and capital.
Compensation decisions take into account a teammate's adherence to, and successful implementation of, Truist's risk values and associated policies and procedures. The Company's compensation structure supports its core values and sound risk management practices in an effort to promote judicious risk-taking behavior.
Truist Financial Corporation 71
Truist employs a comprehensive change management program to manage the risks associated with integrating heritage BB&T and heritage SunTrust. The Board and Executive Leadership oversee the change management program, which is designed to ensure key decisions are reviewed and that there is appropriate oversight of integration activities.
Refer to Truist's Annual Report on Form 10-K for the year ended December 31, 2019 for additional disclosures under the section titled "Risk Management."
Market risk management
Market risk is the risk to current or anticipated earnings, capital or economic value arising from changes in the market value of portfolios, securities, or other financial instruments. Market risk results from changes in the level, volatility or correlations among financial market risk factors or prices, including interest rates, credit spreads, foreign exchange rates, equity, and commodity prices.
Effective management of market risk is essential to achieving Truist's strategic financial objectives. Truist's most significant market risk exposure is to interest rate risk in its balance sheet; however, market risk also results from underlying product liquidity risk, price risk and volatility risk in Truist's BUs. Interest rate risk results from differences between the timing of rate changes and the timing of cash flows associated with assets and liabilities (re-pricing risk); from changing rate relationships among different yield curves affecting bank activities (basis risk); from changing rate relationships across the spectrum of maturities (yield curve risk); and from interest-related options inherently embedded in bank products (options risk).
The primary objectives of effective market risk management are to minimize adverse effects from changes in market risk factors on net interest income, net income and capital and to offset the risk of price changes for certain assets and liabilities recorded at fair value. At Truist, market risk management also includes the enterprise-wide IPV function.
Interest rate market risk (other than trading)
As a financial institution, Truist is exposed to interest rate risk both on its assets and on its liabilities. Since interest rate changes are out of the control of any private sector institution, Truist actively manages its interest rate risk exposure through the strategic repricing of its assets and liabilities, taking into account the volumes, maturities and mix, with the goal of keeping net interest margin as stable as possible. Truist primarily uses three methods to measure and monitor its interest rate risk: (i) simulations of possible changes to net interest income over the next two years based on gradual changes in interest rates; (ii) analysis of interest rate shock scenarios; and (iii) analysis of economic value of equity based on changes in interest rates.
The Company’s simulation model takes into account assumptions related to prepayment trends, using a combination of market data and internal historical experiences for deposits and loans, as well as scheduled maturities and payments and the expected outlook for the economy and interest rates. These assumptions are reviewed and adjusted monthly to reflect changes in current interest rates compared to the rates applicable to Truist’s assets and liabilities. The model also considers Truist's current and prospective liquidity position, current balance sheet volumes and projected growth and/or contractions, accessibility of funds for short-term needs and capital maintenance.
Deposit betas are an important assumption in the interest rate risk modeling process. Truist applies an average deposit beta (the sensitivity of deposit rate changes relative to market rate changes) of approximately 50% to its non-maturity interest-bearing deposit accounts for determining its interest rate sensitivity. Non-maturity, interest-bearing deposit accounts include interest checking accounts, savings accounts and money market accounts that do not have a contractual maturity. Truist also regularly conducts sensitivity analyses on other key variables, including noninterest-bearing deposits, to determine the impact these variables could have on the Company’s interest rate risk position. The predictive value of the simulation model depends upon the accuracy of the assumptions, but management believes that it provides helpful information for the management of interest rate risk.
72 Truist Financial Corporation
The following table shows the effect that the indicated changes in interest rates would have on net interest income as projected for the next 12 months assuming a gradual change in interest rates as described below.
| Table 21: Interest Sensitivity Simulation Analysis | ||||||||||||||||||||||||||
| Interest Rate Scenario | Annualized Hypothetical Percentage Change in Net Interest Income | |||||||||||||||||||||||||
| Linear Change in Prime Rate (bps) | Prime Rate | |||||||||||||||||||||||||
| Sep 30, 2020 | Sep 30, 2019 | Sep 30, 2020 | Sep 30, 2019 | |||||||||||||||||||||||
| Up 100 | 4.25 | % | 6.00 | % | 3.43 | % | (0.56) | % | ||||||||||||||||||
| Up 50 | 3.75 | 5.50 | 2.68 | (0.14) | ||||||||||||||||||||||
| No Change | 3.25 | 5.00 | — | — | ||||||||||||||||||||||
| Down 25 (1) | 3.00 | 4.75 | (1.62) | (0.22) | ||||||||||||||||||||||
| Down 50 (1) | 2.75 | 4.50 | (1.94) | (0.55) | ||||||||||||||||||||||
(1) The Down 25 and 50 rates are floored at one basis point and may not reflect Down 25 and 50 basis points for all rate indices.
Rate sensitivity increased compared to the prior periods, primarily driven by loan and deposit mix changes related to the Merger and recent activity, increased fixed rate funding, and increased noninterest-bearing deposits.
Management considers how the interest rate risk position could be impacted by changes in balance sheet mix. Liquidity in the banking industry has been very strong during the current economic cycle. Much of this liquidity increase has resulted in growth in noninterest-bearing demand deposits. Consistent with the industry, Truist has seen a significant increase in this funding source. The behavior of these deposits is one of the most important assumptions used in determining the interest rate risk position of Truist. A loss of these deposits in the future would reduce the asset sensitivity of Truist’s balance sheet as the Company would increase interest-bearing funds to offset the loss of this advantageous funding source.
The following table shows the results of Truist's interest-rate sensitivity position assuming the loss of demand deposits and an associated increase in managed rate deposits under various scenarios. For purposes of this analysis, Truist modeled the incremental beta of managed rate deposits for the replacement of the demand deposits at 100%.
| Table 22: Deposit Mix Sensitivity Analysis | ||||||||||||||
| Linear Change in Rates (bps) | Base Scenario at September,30,2020 (1) | Results Assuming a $10 Billion Decrease in Noninterest-Bearing Demand Deposits | ||||||||||||
| Up 100 | 3.43 | % | 3.02 | % | ||||||||||
| Up 50 | 2.68 | 2.38 | ||||||||||||
(1) The base scenario is equal to the annualized hypothetical percentage change in net interest income at September 30, 2020 as presented in the preceding table.
If rates increased 100 basis points, Truist could absorb the loss of $82.8 billion, or 66.6%, of noninterest-bearing deposit balances and replace them with managed rate deposits with a beta of 100% before becoming neutral to interest rate changes.
Truist also uses an EVE analysis to focus on longer-term projected changes in asset and liability values given potential changes in interest rates. This measure allows Truist to analyze interest rate risk that falls outside the net interest income simulation period. The EVE model is a discounted cash flow of the portfolio of assets, liabilities and derivative instruments. The difference in the present value of assets minus the present value of liabilities is defined as EVE.
The following table shows the effect that the indicated changes in interest rates would have on EVE:
| Table 23: EVE Simulation Analysis | ||||||||||||||
| Change in Interest Rates (bps) | Hypothetical Percentage Change in EVE | |||||||||||||
| Sep 30, 2020 | Sep 30, 2019 | |||||||||||||
| Up 100 | 7.4 | % | 3.2 | % | ||||||||||
| No Change | — | — | ||||||||||||
| Down 100 | (6.8) | (13.2) | ||||||||||||
Truist uses financial instruments including derivatives to manage interest rate risk related to securities, commercial loans, MSRs and mortgage banking operations, long-term debt and other funding sources. During October 2020, Truist initiated a new investment securities fair value hedging program, whereby pay fixed interest rate swaps are utilized. Truist also uses derivatives to facilitate transactions on behalf of its clients and as part of associated hedging activities. As of September 30, 2020, Truist had derivative financial instruments outstanding with notional amounts totaling $303.6 billion, with an associated net fair value of $3.6 billion. See "Note 16. Derivative Financial Instruments" for additional disclosures.
Truist Financial Corporation 73
LIBOR in its current form may no longer be available after 2021. Truist has LIBOR-based contracts that extend beyond 2021. To prepare for the possible transition to an alternative reference rate, management has formed a cross-functional project team to address the LIBOR transition. The project team has performed an assessment to identify the potential risks related to the transition from LIBOR to a new index. The project team provides updates to management and the Board.
The project team is reviewing contract fallback language for loans and leases and noted that certain contracts will need updated provisions for the transition, and the team is coordinating with impacted lines of business to update LIBOR fallback language generally consistent with the ARRC recommendation. Truist is continuing to evaluate the impact on these contracts and other financial instruments, systems implications, hedging strategies, and other related operational and market risks. Market risks associated with this change are dependent on the alternative reference rates available and market conditions at transition. For a further discussion of the various risks associated with the potential cessation of LIBOR and the transition to alternative reference rates, refer to the section titled "Item 1A. Risk Factors" in the Form 10-K for the year ended December 31, 2019. In October 2020, Truist began offering SOFR-based lending solutions to wholesale and retail clients. Truist expects SOFR to become a more commonly-used pricing benchmark across the industry. Truist continues to evaluate SOFR for additional product offerings and other alternative reference rates as replacements for LIBOR.
Market risk from trading activities
As a financial intermediary, Truist provides its clients access to derivatives, foreign exchange and securities markets, which generate market risks. Trading market risk is managed using a comprehensive risk management approach, which includes measuring risk using VaR, stress testing and sensitivity analysis. Risk metrics are monitored against a suite of limits on a daily basis at both the trading desk level and at the aggregate portfolio level to ensure exposures are in line with Truist's risk appetite.
Truist is subject to risk-based capital guidelines for market risk under the Market Risk Rule.
Covered trading positions
Covered positions subject to the Market Risk Rule include trading assets and liabilities, specifically those held for the purpose of short-term resale or with the intent of benefiting from actual or expected short-term price movements, or to lock in arbitrage profits. Truist’s trading portfolio of covered positions results primarily from market making and underwriting services for our clients, as well as associated risk mitigating hedging activity. The trading portfolio, measured in terms of VaR, consists primarily of four sub-portfolios of covered positions: (i) credit trading, (ii) fixed income securities, (iii) interest rate derivatives and (iv) equity derivatives. As a market maker across different asset classes, Truist’s trading portfolio also contains other sub-portfolios, including foreign exchange, loan trading, and commodity derivatives; however, these portfolios do not generate material trading risk exposures.
Valuation policies, procedures, and methodologies exist for all covered positions. Additionally, trading positions are subject to independent price verification. See "Note 16. Derivative Financial Instruments,” "Note 15. Fair Value Disclosures,” and “Critical Accounting Policies” herein for discussion of valuation policies, procedures and methodologies.
Securitizations
As of September 30, 2020, the aggregate market value of on-balance sheet securitization positions subject to the Market Risk Rule was $5 million, all of which were non-agency asset backed securities positions. Consistent with the Market Risk Rule requirements, the Company performs pre-purchase due diligence on each securitization position to identify the characteristics including, but not limited to, deal structure and the asset quality of the underlying assets, that materially affect valuation and performance. Securitization positions are subject to Truist’s comprehensive risk management framework, which includes daily monitoring against a suite of limits. There were no off-balance sheet securitization positions during the reporting period.
Correlation trading positions
The trading portfolio of covered positions did not contain any correlation trading positions as of September 30, 2020.
74 Truist Financial Corporation
VaR-based measures
VaR measures the potential loss of a given position or portfolio of positions at a specified confidence level and time horizon. Truist utilizes a historical VaR methodology to measure and aggregate risks across its covered trading positions. Prior to the integration of the two institutional broker dealer businesses to form Truist Securities in the third quarter of 2020, Truist operated two historical VaR models and the aggregate company-wide VaR across the systems was determined additively with no benefit of diversification. The heritage BB&T VaR model was retired following the formation of Truist Securities. Following the formation of Truist Securities, VaR is calculated on a consolidated basis using the Truist VaR engine. For risk management purposes, the VaR calculation is based on a historical simulation approach and measures the potential trading losses using a one-day holding period at a one-tail, 99% confidence level. For Market Risk Rule purposes, the Company calculates VaR using a 10-day holding period and a 99% confidence level. Due to inherent limitations of the VaR methodology, such as the assumption that past market behavior is indicative of future market performance, VaR is only one of several tools used to measure and manage market risk. Other tools used to actively manage market risk include stress testing, profit and loss attribution, and stop loss limits.
The trading portfolio’s VaR profile is influenced by a variety of factors, including the size and composition of the portfolio, market volatility and the correlation between different positions. A portfolio of trading positions is typically less risky than the sum of risk from each of the individual sub-portfolios. As such, risk within each category partially offsets the exposure to other risk categories thereby creating a portfolio diversification benefit. The following table summarizes certain VaR-based measures for both the three and nine months ended September 30, 2020 and 2019. The increase from the prior year was mainly due to the integration of the heritage SunTrust trading business and the market volatility due to the COVID-19 pandemic. As illustrated in the table below, the inclusion of volatility levels observed in March and April in the 12 month VaR historic look back window led to a convergence between VaR and Stressed VaR measures.
| Table 24: VaR-based Measures | |||||||||||||||||||||||||||||||||||||||||||||||
| Three Months Ended September 30, | Nine Months Ended September 30, | ||||||||||||||||||||||||||||||||||||||||||||||
| 2020 | 2019 | 2020 | 2019 | ||||||||||||||||||||||||||||||||||||||||||||
|
(Dollars in millions) |
10-Day Holding Period | 1-Day Holding Period | 10-Day Holding Period | 1-Day Holding Period | 10-Day Holding Period | 1-Day Holding Period | 10-Day Holding Period | 1-Day Holding Period | |||||||||||||||||||||||||||||||||||||||
| VaR-based Measures: | |||||||||||||||||||||||||||||||||||||||||||||||
| Maximum | $ | 65 | $ | 11 | $ | 1 | $ | 1 | $ | 65 | $ | 11 | $ | 2 | $ | 1 | |||||||||||||||||||||||||||||||
| Average | 31 | 6 | 1 | — | 23 | 5 | 1 | — | |||||||||||||||||||||||||||||||||||||||
| Minimum | 13 | 3 | — | — | 3 | 1 | — | — | |||||||||||||||||||||||||||||||||||||||
| Period-end | 46 | 8 | 1 | — | 46 | 8 | 1 | — | |||||||||||||||||||||||||||||||||||||||
| VaR by Risk Class: | |||||||||||||||||||||||||||||||||||||||||||||||
| Interest Rate Risk | 1 | — | 1 | — | |||||||||||||||||||||||||||||||||||||||||||
| Credit Spread Risk | 10 | — | 10 | — | |||||||||||||||||||||||||||||||||||||||||||
| Equity Price Risk | 2 | — | 2 | — | |||||||||||||||||||||||||||||||||||||||||||
| Foreign Exchange Risk | — | — | — | — | |||||||||||||||||||||||||||||||||||||||||||
| Portfolio Diversification | (6) | — | (6) | — | |||||||||||||||||||||||||||||||||||||||||||
| Period-end | 8 | — | 8 | — | |||||||||||||||||||||||||||||||||||||||||||
Stressed VaR-based measures
Stressed VaR, another component of market risk capital, is calculated using the same internal models as used for the VaR-based measure. Stressed VaR is calculated over a ten-day holding period at a one-tail, 99% confidence level and employs a historical simulation approach based on a continuous twelve-month historical window selected to reflect a period of significant financial stress for our trading portfolio. The following table summarizes Stressed VaR-based measures:
| Table 25: Stressed VaR-based Measures - 10 Day Holding Period | |||||||||||||||||||||||
| Three Months Ended September 30, | Nine Months Ended September 30, | ||||||||||||||||||||||
| (Dollars in millions) | 2020 | 2019 | 2020 | 2019 | |||||||||||||||||||
| Maximum | $ | 65 | $ | 4 | $ | 65 | $ | 6 | |||||||||||||||
| Average | 31 | 3 | 31 | 4 | |||||||||||||||||||
| Minimum | 14 | 2 | 13 | 2 | |||||||||||||||||||
| Period-end | 46 | 2 | 46 | 2 | |||||||||||||||||||
The increase from the prior year in stressed VaR-based measures was due to the integration of heritage SunTrust trading business after the Merger and the market volatility due to the COVID-19 pandemic.
Truist Financial Corporation 75
Specific risk measures
Specific risk is a measure of idiosyncratic risk that could result from risk factors other than broad market movements (e.g. default, event risks). The Market Risk Rule provides fixed risk weights under a standardized measurement method while also allowing a model-based approach, subject to regulatory approval. Truist utilizes the standardized measurement method to calculate the specific risk component of market risk regulatory capital. As such, incremental risk capital requirements do not apply.
VaR model backtesting
In accordance with the Market Risk Rule, the Company evaluates the accuracy of its VaR model through daily backtesting by comparing aggregate daily trading gains and losses (excluding fees, commissions, reserves, net interest income, and intraday trading) from covered positions with the corresponding daily VaR-based measures generated by the model.
There were eight company-wide VaR backtesting exceptions during the twelve months ended September 30, 2020, primarily driven by the COVID-19 pandemic which led to a sudden and significant repricing of financial markets during the first and second quarter of 2020, amid an increase in market volatility and deterioration in overall market liquidity. In accordance with established policy and procedure, all company-wide VaR backtesting exceptions are thoroughly reviewed in the context of VaR model use and performance. Following such reviews, it was determined that the VaR model performed in line with expectations. However, the extreme moves in underlying market risk factors caused by the COVID-19 pandemic would not typically have been captured within the 1-day VaR measure.
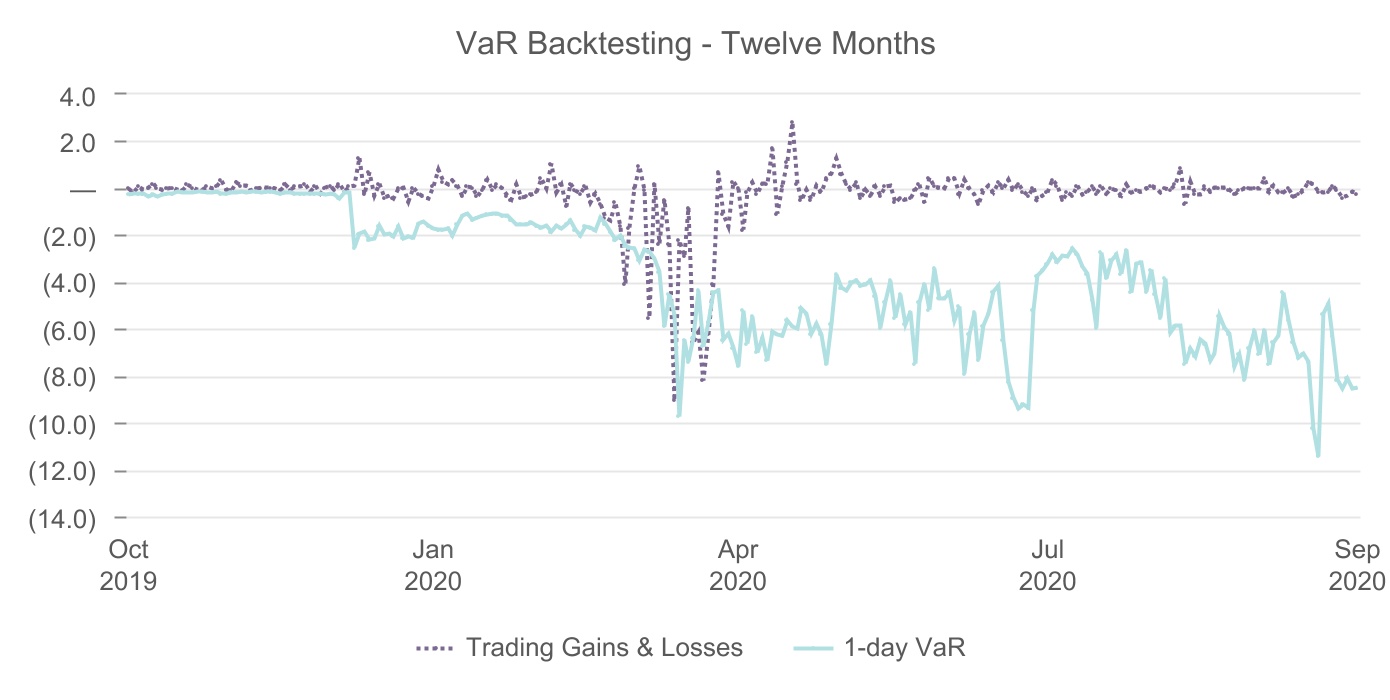
Model risk management
MRM is responsible for the independent model validation of all decision tools and models including trading market risk models. The validation activities are conducted in accordance with MRM policy, which incorporates regulatory guidance related to the evaluation of model conceptual soundness, ongoing monitoring and outcomes analysis. As part of ongoing monitoring efforts, the performance of all trading risk models are reviewed regularly to preemptively address emerging developments in financial markets, assess evolving modeling approaches, and to identify potential model enhancement.
Stress testing
76 Truist Financial Corporation
The Company uses a comprehensive range of stress testing techniques to help monitor risks across trading desks and to augment standard daily VaR and other risk limits reporting. The stress testing framework is designed to quantify the impact of extreme, but plausible, stress scenarios that could lead to large unexpected losses. Stress tests include simulations for historical repeats and hypothetical risk factor shocks. All trading positions within each applicable market risk category (interest rate risk, equity risk, foreign exchange rate risk, credit spread risk, and commodity price risk) are included in the Company's comprehensive stress testing framework. Management reviews stress testing scenarios on an ongoing basis and makes updates, as necessary, to ensure that both current and emerging risks are captured appropriately. Management also utilizes stress analyses to support the Company’s capital adequacy assessment standards. See the “Capital” section of this MD&A for additional discussion of capital adequacy.
Liquidity
Liquidity represents the continuing ability to meet funding needs, including deposit withdrawals, repayment of borrowings and other liabilities, and funding of loan commitments. In addition to the level of liquid assets, such as cash, cash equivalents and AFS securities, other factors affect the ability to meet liquidity needs, including access to a variety of funding sources, maintaining borrowing capacity, growing core deposits, loan repayment and the ability to securitize or package loans for sale.
Truist monitors the ability to meet client demand for funds under both normal and stressed market conditions. In considering its liquidity position, management evaluates Truist's funding mix based on client core funding, client rate-sensitive funding and national markets funding. In addition, management evaluates exposure to rate-sensitive funding sources that mature in one year or less. Management also measures liquidity needs against 30 days of stressed cash outflows for Truist and Truist Bank. To ensure a strong liquidity position, and compliance with regulatory requirements, management maintains a liquid asset buffer of cash on hand and highly liquid unencumbered securities. As of September 30, 2020 and December 31, 2019, Truist's liquid asset buffer, as a percent of total assets, was 18.6% and 16.5%, respectively.
The LCR rule directs large U.S. banking organizations to hold unencumbered high-quality liquid assets sufficient to withstand projected 30-day total net cash outflows, each as defined under the LCR rule. As of January 1, 2020, Truist is subject to the Category III reduced LCR requirements. Truist's average LCR was 117% for the three months ended September 30, 2020, well above the regulatory minimum.
The ability to raise funding at competitive prices is affected by the rating agencies' views of the Parent Company's and Truist Bank's credit quality, liquidity, capital and earnings. Management meets with the rating agencies on a regular basis to discuss current outlooks. In April 2020, DBRS revised its outlook for Truist and Truist Bank from “positive” to “stable,” citing economic deterioration related to COVID-19. DBRS affirmed all other ratings for Truist and Truist Bank. Additionally, Fitch revised its outlook for Truist and Truist Bank from “stable” to “negative,” also citing pandemic-related economic deterioration. Fitch downgraded Truist’s subordinated debt to A-, and upgraded Truist’s preferred stock to BBB, in order to align these ratings to its recently revised bank rating methodology.
In July 2020, Fitch completed the implementation of its revised bank rating methodology. As a result, Fitch downgraded Truist’s senior unsecured debt to A and affirmed Truist Bank’s senior unsecured and subordinated debt ratings. This rating action taken by Fitch was solely a function of implementing its revised bank rating methodology and did not reflect a change in Fitch’s current or expected view of Truist’s or Truist Bank’s credit fundamentals.
See "Liquidity" section of the MD&A of the Annual Report on Form 10-K for the year ended December 31, 2019 for additional information regarding credit ratings.
Parent Company
The Parent Company serves as the primary source of capital for the operating subsidiaries. The Parent Company's assets consist primarily of cash on deposit with Truist Bank, equity investments in subsidiaries, advances to subsidiaries, and accounts receivable from subsidiaries. The principal obligations of the Parent Company are payments on long-term debt. The main sources of funds for the Parent Company are dividends and management fees from subsidiaries, repayments of advances to subsidiaries, and proceeds from the issuance of equity and long-term debt. The primary uses of funds by the Parent Company are investments in subsidiaries, advances to subsidiaries, dividend payments to common and preferred shareholders, retirement of common stock, and payments on long-term debt.
See "Note 22. Parent Company Financial Information" of the Annual Report on Form 10-K for the year ended December 31, 2019 for additional information regarding dividends from subsidiaries and debt transactions.
Truist Financial Corporation 77
Access to funding at the Parent Company is more sensitive to market disruptions. Therefore, Truist prudently manages cash levels at the Parent Company to cover a minimum of one year of projected cash outflows which includes unfunded external commitments, debt service, common and preferred dividends and scheduled debt maturities, without the benefit of any new cash inflows. Truist maintains a significant buffer above the projected one year of cash outflows. In determining the buffer, Truist considers cash requirements for common and preferred dividends, unfunded commitments to affiliates, serving as a source of strength to Truist Bank, and being able to withstand sustained market disruptions that could limit access to the capital markets. At September 30, 2020 and December 31, 2019, the Parent Company had 46 months and 29 months, respectively, of cash on hand to satisfy projected cash outflows, and 22 months and 20 months, respectively, when including the payment of common stock dividends.
Truist Bank
Truist carefully manages liquidity risk at Truist Bank. Truist Bank's primary source of funding is client deposits. Continued access to client deposits is highly dependent on public confidence in the stability of Truist Bank and its ability to return funds to clients when requested.
Truist Bank maintains a number of diverse funding sources to meet its liquidity requirements. These sources include unsecured borrowings from the capital markets through the issuance of senior or subordinated bank notes, institutional CDs, overnight and term Federal funds markets, and retail brokered CDs. Truist Bank also maintains access to secured borrowing sources including FHLB advances, repurchase agreements, and the FRB discount window. At September 30, 2020, Truist Bank had approximately $169.5 billion of available secured borrowing capacity, which represents approximately 8.3 times the amount of one-year wholesale funding maturities. In addition to secured borrowing sources, Truist had excess eligible cash at the Federal Reserve Bank of $32.6 billion at September 30, 2020.
Contractual Obligations, Commitments, Contingent Liabilities and Off-Balance Sheet Arrangements
Refer to Truist's Annual Report on Form 10-K for the year ended December 31, 2019 for discussion with respect to Truist's quantitative and qualitative disclosures about its fixed and determinable contractual obligations. Truist's commitments include investments in affordable housing projects throughout its market area, renewable energy credits, private equity funds, derivative contracts to manage various financial risks, as well as other commitments. Refer to "Note 14. Commitments and Contingencies,” “Note 15. Fair Value Disclosures” and “Note 16. Derivative Financial Instruments” in this Form 10-Q, and “Note 16. Commitments and Contingencies" of the Annual Report on Form 10-K for further discussion of these commitments.
Capital
The maintenance of appropriate levels of capital is a management priority and is monitored on a regular basis. Truist's principal goals related to the maintenance of capital are to provide adequate capital to support Truist's risk profile consistent with the Board-approved risk appetite, provide financial flexibility to support future growth and client needs, comply with relevant laws, regulations, and supervisory guidance, achieve optimal credit ratings for Truist and its subsidiaries and provide a competitive return to shareholders. Risk-based capital ratios, which include CET1 capital, Tier 1 capital and Total capital are calculated based on regulatory guidance related to the measurement of capital and risk-weighted assets.
Truist regularly performs stress testing on its capital levels and is required to periodically submit the Company's capital plans and stress testing results to the banking regulators. Management regularly monitors the capital position of Truist on both a consolidated and bank-level basis. In this regard, management's overriding policy is to maintain capital at levels that are in excess of internal capital targets, which are above the regulatory "well capitalized" minimums. Management has implemented stressed capital ratio minimum targets to evaluate whether capital ratios calculated after the effect of alternative capital actions are likely to remain above minimums specified by the FRB for the annual CCAR process. Breaches of stressed minimum targets prompt a review of the planned capital actions included in Truist's capital plan.
| Table 26: Capital Requirements and Targets | ||||||||||||||||||||||||||
| Minimum Capital | Well Capitalized | Minimum Capital Plus Capital Conservation Buffer (3) | Truist Targets (1) | |||||||||||||||||||||||
| Truist | Truist Bank | Interim Operating (2) | Stressed | |||||||||||||||||||||||
|
CET1
|
4.5 | % | NA | 6.5 | % | 7.0 | % | 8.0 | % | 7.0 | % | |||||||||||||||
| Tier 1 capital | 6.0 | 6.0 | 8.0 | 8.5 | 9.3 | 8.5 | ||||||||||||||||||||
| Total capital | 8.0 | 10.0 | 10.0 | 10.5 | 11.3 | 10.5 | ||||||||||||||||||||
| Leverage ratio | 4.0 | NA | 5.0 | NA | 7.5 | 7.0 | ||||||||||||||||||||
| Supplementary leverage ratio | 3.0 | NA | NA | NA | 6.5 | 6.0 | ||||||||||||||||||||
(1)
The Truist targets are subject to revision based on finalization of pending regulatory guidance and other strategic factors.
(2)
Truist's goal is to maintain capital levels above all regulatory minimums.
(3)
The current capital conservation buffer of 250 basis points was replaced by the SCB of 270 basis points effective October 1, 2020.
78 Truist Financial Corporation
During the first quarter of 2020, as market conditions evolved, Truist received Board approval to establish new interim operating targets that provide for sufficient capital levels while allowing the company to support clients through the economic downturn. These interim operating targets will be evaluated as economic conditions evolve.
While nonrecurring events or management decisions may result in the Company temporarily falling below its operating minimum guidelines for one or more of these ratios, it is management's intent to return to these targeted operating minimums within a reasonable period of time through capital planning. Such temporary decreases below the operating minimums shown above are not considered an infringement of Truist's overall capital policy, provided a return above the minimums is forecasted to occur within a reasonable time period.
In August 2020, the Federal Reserve informed Truist of its final SCB of 270 basis points for risk-based capital ratios. This buffer, which was determined based on stress testing results developed by the Federal Reserve, is 20 basis points above the Capital Conservation Buffer. The SCB will be effective from October 1, 2020 through September 30, 2021, at which point a revised SCB will be calculated and provided to Truist. Consistent with the Federal Reserve’s mandate across the industry, Truist will update and resubmit its capital plan in early November 2020 to reflect changes in financial markets and the macroeconomic outlook. Truist’s review of the results of the 2020 CCAR supervisory stress test notes that the modeled outcomes shown by the FRB differ from those calculated by the Company. Truist believes those differences are attributable to the application of purchase accounting associated with the Merger. Purchase accounting adjustments could result in a reduction in provision expense and an increase in pre-provision net revenue. These differences could result in higher capital ratios than were reflected in the CCAR results.
Truist's capital ratios are presented in the following table:
| Table 27: Capital Ratios - Truist Financial Corporation | ||||||||||||||
| (Dollars in millions, except per share data, shares in thousands) | Sep 30, 2020 | Dec 31, 2019 | ||||||||||||
| Risk-based: | (preliminary) | |||||||||||||
| CET1 capital to risk-weighted assets | 10.0 | % | 9.5 | % | ||||||||||
| Tier 1 capital to risk-weighted assets | 12.2 | 10.8 | ||||||||||||
| Total capital to risk-weighted assets | 14.6 | 12.6 | ||||||||||||
| Leverage ratio | 9.6 | 14.7 | ||||||||||||
| Supplementary leverage ratio | 8.9 | NA | ||||||||||||
| Non-GAAP capital measure (1): | ||||||||||||||
| Tangible common equity per common share | $ | 26.63 | $ | 25.93 | ||||||||||
| Calculation of tangible common equity (1): | ||||||||||||||
| Total shareholders' equity | $ | 69,973 | $ | 66,558 | ||||||||||
| Less: | ||||||||||||||
| Preferred stock | 8,048 | 5,102 | ||||||||||||
| Noncontrolling interests | 106 | 174 | ||||||||||||
| Goodwill and intangible assets, net of deferred taxes | 25,923 | 26,482 | ||||||||||||
| Tangible common equity | $ | 35,896 | $ | 34,800 | ||||||||||
| Risk-weighted assets | $ | 377,045 | $ | 376,056 | ||||||||||
| Common shares outstanding at end of period | 1,348,118 | 1,342,166 | ||||||||||||
(1)
Tangible common equity and related measures are non-GAAP measures that exclude the impact of intangible assets, net of deferred taxes, and their related amortization. These measures are useful for evaluating the performance of a business consistently, whether acquired or developed internally. Truist's management uses these measures to assess the quality of capital and returns relative to balance sheet risk.
These capital measures are not necessarily comparable to similar capital measures that may be presented by other companies.
Capital ratios improved compared to year-end 2019, due to growth in CET1 capital, partially offset by higher risk-weighted assets. Truist's capital levels remain strong compared to the regulatory levels for well capitalized banks at September 30, 2020. Truist’s other capital measures also improved as Truist issued various capital instruments to strengthen its capital position. Truist issued $3.5 billion of preferred stock and redeemed $500 million of Series K preferred stock during the first nine months of 2020. In addition, Truist issued $1.3 billion of subordinated debt. Truist declared common dividends of $0.450 per share during the third quarter of 2020. The dividend and total payout ratios for the third quarter of 2020 were 56.8%.
Truist Financial Corporation 79
Share Repurchase Activity
| Table 28: Share Repurchase Activity | |||||||||||||||||||||||
| (Dollars in millions, except per share data, shares in thousands) | Total Shares Repurchased (1) | Average Price Paid Per Share (2) | Total Shares Repurchased Pursuant to Publicly-Announced Plan | Maximum Remaining Dollar Value of Shares Available for Repurchase Pursuant to Publicly-Announced Plan | |||||||||||||||||||
| July 2020 | 1 | $ | 36.42 | — | $ | — | |||||||||||||||||
| August 2020 | — | — | — | — | |||||||||||||||||||
| September 2020 | — | — | — | — | |||||||||||||||||||
| Total | 1 | 36.42 | — | ||||||||||||||||||||
(1)
Includes shares exchanged or surrendered in connection with the exercise of equity-based awards under equity-based compensation plans.
(2)
Excludes commissions.
Critical Accounting Policies
The accounting and reporting policies of Truist are in accordance with GAAP and conform to the accounting and reporting guidelines prescribed by bank regulatory authorities. Truist's financial position and results of operations are affected by management's application of accounting policies, including estimates, assumptions and judgments made to arrive at the carrying value of assets and liabilities and amounts reported for revenues and expenses. Different assumptions in the application of these policies could result in material changes in the consolidated financial position and/or consolidated results of operations and related disclosures. The more critical policies include accounting for the ACL, determining fair value of financial instruments, intangible assets, income taxes and costs and benefit obligations associated with pension and postretirement benefit plans. Understanding Truist's accounting policies is fundamental to understanding the consolidated financial position and consolidated results of operations. The critical accounting policies are discussed in MD&A in Truist's Annual Report on Form 10-K for the year ended December 31, 2019. Significant accounting policies and changes in accounting principles and effects of new accounting pronouncements are discussed in “Note 1. Basis of Presentation” in Form 10-K for the year ended December 31, 2019. Additional disclosures regarding the effects of new accounting pronouncements are included in the “Note 1. Basis of Presentation” included herein. Except for the items noted below, there have been no changes to the significant accounting policies during 2020.
Intangible Assets
The severe economic disruption and related financial effects of the COVID-19 pandemic have impacted Truist’s businesses. Truist’s commercial clients have experienced varying levels of disruptions to business activity, supply chains and demand for products and services. Additionally, many consumer clients have experienced interrupted income or unemployment. The pandemic also has resulted in continuing volatility to the global and U.S. financial markets, although intensive relief actions by the U.S. Congress and regulatory agencies intended to mitigate the extent of adverse economic effects have stabilized financial markets and liquidity, including with respect to equity prices and corporate credit spreads for Truist and the banking sector, in comparison to earlier in the year.
As a result of these considerations, Truist performed a qualitative assessment of the goodwill carried by the CB&W, C&CB and IH reporting units for impairment in the third quarter of 2020 to determine whether it was more-likely-than-not that the fair value of one or more of its reporting units was below its respective carrying amount as of period-end. In performing this assessment, Truist considered macroeconomic and market factors, industry and banking sector events, a sensitivity analysis on management’s forecast and assumptions, and Truist specific performance indicators, including any changes from when the Merger closed in December 2019. Despite the adverse economic and still uncertain environment caused by the pandemic, Truist’s third quarter 2020 results reflected profitable performance across each of its reporting units; strong capital and liquidity levels that have facilitated swift actions in support of clients, teammates and communities; and Truist’s affirmation that it remains committed to achieving its Merger value proposition, including targeted net cost saves.
Based on the qualitative assessment performed, Truist concluded that it was not more-likely-than-not that the fair value of one or more of its reporting units is below its respective carrying amount as of September 30, 2020, and therefore no triggering event occurred that required a quantitative goodwill impairment test. If economic conditions deteriorate, or the pandemic’s effects prolong or worsen, it may be more-likely-than-not that the fair value of one or more of Truist’s reporting units falls below its respective carrying amount, which would require a quantitative goodwill impairment test.
80 Truist Financial Corporation
ACL
Truist's policy is to maintain an ACL, which represents management's best estimate of expected future credit losses related to the loan and lease portfolios and off-balance sheet lending commitments at the balance sheet date. Estimates of expected future loan and lease losses are determined by using statistical models and management’s judgement. The models are designed to forecast probability of default, exposure at default and loss given default by correlating certain macroeconomic variables to historical experience. The models are generally applied at the portfolio level to pools of loans with similar risk characteristics. The macroeconomic data used in the models is based on forecasted variables for the reasonable and supportable period of two years. Beyond this forecast period the models gradually revert to long-term historical loss conditions over a one year period. Expected losses are estimated through contractual maturity, giving appropriate consideration to expected prepayments unless the borrower has a right to renew that is not cancellable or it is reasonably expected that the loan will be modified as a TDR.
A qualitative allowance which incorporates management’s judgement is also included in the estimation of expected future loan and lease losses, including qualitative adjustments in circumstances where the model output is inconsistent with management’s expectations with respect to expected credit losses. This allowance is used to adjust for limitations in modeled results related to the current economic conditions and capture risks in the portfolio such as considerations with respect to the impact of current economic events, the outcomes of which are uncertain. These events may include, but are not limited to, political conditions, legislation that may directly or indirectly affect the banking industry and economic conditions affecting specific geographical areas and industries in which Truist conducts business.
Loans and leases that do not share similar risk characteristics and significant loans that are considered collateral-dependent are individually evaluated. For these loans, the ALLL is determined through review of data specific to the borrower and related collateral, if any. For TDRs, default expectations and estimated prepayment speeds that are specific to each of the restructured loan populations are incorporated in the determination of the ALLL.
The methodology used to determine an estimate for the RUFC is similar to that used to determine the funded component of the ALLL and is measured over the period there is a contractual obligation to extend credit that is not unconditionally cancellable. The RUFC is adjusted for factors specific to binding commitments, including the probability of funding and exposure at default. A detailed discussion of the methodology used in determining the ACL is included in "Note 1. Basis of Presentation."
ITEM 4. CONTROLS AND PROCEDURES
Evaluation of Disclosure Controls and Procedures
As of the end of the period covered by this report, the management of the Company, under the supervision and with the participation of the Company's CEO and CFO, carried out an evaluation of the effectiveness of the Company's disclosure controls and procedures as defined in Rules 13a-15(e) and 15d-15(e) of the Exchange Act. Based on that evaluation, the CEO and CFO concluded that the Company's disclosure controls and procedures were effective.
Changes in Internal Control over Financial Reporting
Management of Truist is responsible for establishing and maintaining adequate internal control over financial reporting as defined in Rule 13a-15(f) of the Exchange Act. The Company's internal control over financial reporting is a process designed to provide reasonable assurance regarding the reliability of financial reporting and the preparation of financial statements for external purposes in accordance with GAAP.
There were no changes in the Company's internal control over financial reporting that occurred during the quarter ended September 30, 2020 that materially affected, or are reasonably likely to materially affect, the Company’s internal control over financial reporting.
Truist Financial Corporation 81
PART II. OTHER INFORMATION
ITEM 1. LEGAL PROCEEDINGS
Refer to the Legal Proceeding section in “Note 14. Commitments and Contingencies,” which is incorporated by reference into this item.
ITEM 1A. RISK FACTORS
The following risk factor supplements the risk factors disclosed in Truist's Annual Report on Form 10-K for the year ended December 31, 2019. Additional risks and uncertainties not currently known to Truist or that management has deemed to be immaterial also may materially adversely affect Truist's business, financial condition, or operating results.
The effects of COVID-19 have adversely impacted, and will likely continue to adversely impact, the Company’s financial condition and results of operations.
The COVID-19 pandemic has severely disrupted almost all economic activity in the U.S. Despite the partial lifting of federal and state shelter-in-place orders, some of which have been renewed, it remains unknown when there will be a return to normal economic activity due to continued significant numbers of new cases, and increased economic stress associated with the pandemic. Truist temporarily limited access to certain offices, limited branches to drive-thru and appointment only, suspended some services and the majority of the Company’s workforce is working remotely, which may increase cybersecurity risks to the Company. Approximately 90% of branches are open and unlocked, or open with controlled access. Truist continues to follow appropriate COVID-19 safety protocols, including proper social distancing. Commercial clients are experiencing varying levels of disruptions or restrictions on their business activity and supply chains, closures of facilities or decreases in demand for their products and services. Consumer clients are experiencing interrupted income or unemployment. Certain industries have been particularly susceptible to the effects of the pandemic, such as hotels, resorts, cruise lines, oil and gas companies, senior and acute care facilities, restaurants, and other sensitive retail businesses, and Truist has outstanding loans to clients in these industries. In addition, in March 2020, Moody’s Investor Services downgraded its outlook on U.S. banks to “negative” from “stable” due in part to the concerns presented by the pandemic. The global financial markets have also experienced significant volatility. The duration of this severe economic disruption and its related financial impact cannot be reasonably estimated at this time.
The effects of the pandemic have already resulted in an increase in the allowance for credit losses, a reduction of fee income, a reduction of net interest margin and an increase in expenses. Prolonged continuation of current conditions could worsen these impacts and also affect the Company’s capital and liquidity position, impair the ability of borrowers to repay outstanding loans, impair the value of collateral securing loans, cause an outflow of deposits, cause significant property damage, in case of civil unrest or vandalism, influence the recognition of credit losses on loans and securities and further increase the allowance for credit losses, result in additional lost revenue, cause additional increases in expenses, result in goodwill impairment charges, result in the impairment of other financial and nonfinancial assets, and increase the Company’s cost of capital.
Intensive government actions to mitigate the economic suffering caused by the pandemic may not be successful or may result in increased pressure on the banking sector. Net interest margin has been, and is likely to continue to be, affected by the very low interest rate environment. The application of forbearance and payment deferral policies beyond any statutory requirements may impact Truist’s interest income. Truist participated in the SBA’s PPP as an eligible lender with the benefit of a government guaranty of loans to small business clients, many of whom may face difficulties even after being granted such a loan. The Company has registered to participate in Federal Reserve supported lending programs for Main Street-eligible borrowers as well. The Company faces increased risks, in terms of credit, fraud risk and litigation, in light of participation in these programs. Truist has already been named in several lawsuits relating to its participation in the PPP.
It is possible that the pandemic and its aftermath will lead to a prolonged economic slowdown or recession in the U.S. economy or the world economy in general. The ultimate impact on the Company’s financial condition, results of operation, and liquidity and capital position will depend on future developments, which are highly uncertain and cannot be predicted, including new information which may emerge concerning the severity of the pandemic and the actions to contain or treat its impact. Moreover, the effects of the COVID-19 pandemic will heighten the other risks described in the section entitled “Risk Factors” in the most recent Annual Report on Form 10-K and any subsequent Quarterly Report on Form 10-Q or Current Report on Form 8-K.
ITEM 2. UNREGISTERED SALES OF EQUITY SECURITIES AND USE OF PROCEEDS
Refer to the Share Repurchase Activity section in the MD&A, which is incorporated by reference into this item.
82 Truist Financial Corporation
ITEM 6. EXHIBITS
| Exhibit No. | Description | Location | ||||||||||||
| 3.1 | Articles of Amendment of the Company with respect to Series R Non-Cumulative Perpetual Preferred Stock filed on July 31, 2020. | |||||||||||||
| 11 | Statement re computation of earnings per share. | |||||||||||||
| 31.1 | Certification of Chief Executive Officer pursuant to Rule 13a-14(a) or 15d-14(a) of the Exchange Act, as adopted pursuant to Section 302 of the Sarbanes-Oxley Act of 2002. | |||||||||||||
| 31.2 | Certification of Chief Financial Officer pursuant to Rule 13a-14(a) or 15d-14(a) of the Exchange Act, as adopted pursuant to Section 302 of the Sarbanes-Oxley Act of 2002. | |||||||||||||
| 32 | Certification of Chief Executive Officer and Chief Financial Officer pursuant to 18 U.S.C. Section 1350, as adopted pursuant to Section 906 of the Sarbanes-Oxley Act of 2002. | |||||||||||||
| 101.INS | XBRL Instance Document – the instance document does not appear in the interactive data file because its XBRL tags are embedded within the inline XBRL document. | Filed herewith. | ||||||||||||
| 101.SCH | XBRL Taxonomy Extension Schema. | Filed herewith. | ||||||||||||
| 101.CAL | XBRL Taxonomy Extension Calculation Linkbase. | Filed herewith. | ||||||||||||
| 101.LAB | XBRL Taxonomy Extension Label Linkbase. | Filed herewith. | ||||||||||||
| 101.PRE | XBRL Taxonomy Extension Presentation Linkbase. | Filed herewith. | ||||||||||||
| 101.DEF | XBRL Taxonomy Definition Linkbase. | Filed herewith. | ||||||||||||
| 104 | Cover Page Interactive Data File (formatted as inline XBRL with applicable taxonomy extension information contained in Exhibits101). | Filed herewith. | ||||||||||||
Truist Financial Corporation 83
SIGNATURES
Pursuant to the requirements of the Securities Exchange Act of 1934, the registrant has duly caused this report to be signed on its behalf by the undersigned thereunto duly authorized.
|
TRUIST FINANCIAL CORPORATION
(Registrant)
|
||||||||||||||
| Date: | November 2, 2020 | By: | /s/ Daryl N. Bible | |||||||||||
| Daryl N. Bible | ||||||||||||||
| Senior Executive Vice President and Chief Financial Officer | ||||||||||||||
| (Principal Financial Officer) | ||||||||||||||
| Date: | November 2, 2020 | By: | /s/ Cynthia B. Powell | |||||||||||
| Cynthia B. Powell | ||||||||||||||
| Executive Vice President and Corporate Controller | ||||||||||||||
| (Principal Accounting Officer) | ||||||||||||||
84 Truist Financial Corporation
TABLE OF CONTENTS
Item 1. Financial StatementsNote 1. Basis Of PresentationNote 2. Business CombinationsNote 3. Securities Financing ActivitiesNote 4. Investment SecuritiesNote 5. Loans and AclNote 6. Goodwill and Other Intangible AssetsNote 7. Loan ServicingNote 8. Other Assets and LiabilitiesNote 9. BorrowingsNote 10. Shareholders' EquityNote 11. AociNote 12. Income TaxesNote 13. Benefit PlansNote 14. Commitments and ContingenciesNote 15. Fair Value DisclosuresNote 16. Derivative Financial InstrumentsNote 17. Computation Of EpsNote 18. Operating SegmentsItem 2. Management's Discussion and Analysis Of Financial Condition and Results Of OperationsItem 4. Controls and ProceduresPart II. Other InformationItem 1. Legal ProceedingsItem 1A. Risk FactorsItem 2. Unregistered Sales Of Equity Securities and Use Of ProceedsItem 6. Exhibits