TRUIST FINANCIAL CORP
10-Ks and 10-Qs
|
|
|
|
|
|
|
|
|
|
|
|
|
|
|
|
|
|
|
|
|
|
|
|
|
|
|
|
|
|
|
|
|
|
|
|
|
|
|
|
|
|
|
|
|
|
|
|
|
|
|
|
|
|
|
|
UNITED STATES
SECURITIES AND EXCHANGE COMMISSION
Washington, D.C. 20549
_____________________________________________
FORM
10-Q
_____________________________________________
of the Securities Exchange Act of 1934
For the quarterly period ended:
March 31, 2021
Commission File Number:
1-10853
_____________________________
(Exact name of registrant as specified in its charter)
_____________________________________________
|
|
|
||||||||||
| (State or other jurisdiction of incorporation or organization) | (I.R.S. Employer Identification No.) | ||||||||||
|
|
|||||||||||
|
|
|
|
|||||||||
| (Address of principal executive offices) | (Zip Code) | ||||||||||
| Registrant’s telephone number, including area code: |
|
|
|||||||||
_____________________________________________
Securities registered pursuant to Section 12(b) of the Act:
| Title of each class | Trading Symbol | Name of each exchange on which registered | ||||||||||||
|
|
|
|
||||||||||||
|
|
|
|
||||||||||||
|
|
|
|
||||||||||||
|
|
|
|
||||||||||||
|
|
|
|
||||||||||||
|
|
|
|
||||||||||||
Indicate by check mark whether the registrant (1) has filed all reports required to be filed by Section 13 or 15(d) of the Securities Exchange Act of 1934 during the preceding 12 months (or for such shorter period that the registrant was required to file such reports), and (2) has been subject to such filing requirements for the past 90 days.
Yes
☒
No
☐
Indicate by check mark whether the registrant has submitted electronically every Interactive Data File required to be submitted pursuant to Rule 405 of Regulation S-T (§232.405 of this chapter) during the preceding 12 months (or for such shorter period that the registrant was required to submit such files).
Yes
☒
No
☐
Indicate by check mark whether the registrant is a large accelerated filer, an accelerated filer, a non-accelerated filer, a smaller reporting company, or an emerging growth company. See the definitions of “large accelerated filer,” “accelerated filer,” “smaller reporting company” and “emerging growth company” in Rule 12b-2 of the Exchange Act.
|
|
☒ | Accelerated filer | ☐ | |||||||||||
| Non-accelerated filer | ☐ | Smaller reporting company |
|
|||||||||||
| Emerging growth company |
|
|||||||||||||
If an emerging growth company, indicate by check mark if the registrant has elected not to use the extended transition period for complying with any new or revised financial accounting standards provided pursuant to Section 13(a) of the Exchange Act.
☐
Indicate by check mark whether the registrant is a shell company (as defined in Rule 12b-2 of the Exchange Act). Yes
☐
No
☒
At March 31, 2021,
1,344,845,174
shares of the registrant’s common stock, $5 par value, were outstanding.
| TABLE OF CONTENTS | ||||||||
| TRUIST FINANCIAL CORPORATION | ||||||||
| FORM 10-Q | ||||||||
| March 31, 2021 | ||||||||
| Page No. | ||||||||
| PART I - Financial Information | ||||||||
| Glossary of Defined Terms | ||||||||
| Forward-Looking Statements | ||||||||
| Item 1. | Financial Statements | |||||||
| Consolidated Balance Sheets (Unaudited) | ||||||||
| Consolidated Statements of Income (Unaudited) | ||||||||
| Consolidated Statements of Comprehensive Income (Unaudited) | ||||||||
| Consolidated Statements of Changes in Shareholders’ Equity (Unaudited) | ||||||||
| Consolidated Statements of Cash Flows (Unaudited) | ||||||||
| Notes to Consolidated Financial Statements (Unaudited) | ||||||||
| Note 1. Basis of Presentation | ||||||||
| Note 2. Securities Financing Activities | ||||||||
| Note 3. Investment Securities | ||||||||
| Note 4. Loans and ACL | ||||||||
| Note 5. Goodwill and Other Intangible Assets | ||||||||
| Note 6. Loan Servicing | ||||||||
| Note 7. Other Assets and Liabilities | ||||||||
| Note 8. Borrowings | ||||||||
| Note 9. Shareholders’ Equity | ||||||||
| Note 10. AOCI | ||||||||
| Note 11. Income Taxes | ||||||||
| Note 12. Benefit Plans | ||||||||
| Note 13. Commitments and Contingencies | ||||||||
| Note 14. Fair Value Disclosures | ||||||||
| Note 15. Derivative Financial Instruments | ||||||||
| Note 16. Computation of EPS | ||||||||
| Note 17. Operating Segments | ||||||||
| Item 2. | Management’s Discussion and Analysis of Financial Condition and Results of Operations | |||||||
| Item 3. | Quantitative and Qualitative Disclosures About Market Risk (see Market Risk Management in MD&A) | |||||||
| Item 4. | Controls and Procedures | |||||||
| PART II - Other Information | ||||||||
| Item 1. | Legal Proceedings | |||||||
| Item 1A. | Risk Factors | |||||||
| Item 2. | Unregistered Sales of Equity Securities and Use of Proceeds | |||||||
| Item 3. | Defaults Upon Senior Securities - (none) | |||||||
| Item 4. | Mine Safety Disclosures - (not applicable) | |||||||
| Item 5. | Other Information - (none to be reported) | |||||||
| Item 6. | Exhibits | |||||||
Glossary of Defined Terms
The following terms may be used throughout this report, including the consolidated financial statements and related notes.
| Term | Definition | ||||
|
ACL
|
Allowance for credit losses
|
||||
|
AFS
|
Available-for-sale
|
||||
|
Agency MBS
|
Mortgage-backed securities issued by a U.S. government agency or GSE
|
||||
|
ALLL
|
Allowance for loan and lease losses
|
||||
|
ARRC
|
Alternative Reference Rates Committee of the FRB and the Federal Reserve Bank of New York
|
||||
|
AOCI
|
Accumulated other comprehensive income (loss)
|
||||
|
BB&T
|
BB&T Corporation and subsidiaries (changed to “Truist Financial Corporation” effective with the Merger)
|
||||
| Board | Truist’s Board of Directors | ||||
|
C&CB
|
Corporate and Commercial Banking, an operating segment
|
||||
| CARES Act | The Coronavirus Aid, Relief, and Economic Security Act | ||||
|
CB&W
|
Consumer Banking and Wealth, an operating segment
|
||||
|
CCAR
|
Comprehensive Capital Analysis and Review
|
||||
|
CDI
|
Core deposit intangible | ||||
| CECL | Current expected credit loss model | ||||
|
CEO
|
Chief Executive Officer
|
||||
|
CFO
|
Chief Financial Officer
|
||||
|
CET1
|
Common equity tier 1
|
||||
|
Company
|
Truist Financial Corporation and its subsidiaries (interchangeable with “Truist” below), formerly BB&T Corporation
|
||||
| COVID-19 | Coronavirus disease 2019 | ||||
|
CRA
|
Community Reinvestment Act of 1977
|
||||
|
CRE
|
Commercial real estate
|
||||
|
CRO
|
Chief Risk Officer
|
||||
| CVA | Credit valuation adjustment | ||||
|
EPS
|
Earnings per common share
|
||||
|
EVE
|
Economic value of equity
|
||||
|
FDIC
|
Federal Deposit Insurance Corporation
|
||||
|
FHLB
|
Federal Home Loan Bank
|
||||
|
FHLMC
|
Federal Home Loan Mortgage Corporation
|
||||
|
FNMA
|
Federal National Mortgage Association
|
||||
|
FRB
|
Board of Governors of the Federal Reserve System
|
||||
|
GAAP
|
Accounting principles generally accepted in the United States of America
|
||||
| GDP | Gross Domestic Product | ||||
|
Grandbridge
|
Grandbridge Real Estate Capital, LLC
|
||||
|
GSE
|
U.S. government-sponsored enterprise
|
||||
|
HFI
|
Held for investment
|
||||
|
IH
|
Insurance Holdings, an operating segment
|
||||
|
LCR
|
Liquidity Coverage Ratio
|
||||
|
LHFS
|
Loans held for sale
|
||||
|
LIBOR
|
London Interbank Offered Rate
|
||||
| Market Risk Rule |
Market risk capital requirements issued jointly by the OCC, U.S. Treasury, FRB, and FDIC
|
||||
|
MBS
|
Mortgage-backed securities
|
||||
| MD&A | Management’s Discussion and Analysis of Financial Condition and Results of Operations | ||||
| Merger | Merger of BB&T and SunTrust effective December 6, 2019 | ||||
|
MRM
|
Model Risk Management
|
||||
|
MSR
|
Mortgage servicing right
|
||||
|
NA
|
Not applicable | ||||
|
NIM
|
Net interest margin, computed on a TE basis
|
||||
|
NM
|
Not meaningful
|
||||
|
NPA
|
Nonperforming asset
|
||||
|
NPL
|
Nonperforming loan
|
||||
|
OAS
|
Option adjusted spread
|
||||
| OCC | Office of the Comptroller of the Currency | ||||
|
OCI
|
Other comprehensive income (loss)
|
||||
|
OPEB
|
Other post-employment benefit
|
||||
Truist Financial Corporation 1
| Term | Definition | ||||
|
OREO
|
Other real estate owned
|
||||
|
OT&C
|
Other, Treasury and Corporate
|
||||
|
Parent Company
|
Truist Financial Corporation, the parent company of Truist Bank and other subsidiaries
|
||||
|
PCD
|
Purchased credit deteriorated loans
|
||||
|
PCI
|
Purchased credit impaired loans
|
||||
| PPP | Paycheck Protection Program, established by the CARES Act | ||||
| Re-REMICs | Re-securitizations of Real Estate Mortgage Investment Conduits | ||||
|
ROU assets
|
Right-of-use assets
|
||||
|
RUFC
|
Reserve for unfunded lending commitments
|
||||
|
SBIC
|
Small Business Investment Company
|
||||
| SCB | Stress Capital Buffer | ||||
| SOFR |
Secured Overnight Financing Rate
|
||||
| SunTrust |
SunTrust Banks, Inc.
|
||||
|
TDR
|
Troubled debt restructuring
|
||||
|
TE
|
Taxable-equivalent
|
||||
| TRS | Total Return Swap | ||||
|
Truist
|
Truist Financial Corporation and its subsidiaries (interchangeable with the “Company” above), formerly BB&T Corporation
|
||||
| Truist Bank | Truist Bank, formerly Branch Banking and Trust Company | ||||
|
U.S.
|
United States of America
|
||||
|
U.S. Treasury
|
United States Department of the Treasury
|
||||
|
UPB
|
Unpaid principal balance
|
||||
|
VaR
|
Value-at-risk
|
||||
| VIE |
Variable interest entity
|
||||
2 Truist Financial Corporation
Forward-Looking Statements
This Quarterly Report on Form 10-Q contains “forward-looking statements” within the meaning of the Private Securities Litigation Reform Act of 1995, regarding the financial condition, results of operations, business plans and the future performance of Truist. Words such as “anticipates,” “believes,” “estimates,” “expects,” “forecasts,” “intends,” “plans,” “projects,” “may,” “will,” “should,” “would,” “could” and other similar expressions are intended to identify these forward-looking statements.
Forward-looking statements are not based on historical facts but instead represent management’s expectations and assumptions regarding Truist’s business, the economy, and other future conditions. Such statements involve inherent uncertainties, risks, and changes in circumstances that are difficult to predict. As such, Truist’s actual results may differ materially from those contemplated by forward-looking statements. While there can be no assurance that any list of risks and uncertainties or risk factors is complete, important factors that could cause actual results to differ materially from those contemplated by forward-looking statements include the following, without limitation, as well as the risks and uncertainties more fully discussed in Part II, Item 1A-Risk Factors in this report and Part I, Item 1A-Risk Factors in Truist’s Form 10-K for the year ended December 31, 2020:
•
risks and uncertainties relating to the Merger of heritage BB&T and heritage SunTrust, including the ability to successfully integrate the companies or to realize the anticipated benefits of the Merger;
•
expenses relating to the Merger and integration of heritage BB&T and heritage SunTrust;
•
deposit attrition, client loss or revenue loss following completed mergers or acquisitions may be greater than anticipated;
•
the COVID-19 pandemic has disrupted the global economy, adversely impacted Truist’s financial condition, and results of operations, including through increased expenses, reduced fee income and net interest margin and increases in the allowance for credit losses, and continuation of current conditions could worsen these impacts and also adversely affect Truist’s capital and liquidity position or cost of capital, impair the ability of borrowers to repay outstanding loans, cause an outflow of deposits, and impair goodwill or other assets;
•
Truist is subject to credit risk by lending or committing to lend money, and may have more credit risk and higher credit losses to the extent that loans are concentrated by loan type, industry segment, borrower type or location of the borrower or collateral;
•
changes in the interest rate environment, including the replacement of LIBOR as an interest rate benchmark and potentially negative interest rates, which could adversely affect Truist’s revenue and expenses, the value of assets and obligations, and the availability and cost of capital, cash flows, and liquidity;
•
inability to access short-term funding or liquidity, loss of client deposits or changes in Truist’s credit ratings, which could increase the cost of funding or limit access to capital markets;
•
risk management oversight functions may not identify or address risks adequately, and management may not be able to effectively manage credit risk;
•
risks resulting from the extensive use of models in Truist’s business, which may impact decisions made by management and regulators;
•
failure to execute on strategic or operational plans, including the ability to successfully complete or integrate mergers and acquisitions;
•
increased competition, including from (i) new or existing competitors that could have greater financial resources or be subject to different regulatory standards, and (ii) products and services offered by non-bank financial technology companies, may reduce Truist’s client base, cause Truist to lower prices for its products and services in order to maintain market share or otherwise adversely impact Truist’s businesses or results of operations;
•
failure to maintain or enhance Truist’s competitive position with respect to new products, services and technology, whether it fails to anticipate client expectations or because its technological developments fail to perform as desired or do not achieve market acceptance or regulatory approval or for other reasons, may cause Truist to lose market share or incur additional expense;
•
negative public opinion, which could damage Truist’s reputation;
•
increased scrutiny regarding Truist’s consumer sales practices, training practices, incentive compensation design, and governance;
•
regulatory matters, litigation or other legal actions, which may result in, among other things, costs, fines, penalties, restrictions on Truist’s business activities, reputational harm, negative publicity, or other adverse consequences;
•
evolving legislative, accounting and regulatory standards, including with respect to capital and liquidity requirements, and results of regulatory examinations may adversely affect Truist’s financial condition and results of operations;
•
the monetary and fiscal policies of the federal government and its agencies could have a material adverse effect on profitability;
•
accounting policies and processes require management to make estimates about matters that are uncertain, including the potential write down to goodwill if there is an elongated period of decline in market value for Truist’s stock and adverse economic conditions are sustained over a period of time;
•
general economic or business conditions, either globally, nationally or regionally, may be less favorable than expected, and instability in global geopolitical matters or volatility in financial markets could result in, among other things, slower deposit or asset growth, a deterioration in credit quality, or a reduced demand for credit, insurance, or other services;
•
risks related to originating and selling mortgages, including repurchase and indemnity demands from purchasers related to representations and warranties on loans sold, which could result in an increase in the amount of losses for loan repurchases;
•
risks relating to Truist’s role as a loan servicer, including an increase in the scope or costs of the services Truist is required to perform, without any corresponding increase in servicing fees or a breach of Truist’s obligations as servicer;
•
Truist’s success depends on hiring and retaining key personnel, and if these individuals leave or change roles without effective replacements, Truist’s operations and integration activities could be adversely impacted, which could be exacerbated as Truist continues to integrate the management teams of heritage BB&T and heritage SunTrust;
•
fraud or misconduct by internal or external parties, which Truist may not be able to prevent, detect, or mitigate;
•
security risks, including denial of service attacks, hacking, social engineering attacks targeting Truist’s teammates and clients, malware intrusion, data corruption attempts, system breaches, cyber attacks, and identity theft, could result in the disclosure of confidential information, adversely affect Truist’s business or reputation or create significant legal or financial exposure; and
•
widespread outages of operational, communication, or other systems, whether internal or provided by third parties, natural or other disasters (including acts of terrorism and pandemics), and the effects of climate change could have an adverse effect on Truist’s financial condition and results of operations, lead to material disruption of Truist’s operations or the ability or willingness of clients to access Truist’s products and services.
Readers are cautioned not to place undue reliance on these forward-looking statements, which speak only as of the date they are made. Except to the extent required by applicable law or regulation, Truist undertakes no obligation to revise or update any forward-looking statements.
Truist Financial Corporation 3
ITEM 1. FINANCIAL STATEMENTS
CONSOLIDATED BALANCE SHEETS
TRUIST FINANCIAL CORPORATION AND SUBSIDIARIES
|
Unaudited
(Dollars in millions, except per share data, shares in thousands) |
March 31, 2021 | December 31, 2020 | |||||||||
| Assets | |||||||||||
| Cash and due from banks | $ |
|
$ |
|
|||||||
| Interest-bearing deposits with banks |
|
|
|||||||||
| Securities borrowed or purchased under resale agreements |
|
|
|||||||||
| Trading assets at fair value |
|
|
|||||||||
| AFS securities at fair value |
|
|
|||||||||
| LHFS (including $5,465 and $4,955 at fair value, respectively) |
|
|
|||||||||
| Loans and leases |
|
|
|||||||||
| ALLL |
(
|
(
|
|||||||||
| Loans and leases, net of ALLL |
|
|
|||||||||
| Premises and equipment |
|
|
|||||||||
| Goodwill |
|
|
|||||||||
| CDI and other intangible assets |
|
|
|||||||||
| MSRs at fair value |
|
|
|||||||||
| Other assets (including $3,801 and $4,891 at fair value, respectively) |
|
|
|||||||||
| Total assets | $ |
|
$ |
|
|||||||
| Liabilities | |||||||||||
| Noninterest-bearing deposits | $ |
|
$ |
|
|||||||
| Interest-bearing deposits |
|
|
|||||||||
| Short-term borrowings (including $1,313 and $1,115 at fair value, respectively) |
|
|
|||||||||
| Long-term debt |
|
|
|||||||||
| Other liabilities (including $704 and $555 at fair value, respectively) |
|
|
|||||||||
| Total liabilities |
|
|
|||||||||
| Shareholders’ Equity | |||||||||||
| Preferred stock, $5 par value, liquidation preference of $25,000 per share |
|
|
|||||||||
| Common stock, $5 par value |
|
|
|||||||||
| Additional paid-in capital |
|
|
|||||||||
| Retained earnings |
|
|
|||||||||
| AOCI, net of deferred income taxes |
(
|
|
|||||||||
| Noncontrolling interests |
|
|
|||||||||
| Total shareholders’ equity |
|
|
|||||||||
| Total liabilities and shareholders’ equity | $ |
|
$ |
|
|||||||
| Common shares outstanding |
|
|
|||||||||
| Common shares authorized |
|
|
|||||||||
| Preferred shares outstanding |
|
|
|||||||||
| Preferred shares authorized |
|
|
|||||||||
The accompanying notes are an integral part of these consolidated financial statements.
4 Truist Financial Corporation
CONSOLIDATED STATEMENTS OF INCOME
TRUIST FINANCIAL CORPORATION AND SUBSIDIARIES
|
Unaudited
Three Months Ended March 31, (Dollars in millions, except per share data, shares in thousands) |
2021 | 2020 | ||||||||||||
| Interest Income | ||||||||||||||
| Interest and fees on loans and leases | $ |
|
$ |
|
||||||||||
| Interest on securities |
|
|
||||||||||||
| Interest on other earning assets |
|
|
||||||||||||
| Total interest income |
|
|
||||||||||||
| Interest Expense | ||||||||||||||
| Interest on deposits |
|
|
||||||||||||
| Interest on long-term debt |
|
|
||||||||||||
| Interest on other borrowings |
|
|
||||||||||||
| Total interest expense |
|
|
||||||||||||
| Net Interest Income |
|
|
||||||||||||
| Provision for credit losses |
|
|
||||||||||||
| Net Interest Income After Provision for Credit Losses |
|
|
||||||||||||
| Noninterest Income | ||||||||||||||
| Insurance income |
|
|
||||||||||||
| Wealth management income |
|
|
||||||||||||
| Service charges on deposits |
|
|
||||||||||||
| Residential mortgage income |
|
|
||||||||||||
| Investment banking and trading income |
|
|
||||||||||||
| Card and payment related fees |
|
|
||||||||||||
| Lending related fees |
|
|
||||||||||||
| Operating lease income |
|
|
||||||||||||
| Commercial real estate related income |
|
|
||||||||||||
| Income from bank-owned life insurance |
|
|
||||||||||||
| Securities gains (losses) |
|
(
|
||||||||||||
| Other income (loss) |
|
(
|
||||||||||||
| Total noninterest income |
|
|
||||||||||||
| Noninterest Expense | ||||||||||||||
| Personnel expense |
|
|
||||||||||||
| Professional fees and outside processing |
|
|
||||||||||||
| Net occupancy expense |
|
|
||||||||||||
| Software expense |
|
|
||||||||||||
| Amortization of intangibles |
|
|
||||||||||||
| Equipment expense |
|
|
||||||||||||
| Marketing and customer development |
|
|
||||||||||||
| Operating lease depreciation |
|
|
||||||||||||
| Loan-related expense |
|
|
||||||||||||
| Regulatory costs |
|
|
||||||||||||
| Merger-related and restructuring charges |
|
|
||||||||||||
| Loss (gain) on early extinguishment of debt |
(
|
|
||||||||||||
| Other expense |
|
|
||||||||||||
| Total noninterest expense |
|
|
||||||||||||
| Earnings | ||||||||||||||
| Income before income taxes |
|
|
||||||||||||
| Provision for income taxes |
|
|
||||||||||||
| Net income |
|
|
||||||||||||
| Noncontrolling interests |
(
|
|
||||||||||||
| Net income available to the bank holding company |
|
|
||||||||||||
| Preferred stock dividends and other |
|
|
||||||||||||
| Net income available to common shareholders | $ |
|
$ |
|
||||||||||
| Basic EPS | $ |
|
$ |
|
||||||||||
| Diluted EPS |
|
|
||||||||||||
| Basic weighted average shares outstanding |
|
|
||||||||||||
| Diluted weighted average shares outstanding |
|
|
||||||||||||
The accompanying notes are an integral part of these consolidated financial statements.
Truist Financial Corporation 5
CONSOLIDATED STATEMENTS OF COMPREHENSIVE INCOME
TRUIST FINANCIAL CORPORATION AND SUBSIDIARIES
|
Unaudited
Three Months Ended March 31, (Dollars in millions) |
2021 | 2020 | |||||||||
| Net income | $ |
|
$ |
|
|||||||
| OCI, net of tax: | |||||||||||
| Net change in net pension and postretirement costs |
|
|
|||||||||
| Net change in cash flow hedges |
|
|
|||||||||
| Net change in AFS securities |
(
|
|
|||||||||
| Other, net |
|
(
|
|||||||||
| Total OCI, net of tax |
(
|
|
|||||||||
| Total comprehensive income | $ |
(
|
$ |
|
|||||||
| Income Tax Effect of Items Included in OCI: | |||||||||||
| Net change in net pension and postretirement costs | $ |
|
$ |
|
|||||||
| Net change in cash flow hedges |
|
|
|||||||||
| Net change in AFS securities |
(
|
|
|||||||||
| Total income taxes related to OCI | $ |
(
|
$ |
|
|||||||
The accompanying notes are an integral part of these consolidated financial statements.
6 Truist Financial Corporation
CONSOLIDATED STATEMENTS OF CHANGES IN SHAREHOLDERS’ EQUITY
TRUIST FINANCIAL CORPORATION AND SUBSIDIARIES
|
Unaudited
(Dollars in millions, shares in thousands) |
Shares of Common Stock | Preferred Stock | Common Stock | Additional Paid-In Capital | Retained Earnings | AOCI | Noncontrolling Interests | Total Shareholders’ Equity | |||||||||||||||||||||||||||||||||||||||
| Balance, January 1, 2020 |
|
$ |
|
$ |
|
$ |
|
$ |
|
$ |
(
|
$ |
|
$ |
|
||||||||||||||||||||||||||||||||
| Net income | — | — | — | — |
|
— |
|
|
|||||||||||||||||||||||||||||||||||||||
| OCI | — | — | — | — | — |
|
— |
|
|||||||||||||||||||||||||||||||||||||||
| Issued in connection with equity awards, net |
|
— |
|
(
|
(
|
— | — |
(
|
|||||||||||||||||||||||||||||||||||||||
| Redemption of preferred stock | — |
(
|
— | — |
|
— | — |
(
|
|||||||||||||||||||||||||||||||||||||||
| Cash dividends declared on common stock | — | — | — | — |
(
|
— | — |
(
|
|||||||||||||||||||||||||||||||||||||||
| Cash dividends declared on preferred stock | — | — | — | — |
(
|
— | — |
(
|
|||||||||||||||||||||||||||||||||||||||
| Equity-based compensation expense | — | — | — |
|
— | — | — |
|
|||||||||||||||||||||||||||||||||||||||
| Cumulative effect adjustment for new accounting standards | — | — | — | — |
(
|
— | — |
(
|
|||||||||||||||||||||||||||||||||||||||
| Other, net | — | — | — |
|
|
— |
(
|
(
|
|||||||||||||||||||||||||||||||||||||||
| Balance, March 31, 2020 |
|
$ |
|
$ |
|
$ |
|
$ |
|
$ |
|
$ |
|
$ |
|
||||||||||||||||||||||||||||||||
| Balance, January 1, 2021 |
|
$ |
|
$ |
|
$ |
|
$ |
|
$ |
|
$ |
|
$ |
|
||||||||||||||||||||||||||||||||
| Net income | — | — | — | — |
|
— |
(
|
|
|||||||||||||||||||||||||||||||||||||||
| OCI | — | — | — | — | — |
(
|
— |
(
|
|||||||||||||||||||||||||||||||||||||||
| Issued in connection with equity awards, net |
|
— |
|
(
|
— | — | — |
(
|
|||||||||||||||||||||||||||||||||||||||
| Repurchase of common stock |
(
|
— |
(
|
(
|
— | — | — |
(
|
|||||||||||||||||||||||||||||||||||||||
| Redemption of preferred stock | — |
(
|
— | — |
(
|
— | — |
(
|
|||||||||||||||||||||||||||||||||||||||
| Cash dividends declared on common stock | — | — | — | — |
(
|
— | — |
(
|
|||||||||||||||||||||||||||||||||||||||
| Cash dividends declared on preferred stock | — | — | — | — |
(
|
— | — |
(
|
|||||||||||||||||||||||||||||||||||||||
| Equity-based compensation expense | — | — | — |
|
— | — | — |
|
|||||||||||||||||||||||||||||||||||||||
| Other, net | — | — | — | — | — | — |
(
|
(
|
|||||||||||||||||||||||||||||||||||||||
| Balance, March 31, 2021 |
|
$ |
|
$ |
|
$ |
|
$ |
|
$ |
(
|
$ |
|
$ |
|
||||||||||||||||||||||||||||||||
The accompanying notes are an integral part of these consolidated financial statements.
Truist Financial Corporation 7
CONSOLIDATED STATEMENTS OF CASH FLOWS
TRUIST FINANCIAL CORPORATION AND SUBSIDIARIES
|
Unaudited
Three Months Ended March 31, (Dollars in millions) |
2021 | 2020 | ||||||||||||
| Cash Flows From Operating Activities: | ||||||||||||||
| Net income | $ |
|
$ |
|
||||||||||
| Adjustments to reconcile net income to net cash from operating activities: | ||||||||||||||
| Provision for credit losses |
|
|
||||||||||||
| Depreciation |
|
|
||||||||||||
| Amortization of intangibles |
|
|
||||||||||||
| Equity-based compensation expense |
|
|
||||||||||||
| Securities (gains) losses |
|
|
||||||||||||
| Net change in operating assets and liabilities: | ||||||||||||||
| LHFS |
(
|
|
||||||||||||
| MSRs |
(
|
|
||||||||||||
| Pension asset |
(
|
(
|
||||||||||||
| Derivative assets and liabilities |
|
(
|
||||||||||||
| Trading assets |
(
|
|
||||||||||||
| Other assets and other liabilities |
(
|
(
|
||||||||||||
| Other, net |
|
|
||||||||||||
| Net cash from operating activities |
(
|
|
||||||||||||
| Cash Flows From Investing Activities: | ||||||||||||||
| Proceeds from sales of AFS securities |
|
|
||||||||||||
| Proceeds from maturities, calls and paydowns of AFS securities |
|
|
||||||||||||
| Purchases of AFS securities |
(
|
(
|
||||||||||||
| Originations and purchases of loans and leases, net of sales and principal collected |
|
(
|
||||||||||||
| Net cash received (paid) for FHLB stock |
|
(
|
||||||||||||
| Net cash paid for premises and equipment |
(
|
(
|
||||||||||||
| Net cash received (paid) for mergers, acquisitions and divestitures |
|
(
|
||||||||||||
| Other, net |
|
(
|
||||||||||||
| Net cash from investing activities |
|
(
|
||||||||||||
| Cash Flows From Financing Activities: | ||||||||||||||
| Net change in deposits |
|
|
||||||||||||
| Net change in short-term borrowings |
(
|
(
|
||||||||||||
| Proceeds from issuance of long-term debt |
|
|
||||||||||||
| Repayment of long-term debt |
(
|
(
|
||||||||||||
| Repurchase of common stock |
(
|
|
||||||||||||
| Redemption of preferred stock |
(
|
(
|
||||||||||||
| Cash dividends paid on common stock |
(
|
(
|
||||||||||||
| Cash dividends paid on preferred stock |
(
|
(
|
||||||||||||
| Other, net |
(
|
(
|
||||||||||||
| Net cash from financing activities |
|
|
||||||||||||
| Net Change in Cash and Cash Equivalents |
|
|
||||||||||||
| Cash and Cash Equivalents, January 1 |
|
|
||||||||||||
| Cash and Cash Equivalents, March 31 | $ |
|
$ |
|
||||||||||
| Supplemental Disclosure of Cash Flow Information: | ||||||||||||||
| Net cash paid (received) during the period for: | ||||||||||||||
| Interest expense | $ |
|
$ |
|
||||||||||
| Income taxes |
|
|
||||||||||||
The accompanying notes are an integral part of these consolidated financial statements.
8 Truist Financial Corporation
NOTE 1.
Basis of Presentation
General
See the Glossary of Defined Terms at the beginning of this Report for terms used herein. These consolidated financial statements and notes are presented in accordance with the instructions for Form 10-Q, and, therefore, do not include all information and notes necessary for a complete presentation of financial position, results of operations, and cash flow activity required in accordance with GAAP. In the opinion of management, all normal recurring adjustments necessary for a fair statement of the consolidated financial position and consolidated results of operations have been made. The year-end consolidated balance sheet data was derived from audited annual financial statements but does not contain all of the footnote disclosures from the annual financial statements. The information contained in the financial statements and notes included in the Annual Report on Form 10-K for the year ended December 31, 2020 should be referred to in connection with these unaudited interim consolidated financial statements. There were no significant changes to the Company’s accounting policies from those disclosed in the Annual Report on Form 10-K for the year ended December 31, 2020 that could have a material effect on the Company’s financial statements.
Reclassifications
Certain amounts reported in prior periods’ consolidated financial statements have been reclassified to conform to the current presentation.
Use of Estimates in the Preparation of Financial Statements
The preparation of financial statements in conformity with GAAP requires management to make estimates and assumptions that affect the reported amounts of assets and liabilities and disclosure of contingent assets and liabilities as of the date of the financial statements, and the reported amounts of revenues and expenses. Actual results could differ from those estimates. Material estimates that are particularly susceptible to significant change include the determination of the ACL; determination of fair value for financial instruments; valuation of MSRs; goodwill, intangible assets and other purchase accounting related adjustments; benefit plan obligations and expenses; and tax assets, liabilities, and expense.
Changes in Accounting Principles and Effects of New Accounting Pronouncements
There were no standards adopted during the current year that had a material effect on the Company’s financial statements, and no standards not yet adopted by the Company that are expected to have a material effect on the Company’s financial statements.
Truist Financial Corporation 9
NOTE 2.
Securities Financing Activities
Securities purchased under resale agreements are primarily collateralized by U.S. government or agency securities and are carried at the amounts at which the securities will be subsequently sold, plus accrued interest. Securities borrowed are primarily collateralized by corporate securities. The Company borrows securities and purchases securities under agreements to resell as part of its securities financing activities. On the acquisition date of these securities, the Company and the related counterparty agree on the amount of collateral required to secure the principal amount loaned under these arrangements. The Company monitors collateral values daily and calls for additional collateral to be provided as warranted under the respective agreements. At March 31, 2021 and December 31, 2020, the total market value of collateral held was $
1.3
billion and $
1.7
billion, of which amounts repledged were immaterial at March 31, 2021 and $
27
million at December 31, 2020.
The following table presents securities borrowed or purchased under resale agreements:
| (Dollars in millions) | Mar 31, 2021 | Dec 31, 2020 | ||||||||||||
| Securities purchased under resale agreements | $ |
|
$ |
|
||||||||||
| Securities borrowed |
|
|
||||||||||||
| Total securities borrowed or purchased under resale agreements | $ |
|
$ |
|
||||||||||
For securities sold under agreements to repurchase, the Company would be obligated to provide additional collateral in the event of a significant decline in fair value of the collateral pledged. This risk is managed by monitoring the liquidity and credit quality of the collateral, as well as the maturity profile of the transactions. Refer to “Note 13. Commitments and Contingencies” for additional information related to pledged securities. Securities sold under agreements to repurchase are accounted for as secured borrowings.
The following table presents the Company’s related activity, by collateral type and remaining contractual maturity:
| March 31, 2021 | December 31, 2020 | ||||||||||||||||||||||||||||||||||
| (Dollars in millions) | Overnight and Continuous | Up to 30 days | Total | Overnight and Continuous | Up to 30 days | Total | |||||||||||||||||||||||||||||
| U.S. Treasury | $ |
|
$ |
|
$ |
|
$ |
|
$ |
|
$ |
|
|||||||||||||||||||||||
| GSE |
|
|
|
|
|
|
|||||||||||||||||||||||||||||
| Agency MBS - residential |
|
|
|
|
|
|
|||||||||||||||||||||||||||||
| Corporate and other debt securities |
|
|
|
|
|
|
|||||||||||||||||||||||||||||
| Total securities sold under agreements to repurchase | $ |
|
$ |
|
$ |
|
$ |
|
$ |
|
$ |
|
|||||||||||||||||||||||
There were no securities financing transactions subject to legally enforceable master netting arrangements that were eligible for balance sheet netting for the periods presented.
NOTE 3.
Investment Securities
The following tables summarize the Company’s AFS securities:
|
March 31, 2021
(Dollars in millions) |
Amortized Cost | Gross Unrealized | Fair Value | |||||||||||||||||||||||
| Gains | Losses | |||||||||||||||||||||||||
| AFS securities: | ||||||||||||||||||||||||||
| U.S. Treasury | $ |
|
$ |
|
$ |
|
$ |
|
||||||||||||||||||
| GSE |
|
|
|
|
||||||||||||||||||||||
| Agency MBS - residential |
|
|
|
|
||||||||||||||||||||||
| Agency MBS - commercial |
|
|
|
|
||||||||||||||||||||||
| States and political subdivisions |
|
|
|
|
||||||||||||||||||||||
| Other |
|
|
|
|
||||||||||||||||||||||
| Total AFS securities | $ |
|
$ |
|
$ |
|
$ |
|
||||||||||||||||||
|
December 31, 2020
(Dollars in millions) |
Amortized Cost | Gross Unrealized | Fair Value | |||||||||||||||||||||||
| Gains | Losses | |||||||||||||||||||||||||
| AFS securities: | ||||||||||||||||||||||||||
| U.S. Treasury | $ |
|
$ |
|
$ |
|
$ |
|
||||||||||||||||||
| GSE |
|
|
|
|
||||||||||||||||||||||
| Agency MBS - residential |
|
|
|
|
||||||||||||||||||||||
| Agency MBS - commercial |
|
|
|
|
||||||||||||||||||||||
| States and political subdivisions |
|
|
|
|
||||||||||||||||||||||
| Other |
|
|
|
|
||||||||||||||||||||||
| Total AFS securities | $ |
|
$ |
|
$ |
|
$ |
|
||||||||||||||||||
10 Truist Financial Corporation
Certain securities issued by FNMA and FHLMC exceeded 10 percent of shareholders’ equity at March 31, 2021. The FNMA investments had total amortized cost and fair value of $
33.6
billion and $
33.0
billion, respectively. The FHLMC investments had total amortized cost and fair value of $
33.7
billion and $
32.9
billion, respectively.
The amortized cost and estimated fair value of the securities portfolio by contractual maturity are shown in the following table. The expected life of MBS may differ from contractual maturities because borrowers may have the right to prepay their obligations with or without penalties.
| Amortized Cost | Fair Value | ||||||||||||||||||||||||||||||||||||||||||||||||||||||||||
|
March 31, 2021
(Dollars in millions) |
Due in one year or less | Due after one year through five years | Due after five years through ten years | Due after ten years | Total | Due in one year or less | Due after one year through five years | Due after five years through ten years | Due after ten years | Total | |||||||||||||||||||||||||||||||||||||||||||||||||
| AFS securities: | |||||||||||||||||||||||||||||||||||||||||||||||||||||||||||
| U.S. Treasury | $ |
|
$ |
|
$ |
|
$ |
|
$ |
|
$ |
|
$ |
|
$ |
|
$ |
|
$ |
|
|||||||||||||||||||||||||||||||||||||||
| GSE |
|
|
|
|
|
|
|
|
|
|
|||||||||||||||||||||||||||||||||||||||||||||||||
| Agency MBS - residential |
|
|
|
|
|
|
|
|
|
|
|||||||||||||||||||||||||||||||||||||||||||||||||
| Agency MBS - commercial |
|
|
|
|
|
|
|
|
|
|
|||||||||||||||||||||||||||||||||||||||||||||||||
| States and political subdivisions |
|
|
|
|
|
|
|
|
|
|
|||||||||||||||||||||||||||||||||||||||||||||||||
| Other |
|
|
|
|
|
|
|
|
|
|
|||||||||||||||||||||||||||||||||||||||||||||||||
| Total AFS securities | $ |
|
$ |
|
$ |
|
$ |
|
$ |
|
$ |
|
$ |
|
$ |
|
$ |
|
$ |
|
|||||||||||||||||||||||||||||||||||||||
The following tables present the fair values and gross unrealized losses of investments based on the length of time that individual securities have been in a continuous unrealized loss position:
| Less than 12 months | 12 months or more | Total | |||||||||||||||||||||||||||||||||
|
March 31, 2021
(Dollars in millions) |
Fair Value | Unrealized Losses | Fair Value | Unrealized Losses | Fair Value | Unrealized Losses | |||||||||||||||||||||||||||||
| AFS securities: | |||||||||||||||||||||||||||||||||||
| U.S. Treasury | $ |
|
$ |
|
$ |
|
$ |
|
$ |
|
$ |
|
|||||||||||||||||||||||
| GSE |
|
|
|
|
|
|
|||||||||||||||||||||||||||||
| Agency MBS - residential |
|
|
|
|
|
|
|||||||||||||||||||||||||||||
| Agency MBS - commercial |
|
|
|
|
|
|
|||||||||||||||||||||||||||||
| States and political subdivisions |
|
|
|
|
|
|
|||||||||||||||||||||||||||||
| Total | $ |
|
$ |
|
$ |
|
$ |
|
$ |
|
$ |
|
|||||||||||||||||||||||
| Less than 12 months | 12 months or more | Total | |||||||||||||||||||||||||||||||||
|
December 31, 2020
(Dollars in millions) |
Fair Value | Unrealized Losses | Fair Value | Unrealized Losses | Fair Value | Unrealized Losses | |||||||||||||||||||||||||||||
| AFS securities: | |||||||||||||||||||||||||||||||||||
| U.S. Treasury | $ |
|
$ |
|
$ |
|
$ |
|
$ |
|
$ |
|
|||||||||||||||||||||||
| Agency MBS - residential |
|
|
|
|
|
|
|||||||||||||||||||||||||||||
| Agency MBS - commercial |
|
|
|
|
|
|
|||||||||||||||||||||||||||||
| States and political subdivisions |
|
|
|
|
|
|
|||||||||||||||||||||||||||||
| Other |
|
|
|
|
|
|
|||||||||||||||||||||||||||||
| Total | $ |
|
$ |
|
$ |
|
$ |
|
$ |
|
$ |
|
|||||||||||||||||||||||
At March 31, 2021,
no
ACL was established for AFS securities. Substantially all of the unrealized losses on the securities portfolio were the result of changes in market interest rates compared to the date the securities were acquired rather than the credit quality of the issuers or underlying loans.
The following table presents gross securities gains and losses recognized in earnings:
|
Three Months Ended March 31,
(Dollars in millions) |
2021 | 2020 | ||||||||||||
| Gross realized gains | $ |
|
$ |
|
||||||||||
| Gross realized losses |
|
(
|
||||||||||||
| Securities gains (losses), net | $ |
|
$ |
(
|
||||||||||
Truist Financial Corporation 11
NOTE 4.
Loans and ACL
The following tables present loans and leases HFI by aging category. Government guaranteed loans are not placed on nonaccrual status regardless of delinquency because collection of principal and interest is reasonably assured. The past due status of loans that received a deferral under the CARES Act is generally frozen during the deferral period. In certain limited circumstances, accommodation programs result in the delinquency status being reset to current.
| Accruing | ||||||||||||||||||||||||||||||||
|
March 31, 2021
(Dollars in millions) |
Current | 30-89 Days Past Due | 90 Days Or More Past Due | Nonperforming | Total | |||||||||||||||||||||||||||
| Commercial: | ||||||||||||||||||||||||||||||||
| Commercial and industrial | $ |
|
$ |
|
$ |
|
$ |
|
$ |
|
||||||||||||||||||||||
| CRE |
|
|
|
|
|
|||||||||||||||||||||||||||
| Commercial construction |
|
|
|
|
|
|||||||||||||||||||||||||||
| Lease financing |
|
|
|
|
|
|||||||||||||||||||||||||||
| Consumer: | ||||||||||||||||||||||||||||||||
| Residential mortgage |
|
|
|
|
|
|||||||||||||||||||||||||||
| Residential home equity and direct |
|
|
|
|
|
|||||||||||||||||||||||||||
| Indirect auto |
|
|
|
|
|
|||||||||||||||||||||||||||
| Indirect other |
|
|
|
|
|
|||||||||||||||||||||||||||
| Student |
|
|
|
|
|
|||||||||||||||||||||||||||
| Credit card |
|
|
|
|
|
|||||||||||||||||||||||||||
| Total | $ |
|
$ |
|
$ |
|
$ |
|
$ |
|
||||||||||||||||||||||
| Accruing | ||||||||||||||||||||||||||||||||
|
December 31, 2020
(Dollars in millions) |
Current | 30-89 Days Past Due | 90 Days Or More Past Due | Nonperforming | Total | |||||||||||||||||||||||||||
| Commercial: | ||||||||||||||||||||||||||||||||
| Commercial and industrial | $ |
|
$ |
|
$ |
|
$ |
|
$ |
|
||||||||||||||||||||||
| CRE |
|
|
|
|
|
|||||||||||||||||||||||||||
| Commercial construction |
|
|
|
|
|
|||||||||||||||||||||||||||
| Lease financing |
|
|
|
|
|
|||||||||||||||||||||||||||
| Consumer: | ||||||||||||||||||||||||||||||||
| Residential mortgage |
|
|
|
|
|
|||||||||||||||||||||||||||
| Residential home equity and direct |
|
|
|
|
|
|||||||||||||||||||||||||||
| Indirect auto |
|
|
|
|
|
|||||||||||||||||||||||||||
| Indirect other |
|
|
|
|
|
|||||||||||||||||||||||||||
| Student |
|
|
|
|
|
|||||||||||||||||||||||||||
| Credit card |
|
|
|
|
|
|||||||||||||||||||||||||||
| Total | $ |
|
$ |
|
$ |
|
$ |
|
$ |
|
||||||||||||||||||||||
12 Truist Financial Corporation
The following table presents the amortized cost basis of loans by origination year and credit quality indicator:
|
March 31, 2021
(Dollars in millions) |
Amortized Cost Basis by Origination Year | Revolving Credit | Loans Converted to Term | Other (1) | |||||||||||||||||||||||||||||||||||||||||||||||||||||||
| 2021 | 2020 | 2019 | 2018 | 2017 | Prior | Total | |||||||||||||||||||||||||||||||||||||||||||||||||||||
| Commercial: | |||||||||||||||||||||||||||||||||||||||||||||||||||||||||||
| Commercial and industrial: | |||||||||||||||||||||||||||||||||||||||||||||||||||||||||||
| Pass | $ |
|
$ |
|
$ |
|
$ |
|
$ |
|
$ |
|
$ |
|
$ |
|
$ |
(
|
$ |
|
|||||||||||||||||||||||||||||||||||||||
| Special mention |
|
|
|
|
|
|
|
|
|
|
|||||||||||||||||||||||||||||||||||||||||||||||||
| Substandard |
|
|
|
|
|
|
|
|
(
|
|
|||||||||||||||||||||||||||||||||||||||||||||||||
| Nonperforming |
|
|
|
|
|
|
|
|
|
|
|||||||||||||||||||||||||||||||||||||||||||||||||
| Total |
|
|
|
|
|
|
|
|
(
|
|
|||||||||||||||||||||||||||||||||||||||||||||||||
| CRE: | |||||||||||||||||||||||||||||||||||||||||||||||||||||||||||
| Pass |
|
|
|
|
|
|
|
|
(
|
|
|||||||||||||||||||||||||||||||||||||||||||||||||
| Special mention |
|
|
|
|
|
|
|
|
|
|
|||||||||||||||||||||||||||||||||||||||||||||||||
| Substandard |
|
|
|
|
|
|
|
|
|
|
|||||||||||||||||||||||||||||||||||||||||||||||||
| Nonperforming |
|
|
|
|
|
|
|
|
|
|
|||||||||||||||||||||||||||||||||||||||||||||||||
| Total |
|
|
|
|
|
|
|
|
(
|
|
|||||||||||||||||||||||||||||||||||||||||||||||||
| Commercial construction: | |||||||||||||||||||||||||||||||||||||||||||||||||||||||||||
| Pass |
|
|
|
|
|
|
|
|
|
|
|||||||||||||||||||||||||||||||||||||||||||||||||
| Special mention |
|
|
|
|
|
|
|
|
|
|
|||||||||||||||||||||||||||||||||||||||||||||||||
| Substandard |
|
|
|
|
|
|
|
|
|
|
|||||||||||||||||||||||||||||||||||||||||||||||||
| Nonperforming |
|
|
|
|
|
|
|
|
|
|
|||||||||||||||||||||||||||||||||||||||||||||||||
| Total |
|
|
|
|
|
|
|
|
|
|
|||||||||||||||||||||||||||||||||||||||||||||||||
| Lease financing: | |||||||||||||||||||||||||||||||||||||||||||||||||||||||||||
| Pass |
|
|
|
|
|
|
|
|
(
|
|
|||||||||||||||||||||||||||||||||||||||||||||||||
| Special mention |
|
|
|
|
|
|
|
|
|
|
|||||||||||||||||||||||||||||||||||||||||||||||||
| Substandard |
|
|
|
|
|
|
|
|
|
|
|||||||||||||||||||||||||||||||||||||||||||||||||
| Nonperforming |
|
|
|
|
|
|
|
|
|
|
|||||||||||||||||||||||||||||||||||||||||||||||||
| Total |
|
|
|
|
|
|
|
|
(
|
|
|||||||||||||||||||||||||||||||||||||||||||||||||
| Consumer: | |||||||||||||||||||||||||||||||||||||||||||||||||||||||||||
| Residential mortgage: | |||||||||||||||||||||||||||||||||||||||||||||||||||||||||||
| Performing |
|
|
|
|
|
|
|
|
|
|
|||||||||||||||||||||||||||||||||||||||||||||||||
| Nonperforming |
|
|
|
|
|
|
|
|
|
|
|||||||||||||||||||||||||||||||||||||||||||||||||
| Total |
|
|
|
|
|
|
|
|
|
|
|||||||||||||||||||||||||||||||||||||||||||||||||
| Residential home equity and direct: | |||||||||||||||||||||||||||||||||||||||||||||||||||||||||||
| Performing |
|
|
|
|
|
|
|
|
|
|
|||||||||||||||||||||||||||||||||||||||||||||||||
| Nonperforming |
|
|
|
|
|
|
|
|
|
|
|||||||||||||||||||||||||||||||||||||||||||||||||
| Total |
|
|
|
|
|
|
|
|
|
|
|||||||||||||||||||||||||||||||||||||||||||||||||
| Indirect auto: | |||||||||||||||||||||||||||||||||||||||||||||||||||||||||||
| Performing |
|
|
|
|
|
|
|
|
|
|
|||||||||||||||||||||||||||||||||||||||||||||||||
| Nonperforming |
|
|
|
|
|
|
|
|
(
|
|
|||||||||||||||||||||||||||||||||||||||||||||||||
| Total |
|
|
|
|
|
|
|
|
|
|
|||||||||||||||||||||||||||||||||||||||||||||||||
| Indirect other: | |||||||||||||||||||||||||||||||||||||||||||||||||||||||||||
| Performing |
|
|
|
|
|
|
|
|
|
|
|||||||||||||||||||||||||||||||||||||||||||||||||
| Nonperforming |
|
|
|
|
|
|
|
|
|
|
|||||||||||||||||||||||||||||||||||||||||||||||||
| Total |
|
|
|
|
|
|
|
|
|
|
|||||||||||||||||||||||||||||||||||||||||||||||||
| Student |
|
|
|
|
|
|
|
|
(
|
|
|||||||||||||||||||||||||||||||||||||||||||||||||
| Credit card |
|
|
|
|
|
|
|
|
|
|
|||||||||||||||||||||||||||||||||||||||||||||||||
| Total | $ |
|
$ |
|
$ |
|
$ |
|
$ |
|
$ |
|
$ |
|
$ |
|
$ |
(
|
$ |
|
|||||||||||||||||||||||||||||||||||||||
Truist Financial Corporation 13
|
December 31, 2020
(Dollars in millions) |
Amortized Cost Basis by Origination Year | Revolving Credit | Loans Converted to Term | Other (1) | |||||||||||||||||||||||||||||||||||||||||||||||||||||||
| 2020 | 2019 | 2018 | 2017 | 2016 | Prior | Total | |||||||||||||||||||||||||||||||||||||||||||||||||||||
| Commercial: | |||||||||||||||||||||||||||||||||||||||||||||||||||||||||||
| Commercial and industrial: | |||||||||||||||||||||||||||||||||||||||||||||||||||||||||||
| Pass | $ |
|
$ |
|
$ |
|
$ |
|
$ |
|
$ |
|
$ |
|
$ |
|
$ |
(
|
$ |
|
|||||||||||||||||||||||||||||||||||||||
| Special mention |
|
|
|
|
|
|
|
|
(
|
|
|||||||||||||||||||||||||||||||||||||||||||||||||
| Substandard |
|
|
|
|
|
|
|
|
(
|
|
|||||||||||||||||||||||||||||||||||||||||||||||||
| Nonperforming |
|
|
|
|
|
|
|
|
|
|
|||||||||||||||||||||||||||||||||||||||||||||||||
| Total |
|
|
|
|
|
|
|
|
(
|
|
|||||||||||||||||||||||||||||||||||||||||||||||||
| CRE: | |||||||||||||||||||||||||||||||||||||||||||||||||||||||||||
| Pass |
|
|
|
|
|
|
|
|
(
|
|
|||||||||||||||||||||||||||||||||||||||||||||||||
| Special mention |
|
|
|
|
|
|
|
|
|
|
|||||||||||||||||||||||||||||||||||||||||||||||||
| Substandard |
|
|
|
|
|
|
|
|
|
|
|||||||||||||||||||||||||||||||||||||||||||||||||
| Nonperforming |
|
|
|
|
|
|
|
|
|
|
|||||||||||||||||||||||||||||||||||||||||||||||||
| Total |
|
|
|
|
|
|
|
|
(
|
|
|||||||||||||||||||||||||||||||||||||||||||||||||
| Commercial construction: | |||||||||||||||||||||||||||||||||||||||||||||||||||||||||||
| Pass |
|
|
|
|
|
|
|
|
|
|
|||||||||||||||||||||||||||||||||||||||||||||||||
| Special mention |
|
|
|
|
|
|
|
|
|
|
|||||||||||||||||||||||||||||||||||||||||||||||||
| Substandard |
|
|
|
|
|
|
|
|
|
|
|||||||||||||||||||||||||||||||||||||||||||||||||
| Nonperforming |
|
|
|
|
|
|
|
|
|
|
|||||||||||||||||||||||||||||||||||||||||||||||||
| Total |
|
|
|
|
|
|
|
|
|
|
|||||||||||||||||||||||||||||||||||||||||||||||||
| Lease financing: | |||||||||||||||||||||||||||||||||||||||||||||||||||||||||||
| Pass |
|
|
|
|
|
|
|
|
|
|
|||||||||||||||||||||||||||||||||||||||||||||||||
| Special mention |
|
|
|
|
|
|
|
|
|
|
|||||||||||||||||||||||||||||||||||||||||||||||||
| Substandard |
|
|
|
|
|
|
|
|
|
|
|||||||||||||||||||||||||||||||||||||||||||||||||
| Nonperforming |
|
|
|
|
|
|
|
|
|
|
|||||||||||||||||||||||||||||||||||||||||||||||||
| Total |
|
|
|
|
|
|
|
|
|
|
|||||||||||||||||||||||||||||||||||||||||||||||||
| Consumer: | |||||||||||||||||||||||||||||||||||||||||||||||||||||||||||
| Residential mortgage: | |||||||||||||||||||||||||||||||||||||||||||||||||||||||||||
| Performing |
|
|
|
|
|
|
|
|
|
|
|||||||||||||||||||||||||||||||||||||||||||||||||
| Nonperforming |
|
|
|
|
|
|
|
|
|
|
|||||||||||||||||||||||||||||||||||||||||||||||||
| Total |
|
|
|
|
|
|
|
|
|
|
|||||||||||||||||||||||||||||||||||||||||||||||||
| Residential home equity and direct: | |||||||||||||||||||||||||||||||||||||||||||||||||||||||||||
| Performing |
|
|
|
|
|
|
|
|
|
|
|||||||||||||||||||||||||||||||||||||||||||||||||
| Nonperforming |
|
|
|
|
|
|
|
|
|
|
|||||||||||||||||||||||||||||||||||||||||||||||||
| Total |
|
|
|
|
|
|
|
|
|
|
|||||||||||||||||||||||||||||||||||||||||||||||||
| Indirect auto: | |||||||||||||||||||||||||||||||||||||||||||||||||||||||||||
| Performing |
|
|
|
|
|
|
|
|
|
|
|||||||||||||||||||||||||||||||||||||||||||||||||
| Nonperforming |
|
|
|
|
|
|
|
|
(
|
|
|||||||||||||||||||||||||||||||||||||||||||||||||
| Total |
|
|
|
|
|
|
|
|
|
|
|||||||||||||||||||||||||||||||||||||||||||||||||
| Indirect other: | |||||||||||||||||||||||||||||||||||||||||||||||||||||||||||
| Performing |
|
|
|
|
|
|
|
|
|
|
|||||||||||||||||||||||||||||||||||||||||||||||||
| Nonperforming |
|
|
|
|
|
|
|
|
|
|
|||||||||||||||||||||||||||||||||||||||||||||||||
| Total |
|
|
|
|
|
|
|
|
|
|
|||||||||||||||||||||||||||||||||||||||||||||||||
| Student |
|
|
|
|
|
|
|
|
(
|
|
|||||||||||||||||||||||||||||||||||||||||||||||||
| Credit card |
|
|
|
|
|
|
|
|
|
|
|||||||||||||||||||||||||||||||||||||||||||||||||
| Total | $ |
|
$ |
|
$ |
|
$ |
|
$ |
|
$ |
|
$ |
|
$ |
|
$ |
(
|
$ |
|
|||||||||||||||||||||||||||||||||||||||
(1)
Includes certain deferred fees and costs, unapplied payments, and other adjustments.
14 Truist Financial Corporation
ACL
The following tables present activity in the ACL:
| (Dollars in millions) | Balance at Jan 1, 2020 (1) | Charge-Offs | Recoveries | Provision (Benefit) | Other (2) | Balance at Mar 31, 2020 | ||||||||||||||||||||||||||||||||
| Commercial: | ||||||||||||||||||||||||||||||||||||||
| Commercial and industrial | $ |
|
$ |
(
|
$ |
|
$ |
|
$ |
|
$ |
|
||||||||||||||||||||||||||
| CRE |
|
(
|
|
|
|
|
||||||||||||||||||||||||||||||||
| Commercial construction |
|
(
|
|
|
|
|
||||||||||||||||||||||||||||||||
| Lease financing |
|
(
|
|
(
|
|
|
||||||||||||||||||||||||||||||||
| Consumer: | ||||||||||||||||||||||||||||||||||||||
| Residential mortgage |
|
(
|
|
(
|
|
|
||||||||||||||||||||||||||||||||
| Residential home equity and direct |
|
(
|
|
|
|
|
||||||||||||||||||||||||||||||||
| Indirect auto |
|
(
|
|
|
|
|
||||||||||||||||||||||||||||||||
| Indirect other |
|
(
|
|
|
|
|
||||||||||||||||||||||||||||||||
| Student |
|
(
|
|
|
|
|
||||||||||||||||||||||||||||||||
| Credit card |
|
(
|
|
|
|
|
||||||||||||||||||||||||||||||||
| PCI |
|
|
|
|
(
|
|
||||||||||||||||||||||||||||||||
| ALLL |
|
(
|
|
|
|
|
||||||||||||||||||||||||||||||||
| RUFC |
|
|
|
|
|
|
||||||||||||||||||||||||||||||||
| ACL | $ |
|
$ |
(
|
$ |
|
$ |
|
$ |
|
$ |
|
||||||||||||||||||||||||||
| (Dollars in millions) | Balance at Jan 1, 2021 | Charge-Offs | Recoveries | Provision (Benefit) | Other (2) | Balance at Mar 31, 2021 | ||||||||||||||||||||||||||||||||
| Commercial: | ||||||||||||||||||||||||||||||||||||||
| Commercial and industrial | $ |
|
$ |
(
|
$ |
|
$ |
(
|
$ |
|
$ |
|
||||||||||||||||||||||||||
| CRE |
|
(
|
|
(
|
|
|
||||||||||||||||||||||||||||||||
| Commercial construction |
|
(
|
|
(
|
|
|
||||||||||||||||||||||||||||||||
| Lease financing |
|
(
|
|
|
|
|
||||||||||||||||||||||||||||||||
| Consumer: | ||||||||||||||||||||||||||||||||||||||
| Residential mortgage |
|
(
|
|
(
|
|
|
||||||||||||||||||||||||||||||||
| Residential home equity and direct |
|
(
|
|
|
|
|
||||||||||||||||||||||||||||||||
| Indirect auto |
|
(
|
|
|
|
|
||||||||||||||||||||||||||||||||
| Indirect other |
|
(
|
|
(
|
|
|
||||||||||||||||||||||||||||||||
| Student |
|
(
|
|
|
|
|
||||||||||||||||||||||||||||||||
| Credit card |
|
(
|
|
|
|
|
||||||||||||||||||||||||||||||||
| ALLL |
|
(
|
|
|
|
|
||||||||||||||||||||||||||||||||
| RUFC |
|
|
|
(
|
|
|
||||||||||||||||||||||||||||||||
| ACL | $ |
|
$ |
(
|
$ |
|
$ |
|
$ |
|
$ |
|
||||||||||||||||||||||||||
(1)
Balance is prior to the adoption of CECL.
(2)
Includes the adoption of CECL, the ALLL for PCD acquisitions, and other activity.
The commercial ALLL decreased $
101
million as of March 31, 2021 compared to December 31, 2020 due to lower loan balances and improving economic conditions.
The consumer ALLL decreased $
74
million as of March 31, 2021 compared to December 31, 2020. The decrease reflects lower loan balances primarily in the mortgage and indirect other portfolios and improved economic conditions.
The RUFC decreased $
15
million as of March 31, 2021 compared to December 31, 2020. The decrease reflects a change in the composition of unfunded commitments and the improving economic forecast.
Truist’s ACL estimate represents management’s best estimate of expected credit losses related to the loan and lease portfolio, including unfunded commitments, at the balance sheet date. This estimate incorporates both quantitatively-derived output, as well as qualitative components that represent expected losses not otherwise captured by the models.
The quantitative models have been designed to estimate losses using macro-economic forecasts over a reasonable and supportable forecast period, which management has determined to be two years, followed by a reversion to long-term historical loss conditions over a one-year period. These macro-economic forecasts include a number of key economic variables utilized in loss forecasting that include, but are not limited to, unemployment trends, US real GDP, corporate credit spreads, rental rates, property values, the primary 30-year mortgage rate, home price indices and used car prices.
Truist Financial Corporation 15
The primary economic forecast incorporates a third -party baseline forecast that is adjusted to reflect Truist’s interest rate outlook. Management also considered multiple third-party macro-economic forecasts that reflected a range of possible outcomes in order to capture uncertainty in the economic environment caused by the pandemic. The economic forecast shaping the ACL estimate at March 31, 2021 included a GDP recovery to pre-pandemic levels in the third quarter of 2021 with an improving unemployment rate to the mid-single-digits through the end of 2021 followed by continued improvement through the remainder of the reasonable and supportable period.
Quantitative models have certain limitations with respect to estimating expected losses in times of rapidly changing macro-economic forecasts. As a result, management believes that the qualitative component of the ACL, which incorporates management’s expert judgment related to expected future credit losses, will continue to represent a significant portion of the ACL for the foreseeable future. The March 31, 2021 ACL estimate includes qualitative adjustments to address limitations in modeled results with respect to forecasted economic conditions that are well outside of historic economic ranges used to develop the models. These adjustments give consideration to other risks in the portfolio, including the impact of government relief programs, stimulus and client accommodations, that are not directly considered in the quantitative models.
PCD Loan Activity
For PCD loans, the initial estimate of expected credit losses is recognized in the ALLL on the date of acquisition using the same methodology as other loans held for investment. The following table provides a summary of purchased student loans with credit deterioration at acquisition:
|
Three Months Ended March 31, 2021
(Dollars in millions) |
|||||
| Par value | $ |
|
|||
| ALLL at acquisition |
(
|
||||
| Non-credit premium (discount) |
|
||||
| Purchase price | $ |
|
|||
NPAs
The following table provides a summary of nonperforming loans, excluding LHFS. Interest income recognized on nonperforming loans HFI was $
10
million and $
8
million for the three months ended March 31, 2021 and 2020, respectively.
| March 31, 2021 | December 31, 2020 | ||||||||||||||||||||||
| Recorded Investment | Recorded Investment | ||||||||||||||||||||||
| (Dollars in millions) | Without an ALLL | With an ALLL | Without an ALLL | With an ALLL | |||||||||||||||||||
| Commercial: | |||||||||||||||||||||||
| Commercial and industrial | $ |
|
$ |
|
$ |
|
$ |
|
|||||||||||||||
| CRE |
|
|
|
|
|||||||||||||||||||
| Commercial construction |
|
|
|
|
|||||||||||||||||||
| Lease financing |
|
|
|
|
|||||||||||||||||||
| Consumer: | |||||||||||||||||||||||
| Residential mortgage |
|
|
|
|
|||||||||||||||||||
| Residential home equity and direct |
|
|
|
|
|||||||||||||||||||
| Indirect auto |
|
|
|
|
|||||||||||||||||||
| Indirect other |
|
|
|
|
|||||||||||||||||||
| Total | $ |
|
$ |
|
$ |
|
$ |
|
|||||||||||||||
The following table presents a summary of nonperforming assets and residential mortgage loans in the process of foreclosure.
| (Dollars in millions) | Mar 31, 2021 | Dec 31, 2020 | |||||||||
| Nonperforming loans and leases HFI | $ |
|
$ |
|
|||||||
| Nonperforming LHFS |
|
|
|||||||||
| Foreclosed real estate |
|
|
|||||||||
| Other foreclosed property |
|
|
|||||||||
| Total nonperforming assets | $ |
|
$ |
|
|||||||
| Residential mortgage loans in the process of foreclosure | $ |
|
$ |
|
|||||||
16 Truist Financial Corporation
TDRs
The following table presents a summary of TDRs:
| (Dollars in millions) | Mar 31, 2021 | Dec 31, 2020 | |||||||||
| Performing TDRs: | |||||||||||
| Commercial: | |||||||||||
| Commercial and industrial | $ |
|
$ |
|
|||||||
| CRE |
|
|
|||||||||
| Lease financing |
|
|
|||||||||
| Consumer: | |||||||||||
| Residential mortgage |
|
|
|||||||||
| Residential home equity and direct |
|
|
|||||||||
| Indirect auto |
|
|
|||||||||
| Indirect other |
|
|
|||||||||
| Student |
|
|
|||||||||
| Credit card |
|
|
|||||||||
| Total performing TDRs |
|
|
|||||||||
| Nonperforming TDRs |
|
|
|||||||||
| Total TDRs | $ |
|
$ |
|
|||||||
| ALLL attributable to TDRs | $ |
|
$ |
|
|||||||
The primary reason loan modifications were classified as TDRs is summarized in the tables below. New TDR balances represent the recorded investment at the end of the quarter in which the modification was made. The prior quarter balance represents recorded investment at the beginning of the quarter in which the modification was made. Rate modifications consist of TDRs made with below market interest rates, including those that also have modifications of loan structures.
|
March 31, 2021
(Dollars in millions) |
Type of Modification | Prior Quarter Loan Balance | ALLL at Period End | ||||||||||||||||||||
| Rate | Structure | ||||||||||||||||||||||
| Newly designated TDRs: | |||||||||||||||||||||||
| Commercial: | |||||||||||||||||||||||
| Commercial and industrial | $ |
|
$ |
|
$ |
|
$ |
|
|||||||||||||||
| CRE |
|
|
|
|
|||||||||||||||||||
| Consumer: | |||||||||||||||||||||||
| Residential mortgage |
|
|
|
|
|||||||||||||||||||
| Residential home equity and direct |
|
|
|
|
|||||||||||||||||||
| Indirect auto |
|
|
|
|
|||||||||||||||||||
| Indirect other |
|
|
|
|
|||||||||||||||||||
| Student |
|
|
|
|
|||||||||||||||||||
| Credit card |
|
|
|
|
|||||||||||||||||||
| Re-modification of previously designated TDRs |
|
|
|||||||||||||||||||||
|
March 31, 2020
(Dollars in millions) |
Type of Modification | Prior Quarter Loan Balance | ALLL at Period End | ||||||||||||||||||||
| Rate | Structure | ||||||||||||||||||||||
| Newly designated TDRs: | |||||||||||||||||||||||
| Commercial: | |||||||||||||||||||||||
| Commercial and industrial | $ |
|
$ |
|
$ |
|
$ |
|
|||||||||||||||
| CRE |
|
|
|
|
|||||||||||||||||||
| Lease financing |
|
|
|
|
|||||||||||||||||||
| Consumer: | |||||||||||||||||||||||
| Residential mortgage |
|
|
|
|
|||||||||||||||||||
| Residential home equity and direct |
|
|
|
|
|||||||||||||||||||
| Indirect auto |
|
|
|
|
|||||||||||||||||||
| Indirect other |
|
|
|
|
|||||||||||||||||||
| Student |
|
|
|
|
|||||||||||||||||||
| Credit card |
|
|
|
|
|||||||||||||||||||
| Re-modification of previously designated TDRs |
|
|
|||||||||||||||||||||
Charge-offs and forgiveness of principal and interest for TDRs were immaterial for all periods presented.
Truist Financial Corporation 17
The re-default balance for modifications that had been classified as TDRs during the previous 12 months that experienced a payment default was $14 million and $21 million for the three months ended March 31, 2021 and 2020, respectively. Payment default is defined as movement of the TDR to nonperforming status, foreclosure, or charge-off, whichever occurs first.
Unearned Income, Discounts and Net Deferred Loan Fees and Costs
The following table presents additional information about loans and leases:
| (Dollars in millions) | Mar 31, 2021 | Dec 31, 2020 | |||||||||
| Unearned income, discounts and net deferred loan fees and costs | $ |
|
$ |
|
|||||||
NOTE 5.
Goodwill and Other Intangible Assets
The Company performed a qualitative assessment of current events and circumstances during the first quarter of 2021, including macroeconomic and market factors, industry and banking sector events, Truist specific performance indicators, and a comparison of management’s forecast and assumptions to those used in its October 1, 2020 quantitative impairment test, concluding that it was not more-likely-than-not that the fair value of one or more of its reporting units is below its respective carrying amount as of March 31, 2021, and therefore no triggering event occurred that required a quantitative goodwill impairment test. See “Note 1. Basis of Presentation” and “Note 7. Goodwill and Other Intangible Assets” in Truist’s Annual Report on Form 10-K for the year ended December 31, 2020 for additional information.
The changes in the carrying amount of goodwill attributable to operating segments are reflected in the table below. The adjustments for 2021 to CB&W reflect the divestiture of certain businesses. Refer to “Note 17. Operating Segments” for additional information on segments.
| (Dollars in millions) | CB&W | C&CB | IH | Total | |||||||||||||||||||
| Goodwill, January 1, 2020 | $ |
|
$ |
|
$ |
|
$ |
|
|||||||||||||||
| Mergers and acquisitions |
|
|
|
|
|||||||||||||||||||
| Adjustments and other |
|
(
|
|
(
|
|||||||||||||||||||
| Goodwill, December 31, 2020 |
|
|
|
|
|||||||||||||||||||
| Mergers and acquisitions |
|
|
|
|
|||||||||||||||||||
| Adjustments and other |
(
|
|
|
(
|
|||||||||||||||||||
| Goodwill, March 31, 2021 | $ |
|
$ |
|
$ |
|
$ |
|
|||||||||||||||
The following table, which excludes fully amortized intangibles, presents information for identifiable intangible assets:
| March 31, 2021 | December 31, 2020 | ||||||||||||||||||||||||||||||||||
| (Dollars in millions) | Gross Carrying Amount | Accumulated Amortization | Net Carrying Amount | Gross Carrying Amount | Accumulated Amortization | Net Carrying Amount | |||||||||||||||||||||||||||||
| CDI | $ |
|
$ |
(
|
$ |
|
$ |
|
$ |
(
|
$ |
|
|||||||||||||||||||||||
|
Other, primarily client relationship intangibles
|
|
(
|
|
|
(
|
|
|||||||||||||||||||||||||||||
| Total | $ |
|
$ |
(
|
$ |
|
$ |
|
$ |
(
|
$ |
|
|||||||||||||||||||||||
18 Truist Financial Corporation
NOTE 6.
Loan Servicing
The Company acquires servicing rights and retains servicing rights for certain of its sales or securitizations of residential mortgages and commercial loans. Servicing rights on residential and commercial mortgages are capitalized by the Company as MSRs on the Consolidated Balance Sheets. Income earned by the Company on its residential MSRs is derived primarily from contractually specified mortgage servicing fees and late fees, net of curtailment costs. Income earned by the Company on its commercial mortgage servicing rights is derived primarily from contractually specified servicing fees and other ancillary fees.
Residential Mortgage
Activities
The following tables summarize residential mortgage servicing activities:
| (Dollars in millions) | Mar 31, 2021 | Dec 31, 2020 | ||||||||||||
| UPB of residential mortgage loan servicing portfolio | $ |
|
$ |
|
||||||||||
|
UPB of residential mortgage loans serviced for others, primarily agency conforming fixed rate
|
|
|
||||||||||||
| Mortgage loans sold with recourse |
|
|
||||||||||||
| Maximum recourse exposure from mortgage loans sold with recourse liability |
|
|
||||||||||||
| Indemnification, recourse and repurchase reserves |
|
|
||||||||||||
|
As of / For the Three Months Ended March 31,
(Dollars in millions) |
2021 | 2020 | ||||||||||||
| UPB of residential mortgage loans sold from LHFS | $ |
|
$ |
|
||||||||||
| Pre-tax gains recognized on mortgage loans sold and held for sale |
|
|
||||||||||||
| Servicing fees recognized from mortgage loans serviced for others |
|
|
||||||||||||
|
Approximate weighted average servicing fee on the outstanding balance of residential mortgage loans serviced for others
|
|
% |
|
% | ||||||||||
| Weighted average interest rate on mortgage loans serviced for others |
|
|
||||||||||||
The following table presents a roll forward of the carrying value of residential MSRs recorded at fair value:
|
Three Months Ended March 31,
(Dollars in millions) |
2021 | 2020 | ||||||||||||
| Residential MSRs, carrying value, January 1 | $ |
|
$ |
|
||||||||||
| Additions |
|
|
||||||||||||
| Change in fair value due to changes in valuation inputs or assumptions: | ||||||||||||||
| Prepayment speeds |
|
(
|
||||||||||||
| OAS |
|
|
||||||||||||
| Servicing costs |
|
|
||||||||||||
| Realization of expected net servicing cash flows, passage of time and other |
(
|
(
|
||||||||||||
| Residential MSRs, carrying value, March 31 | $ |
|
$ |
|
||||||||||
The sensitivity of the fair value of the Company’s residential MSRs to changes in key assumptions is presented in the following table:
| March 31, 2021 | December 31, 2020 | ||||||||||||||||||||||||||||||||||
| Range | Weighted Average | Range | Weighted Average | ||||||||||||||||||||||||||||||||
| (Dollars in millions) | Min | Max | Min | Max | |||||||||||||||||||||||||||||||
| Prepayment speed |
|
% |
|
% |
|
% |
|
% |
|
% |
|
% | |||||||||||||||||||||||
| Effect on fair value of a 10% increase | $ |
(
|
$ |
(
|
|||||||||||||||||||||||||||||||
| Effect on fair value of a 20% increase |
(
|
(
|
|||||||||||||||||||||||||||||||||
| OAS |
|
% |
|
% |
|
% |
|
% |
|
% |
|
% | |||||||||||||||||||||||
| Effect on fair value of a 10% increase | $ |
(
|
$ |
(
|
|||||||||||||||||||||||||||||||
| Effect on fair value of a 20% increase |
(
|
(
|
|||||||||||||||||||||||||||||||||
| Composition of loans serviced for others: | |||||||||||||||||||||||||||||||||||
| Fixed-rate residential mortgage loans |
|
% |
|
% | |||||||||||||||||||||||||||||||
|
Adjustable-rate residential mortgage loans
|
|
|
|||||||||||||||||||||||||||||||||
| Total |
|
% |
|
% | |||||||||||||||||||||||||||||||
| Weighted average life |
|
|
|||||||||||||||||||||||||||||||||
Truist Financial Corporation 19
The sensitivity calculations above are hypothetical and should not be considered to be predictive of future performance. As indicated, changes in fair value based on adverse changes in assumptions generally cannot be extrapolated because the relationship of the change in assumption to the change in fair value may not be linear. Also, in the above table, the effect of an adverse variation in one assumption on the fair value of the MSRs is calculated without changing any other assumption; while in reality, changes in one factor may result in changes in another, which may magnify or counteract the effect of the change. See “Note 14. Fair Value Disclosures” for additional information on the valuation techniques used.
Commercial Mortgage Activities
The following table summarizes commercial mortgage servicing activities for the periods presented:
| (Dollars in millions) | Mar 31, 2021 | Dec 31, 2020 | |||||||||
| UPB of CRE mortgages serviced for others | $ |
|
$ |
|
|||||||
| CRE mortgages serviced for others covered by recourse provisions |
|
|
|||||||||
| Maximum recourse exposure from CRE mortgages sold with recourse liability |
|
|
|||||||||
| Recorded reserves related to recourse exposure |
|
|
|||||||||
| CRE mortgages originated during the year-to-date period |
|
|
|||||||||
| Commercial MSRs at fair value |
|
|
|||||||||
NOTE 7.
Other Assets and Liabilities
Lessee Operating and Finance Leases
The Company leases certain assets, consisting primarily of real estate, and assesses at contract inception whether a contract is, or contains, a lease.
The following tables present additional information on leases, excluding leases related to the lease financing businesses:
| March 31, 2021 | December 31, 2020 | ||||||||||||||||||||||
| (Dollars in millions) | Operating Leases | Finance Leases | Operating Leases | Finance Leases | |||||||||||||||||||
| ROU assets | $ |
|
$ |
|
$ |
|
$ |
|
|||||||||||||||
| Lease liabilities |
|
|
|
|
|||||||||||||||||||
| Weighted average remaining term |
|
|
|
|
|||||||||||||||||||
| Weighted average discount rate |
|
% |
|
% |
|
% |
|
% | |||||||||||||||
|
Three Months Ended March 31,
(Dollars in millions) |
2021 | 2020 | |||||||||
| Operating lease costs | $ |
|
$ |
|
|||||||
Lessor Operating Leases
The Company’s two primary lessor businesses are equipment financing and structured real estate with income recorded in Operating lease income on the Consolidated Statements of Income.
The following table presents a summary of assets under operating leases and activity related to assets under operating leases. This table excludes subleases on assets included in premises and equipment.
| (Dollars in millions) | Mar 31, 2021 | Dec 31, 2020 | ||||||||||||
| Assets held under operating leases (1) | $ |
|
$ |
|
||||||||||
| Accumulated depreciation |
(
|
(
|
||||||||||||
| Net | $ |
|
$ |
|
||||||||||
The carrying value of assets previously under operating leases was immaterial.
Bank-Owned Life Insurance
Bank-owned life insurance consists of life insurance policies held on certain teammates for which the Company is the beneficiary. These policies provide the Company an efficient form of funding for retirement and other employee benefits costs. The carrying value of bank-owned life insurance was $
6.5
billion at March 31, 2021 and December 31, 2020.
20 Truist Financial Corporation
NOTE 8.
Borrowings
The following table presents a summary of short-term borrowings:
| (Dollars in millions) | Mar 31, 2021 | Dec 31, 2020 | ||||||||||||
| Federal funds purchased | $ |
|
$ |
|
||||||||||
| Securities sold under agreements to repurchase |
|
|
||||||||||||
| FHLB advances |
|
|
||||||||||||
|
Collateral in excess of derivative exposures
|
|
|
||||||||||||
| Master notes |
|
|
||||||||||||
| Other short-term borrowings |
|
|
||||||||||||
| Total short-term borrowings | $ |
|
$ |
|
||||||||||
The following table presents a summary of long-term debt:
| (Dollars in millions) | Mar 31, 2021 | Dec 31, 2020 | |||||||||
| Truist Financial Corporation: | |||||||||||
| Fixed rate senior notes | $ |
|
$ |
|
|||||||
| Floating rate senior notes |
|
|
|||||||||
| Fixed rate subordinated notes |
|
|
|||||||||
| Capital notes |
|
|
|||||||||
| Structured notes (1) |
|
|
|||||||||
| Truist Bank: | |||||||||||
| Fixed rate senior notes |
|
|
|||||||||
| Floating rate senior notes |
|
|
|||||||||
| Fixed rate subordinated notes |
|
|
|||||||||
|
FHLB advances
|
|
|
|||||||||
| Other long-term debt (2) |
|
|
|||||||||
| Nonbank subsidiaries: | |||||||||||
| Other long-term debt (3) |
|
|
|||||||||
| Total long-term debt | $ |
|
$ |
|
|||||||
(1)
Consist of notes with various terms that include fixed or floating rate interest or returns that are linked to an equity index.
(2)
Includes debt associated with finance leases, tax credit investments, and other.
(3)
Includes debt associated with structured real estate leases.
The Company does not consolidate certain wholly-owned trusts which were formed for the sole purpose of issuing trust preferred securities. The proceeds from the trust preferred securities issuances were invested in capital notes of the Parent Company. The Parent Company’s obligations constitute a full and unconditional guarantee of the trust preferred securities.
Truist Financial Corporation 21
NOTE 9.
Shareholders’ Equity
Common Stock
The following table presents the dividends declared per share of common stock:
| Three Months Ended March 31, | 2021 | 2020 | ||||||||||||
| Cash dividends declared per share | $ |
|
$ |
|
||||||||||
Share Repurchase Activity
In December 2020, Truist announced the Board of Directors had authorized the repurchase of up to $
2.0
billion of common stock beginning in the first quarter of 2021 to optimize Truist’s capital position. During the first quarter of 2021, the Company repurchased $
506
million of common stock, which represented
9.5
million shares, through a combination of open market and accelerated share repurchases. Repurchased shares revert to the status of authorized and unissued shares upon repurchase. At March 31, 2021, Truist had remaining authorization to repurchase up to $
1.5
billion of common stock under the Board approved repurchase plan.
Preferred Stock
During the first quarter of 2021, the Company redeemed all
18,000
outstanding shares of its perpetual preferred stock series F and the corresponding depositary shares representing fractional interests in such series for $
450
million, and all
20,000
outstanding shares of its perpetual preferred stock series G and the corresponding depositary shares representing fractional interests in such series for $
500
million.
In April 2021, the Company announced the redemption of all
18,600
outstanding shares of its perpetual preferred stock series H and the corresponding depositary shares representing fractional interests in such series for $
465
million.
NOTE 10.
AOCI
AOCI includes the after-tax change in unrecognized net costs related to defined benefit pension and OPEB plans as well as unrealized gains and losses on cash flow hedges and AFS securities.
|
Three Months Ended March 31, 2021 and 2020
(Dollars in millions) |
Pension and OPEB Costs | Cash Flow Hedges | AFS Securities | Other, net | Total | ||||||||||||||||||||||||
| AOCI balance, January 1, 2020 | $ |
(
|
$ |
(
|
$ |
|
$ |
(
|
$ |
(
|
|||||||||||||||||||
| OCI before reclassifications, net of tax |
|
|
|
(
|
|
||||||||||||||||||||||||
| Amounts reclassified from AOCI: | |||||||||||||||||||||||||||||
| Before tax |
|
|
|
|
|
||||||||||||||||||||||||
| Tax effect |
|
|
|
|
|
||||||||||||||||||||||||
| Amounts reclassified, net of tax |
|
|
|
|
|
||||||||||||||||||||||||
| Total OCI, net of tax |
|
|
|
(
|
|
||||||||||||||||||||||||
| AOCI balance, March 31, 2020 | $ |
(
|
$ |
(
|
$ |
|
$ |
(
|
$ |
|
|||||||||||||||||||
| AOCI balance, January 1, 2021 | $ |
(
|
$ |
(
|
$ |
|
$ |
|
$ |
|
|||||||||||||||||||
| OCI before reclassifications, net of tax |
|
|
(
|
|
(
|
||||||||||||||||||||||||
| Amounts reclassified from AOCI: | |||||||||||||||||||||||||||||
| Before tax |
|
|
|
|
|
||||||||||||||||||||||||
| Tax effect |
|
|
|
|
|
||||||||||||||||||||||||
| Amounts reclassified, net of tax |
|
|
|
|
|
||||||||||||||||||||||||
| Total OCI, net of tax |
|
|
(
|
|
(
|
||||||||||||||||||||||||
| AOCI balance, March 31, 2021 | $ |
(
|
$ |
(
|
$ |
(
|
$ |
|
$ |
(
|
|||||||||||||||||||
|
Primary income statement location of amounts reclassified from AOCI
|
Other expense | Net interest income and Other expense | Securities gains (losses) and Net interest income | Net interest income | |||||||||||||||||||||||||
22 Truist Financial Corporation
NOTE 11.
Income Taxes
NOTE 12.
Benefit Plans
The components of net periodic benefit cost for defined benefit pension plans are summarized in the following table:
|
Three Months Ended March 31,
(Dollars in millions) |
Income Statement Location | 2021 | 2020 | |||||||||||
| Service cost | Personnel expense | $ |
|
$ |
|
|||||||||
| Interest cost | Other expense |
|
|
|||||||||||
| Estimated return on plan assets | Other expense |
(
|
(
|
|||||||||||
| Amortization and other | Other expense |
|
|
|||||||||||
| Net periodic (benefit) cost | $ |
(
|
$ |
(
|
||||||||||
Truist makes contributions to the qualified pension plans in amounts between the minimum required for funding and the maximum deductible for federal income tax purposes. Discretionary contributions totaling $
387
million were made to the Truist pension plan during the three months ended March 31, 2021. There are no required contributions for the remainder of 2021.
NOTE 13.
Commitments and Contingencies
Truist utilizes a variety of financial instruments to meet the financing needs of clients and to mitigate exposure to risks. These financial instruments include commitments to extend credit, letters of credit and financial guarantees and derivatives. Truist also has commitments to fund certain affordable housing investments and contingent liabilities related to certain sold loans.
Tax Credit and Certain Equity Investments
The Company invests in certain affordable housing projects throughout its market area as a means of supporting local communities. Truist receives tax credits related to these investments, for which the Company typically acts as a limited partner and therefore does not exert control over the operating or financial policies of the partnerships.
The following table summarizes certain tax credit and certain equity investments:
| (Dollars in millions) | Balance Sheet Location | Mar 31, 2021 | Dec 31, 2020 | |||||||||||
| Investments in affordable housing projects: | ||||||||||||||
| Carrying amount | Other assets | $ |
|
$ |
|
|||||||||
| Amount of future funding commitments included in carrying amount | Other liabilities |
|
|
|||||||||||
| Lending exposure | NA |
|
|
|||||||||||
| Renewable energy investments: | ||||||||||||||
| Carrying amount | Other assets |
|
|
|||||||||||
| Amount of future funding commitments not included in carrying amount | NA |
|
|
|||||||||||
| Private equity and certain other equity method investments: | ||||||||||||||
| Carrying amount | Other assets |
|
|
|||||||||||
| Amount of future funding commitments not included in carrying amount | NA |
|
|
|||||||||||
Truist Financial Corporation 23
The following table presents a summary of tax credits and amortization associated with the Company’s tax credit investment activity:
| Three Months Ended March 31, | ||||||||||||||
| (Dollars in millions) | Income Statement Location | 2021 | 2020 | |||||||||||
| Tax credits: | ||||||||||||||
| Investments in affordable housing projects | Provision for income taxes | $ |
|
$ |
|
|||||||||
| Other community development investments | Provision for income taxes |
|
|
|||||||||||
| Renewable energy investments | NA (1) |
|
|
|||||||||||
| Amortization and other changes in carrying amount: | ||||||||||||||
| Investments in affordable housing projects | Provision for income taxes | $ |
|
$ |
|
|||||||||
| Other community development investments | Other noninterest income |
|
|
|||||||||||
| Renewable energy investments | Other noninterest income |
|
|
|||||||||||
(1)
Tax credits received for these investments are recorded as a reduction to the carrying value of these investments
.
Letters of Credit and Financial Guarantees
In the normal course of business, Truist utilizes certain financial instruments to meet the financing needs of clients and to mitigate exposure to risks. Such financial instruments include commitments to extend credit and certain contractual agreements, including standby letters of credit and financial guarantee arrangements.
The following is a summary of selected notional amounts of off-balance sheet financial instruments:
| (Dollars in millions) | March 31, 2021 | December 31, 2020 | |||||||||
| Commitments to extend, originate, or purchase credit | $ |
|
$ |
|
|||||||
| Residential mortgage loans sold with recourse |
|
|
|||||||||
| CRE mortgages serviced for others covered by recourse provisions |
|
|
|||||||||
| Letters of credit |
|
|
|||||||||
Total Return Swaps
The Company facilitates matched book TRS transactions on behalf of clients, whereby a VIE purchases reference assets identified by a client and the Company enters into a TRS with the VIE, with a mirror-image TRS facing the client. The Company provides senior financing to the VIE in the form of demand notes to fund the purchase of the reference assets. Reference assets are fixed income instruments primarily composed of syndicated bank loans. The TRS contracts pass through interest and other cash flows on the reference assets to the third party clients, along with exposing those clients to decreases in value on the assets and providing them with the rights to appreciation on the assets. The terms of the TRS contracts require the third parties to post initial margin collateral, as well as ongoing margin as the fair values of the underlying reference assets change.
The Company concluded that the associated VIEs should be consolidated because the Company has (i) the power to direct the activities that most significantly impact the economic performance of the VIE and (ii) the obligation to absorb losses and the right to receive benefits, that could potentially be significant. At March 31, 2021, the Company’s Consolidated Balance Sheet reflected $
1.5
billion of assets and $
66
million of other liabilities of the VIEs. At December 31, 2020, the Company’s Consolidated Balance Sheet reflected $
1.3
billion of assets and $
41
million of other liabilities of the VIEs. Assets at March 31, 2021 and December 31, 2020 include $
1.3
billion in trading loans and bonds. The activities of the VIEs are restricted to buying and selling the reference assets and the risks/benefits of any such assets owned by the VIEs are passed to the third party clients via the TRS contracts. For additional information on TRS contracts and the related VIEs, see “Note 15. Derivative Financial Instruments.”
24 Truist Financial Corporation
Pledged Assets
Certain assets were pledged to secure municipal deposits, securities sold under agreements to repurchase, certain derivative agreements, and borrowings or borrowing capacity, as well as for other purposes as required or permitted by law. Assets pledged to the FHLB and FRB are subject to applicable asset discounts when determining borrowing capacity. The Company obtains secured financing and letters of credit from the FRB and FHLB. The Company’s letters of credit from the FHLB can be used to secure various client deposits, including public fund relationships. Excluding assets related to employee benefit plans, the majority of the agreements governing the pledged assets do not permit the other party to sell or repledge the collateral.
The following table provides the total carrying amount of pledged assets by asset type:
| (Dollars in millions) | Mar 31, 2021 | Dec 31, 2020 | ||||||||||||
| Pledged securities | $ |
|
$ |
|
||||||||||
| Pledged loans: | ||||||||||||||
| FRB |
|
|
||||||||||||
| FHLB |
|
|
||||||||||||
| Unused borrowing capacity: | ||||||||||||||
| FRB |
|
|
||||||||||||
| FHLB |
|
|
||||||||||||
Litigation and Regulatory Matters
Truist and/or its subsidiaries are routinely parties to numerous legal proceedings, including private, civil litigation, and regulatory investigations, arising from the ordinary conduct of its regular business activities. The matters range from individual actions involving a single plaintiff to class action lawsuits with multiple class members and can involve claims for substantial amounts. Investigations involve both formal and informal proceedings, by both governmental agencies and self-regulatory organizations. These legal proceedings are at varying stages of adjudication, arbitration, or investigation and may consist of a variety of claims, including common law tort and contract claims, as well as statutory antitrust, securities, and consumer protection claims. The ultimate resolution of any proceeding is uncertain and inherently difficult to predict. It is possible that the ultimate resolution of these matters, if unfavorable, may be material to the consolidated financial position, consolidated results of operations, or consolidated cash flows of Truist.
Truist establishes accruals for legal matters when potential losses associated with the actions become probable and the amount of loss can be reasonably estimated. There is no assurance that the ultimate resolution of these matters will not significantly exceed the amounts that Truist has accrued. Accruals for legal matters are based on management’s best judgment after consultation with counsel and others.
The Company estimates reasonably possible losses, in excess of amounts accrued, of up to approximately $
200
million as of March 31, 2021. This estimate is based upon currently available information and involves considerable judgment, given that claims often include significant legal uncertainties, damages alleged by plaintiffs are often unspecified or overstated, discovery may not have started or may not be complete and material facts may be disputed or unsubstantiated, among other factors. In addition, the matters underlying this estimate will change from time to time and actual losses may vary significantly from this estimate. As a result, the Company does not believe that an estimate of reasonably possible losses can be made for certain matters. Such matters are not reflected in the estimate provided herein.
The following is a description of a certain legal proceeding in which Truist is involved:
Bickerstaff v. SunTrust Bank
This class action case was filed in the Fulton County State Court on July 12, 2010, and an amended complaint was filed on August 9, 2010. Plaintiff asserts that all overdraft fees charged to his account which related to debit card and ATM transactions are actually interest charges and therefore subject to the usury laws of Georgia. Plaintiff has brought claims for violations of civil and criminal usury laws, conversion, and money had and received. On October 6, 2017, the trial court granted plaintiff’s motion for class certification and defined the class as “Every Georgia citizen who had or has one or more accounts with SunTrust Bank and who, from July 12, 2006, to October 6, 2017 (i) had at least one overdraft of $500.00 or less resulting from an ATM or debit card transaction (the “Transaction”); (ii) paid any Overdraft Fees as a result of the Transaction; and (iii) did not receive a refund of those Fees,” and the granting of a certified class was affirmed on appeal. On April 8, 2020, the Company filed a motion seeking to narrow the scope of this class, and on May 29, 2020, it filed a renewed motion to compel arbitration of the claims of some of the class members. On February 9, 2021, the trial court denied both motions as premature but held that the issues could be raised again after the conclusion of discovery, which is currently underway. The Company believes that the claims are without merit.
Truist Financial Corporation 25
NOTE 14.
Fair Value Disclosures
Recurring Fair Value Measurements
Accounting standards define fair value as the price that would be received on the measurement date to sell an asset or the price paid to transfer a liability in the principal or most advantageous market available to the entity in an orderly transaction between market participants, with a three level measurement hierarchy:
•
Level 1: Quoted prices for identical instruments in active markets
•
Level 2: Quoted prices for similar instruments in active markets; quoted prices for identical or similar instruments in markets that are not active; and model-derived valuations in which all significant inputs are observable in active markets
•
Level 3: Valuations derived from valuation techniques in which one or more significant inputs are unobservable
The following tables present fair value information for assets and liabilities measured at fair value on a recurring basis:
|
March 31, 2021
(Dollars in millions) |
Total | Level 1 | Level 2 | Level 3 | Netting Adjustments (1) | |||||||||||||||||||||||||||
| Assets: | ||||||||||||||||||||||||||||||||
| Trading assets: | ||||||||||||||||||||||||||||||||
| U.S. Treasury | $ |
|
$ |
|
$ |
|
$ |
|
$ | — | ||||||||||||||||||||||
| GSE |
|
|
|
|
— | |||||||||||||||||||||||||||
| Agency MBS - residential |
|
|
|
|
— | |||||||||||||||||||||||||||
| Agency MBS - commercial |
|
|
|
|
— | |||||||||||||||||||||||||||
| States and political subdivisions |
|
|
|
|
— | |||||||||||||||||||||||||||
| Corporate and other debt securities |
|
|
|
|
— | |||||||||||||||||||||||||||
| Loans |
|
|
|
|
— | |||||||||||||||||||||||||||
| Other |
|
|
|
|
— | |||||||||||||||||||||||||||
| Total trading assets |
|
|
|
|
— | |||||||||||||||||||||||||||
| AFS securities: | ||||||||||||||||||||||||||||||||
| U.S. Treasury |
|
|
|
|
— | |||||||||||||||||||||||||||
| GSE |
|
|
|
|
— | |||||||||||||||||||||||||||
| Agency MBS - residential |
|
|
|
|
— | |||||||||||||||||||||||||||
| Agency MBS - commercial |
|
|
|
|
— | |||||||||||||||||||||||||||
| States and political subdivisions |
|
|
|
|
— | |||||||||||||||||||||||||||
| Other |
|
|
|
|
— | |||||||||||||||||||||||||||
| Total AFS securities |
|
|
|
|
— | |||||||||||||||||||||||||||
| LHFS at fair value |
|
|
|
|
— | |||||||||||||||||||||||||||
| MSRs at fair value |
|
|
|
|
— | |||||||||||||||||||||||||||
| Other assets: | ||||||||||||||||||||||||||||||||
| Derivative assets |
|
|
|
|
(
|
|||||||||||||||||||||||||||
| Equity securities |
|
|
|
|
— | |||||||||||||||||||||||||||
| Total assets | $ |
|
$ |
|
$ |
|
$ |
|
$ |
(
|
||||||||||||||||||||||
| Liabilities: | ||||||||||||||||||||||||||||||||
| Derivative liabilities | $ |
|
$ |
|
$ |
|
$ |
|
$ |
(
|
||||||||||||||||||||||
| Securities sold short |
|
|
|
|
— | |||||||||||||||||||||||||||
| Total liabilities | $ |
|
$ |
|
$ |
|
$ |
|
$ |
(
|
||||||||||||||||||||||
26 Truist Financial Corporation
|
December 31, 2020
(Dollars in millions) |
Total | Level 1 | Level 2 | Level 3 | Netting Adjustments (1) | |||||||||||||||||||||||||||
| Assets: | ||||||||||||||||||||||||||||||||
| Trading assets: | ||||||||||||||||||||||||||||||||
| U.S. Treasury | $ |
|
$ |
|
$ |
|
$ |
|
$ | — | ||||||||||||||||||||||
| GSE |
|
|
|
|
— | |||||||||||||||||||||||||||
| Agency MBS - residential |
|
|
|
|
— | |||||||||||||||||||||||||||
| Agency MBS - commercial |
|
|
|
|
— | |||||||||||||||||||||||||||
| States and political subdivisions |
|
|
|
|
— | |||||||||||||||||||||||||||
| Corporate and other debt securities |
|
|
|
|
— | |||||||||||||||||||||||||||
| Loans |
|
|
|
|
— | |||||||||||||||||||||||||||
| Other |
|
|
|
|
— | |||||||||||||||||||||||||||
| Total trading assets |
|
|
|
|
— | |||||||||||||||||||||||||||
| AFS securities: | ||||||||||||||||||||||||||||||||
| U.S. Treasury |
|
|
|
|
— | |||||||||||||||||||||||||||
| GSE |
|
|
|
|
— | |||||||||||||||||||||||||||
| Agency MBS - residential |
|
|
|
|
— | |||||||||||||||||||||||||||
| Agency MBS - commercial |
|
|
|
|
— | |||||||||||||||||||||||||||
| States and political subdivisions |
|
|
|
|
— | |||||||||||||||||||||||||||
| Other |
|
|
|
|
— | |||||||||||||||||||||||||||
| Total AFS securities |
|
|
|
|
— | |||||||||||||||||||||||||||
| LHFS at fair value |
|
|
|
|
— | |||||||||||||||||||||||||||
| MSRs at fair value |
|
|
|
|
— | |||||||||||||||||||||||||||
| Other assets: | ||||||||||||||||||||||||||||||||
| Derivative assets |
|
|
|
|
(
|
|||||||||||||||||||||||||||
| Equity securities |
|
|
|
|
— | |||||||||||||||||||||||||||
| Total assets | $ |
|
$ |
|
$ |
|
$ |
|
$ |
(
|
||||||||||||||||||||||
| Liabilities: | ||||||||||||||||||||||||||||||||
| Derivative liabilities | $ |
|
$ |
|
$ |
|
$ |
|
$ |
(
|
||||||||||||||||||||||
| Securities sold short |
|
|
|
|
— | |||||||||||||||||||||||||||
| Total liabilities | $ |
|
$ |
|
$ |
|
$ |
|
$ |
(
|
||||||||||||||||||||||
(1)
Refer to “Note 15. Derivative Financial Instruments” for additional discussion on netting adjustments.
At March 31, 2021 and December 31, 2020, investments totaling $
371
million and $
387
million, respectively, have been excluded from the table above as they are valued based on net asset value as a practical expedient. These investments primarily consist of certain SBIC funds.
For additional information on the valuation techniques and significant inputs for Level 2 and Level 3 assets and liabilities that are measured at fair value on a recurring basis, see “Note 18. Fair Value Disclosures” of the Annual Report on Form 10-K for the year ended December 31, 2020.
Truist Financial Corporation 27
Activity for Level 3 assets and liabilities is summarized below:
|
Three Months Ended
(Dollars in millions) |
Non-agency MBS | MSRs | Net Derivatives | Private Equity Investments | |||||||||||||||||||
| Balance at January 1, 2020 | $ |
|
$ |
|
$ |
|
$ |
|
|||||||||||||||
| Total realized and unrealized gains (losses): | |||||||||||||||||||||||
| Included in earnings |
|
(
|
|
|
|||||||||||||||||||
| Included in unrealized net holding gains (losses) in OCI |
(
|
|
|
|
|||||||||||||||||||
| Issuances |
|
|
|
|
|||||||||||||||||||
| Settlements |
(
|
(
|
(
|
(
|
|||||||||||||||||||
| Balance at March 31, 2020 | $ |
|
$ |
|
$ |
|
$ |
|
|||||||||||||||
| Balance at January 1, 2021 | $ |
|
$ |
|
$ |
|
$ |
|
|||||||||||||||
| Total realized and unrealized gains (losses): | |||||||||||||||||||||||
| Included in earnings |
|
|
(
|
|
|||||||||||||||||||
| Issuances |
|
|
|
|
|||||||||||||||||||
| Settlements |
|
(
|
(
|
|
|||||||||||||||||||
| Balance at March 31, 2021 | $ |
|
$ |
|
$ |
(
|
$ |
|
|||||||||||||||
| Change in unrealized gains (losses) included in earnings for the period, attributable to assets and liabilities still held at March 31, 2021 | $ |
|
$ |
|
$ |
(
|
$ |
|
|||||||||||||||
|
Primary income statement location of realized gains (losses) included in earnings
|
Securities gains (losses) | Residential mortgage income and Commercial real estate related income | Residential mortgage income and Commercial real estate related income | Other income | |||||||||||||||||||
During 2020, Truist sold non-agency MBS previously categorized as Level 3 that represented ownership interests in various tranches of Re-REMIC trusts. Additionally during 2020, as a result of a change in control of the funds’ manager, the Company deconsolidated certain SBIC funds for which it had previously concluded that it was the primary beneficiary.
Refer to “Note 6. Loan Servicing” for additional information on valuation techniques and inputs for MSRs.
Fair Value Option
The following table details the fair value and UPB of LHFS that were elected to be measured at fair value. Trading loans, included in other trading assets, were also elected to be measured at fair value.
| March 31, 2021 | December 31, 2020 | |||||||||||||||||||||||||||||||||||||
| (Dollars in millions) | Fair Value | UPB | Difference | Fair Value | UPB | Difference | ||||||||||||||||||||||||||||||||
| Trading loans | $ |
|
$ |
|
$ |
|
$ |
|
$ |
|
$ |
(
|
||||||||||||||||||||||||||
| LHFS at fair value |
|
|
|
|
|
|
||||||||||||||||||||||||||||||||
Nonrecurring Fair Value Measurements
The following table provides information about certain assets measured at fair value on a nonrecurring basis still held as of period end. The carrying values represent end of period values, which approximate the fair value measurements that occurred on the various measurement dates throughout the period. These assets are considered to be Level 3 assets.
| (Dollars in millions) | Mar 31, 2021 | Dec 31, 2020 | ||||||||||||
| Carrying value: | ||||||||||||||
| LHFS | $ |
|
$ |
|
||||||||||
| Loans and leases |
|
|
||||||||||||
| Other |
|
|
||||||||||||
28 Truist Financial Corporation
The following table provides information about valuation adjustments for certain assets measured at fair value on a nonrecurring basis. The valuation adjustments represent the amounts recorded during the period regardless of whether the asset is still held at period end.
|
Three Months Ended March 31,
(Dollars in millions) |
2021 | 2020 | ||||||||||||
| Valuation adjustments: | ||||||||||||||
| LHFS | $ |
(
|
$ |
(
|
||||||||||
| Loans and leases |
(
|
(
|
||||||||||||
| Other |
(
|
(
|
||||||||||||
LHFS with valuation adjustments in the table above consisted primarily of residential mortgages and commercial loans that were valued using market prices and measured at the lower of cost or market. LHFS as of December 31, 2020 includes the small ticket loan and lease portfolio that was sold during the first quarter of 2021. The table above excludes $
43
million and $
125
million of LHFS carried at cost at March 31, 2021 and December 31, 2020, respectively, that did not require a valuation adjustment during the period. The remainder of LHFS is carried at fair value. The Company held $
72
million in nonperforming LHFS at March 31, 2021 and $
5
million of nonperforming LHFS at December 31, 2020. LHFS that were 90 days or more past due and still accruing interest were not material at March 31, 2021.
Loans and leases consists of larger commercial loans and leases that do not share similar risk characteristics that are collateral dependent and may be subject to liquidity adjustments. Refer to “Note 1. Basis of Presentation” in Truist’s Annual Report on Form 10-K for the year ended December 31, 2020 for additional discussion of individually evaluated loans and leases.
Other includes foreclosed real estate, other foreclosed property, ROU assets, premises and equipment, and OREO, and consists primarily of residential homes, commercial properties, vacant lots, and automobiles. ROU assets are measured based on the fair value of the assets, which considers the potential for sublease income. The remaining assets are measured at the lower of cost or fair value, less costs to sell.
Financial Instruments Not Recorded at Fair Value
For financial instruments not recorded at fair value, estimates of fair value are based on relevant market data and information about the instruments. Values obtained relate to trading without regard to any premium or discount that may result from concentrations of ownership, possible tax ramifications, estimated transaction costs that may result from bulk sales or the relationship between various instruments.
An active market does not exist for certain financial instruments. Fair value estimates for these instruments are based on current economic conditions and interest rate risk characteristics, loss experience and other factors. Many of these estimates involve uncertainties and matters of significant judgment and cannot be determined with precision. Therefore, the fair value estimates in many instances cannot be substantiated by comparison to independent markets. In addition, changes in assumptions could significantly affect these fair value estimates.
Financial assets and liabilities not recorded at fair value are summarized below:
| March 31, 2021 | December 31, 2020 | ||||||||||||||||||||||||||||
| (Dollars in millions) | Fair Value Hierarchy | Carrying Amount | Fair Value | Carrying Amount | Fair Value | ||||||||||||||||||||||||
| Financial assets: | |||||||||||||||||||||||||||||
| Loans and leases HFI, net of ALLL | Level 3 | $ |
|
$ |
|
$ |
|
$ |
|
||||||||||||||||||||
| Financial liabilities: | |||||||||||||||||||||||||||||
| Time deposits | Level 2 |
|
|
|
|
||||||||||||||||||||||||
| Long-term debt | Level 2 |
|
|
|
|
||||||||||||||||||||||||
The carrying value of the RUFC, which approximates the fair value of unfunded commitments, was $
349
million and $
364
million at March 31, 2021 and December 31, 2020, respectively.
Truist Financial Corporation 29
NOTE 15.
Derivative Financial Instruments
Impact of Derivatives on the Consolidated Balance Sheets
The following table presents the gross notional amounts and estimated fair value of derivative instruments employed by the Company. Truist held
no
cash flow hedges as of March 31, 2021 and December 31, 2020.
| March 31, 2021 | December 31, 2020 | ||||||||||||||||||||||||||||||||||
| Notional Amount | Fair Value | Notional Amount | Fair Value | ||||||||||||||||||||||||||||||||
| (Dollars in millions) | Assets | Liabilities | Assets | Liabilities | |||||||||||||||||||||||||||||||
| Fair value hedges: | |||||||||||||||||||||||||||||||||||
| Interest rate contracts: | |||||||||||||||||||||||||||||||||||
| Swaps hedging AFS securities | $ |
|
$ |
|
$ |
|
$ |
|
$ |
|
$ |
|
|||||||||||||||||||||||
| Not designated as hedges: | |||||||||||||||||||||||||||||||||||
| Client-related and other risk management: | |||||||||||||||||||||||||||||||||||
| Interest rate contracts: | |||||||||||||||||||||||||||||||||||
| Swaps |
|
|
(
|
|
|
(
|
|||||||||||||||||||||||||||||
| Options |
|
|
(
|
|
|
(
|
|||||||||||||||||||||||||||||
| Forward commitments |
|
|
(
|
|
|
(
|
|||||||||||||||||||||||||||||
| Other |
|
|
|
|
|
|
|||||||||||||||||||||||||||||
| Equity contracts |
|
|
(
|
|
|
(
|
|||||||||||||||||||||||||||||
| Credit contracts: | |||||||||||||||||||||||||||||||||||
| Loans and leases |
|
|
(
|
|
|
(
|
|||||||||||||||||||||||||||||
| Risk participation agreements |
|
|
(
|
|
|
(
|
|||||||||||||||||||||||||||||
| Total return swaps |
|
|
(
|
|
|
(
|
|||||||||||||||||||||||||||||
| Foreign exchange contracts |
|
|
(
|
|
|
(
|
|||||||||||||||||||||||||||||
| Commodity |
|
|
(
|
|
|
(
|
|||||||||||||||||||||||||||||
| Total |
|
|
(
|
|
|
(
|
|||||||||||||||||||||||||||||
| Mortgage banking: | |||||||||||||||||||||||||||||||||||
| Interest rate contracts: | |||||||||||||||||||||||||||||||||||
| Swaps |
|
|
|
|
|
|
|||||||||||||||||||||||||||||
| Interest rate lock commitments |
|
|
(
|
|
|
(
|
|||||||||||||||||||||||||||||
|
When issued securities, forward rate agreements and forward commitments
|
|
|
(
|
|
|
(
|
|||||||||||||||||||||||||||||
| Other |
|
|
|
|
|
|
|||||||||||||||||||||||||||||
| Total |
|
|
(
|
|
|
(
|
|||||||||||||||||||||||||||||
| MSRs: | |||||||||||||||||||||||||||||||||||
| Interest rate contracts: | |||||||||||||||||||||||||||||||||||
| Swaps |
|
|
|
|
|
(
|
|||||||||||||||||||||||||||||
| Options |
|
|
|
|
|
|
|||||||||||||||||||||||||||||
|
When issued securities, forward rate agreements and forward commitments
|
|
|
(
|
|
|
|
|||||||||||||||||||||||||||||
| Other |
|
|
|
|
|
|
|||||||||||||||||||||||||||||
| Total |
|
|
(
|
|
|
(
|
|||||||||||||||||||||||||||||
| Total derivatives not designated as hedges |
|
|
(
|
|
|
(
|
|||||||||||||||||||||||||||||
| Total derivatives | $ |
|
|
(
|
$ |
|
|
(
|
|||||||||||||||||||||||||||
| Gross amounts in the Consolidated Balance Sheets: | |||||||||||||||||||||||||||||||||||
|
Amounts subject to master netting arrangements
|
(
|
|
(
|
|
|||||||||||||||||||||||||||||||
|
Cash collateral (received) posted for amounts subject to master netting arrangements
|
(
|
|
(
|
|
|||||||||||||||||||||||||||||||
| Net amount | $ |
|
$ |
(
|
$ |
|
$ |
(
|
|||||||||||||||||||||||||||
30 Truist Financial Corporation
The following table presents the offsetting of derivative instruments including financial instrument collateral related to legally enforceable master netting agreements and amounts held or pledged as collateral. U.S. GAAP does not permit netting of non-cash collateral balances in the Consolidated Balance Sheets:
|
March 31, 2021
(Dollars in millions) |
Gross Amount | Amount Offset | Net Amount in Consolidated Balance Sheets | Held/Pledged Financial Instruments | Net Amount | ||||||||||||||||||||||||
| Derivative assets: | |||||||||||||||||||||||||||||
| Derivatives subject to master netting arrangement or similar arrangement | $ |
|
$ |
(
|
$ |
|
$ |
(
|
$ |
|
|||||||||||||||||||
| Derivatives not subject to master netting arrangement or similar arrangement |
|
|
|
|
|
||||||||||||||||||||||||
| Exchange traded derivatives |
|
|
|
|
|
||||||||||||||||||||||||
| Total derivative assets | $ |
|
$ |
(
|
$ |
|
$ |
(
|
$ |
|
|||||||||||||||||||
| Derivative liabilities: | |||||||||||||||||||||||||||||
| Derivatives subject to master netting arrangement or similar arrangement | $ |
(
|
$ |
|
$ |
(
|
$ |
|
$ |
(
|
|||||||||||||||||||
| Derivatives not subject to master netting arrangement or similar arrangement |
(
|
|
(
|
|
(
|
||||||||||||||||||||||||
| Total derivative liabilities | $ |
(
|
$ |
|
$ |
(
|
$ |
|
$ |
(
|
|||||||||||||||||||
|
December 31, 2020
(Dollars in millions) |
Gross Amount | Amount Offset | Net Amount in Consolidated Balance Sheets | Held/Pledged Financial Instruments | Net Amount | ||||||||||||||||||||||||
| Derivative assets: | |||||||||||||||||||||||||||||
| Derivatives subject to master netting arrangement or similar arrangement | $ |
|
$ |
(
|
$ |
|
$ |
(
|
$ |
|
|||||||||||||||||||
| Derivatives not subject to master netting arrangement or similar arrangement |
|
|
|
(
|
|
||||||||||||||||||||||||
| Exchange traded derivatives |
|
(
|
|
|
|
||||||||||||||||||||||||
| Total derivative assets | $ |
|
$ |
(
|
$ |
|
$ |
(
|
$ |
|
|||||||||||||||||||
| Derivative liabilities: | |||||||||||||||||||||||||||||
| Derivatives subject to master netting arrangement or similar arrangement | $ |
(
|
$ |
|
$ |
(
|
$ |
|
$ |
(
|
|||||||||||||||||||
| Derivatives not subject to master netting arrangement or similar arrangement |
(
|
|
(
|
|
(
|
||||||||||||||||||||||||
| Exchange traded derivatives |
(
|
|
|
|
|
||||||||||||||||||||||||
| Total derivative liabilities | $ |
(
|
$ |
|
$ |
(
|
$ |
|
$ |
(
|
|||||||||||||||||||
The following table presents the carrying value of hedged items in fair value hedging relationships:
| March 31, 2021 | December 31, 2020 | |||||||||||||||||||||||||||||||||||||
| Hedge Basis Adjustment | Hedge Basis Adjustment | |||||||||||||||||||||||||||||||||||||
| (Dollars in millions) | Hedged Asset / Liability Basis | Items Currently Designated | Discontinued Hedges | Hedged Asset / Liability Basis | Items Currently Designated | Discontinued Hedges | ||||||||||||||||||||||||||||||||
| AFS securities (1) | $ |
|
$ |
(
|
$ |
|
$ |
|
$ |
(
|
$ |
|
||||||||||||||||||||||||||
| Loans and leases |
|
|
|
|
|
|
||||||||||||||||||||||||||||||||
| Long-term debt |
|
|
|
|
|
|
||||||||||||||||||||||||||||||||
(1)
The amortized cost of AFS securities was $
103.2
billion at March 31, 2021 and $
99.4
billion at December 31, 2020.
Truist Financial Corporation 31
Impact of Derivatives on the Consolidated Statements of Income and Comprehensive Income
Derivatives Designated as Hedging Instruments under GAAP
No portion of the change in fair value of derivatives designated as hedges has been excluded from effectiveness testing.
The following table summarizes amounts related to cash flow hedges, which consist of interest rate contracts.
| Three Months Ended March 31, | |||||||||||
| (Dollars in millions) | 2021 | 2020 | |||||||||
| Pre-tax gain (loss) recognized in OCI: | |||||||||||
| Deposits | $ |
|
$ |
|
|||||||
| Short-term borrowings |
|
|
|||||||||
| Long-term debt |
|
|
|||||||||
| Total | $ |
|
$ |
|
|||||||
| Pre-tax gain (loss) reclassified from AOCI into interest expense: | |||||||||||
| Deposits | $ |
(
|
$ |
(
|
|||||||
| Short-term borrowings |
(
|
(
|
|||||||||
| Long-term debt |
(
|
(
|
|||||||||
| Total | $ |
(
|
$ |
(
|
|||||||
| Pre-tax gain (loss) reclassified from AOCI into other expense: (1) | |||||||||||
| Deposits | $ |
(
|
$ |
|
|||||||
| Short-term borrowings |
(
|
|
|||||||||
| Long-term debt |
(
|
|
|||||||||
| Total | $ |
(
|
$ |
|
|||||||
(1)
Represents the accelerated amortization of amounts reclassified from AOCI, where management determined that the forecasted transaction is probable of not occurring.
The following table summarizes the impact on net interest income related to fair value hedges:
| Three Months Ended March 31, | |||||||||||
| (Dollars in millions) | 2021 | 2020 | |||||||||
|
AFS securities:
|
|||||||||||
| Amounts related to interest settlements | $ |
(
|
$ |
|
|||||||
| Recognized on derivatives |
|
|
|||||||||
|
Recognized on hedged items
|
(
|
(
|
|||||||||
| Net income (expense) recognized |
(
|
(
|
|||||||||
| Loans and leases: | |||||||||||
| Recognized on derivatives |
|
(
|
|||||||||
|
Recognized on hedged items
|
(
|
|
|||||||||
| Net income (expense) recognized |
(
|
(
|
|||||||||
|
Long-term debt:
|
|||||||||||
| Amounts related to interest settlements |
|
|
|||||||||
| Recognized on derivatives |
|
|
|||||||||
|
Recognized on hedged items
|
|
(
|
|||||||||
| Net income (expense) recognized |
|
|
|||||||||
|
Net income (expense) recognized, total
|
$ |
|
$ |
|
|||||||
The following table presents information about the Company’s cash flow and fair value hedges:
| (Dollars in millions) | Mar 31, 2021 | Dec 31, 2020 | ||||||||||||
| Cash flow hedges: | ||||||||||||||
|
Net unrecognized after-tax gain (loss) on terminated hedges recorded in AOCI (to be recognized in earnings through 2022)
|
$ |
(
|
$ |
(
|
||||||||||
|
Estimated portion of net after-tax gain (loss) on active and terminated hedges to be reclassified from AOCI into earnings during the next 12 months
|
(
|
(
|
||||||||||||
| Fair value hedges: | ||||||||||||||
|
Unrecognized pre-tax net gain (loss) on terminated hedges (to be recognized as interest primarily through 2029)
|
$ |
|
$ |
|
||||||||||
|
Portion of pre-tax net gain (loss) on terminated hedges to be recognized as a change in interest during the next 12 months
|
|
|
||||||||||||
32 Truist Financial Corporation
Derivatives Not Designated as Hedging Instruments under GAAP
The Company also enters into derivatives that are not designated as accounting hedges under GAAP to economically hedge certain risks as well as in a trading capacity with its clients.
The following table presents pre-tax gain (loss) recognized in income for derivative instruments not designated as hedges:
| Three Months Ended March 31, | ||||||||||||||
| (Dollars in millions) | Income Statement Location | 2021 | 2020 | |||||||||||
| Client-related and other risk management: | ||||||||||||||
| Interest rate contracts | Investment banking and trading income and other income | $ |
|
$ |
(
|
|||||||||
| Foreign exchange contracts | Investment banking and trading income and other income |
|
|
|||||||||||
| Equity contracts | Investment banking and trading income and other income |
(
|
(
|
|||||||||||
| Credit contracts | Investment banking and trading income and other income |
(
|
|
|||||||||||
| Commodity contracts | Investment banking and trading income |
|
|
|||||||||||
| Mortgage banking: | ||||||||||||||
| Interest rate contracts | Residential mortgage income |
|
(
|
|||||||||||
| Interest rate contracts | Commercial real estate related income |
(
|
|
|||||||||||
| MSRs: | ||||||||||||||
| Interest rate contracts | Residential mortgage income |
(
|
|
|||||||||||
| Interest rate contracts | Commercial real estate related income |
(
|
|
|||||||||||
| Total | $ |
(
|
$ |
|
||||||||||
Credit Derivative Instruments
As part of the Company’s corporate investment banking business, the Company enters into contracts that are, in form or substance, written guarantees; specifically, credit default swaps, risk participations, and TRS. The Company accounts for these contracts as derivatives.
The Company has entered into TRS contracts on loans. To mitigate its credit risk, the Company typically receives initial margin from the counterparty upon entering into the TRS and variation margin if the fair value of the underlying reference assets deteriorates. For additional information on the Company’s TRS contracts, see “Note 13. Commitments and Contingencies.”
Truist has entered into risk participation agreements to share the credit exposure with other financial institutions on client-related interest rate derivative contracts. Under these agreements, the Company has guaranteed payment to a dealer counterparty in the event the counterparty experiences a loss on the derivative due to a failure to pay by the counterparty’s client. The Company manages its payment risk on its risk participations by monitoring the creditworthiness of the underlying client through the normal credit review process that the Company would have performed had it entered into a derivative directly with the obligors. At March 31, 2021, the remaining terms on these risk participations ranged from less than one year to 10 years. The potential future exposure represents the Company’s maximum estimated exposure to written risk participations, as measured by projecting a maximum value of the guaranteed derivative instruments based on scenario simulations and assuming 100 percent default by all obligors on the maximum value.
The following table presents additional information related to interest rate derivative risk participation agreements and total return swaps:
| (Dollars in millions) | Mar 31, 2021 | Dec 31, 2020 | |||||||||
| Risk participation agreements: | |||||||||||
|
Maximum potential amount of exposure
|
$ |
|
$ |
|
|||||||
| Total return swaps: | |||||||||||
| Cash collateral held |
|
|
|||||||||
Truist Financial Corporation 33
The following table summarizes collateral positions with counterparties:
| (Dollars in millions) | Mar 31, 2021 | Dec 31, 2020 | |||||||||
| Dealer and other counterparties: | |||||||||||
| Cash and other collateral received from counterparties | $ |
|
$ |
|
|||||||
| Derivatives in a net gain position secured by collateral received |
|
|
|||||||||
|
Unsecured positions in a net gain with counterparties after collateral postings
|
|
|
|||||||||
| Cash collateral posted to dealer counterparties |
|
|
|||||||||
| Derivatives in a net loss position secured by collateral |
|
|
|||||||||
|
Additional collateral that would have been posted had the Company’s credit ratings dropped below investment grade
|
|
|
|||||||||
| Central counterparties clearing: | |||||||||||
| Cash collateral, including initial margin, posted to central clearing parties |
|
|
|||||||||
| Derivatives in a net loss position |
|
|
|||||||||
| Derivatives in a net gain position |
|
|
|||||||||
| Securities pledged to central counterparties clearing |
|
|
|||||||||
NOTE 16.
Computation of EPS
Basic and diluted EPS calculations are presented in the following table:
|
Three Months Ended March 31,
(Dollars in millions, except per share data, shares in thousands) |
2021 | 2020 | |||||||||
| Net income available to common shareholders | $ |
|
$ |
|
|||||||
| Weighted average number of common shares |
|
|
|||||||||
| Effect of dilutive outstanding equity-based awards |
|
|
|||||||||
| Weighted average number of diluted common shares |
|
|
|||||||||
| Basic EPS | $ |
|
$ |
|
|||||||
| Diluted EPS | $ |
|
$ |
|
|||||||
| Anti-dilutive awards |
|
|
|||||||||
NOTE 17.
Operating Segments
34 Truist Financial Corporation
The following table presents results by segment:
|
Three Months Ended March 31,
(Dollars in millions) |
CB&W | C&CB | IH | OT&C (1) | Total | ||||||||||||||||||||||||||||||||||||||||||||||||||||||
| 2021 | 2020 | 2021 | 2020 | 2021 | 2020 | 2021 | 2020 | 2021 | 2020 | ||||||||||||||||||||||||||||||||||||||||||||||||||
| Net interest income (expense) | $ |
|
$ |
|
$ |
|
$ |
|
$ |
|
$ |
|
$ |
|
$ |
|
$ |
|
$ |
|
|||||||||||||||||||||||||||||||||||||||
| Net intersegment interest income (expense) |
|
|
|
(
|
(
|
(
|
(
|
(
|
|
|
|||||||||||||||||||||||||||||||||||||||||||||||||
| Segment net interest income |
|
|
|
|
|
|
(
|
|
|
|
|||||||||||||||||||||||||||||||||||||||||||||||||
| Allocated provision for credit losses |
|
|
(
|
|
|
|
(
|
|
|
|
|||||||||||||||||||||||||||||||||||||||||||||||||
| Segment net interest income after provision |
|
|
|
|
|
|
(
|
(
|
|
|
|||||||||||||||||||||||||||||||||||||||||||||||||
| Noninterest income |
|
|
|
|
|
|
(
|
(
|
|
|
|||||||||||||||||||||||||||||||||||||||||||||||||
| Amortization of intangibles |
|
|
|
|
|
|
|
|
|
|
|||||||||||||||||||||||||||||||||||||||||||||||||
| Other noninterest expense |
|
|
|
|
|
|
|
|
|
|
|||||||||||||||||||||||||||||||||||||||||||||||||
| Income (loss) before income taxes |
|
|
|
|
|
|
(
|
(
|
|
|
|||||||||||||||||||||||||||||||||||||||||||||||||
| Provision (benefit) for income taxes |
|
|
|
|
|
|
(
|
(
|
|
|
|||||||||||||||||||||||||||||||||||||||||||||||||
| Segment net income (loss) | $ |
|
$ |
|
$ |
|
$ |
|
$ |
|
$ |
|
$ |
(
|
$ |
(
|
$ |
|
$ |
|
|||||||||||||||||||||||||||||||||||||||
| Identifiable assets (period end) | $ |
|
$ |
|
$ |
|
$ |
|
$ |
|
$ |
|
$ |
|
$ |
|
$ |
|
$ |
|
|||||||||||||||||||||||||||||||||||||||
(1)
Includes financial data from business units below the quantitative and qualitative thresholds requiring disclosure.
Truist Financial Corporation 35
ITEM 2. MANAGEMENT’S DISCUSSION AND ANALYSIS OF FINANCIAL CONDITION AND RESULTS OF OPERATIONS
MD&A is intended to assist readers in their analysis of the accompanying Consolidated Financial Statements and supplemental financial information. It should be read in conjunction with the Consolidated Financial Statements, the accompanying Notes to the Consolidated Financial Statements in this Form 10-Q, other information contained in this document, as well as with Truist’s Annual Report on Form 10-K for the year ended December 31, 2020.
Regulatory Considerations
The regulatory framework applicable to banking organizations is intended primarily for the protection of depositors and the stability of the financial system, rather than for the protection of shareholders and creditors. Truist is subject to banking laws and regulations, and various other laws and regulations, which affect the operations and management of Truist and its ability to make distributions to shareholders. Truist and its subsidiaries are also subject to supervision and examination by multiple regulators. Refer to Truist’s Annual Report on Form 10-K for the year ended December 31, 2020 for additional disclosures with respect to significant laws and regulations affecting Truist.
The descriptions below summarize updates since the filing of the Annual Report on Form 10-K for the year ended December 31, 2020 to state and federal laws to which Truist is subject. These descriptions do not summarize all possible or proposed changes in current laws or regulations, and are not intended to be a substitute for the related statues or regulatory provisions.
On March 19, 2021, the FRB announced the temporary exclusion of U.S. Treasury securities and deposits at the FRB from the calculation of the supplementary leverage ratio will expire as scheduled on March 31, 2021; this temporary relief added 24 basis points to the Company’s supplementary leverage ratio as of March 31, 2021. The FRB also announced plans to propose several potential modifications to the supplementary leverage ratio to ensure that the supplementary leverage ratio remains effective in an environment of higher reserves, though such proposal had not been published as of the date of this report.
Executive Overview
Truist had a strong financial performance in the first quarter of 2021 and several significant milestones that are reflective of its purpose in action. Truist continues to closely monitor the COVID-19 pandemic and its effects on stakeholders and the financial markets and is actively supporting teammates, clients, and communities. Truist also continues to make significant progress on Merger integration and conversion efforts.
Integration Efforts
Recent highlights include:
•
Truist reaffirmed its commitment to achieving $1.6 billion in net cost saves on a run rate basis by the fourth quarter of 2022.
•
Completed the Wealth brokerage and trust transitions.
•
Continued the mortgage transition, enabling clients to get the best of both heritage SunTrust and heritage BB&T to meet their homeownership needs.
•
Activated the Integrated Relationship Management approach. Truist’s Integrated Relationship Management approach is designed to deepen client relationships that brings the full breadth and depth of products and services to meet clients’ financial needs.
•
Completed testing protocols for core bank transition events.
•
Launched teammate pilot program for digital experience.
Supporting Clients
Truist is continuing to work closely with clients as they experience challenges from the COVID-19 pandemic. Truist supported clients by being the sixth largest commercial bank in the second round of PPP funding and through the forgiveness process, and continues to support clients as they transition from payment relief programs. The carrying value of PPP loans was $10.1 billion as of March 31, 2021.
Supporting Teammates
This quarter, Truist signed the Hispanic Promise, a first-of-its-kind national pledge to prepare, hire, promote, retain, and celebrate Hispanics in the workplace. Truist was also recognized for its commitment to stand for better by the Human Rights Campaign’s Corporate Equality Index with a perfect 100 score, by ‘FORTUNE ’ as one of the world’s most admired companies, and as a top 50 employer by both ‘Equal Opportunity’ and ‘CAREERS & the disABLED’ magazines.
36 Truist Financial Corporation
Supporting Communities
In February 2021, Truist issued its first social bond for $1.3 billion, becoming the first U.S. regional bank to issue a social bond. Truist also became the lead investor for Greenwood, an innovative digital banking platform designed for Black and Latinx consumers and business owners. In addition, Truist received an ‘Outstanding’ CRA rating for its community development efforts and continued to make great progress towards the Company’s $60 billion Community Benefits Plan, after ending 2020 at 114 percent of the annual target.
Financial Results
Net income available to common shareholders for the first quarter of 2021 totaled $1.3 billion, up 35.3 percent, compared with the first quarter last year. On a diluted per common share basis, earnings for the first quarter of 2021 were $0.98, an increase of $0.25 compared to the first quarter of 2020. Truist’s results of operations for the first quarter of 2021 produced an annualized return on average assets of 1.17 percent and an annualized return on average common shareholders’ equity of 8.69 percent compared to prior year returns of 0.90 percent and 6.58 percent, respectively. Results for the first quarter of 2021 included merger-related and restructuring charges of $141 million ($108 million after-tax), incremental operating expenses related to the Merger of $175 million ($134 million after-tax), and an acceleration of loss recognition related to certain terminated cash flow hedges of $36 million ($28 million after-tax). Results for the first quarter of 2020 included $107 million ($82 million after-tax) of merger-related and restructuring charges and $74 million ($57 million after-tax) of incremental operating expenses related to the Merger.
Truist’s revenue for the first quarter of 2021 was $5.5 billion. On a TE basis, revenue was also $5.5 billion for the first quarter of 2021, a decrease of $138 million compared to the same period in 2020, reflecting a decrease of $374 million in TE net interest income, and an increase of $236 million in noninterest income.
NIM was 3.01 percent for the first quarter of 2021, down 57 basis points compared to the prior year. Average earning assets increased $30.4 billion, as average securities increased $46.5 billion, partially offset by a decline in average loans and leases of $8.2 billion, and average other earning assets of $6.3 billion. Average interest-bearing liabilities decreased $7.8 billion and noninterest-bearing deposits increased $35.4 billion. The annualized TE yield on the total loan portfolio for the first quarter of 2021 was 4.09 percent, down 89 basis points compared to the prior year. The annualized TE yield on the average securities portfolio was 1.45 percent, down 117 basis points compared to the prior year. The average costs of interest-bearing liabilities was 0.28 percent, down 74 basis points compared to the prior year.
The provision for credit losses was $48 million compared to $893 million for the first quarter of 2020. The earlier quarter included an increase to the ACL for the significant uncertainty of the economic impacts resulting from the onset of the pandemic. Net charge-offs for the first quarter of 2021 totaled $238 million compared to $272 million in the earlier quarter. The net charge-off rate for the current quarter of 0.33 percent was down three basis points compared to the first quarter of 2020.
Noninterest income for the first quarter of 2021 increased $236 million compared to the earlier quarter, driven by increases in insurance income of $77 million, and investment banking and trading income of $222 million. Other income increased $76 million primarily due to income from assets held for certain post-retirement benefits, which is primarily offset by higher personnel expense. Other income also includes a $37 million gain from the divestiture of certain businesses, which was mostly offset by gains from credit default swaps recorded in the earlier quarter. Lending related fees increased $33 million. These increases were partially offset by a decline in residential mortgage income of $145 million, as well as a decline in service charges on deposits of $47 million.
Noninterest expense for the first quarter of 2021 was up $179 million compared to the earlier quarter. Merger-related and restructuring charges increased $34 million and other incremental operating expenses related to the Merger increased $101 million. The current quarter also includes $36 million of expense associated with an acceleration of loss recognition related to certain terminated cash flow hedges. Excluding the items mentioned above, changes in amortization of intangibles, and a small gain from debt extinguishment, adjusted noninterest expense was up $32 million compared to the earlier quarter. Additionally, increases in personnel expense of $170 million were partially offset by declines in net occupancy expense, marketing and customer development, and operating lease depreciation.
The provision for income taxes was $351 million for the first quarter of 2021, compared to $224 million for the earlier quarter. This produced an effective tax rate for the first quarter of 2021 of 19.2 percent, compared to 17.4 percent for the earlier quarter. The higher effective tax rate in the first quarter of 2021 was primarily due to higher pre-tax income and discrete tax expenses resulting from the divestiture of certain businesses in the current year.
Truist’s total assets at March 31, 2021 were $517.5 billion, an increase of $8.3 billion compared to December 31, 2020. The increase in total assets was primarily a result of an increase of $13.2 billion in interest-bearing deposits driving higher balances held at the Federal Reserve and an increase of $3.0 billion in AFS securities. These increases were partially offset by an $8.6 billion decline in total loans and leases.
Truist Financial Corporation 37
Total deposits at March 31, 2021 were $395.6 billion, an increase of $14.5 billion compared to December 31, 2020. Deposit growth was strong for the first quarter of 2021 driven by growth resulting from additional government stimulus programs and pandemic-related client behavior, partially offset by a decrease in time deposits primarily due to the maturity of wholesale negotiable certificates of deposit and higher-cost personal accounts.
Asset quality ratios were stable at March 31, 2021. As of March 31, 2021, nonperforming assets were 0.25 percent of total assets. The allowance for loan and lease loss coverage ratio was 4.84x nonperforming loans and leases held for investment, compared to 4.39x at December 31, 2020.
Truist maintained strong capital and liquidity. As of March 31, 2021, the CET1 ratio was 10.1 percent and the average LCR was 111 percent. During the first quarter of 2021, Truist completed $506 million of share repurchases and also redeemed $950 million of preferred stock. The Company issued $1.3 billion of senior long-term debt. In connection with the redemptions of preferred stock, net income available to common shareholders was reduced by $26 million to recognize the difference between the redemption price and the carrying value. Truist declared common dividends of $0.45 per share during the first quarter of 2021, resulting in dividend and total payout ratios for the first quarter of 2021 of 45.4 percent and 83.3 percent, respectively. In April 2021, Truist declared common dividends of $0.45 per share for the second quarter of 2021. Additionally in April 2021, the Company announced the redemption of $465 million in preferred stock for Series H.
Analysis of Results of Operations
Net Interest Income and NIM
First Quarter 2021 compared to First Quarter 2020
Net interest margin was 3.01 percent, down 57 basis points compared to the earlier quarter. The yield on the total loan portfolio for the first quarter of 2021 was 4.09 percent, down 89 basis points compared to the earlier quarter, reflecting the impact of rate decreases and lower purchase accounting accretion from merged loans. The yield on the average securities portfolio was 1.45 percent, down 117 basis points compared to the earlier quarter primarily due to lower yields on new purchases.
The average cost of total deposits was 0.05 percent, down 46 basis points compared to the earlier quarter and the average cost of interest-bearing deposits was 0.07 percent, down 63 basis points compared to the earlier quarter. The average rate on short-term borrowings was 0.82 percent, down 94 basis points compared to the earlier quarter. The average rate on long-term debt was 1.57 percent, down 77 basis points compared to the earlier quarter. The lower rates on interest-bearing liabilities reflect the lower rate environment.
As of March 31, 2021, the remaining unamortized fair value marks on the loan and lease portfolio, deposits, and long-term debt were $2.1 billion, $15 million, and $196 million, respectively. The remaining unamortized fair value mark on loans and leases consists of $1.1 billion for consumer loans and leases, and $978 million for commercial loans and leases. These amounts will be recognized over the remaining contractual lives of the underlying instruments or as paydowns occur.
The major components of net interest income and the related annualized yields as well as the variances between the periods caused by changes in interest rates versus changes in volumes are summarized below.
38 Truist Financial Corporation
| Table 1: Taxable-Equivalent Net Interest Income and Rate / Volume Analysis (1) | |||||||||||||||||||||||||||||||||||||||||||||||||||||
|
Three Months Ended March 31,
(Dollars in millions) |
Average Balances (5) | Annualized Yield/Rate | Income/Expense |
Incr.
(Decr.) |
Change due to | ||||||||||||||||||||||||||||||||||||||||||||||||
| 2021 | 2020 | 2021 | 2020 | 2021 | 2020 | Rate | Volume | ||||||||||||||||||||||||||||||||||||||||||||||
| Assets | |||||||||||||||||||||||||||||||||||||||||||||||||||||
| Total securities, at amortized cost: (2) | |||||||||||||||||||||||||||||||||||||||||||||||||||||
| U.S. Treasury | $ | 1,759 | $ | 2,274 | 0.89 | % | 1.93 | % | $ | 4 | $ | 11 | $ | (7) | $ | (5) | $ | (2) | |||||||||||||||||||||||||||||||||||
| GSE | 1,839 | 1,856 | 2.33 | 2.33 | 11 | 10 | 1 | — | 1 | ||||||||||||||||||||||||||||||||||||||||||||
| Agency MBS | 118,171 | 70,816 | 1.44 | 2.60 | 426 | 461 | (35) | (257) | 222 | ||||||||||||||||||||||||||||||||||||||||||||
| States and political subdivisions | 444 | 530 | 3.52 | 3.56 | 4 | 5 | (1) | — | (1) | ||||||||||||||||||||||||||||||||||||||||||||
| Non-agency MBS | — | 185 | — | 16.72 | — | 8 | (8) | (4) | (4) | ||||||||||||||||||||||||||||||||||||||||||||
| Other | 33 | 40 | 1.92 | 3.01 | — | — | — | — | — | ||||||||||||||||||||||||||||||||||||||||||||
| Total securities | 122,246 | 75,701 | 1.45 | 2.62 | 445 | 495 | (50) | (266) | 216 | ||||||||||||||||||||||||||||||||||||||||||||
| Interest earning trading assets | 4,742 | 6,334 | 2.79 | 4.04 | 32 | 64 | (32) | (18) | (14) | ||||||||||||||||||||||||||||||||||||||||||||
| Other earning assets (3) | 17,417 | 23,750 | 0.37 | 1.55 | 16 | 92 | (76) | (56) | (20) | ||||||||||||||||||||||||||||||||||||||||||||
| Loans and leases, net of unearned income: (4) | |||||||||||||||||||||||||||||||||||||||||||||||||||||
| Commercial and industrial | 136,051 | 131,743 | 3.10 | 4.33 | 1,040 | 1,419 | (379) | (423) | 44 | ||||||||||||||||||||||||||||||||||||||||||||
| CRE | 26,211 | 27,046 | 2.90 | 4.25 | 189 | 287 | (98) | (89) | (9) | ||||||||||||||||||||||||||||||||||||||||||||
| Commercial Construction | 6,557 | 6,409 | 3.04 | 4.87 | 48 | 76 | (28) | (30) | 2 | ||||||||||||||||||||||||||||||||||||||||||||
| Lease financing | 4,975 | 6,070 | 4.28 | 4.27 | 53 | 65 | (12) | — | (12) | ||||||||||||||||||||||||||||||||||||||||||||
| Residential mortgage | 45,823 | 52,993 | 4.42 | 4.48 | 507 | 594 | (87) | (8) | (79) | ||||||||||||||||||||||||||||||||||||||||||||
| Residential home equity and direct | 25,658 | 27,564 | 5.81 | 6.60 | 368 | 452 | (84) | (53) | (31) | ||||||||||||||||||||||||||||||||||||||||||||
| Indirect auto | 26,363 | 24,975 | 6.56 | 6.89 | 426 | 428 | (2) | (23) | 21 | ||||||||||||||||||||||||||||||||||||||||||||
| Indirect other | 10,848 | 10,950 | 6.98 | 7.37 | 187 | 201 | (14) | (12) | (2) | ||||||||||||||||||||||||||||||||||||||||||||
| Student | 7,519 | 7,787 | 3.96 | 5.38 | 73 | 104 | (31) | (28) | (3) | ||||||||||||||||||||||||||||||||||||||||||||
| Credit card | 4,645 | 5,534 | 9.24 | 9.68 | 106 | 133 | (27) | (6) | (21) | ||||||||||||||||||||||||||||||||||||||||||||
| Total loans and leases HFI | 294,650 | 301,071 | 4.11 | 5.02 | 2,997 | 3,759 | (762) | (672) | (90) | ||||||||||||||||||||||||||||||||||||||||||||
| LHFS | 4,891 | 6,677 | 2.59 | 3.14 | 32 | 53 | (21) | (8) | (13) | ||||||||||||||||||||||||||||||||||||||||||||
| Total loans and leases | 299,541 | 307,748 | 4.09 | 4.98 | 3,029 | 3,812 | (783) | (680) | (103) | ||||||||||||||||||||||||||||||||||||||||||||
| Total earning assets | 443,946 | 413,533 | 3.20 | 4.33 | 3,522 | 4,463 | (941) | (1,020) | 79 | ||||||||||||||||||||||||||||||||||||||||||||
| Nonearning assets | 64,887 | 64,017 | |||||||||||||||||||||||||||||||||||||||||||||||||||
| Total assets | $ | 508,833 | $ | 477,550 | |||||||||||||||||||||||||||||||||||||||||||||||||
| Liabilities and Shareholders’ Equity | |||||||||||||||||||||||||||||||||||||||||||||||||||||
| Interest-bearing deposits: | |||||||||||||||||||||||||||||||||||||||||||||||||||||
| Interest-checking | $ | 104,744 | $ | 85,008 | 0.06 | 0.61 | 15 | 129 | (114) | (138) | 24 | ||||||||||||||||||||||||||||||||||||||||||
| Money market and savings | 129,303 | 120,936 | 0.03 | 0.59 | 10 | 178 | (168) | (179) | 11 | ||||||||||||||||||||||||||||||||||||||||||||
| Time deposits | 20,559 | 35,570 | 0.44 | 1.29 | 22 | 114 | (92) | (56) | (36) | ||||||||||||||||||||||||||||||||||||||||||||
| Total interest-bearing deposits (6) | 254,606 | 241,514 | 0.07 | 0.70 | 47 | 421 | (374) | (373) | (1) | ||||||||||||||||||||||||||||||||||||||||||||
| Short-term borrowings | 6,731 | 18,900 | 0.82 | 1.76 | 14 | 83 | (69) | (31) | (38) | ||||||||||||||||||||||||||||||||||||||||||||
| Long-term debt | 37,820 | 46,547 | 1.57 | 2.34 | 148 | 272 | (124) | (79) | (45) | ||||||||||||||||||||||||||||||||||||||||||||
| Total interest-bearing liabilities | 299,157 | 306,961 | 0.28 | 1.02 | 209 | 776 | (567) | (483) | (84) | ||||||||||||||||||||||||||||||||||||||||||||
| Noninterest-bearing deposits (6) | 128,579 | 93,135 | |||||||||||||||||||||||||||||||||||||||||||||||||||
| Other liabilities | 11,050 | 12,042 | |||||||||||||||||||||||||||||||||||||||||||||||||||
| Shareholders’ equity | 70,047 | 65,412 | |||||||||||||||||||||||||||||||||||||||||||||||||||
| Total liabilities and shareholders’ equity | $ | 508,833 | $ | 477,550 | |||||||||||||||||||||||||||||||||||||||||||||||||
| Average interest-rate spread | 2.92 | % | 3.31 | % | |||||||||||||||||||||||||||||||||||||||||||||||||
| NIM/net interest income | 3.01 | % | 3.58 | % | $ | 3,313 | $ | 3,687 | $ | (374) | $ | (537) | $ | 163 | |||||||||||||||||||||||||||||||||||||||
| Taxable-equivalent adjustment | $ | 28 | $ | 37 | |||||||||||||||||||||||||||||||||||||||||||||||||
(1) Yields are stated on a TE basis utilizing federal tax rate. The change in interest not solely due to changes in rate or volume has been allocated based on the pro-rata absolute dollar amount of each. Interest income includes certain fees, deferred costs, and dividends.
(2) Total securities include AFS securities.
(3) Includes cash equivalents, interest-bearing deposits with banks, FHLB stock and other earning assets.
(4) Fees, which are not material for any of the periods shown, are included for rate calculation purposes. NPLs are included in the average balances.
(5) Excludes basis adjustments for fair value hedges.
(6) Total deposit costs were 0.05 percent and 0.51 percent for the three months ended March 31, 2021 and 2020, respectively.
Truist Financial Corporation 39
Provision for Credit Losses
First Quarter 2021 compared to First Quarter 2020
The provision for credit losses was $48 million, compared to $893 million for the earlier quarter. The earlier quarter included the significant uncertainty of the economic impacts resulting from the onset of the pandemic. Net charge-offs for the first quarter of 2021 totaled $238 million compared to $272 million in the earlier quarter. The net charge-off rate for the current quarter of 0.33 percent was down three basis points compared to the first quarter of 2020.
Noninterest Income
Noninterest income is a significant contributor to Truist’s financial results. Management focuses on diversifying its sources of revenue to reduce Truist’s reliance on traditional spread-based interest income, as certain fee-based activities are a relatively stable revenue source during periods of changing interest rates.
| Table 2: Noninterest Income | |||||||||||||||||
|
Three Months Ended March 31,
(Dollars in millions) |
% Change | ||||||||||||||||
| 2021 | 2020 | 2021 vs. 2020 | |||||||||||||||
| Insurance income | $ | 626 | $ | 549 | 14.0 | % | |||||||||||
| Wealth management income | 341 | 332 | 2.7 | ||||||||||||||
| Service charges on deposits | 258 | 305 | (15.4) | ||||||||||||||
| Residential mortgage income | 100 | 245 | (59.2) | ||||||||||||||
| Investment banking and trading income | 340 | 118 | 188.1 | ||||||||||||||
| Card and payment related fees | 200 | 187 | 7.0 | ||||||||||||||
| Lending related fees | 100 | 67 | 49.3 | ||||||||||||||
| Operating lease income | 68 | 77 | (11.7) | ||||||||||||||
| Commercial real estate related income | 43 | 44 | (2.3) | ||||||||||||||
| Income from bank-owned life insurance | 50 | 44 | 13.6 | ||||||||||||||
| Securities gains (losses) | — | (2) | NM | ||||||||||||||
| Other income (loss) | 71 | (5) | NM | ||||||||||||||
| Total noninterest income | $ | 2,197 | $ | 1,961 | 12.0 | ||||||||||||
First Quarter 2021 compared to First Quarter 2020
Noninterest income for the first quarter of 2021 increased $236 million compared to the earlier quarter. Investment banking and trading income increased $222 million due to the impact from CVA recoveries in the current period compared to losses in the earlier quarter and strong investment banking income from equity originations, loan syndications, and asset securitization transactions. Insurance income increased $77 million due to new business and higher retention, as well as acquisitions. Other income increased $76 million primarily due to income from assets held for certain post-retirement benefits, which was primarily offset by higher personnel expense. Other income also includes a $37 million gain from the divestiture of certain businesses, which was mostly offset by gains from credit default swaps recorded in the earlier quarter. Lending related fees increased $33 million due to gains from the sale of finance leases. Residential mortgage banking income decreased $145 million primarily due to lower production related revenues as a result of lower gain on sale margins and volumes, as well as lower servicing income due to a reduction in the third-party servicing portfolio as a result of prepayments. Service charges on deposits decreased $47 million due to reduced overdraft incident rates.
40 Truist Financial Corporation
Noninterest Expense
The following table provides a breakdown of Truist’s noninterest expense:
| Table 3: Noninterest Expense | |||||||||||||||||
|
Three Months Ended March 31,
(Dollars in millions) |
% Change | ||||||||||||||||
| 2021 | 2020 | 2021 vs. 2020 | |||||||||||||||
| Personnel expense | $ | 2,142 | $ | 1,972 | 8.6 | % | |||||||||||
| Professional fees and outside processing | 350 | 247 | 41.7 | ||||||||||||||
| Net occupancy expense | 209 | 221 | (5.4) | ||||||||||||||
| Software expense | 210 | 210 | — | ||||||||||||||
| Amortization of intangibles | 144 | 165 | (12.7) | ||||||||||||||
| Equipment expense | 113 | 116 | (2.6) | ||||||||||||||
| Marketing and customer development | 66 | 84 | (21.4) | ||||||||||||||
| Operating lease depreciation | 50 | 71 | (29.6) | ||||||||||||||
| Loan-related expense | 54 | 62 | (12.9) | ||||||||||||||
| Regulatory costs | 25 | 29 | (13.8) | ||||||||||||||
| Merger-related and restructuring charges | 141 | 107 | 31.8 | ||||||||||||||
| Loss (gain) on early extinguishment of debt | (3) | — | NM | ||||||||||||||
| Other expense | 109 | 147 | (25.9) | ||||||||||||||
| Total noninterest expense | $ | 3,610 | $ | 3,431 | 5.2 | ||||||||||||
First Quarter 2021 compared to First Quarter 2020
Noninterest expense for the first quarter of 2021 was up $179 million compared to the earlier quarter. Merger-related and restructuring charges increased $34 million and other incremental operating expenses related to the Merger increased $101 million, primarily reflected in professional fees and outside processing. The current quarter also includes $36 million of expense associated with an acceleration of loss recognition related to certain terminated cash flow hedges. Excluding the items mentioned above and changes in amortization of intangibles and a small gain from debt extinguishment, adjusted noninterest expense was up $32 million compared to the earlier quarter. Personnel expense increased $170 million primarily due to higher incentive expenses due to improved performance, higher equity-based compensation expense, higher other employee benefits, partially offset by lower salaries due to fewer FTEs. Other expense also includes decreases of $42 million for non-service-related pension cost components and $20 million for teammate travel. There was also a decrease of $51 million from net occupancy expense, marketing and customer development and operating lease depreciation.
Merger-Related and Restructuring Charges
The following table presents a summary of merger-related and restructuring charges and the related accruals:
| Table 4: Merger-Related and Restructuring Accrual Activity | |||||||||||||||||||||||
| (Dollars in millions) | Accrual at Jan 1, 2021 | Expense | Utilized | Accrual at Mar 31, 2021 | |||||||||||||||||||
| Severance and personnel-related | $ | 36 | $ | 26 | $ | (50) | $ | 12 | |||||||||||||||
| Occupancy and equipment | — | 54 | (54) | — | |||||||||||||||||||
| Professional services | 16 | 54 | (41) | 29 | |||||||||||||||||||
|
Systems conversion and related costs
|
— | 7 | (7) | — | |||||||||||||||||||
| Other | 11 | — | — | 11 | |||||||||||||||||||
| Total (1) | $ | 63 | $ | 141 | $ | (152) | $ | 52 | |||||||||||||||
(1)
The Company recognized $130 million of expenses for the three months ended March 31, 2021 related to the Merger. At March 31, 2021, the Company had an accrual of $42 million related to the Merger. The remaining expense and accrual relate to other restructuring activities.
Truist Financial Corporation 41
Segment Results
See “Note 17. Operating Segments” herein and “Note 21. Operating Segments” in Truist’s Annual Report on Form 10-K for the year ended December 31, 2020 for additional disclosures related to Truist’s reportable business segments, including additional details related to results of operations. Fluctuations in noninterest income and noninterest expense are more fully discussed in the Noninterest Income and Noninterest Expense sections above.
| Table 5: Net Income by Reportable Segment | |||||||||||||||||
|
Three Months Ended March 31,
(Dollars in millions) |
2021 | 2020 | % Change | ||||||||||||||
| Consumer Banking and Wealth | $ | 803 | $ | 675 | 19.0 | % | |||||||||||
| Corporate and Commercial Banking | 908 | 421 | 115.7 | ||||||||||||||
| Insurance Holdings | 131 | 105 | 24.8 | ||||||||||||||
| Other, Treasury & Corporate | (369) | (138) | 167.4 | ||||||||||||||
| Truist Financial Corporation | $ | 1,473 | $ | 1,063 | 38.6 | ||||||||||||
First Quarter 2021 compared to First Quarter 2020
Consumer Banking and Wealth
CB&W serves individuals and small business clients by offering a variety of loan and deposit products, payment services, bankcard products, and other financial services. CB&W includes Retail Community Bank, which provides banking, borrowing, investing, insurance solutions, and advice through Premier Banking to individuals and small business clients through an extensive network of branches and ATMs, digital channels, and contact centers. Financial products and services offered include deposits and payments, credit cards, loans, mortgages, brokerage and investment advisory services, and insurance solutions. CB&W also includes Dealer Retail Services, which originates loans on an indirect basis to individuals for the purchase of automobiles, boats, and recreational vehicles. Additionally, CB&W includes National Consumer Finance and Payments, which provides a comprehensive set of technology-enabled lending solutions to individuals and small businesses through several national channels, as well as merchant services and payment processing solutions to business clients. CB&W also includes Mortgage Banking, which offers residential mortgage products nationally through its retail and correspondent channels, the internet, and by telephone. These products are either sold in the secondary market, primarily with servicing rights retained or held in the Company’s loan portfolio. Mortgage Banking also services loans for other investors, in addition to loans held in the Company’s loan portfolio. Mortgage Banking also includes Mortgage Warehouse Lending, which provides short-term lending solutions to finance first-lien residential mortgage LHFS by independent mortgage companies. Wealth delivers investment management, financial planning, banking, fiduciary services, and related solutions to institutions, affluent and high net worth individuals, and families, with financial expertise and industry-specific insights in the medical, legal, sports, and entertainment industries.
CB&W net income was $803 million for the first quarter of 2021, an increase of $128 million compared to the earlier quarter. Segment net interest income decreased $119 million primarily due to a decline in the funding credit provided on liabilities and lower purchase accounting accretion. Noninterest income decreased $145 million driven by lower residential mortgage income due to lower gain on sale margins and volumes, partially offset by gains from the divestiture of certain businesses. The allocated provision for credit losses decreased $337 million reflecting an allowance build during the first quarter of 2020 resulting from the deteriorating economic outlook caused by the onset of the pandemic, as well as a benefit from lower charge offs in the auto portfolios compared to the prior year. Noninterest expense decreased $94 million primarily due to lower amortization of intangibles, merger-related expenses, and occupancy expenses in the current quarter.
CB&W average loans held for investment decreased $6.4 billion for the first quarter of 2021 compared to the earlier quarter, primarily driven by lower residential mortgage lending due to elevated prepayments and home equity lending, partially offset by increased mortgage warehouse lending and indirect auto lending. Average total deposits increased $30.6 billion for the first quarter of 2021 compared to the earlier quarter primarily due to the impact of the government stimulus programs and lower consumer spending.
42 Truist Financial Corporation
Corporate and Commercial Banking
C&CB serves large, medium, and small business clients by offering a variety of loan and deposit products, and connecting clients to the combined organization’s broad array of financial services. C&CB includes Corporate and Investment Banking, which delivers a comprehensive range of strategic advisory, capital raising, risk management, financing, liquidity, and investment solutions to both public and private companies in the C&CB segment and Wealth. Additionally, C&CB includes Commercial Community Banking, which offers an array of traditional banking products, including lending, cash management and investment banking to commercial clients via Corporate and Investment Banking. C&CB also includes Commercial Real Estate, which provides a range of credit and deposit services as well as fee-based product offerings to privately held developers, operators and investors in commercial real estate properties. C&CB also includes Grandbridge Real Estate Capital, which is a fully integrated commercial mortgage banking company that originates commercial and multi-family real estate loans, services loan portfolios, provides asset and portfolio management, as well as real estate brokerage services. Treasury Solutions, within C&CB, provides business clients across the organization with services required to manage their payments and receipts, combined with the ability to manage and optimize their deposits across all aspects of their business.
C&CB net income was $908 million for the first quarter of 2021, an increase of $487 million compared to the earlier quarter. Segment net interest income decreased $114 million primarily due to reduced funding credit on liabilities and lower purchase accounting accretion. Noninterest income increased $237 million driven by investment banking, recovery of previously recorded CVA losses and lending related fees. The allocated provision for credit losses decreased $434 million primarily reflecting the impact of a significant allowance build in the first quarter of 2020 resulting from the deteriorating economic outlook caused by the onset of the pandemic. Noninterest expense decreased $87 million primarily due to lower personnel related expenses, merger-related expenses, and operating lease depreciation in the current quarter.
C&CB average loans held for investment decreased $418 million for the first quarter of 2021 compared to the earlier quarter, primarily due to reduced dealer floor plan and commercial real estate lending as well as lower utilization rates for corporate client lines offset by growth in commercial and industrial loans through the PPP. Average total deposits increased $21.9 billion for the first quarter of 2021 compared to the earlier quarter, primarily due to government stimulus programs and reduced spending from commercial clients.
Insurance Holdings
Truist’s IH segment is one of the largest insurance brokers in the world, providing property and casualty, employee benefits and life insurance to businesses and individuals. It also provides small business and corporate services, such as workers compensation and professional liability, as well as surety coverage and title insurance. In addition, IH provides premium financing for property and casualty insurance.
IH net income was $131 million for the first quarter of 2021, an increase of $26 million compared to the earlier quarter. Noninterest income increased $76 million primarily due to higher property and casualty insurance production, as well as acquisitions. Noninterest expense increased $39 million primarily due to higher performance-based incentives and amortization of intangibles related to the acquisitions.
Other, Treasury & Corporate
Net income in OT&C can vary due to the changing needs of the Corporation, including the size of the investment portfolio, the need for wholesale funding and variability associated with derivatives used to hedge the balance sheet.
OT&C generated a net loss of $369 million in the first quarter of 2021, compared to a net loss of $138 million in the earlier quarter. Segment net interest income decreased $127 million primarily due to lower net funding charges to other segments due to lower market rates, partially offset by lower interest expense on borrowings. Noninterest income increased $68 million primarily due to income from assets held for certain post-retirement benefits. The allocated provision for credit losses decreased $74 million due to changes in the reserve for unfunded commitments and an allowance build in the earlier quarter resulting from the onset of the pandemic. Noninterest expense increased $321 million primarily due to higher incremental operating expenses related to the Merger and higher merger-related charges in the current quarter. The benefit for income taxes increased $75 million primarily due to a higher pre-tax loss in the current quarter.
Truist Financial Corporation 43
Analysis of Financial Condition
Investment Activities
The securities portfolio totaled $123.8 billion at March 31, 2021, compared to $120.8 billion at December 31, 2020. The increase was due primarily to a $3.0 billion increase in Agency MBS, reflecting the redeployment of excess liquidity associated with deposit inflows during the quarter.
As of March 31, 2021, approximately 1.6 percent of the securities portfolio was variable rate, compared to 1.9 percent as of December 31, 2020. The effective duration of the securities portfolio was 6.0 years at March 31, 2021, compared to 4.0 years at December 31, 2020.
U.S. Treasury, GSE, and Agency MBS represented 99.6 percent of the total securities portfolio as of March 31, 2021, unchanged compared to the prior year end.
Lending Activities
The following table presents the composition of average loans and leases:
| Table 6: Average Loans and Leases | ||||||||||||||||||||||||||||||||
|
For the Three Months Ended
(Dollars in millions)
|
Mar 31, 2021 | Dec 31, 2020 | Sep 30, 2020 | Jun 30, 2020 | Mar 31, 2020 | |||||||||||||||||||||||||||
| Commercial: | ||||||||||||||||||||||||||||||||
| Commercial and industrial | $ | 136,051 | $ | 139,223 | $ | 143,452 | $ | 152,991 | $ | 131,743 | ||||||||||||||||||||||
| CRE | 26,211 | 27,030 | 27,761 | 27,804 | 27,046 | |||||||||||||||||||||||||||
| Commercial construction | 6,557 | 6,616 | 6,861 | 6,748 | 6,409 | |||||||||||||||||||||||||||
| Lease financing | 4,975 | 5,401 | 5,626 | 5,922 | 6,070 | |||||||||||||||||||||||||||
| Consumer: | ||||||||||||||||||||||||||||||||
| Residential mortgage | 45,823 | 48,847 | 51,500 | 52,380 | 52,993 | |||||||||||||||||||||||||||
| Residential home equity and direct | 25,658 | 26,327 | 26,726 | 27,199 | 27,564 | |||||||||||||||||||||||||||
| Indirect auto | 26,363 | 25,788 | 24,732 | 24,721 | 24,975 | |||||||||||||||||||||||||||
| Indirect other | 10,848 | 11,291 | 11,530 | 11,282 | 10,950 | |||||||||||||||||||||||||||
| Student | 7,519 | 7,519 | 7,446 | 7,633 | 7,787 | |||||||||||||||||||||||||||
| Credit card | 4,645 | 4,818 | 4,810 | 4,949 | 5,534 | |||||||||||||||||||||||||||
| Total average loans and leases HFI | $ | 294,650 | $ | 302,860 | $ | 310,444 | $ | 321,629 | $ | 301,071 | ||||||||||||||||||||||
Average loans and leases held for investment for the first quarter of 2021 were $294.7 billion, down $8.2 billion compared to the fourth quarter of 2020.
Average commercial loans decreased $4.5 billion primarily due to a $1.8 billion decrease in average PPP loans, an $819 million decrease in average CRE loans, a $647 million decrease due to the transfer of $1.0 billion of certain loans and leases to held for sale late in the fourth quarter of 2020, and continued paydowns on revolving credit lines.
Average consumer loans decreased $3.6 billion primarily due to refinance activity resulting in a decline in residential mortgages and residential home equity and direct loans. This was partially offset by an increase in indirect auto loans.
44 Truist Financial Corporation
COVID-19 Lending Activities
The CARES Act created the PPP, which has temporarily expanded the Small Business Administration’s business loan guarantee program. The carrying value of PPP loans was $10.1 billion as of March 31, 2021. The CARES Act additionally includes provisions that were designed to encourage financial institutions to support borrowers impacted by COVID-19. These modifications are generally not considered a TDR. Refer to “Note 1. Basis of Presentation” in Truist’s Annual Report on Form 10-K for the year ended December 31, 2020 for additional disclosures related to modifications and TDRs. Payment relief assistance includes forbearance, deferrals, extension and re-aging programs, along with certain other modification strategies. The following table provides a summary of accommodations as of March 31, 2021:
| Table 7: Client Accommodations (1) | |||||||||||||||||||||||||||||
| Active Accommodations | Exited Accommodations | ||||||||||||||||||||||||||||
|
March 31, 2021
(Dollars in millions) |
Total Count | Outstanding Balance | Outstanding Balance | % Paid-off or Current (2) | Types of Accommodations | ||||||||||||||||||||||||
|
Commercial
|
659 | $ | 18 | $ | 20,550 | 97.8 | % | Clients may elect to defer loan or lease payments for up to 90 days without late fees being incurred but with finance charges continuing to accrue. | |||||||||||||||||||||
|
Consumer
|
48,339 | 1,721 | 9,266 | 90.8 |
Clients may elect to defer loan payments for time periods that generally range from 30 to 90 days without late fees being incurred but with finance charges generally continuing to accrue. The Company’s residential mortgage forbearance program generally provides up to 180 days of relief. Additional relief may be provided in certain circumstances.
|
||||||||||||||||||||||||
|
Credit card
|
3,574 | 19 | 180 | 88.3 | Clients may elect to defer payments for up to 90 days without late fees being incurred but with finance charges accruing. In addition, Truist provided credit card clients with 5 percent cash back on qualifying card purchases for certain important basic needs. | ||||||||||||||||||||||||
| Total | 52,572 | $ | 1,758 | $ | 29,996 | ||||||||||||||||||||||||
(1)
Excludes approximately 36,000 of active accommodations related to government guaranteed loans totaling approximately $2.3 billion.
(2)
Calculated based on accommodation count; includes loans that are less than 30 days past due.
The following table provides a summary of the Company’s exposure related to loans that have exited accommodations:
| Table 8: Accommodations Exposure | |||||
|
March 31, 2021
(Dollars in millions) |
Exposure | ||||
|
Current
|
$ | 28,971 | |||
|
Past due and still accruing
|
368 | ||||
|
Nonperforming
|
657 | ||||
|
Total
|
$ | 29,996 | |||
The following table provides a summary of exposure to industries that management believes are most vulnerable in the current COVID-19 environment. These selected industry exposures represent 9.2 percent of loans held for investment at March 31, 2021. Truist is actively managing these portfolios and will continue to make underwriting or risk acceptance adjustments as appropriate.
| Table 9: Selected Credit Exposures | |||||||||||
|
March 31, 2021
(Dollars in billions) |
Outstanding Balance | Percentage of Loans HFI | |||||||||
|
Hotels, Resorts & Cruise Lines
|
$ | 6.2 | 2.1 | % | |||||||
| Senior Care | 6.1 | 2.1 | |||||||||
| Acute Care Facilities | 5.3 | 1.8 | |||||||||
| Oil & Gas Portfolio | 4.5 | 1.5 | |||||||||
| Restaurants | 2.9 | 1.0 | |||||||||
| Sensitive Retail | 2.0 | 0.7 | |||||||||
| Total | $ | 27.0 | 9.2 | % | |||||||
Truist Financial Corporation 45
Asset Quality
The following tables summarize asset quality information:
| Table 10: Asset Quality | |||||||||||||||||||||||||||||
| (Dollars in millions) | Mar 31, 2021 | Dec 31, 2020 | Sep 30, 2020 | Jun 30, 2020 | Mar 31, 2020 | ||||||||||||||||||||||||
| NPAs: | |||||||||||||||||||||||||||||
| NPLs: | |||||||||||||||||||||||||||||
| Commercial and industrial | $ | 451 | $ | 532 | $ | 507 | $ | 428 | $ | 443 | |||||||||||||||||||
| CRE | 58 | 75 | 52 | 42 | 18 | ||||||||||||||||||||||||
| Commercial construction | 13 | 14 | 7 | 13 | 2 | ||||||||||||||||||||||||
| Lease financing | 23 | 28 | 32 | 56 | 27 | ||||||||||||||||||||||||
| Residential mortgage | 290 | 316 | 205 | 198 | 248 | ||||||||||||||||||||||||
| Residential home equity and direct | 172 | 205 | 180 | 192 | 170 | ||||||||||||||||||||||||
| Indirect auto | 158 | 155 | 137 | 155 | 125 | ||||||||||||||||||||||||
| Indirect other | 6 | 5 | 4 | 3 | 1 | ||||||||||||||||||||||||
| Total NPLs HFI | 1,171 | 1,330 | 1,124 | 1,087 | 1,034 | ||||||||||||||||||||||||
| Loans held for sale | 72 | 5 | 130 | 102 | 41 | ||||||||||||||||||||||||
| Total nonaccrual loans and leases | 1,243 | 1,335 | 1,254 | 1,189 | 1,075 | ||||||||||||||||||||||||
| Foreclosed real estate | 18 | 20 | 30 | 43 | 63 | ||||||||||||||||||||||||
| Other foreclosed property | 38 | 32 | 30 | 20 | 39 | ||||||||||||||||||||||||
| Total nonperforming assets | $ | 1,299 | $ | 1,387 | $ | 1,314 | $ | 1,252 | $ | 1,177 | |||||||||||||||||||
| TDRs: | |||||||||||||||||||||||||||||
| Performing TDRs: | |||||||||||||||||||||||||||||
| Commercial and industrial | $ | 142 | $ | 78 | $ | 84 | $ | 57 | $ | 65 | |||||||||||||||||||
| CRE | 47 | 47 | 36 | 22 | 7 | ||||||||||||||||||||||||
| Commercial construction | — | — | 1 | 36 | 36 | ||||||||||||||||||||||||
| Lease financing | 59 | 60 | 1 | 1 | 1 | ||||||||||||||||||||||||
| Residential mortgage | 733 | 648 | 640 | 533 | 513 | ||||||||||||||||||||||||
| Residential home equity and direct | 109 | 88 | 71 | 71 | 66 | ||||||||||||||||||||||||
| Indirect auto | 399 | 392 | 336 | 342 | 350 | ||||||||||||||||||||||||
| Indirect other | 7 | 6 | 5 | 4 | 5 | ||||||||||||||||||||||||
| Student | 8 | 5 | 5 | 4 | 1 | ||||||||||||||||||||||||
| Credit card | 35 | 37 | 38 | 37 | 35 | ||||||||||||||||||||||||
| Total performing TDRs | 1,539 | 1,361 | 1,217 | 1,107 | 1,079 | ||||||||||||||||||||||||
| Nonperforming TDRs | 207 | 164 | 140 | 111 | 121 | ||||||||||||||||||||||||
| Total TDRs | $ | 1,746 | $ | 1,525 | $ | 1,357 | $ | 1,218 | $ | 1,200 | |||||||||||||||||||
| Loans 90 days or more past due and still accruing: (1) | |||||||||||||||||||||||||||||
| Commercial and industrial | $ | 14 | $ | 13 | $ | 6 | $ | 9 | $ | 5 | |||||||||||||||||||
| CRE | — | — | 8 | 3 | 1 | ||||||||||||||||||||||||
| Lease financing | — | — | — | 1 | — | ||||||||||||||||||||||||
| Residential mortgage | 975 | 841 | 573 | 521 | 610 | ||||||||||||||||||||||||
| Residential home equity and direct | 11 | 10 | 5 | 9 | 10 | ||||||||||||||||||||||||
| Indirect auto | 2 | 2 | 8 | 10 | 11 | ||||||||||||||||||||||||
| Indirect other | 1 | 2 | 3 | 3 | 2 | ||||||||||||||||||||||||
| Student | 1,037 | 1,111 | 570 | 478 | 1,068 | ||||||||||||||||||||||||
| Credit card | 32 | 29 | 24 | 38 | 41 | ||||||||||||||||||||||||
| Total loans 90 days or more past due and still accruing | $ | 2,072 | $ | 2,008 | $ | 1,197 | $ | 1,072 | $ | 1,748 | |||||||||||||||||||
| Loans 30-89 days past due and still accruing: (1) | |||||||||||||||||||||||||||||
| Commercial and industrial | $ | 117 | $ | 83 | $ | 155 | $ | 282 | $ | 262 | |||||||||||||||||||
| CRE | 9 | 14 | 7 | 6 | 8 | ||||||||||||||||||||||||
| Commercial construction | 4 | 5 | — | 1 | 16 | ||||||||||||||||||||||||
| Lease financing | 35 | 6 | 9 | 10 | 8 | ||||||||||||||||||||||||
| Residential mortgage | 577 | 782 | 796 | 703 | 679 | ||||||||||||||||||||||||
| Residential home equity and direct | 82 | 98 | 103 | 108 | 156 | ||||||||||||||||||||||||
| Indirect auto | 328 | 495 | 321 | 265 | 521 | ||||||||||||||||||||||||
| Indirect other | 45 | 68 | 52 | 50 | 74 | ||||||||||||||||||||||||
| Student | 556 | 618 | 666 | 442 | 593 | ||||||||||||||||||||||||
| Credit card | 35 | 51 | 39 | 34 | 57 | ||||||||||||||||||||||||
| Total loans 30-89 days past due and still accruing | $ | 1,788 | $ | 2,220 | $ | 2,148 | $ | 1,901 | $ | 2,374 | |||||||||||||||||||
(1)
The past due status of loans that received a deferral under the CARES Act is generally frozen during the deferral period.
46 Truist Financial Corporation
Nonperforming assets totaled $1.3 billion at March 31, 2021, down $88 million compared to December 31, 2020. Nonperforming loans and leases represented 0.42 percent of total loans and leases, down two basis points compared to December 31, 2020. Nonperforming loans and leases held for investment decreased $159 million, primarily in the commercial and industrial portfolio, while nonperforming loans held for sale increased $67 million as a portfolio of residential mortgage loans was transferred to held for sale during the quarter.
Performing TDRs were up $178 million during the first quarter primarily in the residential mortgage and commercial and industrial portfolios. The increase in residential mortgage was driven by modifications of loans that were not eligible for relief in accordance with the provisions of the CARES Act. The increase in commercial and industrial loan modifications was driven by an increase in the volume of loans entering workout agreements.
Loans 90 days or more past due and still accruing totaled $2.1 billion at March 31, 2021, up $64 million compared to the prior quarter. The increase was primarily in residential mortgage loans due to the repurchase of delinquent government guaranteed loans. The ratio of loans 90 days or more past due and still accruing as a percentage of loans and leases was 0.71 percent at March 31, 2021, up four basis points from the prior quarter. Excluding government guaranteed loans, the ratio of loans 90 days or more past due and still accruing as a percentage of loans and leases was 0.04 percent at March 31, 2021, unchanged from December 31, 2020.
Loans 30-89 days past due and still accruing totaled $1.8 billion at March 31, 2021, down $432 million compared to the prior quarter. The decrease was primarily in consumer loans for residential mortgage and indirect automobile due to seasonality and consumers receiving stimulus funds. The ratio of loans 30-89 days past due and still accruing as a percentage of loans and leases was 0.61 percent at March 31, 2021 down, 13 basis points from the prior quarter.
Problem loans include NPLs and loans that are 90 days or more past due and still accruing as disclosed in Table 10. In addition, for the commercial portfolio segment, loans that are rated special mention or substandard performing are closely monitored by management as potential problem loans. Refer to “Note 4. Loans and ACL” for additional disclosures related to these potential problem loans.
| Table 11: Asset Quality Ratios | |||||||||||||||||||||||||||||
| As of / For the Three Months Ended | Mar 31, 2021 | Dec 31, 2020 | Sep 30, 2020 | Jun 30, 2020 | Mar 31, 2020 | ||||||||||||||||||||||||
|
Loans 30-89 days past due and still accruing as a percentage of loans and leases HFI
|
0.61 | % | 0.74 | % | 0.70 | % | 0.60 | % | 0.74 | % | |||||||||||||||||||
|
Loans 90 days or more past due and still accruing as a percentage of loans and leases HFI
|
0.71 | 0.67 | 0.39 | 0.34 | 0.55 | ||||||||||||||||||||||||
|
NPLs as a percentage of loans and leases HFI
|
0.40 | 0.44 | 0.37 | 0.35 | 0.32 | ||||||||||||||||||||||||
| NPLs as a percentage of total loans and leases (1) | 0.42 | 0.44 | 0.40 | 0.37 | 0.33 | ||||||||||||||||||||||||
|
NPAs as a percentage of:
|
|||||||||||||||||||||||||||||
|
Total assets (1)
|
0.25 | 0.27 | 0.26 | 0.25 | 0.23 | ||||||||||||||||||||||||
|
Loans and leases HFI plus foreclosed property
|
0.42 | 0.46 | 0.39 | 0.37 | 0.36 | ||||||||||||||||||||||||
|
Net charge-offs as a percentage of average loans and leases HFI
|
0.33 | 0.27 | 0.42 | 0.39 | 0.36 | ||||||||||||||||||||||||
|
ALLL as a percentage of loans and leases HFI
|
1.94 | 1.95 | 1.91 | 1.81 | 1.63 | ||||||||||||||||||||||||
|
Ratio of ALLL to:
|
|||||||||||||||||||||||||||||
| Net charge-offs | 5.87x | 7.15x | 4.52x | 4.49x | 4.76x | ||||||||||||||||||||||||
| NPLs | 4.84x | 4.39x | 5.22x | 5.24x | 5.04x | ||||||||||||||||||||||||
|
Loans 90 days or more past due and still accruing as a percentage of loans and leases HFI, excluding PPP and other government guaranteed (2)
|
0.04 | % | 0.04 | % | 0.03 | % | 0.04 | % | 0.04 | % | |||||||||||||||||||
Applicable ratios are annualized.
(1)
Includes LHFS.
(2)
This asset quality ratio has been adjusted to remove the impact of government guaranteed mortgage, student, and PPP loans. Management believes the inclusion of such assets in this asset quality ratio results in distortion of this ratio such that it might not be reflective of asset collectability or might not be comparable to other periods presented or to other portfolios that do not have government guarantees.
Truist Financial Corporation 47
The following table presents activity related to NPAs:
| Table 12: Rollforward of NPAs | ||||||||||||||
| (Dollars in millions) | 2021 | 2020 | ||||||||||||
| Balance, January 1 | $ | 1,387 | $ | 684 | ||||||||||
| New NPAs (1) | 563 | 1,032 | ||||||||||||
| Advances and principal increases | 102 | 86 | ||||||||||||
| Disposals of foreclosed assets (2) | (112) | (158) | ||||||||||||
| Disposals of NPLs (3) | (41) | (106) | ||||||||||||
| Charge-offs and losses | (112) | (124) | ||||||||||||
| Payments | (300) | (147) | ||||||||||||
| Transfers to performing status | (183) | (85) | ||||||||||||
| Other, net | (5) | (5) | ||||||||||||
| Ending balance, March 31 | $ | 1,299 | $ | 1,177 | ||||||||||
(1)
For 2020, includes approximately $500 million of loans previously classified as PCI that would have otherwise been nonperforming as of December 31, 2019.
(2)
Includes charge-offs and losses recorded upon sale of $46 million and $53 million for the three months ended March 31, 2021 and 2020, respectively.
(3)
Includes charge-offs and losses recorded upon sale of $5 million and $10 million for the three months ended March 31, 2021 and 2020, respectively.
TDRs occur when a borrower is experiencing, or is expected to experience, financial difficulties in the near term and a concession has been granted to the borrower. As a result, Truist works with borrowers to prevent further difficulties and to improve the likelihood of recovery on a loan. To facilitate this process, a concessionary modification that would not otherwise be considered may be granted, resulting in classification of the loan as a TDR. In accordance with the CARES Act, Truist implemented loan modification programs in response to the COVID-19 pandemic in order to provide borrowers with flexibility with respect to repayment terms. Payment relief assistance provided by Truist includes forbearance, deferrals, extension, and re-aging programs, along with certain other modification strategies. The Company adopted certain provisions of the CARES Act and other regulatory guidance that provide relief from the requirement to apply TDR accounting to (1) certain modifications of federally backed mortgages upon request from the borrower, and (2) certain modifications of other non-federally backed mortgages for borrowers impacted by the COVID-19 pandemic that were less than 30 days past due at December 31, 2019. Refer to “Note 1. Basis of Presentation” in Truist’s Annual Report on Form 10-K for the year ended December 31, 2020 for the policies related to TDRs and COVID-19 loan modifications.
TDRs identified by SunTrust prior to the Merger date are not included in Truist’s TDR disclosure because all such loans were recorded at fair value and a new accounting basis was established as of the Merger date. Subsequent modifications are evaluated for potential treatment as TDRs in accordance with Truist’s accounting policies.
The following table provides a summary of performing TDR activity:
| Table 13: Rollforward of Performing TDRs | ||||||||||||||
| (Dollars in millions) | 2021 | 2020 | ||||||||||||
| Balance, January 1 | $ | 1,361 | $ | 980 | ||||||||||
| Inflows | 294 | 183 | ||||||||||||
| Payments and payoffs (1) | (57) | (15) | ||||||||||||
| Charge-offs | (13) | (18) | ||||||||||||
| Transfers to nonperforming TDRs (2) | (13) | (19) | ||||||||||||
| Removal due to the passage of time | (7) | (4) | ||||||||||||
| Non-concessionary re-modifications | (12) | (1) | ||||||||||||
| Transferred to LHFS, sold and other | (14) | (27) | ||||||||||||
| Balance, March 31 | $ | 1,539 | $ | 1,079 | ||||||||||
(1)
Includes scheduled principal payments, prepayments, and payoffs of amounts outstanding.
(2)
Represent loans that no longer meet the requirements necessary to reflect the loan in accruing status.
48 Truist Financial Corporation
The following table provides further details regarding the payment status of TDRs outstanding at March 31, 2021:
| Table 14: Payment Status of TDRs (1) | |||||||||||||||||||||||||||||||||||||||||
|
March 31, 2021
(Dollars in millions) |
Current | Past Due 30-89 Days | Past Due 90 Days Or More | Total | |||||||||||||||||||||||||||||||||||||
| Performing TDRs: | |||||||||||||||||||||||||||||||||||||||||
| Commercial: | |||||||||||||||||||||||||||||||||||||||||
| Commercial and industrial | $ | 142 | 100.0 | % | $ | — | — | % | $ | — | — | % | $ | 142 | |||||||||||||||||||||||||||
| CRE | 47 | 100.0 | — | — | — | — | 47 | ||||||||||||||||||||||||||||||||||
| Lease financing | 59 | 100.0 | — | — | — | — | 59 | ||||||||||||||||||||||||||||||||||
| Consumer: | |||||||||||||||||||||||||||||||||||||||||
| Residential mortgage | 480 | 65.5 | 91 | 12.4 | 162 | 22.1 | 733 | ||||||||||||||||||||||||||||||||||
| Residential home equity and direct | 104 | 95.4 | 5 | 4.6 | — | — | 109 | ||||||||||||||||||||||||||||||||||
| Indirect auto | 357 | 89.5 | 42 | 10.5 | — | — | 399 | ||||||||||||||||||||||||||||||||||
| Indirect other | 7 | 100.0 | — | — | — | — | 7 | ||||||||||||||||||||||||||||||||||
| Student | 8 | 100.0 | — | — | — | — | 8 | ||||||||||||||||||||||||||||||||||
| Credit card | 32 | 91.4 | 2 | 5.7 | 1 | 2.9 | 35 | ||||||||||||||||||||||||||||||||||
| Total performing TDRs | 1,236 | 80.3 | 140 | 9.1 | 163 | 10.6 | 1,539 | ||||||||||||||||||||||||||||||||||
| Nonperforming TDRs | 105 | 50.7 | 24 | 11.6 | 78 | 37.7 | 207 | ||||||||||||||||||||||||||||||||||
| Total TDRs | $ | 1,341 | 76.8 | $ | 164 | 9.4 | $ | 241 | 13.8 | $ | 1,746 | ||||||||||||||||||||||||||||||
(1)
Past due performing TDRs are included in past due disclosures and nonperforming TDRs are included in NPL disclosures.
Truist Financial Corporation 49
ACL
Activity related to the ACL is presented in the following tables:
| Table 15: Activity in ACL | |||||||||||||||||||||||||||||
|
(Dollars in millions) |
Mar 31, 2021 | Dec 31, 2020 | Sep 30, 2020 | Jun 30, 2020 | Mar 31, 2020 | ||||||||||||||||||||||||
| Balance, beginning of period | $ | 6,199 | $ | 6,229 | $ | 6,133 | $ | 5,611 | $ | 1,889 | |||||||||||||||||||
| CECL adoption - impact to retained earnings before tax | — | — | — | — | 2,762 | ||||||||||||||||||||||||
| CECL adoption - reserves on PCD assets | — | — | — | — | 378 | ||||||||||||||||||||||||
| Provision for credit losses | 48 | 177 | 421 | 844 | 893 | ||||||||||||||||||||||||
| Charge-offs: | |||||||||||||||||||||||||||||
| Commercial and industrial | (73) | (84) | (112) | (123) | (39) | ||||||||||||||||||||||||
| CRE | (4) | (19) | (44) | (14) | (1) | ||||||||||||||||||||||||
| Commercial construction | (2) | (8) | (19) | — | (3) | ||||||||||||||||||||||||
| Lease financing | (6) | (4) | (44) | (4) | (2) | ||||||||||||||||||||||||
| Residential mortgage | (11) | (6) | (4) | (35) | (11) | ||||||||||||||||||||||||
| Residential home equity and direct | (55) | (46) | (52) | (65) | (68) | ||||||||||||||||||||||||
| Indirect auto | (105) | (84) | (72) | (80) | (142) | ||||||||||||||||||||||||
| Indirect other | (17) | (14) | (8) | (20) | (18) | ||||||||||||||||||||||||
| Student | (3) | (3) | (6) | (6) | (8) | ||||||||||||||||||||||||
| Credit card | (40) | (35) | (44) | (50) | (53) | ||||||||||||||||||||||||
| Total charge-offs | (316) | (303) | (405) | (397) | (345) | ||||||||||||||||||||||||
| Recoveries: | |||||||||||||||||||||||||||||
| Commercial and industrial | 19 | 34 | 20 | 21 | 17 | ||||||||||||||||||||||||
| CRE | 1 | 1 | — | 4 | — | ||||||||||||||||||||||||
| Commercial construction | 1 | 1 | 2 | 7 | 1 | ||||||||||||||||||||||||
| Lease financing | — | — | 4 | — | — | ||||||||||||||||||||||||
| Residential mortgage | 2 | 3 | 3 | 2 | 2 | ||||||||||||||||||||||||
| Residential home equity and direct | 18 | 20 | 16 | 15 | 15 | ||||||||||||||||||||||||
| Indirect auto | 22 | 24 | 22 | 18 | 23 | ||||||||||||||||||||||||
| Indirect other | 6 | 5 | 4 | 7 | 7 | ||||||||||||||||||||||||
| Student | — | — | — | 1 | — | ||||||||||||||||||||||||
| Credit card | 9 | 10 | 8 | 6 | 8 | ||||||||||||||||||||||||
| Total recoveries | 78 | 98 | 79 | 81 | 73 | ||||||||||||||||||||||||
| Net charge-offs | (238) | (205) | (326) | (316) | (272) | ||||||||||||||||||||||||
| Other | 2 | (2) | 1 | (6) | (39) | ||||||||||||||||||||||||
| Balance, end of period | $ | 6,011 | $ | 6,199 | $ | 6,229 | $ | 6,133 | $ | 5,611 | |||||||||||||||||||
| ALLL (excluding PCD loans) | $ | 5,506 | $ | 5,668 | $ | 5,675 | $ | 5,408 | $ | 4,880 | |||||||||||||||||||
| ALLL for PCD loans | 156 | 167 | 188 | 294 | 331 | ||||||||||||||||||||||||
| RUFC | 349 | 364 | 366 | 431 | 400 | ||||||||||||||||||||||||
| Total ACL | $ | 6,011 | $ | 6,199 | $ | 6,229 | $ | 6,133 | $ | 5,611 | |||||||||||||||||||
At March 31, 2021, the allowance for credit losses was $6.0 billion and includes $5.7 billion for loans and leases and $349 million for the reserve for unfunded commitments. The allowance for loan and lease losses represented 1.94 percent of loans and leases held for investment compared to 1.95 percent at December 31, 2020. The allowance for loan and lease losses covered nonperforming loans and leases held for investment 4.84 times compared to 4.39 times at December 31, 2020. At March 31, 2021, the allowance for loan and lease losses was 5.87 times annualized net charge-offs, compared to 7.15 times at December 31, 2020.
Net charge-offs during the first quarter totaled $238 million, up $33 million compared to the prior quarter. As a percentage of average loans and leases, annualized net charge-offs were 0.33 percent, up six basis points compared to the prior quarter. The increase in net charge-offs was primarily in the indirect auto portfolio due to seasonality.
The following table presents an allocation of the ALLL. The entire amount of the allowance is available to absorb losses occurring in any category of loans and leases.
50 Truist Financial Corporation
| Table 16: Allocation of ALLL by Category | |||||||||||||||||||||||||||||||||||
| March 31, 2021 | December 31, 2020 | ||||||||||||||||||||||||||||||||||
| (Dollars in millions) | Amount | % ALLL in Each Category | % Loans in Each Category | Amount | % ALLL in Each Category | % Loans in Each Category | |||||||||||||||||||||||||||||
| Commercial and industrial | $ | 2,091 | 36.8 | % | 46.3 | % | $ | 2,156 | 37.0 | % | 46.2 | % | |||||||||||||||||||||||
| CRE | 544 | 9.6 | 8.9 | 573 | 9.8 | 8.9 | |||||||||||||||||||||||||||||
| Commercial construction | 77 | 1.4 | 2.3 | 81 | 1.4 | 2.2 | |||||||||||||||||||||||||||||
| Lease financing | 45 | 0.8 | 1.7 | 48 | 0.8 | 1.7 | |||||||||||||||||||||||||||||
| Residential mortgage | 343 | 6.1 | 15.2 | 368 | 6.3 | 15.8 | |||||||||||||||||||||||||||||
| Residential home equity and direct | 707 | 12.5 | 8.7 | 714 | 12.2 | 8.7 | |||||||||||||||||||||||||||||
| Indirect auto | 1,176 | 20.8 | 9.1 | 1,198 | 20.5 | 8.7 | |||||||||||||||||||||||||||||
| Indirect other | 187 | 3.3 | 3.6 | 208 | 3.6 | 3.7 | |||||||||||||||||||||||||||||
| Student | 131 | 2.3 | 2.6 | 130 | 2.2 | 2.5 | |||||||||||||||||||||||||||||
| Credit card | 361 | 6.4 | 1.6 | 359 | 6.2 | 1.6 | |||||||||||||||||||||||||||||
| Total ALLL | 5,662 | 100.0 | % | 100.0 | % | 5,835 | 100.0 | % | 100.0 | % | |||||||||||||||||||||||||
| RUFC | 349 | 364 | |||||||||||||||||||||||||||||||||
| Total ACL | $ | 6,011 | $ | 6,199 | |||||||||||||||||||||||||||||||
Truist monitors the performance of its home equity loans and lines secured by second liens similarly to other consumer loans and utilizes assumptions specific to these loans in determining the necessary ALLL. Truist also receives notification when the first lien holder, whether Truist or another financial institution, has initiated foreclosure proceedings against the borrower. When notified that the first lien is in the process of foreclosure, Truist obtains valuations to determine if any additional charge-offs or reserves are warranted. These valuations are updated at least annually thereafter.
Truist has limited ability to monitor the delinquency status of the first lien, unless the first lien is held or serviced by Truist. Truist estimates second lien loans where the first lien is delinquent based on historical experience; the increased risk of loss on these credits is reflected in the ALLL. As of March 31, 2021, Truist held or serviced the first lien on 30.2 percent of its second lien positions.
Other Assets
The components of Other assets are presented in the following table:
| Table 17: Other Assets as of Period End | |||||||||||
| (Dollars in millions) | March 31, 2021 | December 31, 2020 | |||||||||
| Bank-owned life insurance | $ | 6,488 | $ | 6,479 | |||||||
| Tax credit and other private equity investments | 5,612 | 5,685 | |||||||||
| Prepaid pension assets | 4,810 | 4,358 | |||||||||
| Derivative assets | 2,926 | 3,837 | |||||||||
| Accrued income | 1,959 | 1,934 | |||||||||
| Accounts receivable | 2,252 | 1,833 | |||||||||
| Leased assets and related assets | 1,870 | 1,810 | |||||||||
| ROU assets | 1,277 | 1,333 | |||||||||
| Prepaid expenses | 1,197 | 1,247 | |||||||||
| Equity securities at fair value | 875 | 1,054 | |||||||||
| Structured real estate | 383 | 390 | |||||||||
| FHLB stock | 124 | 164 | |||||||||
| Other | 532 | 549 | |||||||||
| Total other assets | $ | 30,305 | $ | 30,673 | |||||||
Truist Financial Corporation 51
Funding Activities
Deposits
The following table presents average deposits:
| Table 18: Average Deposits | ||||||||||||||||||||||||||||||||
|
Three Months Ended
(Dollars in millions)
|
Mar 31, 2021 | Dec 31, 2020 | Sep 30, 2020 | Jun 30, 2020 | Mar 31, 2020 | |||||||||||||||||||||||||||
| Noninterest-bearing deposits | $ | 128,579 | $ | 127,103 | $ | 123,966 | $ | 113,875 | $ | 93,135 | ||||||||||||||||||||||
| Interest checking | 104,744 | 99,866 | 96,707 | 97,863 | 85,008 | |||||||||||||||||||||||||||
| Money market and savings | 129,303 | 124,692 | 123,598 | 126,071 | 120,936 | |||||||||||||||||||||||||||
| Time deposits | 20,559 | 23,605 | 27,940 | 33,009 | 35,570 | |||||||||||||||||||||||||||
| Total average deposits | $ | 383,185 | $ | 375,266 | $ | 372,211 | $ | 370,818 | $ | 334,649 | ||||||||||||||||||||||
Average deposits for the first quarter of 2021 were $383.2 billion, an increase of $7.9 billion compared to the prior quarter. Average interest checking and money market and savings deposit growth was strong for the first quarter of 2021 driven by growth resulting from additional government stimulus programs and pandemic-related client behavior. Average noninterest bearing deposits grew 4.7 percent compared to the prior quarter and represented 33.6 percent of total deposits for the first quarter of 2021, compared to 33.9 percent for the prior quarter.
Average time deposits decreased primarily due to the maturity of wholesale negotiable certificates of deposit and higher-cost personal accounts.
The cost of average total deposits was 0.05 percent for the first quarter, down two basis points compared to the prior quarter. The cost of average interest-bearing deposits was 0.07 percent for the first quarter, down four basis points compared to the prior quarter.
Borrowings
At March 31, 2021, short-term borrowings totaled $5.9 billion, a decrease of $203 million compared to December 31, 2020, due primarily to a decrease of $649 million in short-term FHLB advances, partially offset by an increase of $272 million in securities sold under agreements to repurchase.
Average short-term borrowings were $6.7 billion or 1.6 percent of total funding for the first quarter of 2021, as compared to $18.9 billion or 4.7 percent for the prior year. Average short-term borrowings decreased as a percentage of funding sources due to strong deposit growth. Long-term debt provides funding and, to a lesser extent, regulatory capital, and primarily consists of senior and subordinated notes issued by Truist and Truist Bank. Long-term debt totaled $37.8 billion at March 31, 2021, a decrease of $1.8 billion compared to December 31, 2020. During 2021, $3.0 billion of senior notes matured. These maturities were partially offset by issuances of $1.3 billion of senior notes with an interest rate of 1.27 percent maturing in 2027. FHLB advances represented 2.3 percent of total outstanding long-term debt at March 31, 2021, compared to 2.2 percent at December 31, 2020. The average cost of long-term debt was 1.57 percent for the three months ended March 31, 2021, down 77 basis points compared to the same period in 2020.
In April 2021, Truist redeemed $1.3 billion of fixed rate senior notes due in May 2021. In May 2021, Truist redeemed $250 million of floating rate senior notes due in June 2021.
Shareholders’ Equity
Total shareholders’ equity was $67.9 billion at March 31, 2021, a decrease of $3.0 billion from December 31, 2020. This decrease includes a decrease of $2.2 billion in AOCI, redemptions of $950 million in preferred stock for Series F and G, $722 million in dividends and $506 million in repurchases of common stock, partially offset by $1.5 billion in net income available to common shareholders. Truist’s book value per common share at March 31, 2021 was $45.17, compared to $46.52 at December 31, 2020.
In connection with the redemptions of preferred stock, net income available to common shareholders was reduced by $26 million to recognize the difference between the redemption price and the carrying value. Refer to “Note 9. Shareholders’ Equity” for additional disclosures related to preferred stock redemptions.
Truist has approximately $1.5 billion authorization remaining under the share repurchase program approved by the Board of Directors in December 2020.
In April 2021, the Company announced the redemption of $465 million in preferred stock for Series H.
52 Truist Financial Corporation
Risk Management
Truist maintains a comprehensive risk management framework supported by people, processes, and systems to identify, measure, monitor, manage, and report significant risks arising from its exposures and business activities. Effective risk management involves optimizing risk and return while operating in a safe and sound manner, and promoting compliance with applicable laws and regulations. The Company’s risk management framework promotes the execution of business strategies and objectives in alignment with its risk appetite.
Truist has developed and employs a risk taxonomy that further guides business functions in identifying, measuring, responding to, monitoring, and reporting on possible exposures to the organization. The risk taxonomy drives internal risk conversations and enables Truist to clearly and transparently communicate to stakeholders the level of potential risk the Company faces, both presently and in the future, and the Company’s position on managing risk to acceptable levels.
Truist is committed to fostering a culture that supports identification and escalation of risks across the organization. All teammates are responsible for upholding the Company’s purpose, mission, and values, and are encouraged to speak up if there is any activity or behavior that is inconsistent with the Company’s culture. The Truist code of ethics guides the Company’s decision making and informs teammates on how to act in the absence of specific guidance.
Truist seeks an appropriate return for the risk taken in its business operations. Risk-taking activities are evaluated and prioritized to identify those that present attractive risk-adjusted returns, while preserving asset value and capital.
Compensation decisions take into account a teammate’s adherence to and successful implementation of Truist’s risk values and associated policies and procedures. The Company’s compensation structure supports its core values and sound risk management practices in an effort to promote judicious risk-taking behavior.
Truist employs a comprehensive change management program to manage the risks associated with integrating heritage BB&T and heritage SunTrust. The Board and Executive Leadership oversee the change management program, which is designed to ensure key decisions are reviewed and that there is appropriate oversight of integration activities.
Refer to Truist’s Annual Report on Form 10-K for the year ended December 31, 2020 for additional disclosures under the section titled “Risk Management.”
Market Risk
Market risk is the risk to current or anticipated earnings, capital, or economic value arising from changes in the market value of portfolios, securities, or other financial instruments. Market risk results from changes in the level, volatility, or correlations among financial market risk factors or prices, including interest rates, credit spreads, foreign exchange rates, equity, and commodity prices.
Effective management of market risk is essential to achieving Truist’s strategic financial objectives. Truist’s most significant market risk exposure is to interest rate risk in its balance sheet; however, market risk also results from underlying product liquidity risk, price risk, and volatility risk in Truist’s BUs. Interest rate risk results from differences between the timing of rate changes and the timing of cash flows associated with assets and liabilities (re-pricing risk); from changing rate relationships among different yield curves affecting bank activities (basis risk); from changing rate relationships across the spectrum of maturities (yield curve risk); and from interest-related options inherently embedded in bank products (options risk).
The primary objectives of effective market risk management are to minimize adverse effects from changes in market risk factors on net interest income, net income, and capital, and to offset the risk of price changes for certain assets and liabilities recorded at fair value. At Truist, market risk management also includes the enterprise-wide IPV function.
Interest Rate Market Risk
As a financial institution, Truist is exposed to interest rate risk both on its assets and on its liabilities. Truist actively manages its interest rate risk exposure through the strategic repricing of its assets and liabilities, taking into account the volumes, maturities, and mix, with the goal of keeping net interest margin as stable as possible. Truist primarily uses three methods to measure and monitor its interest rate risk: (i) simulations of possible changes to net interest income over the next two years based on gradual changes in interest rates; (ii) analysis of interest rate shock scenarios; and (iii) analysis of economic value of equity based on changes in interest rates.
Truist Financial Corporation 53
The Company’s simulation model takes into account assumptions related to prepayment trends, using a combination of market data and internal historical experiences for deposits and loans, as well as scheduled maturities and payments, and the expected outlook for the economy and interest rates. These assumptions are reviewed and adjusted monthly to reflect changes in current interest rates compared to the rates applicable to Truist’s assets and liabilities. The model also considers Truist’s current and prospective liquidity position, current balance sheet volumes, and projected growth and/or contractions, accessibility of funds for short-term needs and capital maintenance.
Deposit betas are an important assumption in the interest rate risk modeling process. Truist applies an average deposit beta (the sensitivity of deposit rate changes relative to market rate changes) of approximately 50 percent to its non-maturity interest-bearing deposit accounts when determining its interest rate sensitivity. Non-maturity, interest-bearing deposit accounts include interest checking accounts, savings accounts, and money market accounts that do not have a contractual maturity. Truist also regularly conducts sensitivity analyses on other key variables, including noninterest-bearing deposits, to determine the impact these variables could have on the Company’s interest rate risk position. The predictive value of the simulation model depends upon the accuracy of the assumptions, but management believes that it provides helpful information for the management of interest rate risk.
The following table shows the effect that the indicated changes in interest rates would have on net interest income as projected for the next 12 months assuming a gradual change in interest rates as described below.
| Table 19: Interest Sensitivity Simulation Analysis | ||||||||||||||||||||||||||
| Interest Rate Scenario | Annualized Hypothetical Percentage Change in Net Interest Income | |||||||||||||||||||||||||
| Linear Change in Prime Rate (bps) | Prime Rate | |||||||||||||||||||||||||
| Mar 31, 2021 | Mar 31, 2020 | Mar 31, 2021 | Mar 31, 2020 | |||||||||||||||||||||||
| Up 100 | 4.25 | % | 4.25 | % | 3.74 | % | 2.56 | % | ||||||||||||||||||
| Up 50 | 3.75 | 3.75 | 2.92 | 2.00 | ||||||||||||||||||||||
| No Change | 3.25 | 3.25 | — | — | ||||||||||||||||||||||
| Down 25 (1) | 3.00 | 3.00 | (1.32) | (2.11) | ||||||||||||||||||||||
| Down 50 (1) | 2.75 | 2.75 | (1.75) | (3.86) | ||||||||||||||||||||||
(1)
The Down 25 and 50 rates are floored at one basis point and may not reflect Down 25 and 50 basis points for all rate indices.
Rate sensitivity increased compared to the prior periods, primarily driven by increased deposits as a result of government stimulus programs.
Management considers how the interest rate risk position could be impacted by changes in balance sheet mix. Liquidity in the banking industry has been very strong during the current economic cycle. Much of this liquidity increase has resulted in growth in noninterest-bearing demand deposits. Consistent with the industry, Truist has seen a significant increase in this funding source. The behavior of these deposits is one of the most important assumptions used in determining the interest rate risk position of Truist. A decrease in the amount of these deposits in the future would reduce the asset sensitivity of Truist’s balance sheet because the Company would increase interest-bearing funds to offset the loss of this advantageous funding source.
The following table shows the results of Truist’s interest-rate sensitivity position assuming the loss of demand deposits and an associated increase in managed rate deposits under various scenarios. For purposes of this analysis, Truist modeled the incremental beta of managed rate deposits for the replacement of the demand deposits at 100 percent.
| Table 20: Deposit Mix Sensitivity Analysis | ||||||||||||||||||||
| Linear Change in Rates (bps) | Base Scenario at March 31, 2021 (1) | Results Assuming a Decrease in Noninterest-Bearing Demand Deposits | ||||||||||||||||||
| $20 Billion | $40 Billion | |||||||||||||||||||
| Up 100 | 3.74 | % | 2.92 | % | 2.09 | % | ||||||||||||||
| Up 50 | 2.92 | 2.32 | 1.72 | |||||||||||||||||
(1)
The base scenario is equal to the annualized hypothetical percentage change in net interest income at March 31, 2021 as presented in the preceding table.
Truist also uses an EVE analysis to focus on longer-term projected changes in asset and liability values given potential changes in interest rates. This measure allows Truist to analyze interest rate risk that falls outside the net interest income simulation period. The EVE model is a discounted cash flow of the portfolio of assets, liabilities, and derivative instruments. The difference in the present value of assets minus the present value of liabilities is defined as EVE.
54 Truist Financial Corporation
The following table shows the effect that the indicated changes in interest rates would have on EVE:
| Table 21: EVE Simulation Analysis | ||||||||||||||
| Change in Interest Rates (bps) | Hypothetical Percentage Change in EVE | |||||||||||||
| Mar 31, 2021 | Mar 31, 2020 | |||||||||||||
| Up 100 | (2.2) | % | 4.8 | % | ||||||||||
| No Change | — | — | ||||||||||||
| Down 100 | (1.9) | (10.7) | ||||||||||||
Truist uses financial instruments including derivatives to manage interest rate risk related to securities, commercial loans, MSRs, and mortgage banking operations, long-term debt, and other funding sources. Truist also uses derivatives to facilitate transactions on behalf of its clients and as part of associated hedging activities. As of March 31, 2021, Truist had derivative financial instruments outstanding with notional amounts totaling $311.6 billion, with an associated net fair value of $2.2 billion. See “Note 15. Derivative Financial Instruments” for additional disclosures.
LIBOR in its current form was anticipated to no longer be available after 2021. For most tenors of U.S. dollar LIBOR, the administrator of LIBOR is extending publication until June 30, 2023. Tenors used infrequently by Truist, including one week and two month U.S. dollar LIBOR, are still anticipated to cease publication at December 31, 2021, based on this new guidance. Truist has U.S. dollar LIBOR-based contracts that extend beyond June 30, 2023. To prepare for the transition to an alternative reference rate, management has formed a cross-functional project team to address the LIBOR transition. The project team has performed an assessment to identify the potential risks related to the transition from LIBOR to a new index. The project team provides updates to Executive Leadership and the Board.
Contract fallback language for existing loans and leases is under review and certain contracts will need updated provisions for the transition. Current fallback language used for new, renewed, and modified contracts is generally consistent with ARRC recommendations. Updates to current fallback language will be evaluated according to new regulatory guidance for the extension of timelines for the transition and expectations for production of U.S. dollar LIBOR contracts during 2021. Truist continues to manage the impact of these contracts and other financial instruments, systems implications, hedging strategies, and related operational and market risks on established project plans for business and operational readiness for the transition. Market risks associated with this change are dependent on the alternative reference rates available and market conditions at transition. For a further discussion of the various risks associated with the potential cessation of LIBOR and the transition to alternative reference rates, refer to the section titled “Item1A. Risk Factors” in the Form 10-K for the year ended December 31, 2020. In 2020, Truist began offering SOFR-based lending solutions to wholesale and consumer clients and entered into SOFR-based derivative contracts. Truist expects SOFR to become a more commonly-used pricing benchmark across the industry. Truist continues to evaluate SOFR for additional product offerings and other alternative reference rates as replacements for LIBOR.
Market risk from trading activities
As a financial intermediary, Truist provides its clients access to derivatives, foreign exchange and securities markets, which generate market risks. Trading market risk is managed using a comprehensive risk management approach, which includes measuring risk using VaR, stress testing, and sensitivity analysis. Risk metrics are monitored against a suite of limits on a daily basis at both the trading desk level and at the aggregate portfolio level, which is intended to ensure that exposures are in line with Truist’s risk appetite.
Truist is also subject to risk-based capital guidelines for market risk under the Market Risk Rule.
Covered Trading Positions
Covered positions subject to the Market Risk Rule include trading assets and liabilities, specifically those held for the purpose of short-term resale or with the intent of benefiting from actual or expected short-term price movements or to lock in arbitrage profits. Truist’s trading portfolio of covered positions results primarily from market making and underwriting services for the Company’s clients, as well as associated risk mitigating hedging activity. The trading portfolio, measured in terms of VaR, consists primarily of four sub-portfolios of covered positions: (i) credit trading, (ii) fixed income securities, (iii) interest rate derivatives, and (iv) equity derivatives. As a market maker across different asset classes, Truist’s trading portfolio also contains other sub-portfolios, including foreign exchange, loan trading, and commodity derivatives; however, these portfolios do not generate material trading risk exposures.
Valuation policies and methodologies exist for all covered positions. Additionally, trading positions are subject to independent price verification. See “Note 15. Derivative Financial Instruments,” “Note 14. Fair Value Disclosures,” and “Critical Accounting Policies” herein for discussion of valuation policies and methodologies.
Truist Financial Corporation 55
Securitizations
As of March 31, 2021, the aggregate market value of on-balance sheet securitization positions subject to the Market Risk Rule was $30 million, all of which were non-agency asset backed securities positions. Consistent with the Market Risk Rule requirements, the Company performs pre-purchase due diligence on each securitization position to identify the characteristics including, but not limited to, deal structure and the asset quality of the underlying assets, that materially affect valuation and performance. Securitization positions are subject to Truist’s comprehensive risk management framework, which includes daily monitoring against a suite of limits. There were no off-balance sheet securitization positions during the reporting period.
Correlation Trading Positions
The trading portfolio of covered positions did not contain any correlation trading positions as of March 31, 2021.
VaR-Based Measures
VaR measures the potential loss of a given position or portfolio of positions at a specified confidence level and time horizon. Truist utilizes a historical VaR methodology to measure and aggregate risks across its covered trading positions. For risk management purposes, the VaR calculation is based on a historical simulation approach and measures the potential trading losses using a one-day holding period at a one-tail, 99 percent confidence level. For Market Risk Rule purposes, the Company calculates VaR using a 10-day holding period and a 99 percent confidence level. Due to inherent limitations of the VaR methodology, such as the assumption that past market behavior is indicative of future market performance, VaR is only one of several tools used to measure and manage market risk. Other tools used to actively manage market risk include stress testing, profit and loss attribution, and stop loss limits.
The trading portfolio’s VaR profile is influenced by a variety of factors, including the size and composition of the portfolio, market volatility, and the correlation between different positions. A portfolio of trading positions is typically less risky than the sum of the risk from each of the individual sub-portfolios, because, under normal market conditions, risk within each category partially offsets the exposure to other risk categories. The following table summarizes certain VaR-based measures for the three months ended March 31, 2021 and 2020. Heightened market volatility experienced during March 2020 significantly impacted the year-over-year comparison.
| Table 22: VaR-based Measures | ||||||||||||||||||||||||||
| Three Months Ended March 31, | 2021 | 2020 | ||||||||||||||||||||||||
| (Dollars in millions) | 10-Day Holding Period | 1-Day Holding Period | 10-Day Holding Period | 1-Day Holding Period | ||||||||||||||||||||||
| VaR-based Measures: | ||||||||||||||||||||||||||
| Maximum | $ | 68 | $ | 16 | $ | 30 | $ | 10 | ||||||||||||||||||
| Average | 39 | 10 | 10 | 3 | ||||||||||||||||||||||
| Minimum | 3 | 3 | 3 | 1 | ||||||||||||||||||||||
| Period-end | 5 | 3 | 19 | 8 | ||||||||||||||||||||||
| VaR by Risk Class: | ||||||||||||||||||||||||||
| Interest Rate Risk | 2 | 5 | ||||||||||||||||||||||||
| Credit Spread Risk | 4 | 4 | ||||||||||||||||||||||||
| Equity Price Risk | 1 | 8 | ||||||||||||||||||||||||
| Foreign Exchange Risk | — | — | ||||||||||||||||||||||||
| Portfolio Diversification | (5) | (9) | ||||||||||||||||||||||||
| Period-end | 3 | 8 | ||||||||||||||||||||||||
For most of the first quarter of 2021, the rolling 12-month VaR historic look-back window incorporated the peak March 2020 volatility, which contributed to the increase in Average and Maximum VaR. VaR as of March 31, 2021 declined compared to March 31, 2020 as this volatile period in March 2020 aged out of the 12-month VaR look-back window, partially offset by the normalization of inventory levels in March 2021 compared to March 2020.
56 Truist Financial Corporation
Stressed VaR-based measures
Stressed VaR, another component of market risk capital, is calculated using the same internal models as used for the VaR-based measure. Stressed VaR is calculated over a ten-day holding period at a one-tail, 99 percent confidence level and employs a historical simulation approach based on a continuous twelve-month historical window selected to reflect a period of significant financial stress for the Company’s trading portfolio. The following table summarizes Stressed VaR-based measures:
| Table 23: Stressed VaR-based Measures - 10 Day Holding Period | ||||||||||||||
| Three Months Ended March 31, | ||||||||||||||
| (Dollars in millions) | 2021 | 2020 | ||||||||||||
| Maximum | $ | 72 | $ | 65 | ||||||||||
| Average | 54 | 33 | ||||||||||||
| Minimum | 26 | 16 | ||||||||||||
| Period-end | 64 | 19 | ||||||||||||
The increase from the prior year in stressed VaR-based measures was due to inclusion of volatility levels from March 2020 in the 12-month Stressed VaR window and normalization of market making inventory levels in March 2021 compared to March 2020 when inventory levels were lower due to the market volatility.
Specific Risk Measures
Specific risk is a measure of idiosyncratic risk that could result from risk factors other than broad market movements (e.g. default, event risks). The Market Risk Rule provides fixed risk weights under a standardized measurement method while also allowing a model-based approach, subject to regulatory approval. Truist utilizes the standardized measurement method to calculate the specific risk component of market risk regulatory capital. As such, incremental risk capital requirements do not apply.
VaR Model Backtesting
In accordance with the Market Risk Rule, the Company evaluates the accuracy of its VaR model through daily backtesting by comparing aggregate daily trading gains and losses (excluding fees, commissions, reserves, net interest income, and intraday trading) from covered positions with the corresponding daily VaR-based measures generated by the model. As illustrated in the following graph, there were no Company-wide VaR backtesting exceptions during the twelve months ended March 31, 2021. The total number of Company-wide VaR backtesting exceptions over the preceding twelve months is used to determine the multiplication factor for the VaR-based capital requirement under the Market Risk Rule. The capital multiplication factor increases from a minimum of three to a maximum of four, depending on the number of exceptions. All Company-wide VaR backtesting exceptions are thoroughly reviewed in the context of VaR model use and performance. There was no change in the capital multiplication factor over the preceding twelve months.
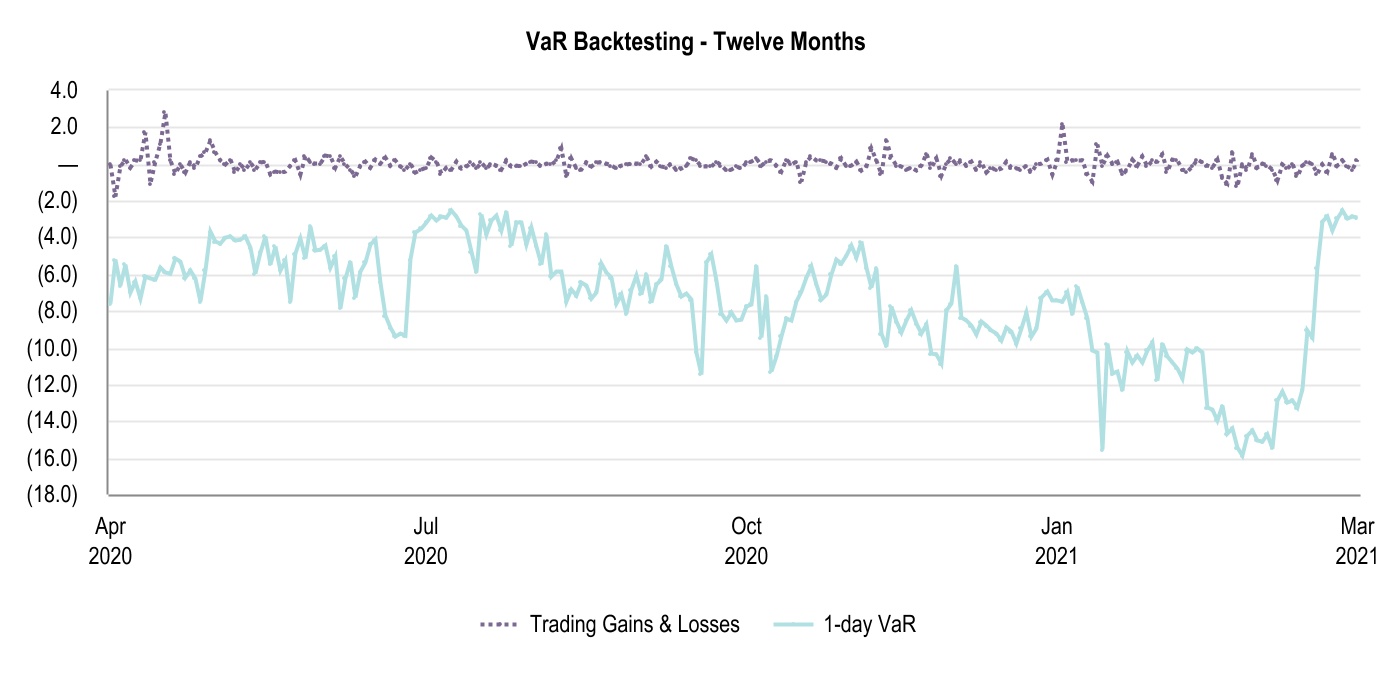
Truist Financial Corporation 57
Model Risk Management
MRM is responsible for the independent model validation of all decision tools and models including trading market risk models. The validation activities are conducted in accordance with MRM policy, which incorporates regulatory guidance related to the evaluation of model conceptual soundness, ongoing monitoring, and outcomes analysis. As part of ongoing monitoring efforts, the performance of all trading risk models are reviewed regularly to preemptively address emerging developments in financial markets, assess evolving modeling approaches, and to identify potential model enhancement.
Stress Testing
The Company uses a comprehensive range of stress testing techniques to help monitor risks across trading desks and to augment standard daily VaR and other risk limits reporting. The stress testing framework is designed to quantify the impact of extreme, but plausible, stress scenarios that could lead to large unexpected losses. Stress tests include simulations for historical repeats and hypothetical risk factor shocks. All trading positions within each applicable market risk category (interest rate risk, equity risk, foreign exchange rate risk, credit spread risk, and commodity price risk) are included in the Company’s comprehensive stress testing framework. Management reviews stress testing scenarios on an ongoing basis and makes updates, as necessary, which is intended to ensure that both current and emerging risks are captured appropriately. Management also utilizes stress analyses to support the Company’s capital adequacy assessment standards. See the “Capital” section of MD&A for additional discussion of capital adequacy.
Liquidity
Liquidity represents the continuing ability to meet funding needs, including deposit withdrawals, repayment of borrowings and other liabilities, and funding of loan commitments. In addition to the level of liquid assets, such as cash, cash equivalents, and AFS securities, other factors affect the ability to meet liquidity needs, including access to a variety of funding sources, maintaining borrowing capacity, growing core deposits, loan repayment, and the ability to securitize or package loans for sale.
Truist monitors the ability to meet client demand for funds under both normal and stressed market conditions. In considering its liquidity position, management evaluates Truist’s funding mix based on client core funding, client rate-sensitive funding and national markets funding. In addition, management evaluates exposure to rate-sensitive funding sources that mature in one year or less. Management also measures liquidity needs against 30 days of stressed cash outflows for Truist and Truist Bank. To ensure a strong liquidity position and compliance with regulatory requirements, management maintains a liquid asset buffer of cash on hand and highly liquid unencumbered securities. As of March 31, 2021 and December 31, 2020, Truist’s liquid asset buffer, as a percent of total assets, was 23.2 percent and 20.2 percent, respectively.
The LCR rule directs large U.S. banking organizations to hold unencumbered high-quality liquid assets sufficient to withstand projected 30-day total net cash outflows, as defined under the LCR rule. As of January 1, 2020, Truist is subject to the Category III reduced LCR requirements. Truist’s average LCR was 111 percent for the three months ended March 31, 2021, well above the regulatory minimum of 100 percent.
The ability to raise funding at competitive prices is affected by the rating agencies’ views of the Parent Company’s and Truist Bank’s credit quality, liquidity, capital, and earnings. Management meets with the rating agencies on a regular basis to discuss current outlooks. There were no changes to the ratings of Truist or Truist Bank by the major rating agencies during the quarter ended March 31, 2021. See the “Liquidity” section of MD&A in Truist’s Annual Report on Form 10-K for the year ended December 31, 2020 for additional information regarding credit ratings.
Parent Company
The Parent Company serves as the primary source of capital for the operating subsidiaries. The Parent Company’s assets consist primarily of cash on deposit with Truist Bank, equity investments in subsidiaries, advances to subsidiaries, and notes receivable from subsidiaries. The principal obligations of the Parent Company are payments on long-term debt. The main sources of funds for the Parent Company are dividends and management fees from subsidiaries, repayments of advances to subsidiaries, and proceeds from the issuance of equity and long-term debt. The primary uses of funds by the Parent Company are investments in subsidiaries, advances to subsidiaries, dividend payments to common and preferred shareholders, retirement of common stock, and payments on long-term debt.
See “Note 22. Parent Company Financial Information” in Truist’s Annual Report on Form 10-K for the year ended December 31, 2020 for additional information regarding dividends from subsidiaries and debt transactions.
58 Truist Financial Corporation
Access to funding at the Parent Company is more sensitive to market disruptions. Therefore, Truist prudently manages cash levels at the Parent Company to cover a minimum of one year of projected cash outflows which includes unfunded external commitments, debt service, common and preferred dividends and scheduled debt maturities, without the benefit of any new cash inflows. Truist maintains a significant buffer above the projected one year of cash outflows. In determining the buffer, Truist considers cash requirements for common and preferred dividends, unfunded commitments to affiliates, serving as a source of strength to Truist Bank, and being able to withstand sustained market disruptions that could limit access to the capital markets. At March 31, 2021 and December 31, 2020, the Parent Company had 40 months and 43 months, respectively, of cash on hand to satisfy projected cash outflows, and 22 months at each such date when including the payment of common stock dividends.
Truist Bank
Truist carefully manages liquidity risk at Truist Bank. Truist Bank’s primary source of funding is client deposits. Continued access to client deposits is highly dependent on public confidence in the stability of Truist Bank and its ability to return funds to clients when requested.
Truist Bank maintains a number of diverse funding sources to meet its liquidity requirements. These sources include unsecured borrowings from the capital markets through the issuance of senior or subordinated bank notes, institutional CDs, overnight and term Federal funds markets, and retail brokered CDs. Truist Bank also maintains access to secured borrowing sources including FHLB advances, repurchase agreements, and the FRB discount window. At March 31, 2021, Truist Bank had $203.4 billion of available secured borrowing capacity, which represents approximately 10.7 times the amount of wholesale funding maturities in one-year or less. In addition to secured borrowing sources, Truist had excess eligible cash at the Federal Reserve Bank of $26.8 billion at March 31, 2021.
Contractual Obligations, Commitments, Contingent Liabilities, and Off-Balance Sheet Arrangements
Refer to Truist’s Annual Report on Form 10-K for the year ended December 31, 2020 for discussion with respect to Truist’s quantitative and qualitative disclosures about its fixed and determinable contractual obligations. Truist’s commitments include investments in affordable housing projects throughout its market area, renewable energy credits, private equity funds, derivative contracts to manage various financial risks, as well as other commitments. Refer to “Note 13. Commitments and Contingencies,” “Note 14. Fair Value Disclosures,” and “Note 15. Derivative Financial Instruments” in this Form 10-Q, and “Note 16. Commitments and Contingencies” of the Annual Report on Form 10-K for further discussion of these commitments.
Capital
The maintenance of appropriate levels of capital is a management priority and is monitored on a regular basis. Truist’s principal goals related to the maintenance of capital are to provide adequate capital to support Truist’s risk profile consistent with the Board-approved risk appetite, provide financial flexibility to support future growth and client needs, comply with relevant laws, regulations, and supervisory guidance, achieve optimal credit ratings for Truist and its subsidiaries, and provide a competitive return to shareholders. Risk-based capital ratios, which include CET1 capital, Tier 1 capital, and Total capital are calculated based on regulatory guidance related to the measurement of capital and risk-weighted assets.
Truist regularly performs stress testing on its capital levels and is required to periodically submit the Company’s capital plans and stress testing results to the banking regulators. Management regularly monitors the capital position of Truist on both a consolidated and bank-level basis. In this regard, management’s overriding policy is to maintain capital at levels that are in excess of internal capital targets, which are above the regulatory “well capitalized” minimums. Management has implemented stressed capital ratio minimum targets to evaluate whether capital ratios calculated after the effect of alternative capital actions are likely to remain above minimums specified by the FRB for the annual CCAR process. Breaches of stressed minimum targets prompt a review of the planned capital actions included in Truist’s capital plan.
| Table 24: Capital Requirements and Targets | ||||||||||||||||||||||||||
| Minimum Capital | Well Capitalized | Minimum Capital Plus Stress Capital Buffer (3) | Truist Targets (1) | |||||||||||||||||||||||
| Truist | Truist Bank | Interim Operating (2) | Stressed | |||||||||||||||||||||||
|
CET1
|
4.5 | % | NA | 6.5 | % | 7.2 | % | 8.0 | % | 7.2 | % | |||||||||||||||
| Tier 1 capital | 6.0 | 6.0 | 8.0 | 8.7 | 9.3 | 8.7 | ||||||||||||||||||||
| Total capital | 8.0 | 10.0 | 10.0 | 10.7 | 11.3 | 10.7 | ||||||||||||||||||||
| Leverage ratio | 4.0 | NA | 5.0 | NA | 7.5 | 7.0 | ||||||||||||||||||||
| Supplementary leverage ratio | 3.0 | NA | NA | NA | 6.5 | 6.0 | ||||||||||||||||||||
(1)
The Truist targets are subject to revision based on regulatory guidance, feedback, and other strategic factors.
(2)
Truist’s goal is to maintain capital levels above all regulatory minimums.
(3)
Reflects a SCB of 270 basis points for Truist.
Truist Financial Corporation 59
While nonrecurring events or management decisions may result in the Company temporarily falling below its operating targets for one or more of these ratios, it is management’s intent to return to these operating targets within a reasonable period of time through capital planning. Such temporary decreases below the operating minimums shown above are not considered an infringement of Truist’s overall capital policy, provided a return above the minimums is forecasted to occur within a reasonable time period.
Truist has approximately $1.5 billion authorization remaining under the share repurchase program approved by the Board of Directors in December 2020. Management’s intention is to maintain an approximate 10 percent Common Equity Tier 1 ratio after considering strategic actions such as non-bank acquisitions or stock repurchases, as well as changes in risk-weighted assets. For the second quarter of 2021, Truist intends to execute share repurchases consistent with the Federal Reserve’s capital restrictions announced on March 25, 2021. In addition to these restrictions, any future stock repurchase activity will be informed by economic and regulatory considerations, as well as Truist’s capital position, dividends, earnings outlook, and capital deployment priorities.
Truist’s capital ratios are presented in the following table:
| Table 25: Capital Ratios - Truist Financial Corporation | ||||||||||||||
| (Dollars in millions, except per share data, shares in thousands) | Mar 31, 2021 | Dec 31, 2020 | ||||||||||||
| Risk-based: | (preliminary) | |||||||||||||
| CET1 capital to risk-weighted assets | 10.1 | % | 10.0 | % | ||||||||||
| Tier 1 capital to risk-weighted assets | 12.0 | 12.1 | ||||||||||||
| Total capital to risk-weighted assets | 14.3 | 14.5 | ||||||||||||
| Leverage ratio | 9.4 | 9.6 | ||||||||||||
| Supplementary leverage ratio | 8.3 | 8.7 | ||||||||||||
| Non-GAAP capital measure (1): | ||||||||||||||
| Tangible common equity per common share | $ | 25.53 | $ | 26.78 | ||||||||||
| Calculation of tangible common equity (1): | ||||||||||||||
| Total shareholders’ equity | $ | 67,876 | $ | 70,912 | ||||||||||
| Less: | ||||||||||||||
| Preferred stock | 7,124 | 8,048 | ||||||||||||
| Noncontrolling interests | — | 105 | ||||||||||||
| Goodwill and intangible assets, net of deferred taxes | 26,413 | 26,629 | ||||||||||||
| Tangible common equity | $ | 34,339 | $ | 36,130 | ||||||||||
| Risk-weighted assets | $ | 378,522 | $ | 379,153 | ||||||||||
| Common shares outstanding at end of period | 1,344,845 | 1,348,961 | ||||||||||||
(1)
Tangible common equity and related measures are non-GAAP measures that exclude the impact of intangible assets, net of deferred taxes, and their related amortization. These measures are useful for evaluating the performance of a business consistently, whether acquired or developed internally. Truist’s management uses these measures to assess the quality of capital and returns relative to balance sheet risk.
These capital measures are not necessarily comparable to similar capital measures that may be presented by other companies.
Capital ratios remained strong compared to the regulatory levels for well capitalized banks. Truist declared common dividends of $0.45 per share during the first quarter of 2021 and completed $506 million of share repurchases. The dividend and total payout ratios for the first quarter of 2021 were 45.4 percent and 83.3 percent, respectively. Truist also redeemed $950 million of preferred stock during the quarter to optimize the Company’s capital position. In connection with the redemptions of preferred stock, net income available to common shareholders was reduced by $26 million to recognize the difference between the redemption price and the carrying value.
60 Truist Financial Corporation
Share Repurchase Activity
| Table 26: Share Repurchase Activity | |||||||||||||||||||||||
| (Dollars in millions, except per share data, shares in thousands) | Total Shares Repurchased (1) | Average Price Paid Per Share (2) | Total Shares Repurchased Pursuant to Publicly-Announced Plan (3) | Maximum Remaining Dollar Value of Shares Available for Repurchase Pursuant to Publicly-Announced Plan | |||||||||||||||||||
| January 2021 | 2,339 | $ | 49.50 | 2,339 | $ | 1,884 | |||||||||||||||||
| February 2021 | 7,165 | 54.46 | 7,165 | 1,494 | |||||||||||||||||||
| March 2021 | 64 | 59.48 | — | 1,494 | |||||||||||||||||||
| Total | 9,568 | 53.28 | 9,504 | ||||||||||||||||||||
(1)
Includes shares exchanged or surrendered in connection with the exercise of equity-based awards under equity-based compensation plans.
(2)
Excludes commissions.
(3)
Pursuant to the 2020 Repurchase Plan, announced in December 2020, authorizing up to $2.0 billion of share repurchases beginning in the first quarter of 2021.
Critical Accounting Policies
The accounting and reporting policies of Truist are in accordance with GAAP and conform to the accounting and reporting guidelines prescribed by bank regulatory authorities. Truist’s financial position and results of operations are affected by management’s application of accounting policies, including estimates, assumptions, and judgments made to arrive at the carrying value of assets and liabilities, and amounts reported for revenues and expenses. Different assumptions in the application of these policies could result in material changes in the consolidated financial position and/or consolidated results of operations, and related disclosures. The more critical policies include accounting for the ACL, determining fair value of financial instruments, intangible assets, income taxes, and benefit obligations associated with pension and postretirement benefit plans. Understanding Truist’s accounting policies is fundamental to understanding the consolidated financial position and consolidated results of operations. The critical accounting policies are discussed in MD&A in Truist’s Annual Report on Form 10-K for the year ended December 31, 2020. Significant accounting policies and changes in accounting principles and effects of new accounting pronouncements are discussed in “Note 1. Basis of Presentation” in Form 10-K for the year ended December 31, 2020. Additional disclosures regarding the effects of new accounting pronouncements are included in the “Note 1. Basis of Presentation” included herein. Except for the item noted below, there have been no other changes to the significant accounting policies during 2021.
Intangible Assets
The Company performed a qualitative assessment of current events and circumstances during the first quarter of 2021, including macroeconomic and market factors, industry and banking sector events, Truist specific performance indicators, and a comparison of management’s forecast and assumptions to those used in its October 1, 2020 quantitative impairment test, concluding that it was not more-likely-than-not that the fair value of one or more of its reporting units is below its respective carrying amount as of March 31, 2021, and therefore no triggering event occurred that required a quantitative goodwill impairment test. If economic conditions deteriorate, or the pandemic’s effects prolong or worsen, it may be more-likely-than-not that the fair value of one or more of Truist’s reporting units falls below its respective carrying amount, which would require a quantitative goodwill impairment test.
ITEM 4. CONTROLS AND PROCEDURES
Evaluation of Disclosure Controls and Procedures
As of the end of the period covered by this report, the management of the Company, under the supervision and with the participation of the Company’s CEO and CFO, carried out an evaluation of the effectiveness of the Company’s disclosure controls, and procedures as defined in Rules 13a-15(e) and 15d-15(e) of the Exchange Act. Based on that evaluation, the CEO and CFO concluded that the Company’s disclosure controls and procedures were effective.
Changes in Internal Control over Financial Reporting
Management of Truist is responsible for establishing and maintaining adequate internal control over financial reporting as defined in Rule 13a-15(f) of the Exchange Act. The Company’s internal control over financial reporting is a process designed to provide reasonable assurance regarding the reliability of financial reporting and the preparation of financial statements for external purposes in accordance with GAAP.
There were no changes in the Company’s internal control over financial reporting that occurred during the quarter ended March 31, 2021 that materially affected, or are reasonably likely to materially affect, the Company’s internal control over financial reporting.
Truist Financial Corporation 61
PART II. OTHER INFORMATION
ITEM 1. LEGAL PROCEEDINGS
Refer to the Litigation and Regulatory Matters section in “Note 13. Commitments and Contingencies,” which is incorporated by reference into this item.
ITEM 1A. RISK FACTORS
There have been no material changes to the risk factors disclosed in Truist’s Annual Report on Form 10-K for the year ended December 31, 2020. Additional risks and uncertainties not currently known to Truist or that management has deemed to be immaterial also may materially adversely affect Truist’s business, financial condition, or operating results.
ITEM 2. UNREGISTERED SALES OF EQUITY SECURITIES AND USE OF PROCEEDS
Refer to the Share Repurchase Activity section in the MD&A, which is incorporated by reference into this item.
62 Truist Financial Corporation
ITEM 6. EXHIBITS
| Exhibit No. | Description | Location | ||||||||||||
| 10.1* | Form of Restricted Stock Unit Agreement (Category 2 Employee) for the Truist Financial Corporation 2012 Incentive Plan (effective 2021). | |||||||||||||
| 10.2* | Form of Restricted Stock Unit Agreement (Executive Officers) for the Truist Financial Corporation 2012 Incentive Plan (effective 2021). | |||||||||||||
| 10.3* | Form of LTIP Award Agreement for the Truist Financial Corporation 2012 Incentive Plan (effective 2021). | |||||||||||||
| 10.4* | Form of Performance Unit Award Agreement for the Truist Financial Corporation 2012 Incentive Plan (effective 2021). | |||||||||||||
| 11 | Statement re computation of earnings per share. | |||||||||||||
| 31.1 | Certification of Chief Executive Officer pursuant to Rule 13a-14(a) or 15d-14(a) of the Exchange Act, as adopted pursuant to Section 302 of the Sarbanes-Oxley Act of 2002. | |||||||||||||
| 31.2 | Certification of Chief Financial Officer pursuant to Rule 13a-14(a) or 15d-14(a) of the Exchange Act, as adopted pursuant to Section 302 of the Sarbanes-Oxley Act of 2002. | |||||||||||||
| 32 | Certification of Chief Executive Officer and Chief Financial Officer pursuant to 18 U.S.C. Section 1350, as adopted pursuant to Section 906 of the Sarbanes-Oxley Act of 2002. | |||||||||||||
| 101.INS | XBRL Instance Document – the instance document does not appear in the interactive data file because its XBRL tags are embedded within the inline XBRL document. | Filed herewith. | ||||||||||||
| 101.SCH | XBRL Taxonomy Extension Schema. | Filed herewith. | ||||||||||||
| 101.CAL | XBRL Taxonomy Extension Calculation Linkbase. | Filed herewith. | ||||||||||||
| 101.LAB | XBRL Taxonomy Extension Label Linkbase. | Filed herewith. | ||||||||||||
| 101.PRE | XBRL Taxonomy Extension Presentation Linkbase. | Filed herewith. | ||||||||||||
| 101.DEF | XBRL Taxonomy Definition Linkbase. | Filed herewith. | ||||||||||||
| 104 | Cover Page Interactive Data File (formatted as inline XBRL with applicable taxonomy extension information contained in Exhibits101). | Filed herewith. | ||||||||||||
|
* Management compensatory plan or arrangement.
|
||||||||||||||
Truist Financial Corporation 63
SIGNATURES
Pursuant to the requirements of the Securities Exchange Act of 1934, the registrant has duly caused this report to be signed on its behalf by the undersigned thereunto duly authorized.
|
TRUIST FINANCIAL CORPORATION
(Registrant)
|
||||||||||||||
| Date: | May 3, 2021 | By: | /s/ Daryl N. Bible | |||||||||||
| Daryl N. Bible | ||||||||||||||
| Senior Executive Vice President and Chief Financial Officer | ||||||||||||||
| (Principal Financial Officer) | ||||||||||||||
| Date: | May 3, 2021 | By: | /s/ Cynthia B. Powell | |||||||||||
| Cynthia B. Powell | ||||||||||||||
| Executive Vice President and Corporate Controller | ||||||||||||||
| (Principal Accounting Officer) | ||||||||||||||
64 Truist Financial Corporation
TABLE OF CONTENTS
Item 1. Financial StatementsNote 1. Basis Of PresentationNote 2. Securities Financing ActivitiesNote 3. Investment SecuritiesNote 4. Loans and AclNote 5. Goodwill and Other Intangible AssetsNote 6. Loan ServicingNote 7. Other Assets and LiabilitiesNote 8. BorrowingsNote 9. Shareholders EquityNote 10. AociNote 11. Income TaxesNote 12. Benefit PlansNote 13. Commitments and ContingenciesNote 14. Fair Value DisclosuresNote 15. Derivative Financial InstrumentsNote 16. Computation Of EpsNote 17. Operating SegmentsItem 2. Management S Discussion and Analysis Of Financial Condition and Results Of OperationsItem 4. Controls and ProceduresPart II. Other InformationItem 1. Legal ProceedingsItem 1A. Risk FactorsItem 2. Unregistered Sales Of Equity Securities and Use Of ProceedsItem 6. Exhibits