TFS FINANCIAL CORP
10-Ks and 10-Qs
|
|
|
|
|
|
|
|
|
|
|
|
|
|
|
|
|
|
|
|
|
|
|
|
|
|
|
|
|
|
|
|
|
|
|
|
|
|
|
|
|
|
|
|
|
|
|
UNITED STATES
SECURITIES AND EXCHANGE COMMISSION
WASHINGTON, D.C. 20549
|
FORM 10-K
|
|
ý
|
ANNUAL REPORT PURSUANT TO SECTION 13 OR 15(d) OF THE SECURITIES EXCHANGE ACT OF 1934
|
For the fiscal year ended September 30, 2012
or
|
¨
|
TRANSITION REPORT PURSUANT TO SECTION 13 OR 15(d) OF THE SECURITIES EXCHANGE ACT OF 1934
|
For transition period from to
Commission File Number 001-33390
___________________________________________
TFS FINANCIAL CORPORATION
(Exact Name of Registrant as Specified in its Charter)
___________________________________________
|
United States of America
|
|
52-2054948
|
|
(State or Other Jurisdiction of
Incorporation or Organization)
|
|
(I.R.S. Employer
Identification No.)
|
|
7007 Broadway Avenue
|
|
|
|
Cleveland, Ohio
|
|
44105
|
|
(Address of Principal Executive Offices)
|
|
(Zip Code)
|
(216) 441-6000
(Registrant’s telephone number, including area code)
Securities registered pursuant to Section 12(b) of the Act:
Common Stock, par value $0.01 per share
(Title of class)
The NASDAQ Stock Market, LLC
(Name of exchange on which registered)
Securities registered pursuant to Section 12(g) of the Act: None
___________________________________________
Indicate by check mark if the registrant is a well-known seasoned issuer, as defined in Rule 405 of the Securities Act. Yes
x
No
o
Indicate by check mark if the registrant is not required to file reports pursuant to Section 13 or Section 15(d) of the Act. Yes
o
No
x
Indicate by check mark whether the Registrant (1) has filed all reports required to be filed by Section 13 or 15(d) of the Securities Exchange Act of 1934 during the preceding 12 months (or for such shorter period that the Registrant was required to file such reports), and (2) has been subject to such filing requirements for the past 90 days. Yes
x
No
o
Indicate by check mark whether the registrant has submitted electronically and posted on its corporate Web site, if any, every Interactive Data File required to be submitted and posted pursuant to Rule 405 of Regulation S-T during the preceding 12 months (or for such shorter period that the registrant was required to submit and post such files). Yes
x
No
o
Indicate by check mark if disclosure of delinquent filers pursuant to Item 405 of Regulation S-K (§229.405 of this chapter) is not contained herein, and will not be contained, to the best of registrant’s knowledge, in definitive proxy or information statements incorporated by reference in Part III of this Form 10-K or any amendment to this Form 10-K.
x
Indicate by check mark whether the Registrant is a large accelerated filer, an accelerated filer, a non-accelerated filer or a smaller reporting company. See the definition of “large accelerated filer", "accelerated filer” and "smaller reporting company" in Rule 12b-2 of the Exchange Act (Check one):
|
Large accelerated filer
x
|
Accelerated filer
o
|
Non-accelerated filer
o
|
Smaller reporting company
o
|
|||
|
(do not check if a smaller reporting company)
|
||||||
Indicate by check mark whether the Registrant is a shell company (as defined in Rule 12b-2 of the Exchange Act.) Yes
o
No
x
The aggregate market value of the voting and non-voting common equity held by non-affiliates of the Registrant, computed by reference to the last sale price on
March 31, 2012
, as reported by the NASDAQ Global Select Market, was approximately
$763.4 million
.
Indicate the number of shares outstanding of each of the Registrant’s classes of common stock as of the latest practicable date.
At
November 19, 2012
there were
309,009,393
shares of the Registrant’s common stock, par value $0.01 per share, outstanding, of which
227,119,132
shares, or
73.50%
of the Registrant’s common stock, were held by Third Federal Savings and Loan Association of Cleveland, MHC, the Registrant’s mutual holding company.
DOCUMENTS INCORPORATED BY REFERENCE
(to the Extent Indicated Herein)
Portions of the registrant’s Proxy Statement for the 2013 Annual Meeting of Shareholders are incorporated by reference in Part III hereof.
TFS Financial Corporation
INDEX
|
Part I
|
|||
|
Item 1.
|
|||
|
Item 1A.
|
|||
|
Item 1B.
|
|||
|
Item 2.
|
|||
|
Item 3.
|
|||
|
Item 4.
|
|||
|
Part II
|
|||
|
Item 5.
|
|||
|
Item 6.
|
|||
|
Item 7.
|
|||
|
Item 7A.
|
|||
|
Item 8.
|
|||
|
Item 9.
|
|||
|
Item 9A.
|
|||
|
Item 9B.
|
|||
|
Part III
|
|||
|
Item 10.
|
|||
|
Item 11.
|
|||
|
Item 12.
|
|||
|
Item 13.
|
|||
|
Item 14.
|
|||
|
Part IV
|
|||
|
Item 15.
|
|||
2
|
Item 1.
|
Business
|
Forward Looking Statements
This report contains forward-looking statements, which can be identified by the use of such words as estimate, project, believe, intend, anticipate, plan, seek, expect and similar expressions. These forward-looking statements include:
|
•
|
statements of our goals, intentions and expectations;
|
|
•
|
statements regarding our business plans and prospects and growth and operating strategies;
|
|
•
|
statements concerning trends in our provision for loan losses and charge-offs;
|
|
•
|
statements regarding the asset quality of our loan and investment portfolios; and
|
|
•
|
estimates of our risks and future costs and benefits.
|
These forward-looking statements are subject to significant risks, assumptions and uncertainties, including, among other things, the following important factors that could affect the actual outcome of future events:
|
•
|
significantly increased competition among depository and other financial institutions;
|
|
•
|
inflation and changes in the interest rate environment that reduce our interest margins or reduce the fair value of financial instruments;
|
|
•
|
general economic conditions, either nationally or in our market areas, including employment prospects, real estate values and conditions that are worse than expected;
|
|
•
|
decreased demand for our products and services and lower revenue and earnings because of a recession or other events;
|
|
•
|
adverse changes and volatility in the securities markets;
|
|
•
|
adverse changes and volatility in credit markets;
|
|
•
|
legislative or regulatory changes that adversely affect our business, including changes in regulatory costs and capital requirements and changes related to our ability to pay dividends and the ability of Third Federal Savings and Loan Association of Cleveland, MHC to waive dividends;
|
|
•
|
our ability to enter new markets successfully and take advantage of growth opportunities, and the possible short-term dilutive effect of potential acquisitions or de novo branches, if any;
|
|
•
|
changes in consumer spending, borrowing and savings habits;
|
|
•
|
changes in accounting policies and practices, as may be adopted by the bank regulatory agencies, the Financial Accounting Standards Board and the Public Company Accounting Oversight Board;
|
|
•
|
future adverse developments concerning Fannie Mae or Freddie Mac;
|
|
•
|
changes in monetary and fiscal policy of the U.S. Government, including policies of the U.S. Treasury and the Federal Reserve Board and changes in the level of government support of housing finance;
|
|
•
|
changes in policy and/or assessment rates of taxing authorities that adversely affect us;
|
|
•
|
changes in expense trends (including, but not limited to trends affecting non-performing assets, charge-offs and provisions for loan losses);
|
|
•
|
the impact of the current governmental effort to restructure the U.S. financial and regulatory system;
|
|
•
|
inability of third-party providers to perform their obligations to us;
|
|
•
|
adverse changes and volatility in real estate markets;
|
|
•
|
a slowing or failure of the moderate economic recovery;
|
|
•
|
the extensive reforms enacted in the Dodd-Frank Wall Street Reform and Consumer Protection Act (“Dodd-Frank Act”), which will impact us;
|
|
•
|
the adoption of implementing regulations by a number of different regulatory bodies under the Dodd-Frank Act, and
|
3
uncertainty in the exact nature, extent and timing of such regulations and the impact they will have on us,
|
•
|
the impact of our coming under the jurisdiction of new federal regulators;
|
|
•
|
changes in our organization, or compensation and benefit plans;
|
|
•
|
the strength or weakness of the real estate markets and of the consumer and commercial credit sectors and its impact on the credit quality of our loans and other assets; and
|
|
•
|
the ability of the U.S. Federal government to manage federal debt limits.
|
Because of these and other uncertainties, our actual future results may be materially different from the results indicated by these forward-looking statements. Please see
Item 1A. Risk Factors
for a discussion of certain risks related to our business.
TFS FINANCIAL CORPORATION
TFS Financial Corporation (“we,” “us,” “our,” or the “Company”) was organized in 1997 as the mid-tier stock holding company for Third Federal Savings and Loan Association of Cleveland (“Third Federal Savings and Loan” or the “Association”). We completed our initial public stock offering on April 20, 2007 and issued 100,199,618 shares of common stock, or 30.16% of our post-offering outstanding common stock, to subscribers in the offering. Additionally, at the time of the public offering, 5,000,000 shares of our common stock, or 1.50% of our outstanding shares, were issued to the newly formed charitable foundation, Third Federal Foundation (the “Foundation”). Third Federal Savings and Loan Association of Cleveland, MHC (“Third Federal Savings, MHC”), our mutual holding company parent, holds the remainder of our outstanding common stock (
227,119,132
shares). Net proceeds from our initial public stock offering were approximately $886 million and reflected the costs we incurred in completing the offering as well as a $106.5 million loan to the Third Federal Employee Stock Ownership Plan related to its acquisition of shares in the initial public stock offering.
Our ownership of the Association remains our primary business activity.
We also operate Third Capital, Inc. as a wholly-owned subsidiary.
As the holding company of Third Federal Savings and Loan, we are authorized to pursue other business activities permitted by applicable laws and regulations for savings and loan holding companies, which include making equity investments and the acquisition of banking and financial services companies.
Our cash flow depends primarily on earnings from the investment of the portion of the net offering proceeds we retained, and any dividends we receive from Third Federal Savings and Loan and Third Capital, Inc. All of our officers are also officers of the Association. In addition, we use the services of the support staff of the Association from time to time. We may hire additional employees, as needed, to the extent we expand our business in the future.
THIRD CAPITAL, INC.
Third Capital, Inc. is a Delaware corporation that was organized in 1998 as our wholly-owned subsidiary. At
September 30, 2012
, Third Capital, Inc. had consolidated assets of $81.8 million, and for the fiscal year ended
September 30, 2012
, Third Capital, Inc. had consolidated net income of $0.5 million. Third Capital, Inc. has no separate operations other than as the holding company for its operating subsidiaries, and as a minority investor or partner in other entities including minority investments in private equity funds. The following is a description of the entities, other than the private equity funds, in which Third Capital, Inc. is the owner, an investor or a partner.
Hazelmere Investment Group I, Ltd.
This Ohio limited liability company engages in net lease transactions of commercial buildings in targeted markets. Third Capital, Inc. is a partner of this entity, receives a preferred return on amounts contributed to acquire investment properties and has a 70% ownership interest in remaining earnings. Hazelmere Investment Group I, Ltd
.
incurred a net loss of $0.5 million during fiscal
2012
.
Third Cap Associates, Inc.
This Ohio corporation also maintains minority investments in private equity funds, and owns 49% and 60% of two title agencies that provide escrow and settlement services in the State of Ohio, primarily to customers of Third Federal Savings and Loan. For the fiscal year ended
September 30, 2012
, Third Cap Associates, Inc. recorded net income of $1.5 million.
Third Capital Mortgage Insurance Company.
This Vermont corporation reinsures private mortgage insurance on residential mortgage loans originated by Third Federal Savings and Loan. For the fiscal year ended
September 30, 2012
, Third Capital Mortgage Insurance Company incurred a net loss of $0.4 million.
4
THIRD FEDERAL SAVINGS AND LOAN ASSOCIATION OF CLEVELAND
General
Third Federal Savings and Loan is a federally chartered savings and loan association headquartered in Cleveland, Ohio that was organized in 1938. In May 1997, the Association reorganized into its current two-tier mutual holding company structure. The Association’s principal business consists of originating and servicing residential real estate mortgage loans and attracting retail savings deposits.
The Association’s business strategy is to originate mortgage loans with interest rates that are competitive with those of similar products offered by other financial institutions in its markets. Similarly, the Association offers high-yield checking accounts and high-yield savings accounts and certificate of deposit accounts, each bearing interest rates that are competitive with similar products offered by other financial institutions in its markets. The Association expects to continue to pursue this business philosophy. While this strategy does not enable it to earn the highest rates of interest on loans it offers or pay the lowest rates on its deposit accounts, the Association believes that this strategy is the primary reason for its successful growth in the past.
The Association attracts retail deposits from the general public in the areas surrounding its main office and its branch offices. It also utilizes its internet website and its customer service call center to generate loan applications and attract retail deposits. In addition to residential real estate mortgage loans, the Association originates residential construction loans. Prior to June 28, 2010, the Association also actively originated home equity loans and lines of credit. In connection with its home equity risk reduction program, in June 2010, originations of home equity loans and lines of credit were suspended. Beginning in 2012, the Association originates home equity loans and lines of credit to only its existing line customers. The Association retains in its portfolio a large portion of the loans that it originates. Loans that the Association sells consist primarily of long-term, fixed-rate residential real estate mortgage loans. Since June 2010, the volume of loan sales has decreased significantly as, to date, the Association has not adopted certain loan origination requirement changes affecting loan eligibility for sale as promulgated by Fannie Mae, effective July 1, 2010. The Association retains the servicing rights on all loans that it sells. The Association’s revenues are derived primarily from interest on loans and, to a lesser extent, interest on interest-bearing deposits in other financial institutions, deposits maintained at the Federal Reserve, federal funds sold, and investment securities, including mortgage-backed securities. The Association also generates revenues from fees and service charges. The Association’s primary sources of funds are deposits, borrowings, principal and interest payments on loans and securities and proceeds from loan sales.
The Association’s website address is
www.thirdfederal.com
. Filings of the Company made with the Securities and Exchange Commission are available for free on the Association’s website. Information on that website is not and should not be considered a part of this document.
Market Area
Third Federal Savings and Loan conducts its operations from its main office in Cleveland, Ohio, and from 39 additional, full-service branches and eight loan production offices located throughout the states of Ohio and Florida. In Ohio, the Association’s 22 full-service offices are located in the northeast Ohio counties of Cuyahoga, Lake, Lorain, Medina and Summit, four loan production offices are located in the central Ohio county of Franklin and Delaware (Columbus, Ohio) and four loan production offices are located in the southern Ohio counties of Butler and Hamilton (Cincinnati, Ohio). In Florida, 17 full-service branches are located in the counties of Pasco, Pinellas, Hillsborough, Sarasota, Lee, Collier, Palm Beach and Broward. The economies and housing markets in Ohio and Florida have been negatively impacted by the current economic situation. In recent years, both states have experienced high foreclosures rates and reduced employment rates and housing values. The depressed housing market and employment uncertainties have created consumer pessimism and apprehension, which is manifested in suppressed consumer housing demand.
The Association also provides savings products in all 50 states and first mortgage refinance loans in 11 selected states outside of its branch footprint through its customer service call center and its internet site.
Competition
The Association faces intense competition in its market areas both in making loans and attracting deposits. Its market areas have a high concentration of financial institutions, including large money center and regional banks, community banks and credit unions, and it faces additional competition for deposits from money market funds, brokerage firms, mutual funds and insurance companies. Some of its competitors offer products and services that the Association currently does not offer, such as commercial business loans, trust services and private banking.
5
The majority of the Association’s deposits are held in its offices located in Cuyahoga County, Ohio. As of June 30, 2012 (the latest date for which information is publicly available), the Association had $4.80 billion of deposits in Cuyahoga County, and ranked second among all financial institutions with offices in the county in terms of deposits, with a market share of 12.96%. As of that date, the Association had $6.16 billion of deposits in the State of Ohio, and ranked 9
th
among all financial institutions in the state in terms of deposits, with a market share of 2.53%. As of June 30, 2012, the Association had $2.93 billion of deposits in the State of Florida, and ranked 21
st
among all financial institutions in terms of deposits, with a market share of 0.69%.
Since 2009 the Federal Deposit Insurance Corporation (“FDIC”) has administered the resolution of hundreds of troubled financial institutions, the Depository Insurance Fund (“DIF”) has incurred significant losses and the reserves of the DIF has been substantially depleted. This depletion prompted re-examination of the method of assessing insured institutions and rebuilding the DIF. Further, the Dodd-Frank Act, which was signed into law in July 2010, required that the FDIC amend its regulations to define “assessment base” as an insured institution’s average total assets minus average tangible equity during the assessment period. This revision had the effect of eliminating the funding cost advantage that borrowed funds generally had when compared to the funding cost associated with deposits. As a result, many financial institutions, including institutions that compete in our markets, have targeted retail deposit gathering as a more attractive funding source than borrowings, and have become more active and more competitive in their deposit product pricing. The combination of reduced demand by borrowers and more competition with respect to rates paid to depositors has created an increasingly difficult marketplace for attracting deposits, which could adversely affect future operating results.
From October 2011 through September 2012, the Association had the second largest market share of conventional purchase mortgage loans originated in Cuyahoga County, Ohio. For the same period, it also had the second largest market share of conventional purchase mortgage loans originated in the seven northeast Ohio counties which comprise the Cleveland and Akron metropolitan statistical areas. In addition, based on the same statistics, the Association has consistently been one of the six largest lenders in Franklin County (Columbus, Ohio) and one of the 10 largest lenders in Hamilton County (Cincinnati, Ohio) since it entered those markets in 1999.
The Association’s primary strategy for increasing and retaining its customer base is to offer competitive deposit and loan rates and other product features, delivered with exceptional customer service, in each of the markets it serves.
We rely on the Association’s almost 75-year history of serving its customers and the communities in which it operates, the Association’s high capital levels, and liquidity alternatives to maintain and nurture customer and marketplace confidence. The Company’s high capital ratio continues to reflect the beneficial impact of our April 2007 initial public offering, which raised net proceeds of $886 million. At
September 30, 2012
, our ratio of shareholders’ equity to total assets was 15.7%. Our liquidity alternatives include management and monitoring of the level of liquid assets held in our portfolio as well as the maintenance of alternative wholesale funding sources. At
September 30, 2012
, our liquidity ratio was
5.80%
(which we compute as the sum of cash and cash equivalents plus unpledged investment securities for which ready markets exist, divided by total assets) and, through the Association, we had the ability to immediately borrow an additional
$466.6 million
from the Federal Home Loan Bank of Cincinnati (“FHLB of Cincinnati”) under existing credit arrangements along with
$233.3 million
from the Federal Reserve Bank of Cleveland (“Federal Reserve”). From the perspective of collateral value securing FHLB of Cincinnati advances, our capacity limit for additional borrowings at
September 30, 2012
was
$4.22 billion
, subject to satisfaction of the FHLB of Cincinnati common stock ownership requirement. To satisfy the common stock ownership requirement we would have to increase our ownership of FHLB of Cincinnati common stock by an additional
$75.0 million
. See “Item 7. Management’s Discussion and Analysis of Financial Condition and Results of Operation—Liquidity and Capital Resources.”
We continue to utilize a multi-faceted approach to support our efforts to instill customer and marketplace confidence. First, we provide thorough and timely information to all of our associates so as to prepare them for their day-to-day interactions with customers and other individuals who are not part of the Company. We believe that it is important that our customers and others sense the comfort level and confidence of our associates throughout their dealings. Second, we encourage our management team to maintain a presence and to be available in our branches and other areas of customer contact, so as to provide more opportunities for informal contact and interaction with our customers and community members. Third, our CEO remains accessible to both local and national media, as a spokesman for our institution as well as an observer and interpreter of financial marketplace situations and events. Fourth, we periodically include advertisements in local newspapers that display our strong capital levels and history of service. We also continue to emphasize our traditional tagline—“STRONG * STABLE * SAFE”—in our advertisements and branch displays. Finally, for customers who adhere to the old adage of trust but verify, we refer them to the safety/security rankings of a nationally recognized, independent rating organization that specializes in the evaluation of financial institutions, which has awarded Third Federal Savings and Loan its highest rating.
6
Lending Activities
The Association’s principal lending activity is the origination of first mortgage loans to purchase or refinance residential real estate. Its current policies generally provide that it will maintain between 40% and 70% of its assets in fixed-rate, residential real estate, first mortgage loans and up to 30% of its assets in adjustable-rate, residential real estate, first mortgage loans, subject to its liquidity levels and the credit demand of its customers. At
September 30, 2012
adjustable-rate, residential real estate, first mortgage loans comprised
25%
of total assets. The Association also originates residential construction loans to individuals (for the construction of their personal residences by a qualified builder) and prior to June 28, 2010 originated a significant amount of home equity loans and lines of credit. Between June 28, 2010 and March 11, 2012 the association suspended the acceptance of new equity line of credit applications. Effective March 20, 2012, the Association began offering new equity lines of credit to qualify existing home equity customers. Refer to Item 7. Management’s Discussion and Analysis of Financial Condition and Results of Operation -
Monitoring and Limiting Our Credit Risk
for additional information regarding home equity loans and lines of credit. At
September 30, 2012
, residential real estate mortgage loans totaled
$8.15 billion
, or
78.5
% of our loan portfolio, home equity loans and lines of credit totaled
$2.16 billion
, or
20.8
% of our loan portfolio, and residential construction loans totaled
$69.2 million
, or
0.7
% of our loan portfolio.
Loan Portfolio Composition.
The following table sets forth the composition of the loan portfolio, by type of loan segregated by geographic location at the dates indicated, excluding loans held for sale. Construction loans are on properties located in Ohio and the balances of consumer loans are immaterial. Therefore, neither was segregated by geographic location.
|
|
September 30,
|
|||||||||||||||||||||||||||||||||
|
|
2012
|
2011
|
2010
|
2009
|
2008
|
|||||||||||||||||||||||||||||
|
|
Amount
|
Percent
|
Amount
|
Percent
|
Amount
|
Percent
|
Amount
|
Percent
|
Amount
|
Percent
|
||||||||||||||||||||||||
|
|
(Dollars in thousands)
|
|||||||||||||||||||||||||||||||||
|
Real estate loans:
|
||||||||||||||||||||||||||||||||||
|
Residential non-Home
Today(1)
|
||||||||||||||||||||||||||||||||||
|
Ohio
|
$
|
6,088,264
|
|
$
|
5,691,614
|
|
$
|
4,843,804
|
|
$
|
4,582,542
|
|
$
|
5,133,689
|
|
|||||||||||||||||||
|
Florida
|
1,396,612
|
|
1,269,242
|
|
1,168,701
|
|
1,285,426
|
|
1,105,836
|
|
||||||||||||||||||||||||
|
Other
|
458,289
|
|
159,933
|
|
125,949
|
|
122,315
|
|
159,967
|
|
||||||||||||||||||||||||
|
Total
|
7,943,165
|
|
76.5
|
%
|
7,120,789
|
|
71.5
|
%
|
6,138,454
|
|
65.4
|
%
|
5,990,283
|
|
64.0
|
%
|
6,399,492
|
|
68.7
|
%
|
||||||||||||||
|
Residential Home
Today
|
||||||||||||||||||||||||||||||||||
|
Ohio
|
199,456
|
|
252,879
|
|
268,983
|
|
279,835
|
|
291,386
|
|
||||||||||||||||||||||||
|
Florida
|
8,540
|
|
10,784
|
|
10,940
|
|
11,128
|
|
11,070
|
|
||||||||||||||||||||||||
|
Other
|
329
|
|
356
|
|
610
|
|
729
|
|
697
|
|
||||||||||||||||||||||||
|
Total
|
208,325
|
|
2.0
|
|
264,019
|
|
2.6
|
|
280,533
|
|
3.0
|
|
291,692
|
|
3.1
|
|
303,153
|
|
3.3
|
|
||||||||||||||
|
Home equity loans and
lines of credit(2)
|
||||||||||||||||||||||||||||||||||
|
Ohio
|
838,492
|
|
982,591
|
|
1,145,819
|
|
1,192,498
|
|
1,098,912
|
|
||||||||||||||||||||||||
|
Florida
|
628,554
|
|
712,087
|
|
797,658
|
|
831,979
|
|
731,538
|
|
||||||||||||||||||||||||
|
California
|
256,900
|
|
293,307
|
|
324,778
|
|
343,432
|
|
292,100
|
|
||||||||||||||||||||||||
|
Other
|
431,550
|
|
503,213
|
|
580,435
|
|
615,094
|
|
365,504
|
|
||||||||||||||||||||||||
|
Total
|
2,155,496
|
|
20.8
|
|
2,491,198
|
|
25.0
|
|
2,848,690
|
|
30.4
|
|
2,983,003
|
|
31.8
|
|
2,488,054
|
|
26.7
|
|
||||||||||||||
|
Construction
|
69,152
|
|
0.7
|
82,048
|
|
0.8
|
|
100,404
|
|
1.1
|
|
94,287
|
|
1.0
|
|
115,323
|
|
1.2
|
|
|||||||||||||||
|
Consumer loans:
|
||||||||||||||||||||||||||||||||||
|
Automobile
|
—
|
|
—
|
|
—
|
|
—
|
|
1
|
|
—
|
|
35
|
|
—
|
|
1,044
|
|
—
|
|
||||||||||||||
|
Other loans
|
4,612
|
|
—
|
|
6,868
|
|
0.1
|
|
7,198
|
|
0.1
|
|
7,072
|
|
0.1
|
|
6,555
|
|
0.1
|
|
||||||||||||||
|
Total loans receivable
|
10,380,750
|
|
100.0
|
%
|
9,964,922
|
|
100.0
|
%
|
9,375,280
|
|
100.0
|
%
|
9,366,372
|
|
100.0
|
%
|
9,313,621
|
|
100.0
|
%
|
||||||||||||||
|
Deferred loan fees, net
|
(18,561
|
)
|
(19,854
|
)
|
(15,283
|
)
|
(10,463
|
)
|
(14,596
|
)
|
||||||||||||||||||||||||
|
Loans in process
|
(36,736
|
)
|
(37,147
|
)
|
(45,008
|
)
|
(41,076
|
)
|
(46,493
|
)
|
||||||||||||||||||||||||
|
Allowance for loan
losses
|
(100,464
|
)
|
(156,978
|
)
|
(133,240
|
)
|
(95,248
|
)
|
(43,796
|
)
|
||||||||||||||||||||||||
|
Total loans receivable, net
|
$
|
10,224,989
|
|
$
|
9,750,943
|
|
$
|
9,181,749
|
|
$
|
9,219,585
|
|
$
|
9,208,736
|
|
|||||||||||||||||||
______________________
|
(1)
|
See the
Residential Real Estate Mortgage Loans
section which follows for a description of Home Today and non-Home Today loans.
|
7
|
(2)
|
Includes bridge loans (loans where borrowers can utilize the existing equity in their current home to fund the purchase of a new home before they have sold their current home).
|
Loan Portfolio Maturities.
The following table summarizes the scheduled repayments of the loan portfolio at
September 30, 2012
. Demand loans, loans having no stated repayment schedule or maturity, and overdraft loans are reported as being due in the fiscal year ending September 30,
2013
. Maturities are based on the final contractual payment date and do not reflect the impact of prepayments and scheduled principal amortization.
|
Due During the Years
Ending September 30,
|
Residential Real Estate
|
Home Equity
Loans
and Lines of
Credit(1)
|
Construction
Loans
|
Consumer
And Other
Loans
|
Total
|
||||||||||||||||||
|
Non-Home
Today
|
Home
Today
|
||||||||||||||||||||||
|
|
(In thousands)
|
||||||||||||||||||||||
|
2013
|
$
|
2,858
|
|
$
|
—
|
|
$
|
2,177
|
|
$
|
5,288
|
|
$
|
4,612
|
|
$
|
14,935
|
|
|||||
|
2014
|
6,504
|
|
9
|
|
2,164
|
|
2,281
|
|
—
|
|
10,958
|
|
|||||||||||
|
2015
|
3,469
|
|
9
|
|
3,214
|
|
—
|
|
—
|
|
6,692
|
|
|||||||||||
|
2016 to 2017
|
52,878
|
|
130
|
|
10,932
|
|
—
|
|
—
|
|
63,940
|
|
|||||||||||
|
2018 to 2022
|
607,186
|
|
3,273
|
|
81,878
|
|
—
|
|
—
|
|
692,337
|
|
|||||||||||
|
2023 to 2027
|
1,576,976
|
|
2,588
|
|
866,896
|
|
5,493
|
|
—
|
|
2,451,953
|
|
|||||||||||
|
2028 and beyond
|
5,693,294
|
|
202,316
|
|
1,188,235
|
|
56,090
|
|
—
|
|
7,139,935
|
|
|||||||||||
|
Total
|
$
|
7,943,165
|
|
$
|
208,325
|
|
$
|
2,155,496
|
|
$
|
69,152
|
|
$
|
4,612
|
|
$
|
10,380,750
|
|
|||||
______________________
|
(1)
|
Includes bridge loans (loans where borrowers can utilize the existing equity in their current home to fund the purchase of a new home before they have sold their current home).
|
The following table sets forth the scheduled repayments of fixed- and adjustable-rate loans at
September 30, 2012
that are contractually due after September 30,
2013
.
|
|
Due After September 30, 2013
|
||||||||||
|
|
Fixed
|
Adjustable
|
Total
|
||||||||
|
|
(In thousands)
|
||||||||||
|
Real estate loans:
|
|||||||||||
|
Residential non-Home Today
|
$
|
5,015,213
|
|
$
|
2,925,094
|
|
$
|
7,940,307
|
|
||
|
Residential Home Today
|
208,206
|
|
119
|
|
208,325
|
|
|||||
|
Home Equity Loans and Lines of Credit(1)
|
50,620
|
|
2,102,699
|
|
2,153,319
|
|
|||||
|
Construction
|
42,747
|
|
21,117
|
|
63,864
|
|
|||||
|
Consumer Loans:
|
|||||||||||
|
Other
|
—
|
|
—
|
|
—
|
|
|||||
|
Total
|
$
|
5,316,786
|
|
$
|
5,049,029
|
|
$
|
10,365,815
|
|
||
______________________
|
(1)
|
Includes bridge loans (loans where borrowers can utilize the existing equity in their current home to fund the purchase of a new home before they have sold their current home).
|
Residential Real Estate Mortgage Loans.
The Association’s primary lending activity is the origination of residential real estate mortgage loans. A comparison of
2012
data to the corresponding
2011
data and the Association’s expectations for
2013
can be found in “Item 7. Management’s Discussion and Analysis of Financial Condition and Results of Operation.” The Association currently offers fixed-rate conventional mortgage loans with terms of 30 years or less that are fully amortizing with monthly loan payments, and adjustable-rate mortgage loans that amortize over a period of up to 30 years, provide an initial fixed interest rate for three or five years and then adjust annually. Effective March 11, 2009, the Association discontinued offering “interest only” residential real estate mortgage loans, where the borrower pays interest for an initial period (one, three or five years), after which the loan converts to a fully amortizing loan. At
September 30, 2012
, “interest only” residential real estate mortgage loans totaled $
11.5 million
.
Historically, residential real estate mortgage loans were generally underwritten according to Fannie Mae’s dollar limit requirements, and the Association referred to these loans that conform to such limits as “conforming loans.” Effective July 1, 2010, Fannie Mae, the Association’s primary loan investor, implemented certain loan origination requirement changes affecting
8
loan eligibility that, to date, we have not fully adopted, as explained below. The Association generally originates both fixed- and adjustable-rate mortgage loans in amounts up to the maximum conforming loan limits as established by the Office of Federal Housing Enterprise Oversight, which is currently $417,000 and $625,000, respectively, for single-family homes in most of our lending markets. The Association also originates loans above the lending limit for conforming loans, which the Association refers to as “jumbo loans.” The Association generally underwrites jumbo loans in a manner similar to conforming loans. Jumbo loans are not uncommon in the Association’s market areas. During periods of high market activity, these jumbo loans are generally eligible for sale to various firms that specialize in purchasing non-conforming loans although, since the beginning of the 2008 recessionary period, there has been very limited activity with respect to the sale of non-conforming loans. The Association has not sold any jumbo loans since June 2005.
The Association has always considered the promotion of home ownership a primary goal. In that regard, it has historically offered affordable housing programs in all of its market areas. These programs are targeted toward low- and moderate-income home buyers. The Association’s primary program is called Home Today and is described in detail below. Prior to March 27, 2009, loans originated under the Home Today program had higher risk characteristics. The Association did not classify it as a sub-prime lending program based on the exclusion provided to community development loans in the
Expanded Guidance for Sub-prime Lending
issued by The Office of Thrift Supervision and the Office of the Comptroller of the Currency. During the last several years, attention has focused on sub-prime lending and its negative effect on borrowers and financial markets. Borrowers in the Home Today program are not charged higher fees or interest rates than non-Home Today borrowers. These loans are not interest only or negative amortizing and contain no low initial payment features or adjustable interest rates, which are features often associated with sub-prime lending. While the credit risk profiles of the Association’s borrowers in the Home Today program are generally higher risk than the credit risk profiles of its non-Home Today borrowers, the Association attempts to mitigate that higher risk through the use of private mortgage insurance and continued pre- and post-purchase counseling. The Association’s philosophy has been to provide borrowers the opportunity for home ownership within their financial means. Effective March 27, 2009, the Home Today underwriting guidelines were revised to be substantially the same as for the Association’s traditional first mortgage product.
Prior to March 27, 2009, through the Home Today program, the Association originated loans with its standard terms to borrowers who might not have otherwise qualified for such loans. After March 27, 2009 borrowers under the Home Today program are subject to substantially the same qualification requirements as non-Home Today borrowers. To qualify for the Association’s Home Today program, a borrower must complete financial management education and counseling and must be referred to the Association by a sponsoring organization with which the Association has partnered as part of the program. Borrowers must meet a minimum credit score threshold. The Association will originate loans with a loan-to-value ratio of up to 90% through its Home Today program, provided that any loan originated through this program with a loan-to-value ratio in excess of 80% must meet the underwriting criteria mandated by its private mortgage insurance carrier. Because the Association previously applied less stringent underwriting and credit standards to these loans, the vast majority of loans originated under the Home Today program generally have greater credit risk than our traditional residential real estate mortgage loans. Effective October 2007, the private mortgage insurance carrier that provides coverage for the Home Today loans with loan-to-value ratios in excess of 80% imposed more restrictive lending requirements that have decreased the volume of Home Today lending, which decrease we expect will continue. As of
September 30, 2012
, the Association had
$208.3 million
of loans outstanding that were originated through its Home Today program. Originations under the Home Today program have effectively stopped as a result of these new requirements. At
September 30, 2012
, of the loans that were originated under the Home Today program,
21.1%
were delinquent 30 days or more in repayments, compared to
1.3%
for the portfolio of non-Home Today loans as of that date. At
September 30, 2012
,
$27.5 million
, or
13.4%
, of loans originated under the Home Today program were delinquent 90 days and over and
$41.1 million
of Home Today loans were non-accruing loans, representing
22.5%
of total non-accruing loans as of that date. See “—Non-performing Assets and Restructured Loans—Delinquent Loans” for a discussion of the asset quality of this portion of the Association’s loan portfolio.
Prior to November 25, 2008 the Association also originated loans under its high loan-to-value (“High LTV”) program. These loans had initial loan-to-value ratios of 90% or greater and could be as high as 95%. To qualify for this program, the loan applicant was required to satisfy more stringent underwriting criteria (credit score, income qualification, and other criteria). Borrowers did not obtain private mortgage insurance with respect to these loans. High LTV loans were originated with higher interest rates than the Association’s other residential real estate loans. The Association believes that the higher credit quality of this portion of the portfolio offsets the risk of not requiring private mortgage insurance. While these loans were not initially covered by private mortgage insurance, the Association had negotiated with a private mortgage insurance carrier a contract under which, at the Association’s option, a pre-determined dollar amount of qualifying loans could be grouped and submitted to the carrier for pooled private mortgage insurance coverage. As of
September 30, 2012
, the Association had $
214.6 million
of loans outstanding that were originated through its High LTV program, $
184.0 million
of which the Association has insured through the private mortgage insurance carrier. The High LTV program was suspended November 25, 2008.
9
For loans with loan-to-value ratios in excess of 80% but equal to or less than 90% (which are available only for purchase transactions), the Association requires private mortgage insurance, except that for adjustable-rate, first mortgage loans that meet enhanced credit qualification parameters, loan-to-value ratios of up to 85% may be obtained without private mortgage insurance. Loan-to-value ratios in excess of 80% are not available for refinance transactions except that for adjustable-rate, first mortgage loans that meet enhanced credit qualification parameters, loan-to-value ratios of up to 85% may be obtained without private mortgage insurance.
The Association actively monitors its interest rate risk position to determine the desirable level of investment in fixed-rate mortgages. Prior to July 2010, depending primarily on market interest rates and its capital and liquidity positions, the Association elected to: (1) retain all of its newly originated longer-term fixed-rate residential mortgage loans, (2) sell all or a portion of such loans in the secondary mortgage market to governmental entities such as Fannie Mae or other purchasers; or (3) securitize such loans by selling the loans in exchange for mortgage-backed securities. Securitized loans can be sold more readily to meet liquidity or interest rate risk management needs, and have a lower risk-weight than the underlying loans, which reduces the Association’s regulatory capital requirements. All of the loans that the Association sold or securitized during the five fiscal years ended
September 30, 2012
were fixed-rate mortgage loans.
Effective July 1, 2010, Fannie Mae, historically the Association’s primary loan investor, implemented certain loan origination requirement changes affecting loan eligibility that, to date, we have not adopted. In reaching our current decision regarding implementation of the changes necessary to comply with Fannie Mae’s revised requirements, we considered that since 1991, the Association, employing only non-commissioned loan originators and utilizing a centralized underwriting process, had sold loans to Fannie Mae under a series of proprietary variances, or contract waivers, that were negotiated between us and Fannie Mae during the term of our relationship. These proprietary concessions related to certain loan file documentation and quality control procedures that, in our opinion, did not diminish in any way the credit quality of the loans that we delivered to Fannie Mae, but facilitated the efficiency and effectiveness of our operations and the quality and value of the loan products that we were able to offer to our borrowers. The credit quality of the loans that we delivered to Fannie Mae was consistently evidenced by the superior delinquency profile of our portfolio in peer performance comparisons prepared by Fannie Mae throughout the term of our relationship. In response to the tumult of the housing crisis that commenced in 2008, and with the objective of improving the credit profile of its loan portfolio, Fannie Mae enacted many credit tightening measures, culminating in the effective elimination of proprietary variances and waivers, accompanied by the imposition of additional file documentation requirements and expanded quality control procedures. In addition to substantively changing Fannie Mae’s operating environment, effects of the housing crisis spread throughout the secondary residential mortgage market and resulted in a significantly altered operating framework for all secondary market participants. We believe that this dramatically altered operating framework offers opportunities for business process innovators to create new secondary market solutions especially as such opportunities pertain to high credit quality residential loans similar to those that we have traditionally originated. With the current uncertainty as to how the secondary market might be structured in the future, the Association has concluded that it is premature to incur the costs of the infrastructural changes to our operations (file documentation collection and additive quality control procedures) that would be necessary to fully comply with current Fannie Mae loan eligibility standards. However, pursuant to the specifications of Fannie Mae's Home Affordable Refinance Program ("HARP II"), the Association sold
$11.4 million
of longer-term fixed rate residential loans to Fannie Mae during the fiscal year ended
September 30, 2012
. The Association continues to monitor secondary market developments and will continue to assess the merits of implementing the changes required to comply with Fannie Mae’s loan eligibility standards. As a result, the Association’s ability to reduce interest rate risk via our traditional loan sales of newly originated longer-term fixed rate residential loans is limited until the Association either changes its loan origination processes or Fannie Mae, Freddie Mac or other market participants revise their loan eligibility standards. In response to this situation, the Association developed, and on July 21, 2010, began marketing a new adjustable-rate mortgage loan product that provides the Association with improved interest rate risk characteristics when compared to a long-term, fixed-rate mortgage.
The Association currently retains the servicing rights on all loans sold in order to generate fee income and reinforce its commitment to customer service. These one- to four-family residential mortgage real estate loans were underwritten generally to Fannie Mae guidelines and comply with applicable federal, state and local laws. At the time of the closing of these loans the Association owned the loans and subsequently sold them to Fannie Mae and others providing normal and customary representations and warranties, including representations and warranties related to compliance, generally with Fannie Mae underwriting standards. At the time of sale, the loans were free from encumbrances except for the mortgages filed for by the Association which, with other underwriting documents, were subsequently assigned and delivered to Fannie Mae and others. For the fiscal years ended
September 30, 2012
and
2011
, the Association recognized servicing fees, net of amortization, related to these servicing rights of
$7.3 million
and
$11.4 million
, respectively. As of
September 30, 2012
and
2011
, the principal balance of loans serviced for others totaled
$3.81 billion
and
$5.43 billion
, respectively. At
September 30, 2012
, substantially all of the loans serviced for Fannie Mae and others were performing in accordance with their contractual terms and management believes that it has no material repurchase obligations associated with these loans but an accrual for $2.4 million
10
has been established for potential repurchase or loss reimbursement requests at
September 30, 2012
. See "Critical Accounting Policies: Mortgage Servicing Rights
"
for further discussion.
The Association currently offers “Smart Rate” adjustable-rate mortgage loan products secured by residential properties with interest rates that are fixed for an initial period of three or five years, after which the interest rate generally resets every year based upon a contractual spread or margin above the Prime Rate as published in the Wall Street Journal. These adjustable-rate mortgages provide the borrower with an attractive rate reset option, based on the Association’s then current lending rates. Prior to July 2010, the Association’s adjustable-rate mortgage loan products secured by residential properties offered interest rates that were fixed for an initial period ranging from one year to five years, after which the interest rate generally reset every year based upon a contractual spread or margin above the average yield on U.S. Treasury securities, adjusted to a constant maturity of one year, as published weekly by the Federal Reserve Board (“Traditional ARM”). All of the Association’s adjustable-rate mortgage loans are subject to periodic and lifetime limitations on interest rate changes. Prior to March 11, 2009, the Association offered mortgage loans where the borrower paid only interest for a portion of the loan term (“Interest-only ARM”). All of its adjustable-rate mortgage loans with initial fixed-rate periods of one, three or five years have initial and periodic caps of two percentage points on interest rate changes, with a cap of six percentage points for the life of the loan for Traditional ARM and Interest-only ARM loans and five or six percentage points for the life of Smart Rate loans. Previously, the Association also offered Traditional ARM loans with an initial fixed-rate period of seven years. Loans originated under that program, which was discontinued in August 2007, had an initial cap of five percentage points on the changes in interest rate, with a two percentage point cap on subsequent changes and a cap of five percentage points for the life of the loan. Many of the borrowers who select adjustable-rate mortgage loans have shorter-term credit needs than those who select long-term, fixed-rate mortgage loans. The Association will permit borrowers to convert non-“Smart Rate” adjustable-rate mortgage loans into fixed-rate mortgage loans at no cost to the borrower. The Association has never offered “Option ARM” loans, where borrowers can pay less than the interest owed on their loan, resulting in an increased principal balance during the life of the loan.
Adjustable-rate mortgage loans generally present different credit risks than fixed-rate mortgage loans primarily because the underlying debt service payments of the borrowers increase as interest rates increase, thereby increasing the potential for default. Interest-only loans present different credit risks than fully amortizing loans, as the principal balance of the loan does not decrease during the interest-only period. As a result, the Association’s exposure to loss of principal in the event of default does not decrease during this period. Adjustable rate, interest-only loans comprise less than 1% of our residential loans.
The Association requires title insurance on all of its residential real estate mortgage loans. The Association also requires that borrowers maintain fire and extended coverage casualty insurance (and, if appropriate, flood insurance up to $250 thousand) in an amount at least equal to the lesser of the loan balance or the replacement cost of the improvements. A majority of its residential real estate mortgage loans have a mortgage escrow account from which disbursements are made for real estate taxes and flood insurance. The Association does not conduct environmental testing on residential real estate mortgage loans unless specific concerns for hazards are identified by the appraiser used in connection with the origination of the loan.
Home Equity Loans and Home Equity Lines of Credit
. Prior to June 28, 2010, the Association offered home equity loans and home equity lines of credit, which were primarily secured by a second mortgage on residences. The Association also offered a home equity lending product that was secured by a third mortgage, although the Association only originated this loan to borrowers where the Association also held the second mortgage. Between June 28, 2010 and March 19, 2012, we suspended the acceptance of new home equity credit applications with the exception of bridge loans and, in accordance with a reduction plan that was accepted by our primary federal banking regulator in December 2010, we actively pursued strategies to decrease the outstanding balance of our home equity lending portfolio as well as our exposure to undrawn home equity lines of credit. During the quarter ended June 30, 2011, we achieved the balance and exposure reduction targets included in the home equity lending reduction plan (“Reduction Plan”), the objective of which was to reduce the Association’s exposure (measured against tier 1 capital plus allowance for loan losses) to the credit risk inherent in home equity lending products. The Reduction Plan’s performance period was June 30, 2010 through December 31, 2011. At
September 30, 2012
and
2011
, home equity loans totaled
$179.0 million
, or
1.7%
, and
$206.2 million
, or
2.1%
, respectively, of total loans receivable (which includes
$124.3 million
, and
$122.9 million
respectively, of home equity lines of credit which are in the amortization period and no longer eligible to be drawn upon), and home equity lines of credit totaled
$1.97 billion
, or
19.0%
, and
$2.28 billion
, or
22.8%
, respectively, of total loans receivable. Additionally, at
September 30, 2012
and
2011
, the unadvanced amounts of home equity lines of credit totaled
$1.31 billion
and
$1.46 billion
, respectively.
Beginning March 20, 2012, we again offered new home equity lines of credit to qualifying existing home equity customers, subject to certain property and credit performance conditions which include:
|
•
|
lower combined loan to value ("CLTV") ratios (80% in Ohio/Kentucky and 70% in Florida; prior programs extended to as high as 89.99%);
|
|
•
|
limited geographic offering (only Ohio, Kentucky and Florida; prior programs were offered nationwide);
|
11
|
•
|
borrower income is fully verified (in prior programs income was not always fully verified);
|
|
•
|
the borrower is qualified using a principal and interest payment based on the current prime rate plus 2.00%, amortized for 20 years (prior programs qualified using the current prime rate);
|
|
•
|
the minimum credit score to qualify for the re-introduced home equity line of credit is 720 (our most recent prior home equity line of credit offering required a minimum credit score of 680); and
|
|
•
|
the term of the new home equity line of credit is a five year draw period, interest only payment, followed by a 20-year repayment period, principal and interest (prior program terms generally offered a 10-year draw period, interest only payment, followed by a 10-year repayment period, principal and interest).
|
Notwithstanding achievement of the reduction plan target and recent limited offers to extend new revolving lines of credit to qualifying, existing home equity line of credit customers, promotion of this product is not a current, meaningful strategy used to manage our interest rate risk profile.
Prior to June 28, 2010, the underwriting standards for home equity loans and home equity lines of credit included an evaluation of the applicant’s credit history, an assessment of the applicant’s ability to meet existing obligations and payments on the proposed loan and the value of the collateral securing the loan. In addition, prior to June 28, 2010, through a series of modifications and program adjustments, the home equity lending parameters became increasingly restrictive and included the additional evaluation of the applicant’s employment and income verification. From a geographic perspective, product offerings peaked in 2008 when offers were extended (primarily via direct mail) to targeted borrowers in 18 states. Generally, the least restrictive qualification and the most attractive product features from a borrower’s perspective were in place during portions of fiscal 2006 and 2007, when combined loan-to-value ratios of up to 89.99% were permitted, minimum credit scores reduced to 620, maximum loan amounts reached $250,000 and pricing for lines of credit reached Prime minus 1.01% when drawn balances exceeded $50,000. The Association originated its home equity loans and home equity lines of credit without application fees (except for bridge loans) or borrower-paid closing costs. Home equity loans were offered with fixed interest rates, were fully amortizing and had terms of up to 15 years. The Association’s home equity lines of credit were offered with adjustable rates of interest indexed to the prime rate, as reported in
The Wall Street Journal
. The Association’s Lowest Rate Guarantee program provided that, subject to the terms and conditions of the guarantee program, if a loan applicant or current home equity line of credit borrower found and qualified for a better interest rate on a similar product with another lender, the Association would offer a lower rate or, if the borrower closed under the rate and terms presented with respect to the other lender, the Association paid the loan applicant or borrower $1,000.
Bridge loans, where a borrower can utilize the existing equity in their current home to fund the purchase of a new home before the current home is sold, totaled
$2.0 million
, or
0.02%
of total loans receivable, as of
September 30, 2012
. Bridge loans are originated for a one-year term, with no prepayment penalties. These loans have fixed interest rates, and are currently limited to a combined 80% loan-to-value ratio (first and second mortgage liens). The Association charges a closing fee with respect to bridge loans.
12
The following table sets forth credit exposure, principal balance, percent delinquent 90 days or more, the mean combined loan-to-value (“CLTV”) percent at the time of origination and the current CLTV percent of our home equity loans, home equity lines of credit and bridge loan portfolio as of
September 30, 2012
. Home equity lines of credit in the draw period are by geographical distribution:
|
Credit
Exposure
|
Principal
Balance
|
Percent
Delinquent
90 days or more
|
Mean CLTV
Percent at
Origination(2)
|
Current Mean
CLTV
Percent(3)
|
||||||||||||
|
|
(Dollars in thousands)
|
|
|
|
||||||||||||
|
Home equity lines of credit in draw period (by
state):
|
||||||||||||||||
|
Ohio
|
$
|
1,481,588
|
|
$
|
742,999
|
|
0.53
|
%
|
62
|
%
|
72
|
%
|
||||
|
Florida
|
860,368
|
|
614,074
|
|
0.95
|
%
|
62
|
%
|
97
|
%
|
||||||
|
California
|
338,887
|
|
241,162
|
|
0.48
|
%
|
68
|
%
|
86
|
%
|
||||||
|
Other(1)
|
613,730
|
|
376,349
|
|
0.22
|
%
|
63
|
%
|
76
|
%
|
||||||
|
Total home equity lines of credit in draw
period
|
3,294,573
|
|
1,974,584
|
|
0.60
|
%
|
62
|
%
|
79
|
%
|
||||||
|
Home equity lines in repayment, home equity
loans and bridge loans
|
180,912
|
|
180,912
|
|
2.65
|
%
|
66
|
%
|
66
|
%
|
||||||
|
Total
|
$
|
3,475,485
|
|
$
|
2,155,496
|
|
0.77
|
%
|
63
|
%
|
78
|
%
|
||||
______________________
|
(1)
|
No individual state has a committed or drawn balance greater than 5% of the total.
|
|
(2)
|
Mean CLTV percent at origination for all home equity lines of credit is based on the committed amount.
|
|
(3)
|
Current Mean CLTV is based on best available first mortgage and property values as of
September 30, 2012
. Current Mean CLTV percent for home equity lines of credit in the draw period is calculated using the committed amount. Current Mean CLTV on home equity lines of credit in the repayment period is calculated using the principal balance.
|
At
September 30, 2012
,
43%
of our home equity lending portfolio was either in first lien position (
24%
) or was in a subordinate (second) lien position behind a first lien that we held (
7%
) or behind a first lien that was held by a loan that we serviced for others (
12%
). In addition, at
September 30, 2012
,
19%
of our home equity line of credit portfolio makes only the minimum payment on their outstanding line balance.
13
The following table sets forth credit exposure, principal balance, percent delinquent 90 days or more, the mean CLTV percent at the time of origination and the current mean CLTV percent of our home equity loans, home equity lines of credit and bridge loan portfolio as of
September 30, 2012
. Home equity lines of credit in the draw period are by the year originated:
|
Credit
Exposure
|
Principal
Balance
|
Percent
Delinquent
90 days or more
|
Mean CLTV
Percent at
Origination(1)
|
Current Mean
CLTV
Percent(2)
|
||||||||||||
|
|
(Dollars in thousands)
|
|
|
|
||||||||||||
|
Home equity lines of credit in draw period:
|
||||||||||||||||
|
2000 and prior
|
$
|
346,705
|
|
$
|
157,738
|
|
0.66
|
%
|
47
|
%
|
63
|
%
|
||||
|
2001
|
56,751
|
|
34,809
|
|
1.40
|
%
|
67
|
%
|
74
|
%
|
||||||
|
2002
|
133,232
|
|
74,041
|
|
0.90
|
%
|
66
|
%
|
72
|
%
|
||||||
|
2003
|
284,177
|
|
147,870
|
|
0.57
|
%
|
68
|
%
|
73
|
%
|
||||||
|
2004
|
180,172
|
|
100,922
|
|
1.04
|
%
|
68
|
%
|
78
|
%
|
||||||
|
2005
|
126,040
|
|
77,431
|
|
1.54
|
%
|
68
|
%
|
87
|
%
|
||||||
|
2006
|
296,879
|
|
193,898
|
|
0.80
|
%
|
66
|
%
|
94
|
%
|
||||||
|
2007
|
455,833
|
|
324,883
|
|
0.82
|
%
|
67
|
%
|
95
|
%
|
||||||
|
2008
|
950,580
|
|
624,287
|
|
0.31
|
%
|
64
|
%
|
79
|
%
|
||||||
|
2009
|
408,592
|
|
214,074
|
|
0.16
|
%
|
56
|
%
|
66
|
%
|
||||||
|
2010
|
36,821
|
|
16,614
|
|
—
|
%
|
59
|
%
|
64
|
%
|
||||||
|
2011 (3)
|
232
|
|
135
|
|
—
|
%
|
39
|
%
|
75
|
%
|
||||||
|
2012
|
18,559
|
|
7,882
|
|
—
|
%
|
51
|
%
|
56
|
%
|
||||||
|
Total home equity lines of credit in
draw period
|
3,294,573
|
|
1,974,584
|
|
0.60
|
%
|
62
|
%
|
79
|
%
|
||||||
|
Home equity lines in repayment, home equity
loans and bridge loans
|
180,912
|
|
180,912
|
|
2.65
|
%
|
66
|
%
|
66
|
%
|
||||||
|
Total
|
$
|
3,475,485
|
|
$
|
2,155,496
|
|
0.77
|
%
|
63
|
%
|
78
|
%
|
||||
______________________
|
(1)
|
Mean CLTV percent at origination for all home equity lines of credit is based on the committed amount.
|
|
(2)
|
Current Mean CLTV is based on best available first mortgage and property values as of
September 30, 2012
. Current Mean CLTV percent for home equity lines of credit in the draw period is calculated using the committed amount. Current Mean CLTV on home equity lines of credit in the repayment period is calculated using the principal balance.
|
|
(3)
|
Amounts represent home equity lines of credit that were previously originated, and that were closed and subsequently replaced in 2011.
|
In general, the home equity line of credit product is characterized by a ten year draw period followed by a ten-year repayment period; however, prior to June 2010 (when new home equity lending was temporarily suspended), there were two types of transactions that could result in a draw period that extended beyond ten years. The first transaction involved customer requests for increases in the amount of their home equity line of credit. When the customer’s credit performance and profile supported the increase, the draw period term was reset for the ten-year period following the date of the increase in the home equity line of credit amount. A second transaction that impacted the draw period involved extensions. For a period of time prior to June 2008, Third Federal Savings and Loan had a program that evaluated home equity lines of credit that were nearing the end of their draw period and made a determination as to whether or not the customer should be offered an additional ten year draw period. If the account and customer met certain pre-established criteria, an offer was made to extend the otherwise expiring draw period by ten years from the date of the offer. If the customer chose to accept the extension, the origination date of the account remained unchanged but the account would have a revised draw period that was extended by ten years. As a result of these two programs, the reported draw periods for certain home equity line of credit accounts exceed ten years.
As shown in the table above, the percents of loans delinquent 90 days or more (seriously delinquent) originated during the years preceding the 2008 financial and housing crisis are comparatively higher than the years following 2008. Those years saw rapidly increasing housing prices, especially in our Florida market. As the housing prices have declined along with the general economic downturn coupled with higher unemployment, we see that reflected in delinquencies for those years. Equity lines of credit originated during those years also saw higher loan amounts, higher permitted loan-to-value ratios, and lower credit scores. Reflective of the general decrease in housing values since 2006, Current Mean CLTV percentages are higher than the Mean CLTV percentages at Origination.
14
In light of the weak housing market, the current level of delinquencies and the instability in employment and economic prospects, we currently conduct an expanded loan level evaluation of our equity lines of credit which are delinquent 90 days or more.
The following table sets forth the breakdown of current mean CLTV percentages for our home equity lines of credit in the draw period as of
September 30, 2012
.
|
Credit
Exposure
|
Principal
Balance
|
Percent
of Total
|
Percent
Delinquent
90 days or
More
|
Mean
CLTV
Percent at
Origination
|
Current
Mean
CLTV
Percent
|
||||||||||||||
|
|
(Dollars in thousands)
|
|
|
|
|
||||||||||||||
|
Home equity lines of credit in draw period (by
current mean CLTV):
|
|||||||||||||||||||
|
< 80%
|
$
|
1,630,782
|
|
$
|
802,798
|
|
40.6
|
%
|
0.70
|
%
|
52
|
%
|
53
|
%
|
|||||
|
80 - 89.9%
|
403,525
|
|
244,315
|
|
12.4
|
%
|
1.10
|
%
|
73
|
%
|
85
|
%
|
|||||||
|
90 - 100%
|
287,460
|
|
196,522
|
|
10.0
|
%
|
0.50
|
%
|
75
|
%
|
95
|
%
|
|||||||
|
> 100%
|
675,113
|
|
548,712
|
|
27.8
|
%
|
0.40
|
%
|
77
|
%
|
134
|
%
|
|||||||
|
Unknown (1)
|
297,693
|
|
182,237
|
|
9.2
|
%
|
0.20
|
%
|
63
|
%
|
(1
|
)
|
|||||||
|
$
|
3,294,573
|
|
$
|
1,974,584
|
|
100.0
|
%
|
0.60
|
%
|
62
|
%
|
79
|
%
|
||||||
______________________
|
(1)
|
Market data necessary for stratification is not readily available.
|
Construction Loans.
The Association originates construction loans for the construction of single-family residences or previously for the purchase of developed lots. Construction loans are offered to individuals for the construction of their personal residences by a qualified builder (construction/permanent loans), and were previously offered to qualified builders (builder loans). At
September 30, 2012
, construction loans totaled
$69.2 million
, or
0.7
% of total loans receivable. At
September 30, 2012
, the unadvanced portion of these construction loans totaled
$36.7 million
.
The Association’s construction/permanent loans generally provide for disbursements to the builder or sub-contractors during the construction phase as work progresses. During the construction phase, the borrower only pays interest on the drawn balance. Upon completion of construction, the loan converts to a permanent amortizing loan without the expense of a second closing. The Association offers construction/permanent loans with fixed or adjustable rates, and a current maximum loan-to-completed-appraised value ratio of 80%. At
September 30, 2012
, the Association’s construction/permanent loans totaled
$58.5 million
, or
0.6%
of total loans receivable.
The Association’s builder loans consist of loans for homes that have been pre-sold as well as loans to developers that build homes before a buyer has been identified. The Association does not make land loans to developers for the acquisition and development of raw land. Construction loans to developers were limited to an 80% loan-to-completed-appraised value ratio for homes that were under contract for purchase and a 70% loan-to-completed-appraised value ratio for loans where no buyer had been identified. The interest rates are based on and adjust with the prime rate of interest, and are for terms of up to two years. Effective August 30, 2011, the Association made the strategic decision to exit the commercial construction loan business and ceased accepting new builder relationships. Existing builder commitments were honored for a period of up to one year, giving our customers the ability to secure new borrowing relationships. The builder loan portfolio as of
September 30, 2012
is
$7.6 million
, which represents a
51%
decrease
from
September 30, 2011
. The portfolio is considered to be in runoff.
Prior to August 31, 2011, before making a commitment to fund a construction loan, the Association required an appraisal of the property by an independent licensed appraiser. The Association generally reviewed and inspected each property before disbursement of funds during the term of the construction loan.
Construction financing generally involves greater credit risk than long-term financing on improved, owner-occupied real estate. Risk of loss on a construction loan depends largely upon the accuracy of the initial estimate of the value of the property at completion of construction compared to the estimated cost (including interest) of construction and other assumptions. If the estimate of construction cost proves to be inaccurate, the Association may be required to advance additional funds beyond the amount originally committed in order to protect the value of the property. Moreover, if the estimated value of the completed project proves to be inaccurate, the borrower may hold a property with a value that is insufficient to assure full repayment of the construction loan upon the sale of the property. This is more likely to occur when home prices are falling, like our current economic environment.
15
Loan Originations, Purchases, Sales, Participations and Servicing.
Lending activities are conducted primarily by the Association’s loan personnel (all of whom are salaried employees) operating at our main and branch office locations and at our loan production offices. All loans that the Association originates are underwritten pursuant to its policies and procedures, which are generally consistent with Fannie Mae underwriting guidelines to the extent applicable, subject to the discussion below. The Association originates both adjustable-rate and fixed-rate loans and advertises extensively throughout its market area. Its ability to originate fixed- or adjustable-rate loans is dependent upon the relative customer demand for such loans, which is affected by current market interest rates as well as anticipated future market interest rates. The Association’s loan origination and sales activity may be adversely affected by a rising interest rate environment or economic recession, which typically results in decreased loan demand. Most of the Association’s residential real estate mortgage loan originations are generated by its in-house loan representatives, by referrals from existing or past customers, by referrals from local builders and real estate brokers, from calls to its telephone call center and from the internet. From 2005 to October 2010, the Association maintained a relationship with one mortgage broker, which is affiliated with a national builder.
The Association decides whether to retain the loans that it originates, sell loans in the secondary market or securitize loans after evaluating current and projected market interest rates, its interest rate risk objectives, its liquidity needs and other factors. The Association sold
$11.4 million
of residential real estate mortgage loans (all fixed-rate loans, with 15- to 30-year terms) during the fiscal year ended
September 30, 2012
. As described in "
Residential Real Estate Mortgage Loans"
, effective July 1, 2010, Fannie Mae, historically the Association’s primary loan investor, implemented certain loan origination requirement changes affecting loan eligibility that, to date, we have not adopted. Accordingly, the Association’s ability to reduce interest rate risk via our traditional loan sales of newly originated longer-term fixed rate residential loans is limited until either the Association changes its loan origination processes or Fannie Mae, Freddie Mac or other market participants revise their loan eligibility standards. While we have not changed our traditional underwriting standards, during the fiscal year ended
September 30, 2012
, the Association reclassified a pool of long-term fixed rate loans from the portfolio of loans held for investment and investment banking representatives were engaged to offer those loans for sale, on a servicing retained basis, as non-agency whole loans in the secondary market. The balance of loans held for sale was
$124.5 million
at
September 30, 2012
and included
$9.6 million
of loans originated pursuant to the stipulations of Fannie Mae's HARP II. The fixed-rate mortgage loans that the Association originated and retained during the fiscal year ended
September 30, 2012
consisted primarily of loans with 30-year terms.
Historically, the Association has retained the servicing rights on all residential real estate mortgage loans that it has sold, and intends to continue this practice in the future. At
September 30, 2012
, the Association serviced loans owned by others with a principal balance of
$3.81 billion
, including $6.3 million of loans sold to Fannie Mae remain subject to recourse. All recourse sales occurred prior to the year 2000. Loan servicing includes collecting and remitting loan payments, accounting for principal and interest, contacting delinquent borrowers, supervising foreclosures and property dispositions in the event of unremedied defaults, making certain insurance and tax payments on behalf of the borrowers and generally administering the loans. The Association retains a portion of the interest paid by the borrower on the loans it services as consideration for its servicing activities. The Association did not enter into any loan participations during the fiscal year ended
September 30, 2012
and does not expect to do so in the near future.
Loan Approval Procedures and Authority
. The Association’s lending activities follow written, non-discriminatory underwriting standards and loan origination procedures established by its board of directors. The loan approval process is intended to assess the borrower’s ability to repay the loan and the value of the property that will secure the loan. To assess the borrower’s ability to repay, the Association reviews the borrower’s employment and credit history and information on the historical and projected income and expenses of the borrower.
The Association’s policies and loan approval limits are established by its board of directors. The Association’s Board of Directors has delegated authority to its Executive Committee (consisting of the Association’s Chief Executive Officer and two directors) to review and assign lending authorities to certain individuals of the Association to consider and approve loans within their designated authority. Residential real estate mortgage loans and construction loans in amounts above $625,000 require the approval of two individuals with designated underwriting authority. Loans in amounts below $625,000 require the approval of one individual with designated underwriting authority.
The Association also maintains automated underwriting systems for point-of-sale approvals of residential real estate mortgage loans. Applications for loans that meet certain credit and income criteria may receive a credit approval subject to an appraisal of the subject property.
The Association requires independent third-party appraisals of real property. Appraisals are performed by independent licensed appraisers.
16
Non-performing Assets and Restructured Loans
. Within 15 days of a borrower’s delinquency, the Association attempts personal, direct contact with the borrower to determine the reason for the delinquency, to ensure that the borrower correctly understands the terms of the loan and to emphasize the importance of making payments on or before the due date. If necessary, subsequent late charges and delinquent notices are issued and the borrower’s account will be monitored on a regular basis thereafter. The Association also mails system-generated reminder notices on a monthly basis. When a loan is more than 30 days past due, the Association attempts to contact the borrower and develop a plan of repayment. By the 90
th
day of delinquency, the Association may recommend foreclosure. By this date, if a repayment agreement has not been established, or if an agreement is established but is subsequently broken, the borrower’s credit file is reviewed and, if considered necessary, the loan will be evaluated for impairment. For further discussion on evaluating loans for impairment, see
Note 5. LOANS AND ALLOWANCE FOR LOAN LOSSES
. A summary report of all loans 30 days or more past due is provided to the Association’s board of directors.
Loans are placed in non-accrual status when they are contractually
90
days or more past due or if collection of principal or interest in full is in doubt. Loans modified in troubled debt restructurings that were in non-accrual status prior to the restructurings remain in non-accrual status for a minimum of
six
months. Beginning with the quarter ended March 31, 2012, home equity loans and lines of credit which are subordinate to a first mortgage lien where the customer is seriously delinquent, are also placed in non-accrual status. Beginning in the quarter ended September 30, 2012, loans in Chapter 7 bankruptcy status where all borrowers have been discharged from their mortgage obligation are also placed in non-accrual status. Interest on loans in accrual status, including certain loans individually reviewed for impairment, is recognized in interest income as it accrues, on a daily basis. Accrued interest on loans in non-accrual status is reversed by a charge to interest income and income is subsequently recognized only to the extent cash payments are received. Cash payments on loans in non-accrual status are applied to the oldest scheduled, unpaid payment first. Cash payments on loans with a partial charge-off are applied fully to principal, then to recovery of the charged off amount prior to interest income being recognized. A non-accrual loan is generally returned to accrual status when contractual payments are less than 90 days past due. However, a loan may remain in nonaccrual status when collectability is uncertain, such as a troubled debt restructuring that has not met minimum payment requirements, a loan with a partial charge-off, an equity loan or line of credit with a delinquent first mortgage greater than 90 days, or a loan in Chapter 7 bankruptcy status where all borrowers have been discharged of their obligation. The number of days past due is determined by the number of days the oldest scheduled payment remains unpaid.
17
The table below sets forth the recorded investments and categories of our non-performing assets and troubled debt restructurings at the dates indicated.
|
|
September 30,
|
||||||||||||||||||
|
|
2012
|
2011
|
2010
|
2009
|
2008
|
||||||||||||||
|
|
(Dollars in thousands)
|
||||||||||||||||||
|
Non-accrual loans:
|
|||||||||||||||||||
|
Real estate loans:
|
|||||||||||||||||||
|
Residential non-Home Today
|
$
|
105,780
|
|
$
|
125,014
|
|
$
|
135,109
|
|
$
|
99,576
|
|
$
|
43,717
|
|
||||
|
Residential Home Today
|
41,087
|
|
69,602
|
|
91,985
|
|
84,284
|
|
63,362
|
|
|||||||||
|
Home equity loans and lines of credit(1)(2)
|
35,316
|
|
36,872
|
|
54,481
|
|
59,762
|
|
54,856
|
|
|||||||||
|
Construction
|
377
|
|
3,770
|
|
4,994
|
|
11,553
|
|
10,773
|
|
|||||||||
|
Consumer and other loans
|
—
|
|
—
|
|
1
|
|
1
|
|
—
|
|
|||||||||
|
Total non-accrual loans(3)(4)(5)(6)
|
182,560
|
|
235,258
|
|
286,570
|
|
255,176
|
|
172,708
|
|
|||||||||
|
Real estate owned
|
19,647
|
|
19,155
|
|
15,912
|
|
17,697
|
|
14,108
|
|
|||||||||
|
Other non-performing assets
|
—
|
|
—
|
|
—
|
|
—
|
|
—
|
|
|||||||||
|
Total non-performing assets
|
$
|
202,207
|
|
$
|
254,413
|
|
$
|
302,482
|
|
$
|
272,873
|
|
$
|
186,816
|
|
||||
|
Ratios:
|
|||||||||||||||||||
|
Total non-accrual loans to total loans
|
1.77
|
%
|
2.37
|
%
|
3.08
|
%
|
2.74
|
%
|
1.87
|
%
|
|||||||||
|
Total non-accrual loans to total assets
|
1.58
|
%
|
2.16
|
%
|
2.59
|
%
|
2.41
|
%
|
1.60
|
%
|
|||||||||
|
Total non-performing assets to total assets
|
1.76
|
%
|
2.34
|
%
|
2.73
|
%
|
2.57
|
%
|
1.73
|
%
|
|||||||||
|
Troubled debt restructurings (not included in non-accrual
loans above):
|
|||||||||||||||||||
|
Real estate loans:
|
|||||||||||||||||||
|
Residential non-Home Today
|
$
|
66,988
|
|
$
|
50,841
|
|
$
|
39,167
|
|
$
|
21,278
|
|
$
|
640
|
|
||||
|
Residential Home Today
|
57,168
|
|
67,240
|
|
47,601
|
|
20,817
|
|
225
|
|
|||||||||
|
Home equity loans and lines of credit(1)
|
9,761
|
|
2,171
|
|
3,430
|
|
2,301
|
|
—
|
|
|||||||||
|
Construction
|
613
|
|
863
|
|
—
|
|
—
|
|
—
|
|
|||||||||
|
Consumer and other loans
|
—
|
|
—
|
|
—
|
|
—
|
|
—
|
|
|||||||||
|
Total(7)
|
$
|
134,530
|
|
$
|
121,115
|
|
$
|
90,198
|
|
$
|
44,396
|
|
$
|
865
|
|
||||
______________________
|
(1)
|
Includes bridge loans (loans where borrowers can utilize the existing equity in their current home to fund the purchase of a new home before they have sold their current home).
|
|
(2)
|
The totals at
September 30, 2012
include $
8.8 million
of performing home equity lines of credit included in non-accrual, pursuant to regulatory guidance regarding senior lien delinquency issued in January 2012.
|
|
(3)
|
At
September 30, 2012
,
2011
, and 2010 includes $
47.7 million
, $
16.5 million
, and $
32.2 million
respectively, in troubled debt restructurings which are current but included with non-accrual loans for a minimum period of six months from the restructuring date due to their non-accrual status prior to restructuring or because they have been partially charged off. At the fiscal year ends prior to September 30, 2010, troubled debt restructurings that would have remained in non-accrual due to their accrual status prior to restructuring were not material and therefore were not included with non-accrual loans at those reporting dates.
|
|
(4)
|
Includes $
39.1 million
, $
28.6 million
, $
12.3 million
, $
1.9 million
, and $
260 thousand
in troubled debt restructurings that are 90 days or more past due as of
September 30, 2012
,
2011
,
2010
, 2009, and 2008, respectively.
|
|
(5)
|
During the quarter ended December 31, 2011, in accordance with an Office of the Comptroller of the Currency ("OCC") directive, our specific valuation allowance (which had a balance of $55.5 million as of September 30, 2011) were charged off, which reduced the balance of non-accrual loans.
|
|
(6)
|
At
September 30, 2012
, the recorded investment in non-accrual status loans includes
$30.6 million
of performing loans in Chapter 7 bankruptcy status where all borrowers have been discharged of their obligation.
|
|
(7)
|
Beginning in the quarter ended September 30, 2012,
$20.5 million
of accruing, performing loans in Chapter 7 bankruptcy status, where at least one borrower has been discharged of their obligation, are reported as troubled debt restructurings per the OCC Bank Accounting Advisory Series ("BAAS") interpretive guidance issued in July 2012.
|
18
The gross interest income that would have been recorded during the year ended
September 30, 2012
on non-accrual loans if they had been accruing during the entire period and troubled debt restructurings if they had been current and performing in accordance with their original terms during the entire period was
$17.1 million
. The interest income recognized on those loans included in net income for the year ended
September 30, 2012
was
$11.3 million
.
At
September 30, 2012
,
2011
,
2010
, 2009 and 2008 respectively, the recorded investment of impaired loans includes $
137.3 million
, $
129.1 million
, $
98.8 million
, $
50.8 million
, and $
5.2 million
of accruing loans of which $
134.5 million
, $
121.1 million
, $
90.2 million
, $
44.4 million
, and $
0
are troubled debt restructurings and $
2.8 million
, $
8.0 million
, $
8.6 million
, $
6.4 million
, and $
5.2 million
, respectively, of loans that are returned to accrual status when contractual payments are less than 90 days past due. These loans continue to be individually evaluated for impairment until contractual payments are less than 30 days past due. At
September 30, 2012
,
2011
,
2010
, 2009, and 2008, respectively, the recorded investment of non-accrual loans includes $
21.0 million
, $
24.6 million
, $
44.7 million
, $
87.2 million
, and $
61.6 million
that are not included in the recorded investment of impaired loans because they are included in loans collectively evaluated for impairment.
The level of loan modifications has increased, resulting in
$221.4 million
of total (accrual and non-accrual) troubled debt restructurings recorded at
September 30, 2012
, a
$55.2 million
increase from
September 30, 2011
. Among other activity, the change includes the addition of
$70.9 million
of loans in Chapter 7 bankruptcy status, where at least one borrower has been discharged of their obligation, being reported as troubled debt restructurings per the OCC Bank Accounting Advisory Series (BAAS) interpretive guidance issued in July 2012, and charging off of $7.7 million related to the specific valuation allowance ("SVA") balance on TDRs as of September 30, 2011 in accordance with an OCC directive. Of the
$221.4 million
of troubled debt restructurings recorded at
September 30, 2012
,
$118.0 million
is in the residential, non-Home Today portfolio and
$81.9 million
is in the Home Today portfolio.
Debt restructuring is a method being increasingly used to help families keep their homes and preserve our neighborhoods. This involves making changes to the borrowers’ loan terms through interest rate reductions, either for a specific period or for the remaining term of the loan; term extensions including those beyond that provided in the original agreement; principal forgiveness; capitalization of delinquent payments in special situations; or some combination of the above. These loans are measured for impairment based on the present value of expected future cash flows discounted at the effective interest rate of the original loan contract. Expected future cash flows include a discount factor representing a potential for default. Any shortfall is recorded as an individually evaluated general valuation reserve as part of the allowance for loan losses. We evaluate these loans using the expected future cash flows because we expect the borrower, and not liquidation of the collateral, to be the source of repayment for the loan. A loan modified as a troubled debt restructuring is reported as a troubled debt restructuring for a minimum of one year. After one year, a loan will no longer be included in the balance of troubled debt restructurings if the loan was modified to yield a market rate for loans of similar credit risk at the time of restructuring and the loan is not impaired based on the terms of restructuring agreement. No loans were removed from total troubled debt restructurings during the year ended
September 30, 2012
.
19
The following table sets forth the recorded investments of accrual and non-accrual troubled debt restructurings, by the types of concessions granted as of
September 30, 2012
.
|
Reduction in
Interest Rates
|
Payment
Extensions
|
Forbearance
or Other
Actions
|
Multiple
Concessions
|
Multiple
Modifications
|
Bankruptcy
|
Total
|
|||||||||||||||||||||
|
|
(In thousands)
|
||||||||||||||||||||||||||
|
Accrual
|
|||||||||||||||||||||||||||
|
Residential non-Home Today
|
$
|
16,262
|
|
$
|
1,332
|
|
$
|
13,331
|
|
$
|
16,659
|
|
$
|
7,232
|
|
$
|
12,172
|
|
$
|
66,988
|
|
||||||
|
Residential Home Today
|
14,532
|
|
173
|
|
7,857
|
|
23,382
|
|
10,540
|
|
684
|
|
57,168
|
|
|||||||||||||
|
Home equity loans and lines of credit
|
76
|
|
633
|
|
813
|
|
243
|
|
384
|
|
7,612
|
|
9,761
|
|
|||||||||||||
|
Construction
|
—
|
|
613
|
|
—
|
|
—
|
|
—
|
|
—
|
|
613
|
|
|||||||||||||
|
Total
|
$
|
30,870
|
|
$
|
2,751
|
|
$
|
22,001
|
|
$
|
40,284
|
|
$
|
18,156
|
|
$
|
20,468
|
|
$
|
134,530
|
|
||||||
|
Non-Accrual, Performing
|
|||||||||||||||||||||||||||
|
Residential non-Home Today
|
$
|
2,567
|
|
$
|
445
|
|
$
|
2,076
|
|
$
|
2,744
|
|
$
|
1,203
|
|
$
|
19,309
|
|
$
|
28,344
|
|
||||||
|
Residential Home Today
|
3,501
|
|
88
|
|
2,314
|
|
1,368
|
|
757
|
|
3,197
|
|
11,225
|
|
|||||||||||||
|
Home equity loans and lines of credit
|
29
|
|
13
|
|
—
|
|
6
|
|
—
|
|
8,125
|
|
8,173
|
|
|||||||||||||
|
Construction
|
—
|
|
—
|
|
—
|
|
—
|
|
—
|
|
—
|
|
—
|
|
|||||||||||||
|
Total
|
$
|
6,097
|
|
$
|
546
|
|
$
|
4,390
|
|
$
|
4,118
|
|
$
|
1,960
|
|
$
|
30,631
|
|
$
|
47,742
|
|
||||||
|
Non-Accrual, Non-Performing
|
|||||||||||||||||||||||||||
|
Residential non-Home Today
|
$
|
3,210
|
|
$
|
1,025
|
|
$
|
1,699
|
|
$
|
1,384
|
|
$
|
1,003
|
|
$
|
14,380
|
|
$
|
22,701
|
|
||||||
|
Residential Home Today
|
3,944
|
|
99
|
|
3,820
|
|
2,308
|
|
663
|
|
2,667
|
|
13,501
|
|
|||||||||||||
|
Home equity loans and lines of credit
|
—
|
|
—
|
|
147
|
|
8
|
|
—
|
|
2,597
|
|
2,752
|
|
|||||||||||||
|
Construction
|
—
|
|
21
|
|
—
|
|
—
|
|
—
|
|
152
|
|
173
|
|
|||||||||||||
|
Total
|
$
|
7,154
|
|
$
|
1,145
|
|
$
|
5,666
|
|
$
|
3,700
|
|
$
|
1,666
|
|
$
|
19,796
|
|
$
|
39,127
|
|
||||||
|
Total Troubled Debt
Restructurings
|
|||||||||||||||||||||||||||
|
Residential non-Home Today
|
$
|
22,039
|
|
$
|
2,802
|
|
$
|
17,106
|
|
$
|
20,787
|
|
$
|
9,438
|
|
$
|
45,861
|
|
$
|
118,033
|
|
||||||
|
Residential Home Today
|
21,977
|
|
360
|
|
13,991
|
|
27,058
|
|
11,960
|
|
6,548
|
|
81,894
|
|
|||||||||||||
|
Home equity loans and lines of credit
|
105
|
|
646
|
|
960
|
|
257
|
|
384
|
|
18,334
|
|
20,686
|
|
|||||||||||||
|
Construction
|
—
|
|
634
|
|
—
|
|
—
|
|
—
|
|
152
|
|
786
|
|
|||||||||||||
|
Total
|
$
|
44,121
|
|
$
|
4,442
|
|
$
|
32,057
|
|
$
|
48,102
|
|
$
|
21,782
|
|
$
|
70,895
|
|
$
|
221,399
|
|
||||||
Troubled debt restructurings in accrual status are loans accruing interest and performing according to the terms of the restructuring. To be performing, a loan must be less than 90 days past due as of the report date. Non-accrual, performing status indicates that a loan was not accruing interest at the time of modification, continues to not accrue interest and is performing according to the terms of the restructuring, but has not been current for at least six months since its modification or is being classified as non-accrual per the OCC guidance on loans in Chapter 7 bankruptcy status, where all borrowers have been discharged of their obligation. Non-accrual, non-performing status includes loans that are not accruing interest because they are greater than 90 days past due and therefore not performing according to the terms of the restructuring.
Since August 2008,
43.3
% of loans modified through the Association's restructuring program are for borrowers who are current on their loans but who request a modification due to a recent or impending event that has caused or will cause a temporary or permanent financial strain and who receive concessions that would otherwise not be considered.
20
The recorded investment of troubled debt restructurings in accrual status as of
September 30, 2012
, separated based on modification date, is set forth in the following table.
|
Reduction
in Interest
Rates
|
Payment
Extensions
|
Forbearance
or Other
Actions
|
Multiple
Concessions
|
Multiple
Modifications
|
Bankruptcy
|
Total
|
|||||||||||||||||||||
|
|
(In thousands)
|
||||||||||||||||||||||||||
|
Accruing Modifications Less Than
One Year Old
|
|||||||||||||||||||||||||||
|
Residential non-Home Today
|
$
|
6,692
|
|
$
|
258
|
|
$
|
994
|
|
$
|
6,774
|
|
$
|
2,855
|
|
$
|
3,283
|
|
$
|
20,856
|
|
||||||
|
Residential Home Today
|
1,117
|
|
—
|
|
548
|
|
1,657
|
|
3,780
|
|
70
|
|
7,172
|
|
|||||||||||||
|
Home equity loans and lines of credit
|
46
|
|
—
|
|
60
|
|
22
|
|
230
|
|
1,451
|
|
1,809
|
|
|||||||||||||
|
Construction
|
—
|
|
—
|
|
—
|
|
—
|
|
—
|
|
—
|
|
—
|
|
|||||||||||||
|
Total
|
$
|
7,855
|
|
$
|
258
|
|
$
|
1,602
|
|
$
|
8,453
|
|
$
|
6,865
|
|
$
|
4,804
|
|
$
|
29,837
|
|
||||||
|
Accruing Modifications Greater
Than or Equal to One Year Old
|
|||||||||||||||||||||||||||
|
Residential non-Home Today
|
$
|
9,570
|
|
$
|
1,074
|
|
$
|
12,337
|
|
$
|
9,885
|
|
$
|
4,377
|
|
$
|
8,889
|
|
$
|
46,132
|
|
||||||
|
Residential Home Today
|
13,415
|
|
173
|
|
7,309
|
|
21,725
|
|
6,760
|
|
614
|
|
49,996
|
|
|||||||||||||
|
Home equity loans and lines of credit
|
30
|
|
633
|
|
753
|
|
221
|
|
154
|
|
6,161
|
|
7,952
|
|
|||||||||||||
|
Construction
|
—
|
|
613
|
|
—
|
|
—
|
|
—
|
|
—
|
|
613
|
|
|||||||||||||
|
Total
|
$
|
23,015
|
|
$
|
2,493
|
|
$
|
20,399
|
|
$
|
31,831
|
|
$
|
11,291
|
|
$
|
15,664
|
|
$
|
104,693
|
|
||||||
Delinquent Loans
. The following tables set forth the number and recorded investment in loan delinquencies by type, segregated by geographic location and by severity of delinquency at the dates indicated. Construction loans are on properties located in Ohio and the balances of consumer and other loans are immaterial; therefore, neither was segregated.
|
|
Loans Delinquent For
|
|||||||||||||||||||
|
|
30-89 Days
|
90 Days or Over
|
Total
|
|||||||||||||||||
|
|
Number
|
Amount
|
Number
|
Amount
|
Number
|
Amount
|
||||||||||||||
|
|
(Dollars in thousands)
|
|||||||||||||||||||
|
At September 30, 2012
|
||||||||||||||||||||
|
Real estate loans:
|
||||||||||||||||||||
|
Residential non-Home Today
|
||||||||||||||||||||
|
Ohio
|
181
|
|
$
|
19,301
|
|
436
|
|
$
|
43,871
|
|
617
|
|
$
|
63,172
|
|
|||||
|
Florida
|
32
|
|
5,974
|
|
258
|
|
30,873
|
|
290
|
|
36,847
|
|
||||||||
|
Other
|
2
|
|
401
|
|
1
|
|
63
|
|
3
|
|
464
|
|
||||||||
|
Total Residential non-Home Today
|
215
|
|
25,676
|
|
695
|
|
74,807
|
|
910
|
|
100,483
|
|
||||||||
|
Residential Home Today
|
||||||||||||||||||||
|
Ohio
|
208
|
|
15,068
|
|
519
|
|
26,604
|
|
727
|
|
41,672
|
|
||||||||
|
Florida
|
7
|
|
542
|
|
21
|
|
913
|
|
28
|
|
1,455
|
|
||||||||
|
Total Residential Home Today
|
215
|
|
15,610
|
|
540
|
|
27,517
|
|
755
|
|
43,127
|
|
||||||||
|
Home equity loans and lines of credit(1)
|
||||||||||||||||||||
|
Ohio
|
133
|
|
4,572
|
|
145
|
|
5,994
|
|
278
|
|
10,566
|
|
||||||||
|
Florida
|
58
|
|
3,657
|
|
94
|
|
6,210
|
|
152
|
|
9,867
|
|
||||||||
|
California
|
16
|
|
1,637
|
|
20
|
|
1,863
|
|
36
|
|
3,500
|
|
||||||||
|
Other
|
27
|
|
2,020
|
|
43
|
|
2,520
|
|
70
|
|
4,540
|
|
||||||||
|
Total Home equity loans and lines of credit
|
234
|
|
11,886
|
|
302
|
|
16,587
|
|
536
|
|
28,473
|
|
||||||||
|
Construction
|
—
|
|
—
|
|
8
|
|
377
|
|
8
|
|
377
|
|
||||||||
|
Other loans
|
—
|
|
—
|
|
—
|
|
—
|
|
—
|
|
—
|
|
||||||||
|
Total
|
664
|
|
$
|
53,172
|
|
1,545
|
|
$
|
119,288
|
|
2,209
|
|
$
|
172,460
|
|
|||||
21
|
|
Loans Delinquent For
|
|||||||||||||||||||
|
|
30-89 Days
|
90 Days or Over
|
Total
|
|||||||||||||||||
|
|
Number
|
Amount
|
Number
|
Amount
|
Number
|
Amount
|
||||||||||||||
|
|
(Dollars in thousands)
|
|||||||||||||||||||
|
At September 30, 2011
|
||||||||||||||||||||
|
Real estate loans:
|
||||||||||||||||||||
|
Residential non-Home Today
|
||||||||||||||||||||
|
Ohio
|
204
|
|
$
|
20,315
|
|
529
|
|
$
|
62,340
|
|
733
|
|
$
|
82,655
|
|
|||||
|
Florida
|
37
|
|
8,438
|
|
272
|
|
55,700
|
|
309
|
|
64,138
|
|
||||||||
|
Other
|
3
|
|
574
|
|
4
|
|
477
|
|
7
|
|
1,051
|
|
||||||||
|
Total Residential non-Home Today
|
244
|
|
29,327
|
|
805
|
|
118,517
|
|
1,049
|
|
147,844
|
|
||||||||
|
Residential Home Today
|
||||||||||||||||||||
|
Ohio
|
213
|
|
18,395
|
|
634
|
|
57,664
|
|
847
|
|
76,059
|
|
||||||||
|
Florida
|
11
|
|
1,135
|
|
25
|
|
2,321
|
|
36
|
|
3,456
|
|
||||||||
|
Total Residential Home Today
|
224
|
|
19,530
|
|
659
|
|
59,985
|
|
883
|
|
79,515
|
|
||||||||
|
Home equity loans and lines of credit(1)
|
||||||||||||||||||||
|
Ohio
|
158
|
|
5,457
|
|
227
|
|
10,553
|
|
385
|
|
16,010
|
|
||||||||
|
Florida
|
103
|
|
7,408
|
|
149
|
|
16,211
|
|
252
|
|
23,619
|
|
||||||||
|
California
|
18
|
|
1,789
|
|
20
|
|
2,207
|
|
38
|
|
3,996
|
|
||||||||
|
Other
|
36
|
|
2,771
|
|
81
|
|
7,550
|
|
117
|
|
10,321
|
|
||||||||
|
Total Home equity loans and lines of credit
|
315
|
|
17,425
|
|
477
|
|
36,521
|
|
792
|
|
53,946
|
|
||||||||
|
Construction
|
1
|
|
72
|
|
20
|
|
3,770
|
|
21
|
|
3,842
|
|
||||||||
|
Other loans
|
—
|
|
—
|
|
—
|
|
—
|
|
—
|
|
—
|
|
||||||||
|
Total
|
784
|
|
$
|
66,354
|
|
1,961
|
|
$
|
218,793
|
|
2,745
|
|
$
|
285,147
|
|
|||||
|
|
Loans Delinquent For
|
|||||||||||||||||||
|
|
30-89 Days
|
90 Days or Over
|
Total
|
|||||||||||||||||
|
|
Number
|
Amount
|
Number
|
Amount
|
Number
|
Amount
|
||||||||||||||
|
|
(Dollars in thousands)
|
|||||||||||||||||||
|
At September 30, 2010
|
||||||||||||||||||||
|
Real estate loans:
|
||||||||||||||||||||
|
Residential non-Home Today
|
||||||||||||||||||||
|
Ohio
|
215
|
|
$
|
21,182
|
|
582
|
|
$
|
68,845
|
|
797
|
|
$
|
90,027
|
|
|||||
|
Florida
|
42
|
|
8,597
|
|
244
|
|
51,765
|
|
286
|
|
60,362
|
|
||||||||
|
Other
|
5
|
|
902
|
|
4
|
|
991
|
|
9
|
|
1,893
|
|
||||||||
|
Total Residential non-Home Today
|
262
|
|
30,681
|
|
830
|
|
121,601
|
|
1,092
|
|
152,282
|
|
||||||||
|
Residential Home Today
|
||||||||||||||||||||
|
Ohio
|
230
|
|
20,879
|
|
807
|
|
72,265
|
|
1,037
|
|
93,144
|
|
||||||||
|
Florida
|
9
|
|
927
|
|
26
|
|
2,566
|
|
35
|
|
3,493
|
|
||||||||
|
Total Residential Home Today
|
239
|
|
21,806
|
|
833
|
|
74,831
|
|
1,072
|
|
96,637
|
|
||||||||
|
Home equity loans and lines of credit(1)
|
||||||||||||||||||||
|
Ohio
|
223
|
|
6,830
|
|
354
|
|
16,255
|
|
577
|
|
23,085
|
|
||||||||
|
Florida
|
118
|
|
9,979
|
|
233
|
|
23,277
|
|
351
|
|
33,256
|
|
||||||||
|
California
|
16
|
|
1,401
|
|
27
|
|
3,584
|
|
43
|
|
4,985
|
|
||||||||
|
Other
|
49
|
|
3,167
|
|
111
|
|
10,832
|
|
160
|
|
13,999
|
|
||||||||
|
Total Home equity loans and lines of credit
|
406
|
|
21,377
|
|
725
|
|
53,948
|
|
1,131
|
|
75,325
|
|
||||||||
|
Construction
|
2
|
|
558
|
|
31
|
|
3,980
|
|
33
|
|
4,538
|
|
||||||||
|
Other loans
|
—
|
|
—
|
|
2
|
|
1
|
|
2
|
|
1
|
|
||||||||
|
Total
|
909
|
|
$
|
74,422
|
|
2,421
|
|
$
|
254,361
|
|
3,330
|
|
$
|
328,783
|
|
|||||
22
|
|
Loans Delinquent For
|
|||||||||||||||||||
|
|
30-89 Days
|
90 Days or Over
|
Total
|
|||||||||||||||||
|
|
Number
|
Amount
|
Number
|
Amount
|
Number
|
Amount
|
||||||||||||||
|
|
(Dollars in thousands)
|
|||||||||||||||||||
|
At September 30, 2009
|
||||||||||||||||||||
|
Real estate loans:
|
||||||||||||||||||||
|
Residential non-Home Today
|
||||||||||||||||||||
|
Ohio
|
212
|
|
$
|
22,064
|
|
564
|
|
$
|
59,146
|
|
776
|
|
$
|
81,210
|
|
|||||
|
Florida
|
40
|
|
8,545
|
|
177
|
|
39,493
|
|
217
|
|
48,038
|
|
||||||||
|
Other
|
1
|
|
181
|
|
4
|
|
937
|
|
5
|
|
1,118
|
|
||||||||
|
Total Residential non-Home Today
|
253
|
|
30,790
|
|
745
|
|
99,576
|
|
998
|
|
130,366
|
|
||||||||
|
Residential Home Today
|
||||||||||||||||||||
|
Ohio
|
288
|
|
24,865
|
|
888
|
|
81,777
|
|
1,176
|
|
106,642
|
|
||||||||
|
Florida
|
8
|
|
841
|
|
25
|
|
2,507
|
|
33
|
|
3,348
|
|
||||||||
|
Total Residential Home Today
|
296
|
|
25,706
|
|
913
|
|
84,284
|
|
1,209
|
|
109,990
|
|
||||||||
|
Home equity loans and lines of credit(1)
|
||||||||||||||||||||
|
Ohio
|
289
|
|
9,261
|
|
406
|
|
20,167
|
|
695
|
|
29,428
|
|
||||||||
|
Florida
|
127
|
|
10,704
|
|
224
|
|
23,118
|
|
351
|
|
33,822
|
|
||||||||
|
California
|
21
|
|
2,007
|
|
37
|
|
4,325
|
|
58
|
|
6,332
|
|
||||||||
|
Other
|
54
|
|
4,281
|
|
126
|
|
12,152
|
|
180
|
|
16,433
|
|
||||||||
|
Total Home equity loans and lines of credit
|
491
|
|
26,253
|
|
793
|
|
59,762
|
|
1,284
|
|
86,015
|
|
||||||||
|
Construction
|
7
|
|
1,454
|
|
56
|
|
11,553
|
|
63
|
|
13,007
|
|
||||||||
|
Other loans
|
2
|
|
—
|
|
3
|
|
1
|
|
5
|
|
1
|
|
||||||||
|
Total
|
1,049
|
|
$
|
84,203
|
|
2,510
|
|
$
|
255,176
|
|
3,559
|
|
$
|
339,379
|
|
|||||
|
|
Loans Delinquent For
|
|||||||||||||||||||
|
|
30-89 Days
|
90 Days or Over
|
Total
|
|||||||||||||||||
|
|
Number
|
Amount
|
Number
|
Amount
|
Number
|
Amount
|
||||||||||||||
|
|
(Dollars in thousands)
|
|||||||||||||||||||
|
At September 30, 2008
|
||||||||||||||||||||
|
Real estate loans:
|
||||||||||||||||||||
|
Residential non-Home Today
|
||||||||||||||||||||
|
Ohio
|
250
|
|
$
|
22,836
|
|
375
|
|
$
|
33,636
|
|
625
|
|
$
|
56,472
|
|
|||||
|
Florida
|
33
|
|
7,499
|
|
46
|
|
9,762
|
|
79
|
|
17,261
|
|
||||||||
|
Other
|
4
|
|
895
|
|
1
|
|
318
|
|
5
|
|
1,213
|
|
||||||||
|
Total Residential non-Home Today
|
287
|
|
31,230
|
|
422
|
|
43,716
|
|
709
|
|
74,946
|
|
||||||||
|
Residential Home Today
|
||||||||||||||||||||
|
Ohio
|
320
|
|
28,751
|
|
673
|
|
61,950
|
|
993
|
|
90,701
|
|
||||||||
|
Florida
|
10
|
|
1,117
|
|
15
|
|
1,412
|
|
25
|
|
2,529
|
|
||||||||
|
Total Residential Home Today
|
330
|
|
29,868
|
|
688
|
|
63,362
|
|
1,018
|
|
93,230
|
|
||||||||
|
Home equity loans and lines of credit(1)
|
||||||||||||||||||||
|
Ohio
|
357
|
|
12,431
|
|
420
|
|
20,302
|
|
777
|
|
32,733
|
|
||||||||
|
Florida
|
128
|
|
9,718
|
|
242
|
|
23,023
|
|
370
|
|
32,741
|
|
||||||||
|
California
|
12
|
|
1,078
|
|
17
|
|
1,968
|
|
29
|
|
3,046
|
|
||||||||
|
Other
|
49
|
|
3,685
|
|
117
|
|
9,563
|
|
166
|
|
13,248
|
|
||||||||
|
Total Home equity loans and lines of credit
|
546
|
|
26,912
|
|
796
|
|
54,856
|
|
1,342
|
|
81,768
|
|
||||||||
|
Construction
|
4
|
|
753
|
|
57
|
|
10,773
|
|
61
|
|
11,526
|
|
||||||||
|
Other loans
|
4
|
|
—
|
|
—
|
|
1
|
|
4
|
|
1
|
|
||||||||
|
Total
|
1,171
|
|
$
|
88,763
|
|
1,963
|
|
$
|
172,708
|
|
3,134
|
|
$
|
261,471
|
|
|||||
______________________
|
(1)
|
Includes bridge loans (loans where borrowers can utilize the existing equity in their current home to fund the purchase of a new home before they have sold their current home).
|
The SVA charge-off that was recorded during the quarter ended December 31, 2011 contributed to the decrease in the reported balances of delinquent and nonperforming loans during fiscal 2012. The balance of the SVA at September 30, 2011 was $55.5 million. Total loans seriously delinquent
decreased
1.0%
to
1.2%
of total net loans at
September 30, 2012
, from
23
2.2%
at
September 30, 2011
. Seriously delinquent loans to total net loans decreased in residential non-Home Today portfolio from
0.7%
to
0.5%
. Residential Home Today portfolio remained relatively unchanged from
0.3%
to
0.3%
; and home equity loans and lines of credit portfolio remained relatively unchanged from
0.2%
to
0.2%
. The inability of borrowers to repay their loans is primarily a result of high unemployment and uncertain economic prospects in our primary lending markets. Inasmuch as job losses and unemployment levels both remain at elevated levels, we expect some borrowers who are current on their loans at
September 30, 2012
to experience payment problems in the future. The excess number of housing units available for sale in the market today also may limit their ability to sell a home they can no longer afford. In Florida, housing values continue to remain depressed due to prior rapid building and speculation from prior periods, which is now resulting in considerable inventory on the market and may limit a borrower’s ability to sell a home. As a result, we expect the level of loans delinquent 90 days and over will remain elevated in the foreseeable future.
Real Estate Owned
. Real estate acquired as a result of foreclosure or by deed in lieu of foreclosure is classified as real estate owned until sold. When property is acquired, it is recorded at the lower of cost or estimated fair market value at the date of foreclosure, establishing a new cost basis. Estimated fair value generally represents the sale price a buyer would be willing to pay on the basis of current market conditions. Holding costs and declines in estimated fair market value result in charges to expense after acquisition. At
September 30, 2012
, we had $
19.6 million
in real estate owned.
Classification of Assets.
Our policies, consistent with regulatory guidelines, provide for the classification of loans and other assets that are considered to be of lesser quality as substandard, doubtful, or loss assets. An asset is considered substandard if it is inadequately protected by the current payment capacity of the borrower or the collateral pledged has a defined weakness that jeopardizes the liquidation of the debt. Substandard assets include those assets characterized by the distinct possibility that we will sustain some loss if the deficiencies are not corrected. Assets classified as doubtful have all of the weaknesses inherent in those classified substandard with the added characteristic that the weaknesses present make collection or liquidation in full, on the basis of currently existing facts, conditions and values, highly questionable or improbable. Assets (or portions of assets) classified as loss are those considered uncollectible and of such little value that their continuance as assets is not warranted. Assets that do not expose us to risk sufficient to warrant classification in one of the aforementioned categories, but which possess potential weaknesses that deserve management's attention and may result in further deterioration in their repayment prospects and/or the Association's credit position, are required to be designated as special mention.
When we classify assets as either substandard or doubtful, we allocate a portion of the related general loss allowances to such assets as we deem prudent. The allowance for loan losses is the amount estimated by management as necessary to absorb credit losses incurred in the loan portfolio that are both probable and reasonably estimable at the balance sheet date. When we classify a problem asset as loss, we charge-off that portion of the asset that is uncollectible. Our determinations as to the classification of our assets and the amount of our loss allowances are subject to review by our primary federal regulator, the OCC, which can require that we establish additional loss allowances. We regularly review our asset portfolio to determine whether any assets require classification in accordance with applicable regulations. On the basis of our review of assets at
September 30, 2012
, the recorded investment of classified assets consists of substandard assets of $
205.5 million
, including $
19.6 million
of real estate owned, and $
9.9 million
of assets designated special mention. As of
September 30, 2012
, there were no individual assets classified as substandard with balances exceeding $1 million. Substandard assets at
September 30, 2012
include
$119.3 million
of loans 90 or more days past due and
$66.5 million
of loans less than 90 days past due displaying a weakness sufficient to warrant an adverse classification, the majority of which are troubled debt restructurings.
Impaired Loans.
A loan is considered impaired when, based on current information and events, it is probable that the Association will be unable to collect the scheduled payments of principal and interest according to the contractual terms of the loan agreement. During the year ended September 30, 2008, the Association changed the population of loans that it individually evaluates for impairment to include real estate secured loans 180 days or more past due, except home equity lines of credit, which it evaluates at 90 or more days past due. During the year ended September 30, 2011, the Association included equity loans, bridge loans and troubled debt restructurings with loans evaluated at 90 or more days past due. During the year ended September 30, 2012, the Association included loans greater than 30 days past due in bankruptcy status and all loans in Chapter 7 bankruptcy status where all borrowers filed, with loans individually evaluated. Large groups of smaller balance homogeneous loans are combined and collectively evaluated by portfolio for impairment. For a collateral dependent loan, impairment is measured based on the fair value of the collateral. For a loan whose terms are modified in a troubled debt restructuring, including loans in Chapter 7 bankruptcy, where at least one borrower has not had the debt discharged, the Association measures impairment based on the present value of expected future cash flows discounted at the loan’s effective interest rate, where the loan’s effective interest rate is based on the contractual rate of the original loan, not the terms of the restructuring. Expected future cash flows include a discount factor representing a potential for default. Loans in Chapter 7 bankruptcy where all borrowers' obligations related to the loan have been discharged, are evaluated based on collateral. When the recorded investment of an impaired loan, net of anticipated mortgage insurance claims, exceeds the fair value of the collateral, a charge-off is recorded for the excess. When the recorded investment of an impaired loan exceeds the present value of its expected
24
future cash flows, an individual valuation allowance is established for the excess. For additional information regarding impaired loans, see
Note
5 of the Notes to the Consolidated Financial Statements.
Allowance for Loan Losses
. We provide for loan losses based on the allowance method. Accordingly, all loan losses are charged to the related allowance and all recoveries are credited to it. Additions to the allowance for loan losses are provided by charges to income based on various factors which, in our judgment, deserve current recognition in estimating probable losses. We regularly review the loan portfolio and make provisions for loan losses in order to maintain the allowance for loan losses in accordance with GAAP. Historically, our allowance for loan losses consisted of three components:
|
(1)
|
specific allowances established for any impaired loans for which the recorded investment in the loan exceeded the measured value of the collateral (“specific valuation allowances” or “SVAs”) as well as allowances on individually reviewed loans dependent on cash flows, such as performing troubled debt restructurings, and a portion of the allowance on loans individually reviewed that represents further deterioration in the fair value of the collateral not yet identified as uncollectible ("individual valuation allowances" or "IVAs");
|
|
(2)
|
general allowances for loan losses for each loan type based on historical loan loss experience (“general valuation allowances” or “GVAs”); and
|
|
(3)
|
adjustments, which we describe as a market valuation adjustment, to historical loss experience (general allowances), maintained to cover uncertainties that affect our estimate of incurred probable losses for each loan type (“market valuation allowances” or “MVAs”).
|
In an October 2011 directive applicable to institutions subject to its regulation, the OCC required all SVAs on collateral dependent loans maintained by savings institutions to be charged off by March 31, 2012. As permitted, the Association elected to early-adopt this methodology effective for the quarter ended December 31, 2011. Additionally, the OCC issued guidance in July 2012 which requires loans, where at least one borrower has been discharged of their obligation, in Chapter 7 bankruptcy, to be classified as troubled debt restructurings. Also required is the charge off of performing loans to collateral value when all borrowers have had their obligations discharged in Chapter 7 bankruptcy, regardless of how long the loans have been performing. As a result, reported loan charge-offs for the
year ended
September 30, 2012
were impacted by the charge-off of specific valuation allowances, which had a balance of $55.5 million at September 30, 2011 and the charge-off of
$15.8 million
in connection with the Chapter 7 related guidance. The one-time SVA related charge-off did not impact the provision for loan losses for the year ended September 30, 2012; however, reported loan charge-offs during the year ended September 30, 2012 increased and the balance of the allowance for loan losses as of September 30, 2012 decreased accordingly. Additionally, the SVA charge-off contributed to the decrease in the reported balances of seriously delinquent and nonperforming loans for the year ended September 30, 2012. As a result of our adoption of this required change, effective for the year ended September 30, 2012 and prospectively, the balance of the SVA component of the allowance for loan losses was and will be zero. The Chapter 7 related charge-offs increased the provision for loan losses for the year ended September 30, 2012.
In many respects, market valuation allowances are more qualitative in nature than are general valuation allowances. MVAs expand our ability to identify and estimate probable losses and are based on our evaluation of the following factors, some of which are consistent with factors that impact the determination of GVAs. For example, delinquency statistics (both current and historical) are used in developing the GVAs while the trending of the delinquency statistics is considered and evaluated in the determination of the MVAs. From a directional perspective, during periods of increasing loan loss experience, MVAs generally comprise larger portions of the total allowance for loan losses as MVAs provide a mechanism to extend existing trends and to reflect broader changes that exist within a particular region, product type, demographic, etc. and that may not yet be captured in traditional GVA measurements. Similarly, MVAs generally comprise smaller portions of the total allowance for loan losses during periods of improving loan loss experience, or following a period of stable loan loss experience, as traditional GVA measures become able to more fully capture probable losses. Factors impacting the determination of MVAs include:
|
•
|
the trending of delinquency statistics (both current and historical), including factors that influence the trending, particularly, as described in the following bullet points, in the context of regional economies, including local housing markets and employment;
|
|
•
|
the status of loans in foreclosure, real estate in judgment and real estate owned;
|
|
•
|
the uncertainty with respect to the status of home equity loan and line of credit borrowers’ performance on first lien obligations when the Association is not in the first lien position;
|
|
•
|
the composition of the loan portfolio;
|
|
•
|
historical loan loss experience and trends;
|
|
•
|
national, regional and local economic factors and trends;
|
|
•
|
national, regional and local housing market factors and trends;
|
25
|
•
|
the frequency and magnitude of re-modifications of loans previously the subject of troubled debt restructurings;
|
|
•
|
uncertainty surrounding borrowers’ ability to recover from temporary hardships for which short-term loan modifications are granted;
|
|
•
|
asset disposition loss statistics (both current and historical) and the trending of those statistics;
|
|
•
|
the current status of all assets classified during the immediately preceding meeting of the Asset Classification Committee; and
|
|
•
|
market conditions and regulatory directives that impact the entire financial services industry.
|
Additionally, when loan modifications qualify as troubled debt restructurings, we record an individual valuation allowance for impairment based on the present value of expected future cash flows, which includes a factor for subsequent potential defaults, discounted at the effective interest rate of the original loan contract. Potential defaults are distinguished from re-modifications as borrowers who default are not eligible for re-modification. At
September 30, 2012
, the balance of such individual valuation allowances was $
17.7 million
. In instances when loans require re-modification, additional valuation allowances may be required. The new valuation allowance on a re-modified loan is calculated based on the present value of the expected cash flows, discounted at the effective interest rate of the original loan contract, considering the new terms of the modification agreement. Due to the immaterial amount of this exposure to date, we continue to capture this exposure as a component of our MVA evaluation. The significance of this exposure will be monitored and if warranted, we will enhance our loan loss methodology to include a new default factor (developed to reflect the estimated impact to the balance of the allowance for loan losses that will occur as a result of future re-modifications) that will be assessed against all loans reviewed collectively. If new default factors are implemented, the MVA methodology will be adjusted to preclude duplicative loss consideration.
We evaluate the allowance for loan losses based upon the combined total of the specific, historical loss and general components. Generally when the loan portfolio increases, absent other factors, the allowance for loan loss methodology results in a higher dollar amount of estimated probable losses than would be the case without the increase. Generally when the loan portfolio decreases, absent other factors, the allowance for loan loss methodology results in a lower dollar amount of estimated probable losses than would be the case without the decrease.
Equity loans and equity lines of credit generally have higher credit risk than traditional residential mortgage loans. These loans and lines are usually in a second lien position and when combined with the first mortgage, result in generally higher overall loan-to-value ratios. In a stressed housing market with high delinquencies and low housing prices, such as currently exists, these higher loan-to-value ratios represent a greater risk of loss to the Association. A borrower with more equity in the property has a vested interest in keeping the loan current compared to a borrower with little or no equity in the property. In light of the weak housing market, the current level of delinquencies and the current instability in employment and economic prospects, we currently conduct an expanded loan level evaluation of our equity loans and lines of credit, including bridge loans, which are delinquent 90 days or more. This expanded evaluation is in addition to our traditional evaluation procedures. Our home equity loans and lines of credit portfolio continues to comprise the largest portion of our net charge-offs, although the level of home equity loans and lines of credit charge-offs (excluding the impact of the elimination of SVAs that was recorded during the quarter ended December 31, 2011) has been reduced during the year from previous levels. At
September 30, 2012
, we had a recorded investment of
$2.16 billion
in equity loans and equity lines of credit outstanding,
0.8%
of which were delinquent 90 days or more.
Construction loans generally have greater credit risk than traditional residential real estate mortgage loans. The repayment of these loans depends upon the sale of the property to third parties or the availability of permanent financing upon completion of all improvements. In the event we make a loan on property that is not yet approved for the planned development, there is the risk that approvals will not be granted or will be delayed. These events may adversely affect the borrower and the collateral value of the property. Construction loans also expose us to the risk that improvements will not be completed on time in accordance with specifications and projected costs. In addition, the ultimate sale or rental of the property may not occur as anticipated.
We periodically evaluate the carrying value of loans and the allowance is adjusted accordingly. While we use the best information available to make evaluations, future additions to the allowance may be necessary based on unforeseen changes in loan quality and economic conditions. For more on allowance for loan losses, see “Management’s Discussion and Analysis of Financial Condition and Results of Operation.”
26
The following table sets forth activity in our allowance for loan losses segregated by geographic location for the periods indicated. Construction loans are on properties located in Ohio and the balances of consumer and other loans are immaterial; therefore neither was segregated.
|
|
At or For the Years Ended September 30,
|
||||||||||||||||||
|
|
2012
|
2011
|
2010
|
2009
|
2008
|
||||||||||||||
|
|
(Dollars in thousands)
|
||||||||||||||||||
|
Allowance balance (beginning of the period)
|
$
|
156,978
|
|
$
|
133,240
|
|
$
|
95,248
|
|
$
|
43,796
|
|
$
|
25,111
|
|
||||
|
Charge-offs:
|
|||||||||||||||||||
|
Real estate loans:
|
|||||||||||||||||||
|
Residential non-Home Today
|
|||||||||||||||||||
|
Ohio
|
25,828
|
|
8,915
|
|
5,081
|
|
4,507
|
|
3,884
|
|
|||||||||
|
Florida
|
29,285
|
|
8,889
|
|
7,425
|
|
2,319
|
|
787
|
|
|||||||||
|
Other
|
249
|
|
—
|
|
72
|
|
69
|
|
328
|
|
|||||||||
|
Total Residential non-Home Today
|
55,362
|
|
17,804
|
|
12,578
|
|
6,895
|
|
4,999
|
|
|||||||||
|
Residential Home Today
|
|||||||||||||||||||
|
Ohio
|
41,325
|
|
6,852
|
|
4,574
|
|
3,904
|
|
4,283
|
|
|||||||||
|
Florida
|
1,890
|
|
99
|
|
104
|
|
106
|
|
—
|
|
|||||||||
|
Other
|
—
|
|
—
|
|
—
|
|
—
|
|
—
|
|
|||||||||
|
Total Residential Home Today
|
43,215
|
|
6,951
|
|
4,678
|
|
4,010
|
|
4,283
|
|
|||||||||
|
Home equity loans and lines of credit(1)
|
|||||||||||||||||||
|
Ohio
|
13,957
|
|
10,564
|
|
7,471
|
|
5,893
|
|
1,343
|
|
|||||||||
|
Florida
|
30,473
|
|
30,319
|
|
33,589
|
|
35,939
|
|
3,678
|
|
|||||||||
|
California
|
5,747
|
|
4,895
|
|
4,002
|
|
4,890
|
|
—
|
|
|||||||||
|
Other
|
12,858
|
|
5,636
|
|
5,146
|
|
4,901
|
|
1,166
|
|
|||||||||
|
Total Home equity loans and lines of credit
|
63,035
|
|
51,414
|
|
50,208
|
|
51,623
|
|
6,187
|
|
|||||||||
|
Construction
|
1,268
|
|
994
|
|
2,491
|
|
1,442
|
|
598
|
|
|||||||||
|
Consumer and other loans
|
—
|
|
1
|
|
—
|
|
—
|
|
8
|
|
|||||||||
|
Total charge-offs
|
162,880
|
|
77,164
|
|
69,955
|
|
63,970
|
|
16,075
|
|
|||||||||
|
Recoveries:
|
|||||||||||||||||||
|
Real estate loans:
|
|||||||||||||||||||
|
Residential non-Home Today
|
850
|
|
338
|
|
523
|
|
195
|
|
128
|
|
|||||||||
|
Residential Home Today
|
162
|
|
108
|
|
23
|
|
—
|
|
117
|
|
|||||||||
|
Home equity loans and lines of credit(1)
|
3,318
|
|
1,921
|
|
1,390
|
|
225
|
|
8
|
|
|||||||||
|
Construction
|
36
|
|
35
|
|
11
|
|
—
|
|
—
|
|
|||||||||
|
Consumer and other loans
|
—
|
|
—
|
|
—
|
|
2
|
|
7
|
|
|||||||||
|
Total recoveries
|
4,366
|
|
2,402
|
|
1,947
|
|
422
|
|
260
|
|
|||||||||
|
Net charge-offs
|
(158,514
|
)
|
(74,762
|
)
|
(68,008
|
)
|
(63,548
|
)
|
(15,815
|
)
|
|||||||||
|
Provision for loan losses
|
102,000
|
|
98,500
|
|
106,000
|
|
115,000
|
|
34,500
|
|
|||||||||
|
Allowance balance (end of the period)
|
$
|
100,464
|
|
$
|
156,978
|
|
$
|
133,240
|
|
$
|
95,248
|
|
$
|
43,796
|
|
||||
|
Ratios:
|
|||||||||||||||||||
|
Net charge-offs to average loans outstanding
|
1.54
|
%
|
0.76
|
%
|
0.73
|
%
|
0.66
|
%
|
0.18
|
%
|
|||||||||
|
Allowance for loan losses to non-performing loans at end
of the year
|
55.03
|
%
|
71.75
|
%
|
52.38
|
%
|
37.24
|
%
|
25.33
|
%
|
|||||||||
|
Allowance for loan losses to the total recorded investment
in loans at end of the year
|
0.97
|
%
|
1.58
|
%
|
1.43
|
%
|
1.02
|
%
|
0.47
|
%
|
|||||||||
______________________
|
(1)
|
Includes bridge loans (loans where borrowers can utilize the existing equity in their current home to fund the purchase of a new home before they have sold their current home).
|
27
The increase in net charge-offs, to $
158.5 million
during the year ended
September 30, 2012
from
$74.8 million
during the year ended
September 30, 2011
, is attributable to the elimination of SVAs and charge-offs related to Chapter 7 bankruptcies per the OCC Bank Accounting Advisory Series interpretative guidance issued in July 2012. The following table separates the charge-offs during the year ended
September 30, 2012
between the elimination of specific valuation allowances, charge-offs related to Chapter 7 bankruptcies and other charge-offs during the period and compares the information with charge-offs during the year ended
September 30, 2011
. Charge-offs for the year ended September 30, 2011 exclude increases in SVAs of $14.6 million.
|
|
Charge-offs As of and For the Years Ended
|
|||||||||||||||||||
|
|
September 30, 2012
|
September 30, 2011
|
||||||||||||||||||
|
|
Total
|
SVA (1)
|
Bankruptcy (2)
|
Other
|
|
|||||||||||||||
|
|
(Dollars in thousands)
|
|||||||||||||||||||
|
Charge-offs:
|
||||||||||||||||||||
|
Real estate loans:
|
||||||||||||||||||||
|
Residential non-Home Today
|
||||||||||||||||||||
|
Ohio
|
$
|
25,828
|
|
$
|
6,269
|
|
$
|
3,175
|
|
$
|
16,384
|
|
$
|
8,915
|
|
|||||
|
Florida
|
29,285
|
|
16,223
|
|
552
|
|
12,510
|
|
8,889
|
|
||||||||||
|
Other
|
249
|
|
—
|
|
29
|
|
220
|
|
—
|
|
||||||||||
|
Total
|
55,362
|
|
22,492
|
|
3,756
|
|
29,114
|
|
17,804
|
|
||||||||||
|
Residential Home Today
|
||||||||||||||||||||
|
Ohio
|
41,325
|
|
17,042
|
|
2,348
|
|
21,935
|
|
6,852
|
|
||||||||||
|
Florida
|
1,890
|
|
1,171
|
|
102
|
|
617
|
|
99
|
|
||||||||||
|
Total
|
43,215
|
|
18,213
|
|
2,450
|
|
22,552
|
|
6,951
|
|
||||||||||
|
Home equity loans and lines of credit (3)
|
||||||||||||||||||||
|
Ohio
|
13,957
|
|
3,129
|
|
3,436
|
|
7,392
|
|
10,564
|
|
||||||||||
|
Florida
|
30,473
|
|
7,339
|
|
2,706
|
|
20,428
|
|
30,319
|
|
||||||||||
|
California
|
5,747
|
|
1,015
|
|
2,040
|
|
2,692
|
|
4,895
|
|
||||||||||
|
Other
|
12,858
|
|
2,204
|
|
1,439
|
|
9,215
|
|
5,636
|
|
||||||||||
|
Total
|
63,035
|
|
13,687
|
|
9,621
|
|
39,727
|
|
51,414
|
|
||||||||||
|
Construction
|
1,268
|
|
1,115
|
|
—
|
|
153
|
|
994
|
|
||||||||||
|
Consumer and other loans
|
—
|
|
—
|
|
—
|
|
—
|
|
1
|
|
||||||||||
|
Total charge-offs
|
162,880
|
|
55,507
|
|
15,827
|
|
91,546
|
|
77,164
|
|
||||||||||
|
Recoveries
|
(4,366
|
)
|
—
|
|
—
|
|
(4,366
|
)
|
(2,402
|
)
|
||||||||||
|
Net charge-offs
|
$
|
158,514
|
|
$
|
55,507
|
|
$
|
15,827
|
|
$
|
87,180
|
|
$
|
74,762
|
|
|||||
______________________
|
(1)
|
Reflects the balance of specific valuation allowances at September 30, 2011. Actual charge-offs related to loans with SVAs may differ due to updated reviews, foreclosure activity, or individual loan performance.
|
|
(2)
|
During the quarter ended September 30, 2012,
$15.8 million
of loans in Chapter 7 bankruptcy status, where all borrowers have been discharged of their obligation, were charged down to the fair value of collateral per the OCC Bank Accounting Advisory Series (BAAS) interpretive guidance issued in July 2012.
|
|
(3)
|
Includes bridge loans (loans where borrowers can utilize the equity in their current home to fund the purchase of a new home before they have sold their current home).
|
Net charge-offs, excluding the one-time SVA charge-offs and the Chapter 7 bankruptcy charge-offs during the year ended
September 30, 2012
increased $
12.4 million
to $
87.2 million
as compared to $
74.8 million
during the year ended
September 30, 2011
. Increased charge-offs related to the residential Home Today and the residential non-Home Today portfolios during the year ended
September 30, 2012
were partially offset by decreased charge-offs in the home equity and construction portfolios when compared to the year ended
September 30, 2011
. Increased charge-offs in our first lien portfolios and decreased charge-offs in our second lien and construction portfolios reflect the susceptibility of junior and higher risk lien positions during early stages of a broad economic downturn followed by increasing susceptibility for first and lower risk liens when depressed economic conditions persist.
28
We continue to evaluate loans becoming delinquent for potential losses and record provisions for our estimate of those losses. We expect this high level of charge-offs to continue as the delinquent loans are resolved in the future and uncollected balances are charged against the allowance.
Allocation of Allowance for Loan Losses.
The following tables set forth the allowance for loan losses allocated by loan category, the percent of allowance in each category to the total allowance, and the percent of loans in each category to total loans at the dates indicated. The allowance for loan losses allocated to each category is not necessarily indicative of future losses in any particular category and does not restrict the use of the allowance to absorb losses in other categories.
|
|
At September 30,
|
||||||||||||||||||||||||||||
|
|
2012
|
2011
|
2010
|
||||||||||||||||||||||||||
|
|
Amount
|
Percent of
Allowance
to Total
Allowance
|
Percent of
Loans in
Category to
Total Loans
|
Amount
|
Percent of
Allowance
to Total
Allowance
|
Percent of
Loans in
Category to
Total Loans
|
Amount
|
Percent of
Allowance
to Total
Allowance
|
Percent of
Loans in
Category to
Total Loans
|
||||||||||||||||||||
|
|
(Dollars in thousands)
|
||||||||||||||||||||||||||||
|
Real estate loans:
|
|||||||||||||||||||||||||||||
|
Residential non-
Home Today
|
$
|
31,618
|
|
31.5
|
%
|
76.5
|
%
|
$
|
49,484
|
|
31.5
|
%
|
71.5
|
%
|
$
|
41,246
|
|
31.0
|
%
|
65.4
|
%
|
||||||||
|
Residential Home
Today
|
22,588
|
|
22.5
|
|
2.0
|
|
31,025
|
|
19.8
|
|
2.6
|
|
13,331
|
|
10.0
|
|
3.0
|
|
|||||||||||
|
Home equity loans
and lines of credit
(1)
|
45,508
|
|
45.3
|
|
20.8
|
|
74,071
|
|
47.2
|
|
25.0
|
|
73,780
|
|
55.4
|
|
30.4
|
|
|||||||||||
|
Construction
|
750
|
|
0.7
|
|
0.7
|
|
2,398
|
|
1.5
|
|
0.8
|
|
4,882
|
|
3.6
|
|
1.1
|
|
|||||||||||
|
Other loans
|
—
|
|
—
|
|
—
|
|
—
|
|
—
|
|
0.1
|
|
1
|
|
—
|
|
0.1
|
|
|||||||||||
|
Total allowance
|
$
|
100,464
|
|
100.0
|
%
|
100.0
|
%
|
$
|
156,978
|
|
100.0
|
%
|
100.0
|
%
|
$
|
133,240
|
|
100.0
|
%
|
100.0
|
%
|
||||||||
|
|
At September 30,
|
||||||||||||||||||
|
|
2009
|
2008
|
|||||||||||||||||
|
|
Amount
|
Percent of
Allowance
to Total
Allowance
|
Percent of
Loans in
Category to
Total Loans
|
Amount
|
Percent of
Allowance
to Total
Allowance
|
Percent of
Loans in
Category to
Total Loans
|
|||||||||||||
|
|
(Dollars in thousands)
|
||||||||||||||||||
|
Real estate loans:
|
|||||||||||||||||||
|
Residential non-Home Today
|
$
|
22,678
|
|
23.8
|
%
|
64.0
|
%
|
$
|
7,873
|
|
18.0
|
%
|
68.7
|
%
|
|||||
|
Residential Home Today
|
9,232
|
|
9.7
|
|
3.1
|
|
5,883
|
|
13.4
|
|
3.3
|
|
|||||||
|
Home equity loans and lines of credit (1)
|
57,594
|
|
60.5
|
|
31.8
|
|
28,118
|
|
64.2
|
|
26.7
|
|
|||||||
|
Construction
|
5,743
|
|
6.0
|
|
1.0
|
|
1,922
|
|
4.4
|
|
1.2
|
|
|||||||
|
Other loans
|
1
|
|
—
|
|
0.1
|
|
—
|
|
—
|
|
0.1
|
|
|||||||
|
Total allowance
|
$
|
95,248
|
|
100.0
|
%
|
100.0
|
%
|
$
|
43,796
|
|
100.0
|
%
|
100.0
|
%
|
|||||
______________________
|
(1)
|
Includes bridge loans (loans where borrowers can utilize the existing equity in their current home to fund the purchase of a new home before they have sold their current home).
|
29
The following tables provide detailed information with respect to the composition of the allowance for loan losses, by loan segment and by method of determination as of
September 30, 2012
,
2011
,
2010
and 2009. The total balance of the MVA is determined for the portfolio as a whole and is allocated to the individual loan segments based on loss experience, credit metrics, and loan segment characteristics.
|
|
September 30, 2012
|
||||||||||||||||||||||||||
|
|
Separately Evaluated
|
Collectively Evaluated
|
Total Individual, General and Market Valuations
|
Total Allowance
|
|||||||||||||||||||||||
|
|
Specific
Valuation
|
Individual Valuation
|
General
Valuation
|
Market
Valuation
|
Combined
|
||||||||||||||||||||||
|
|
(In thousands)
|
||||||||||||||||||||||||||
|
Real estate loans:
|
|||||||||||||||||||||||||||
|
Residential non-Home Today
|
$
|
—
|
|
$
|
6,220
|
|
$
|
10,042
|
|
$
|
15,356
|
|
$
|
25,398
|
|
$
|
31,618
|
|
$
|
31,618
|
|
||||||
|
Residential Home Today
|
—
|
|
9,747
|
|
5,174
|
|
7,667
|
|
12,841
|
|
22,588
|
|
22,588
|
|
|||||||||||||
|
Home equity loans and lines of credit
|
—
|
|
3,928
|
|
30,757
|
|
10,823
|
|
41,580
|
|
45,508
|
|
45,508
|
|
|||||||||||||
|
Construction
|
—
|
|
41
|
|
454
|
|
255
|
|
709
|
|
750
|
|
750
|
|
|||||||||||||
|
Total real estate loans
|
—
|
|
19,936
|
|
46,427
|
|
34,101
|
|
80,528
|
|
100,464
|
|
100,464
|
|
|||||||||||||
|
Consumer and other loans
|
—
|
|
—
|
|
—
|
|
—
|
|
—
|
|
—
|
|
—
|
|
|||||||||||||
|
Total
|
$
|
—
|
|
$
|
19,936
|
|
$
|
46,427
|
|
$
|
34,101
|
|
$
|
80,528
|
|
$
|
100,464
|
|
$
|
100,464
|
|
||||||
|
|
September 30, 2011
|
||||||||||||||||||||||||||
|
|
Separately Evaluated
|
Collectively Evaluated
|
Total Individual, General and Market Valuations
|
Total Allowance
|
|||||||||||||||||||||||
|
|
Specific
Valuation
|
Individual Valuation
|
General
Valuation
|
Market
Valuation
|
Combined
|
||||||||||||||||||||||
|
|
(In thousands)
|
||||||||||||||||||||||||||
|
Real estate loans:
|
|||||||||||||||||||||||||||
|
Residential non-Home Today
|
$
|
22,492
|
|
$
|
2,903
|
|
$
|
10,760
|
|
$
|
13,329
|
|
$
|
24,089
|
|
$
|
26,992
|
|
$
|
49,484
|
|
||||||
|
Residential Home Today
|
18,213
|
|
3,725
|
|
3,027
|
|
6,060
|
|
9,087
|
|
12,812
|
|
31,025
|
|
|||||||||||||
|
Home equity loans and lines of credit
|
13,687
|
|
637
|
|
16,567
|
|
43,180
|
|
59,747
|
|
60,384
|
|
74,071
|
|
|||||||||||||
|
Construction
|
1,115
|
|
140
|
|
725
|
|
418
|
|
1,143
|
|
1,283
|
|
2,398
|
|
|||||||||||||
|
Total real estate loans
|
55,507
|
|
7,405
|
|
31,079
|
|
62,987
|
|
94,066
|
|
101,471
|
|
156,978
|
|
|||||||||||||
|
Consumer and other loans
|
—
|
|
—
|
|
—
|
|
—
|
|
—
|
|
—
|
|
—
|
|
|||||||||||||
|
Total
|
$
|
55,507
|
|
$
|
7,405
|
|
$
|
31,079
|
|
$
|
62,987
|
|
$
|
94,066
|
|
$
|
101,471
|
|
$
|
156,978
|
|
||||||
|
|
September 30, 2010
|
||||||||||||||||||||||||||
|
|
Separately Evaluated
|
Collectively Evaluated
|
Total Individual, General and Market Valuations
|
Total Allowance
|
|||||||||||||||||||||||
|
|
Specific
Valuation
|
Individual Valuation
|
General
Valuation
|
Market
Valuation
|
Combined
|
||||||||||||||||||||||
|
|
(In thousands)
|
||||||||||||||||||||||||||
|
Real estate loans:
|
|||||||||||||||||||||||||||
|
Residential non-Home Today
|
$
|
14,734
|
|
$
|
1,056
|
|
$
|
10,385
|
|
$
|
15,071
|
|
$
|
25,456
|
|
$
|
26,512
|
|
$
|
41,246
|
|
||||||
|
Residential Home Today
|
6,715
|
|
3,037
|
|
1,281
|
|
2,298
|
|
3,579
|
|
6,616
|
|
13,331
|
|
|||||||||||||
|
Home equity loans and lines of credit
|
17,692
|
|
816
|
|
18,532
|
|
36,740
|
|
55,272
|
|
56,088
|
|
73,780
|
|
|||||||||||||
|
Construction
|
1,721
|
|
267
|
|
1,036
|
|
1,858
|
|
2,894
|
|
3,161
|
|
4,882
|
|
|||||||||||||
|
Total real estate loans
|
40,862
|
|
5,176
|
|
31,234
|
|
55,967
|
|
87,201
|
|
92,377
|
|
133,239
|
|
|||||||||||||
|
Consumer and other loans
|
1
|
|
—
|
|
—
|
|
—
|
|
—
|
|
—
|
|
1
|
|
|||||||||||||
|
Total
|
$
|
40,863
|
|
$
|
5,176
|
|
$
|
31,234
|
|
$
|
55,967
|
|
$
|
87,201
|
|
$
|
92,377
|
|
$
|
133,240
|
|
||||||
30
|
|
September 30, 2009
|
||||||||||||||||||||||||||
|
|
Separately Evaluated
|
Collectively Evaluated
|
Total Individual, General and Market Valuations
|
Total Allowance
|
|||||||||||||||||||||||
|
|
Specific
Valuation
|
Individual Valuation
|
General
Valuation
|
Market
Valuation
|
Combined
|
||||||||||||||||||||||
|
|
(In thousands)
|
||||||||||||||||||||||||||
|
Real estate loans:
|
|||||||||||||||||||||||||||
|
Residential non-Home Today
|
$
|
7,726
|
|
$
|
650
|
|
$
|
11,003
|
|
$
|
3,299
|
|
$
|
14,302
|
|
$
|
14,952
|
|
$
|
22,678
|
|
||||||
|
Residential Home Today
|
3,397
|
|
1,128
|
|
2,428
|
|
2,279
|
|
4,707
|
|
5,835
|
|
9,232
|
|
|||||||||||||
|
Home equity loans and lines of credit
|
13,945
|
|
57
|
|
18,875
|
|
24,717
|
|
43,592
|
|
43,649
|
|
57,594
|
|
|||||||||||||
|
Construction
|
—
|
|
—
|
|
2,962
|
|
2,781
|
|
5,743
|
|
5,743
|
|
5,743
|
|
|||||||||||||
|
Total real estate loans
|
25,068
|
|
1,835
|
|
35,268
|
|
33,076
|
|
68,344
|
|
70,179
|
|
95,247
|
|
|||||||||||||
|
Consumer and other loans
|
1
|
|
—
|
|
—
|
|
—
|
|
—
|
|
—
|
|
1
|
|
|||||||||||||
|
Total
|
$
|
25,069
|
|
$
|
1,835
|
|
$
|
35,268
|
|
$
|
33,076
|
|
$
|
68,344
|
|
$
|
70,179
|
|
$
|
95,248
|
|
||||||
During the fiscal year ended
September 30, 2012
, the total real estate loan portfolio increased 4.2% or $419.8 million while the total allowance for loan losses decreased $56.5 million to $100.5 million, from $157.0 million at
September 30, 2011
. Of this decrease, $55.5 million was attributable to the first quarter 2012 charge-off related to the adoption of an OCC directive to discontinue the use of SVA. The remaining $1.0 million decrease is the net of a $13.5 million decrease in the allowance for loan losses that was determined by evaluating groups of loans collectively (i.e. those loans not reviewed individually) offset by a $12.5 million increase in allowance for loan losses attributable to allowances established for loans reviewed individually. Changes in the balances of GVAs and MVAs for the individual loan segments varied based on the particular circumstances most relevant to the individual loan segment. Refer to the discussion of the allowance for loan losses and analysis of the allowance for loan losses tables in
Note 5. LOANS AND ALLOWANCE FOR LOAN LOSSES
for more information. Other than the changes related to the insignificant construction/consumer/other loans segments, changes in the balances of the GVAs and MVAs for the loans evaluated collectively related to the significant loan segments are described as follows:
|
•
|
Residential non-Home Today
—The total loan portfolio increased 11.7% or $829.1 million for this segment while the total allowance for loan losses for this segment decreased 36.1% , or $17.9 million. Of this decrease, $22.5 million was attributable to the SVA charge-off, offset by the combined GVA/MVA allowance for loan losses that was determined by evaluating groups of loans collectively (i.e. those loans that were not reviewed individually) that increased $1.3 million during the fiscal year ended
September 30, 2012
and a $3.3 million increase in the allowance established for loans reviewed individually. Of the $1.3 million increase in the allowance for loans evaluated collectively, the GVA segment decreased $0.7 million offset by a $2.0 million increase in the MVA. Net charge-offs of non-Home Today loans increased $37.0 million from $17.5 million for fiscal year ending September 30, 2011 to $54.5 million for fiscal year ending September 2012, including the $22.5 million SVA charge-off. Total d
elinquencies
for this loan segment decreased 32.0% and delinquencies 90 days and greater decreased 36.9% from September 30, 2011 to September 30, 2012 reflecting the improving credit profile of this loan segment due to the addition of high credit quality, adjustable-rate, residential, first-mortgage loans, as well as impact of the SVA charge-off.
|
|
•
|
Residential Home Today
—The total loan portfolio for this segment decreased 22.1% or $58.0 million as new originations have effectively stopped since the imposition of more restrictive lending requirements in 2009. The total allowance for loan losses for this segment decreased $8.4 million or 27.2%. Of this decrease, $18.2 million was attributable to the SVA charge-off, offset by a $6.0 million increase in the allowance established for loans reviewed individually and a $3.8 million increase in the portion of this loan segment’s allowance for loan losses that was determined by evaluating groups of loans collectively, during the fiscal year ended
September 30, 2012
. The GVA segment of the allowance determined by evaluating groups of loans collectively increased $2.2 million and in the MVA segment increased $1.6 million. The ratio of this portion of the allowance for loan losses to the total balances of loans in this loan segment that were evaluated collectively, also increased to 11.7 % at
September 30, 2012
, from 7.1% at
September 30, 2011
, reflecting increased net charge-offs ($24.8 million, in addition to the $18.2 million SVA charge-off, during the fiscal year ended
September 30, 2012
as compared to $6.8 million for the fiscal year ended
September 30, 2011
). Total delinquencies decreased 45.8% and delinquencies 90 days and greater decreased 54.1% for the fiscal year ending September 30, 2012. Of the reductions in delinquency balances, $18.2 million occurred in connection with the SVA charge-off.
|
|
•
|
Home equity loans and lines of credit
—The total loan portfolio for this segment decreased 13.5% or $338.9 million from $2.50 billion at September 30, 2011 to $2.16 billion at September 30, 2012. Between June 2010 and March
|
31
2012, new home equity loans and lines of credit were not being offered. The total allowance for loan losses for this loan segment decreased $28.6 million or 38.6% during the year ended September 30, 2012. The decrease would have been less, absent $13.7 million of charge-offs attributable to the December 2011 SVA charge-off which was partially offset by the $3.3 million increase in the balance of the allowance that was required for the individually reviewed loans. As of March 31, 2012, the Association implemented the stipulations of regulatory guidance issued in January 2012 that required the Association to report performing home equity loans and lines of credit as non-accrual and substandard in situations where a borrower's first lien position was severely delinquent. The portion of this loan segment’s allowance for loan losses that was determined by evaluating groups of loans collectively, decreased by $18.2 million during the fiscal year ended
September 30, 2012
. The GVA and MVA worked together as the GVA components are a reflection of loss experience and the MVA reflects the market dynamics. The GVA increased $14.2 million or 85.7% since September 30, 2011: conversely MVA decreased $32.4 million or 74.9% for the same time period. The ratio of this portion of the allowance for loan losses to the total balances of loans in this loan segment that were evaluated collectively, also decreased to 1.95% at
September 30, 2012
, from 2.42% at
September 30, 2011
, reflecting a decreased level of net charge-offs ($46.0 million for the fiscal year ended
September 30, 2012
, excluding the one-time SVA charge-off of $13.7 million, as compared to $49.5 million for the fiscal year ended
September 30, 2011
), which indicates a decrease in the level of losses that is expected when credits are resolved. Additionally, total delinquencies decreased 47.2% from $53.9 million at September 30, 2011 to $28.5 million at September 30, 2012 with delinquencies 90 days and greater decreasing 54.6% from $36.5 million to $16.6 million for the same period. Of the reductions in delinquency balances, $13.7 million occurred in connection with the SVA charge-off.
Provisions for loan losses on home equity loans and lines of credit continue to comprise the majority of our provisions and are expected to continue to do so for the foreseeable future, especially if non-performing loan balances and charge-offs remain at elevated levels. Additional discussion of non-performing home equity loan and lines of credit as well as charge-offs appears in “Management’s Discussion and Analysis of Financial Conditions and Operating Results.”
Our analysis for evaluating the adequacy of and the appropriateness of our loan loss provision and allowance for loan losses is continually refined as new information becomes available and actual loss experience is acquired. During the last several years, numerous modifications to our procedures have been made including the following:
|
•
|
As of June 30, 2008, in light of the weak housing market, the then current level of delinquencies and the instability in employment and economic prospects, our loan evaluation methodology related to home equity line of credit loans was expanded to include an accelerated individual loan loss review framework that evaluated all home equity lines of credit that were 90 days or more past due, and we recorded an additional $12 million to our provision for loan losses and the total allowance for loan losses carried on our balance sheet.
|
|
•
|
As of September 30, 2008, an expanded individual loan loss review framework was implemented for our residential real estate and home equity loans delinquent 180 days or more.
|
|
•
|
As of March 31, 2009 and as a precursor to the qualitative MVA that was subsequently added in September 2009, an additional $10 million was added to our traditional general valuation allowance which correspondingly increased our loan loss provision and the total allowance for loan losses carried on our balance sheet.
|
|
•
|
As of September 30, 2009, the qualitative MVA was formally added to our procedures to provide consideration of factors that may not be directly derived from historical portfolio performance. With its orientation aligned more closely with contemporaneous qualitative factors, as opposed to the more historically-oriented loss experience factors, the MVA ensures that the provision for loan losses recognized in our income statement, as well as the balance of the allowance for loan losses carried on our balance sheet, remain consistent with not only our experience, but also with our expectations, which are influenced by the then-current status of the economy and housing markets and how those conditions may impact the performance of loans held on our balance sheet on the reporting date. The MVA supplement to the “general” component of our overall allowance for loan losses added approximately $33 million to the provision for loan losses and the total allowance for loan losses carried on our balance sheet as of and for the quarter ended September 30, 2009.
|
|
•
|
As of September 30, 2010, the individual loan loss review methodology for home equity loans and lines of credit was enhanced to include updated individual reviews for all home equity loans and lines of credit that were 90 days or more past due. Previously, updated individual reviews were not performed if the previous review had been performed within the last 12 months.
|
|
•
|
As of September 30, 2011,
$7.4 million
of the SVA was reclassified as an individual valuation allowance ("IVA"). This portion represents the allowance on individually reviewed loans dependent on cash flows, such as performing troubled debt restructurings, and a portion of the allowance on loans that represents further deterioration in the fair value not
|
32
supported by an appraisal. Reclassifications have also been made to the SVA balances as of September 30, 2010 and 2009.
|
•
|
As of September 30, 2012, home equity loans and lines of credit where the customer has a severely delinquent first mortgage are also placed in non-accrual status and classified Substandard, receiving a higher GVA factor than if they remained in the performing Pass category. Also, all loans in Chapter 7 bankruptcy status, where at least one borrower has been discharged of their obligation, have been added to the individually reviewed population. Those loans where all borrowers have had their obligation discharged are evaluated for impairment based on the fair value of the underlying collateral. Those loans where at least one borrower has not had the debt discharged are evaluated for impairment based on the present value of cash flow analysis.
|
During the year ended September 30, 2012, in accordance with an OCC directive, our SVAs (which had a balance of $55.5 million as of September 30, 2011) were charged off. This one-time charge-off did not impact the provision for loan losses for the year ended September 30, 2012; however, reported loan charge-offs during the year ended September 30, 2012 increased and the balances of loans, the allowance for loan losses, non-accrual status loans and loan delinquencies all decreased accordingly.
Investments
The Association’s board of directors is responsible for establishing and overseeing the Association’s investment policy. The investment policy is reviewed at least annually by management and any changes to the policy are recommended to the board of directors, or a committee thereof, and are subject to its approval. This policy dictates that investment decisions be made based on the safety of the investment, liquidity requirements, potential returns, the ability to provide collateral for pledging requirements, and consistency with our interest rate risk management strategy. The Association’s Investment Committee, which consists of its chief operating officer, chief financial officer and other members of management, oversees its investing activities and strategies. The portfolio manager is responsible for making securities portfolio decisions in accordance with established policies. The portfolio manager has the authority to purchase and sell securities within specific guidelines established in the investment policy, but historically the portfolio manager has executed purchases only after extensive discussions with other Investment Committee members. All transactions are formally reviewed by the Investment Committee at least quarterly. In addition, all investment transactions are reviewed by the Executive Committee of the Association’s board of directors within 60 days of the transaction date to determine compliance with our investment policy. Any investment which, subsequent to its purchase, fails to meet the guidelines of the policy is reported to the Investment Committee, which decides whether to hold or sell the investment.
The Association’s current investment policy requires that it invest primarily in debt securities issued by the U.S. Government, agencies of the U.S. Government, and government-sponsored entities, which now include Fannie Mae and Freddie Mac. The policy also permits investments in mortgage-backed securities, including pass-through securities issued and guaranteed by Fannie Mae, Freddie Mac and Ginnie Mae as well as collateralized mortgage obligations (“CMOs”) and real estate mortgage investment conduits (“REMICS”) issued or backed by securities issued by these governmental agencies and government-sponsored entities. The investment policy also permits investments in asset-backed securities, banker’s acceptances, money market funds, term federal funds, repurchase agreements and reverse repurchase agreements.
The Association’s current investment policy does not permit investment in municipal bonds, corporate debt obligations, preferred or common stock of government agencies or equity securities other than its required investment in the common stock of the FHLB of Cincinnati. As of
September 30, 2012
, we held no asset-backed securities or securities with sub-prime credit risk exposure, nor did we hold any banker’s acceptances, term federal funds, repurchase agreements or reverse repurchase agreements. As a federal savings association, Third Federal Savings and Loan is not permitted to invest in equity securities. This general restriction does not apply to the Company.
The Association’s current investment policy prohibits hedging through the use of such instruments as financial futures, interest rate options and swaps, without specific approval from its board of directors.
Financial Accounting Standards Board (“FASB”) Accounting Standards Codification (“ASC”) 320, “Investments-Debt and Equity Securities,” requires that, at the time of purchase, we designate a security as held to maturity, available-for-sale, or trading, depending on our ability and intent. Securities designated as available-for-sale are reported at fair value, while securities designated as held to maturity are reported at amortized cost. During the quarter ended June 30, 2012, the Company's primary regulator objected to the inclusion in the Company's reported balance of liquid assets, of any investment security not classified as available for sale. Such objection had not been expressed by the Company's or the Association's prior regulator, nor has it been expressed by the Association's current regulator. In response to the objection of the Company's primary regulator, all of the Company's investment securities previously classified as held to maturity were transferred to the available
33
for sale portfolio to ensure that the securities would be eligible for inclusion in the computation of regulatory liquidity. At
September 30, 2012
, all investment securities held by the Company are classified as available for sale. We do not have a trading portfolio.
Our investment portfolio at
September 30, 2012
, primarily consisted of
$2.0 million
of U.S. government and federal agency obligations,
$24.2 million
in primarily fixed-rate securities guaranteed by Fannie Mae, Freddie Mac or Ginnie Mae,
$383.5 million
of REMICs collateralized only by securities guaranteed by Fannie Mae, Freddie Mac or Ginnie Mae, and
$7.7 million
in money market accounts.
U.S. Government and Federal Agency Obligations.
While U.S. Government and federal agency securities generally provide lower yields than other investments in our securities investment portfolio, we maintain these investments, to the extent appropriate, for liquidity purposes, as collateral for borrowings and as an interest rate risk hedge in the event of significant mortgage loan prepayments.
Mortgage-Backed Securities.
We purchase mortgage-backed securities insured or guaranteed by Fannie Mae, Freddie Mac or Ginnie Mae. We invest in mortgage-backed securities to achieve positive interest rate spreads with minimal administrative expense, and to lower our credit risk as a result of the guarantees provided by Freddie Mac, Fannie Mae or Ginnie Mae. During the financial market upheaval of 2008, concern arose about the financial health of Fannie Mae and Freddie Mac, the value of their guarantees and therefore, the continued existence of the secondary market for mortgage loans upon which the Company historically relied for liquidity and interest rate risk management. This market was preserved when, in September 2008, the Federal Housing Finance Agency placed Freddie Mac and Fannie Mae into conservatorship. The U.S. Treasury Department has established financing agreements to ensure that Fannie Mae and Freddie Mac meet their obligations to holders of mortgage-backed securities that they have issued or guaranteed.
Mortgage-backed securities are created by the pooling of mortgages and the issuance of a security with an interest rate that is less than the interest rate on the underlying mortgages. Mortgage-backed securities typically represent a participation interest in a pool of single-family or multi-family mortgages, although we invest primarily in mortgage-backed securities backed by one- to four-family mortgages. The issuers of such securities (generally Ginnie Mae, Fannie Mae and Freddie Mac) pool and resell the participation interests in the form of securities to investors such as the Association, and guarantee the payment of principal and interest to investors. Mortgage-backed securities generally yield less than the loans that underlie such securities because of the cost of payment guarantees and credit enhancements. However, mortgage-backed securities are more liquid than individual mortgage loans since there is an active trading market for such securities. While there has been significant disruption in the demand for private issuer mortgage-backed securities, the U.S. Treasury support for Fannie Mae and Freddie Mac guarantees has maintained an orderly market for the mortgage-backed securities the Company typically purchases. In addition, mortgage-backed securities may be used to collateralize our specific liabilities and obligations. Investments in mortgage-backed securities involve a risk that the timing of actual payments will be earlier or later than the timing estimated when the mortgage-backed security was purchased, which may require adjustments to the amortization of any premium or accretion of any discount relating to such interests, thereby affecting the net yield on our securities. We periodically review current prepayment speeds to determine whether prepayment estimates require modifications that could cause amortization or accretion adjustments.
REMICs are types of debt securities issued by a special-purpose entity that aggregates pools of mortgages and mortgage-backed securities and creates different classes of securities with varying maturities and amortization schedules, as well as a residual interest, with each class possessing different risk characteristics. The cash flows from the underlying collateral are generally divided into “tranches” or classes that have descending priorities with respect to the distribution of principal and interest cash flows, while cash flows on pass-through mortgage-backed securities are distributed pro rata to all security holders.
34
The following table sets forth the amortized cost and fair value of our securities portfolio (excluding FHLB of Cincinnati common stock) at the dates indicated.
|
|
At September 30,
|
||||||||||||||||||||||
|
|
2012
|
2011
|
2010
|
||||||||||||||||||||
|
|
Amortized
Cost
|
Fair
Value
|
Amortized
Cost
|
Fair
Value
|
Amortized
Cost
|
Fair
Value
|
|||||||||||||||||
|
|
(In thousands)
|
||||||||||||||||||||||
|
Investments available for sale:
|
|||||||||||||||||||||||
|
U.S. Government and agency obligations
|
$
|
2,000
|
|
$
|
2,056
|
|
$
|
2,000
|
|
$
|
2,046
|
|
$
|
7,000
|
|
$
|
7,063
|
|
|||||
|
Freddie Mac certificates
|
922
|
|
989
|
|
—
|
|
—
|
|
—
|
|
—
|
|
|||||||||||
|
Ginnie Mae certificates
|
16,123
|
|
16,786
|
|
—
|
|
—
|
|
—
|
|
—
|
|
|||||||||||
|
REMICs
|
383,545
|
|
386,009
|
|
5,244
|
|
5,337
|
|
8,718
|
|
8,794
|
|
|||||||||||
|
Money market accounts
|
7,701
|
|
7,701
|
|
8,516
|
|
8,516
|
|
8,762
|
|
8,762
|
|
|||||||||||
|
Fannie Mae certificates
|
7,125
|
|
7,889
|
|
—
|
|
—
|
|
—
|
|
—
|
|
|||||||||||
|
Total investment securities available for sale
|
$
|
417,416
|
|
$
|
421,430
|
|
$
|
15,760
|
|
$
|
15,899
|
|
$
|
24,480
|
|
$
|
24,619
|
|
|||||
|
Investments held to maturity:
|
|||||||||||||||||||||||
|
Freddie Mac certificates
|
$
|
—
|
|
$
|
—
|
|
$
|
2,724
|
|
$
|
2,842
|
|
$
|
4,441
|
|
$
|
4,672
|
|
|||||
|
Ginnie Mae certificates
|
—
|
|
—
|
|
19,532
|
|
20,033
|
|
22,375
|
|
22,973
|
|
|||||||||||
|
REMICs
|
—
|
|
—
|
|
362,489
|
|
367,268
|
|
611,000
|
|
619,486
|
|
|||||||||||
|
Fannie Mae certificates
|
—
|
|
—
|
|
7,782
|
|
8,582
|
|
9,124
|
|
9,945
|
|
|||||||||||
|
Total securities held to maturity
|
$
|
—
|
|
$
|
—
|
|
$
|
392,527
|
|
$
|
398,725
|
|
$
|
646,940
|
|
$
|
657,076
|
|
|||||
Portfolio Maturities and Yields
.
The composition and maturities of the investment securities portfolio and the mortgage-backed securities portfolio at
September 30, 2012
are summarized in the following table. Maturities are based on the final contractual payment dates, and do not reflect the impact of prepayments or early redemptions that may occur. All of our securities at
September 30, 2012
were taxable securities.
|
|
One Year or Less
|
More than
One Year Through
Five years
|
More than
Five Years Through
Ten Years
|
More than Ten
Years
|
Total Securities
|
|||||||||||||||||||||||||||||||||
|
|
Amortized
Cost
|
Weighted
Average
Yield
|
Amortized
Cost
|
Weighted
Average
Yield
|
Amortized
Cost
|
Weighted
Average
Yield
|
Amortized
Cost
|
Weighted
Average
Yield
|
Amortized
Cost
|
Fair
Value
|
Weighted
Average
Yield
|
|||||||||||||||||||||||||||
|
|
|
|
(Dollars in thousands)
|
|
|
|
||||||||||||||||||||||||||||||||
|
Investments available-for-sale:
|
||||||||||||||||||||||||||||||||||||||
|
U.S. Government and agency obligations
|
$
|
—
|
|
—
|
%
|
$
|
2,000
|
|
1.25
|
%
|
$
|
—
|
|
—
|
%
|
$
|
—
|
|
—
|
%
|
$
|
2,000
|
|
$
|
2,056
|
|
1.25
|
%
|
||||||||||
|
Freddie Mac certificates
|
—
|
|
—
|
%
|
—
|
|
—
|
%
|
—
|
|
—
|
%
|
922
|
|
2.72
|
%
|
922
|
|
989
|
|
2.72
|
%
|
||||||||||||||||
|
Ginnie Mae certificates
|
—
|
|
—
|
%
|
822
|
|
2.93
|
%
|
1,460
|
|
2.72
|
%
|
13,841
|
|
2.83
|
%
|
16,123
|
|
16,786
|
|
2.83
|
%
|
||||||||||||||||
|
REMICs
|
—
|
|
—
|
%
|
2,822
|
|
1.93
|
%
|
26,923
|
|
0.80
|
%
|
353,800
|
|
1.11
|
%
|
383,545
|
|
386,009
|
|
1.10
|
%
|
||||||||||||||||
|
Fannie Mae certificates
|
1
|
|
5.53
|
%
|
—
|
|
—
|
%
|
857
|
|
6.50
|
%
|
6,267
|
|
6.44
|
%
|
7,125
|
|
7,889
|
|
6.45
|
%
|
||||||||||||||||
|
Money market accounts
|
—
|
|
—
|
%
|
—
|
|
—
|
%
|
—
|
|
—
|
%
|
7,701
|
|
0.16
|
%
|
7,701
|
|
7,701
|
|
0.16
|
%
|
||||||||||||||||
|
Total investment securities available-for-sale
|
$
|
1
|
|
5.53
|
%
|
$
|
5,644
|
|
1.83
|
%
|
$
|
29,240
|
|
1.06
|
%
|
$
|
382,531
|
|
1.25
|
%
|
$
|
417,416
|
|
$
|
421,430
|
|
1.24
|
%
|
||||||||||
Sources of Funds
General.
Deposits traditionally have been the primary source of funds for the Association’s lending and investment activities. The Association also borrows, primarily from the FHLB of Cincinnati and the Federal Reserve Discount Window, to supplement cash flow, to lengthen the maturities of liabilities for interest rate risk management purposes and to manage its cost
35
of funds. Additional sources of funds are scheduled loan payments, maturing investments, loan prepayments, collateralized wholesale borrowings, income on other earning assets, and the proceeds of loan sales.
Deposits.
The Association generates deposits primarily from the areas in which its branch offices are located, as well as from its customer service call center and its internet website. It relies on its competitive pricing, convenient locations, and customer service to attract and retain deposits. It offers a variety of deposit accounts with a range of interest rates and terms. Its deposit accounts consist of savings accounts (primarily high-yield savings), NOW accounts (primarily high-yield checking accounts), certificates of deposit, individual retirement accounts, and other qualified plan accounts. It currently does not accept brokered deposits.
Interest rates paid, maturity terms, service fees, and withdrawal penalties are established on a periodic basis. Deposit rates and terms are based primarily on current operating strategies and market interest rates, liquidity requirements, interest rates paid by competitors, and our deposit growth goals.
At
September 30, 2012
, deposits totaled
$8.98 billion
. NOW accounts totaled
$1.01 billion
(including
$934.8 million
of high-yield checking accounts) and savings accounts totaled
$1.78 billion
(including
$1.64 billion
of high-yield savings accounts). At
September 30, 2012
, the Association had a total of
$6.20 billion
in certificates of deposit, of which
$2.55 billion
had remaining maturities of one year or less. Based on historical experience and its current pricing strategy, management believes the Association will retain a large portion of these accounts upon maturity.
The following table sets forth the distribution of the Association’s average total deposit accounts, by account type, for the fiscal years indicated.
|
|
For the Years Ended September 30,
|
||||||||||||||||||||||||||||
|
|
2012
|
2011
|
2010
|
||||||||||||||||||||||||||
|
|
Average
Balance
|
Percent
|
Weighted
Average
Rate
|
Average
Balance
|
Percent
|
Weighted
Average
Rate
|
Average
Balance
|
Percent
|
Weighted
Average
Rate
|
||||||||||||||||||||
|
|
(Dollars in thousands)
|
||||||||||||||||||||||||||||
|
Deposit type:
|
|||||||||||||||||||||||||||||
|
NOW
|
986,198
|
|
11.2
|
%
|
0.29
|
%
|
$
|
975,938
|
|
11.1
|
%
|
0.37
|
%
|
$
|
975,889
|
|
11.2
|
%
|
0.56
|
%
|
|||||||||
|
Savings
|
1,756,840
|
|
19.9
|
%
|
0.43
|
%
|
1,631,764
|
|
18.7
|
%
|
0.61
|
%
|
1,442,641
|
|
16.5
|
%
|
0.91
|
%
|
|||||||||||
|
Certificates of deposit
|
6,064,950
|
|
68.9
|
%
|
2.35
|
%
|
6,137,246
|
|
70.2
|
%
|
2.68
|
%
|
6,301,459
|
|
72.3
|
%
|
3.01
|
%
|
|||||||||||
|
Total deposits
|
$
|
8,807,988
|
|
100.0
|
%
|
1.74
|
%
|
$
|
8,744,948
|
|
100.0
|
%
|
2.04
|
%
|
$
|
8,719,989
|
|
100.0
|
%
|
2.39
|
%
|
||||||||
As of
September 30, 2012
, the aggregate amount of the Association’s outstanding certificates of deposit in amounts greater than or equal to $100,000 was approximately
$2.25 billion
. The following table sets forth the maturity of those certificates as of
September 30, 2012
.
|
|
At September 30, 2012
|
||
|
|
(In thousands)
|
||
|
Three months or less
|
$
|
362,544
|
|
|
Over three months through six months
|
111,735
|
|
|
|
Over six months through one year
|
349,441
|
|
|
|
Over one year to three years
|
900,603
|
|
|
|
Over three years
|
526,227
|
|
|
|
Total
|
$
|
2,250,550
|
|
36
The following table sets forth, by interest rate ranges, information concerning the Association’s certificates of deposit at
September 30, 2012
.
|
|
Period to Maturity
|
|||||||||||||||||||||
|
|
Less Than or
Equal to
One Year
|
More
Than One
to Two
Years
|
More
Than Two
to Three
Years
|
More Than
Three Years
|
Total
|
Percent
of Total
|
||||||||||||||||
|
|
(Dollars in thousands)
|
|
||||||||||||||||||||
|
Interest Rate Range:
|
||||||||||||||||||||||
|
0.99% and below
|
$
|
1,410,271
|
|
$
|
468,814
|
|
$
|
81,909
|
|
$
|
453
|
|
$
|
1,961,447
|
|
31.65
|
%
|
|||||
|
1.00% to 1.99%
|
241,454
|
|
510,980
|
|
536,188
|
|
457,467
|
|
1,746,089
|
|
28.18
|
%
|
||||||||||
|
2.00% to 2.99%
|
149,399
|
|
50,378
|
|
132,573
|
|
567,828
|
|
900,178
|
|
14.53
|
%
|
||||||||||
|
3.00% to 3.99%
|
121,180
|
|
99,996
|
|
362,508
|
|
168,954
|
|
752,638
|
|
12.14
|
%
|
||||||||||
|
4.00% to 4.99%
|
427,043
|
|
116,881
|
|
37,434
|
|
5,628
|
|
586,986
|
|
9.47
|
%
|
||||||||||
|
5.00% and above
|
202,384
|
|
20,414
|
|
2,183
|
|
25,000
|
|
249,981
|
|
4.03
|
%
|
||||||||||
|
Total
|
$
|
2,551,731
|
|
$
|
1,267,463
|
|
$
|
1,152,795
|
|
$
|
1,225,330
|
|
$
|
6,197,319
|
|
100.00
|
%
|
|||||
The following table sets forth the Association’s time deposits classified by interest rate at the dates indicated.
|
|
At September 30,
|
||||||||||
|
|
2012
|
2011
|
2010
|
||||||||
|
|
(In thousands)
|
||||||||||
|
Interest Rate
|
|||||||||||
|
0.99% and below
|
$
|
1,961,447
|
|
$
|
1,607,868
|
|
$
|
859,341
|
|
||
|
1.00% to 1.99%
|
1,746,089
|
|
1,229,567
|
|
1,767,511
|
|
|||||
|
2.00% to 2.99%
|
900,178
|
|
937,003
|
|
894,421
|
|
|||||
|
3.00% to 3.99%
|
752,638
|
|
803,268
|
|
970,218
|
|
|||||
|
4.00% to 4.99%
|
586,986
|
|
736,543
|
|
827,797
|
|
|||||
|
5.00% and above
|
249,981
|
|
743,589
|
|
984,297
|
|
|||||
|
Total
|
$
|
6,197,319
|
|
$
|
6,057,838
|
|
$
|
6,303,585
|
|
||
Borrowings.
At
September 30, 2012
, the Association had
$488.2 million
of borrowings from the FHLB of Cincinnati. During the fiscal year ended
September 30, 2012
, the Association’s only third party borrowings consisted of loans, commonly referred to as “advances,” from the FHLB of Cincinnati. Borrowings from the FHLB of Cincinnati are secured by the Association’s investment in the common stock of the FHLB of Cincinnati as well as by a blanket pledge of its mortgage portfolio not otherwise pledged. Our current, immediate additional borrowing capacity with the FHLB of Cincinnati is
$466.6 million
as limited by the amount of FHLB of Cincinnati common stock that we own. Based on the amount of collateral that is subject to the blanket pledge that secures advances, our capacity limit for additional borrowings from the FHLB of Cincinnati at
September 30, 2012
was
$4.22 billion
, subject to satisfaction of the FHLB of Cincinnati common stock ownership requirement. To satisfy the common stock ownership requirement, we would have to increase our ownership of FHLB of Cincinnati common stock by an additional
$75.0 million
. The ability to borrow from the Federal Reserve Discount Window is also available to the Association and is secured by a pledge of specific loans in the Association’s mortgage portfolio. At
September 30, 2012
, the Association had the capacity to borrow up to
$233.3 million
from the Federal Reserve Bank of Cleveland and had no amount outstanding as of that date.
37
The following table sets forth information concerning balances and interest rates on the Association’s borrowings at and for the periods shown:
|
|
At or For The Fiscal Years
Ended September 30,
|
||||||||||
|
|
2012
|
2011
|
2010
|
||||||||
|
|
(Dollars in thousands)
|
||||||||||
|
Balance at end of year
|
$
|
488,191
|
|
$
|
139,856
|
|
$
|
70,158
|
|
||
|
Average balance during year
|
$
|
359,666
|
|
$
|
123,570
|
|
$
|
70,009
|
|
||
|
Maximum outstanding at any month end
|
$
|
569,733
|
|
$
|
185,129
|
|
$
|
70,163
|
|
||
|
Weighted average interest rate at end of year
|
0.60
|
%
|
1.62
|
%
|
2.75
|
%
|
|||||
|
Average interest rate during year
|
0.71
|
%
|
1.62
|
%
|
2.75
|
%
|
|||||
Since September 30, 2010, when the level of the loan securitizations with Fannie Mae were substantially reduced and the proceeds from loan sales no longer provided a source of recurring liquidity, the Association has utilized borrowings from the FHLB of Cincinnati to manage its on-balance sheet liquidity. Beginning in September 2012, the Association began to more actively utilize borrowings from the FHLB of Cincinnati to replace maturing, high rate certificates of deposit at a lower cost.
Federal Taxation
General
.
The Company and the Association are subject to federal income taxation in the same general manner as other corporations, with certain exceptions. Prior to the completion of our initial public stock offering on April 20, 2007, the Company and the Association were included as part of Third Federal Savings, MHC’s consolidated tax group. However, upon completion of the offering, the Company and the Association are no longer a part of Third Federal Savings, MHC’s consolidated tax group because Third Federal Savings, MHC no longer owns at least 80% of the common stock of the Company. Beginning as of September 30, 2007 and for each subsequent fiscal year thereafter, the Company has filed consolidated tax returns with the Association, its wholly-owned subsidiary. During the fiscal year ended September 30, 2012, in connection with an audit of the Company’s consolidated federal tax returns that commenced on November 22, 2010, the Company reached a settlement with the Internal Revenue Service related to the timing of bad debt deductions on the federal tax returns of the Company and its subsidiaries for fiscal years ended 2008, 2009 and 2010. The following discussion of federal taxation is intended only to summarize certain pertinent federal income tax matters and is not a comprehensive description of the tax rules applicable to the Company or the Association.
Taxable Distributions and Recapture
.
Prior to 1996, bad debt reserves created prior to 1988 were subject to recapture into taxable income if the Association failed to meet certain thrift asset and definitional tests or made certain distributions. Tax law changes in 1996 eliminated thrift-related recapture rules. However, under current law, pre-1988 tax bad debt reserves remain subject to recapture if the Association makes certain non-dividend distributions, repurchases any of its common stock, pays dividends in excess of earnings and profits, or fails to qualify as a bank for tax purposes.
At
September 30, 2012
, the total federal pre-base year bad debt reserve of the Association was approximately $105.0 million.
Charitable Contribution Carryovers.
Federal income tax regulations limit charitable contribution deductions to 10% of taxable income. Unused charitable contribution deductions may be carried forward to the succeeding five taxable years. At
September 30, 2012
, the Company has no charitable contribution carryover.
State Taxation
Following its initial public stock offering in 2007, the Company converted from a qualified passive investment company domiciled in the State of Delaware to a qualified holding company in Ohio and is subject to Ohio tax levied on income. A significant majority of state taxes paid by the remaining entities in our corporate structure are also paid to the State of Ohio. The Association is subject to Ohio franchise tax based on equity capital plus certain reserve amounts. Total equity capital for this purpose is reduced by certain exempted assets. The resulting net taxable value of capital is taxed at a rate of 1.3%. The other Ohio subsidiaries of the Company are taxed on the greater of a tax based on net income or net worth. The State of Ohio
38
Department of Taxation is currently conducting an audit of the Association's Ohio Franchise Tax Returns for fiscal years ended September 30, 2009, 2010 and 2011.
SUPERVISION AND REGULATION
General
The Company is a savings and loan holding company, and is required to file certain reports with, is subject to examination by, and otherwise must comply with the rules and regulations of, the Board of Governors of the Federal Reserve System (“FRB”). The Company is also subject to the rules and regulations of the Securities and Exchange Commission under the federal securities laws.
The Association is a federal savings association that is currently examined and supervised by the Office of the Comptroller of the Currency (“OCC”) and the Consumer Financial Protection Bureau (“CFPB”), and is subject to examination by the Federal Deposit Insurance Corporation (“FDIC”). This regulation and supervision establishes a comprehensive framework of activities in which an institution may engage and is intended primarily for the protection of the FDIC’s deposit insurance fund and depositors. Under this system of federal regulation, financial institutions are periodically examined to ensure that they satisfy applicable standards with respect to their capital adequacy, assets, management, earnings, liquidity and sensitivity to market interest rates. Following completion of its examination, the federal agency critiques the institution’s operations and assigns its rating (known as an institution’s CAMELS rating). Under federal law, an institution may not disclose its CAMELS rating to the public. The Association also is a member of and owns stock in the FHLB of Cincinnati, which is one of the twelve regional banks in the Federal Home Loan Bank System. The Association also is regulated to a lesser extent by the FRB, governing reserves to be maintained against deposits and other matters. The OCC will examine the Association and prepare reports for the consideration of the Association’s board of directors on any operating deficiencies. The CFPB, which is discussed further in the
Federal Legislation
section that follows, has examination and enforcement authority over the Association. The Association’s relationship with its depositors and borrowers also is regulated to a great extent by federal law and, to a much lesser extent, state law, especially in matters concerning the ownership of deposit accounts and the form and content of the Association’s mortgage documents.
Any change in these laws or regulations, whether by the FDIC, the OCC, FRB, CFPB or Congress, could have a material adverse impact on the Company, the Association and their operations.
Certain statutes and regulations of the regulatory requirements that are applicable to the Association and the Company are described below. This description of statutes and regulations is not intended to be a complete explanation of such statutes and regulations and their effects on the Association and the Company, and is qualified in its entirety by reference to the actual statutes and regulations.
Dodd-Frank Act
The Dodd-Frank Wall Street Reform and Consumer Protection Act of 2010 (the “Dodd-Frank Act”), enacted on July 21, 2010, has changed bank regulation and the lending, investment, trading and operating activities of depository institutions and their holding companies. The Dodd-Frank Act eliminated our former primary federal regulator, the Office of Thrift Supervision, and required the Association to be regulated by the OCC (the primary federal regulator for national banks). The Dodd-Frank Act also authorized the FRB to supervise and regulate all savings and loan holding companies, including mutual holding companies and their mid-tier holding companies, like Third Federal Savings, MHC and the Company, in addition to bank holding companies that the FRB already regulated. Third Federal Savings, MHC will require the approval of the FRB before it may waive the receipt of any dividends from the Company under the standards specified in the Dodd-Frank Act and implementing FRB regulations. The Dodd-Frank Act also requires the FRB to set minimum capital levels for depository institution holding companies that are as stringent as those required for the insured depository subsidiaries, and the components of Tier 1 capital would be restricted to capital instruments that are currently considered to be Tier 1 capital for insured depository institutions. The legislation also establishes a floor for capital of insured depository institutions that cannot be lower than the standards in effect on July 21, 2010, and directs the federal banking regulators to implement new leverage and capital requirements within 18 months from the enactment of the Dodd-Frank Act that take into account off-balance sheet activities and other risks, including risks relating to securitized products and derivatives.
The Dodd-Frank Act also created the CFPB with substantial power to supervise and enforce consumer protection laws. The CFPB has broad rulemaking authority for a wide range of consumer protection laws that apply to all banks and savings institutions such as the Association, including the authority to prohibit “unfair, deceptive or abusive” acts and practices. The CFPB has examination and enforcement authority over all banks and savings institutions with more than $10 billion in assets. Banks and savings institutions with $10 billion or less in assets will be examined by their applicable federal bank regulators. The banking agencies are using June 30, 2011 financial information for purposes of initially determining CFPB authority. Since
39
the Association had more than $10.0 billion of total assets on that date, it is subject to CFPB examination and enforcement authority. The legislation also weakened the federal preemption available for national banks and federal savings associations, and gives state attorneys general the ability to enforce applicable federal consumer protection laws.
The legislation broadened the base for FDIC insurance assessments. Assessments are now based on the average consolidated total assets less tangible equity capital of a financial institution. The Dodd-Frank Act also permanently increased the maximum amount of deposit insurance for banks, savings institutions and credit unions to $250,000 per depositor, retroactive to January 1, 2008, and non-interest bearing transaction accounts have unlimited deposit insurance through December 31, 2012. The Dodd-Frank Act increased stockholder influence over boards of directors by requiring companies to give stockholders a non-binding vote on executive compensation and so-called “golden parachute” payments. The legislation also directs the FRB to promulgate rules prohibiting excessive compensation paid to bank holding company executives, regardless of whether the company is publicly traded. The Dodd-Frank Act provided for originators of certain securitized loans to retain a percentage of the risk for transferred loans, directed the FRB to regulate pricing of certain debit card interchange fees and contained a number of reforms related to mortgage origination. Many of the provisions of the Dodd-Frank Act have delayed effective dates and the legislation requires various federal agencies to promulgate numerous and extensive implementing regulations over the next several years. Although the substance and scope of these regulations cannot be completely determined at this time, it is expected that the legislation and implementing regulations has and will continue to increase our operating and compliance costs.
Federal Banking Regulation
Business Activities.
A federal savings association derives its lending and investment powers from the Home Owners’ Loan Act, as amended, and federal regulations. Under these laws and regulations, the Association may invest in mortgage loans secured by residential real estate without limitations as a percentage of assets, and may invest in non-residential real estate loans up to 400% of capital in the aggregate. The Association may also invest in commercial business loans up to 20% of assets in the aggregate and consumer loans up to 35% of assets in the aggregate, and in certain types of debt securities and certain other assets. An association also may establish subsidiaries that may engage in certain activities not otherwise permissible for an association, including real estate investment and securities and insurance brokerage. The Dodd-Frank Act authorized depository institutions to commence paying interest on business checking accounts, effective July 21, 2011.
Capital Requirements.
Federal regulations require savings associations to meet three minimum capital standards: a 1.5% tangible capital ratio, a 4% leverage ratio (3% for savings associations receiving the highest rating on the CAMELS rating system and meeting certain other requirements) and an 8% risk-based capital ratio.
The risk-based capital standard for savings associations requires the maintenance of Tier 1 (core) and total capital (which is defined as core capital and supplementary capital) to risk-weighted assets of at least 4% and 8%, respectively. In determining the amount of risk-weighted assets, all assets, including certain off-balance sheet assets, are multiplied by a risk-weight factor of 0% to 100% (or 200% for certain residual interests in transferred assets), assigned by the applicable regulatory agency, based on the risks believed inherent in the type of asset. Core capital is defined as common shareholders’ equity (including retained earnings), certain non-cumulative perpetual preferred stock and related surplus and minority interests in equity accounts of consolidated subsidiaries, less intangibles other than certain mortgage servicing rights and credit card relationships. The components of supplementary capital currently include cumulative preferred stock, long-term perpetual preferred stock, mandatory convertible securities, subordinated debt and intermediate preferred stock, the allowance for loan and lease losses limited to a maximum of 1.25% of risk-weighted assets and up to 45% of net unrealized gains on available-for-sale equity securities with readily determinable fair market values. Overall, the amount of supplementary capital included as part of total capital cannot exceed 100% of core capital. Additionally, a savings association that retains credit risk in connection with an asset sale may be required to maintain additional regulatory capital because of the recourse back to the savings association.
At
September 30, 2012
, the Association’s capital exceeded all applicable requirements.
The federal banking regulators have recently issued proposed rules that, if adopted, would significantly increase regulatory capital requirements. Among other things, the proposed rules would introduce a new minimum common equity tier 1 capital ratio of 4.5% of risk-weighted assets and increase the minimum Tier 1 capital risk-based capital ratio from 4.0% to 6.0% of risk-weighted assets. There would also be a new “capital conservation buffer” that would require an institution to hold an additional 2.5% of common equity tier 1 capital to risk-based assets in order to avoid restrictions on dividends and executive compensation. The proposed rules would impose stricter capital deduction requirements and incorporate and revise the current risk-weighting categories to increase risk sensitivity and require unrealized gains and losses on certain securities holding to be included for purposes of calculating certain capital requirements. If finalized, the new requirements would be phased in over a period of several years.
40
Loans-to-One Borrower.
Generally, a federal savings association may not make a loan or extend credit to a single or related group of borrowers in excess of 15% of unimpaired capital and surplus. An additional amount may be loaned, equal to 10% of unimpaired capital and surplus, if the loan is secured by readily marketable collateral, which generally does not include real estate. As of
September 30, 2012
, the Association was in compliance with the loans-to-one borrower limitations.
Qualified Thrift Lender Test.
As a federal savings association, the Association must satisfy the qualified thrift lender, or “QTL”, test. Under the QTL test, the Association must maintain at least 65% of its “portfolio assets” in “qualified thrift investments” (primarily residential mortgages and related investments, including mortgage-backed securities) in at least nine months of the most recent 12-month period. “Portfolio assets” generally means total assets of a savings institution, less the sum of specified liquid assets up to 20% of total assets, goodwill and other intangible assets, and the value of property used in the conduct of the savings association’s business.
The Association also may satisfy the QTL test by qualifying as a “domestic building and loan association” as defined in the Internal Revenue Code.
A savings association that fails the qualified thrift lender test must operate under specified restrictions. Under the Dodd-Frank Act, non-compliance with the QTL test may subject the Association to agency enforcement action for a violation of law. At
September 30, 2012
, the Association satisfied the QTL test.
Capital Distributions.
Federal regulations govern capital distributions by a federal savings association, which include cash dividends, stock repurchases and other transactions charged to the capital account. A federal savings association must file an application with the OCC for approval of a capital distribution if:
|
•
|
the total capital distributions for the applicable calendar year exceed the sum of the savings association’s net income for that year to date plus the savings association’s retained net income for the preceding two years;
|
|
•
|
the savings association would not be at least adequately capitalized following the distribution;
|
|
•
|
the distribution would violate any applicable statute, regulation, agreement or condition imposed by a regulator; or
|
|
•
|
the savings association is not eligible for expedited treatment of its filings.
|
Even if an application is not otherwise required, every savings association that is a subsidiary of a holding company must still file a notice with the FRB at least 30 days before the board of directors declares a dividend or approves a capital distribution.
The OCC and the FRB have established similar criteria for approving an application or notice, and may disapprove an application or notice if:
•
the savings association would be undercapitalized following the distribution;
•
the proposed capital distribution raises safety and soundness concerns; or
•
the capital distribution would violate a prohibition contained in any statute, regulation or agreement.
In addition, the Federal Deposit Insurance Act provides that an insured depository institution may not make any capital distribution, if the institution would be undercapitalized after the distribution.
There were no dividends paid to the Company by the Association or Third Capital during the years ended
September 30, 2012
,
2011
or
2010
.
In June 2010 the OTS, the Company’s former regulator, directed the Company to not declare or pay any cash dividend or other capital distributions or purchase, repurchase or redeem or commit to purchase, repurchase or redeem any of its equity stock without providing 45 days prior written notice to the Central Regional Director of the OTS and receiving the Regional Director’s written non-objection. This restriction continues to apply under the Company’s new regulator, the FRB.
Liquidity.
A federal savings association is required to maintain a sufficient amount of liquid assets to ensure its safe and sound operation.
Community Reinvestment Act and Fair Lending Laws.
All savings associations have a responsibility under the Community Reinvestment Act and federal regulations to help meet the credit needs of their communities, including low- and moderate-income neighborhoods. In connection with its examination of a federal savings association, the OCC is required to assess the savings association’s record of compliance with the Community Reinvestment Act. In addition, the Equal Credit Opportunity Act and the Fair Housing Act prohibit lenders from discriminating in their lending practices on the basis of characteristics specified in those statutes. A savings association’s failure to comply with the provisions of the Community
41
Reinvestment Act could, at a minimum, result in denial of certain corporate applications such as branches or mergers, or in restrictions on its activities. The failure to comply with the Equal Credit Opportunity Act and the Fair Housing Act could result in enforcement actions by the OCC, as well as other federal regulatory agencies and the Department of Justice.
The Association received a satisfactory Community Reinvestment Act rating in its most recent federal examination.
Transactions with Related Parties.
A federal savings association’s authority to engage in transactions with its affiliates is limited by FRB regulations and by Sections 23A and 23B of the Federal Reserve Act and its implementing Regulation W. An affiliate is a company that controls, is controlled by, or is under common control with an insured depository institution such as the Association. Third Federal Savings, MHC and the Company are affiliates of the Association. In general, loan transactions between an insured depository institution and its affiliates are subject to certain quantitative and collateral requirements. In this regard, transactions between an insured depository institution and its affiliates are limited to 10% of the institution’s unimpaired capital and unimpaired surplus for transactions with any one affiliate and 20% of unimpaired capital and unimpaired surplus for transactions in the aggregate with all affiliates. Collateral in specified amounts ranging from 100% to 130% of the amount of the transaction must usually be provided by affiliates in order to receive loans from the savings association. In addition, federal regulations prohibit a savings association from lending to any of its affiliates that are engaged in activities that are not permissible for bank holding companies and from purchasing the securities of any affiliate, other than a subsidiary. Finally, transactions with affiliates must be consistent with safe and sound banking practices, not involve low-quality assets and be on terms that are as favorable to the institution as comparable transactions with non-affiliates. Savings associations are required to maintain detailed records of all transactions with affiliates.
The Association’s authority to extend credit to its directors, executive officers and 10% shareholders, as well as to entities controlled by such persons, is currently governed by the requirements of Sections 22(g) and 22(h) of the Federal Reserve Act and Regulation O of the Federal Reserve Board. Among other things, these provisions require that extensions of credit to insiders:
|
(i)
|
are subject to certain exceptions for loan programs made available to all employees, be made on terms that are substantially the same as, and follow credit underwriting procedures that are not less stringent than, those prevailing for comparable transactions with unaffiliated persons and that do not involve more than the normal risk of repayment or present other unfavorable features, and
|
|
(ii)
|
do not exceed certain limitations on the amount of credit extended to such persons, individually and in the aggregate, which limits are based, in part, on the amount of the Association’s capital.
|
In addition, extensions of credit in excess of certain limits must be approved by the Association’s board of directors.
Enforcement.
The OCC has primary enforcement responsibility over federal savings institutions and has the authority to bring enforcement action against all “institution-affiliated parties,” including shareholders, and attorneys, appraisers and accountants who knowingly or recklessly participate in wrongful action likely to have an adverse effect on an insured institution. Formal enforcement action by the OCC may range from the issuance of a capital directive or cease and desist order, to removal of officers and/or directors of the institution and the appointment of a receiver or conservator. Civil penalties cover a wide range of violations and actions, and range up to $25,000 per day, unless a finding of reckless disregard is made, in which case penalties may be as high as $1 million per day. The FDIC also has the authority to terminate deposit insurance or to recommend to the OCC that enforcement action be taken with respect to a particular savings institution. If action is not taken by the OCC, the FDIC has authority to take action under specified circumstances.
Standards for Safety and Soundness.
Federal law requires each federal banking agency to prescribe certain standards for all insured depository institutions. These standards relate to, among other things, internal controls, information systems and audit systems, loan documentation, credit underwriting, interest rate risk exposure, asset growth, compensation, and other operational and managerial standards as the agency deems appropriate. The federal banking agencies adopted Interagency Guidelines Prescribing Standards for Safety and Soundness to implement the safety and soundness standards required under federal law. The guidelines set forth the safety and soundness standards that the federal banking agencies use to identify and address problems at insured depository institutions before capital becomes impaired. If the appropriate federal banking agency determines that an institution fails to meet any standard prescribed by the guidelines, the agency may require the institution to submit to the agency an acceptable plan to achieve compliance with the standard. If an institution fails to meet these standards, the appropriate federal banking agency may require the institution to submit a compliance plan. On June 11, 2010, the OTS, the Association’s former regulator, notified the Company that it had failed to develop appropriate credit administration and account management procedures and acceptable loss mitigation processes to correspond with the growth in its home equity line of credit portfolio. The OTS concluded that these procedural deficiencies constituted an unsafe and unsound condition and directed the Company, as well as the Association and Third Federal Savings, MHC, not to declare or pay any cash dividends or other capital distributions or purchase, repurchase or redeem or commit to purchase, repurchase or redeem any of the
42
Company’s equity stock without providing 45 days prior written notice to the Regional Director of the OTS and receiving the Regional Director’s written non-objection. Further, the OTS advised the Company that until the Association satisfactorily addressed the problems associated with the home equity line of credit portfolio, the OTS would remove the Association from the FDIC’s prospective bidders list. These restrictions have continued to exist since the change in the Association’s and Company’s federal regulators.
Prompt Corrective Action Regulations
.
Under the prompt corrective action regulations, the OCC is required and authorized to take supervisory actions against undercapitalized savings associations. For this purpose, a savings association is placed in one of the following five categories based on the savings association’s capital:
|
•
|
well-capitalized (at least 5% leverage capital, 6% Tier 1 risk-based capital and 10% total risk-based capital, and is not subject to any written agreement, order, capital directive or prompt corrective action directive issued under certain statutes and regulations, to maintain a specific capital level for any capital measure);
|
|
•
|
adequately capitalized (at least 4% leverage capital (3% for savings banks with a composite examination rating of 1), 4% Tier 1 risk-based capital and 8% total risk-based capital);
|
|
•
|
undercapitalized (less than 4% leverage capital (3% for savings banks with a composite examination rating of 1), 4% Tier 1 risk-based capital or 8% total risk-based capital);
|
|
•
|
significantly undercapitalized (less than 3% leverage capital, 3% Tier 1 risk-based capital or 6% total risk-based capital); and
|
|
•
|
critically undercapitalized (less than 2% tangible capital).
|
The recently proposed rules that would increase regulatory capital requirements would, if adopted, adjust the prompt corrective actions categories accordingly.
Generally, the banking regulator is required to appoint a receiver or conservator for a savings association that is “critically undercapitalized” within specific time frames. The regulations also provide that a capital restoration plan must be filed with the OCC within 45 days of the date a savings association receives notice that it is “undercapitalized,” “significantly undercapitalized” or “critically undercapitalized.” The criteria for an acceptable capital restoration plan include, among other things, the establishment of the methodology and assumptions for attaining adequately capitalized status on an annual basis, procedures for ensuring compliance with restrictions imposed by applicable federal regulations, the identification of the types and levels of activities the savings association will engage in while the capital restoration plan is in effect, and assurances that the capital restoration plan will not appreciably increase the current risk profile of the savings association. Any holding company for a savings association required to submit a capital restoration plan must guarantee the lesser of an amount equal to 5% of the savings association’s assets at the time it was notified or deemed to be undercapitalized by the OCC, or the amount necessary to restore the savings association to adequately capitalized status. This guarantee remains in place until the OCC notifies the savings association that it has maintained adequately capitalized status for each of four consecutive calendar quarters, and the OCC has the authority to require payment and collect payment under the guarantee. Failure by a holding company to provide the required guarantee will result in certain operating restrictions on the savings association, such as restrictions on the ability to declare and pay dividends, pay executive compensation and management fees, and increase assets or expand operations. The OCC may also take any one of a number of discretionary supervisory actions against undercapitalized associations, including the issuance of a capital directive and the replacement of senior executive officers and directors.
As of
September 30, 2012
the Association exceeded all regulatory requirements to be considered “Well Capitalized” as presented in the table below (dollar amounts in thousands).
|
|
Actual
|
Required (Well Capitalized)
|
|||||||||||
|
|
Amount
|
Ratio
|
Amount
|
Ratio
|
|||||||||
|
Total Capital to Risk Weighted Assets
|
$
|
1,618,653
|
|
22.19
|
%
|
$
|
729,482
|
|
10.00
|
%
|
|||
|
Core Capital to Adjusted Tangible Assets
|
1,527,353
|
|
13.31
|
%
|
573,637
|
|
5.00
|
%
|
|||||
|
Tier I Capital to Risk-Weighted Assets
|
1,527,353
|
|
20.94
|
%
|
437,689
|
|
6.00
|
%
|
|||||
Insurance of Deposit Accounts.
The Dodd-Frank Act permanently increased the maximum amount of deposit insurance for banks, savings institutions and credit unions to $250,000 per depositor, retroactive to January 1, 2009. Also, under the Dodd-Frank Act, noninterest-bearing checking accounts have unlimited deposit insurance through December 31, 2012.
On November 12, 2009, the FDIC approved a final rule requiring insured depository institutions to prepay, on December 30, 2009, their estimated quarterly risk-based assessments for the fourth calendar quarter of 2009, and for all of the
43
calendar years 2010, 2011, and 2012. Estimated assessments for the fourth calendar quarter of 2009 and for all of calendar year 2010 were based upon the assessment rate in effect on September 30, 2009, with three basis points added for the calendar years 2011 and 2012 assessment rates. In addition, a 5% annual growth in the assessment base was assumed. Prepaid assessments are to be applied against the actual quarterly assessments until exhausted, and may not be applied to any special assessments that may occur in the future. Any unused prepayments will be returned to the institution on June 30, 2013. On December 30, 2009, the Association prepaid $51.9 million in estimated assessment fees for the fourth calendar quarter of 2009 through calendar year end 2012.
Effective April 1, 2011, the FDIC implemented a requirement of the Dodd-Frank Act to revise its assessment system to base the assessments on each institution’s total assets less Tier 1 capital, instead of deposits. The FDIC also revised its assessment schedule so that it ranges from 2.5 basis points for the least risky institutions to 45 basis points for the riskiest. Institutions with over $10 billion of total assets, such as the Association, are classified for assessment purposes as "Large Institutions", and unless otherwise classified, are subjected to a large institution pricing system that includes a separate “scorecard” methodology, also adopted in 2011.
Insurance of deposits may be terminated by the FDIC upon a finding that an institution has engaged in unsafe or unsound practices, is in an unsafe or unsound condition to continue operations or has violated any applicable law, regulation, rule, order or condition imposed by the Federal Deposit Insurance Corporation. The Association does not believe that it is taking, or is subject to, any action, condition or violation that could lead to termination of its deposit insurance.
All FDIC-insured institutions are required to pay a pro rata portion of the interest due on obligations issued by the Financing Corporation (“FICO”) for anticipated payments, issuance costs and custodial fees on bonds issued by the FICO in the 1980s to recapitalize the Federal Savings and Loan Insurance Corporation. The bonds issued by the FICO are due to mature in 2017 through 2019. For the quarter ended
September 30, 2012
, the annualized FICO assessment was equal to 0.66 basis points of total assets less Tier 1 capital. Assessments related to the FICO bond obligations were not subject to the December 30, 2009 prepayment.The Dodd-Frank Act increased the minimum target ratio for the Deposit Insurance Fund from 1.15% of estimated insured deposits to 1.35% of estimated insured deposits. The FDIC must seek to achieve the 1.35% ratio by September 30, 2020. Insured institutions with assets of $10 billion or more are supposed to fund the increase. The Dodd-Frank Act eliminated the 1.5% maximum fund ratio, instead leaving it to the discretion of the FDIC and the FDIC has exercised that discretion by establishing a long-term fund ratio of 2%.
For the fiscal year ended
September 30, 2012
, the Association paid $629 thousand related to the FICO bonds. No payments were made during fiscal
2012
pertaining to deposit insurance assessments, as estimated deposit insurance assessments were prepaid in December 2009, for calendar years 2010 through 2012. The remaining balance of the Association's prepaid insurance assessments was
$12.1 million
at
September 30, 2012
.
Prohibitions Against Tying Arrangements
.
Federal savings associations are prohibited, subject to some exceptions, from extending credit to or offering any other service, or fixing or varying the consideration for such extension of credit or service, on the condition that the customer obtain some additional service from the institution or its affiliates or not obtain services of a competitor of the institution.
Federal Home Loan Bank System.
The Association is a member of the Federal Home Loan Bank System, which consists of 12 regional Federal Home Loan Banks. The Federal Home Loan Bank System provides a central credit facility primarily for member institutions. As a member of the FHLB of Cincinnati, the Association is required to acquire and hold shares of capital stock in the Federal Home Loan Bank.
As of
September 30, 2012
, outstanding borrowings (including accrued interest) from the FHLB of Cincinnati were
$488.2 million
and the Association was in compliance with the stock investment requirement.
Other Regulations
Interest and other charges collected or contracted for by the Association are subject to state usury laws and federal laws concerning interest rates. The Association’s operations are also subject to federal laws applicable to credit transactions, such as the:
|
•
|
Truth-In-Lending Act, governing disclosures of credit terms to consumer borrowers;
|
|
•
|
Home Mortgage Disclosure Act, requiring financial institutions to provide information to enable the public and public officials to determine whether a financial institution is fulfilling its obligation to help meet the housing needs of the community it serves;
|
44
|
•
|
Equal Credit Opportunity Act, prohibiting discrimination on the basis of race, creed or other prohibited factors in extending credit;
|
|
•
|
Fair Credit Reporting Act, governing the use and provision of information to credit reporting agencies;
|
|
•
|
Fair Debt Collection Act, governing the manner in which consumer debts may be collected by collection agencies; and
|
|
•
|
rules and regulations of the various federal agencies charged with the responsibility of implementing such federal laws.
|
The operations of the Association also are subject to:
|
•
|
The Right to Financial Privacy Act, which imposes a duty to maintain confidentiality of consumer financial records and prescribes procedures for complying with administrative subpoenas of financial records;
|
|
•
|
The Electronic Funds Transfer Act and Regulation E promulgated thereunder, which govern automatic deposits to and withdrawals from deposit accounts and customers’ rights and liabilities arising from the use of automated teller machines and other electronic banking services;
|
|
•
|
The Check Clearing for the 21
st
Century Act (also known as “Check 21”), which gives “substitute checks,” such as digital check images and copies made from those images, the same legal standing as the original paper check;
|
|
•
|
Title III of The Uniting and Strengthening America by Providing Appropriate Tools Required to Intercept and Obstruct Terrorism Act of 2001 (referred to as the “USA PATRIOT Act”), which significantly expanded the responsibilities of financial institutions, including savings associations, in preventing the use of the U.S. financial system to fund terrorist activities. Among other provisions, the USA PATRIOT Act and the related regulations of the OCC require savings associations operating in the United States to develop new anti-money laundering compliance programs, due diligence policies and controls to ensure the detection and reporting of money laundering. Such compliance programs are intended to supplement existing compliance requirements, also applicable to financial institutions, under the Bank Secrecy Act and the Office of Foreign Assets Control Regulations; and
|
|
•
|
The Gramm-Leach-Bliley Act, which placed limitations on the sharing of consumer financial information by financial institutions with unaffiliated third parties. Specifically, the Gramm-Leach-Bliley Act requires all financial institutions offering financial products or services to retail customers to provide such customers with the financial institution’s privacy policy and provide such customers the opportunity to “opt out” of the sharing of certain personal financial information with unaffiliated third parties.
|
Holding Company Regulation
General
. Third Federal Savings, MHC, and the Company are non-diversified savings and loan holding companies within the meaning of the Home Owners’ Loan Act. As such, Third Federal Savings, MHC and the Company are registered with the FRB and subject to FRB regulations, examinations, supervision and reporting requirements. In addition, the FRB has enforcement authority over Third Federal Savings, MHC, the Company and the Association. Among other things, this authority permits the FRB to restrict or prohibit activities that are determined to be a serious risk to the Association. As federal corporations, Third Federal Savings, MHC and the Company are generally not subject to state business organization laws.
Permitted Activities
. Pursuant to Section 10(o) of the Home Owners’ Loan Act and FRB regulations, a mutual holding company, such as Third Federal Savings, MHC and its mid-tier companies, such as the Company, may, with appropriate regulatory approval, engage in the following activities:
|
(i)
|
investing in the stock of a savings association;
|
|
(ii)
|
acquiring a mutual association through the merger of such association into a savings association subsidiary of such holding company or an interim savings association subsidiary of such holding company;
|
|
(iii)
|
merging with or acquiring another holding company, one of whose subsidiaries is a savings association;
|
|
(iv)
|
investing in a corporation, the capital stock of which is available for purchase by a savings association under federal law or under the law of any state where the subsidiary savings association has its home offices;
|
|
(v)
|
furnishing or performing management services for a savings association subsidiary of such company;
|
|
(vi)
|
holding, managing or liquidating assets owned or acquired from a savings association subsidiary of such company;
|
|
(vii)
|
holding or managing properties used or occupied by a savings association subsidiary of such company
|
|
(viii)
|
acting as trustee under deeds of trust;
|
|
(ix)
|
any other activity:
|
45
|
(A)
|
that the FRB, by regulation, has determined to be permissible for bank holding companies under Section 4(c) of the Bank Holding Company Act of 1956, unless the Director, by regulation, prohibits or limits any such activity for savings and loan holding companies; or
|
|
(B)
|
in which multiple savings and loan holding companies were authorized (by regulation) to directly engage on March 5, 1987;
|
(x) if the savings and loan holding company meets the criteria to qualify as a financial holding company, any activity permissible for financial holding companies under Section 4(k) of the Bank Holding Company Act, including securities and insurance underwriting; and
(xi) purchasing, holding, or disposing of stock acquired in connection with a qualified stock issuance if the purchase of such stock by such savings and loan holding company is approved by the Director. If a mutual holding company acquires or merges with another holding company, the holding company acquired or the holding company resulting from such merger or acquisition may only invest in assets and engage in activities listed in (i) through (x) above, and has a period of two years to cease any nonconforming activities and divest any nonconforming investments.
The Home Owners’ Loan Act prohibits a savings and loan holding company, including the Company, directly or indirectly, or through one or more subsidiaries, from acquiring more than 5% of another savings institution or holding company thereof, without prior written approval of the FRB. It also prohibits the acquisition or retention of, with certain exceptions, more than 5% of a non-subsidiary company engaged in activities other than those permitted by the Home Owners’ Loan Act or acquiring or retaining control of an institution that is not federally insured. In evaluating applications by holding companies to acquire savings institutions, the FRB must consider the financial and managerial resources, future prospects of the company and institution involved, the effect of the acquisition on the risk to the federal deposit insurance fund, the convenience and needs of the community and competitive factors.
The FRB is prohibited from approving any acquisition that would result in a multiple savings and loan holding company controlling savings institutions in more than one state, subject to two exceptions:
|
(i)
|
the approval of interstate supervisory acquisitions by savings and loan holding companies; and
|
|
(ii)
|
the acquisition of a savings institution in another state if the laws of the state of the target savings institution specifically permit such acquisition.
|
The states vary in the extent to which they permit interstate savings and loan holding company acquisitions.
Capital.
Savings and loan holding companies are not currently subject to specific regulatory capital requirements. The Dodd-Frank Act, however, requires the FRB to promulgate consolidated capital requirements for depository institution holding companies that are no less stringent, both quantitatively and in terms of components of capital, than those applicable to depository institutions themselves. Instruments such as cumulative preferred stock and trust preferred securities will no longer be includable as Tier 1 capital, as is currently permitted for bank holding companies. There is a five-year transition period (from the July 21, 2010 effective date of the Dodd-Frank Act) before the capital requirements should apply to savings and loan holding companies. However, the recent proposed rule that would establish such regulatory capital requirements for savings and loan holding companies failed to acknowledge either the grandfather for trust preferred securities or the five-year transition period for application of the capital requirements to savings and loan holding companies. It is therefore uncertain whether the FRB will implement the statutory grandfather and transitional period.
Dividends
and Repurchases.
The FRB has issued a policy statement regarding the payment of dividends and the repurchase of shares of common stock by bank holding companies that it has made applicable to savings and loan holding companies as well. In general, the policy provides that dividends should be paid only out of current earnings and only if the prospective rate of earnings retention by the holding company appears consistent with the organization's capital needs, asset quality and overall financial condition. Regulatory guidance provides for prior regulatory review of capital distributions in certain circumstances such as where the company's net income for the past four quarters, net of dividends previously paid over that period, is insufficient to fully fund the dividend or the company's overall rate of earnings retention is inconsistent with the company's capital needs and overall financial condition. The ability of a holding company to pay dividends may be restricted if a subsidiary bank becomes undercapitalized. The policy statement also provides for regulatory review prior to a holding company redeeming or repurchasing regulatory capital instruments when the holding company is experiencing financial weaknesses or redeeming or repurchasing common stock or perpetual preferred stock that would result in a net reduction as of the end of a quarter in the amount of such equity instruments outstanding compared with the beginning of the quarter in which the redemption or repurchase occurred. These regulatory policies could affect the ability of the Company to pay dividends, repurchase shares of common stock or otherwise engage in capital distributions.
46
Source of Strength.
The Dodd-Frank Act extended the “source of strength” doctrine to savings and loan holding companies. The regulatory agencies must issue regulations requiring that all bank and savings and loan holding companies serve as a source of strength to their subsidiary depository institutions by providing capital, liquidity and other support in times of financial stress.
Waivers of Dividends by Third Federal Savings, MHC
.
Federal regulations require Third Federal Savings, MHC to notify the FRB of any proposed waiver of its receipt of dividends from the Company. The OTS, the previous regulator for Third Federal Savings, MHC, allowed dividend waivers provided the mutual holding company’s board of directors determined that the waiver was consistent with its fiduciary duties and the waiver would not be detrimental to the safety and soundness of its subsidiary institution. In February 2008, the Company declared its first quarterly dividend and continued to declare and pay quarterly dividends through May 2010, when the Company suspended future dividend payments until concerns expressed by OTS regarding the Association’s home equity line of credit portfolio were satisfactorily resolved. Prior to the suspension of the dividends, Third Federal Savings, MHC waived its right to receive each dividend paid by the Company. The FRB has recently issued an interim final rule pursuant to a Dodd-Frank Act, providing that the FRB “may not” object to dividend waivers by grandfathered mutual holding companies, such as Third Federal Savings, MHC, under standards substantially similar to those previously required by the OTS. However, the interim final rule added a requirement that a majority of the mutual holding company’s members eligible to vote must approve a dividend waiver by a mutual holding company within 12 months prior to the declaration of the dividend being waived. The FRB is reviewing comments on the interim final rule as part of its rulemaking process, and there can be no assurance that the final rule will not require such a member vote.
Conversion of Third Federal Savings, MHC to Stock Form
.
Federal regulations permit Third Federal Savings, MHC to convert from the mutual form of organization to the capital stock form of organization (a “Conversion Transaction”). There can be no assurance when, if ever, a Conversion Transaction will occur, and the Board of Directors has no current intention or plan to undertake a Conversion Transaction. In a Conversion Transaction, a new stock holding company would be formed as the successor to the Company, Third Federal Savings, MHC’s corporate existence would end, and certain depositors of the Association would receive the right to subscribe for additional shares of common stock of the new holding company. In a Conversion Transaction, each share of common stock held by stockholders other than Third Federal Savings, MHC (“Minority Stockholders”) would be automatically converted into a number of shares of common stock of the new holding company determined pursuant to an exchange ratio that ensures that Minority Stockholders own the same percentage of common stock in the new holding company as they owned in the Company immediately prior to the Conversion Transaction. Under a provision of the Dodd-Frank Act applicable to Third Federal Savings, MHC, Minority Stockholders should not be diluted because of any dividends waived by Third Federal Savings, MHC (and waived dividends should not be considered in determining an appropriate exchange ratio), in the event Third Federal Savings, MHC converts to stock form. Any such Conversion Transaction would require various member and stockholder approvals, as well as regulatory approval.
Sarbanes-Oxley Act of 2002
The Sarbanes-Oxley Act of 2002 and related regulations address, among other issues, corporate governance, auditing and accounting, executive compensation, and enhanced and timely disclosure of corporate information. We have prepared policies, procedures and systems designed to ensure compliance with these regulations.
47
|
Item 1A.
|
Risk Factors
|
Future changes in interest rates could reduce our net income.
Our net income largely depends on our net interest income, which could be negatively affected by changes in interest rates. Net interest income is the difference between the interest income we earn on our interest-earning assets, such as loans and securities, and the interest we pay on our interest-bearing liabilities, such as deposits and borrowings.
The vast majority of our assets and liabilities are financial in nature, and as a result, changes in market and competitive interest rates can impact our customers’ actions as well as the types and amount of business opportunities that are available to us. In general, when changes occur in interest rates that prompt our customers to pursue strategies that are beneficial to them, the results are generally unfavorable for us.
For example, if mortgage interest rates decline, our customers may seek to refinance, without penalty, their mortgage loans with us or repay their mortgage loans with us and borrow from another lender. When that happens, either the yield that we earn on the customer’s loan is reduced (if the customer refinances with us) or the mortgage is paid off and we are faced with the challenge of reinvesting the cash received to repay the mortgage in a lower interest rate environment. This is frequently referred to as reinvestment risk, which is the risk that we may not be able to reinvest the proceeds of loan prepayments at rates that are comparable to the rates we earned on the loans prior to receipt of the repayment. This risk also exists with the securities in our investment portfolio that are backed by mortgage loans.
Another example of changes in interest rates that can have an unfavorable impact on our net interest income occurs in situations where interest rates paid on certificates of deposit experience a significant increase. In this circumstance, a certificate of deposit customer may determine that it is in his/her best interest to incur the existing penalty for early withdrawal, tender the certificate for cash and either reinvest the proceeds in a new certificate of deposit with us, or withdraw the funds and leave us. As a result, we either establish a new, higher rate certificate (if the customer stays with us) or we must fund the customer’s withdrawal by: (1) reducing our cash reserves; (2) selling assets to generate cash to fund the withdrawal; (3) attracting deposits from another customer at the then-higher interest rate; or (4) borrowing from a wholesale lender like the FHLB of Cincinnati, again at the then-higher interest rate. Each of these alternatives can have an unfavorable impact on us.
Our net interest income can also be negatively impacted when assets and funding sources with seemingly similar, but not identical re-pricing characteristics react differently to changing interest rates. An example is our home equity lines of credit loan portfolio and our high yield checking and high yield savings deposit products. Interest rates charged on our home equity lines of credit loans are linked to the prime rate of interest, which generally adjusts in a direct relationship to changes in the Federal Reserve’s Federal Funds target rate. Similarly, our High Yield Checking and High Yield Savings deposit products are generally expected to adjust when changes are made to the Federal Funds target rate. However, to the extent that reductions are made to the Federal Funds target rate, and those reductions translate into reductions of the prime rate and the rate charged on our home equity lines of credit loans, but do not extend to equivalent adjustments to our High Yield Checking and High Yield Savings deposit products, we will experience a reduction in our net interest income. At
September 30, 2012
, we held
$2.16 billion
of home equity lines of credit loans and
$2.58 billion
of High Yield Checking and High Yield Savings deposits.
Our net income can also be reduced by the impact that changes in interest rates can have on the value of our capitalized mortgage servicing rights. As of
September 30, 2012
, we serviced
$3.81 billion
of loans sold to third parties, and the mortgage servicing rights associated with such loans had an amortized cost of
$19.6 million
and an estimated fair value, at that date, of
$25.3 million
. Because the estimated life and estimated income from the underlying mortgage loans generally increase with rising interest rates and decrease with falling interest rates, the value of mortgage servicing rights generally increases as interest rates rise and decreases as interest rates fall.
In general, changes in market and competitive interest rates result from events that we do not control and over which we generally have little or no influence. As a result, mitigation of the adverse affects of changing interest rates is generally limited to controlling the composition of the assets and liabilities that we hold. To monitor our positions, we maintain an interest rate risk modeling system which is designed to measure our interest rate risk sensitivity. Using customized modeling software, the Association prepares periodic estimates of the amounts by which the net present value of its cash flows from assets, liabilities and off balance sheet items (the institution’s economic value of equity or “EVE”) would change in the event of a range of assumed changes in market interest rates. The simulation model uses a discounted cash flow analysis and an option-based pricing approach in measuring the interest rate sensitivity of EVE. At
September 30, 2012
, in the event of an immediate 200 basis point increase in all interest rates, our model projects that we would experience a
$471.4 million
, or
26%
,
decrease
in EVE. Our calculations further project that, at
September 30, 2012
, in the event of an immediate 200 basis point increase in all interest rates, we would expect our projected net interest income for the twelve months ended September 30,
2013
to
decrease
by
12%
. See “Item 7A. Quantitative and Qualitative Disclosures about Market Risk.”
48
Historically low interest rates may adversely affect our net interest income and profitability.
During the past several years it has been the policy of the Board of Governors of the Federal Reserve System to maintain interest rates at historically low levels through its targeted federal funds rate and the purchase of mortgage-backed securities. As a result, market rates on the loans we have originated and the yields on securities we have purchased have been at lower levels than available prior to 2008. This has been a significant factor in the decrease in the amount of our interest income to
$417.9 million
for the fiscal year ended
September 30, 2012
from
$427.5 million
for the fiscal year ended
September 30, 2011
and from $550.2 million for the fiscal year ended September 30, 2008. As a general matter, our interest-bearing liabilities reprice or mature more quickly than our interest-earning assets, which has generally resulted in progressive increases in net interest income since 2008. However, because interest rates have been low for so long, our ability to further lower our interest expense may become increasingly difficult while the average yield on our interest-earning assets may continue to decrease. The Board of Governors of the Federal Reserve System has indicated its intention to maintain low interest rates in the near future. Accordingly, our net interest income (the difference between interest income earned on assets and interest expense paid on liabilities) may be adversely affected which may have an adverse effect on our profitability.
Our ability to reduce interest rate risk has been adversely affected by the fact that the Association no longer sells long-term fixed-rate residential loans to Fannie Mae and we continue to experience decreases in the balance of our home equity line of credit portfolio.
Effective July 1, 2010, Fannie Mae, historically the Association’s primary loan investor, promulgated certain loan origination requirement changes affecting loan eligibility that, to date, we have not fully adopted. Accordingly, the Association’s ability to reduce interest rate risk via our traditional sales of longer-term fixed-rate residential loans is limited until either the Association changes its loan origination processes or Fannie Mae revises its loan eligibility standards. In the absence of such changes, and except for certain specific circumstances as described below, future sales of longer-term fixed-rate mortgage loans will be predominantly limited to those loans that have established payment histories, strong borrower credit profiles, are supported by adequate collateral values and are acceptable to market participants other than Fannie Mae. During the fiscal year ended
September 30, 2012
, we sold to Fannie Mae $11.4 million of longer-term fixed-rate residential loans compared to $13.3 million and $1.03 billion during the fiscal years ended
September 30, 2011
and
2010
, respectively. Sales to other market participants totaled $20.3 million during the fiscal year ended September 30, 2011. During the fiscal years ended September 30, 2012 and 2010, all sales were to Fannie Mae and none were to other market participants.
Because it is no longer selling loans to Fannie Mae, the Association is also generating less non-interest income. During the fiscal years ended
September 30, 2012
and
2011
, we realized net gains on the sale of loans of
$688 thousand
and
$490 thousand
, respectively, compared to net gains on the sale of loans of $25.3 million during the fiscal year ended September 30, 2010. The Association’s ability to reduce interest rate risk exposure may be further compromised as, beginning in June 2010 and extending into March 2012, the Association suspended the origination of new home equity lending account relationships. Effective in March 2012, the Association began to offer, on a limited basis, new home equity lending products only to existing home equity lines of credit customers whose current accounts had, or were about to enter into repayment. This change has had the effect of only slightly slowing the pace of the reduction in the home equity lending portfolio. While we have been originating SmartRate adjustable-rate mortgages, since July 2010, which have improved interest rate characteristics as compared to long-term fixed-rate mortgages, the production volume of such loans may be insufficient to offset the increased interest rate risk resulting from the Association no longer selling loans to Fannie Mae.
Each of the Association, the Company and Third Federal Savings, MHC entered into a memorandum of understanding with the OTS on February 7, 2011 that will entail compliance costs. Failure to comply with the memorandums of understanding could result in formal enforcement action or additional regulatory constraints on the Association, the Company or Third Federal Savings, MHC.
Prior to its merger into the Office of the Comptroller of the Currency (“OCC”) on July 21, 2011, the Office of Thrift Supervision (“OTS”) expressed concerns with the risk concentration and other aspects of the Association’s home equity loans and lines of credit portfolio and the administration of that portfolio. Under the terms of an August 13, 2010 memorandum of understanding (the “MOU”) between the Association and the OTS, management prepared, or obtained, and submitted to the OTS: (1) a third party report on our home equity lending portfolio; (2) a home equity lending reduction plan (the “Reduction Plan”); (3) enhanced home equity lending and credit risk management policies and procedures; and (4) an updated business plan. On December 27, 2010, notice was received from the OTS that it did not object to the Reduction Plan. The Reduction Plan spanned the period from June 30, 2010 through December 31, 2011. As of
September 30, 2012
, the Reduction Plan targets (a $1 billion reduction in home equity lending commitments, including a $300 million reduction in outstanding balances) had been met and exceeded as home equity lending commitments had been reduced by
$1.66 billion
billion, including
$749.5 million
in outstanding balances. Other elements of the Reduction Plan included: a $150 million capital infusion from the Company to the Association, which was completed in October, 2010, and implementation of expanded line management,
49
account management and collection processes regarding home equity lending. These process changes have been implemented and are subject to continuing enhancement. The ratio of the Association’s home equity loans and lines of credit portfolio and open commitments relative to Tier 1 Capital, plus the allowance for loan losses, was further reduced to
214
% at
September 30, 2012
from 247% at
September 30, 2011
. The December 31, 2011 targeted ratio as contained in the Reduction Plan was
261
%.
Effective February 7, 2011, the MOU was terminated and replaced by new memorandums of understanding (the “New MOU”) covering the Association, Third Federal Savings, MHC and the Company. The New MOU addressed the ongoing monitoring of issues raised in the original MOU. In addition, the New MOU required the following actions, all of which we have performed: (1) an independent assessment of the Association’s interest rate risk management policy and a plan to address any deficiencies (the assessment was submitted to the OTS on February 14, 2011); (2) an independent review of management compensation (the review was submitted to the OTS on June 30, 2011); (3) the submittal of an independent enterprise risk management study and a plan to address any deficiencies (the study and plan to address deficiencies were submitted to the OTS on February 11, 2011); (4) the submittal for OTS non-objection 45 days in advance of any plans for new debt, dividends or stock repurchases; (5) formal management and director succession plans (these plans were submitted to the OTS on March 30, 2011 and April 29, 2011, respectively); and (6) revisions to various operational policies (each of which has been completed). In a self-initiated effort, and prior to receipt of the New MOU, in September 2010, we engaged a third party to conduct an independent assessment of our interest rate risk management policy and our enterprise risk management approach. As indicated above, just days after receipt of the New MOU, the assessments were submitted to the OTS. Pursuant to recommendations of the assessments, we installed a new interest rate risk model that provides more customized analysis and we have established new board and management level committees to govern and oversee risk management and compliance. As indicated above, we believe that to date, we have complied with all of the stipulations of the MOU and New MOU. The requirements of the MOU and New MOU carry costs to complete which will continue to increase our non-interest expense in amounts that are not expected to, but may, be material to our results of operations. The Company does not intend to declare or pay a cash dividend, or to repurchase any of its outstanding common stock until the concerns of our regulators are resolved. The requirements of the New MOU will remain in effect until our primary regulator decides to terminate, suspend or modify them.
Negative developments in the financial industry and the domestic and international credit markets may adversely affect our operations and results.
Since the latter half of 2007, negative developments in the global credit and securitization markets have resulted in uncertainty in the financial markets and a lingering, general economic downturn which contributed to deteriorated loan portfolio quality at many institutions, including the Company. In addition, the value of real estate collateral supporting many home mortgages has declined and may continue to decline. Bank and bank holding company stock prices were negatively affected, as was the ability of banks and bank holding companies to raise capital or borrow in the debt markets. These negative developments along with the turmoil and uncertainties that have accompanied them have heavily influenced the formulation and enactment of the Dodd-Frank Act, along with its implications as described elsewhere in this
Risk Factors
section. In addition to the many future implementing rules and regulations of the Dodd-Frank Act, the potential exists for other new federal or state laws and regulations regarding lending and funding practices and liquidity standards to be enacted. Bank regulatory agencies are expected to continue to be active in responding to concerns and trends identified in examinations. Negative developments in the financial industry and the domestic and international credit markets, and the impact of new legislation in response to those developments, may negatively impact our operations by increasing our costs, restricting our business operations, including our ability to originate or sell loans, and adversely impact our financial performance. In addition, these risks could affect the value of our loan portfolio as well as the value of our investment portfolio, which would also negatively affect our financial performance.
The ratings downgrade of the United States Government may adversely affect the Company.
In July 2011, certain rating agencies placed the United States government’s long-term sovereign debt rating on their equivalent of negative watch and announced the possibility of a credit rating downgrade. In August 2011, one rating agency deceased its rating of the United States Government to AA+. The rating agencies, due to constraints related to the rating of the United States, also placed government-sponsored enterprises on negative watch. A downgrade of the United States credit rating would trigger a similar downgrade in the credit rating of these government-sponsored enterprises. Furthermore, the credit rating of other entities, such as state and local governments, may be downgraded if the United States’ credit rating is downgraded. The impact that these credit rating downgrades may have on the national and local economy and the Company’s financial condition and results of operations is uncertain.
Difficult market conditions have already affected us and our industry and may continue to do so.
Our performance is significantly impacted by the general economic conditions in our primary markets in the States of Ohio and Florida, and surrounding areas, which have been severely affected by recent and persisting economic issues. The continuation of difficult market conditions is likely to result in continued high levels of unemployment, which will further
50
weaken an already distressed local economy and could result in additional defaults of mortgage loans. Most of the loans in our loan portfolio are secured by real estate located in our primary market areas. Negative conditions, such as layoffs, in the markets where collateral for a mortgage loan is located could adversely affect a borrower’s ability to repay the loan and the value of the collateral securing the loan. Declines in the U.S. housing market manifested by falling home prices and increasing foreclosures, as well as unemployment and under-employment, have all negatively impacted the credit performance of mortgage loans and resulted in significant write-downs of asset values by financial institutions. These write-downs, initially of mortgage-backed securities but spreading to derivative and traditional securities, in turn, have caused many financial institutions to seek additional capital from private and government entities, to merge with larger and stronger financial institutions and, in some cases, fail. Our business, financial condition and results of operations could be adversely affected by recessionary or impaired recovery conditions that are longer or deeper than expected.
Reflecting concern about the stability of the financial markets generally, many lenders and institutional investors have reduced or ceased providing funding to borrowers, including other financial institutions. This market turmoil and tightening of credit have led to an increased level of commercial and consumer delinquencies, lack of consumer confidence, increased market volatility and widespread reduction of business activity generally. The resulting economic pressure on consumers and lack of confidence in the financial markets may adversely affect our business, financial condition and results of operations. We do not expect that the difficult conditions in the financial markets are likely to improve in the near future. A worsening of these conditions would likely exacerbate the adverse effects of these difficult market conditions on us and others in the financial industry. In particular, we may face the following risks in connection with these events:
|
•
|
We already face and we expect to continue to face increased regulation of our industry and compliance with such regulation may increase our costs and limit our ability to pursue business opportunities.
|
|
•
|
Our ability to assess the creditworthiness of our customers may be impaired if the models and approaches we use to select, manage, and underwrite our customers become less predictive of future behaviors.
|
|
•
|
The processes we use to estimate losses inherent in our credit exposure require difficult, subjective, and complex judgments, including forecasts of economic conditions and how these economic predictions might impair the ability of our borrowers to repay their loans, which may no longer be capable of viable estimation and which may, in turn, impact the reliability of the processes.
|
|
•
|
Our ability to engage in sales of mortgage loans to third parties (including mortgage loan securitization transactions with governmental entities) on favorable terms or at all could be adversely affected by further disruptions in the capital markets or other events, including deteriorating investor expectations.
|
|
•
|
Competition in our industry could intensify as a result of increasing consolidation of financial services companies in connection with current market conditions.
|
If our allowance for loan losses is not sufficient to cover actual loan losses, our earnings and capital could decrease.
We make various assumptions and judgments about the collectability of our loan portfolio, including the creditworthiness of our borrowers and the value of the real estate and other assets serving as collateral for the repayment of many of our loans. In determining the amount of the allowance for loan losses, we review our loans and our loss and delinquency experience, as well as the experience of other similarly situated institutions, and we evaluate other factors including, among other things, current economic conditions. If our assumptions are incorrect, or if delinquencies do not continue to improve or non-accrual and non-performing loans increase, our allowance for loan losses may not be sufficient to cover losses inherent in our loan portfolio, which would require additions to our allowance. Material additions to our allowance would materially decrease our net income.
In addition, bank regulators periodically review our allowance for loan losses and, based on information available to them at the time of their review, may require us to increase our allowance for loan losses or recognize further loan charge-offs. An increase in our allowance for loan losses or loan charge-offs as required by these regulatory authorities may have a material adverse effect on our financial condition and results of operations.
Financial reform legislation enacted by Congress in 2010, among other things, eliminated the Office of Thrift Supervision, tightened capital standards, created a new Consumer Financial Protection Bureau and resulted in new laws and regulations that are expected to increase our costs of operations.
Effective July 21, 2010, Congress enacted the Dodd-Frank Act. This law significantly changed the bank regulatory structure and affected the lending, deposit, investment, trading and operating activities of financial institutions and their holding companies. The Dodd-Frank Act required various federal agencies to adopt a broad range of new implementing rules and regulations, and to prepare numerous studies and reports for Congress. The federal agencies are given significant discretion in
51
drafting the implementing rules and regulations, and consequently, many of the details and much of the ultimate impact of the Dodd-Frank Act may not be known for many years.
Certain provisions of the Dodd-Frank Act have already impacted the Company. For example, on July 21, 2011, the Office of Thrift Supervision, which was the primary federal regulator for the Company and its subsidiary, the Association, was dissolved, and the Office of the Comptroller of the Currency, which is the primary federal regulator for national banks, became the primary federal regulator for federal thrifts. Also on that date, the Board of Governors of the Federal Reserve System (“Federal Reserve Board”) assumed supervisory and regulatory responsibilities for all savings and loan holding companies that were formerly regulated by the Office of Thrift Supervision, including the Company. Moreover, Third Federal Savings, MHC now requires the approval of the Federal Reserve Board before it may waive the receipt of any dividends from the Company, and there is no assurance that the Federal Reserve Board will approve future dividend waivers or what conditions it
may impose on such waivers. See the next risk factor
“—
Recently enacted financial reform legislation may have an adverse effect on our ability to pay dividends, which would adversely affect the value of our common stock.”
Also effective July 21, 2011 is a provision of the Dodd-Frank Act that eliminated the federal prohibitions on paying interest on demand deposits, thus allowing businesses to have interest bearing checking accounts. Depending on competitive responses, this significant change to existing law could have an adverse impact on the Company’s interest expense.
The Dodd-Frank Act also broadens the base for Federal Deposit Insurance Corporation insurance assessments. Assessments are based on the average consolidated total assets less tangible equity capital of a financial institution. The Dodd-Frank Act also permanently increased the maximum amount of deposit insurance for banks, savings institutions and credit unions to $250,000 per depositor, retroactive to January 1, 2009, and non-interest bearing transaction accounts have unlimited deposit insurance through December 31, 2013.
The Dodd-Frank Act requires publicly traded companies to give stockholders a non-binding vote on executive compensation and so-called “golden parachute” payments. The legislation also directs the Federal Reserve Board to promulgate rules prohibiting excessive compensation paid to bank holding company executives, regardless of whether the company is publicly traded or not.
The Dodd-Frank Act created a new Consumer Financial Protection Bureau with broad powers to supervise and enforce consumer protection laws. The Consumer Financial Protection Bureau has broad rule-making authority for a wide range of consumer protection laws that apply to all banks and savings institutions, including the authority to prohibit “unfair, deceptive or abusive” acts and practices. The Consumer Financial Protection Bureau has examination and enforcement authority over all banks and savings institutions with more than $10 billion in assets. The Dodd-Frank Act also weakens the federal preemption rules that have been applicable for national banks and federal savings associations, and gives state attorneys general the ability to enforce federal consumer protection laws.
It is not possible to predict at this time what specific impact the Dodd-Frank Act and the future implementing rules and regulations will have on community banks. However, it is expected that at a minimum they will increase our operating and compliance costs and could increase our interest expense.
Proposed revisions to align the risk-based and leverage capital computational framework used in the United States with the structure developed internationally (Basel III) may adversely impact the amount by which our capital exceeds current regulatory requirements.
The Association is subject to various regulatory capital requirements, including a risk-based capital measure. The risk-based capital guidelines include both a definition of capital and a framework for calculating risk-weighted assets by assigning balance sheet assets and off-balance sheet items to broad risk categories. On June 6, 2012, the OCC and the other federal bank regulatory agencies issued a series of proposed rules to revise their risk-based and leverage capital requirements and their method for calculating risk-weighted assets to make them consistent with the agreements that were reached by the Basel Committee on Banking Supervision in "Basel III: A Global Regulatory Framework for More Resilient Banks and Banking Systems" ("Basel III"). The proposed rules would apply to all depository institutions, top-tier bank holding companies with total consolidated assets of $500 million or more, and top-tier savings and loan holding companies ("banking organizations"). Among other things, the proposed rules establish a new common equity tier 1 (CET1) minimum capital requirement (4.5% of risk-weighted assets) and a higher minimum tier 1 capital requirement (from 4.0% to 6.0% of risk-weighted assets), and assign higher risk weightings (150%) to exposures that are more than 90 days past due or are on nonaccrual status and certain commercial real estate facilities that finance the acquisition, development or construction of real property.
When fully phased in, Basel III requires financial institutions to maintain: (a) as a newly adopted international standard, a minimum ratio of CET1 to risk-weighted assets of at least 4.5%, plus a 2.5% “capital conservation buffer” (which is added to
52
the 4.5% CET1 ratio as that buffer is phased in, effectively resulting in a minimum ratio of CET1 to risk-weighted assets of at least 7.0%); (b) a minimum ratio of Tier 1 capital to risk-weighted assets of at least 6.0%, plus the capital conservation buffer (which is added to the 6.0% Tier 1 capital ratio as that buffer is phased in, effectively resulting in a minimum Tier 1 capital ratio of 8.5% upon full implementation); (c) a minimum ratio of Total (that is, Tier 1 plus Tier 2) capital to risk-weighted assets of at least 8.0%, plus the capital conservation buffer (which is added to the 8.0% total capital ratio as that buffer is phased in, effectively resulting in a minimum total capital ratio of 10.5% upon full implementation); and (d) as a newly adopted international standard, a minimum leverage ratio of 3.0%, calculated as the ratio of Tier 1 capital balance sheet exposures plus certain off-balance sheet exposures (computed as the average for each quarter of the month-end ratios for the quarter). In addition, the proposed rules also limit a banking organization's capital distributions and certain discretionary bonus payments if the banking organization does not hold a "capital conservation buffer".
When issued, the proposed rules indicated that final rules would become effective on January 1, 2013, and that the changes set forth in the final rules would be phased in from January 1, 2013 through January 1, 2019. On November 9, 2012, pursuant to a joint release, the federal bank agencies announced that they "do not expect that any of the proposed rules would become effective on January 1, 2013. As members of the Basel Committee on Banking Supervision, the U.S. agencies take seriously our internationally agreed timing commitments regarding the implementation of Basel III and are working as expeditiously as possible to complete the rulemaking process. As with any rule, the agencies will take operational and other considerations into account when determining appropriate implementation dates and associated transition periods." The Company expects that future risk weighted capital ratios determined pursuant to asset risk weightings as they may ultimately be structured under the prospective Basel III computational framework will differ unfavorably when compared to current computations. In light of the current uncertainty regarding the final structure of the computational framework, the Company cannot currently estimate the impact of the proposal on reported risk weighted capital ratios.
Recently enacted financial reform legislation may have an adverse effect on our ability to pay dividends, which would adversely affect the value of our common stock.
The value of the Company’s common stock is significantly affected by our ability to pay dividends to our public stockholders. The Company’s ability to pay dividends to our stockholders is subject to the availability of cash at the holding company and, in the event earnings are not sufficient to fund the dividends, eventually, the ability of the Association to make capital distributions to the Company. Moreover, our ability to pay dividends and the amount of such dividends is affected by the ability of Third Federal Savings, MHC, our mutual holding company, to waive the receipt of dividends declared by the Company.
Federal regulations require Third Federal Savings, MHC to notify the FRB of any proposed waiver of its receipt of dividends from the Company. The OTS, the previous regulator for Third Federal Savings, MHC, allowed dividend waivers provided the mutual holding company’s board of directors determined that the waiver was consistent with its fiduciary duties and the waiver would not be detrimental to the safety and soundness of its subsidiary institution. In February 2008, the Company declared its first quarterly dividend and continued to declare and pay quarterly dividends through May 2010, when the Company suspended future dividend payments until concerns expressed by OTS regarding the Association’s home equity line of credit portfolio were satisfactorily resolved. Prior to the suspension of the dividends, Third Federal Savings, MHC waived its right to receive each dividend paid by the Company. The FRB has recently issued an interim final rule pursuant to the Dodd-Frank Act, providing that the FRB “may not” object to dividend waivers by grandfathered mutual holding companies, such as Third Federal Savings, MHC, under standards substantially similar to those previously required by the OTS. However, the interim final rule added a requirement that a majority of the mutual holding company’s members eligible to vote must approve a dividend waiver by a mutual holding company within 12 months prior to the declaration of the dividend being waived. As part of its rulemaking process, the FRB is reviewing comments on the interim final rule and there can be no assurance that the final rule will not require such a member vote.
Changes in laws and regulations and the cost of compliance with new laws and regulations may adversely affect our operations and our income.
We are subject to extensive regulation, supervision and examination by the Federal Reserve Board, the Office of the Comptroller of the Currency, the Consumer Financial Protection Bureau and the Federal Deposit Insurance Corporation. These regulatory authorities have extensive discretion in connection with their supervisory and enforcement activities, including the ability to impose restrictions on a bank’s operations, reclassify assets, determine the adequacy of a bank’s allowance for loan losses and determine the level of deposit insurance premiums assessed. Because our business is highly regulated, the laws and applicable regulations are subject to frequent change. Any change in these regulations and oversight, whether in the form of regulatory policy, new regulations or legislation or additional deposit insurance premiums could have a material impact on our operations.
53
In response to the financial crisis, Congress has taken actions that are intended to strengthen confidence and encourage liquidity in financial institutions, and the Federal Deposit Insurance Corporation has taken actions to increase insurance coverage on deposit accounts. In addition, there have been proposals made by members of Congress and others that would reduce the amount delinquent borrowers are otherwise contractually obligated to pay under their mortgage loans and limit an institution’s ability to foreclose on mortgage collateral. Previously, a number of the largest mortgage lenders in the United States voluntarily imposed a temporary moratorium on all foreclosures due to document verification deficiencies.
The potential exists for additional federal or state laws and regulations, or changes in policy, affecting lending and funding practices and liquidity standards. Moreover, bank regulatory agencies have been active in responding to concerns and trends identified in examinations, and have issued many formal enforcement orders requiring capital ratios in excess of regulatory requirements. Bank regulatory agencies, such as the Federal Reserve Board, the Office of the Comptroller of the Currency, the Consumer Financial Protection Bureau and the Federal Deposit Insurance Corporation, govern the activities in which we may engage, primarily for the protection of depositors, and not for the protection or benefit of potential investors. In addition, new laws and regulations may increase our costs of regulatory compliance and of doing business, and otherwise affect our operations. New laws and regulations may significantly affect the markets in which we do business, the markets for and value of our loans and investments, the fees we can charge and our ongoing operations, costs and profitability.
Loans originated through our Home Today program have higher delinquency rates than the remainder of our loan portfolio.
Prior to March 27, 2009, we offered loans through our Home Today program with our standard terms to borrowers who might not otherwise qualify for such loans. To qualify for our Home Today program, a borrower must complete financial management education and counseling and must be referred to us by a sponsoring organization with which we have partnered as part of the program and must meet a minimum credit score threshold. Because we applied less stringent underwriting and credit standards to these loans, loans originated under the Home Today program prior to March 27, 2009 have greater credit risk than traditional residential real estate mortgage loans. As of
September 30, 2012
, we had
$208.3 million
of outstanding loans that were originated through our Home Today program,
20.7%
of which were delinquent 30 days or more, compared to
1.3%
for our portfolio of non-Home Today loans as of that date. During the fiscal year ended
September 30, 2012
, we incurred net charge-offs (exclusive of one-time SVA and Chapter 7 bankruptcy charge-offs) of
$22.6 million
, (
9.5%
of the average balance of Home Today loans) on loans originated through our Home Today program, compared to
$29.1 million
, (
0.4%
of the average balance of non-Home Today loans) of net charge-offs for our non-Home Today portfolio. Effective March 27, 2009, the Home Today underwriting guidelines are substantially the same as those for our traditional mortgage product.
The expiration of unlimited FDIC insurance on certain non-interest-bearing transaction accounts may increase our costs and reduce our liquidity levels.
On December 31, 2012, unlimited FDIC insurance on certain non-interest-bearing transaction accounts is scheduled to expire. Unlimited insurance coverage does not apply to money market deposit accounts or negotiable order of withdrawal accounts. The reduction in FDIC insurance on other types of accounts to the standard $250,000 maximum amount may cause depositors to place such funds in fully insured interest-bearing accounts, which would increase our costs of funds and negatively affect our results of operations, or may cause depositors to withdraw their deposits and invest uninsured funds in investments perceived as being more secure, such as securities issued by the United States Treasury. This may reduce our liquidity, or require us to pay higher interest rates to maintain our liquidity by retaining deposits.
Any future increases in FDIC insurance premiums or FDIC special assessments will adversely impact our earnings.
On November 12, 2009, the FDIC adopted a final rule that imposed a prepayment of deposit insurance assessments that institutions would otherwise be expected to pay for calendar years 2010 through 2012. As a result of this final rule, the Association remitted a prepayment of $51.9 million to the FDIC on December 30, 2009. The prepayment requirement does not preclude the FDIC from imposing future special assessments, from changing assessment rates or from revising the risk-based assessment system, pursuant to the existing notice-and-comment rulemaking framework. Pursuant to a stipulation of the Dodd-Frank Act, effective April 1, 2011, the assessment base used by the FDIC for the purpose of determining the amount of each insured depository institution’s deposit insurance premium was revised to reflect each institution’s total assets minus Tier 1 capital. In addition, the FDIC now imposes a separate assessment methodology for large (with assets exceeding $10 billion) institutions. Should the FDIC find it necessary to impose additional special assessments or further increase assessment rates, our FDIC general insurance premium expense will increase substantially compared to prior periods.
54
If our investment in the common stock of the FHLB of Cincinnati is classified as other-than-temporarily impaired or as permanently impaired, earnings and shareholders' equity could decrease.
We own stock of the FHLB of Cincinnati, which is part of the FHLB system. The FHLB of Cincinnati common stock is held to qualify for membership in the FHLB of Cincinnati and to be eligible to borrow funds under the FHLB of Cincinnati's advance programs. The aggregate cost of our FHLB of Cincinnati common stock as of September 30, 2012, was
$35.6
million based on its par value. There is no market for FHLB of Cincinnati common stock.
Although the FHLB of Cincinnati is not reporting current operating difficulties, it is possible that the capital of the FHLB system, including the FHLB of Cincinnati, could be substantially diminished. This could occur with respect to an individual FHLB due to the requirement that each FHLB is jointly and severally liable along with the other FHLBs for the consolidated obligations issued through the Office of Finance, a joint office of the FHLBs, or due to the merger of a FHLB experiencing operating difficulties into a stronger FHLB. Consequently, there continues to be a risk that our investment in FHLB of Cincinnati common stock could be deemed other-than-temporarily impaired at some time in the future, and if this occurs, it would cause our earnings and shareholders' equity to decrease by the impairment charge.
Hurricanes or other adverse weather events could negatively affect the economy in our Florida market area or cause disruptions to our branch office locations, which could have an adverse effect on our business or results of operations.
A significant portion of our operations are conducted in the State of Florida, a geographic region with coastal areas that are susceptible to hurricanes and tropical storms. Such weather events can disrupt our operations, result in damage to our branch office locations and negatively affect the local economy in which we operate. We cannot predict whether or to what extent damage caused by future hurricanes or tropical storms will affect our operations or the economy in our market area, but such weather events could result in fewer loan originations and greater delinquencies, foreclosures or loan losses. These and other negative effects of future hurricanes or tropical storms may adversely affect our business or results of operations.
Strong competition within our market areas may limit our growth and profitability.
Competition in the banking and financial services industry is intense. In our market areas, we compete with commercial banks, savings institutions, mortgage brokerage firms, credit unions, finance companies, mutual funds, money market funds, insurance companies, and brokerage and investment banking firms operating locally and elsewhere. Some of our competitors have greater name recognition and market presence that benefit them in attracting business, and offer certain services that we do not or cannot provide. In addition, larger competitors may be able to price loans and deposits more aggressively than we do. Troubled financial institutions may significantly increase the interest rates paid to depositors in pursuit of retail deposits when wholesale funding sources are not available to them. Our profitability depends upon our continued ability to successfully compete in our market areas. For additional information see PART 1 Item 1. Business—THIRD FEDERAL SAVINGS AND LOAN ASSOCIATION OF CLEVELAND—
Competition
.
Our information systems may experience an interruption or breach in security.
We rely heavily on communications and information systems to conduct our business. Any failure, interruption, or breach in security or operational integrity of these systems could result in failures or disruptions in our customer relationship management, general ledger, deposit, loan, and other systems. While we have policies and procedures designed to prevent or limit the effect of the failure, interruption, or security breach of our information systems, we cannot assure you that any such failures, interruptions, or security breaches will not occur or, if they do occur, that they will be adequately addressed. The occurrence of any failures, interruptions, or security breaches of our information systems could damage our reputation, result in a loss of customer business, subject us to additional regulatory scrutiny, or expose us to civil litigation and possible financial liability, any of which could have a material adverse effect on our financial condition and results of operations.
In addition, we outsource selected portions
of our data processing to certain third-party providers. If these third-party providers encounter difficulties, or if we have difficulty communicating with them, our ability to adequately process and account for transactions could be affected, and our business operations could be adversely affected. Threats to information security also exist in the processing of customer information through various other vendors and their personnel.
Our stock value may be affected negatively by our mutual holding company structure.
Third Federal Savings, MHC, as our majority shareholder, is able to control the outcome of virtually all matters presented to our shareholders for their approval, including any proposal to acquire us. Accordingly, Third Federal Savings, MHC may prevent the sale of control or merger of the Company or its subsidiaries even if such a transaction were favored by a majority of the public shareholders of the Company.
55
|
Item 1B.
|
Unresolved Staff Comments
|
None.
|
Item 2.
|
Properties
|
We operate from our main office in Cleveland, Ohio, our
39
full-service branch offices located in Ohio and Florida and our
eight
loan production offices located in Ohio. Our branch offices are located in the Ohio counties of Cuyahoga, Lake, Lorain, Medina and Summit and in the Florida counties of Broward, Collier, Hillsborough, Lee, Palm Beach, Pasco, Pinellas and Sarasota. Our loan production offices are located in the Ohio counties of Franklin, Butler, Delaware and Hamilton. The Company owns the building in which its home office and executive offices are located, and five other office locations. The net book value of our land, premises, equipment and software was
$61.2
million at
September 30, 2012
. Included in the net book value are two commercial buildings located in Canton, Massachusetts, valued at $18.9 million, which are owned by our Hazelmere entity and leased to third parties in net lease transactions.
|
Item 3.
|
Legal Proceedings
|
The Company and its subsidiaries are subject to various legal actions arising in the normal course of business. In the opinion of management, the resolution of these legal actions is not expected to have a material effect on the Company’s financial condition, results of operation, or statement of cash flows.
|
Item 4.
|
Mine Safety Disclosures
|
Not applicable.
|
Item 5.
|
Market for Registrant’s Common Equity, Related Stockholder Matters and Issuer Purchases of Equity Securities
|
(a)
Our common stock is listed and traded on the NASDAQ Global Select Market under the symbol “TFSL”. As of November 19, 2012, we had 9,013 shareholders of record, which number does not include persons or entities holding shares in “nominee” or “street” name through brokerage firms. Shares of our common stock began trading on April 23, 2007 following the completion of our initial public offering. Quarterly trading information for the periods indicated is provided by NASDAQ and included in the following table.
|
|
Traded Market Prices
|
|
||||||||
|
|
High
|
Low
|
Dividends
|
|||||||
|
Quarter ended December 31, 2010
|
$
|
9.17
|
|
$
|
7.77
|
|
—
|
|
||
|
Quarter ended March 31, 2011
|
10.84
|
|
9.16
|
|
—
|
|
||||
|
Quarter ended June 30, 2011
|
10.90
|
|
9.32
|
|
—
|
|
||||
|
Quarter ended September 30, 2011
|
10.07
|
|
7.79
|
|
—
|
|
||||
|
Quarter ended December 31, 2011
|
9.47
|
|
8.05
|
|
—
|
|
||||
|
Quarter ended March 31, 2012
|
9.72
|
|
9.01
|
|
—
|
|
||||
|
Quarter ended June 30, 2012
|
9.97
|
|
9.19
|
|
—
|
|
||||
|
Quarter ended September 30, 2012
|
9.75
|
|
8.53
|
|
—
|
|
||||
Payment of dividends is subject to declaration by our board of directors and is dependent on a number of factors, including:
|
•
|
our capital requirements and, to the extent that funds for any such dividend are provided by Third Federal Savings and Loan, the regulatory capital requirements imposed on the Association by the Office of Comptroller of the Currency;
|
|
•
|
our financial position and results of operations;
|
|
•
|
tax considerations;
|
56
|
•
|
our alternative uses of funds;
|
|
•
|
statutory and regulatory limitations; and
|
|
•
|
general economic conditions.
|
In June 2010, and as subsequently reaffirmed on February 7, 2011, the Company was directed not to declare or pay any cash dividend, purchase or redeem any common stock or make any other capital distribution without providing 45 days prior written notice to the Central Regional Director of the OTS and receiving the Regional Director’s written non-objection. This restriction continues to apply under the Company’s new regulator, the FRB. Refer to the
Monitoring and Limiting Our Credit Risk
section which follows in Item 7. of this Part II, for additional information. At this time the Company does not intend to declare or pay a cash dividend until the concerns of its primary regulator and the Association’s primary regulator are resolved. Any future payment of dividends will be decided by the Company’s board of directors, subject to proper FRB notice and non-objection, if required at that time.
Pursuant to Internal Revenue Service regulations, any payment of dividends by the Association to the Company that would be deemed to be drawn from the Association’s bad debt reserves would require a payment of taxes at the then-current tax rate by the Association on the amount of earnings deemed to be removed from the reserves for such distribution. The Association does not intend to make any distribution to the Company that would create such a federal tax liability.
Through September 30, 2010, Third Federal Savings, MHC, waived its right to receive dividends. The waivers complied with regulatory authorizations (in the form of non-objection) obtained by Third Federal Savings, MHC. Requests for future regulatory authorizations to waive receipts of dividends will be submitted to the FRB. Please refer to the preceding discussion of dividend waivers presented in Part I, Item 1. Business, SUPERVISION AND REGULATION,
Holding Company Regulation,
sections—
Dividends
and
Waivers of Dividends by Third Federal, MHC
. Regulatory non-objection is subject to periodic regulatory review and no assurances can be given regarding future regulatory non-objection. In addition, recent interim final rules issued by the FRB require that a majority of the mutual holding company's members eligible to vote must approve a dividend waiver by a mutual holding company within 12 months prior to the declaration of the dividend being waived. As part of its rulemaking process, the FRB is reviewing comments on the interim final rule
and
there can be no assurance that the final rule will not require such a member vote.
57
In the table and graph that follow, we have provided summary information regarding the performance of the cumulative total return of our common stock from September 30, 2007 through September 30, 2012, relative to the cumulative total return on stocks included in the (a) SNL Bank and Thrift Index; (b) SNL Thrift Index and (c) NASDAQ Composite, in each case for the same period. The cumulative return data are presented in dollars, based on starting investments of $100 and assuming the reinvestment of dividends.
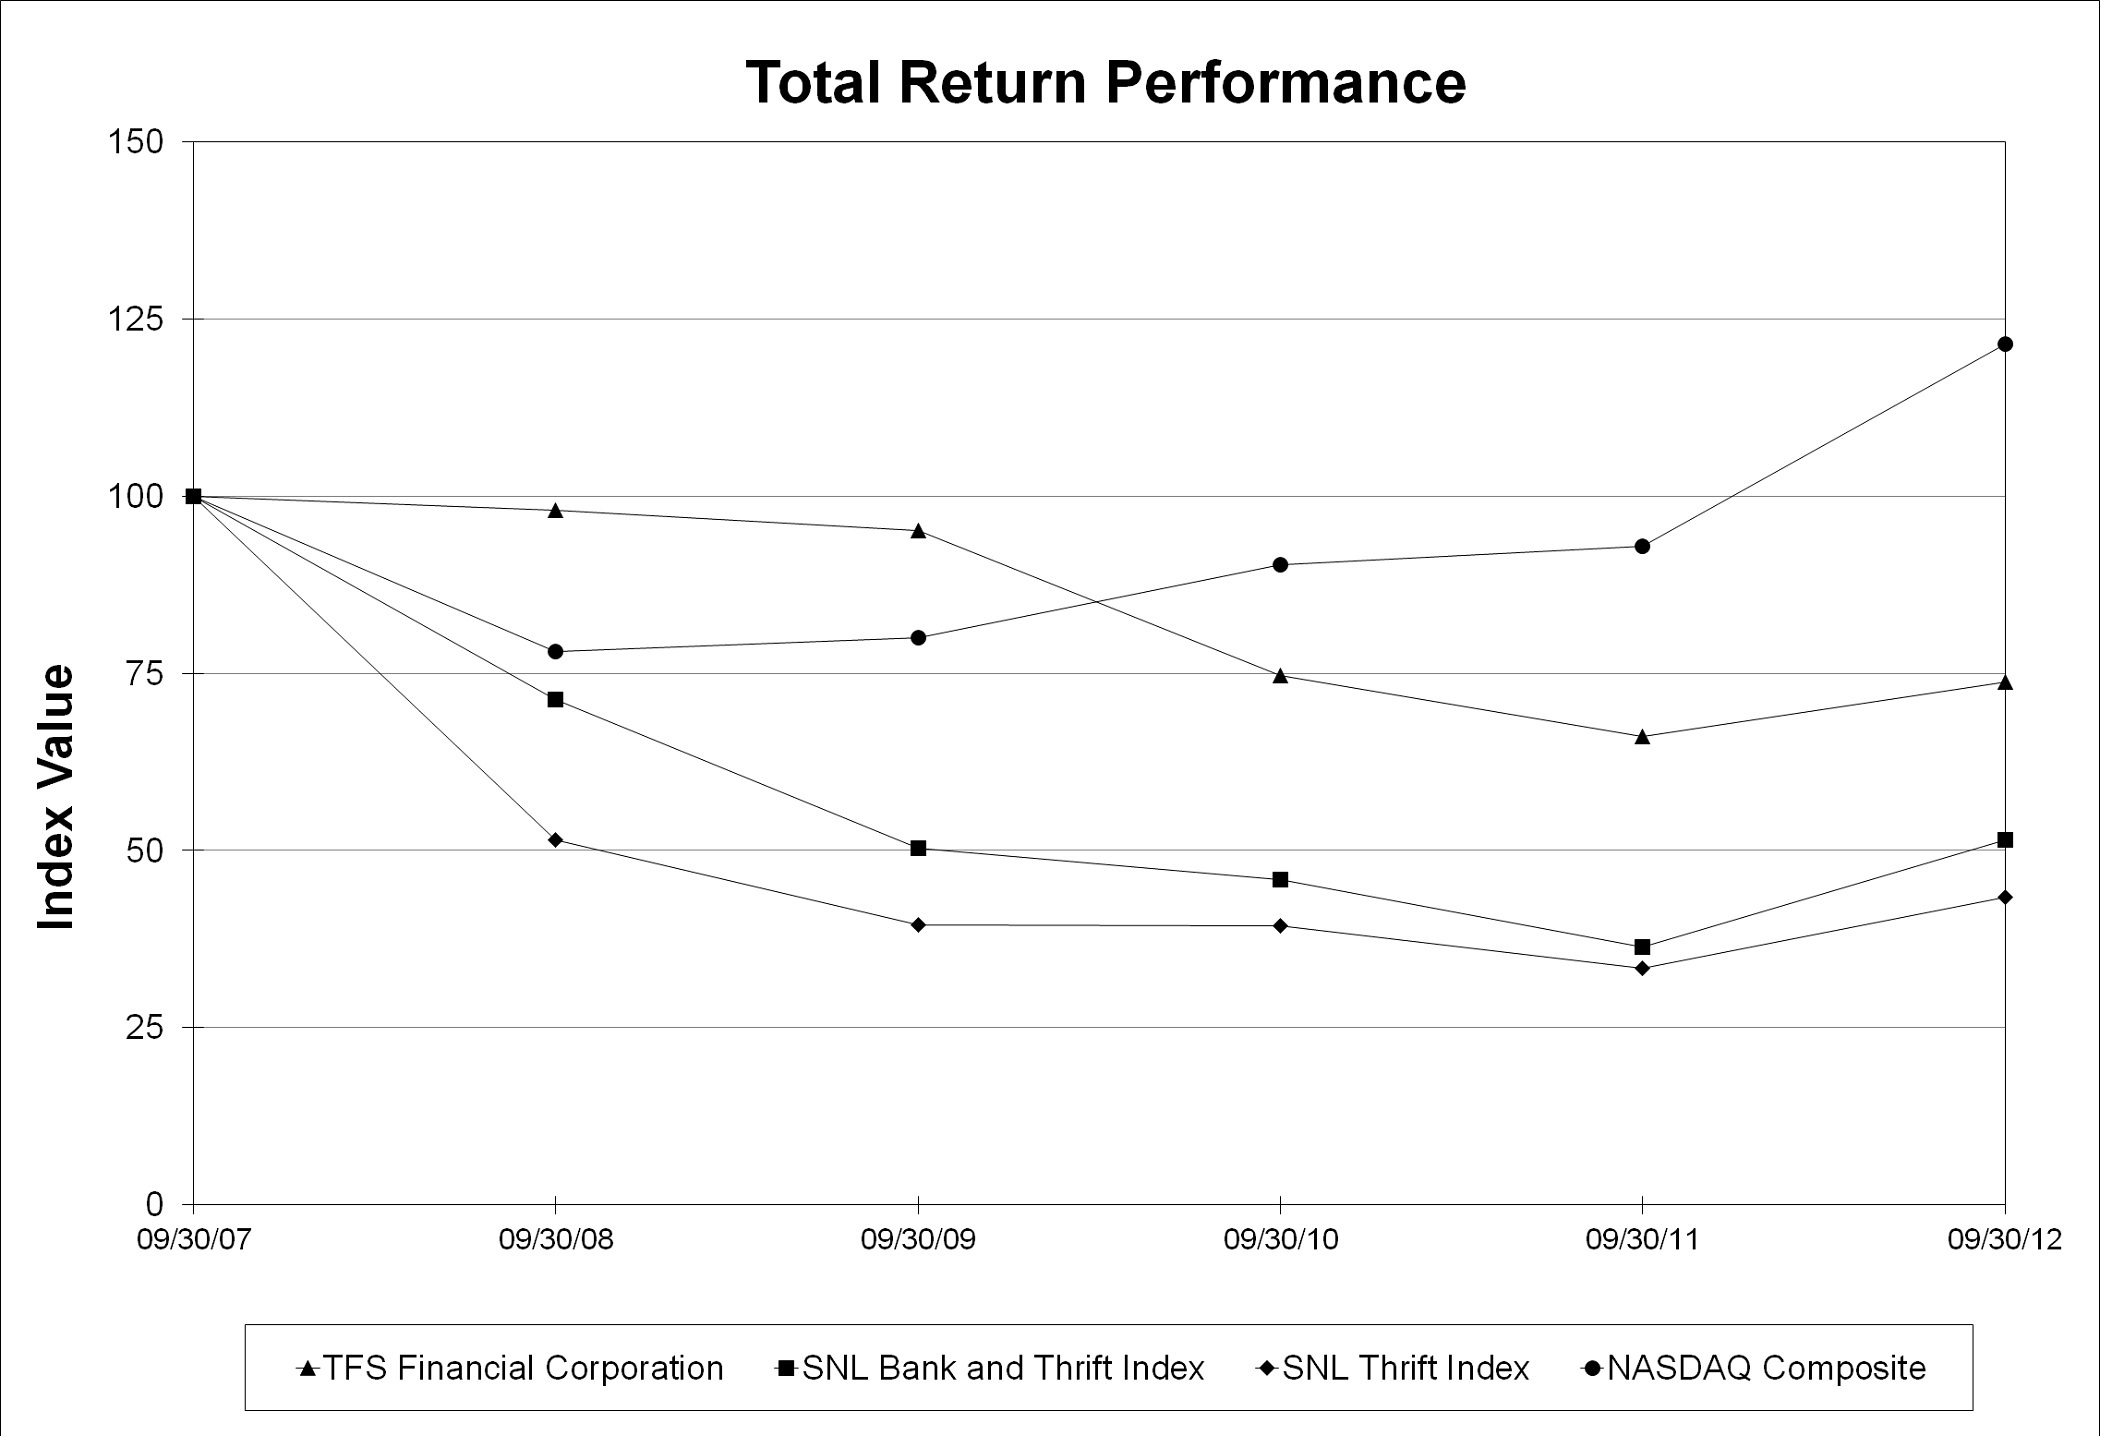
|
|
Measurement Date
|
||||||||||||||||
|
Index (with base price at 9/30/2007)
|
9/30/2007
|
9/30/2008
|
9/30/2009
|
9/30/2010
|
9/30/2011
|
9/30/2012
|
|||||||||||
|
TFS Financial Corporation
|
100.00
|
|
97.95
|
|
95.12
|
|
74.68
|
|
66.07
|
|
73.71
|
|
|||||
|
SNL Bank and Thrift Index
|
100.00
|
|
71.23
|
|
50.36
|
|
45.95
|
|
36.41
|
|
51.45
|
|
|||||
|
SNL Thrift Index
|
100.00
|
|
51.51
|
|
39.45
|
|
39.40
|
|
33.40
|
|
43.41
|
|
|||||
|
NASDAQ Composite
|
100.00
|
|
78.08
|
|
80.06
|
|
90.26
|
|
92.97
|
|
121.46
|
|
|||||
______________________
|
(a)
|
We did not sell any unregistered securities during the fiscal year ended
September 30, 2012
.
|
|
(b)
|
Not applicable
|
|
(c)
|
The Company did not repurchase any shares of common stock during the quarter ended
September 30, 2012
.
|
On March 12, 2009, the Company announced its fourth stock repurchase program, which authorizes the repurchase of up to an additional 3,300,000 shares of the Company’s outstanding common stock. Purchases under the program will be on an ongoing basis, subject to the availability of stock, general market conditions, the trading price of the stock, alternative uses of capital, regulatory restrictions and our financial performance. Repurchased shares will be held as treasury stock and be available for general corporate use. The program has
2,156,250
shares yet to be purchased as of
September 30, 2012
. Our last repurchases occurred during the quarter ended December 31, 2009.
Because of concerns communicated to us by the OTS, which was merged into the OCC on July 21, 2011, and pending evaluations by our current federal regulators, the OCC and the Federal Reserve, as referred to in the Monitoring and Limiting Our Credit Risk section in the Overview, section of Item 7, Management’s Discussion and Analysis of Financial Condition and Results of Operations, the Company does not intend to declare or pay a cash dividend, or to repurchase any of its outstanding common stock until the concerns of our regulators are resolved.
58
|
Item 6.
|
Selected Financial Data
|
|
|
At September 30,
|
||||||||||||||||||
|
|
2012
|
2011
|
2010
|
2009
|
2008
|
||||||||||||||
|
|
|||||||||||||||||||
|
Selected Financial Condition Data:
|
|||||||||||||||||||
|
Total assets
|
$
|
11,518,125
|
|
$
|
10,892,948
|
|
$
|
11,076,027
|
|
$
|
10,598,840
|
|
$
|
10,786,451
|
|
||||
|
Cash and cash equivalents
|
308,262
|
|
294,846
|
|
743,740
|
|
307,046
|
|
132,379
|
|
|||||||||
|
Investment securities:
|
|||||||||||||||||||
|
Available for sale
|
421,430
|
|
15,899
|
|
24,619
|
|
23,434
|
|
31,102
|
|
|||||||||
|
Held to maturity
|
—
|
|
392,527
|
|
646,940
|
|
578,331
|
|
817,750
|
|
|||||||||
|
Loans held for sale
|
124,528
|
|
—
|
|
25,027
|
|
61,170
|
|
200,670
|
|
|||||||||
|
Loans, net
|
10,224,989
|
|
9,750,943
|
|
9,181,749
|
|
9,219,585
|
|
9,208,736
|
|
|||||||||
|
Bank owned life insurance
|
177,279
|
|
170,845
|
|
164,334
|
|
157,864
|
|
151,294
|
|
|||||||||
|
Prepaid expenses and other assets(1)
|
90,720
|
|
88,853
|
|
100,461
|
|
53,183
|
|
38,783
|
|
|||||||||
|
Deposits
|
8,981,419
|
|
8,715,910
|
|
8,851,941
|
|
8,570,506
|
|
8,261,101
|
|
|||||||||
|
Borrowed funds
|
488,191
|
|
139,856
|
|
70,158
|
|
70,158
|
|
498,028
|
|
|||||||||
|
Shareholders’ equity
|
1,806,850
|
|
1,773,924
|
|
1,752,897
|
|
1,745,865
|
|
1,843,652
|
|
|||||||||
______________________
|
(1)
|
Prepaid expenses and other assets include the remaining balance in prepaid FDIC assessments of
$12.1 million
at September 30, 2012, $23.4 million at September 30, 2011, and $39.5 million at September 30, 2010.
|
|
|
For the Years Ended September 30,
|
||||||||||||||||||
|
|
2012
|
2011
|
2010
|
2009
|
2008
|
||||||||||||||
|
|
(In thousands, except per share amounts)
|
||||||||||||||||||
|
Selected Data:
|
|||||||||||||||||||
|
Interest income
|
$
|
417,853
|
|
$
|
427,493
|
|
$
|
437,891
|
|
$
|
487,222
|
|
$
|
550,183
|
|
||||
|
Interest expense
|
155,646
|
|
179,845
|
|
210,385
|
|
257,147
|
|
330,321
|
|
|||||||||
|
Net interest income
|
262,207
|
|
247,648
|
|
227,506
|
|
230,075
|
|
219,862
|
|
|||||||||
|
Provision for loan losses
|
102,000
|
|
98,500
|
|
106,000
|
|
115,000
|
|
34,500
|
|
|||||||||
|
Net interest income after provision for loan losses
|
160,207
|
|
149,148
|
|
121,506
|
|
115,075
|
|
185,362
|
|
|||||||||
|
Non-interest income
|
24,463
|
|
30,982
|
|
58,638
|
|
67,384
|
|
47,780
|
|
|||||||||
|
Non-interest expenses
|
171,058
|
|
168,055
|
|
161,933
|
|
162,388
|
|
151,447
|
|
|||||||||
|
Earnings before income tax expense
|
13,612
|
|
12,075
|
|
18,211
|
|
20,071
|
|
81,695
|
|
|||||||||
|
Income tax expense
|
2,133
|
|
2,735
|
|
6,873
|
|
5,676
|
|
27,205
|
|
|||||||||
|
Net earnings after income tax expense
|
$
|
11,479
|
|
$
|
9,340
|
|
$
|
11,338
|
|
$
|
14,395
|
|
$
|
54,490
|
|
||||
|
Earnings per share—basic and fully diluted
|
$
|
0.04
|
|
$
|
0.03
|
|
$
|
0.04
|
|
$
|
0.05
|
|
$
|
0.17
|
|
||||
|
Cash dividends declared per share
|
$
|
—
|
|
$
|
—
|
|
$
|
0.21
|
|
$
|
0.26
|
|
$
|
0.15
|
|
||||
59
|
|
At September 30,
|
|||||||||||||
|
|
2012
|
2011
|
2010
|
2009
|
2008
|
|||||||||
|
Selected Financial Ratios and Other Data:
|
||||||||||||||
|
Performance Ratios:
|
||||||||||||||
|
Return on average assets
|
0.10
|
%
|
0.09
|
%
|
0.10
|
%
|
0.13
|
%
|
0.52
|
%
|
||||
|
Return on average equity
|
0.64
|
%
|
0.53
|
%
|
0.65
|
%
|
0.80
|
%
|
2.74
|
%
|
||||
|
Interest rate spread(1)
|
2.11
|
%
|
1.97
|
%
|
1.77
|
%
|
1.70
|
%
|
1.45
|
%
|
||||
|
Net interest margin(2)
|
2.39
|
%
|
2.32
|
%
|
2.16
|
%
|
2.20
|
%
|
2.18
|
%
|
||||
|
Efficiency ratio(3)
|
59.67
|
%
|
60.31
|
%
|
56.59
|
%
|
54.59
|
%
|
56.59
|
%
|
||||
|
Noninterest expense to average total assets
|
1.52
|
%
|
1.54
|
%
|
1.50
|
%
|
1.51
|
%
|
1.45
|
%
|
||||
|
Average interest-earning assets to average interest-bearing liabilities
|
119.60
|
%
|
120.39
|
%
|
119.70
|
%
|
120.57
|
%
|
122.38
|
%
|
||||
|
Dividend payout ratio(4)
|
—
|
%
|
—
|
%
|
525.00
|
%
|
520.00
|
%
|
88.24
|
%
|
||||
|
Asset Quality Ratios:
|
||||||||||||||
|
Non-performing assets as a percent of total assets(5)
|
1.76
|
%
|
2.34
|
%
|
2.73
|
%
|
2.57
|
%
|
1.73
|
%
|
||||
|
Non-accruing loans as a percent of total loans(5)
|
1.77
|
%
|
2.37
|
%
|
3.08
|
%
|
2.74
|
%
|
1.87
|
%
|
||||
|
Allowance for loan losses as a percent of non-accruing loans(5)
|
55.03
|
%
|
66.73
|
%
|
46.36
|
%
|
37.24
|
%
|
25.33
|
%
|
||||
|
Allowance for loan losses as a percent of total loans(5)
|
0.97
|
%
|
1.58
|
%
|
1.43
|
%
|
1.02
|
%
|
0.47
|
%
|
||||
|
Capital Ratios:
|
||||||||||||||
|
Third Federal Savings and Loan
|
||||||||||||||
|
Total risk-based capital (to risk weighted assets)
|
22.19
|
%
|
22.29
|
%
|
19.17
|
%
|
18.19
|
%
|
17.55
|
%
|
||||
|
Tier 1 core capital (to adjusted tangible assets)
|
13.31
|
%
|
13.90
|
%
|
12.14
|
%
|
12.48
|
%
|
12.05
|
%
|
||||
|
Tangible capital (to tangible assets)
|
13.31
|
%
|
13.90
|
%
|
12.14
|
%
|
12.48
|
%
|
12.05
|
%
|
||||
|
Tier 1 risk-based capital (to risk weighted assets)
|
20.94
|
%
|
21.04
|
%
|
18.00
|
%
|
17.30
|
%
|
17.27
|
%
|
||||
|
TFS Financial Corporation(6)
|
||||||||||||||
|
Total risk-based capital (to risk weighted assets)
|
25.03
|
%
|
NA
|
|
NA
|
|
NA
|
|
NA
|
|
||||
|
Tier 1 core capital (to adjusted tangible assets)
|
15.33
|
%
|
NA
|
|
NA
|
|
NA
|
|
NA
|
|
||||
|
Tangible capital (to tangible assets)
|
15.33
|
%
|
NA
|
|
NA
|
|
NA
|
|
NA
|
|
||||
|
Tier 1 risk-based capital (to risk weighted assets)
|
23.78
|
%
|
NA
|
|
NA
|
|
NA
|
|
NA
|
|
||||
|
Average equity to average total assets
|
16.00
|
%
|
16.07
|
%
|
16.19
|
%
|
16.69
|
%
|
19.06
|
%
|
||||
|
Other Data:
|
||||||||||||||
|
Third Federal Savings and Loan
|
||||||||||||||
|
Number of full service offices
|
39
|
|
39
|
|
39
|
|
39
|
|
38
|
|
||||
|
Loan production offices
|
8
|
|
8
|
|
8
|
|
8
|
|
8
|
|
||||
______________________
|
(1)
|
Represents the difference between the weighted-average yield on interest-earning assets and the weighted-average cost of interest-bearing liabilities for the year.
|
|
(2)
|
The net interest margin represents net interest income as a percent of average interest-earning assets for the year.
|
|
(3)
|
The efficiency ratio represents non-interest expense divided by the sum of net interest income and non-interest income.
|
|
(4)
|
Represents dividends paid per share divided by diluted earnings per share. Receipt of dividends on shares owned by Third Federal Savings, MHC has been waived and dividends paid on unallocated shares of the ESOP are used to pay down the loan to the ESOP.
|
|
(5)
|
Ratios in fiscal year 2012 have been impacted by elimination of SVAs and regulatory guidance related to Chapter 7 bankruptcy.
|
|
(6)
|
TFS Financial Corporation capital ratios were not calculated prior to 2012.
|
60
|
Item 7.
|
Management’s Discussion and Analysis of Financial Condition and Results of Operation
|
Overview
Our business strategy is to operate as a well-capitalized and profitable financial institution dedicated to providing exceptional personal service to our customers. We cannot assure you that we will successfully implement our business strategy.
Since being organized in 1938, we grew to become, at the time of our initial public offering of stock in April 2007, the nation’s largest mutually-owned savings and loan association based on total assets. We credit our success to our continued emphasis on our primary values: “Love, Trust, Respect, and a Commitment to Excellence, along with some Fun.” Our values are reflected in our pricing of loan and deposit products, and historically, in our Home Today program, as described below. Our values are further reflected in the Broadway Redevelopment Initiative (a long-term revitalization program encompassing the three-mile corridor of the Broadway-Slavic Village neighborhood in Cleveland, Ohio where our main office is located) and the education programs we have established and/or supported. We intend to continue to support our customers.
Regionally high unemployment, weak residential real estate values, capital and credit markets that remain at less than robust levels, and a general lack of confidence in the financial service sector of the economy present challenges for us.
Management believes that the following matters are those most critical to our success: (1) controlling our interest rate risk exposure; (2) monitoring and limiting our credit risk; (3) maintaining access to adequate liquidity and alternative funding sources; and (4) monitoring and controlling operating expenses.
Controlling Our Interest Rate Risk Exposure.
Although housing and credit quality issues persist in financial headlines and continue to have a negative effect on our operating results and, as described below, are certainly a matter of significant concern for us, historically our greatest risk has been interest rate risk exposure. When we hold long-term, fixed-rate assets, funded by liabilities with shorter re-pricing characteristics, we are exposed to potentially adverse impact from rising interest rates. Generally, and particularly over extended periods of time that encompass full economic cycles, interest rates associated with longer term assets, like fixed rate mortgages, have been higher than interest rates associated with shorter term funding sources, like deposits. This difference has been an important component of our net interest income and is fundamental to our operations. We manage the risk of holding long-term, fixed-rate mortgage assets primarily by moderating the attractiveness of our loan offerings, thereby controlling the level of additions (new originations) to our portfolio, and, prior to September 30, 2010, by periodically selling long-term, fixed-rate mortgage loans in the secondary market to reduce the amount of those assets held in our portfolio. During the fiscal year ended
September 30, 2012
, we sold
$11.4 million
of long-term, fixed-rate mortgage loans compared to
$33.6 million
and
$1.03 billion
during the fiscal years ended
September 30, 2011
and
2010
, respectively the low volume of loan sales since September 30, 2010 reflects the impact of changes by Fannie Mae, historically the Association’s primary loan investor, related to requirements for loans that it accepts and a reduced level of fixed-rate loan originations as described below.
Effective July 1, 2010, Fannie Mae, historically the Association’s primary loan investor, implemented certain loan origination requirement changes affecting loan eligibility that, to date, we have not adopted. In reaching our current decision regarding implementation of the changes necessary to comply with Fannie Mae’s revised requirements, we considered that since 1991, the Association, employing only non-commissioned loan originators and utilizing a centralized underwriting process, had sold loans to Fannie Mae under a series of proprietary variances, or contract waivers, that were negotiated between us and Fannie Mae during the term of our relationship. These proprietary concessions related to certain loan file documentation and quality control procedures the lack of which, in our opinion, did not diminish in any way the excellent credit quality of the loans that we delivered to Fannie Mae, but facilitated the efficiency and effectiveness of our operations and the quality and value of the loan products that we were able to offer to our borrowers. The credit quality of the loans that we delivered to Fannie Mae was consistently evidenced by the superior delinquency profile of our portfolio in peer performance comparisons prepared by Fannie Mae throughout the term of our relationship. In response to the tumult of the housing crisis that commenced in 2008, and with the objective of improving the credit profile its loan portfolio, Fannie Mae has enacted many credit tightening measures, culminating in the effective elimination of proprietary variances and waivers, accompanied by the imposition of additional file documentation requirements and expanded quality control procedures. In addition to substantively changing Fannie Mae’s operating environment, effects of the housing crisis spread throughout the secondary residential mortgage market and resulted in a significantly altered operating framework for all secondary market participants. We believe that this dramatically altered operating framework offers opportunities for business process innovators to create new secondary market solutions especially as such opportunities pertain to high credit quality residential loans similar to those that we have traditionally originated. With the current uncertainty as to how the secondary market might be structured in the future, the Association has concluded that it is premature to incur the costs of the infrastructural changes to our operations (file documentation collection and additional quality control procedures) that would be necessary to fully comply with current Fannie Mae loan eligibility standards. In the near term, the Association expects to continue to monitor secondary market
61
developments and will continue to assess the merits of implementing the changes required to comply with Fannie Mae’s loan eligibility standards.The Association’s ability to significantly reduce interest rate risk via our traditional loan sales of newly originated longer-term fixed rate residential loans has been limited and will remain so until either the Association changes its loan origination processes or Fannie Mae, Freddie Mac or other market participants revise their loan eligibility standards. In the absence of such changes, future sales of fixed-rate mortgage loans will be predominantly limited to those loans that have established payment histories, strong borrower credit profiles and are supported by adequate collateral values. In that regard, in June 2011, we sold, on a servicing retained basis, $20.3 million of fixed-rate mortgage loans to a private investor. During the three months ended March 31, 2012, we reclassified a pool of high credit quality, fixed-rate, first mortgage loans, with a recorded investment of $245.9 million, from “loans held for investment” to “loans held for sale” and engaged an investment banking representative to offer those loans for sale as non-agency, whole loans in the secondary market to private investors. As a condition to any transaction, the Association will retain the mortgage servicing rights associated with any loans sold. During the three months ended September 30, 2012,
$104.7 million
of the non-agency, "loans held for sale" portfolio were reclassified to "loans held for investment". During the fiscal year ended
September 30, 2012
, no loan sales to private investors were completed, nor at September 30, 2012, were any loan sale commitments to private investors outstanding. At
September 30, 2012
, non-agency, whole loans included as "loans held for sale" had a recorded investment of $
114.7 million
. During the quarter ended June 30, 2012, the Association implemented procedures necessary for participation in Fannie Mae's HARP II (Home Affordable Refinance Program) initiative. Included in the balance of "loans held for sale" at September 30, 2012, were $
9.6 million
of agency-compliant HARP II loans. HARP II loan sales during the fiscal year ended
September 30, 2012
, totaled $11.4 million. At
September 30, 2012
, outstanding HARP II loan sales commitments totaled
$2.8
million.
In response to the agencies’ loan eligibility changes, in July 2010 we began marketing an adjustable-rate mortgage loan product that provides us with improved interest rate risk characteristics when compared to a long-term, fixed-rate mortgage. Since its introduction, the “SmartRate” adjustable rate mortgage has offered borrowers an interest rate lower than that of a fixed-rate loan. The rate is locked for three or five years then resets annually after that. It contains a feature to relock the rate an unlimited number of times at our then current rate and fee schedule, for another three or five years (dependent on the original reset period) without having to complete a full refinance transaction. Relock eligibility is subject to satisfactory payment performance history by the borrower (never 60 days late, no 30-day delinquencies during the last twelve months, current at the time of relock, and no foreclosures or bankruptcies since the SmartRate application was taken). In addition to a satisfactory payment history, relock eligibility requires that the property continue to be the borrower’s primary residence. The loan term cannot be extended in connection with a relock nor can new funds be advanced. All interest rate caps and floors remain as originated. During the fiscal year ended
September 30, 2012
, adjustable-rate mortgage loan production
increased
$302.1 million
to
$1.49 billion
from
$1.18 billion
during the fiscal year ended
September 30, 2011
. During the same time period, fixed-rate mortgage loan production
increased
$198.5 million
to
$1.16 billion
from
$959.0 million
. The amount of origination and refinancing volumes along with the portion of that activity that pertains to loans that we previously sold (but for which we maintained the right to provide mortgage servicing so as to maintain our relationship with our customer) when coupled with the level of loan sales, if any, determines the balance of loans held on our balance sheet. The amount of adjustable-rate loan activity described above resulted in
$2.95 billion
of long-term adjustable-rate loans in our residential mortgage loans held for investment portfolio at
September 30, 2012
, as compared to
$1.83 billion
at
September 30, 2011
, or an
increase
of
$1.13 billion
during the fiscal year. In addition, fixed-rate mortgage loan activity described above resulted in
$5.20 billion
of long-term fixed rate loans in our residential mortgage loans held for investment portfolio at
September 30, 2012
, as compared to
$5.56 billion
at
September 30, 2011
. The
September 30, 2012
measurement excludes
$124.5 million
of agency and non-agency, long-term, fixed-rate loans reported as “held for sale”. At
September 30, 2011
, we had
no
loans designated as “held for sale”.
In the past, we have also managed interest rate risk by promoting home equity lines of credit, which have a variable interest rate. As described below, this product carries an incremental credit risk component and has been adversely impacted by the housing market downturn. Effective June 28, 2010, we suspended the acceptance of new home equity credit applications with the exception of bridge loans and, in accordance with a reduction plan that was accepted by our primary regulator in December 2010, we actively pursued strategies to decrease the outstanding balance of our home equity lending portfolio as well as our exposure to undrawn home equity lines of credit. During the quarter ended June 30, 2011, we achieved the balance and exposure reduction targets included in the reduction plan. Beginning in March 2012, we again offered new home equity lines of credit to qualifying existing home equity customers, subject to certain property and credit performance conditions, which include:
|
•
|
lower combined loan to value ("CLTV") ratios (80% in Ohio/Kentucky and 70% in Florida; prior programs extended to as high as 89.99%);
|
|
•
|
limited geographic offering (only Ohio, Kentucky and Florida; prior programs were offered nationwide);
|
|
•
|
borrower income is fully verified (in prior programs income was not always fully verified);
|
62
|
•
|
the borrower is qualified using a principal and interest payment based on the current prime rate plus 2.00%, amortized for 20 years (prior programs qualified using the current prime rate);
|
|
•
|
the minimum credit score to qualify for the re-introduced home equity line of credit is 720 (our most recent prior home equity line of credit offering required a minimum credit score of 680); and
|
|
•
|
the term of the new home equity line of credit is a five year draw period, interest only payment, followed by a 20 year repayment period, principal and interest (prior program terms generally offered a 10 year draw period, interest only payment, followed by a 10 year repayment period, principal and interest).
|
Notwithstanding achievement of the reduction plan target and recent limited offers to extend new revolving lines of credit to qualifying, existing home equity line of credit customers, promotion of this product is not a current, meaningful strategy used to manage our interest rate risk profile.
Should a rapid and substantial increase occur in general market interest rates, it is probable that, prospectively and particularly over a multi-year time horizon, the level of our net interest income would be adversely impacted.
Monitoring and Limiting Our Credit Risk.
While, historically, we had been successful in limiting our credit risk exposure by generally imposing high credit standards with respect to lending, the confluence of unfavorable regional and macro-economic events since 2008, coupled with our pre-2010 expanded participation in the second lien mortgage lending markets, has significantly refocused our attention with respect to credit risk. In response to the evolving economic landscape, we have continuously revised and updated our quarterly analysis and evaluation procedures, as needed, for each category of our lending with the objective of identifying and recognizing all appropriate credit impairments. At
September 30, 2012
,
90%
of our assets consisted of residential real estate loans (both “held for sale” and “held for investment”) and home equity loans and lines of credit, the overwhelming majority of which were originated to borrowers in the states of Ohio and Florida. Our analytic procedures and evaluations include specific reviews of all home equity loans and lines of credit that become 90 or more days past due, as well as specific reviews of all first mortgage loans that become 180 or more days past due. We also expanded our analysis of current performing home equity lines of credit to better mitigate future risk of loss. In accordance with regulatory guidance issued in January 2012, performing home equity lines of credit subordinate to first mortgages delinquent greater than 90 days are transferred to non-accrual status. At
September 30, 2012
, the recorded investment of such performing home equity lines of credit classified as non-accrual was $
8.8 million
. Also, the OCC issued guidance in July 2012 which requires loans, where at least one borrower has been discharged of their obligation in Chapter 7 bankruptcy, to be classified as troubled debt restructurings. Also required is the charge off of performing loans to collateral value and non-accrual classification when all borrowers have had their obligations discharged in Chapter 7 bankruptcy, regardless of how long the loans have been performing. At
September 30, 2012
, troubled debt restructurings increased by
$70.9 million
of loans in Chapter 7 bankruptcy status. At
September 30, 2012
, the recorded investment in non-accrual status loans includes
$30.6
of performing loans in Chapter 7 bankruptcy status where at least one borrower has been discharged of their obligation. Based on the OCC interpretive guidance, net charge-offs related to those loans increased
$15.8 million
for the fiscal year ended
September 30, 2012
.
In response to market conditions, and in an effort to limit our credit risk exposure and improve the credit performance of new customers, we have tightened our credit criteria in evaluating a borrower’s ability to successfully fulfill his or her repayment obligation and we have revised the design of many of our loan products to require higher borrower down-payments, limited the products available for condominiums, and eliminated certain product features (such as interest-only adjustable-rate loans, loans above certain loan-to-value ratios, and prior to March 2012, home equity lending products with the exception of bridge loans).
Prior to its July 21, 2011 merger into the Office of the Comptroller of the Currency (“OCC”), the Office of Thrift Supervision (“OTS”) expressed concerns with the risk concentration and other aspects of the Association’s home equity loans and lines of credit portfolio and the administration of that portfolio. Under the terms of an August 13, 2010 memorandum of understanding (the “MOU”) between the Association and the OTS, management prepared, or obtained, and submitted to the OTS: (1) a third party report on our home equity lending portfolio; (2) a home equity lending reduction plan (the “Reduction Plan”); (3) enhanced home equity lending and credit risk management policies and procedures; and (4) an updated business plan. On December 27, 2010, notice was received from the OTS that it did not object to the Reduction Plan. The Reduction Plan spanned the period from June 30, 2010 through December 31, 2011. As of December 31, 2011, the Reduction Plan’s targets (a $1 billion reduction in home equity lending commitments, including a $300 million reduction in outstanding balances) had been met and exceeded as home equity lending commitments had been reduced by $
1.31 billion
from June 30, 2010 levels, including $
506.1 million
in outstanding balances, to $
3.83 billion
. Further reductions occurred during the nine months ended
September 30, 2012
, and as a result, through
September 30, 2012
home equity lending commitments had been reduced by
$1.66 billion
, including
$749.5 million
in outstanding balances, to
$3.48 billion
. Other elements of the Reduction Plan included: a $150 million capital infusion from the Company to the Association, which was completed in October, 2010,
63
and implementation of expanded line management, account management and collection processes regarding home equity lending. These process changes are all now substantially complete. Further, the ratio of the Association’s home equity loans and lines of credit portfolio and open commitments relative to Tier 1 Capital, plus the allowance for loan losses, was reduced to
214
% at
September 30, 2012
from
237
% at December 31, 2011. The December 31, 2011 targeted ratio as contained in the Reduction Plan was
261
%.
Effective February 7, 2011, the MOU was terminated and replaced by new memorandums of understanding (the “New MOU”) covering the Association, Third Federal Savings, MHC and the Company. The New MOU addressed the ongoing monitoring of issues raised in the original MOU. In addition, the New MOU required the following actions, all of which we have performed: (1) an independent assessment of the Association’s interest rate risk management policy and a plan to address any deficiencies (the assessment was submitted to the OTS on February 14, 2011); (2) an independent review of management compensation (the review was submitted to the OTS on June 30, 2011); (3) the submittal of an independent enterprise risk management study and a plan to address any deficiencies (the study and plan to address deficiencies were submitted to the OTS on February 11, 2011); (4) the submittal for OTS non-objection 45 days in advance of any plans for new debt, dividends or stock repurchases; (5) formal management and director succession plans (these plans were submitted to the OTS on March 30, 2011 and April 29, 2011, respectively); and (6) revisions to various operational policies (each of which has been completed). In a self-initiated effort, and prior to receipt of the New MOU, in September 2010, we engaged a third party to conduct an independent assessment of our interest rate risk management policy and our enterprise risk management approach. As indicated above, just days after receipt of the New MOU, the assessments were submitted to the OTS. Pursuant to recommendations of the assessments, we installed a new interest rate risk model that provides more customized analysis and we have established new board and management level committees to govern and oversee risk management and compliance. As indicated above, we believe that to date, we have complied with all of the stipulations of the MOU and New MOU. The requirements of the MOU and New MOU carry costs to complete that will continue to increase our non-interest expense in amounts that are not expected to, but may, be material to our results of operations. The Company does not intend to declare or pay a cash dividend, or to repurchase any of its outstanding common stock until the concerns of our regulators are resolved. The requirements of the New MOU will remain in effect until our primary regulator decides to terminate, suspend or modify them.
One aspect of our credit risk concern relates to the high percentage of our loans that are secured by residential real estate in the states of Ohio and Florida, particularly in light of the difficulties that have arisen with respect to the real estate markets in those states. At
September 30, 2012
, approximately
76.8%
and
17.4%
of the combined total of our residential, non-Home Today and construction loans held for investment were secured by properties in Ohio and Florida, respectively. Our 30 or more days delinquency ratios on those loans in Ohio and Florida at
September 30, 2012
were
1.0%
and
2.6%
, respectively. Our 30 or more days delinquency ratio for the non-Home Today portfolio as a whole was
1.3%
. Also, at
September 30, 2012
, approximately
38.9%
and
29.2%
of our home equity loans and lines of credit were secured by properties in Ohio and Florida, respectively. Our 30 days or more delinquency ratios on those loans in Ohio and Florida at
September 30, 2012
were
1.3%
and
1.6%
, respectively. Our 30 or more days delinquency ratio for the home equity loans and lines of credit portfolio as a whole was
1.3%
. While we focus our attention on, and are concerned with respect to the resolution of, all loan delinquencies, as these ratios illustrate, our highest concern is centered on loans that are secured by properties in Florida. The “Allowance for Loan Losses” portion of the preceding PART I, Item 1, Business section provides extensive details regarding our loan portfolio composition, delinquency statistics, our methodology in evaluating our loan loss provisions and the adequacy of our allowance for loan losses. As long as unemployment levels remain high, particularly in Ohio and Florida, and housing values remain depressed, due to prior overbuilding and speculation which has resulted in considerable inventory on the market, we expect that we will continue to experience elevated levels of delinquencies and risk of loss.
Our residential Home Today loans are another area of credit risk concern. Although the recorded investment in these loans totaled
$204.9 million
at
September 30, 2012
, and constituted only
2.0
% of our total “held for investment” loan portfolio balance, these loans comprised
23.1%
and
25.0%
of our 90 days or greater delinquencies and our total delinquencies, respectively. At
September 30, 2012
, approximately
95.7%
and
4.1%
of our residential, Home Today loans were secured by properties in Ohio and Florida, respectively. At
September 30, 2012
, the percentages of those loans delinquent 30 days or more in Ohio and Florida were
21.2%
and
17.2%
, respectively. The disparity between the portfolio composition ratio and delinquency composition ratio reflects the nature of the Home Today loans. We do not offer, and have not offered, loan products frequently considered to be designed to target sub-prime borrowers containing features such as higher fees or higher rates, negative amortization, or low initial payment features with adjustable interest rates. Our Home Today loan products, which prior to March 27, 2009 were made to borrowers with credit profiles who would not have otherwise qualified for our loan products and might have been described as sub-prime borrowers, generally contained the same features as loans offered to our non-Home Today borrowers. The overriding objective of our Home Today lending, just as it is with our non-Home Today lending, was to create successful homeowners. We have attempted to manage our Home Today credit risk by requiring that borrowers attend pre- and post-borrowing financial management education and counseling and that the borrowers be referred to us by a sponsoring organization with which we have partnered. Further, to manage the credit aspect of these loans, inasmuch as
64
the majority of these buyers do not have sufficient funds for required down payments, many loans include private mortgage insurance. At
September 30, 2012
,
54.2%
of Home Today loans included private mortgage insurance coverage. From a peak recorded investment of $306.6 million at December 31, 2007, the total recorded investment of the Home Today portfolio has declined to
$204.9 million
at
September 30, 2012
. This trend generally reflects the evolving conditions in the mortgage real estate market and the tightening of standards imposed by issuers of private mortgage insurance. As part of our effort to manage credit risk, effective March 27, 2009, the Home Today underwriting guidelines were revised to be substantially the same as our traditional mortgage product. At
September 30, 2012
, the recorded investment in Home Today loans originated subsequent to March 27, 2009 was
$2.2 million
. Unless and until lending standards and private mortgage insurance requirements loosen, we expect the Home Today portfolio to continue to decline in balance.
Maintaining Access to Adequate Liquidity and Alternative Funding Sources.
For most insured depositories, customer and community confidence are critical to their ability to maintain access to adequate liquidity and to conduct business in an orderly fashion. The Company believes that maintaining high levels of capital is one of the most important factors in nurturing customer and community confidence. Accordingly, we have managed the pace of our growth in a manner that reflects our emphasis on high capital levels. At
September 30, 2012
, the Association’s ratio of core capital to adjusted tangible assets (a basic industry measure under which 5.00% is deemed to represent a “well capitalized” status) was
13.31%
. We expect to continue to maintain high capital ratios.
In managing its level of liquidity, the Company monitors available funding sources, which include attracting new deposits, borrowing from others, the conversion of assets to cash and the generation of funds through profitable operations. The Company has traditionally relied on retail deposits as its primary means in meeting its funding needs. At
September 30, 2012
, deposits totaled
$8.98 billion
, while borrowings totaled
$488.2 million
and borrowers’ advances and servicing escrows totaled
$195.4 million
, combined. In evaluating funding sources, we consider many factors, including cost, duration, current availability, expected sustainability, impact on operations and capital levels.
To attract deposits, we offer our customers attractive rates of return on our deposit products. Our deposit products typically offer rates that are highly competitive with the rates on similar products offered by other financial institutions. We intend to continue this practice.
We preserve the availability of alternative funding sources through various mechanisms. First, by maintaining high capital levels, we retain the flexibility to increase our balance sheet size without jeopardizing our capital adequacy. Effectively, this permits us to increase the rates that we offer on our deposit products thereby attracting more potential customers. Second, we pledge available real estate mortgage loans and investment securities with the Federal Home Loan Bank of Cincinnati (“FHLB”) and the Federal Reserve Bank of Cleveland (“Federal Reserve”). At
September 30, 2012
, these collateral pledge support arrangements provide for additional borrowing capacity of up to
$4.22 billion
with the FHLB (provided an additional investment in FHLB capital stock of up to
$75.0 million
is made) and up to
$233.3 million
at the Federal Reserve. Third, we invest in high quality marketable securities that exhibit limited market price variability, and to the extent that they are not needed as collateral for borrowings, can be sold in the institutional market and converted to cash. At
September 30, 2012
, our investment securities portfolio totaled
$421.4 million
. Finally, cash flows from operating activities have been a regular source of funds. During the fiscal years ended
September 30, 2012
,
2011
and
2010
, cash flows from operations totaled
$155.6 million
,
$135.6 million
and
$116.5 million
, respectively. Cash flow from operations during the fiscal year ended September 30, 2010 was adversely affected by the $51.9 million prepayment of Federal Deposit Insurance Corporation (FDIC) deposit insurance assessments made in December 2009, which has a remaining balance of
$12.1 million
at
September 30, 2012
.
Finally, historically, a portion of the residential first mortgage loans that we originated were considered to be highly liquid as they were eligible for sale/delivery to Fannie Mae. However, due to delivery requirement changes imposed by Fannie Mae, effective July 1, 2010, this channel of available liquidity has been significantly reduced. Refer to the
Residential Real Estate Mortgage Loans
section in PART I, Item 1, Business for additional details. At
September 30, 2012
,
$124.5 million
of agency and non-agency eligible, long-term, fixed-rate loans were reported as “held for sale”. During the fiscal year ended September 30, 2012,
$11.4 million
of agency-compliant HARP II loans were sold. Although negotiations were conducted with several potential buyers, no loan sales to private investors were completed during the current fiscal year. We continue to evaluate and consider adopting the various process changes which we would be required to make in order to conform our newly originated mortgage loans with Fannie Mae's requirements. To date, we have not elected to incorporate those process changes into our core operations, should we elect to do so, we believe that we have the ability, after implementing appropriate process changes, to originate mortgages that would conform to the Fannie Mae Selling Guide requirements and would be eligible for delivery to Fannie Mae.
Overall, while customer and community confidence can never be assured, the Company believes that our liquidity is adequate and that we have adequate access to alternative funding sources.
65
Monitoring and Controlling Operating Expenses.
We continue to focus on managing operating expenses. Our ratio of non-interest expense to average assets was
1.52%
for the fiscal year ended
September 30, 2012
and
1.54%
for the fiscal year ended
September 30, 2011
. As of
September 30, 2012
, our average assets per full-time employee and our average deposits per full-time employee were
$11.7 million
and
$9.2 million
, respectively. Based on industry statistics published by the Office of Comptroller of the Currency as of December 31, 2011, we believe that each of these measures compares favorably with the averages for our peer group. Our average deposits held at our branch offices (
$230.3 million
per branch office as of
September 30, 2012
) contribute to our expense management efforts by limiting the overhead costs of serving our deposit customers. We will continue our efforts to control operating expenses as we grow our business.
While we devote a great deal of our attention to managing our operating expenses, certain costs are largely outside of our control. One expense that increased dramatically beginning in fiscal 2009 is our FDIC deposit insurance premiums and assessments. In November 2009, the FDIC amended its assessment regulations to require insured institutions to pay, on December 30, 2009, their estimated quarterly risk-based assessments for the fourth quarter of calendar 2009 and to also prepay their estimated risk-based assessments for all of the calendar years 2010, 2011 and 2012. Our required $51.9 million prepayment was determined based upon our assessment rate in effect on September 30, 2009 and reflected a presumed 5% annualized growth factor applied to the institution’s assessment base as well as an assumed assessment rate increase of three cents per $100 of deposits effective January 1, 2011. In recognition of the industry’s weakened condition and the significant losses experienced by the FDIC, the prepayment was intended to preclude additional special assessments for the foreseeable future; however, the prepayment does not preclude the FDIC from changing assessment rates or from revising the risk-based assessment system, pursuant to the existing notice and comment rulemaking framework. As more fully described in PART I Item 1. Business—SUPERVISION AND REGULATION
Federal Banking Regulation—Insurance of Deposit Accounts
the Dodd-Frank Act required the FDIC to revise its assessment system to base it on each institution’s total assets less tangible capital instead of deposits. While the assessment base increased for all institutions, including the Association, changes pursuant to the Dodd-Frank requirement resulted in a
5%
increase in the Association's assessment base which was more than offset by a
35%
reduction in the Association’s assessment rate during the quarter immediately prior to the change when compared to the quarter immediately following the change, which was effective April 1, 2011.
Critical Accounting Policies
Critical accounting policies are defined as those that involve significant judgments and uncertainties, and could potentially result in materially different results under different assumptions and conditions. We believe that the most critical accounting policies upon which our financial condition and results of operations depend, and which involve the most complex subjective decisions or assessments, are our policies with respect to our allowance for loan losses, mortgage servicing rights, income taxes, pension benefits and stock-based compensation.
Allowance for Loan Losses.
The allowance for loan losses is the amount estimated by management as necessary to absorb credit losses incurred in the loan portfolio that are both probable and reasonably estimable at the balance sheet date. The amount of the allowance is based on significant estimates and the ultimate losses may vary from such estimates as more information becomes available or conditions change. The methodology for determining the allowance for loan losses is considered a critical accounting policy by management due to the high degree of judgment involved, the subjectivity of the assumptions used and the potential for changes in the economic environment that could result in changes to the amount of the recorded allowance for loan losses. At
September 30, 2012
, the allowance for loan losses was
$100.5 million
or
0.97%
of total loans. An increase or decrease of 10% in the allowance would result in a
$10.0 million
charge or credit, respectively, to income before income taxes.
As a substantial percentage of our loan portfolio is collateralized by real estate, appraisals of the underlying value of property securing loans are critical in determining the amount of the allowance required for specific loans. Assumptions are instrumental in determining the value of properties. Overly optimistic assumptions or negative changes to assumptions could significantly affect the valuation of a property securing a loan and the related allowance determined. Management carefully reviews the assumptions supporting such appraisals to determine that the resulting values reasonably reflect amounts realizable on the related loans.
Management performs a quarterly evaluation of the adequacy of the allowance for loan losses. We consider a variety of factors in establishing this estimate including, but not limited to, current economic conditions, delinquency statistics, geographic concentrations, the adequacy of the underlying collateral, the financial strength of the borrower, results of internal loan reviews and other relevant factors. This evaluation is inherently subjective as it requires material estimates by management that may be susceptible to significant change based on changes in economic and real estate market conditions.
Historically, the evaluation has been comprised of a specific component and a general component. The specific component relates to loans that are delinquent or otherwise identified as a problem loan through the application of our loan
66
review process and our loan grading system. All such loans are evaluated individually, with principal consideration given to the value of the collateral securing the loan. Through September 30, 2011, specific valuation allowances were established as required by this analysis and charge-offs, when necessary, were recorded when the loan was resolved through deed in lieu, foreclosure or short sales. Beginning in September 2011, a portion of the SVA was reclassified as IVA. This portion represents the allowance on individually reviewed loans dependent on cash flows, such as performing TDRs, and a portion of the allowance on loans that represents further deterioration in the fair value not supported by an appraisal. Refer to the
Allowance for Loan Losses
section in PART I, Item 1, Business
—
THIRD FEDERAL SAVINGS AND LOAN ASSOCIATION OF CLEVELAND—
Lending Activities
,
for additional details. The general component of the evaluation is determined by segregating the remaining loans by type of loan, risk weighting (if applicable) and payment history. We also analyze historical loss experience, delinquency trends, general economic conditions and geographic concentrations. Effective March 31, 2009, loss factors used in determining an appropriate allowance level are supplemented by a market valuation allowance that addresses more qualitative factors that impact potential losses. The conditions evaluated include a combination of various market conditions, mainly a decrease in home values and an increase in unemployment rates, which have caused higher delinquencies and charge-offs in the loan portfolio, and increased foreclosure rates. This analysis establishes factors that are applied to the loan groups to determine the amount of the general component of the allowance for loan losses.
During the quarter ended December 31, 2011, a one-time charge-off of SVAs, which was $55.5 million at September 30, 2011, was recorded by the Company in connection with the adoption of the OCC's prescribed methodology regarding loan impairments. Refer to the
Allowance for Loan Losses
section in PART I, Item 1, Business—THIRD FEDERAL SAVINGS AND LOAN ASSOCIATION OF CLEVELAND—
Lending Activities
, for additional details. Additionally, effective September 30, 2012, pursuant to OCC issued guidance, $15.8 million of performing loans, where all borrowers have been discharged of their obligation through Chapter 7 bankruptcy procedures, were charged-off.
Actual loan losses may be significantly more than the allowances we have established, which could have a material negative effect on our financial results.
Mortgage Servicing Rights
. Mortgage servicing rights represent the present value of the estimated future servicing fees expected to be received pursuant to the right to service loans in our loan servicing portfolio. Mortgage servicing rights are recognized as assets for both purchased rights and for the allocated value of retained servicing rights on loans sold. The most critical accounting policy associated with mortgage servicing is the methodology used to determine the fair value of capitalized mortgage servicing rights. A number of estimates affect the capitalized value and include: (1) the mortgage loan prepayment speed assumption; (2) the estimated prospective cost expected to be incurred in connection with servicing the mortgage loans; and (3) the discount factor used to compute the present value of the mortgage servicing right. The mortgage loan prepayment speed assumption is significantly affected by interest rates. In general, during periods of falling interest rates, mortgage loans prepay faster and the value of our mortgage servicing assets decreases. Conversely, during periods of rising rates, the value of mortgage servicing rights generally increases due to slower rates of prepayments. The estimated prospective cost expected to be incurred in connection with servicing the mortgage loans is deducted from the retained servicing fee (gross mortgage loan interest rate less amounts remitted to third parties—investor pass-thru rate, guarantee fee, mortgage insurance fee, etc.) to determine the net servicing fee for purposes of capitalization computations. To the extent that prospective actual costs incurred to service the mortgage loans differ from the estimate, our future results will be adversely (or favorably) impacted. The discount factor selected to compute the present value of the servicing right reflects expected marketplace yield requirements.
67
The amount and timing of mortgage servicing rights amortization is adjusted monthly based on actual results. In addition, on a quarterly basis, we perform a valuation review of mortgage servicing rights for potential decreases in value. This quarterly valuation review entails applying current assumptions to the portfolio classified by interest rates and, secondarily, by prepayment characteristics. At
September 30, 2012
, the capitalized value of our right to service
$3.81 billion
of loans for others was
$19.6 million
, or
0.51%
of the serviced loan portfolio and was based on an estimated weighted-average life of 2.8 years. Activity in the balance of mortgage servicing rights is summarized as follows:
|
Year Ended September 30, 2012
|
|||||||||||
|
Mortgage
|
Valuation
|
||||||||||
|
Servicing Asset
|
Allowance
|
Net
|
|||||||||
|
Balance - beginning of period
|
$
|
28,919
|
|
$
|
—
|
|
$
|
28,919
|
|
||
|
Additions from loan securitizations/sales
|
43
|
|
43
|
|
|||||||
|
Amortization
|
(9,349
|
)
|
(9,349
|
)
|
|||||||
|
Net change in valuation allowance
|
—
|
|
—
|
|
|||||||
|
Balance - end of period
|
$
|
19,613
|
|
$
|
—
|
|
$
|
19,613
|
|
||
|
Fair value of capitalized amounts
|
$
|
25,294
|
|
||||||||
|
Year Ended September 30, 2011
|
|||||||||||
|
Mortgage
|
Valuation
|
||||||||||
|
Servicing Asset
|
Allowance
|
Net
|
|||||||||
|
Balance - beginning of period
|
$
|
38,676
|
|
$
|
(18
|
)
|
$
|
38,658
|
|
||
|
Additions from loan securitizations/sales
|
137
|
|
137
|
|
|||||||
|
Amortization
|
(9,894
|
)
|
(9,894
|
)
|
|||||||
|
Net change in valuation allowance
|
18
|
|
18
|
|
|||||||
|
Balance - end of period
|
$
|
28,919
|
|
$
|
—
|
|
$
|
28,919
|
|
||
|
Fair value of capitalized amounts
|
$
|
40,654
|
|
||||||||
|
Year Ended September 30, 2010
|
|||||||||||
|
Mortgage
|
Valuation
|
||||||||||
|
Servicing Asset
|
Allowance
|
Net
|
|||||||||
|
Balance - beginning of period
|
$
|
41,426
|
|
$
|
(51
|
)
|
$
|
41,375
|
|
||
|
Additions from loan securitizations/sales
|
6,638
|
|
6,638
|
|
|||||||
|
Amortization
|
(9,388
|
)
|
(9,388
|
)
|
|||||||
|
Net change in valuation allowance
|
33
|
|
33
|
|
|||||||
|
Balance - end of period
|
$
|
38,676
|
|
$
|
(18
|
)
|
$
|
38,658
|
|
||
|
Fair value of capitalized amounts
|
$
|
47,733
|
|
||||||||
68
At
September 30, 2012
, substantially all of the approximately
37.4 thousand
loans serviced for Fannie Mae and others were performing in accordance with their contractual terms and management believes that it has no material repurchase obligations associated with these loans. The following tables summarize our repurchases and loss reimbursements to investors, charges related to default servicing non-compliance and compensatory fees incurred during the indicated periods. All transactions were related to loans serviced for Fannie Mae. There were no material repurchase or loss reimbursement requests outstanding at
September 30, 2012
. An accrual for $2.4 million has been established for probable losses.
|
|
For the Fiscal Years Ended September 30,
|
|||||||||||||||||||||||||||||||
|
|
2012
|
2011
|
2010
|
|||||||||||||||||||||||||||||
|
|
Number
of Loans |
Balance
|
Losses or
Charges Incurred |
Number
of Loans |
Balance
|
Losses or
Charges Incurred |
Number
of Loans |
Balance
|
Losses or
Charges Incurred |
|||||||||||||||||||||||
|
|
(Dollars in thousands)
|
|||||||||||||||||||||||||||||||
|
Repurchased loans:
|
||||||||||||||||||||||||||||||||
|
Non-recourse, non-
performing loans(1)
|
22
|
|
$
|
4,133
|
|
$
|
568
|
|
1
|
|
$
|
146
|
|
$
|
15
|
|
1
|
|
$
|
340
|
|
$
|
26
|
|
||||||||
|
Recourse, non-
performing loans(2)
|
3
|
|
86
|
|
3
|
|
9
|
|
284
|
|
5
|
|
8
|
|
275
|
|
9
|
|
||||||||||||||
|
Non-recourse,
performing loans(3)
|
—
|
|
—
|
|
—
|
|
6
|
|
933
|
|
10
|
|
150
|
|
24,014
|
|
—
|
|
||||||||||||||
|
Post-disposition file reviews
(4)
|
24
|
|
—
|
|
1,713
|
|
4
|
|
—
|
|
397
|
|
1
|
|
—
|
|
74
|
|
||||||||||||||
|
Compensatory fees related to
default servicing(5)
|
—
|
|
—
|
|
89
|
|
—
|
|
—
|
|
—
|
|
—
|
|
—
|
|
—
|
|
||||||||||||||
|
49
|
|
$
|
4,219
|
|
$
|
2,373
|
|
20
|
|
$
|
1,363
|
|
$
|
427
|
|
160
|
|
$
|
24,629
|
|
$
|
109
|
|
|||||||||
(1) Repurchases of non-recourse, non-performing loans were generally attributed to underwriting (primarily debt-to-income ratio) non-compliance.
(2) At September 30, 2012 the Association serviced 178 loans with a principal balance of $6.3 million for Fannie Mae that were subject to recourse. Of these, 12 loans with principal balances that totaled $439 thousand were delinquent 30 days or more. All other loans serviced for others were sold without recourse.
(3) Repurchases of non-recourse, performing loans during prior periods were the result of post-sales file reviews that identified underwriting (primarily debt-to-income ratio) non-compliance.
(4) Post-disposition file reviews resulted in losses or charges when loans which had been sold to Fannie Mae failed to perform; the underlying collateral was sold; a loss was incurred; and a post-disposition file review identified underwriting (primarily debt-to-income ratio) non-compliance.
(5) Compensatory fees related to default servicing represented instances in which the Association's default servicing procedures did not comply with Fannie Mae's servicing requirements.
Income Taxes.
We consider accounting for income taxes a critical accounting policy due to the subjective nature of certain estimates that are involved in the calculation. We use the asset/liability method of accounting for income taxes in which deferred tax assets and liabilities are established for the temporary differences between the financial reporting basis and the tax basis of our assets and liabilities. We must assess the realization of the deferred tax asset and, to the extent that we believe that recovery is not likely, a valuation allowance is established. Adjustments to increase or decrease the valuation allowance are charged or credited, respectively, to income tax expense. The carry forward portion of our $55.0 million charitable contribution expense incurred in April 2007 in conjunction with the formation of the Third Federal Foundation expired on
September 30, 2012
, with a $6.0 million valuation allowance representing the portion of the carryforward that is expiring unused. Although we have determined a valuation allowance is not required for deferred tax assets at
September 30, 2012
, there is no guarantee that those assets will be recognizable in the future.
Pension Benefits.
The determination of our obligations and expense for pension benefits is dependent upon certain assumptions used in calculating such amounts. Key assumptions used in the actuarial valuations include the discount rate, expected long-term rate of return on plan assets and rates of increase in compensation. Actual results could differ from the assumptions and market driven rates may fluctuate. Significant differences in actual experience or significant changes in the assumptions could materially affect future pension obligations and expense.
Stock-based Compensation.
We recognize the cost of associate and director services received in exchange for awards of equity instruments based on the grant date fair value of those awards in accordance with FASB ASC 718, “Compensation—Stock Compensation."
69
We estimate the per share value of option grants using the Black-Scholes option pricing model using assumptions for expected dividend yield, expected stock price volatility, risk-free interest rate and expected option term. These assumptions are subjective in nature and involve uncertainties, and therefore, cannot be determined with precision.
The per share value of options is highly sensitive to changes in assumptions. In general, the per share fair value of options will move in the same direction as changes in the expected stock price volatility, risk-free interest rate and expected option term, and in the opposite direction from changes in expected dividend yield. For example, the per share fair value of options will generally increase as expected stock volatility increases, risk-free interest rate increases, expected option term increases and expected dividend yield decreases. The use of different assumptions or different option pricing models could result in materially different per share fair values of options.
Comparison of Financial Condition at
September 30, 2012
and
2011
Total assets
increased
$625.2 million
, or
6%
, to
$11.52 billion
at
September 30, 2012
from
$10.89 billion
at
September 30, 2011
. This change was the result of increases in our mortgage loans held for sale and our mortgage loan portfolio combined with increases in cash and cash equivalents and investment securities.
Cash and cash equivalents
increased
$13.5 million
, or
5%
, to
$308.3 million
at
September 30, 2012
from
$294.8 million
at
September 30, 2011
. The net increase can be attributed to maintaining liquidity on the balance sheet in the current interest rate environment.
Investment securities
increased
$13.0 million
, or
3%
, to
$421.4 million
at
September 30, 2012
from
$408.4 million
at
September 30, 2011
. During the quarter ended June 30, 2012, all of our investment securities in the held to maturity portfolio were transferred to the available for sale portfolio to ensure that the securities would be eligible for inclusion in the computation of regulatory liquidity. There were no sales of investment securities during the fiscal year ended
September 30, 2012
as
$228.0 million
in purchases of investment securities were substantially offset by
$214.1 million
in principal paydowns and $4.7 million of net acquisition premium amortization which occurred in the mortgage-backed securities portfolio . Differences between cost and fair value for investment securities held in the available for sale portfolio also affected the change in the balance during the fiscal year.
Mortgage loans held for sale increased to
$124.5 million
at
September 30, 2012
from none at
September 30, 2011
. During the quarter ended March 31, 2012, a pool of long-term, fixed-rate loans were reclassified from the portfolio of loans held for investment and an investment banking representative was engaged to offer those loans for sale, on a servicing retained basis, as non-agency, whole loans in the secondary market. No sales of such loans were completed or committed during the fiscal year ended September 30, 2012. Mortgage loans held for sale at September 30, 2012 also included $
9.6 million
of agency-compliant HARP II loans.
Loans held for investment, net,
increased
$474.1 million
, or
5%
, to
$10.22 billion
at
September 30, 2012
from
$9.75 billion
at
September 30, 2011
. Supported by consistent loan growth, residential mortgage loans
increased
$766.7 million
, or
10%
, to
$8.15 billion
during the year ended
September 30, 2012
. The
increase
in residential mortgage loans includes the negative impact of
$97.6 million
in net charge-offs from both Home Today and non-Home Today loans during the year ended
September 30, 2012
. The total allowance for loan losses
decreased
$56.5 million
, or
36%
, to
$100.5 million
from
$157.0 million
at
September 30, 2011
. As previously reported, the Association’s primary federal banking regulator, the OCC, required all SVAs maintained by savings institutions to be charged off by March 31, 2012. As permitted, the Company elected to early-adopt this methodology effective December 31, 2011. As a result, reported loan charge-offs for the year ended
September 30, 2012
were impacted by the $55.5 million balance of the SVA that was recorded at September 30, 2011. During the year ended
September 30, 2012
, $
1.49 billion
of three and five year “SmartRate” loans were originated while $
1.16 billion
of 10, 15, and 30 year fixed-rate first mortgage loans were originated. These originations were partially offset by paydowns. Historically, the preponderance of our new loan originations was comprised of fixed-rate loans which were frequently offset by fixed-rate loan sales. Loan sales of $
11.4 million
were recorded during the year ended
September 30, 2012
. This limited amount of loan sales activity reflects the impact of the changes that were made by Fannie Mae, the Association’s primary loan investor, related to requirements for loans that it accepts, as well as the strategy of originating adjustable rate loans to be held for investment on our balance sheet. Refer to the
Controlling Our Interest Rate Risk Exposure
section of the
Overview
for additional discussion regarding our management of interest rate risk. The
increase
in residential mortgage loans was partially offset by a
$335.7 million
decrease
in home equity loans and lines of credit. Effective June 28, 2010 through February 2012, we suspended the acceptance of new home equity loan and line of credit applications with the exception of bridge loans. Beginning in March 2012, we again offered new home equity lines of credit to qualifying existing home equity customers, subject to certain property and credit performance conditions. At
September 30, 2012
, pending commitments to extend new home equity lines of
70
credit to our existing customers totaled $
3.5 million
. Refer to the
Controlling Our Interest Rate Risk
Exposure
section of the
Overview
for additional information.
Mortgage loan servicing assets, net,
decreased
$9.3 million
, or
32%
, to
$19.6 million
at
September 30, 2012
from
$28.9 million
at
September 30, 2011
. This net change reflects the significant reduction in loan sales, and accompanying creation of new mortgage loan servicing assets, that resulted from the delivery requirement changes imposed by Fannie Mae and as described above. For the fiscal year ended
September 30, 2012
mortgage loan servicing asset amortization totaled
$9.3 million
while asset generation from new sales totaled
$43 thousand
. The majority of the amortization is linked to the cyclically low level of mortgage interest rates that prompted accelerated refinance activity by borrowers. The principal balance of loans serviced
decreased
$1.63 billion
, or
30%
, during the year ended
September 30, 2012
to
$3.81 billion
from
$5.43 billion
at
September 30, 2011
.
Deposits
increased
$265.5 million
, or
3%
, to
$8.98 billion
at
September 30, 2012
from
$8.72 billion
at
September 30, 2011
. The
increase
in deposits was the result of a
$139.5 million
increase
in our certificates of deposit combined with a
$97.3 million
increase
in our high-yield savings accounts (a subcategory of our savings accounts) and a
$31.0 million
increase
in our high-yield checking accounts (a subcategory of our negotiable order of withdrawal accounts) during the fiscal year ended
September 30, 2012
. We believe that our high-yield savings accounts as well as our high-yield checking accounts provide a stable source of funds. In addition, our high yield savings accounts are expected to reprice in a manner similar to our equity loan products, and, therefore, assist us in managing interest rate risk.
Borrowed funds
increased
$348.3 million
, or
249%
, to
$488.2 million
at
September 30, 2012
from
$139.9 million
at
September 30, 2011
. The largest component of the increase is $320.0 million of lower cost, short-term (overnight) borrowings from the Federal Home Loan Bank of Cincinnati, the proceeds of which are held in interest bearing cash equivalents and augment our liquidity.
Principal, interest, and related escrow owed on loans serviced
decreased
$24.4 million
, or
16%
, to
$127.5 million
at
September 30, 2012
from
$151.9 million
at
September 30, 2011
. Principal and interest collected decreased $11.9 million along with a $12.5 million decrease in retained tax payments collected from borrowers in the current period. Principal and interest will fluctuate based on normal curtailments and paydowns, but historically low mortgage interest rates increased the amount of refinancing activity in the preceding periods. As a result of the aforementioned activity and the low volume of loan sales in the current fiscal year, the principal balance of loans serviced
decreased
$1.62 billion, or
30%
, to $
3.81 billion
from $
5.43 billion
at
September 30, 2011
.
Accrued expenses and other liabilities
decreased
$6.9 million
to
$46.3 million
at
September 30, 2012
from
$53.2 million
at
September 30, 2011
. This change primarily reflects a $16.0 million decrease in the accruals related to our retirement and pension plans as a result of a plan amendment to freeze future pension benefit accruals as of December 31, 2011. This decrease was partially offset by the in-transit status of $5.3 million of real estate tax payments that have been collected from borrowers and are being remitted to various taxing agencies, and a $2.4 million increase in loss reimbursement accruals related to serviced loans.
Shareholders’ equity
increased
$32.9 million
, or
2%
, to
$1.81 billion
at
September 30, 2012
from
$1.77 billion
at
September 30, 2011
. Activity reflects
$11.5 million
of net income in the
2012
fiscal year combined with $
11.1 million
of adjustments related to the allocation of shares of our common stock related to awards under the stock-based compensation plan and the ESOP, a $
7.8 million
reduction
in the actuarially determined balance of our pension obligation and a $
2.5 million
increase
in gains on investment securities as a result of the transfer of securities from held to maturity to available for sale.
71
Analysis of Net Interest Income
Net interest income represents the difference between the income we earn on our interest-earning assets and the expense we pay on our interest-bearing liabilities. Net interest income depends on the volume of interest-earning assets and interest-bearing liabilities and the rates earned on such assets and the rates paid on such liabilities.
Average balances and yields
.
The following table sets forth average balances, average yields and costs, and certain other information at and for the fiscal years indicated. No tax-equivalent yield adjustments were made, as the effect thereof was not material. Average balances are derived from daily average balances. Non-accrual loans were included in the computation of average balances, but have been reflected in the table as loans carrying a zero yield. The yields set forth below include the effect of deferred fees, discounts and premiums that are amortized or accreted to interest income or interest expense.
|
|
For the Fiscal Years Ended September 30,
|
|||||||||||||||||||||||||||||||
|
|
2012
|
2011
|
2010
|
|||||||||||||||||||||||||||||
|
|
Average
Balance
|
Interest
Income/
Expense
|
Yield/
Cost
|
Average
Balance
|
Interest
Income/
Expense
|
Yield/
Cost
|
Average
Balance
|
Interest
Income/
Expense
|
Yield/
Cost
|
|||||||||||||||||||||||
|
|
(Dollars in thousands)
|
|||||||||||||||||||||||||||||||
|
Interest-earning assets:
|
||||||||||||||||||||||||||||||||
|
Other interest-bearing cash
equivalents
|
$
|
279,053
|
|
697
|
|
0.25
|
%
|
$
|
293,626
|
|
821
|
|
0.28
|
%
|
505,706
|
|
1,216
|
|
0.24
|
%
|
||||||||||||
|
Investment securities
|
10,212
|
|
38
|
|
0.37
|
%
|
11,821
|
|
101
|
|
0.85
|
%
|
17,343
|
|
364
|
|
2.10
|
%
|
||||||||||||||
|
Mortgage-backed securities
|
375,513
|
|
6,202
|
|
1.65
|
%
|
507,009
|
|
11,594
|
|
2.29
|
%
|
635,845
|
|
19,231
|
|
3.02
|
%
|
||||||||||||||
|
Loans
|
10,264,117
|
|
409,400
|
|
3.99
|
%
|
9,828,565
|
|
413,464
|
|
4.21
|
%
|
9,327,280
|
|
415,477
|
|
4.45
|
%
|
||||||||||||||
|
Federal Home Loan Bank stock
|
35,620
|
|
1,516
|
|
4.26
|
%
|
35,620
|
|
1,514
|
|
4.25
|
%
|
35,620
|
|
1,603
|
|
4.50
|
%
|
||||||||||||||
|
Total interest-earning assets
|
10,964,515
|
|
417,853
|
|
3.81
|
%
|
10,676,641
|
|
427,494
|
|
4.00
|
%
|
10,521,794
|
|
437,891
|
|
4.16
|
%
|
||||||||||||||
|
Noninterest-earning assets
|
282,346
|
|
261,369
|
|
302,647
|
|
||||||||||||||||||||||||||
|
Total assets
|
$
|
11,246,861
|
|
$
|
10,938,010
|
|
$
|
10,824,441
|
|
|||||||||||||||||||||||
|
Interest-bearing liabilities:
|
||||||||||||||||||||||||||||||||
|
NOW accounts
|
$
|
986,198
|
|
2,839
|
|
0.29
|
%
|
$
|
975,938
|
|
3,586
|
|
0.37
|
%
|
$
|
975,889
|
|
5,485
|
|
0.56
|
%
|
|||||||||||
|
Savings accounts
|
1,756,840
|
|
7,533
|
|
0.43
|
%
|
1,631,764
|
|
9,954
|
|
0.61
|
%
|
1,442,641
|
|
13,181
|
|
0.91
|
%
|
||||||||||||||
|
Certificates of deposit
|
6,064,950
|
|
142,728
|
|
2.35
|
%
|
6,137,246
|
|
164,303
|
|
2.68
|
%
|
6,301,459
|
|
189,796
|
|
3.01
|
%
|
||||||||||||||
|
Borrowed funds
|
359,666
|
|
2,546
|
|
0.71
|
%
|
123,570
|
|
2,003
|
|
1.62
|
%
|
70,009
|
|
1,923
|
|
2.75
|
%
|
||||||||||||||
|
Total interest-bearing liabilities
|
9,167,654
|
|
155,646
|
|
1.70
|
%
|
8,868,518
|
|
179,846
|
|
2.03
|
%
|
8,789,998
|
|
210,385
|
|
2.39
|
%
|
||||||||||||||
|
Noninterest-bearing liabilities
|
279,909
|
|
312,147
|
|
281,976
|
|
||||||||||||||||||||||||||
|
Total liabilities
|
9,447,563
|
|
9,180,665
|
|
9,071,974
|
|
||||||||||||||||||||||||||
|
Shareholders’ equity
|
1,799,298
|
|
1,757,345
|
|
1,752,467
|
|
||||||||||||||||||||||||||
|
Total liabilities and
shareholders’ equity
|
$
|
11,246,861
|
|
$
|
10,938,010
|
|
$
|
10,824,441
|
|
|||||||||||||||||||||||
|
Net interest income
|
$
|
262,207
|
|
$
|
247,648
|
|
$
|
227,506
|
|
|
||||||||||||||||||||||
|
Interest rate spread(1)
|
2.11
|
%
|
1.97
|
%
|
1.77
|
%
|
||||||||||||||||||||||||||
|
Net interest-earning assets(2)
|
$
|
1,796,861
|
|
$
|
1,808,123
|
|
$
|
1,731,796
|
|
|||||||||||||||||||||||
|
Net interest margin(3)
|
2.39
|
%
|
2.32
|
%
|
2.16
|
%
|
||||||||||||||||||||||||||
|
Average interest-earning assets to
average interest-bearing liabilities
|
119.60
|
%
|
120.39
|
%
|
119.70
|
%
|
||||||||||||||||||||||||||
______________________
|
(1)
|
Interest rate spread represents the difference between the yield on average interest-earning assets and the cost of average interest-bearing liabilities.
|
|
(2)
|
Net interest-earning assets represent total interest-earning assets less total interest-bearing liabilities.
|
|
(3)
|
Net inter
est margin represents net interest income divided by total interest-earning assets.
|
72
Rate/Volume Analysis.
The following table presents the effects of changing rates and volumes on our net interest income for the fiscal years indicated. The rate column shows the effects attributable to changes in rate (changes in rate multiplied by prior volume). The volume column shows the effects attributable to changes in volume (changes in volume multiplied by prior rate). The net column represents the sum of the prior columns. For purposes of this table, changes attributable to both rate and volume, which cannot be segregated, have been allocated proportionately, based on the changes due to rate and the changes due to volume.
|
|
For the Fiscal Years Ended September 30, 2012 vs. 2011
|
For the Fiscal Years Ended September 30, 2011 vs. 2010
|
|||||||||||||||||||||
|
|
Increase (Decrease)
Due to
|
Increase (Decrease)
Due to |
|
||||||||||||||||||||
|
|
Volume
|
Rate
|
Net
|
Volume
|
Rate
|
Net
|
|||||||||||||||||
|
|
(In thousands)
|
(In thousands)
|
|||||||||||||||||||||
|
Interest-earning assets:
|
|||||||||||||||||||||||
|
Other interest-bearing cash equivalents
|
$
|
(39
|
)
|
$
|
(85
|
)
|
$
|
(124
|
)
|
$
|
(646
|
)
|
$
|
251
|
|
$
|
(395
|
)
|
|||||
|
Investment securities
|
(12
|
)
|
(51
|
)
|
(63
|
)
|
(92
|
)
|
(171
|
)
|
(263
|
)
|
|||||||||||
|
Mortgage-backed securities
|
(2,604
|
)
|
(2,788
|
)
|
(5,392
|
)
|
(3,465
|
)
|
(4,172
|
)
|
(7,637
|
)
|
|||||||||||
|
Loans
|
17,885
|
|
(21,949
|
)
|
(4,064
|
)
|
21,719
|
|
(23,732
|
)
|
(2,013
|
)
|
|||||||||||
|
Federal Home Loan Bank stock
|
—
|
|
2
|
|
2
|
|
—
|
|
(89
|
)
|
(89
|
)
|
|||||||||||
|
Total interest-earning assets
|
15,230
|
|
(24,871
|
)
|
(9,641
|
)
|
17,516
|
|
(27,913
|
)
|
(10,397
|
)
|
|||||||||||
|
Interest-bearing liabilities:
|
|||||||||||||||||||||||
|
NOW accounts
|
38
|
|
(785
|
)
|
(747
|
)
|
—
|
|
(1,899
|
)
|
(1,899
|
)
|
|||||||||||
|
Passbook savings
|
716
|
|
(3,137
|
)
|
(2,421
|
)
|
2,102
|
|
(5,329
|
)
|
(3,227
|
)
|
|||||||||||
|
Certificates of deposit
|
(1,915
|
)
|
(19,660
|
)
|
(21,575
|
)
|
(4,842
|
)
|
(20,651
|
)
|
(25,493
|
)
|
|||||||||||
|
Borrowed funds
|
770
|
|
(227
|
)
|
543
|
|
172
|
|
(92
|
)
|
80
|
|
|||||||||||
|
Total interest-bearing liabilities
|
(391
|
)
|
(23,809
|
)
|
(24,200
|
)
|
(2,568
|
)
|
(27,971
|
)
|
(30,539
|
)
|
|||||||||||
|
Net change in net interest income
|
$
|
15,621
|
|
$
|
(1,062
|
)
|
$
|
14,559
|
|
$
|
20,084
|
|
$
|
58
|
|
$
|
20,142
|
|
|||||
Comparison of Operating Results for the Fiscal Years Ended
September 30, 2012
and
2011
General.
Net income
increased
$2.2 million
, or
24%
, to
$11.5 million
for the fiscal year ended
September 30, 2012
compared to
$9.3 million
for the fiscal year ended
September 30, 2011
. This change was attributed to an increase in net interest income partially offset by a decrease in non-interest income, and increases in the provision for loan losses and non-interest expense.
Interest Income.
Interest income
decreased
$9.6 million
or
2%
, to
$417.9 million
for the fiscal year ended
September 30, 2012
compared to
$427.5 million
for the prior fiscal year. The
decrease
in interest income resulted primarily from decreases in interest income from loans and mortgage-backed securities.
Interest income on mortgage-backed securities
decreased
$5.4 million
, or
47%
, to
$6.2 million
from
$11.6 million
during the prior fiscal year. The average yield on mortgage-backed securities
decreased
64
basis points to
1.65%
compared to
2.29%
in the prior fiscal year as interest rates on adjustable rate securities reset to lower current rates and higher, fixed-rate securities continue to experience accelerated paydowns. The average balance of mortgage-backed securities
decreased
$131.5 million
to
$375.5 million
compared to
$507.0 million
during the prior fiscal year. The
$214.1 million
in principal paydowns and maturities which occurred in the current fiscal year were more than offset by
$228.0 million
in purchases. There were no sales of mortgage-backed securities during the current fiscal year.
Interest income on loans
decreased
$4.1 million
, or less than
1%
, to
$409.4 million
compared to
$413.5 million
in the prior fiscal year. This change was attributed to a
22
basis point
decrease
in the yield to
3.99%
from
4.21%
as historically low interest rates have increased the amount of refinance activity. Additionally, the increase in our “SmartRate” adjustable-rate first mortgage loan originations during the fiscal year at interest rates below rates offered on fixed-rate products contributed to the lower average yield. The
decrease
in interest income on loans during the current fiscal year was partially offset by the
$435.5 million
increase
in the average balance of loans to
$10.26 billion
in the current fiscal year compared to
$9.83 billion
in the prior fiscal year as new loan production exceeded repayments and loan sales.
73
Interest Expense
.
Interest expense
decreased
$24.2 million
, or
13%
, to
$155.6 million
during the
2012
fiscal year from
$179.8 million
during the
2011
fiscal year. The change resulted primarily from a decrease in interest expense on certificates of deposit combined with modest decreases in interest expense on NOW accounts and savings accounts.
Interest expense on certificates of deposit
decreased
$21.6 million
, or
13%
, to
$142.7 million
compared to
$164.3 million
during the prior fiscal year. The change was attributed to a
33
basis point
decrease
in the average rate we paid on certificates of deposit to
2.35%
from
2.68%
combined with a
$80.0 million
, or
1%
,
decrease
in the average balance to
$6.06 billion
from
$6.14 billion
. Rates were adjusted on deposits in response to changes in general market rates as well as to changes in the rates paid by our competition on short-term certificates of deposit.
Interest expense on savings accounts
decreased
$2.5 million
, or
25%
, to
$7.5 million
compared to
$10.0 million
the prior fiscal year. The change was attributed to an
18
basis point
decrease
in the average rate we paid on savings accounts to
0.43%
from
0.61%
, partially offset by a
$125.1 million
, or an
8%
,
increase
in the average balance to
$1.76 billion
from
$1.63 billion
the prior fiscal year, reflecting customer preference for savings accounts when rates are comparable to our short-term certificates of deposit.
Net Interest Income.
Net interest income
increased
$14.6 million
, or
6%
, to
$262.2 million
compared to
$247.6 million
during the prior fiscal year. As net interest income
increased
during the current fiscal year, we experienced an improvement of our interest rate spread which increased
14
basis points to
2.11%
compared to
1.97%
during the prior fiscal year. Our net interest margin increased
7
basis points to
2.39%
compared to
2.32%
in the prior fiscal year. This increase can be partially attributed to the higher average loan balance in the current fiscal year. Our average net interest-earning assets
decreased
$11.3 million
, to
$1.80 billion
during the current fiscal year compared to
$1.81 billion
during the prior fiscal year.
Provision for Loan Losses
.
We establish provisions for loan losses, which are charged to operations, in order to maintain the allowance for loan losses at a level we consider necessary to absorb credit losses incurred in the loan portfolio that are both probable and reasonably estimable at the balance sheet date. In determining the level of the allowance for loan losses, we consider past and current loss experience, evaluations of real estate collateral, current economic conditions, volume and type of lending, adverse situations that may affect a borrower’s ability to repay a loan and the levels of non-performing and other classified loans. The amount of the allowance is based on estimates and the ultimate losses may vary from such estimates as more information becomes available or conditions change. We assess the allowance for loan losses on a quarterly basis and make provisions for loan losses in order to maintain the allowance. Continuing economic issues, including high levels of unemployment, are challenging our borrowers’ ability to repay their loans at a time when housing prices are weak, in part as a consequence of the collapse of the sub-prime mortgage market, and make it difficult to sell their homes. This limits the ability of many borrowers to self-cure a delinquency.
Based on our evaluation of the above factors, we recorded a provision for loan losses of
$102.0 million
during the fiscal year ended
September 30, 2012
and a provision of
$98.5 million
during the fiscal year ended
September 30, 2011
. The increase in the provision is due to the impact of
$15.8 million
of charge-offs related to Chapter 7 Bankruptcy status loans, as described below, which was partially offset by improved credit quality. The increased level of net charge-offs (non-SVA and Chapter 7 related) during the current fiscal year,
$87.2 million
as compared to
$74.8 million
during the fiscal year ended
September 30, 2011
, resulted from increases in both the residential non-Home Today and the residential Home Today portfolios and was partially offset by decreased charge-offs (non-SVA related) in the home equity lending portfolio. The increased charge-off activity (non-SVA related) occurred despite continued improvement in delinquencies and was attributed partially to the OCC Bank Accounting Advisory Series (BAAS) interpretive guidance issued in July 2012 related to loans in Chapter 7 bankruptcy, which resulted in charge-offs totaling
$15.8 million
. Also, more delinquent loans moving into foreclosure and increased losses recognized based on declining sheriff sale appraisal amounts contributed to the increased charge-offs for the year. The current provision reflects our net charge-off experience, lower home values and the uncertain economic times, which continue to challenge many of our loan customers. As delinquencies in the portfolio have been resolved through pay-off, short sale or foreclosure, or management determines the collateral is not sufficient to satisfy the loan, uncollected balances have been charged against the allowance for loan losses previously provided. The net charge-offs (non-SVA related, but inclusive of the Chapter 7 bankruptcy charge-offs) of
$103.0 million
during the fiscal year ended
September 30, 2012
were approximately the same as the
$102.0 million
loan loss provision recorded for the current fiscal year. The loan loss provision of
$98.5 million
recorded for the fiscal year ended
September 30, 2011
exceeded net charge-offs of
$74.8 million
plus the increase in specific valuation allowances during that same fiscal year of
$14.6 million
; note that changes in SVAs are considered to be the equivalent of a partial charge-off. The allowance for loan losses was
$100.5 million
, or
0.97%
of the total recorded investment in loans receivable, at
September 30, 2012
, compared to
$157.0 million
, or
1.56%
of the total recorded investment in loans receivable at
September 30, 2011
. The
$56.5 million
decrease
in the allowance for loan losses primarily reflects the impact of the adoption, effective December 31, 2011, of an OCC directive to discontinue the use of SVAs as discussed earlier. The SVA balance at September 30, 2011 was $55.5 million.
74
Of the
$52.7 million
decrease
in the recorded investment of non-accrual loans from September
2011
to September
2012
, the largest decrease was in our residential Home Today portfolio, which
decreased
$28.5 million
, or
41%
to
$41.1 million
. The decrease in the balance of the residential Home Today loans during the fiscal year ended September 30, 2012 included
$22.6 million
, related to the charge-off of SVAs that was recorded effective December 31, 2011. As of
September 30, 2012
, the recorded investment in our Home Today portfolio was
$204.9 million
, compared to
$262.9 million
at
September 30, 2011
. The
$41.1 million
balance in Home Today non-accrual loans includes
$11.2 million
in troubled debt restructurings which are current but included with non-accrual loans for a minimum period of six months from their restructuring date.
The recorded investment in non-accruing home equity loans and lines of credit
decreased
$1.6 million
, or
4%
, during the current fiscal year ended
September 30, 2012
. During the current fiscal year, net charge-offs of
$43.2 million
of uncollected balances have been charged against the allowance for loan losses. As of
September 30, 2012
, the recorded investment in our home equity loans and lines of credit portfolio was
$2.16 billion
, compared to
$2.5 billion
at
September 30, 2011
. We believe that non-performing home equity loans and lines of credit are, on a relative basis, of greater concern than non-Home Today loans as these home equity loans and lines of credits generally hold subordinated positions and accordingly, represent a higher level of risk. The non-performing balances of home equity loans and lines of credit were
$16.6 million
or
1%
of the home equity loans and lines of credit portfolio at
September 30, 2012
compared to
$36.5 million
or
1%
at
September 30, 2011
. In light of the depressed housing market in our primary geographic markets and the continued high level of delinquencies in our portfolio, we will continue to closely monitor the loss performance of this category.
The recorded investment in non-accrual loans in our residential, non-Home Today portfolio
decreased
$19.2 million
or
15%
to
$105.8 million
at
September 30, 2012
. During the current fiscal year, net charge-offs of
$55.4 million
of uncollected balances were charged against the allowance for loan losses. The
$105.8 million
balance includes
$28.3 million
in troubled debt restructurings which are current but included with non-accrual loans for a minimum period of six months from their restructuring date.
We believe we have recorded all losses that are both probable and reasonable to estimate for fiscal years ended
September 30, 2012
and
2011
.
Refer to Item1. Business for additional discussion and disclosure related to our provisions for loan losses.
Non-Interest Income
.
Non-interest income
decreased
$6.5 million
, or
21%
, to
$24.5 million
during the current fiscal year compared to
$31.0 million
during the prior fiscal year primarily due lower to loan fees.
Loan fees and service charges
decreased
$4.1 million
, or
26%
, to
$11.5 million
during the current fiscal year compared to
$15.6 million
during prior fiscal year. This change is attributed to reduced loan servicing fees in the current fiscal year as the balance of our portfolio of sold loans we are servicing for others has
decreased
30%
from
September 30, 2011
resulting in a $4.0 million decrease in loan servicing fees collected in the current period compared to the fiscal year ended
September 30, 2011
. The decrease in the portfolio of sold loans we are servicing for others can be attributed to the increased paydowns in addition to the significantly lower volume of loan sales.
Non-Interest Expense
.
Non-interest expense
increased
$3.0 million
, or
2%
, to
$171.1 million
during fiscal year
2012
compared to
$168.1 million
during fiscal year
2011
, primarily from increases in salaries and employee benefits, other operating and marketing expenses partially offset by decreases in Federal insurance premiums and appraisal and other loan review expenses.
Salaries and employee benefits
increased
$4.1 million
, or
5%
, to
$80.1 million
during the current fiscal year compared to
$76.0 million
during the prior fiscal year. Compensation costs increased $6.2 million, reflecting normal annual salary merit adjustments coupled with full year impacts related to staff additions associated with enhanced risk management and account administration activities. Other variances in comparing our expenses for the fiscal year ended
September 30, 2012
to those during the fiscal year ended
September 30, 2011
included a $2.9 million reduction in retirement costs as accumulated benefits under the defined benefit pension plan were frozen effective December 31, 2011, and a $0.8 million increase in group health care expense. For additional detail regarding the defined benefit plan, see the
Defined Benefit Plan
section of Note 13 of the Notes to our Consolidated Financial Statements.
Federal insurance premium and assessments
decreased
$5.2 million
, or
27%
, to
$14.3 million
during the current fiscal year compared to
$19.5 million
during the prior fiscal year. This change reflects the revision, as required pursuant to the Dodd-Frank Act and as adopted effective April 1, 2011, in the deposit insurance assessment system that reoriented the determination of each institution’s deposit insurance assessment so that it is based on total assets less tangible capital of the institution rather than solely on the balance of deposits. Our high level of tangible capital and minimal use of wholesale borrowings resulted in our reduced level of assessment.
75
Appraisal and other loan review expenses
decreased
$2.4 million
, or
43%
, to
$3.2 million
during during the current fiscal year compared compared to
$5.6 million
during the prior fiscal year. These costs
decreased
in the current fiscal year from an elevated level in the prior fiscal year when additional operating expenses (legal, postage, courier, telephone, etc.) associated with our home equity lending reduction plan were incurred.
Other operating expenses
increased
$2.8 million
, or
11%
, to
$29.0 million
in the current fiscal year compared to
$26.2 million
in the prior fiscal year. The majority of the increase is related to loss reimbursement expenses for loans serviced for FNMA, which increased $4.4 million in the current fiscal year to $4.8 million, partially offset by decreases in various other expenses. The increase in loss reimbursement expenses included $2.4 million of actual loss reimbursements and the establishment of a reserve of $2.4 million for probable losses.
Income Tax Expense.
The provision for income taxes was
$2.1 million
during the current fiscal year compared to
$2.7 million
during the prior fiscal year. The provision for the current fiscal year included
$2.0 million
of federal tax and
$98 thousand
of state income tax expense. The provision for the fiscal year ended
September 30, 2011
included
$2.7 million
of federal income tax provision and
$75 thousand
of state income tax provision. The state income tax provision is subtracted from income before income taxes when calculating the federal income tax provision. Our effective federal tax rate was
15.1%
in the current fiscal year compared to
22.2%
for the prior fiscal year. The primary difference in the effective tax rate of this fiscal year when compared to the prior fiscal year is the adjustment to our deferred tax asset valuation allowance related to our charitable contribution carryforward. The valuation allowance was increased by $600 thousand during the fiscal year ended September 30, 2011 and decreased by $500 thousand during the fiscal year ended September 30, 2012. The charitable contribution carryforward expired September 30, 2012. Our expected effective income tax rate is below the federal statutory rate primarily because of our ownership of bank-owned life insurance.
Comparison of Operating Results for the Fiscal Years Ended September 30, 2011 and 2010
General.
Net income decreased $2.0 million, or 18%, to $9.3 million for the fiscal year
ended September 30, 2011 compared to $11.3 million for the fiscal year
ended September 30, 2010. This change was attributed to a decrease in non-interest income combined with an increase in non-interest expense partially offset by an increase in net interest income and a decrease in the provision for loan losses.
Interest Income.
Interest income decreased $10.4 million or 2%, to $427.5 million for the fiscal year
ended September 30, 2011 compared to $437.9 million for the prior fiscal year. The decrease in interest income resulted primarily from decreases in interest income from loans and mortgage-backed securities.
Interest income on mortgage-backed securities decreased $7.6 million, or 40%, to $11.6 million from $19.2 million during fiscal 2010. The average yield on mortgage-backed securities decreased 73 basis points to 2.29% compared to 3.02% in fiscal 2010 as interest rates on adjustable rate securities reset to lower current rates and higher, fixed-rate securities continue to experience accelerated paydowns. The average balance of mortgage-backed securities decreased $128.8 million to $507.0 million compared to $635.8 million during the prior fiscal year. The $274.1 million in principal paydowns and maturities which occurred in 2011 were partially offset by $14.7 million in purchases. There were no sales of mortgage-backed securities during the 2011 fiscal year.
Interest income on loans decreased $2.0 million, or less than 1%, to $413.5 million compared to $415.5 million compared to the fiscal 2010. This change was attributed to a 24 basis point decrease in the yield to 4.21% from 4.45% as historically low interest rates have increased the amount of refinance activity. Additionally, the increase in our “SmartRate” adjustable-rate first mortgage loan originations during the fiscal year at interest rates below rates offered on fixed-rate products contributed to the lower average yield. The decrease in interest income on loans during fiscal 2011 was partially offset by the $501.3 million increase in the average balance of loans to $9.83 billion in fiscal 2011 compared to $9.33 billion in fiscal 2010 as new loan production exceeded repayments and loan sales.
Interest Expense
.
Interest expense decreased $30.5 million, or 15%, to $179.8 million during the 2011 fiscal year from $210.4 million during the 2010 fiscal year. The change resulted primarily from a decrease in interest expense on certificates of deposit combined with modest decreases in NOW accounts and savings accounts.
Interest expense on certificates of deposit decreased $25.5 million, or 13%, to $164.3 million compared to $189.8 million during fiscal 2010. The change was attributed to a 33 basis point decrease in the average rate we paid on certificates of deposit to 2.68% from 3.01% combined with a $164.2 million, or 3%, decrease in the average balance to $6.14 billion from $6.30 billion. Rates were adjusted on deposits in response to changes in general market rates as well as to changes in the rates paid by our competition on short-term certificates of deposit.
76
Interest expense on savings accounts decreased $3.2 million, or 24%, to $10.0 million compared to $13.2 million in fiscal 2010. The change was attributed to a 30 basis point decrease in the average rate we paid on savings accounts to 0.61% from 0.91%, partially offset by a $189.1 million, or a 13%, increase in the average balance to $1.63 billion from $1.44 billion in fiscal 2010, reflecting customer preference for savings accounts when rates are comparable to our short-term certificates of deposit.
Net Interest Income.
Net interest income increased $20.1 million, or 9%, to $247.6 million compared to $227.5 million during fiscal 2010. As net interest income increased during fiscal 2011, we experienced an improvement of our interest rate spread which increased 20 basis points to 1.97% compared to 1.77% during fiscal 2010. Our net interest margin increased 16 basis points to 2.32% compared to 2.16% in fiscal 2010. This increase can be partially attributed to the higher average loan balance in fiscal 2011. Our average net interest-earning assets increased $76.3 million, to $1.81 billion during fiscal 2011 compared to $1.73 billion during fiscal 2010.
Provision for Loan Losses
.
We established provisions for loan losses, which were charged to operations, in order to maintain the allowance for loan losses at a level we considered necessary to absorb credit losses incurred in the loan portfolio that were both probable and reasonably estimable at the balance sheet date. In determining the level of the allowance for loan losses, we considered past and current loss experience, evaluations of real estate collateral, current economic conditions, volume and type of lending, adverse situations that may affect a borrower's ability to repay a loan and the levels of non-performing and other classified loans. The amount of the allowance was based on estimates and the ultimate losses may vary from such estimates as more information becomes available or conditions change. We assessed the allowance for loan losses on a quarterly basis and made provisions for loan losses in order to maintain the allowance. Economic issues, including high levels of unemployment, have challenged our borrowers' ability to repay their loans at times when housing prices are weak, in part as a consequence of the collapse of the sub-prime mortgage market, and have made it difficult to sell their homes. This limits the ability of many borrowers to self-cure a delinquency.
Based on our evaluation of the above factors, we recorded a provision for loan losses of $98.5 million during the fiscal year ended September 30, 2011 and a provision of $106.0 million during the prior fiscal year. The lower provision in fiscal 2011 reflected the overall stabilization of credit quality in our loan portfolio. The provisions recorded exceeded net charge-offs of $74.8 million and $68.0 million for the fiscal years ended September 30, 2011 and 2010, respectively. Our provisions for loan losses in 2011 exceeded the total of charge-offs, adjusted for the net change in specific valuation allowances, and as a result, our combined general and market valuation allowances increased. The provision for fiscal 2011 reflected our net charge-off experience, lower home values and the uncertain economic times, which challenged many of our loan customers. As delinquencies in the portfolio have been resolved through pay-off, short sale or foreclosure, or management determines the collateral is not sufficient to satisfy the loan, uncollected balances have been charged against the allowance for loan losses previously provided. The allowance for loan losses was $157.0 million, or 1.58% of total recorded investment in loans receivable, at September 30, 2011, compared to $133.2 million or 1.43% of total recorded investment in loans receivable at September 30, 2010.
Of the $51.3 million decrease in the recorded investment of non-accrual loans from September 2010 to September 2011, the largest decrease was in our residential Home Today portfolio, which decreased $22.4 million, or 24.3% to $69.6 million. As of September 30, 2011, the recorded investment in our Home Today portfolio was $262.9 million, compared to $279.2 million at September 30, 2010. The $69.6 million balance in Home Today non-accrual loans included $9.6 million in troubled debt restructurings which are current but included with non-accrual loans for a minimum period of six months from their restructuring date.
The recorded investment in non-accruing home equity loans and lines of credit decreased $17.6 million, or 32%, during the fiscal year ended September 30, 2011, when net charge-offs of $49.5 million of uncollected balances were charged against the allowance for loan losses. As of September 30, 2011, the recorded investment in our home equity loans and lines of credit portfolio was $2.50 billion, compared to $2.87 billion at September 30, 2010. We believed that non-performing home equity loans and lines of credit were, on a relative basis, of greater concern than non-Home Today loans as these home equity loans and lines of credits generally hold subordinated positions and accordingly, represent a higher level of risk. The non-performing balances of home equity loans and lines of credit were $36.9 million or 1.47% of the home equity loans and lines of credit portfolio at September 30, 2011 compared to $54.5 million or 1.90% at September 30, 2010. In light of the depressed housing market in our primary geographic markets and the continued high level of delinquencies in our portfolio, we continued to closely monitor the loss performance of this category.
The recorded investment in non-accrual loans in our residential, non-Home Today portfolio decreased $10.1 million or 7% to $125.0 million at September 30, 2011, when net charge-offs of $17.5 million of uncollected balances were charged against the allowance for loan losses. The $125.0 million balance included $6.5 million in troubled debt restructurings which were current but included with non-accrual loans for a minimum period of six months from their restructuring date. We
77
believed we had recorded all losses that were both probable and reasonable to estimate for fiscal years ended September 30, 2011 and 2010.
We used the same general methodology in assessing the allowance at the end of each period, except that, beginning September 30, 2010, the individual loan loss review methodology applied to home equity loans and lines of credit was enhanced to include updated individual reviews for all home equity loans and lines of credit that were 90 days or more past due. Previously, updated individual reviews were not performed if the previous review had been performed within the last 12 months.
Refer to Item1. Business for additional discussion and disclosure related to our provisions for loan losses.
Non-Interest Income
.
Non-interest income decreased $27.7 million, or 47%, to $31.0 million during fiscal 2011 compared to $58.6 million during fiscal 2010.
In the fiscal year ended September 30, 2011 there were $33.6 million in loan sales from which we recorded $490 thousand of net gains compared to net gains of $25.3 million on $942.2 million in loan sales in prior fiscal year. The significantly lower volume of loan sales in fiscal 2011 reflects the impact of changes by Fannie Mae related to requirements for loans that it accepts. Refer to the
Controlling Our Interest Rate Risk Exposure
section of the
Overview
for additional discussion.
Loan fees and service charges decreased $5.0 million, or 24%, to $15.6 million during the fiscal year 2011 compared to $20.6 million during fiscal 2010. This change was attributed to reduced loan servicing fees in the fiscal year 2011 as the balance of our portfolio of sold loans we were servicing for others has decreased 23% from September 30, 2010 resulting in a $4.9 million decrease in loan servicing fees collected in the period ended September 30, 2011 compared to the fiscal year ended September 30, 2010. The decrease in the portfolio of sold loans we were servicing for others can be attributed to the increased paydowns in addition to the significantly lower volume of loan sales.
Non-Interest Expense
.
Non-interest expense increased $6.1 million, or 4%, to $168.1 million during fiscal year 2011 compared to $161.9 million during fiscal year 2010, primarily from increases in appraisal and other loan review expenses, real estate owned expense (associated legal cost and losses on the disposition of properties) and other operating expenses partially offset by a decrease in salaries and employee benefits. Salaries and employee benefits decreased $7.9 million, or 9%, to $76.0 million during the fiscal year 2011 compared to $83.9 million during fiscal 2010. This change was primarily due to a $5.2 million decrease in associate compensation costs (particularly bonus accruals and costs related to employee stock-based incentive programs), and a $3.3 million decrease in defined benefit retirement plan expense (resulting primarily from the correction of an actuarial error).
Appraisal and other loan review expenses increased $4.3 million to $5.6 million during fiscal year 2011 compared to $1.3 million during fiscal 2010. These costs along with other costs included in other operating expenses (legal, postage, courier, telephone etc.) are associated with our home equity lending reduction plan. Additionally, professional consulting fees incurred in connection with the enhancement of our home equity lending account administration and account management activities coupled with similar fees incurred in connection with an independent evaluation of our enterprise risk management processes and procedures also contributed to the cost increase. Finally, because of the higher loan refinance activity during fiscal year 2011, the cost of interest advances that the Company is required to make (and which is included in other operating expenses) when serviced loans are repaid prior to month end increased $1.0 million in fiscal year 2011 when compared to the prior fiscal year.
Income Tax Expense.
The provision for income taxes was $2.7 million during fiscal year 2011 compared to $6.9 million during fiscal 2010. The provision for fiscal year 2011 included $2.7 million of federal tax and $75 thousand of state income tax expense. The provision for fiscal year ended 2010 included $6.8 million of federal income tax provision and $47 thousand of state income tax provision. The state income tax provision is subtracted from income before income taxes when calculating the federal income tax provision.
Our effective federal tax rate was 22.2% in fiscal year 2011 compared to 37.6% for fiscal 2010. The primary difference in the effective tax rate for fiscal year 2011 when compared to the fiscal 2010 is the result of the $1.9 million adjustment to increase our deferred tax asset valuation allowance related to our charitable contribution carryforward that was recognized during the fiscal year ended September 30, 2010 as compared to an adjustment of $600 thousand recognized during the fiscal year ended September 30, 2011. Our effective federal income tax rate was affected by insurance related permanent tax differences which had a more beneficial impact during fiscal 2011 as compared to fiscal 2010 due to lower pre-tax earnings .
78
Liquidity and Capital Resources
Liquidity is the ability to meet current and future financial obligations of a short-term nature. Our primary sources of funds consist of deposit inflows, loan repayments, advances from the FHLB of Cincinnati, borrowings from the Federal Reserve Discount Window, maturities and sales of securities and, historically, sales of loans. As described below, since June 2010, the amount of liquidity derived from loan sales has decreased significantly.
To augment the primary sources of funds described above, we have the ability to obtain funds through the use of collateralized borrowings in the wholesale markets. Additionally, access to the equity capital markets via a supplemental first step transaction or a full (second step) transaction remain as other potential source of liquidity, although this channel generally requires six to nine months of lead time.
While maturities and scheduled amortization of loans and securities are predictable sources of funds, deposit flows and mortgage prepayments are greatly influenced by general interest rates, economic conditions and competition. The Association’s Asset/Liability Management Committee is responsible for establishing and monitoring our liquidity targets and strategies in order to ensure that sufficient liquidity exists for meeting the borrowing needs and deposit withdrawals of our customers as well as unanticipated contingencies. We seek to maintain a minimum liquidity ratio of 2% or greater (which we compute as the sum of cash and cash equivalents plus unpledged investment securities for which ready markets exist, divided by total assets). For the year ended
September 30, 2012
, our liquidity ratio averaged
5.80%
. We believe that we have enough sources of liquidity to satisfy our short- and long-term liquidity needs as of
September 30, 2012
.
We regularly adjust our investments in liquid assets based upon our assessment of expected loan demand, expected deposit flows, yields available on interest-earning deposits and securities and the objectives of our asset/liability management program.
Excess liquid assets are generally invested in interest-earning deposits and short- and intermediate-term securities.
Our most liquid assets are cash and cash equivalents. The levels of these assets are dependent on our operating, financing, lending and investing activities during any given period. At
September 30, 2012
, cash and cash equivalents totaled
$308.3 million
, which represented an increase of
5%
from
September 30, 2011
. The increase can be attributed to maintaining liquidity on the balance sheet as total assets have increased.
Effective July 1, 2010, our traditional underwriting procedures no longer comply with Fannie Mae’s standard requirements and accordingly, our ability to manage liquidity via the loan sales channel has been and will continue to be limited until either we change our underwriting standards or Fannie Mae, or other market participants, revise their qualification standards. In the absence of such changes, and except for certain specific circumstances as described below, future sales of fixed rate mortgage loans will be limited to those loans that have established payment histories, strong borrower credit profiles and are supported by adequate collateral values. During the year ended
September 30, 2012
sales of long-term, fixed rate loans totaled only
$11.4 million
and were comprised entirely of loans that qualified under Fannie Mae's HARP II (Home Affordable Refinance Program) initiative. While a total of
$124.5 million
of loans were reclassified as “held for sale” at
September 30, 2012
, only $
9.6 million
represented agency-compliant HARP II loans. The remaining
$114.7 million
was comprised of high credit quality, long-term, fixed-rate residential first mortgage loans, which were being marketed to private, third-party investors, but which were not Fannie Mae compliant. At
September 30, 2012
, outstanding HARP II loan sales commitments totaled
$2.8
million; no loan sales commitments with third-party investors were outstanding.
Investment securities classified as available-for-sale, which provide additional sources of liquidity, totaled
$421.4 million
at
September 30, 2012
. Also, at
September 30, 2012
we had borrowed
$488.2 million
from the FHLB of Cincinnati.
Our cash flows are derived from operating activities, investing activities and financing activities as reported in our Consolidated Statements of Cash Flows included in the Consolidated Financial Statements.
At
September 30, 2012
, we had
$299.8 million
in loan commitments outstanding. In addition to commitments to originate loans, we had
$1.36 billion
in unused lines of credit which were available to borrowers. Certificates of deposit due within one year of
September 30, 2012
totaled
$2.55 billion
, or
28.4%
of total deposits. If these deposits do not remain with us, we will be required to seek other sources of funds, including loan sales, sales of investment securities, other deposit products, including certificates of deposit, Federal Home Loan Bank advances, borrowings from the Federal Reserve Discount Window or other collateralized borrowings. Depending on market conditions, we may be required to pay higher rates on such deposits or other borrowings than we currently pay on the certificates of deposit due on or before September 30,
2013
. We believe, however, based on past experience that a significant portion of such deposits will remain with us. Generally, we have the ability to attract and retain deposits by adjusting the interest rates offered.
79
Our primary investing activities are originating residential mortgage loans and purchasing investments. During the year ended
September 30, 2012
, we originated
$2.64 billion
of loans, and during the year ended
September 30, 2011
, we originated
$2.14 billion
of loans. We purchased
$228.0 million
of securities during the year ended
September 30, 2012
, and
$14.7 million
during the year ended
September 30, 2011
.
Financing activities consist primarily of changes in deposit accounts, changes in the balances of principal and interest owed on loans serviced for others, Federal Home Loan Bank advances and borrowings from the Federal Reserve Discount Window. We experienced a net
increase
in total deposits of
$265.5 million
during the year ended
September 30, 2012
compared to a net
decrease
of
$136.0 million
during the year ended
September 30, 2011
. Deposit flows are affected by the overall level of interest rates, the interest rates and products offered by us and our local competitors, and by other factors. Principal and interest owed on loans serviced for others
decreased
$24.4 million
during the year ended
September 30, 2012
compared to a net
decrease
of
$132.6 million
during the year ended
September 30, 2011
.
Liquidity management is both a daily and long-term function of business management. If we require funds beyond our ability to generate them internally, borrowing agreements exist with the FHLB of Cincinnati and the Federal Reserve Discount Window, each of which provides an additional source of funds. At
September 30, 2012
we had
$488.2 million
of FHLB of Cincinnati advances as compared to
$139.9 million
at
September 30, 2011
. The majority of the
$488.2 million
balance in the current year is comprised of lower cost, short term (overnight) advances. The Association had no outstanding borrowings from the Federal Reserve Discount Window at
September 30, 2012
and
2011
. During the year ended
September 30, 2012
, we had average outstanding advances from the FHLB of Cincinnati of
$359.7 million
as compared to average outstanding advances of
$123.6 million
during the year ended
September 30, 2011
, as we used the advances to augment our liquidity and manage our funding costs. At
September 30, 2012
we had the ability to immediately borrow an additional
$466.6 million
from the FHLB of Cincinnati and
$233.3 million
from the Federal Reserve Discount Window. From the perspective of collateral value securing FHLB of Cincinnati advances, our capacity limit for additional borrowings at
September 30, 2012
was
$4.22 billion
, subject to satisfaction of the FHLB of Cincinnati common stock ownership requirement. To satisfy the common stock ownership requirement we would have to increase our ownership of FHLB of Cincinnati common stock by an additional
$75.0 million
.
The Association is subject to various regulatory capital requirements, including a risk-based capital measure. The risk-based capital guidelines include both a definition of capital and a framework for calculating risk-weighted assets by assigning balance sheet assets and off-balance sheet items to broad risk categories. On June 6, 2012, the OCC and the other federal bank regulatory agencies issued a series of proposed rules to revise their risk-based and leverage capital requirements and their method for calculating risk-weighted assets to make them consistent with the agreements that were reached by the Basel Committee on Banking Supervision in "Basel III: A Global Regulatory Framework for More Resilient Banks and Banking Systems" ("Basel III"). The proposed rules would apply to all depository institutions, top-tier bank holding companies with total consolidated assets of $500 million or more, and top-tier savings and loan holding companies ("banking organizations"). Among other things, the proposed rules establish a new common equity tier 1 (CET1) minimum capital requirement (4.5% of risk-weighted assets) and a higher minimum tier 1 capital requirement (from 4.0% to 6.0% of risk-weighted assets), and assign higher risk weightings (150%) to exposures that are more than 90 days past due or are on nonaccrual status and certain commercial real estate facilities that finance the acquisition, development or construction of real property.
When fully phased in, Basel III requires financial institutions to maintain: (a) as a newly adopted international standard, a minimum ratio of CET1 to risk-weighted assets of at least 4.5%, plus a 2.5% “capital conservation buffer” (which is added to the 4.5% CET1 ratio as that buffer is phased in, effectively resulting in a minimum ratio of CET1 to risk-weighted assets of at least 7.0%); (b) a minimum ratio of Tier 1 capital to risk-weighted assets of at least 6.0%, plus the capital conservation buffer (which is added to the 6.0% Tier 1 capital ratio as that buffer is phased in, effectively resulting in a minimum Tier 1 capital ratio of 8.5% upon full implementation); (c) a minimum ratio of Total (that is, Tier 1 plus Tier 2) capital to risk-weighted assets of at least 8.0%, plus the capital conservation buffer (which is added to the 8.0% total capital ratio as that buffer is phased in, effectively resulting in a minimum total capital ratio of 10.5% upon full implementation); and (d) as a newly adopted international standard, a minimum leverage ratio of 3.0%, calculated as the ratio of Tier 1 capital balance sheet exposures plus certain off-balance sheet exposures (computed as the average for each quarter of the month-end ratios for the quarter). In addition, the proposed rules also limit a banking organization's capital distributions and certain discretionary bonus payments if the banking organization does not hold a "capital conservation buffer".
When issued, the proposed rules indicated that final rules would become effective on January 1, 2013, and that the changes set forth in the final rules would be phased in from January 1, 2013 through January 1, 2019. On November 9, 2012, pursuant to a joint release, the federal bank agencies announced that they "do not expect that any of the proposed rules would become effective on January 1, 2013. As members of the Basel Committee on Banking Supervision, the U.S. agencies take seriously our internationally agreed timing commitments regarding the implementation of Basel III and are working as expeditiously as possible to complete the rulemaking process. As with any rule, the agencies will take operational and other considerations into account when determining appropriate implementation dates and associated transition periods." The
80
Company expects that future risk weighted capital ratios determined pursuant to asset risk weightings as they may ultimately be structured under the prospective Basel III computational framework will differ unfavorably when compared to current computations. In light of the current uncertainty regarding the final structure of the computational framework, the Company cannot currently estimate the impact of the proposal on reported risk weighted capital ratios.
At
September 30, 2012
, Third Federal Savings and Loan exceeded all regulatory capital requirements. Third Federal Savings and Loan is considered “well capitalized” under regulatory guidelines.
The net proceeds from the stock offering significantly increased our liquidity and capital resources during fiscal 2007. Our financial condition and results of operations have been enhanced by the net proceeds from the stock offering, and have resulted in increased net interest-earning assets and net interest income during the periods following completion of the offering in April 2007. However, due to the increase in equity that resulted from the net proceeds of our stock offering, our return on equity ratios have been adversely affected and can be expected to continue to be so affected prospectively.
Off-Balance Sheet Arrangements and Aggregate Contractual Obligations
Commitments
.
As a financial services provider, we routinely are a party to various financial instruments with off-balance-sheet risks, such as commitments to extend credit and unused lines of credit. While these contractual obligations represent our future cash requirements, a significant portion of commitments to extend credit may expire without being drawn upon. Such commitments are subject to the same credit policies and approval process accorded to loans we make. In addition, we routinely enter into commitments to securitize and sell mortgage loans. For additional information, see Note 15 of the Notes to our Consolidated Financial Statements.
Contractual Obligations.
In the ordinary course of our operations, we enter into certain contractual obligations. Such obligations include operating leases for premises and equipment, agreements with respect to borrowed funds and deposit liabilities and agreements with respect to investments.
The following table summarizes our significant fixed and determinable contractual obligations and other funding needs by payment date at
September 30, 2012
. The payment amounts represent those amounts due to the recipient and do not include any unamortized premiums or discounts or other similar carrying amount adjustments.
______________________
|
|
Payments due by period
|
||||||||||||||||||||
|
Contractual Obligations
|
Less than
One year
|
|
One to
Three years
|
Three to
Five years
|
More than
Five years
|
Total
|
|||||||||||||||
|
|
(In thousands)
|
||||||||||||||||||||
|
Federal Home Loan Bank advances(1)
|
$
|
374,188
|
|
|
$
|
43,000
|
|
$
|
34,745
|
|
$
|
36,258
|
|
$
|
488,191
|
|
|||||
|
Operating leases
|
4,368
|
|
|
5,968
|
|
3,314
|
|
4,537
|
|
18,187
|
|
||||||||||
|
Certificates of deposit(1)
|
2,549,916
|
|
|
2,422,637
|
|
822,694
|
|
402,636
|
|
6,197,883
|
|
||||||||||
|
Private equity investments
|
13,813
|
|
|
—
|
|
—
|
|
—
|
|
13,813
|
|
||||||||||
|
Total
|
$
|
2,942,285
|
|
|
$
|
2,471,605
|
|
$
|
860,753
|
|
$
|
443,431
|
|
$
|
6,718,074
|
|
|||||
|
Commitments to extend credit
|
$
|
1,870,372
|
|
(2)
|
$
|
1,115
|
|
$
|
—
|
|
$
|
—
|
|
$
|
1,871,487
|
|
|||||
|
(1)
|
Includes accrued interest payable at
September 30, 2012
.
|
|
(2)
|
Includes the unused portion (including commitments for accounts suspended as a result of material default or a decline in equity) of home equity lines of credit of
$1.53 billion
.
|
The Company provides mortgage reinsurance on certain mortgage loans in its own portfolio, including Home Today loans, and loans in its servicing portfolio through contracts with two primary mortgage insurance companies. Under these contracts, the Company absorbs mortgage insurance losses in excess of a specified percentage of the principal balance of a given pool of loans, subject to a contractual limit, in exchange for a portion of the pools’ mortgage insurance premiums. As of
September 30, 2012
, approximately
$370.9 million
of mortgage loans in our portfolios was covered by such mortgage reinsurance contracts. At
September 30, 2012
, the maximum losses under the reinsurance contracts were limited to
$14.4 million
. The Company has incurred
$4.1 million
in losses under these reinsurance contracts and provided a liability for estimated losses totaling
$3.4 million
as of
September 30, 2012
. Management believes it has made adequate provision for estimated losses.
81
Impact of Inflation and Changing Prices
Our consolidated financial statements and related notes have been prepared in accordance with GAAP. GAAP generally requires the measurement of financial position and operating results in terms of historical dollars without consideration for changes in the relative purchasing power of money over time due to inflation. The impact of inflation is reflected in the increased cost of our operations. Unlike industrial companies, our assets and liabilities are primarily monetary in nature. As a result, changes in market interest rates have a greater impact on performance than the effects of inflation.
Recent Accounting Pronouncements
Pending as of
September 30, 2012
Financial Accounting Standards Board (“FASB”) Accounting Standards Update (“ASU”) 2011-12, “Comprehensive Income (Topic 220), Deferral of the Effective Date for Amendments to the Presentation of Reclassifications of Items Out of Accumulated Other Comprehensive Income
Standards Update No. 2011-05” defers indefinitely the provisions of FASB ASU 2011-05 that require entities to present reclassification adjustments for items that are reclassified from other comprehensive income (“OCI”) to net income by component in both the statement in which net income is presented and the statement in which OCI is presented. The only impact of these amendments on the Company's consolidated financial statements would be a change in the presentation of OCI.
FASB ASU 2011-05, “Presentation of Comprehensive Income” eliminates the option to present OCI in the statement of shareholders' equity and provides an entity the option to present the total of comprehensive income, the components of net income, and the components of OCI either in a single continuous statement of comprehensive income or in two separate but consecutive statements. In both choices, an entity is required to present each component of net income along with total net income, each component of OCI along with a total for OCI, and a total amount for comprehensive income. Regardless of whether an entity chooses to present comprehensive income in a single continuous statement or in two separate but consecutive statements, the entity is required to present on the face of the financial statements reclassification adjustments for items that are reclassified from OCI to net income in the statement(s). The amendments in this update will be applied retrospectively for all periods presented and are effective for the Company for the interim and annual periods beginning October 1, 2012, with early adoption permitted. The only impact of these amendments on the Company's consolidated financial statements will be a change in the presentation of OCI.
FASB ASU 2011-08, “Intangibles - Goodwill and Other (Topic 350): Testing Goodwill for Impairment” was issued in September 2011 to reduce the cost and complexity of performing the first step of the two-step goodwill impairment test. This amendment permits an entity to first assess qualitative factors to determine whether the existence of events or circumstances leads to a more likely than not (more than
50%
likelihood) outcome that the fair value of the reporting unit is less than its carrying amount. The performance of the two-step impairment test becomes unnecessary if, after assessing the totality of events and circumstances, the entity determines that it is not more likely than not that the fair value of the reporting unit is less than its carrying amount. The amendment is effective for fiscal years beginning after December 15, 2011, with early adoption permitted. The Company is adopting this guidance for the fiscal year beginning October 1, 2012. The adoption of this guidance is not expected to have a material impact on the Company's consolidated financial statements.
Adopted in fiscal year ended
September 30, 2012
FASB ASU 2011-04, “Amendments to Achieve Common Fair Value Measurement and Disclosure Requirements in U.S. GAAP and IFRS” eliminates unnecessary wording differences between U.S. GAAP and International Financial Reporting Standards, clarifies the intent of existing fair value measurements, and expands disclosure requirements. ASU 2011-04 indicates that the highest and best use and valuation premise in a fair value measurement only apply to non-financial assets. In addition, ASU 2011-04 expands qualitative and quantitative fair value disclosures including those related to descriptions of valuation processes used, the sensitivity of the fair value to changes in unobservable inputs and the interrelationships between those inputs, and quantitative disclosures about unobservable inputs and assumptions. The amendments in ASU 2011-04 are effective for interim and annual reporting periods beginning after December 15, 2011. The adoption of this guidance did not have a material impact on the Company's consolidated financial statements. The new and amended disclosures are included in Note 10, Fair Value.
FASB ASU 2011-03, “Reconsideration of Effective Control for Repurchase Agreements” eliminates from U.S. GAAP the requirement for entities to consider whether a transferor (i.e., seller) has the ability to repurchase the financial assets in a repurchase agreement (“repo”). This requirement was one of the criteria under ASC 860 that entities used to determine whether the transferor maintained effective control. Although entities must consider all the effective-control criteria under ASC 860, the elimination of this requirement may lead to more conclusions that a repurchase arrangement should be accounted for as a
82
secured borrowing rather than as a sale. The amendments in ASU 2011-03 are effective for interim and annual reporting periods beginning after December 15, 2011. The adoption of this guidance did not have a material impact on the Company's consolidated financial statements.
The Company has determined that all other recently issued accounting pronouncements will not have a material impact on the Company’s consolidated financial statements or do not apply to its operations.
|
Item 7A.
|
Quantitative and Qualitative Disclosures About Market Risk
|
General
. The majority of our assets and liabilities are monetary in nature. Consequently, our most significant form of market risk has historically been interest rate risk. In general, our assets, consisting primarily of mortgage loans, have longer maturities than our liabilities, consisting primarily of deposits. As a result, a principal part of our business strategy is to manage interest rate risk and limit the exposure of our net interest income to changes in market interest rates. Accordingly, our board of directors has established risk parameter limits deemed appropriate given our business strategy, operating environment, capital, liquidity and performance objectives. Additionally, our board of directors has also established an Asset/Liability Management Committee comprised of key operating personnel which is responsible for managing this risk consistent with the guidelines and risk limits approved by the board of directors.
We have sought to manage our interest rate risk in order to control the exposure of our earnings and capital to changes in interest rates. As part of our ongoing asset-liability management, we have historically used the following strategies to manage our interest rate risk:
|
(i)
|
marketing adjustable-rate loan products;
|
|
(ii)
|
lengthening the weighted average remaining term of major funding sources, primarily by offering attractive interest rates on deposit products, particularly longer-term certificates of deposit, and through the use of longer-term advances from the Federal Home Loan Bank of Cincinnati;
|
|
(iii)
|
investing in shorter- to medium-term investments and mortgage-backed securities;
|
|
(iv)
|
maintaining high levels of capital; and
|
|
(v)
|
securitizing and/or selling long-term, fixed-rate residential real estate mortgage loans.
|
During the years ended September 30,
2012
,
2011
and
2010
,
$11.4 million
,
$33.6 million
and
$1.03 billion
, respectively, of long-term, fixed rate mortgage loans were sold. Prior to fiscal 2011, when a significant volume of loan sales were undertaken our objective was to improve our interest rate risk position in the event that market interest rates increased. During fiscal 2011 the limited loan sales activities reflected a whole loan transaction with a private, third-party investor and an isolated securitization/sale to Fannie Mae. Loan sales during fiscal 2012 were transactions with Fannie Mae related to its Home Affordability Refinanace Program (HARP II) initiative and were primarily oriented to the avoidance of credit risk related to refinancings of loans that were owned by Fannie Mae.
Effective July 1, 2010, Fannie Mae, historically the Association’s primary loan investor, implemented certain loan origination requirement changes affecting loan eligibility that, to date, we have not fully adopted. Accordingly, the Association’s ability to reduce interest rate risk via our traditional loan sales of newly originated longer-term fixed rate residential loans is limited until either the Association changes its loan origination processes or Fannie Mae, Freddie Mac or other market participants, revise their loan eligibility standards. Otherwise, and except for HARP II-related sales as described above, future sales of fixed-rate mortgage loans will predominantly be limited to those loans that have established payment histories, strong borrower credit profiles and are supported by adequate collateral values. In response to this change, since July 2010, we have actively marketed an adjustable-rate mortgage loan product and beginning in fiscal 2012 have promoted a ten year fixed-rate mortgage loan. Each of these products provide us with improved interest rate risk characteristics when compared to longer-term, fixed-rate mortgage loans. Shortening the average maturity of our interest-earning assets by increasing our investments in shorter-term loans and investments, as well as loans and investments with variable rates of interest, helps to better match the maturities and interest rates of our assets and liabilities, thereby reducing the exposure of our net interest income to changes in market interest rates. By following these strategies, we believe that we are better-positioned to react to increases in market interest rates.
Economic Value of Equity
.
Using customized modeling software, the Association prepares periodic estimates of the amounts by which the net present value of its cash flows from assets, liabilities and off balance sheet items (the institution’s economic value of equity or “EVE”) would change in the event of a range of assumed changes in market interest rates. The simulation model uses a discounted cash flow analysis and an option-based pricing approach in measuring the interest rate sensitivity of EVE. The model estimates the economic value of each type of asset, liability and off-balance sheet contract under
83
the assumption that instantaneous changes (measured in basis points) occur at all maturities along the United States Treasury yield curve and other relevant market interest rates. A basis point equals one-hundredth of one percent, and 100 basis points equals one percent. An increase in interest rates from 2% to 3% would mean, for example, a 100 basis point increase in the “Change in Interest Rates” column below. The model is tailored specifically to our organization, which, we believe, improves its accuracy. The following table presents the estimated changes in the Association’s EVE at
September 30, 2012
that would result from the indicated instantaneous changes in the United States Treasury yield curve and other relevant market interest rates. Computations of prospective effects of hypothetical interest rate changes are based on numerous assumptions, including relative levels of market interest rates, loan prepayments and deposit decay, and should not be relied upon as indicative of actual results.
|
Change in
Interest Rates
(basis points) (1)
|
Estimated
EVE (2)
|
Estimated Increase
(Decrease) in EVE
|
EVE as a Percentage
of Present Value of
Assets (3)
|
||||||||||||||
|
EVE
Ratio (4)
|
Increase
(Decrease)
(basis points)
|
||||||||||||||||
|
Amount
|
Percent
|
||||||||||||||||
|
|
(Dollars in thousands)
|
|
|
|
|||||||||||||
|
+300
|
$
|
1,091,070
|
|
$
|
(749,960
|
)
|
(40.7
|
)%
|
10.37
|
%
|
(511
|
)
|
|||||
|
+200
|
1,369,595
|
|
(471,435
|
)
|
(25.6
|
)%
|
12.47
|
%
|
(302
|
)
|
|||||||
|
+100
|
1,638,001
|
|
(203,029
|
)
|
(11.0
|
)%
|
14.30
|
%
|
(119
|
)
|
|||||||
|
0
|
1,841,030
|
|
—
|
|
—
|
%
|
15.49
|
%
|
—
|
|
|||||||
|
-100
|
1,835,713
|
|
(5,316
|
)
|
(0.3
|
)%
|
15.15
|
%
|
(34
|
)
|
|||||||
____________
|
(1)
|
Assumes an instantaneous uniform change in interest rates at all maturities.
|
|
(2)
|
EVE is the discounted present value of expected cash flows from assets, liabilities and off-balance sheet contracts.
|
|
(3)
|
Present value of assets represents the discounted present value of incoming cash flows on interest-earning assets.
|
|
(4)
|
EVE Ratio represents EVE divided by the present value of assets.
|
The table above indicates that at
September 30, 2012
, in the event of an increase of 200 basis points in all interest rates, the Association would experience a
25.6%
decrease
in EVE. In the event of a 100 basis point decrease in interest rates, the Association would experience a
0.3%
decrease
in EVE.
The following table is based on the calculations contained in the previous table, and sets forth the change in the EVE at a +200 basis point rate of shock at
September 30, 2012
, with comparative information as of
September 30, 2011
. The Association measures and manages its interest rate risk for interest rate shocks relative to established risk tolerances in EVE.
|
At
September 30,
|
|||||
|
Risk Measure (+200 bp Rate Shock)
|
2012
|
2011
|
|||
|
Pre-Shock EVE Ratio
|
15.49
|
%
|
15.43
|
%
|
|
|
Post-Shock EVE Ratio
|
12.47
|
%
|
12.31
|
%
|
|
|
Sensitivity Measure in basis points
|
(302
|
)
|
(312
|
)
|
|
Certain shortcomings are inherent in the methodologies used in determining interest rate risk through changes in EVE. Modeling changes in EVE are based upon certain assumptions that may or may not reflect the manner in which actual yields and costs respond to changes in market interest rates. In this regard, the EVE tables presented above assume that the composition of our interest-sensitive assets and liabilities existing at the beginning of a period remains constant over the period being measured and assume that a particular change in interest rates is reflected uniformly across the yield curve regardless of the duration or repricing of specific assets and liabilities. Accordingly, although the EVE tables provide an indication of our interest rate risk exposure at a particular point in time, such measurements are not intended to and do not provide a precise forecast of the effect of changes in market interest rates on our EVE and will differ from actual results.
We have previously reported that our former primary regulator, the OTS, expressed concern with respect to several significant assumptions used in our prior internal interest rate risk (“IRR”) model, as well as the reliability of the resulting IRR profiles generated by that model. While we believe that the previous IRR model enabled us to efficiently, prudently and reasonably measure and manage IRR, we nevertheless replaced that modeling system with a system that offers enhanced functionality and capabilities. Based on validation and comparative analysis, we do not believe that the IRR profile reported as
84
of September 30, 2011 using our prior IRR model was materially different from the results that would have been derived if the new IRR modeling software had been available. Installation and implementation of the new IRR modeling software was finalized during the quarter ended March 31, 2012 and, for periods subsequent to December 31, 2011, the IRR disclosures as determined using the new model are reported in our SEC filings. In connection with the installation and implementation of the new IRR modeling software, factors related to prepayment, decay and default assumptions that impact the computation of EVE were customized, based on the results of an independent, third party study that was prepared using the Association's data. Use of these customized assumptions should further enhance the alignment of our EVE calculations with our risk profile. In addition to our month end modeling reports that use current month end balances and current month end interest rates, we also compute EVE using current month end balances and last month's interest rates in order to isolate the EVE impact resulting purely from interest rate changes. These results are then reviewed and discussed by management with appropriate actions taken if deemed necessary. At
September 30, 2012
the results were in line with management's expectations. The new model also possesses random patterning capabilities that our prior model lacked and accommodates regression analytics applicable to the prepayment and decay profiles of our borrower and depositor portfolios. We believe that the new model expands our ability to run alternative modeling scenarios and improves the timeliness of and our access to decision making data that is integral to our IRR management processes.
Earnings at Risk.
In addition to EVE calculations, we use our simulation model to analyze the sensitivity of our net interest income to changes in interest rates (the institution’s earnings at risk or “EaR”). Net interest income is the difference between the interest income we earn on our interest-earning assets, such as loans and securities, and the interest we pay on our interest-bearing liabilities, such as deposits and borrowings. In our model, we estimate what our net interest income would be for twelve and twenty-four month periods using customized (based on our portfolio characteristics) assumptions with respect to loan prepayment rates and deposit decay rates, and a commercially available forward yield curve for assumptions as to projected interest rates. We then calculate what the net interest income would be for the same period in the event of instantaneous changes in market interest rates. As of
September 30, 2012
, we estimated that our EaR for the 12 months ending September 30,
2013
would
decrease
by
12.0%
in the event of an instantaneous 200 basis point increase in market interest rates.
Certain shortcomings are also inherent in the methodologies used in determining interest rate risk through changes in EaR. Modeling changes in EaR require making certain assumptions that may or may not reflect the manner in which actual yields and costs respond to changes in market interest rates. In this regard, the interest rate risk information presented above assumes that the composition of our interest-sensitive assets and liabilities existing at the beginning of a period remains substantially constant over the period being measured and assumes that a particular change in interest rates is reflected uniformly across the yield curve regardless of the duration or repricing of specific assets and liabilities. Accordingly, although interest rate risk calculations provide an indication of our interest rate risk exposure at a particular point in time, such measurements are not intended to and do not provide a precise forecast of the effect of changes in market interest rates on our net interest income and will differ from actual results. In addition to the preparation of computations as described above, we also formulate simulations based on a variety of non-linear changes in interest rates and a variety of non-constant balance sheet composition scenarios.
The EVE and EaR analyses are similar in that they both start with the same month end balance sheet amounts, weighted average coupon and maturity. The underlying prepayment, decay and default assumptions are also the same and they both start with the same month end "markets" (Treasury and Libor yield curves, etc.). From that similar starting point, the models follow divergent paths. EVE is a stochastic model using 200 different interest rate paths to compute market value at the transaction level for each of the categories on the balance sheet whereas EaR uses the implied forward curve to compute interest income/expense at transaction level for each of the categories on the balance sheet.
EVE is considered as a point in time calculation with a "liquidation" view of the Association where all the cash flows (including interest, principal and prepayments) are modeled through the maturity of the instrument and discounted using discount factors derived from the current market yield curve. All "on balance sheet" amounts do not assume any new business volume. It provides a long term view and helps to define changes in equity and duration as a result of changes in interest rates. On the other hand, EaR is based on balance sheet projections going one year forward and assumes new business volume and pricing to calculate net interest income under different interest rate environments. EaR is calculated to determine the sensitivity of net interest income under different interest rate scenarios. With each of these models, specific policy limits have been established that are compared with the actual month end results. These limits have been approved by the Association's board of directors and are used as benchmarks to evaluate and moderate interest rate risk. In the event that there is a breach of policy limits, management is responsible for taking such action, similar to those described under the preceding heading of
General
, as may be necessary in order to return the Association's interest rate risk profile to a position that is in compliance with the policy. At
September 30, 2012
the IRR profile as disclosed above did not breach our internal limits under any scenario that was considered more probable than extremely remote.
85
|
Item 8.
|
Financial Statements and Supplementary Data
|
The Financial Statements are included in Part IV, Item 15 of this Form 10-K.
|
Item 9.
|
Changes in and Disagreements with Accountants on Accounting and Financial Disclosure
|
Not applicable.
|
Item 9A.
|
Controls and Procedures
|
Disclosure Controls and Procedures
Under the supervision of and with the participation of the Company’s management, including our principal executive officer and principal financial officer, we have evaluated the effectiveness of the design and operation of our disclosure controls and procedures (as defined in Rule 13a-15(e) and 15d-15(e) under the Exchange Act) as of the end of the period covered by this report. Disclosure controls and procedures include, without limitation, controls and procedures designed to ensure that information required to be disclosed by an issuer in the reports that it files or submits under the Act is accumulated and communicated to the issuer’s management, including its principal executive and principal financial officers, or persons performing similar functions, as appropriate to allow timely decisions regarding required disclosure. Based upon that evaluation, our principal executive officer and principal financial officer concluded that, as of the end of the period covered by this report, our disclosure controls and procedures were effective to ensure that information required to be disclosed in the reports that we file or submit under the Exchange Act is recorded, processed, summarized and reported, within the time periods specified in the SEC’s rules and forms.
Changes in Internal Control Over Financial Reporting
No change in our internal control over financial reporting (as defined in Rules 13a-15(f) and 15d-15(f) under the Exchange Act) occurred during the most recent fiscal quarter that has materially affected, or is reasonably likely to materially affect, our internal control over financial reporting.
Management’s Report Regarding Internal Control Over Financial Reporting
The Company’s management is responsible for establishing and maintaining adequate internal control over financial reporting as such terms are defined in Rule 13a-15(f) of the Exchange Act of 1934. Our system of internal controls is designed to provide reasonable assurance that the financial statements that we provide to the public are fairly presented.
Our internal control over financial reporting includes policies and procedures that (i) pertain to the maintenance of records that, in reasonable detail, accurately and fairly reflect transactions and dispositions of assets, (ii) provide reasonable assurances that transactions are recorded as necessary to permit preparation of financial statements in accordance with accounting principles generally accepted in the United States of America and that receipts and expenditures are being made only in accordance with authorizations of management and the directors of the Company; and (iii) provide reasonable assurance regarding prevention or timely detection of unauthorized acquisition, use or disposition of the Company’s assets that could have a material effect on our financial statements.
All internal control systems, no matter how well designed, have inherent limitations. Therefore, even those systems determined to be effective can provide only reasonable assurance with respect to financial statement preparation and presentation. Accordingly, absolute assurance cannot be provided that the effectiveness of the internal control systems may not become inadequate in future periods because of changes in conditions, or because the degree of compliance with the policies or procedures may deteriorate.
Management assessed the effectiveness of the Company’s internal control over financial reporting as of
September 30, 2012
. In making this assessment, the criteria set forth by the Committee of Sponsoring Organizations of the Treadway Commission in
Internal Control-Integrated Framework
was utilized. Based on this assessment, management believes that, as of
September 30, 2012
, the Company’s internal control over financial reporting is effective.
The Company’s independent registered public accounting firm has issued an attestation report on the Company’s internal control over financial reporting.
The Sarbanes-Oxley Act Section 302 Certifications have been filed as Exhibit 31.1 and Exhibit 31.2 to this Annual Report on Form 10-K.
86
REPORT OF INDEPENDENT REGISTERED PUBLIC ACCOUNTING FIRM
To the Board of Directors and Shareholders of
TFS Financial Corporation
Cleveland, OH
We have audited the internal control over financial reporting of TFS Financial Corporation and subsidiaries (the “Company”) as of September 30, 2012, based on criteria established in
Internal Control—Integrated Framework
issued by the Committee of Sponsoring Organizations of the Treadway Commission. The Company’s management is responsible for maintaining effective internal control over financial reporting and for its assessment of the effectiveness of internal control over financial reporting, included in the accompanying Management’s Report Regarding Internal Control Over Financial Reporting. Our responsibility is to express an opinion on the Company’s internal control over financial reporting based on our audit.
We conducted our audit in accordance with the standards of the Public Company Accounting Oversight Board (United States). Those standards require that we plan and perform the audit to obtain reasonable assurance about whether effective internal control over financial reporting was maintained in all material respects. Our audit included obtaining an understanding of internal control over financial reporting, assessing the risk that a material weakness exists, testing and evaluating the design and operating effectiveness of internal control based on the assessed risk, and performing such other procedures as we considered necessary in the circumstances. We believe that our audit provides a reasonable basis for our opinion.
A company’s internal control over financial reporting is a process designed by, or under the supervision of, the company’s principal executive and principal financial officers, or persons performing similar functions, and effected by the company’s board of directors, management, and other personnel to provide reasonable assurance regarding the reliability of financial reporting and the preparation of financial statements for external purposes in accordance with generally accepted accounting principles. A company’s internal control over financial reporting includes those policies and procedures that (1) pertain to the maintenance of records that, in reasonable detail, accurately and fairly reflect the transactions and dispositions of the assets of the company; (2) provide reasonable assurance that transactions are recorded as necessary to permit preparation of financial statements in accordance with generally accepted accounting principles, and that receipts and expenditures of the company are being made only in accordance with authorizations of management and directors of the company; and (3) provide reasonable assurance regarding prevention or timely detection of unauthorized acquisition, use, or disposition of the company’s assets that could have a material effect on the financial statements.
Because of the inherent limitations of internal control over financial reporting, including the possibility of collusion or improper management override of controls, material misstatements due to error or fraud may not be prevented or detected on a timely basis. Also, projections of any evaluation of the effectiveness of the internal control over financial reporting to future periods are subject to the risk that the controls may become inadequate because of changes in conditions, or that the degree of compliance with the policies or procedures may deteriorate.
In our opinion, the Company maintained, in all material respects, effective internal control over financial reporting as of September 30, 2012, based on the criteria established in
Internal Control—Integrated Framework
issued by the Committee of Sponsoring Organizations of the Treadway Commission.
We have also audited, in accordance with the standards of the Public Company Accounting Oversight Board (United States), the consolidated financial statements as of and for the year ended September 30, 2012 of the Company and our report dated November 29, 2012, expressed an unqualified opinion on those financial statements.
/s/ Deloitte & Touche LLP
Cleveland, OH
November 29, 2012
87
|
Item 9B.
|
Other Information
|
Not applicable.
|
Item 10.
|
Directors, Executive Officers and Corporate Governance
|
Incorporated by reference from the Notice of Annual Meeting and Proxy Statement for the 2013 Annual Meeting of Shareholders (the “Proxy Statement”) sections entitled “Proposal One: Election of Directors,” “Executive Compensation,” “Section 16(a) Beneficial Ownership Reporting Compliance” and “Corporate Governance.” Such information will be filed with the SEC no later than 120 days after the end of the fiscal year covered by this report.
The table below sets forth information, as of September 30, 2012, regarding our executive officers other than Messrs. Stefanski and Kobak and Ms. Piterans.
|
Name
|
Title
|
Age
|
|
Ralph M. Betters
|
Chief Information Officer
|
61
|
|
David S. Huffman
|
Chief Financial Officer
|
60
|
|
Paul J. Huml
|
Chief Accounting Officer Chief Operating Officer, The Company
|
53
|
|
Terence C. Paulett
|
Chief Risk Officer
|
59
|
|
Meredith S. Weil
|
Chief Operating Officer, The Association
|
45
|
The executive officers of the Company and the Association are elected annually and hold office until their respective successors are elected or until death, resignation, retirement or removal by the board of directors.
The Business Background of Our Executive Officers
The business experience for the past five years of each of our executive officers other than Messrs. Stefanski and Kobak and Ms. Piterans is set forth below. Unless otherwise indicated, executive officers have held their positions for the past five years.
Ralph M. Betters
is the Chief Information Officer for the Association, a position he has held since 1991. Prior to joining the Association, he was an information technology principal in the consulting practice of KPMG Peat Marwick, where he was employed from 1980 until 1991. Mr. Betters has more than 30 years of experience in the technology industry.
David S. Huffman
joined the Association in 1993, and has served as its Chief Financial Officer since 2000. He has also served as Chief Financial Officer of the Company since 2004. Mr. Huffman has more than 30 years of experience in the financial institutions industry, including serving as Chief Financial Officer of First American Savings Bank of Canton, Ohio, from 1989 to 1993.
Paul J. Huml
joined the Association as a Vice President in 1998 and was appointed Chief Operating Officer of the Company in 2002 and Chief Accounting Officer in June 2009. Prior to joining the Association, Mr. Huml spent 10 years in the hotel industry, focusing on the areas of finance, real estate development and risk management. Mr. Huml is a certified public accountant in the state of Ohio.
Terence C. Paulett
joined the Association in 1994 and was named Chief Risk Officer in 2011. During his time with the Association, Mr. Paulett has managed many different operational departments, including underwriting, risk, compliance, legal and internal audit. Mr. Paulett’s more than 30 years in the banking industry have also included overseeing several credit and audit functions with both Commerce Exchange Bank and AmeriTrust.
88
Meredith S. Weil
joined the Association in 1999 and was named Chief Operating Officer in July 2012. Prior to her current role, Ms. Weil held several senior management positions within the Association, including that of regional manager of retail delivery operations, overseeing customer service and internet services, as well as marketing. Ms. Weil has spent more than 20 years in the banking industry. Prior to joining the Association, she was Vice President of Strategic Management with Key Bank in Cleveland.
The Company has adopted a policy statement entitled
CODE OF ETHICS FOR SENIOR FINANCIAL OFFICERS
that applies to our chief executive officer and our senior financial officers. A copy of the
CODE OF ETHICS FOR SENIOR FINANCIAL OFFICERS
is available on our website, www.thirdfederal.com.
|
Item 11.
|
Executive Compensation
|
Incorporated by reference from the sections of the Proxy Statement entitled “Executive Compensation,” “Compensation Committee Report,” and “Director Compensation.” Such information will be filed with the SEC no later than 120 days after the end of the fiscal year covered by this report.
|
Item 12.
|
Security Ownership of Certain Beneficial Owners and Management and Related Stockholder Matters
|
Incorporated by reference from the section of the Proxy Statement entitled “Security Ownership of Certain Beneficial Owners and Management.” Such information will be filed with the SEC no later than 120 days after the end of the fiscal year covered by this report.
The Company’s only equity compensation program that was not approved by shareholders is its employee stock ownership plan which was established in conjunction with our initial stock offering completed in April 2007.
The following table provides information as of
September 30, 2012
regarding our 2008 Equity Incentive Plan that was approved by shareholders on May 29, 2008:
|
Plan Category
|
Number of Shares to be
Issued Upon Exercise of
Outstanding Options,
Rights and Warrants
|
Weighted-Average
Exercise Price of
Outstanding Options,
Rights and Warrants
|
Number of Shares
Remaining Available
for Future Issuance
Under the Plan
|
|||||||||||||
|
Equity Compensation Plans
|
||||||||||||||||
|
Approved by Stockholders
|
7,779,104
|
|
$
|
8.99
|
|
(1)
|
14,382,759
|
|
||||||||
|
Equity Compensation Plans
|
||||||||||||||||
|
Not Approved by Stockholders
|
N/A
|
|
N/A
|
|
N/A
|
|
||||||||||
|
Total
|
7,779,104
|
|
$
|
8.99
|
|
(1)
|
14,382,759
|
|
||||||||
______________________
|
(1)
|
Weighted-Average Exercise Price of Outstanding Options, Rights and Warrants is calculated using
1,579,513
shares of restricted stock awards at
$0.00
and
6,199,591
shares of stock option awards at
$11.28
.
|
|
Item 13.
|
Certain Relationships and Related Transactions, and Director Independence
|
Incorporated by reference from the sections of the Proxy Statement entitled “Certain Relationships and Related Transactions” and “Corporate Governance.” Such information will be filed with the SEC no later than 120 days after the end of the fiscal year covered by this report.
|
Item 14.
|
Principal Accounting Fees and Services
|
Incorporated by reference from the section of the Proxy Statement entitled “Fees Paid to Deloitte & Touche LLP.” Such information will be filed with the SEC no later than 120 days after the end of the fiscal year covered by this report.
89
|
Item 15.
|
Exhibits and Financial Statement Schedules
|
(a)(1) Financial Statements
The following documents are filed as part of this Annual Report on Form 10-K:
|
a.
|
The consolidated financial statements of TFS Financial Corporation and subsidiaries contained in Part II, Item 8 of this Annual Report on Form 10-K:
|
|
•
|
Consolidated Statement of Condition at September 30, 2012 and 2011;
|
|
•
|
Consolidated Statement of Income for the years ended September 30, 2012, 2011 and 2010;
|
|
•
|
Consolidated Statement of Shareholders' Equity for the years ended September 30, 2012, 2011 and 2010,
|
|
•
|
Consolidated Statement of Cash Flows for the years ended September 30, 2012, 2011 and 2010; and
|
|
•
|
Notes to the Consolidated Financial Statements
|
b. The exhibits listed in the Exhibits Index beginning on Page 141 of this Annual Report on Form 10-K.
90
REPORT OF INDEPENDENT REGISTERED PUBLIC ACCOUNTING FIRM
To the Board of Directors and Shareholders of
TFS Financial Corporation
Cleveland, OH
We have audited the accompanying consolidated statements of condition of TFS Financial Corporation and subsidiaries (the “Company”) as of September 30, 2012 and 2011, and the related consolidated statements of income, shareholders’ equity, and cash flows for each of the three years in the period ended September 30, 2012. These financial statements are the responsibility of the Company’s management. Our responsibility is to express an opinion on these financial statements based on our audits.
We conducted our audits in accordance with the standards of the Public Company Accounting Oversight Board (United States). Those standards require that we plan and perform the audit to obtain reasonable assurance about whether the financial statements are free of material misstatement. An audit includes examining, on a test basis, evidence supporting the amounts and disclosures in the financial statements. An audit also includes assessing the accounting principles used and significant estimates made by management, as well as evaluating the overall financial statement presentation. We believe that our audits provide a reasonable basis for our opinion.
In our opinion, such consolidated financial statements present fairly, in all material respects, the financial position of TFS Financial Corporation and subsidiaries as of September 30, 2012 and 2011, and the results of their operations and their cash flows for each of the three years in the period ended September 30, 2012, in conformity with accounting principles generally accepted in the United States of America.
We have also audited, in accordance with the standards of the Public Company Accounting Oversight Board (United States), the Company’s internal control over financial reporting as of September 30, 2012, based on the criteria established in
Internal Control—Integrated Framework
issued by the Committee of Sponsoring Organizations of the Treadway Commission and our report dated November 29, 2012 expressed an unqualified opinion on the Company’s internal control over financial reporting.
/s/ Deloitte & Touche LLP
Cleveland, OH
November 29, 2012
91
TFS FINANCIAL CORPORATION AND SUBSIDIARIES
CONSOLIDATED STATEMENTS OF CONDITION
As of
September 30, 2012
and
2011
(In thousands, except share data)
|
2012
|
2011
|
||||||
|
ASSETS
|
|||||||
|
Cash and due from banks
|
$
|
38,914
|
|
$
|
35,532
|
|
|
|
Other interest-bearing cash equivalents
|
269,348
|
|
259,314
|
|
|||
|
Cash and cash equivalents
|
308,262
|
|
294,846
|
|
|||
|
Investment securities:
|
|||||||
|
Available for sale (amortized cost $417,416 and $15,760, respectively)
|
421,430
|
|
15,899
|
|
|||
|
Held to maturity (fair value $0 and $398,725, respectively)
|
—
|
|
392,527
|
|
|||
|
421,430
|
|
408,426
|
|
||||
|
Mortgage loans held for sale, at lower of cost or market ($3,017 measured at fair value, September 30, 2012)
|
124,528
|
|
—
|
|
|||
|
Loans held for investment, net:
|
|||||||
|
Mortgage loans
|
10,339,402
|
|
9,920,907
|
|
|||
|
Other loans
|
4,612
|
|
6,868
|
|
|||
|
Deferred loan fees, net
|
(18,561
|
)
|
(19,854
|
)
|
|||
|
Allowance for loan losses
|
(100,464
|
)
|
(156,978
|
)
|
|||
|
Loans, net
|
10,224,989
|
|
9,750,943
|
|
|||
|
Mortgage loan servicing assets, net
|
19,613
|
|
28,919
|
|
|||
|
Federal Home Loan Bank stock, at cost
|
35,620
|
|
35,620
|
|
|||
|
Real estate owned
|
19,647
|
|
19,155
|
|
|||
|
Premises, equipment, and software, net
|
61,150
|
|
59,487
|
|
|||
|
Accrued interest receivable
|
34,887
|
|
35,854
|
|
|||
|
Bank owned life insurance contracts
|
177,279
|
|
170,845
|
|
|||
|
Other assets
|
90,720
|
|
88,853
|
|
|||
|
TOTAL ASSETS
|
$
|
11,518,125
|
|
$
|
10,892,948
|
|
|
|
LIABILITIES AND SHAREHOLDERS’ EQUITY
|
|||||||
|
Deposits
|
$
|
8,981,419
|
|
$
|
8,715,910
|
|
|
|
Borrowed funds
|
488,191
|
|
139,856
|
|
|||
|
Borrowers’ advances for insurance and taxes
|
67,864
|
|
58,235
|
|
|||
|
Principal, interest, and related escrow owed on loans serviced
|
127,539
|
|
151,859
|
|
|||
|
Accrued expenses and other liabilities
|
46,262
|
|
53,164
|
|
|||
|
Total liabilities
|
9,711,275
|
|
9,119,024
|
|
|||
|
Commitments and contingent liabilities
|
|||||||
|
Preferred stock, $0.01 par value, 100,000,000 shares authorized, none issued and outstanding
|
—
|
|
—
|
|
|||
|
Common stock, $0.01 par value, 700,000,000 shares authorized; 332,318,750 shares issued; 309,009,393 and 308,915,893 outstanding at September 30, 2012 and September 30, 2011, respectively
|
3,323
|
|
3,323
|
|
|||
|
Paid-in capital
|
1,691,884
|
|
1,686,216
|
|
|||
|
Treasury stock, at cost; 23,309,357 and 23,402,857 shares at September 30, 2012 and September 30, 2011, respectively
|
(280,937
|
)
|
(282,090
|
)
|
|||
|
Unallocated ESOP shares
|
(74,751
|
)
|
(79,084
|
)
|
|||
|
Retained earnings—substantially restricted
|
473,247
|
|
461,836
|
|
|||
|
Accumulated other comprehensive loss
|
(5,916
|
)
|
(16,277
|
)
|
|||
|
Total shareholders’ equity
|
1,806,850
|
|
1,773,924
|
|
|||
|
TOTAL LIABILITIES AND SHAREHOLDERS’ EQUITY
|
$
|
11,518,125
|
|
$
|
10,892,948
|
|
|
See accompanying notes to consolidated financial statements.
92
TFS FINANCIAL CORPORATION AND SUBSIDIARIES
For each of the three years in the period ended
September 30, 2012
(In thousands, except share and per share data)
|
2012
|
2011
|
2010
|
|||||||||
|
INTEREST AND DIVIDEND INCOME:
|
|||||||||||
|
Loans, including fees
|
$
|
409,400
|
|
$
|
413,464
|
|
$
|
415,477
|
|
||
|
Investment securities available for sale
|
1,995
|
|
240
|
|
549
|
|
|||||
|
Investment securities held to maturity
|
4,245
|
|
11,455
|
|
19,046
|
|
|||||
|
Other interest and dividend earning assets
|
2,213
|
|
2,334
|
|
2,819
|
|
|||||
|
Total interest and dividend income
|
417,853
|
|
427,493
|
|
437,891
|
|
|||||
|
INTEREST EXPENSE:
|
|||||||||||
|
Deposits
|
153,100
|
|
177,842
|
|
208,462
|
|
|||||
|
Borrowed funds
|
2,546
|
|
2,003
|
|
1,923
|
|
|||||
|
Total interest expense
|
155,646
|
|
179,845
|
|
210,385
|
|
|||||
|
NET INTEREST INCOME
|
262,207
|
|
247,648
|
|
227,506
|
|
|||||
|
PROVISION FOR LOAN LOSSES
|
102,000
|
|
98,500
|
|
106,000
|
|
|||||
|
NET INTEREST INCOME AFTER PROVISION FOR LOAN LOSSES
|
160,207
|
|
149,148
|
|
121,506
|
|
|||||
|
NON-INTEREST INCOME:
|
|||||||||||
|
Fees and service charges, net of amortization
|
11,473
|
|
15,615
|
|
20,625
|
|
|||||
|
Net gain on the sale of loans
|
688
|
|
490
|
|
25,303
|
|
|||||
|
Increase in and death benefits from bank owned life insurance contracts
|
6,484
|
|
6,521
|
|
6,491
|
|
|||||
|
Income on private equity investments
|
56
|
|
1,067
|
|
669
|
|
|||||
|
Other
|
5,762
|
|
7,289
|
|
5,550
|
|
|||||
|
Total non-interest income
|
24,463
|
|
30,982
|
|
58,638
|
|
|||||
|
NON-INTEREST EXPENSE:
|
|||||||||||
|
Salaries and employee benefits
|
80,113
|
|
76,014
|
|
83,915
|
|
|||||
|
Marketing services
|
9,799
|
|
7,745
|
|
6,043
|
|
|||||
|
Office property, equipment, and software
|
20,489
|
|
20,074
|
|
20,379
|
|
|||||
|
Federal insurance premium
|
14,294
|
|
19,516
|
|
18,898
|
|
|||||
|
State franchise tax
|
6,039
|
|
4,805
|
|
4,602
|
|
|||||
|
Real estate owned expense, net
|
8,190
|
|
8,061
|
|
5,339
|
|
|||||
|
Appraisal and other loan review expenses
|
3,172
|
|
5,601
|
|
1,300
|
|
|||||
|
Other operating expenses
|
28,962
|
|
26,239
|
|
21,457
|
|
|||||
|
Total non-interest expense
|
171,058
|
|
168,055
|
|
161,933
|
|
|||||
|
INCOME BEFORE INCOME TAXES
|
13,612
|
|
12,075
|
|
18,211
|
|
|||||
|
INCOME TAX EXPENSE
|
2,133
|
|
2,735
|
|
6,873
|
|
|||||
|
NET INCOME
|
$
|
11,479
|
|
$
|
9,340
|
|
$
|
11,338
|
|
||
|
Earnings per share—basic and diluted
|
$
|
0.04
|
|
$
|
0.03
|
|
$
|
0.04
|
|
||
|
Weighted average shares outstanding
|
|||||||||||
|
Basic
|
301,226,639
|
|
300,358,096
|
|
299,795,588
|
|
|||||
|
Diluted
|
301,770,338
|
|
300,969,844
|
|
300,252,913
|
|
|||||
See accompanying notes to consolidated financial statements.
93
TFS FINANCIAL CORPORATION AND SUBSIDIARIES
CONSOLIDATED STATEMENTS OF SHAREHOLDERS’ EQUITY
For each of the three years in the period ended
September 30, 2012
(In thousands, except share and per share data)
|
|
|
|
|
|
|
Accumulated other
comprehensive income
(loss)
|
|
||||||||||||||||||
|
|
Common
stock
|
Paid-in
capital
|
Treasury
stock
|
Unallocated
common stock
held by ESOP
|
Retained
earnings
|
Unrealized
gains/(losses)
on securities
|
Pension
obligation
|
Total
shareholders’
equity
|
|||||||||||||||||
|
Balance at September 30, 2009
|
$
|
3,323
|
|
1,679,000
|
|
(287,514
|
)
|
(87,896
|
)
|
456,875
|
|
240
|
|
(18,163
|
)
|
$
|
1,745,865
|
|
|||||||
|
Comprehensive income
|
|||||||||||||||||||||||||
|
Net income
|
—
|
|
—
|
|
—
|
|
—
|
|
11,338
|
|
—
|
|
—
|
|
11,338
|
|
|||||||||
|
Change in unrealized losses on securities available for sale
|
—
|
|
—
|
|
—
|
|
—
|
|
—
|
|
(150
|
)
|
—
|
|
(150
|
)
|
|||||||||
|
Change in pension obligation
|
—
|
|
—
|
|
—
|
|
—
|
|
—
|
|
—
|
|
17
|
|
17
|
|
|||||||||
|
Total comprehensive income
|
—
|
|
—
|
|
—
|
|
—
|
|
—
|
|
—
|
|
—
|
|
11,205
|
|
|||||||||
|
Purchase of treasury stock (161,400 shares)
|
—
|
|
—
|
|
(1,810
|
)
|
—
|
|
—
|
|
—
|
|
—
|
|
(1,810
|
)
|
|||||||||
|
ESOP shares allocated or committed to be released
|
—
|
|
1,103
|
|
—
|
|
5,197
|
|
—
|
|
—
|
|
—
|
|
6,300
|
|
|||||||||
|
Compensation costs for stock-based plans
|
—
|
|
6,841
|
|
—
|
|
—
|
|
—
|
|
—
|
|
—
|
|
6,841
|
|
|||||||||
|
Excess tax benefit from stock-based compensation
|
—
|
|
57
|
|
—
|
|
—
|
|
—
|
|
—
|
|
—
|
|
57
|
|
|||||||||
|
Treasury stock allocated to restricted stock plan
|
—
|
|
(939
|
)
|
958
|
|
—
|
|
(19
|
)
|
—
|
|
—
|
|
—
|
|
|||||||||
|
Dividends paid to common shareholders ($0.21 per common share)
|
—
|
|
—
|
|
—
|
|
—
|
|
(15,561
|
)
|
—
|
|
—
|
|
(15,561
|
)
|
|||||||||
|
Balance at September 30, 2010
|
$
|
3,323
|
|
1,686,062
|
|
(288,366
|
)
|
(82,699
|
)
|
452,633
|
|
90
|
|
(18,146
|
)
|
$
|
1,752,897
|
|
|||||||
|
Comprehensive income
|
|||||||||||||||||||||||||
|
Net income
|
—
|
|
—
|
|
—
|
|
—
|
|
9,340
|
|
—
|
|
—
|
|
9,340
|
|
|||||||||
|
Change in unrealized gains on securities available for sale
|
—
|
|
—
|
|
—
|
|
—
|
|
—
|
|
—
|
|
—
|
|
—
|
|
|||||||||
|
Change in pension obligation
|
—
|
|
—
|
|
—
|
|
—
|
|
—
|
|
—
|
|
1,779
|
|
1,779
|
|
|||||||||
|
Total comprehensive income
|
—
|
|
—
|
|
—
|
|
—
|
|
—
|
|
—
|
|
—
|
|
11,119
|
|
|||||||||
|
ESOP shares allocated or committed to be released
|
—
|
|
(393
|
)
|
—
|
|
3,615
|
|
—
|
|
—
|
|
—
|
|
3,222
|
|
|||||||||
|
Compensation costs for stock-based plans
|
—
|
|
6,919
|
|
(3
|
)
|
—
|
|
—
|
|
—
|
|
—
|
|
6,916
|
|
|||||||||
|
Reversal of excess tax effect from stock-based compensation
|
—
|
|
(230
|
)
|
—
|
|
—
|
|
—
|
|
—
|
|
—
|
|
(230
|
)
|
|||||||||
|
Treasury stock allocated to restricted stock plan
|
—
|
|
(6,142
|
)
|
6,279
|
|
—
|
|
(137
|
)
|
—
|
|
—
|
|
—
|
|
|||||||||
|
Balance at September 30, 2011
|
$
|
3,323
|
|
1,686,216
|
|
(282,090
|
)
|
(79,084
|
)
|
461,836
|
|
90
|
|
(16,367
|
)
|
$
|
1,773,924
|
|
|||||||
|
Comprehensive income
|
|||||||||||||||||||||||||
|
Net income
|
—
|
|
—
|
|
—
|
|
—
|
|
11,479
|
|
—
|
|
—
|
|
11,479
|
|
|||||||||
|
Change in unrealized gains on securities available for sale
|
—
|
|
—
|
|
—
|
|
—
|
|
—
|
|
2,520
|
|
—
|
|
2,520
|
|
|||||||||
|
Change in pension obligation
|
—
|
|
—
|
|
—
|
|
—
|
|
—
|
|
—
|
|
7,841
|
|
7,841
|
|
|||||||||
|
Total comprehensive income
|
—
|
|
—
|
|
—
|
|
—
|
|
—
|
|
—
|
|
—
|
|
21,840
|
|
|||||||||
|
ESOP shares allocated or committed to be released
|
—
|
|
(330
|
)
|
—
|
|
4,333
|
|
—
|
|
—
|
|
—
|
|
4,003
|
|
|||||||||
|
Compensation costs for stock-based plans
|
—
|
|
7,112
|
|
—
|
|
—
|
|
—
|
|
—
|
|
—
|
|
7,112
|
|
|||||||||
|
Treasury stock allocated to restricted stock plan
|
—
|
|
(1,114
|
)
|
1,153
|
|
—
|
|
(68
|
)
|
—
|
|
—
|
|
(29
|
)
|
|||||||||
|
Balance at September 30, 2012
|
$
|
3,323
|
|
1,691,884
|
|
(280,937
|
)
|
(74,751
|
)
|
473,247
|
|
2,610
|
|
(8,526
|
)
|
$
|
1,806,850
|
|
|||||||
See accompanying notes to consolidated financial statements.
94
TFS FINANCIAL CORPORATION AND SUBSIDIARIES
For each of the three years in the period ended
September 30, 2012
(In thousands)
|
2012
|
2011
|
2010
|
|||||||||
|
CASH FLOWS FROM OPERATING ACTIVITIES:
|
|||||||||||
|
Net income
|
$
|
11,479
|
|
$
|
9,340
|
|
$
|
11,338
|
|
||
|
Adjustments to reconcile net income to net cash provided by operating activities:
|
|||||||||||
|
ESOP and stock-based compensation expense
|
11,115
|
|
10,138
|
|
13,141
|
|
|||||
|
Reversal of excess tax benefit related to stock-based compensation
|
—
|
|
(230
|
)
|
—
|
|
|||||
|
Depreciation and amortization
|
22,767
|
|
19,404
|
|
18,465
|
|
|||||
|
Deferred income taxes
|
(19,270
|
)
|
(8,243
|
)
|
(10,542
|
)
|
|||||
|
Provision for loan losses
|
102,000
|
|
98,500
|
|
106,000
|
|
|||||
|
Net gain on the sale of loans
|
(688
|
)
|
(490
|
)
|
(25,303
|
)
|
|||||
|
Other net losses
|
2,027
|
|
3,419
|
|
2,316
|
|
|||||
|
Principal repayments on and proceeds from sales of loans held for sale
|
26,585
|
|
—
|
|
243,127
|
|
|||||
|
Loans originated for sale
|
(9,640
|
)
|
—
|
|
(207,488
|
)
|
|||||
|
Increase in and death benefits for bank owned life insurance contracts
|
(6,480
|
)
|
(6,519
|
)
|
(6,489
|
)
|
|||||
|
Net decrease (increase) in interest receivable and other assets
|
10,180
|
|
18,732
|
|
(37,456
|
)
|
|||||
|
Net increase (decrease) in accrued expenses and other liabilities
|
4,920
|
|
(9,304
|
)
|
7,035
|
|
|||||
|
Other
|
631
|
|
821
|
|
2,380
|
|
|||||
|
Net cash provided by operating activities
|
155,626
|
|
135,568
|
|
116,524
|
|
|||||
|
CASH FLOWS FROM INVESTING ACTIVITIES:
|
|||||||||||
|
Loans originated
|
(2,928,682
|
)
|
(2,484,919
|
)
|
(2,746,054
|
)
|
|||||
|
Principal repayments on loans
|
2,185,787
|
|
1,787,544
|
|
1,886,218
|
|
|||||
|
Proceeds from principal repayments and maturities of:
|
|||||||||||
|
Securities available for sale
|
74,589
|
|
10,898
|
|
8,857
|
|
|||||
|
Securities held to maturity
|
139,533
|
|
263,176
|
|
309,853
|
|
|||||
|
Proceeds from sale of:
|
|||||||||||
|
Loans
|
—
|
|
33,722
|
|
792,511
|
|
|||||
|
Real estate owned
|
22,731
|
|
15,606
|
|
17,421
|
|
|||||
|
Purchases of:
|
|||||||||||
|
Securities available for sale
|
(134,488
|
)
|
(2,291
|
)
|
(10,331
|
)
|
|||||
|
Securities held to maturity
|
(93,509
|
)
|
(12,424
|
)
|
(380,072
|
)
|
|||||
|
Premises and equipment
|
(7,332
|
)
|
(2,616
|
)
|
(4,397
|
)
|
|||||
|
Other
|
8
|
|
(1,093
|
)
|
128
|
|
|||||
|
Net cash used in in investing activities
|
(741,363
|
)
|
(392,397
|
)
|
(125,866
|
)
|
|||||
|
CASH FLOWS FROM FINANCING ACTIVITIES:
|
|||||||||||
|
Net increase (decrease) in deposits
|
265,509
|
|
(136,031
|
)
|
281,435
|
|
|||||
|
Net increase in borrowers' advances for insurance and taxes
|
9,629
|
|
6,834
|
|
3,209
|
|
|||||
|
Net (decrease) increase in principal and interest owed on loans serviced
|
(24,320
|
)
|
(132,566
|
)
|
178,706
|
|
|||||
|
Net increase in short term borrowed funds
|
316,335
|
|
50,025
|
|
—
|
|
|||||
|
Proceeds from long term borrowed funds
|
35,000
|
|
34,673
|
|
—
|
|
|||||
|
Repayment of long term borrowed funds
|
(3,000
|
)
|
(15,000
|
)
|
—
|
|
|||||
|
Purchase of treasury shares
|
—
|
|
—
|
|
(1,810
|
)
|
|||||
|
Excess tax benefit related to stock-based compensation
|
—
|
|
—
|
|
57
|
|
|||||
|
Dividends paid to common shareholders
|
—
|
|
—
|
|
(15,561
|
)
|
|||||
|
Net cash provided by (used in) in financing activities
|
599,153
|
|
(192,065
|
)
|
446,036
|
|
|||||
|
NET INCREASE (DECREASE) IN CASH AND CASH EQUIVALENTS
|
13,416
|
|
(448,894
|
)
|
436,694
|
|
|||||
|
CASH AND CASH EQUIVALENTS—Beginning of year
|
294,846
|
|
743,740
|
|
307,046
|
|
|||||
|
CASH AND CASH EQUIVALENTS—End of year
|
$
|
308,262
|
|
$
|
294,846
|
|
$
|
743,740
|
|
||
|
SUPPLEMENTAL DISCLOSURE OF CASH FLOW INFORMATION:
|
|||||||||||
|
Cash paid for interest on deposits
|
$
|
153,463
|
|
$
|
178,452
|
|
$
|
210,810
|
|
||
|
Cash paid for interest on borrowed funds
|
2,541
|
|
1,972
|
|
1,923
|
|
|||||
|
Cash paid for income taxes
|
19,794
|
|
7,600
|
|
19,900
|
|
|||||
|
SUPPLEMENTAL SCHEDULES OF NONCASH INVESTING AND FINANCING ACTIVITIES:
|
|||||||||||
|
Transfer of loans to real estate owned
|
23,006
|
|
21,069
|
|
17,310
|
|
|||||
|
Transfer of loans from held for investment to held for sale
|
245,920
|
|
—
|
|
—
|
|
|||||
|
Transfer of loans from held for sale to held for investment
|
104,657
|
|
25,027
|
|
—
|
|
|||||
|
Transfer of investments from held to maturity to available for sale
|
343,687
|
|
—
|
|
—
|
|
|||||
See accompanying notes to consolidated financial statements.
95
TFS FINANCIAL CORPORATION AND SUBSIDIARIES
NOTES TO CONSOLIDATED FINANCIAL STATEMENTS
As of and for the years ended
September 30, 2012
,
2011
, and
2010
(Dollars in thousands unless otherwise indicated)
1. SUMMARY OF SIGNIFICANT ACCOUNTING POLICIES
The accounting and reporting policies of TFS Financial Corporation and its subsidiaries (collectively, the “Company”) conform to accounting principles generally accepted in the United States of America (“GAAP”) and to general practices within the thrift industry.
In preparing the accompanying consolidated financial statements, subsequent events were evaluated through the time the consolidated financial statements were issued. No material subsequent events have occurred requiring recognition in the consolidated financial statements or disclosure in the notes to the consolidated financial statements.
The following is a description of the significant accounting and reporting policies, which the Company follows in preparing and presenting its consolidated financial statements.
Business
—TFS Financial Corporation (the “Holding Company”), a federally chartered stock holding company, conducts its principal activities through its wholly owned subsidiaries. The principal line of business of the Company is retail consumer banking, including mortgage lending, deposit gathering, and other insignificant financial services. Third Federal Savings and Loan Association of Cleveland, MHC (“Third Federal Savings, MHC”), its federally chartered mutual holding company parent, currently owns
73.50%
of the outstanding shares of common stock of the Company.
The Company’s primary operating subsidiaries include Third Federal Savings and Loan Association of Cleveland (the "Association” or “Third Federal Savings and Loan”) and Third Capital, Inc. (“Third Capital”). The Association is a federal savings association, which provides retail loan and savings products to its customers in Ohio and Florida, through its
39
full-service branches,
eight
loan production offices, customer service call center and internet site. The Association also provides savings products and first mortgage refinance loans in states outside of its branch footprint. Third Capital was formed to hold non-thrift investments and subsidiaries, which include a limited liability company that acquires and manages commercial real estate, a Vermont captive reinsurance company, an entity that pursues merger and acquisition opportunities and investments in private equity investment funds.
Principles of Consolidation
—The consolidated financial statements of the Company include the accounts of the Holding Company and its wholly owned subsidiaries. Intercompany balances and transactions have been eliminated in consolidation.
Cash and Cash Equivalents
—Cash and cash equivalents consist of working cash on hand, and demand and interest bearing deposits at other financial institutions with maturities of three months or less. For purposes of reporting cash flows, cash and cash equivalents also includes federal funds sold. The Company has acknowledged informal agreements with banks where it maintains deposits. Under these agreements, service fees charged to the Company are waived provided certain average compensating balances are maintained throughout each month.
Investment Securities
—Securities held to maturity are securities that the Company has the positive intent and the ability to hold to maturity; these securities are reported at amortized cost and adjusted for unamortized premiums and discounts. Securities held for trading are securities that are bought and held principally for the purpose of selling in the near term; these securities are reported at fair value, with unrealized gains and losses reported in current earnings. All other securities are classified as available for sale. Securities held as available for sale are reported at fair value, with unrealized gains and losses, net of tax, reported as a component of accumulated other comprehensive income (“AOCI”). Management determines the appropriate classification at the time of purchase.
Gains and losses on the sale of investment and mortgage-backed securities available for sale and trading are computed on a specific identification basis. Purchases and sales of securities are accounted for on a trade-date or settlement-date, depending on the settlement terms.
A decline in the fair value of any available for sale or held to maturity security, below cost, that is deemed to be other than temporary, results in a reduction in the carrying amount to fair value. The impairment loss is bifurcated between that related to credit loss which is recognized in non-interest income and that related to all other factors which is recognized in other comprehensive income. To determine whether an impairment is other than temporary, the Company considers, among other things, the duration and extent to which the fair value of an investment is less than its cost, changes in value subsequent to year end, forecast performance of the issuer, and whether the Company has the intent to hold the investment until market price
96
recovery, or, for debt securities, whether the Company has the intent to sell the security or more likely than not will be required to sell the debt security before its anticipated recovery.
Premiums and discounts are amortized using the level-yield method.
Mortgage Banking Activity
—Mortgage loans originated and intended for sale in the secondary market are carried at the lower of cost or estimated fair value in the aggregate. Mortgage loans included in pending agency contracts to sell and securitize loans are carried at fair value. Fair value is based on quoted secondary market pricing for loan portfolios with similar characteristics and includes consideration of deferred fees (costs). Net unrealized losses are recognized in a valuation allowance by charges to income.
The Company retains servicing on loans that are sold and recognizes an asset for mortgage loan servicing rights based on the fair value of the servicing rights. Mortgage loan servicing rights are recorded at the lower of cost or fair value. Mortgage loan servicing rights are reported net of accumulated amortization, which is recorded in proportion to, and over the period of, estimated net servicing revenues. The impairment analysis is based on predominant risk characteristics of the loans serviced, such as type, fixed and adjustable rate loans, original terms and interest rates. Fair values are estimated using discounted cash flows based on current interest rates and prepayment assumptions, and impairment is monitored periodically. The amount of impairment recognized is the amount by which the mortgage loan servicing assets exceed their fair value. The Company monitors prepayments and changes amortization of mortgage servicing rights accordingly.
Servicing fee income net of amortization and other loan fees collected on loans serviced for others are included in Fees and service charges, net of amortization on the financial statements.
Derivative Instruments
—The Company enters into certain transactions, referred to as forward commitments, for the sale of mortgage loans principally to protect against the risk of adverse interest rate movements on the value of those assets. The Company recognizes the fair value of the contracts when the characteristics of those contracts meet the definition of a derivative. These derivatives are not designated in a hedging relationship; therefore, gains and losses are recognized immediately in the statement of income.
The Company enters into commitments to originate loans which, when funded, will be classified as held for sale. Such commitments meet the definition of a derivative and are not designated in a hedging relationship; therefore, gains and losses are recognized immediately in the statement of income.
Loans and Related Fees
—Loans originated with the intent to hold into the foreseeable future are carried at unpaid principal balances adjusted for partial charge-offs, the allowance for loan losses and net deferred origination fees. Interest on loans is accrued and credited to income as earned. Interest is not accrued on loans when collectability is uncertain.
Loan fees and certain direct loan origination costs are deferred and recognized as an adjustment to interest income using the level-yield method over the contractual lives of related loans, if the loans are held for investment. If the loans are held for sale, net deferred fees (costs) are not amortized, but rather are recognized when the related loans are sold.
Allowance for Loan Losses
—The allowance for loan losses is assessed on a quarterly basis and provisions for loan losses are made in order to maintain the allowance at a level sufficient to absorb credit losses in the portfolio. Impairment evaluations are performed on loans segregated into homogeneous pools based on similarities in credit profile, product and property types. Through the evaluation, general allowances for loan losses are assessed based on historical loan loss experience for each homogeneous pool. General allowances are adjusted to address other factors that affect estimated probable losses including the size of the portion of the portfolio that is not subjected to individual review; current delinquency statistics; the status of loans in foreclosure, real estate in judgment and real estate owned; national, regional and local economic factors and trends; asset disposition loss statistics (both current and historical); and the relative level of individually allocated valuation allowances to the balances of loans individually reviewed. The allowance for loan losses is increased by charges to income and decreased by charge-offs (net of recoveries). Management believes the allowance is adequate.
For further discussion on the allowance for loan losses, non-accrual, impairment, and troubled debt restructurings, see
Note 5. LOANS AND ALLOWANCE FOR LOAN LOSSES.
Real Estate Owned
—Real estate owned represents real estate acquired through foreclosure or deed in lieu of foreclosure and is carried at the lower of cost or fair value less estimated selling costs. Management performs periodic valuations and a charge to operations is recorded for any excess of the carrying value over the fair value less estimated costs to sell the property. Costs related to holding and maintaining the property are charged to expense.
Premises, Equipment, and Software
—Depreciation and amortization of premises, equipment and software is computed on a straight-line basis over the estimated useful lives of the related assets. Estimated lives are
20
to
50
years for office
97
facilities and
three
to
10
years for equipment and software. Amortization of leasehold improvements is computed on a straight-line basis over the lesser of the lease term or the life of the related asset.
Impairment of Long-Lived Assets
—Long-lived assets, consisting of premises, equipment and software, are reviewed for impairment whenever events or changes in circumstances indicate that the carrying amount of an asset may not be recoverable. Recoverability of assets to be held and used is measured by a comparison of the carrying amount of an asset to future net cash flows expected to be generated by the asset. If such assets are considered to be impaired, the impairment to be recognized is measured by the amount by which the carrying amount of the assets exceeds the recovery amount or estimated fair value of the assets. No events or changes in circumstances have occurred causing management to evaluate the recoverability of the Company’s long-lived assets.
Private Equity Investments
—Private equity investments are funds managed by third parties. Each fund is diversified according to the terms of the fund’s agreement and the general partner’s direction. These investments, which are not publicly traded, are initially valued at cost and subsequent changes are recorded at fair value. Fair value estimates are based upon currently available information and may not represent amounts that will ultimately be realized, which will depend on future events and circumstances. At
September 30, 2012
and
2011
, the fair value of private equity investments included in Other Assets was
$944
and
$1,604
, respectively. The income related to these investments and changes in fair value estimates of
$56
,
$1,067
, and
$669
for
2012
,
2011
, and
2010
, respectively, are reported in Non-interest Income.
Goodwill
—The excess of purchase price over the fair value of net assets of acquired companies is classified as goodwill and reported in Other Assets. Goodwill was
$9,732
at
September 30, 2012
and
2011
. Goodwill is reviewed for impairment on an annual basis as of September 30.
No
impairment was identified as of
September 30, 2012
or
2011
.
Taxes on Income
—Deferred tax assets and liabilities are recognized for the future tax consequences attributable to differences between the financial statement carrying amounts of existing assets and liabilities and their respective tax bases. Deferred tax assets and liabilities are measured using enacted tax rates expected to apply to taxable income in the years in which those temporary differences are expected to be recovered or settled. The effect on deferred tax assets and liabilities of a change in tax rates is recognized in income in the period that includes the enactment date. Additional information about policies related to income taxes is included in
Note 12. Income Taxes
.
Deposits
—Interest on deposits is accrued and charged to expense monthly and is paid or credited in accordance with the terms of the accounts.
Treasury Stock—
Acquisitions of treasury stock are recorded at cost using the cost method of accounting. Repurchases may be made through open market purchases, block trades, and in negotiated private transactions, subject to the availability of stock, general market conditions, the trading price of the stock, alternative uses for capital, and the Company’s financial performance. Repurchased shares will be available for general corporate purposes.
Accumulated Other Comprehensive Loss
—Accumulated other comprehensive loss consists of pension liability adjustments and gains (losses) on securities available for sale, net of the related tax effects.
Share-Based Compensation
—Compensation expense for awards of equity instruments is recognized on a straight-line basis over the requisite service period based on the grant date fair value estimated in accordance with the provisions of Financial Accounting Standards Board (“FASB”) Accounting Standards Codification (“ASC”) 718 “Compensation—Stock Compensation”. Share-based compensation expense is included in Salaries and employee benefits in the consolidated statements of income.
The grant date fair value of stock options is estimated using the Black-Scholes option-pricing model using assumptions for the expected option term, expected stock price volatility, risk-free interest rate, and expected dividend yield. Due to limited historical data on exercise of share options, the simplified method is used to estimate expected option term.
Advertising Costs
—Advertising costs are expensed as incurred.
Earnings per Share
—Basic earnings per share is computed by dividing net income (loss) by the weighted average shares of common stock outstanding. Outstanding shares include shares sold to subscribers, shares held by the Third Federal Foundation, shares of the Employee Stock Ownership Plan which have been allocated or committed to be released for allocation to participants, and shares held by Third Federal Savings, MHC.
Diluted earnings per share is computed using the same method as basic earnings per share, but reflects the potential dilution, if any, of unexercised stock options and unvested shares of restricted stock units that could occur if stock options were exercised and restricted stock units were issued and converted into common stock. These potentially dilutive shares would then be included in the weighted average number of shares outstanding for the period using the treasury stock method. At
98
September 30, 2012
,
2011
and
2010
, potentially dilutive shares include stock options and restricted stock units issued through stock-based compensation plans.
Use of Estimates
—The preparation of financial statements in conformity with GAAP requires management to make estimates and assumptions that affect the reported amounts of assets and liabilities at the date of the financial statements and the reported amounts of revenues and expenses during the reporting period. Actual results could differ from these estimates.
2. STOCK TRANSACTIONS
The Holding Company completed its initial public stock offering on
April 20, 2007
and sold
100,199,618
shares, or
30.16%
of its post-offering outstanding common stock, to subscribers in the offering. Third Federal Savings, MHC, the Company’s mutual holding company parent, holds
227,119,132
shares of the Holding Company’s outstanding common stock. Additionally, the Association contributed
$5,000
in cash and the Holding Company issued
5,000,000
shares of common stock, or
1.50%
of its post-offering outstanding common stock, to Third Federal Foundation.
On March 12, 2009, the Board of Directors approved a fourth repurchase program authorizing the repurchase of up to an additional
3,300,000
shares of the Company’s outstanding common stock.
No
shares were repurchased during the year ended
September 30, 2012
. At
September 30, 2012
, there are
2,156,250
shares remaining to be purchased under the fourth repurchase program. As a result of the concerns communicated to the Company by the Office of Thrift Supervision (“OTS”), which was merged into the OCC on July 21, 2011, and pending an evaluation by the Company’s current, primary regulators, the OCC and the Board of Governors of the Federal Reserve System (“Federal Reserve” or "FRB") (see Note 3), the Company has suspended its repurchase program. The Company previously repurchased
23,000,000
shares of the Company’s common stock as part of the first three previous Board of Directors-approved share repurchase programs.
3. REGULATORY MATTERS
The Association is subject to various regulatory capital requirements administered by the federal banking agencies. Failure to meet minimum capital requirements can initiate certain mandatory and possibly additional discretionary actions by regulators that, if undertaken, could have a direct material effect on the financial statements of the Association. Under capital adequacy guidelines and the regulatory framework for prompt corrective action, the Association must meet specific capital guidelines that involve quantitative measures of its assets, liabilities, and certain off-balance-sheet items as calculated under regulatory accounting practices. The capital amounts and classifications are also subject to qualitative judgments by the regulators about components, risk weightings, and other factors.
Quantitative measures established by regulation to ensure capital adequacy require the Association to maintain minimum amounts and ratios (set forth in the table below) of total and Tier I capital (as defined in the regulations) to risk-weighted assets (as defined), Core capital (as defined) to adjusted assets (as defined), and Tangible capital (as defined) to tangible assets. Management believes that, as of
September 30, 2012
, the Association met all capital adequacy requirements to which it is subject.
The Association is subject to various regulatory capital requirements, including a risk-based capital measure. The risk-based capital guidelines include both a definition of capital and a framework for calculating risk-weighted assets by assigning balance sheet assets and off-balance sheet items to broad risk categories. At
September 30, 2012
, the Association exceeded all regulatory capital requirements and is considered “well capitalized” under regulatory guidelines.
99
The following table summarizes the actual capital amounts and ratios of the Association as of
September 30, 2012
and
2011
, compared to the minimum capital adequacy requirements and the requirements for classification as a well capitalized institution.
|
|
|
|
Minimum Requirements
|
|||||||||||||||||
|
|
Actual
|
For Capital
Adequacy Purposes
|
To be “Well Capitalized”
Under Prompt Corrective
Action Provision
|
|||||||||||||||||
|
|
Amount
|
Ratio
|
Amount
|
Ratio
|
Amount
|
Ratio
|
||||||||||||||
|
September 30, 2012
|
||||||||||||||||||||
|
Total Capital to Risk-Weighted Assets
|
$
|
1,618,653
|
|
22.19
|
%
|
$
|
583,586
|
|
8.00
|
%
|
$
|
729,482
|
|
10.00
|
%
|
|||||
|
Core Capital to Adjusted Tangible Assets
|
1,527,353
|
|
13.31
|
%
|
458,910
|
|
4.00
|
%
|
573,637
|
|
5.00
|
%
|
||||||||
|
Tier 1 Capital to Risk-Weighted Assets
|
1,527,353
|
|
20.94
|
%
|
N/A
|
|
N/A
|
|
437,689
|
|
6.00
|
%
|
||||||||
|
September 30, 2011
|
||||||||||||||||||||
|
Total Capital to Risk-Weighted Assets
|
$
|
1,596,785
|
|
22.29
|
%
|
$
|
573,030
|
|
8.00
|
%
|
$
|
716,287
|
|
10.00
|
%
|
|||||
|
Core Capital to Adjusted Tangible Assets
|
1,507,249
|
|
13.90
|
%
|
433,847
|
|
4.00
|
%
|
542,309
|
|
5.00
|
%
|
||||||||
|
Tier 1 Capital to Risk-Weighted Assets
|
1,507,249
|
|
21.04
|
%
|
N/A
|
|
N/A
|
|
429,772
|
|
6.00
|
%
|
||||||||
The following table reconciles the Association’s total capital under GAAP to reported regulatory capital amounts as of
September 30, 2012
and
2011
.
|
2012
|
2011
|
||||||
|
Total capital as reported under GAAP
|
$
|
1,526,286
|
|
$
|
1,495,820
|
|
|
|
Goodwill
|
(4,848
|
)
|
(4,848
|
)
|
|||
|
AOCI related to pension obligation
|
8,526
|
|
16,367
|
|
|||
|
Other
|
(2,611
|
)
|
(90
|
)
|
|||
|
Total core and tier 1 capital
|
1,527,353
|
|
1,507,249
|
|
|||
|
Allowable allowance for loan losses
|
91,300
|
|
89,536
|
|
|||
|
Total risk based capital
|
$
|
1,618,653
|
|
$
|
1,596,785
|
|
|
There were
no
dividends paid to the Company during the years ended
September 30, 2012
and
September 30, 2011
.
Because of concerns communicated to the Company by the OTS, which was merged into the OCC on July 21, 2011, and pending an evaluation by the Company’s current federal regulators, the OCC (for the Association) and the FRB (for the Holding Company), the Company does not intend to declare or pay a cash dividend or to repurchase any of its outstanding common stock until the concerns of the Company’s regulators are resolved. In addition, prior to the suspension of the dividends, Third Federal Savings, MHC waived its right to receive each dividend paid by the Company, which allowed dividends to only be paid to the 26.5% of the shares which are not owned by Third Federal Savings, MHC. Recent interim final rules issued by the FRB require that a majority of the mutual holding company's members eligible to vote must approve a dividend waiver by a mutual holding company within 12 months prior to the declaration of the dividend being waived. As part of its rulemaking process, the FRB is reviewing comments on the interim final rule
and there can be no assurance that the final rule will not require such a member vote.
The terms of an August 13, 2010 OTS memorandum of understanding, which was terminated and replaced effective February 7, 2011 (collectively, the “MOU”) which covers the Company, the Association and Third Federal Savings, MHC required the following actions to be prepared or obtained by management, all of which have been performed: (1) completion of a home equity lending reduction plan; (2) enhanced home equity lending, credit risk and other management policies and procedures; (3) an assessment of the Association's interest rate risk management policy and a plan to address any deficiencies and (4) an assessment of the enterprise risk management and a plan to address any deficiencies. Management believes that it has substantially completed the measures required by the MOU, although compliance will be determined by the OCC and the Federal Reserve.
100
4. INVESTMENT SECURITIES
Investments available for sale are summarized as follows:
|
|
September 30, 2012
|
||||||||||||||
|
|
Amortized
Cost
|
Gross
Unrealized
|
Fair
Value
|
||||||||||||
|
|
Gains
|
Losses
|
|||||||||||||
|
U.S. government and agency obligations
|
$
|
2,000
|
|
$
|
56
|
|
$
|
—
|
|
$
|
2,056
|
|
|||
|
Freddie Mac certificates
|
922
|
|
67
|
|
—
|
|
989
|
|
|||||||
|
Ginnie Mae certificates
|
16,123
|
|
663
|
|
—
|
|
16,786
|
|
|||||||
|
Real estate mortgage investment conduits (REMICs)
|
383,545
|
|
2,772
|
|
(308
|
)
|
386,009
|
|
|||||||
|
Fannie Mae certificates
|
7,125
|
|
764
|
|
—
|
|
7,889
|
|
|||||||
|
Money market accounts
|
7,701
|
|
—
|
|
—
|
|
7,701
|
|
|||||||
|
$
|
417,416
|
|
$
|
4,322
|
|
$
|
(308
|
)
|
$
|
421,430
|
|
||||
|
|
September 30, 2011
|
||||||||||||||
|
|
Amortized
Cost
|
Gross
Unrealized
|
Fair
Value
|
||||||||||||
|
|
Gains
|
Losses
|
|||||||||||||
|
U.S. government and agency obligations
|
$
|
2,000
|
|
$
|
46
|
|
$
|
—
|
|
$
|
2,046
|
|
|||
|
REMICs
|
5,244
|
|
93
|
|
—
|
|
5,337
|
|
|||||||
|
Money market accounts
|
8,516
|
|
—
|
|
—
|
|
8,516
|
|
|||||||
|
$
|
15,760
|
|
$
|
139
|
|
$
|
—
|
|
$
|
15,899
|
|
||||
During the quarter ended June 30, 2012, all of the Company's investment securities previously classified as held to maturity,
$343,687
, were transferred to the available for sale portfolio to ensure that the securities would be eligible for inclusion in the computation of regulatory liquidity. At the time of transfer, a net unrealized gain of
$2,228
was recorded in accumulated other comprehensive income. At
September 30, 2012
, all investment securities held by the Company are classified as available for sale.
Investment securities held to maturity are summarized as follows:
|
|
September 30, 2011
|
||||||||||||||
|
|
Amortized
Cost
|
Gross
Unrealized
|
Fair
Value
|
||||||||||||
|
|
Gains
|
Losses
|
|||||||||||||
|
Freddie Mac certificates
|
$
|
2,724
|
|
$
|
118
|
|
$
|
—
|
|
$
|
2,842
|
|
|||
|
Ginnie Mae certificates
|
19,532
|
|
501
|
|
—
|
|
20,033
|
|
|||||||
|
REMICs
|
362,489
|
|
4,837
|
|
(58
|
)
|
367,268
|
|
|||||||
|
Fannie Mae certificates
|
7,782
|
|
800
|
|
—
|
|
8,582
|
|
|||||||
|
$
|
392,527
|
|
$
|
6,256
|
|
$
|
(58
|
)
|
$
|
398,725
|
|
||||
There were
no
sales from the investment securities available for sale portfolio or the investment securities held-to-maturity portfolio during the years ended
September 30, 2012
,
2011
and
2010
.
101
Gross unrealized losses on securities and the estimated fair value of the related securities, aggregated by investment category and length of time the individual securities have been in a continuous loss position, at
September 30, 2012
and
2011
, were as follows:
|
|
September 30, 2012
|
||||||||||||||||||||||
|
|
Less Than 12 Months
|
12 Months or More
|
Total
|
||||||||||||||||||||
|
|
Estimated
Fair Value
|
Unrealized
Loss
|
Estimated
Fair Value
|
Unrealized
Loss
|
Estimated
Fair Value
|
Unrealized
Loss
|
|||||||||||||||||
|
Available for sale—
|
|||||||||||||||||||||||
|
REMICs
|
$
|
80,219
|
|
$
|
291
|
|
$
|
6,550
|
|
$
|
17
|
|
$
|
86,769
|
|
$
|
308
|
|
|||||
|
Total
|
$
|
80,219
|
|
$
|
291
|
|
$
|
6,550
|
|
$
|
17
|
|
$
|
86,769
|
|
$
|
308
|
|
|||||
|
|
September 30, 2011
|
||||||||||||||||||||||
|
|
Less Than 12 Months
|
12 Months or More
|
Total
|
||||||||||||||||||||
|
|
Estimated
Fair Value
|
Unrealized
Loss
|
Estimated
Fair Value
|
Unrealized
Loss
|
Estimated
Fair Value
|
Unrealized
Loss
|
|||||||||||||||||
|
Held to maturity—
|
|||||||||||||||||||||||
|
REMICs
|
$
|
5,961
|
|
$
|
29
|
|
$
|
11,353
|
|
$
|
29
|
|
$
|
17,314
|
|
$
|
58
|
|
|||||
|
Total
|
$
|
5,961
|
|
$
|
29
|
|
$
|
11,353
|
|
$
|
29
|
|
$
|
17,314
|
|
$
|
58
|
|
|||||
The unrealized losses on investment securities were attributable to market rate increases. The contractual terms of U.S. government and agency obligations do not permit the issuer to settle the security at a price less than the par value of the investment. The contractual cash flows of mortgage-backed securities are guaranteed by Fannie Mae, Freddie Mac and Ginnie Mae. REMICs are issued by or backed by securities issued by these governmental agencies. It is expected that the securities would not be settled at a price substantially less than the amortized cost of the investment. During the financial market upheaval of 2008, concern arose about the financial health of Fannie Mae and Freddie Mac and, therefore, the viability of the payment guarantees issued by the agencies. This market was preserved when, in September 2008, the Federal Housing Finance Agency placed Fannie Mae and Freddie Mac into conservatorship. Shortly after taking control, the U.S. Treasury Department established financing agreements to ensure Fannie Mae and Freddie Mac meet their obligations to holders of mortgage-backed securities that they have issued or guaranteed.
Since the decline in value is attributable to changes in interest rates and not credit quality and because the Association has neither the intent to sell the securities nor is it more likely than not the Association will be required to sell the securities for the time periods necessary to recover the amortized cost, these investments are not considered other-than-temporarily impaired.
At
September 30, 2012
and
2011
, the carrying amount of U.S. government and agency obligations pledged to secure public deposits totaled
$0
and
$2,000
, respectively.
At
September 30, 2012
, the amortized cost and fair value of U.S. government and agency obligations available for sale due in more than one year but less than five years are
$2,000
and
$2,046
, respectively. There are
no
other investment securities held to maturity at
September 30, 2012
.
102
5. LOANS AND ALLOWANCE FOR LOAN LOSSES
Loans held for investment consist of the following:
|
|
September 30,
|
||||||
|
|
2012
|
2011
|
|||||
|
Real estate loans:
|
|||||||
|
Residential non-Home Today
|
$
|
7,943,165
|
|
$
|
7,120,789
|
|
|
|
Residential Home Today
|
208,325
|
|
264,019
|
|
|||
|
Home equity loans and lines of credit
|
2,155,496
|
|
2,491,198
|
|
|||
|
Construction
|
69,152
|
|
82,048
|
|
|||
|
Real estate loans
|
10,376,138
|
|
9,958,054
|
|
|||
|
Consumer and other loans
|
4,612
|
|
6,868
|
|
|||
|
Less:
|
|||||||
|
Deferred loan fees—net
|
(18,561
|
)
|
(19,854
|
)
|
|||
|
Loans-in-process (“LIP”)
|
(36,736
|
)
|
(37,147
|
)
|
|||
|
Allowance for loan losses
|
(100,464
|
)
|
(156,978
|
)
|
|||
|
Loans held for investment, net
|
$
|
10,224,989
|
|
$
|
9,750,943
|
|
|
At
September 30, 2012
and
2011
, respectively, $
124,528
and
$0
of long-term, fixed-rate loans were classified as mortgage loans held for sale.
In an October 2011 directive, the OCC required all specific valuation allowances (“SVA”) on collateral-dependent loans (SVAs established when the recorded investment in an impaired loan exceeded the measured value of the collateral) maintained by savings institutions to be charged off by March 31, 2012. As permitted, the Company elected to early-adopt this methodology effective for the quarter ended December 31, 2011. Additionally, the OCC issued guidance in July, 2012 which requires loans, where at least one borrower has been discharged of their obligation in Chapter 7 bankruptcy proceedings, and have not reaffirmed the debt to be classified as troubled debt restructurings. Additionally, this guidance requires the charge off of performing loans to collateral value when, due to a discharge of indebtedness, the Company's only recourse in the event of nonpayment is to foreclose on the property. As a result, reported loan charge-offs for the
year ended
September 30, 2012
included the charge-off of specific valuation allowances, which had a balance of $
55,507
at September 30, 2011 and the charge-off of
$15,827
in connection with the bankruptcy related guidance. The one-time SVA related charge-off did not impact the provision for loan losses for the year ended
September 30, 2012
; however, reported loan charge-offs during the year increased and the balances of loans, the allowance for loan losses, non-accrual status loans and loan delinquencies as of
September 30, 2012
, all decreased accordingly.A large concentration of the Company’s lending is in Ohio. As of
September 30, 2012
and
2011
, the percentage of total residential non-Home Today and Home Today loans held in Ohio were
77%
and
81%
, and the percentage held in Florida were
17%
and
17%
, respectively. As of
September 30, 2012
and
2011
, equity loans and lines of credit were concentrated in the states of Ohio (
39%
and
39%
), Florida (
29%
and
29%
) and California (
12%
and
12%
), respectively. The economic conditions and market for real estate in those states have significantly impacted the ability of borrowers in those areas to repay their loans.
Home Today is an affordable housing program targeted to benefit low- and moderate-income home buyers. Through this program, prior to March 27, 2009, the Association provided loans to borrowers who would not otherwise qualify for the Association’s loan products, generally because of low credit scores. Although the credit profiles of borrowers in the Home Today program prior to March 27, 2009 might be described as sub-prime, Home Today loans generally contain the same features as loans offered to our non-Home Today borrowers. Borrowers in the Home Today program must complete financial management education and counseling and must be referred to the Association by a sponsoring organization with which the Association has partnered as part of the program. Borrowers must also meet a minimum credit score threshold. Because prior to March 27, 2009 the Association applied less stringent underwriting and credit standards to these loans, loans originated under the Home Today program prior to that date have greater credit risk than its traditional residential real estate mortgage loans. Effective March 27, 2009, the Home Today underwriting guidelines are substantially the same as the Association’s traditional first mortgage product. As of
September 30, 2012
and
2011
, the principal balance of Home Today loans originated prior to March 27, 2009 was $
204,733
and $
261,817
respectively. The Association does not offer, and has not offered, loan products frequently considered to be designed to target sub-prime borrowers containing features such as higher fees or higher rates, negative amortization, a loan-to-value ratio greater than
100%
, or option adjustable-rate mortgages.
103
Beginning March 20, 2012, the Association offers new home equity lines of credit to qualifying existing home equity customers, subject to certain property and credit performance conditions. Between June 28, 2010 and March 19, 2012, the Association suspended the acceptance of new equity line of credit applications. Prior to March 11, 2009, the Association offered residential mortgage loan products where the borrower pays only interest for a portion of the loan term. The recorded investment in interest only loans is comprised of the following:
|
|
September 30,
|
||||||
|
|
2012
|
2011
|
|||||
|
Residential non-Home Today
|
$
|
11,519
|
|
$
|
43,936
|
|
|
|
Equity lines of credit
|
1,983,581
|
|
2,291,783
|
|
|||
|
Total
|
$
|
1,995,100
|
|
$
|
2,335,719
|
|
|
Home equity lines of credit are interest only for a maximum of
10
years and convert to fully amortizing for the remaining term up to
20
years at which time they are included in the home equity loan balance. Residential loans are interest only for a maximum of
5
years and convert to fully amortizing for the remaining term of up to
30
years.
The recorded investment of loan receivables in non-accrual status is summarized in the following table. Balances are net of deferred fees.
|
|
September 30,
|
||||||
|
|
2012
|
2011
|
|||||
|
Real estate loans:
|
|||||||
|
Residential non-Home Today
|
$
|
105,780
|
|
$
|
125,014
|
|
|
|
Residential Home Today
|
41,087
|
|
69,602
|
|
|||
|
Home equity loans and lines of credit
|
35,316
|
|
36,872
|
|
|||
|
Construction
|
377
|
|
3,770
|
|
|||
|
Total real estate loans
|
182,560
|
|
235,258
|
|
|||
|
Consumer and other loans
|
—
|
|
—
|
|
|||
|
Total non-accrual loans
|
$
|
182,560
|
|
$
|
235,258
|
|
|
Loans are placed in non-accrual status when they are contractually
90
days or more past due. Loans modified in troubled debt restructurings that were in non-accrual status prior to the restructurings remain in non-accrual status for a minimum of
six
months. Total performing non-accrual loans at
September 30, 2012
and
2011
includes
$47,742
and $
16,465
, respectively, in troubled debt restructurings which are current according to the terms of their agreement but included with non-accrual loans for a minimum period of
six
months from the restructuring date. SVAs, which had a balance of $
55,507
at September 30, 2011, were charged-off per an OCC directive reducing the balance of loans in non-accrual during the
year ended
September 30, 2012
. Beginning with the quarter ended March 31, 2012, home equity loans and lines of credit where the customer has a severely delinquent first mortgage are also placed in non-accrual status. Beginning in the quarter ended September 30, 2012, loans in Chapter 7 bankruptcy status where all borrowers have been discharged of their obligation are also placed in non-accrual status. At
September 30, 2012
, the recorded investment in non-accrual status loans includes $
8,807
of performing second lien loans subordinate to first mortgages delinquent greater than
90
days past due. At
September 30, 2012
, the recorded investment in non-accrual status loans includes
$30,631
of performing loans in Chapter 7 bankruptcy status where all borrowers have been discharged of their obligations. Interest on loans in accrual status, including certain loans individually reviewed for impairment, is recognized in interest income as it accrues, on a daily basis. Accrued interest on loans in non-accrual status is reversed by a charge to interest income and income is subsequently recognized only to the extent cash payments are received. Cash payments on loans in non-accrual status are applied to the oldest scheduled, unpaid payment first. Cash payments on loans with a partial charge-off are applied fully to principal, then to recovery of the charged off amount prior to interest income being recognized. A non-accrual loan is generally returned to accrual status when contractual payments are less than
90
days past due. However, a loan may remain in nonaccrual status when collectability is uncertain, such as a troubled debt restructuring that has not met minimum payment requirements, a loan with a partial charge-off, an equity loan or line of credit with a delinquent first mortgage greater than
90
days, or a loan in Chapter 7 bankruptcy status where all borrowers have been discharged of their obligation. The number of days past due is determined by the number of scheduled payments that remain unpaid, assuming a period of 30 days between each scheduled payment. An age analysis of the recorded investment in loan receivables that are past due at
September 30, 2012
and
2011
is summarized in the following tables. When a loan is more than
one
month past due on its scheduled payments, the loan is considered
30
days or more past due. Balances are net of deferred fees and any applicable loans-in-process.
104
|
30-59 Days
Past Due
|
60-89 Days
Past Due
|
90 Days
or More
Past Due
|
Total Past
Due
|
Current
|
Total
|
||||||||||||||||||
|
September 30, 2012
|
|||||||||||||||||||||||
|
Real estate loans:
|
|||||||||||||||||||||||
|
Residential non-Home Today
|
$
|
15,015
|
|
$
|
10,661
|
|
$
|
74,807
|
|
$
|
100,483
|
|
$
|
7,818,927
|
|
$
|
7,919,410
|
|
|||||
|
Residential Home Today
|
10,874
|
|
4,736
|
|
27,517
|
|
43,127
|
|
161,743
|
|
204,870
|
|
|||||||||||
|
Home equity loans and lines of credit
|
8,676
|
|
3,210
|
|
16,587
|
|
28,473
|
|
2,136,255
|
|
2,164,728
|
|
|||||||||||
|
Construction
|
—
|
|
—
|
|
377
|
|
377
|
|
31,456
|
|
31,833
|
|
|||||||||||
|
Total real estate loans
|
34,565
|
|
18,607
|
|
119,288
|
|
172,460
|
|
10,148,381
|
|
10,320,841
|
|
|||||||||||
|
Consumer and other loans
|
—
|
|
—
|
|
—
|
|
—
|
|
4,612
|
|
4,612
|
|
|||||||||||
|
Total
|
$
|
34,565
|
|
$
|
18,607
|
|
$
|
119,288
|
|
$
|
172,460
|
|
$
|
10,152,993
|
|
$
|
10,325,453
|
|
|||||
|
30-59
Days
Past Due
|
60-89
Days
Past Due
|
90 Days
or More
Past Due
|
Total Past
Due
|
Current
|
Total
|
||||||||||||||||||
|
September 30, 2011
|
|||||||||||||||||||||||
|
Real estate loans:
|
|||||||||||||||||||||||
|
Residential non-Home Today
|
$
|
19,509
|
|
$
|
9,818
|
|
$
|
118,517
|
|
$
|
147,844
|
|
$
|
6,942,424
|
|
$
|
7,090,268
|
|
|||||
|
Residential Home Today
|
12,399
|
|
7,131
|
|
59,985
|
|
79,515
|
|
183,372
|
|
262,887
|
|
|||||||||||
|
Home equity loans and lines of credit
|
11,299
|
|
6,126
|
|
36,521
|
|
53,946
|
|
2,449,707
|
|
2,503,653
|
|
|||||||||||
|
Construction
|
72
|
|
—
|
|
3,770
|
|
3,842
|
|
40,403
|
|
44,245
|
|
|||||||||||
|
Total real estate loans
|
43,279
|
|
23,075
|
|
218,793
|
|
285,147
|
|
9,615,906
|
|
9,901,053
|
|
|||||||||||
|
Consumer and other loans
|
—
|
|
—
|
|
—
|
|
—
|
|
6,868
|
|
6,868
|
|
|||||||||||
|
Total
|
$
|
43,279
|
|
$
|
23,075
|
|
$
|
218,793
|
|
$
|
285,147
|
|
$
|
9,622,774
|
|
$
|
9,907,921
|
|
|||||
Activity in the allowance for loan losses is summarized as follows:
|
|
For the Year Ended September 30, 2012
|
||||||||||||||||||
|
|
Beginning
Balance
|
Provisions
|
Charge-offs
|
Recoveries
|
Ending
Balance
|
||||||||||||||
|
Real estate loans:
|
|||||||||||||||||||
|
Residential non-Home Today
|
$
|
49,484
|
|
$
|
36,646
|
|
$
|
(55,362
|
)
|
$
|
850
|
|
$
|
31,618
|
|
||||
|
Residential Home Today
|
31,025
|
|
34,616
|
|
(43,215
|
)
|
162
|
|
22,588
|
|
|||||||||
|
Home equity loans and lines of credit
|
74,071
|
|
31,154
|
|
(63,035
|
)
|
3,318
|
|
45,508
|
|
|||||||||
|
Construction
|
2,398
|
|
(416
|
)
|
(1,268
|
)
|
36
|
|
750
|
|
|||||||||
|
Total real estate loans
|
156,978
|
|
102,000
|
|
(162,880
|
)
|
4,366
|
|
100,464
|
|
|||||||||
|
Consumer and other loans
|
—
|
|
—
|
|
—
|
|
—
|
|
—
|
|
|||||||||
|
Total
|
$
|
156,978
|
|
$
|
102,000
|
|
$
|
(162,880
|
)
|
$
|
4,366
|
|
$
|
100,464
|
|
||||
105
|
|
For the Year Ended September 30, 2011
|
||||||||||||||||||
|
|
Beginning
Balance
|
Provisions
|
Charge-offs
|
Recoveries
|
Ending
Balance
|
||||||||||||||
|
Real estate loans:
|
|||||||||||||||||||
|
Residential non-Home Today
|
$
|
41,246
|
|
$
|
25,704
|
|
$
|
(17,804
|
)
|
$
|
338
|
|
$
|
49,484
|
|
||||
|
Residential Home Today
|
13,331
|
|
24,537
|
|
(6,951
|
)
|
108
|
|
31,025
|
|
|||||||||
|
Home equity loans and lines of credit
|
73,780
|
|
49,784
|
|
(51,414
|
)
|
1,921
|
|
74,071
|
|
|||||||||
|
Construction
|
4,882
|
|
(1,525
|
)
|
(994
|
)
|
35
|
|
2,398
|
|
|||||||||
|
Total real estate loans
|
133,239
|
|
98,500
|
|
(77,163
|
)
|
2,402
|
|
156,978
|
|
|||||||||
|
Consumer and other loans
|
1
|
|
—
|
|
(1
|
)
|
—
|
|
—
|
|
|||||||||
|
Total
|
$
|
133,240
|
|
$
|
98,500
|
|
$
|
(77,164
|
)
|
$
|
2,402
|
|
$
|
156,978
|
|
||||
|
|
For the Year Ended September 30, 2010
|
||||||||||||||||||
|
|
Beginning
Balance
|
Provisions
|
Charge-offs
|
Recoveries
|
Ending
Balance
|
||||||||||||||
|
Real estate loans:
|
|||||||||||||||||||
|
Residential non-Home Today
|
$
|
22,678
|
|
$
|
30,623
|
|
$
|
(12,578
|
)
|
$
|
523
|
|
$
|
41,246
|
|
||||
|
Residential Home Today
|
9,232
|
|
8,754
|
|
(4,678
|
)
|
23
|
|
13,331
|
|
|||||||||
|
Home equity loans and lines of credit
|
57,594
|
|
65,004
|
|
(50,208
|
)
|
1,390
|
|
73,780
|
|
|||||||||
|
Construction
|
5,743
|
|
1,619
|
|
(2,491
|
)
|
11
|
|
4,882
|
|
|||||||||
|
Total real estate loans
|
95,247
|
|
106,000
|
|
(69,955
|
)
|
1,947
|
|
133,239
|
|
|||||||||
|
Consumer and other loans
|
1
|
|
—
|
|
—
|
|
—
|
|
1
|
|
|||||||||
|
Total
|
$
|
95,248
|
|
$
|
106,000
|
|
$
|
(69,955
|
)
|
$
|
1,947
|
|
$
|
133,240
|
|
||||
The recorded investment in loan receivables at
September 30, 2012
and
2011
is summarized in the following table. The table provides details of the recorded balances according to the method of evaluation used for determining the allowance for loan losses, distinguishing between determinations made by evaluating individual loans and determinations made by evaluating groups of loans not individually evaluated. Balances of recorded investments are net of deferred fees and any applicable LIP.
|
|
For the Year Ended September 30,
|
||||||||||||||||||||||
|
|
2012
|
2011
|
|||||||||||||||||||||
|
|
Individually
|
Collectively
|
Total
|
Individually
|
Collectively
|
Total
|
|||||||||||||||||
|
Real estate loans:
|
|||||||||||||||||||||||
|
Residential non-Home Today
|
$
|
165,121
|
|
$
|
7,754,289
|
|
$
|
7,919,410
|
|
$
|
159,924
|
|
$
|
6,930,344
|
|
$
|
7,090,268
|
|
|||||
|
Residential Home Today
|
95,355
|
|
109,515
|
|
204,870
|
|
134,381
|
|
128,506
|
|
262,887
|
|
|||||||||||
|
Home equity loans and lines of credit
|
37,016
|
|
2,127,712
|
|
2,164,728
|
|
39,738
|
|
2,463,915
|
|
2,503,653
|
|
|||||||||||
|
Construction
|
1,378
|
|
30,455
|
|
31,833
|
|
5,729
|
|
38,516
|
|
44,245
|
|
|||||||||||
|
Total real estate loans
|
298,870
|
|
10,021,971
|
|
10,320,841
|
|
339,772
|
|
9,561,281
|
|
9,901,053
|
|
|||||||||||
|
Consumer and other loans
|
—
|
|
4,612
|
|
4,612
|
|
—
|
|
6,868
|
|
6,868
|
|
|||||||||||
|
Total
|
$
|
298,870
|
|
$
|
10,026,583
|
|
$
|
10,325,453
|
|
$
|
339,772
|
|
$
|
9,568,149
|
|
$
|
9,907,921
|
|
|||||
106
An analysis of the allowance for loan losses at
September 30, 2012
and
2011
is summarized in the following table. The analysis provides details of the allowance for loan losses according to the method of evaluation, distinguishing between allowances for loan losses determined by evaluating individual loans and allowances for loan losses determined by evaluating groups of loans not individually evaluated.
|
For the Year Ended September 30,
|
|||||||||||||||||||||||
|
|
2012
|
2011
|
|||||||||||||||||||||
|
|
Individually
|
Collectively
|
Total
|
Individually
|
Collectively
|
Total
|
|||||||||||||||||
|
Real estate loans:
|
|||||||||||||||||||||||
|
Residential non-Home Today
|
$
|
6,220
|
|
$
|
25,398
|
|
$
|
31,618
|
|
$
|
25,395
|
|
$
|
24,089
|
|
$
|
49,484
|
|
|||||
|
Residential Home Today
|
9,747
|
|
12,841
|
|
22,588
|
|
21,938
|
|
9,087
|
|
31,025
|
|
|||||||||||
|
Home equity loans and lines of credit
|
3,928
|
|
41,580
|
|
45,508
|
|
14,324
|
|
59,747
|
|
74,071
|
|
|||||||||||
|
Construction
|
41
|
|
709
|
|
750
|
|
1,255
|
|
1,143
|
|
2,398
|
|
|||||||||||
|
Total real estate loans
|
19,936
|
|
80,528
|
|
100,464
|
|
62,912
|
|
94,066
|
|
156,978
|
|
|||||||||||
|
Consumer and other loans
|
—
|
|
—
|
|
—
|
|
—
|
|
—
|
|
—
|
|
|||||||||||
|
Total
|
$
|
19,936
|
|
$
|
80,528
|
|
$
|
100,464
|
|
$
|
62,912
|
|
$
|
94,066
|
|
$
|
156,978
|
|
|||||
At
September 30, 2012
, individually evaluated loans that required an allowance were comprised only of loans evaluated for impairment based on the present value of cash flows, such as performing troubled debt restructurings, performing second liens subordinate to first mortgages delinquent greater than
90
days and loans with a further deterioration in the fair value of collateral not yet identified as uncollectible. All other individually evaluated loans received a charge-off if applicable. At September 30, 2011, individually evaluated loans were comprised of loans evaluated for impairment based on the present value of cash flows, such as performing troubled debt restructurings, and impaired loans for which the recorded investment in the impaired loan exceeded the measured value of the collateral, previously referred to as a SVA. Effective for the quarter ended December 31, 2011, and in accordance with the previously described regulatory directive, SVAs were charged-off against the recorded loan balance.
Because many variables are considered in determining the appropriate level of general valuation allowances, directional changes in individual considerations do not always align with the directional change in the balance of a particular component of the general valuation allowance. At
September 30, 2012
and
2011
, respectively, individually allocated, collateral-based reserves on impaired loans were $
0
and $
55,507
; allowances on other individually reviewed loans evaluated for impairment based on the present value of cash flows, such as performing troubled debt restructurings were $
17,720
and $
7,010
; allowances on performing second liens subordinate to first mortgages delinquent greater than
90
days were $
1,550
and $
0
; and allowances on loans with further deteriorations in the fair value of collateral not yet identified as uncollectible were $
666
and $
395
. Prior to the quarter ended December 31, 2011, specific valuation allowances were assessed on impaired loans as described throughout this footnote.
Residential non-Home Today mortgage loans represent the largest piece of the residential real estate portfolio. The Company believes overall credit risk is low based on the nature, composition, collateral, products, lien position and performance of the portfolio. The portfolio does not include loan types or structures that have recently experienced severe performance problems at other financial institutions (sub-prime, no documentation or pay option adjustable rate mortgages).
As described earlier in this footnote, Home Today loans, particularly those originated prior to March 27, 2009, have greater credit risk than traditional residential real estate mortgage loans. At
September 30, 2012
, more than
54%
of Home Today loans include private mortgage insurance coverage. The majority of the coverage on these loans was provided by PMI Mortgage Insurance Co. (“PMIC”) which the Arizona Department of Insurance seized in 2011 and indicated that all claims payments would be reduced by
50%
. Appropriate adjustments have been made to all of the Association’s affected valuation allowances and charge-offs, and estimated loss severity factors were increased for loans evaluated collectively. The amount of loans in our owned portfolio covered by mortgage insurance provided by PMIC as of
September 30, 2012
was $
303,621
of which $
273,225
was current. The amount of loans in our owned portfolio covered by mortgage insurance provided by Mortgage Guaranty Insurance Corporation ("MGIC") as of
September 30, 2012
was $
118,055
of which $
116,132
was current. As of
September 30, 2012
, MGIC's long-term debt rating, as published by the major credit rating agencies, did not meet the requirements to qualify as "investment grade"; however, MGIC continues to make claims payments in accordance with its contractual obligations and the Association has not increased its estimated loss given default factors related to MGIC's claim paying ability.
No
other loans were covered by mortgage insurers that were deferring claim payments or which we assessed as being non-investment grade.
107
Home equity lines of credit represent a significant portion of the residential real estate portfolio. The state of the economy and low housing prices continue to have an adverse impact on this portfolio since the home equity lines generally are in a second lien position. Between June 28, 2010 and March 19, 2012, due to the perceived deterioration in the overall housing conditions including concerns for loans and lines in a second lien position, equity lines of credit and home equity loans were not offered. Beginning March 20, 2012, the Association offers new home equity lines of credit to qualifying existing home equity customers, subject to certain property and credit performance conditions.
Construction loans generally have greater credit risk than traditional residential real estate mortgage loans. The repayment of these loans depends upon the sale of the property to third parties or the availability of permanent financing upon completion of all improvements. In the event we make a loan on property that is not yet approved for the planned development, there is the risk that approvals will not be granted or will be delayed. These events may adversely affect the borrower and the collateral value of the property. Construction loans also expose the Association to the risk that improvements will not be completed on time in accordance with specifications and projected costs. In addition, the ultimate sale or rental of the property may not occur as anticipated. Effective August 30, 2011, the Association made the strategic decision to exit the commercial construction loan business and ceased accepting new builder relationships. Existing builder commitments to provide additional financing were honored for a period of not longer than
one
year, giving our customers the ability to secure new borrowing relationships.
Consumer loans are comprised of loans secured by certificate of deposit accounts, which are fully recoverable in the event of non-payment.
Reflective of the much publicized foreclosure and mortgage servicing problems that have confronted the industry, the Company has generally experienced longer foreclosure timelines than those experienced in the past, particularly in Florida. The longer foreclosure timelines in Florida generally have a greater impact on the Association’s first position liens as opposed to subordinate liens primarily because the significant property value decline in Florida since 2008, when coupled with the subordinate lien position of home equity lending products, generally results in a high percentage of full charge-offs on the date of initial evaluation. As a result, once a home equity loan or line of credit has been fully charged off, foreclosure timing is no longer relevant. Longer foreclosure timelines generally result in greater loss experience rates on first position liens where full charge-offs are not as prevalent, particularly to the extent that property values continue to decline during the foreclosure process. These expected higher loss experience rates are factored into the determination of collateral fair value and are considered in making charge-off decisions.
108
The recorded investment and the unpaid principal balance of impaired loans, including those whose terms have been modified in troubled debt restructurings, as of
September 30, 2012
and
2011
are summarized as follows. Balances of recorded investments are net of deferred fees.
|
|
September 30,
|
||||||||||||||||||||||
|
|
2012
|
2011
|
|||||||||||||||||||||
|
|
Recorded
Investment
|
Unpaid
Principal
Balance
|
Related
Allowance
|
Recorded
Investment
|
Unpaid
Principal
Balance
|
Related
Allowance
|
|||||||||||||||||
|
With no related allowance recorded:
|
|||||||||||||||||||||||
|
Residential non-Home Today
|
$
|
96,227
|
|
$
|
126,806
|
|
$
|
—
|
|
$
|
32,713
|
|
$
|
32,854
|
|
$
|
—
|
|
|||||
|
Residential Home Today
|
36,578
|
|
68,390
|
|
—
|
|
8,614
|
|
8,651
|
|
—
|
|
|||||||||||
|
Home equity loans and lines of credit
|
24,397
|
|
41,974
|
|
—
|
|
12,121
|
|
12,061
|
|
—
|
|
|||||||||||
|
Construction
|
970
|
|
1,349
|
|
—
|
|
798
|
|
804
|
|
—
|
|
|||||||||||
|
Consumer and other loans
|
—
|
|
—
|
|
—
|
|
—
|
|
—
|
|
—
|
|
|||||||||||
|
Total
|
$
|
158,172
|
|
$
|
238,519
|
|
$
|
—
|
|
$
|
54,246
|
|
$
|
54,370
|
|
$
|
—
|
|
|||||
|
With an allowance recorded:
|
|||||||||||||||||||||||
|
Residential non-Home Today
|
$
|
68,894
|
|
$
|
70,577
|
|
$
|
6,220
|
|
$
|
127,211
|
|
$
|
127,758
|
|
$
|
25,395
|
|
|||||
|
Residential Home Today
|
58,777
|
|
60,104
|
|
9,747
|
|
125,767
|
|
126,309
|
|
21,938
|
|
|||||||||||
|
Home equity loans and lines of credit
|
12,619
|
|
13,554
|
|
3,928
|
|
27,617
|
|
27,480
|
|
14,324
|
|
|||||||||||
|
Construction
|
408
|
|
408
|
|
41
|
|
4,931
|
|
4,971
|
|
1,255
|
|
|||||||||||
|
Consumer and other loans
|
—
|
|
—
|
|
—
|
|
—
|
|
—
|
|
—
|
|
|||||||||||
|
Total
|
$
|
140,698
|
|
$
|
144,643
|
|
$
|
19,936
|
|
$
|
285,526
|
|
$
|
286,518
|
|
$
|
62,912
|
|
|||||
|
Total impaired loans:
|
|||||||||||||||||||||||
|
Residential non-Home Today
|
$
|
165,121
|
|
$
|
197,383
|
|
$
|
6,220
|
|
$
|
159,924
|
|
$
|
160,612
|
|
$
|
25,395
|
|
|||||
|
Residential Home Today
|
95,355
|
|
128,494
|
|
9,747
|
|
134,381
|
|
134,960
|
|
21,938
|
|
|||||||||||
|
Home equity loans and lines of credit
|
37,016
|
|
55,528
|
|
3,928
|
|
39,738
|
|
39,541
|
|
14,324
|
|
|||||||||||
|
Construction
|
1,378
|
|
1,757
|
|
41
|
|
5,729
|
|
5,775
|
|
1,255
|
|
|||||||||||
|
Consumer and other loans
|
—
|
|
—
|
|
—
|
|
—
|
|
—
|
|
—
|
|
|||||||||||
|
Total
|
$
|
298,870
|
|
$
|
383,162
|
|
$
|
19,936
|
|
$
|
339,772
|
|
$
|
340,888
|
|
$
|
62,912
|
|
|||||
At
September 30, 2012
and
2011
, respectively, the recorded investment in impaired loans includes $
221,399
and $
166,197
of loans modified in troubled debt restructurings of which $
39,127
and $
28,617
are
90
days or more past due.
For all classes of loans, a loan is considered impaired when, based on current information and events, it is probable that the Company will be unable to collect the scheduled payments of principal and interest according to the contractual terms of the loan agreement. Factors considered in determining that a loan is impaired may include the deteriorating financial condition of the borrower indicated by missed or delinquent payments, a pending legal action, such as bankruptcy or foreclosure, or the absence of adequate security for the loan. Impairment is measured based on the fair value of the collateral less costs to dispose when it is probable that the sole source of repayment for the loan is the underlying collateral. The fair value less estimated cost to dispose of the underlying property is compared to the recorded investment in the loan, net of anticipated mortgage insurance claims, to estimate a loss recorded as a charge-off in the allowance for credit losses. This applies to all mortgage loans and lines of credit. Equity loans, bridge loans, equity lines of credit and loans modified in troubled debt restructurings are included in loans individually evaluated based on the fair value of the collateral at
90
or more days past due. Also, loans in Chapter 7 bankruptcy, where all borrowers' obligations related to the loan have been discharged, regardless of delinquency, are evaluated based on collateral. Collateral-based evaluations on all other loans are performed at
180
or more days past due. An individual impairment evaluation may be performed on a loan in any portfolio prior to the guidelines established when a it becomes evident that a loss is probable. A loan in any portfolio that is identified for individual evaluation based on a failure to make timely payments will continue to be reported as impaired until it is less than
30
days past due and does not have a prior charge-off. A loan in any portfolio that has a partial charge-off consequent to an impairment evaluation will continue to be individually evaluated for impairment until, at a minimum, the impairment has been recovered.
Loans are charged off when less than the full payment is accepted as satisfaction for a loan; a foreclosure action is completed and the fair value of the collateral received is insufficient to satisfy the loan; management concludes the costs of
109
foreclosure exceed the potential recovery; or, in the case of equity loans and lines of credit, management determines the collateral is not sufficient to satisfy the loan.
Loans modified in troubled debt restructurings, not evaluated based on collateral, are separately evaluated for impairment on a loan by loan basis at the time of restructuring and at each subsequent reporting date for as long as they are reported as troubled debt restructurings. The impairment evaluation is based on the present value of expected future cash flows discounted at the effective interest rate of the original loan. Expected future cash flows include a discount factor representing a potential for default. Valuation allowances are recorded for the excess of the recorded investments over the result of the cash flow analysis. Loans in Chapter 7 bankruptcy, where at least one borrower has not had the debt discharged, are evaluated based on the expected future cash flows. Consumer loans are not considered for restructuring. A loan modified in a troubled debt restructuring is classified as an impaired loan for a minimum of
one
year. After
one
year, a loan is no longer included in the balance of impaired loans if the loan was modified to yield a market rate for loans of similar credit risk at the time of restructuring and the loan is not impaired based on the terms of restructuring agreement.
No
troubled debt restructurings were reclassified out of impaired loans during the year ended
September 30, 2012
.
The average recorded investment in impaired loans and the amount of interest income recognized during the time within the period that the loans were impaired are summarized below. Beginning for the three months ended June 30, 2011, the reported amount of interest income recognized includes interest income on all impaired loans. Prior to that period, the reported amount included interest income from only impaired loans with an allowance, resulting in a reported amount that was less than, but not materially different from, the actual amount of interest income recognized. Balances of average recorded investments are net of deferred fees.
|
|
For the Year Ended September 30,
|
||||||||||||||||||||||
|
|
2012
|
2011
|
2010
|
||||||||||||||||||||
|
|
Average
Recorded
Investment
|
Interest
Income
Recognized
|
Average
Recorded
Investment
|
Interest
Income
Recognized
|
Average
Recorded
Investment
|
Interest
Income
Recognized
|
|||||||||||||||||
|
With no related allowance recorded:
|
|||||||||||||||||||||||
|
Residential non-Home Today
|
$
|
64,470
|
|
$
|
854
|
|
$
|
36,072
|
|
$
|
363
|
|
$
|
40,980
|
|
$
|
—
|
|
|||||
|
Residential Home Today
|
22,596
|
|
513
|
|
23,036
|
|
144
|
|
38,852
|
|
—
|
|
|||||||||||
|
Home equity loans and lines of credit
|
18,259
|
|
293
|
|
16,249
|
|
95
|
|
23,416
|
|
—
|
|
|||||||||||
|
Construction
|
884
|
|
36
|
|
495
|
|
6
|
|
96
|
|
—
|
|
|||||||||||
|
Consumer and other loans
|
—
|
|
—
|
|
—
|
|
—
|
|
—
|
|
—
|
|
|||||||||||
|
Total
|
$
|
106,209
|
|
$
|
1,696
|
|
$
|
75,852
|
|
$
|
608
|
|
$
|
103,344
|
|
$
|
—
|
|
|||||
|
With an allowance recorded:
|
|||||||||||||||||||||||
|
Residential non-Home Today
|
$
|
98,053
|
|
$
|
3,164
|
|
$
|
117,392
|
|
$
|
2,584
|
|
$
|
74,179
|
|
$
|
1,230
|
|
|||||
|
Residential Home Today
|
92,272
|
|
2,625
|
|
109,015
|
|
2,689
|
|
65,085
|
|
1,243
|
|
|||||||||||
|
Home equity loans and lines of credit
|
20,118
|
|
227
|
|
31,674
|
|
256
|
|
33,263
|
|
198
|
|
|||||||||||
|
Construction
|
2,670
|
|
36
|
|
6,310
|
|
70
|
|
3,845
|
|
—
|
|
|||||||||||
|
Consumer and other loans
|
—
|
|
—
|
|
1
|
|
—
|
|
1
|
|
—
|
|
|||||||||||
|
Total
|
$
|
213,113
|
|
$
|
6,052
|
|
$
|
264,392
|
|
$
|
5,599
|
|
$
|
176,373
|
|
$
|
2,671
|
|
|||||
|
Total impaired loans:
|
|||||||||||||||||||||||
|
Residential non-Home Today
|
$
|
162,523
|
|
$
|
4,018
|
|
$
|
153,464
|
|
$
|
2,947
|
|
$
|
115,159
|
|
$
|
1,230
|
|
|||||
|
Residential Home Today
|
114,868
|
|
3,138
|
|
132,051
|
|
2,833
|
|
103,937
|
|
1,243
|
|
|||||||||||
|
Home equity loans and lines of credit
|
38,377
|
|
520
|
|
47,923
|
|
351
|
|
56,679
|
|
198
|
|
|||||||||||
|
Construction
|
3,554
|
|
72
|
|
6,805
|
|
76
|
|
3,941
|
|
—
|
|
|||||||||||
|
Consumer and other loans
|
—
|
|
—
|
|
1
|
|
—
|
|
1
|
|
—
|
|
|||||||||||
|
Total
|
$
|
319,322
|
|
$
|
7,748
|
|
$
|
340,244
|
|
$
|
6,207
|
|
$
|
279,717
|
|
$
|
2,671
|
|
|||||
The amount of interest income on impaired loans recognized using a cash-basis method is $
1,734
for the year ended
September 30, 2012
, not considered materially different from $
1,064
for the year ended
September 30, 2011
, and not material for the year ended
September 30, 2010
.
110
For all loans modified during the years ended
September 30, 2012
and
2011
(set forth in the tables below), the pre-modification outstanding recorded investment was not materially different from the post-modification outstanding recorded investment.
The following tables set forth the recorded investment in troubled debt restructured loans modified during the year presented, according to the types of concessions granted.
L
oans in Chapter 7 bankruptcy status, where at least one borrower has been discharged of their obligation, that were not in Chapter 7 bankruptcy status at September 30, 2011 are included in reported values for the year ended September 30, 2012 in accordance with updated OCC guidance. Reported values for the prior year have not been adjusted for Chapter 7 bankruptcies.
|
|
For the Year Ended September 30, 2012
|
||||||||||||||||||||||||||
|
|
Reduction in
Interest
Rates
|
Payment
Extensions
|
Forbearance or
Other Actions
|
Multiple
Concessions
|
Multiple
Modifications
|
Bankruptcy
|
Total
|
||||||||||||||||||||
|
|
(Dollars in thousands)
|
||||||||||||||||||||||||||
|
Residential non-Home Today
|
$
|
7,965
|
|
$
|
521
|
|
$
|
1,812
|
|
$
|
8,668
|
|
$
|
3,287
|
|
$
|
12,671
|
|
$
|
34,924
|
|
||||||
|
Residential Home Today
|
1,793
|
|
88
|
|
1,821
|
|
2,768
|
|
4,313
|
|
2,308
|
|
13,091
|
|
|||||||||||||
|
Home equity loans and lines of credit
|
46
|
|
13
|
|
60
|
|
30
|
|
231
|
|
4,435
|
|
4,815
|
|
|||||||||||||
|
Construction
|
—
|
|
—
|
|
—
|
|
—
|
|
—
|
|
153
|
|
153
|
|
|||||||||||||
|
Total
|
$
|
9,804
|
|
$
|
622
|
|
$
|
3,693
|
|
$
|
11,466
|
|
$
|
7,831
|
|
$
|
19,567
|
|
$
|
52,983
|
|
||||||
|
|
For the Year Ended September 30, 2011
|
||||||||||||||||||||||
|
|
Reduction in
Interest
Rates
|
Payment
Extensions
|
Forbearance or
Other Actions
|
Multiple
Concessions
|
Multiple
Modifications
|
Total
|
|||||||||||||||||
|
|
(Dollars in thousands)
|
||||||||||||||||||||||
|
Residential non-Home Today
|
$
|
7,447
|
|
$
|
669
|
|
$
|
5,864
|
|
$
|
3,369
|
|
$
|
5,289
|
|
$
|
22,638
|
|
|||||
|
Residential Home Today
|
9,535
|
|
407
|
|
6,194
|
|
4,776
|
|
8,224
|
|
29,136
|
|
|||||||||||
|
Home equity loans and lines of credit
|
115
|
|
—
|
|
423
|
|
164
|
|
261
|
|
963
|
|
|||||||||||
|
Construction
|
—
|
|
—
|
|
—
|
|
—
|
|
—
|
|
—
|
|
|||||||||||
|
Total
|
$
|
17,097
|
|
$
|
1,076
|
|
$
|
12,481
|
|
$
|
8,309
|
|
$
|
13,774
|
|
$
|
52,737
|
|
|||||
Troubled debt restructured loans may be modified more than once. Among other requirements, a re-modification may be available for a borrower upon the expiration of temporary modification terms if the borrower cannot return to regular loan payments. If the borrower is experiencing an income curtailment that temporarily has reduced his/her capacity to repay, such as loss of employment, reduction of hours, non-paid leave or short term disability, a temporary modification is considered. If the borrower lacks the capacity to repay the loan at the current terms due to a permanent condition, a permanent modification is considered. In evaluating the need for a re-modification, the borrower’s ability to repay is generally assessed utilizing a debt to income and cash flow analysis. As the economy remains sluggish and high unemployment persists, the need for re-modifications continues to linger, resulting in approximately
10%
of short-term modifications extended into more permanent or longer-term modifications. This is slightly less than the
12%
at September 30, 2011 primarily due to the increase in total troubled debt restructurings from the addition of loans in Chapter 7 bankruptcy status.
111
The following table provides information on troubled debt restructured loans modified within the last 12 months that defaulted, or were at least
30
days past due on one scheduled payment, during the period presented. Reported values for the year ended September 30, 2012 include loans in Chapter 7 bankruptcy status, where at least one borrower has been discharged of their obligation, that were not in Chapter 7 bankruptcy status at September 30, 2011. Prior year activity has not been adjusted for Chapter 7 bankruptcies.
|
|
For the Year Ended
September 30, 2012
|
For the Year Ended
September 30, 2011
|
|||||||||||
|
Troubled Debt Restructurings That Subsequently Defaulted
|
Number of
Contracts
|
Recorded
Investment
|
Number of
Contracts
|
Recorded
Investment
|
|||||||||
|
|
(Dollars in thousands)
|
(Dollars in thousands)
|
|||||||||||
|
Residential non-Home Today
|
87
|
|
$
|
9,917
|
|
19
|
|
$
|
3,305
|
|
|||
|
Residential Home Today
|
77
|
|
4,427
|
|
64
|
|
6,257
|
|
|||||
|
Home equity loans and lines of credit
|
41
|
|
1,764
|
|
2
|
|
160
|
|
|||||
|
Construction
|
3
|
|
153
|
|
—
|
|
—
|
|
|||||
|
Total
|
208
|
|
$
|
16,261
|
|
85
|
|
$
|
9,722
|
|
|||
The following tables provide information about the credit quality of residential loan receivables by an internally assigned grade. Balances are net of deferred fees and any applicable LIP.
|
Pass
|
Special
Mention
|
Substandard
|
Loss
|
Total
|
|||||||||||||||
|
September 30, 2012
|
|||||||||||||||||||
|
Real Estate Loans:
|
|||||||||||||||||||
|
Residential non-Home Today
|
$
|
7,812,028
|
|
$
|
—
|
|
$
|
107,382
|
|
$
|
—
|
|
$
|
7,919,410
|
|
||||
|
Residential Home Today
|
163,332
|
|
—
|
|
41,538
|
|
—
|
|
204,870
|
|
|||||||||
|
Home equity loans and lines of credit
|
2,118,926
|
|
9,868
|
|
35,934
|
|
—
|
|
2,164,728
|
|
|||||||||
|
Construction
|
30,850
|
|
—
|
|
983
|
|
—
|
|
31,833
|
|
|||||||||
|
Total
|
$
|
10,125,136
|
|
$
|
9,868
|
|
$
|
185,837
|
|
$
|
—
|
|
$
|
10,320,841
|
|
||||
|
Pass
|
Special
Mention
|
Substandard
|
Loss
|
Total
|
|||||||||||||||
|
September 30, 2011
|
|||||||||||||||||||
|
Real Estate Loans:
|
|||||||||||||||||||
|
Residential non-Home Today
|
$
|
6,963,582
|
|
$
|
—
|
|
$
|
104,290
|
|
$
|
22,396
|
|
$
|
7,090,268
|
|
||||
|
Residential Home Today
|
192,034
|
|
—
|
|
52,719
|
|
18,134
|
|
262,887
|
|
|||||||||
|
Home equity loans and lines of credit
|
2,449,273
|
|
13,591
|
|
27,033
|
|
13,756
|
|
2,503,653
|
|
|||||||||
|
Construction
|
39,378
|
|
—
|
|
3,761
|
|
1,106
|
|
44,245
|
|
|||||||||
|
Total
|
$
|
9,644,267
|
|
$
|
13,591
|
|
$
|
187,803
|
|
$
|
55,392
|
|
$
|
9,901,053
|
|
||||
Residential loans are internally assigned a grade that complies with the guidelines outlined in the OCC’s Handbook for Rating Credit Risk. Pass loans are assets well protected by the current paying capacity of the borrower. Special Mention loans have a potential weakness that the Association feels deserve management’s attention and may result in further deterioration in their repayment prospects and/or the Association’s credit position. Substandard loans are inadequately protected by the current payment capacity of the borrower or the collateral pledged with a defined weakness that jeopardizes the liquidation of the debt. Beginning with the quarter ended March 31, 2012, performing home equity loans and lines of credit where the customer has a severely delinquent subordinate first mortgage are classified Substandard. Beginning in the quarter ended September 30, 2012, loans in Chapter 7 bankruptcy status where all borrowers have had their obligations discharged, and have not reaffirmed the debt, are classified Substandard. Loss loans are considered uncollectible and effective as of December 31, 2011, are charged off when identified. Prior to December 31, 2011, loss loans carried an SVA.
At
September 30, 2012
and
2011
, respectively, the recorded investment of impaired loans includes $
133,508
and $
121,115
of troubled debt restructurings that are individually evaluated for impairment, but have adequately performed under the terms of the restructuring and are classified as pass loans. At
September 30, 2012
and
2011
, respectively, there are $
20,475
and $
24,576
of loans classified substandard and $
9,868
and $
13,553
of loans classified special mention that are not included in the recorded investment of impaired loans; rather, they are included in loans collectively evaluated for impairment.
112
The following table provides information about the credit quality of consumer loan receivables by payment activity.
|
|
September 30,
|
||||||
|
|
2012
|
2011
|
|||||
|
Performing
|
$
|
4,612
|
|
$
|
6,868
|
|
|
|
Nonperforming
|
—
|
|
—
|
|
|||
|
Total
|
$
|
4,612
|
|
$
|
6,868
|
|
|
Consumer loans are internally assigned a grade of nonperforming when they are considered
90
days or more past due.
6. MORTGAGE LOAN SERVICING ASSETS
The Company sells certain types of loans through whole loan sales and through securitizations. In each case, the Company retains a servicing interest in the loans or securitized loans. Certain assumptions and estimates are used to determine the fair value allocated to these retained interests at the date of transfer and at subsequent measurement dates. These assumptions and estimates include loan repayment rates and discount rates.
Changes in interest rates can affect the average life of loans and mortgage-backed securities and the related servicing assets. A reduction in interest rates normally results in increased prepayments, as borrowers refinance their debt in order to reduce their borrowing costs. This creates reinvestment risk, which is the risk that the Company may not be able to reinvest the proceeds of loan and securities prepayments at rates that are comparable to the rates earned on the loans or securities prior to receipt of the repayment.
During
2012
,
2011
and
2010
,
$11,363
,
$33,554
and
$1,028,670
, respectively, of mortgage loans were securitized and/or sold including accrued interest thereon. In these transactions, the Company retained residual interests in the form of mortgage loan servicing assets. Primary economic assumptions used to measure the value of the Company’s retained interests at the date of sale resulting from the completed transactions were as follows (per annum):
|
2012
|
2011
|
||||
|
Primary prepayment speed assumptions (weighted average annual rate)
|
26.3
|
%
|
15.5
|
%
|
|
|
Weighted average life (years)
|
24.0
|
|
16.6
|
|
|
|
Amortized cost to service loans (weighted average)
|
0.12
|
%
|
0.12
|
%
|
|
|
Weighted average discount rate
|
12
|
%
|
12
|
%
|
|
113
Key economic assumptions and the sensitivity of the current fair value of mortgage loan servicing assets to immediate
10%
and
20%
adverse changes in those assumptions are as presented in the following table. The three key economic assumptions that impact the valuation of the mortgage loan servicing rights are: (1) the prepayment speed, or how long the MSR will be outstanding; (2) the estimate of servicing costs that will be incurred in fulfilling the MSR responsibilities; and (3) the discount factor applied to future net cash flows to convert them to present value. The Company established these factors based on independent analysis of our portfolio and reviews these assumptions periodically to ensure that they reasonably reflect current market conditions and our loan portfolio experience. Additionally, to confirm the appropriateness of the Company's mortgage loan servicing rights valuation, an independent third party is engaged at least annually, and more frequently if warranted by market volatility, to value our mortgage loan servicing rights portfolio. The results of the third party valuation are compared and reconciled to the Company's valuation, thereby validating the Company's approach and assumptions.
|
|
September 30, 2012
|
||
|
Fair value of mortgage loan servicing assets
|
$
|
25,294
|
|
|
Prepayment speed assumptions (weighted average annual rate)
|
24.4
|
%
|
|
|
Impact on fair value of 10% adverse change
|
$
|
(1,126
|
)
|
|
Impact on fair value of 20% adverse change
|
$
|
(2,143
|
)
|
|
Estimated prospective annual cost to service loans (weighted average)
|
0.12
|
%
|
|
|
Impact on fair value of 10% adverse change
|
$
|
(2,689
|
)
|
|
Impact on fair value of 20% adverse change
|
$
|
(5,378
|
)
|
|
Discount rate
|
12.0
|
%
|
|
|
Impact on fair value of 10% adverse change
|
$
|
(924
|
)
|
|
Impact on fair value of 20% adverse change
|
$
|
(1,781
|
)
|
These sensitivities are hypothetical and should be used with caution. As indicated in the table above, changes in fair value based on a
10%
variation in assumptions generally cannot be extrapolated because the relationship in the change in assumption to the change in fair value may not be linear. Also, the effect of a variation in a particular assumption on the fair value of the retained interest is calculated without changing any other assumption. In reality, changes in one factor may result in changes in another (for example, increases in market interest rates may result in lower prepayments), which could magnify or counteract the sensitivities.
Servicing assets are evaluated periodically for impairment based on the fair value of those rights.
Eighteen
risk tranches are used in evaluating servicing rights for impairment, segregated primarily by interest rate stratum within original term to maturity categories with additional stratum for less uniform account types.
Activity in mortgage servicing assets is summarized as follows:
|
|
Year Ended September 30,
|
||||||||||
|
|
2012
|
2011
|
2010
|
||||||||
|
Balance—beginning of year
|
$
|
28,919
|
|
$
|
38,658
|
|
$
|
41,375
|
|
||
|
Additions from loan securitizations/sales
|
43
|
|
137
|
|
6,638
|
|
|||||
|
Amortization
|
(9,349
|
)
|
(9,894
|
)
|
(9,388
|
)
|
|||||
|
Net change in valuation allowance
|
—
|
|
18
|
|
33
|
|
|||||
|
Balance—end of year
|
$
|
19,613
|
|
$
|
28,919
|
|
$
|
38,658
|
|
||
|
Fair value of capitalized amounts
|
$
|
25,294
|
|
$
|
40,654
|
|
$
|
47,733
|
|
||
The Company receives annual servicing fees ranging from
0.12%
to
0.31%
of the outstanding loan balances. Servicing income, net of amortization of capitalized servicing assets, included in Non-interest income, amounted to
$7,327
in
2012
,
$11,392
in
2011
and
$16,885
in
2010
. The unpaid principal balance of mortgage loans serviced for others was approximately
$3,810,786
,
$5,434,138
and
$7,043,946
at
September 30, 2012
,
2011
and
2010
, respectively. The ratio of capitalized servicing assets to the unpaid principal balance of mortgage loans serviced for others was
0.52%
,
0.54%
, and
0.55%
at
September 30, 2012
,
2011
and
2010
, respectively.
114
7. PREMISES, EQUIPMENT AND SOFTWARE, NET
Premises, equipment and software at cost are summarized as follows:
|
|
September 30,
|
||||||
|
|
2012
|
2011
|
|||||
|
Land
|
$
|
7,714
|
|
$
|
7,714
|
|
|
|
Office buildings
|
75,999
|
|
71,828
|
|
|||
|
Furniture, fixtures and equipment
|
33,997
|
|
33,552
|
|
|||
|
Software
|
16,447
|
|
15,650
|
|
|||
|
Leasehold improvements
|
9,269
|
|
9,211
|
|
|||
|
143,426
|
|
137,955
|
|
||||
|
Less accumulated depreciation and amortization
|
(82,276
|
)
|
(78,468
|
)
|
|||
|
Total
|
$
|
61,150
|
|
$
|
59,487
|
|
|
During the years ended
September 30, 2012
,
2011
and
2010
, depreciation and amortization expense on premises, equipment, and software was
$5,414
,
$5,485
and
$6,625
, respectively.
The Company leases certain of its branches under renewable operating lease agreements. Future minimum payments under non-cancelable operating leases with initial or remaining terms of one year or more consisted of the following at
September 30, 2012
:
|
Years Ended September 30,
|
|||
|
2013
|
$
|
4,368
|
|
|
2014
|
3,313
|
|
|
|
2015
|
2,655
|
|
|
|
2016
|
1,986
|
|
|
|
2017
|
1,328
|
|
|
|
Thereafter
|
4,537
|
|
|
During the years ended
September 30, 2012
,
2011
and
2010
, rental expense was
$6,019
,
$5,983
and
$5,681
, respectively.
The Company, as lessor, leases certain commercial office buildings. The Company anticipates receiving future minimum payments of the following as of
September 30, 2012
:
|
Years Ended September 30,
|
|
||
|
2013
|
$
|
1,199
|
|
|
2014
|
1,210
|
|
|
|
2015
|
1,034
|
|
|
|
2016
|
975
|
|
|
During each of the years ended
September 30, 2012
,
2011
, and
2010
, rental income was
$893
,
$2,569
and
$2,569
respectively, and appears in other non-interest income in the accompanying statements.
115
8. ACCRUED INTEREST RECEIVABLE
Accrued interest receivable is summarized as follows:
|
|
September 30,
|
||||||
|
|
2012
|
2011
|
|||||
|
Investment securities
|
$
|
980
|
|
$
|
1,002
|
|
|
|
Loans
|
33,906
|
|
34,851
|
|
|||
|
Other
|
1
|
|
1
|
|
|||
|
Total
|
$
|
34,887
|
|
$
|
35,854
|
|
|
9. DEPOSITS
Deposit account balances are summarized by interest rate as follows:
|
|
Stated
Interest
Rate
|
September 30,
|
||||||||||||||
|
|
2012
|
2011
|
||||||||||||||
|
Amount
|
Percent
|
Amount
|
Percent
|
|||||||||||||
|
Negotiable order of withdrawal accounts
|
0.00–0.30%
|
$
|
1,006,125
|
|
11.2
|
%
|
$
|
975,443
|
|
11.2
|
%
|
|||||
|
Savings accounts
|
0.00–0.55
|
1,777,295
|
|
19.8
|
|
1,681,586
|
|
19.3
|
|
|||||||
|
Subtotal
|
2,783,420
|
|
31.0
|
|
2,657,029
|
|
30.5
|
|
||||||||
|
Certificates of deposit
|
0.00–0.99
|
1,961,447
|
|
21.8
|
|
1,607,868
|
|
18.4
|
|
|||||||
|
1.00–1.99
|
1,746,089
|
|
19.5
|
|
1,229,567
|
|
14.1
|
|
||||||||
|
2.00–2.99
|
900,178
|
|
10.0
|
|
937,003
|
|
10.8
|
|
||||||||
|
3.00–3.99
|
752,638
|
|
8.4
|
|
803,268
|
|
9.2
|
|
||||||||
|
4.00–4.99
|
586,986
|
|
6.5
|
|
736,543
|
|
8.5
|
|
||||||||
|
5.00 and above
|
249,981
|
|
2.8
|
|
743,589
|
|
8.5
|
|
||||||||
|
6,197,319
|
|
69.0
|
|
6,057,838
|
|
69.5
|
|
|||||||||
|
Subtotal
|
8,980,739
|
|
100.0
|
|
8,714,867
|
|
100.0
|
|
||||||||
|
Accrued interest
|
680
|
|
—
|
|
1,043
|
|
—
|
|
||||||||
|
Total deposits
|
$
|
8,981,419
|
|
100.0
|
%
|
$
|
8,715,910
|
|
100.0
|
%
|
||||||
At
September 30, 2012
and
2011
, the weighted average interest rate was
0.4%
and
0.5%
on savings accounts, respectively;
0.3%
and
0.3%
on negotiable order of withdrawal accounts, respectively;
2.1%
and
2.6%
on certificates of deposit, respectively; and
1.5%
and
1.9%
on total deposits, respectively.
The aggregate amount of certificates of deposit in denominations of $100 or more totaled approximately
$2,250,550
and
$2,039,440
at
September 30, 2012
and
2011
, respectively. On July 21, 2010, the Dodd-Frank Wall Street Reform and Consumer Protection Act was signed into law, which, in part, permanently increased the maximum amount of deposit insurance to
$250
per depositor, retroactive to January 1, 2009. The Company does not have any brokered deposits.
The scheduled maturity of certificates of deposit is as follows:
|
|
September 30, 2012
|
|||||
|
|
Amount
|
Percent
|
||||
|
12 months or less
|
$
|
2,551,731
|
|
41.2
|
%
|
|
|
13 to 24 months
|
1,267,463
|
|
20.4
|
%
|
||
|
25 to 36 months
|
1,152,795
|
|
18.6
|
%
|
||
|
37 to 48 months
|
370,286
|
|
6.0
|
%
|
||
|
49 to 60 months
|
452,408
|
|
7.3
|
%
|
||
|
Over 60 months
|
402,636
|
|
6.5
|
%
|
||
|
Total
|
$
|
6,197,319
|
|
100.0
|
%
|
|
116
Interest expense on deposits is summarized as follows:
|
|
Year Ended September 30,
|
||||||
|
|
2012
|
2011
|
|||||
|
Certificates of deposit
|
$
|
142,728
|
|
$
|
164,303
|
|
|
|
Negotiable order of withdrawal accounts
|
2,839
|
|
3,586
|
|
|||
|
Savings accounts
|
7,533
|
|
9,953
|
|
|||
|
Total
|
$
|
153,100
|
|
$
|
177,842
|
|
|
10. BORROWED FUNDS
Federal Home Loan Bank (“FHLB”) borrowings at
September 30, 2012
are summarized in the table below:
|
Amount
|
Weighted
Average
Rate
|
|||||
|
Maturing in:
|
||||||
|
2013
|
$
|
374,000
|
|
0.14
|
%
|
|
|
2014
|
40,000
|
|
2.71
|
%
|
||
|
2015
|
3,000
|
|
3.34
|
%
|
||
|
2016
|
24,745
|
|
2.05
|
%
|
||
|
2017
|
10,000
|
|
0.95
|
%
|
||
|
thereafter
|
36,258
|
|
1.64
|
%
|
||
|
Total FHLB Advances
|
488,003
|
|
0.60
|
%
|
||
|
Accrued interest
|
188
|
|
||||
|
Total
|
$
|
488,191
|
|
|||
The Association’s maximum borrowing capacity at the FHLB, under the most restrictive measure, was an additional
$466,616
at
September 30, 2012
. Pursuant to collateral agreements with FHLB Cincinnati, advances are secured by a blanket lien on qualifying first mortgage loans. The Association’s capacity limit for additional borrowings from the FHLB Cincinnati was
$4,218,731
at
September 30, 2012
, subject to satisfaction of the FHLB Cincinnati common stock ownership requirement. To satisfy the common stock ownership requirement, we would have to increase our ownership of FHLB of Cincinnati common stock by an additional
$75.0 million
. The terms of the advances include various restrictive covenants including limitations on the acquisition of additional debt in excess of specified levels. As of
September 30, 2012
, the Association was in compliance with all such covenants. The Association’s borrowing capacity at the Federal Reserve Discount Window was
$233,296
at
September 30, 2012
.
117
11. OTHER COMPREHENSIVE INCOME (LOSS)
The following table represents the components of other comprehensive income (loss) and the related tax effect allocated to component:
|
Before
Tax
Amount
|
Tax
Effect
|
Net of
Tax
|
|||||||||
|
2010
|
|||||||||||
|
Unrealized gain/(loss) from available-for-sale securities:
|
|||||||||||
|
Net unrealized gain/(loss) arising during the year
|
$
|
(230
|
)
|
$
|
80
|
|
$
|
(150
|
)
|
||
|
Reclassification adjustment for realized (gains)/losses included in net income
|
—
|
|
—
|
|
—
|
|
|||||
|
Net unrealized gain/(loss) from securities, net of reclassification adjustment
|
(230
|
)
|
80
|
|
(150
|
)
|
|||||
|
Defined benefit plan:
|
|||||||||||
|
Newly established net gain (loss) and prior service (cost) credit
|
(2,061
|
)
|
721
|
|
(1,340
|
)
|
|||||
|
Reclassification adjustment of prior service costs and actuarial loss included in income
|
2,088
|
|
(731
|
)
|
1,357
|
|
|||||
|
Newly established net gain (loss) and prior service (cost) credit, net of
reclassification adjustment
|
27
|
|
(10
|
)
|
17
|
|
|||||
|
Other comprehensive loss
|
$
|
(203
|
)
|
$
|
70
|
|
$
|
(133
|
)
|
||
|
2011
|
|||||||||||
|
Unrealized gain/(loss) from available-for-sale securities:
|
|||||||||||
|
Net unrealized gain/(loss) arising during the year
|
$
|
—
|
|
$
|
—
|
|
$
|
—
|
|
||
|
Reclassification adjustment for realized (gains)/losses included in net income
|
—
|
|
—
|
|
—
|
|
|||||
|
Net unrealized gain/(loss) from securities, net of reclassification adjustment
|
—
|
|
—
|
|
—
|
|
|||||
|
Defined benefit plan:
|
|||||||||||
|
Newly established net gain (loss) and prior service (cost) credit
|
3,918
|
|
(1,371
|
)
|
2,547
|
|
|||||
|
Reclassification adjustment of prior service costs and actuarial loss included in income
|
(1,181
|
)
|
413
|
|
(768
|
)
|
|||||
|
Newly established net gain (loss) and prior service (cost) credit, net of
reclassification adjustment
|
2,737
|
|
(958
|
)
|
1,779
|
|
|||||
|
Other comprehensive income
|
$
|
2,737
|
|
$
|
(958
|
)
|
$
|
1,779
|
|
||
|
2012
|
|||||||||||
|
Unrealized gain/(loss) from available-for-sale securities:
|
|||||||||||
|
Net unrealized gain/(loss) arising during the year
|
$
|
449
|
|
$
|
(157
|
)
|
$
|
292
|
|
||
|
Transfer of investments from held to maturity to available for sale
|
3,427
|
|
(1,199
|
)
|
2,228
|
|
|||||
|
Net unrealized gain/(loss) from securities
|
3,876
|
|
(1,356
|
)
|
2,520
|
|
|||||
|
Defined benefit plan:
|
|||||||||||
|
Newly established net gain (loss) and prior service (cost) credit
|
11,775
|
|
(4,122
|
)
|
7,653
|
|
|||||
|
Reclassification adjustment of prior service costs and actuarial loss included in income
|
289
|
|
(101
|
)
|
188
|
|
|||||
|
Newly established net gain (loss) and prior service (cost) credit, net of
reclassification adjustment
|
12,064
|
|
(4,223
|
)
|
7,841
|
|
|||||
|
Other comprehensive income
|
$
|
15,940
|
|
$
|
(5,579
|
)
|
$
|
10,361
|
|
||
118
12. INCOME TAXES
The components of the income tax provision are as follows:
|
|
Year Ended September 30,
|
||||||||||
|
|
2012
|
2011
|
2010
|
||||||||
|
Current tax expense:
|
|||||||||||
|
Federal
|
$
|
21,305
|
|
$
|
10,903
|
|
$
|
17,368
|
|
||
|
State
|
98
|
|
75
|
|
47
|
|
|||||
|
Deferred tax expense:
|
|||||||||||
|
Federal
|
(19,270
|
)
|
(8,243
|
)
|
(10,542
|
)
|
|||||
|
State
|
—
|
|
—
|
|
—
|
|
|||||
|
Income tax provision
|
$
|
2,133
|
|
$
|
2,735
|
|
$
|
6,873
|
|
||
Reconciliation from tax at the statutory rate to the income tax provision is as follows:
|
|
Year Ended September 30,
|
|||||||
|
|
2012
|
2011
|
2010
|
|||||
|
Tax at statutory rate
|
35.0
|
%
|
35.0
|
%
|
35.0
|
%
|
||
|
State tax, net
|
0.5
|
|
0.4
|
|
0.2
|
|
||
|
Insurance related amounts
|
(16.7
|
)
|
(18.9
|
)
|
(12.5
|
)
|
||
|
Change in valuation allowance for deferred tax assets
|
(3.7
|
)
|
5.0
|
|
10.4
|
|
||
|
General business credits
|
—
|
|
—
|
|
(0.2
|
)
|
||
|
Other
|
0.6
|
|
1.1
|
|
4.8
|
|
||
|
Income tax provision
|
15.7
|
%
|
22.6
|
%
|
37.7
|
%
|
||
Deferred income tax expense results from temporary differences in the recognition of revenue and expenses for tax and financial statement purposes. The sources of these differences and the tax effect of each were as follows:
|
|
Year Ended September 30,
|
||||||||||
|
|
2012
|
2011
|
2010
|
||||||||
|
Charitable contribution carryforward, net
|
$
|
1,681
|
|
$
|
1,849
|
|
$
|
3,848
|
|
||
|
Loan loss reserve
|
(13,108
|
)
|
(4,357
|
)
|
(7,753
|
)
|
|||||
|
Deferred loan fees
|
(447
|
)
|
(959
|
)
|
(1,388
|
)
|
|||||
|
Mortgage servicing rights
|
(1,629
|
)
|
(1,378
|
)
|
591
|
|
|||||
|
Property basis difference
|
(334
|
)
|
876
|
|
(385
|
)
|
|||||
|
ESOP plan
|
(366
|
)
|
(476
|
)
|
(349
|
)
|
|||||
|
Pending REIT dividend
|
857
|
|
(4,399
|
)
|
(3,439
|
)
|
|||||
|
Deferred compensation
|
(3,657
|
)
|
179
|
|
(1,256
|
)
|
|||||
|
Unrealized gains/losses
|
(1,482
|
)
|
908
|
|
(715
|
)
|
|||||
|
Private equity funds
|
57
|
|
382
|
|
117
|
|
|||||
|
Other
|
(842
|
)
|
(868
|
)
|
187
|
|
|||||
|
Deferred income tax benefit
|
$
|
(19,270
|
)
|
$
|
(8,243
|
)
|
$
|
(10,542
|
)
|
||
119
Temporary differences between the financial statement carrying amounts and tax basis of assets and liabilities that gave rise to significant portions of net deferred taxes relate to the following:
|
|
September 30,
|
||||||
|
|
2012
|
2011
|
|||||
|
Deferred tax assets:
|
|||||||
|
Loan loss reserve
|
$
|
49,765
|
|
$
|
36,657
|
|
|
|
Deferred compensation
|
8,946
|
|
5,288
|
|
|||
|
Pension liability
|
4,590
|
|
8,813
|
|
|||
|
Property, equipment and software basis difference
|
1,573
|
|
1,239
|
|
|||
|
Pending REIT dividend
|
493
|
|
1,350
|
|
|||
|
Charitable contribution carryforward
|
—
|
|
7,920
|
|
|||
|
Other
|
5,534
|
|
2,000
|
|
|||
|
Gross deferred tax assets
|
70,901
|
|
63,267
|
|
|||
|
Valuation allowance—charitable contribution carryforward
|
—
|
|
(6,500
|
)
|
|||
|
Total deferred tax assets
|
70,901
|
|
56,767
|
|
|||
|
Deferred tax liabilities:
|
|||||||
|
FHLB stock basis difference
|
7,695
|
|
7,695
|
|
|||
|
Mortgage servicing rights
|
1,790
|
|
3,419
|
|
|||
|
Goodwill
|
2,836
|
|
2,510
|
|
|||
|
Other
|
3,461
|
|
1,714
|
|
|||
|
Total deferred tax liabilities
|
15,782
|
|
15,338
|
|
|||
|
Net deferred tax asset
|
$
|
55,119
|
|
$
|
41,429
|
|
|
In the accompanying statement of condition the net deferred tax asset is included in Other assets.
A valuation allowance is established to reduce deferred tax assets if it is more likely than not that the related tax benefits will not be realized. The ultimate realization of deferred tax assets is dependent upon the generation of future taxable income during the periods in which those temporary differences become deductible. During the years ended September 30, 2012, 2011 and 2010, there was a net increase (decrease) in the valuation allowance on the charitable contribution carryforward of
$(500)
,
$600
, and
$1,900
, respectively. The charitable contribution carryforward expired September 30, 2012.
Retained earnings at
September 30, 2012
and
2011
included approximately
$104,861
for which no provision for federal income tax has been made. This amount represents allocations of income during years prior to 1988 to bad debt deductions for tax purposes only. These qualifying and nonqualifying base year reserves and supplemental reserves will be recaptured into income in the event of certain distributions and redemptions. Such recapture would create income for tax purposes only, which would be subject to the then current corporate income tax rate. However, recapture would not occur upon the reorganization, merger, or acquisition of the Association, nor if the Association is merged or liquidated tax-free into a bank or undergoes a charter change. If the Association fails to qualify as a bank or merges into a nonbank entity, these reserves will be recaptured into income.
The provisions of Accounting for Uncertainty in Income Taxes, codified within FASB ASC 740 “Income Taxes,” prescribe a recognition threshold and measurement attribute for the financial statement recognition and measurement for a tax position taken or expected to be taken in a tax return. FASB ASC 740 also provides guidance on derecognition, classification, interest and penalties, accounting in interim periods, disclosure and transition. Tax positions must meet a more-likely-than-not recognition threshold in order for the related tax benefit to be recognized or continue to be recognized. As of
September 30, 2012
,
2011
and
2010
, there were
no
unrecognized tax benefits. The Company does not anticipate the total amount of unrecognized tax benefits to significantly change within the next 12 months.
The Company recognizes interest and penalties on income tax assessments or income tax refunds, where applicable, in the financial statements as a component of its provision for income taxes. During the fiscal year ended September 30, 2012, the Company reached a settlement with the Internal Revenue Service ("IRS") related to the timing of bad debt deductions on the federal tax returns of the Company and its subsidiaries for fiscal years ended 2008, 2009 and 2010. For the year ended September 30, 2012, and pursuant to this settlement, the Company recognized
$1,013
of interest expense, net of tax benefit, and
$697
of charitable contribution benefit that would have otherwise expired unused.There is
$729
of estimated interest
120
included in income tax liability at
September 30, 2012
. There were
no
amounts recognized or paid for interest and penalties for the years ended
September 30, 2011
and
2010
. There were
no
amounts accrued at
September 30, 2011
.
The Company and its subsidiaries file income tax returns in the U.S. federal jurisdiction and various state and city jurisdictions. With few exceptions, the Company is no longer subject to federal and state income tax examinations for tax years prior to 2009. The State of Ohio Department of Taxation is currently conducting an audit of the Association's Ohio Franchise Tax Returns for fiscal years ended September 30, 2009, 2010 and 2011.
13. EMPLOYEE BENEFIT PLANS
Defined Benefit Plan
—Third Federal Savings Retirement Plan (the "Plan”) is a defined benefit pension plan. Effective December 31, 2002, the Plan was amended to limit participation to employees who met the Plan’s eligibility requirements on that date. After December 31, 2002, employees not participating in the Plan, upon meeting the applicable eligibility requirements, participate in the third tier of the 401(k) Savings Plan described below. Benefits under the Plan are based on years of service and the employee’s average annual compensation. The funding policy of the Plan is consistent with the funding requirements of U.S. Federal and other governmental laws and regulations. The Plan was amended in the current year to freeze future benefit accruals for participants in the Plan effective December 31, 2011. As of December 31, 2011, the projected benefit obligation, as well as the unfunded liability recorded, was reduced by
$16,149
, the portion attributable to future salary increases. Those eligible participants who no longer receive service credits under the Plan are also eligible to participate in the third tier of the 401(k) Savings Plan described below.
The following table sets forth the change in projected benefit obligation for the defined benefit plan:
|
|
September 30,
|
||||||
|
|
2012
|
2011
|
|||||
|
Projected benefit obligation at beginning of year
|
$
|
75,768
|
|
$
|
79,291
|
|
|
|
Service cost
|
1,005
|
|
4,337
|
|
|||
|
Interest cost
|
2,952
|
|
3,641
|
|
|||
|
Actuarial (gain)/loss and other
|
10,113
|
|
(7,332
|
)
|
|||
|
Plan amendment
|
(16,149
|
)
|
—
|
|
|||
|
Benefits paid
|
(2,901
|
)
|
(4,169
|
)
|
|||
|
Projected benefit obligation at end of year
|
$
|
70,788
|
|
$
|
75,768
|
|
|
Changes in certain actuarial assumptions, including a lower discount rate and interest assumptions for lump sum benefit amounts, increased the projected benefit obligation at
September 30, 2012
by
$6,562
and at
September 30, 2011
by
$2,224
.
The following table reconciles the beginning and ending balances of the fair value of plan assets and presents the funded status of the Plan recognized in the statement of condition at the September 30 measurement date:
|
|
September 30,
|
||||||
|
|
2012
|
2011
|
|||||
|
Fair value of plan assets at beginning of the year
|
$
|
47,684
|
|
$
|
46,184
|
|
|
|
Actual return on plan assets
|
9,465
|
|
(92
|
)
|
|||
|
Employer contributions
|
4,427
|
|
5,761
|
|
|||
|
Benefits paid
|
(2,901
|
)
|
(4,169
|
)
|
|||
|
Fair value of plan assets at end of year
|
$
|
58,675
|
|
$
|
47,684
|
|
|
|
Funded status of the plan—asset/(liability)
|
$
|
(12,113
|
)
|
$
|
(28,084
|
)
|
|
At
September 30, 2012
and
2011
, the accumulated benefit obligation under the Plan was
$70,788
and
$59,798
, respectively. At
September 30, 2012
, the fair value of plan assets was deficient by
$12,113
while at
September 30, 2011
, the fair value of plan assets was deficient by
$12,114
.
121
The components of net periodic benefit cost recognized in the statement of income are as follows:
|
|
Year ended September 30,
|
||||||||||
|
|
2012
|
2011
|
2010
|
||||||||
|
Service cost
|
$
|
1,005
|
|
$
|
4,337
|
|
$
|
3,980
|
|
||
|
Interest Cost
|
2,952
|
|
3,641
|
|
3,576
|
|
|||||
|
Expected return on plan assets
|
(3,727
|
)
|
(3,365
|
)
|
(2,902
|
)
|
|||||
|
Amortization of net (gain)/loss and other
|
572
|
|
(1,120
|
)
|
2,149
|
|
|||||
|
Amortization of prior service cost
|
(15
|
)
|
(61
|
)
|
(61
|
)
|
|||||
|
Recognized net gain due to curtailment
|
(267
|
)
|
—
|
|
—
|
|
|||||
|
Net periodic benefit cost
|
$
|
520
|
|
$
|
3,432
|
|
$
|
6,742
|
|
||
Plan assets carried at fair value are classified into one of the three levels of the fair value hierarchy based on an assessment of inputs used in the valuation techniques. See Note. 16 Fair Value for additional information about fair value measurements, the fair value hierarchy, and a description of the inputs used within each level of the hierarchy.
Plan assets consist of investments in pooled separate accounts that invest in mutual funds, equity securities, debt securities, or real estate investments. Pooled separate accounts are valued at net asset value (“NAV”) of shares held by the pension plan at the reporting date. NAV is categorized as a level 2 fair value measurement except when the investment so measured could not have been redeemed at NAV as of the measurement date. At
September 30, 2012
and
2011
, there are no such restrictions on plan assets. Unless otherwise restricted, pooled separate accounts can be redeemed on a daily basis. At September 30, 2010, there was a temporary withdrawal limitation on one pooled separate account that delayed certain withdrawal transactions until sufficient liquidity levels were achieved. Withdrawal requests were transacted at NAV on the date of distribution. This investment was included in level 3 of the fair value hierarchy until September 30, 2011, the end of the period in which the restriction was lifted, at which time it was transfered to level 2 of the hierarchy.
The following tables present the fair value of plan assets by asset category at the measurement date.
|
|
September 30,
2012 |
Recurring Fair Value Measurements at Reporting Date Using
|
|||||||||||||
|
|
Quoted Prices in
Active Markets for
Identical Assets
(Level 1)
|
Significant Other
Observable Inputs
(Level 2)
|
Significant
Unobservable
Inputs
(Level 3)
|
||||||||||||
|
Asset Category:
|
|||||||||||||||
|
U.S. large cap equity portfolios
|
$
|
18,701
|
|
$
|
—
|
|
$
|
18,701
|
|
$
|
—
|
|
|||
|
U.S. small/mid cap equity portfolios
|
4,455
|
|
—
|
|
4,455
|
|
—
|
|
|||||||
|
International equity portfolios
|
7,259
|
|
—
|
|
7,259
|
|
—
|
|
|||||||
|
Debt securities(1)
|
22,369
|
|
—
|
|
22,369
|
|
—
|
|
|||||||
|
Real estate investments portfolios
|
5,891
|
|
—
|
|
5,891
|
|
—
|
|
|||||||
|
Total
|
$
|
58,675
|
|
$
|
—
|
|
$
|
58,675
|
|
$
|
—
|
|
|||
122
|
|
|
Recurring Fair Value Measurements at Reporting Date Using
|
|||||||||||||
|
|
September 30,
2011 |
Quoted Prices in
Active Markets for
Identical Assets
(Level 1)
|
Significant Other
Observable Inputs
(Level 2)
|
Significant
Unobservable
Inputs
(Level 3)
|
|||||||||||
|
Asset Category:
|
|||||||||||||||
|
U.S. large cap equity portfolios
|
$
|
16,140
|
|
$
|
—
|
|
$
|
16,140
|
|
$
|
—
|
|
|||
|
U.S. small/mid cap equity portfolios
|
3,822
|
|
—
|
|
3,822
|
|
—
|
|
|||||||
|
International equity portfolios
|
6,272
|
|
—
|
|
6,272
|
|
—
|
|
|||||||
|
Debt securities(1)
|
17,174
|
|
—
|
|
17,174
|
|
—
|
|
|||||||
|
Real estate investments portfolios
|
4,276
|
|
—
|
|
4,276
|
|
—
|
|
|||||||
|
Total
|
$
|
47,684
|
|
$
|
—
|
|
$
|
47,684
|
|
$
|
—
|
|
|||
______________________
|
(1)
|
Includes pooled separate accounts that invest mainly in fixed income securities such as corporate bonds, asset backed securities, commercial mortgage backed securities or in a single mutual fund.
|
The following table reconciles the beginning and ending balances for plan assets measured at fair value using significant unobservable inputs (Level 3):
|
|
Year ended September 30,
|
||||||||||
|
Real estate investment portfolios
|
2012
|
2011
|
2010
|
||||||||
|
Fair value at beginning of year
|
$
|
—
|
|
$
|
1,701
|
|
$
|
1,612
|
|
||
|
Actual return gains (losses) on plan assets
|
|||||||||||
|
Relating to assets still held at the reporting date
|
—
|
|
—
|
|
89
|
|
|||||
|
Relating to assets sold or transferred during the period
|
—
|
|
1,612
|
|
—
|
|
|||||
|
Purchases, sales and settlements
|
—
|
|
—
|
|
—
|
|
|||||
|
Transfers in (out) of Level 3
|
—
|
|
(3,313
|
)
|
—
|
|
|||||
|
Fair value at end of year
|
$
|
—
|
|
$
|
—
|
|
$
|
1,701
|
|
||
Asset allocation ranges have been established by broad asset categories. The ranges are designed to provide an appropriate balance between risk and return, while positioning Plan assets, over extended economic cycles, in a manner consistent with the long-term return assumptions used in measurements and valuations. For equity securities the target is
55
to
60%
while the target for debt and real estate securities (including cash equivalents) is
40
to
45%
.
The following additional information is provided with respect to the Plan:
|
|
September 30,
|
|||||||
|
|
2012
|
2011
|
2010
|
|||||
|
Assumptions and dates used to determine benefit obligations:
|
||||||||
|
Discount rate
|
4.3
|
%
|
4.95
|
%
|
5.10
|
%
|
||
|
Rate of compensation increase
|
n/a
|
|
4.55
|
|
4.62
|
|
||
|
Census date
|
1/1/2012
|
|
1/1/2011
|
|
1/1/2010
|
|
||
|
Assumptions used to determine net periodic benefit cost:
|
||||||||
|
Discount rate
|
4.95%/4.40%
|
|
5.10
|
%
|
5.40
|
%
|
||
|
Long-term rate of return on plan assets
|
7.50
|
|
7.50
|
|
8.00
|
|
||
|
Rate of compensation increase (graded scale)
|
4.55
|
|
4.62
|
|
4.66
|
|
||
The discount rate for fiscal year 2012 was
4.95%
for the three months ended December 31, 2011, which was the date future benefit accruals were frozen and
4.40%
for the remainder of the year. The expected long-term return on assets assumption has been derived based upon the average rates of earnings expected on the funds invested to provide for Plan benefits. Management evaluates the historical performance of the various asset categories, as well as current expectations in determining the adequacy of the assumed rates of return in meeting Plan obligations. If warranted, the assumption is modified.
123
The following table provides estimates of expected future benefit payments during each of the next five fiscal years, as well as in the aggregate for years six through ten. Additionally, the table includes the expected employer contribution during the next fiscal year.
|
Expected Benefit Payments During the Fiscal Years Ending September 30:
|
|
||
|
2013
|
$
|
4,920
|
|
|
2014
|
4,130
|
|
|
|
2015
|
4,090
|
|
|
|
2016
|
3,900
|
|
|
|
2017
|
4,250
|
|
|
|
Aggregate expected benefit payments during the five fiscal year period beginning October 1, 2018, and ending September 30, 2022
|
$
|
22,930
|
|
|
Minimum employer contributions expected to be paid during the fiscal year ending September 30, 2013
|
$
|
—
|
|
Effective September 30, 2006, the Company adopted the provisions of FASB ASC 715 “Compensation – Retirement Benefits” which requires an employer to recognize the funded status of its Plan in the statement of financial condition by a charge to AOCI. AOCI includes the following items that have not yet been recognized as components of net periodic benefit cost as of the measurement date (there was no transition obligation at any date):
|
|
Year ended September 30,
|
||||||||||
|
|
2012
|
2011
|
2010
|
||||||||
|
Net actuarial loss
|
$
|
13,116
|
|
$
|
25,462
|
|
$
|
28,260
|
|
||
|
Prior service cost (benefit)
|
—
|
|
(282
|
)
|
(343
|
)
|
|||||
|
Net amount recognized in AOCI
|
$
|
13,116
|
|
$
|
25,180
|
|
$
|
27,917
|
|
||
The Company expects that
$555
of net actuarial losses will be recognized as AOCI components of net periodic benefit cost during the fiscal year ended September 30,
2013
.
401(k) Savings Plan
—The Company maintains a 401(k) savings plan that is comprised of three tiers. The first tier allows eligible employees to contribute up to
75%
of their compensation to the plan, subject to limitations established by the Internal Revenue Service, with the Company matching
100%
of up to
4%
on funds contributed. The second tier permits the Company to make a profit-sharing contribution at its discretion. The first and second tiers cover substantially all employees who have reached age
21
and have worked
1,000
hours in one year of service. The third tier permits the Company to make discretionary contributions allocable to eligible employees including those eligible employees who are participants, but no longer receiving service credits, under the Company’s defined benefit pension plan. Voluntary contributions made by employees are vested at all times whereas Company contributions and Company matching contributions are subject to various vesting periods which range from
immediately
vested to fully vesting upon
five
years of service.
The total of the Company’s matching and discretionary contributions related to the 401(k) savings plan for the years ended
September 30, 2012
,
2011
and
2010
was
$2,717
,
$1,943
and
$2,014
respectively.
Other Deferred Compensation
—The Company also maintains an Executive Retirement Benefit Plan, which provides additional retirement benefits to certain key associates, as designated by the board of directors. The total cost related to the Executive Retirement Benefit Plan was
$26
in
2012
,
$39
in
2011
and
$38
in
2010
. Future contributions will consist of interest on the vested balance.
The Company also maintains several other non-qualified defined contribution plans for certain key associates. Awards granted and participation in these plans are at the discretion of the board of directors. The total expense relating to these plans amounted to
$167
in
2012
,
$139
in
2011
and
$166
in
2010
.
Employee (Associate) Stock Ownership Plan (“ESOP”)
—The Company established an ESOP for its employees effective January 1, 2006. The ESOP is a tax-qualified plan designed to invest primarily in the Company’s common stock and provides employees with an opportunity to receive a funded retirement benefit, based primarily on the value of the Company’s common stock. The ESOP covers all eligible employees of the Company and its wholly-owned subsidiaries. Employees are eligible to participate in the ESOP after attainment of age
18
, completion of
1,000
hours of service, and employment on the last day of the plan’s calendar year. Company contributions to the plan are at the discretion of the board of directors. The ESOP is accounted for in accordance with the provisions for stock compensation in FASB ASC 718
.
Compensation expense for the ESOP is based on the market price of the Company’s stock and is recognized as shares are committed to be released to
124
participants. The total compensation expense related to this plan in the
2012
,
2011
and
2010
fiscal year was
$4,004
,
$3,222
and
$6,300
, respectively.
The ESOP was authorized to purchase, and did purchase,
11,605,824
shares of the Company’s common stock at a price of
$10
per share with a 2006 plan year cash contribution and the proceeds of a loan from the Company to the ESOP. The outstanding loan principal balance as of
September 30, 2012
and
2011
was
$79,381
and
$82,591
, respectively. Shares of the Company’s common stock pledged as collateral for the loan are released from the pledge for allocation to participants as loan payments are made. At
September 30, 2012
,
3,805,709
shares have been allocated to participants and
325,005
shares were committed to be released. Shares that are committed to be released will be allocated to participants at the end of the plan year (December 31). ESOP shares that are unallocated or not yet committed to be released totaled
7,475,110
at
September 30, 2012
, and had a fair market value of
$67,799
.
14. EQUITY INCENTIVE PLAN
At a special meeting of shareholders held on May 29, 2008, shareholders of the Company approved the TFS Financial Corporation 2008 Equity Incentive Plan (the "Equity Plan”). The Company adopted the provisions related to share-based compensation in FASB ASC 718 and FASB ASC 505, upon approval of the Equity Plan, and began to expense the fair value of all share-based compensation granted over the requisite service periods.
During the year ended
September 30, 2012
, the Compensation Committee of the Company’s Board of Directors approved the issuance of an additional
1,277,500
stock options and
444,700
restricted stock units to certain officers and employees of the Company. The awards were made pursuant to the Equity Plan.
FASB ASC 718 requires the Company to report as a financing cash flow the benefits of realized tax deductions in excess of the deferred tax benefits previously recognized for compensation expense. The excess tax benefit for
2012
,
2011
and
2010
was
$0
,
$0
, and
$57
respectively.
The stock options have a contractual term of
10
years and vest over a
three
to
seven
year service period. The Company recognizes compensation expense for the fair values of these awards, which have installment vesting, on a straight-line basis over the requisite service period of the awards.
Restricted stock units vest over a
one
to
ten
year service period. The product of the number of units granted and the grant date market price of the Company’s common stock determines the fair value of restricted stock units under the Equity Plan. The Company recognizes compensation expense for the fair value of restricted stock units on a straight-line basis over the requisite service period.
During the years ended
September 30, 2012
,
2011
and
2010
, the Company recorded
$7,112
,
$6,919
and
$6,841
, respectively, of share-based compensation expense, comprised of stock option expense of
$3,570
,
$2,848
and
$2,632
, respectively and restricted stock units expense of
$3,542
,
$4,071
and
$4,209
, respectively. The tax benefit recognized in net income related to share-based compensation expense was
$3,664
,
$1,685
and
$1,527
, respectively.
The following is a summary of the status of the Company’s restricted stock units as of
September 30, 2012
and changes therein during the year then ended:
|
Number of
Shares
Awarded
|
Weighted
Average
Grant Date
Fair Value
|
|||||
|
Outstanding at September 30, 2011
|
1,238,200
|
|
$
|
11.84
|
|
|
|
Granted
|
444,700
|
|
8.61
|
|
||
|
Exercised
|
(96,887
|
)
|
11.51
|
|
||
|
Forfeited
|
(6,500
|
)
|
8.61
|
|
||
|
Outstanding at September 30, 2012
|
1,579,513
|
|
$
|
10.96
|
|
|
|
Vested and exercisable, at September 30, 2012
|
298,083
|
|
$
|
12.17
|
|
|
|
Vested and expected to vest, at September 30, 2012
|
1,566,886
|
|
$
|
10.98
|
|
|
The total fair value of restricted stock units vested during the years ended
September 30, 2012
,
2011
and
2010
was
$2,383
,
$8,354
, and
$1,089
, respectively. Expected future compensation expense relating to the non-vested restricted stock units at
September 30, 2012
is
$8,363
over a weighted average period of
2.88
years.
125
The following is a summary of the Company’s stock option activity and related information for the Equity Plan for the year ended
September 30, 2012
:
|
Number of
Stock Options
|
Weighted
Average
Exercise
Price
|
Weighted
Average
Remaining
Contractual
Life
|
Aggregate
Intrinsic
Value
|
|||||||||
|
Outstanding at September 30, 2011
|
5,005,925
|
|
$
|
11.96
|
|
7.1
|
$
|
—
|
|
|||
|
Granted
|
1,277,500
|
|
8.61
|
|
||||||||
|
Exercised
|
—
|
|
—
|
|
||||||||
|
Forfeited
|
(83,834
|
)
|
11.25
|
|
$
|
5
|
|
|||||
|
Outstanding at September 30, 2012
|
6,199,591
|
|
$
|
11.28
|
|
6.7
|
$
|
582
|
|
|||
|
Vested and exercisable at September 30, 2012
|
2,217,421
|
|
$
|
12.08
|
|
6.3
|
$
|
3
|
|
|||
|
Vested or expected to vest at September 30, 2012
|
6,191,525
|
|
$
|
11.28
|
|
6.7
|
$
|
580
|
|
|||
The fair value of the option grants was estimated on the date of grant using the Black-Scholes option-pricing model with the following weighted average assumptions.
|
|
2012
|
2010
|
|||
|
Expected dividend yield
|
—
|
%
|
2.00
|
%
|
|
|
Expected volatility
|
28.54
|
%
|
25.30
|
%
|
|
|
Risk-free interest rate
|
1.19
|
%
|
2.52
|
%
|
|
|
Expected option term (in years)
|
6.0
|
|
6.0
|
|
|
The expected dividend yield was assumed to be
0%
since
no
dividends have been paid since May 2010. Volatility of the company’s stock was used in the estimation of fair value. Management estimated the expected life of the options using the simplified method allowed under SEC Staff Accounting Bulletin (SAB) 110, which expresses the views of the SEC regarding the use of a “simplified” method, as discussed in SAB No. 107. The five and seven year Treasury yield in effect at the time of the grant provides the risk-free rate of return for periods within the expected term of the options.
The weighted average grant date fair value of options granted during the year ended
September 30, 2012
was
$2.58
per share. There were
no
options granted or other option activity during the year ended September 30, 2011. Expected future compensation expense relating to the non-vested options outstanding as of
September 30, 2012
is
$6,482
over a weighted average period of
2.36
years. Upon exercise of vested options, management expects to draw on treasury stock as the source of the shares. At
September 30, 2012
, the number of common shares authorized for award under the Equity Plan was
23,000,000
, of which
14,382,759
shares remain available for future award.
15. COMMITMENTS AND CONTINGENT LIABILITIES
In the normal course of business, the Company enters into commitments with off-balance-sheet risk to meet the financing needs of its customers. Commitments to extend credit are agreements to lend to a customer as long as there is no violation of any condition established in the contract. Commitments to originate loans generally have fixed expiration dates of
60
to
360
days or other termination clauses and may require payment of a fee. Unfunded commitments related to home equity lines of credit generally expire
10
years following the date that the line of credit was established, subject to various conditions including compliance with payment obligation, adequacy of collateral securing the line and maintenance of a satisfactory credit profile by the borrower. Since some of the commitments may expire without being drawn upon, the total commitment amounts do not necessarily represent future cash requirements.
Off-balance sheet commitments to extend credit involve elements of credit risk and interest rate risk in excess of the amount recognized in the consolidated statements of condition. The Company’s exposure to credit loss in the event of nonperformance by the other party to the commitment is represented by the contractual amount of the commitment. The Company generally uses the same credit policies in making commitments as it does for on-balance-sheet instruments. Interest rate risk on commitments to extend credit results from the possibility that interest rates may have moved unfavorably from the position of the Company since the time the commitment was made.
126
At
September 30, 2012
, the Company had commitments to originate loans as follows:
|
Fixed-rate mortgage loans
|
$
|
125,540
|
|
|
Adjustable-rate mortgage loans
|
169,809
|
|
|
|
Equity loans and lines of credit including bridge loans
|
4,432
|
|
|
|
Total
|
$
|
299,781
|
|
At
September 30, 2012
, the Company had unfunded commitments outstanding as follows:
|
Equity lines of credit
|
$
|
1,311,465
|
|
|
Construction loans
|
36,736
|
|
|
|
Private equity investments
|
13,813
|
|
|
|
Total
|
$
|
1,362,014
|
|
At
September 30, 2012
, the unfunded commitment on home equity lines of credit, including commitments for accounts suspended as a result of material default or a decline in equity, is
$1,534,970
.
The Company assumes mortgage guaranty insurance on an excess of loss basis for the mortgage guaranty risks of certain mortgage loans in its own portfolio, including Home Today loans and loans in its servicing portfolio, through reinsurance contracts with
two
primary mortgage insurance companies. Under these contracts, the Company absorbs mortgage insurance losses in a range of
five
to
12
percentage points in excess of the initial
five
percentage point loss layer of a given pool of loans, in exchange for a portion of the pool’s mortgage insurance premiums. The first
five
percent layer of loss must be exceeded before the Company assumes any liability. At
September 30, 2012
, the maximum losses under the reinsurance contracts were limited to
$14,362
. The Company has paid
$4,059
of losses under these reinsurance contracts and has provided a liability for the remaining estimated losses totaling
$3,351
as of
September 30, 2012
. When evaluating whether or not the reserves provide a reasonable provision for unpaid loss and loss adjustment expenses, it is necessary to project future loss and loss adjustment expense emergence and payments for loan delinquencies occurring through the balance sheet date. The actual future loss and loss adjustment expense may not develop as actuarially projected. They may in fact vary materially from the projections as mortgage insurance results are influenced by factors such as unemployment, housing market conditions and loan repayment rates. Management believes it has made adequate provision for estimated losses. Based upon notice from the Company’s two primary mortgage insurance companies, no new contracts are being added to the Company’s risk exposure. The Company’s insurance partners will retain all new mortgage insurance premiums and all new risk.
The following table summarizes the activity in the liability for unpaid losses and loss adjustment expenses:
|
|
September 30,
|
||||||||||
|
|
2012
|
2011
|
2010
|
||||||||
|
Balance, beginning of year
|
$
|
4,023
|
|
$
|
5,082
|
|
$
|
5,846
|
|
||
|
Incurred increase (decrease)
|
797
|
|
(57
|
)
|
501
|
|
|||||
|
Paid claims
|
(1,469
|
)
|
(1,002
|
)
|
(1,265
|
)
|
|||||
|
Balance, end of period
|
$
|
3,351
|
|
$
|
4,023
|
|
$
|
5,082
|
|
||
At
September 30, 2012
and
2011
, the Company had commitments to securitize and sell mortgage loans which totaled
$2,836
and
$0
, respectively.
In management’s opinion, the above commitments will be funded through normal operations.
127
16. FAIR VALUE
Under U.S. GAAP, fair value is defined as the price that would be received to sell an asset, or paid to transfer a liability, in an orderly transaction between market participants at the measurement date and a fair value framework is established whereby assets and liabilities measured at fair value are grouped into three levels of a fair value hierarchy, based on the transparency of inputs and the reliability of assumptions used to estimate fair value. The Company’s policy is to recognize transfers between levels of the hierarchy as of the end of the reporting period in which the transfer occurs. The three levels of inputs are defined as follows:
|
Level 1
–
|
quoted prices (unadjusted) for identical assets or liabilities in active markets.
|
|
|
Level 2
–
|
quoted prices for similar assets or liabilities in active markets, quoted prices for identical or similar assets or liabilities in markets with few transactions, or model-based valuation techniques using assumptions that are observable in the market.
|
|
|
Level 3
–
|
a company’s own assumptions about how market participants would price an asset or liability.
|
|
As permitted under the fair value guidance in U.S. GAAP, the Company elects to measure at fair value mortgage loans classified as held for sale that are subject to pending agency contracts to securitize and sell loans. This election is expected to reduce volatility in earnings related to timing issues on these contracts. At
September 30, 2012
and
2011
, respectively, there were
$3,017
and
$0
loans held for sale, with unpaid principal balances of
$2,830
and
$0
, subject to pending agency contracts for which the fair value option was elected. For the years ended
September 30, 2012
,
2011
and
2010
, net gain (loss) on the sale of loans includes
$210
,
$0
and
$(204)
, respectively, related to changes during the period in the fair value of loans held for sale subject to pending agency contracts.
Presented below is a discussion of the methods and significant assumptions used by the Company to estimate fair value.
Investment Securities Available for Sale—
Investment securities available for sale are recorded at fair value on a recurring basis. At
September 30, 2012
and
2011
, respectively, this includes
$413,729
and
$7,383
of investments in U.S. government and agency obligations including U.S. Treasury notes and sequentially structured, highly liquid collateralized mortgage obligations (“CMOs”) issued by Fannie Mae, Freddie Mac, and Ginnie Mae and
$7,701
and
$8,516
of secured institutional money market deposits insured by the FDIC up to the current coverage limits, with any excess collateralized by the holding institution. Both are measured using the market approach. The fair values of treasury notes and CMOs represent unadjusted price estimates obtained from third party independent nationally recognized pricing services using pricing models or quoted prices of securities with similar characteristics and are included in Level 2 of the hierarchy. At the time of initial measurement and, subsequently, when changes in methodologies occur, management obtains and reviews documentation of pricing methodologies used by third party pricing services to verify that prices are determined in accordance with fair value guidance in U.S. GAAP and to ensure that assets are properly classified in the fair value hierarchy. Additionally, third party pricing is reviewed on a monthly basis for reasonableness based on the market knowledge and experience of company personnel that interact daily with the markets for these types of securities. The carrying amount of the money market deposit accounts is considered a reasonable estimate of their fair value because they are cash deposits in interest bearing accounts valued at par. These accounts are included in Level 1 of the hierarchy.
Mortgage Loans Held for Sale
—
The fair value of mortgage loans held for sale is estimated using a market approach based on quoted secondary market pricing for loan portfolios with similar characteristics. Loans held for sale are carried at the lower of cost or fair value except, as described above, the Company elects the fair value measurement option for mortgage loans held for sale subject to pending agency contracts to securitize and sell loans. Loans held for sale are included in Level 2 of the hierarchy. At
September 30, 2012
, there were
$3,017
of loans held for sale measured at fair value and
$121,511
of loans held for sale carried at cost. There were
no
loans held for sale at
September 30, 2011
.
Impaired Loans
—
Impaired loans represent certain loans held for investment that are subject to a fair value measurement under U.S. GAAP because they are individually evaluated for impairment and that impairment is measured using a fair value measurement, such as the observable market price of the loan or the fair value of the collateral less estimated costs to sell. Impairment is measured using the market approach based on the fair value of the collateral less estimated costs to sell for loans the Company considers to be collateral-dependent due to a delinquency status or other adverse condition severe enough to indicate that the borrower can no longer be relied upon as the continued source of repayment.These conditions are described more fully in Note 5, Loans and Allowance for Loan Losses.
The fair value of the collateral for a collateral-dependent loan is estimated using an exterior appraisal in the majority of instances. Only if supporting market data is unavailable or the appraiser is unable to complete the assignment will an alternative valuation method be used. Typically that would entail obtaining a Broker Price Opinion (“BPO”). If neither of these
128
methods is available, a commercially available automated valuation model (“AVM”) will be used to estimate value. These models are independently developed and regularly updated. The Association has engaged an independent firm to assist with the validation of automated valuation models.
Updated property valuations are obtained for all collateral-dependent impaired loans that become contractually
180
days past due, except that updated appraisals are obtained for equity lines of credit, equity loans, bridge loans, and loans modified in troubled debt restructurings that become contractually
90
days past due. Subsequently, updated appraisals are obtained at least annually for all loans that remain delinquent.
To calculate impairment of collateral-dependent loans, the fair market values are generally reduced by a calculated cost to sell derived from historical experience and recent market conditions to reflect average net proceeds. A valuation allowance is recorded by a charge to income for any indicated impairment loss. When no impairment loss is indicated, the carrying amount is considered to approximate the fair value of that loan to the Company because contractually that is the maximum recovery the Company can expect. Loans individually evaluated for impairment based on the fair value of the collateral are included in Level 3 of the hierarchy with assets measured at fair value on a non-recurring basis.
Loans held for investment that have been restructured in troubled debt restructurings and are performing according to the modified terms of the loan agreement are individually evaluated for impairment using the present value of future cash flows based on the loan’s effective interest rate, which is not a fair value measurement. At
September 30, 2012
and
2011
, respectively, this included
$137,468
and
$137,580
in recorded investment of troubled debt restructurings with related allowances for loss of
$17,602
and
$6,981
.
Real Estate Owned—
Real estate owned includes real estate acquired as a result of foreclosure or by deed in lieu of foreclosure and is carried at the lower of acquisition cost or fair value less estimated costs to sell. Fair value is estimated under the market approach using independent third party appraisals. As these properties are actively marketed, estimated fair values may be adjusted by management to reflect current economic and market conditions. At
September 30, 2012
and
2011
, respectively,
$16,131
and
$10,533
of real estate owned were included in Level 3 of the hierarchy with assets measured at fair value on a non-recurring basis because the acquisition costs exceeded the fair values less estimated costs to sell of these properties. Real estate owned, as reported in the consolidated statements of condition, includes estimated costs to sell of
$1,383
and
$446
related to properties measured at fair value and
$4,899
and
$9,068
of properties carried at their original or adjusted cost basis at
September 30, 2012
and
2011
, respectively.
Mortgage Loan Servicing Assets
—
Mortgage loan servicing assets are initially recorded at fair value and subsequently amortized over the estimated period of servicing income. The servicing assets are assessed for impairment, based on fair value, on a quarterly basis using a discounted cash flow model incorporating assumptions market participants would use including estimated prepayment speeds, discount factors, and estimated costs to service. For measurement purposes, servicing assets are separated into stratum segregated primarily by the predominant risk characteristics of the loans serviced, such as type, fixed and adjustable rates, original terms, and interest rates. When the carrying value of the servicing asset for an individual stratum exceeds the fair value, the stratum is considered impaired. The amount of impairment is recognized through a valuation allowance recorded in current earnings and the stratum is included in Level 3 of the hierarchy with assets measured at fair value on a non-recurring basis.
Land held for development
—
Land held for development includes real estate surrounding the Company’s main office in Cleveland, Ohio, acquired to preserve and redevelop the community. It is carried at the lower of acquisition cost or fair value less estimated costs to sell or develop and is included in other assets on the Consolidated Statement of Condition. Fair value is estimated under the market approach using values for comparable projects, adjusted by management to reflect current economic and market conditions. At
September 30, 2012
, land held for development is carried at its adjusted cost basis. At
September 30, 2011
there was
$111
of land held for development included in Level 3 of the hierarchy with assets measured at fair value on a non-recurring basis; the acquisition costs of these properties exceeded their fair values less estimated cost to sell or develop by
$3,000
.
Derivatives
—
Derivative instruments include interest rate locks on commitments to originate loans for the held for sale portfolio and contracts to deliver mortgage loans. Derivatives are reported at fair value in other assets or other liabilities on the Consolidated Statement of Condition with changes in value recorded in current earnings. Fair value is estimated using a market approach based on quoted secondary market pricing for loan portfolios with characteristics similar to loans underlying the derivative instruments. The fair value of interest rate lock commitments is adjusted by a closure rate based on the estimated percentage of commitments that will result in closed loans. A significant change in the closure rate may result in a significant change in the ending fair value measurement of these derivatives relative to their total fair value. Because the closure rate is a significantly unobservable assumption, interest rate lock commitments are included in Level 3 of the hierarchy. Contracts to deliver mortgage-backed securities are included in Level 2 of the hierarchy.
129
Assets and liabilities carried at fair value on a recurring basis on the consolidated statements of condition at
September 30, 2012
and
September 30, 2011
are summarized below.
|
|
|
Recurring Fair Value Measurements at Reporting Date Using
|
|||||||||||||
|
|
September 30,
2012 |
Quoted Prices in
Active Markets for
Identical Assets
(Level 1)
|
Significant Other
Observable Inputs
(Level 2)
|
Significant
Unobservable
Inputs
(Level 3)
|
|||||||||||
|
Assets
|
|||||||||||||||
|
Investment securities available for sale:
|
|||||||||||||||
|
U.S. government and agency obligations
|
$
|
2,056
|
|
$
|
—
|
|
$
|
2,056
|
|
$
|
—
|
|
|||
|
Freddie Mac certificates
|
989
|
|
—
|
|
989
|
|
—
|
|
|||||||
|
Ginnie Mae certificates
|
16,786
|
|
—
|
|
16,786
|
|
—
|
|
|||||||
|
REMIC’s
|
386,009
|
|
—
|
|
386,009
|
|
—
|
|
|||||||
|
Fannie Mae certificates
|
7,889
|
|
—
|
|
7,889
|
|
—
|
|
|||||||
|
Money market accounts
|
7,701
|
|
7,701
|
|
—
|
|
—
|
|
|||||||
|
Mortgage loans held for sale
|
3,017
|
|
—
|
|
3,017
|
|
—
|
|
|||||||
|
Derivatives:
|
|||||||||||||||
|
Interest rate lock commitments
|
404
|
|
—
|
|
—
|
|
404
|
|
|||||||
|
Total
|
$
|
424,851
|
|
$
|
7,701
|
|
$
|
416,746
|
|
$
|
404
|
|
|||
|
Liabilities
|
|||||||||||||||
|
Derivatives:
|
|||||||||||||||
|
Forward commitments for the sale of mortgage loans
|
$
|
243
|
|
$
|
—
|
|
$
|
243
|
|
$
|
—
|
|
|||
|
Total
|
$
|
243
|
|
$
|
—
|
|
$
|
243
|
|
$
|
—
|
|
|||
|
|
|
Recurring Fair Value Measurements at Reporting Date Using
|
|||||||||||||
|
|
September 30,
2011 |
Quoted Prices in
Active Markets for
Identical Assets
(Level 1)
|
Significant Other
Observable Inputs
(Level 2)
|
Significant
Unobservable
Inputs
(Level 3)
|
|||||||||||
|
Assets
|
|||||||||||||||
|
Investment securities available for sale:
|
|||||||||||||||
|
U.S. government and agency obligations
|
$
|
2,046
|
|
$
|
—
|
|
$
|
2,046
|
|
$
|
—
|
|
|||
|
REMIC’s
|
5,337
|
|
—
|
|
5,337
|
|
—
|
|
|||||||
|
Money market accounts
|
8,516
|
|
8,516
|
|
—
|
|
—
|
|
|||||||
|
Total
|
$
|
15,899
|
|
$
|
8,516
|
|
$
|
7,383
|
|
$
|
—
|
|
|||
The table below presents a reconciliation of the beginning and ending balances of derivative instruments measured at fair value on a recurring basis using significant unobservable inputs (Level 3).
|
Interest Rate Lock Commitments
|
|||||||||||
|
Year Ended September 30,
|
|||||||||||
|
2012
|
2011
|
2010
|
|||||||||
|
Beginning balance
|
$
|
—
|
|
$
|
—
|
|
$
|
318
|
|
||
|
Total gains (losses) for the period:
|
|||||||||||
|
Included in earnings
|
404
|
|
—
|
|
(318
|
)
|
|||||
|
Ending balance
|
$
|
404
|
|
$
|
—
|
|
$
|
—
|
|
||
|
Change in unrealized gains for the period included in earnings for
assets held at end of the reporting date
|
$
|
404
|
|
$
|
—
|
|
$
|
—
|
|
||
130
The table below summarizes the classification of gains and losses recorded in earnings due to changes in fair value for derivative instruments measured at fair value on a recurring basis using significant unobservable inputs.
|
Interest Rate Lock Commitments
|
|||||||||||
|
Year Ended September 30,
|
|||||||||||
|
2012
|
2011
|
2010
|
|||||||||
|
Classification of gains (losses) in earnings:
|
|||||||||||
|
Other income
|
$
|
404
|
|
$
|
—
|
|
$
|
(318
|
)
|
||
|
Total gains
|
$
|
404
|
|
$
|
—
|
|
$
|
(318
|
)
|
||
Summarized in the table below are those assets measured at fair value on a nonrecurring basis. This includes loans held for investment that are individually evaluated for impairment, excluding performing troubled debt restructurings valued using the present value of cash flow method, land held for development that is carried at lower of acquisition cost or fair value less estimated cost to sell or develop, and properties included in real estate owned that are carried at fair value less estimated costs to sell at the reporting date.
|
|
|
Nonrecurring Fair Value Measurements at Reporting Date Using
|
|||||||||||||
|
|
September 30,
2012 |
Quoted Prices in
Active Markets for
Identical Assets
(Level 1)
|
Significant Other
Observable Inputs
(Level 2)
|
Significant
Unobservable
Inputs
(Level 3)
|
|||||||||||
|
Impaired loans, net of allowance
|
$
|
159,069
|
|
$
|
—
|
|
$
|
—
|
|
$
|
159,069
|
|
|||
|
Real estate owned
(1)
|
16,131
|
|
—
|
|
—
|
|
16,131
|
|
|||||||
|
Total
|
$
|
175,200
|
|
$
|
—
|
|
$
|
—
|
|
$
|
175,200
|
|
|||
______________________
(1) Amounts represent fair value measurements of properties before deducting estimated costs to sell.
|
|
|
Nonrecurring Fair Value Measurements at Reporting Date Using
|
|||||||||||||
|
|
September 30,
2011 |
Quoted Prices in
Active Markets for
Identical Assets
(Level 1)
|
Significant Other
Observable Inputs
(Level 2)
|
Significant
Unobservable
Inputs
(Level 3)
|
|||||||||||
|
Impaired loans, net of allowance
|
$
|
145,698
|
|
$
|
—
|
|
$
|
—
|
|
$
|
145,698
|
|
|||
|
Real estate owned
(1)
|
10,533
|
|
—
|
|
—
|
|
10,533
|
|
|||||||
|
Land held for development
|
111
|
|
—
|
|
—
|
|
111
|
|
|||||||
|
Total
|
$
|
156,342
|
|
$
|
—
|
|
$
|
—
|
|
$
|
156,342
|
|
|||
______________________
(1) Amounts represent fair value measurements of properties before deducting estimated costs to sell.
The following provides quantitative information about significant unobservable inputs categorized within Level 3 of the Fair Value Hierarchy.
|
Fair Value
|
Weighted
|
|||||||||||
|
9/30/2012
|
Valuation Technique(s)
|
Unobservable Input
|
Range
|
Average
|
||||||||
|
Impaired loans, net of allowance
|
$159,069
|
Market comparables of collateral discounted to estimated net proceeds
|
Discount appraised value to estimated net proceeds based on historical experience:
|
|||||||||
|
• Residential Properties
|
0
|
-
|
24%
|
10.5%
|
||||||||
|
Real Estate
Owned |
$16,131
|
Market comparables, adjusted to reflect current economic and market conditions.
|
Discount on appraised value for recent market conditions:
|
|||||||||
|
• Properties appraised $0 to $50
|
0
|
-
|
59%
|
25.3%
|
||||||||
|
• Properties appraised greater than $50
|
0
|
-
|
41%
|
9.7%
|
||||||||
|
Interest rate lock commitments
|
$404
|
Quoted Secondary Market pricing
|
Closure rate
|
0
|
-
|
100%
|
56.0%
|
|||||
131
The following table presents the estimated fair value of the Company’s financial instruments. The estimated fair value amounts have been determined by the Company using available market information and appropriate valuation methodologies. However, considerable judgment is required to interpret market data to develop the estimates of fair value. Accordingly, the estimates presented herein are not necessarily indicative of the amounts the Company could realize in a current market exchange. The use of different market assumptions and/or estimation methodologies may have a material effect on the estimated fair value amounts.
|
September 30, 2012
|
|||||||||||||||||||
|
Carrying
|
Estimated Fair Value
|
||||||||||||||||||
|
Amount
|
Total
|
Level 1
|
Level 2
|
Level 3
|
|||||||||||||||
|
Assets:
|
|||||||||||||||||||
|
Cash and due from banks
|
$
|
38,914
|
|
$
|
38,914
|
|
$
|
38,914
|
|
$
|
—
|
|
$
|
—
|
|
||||
|
Other interest bearing cash equivalents
|
269,348
|
|
269,348
|
|
269,348
|
|
—
|
|
—
|
|
|||||||||
|
Investment securities:
|
|||||||||||||||||||
|
Available for sale
|
421,430
|
|
421,430
|
|
7,701
|
|
413,729
|
|
—
|
|
|||||||||
|
Mortgage loans held for sale
|
124,528
|
|
129,358
|
|
—
|
|
129,358
|
|
|
||||||||||
|
Loans-net:
|
|||||||||||||||||||
|
Mortgage loans held for investment
|
10,220,377
|
|
10,630,220
|
|
—
|
|
—
|
|
10,630,220
|
|
|||||||||
|
Other loans
|
4,612
|
|
4,957
|
|
—
|
|
—
|
|
4,957
|
|
|||||||||
|
Federal Home Loan Bank stock
|
35,620
|
|
35,620
|
|
N/A
|
|
—
|
|
—
|
|
|||||||||
|
Private equity investments
|
944
|
|
944
|
|
—
|
|
—
|
|
944
|
|
|||||||||
|
Accrued interest receivable
|
34,887
|
|
34,887
|
|
—
|
|
34,887
|
|
—
|
|
|||||||||
|
Derivatives
|
404
|
|
404
|
|
—
|
|
—
|
|
404
|
|
|||||||||
|
Liabilities:
|
|||||||||||||||||||
|
NOW and passbook accounts
|
$
|
2,783,420
|
|
$
|
2,783,420
|
|
$
|
—
|
|
$
|
2,783,420
|
|
$
|
—
|
|
||||
|
Certificates of deposit
|
6,197,999
|
|
6,353,376
|
|
—
|
|
6,353,376
|
|
—
|
|
|||||||||
|
Borrowed funds
|
488,191
|
|
490,880
|
|
—
|
|
490,880
|
|
—
|
|
|||||||||
|
Borrowers’ advances for taxes and insurance
|
67,864
|
|
67,864
|
|
—
|
|
67,864
|
|
—
|
|
|||||||||
|
Principal, interest and escrow owed on loans
serviced
|
127,539
|
|
127,539
|
|
—
|
|
127,539
|
|
—
|
|
|||||||||
|
Derivatives
|
243
|
|
243
|
|
—
|
|
243
|
|
—
|
|
|||||||||
132
|
September 30, 2011
|
|||||||||||||||||||
|
Carrying
|
Estimated Fair Value
|
||||||||||||||||||
|
Amount
|
Total
|
Level 1
|
Level 2
|
Level 3
|
|||||||||||||||
|
Assets:
|
|||||||||||||||||||
|
Cash and due from banks
|
$
|
35,532
|
|
$
|
35,532
|
|
$
|
35,532
|
|
$
|
—
|
|
$
|
—
|
|
||||
|
Other interest bearing cash equivalents
|
259,314
|
|
259,314
|
|
259,314
|
|
—
|
|
—
|
|
|||||||||
|
Investment securities:
|
|||||||||||||||||||
|
Available for sale
|
15,899
|
|
15,899
|
|
8,516
|
|
7,383
|
|
—
|
|
|||||||||
|
Held to maturity
|
392,527
|
|
398,725
|
|
—
|
|
398,725
|
|
—
|
|
|||||||||
|
Loans-net:
|
|||||||||||||||||||
|
Mortgage loans held for investment
|
9,744,075
|
|
9,953,386
|
|
—
|
|
—
|
|
9,953,386
|
|
|||||||||
|
Other loans
|
6,868
|
|
7,597
|
|
—
|
|
—
|
|
7,597
|
|
|||||||||
|
Federal Home Loan Bank stock
|
35,620
|
|
—
|
|
N/A
|
|
—
|
|
—
|
|
|||||||||
|
Private equity investments
|
1,604
|
|
1,604
|
|
—
|
|
—
|
|
1,604
|
|
|||||||||
|
Accrued interest receivable
|
35,854
|
|
35,854
|
|
—
|
|
35,854
|
|
—
|
|
|||||||||
|
Liabilities:
|
|||||||||||||||||||
|
NOW and passbook accounts
|
$
|
2,657,029
|
|
$
|
2,657,029
|
|
$
|
—
|
|
$
|
2,657,029
|
|
$
|
—
|
|
||||
|
Certificates of deposit
|
6,058,881
|
|
6,248,137
|
|
—
|
|
6,248,137
|
|
—
|
|
|||||||||
|
Borrowed funds
|
139,856
|
|
142,889
|
|
—
|
|
142,889
|
|
—
|
|
|||||||||
|
Borrowers’ advances for taxes and insurance
|
58,235
|
|
58,235
|
|
—
|
|
58,235
|
|
—
|
|
|||||||||
|
Principal, interest and escrow owed on loans serviced
|
151,859
|
|
151,859
|
|
—
|
|
151,859
|
|
—
|
|
|||||||||
Cash and Due from Banks, Interest Bearing Cash Equivalents
—The carrying amount is a reasonable estimate of fair value.
Investment and Mortgage-Backed Securities
—Estimated fair value for investment and mortgage-backed securities is based on quoted market prices, when available. If quoted prices are not available, management will use as part of their estimation process fair values which are obtained from third party independent nationally recognized pricing services using pricing models, quoted prices of securities with similar characteristics, or discounted cash flows.
Loans
—
For mortgage loans held for investment and other loans, fair value is estimated by discounting contractual cash flows adjusted for prepayment estimates using the current rates at which similar loans would be made to borrowers with similar credit ratings and for the same remaining term. The use of current rates to discount cash flows reflects current market expectations with respect to credit exposure. Inputs and valuation techniques used to estimate the fair value of loans held for sale and impaired loans is described earlier in this note.
Federal Home Loan Bank Stock
—It is not practical to estimate the fair value of FHLB stock due to restrictions on its transferability. The fair value is estimated to be the carrying value, which is par. All transactions in capital stock of the FHLB Cincinnati are executed at par.
Private Equity Investments
—Private equity investments are initially valued based upon transaction price. The carrying value is subsequently adjusted when it is considered necessary based on current performance and market conditions. The carrying values are adjusted to reflect expected exit values. These investments are included in Other assets in the accompanying statements of condition at fair value.
Deposits
—The fair value of demand deposit accounts is the amount payable on demand at the reporting date. The fair value of fixed-maturity certificates of deposit is estimated using discounted cash flows and rates currently offered for deposits of similar remaining maturities.
Borrowed Funds
—Estimated fair value for borrowed funds is estimated using discounted cash flows and rates currently charged for borrowings of similar remaining maturities.
Accrued Interest Receivable, Borrowers’ Advances for Insurance and Taxes, and Principal, Interest and Escrow Owed on Loans Serviced
—The carrying amount is a reasonable estimate of fair value.
133
17. DERIVATIVE INSTRUMENTS
The Company has entered into forward commitments for the sale of mortgage loans principally to protect against the risk of adverse interest rate movements on net income. The Company recognizes the fair value of the contracts when the characteristics of those contracts meet the definition of a derivative. These derivatives are not designated in a hedging relationship; therefore, gains and losses are recognized immediately in the statement of income. In addition, the Company has entered into commitments to originate loans, which when funded, were classified as held for sale. Such commitments meet the definition of a derivative and are not designated in a hedging relationship; therefore, gains and losses are recognized immediately in the statement of income. The Company had
no
derivative instruments at
September 30, 2011
. The Company had
no
derivatives designated as hedging instruments ASC 815, “Derivatives and Hedging,” at
September 30, 2012
or
2011
.
The following tables provide the locations within the Consolidated Statements of Condition and the fair values for derivatives not designated as hedging instruments.
|
Asset Derivatives
|
|||||||||||
|
|
At September 30, 2012
|
At September 30, 2011
|
|||||||||
|
|
Location
|
Fair Value
|
Location
|
Fair Value
|
|||||||
|
Interest rate lock commitments
|
Other Assets
|
$
|
404
|
|
Other Assets
|
$
|
—
|
|
|||
|
Liability Derivatives
|
|||||||||||
|
|
At September 30, 2012
|
At September 30, 2011
|
|||||||||
|
|
Location
|
Fair Value
|
Location
|
Fair Value
|
|||||||
|
Forward commitments for the sale of mortgage loans
|
Other Liabilities
|
$
|
243
|
|
Other Liabilities
|
$
|
—
|
|
|||
The following table summarizes the location and amount of the gains and losses on derivative instruments not designated as hedging instruments.
|
|
Location of Gain or (Loss)
Recognized in Income
|
Amount of Gain or (Loss) Recognized
in Income on Derivative
|
|||||||||||
|
|
Year Ended September 30,
|
||||||||||||
|
|
2012
|
2011
|
2010
|
||||||||||
|
Interest rate lock commitments
|
Other income
|
$
|
404
|
|
$
|
—
|
|
$
|
(318
|
)
|
|||
|
Forward commitments for the sale of mortgage loans
|
Net gain (loss) on the sale of loans
|
(243
|
)
|
—
|
|
204
|
|
||||||
|
Total
|
$
|
161
|
|
$
|
—
|
|
$
|
(114
|
)
|
||||
134
18. PARENT COMPANY ONLY FINANCIAL STATEMENTS
The following condensed financial statements for TFS Financial Corporation (parent company only) reflect the investments in, and transactions with, its wholly-owned subsidiaries. Intercompany activity is eliminated in the consolidated financial statements.
|
|
September 30,
|
||||||
|
|
2012
|
2011
|
|||||
|
Statements of Condition
|
|||||||
|
Assets:
|
|||||||
|
Cash and due from banks
|
$
|
1,706
|
|
$
|
1,063
|
|
|
|
Mortgage backed securities—available for sale
|
390
|
|
1,028
|
|
|||
|
Mortgage loans held for investment
|
—
|
|
42
|
|
|||
|
Other loans:
|
|||||||
|
Demand loan due from Third Federal Savings and Loan
|
164,515
|
|
156,979
|
|
|||
|
Employee Stock Ownership Plan (ESOP) loan receivable
|
79,381
|
|
82,591
|
|
|||
|
Accrued interest receivable
|
1,933
|
|
2,012
|
|
|||
|
Investments in:
|
|||||||
|
Third Federal Savings and Loan
|
1,526,125
|
|
1,495,666
|
|
|||
|
Non-thrift subsidiaries
|
77,496
|
|
77,016
|
|
|||
|
Prepaid federal and state taxes
|
1,267
|
|
490
|
|
|||
|
Deferred income taxes
|
1,534
|
|
2,063
|
|
|||
|
Other assets
|
4,945
|
|
4,931
|
|
|||
|
Total assets
|
$
|
1,859,292
|
|
$
|
1,823,881
|
|
|
|
Liabilities and shareholders’ equity:
|
|||||||
|
Line of credit due non-thrift subsidiary
|
$
|
51,172
|
|
$
|
48,752
|
|
|
|
Accrued expenses and other liabilities
|
1,270
|
|
1,205
|
|
|||
|
Total liabilities
|
52,442
|
|
49,957
|
|
|||
|
Preferred stock, $0.01 par value, 100,000,000 shares authorized, none issued and outstanding
|
—
|
|
—
|
|
|||
|
Common stock, $0.01 par value, 700,000,000 shares authorized; 332,318,750 shares issued; 309,009,393 and 308,915,893 outstanding at September 30, 2012 and September 30, 2011, respectively
|
3,323
|
|
3,323
|
|
|||
|
Paid-in capital
|
1,691,884
|
|
1,686,216
|
|
|||
|
Treasury stock, at cost; 23,309,357 and 23,402,857 shares at September 30, 2012 and September 30, 2011, respectively
|
(280,937
|
)
|
(282,090
|
)
|
|||
|
Unallocated ESOP shares
|
(74,751
|
)
|
(79,084
|
)
|
|||
|
Retained earnings—substantially restricted
|
473,247
|
|
461,836
|
|
|||
|
Accumulated other comprehensive loss
|
(5,916
|
)
|
(16,277
|
)
|
|||
|
Total shareholders’ equity
|
1,806,850
|
|
1,773,924
|
|
|||
|
Total liabilities and shareholders’ equity
|
$
|
1,859,292
|
|
$
|
1,823,881
|
|
|
135
|
|
Years Ended September 30,
|
||||||||||
|
|
2012
|
2011
|
2010
|
||||||||
|
Statements of Income
|
|||||||||||
|
Interest income:
|
|||||||||||
|
Loans, including amortization of deferred costs
|
$
|
3
|
|
$
|
5
|
|
$
|
5
|
|
||
|
Demand loan due from Third Federal Savings and Loan
|
164
|
|
203
|
|
432
|
|
|||||
|
ESOP loan
|
2,608
|
|
2,710
|
|
2,820
|
|
|||||
|
Mortgage backed securities—available for sale
|
6
|
|
11
|
|
3
|
|
|||||
|
Investment securities—available for sale
|
—
|
|
—
|
|
35
|
|
|||||
|
Total interest income
|
2,781
|
|
2,929
|
|
3,295
|
|
|||||
|
Interest expense:
|
|||||||||||
|
Borrowed funds from non-thrift subsidiaries
|
107
|
|
208
|
|
290
|
|
|||||
|
Total interest expense
|
107
|
|
208
|
|
290
|
|
|||||
|
Net interest income
|
2,674
|
|
2,721
|
|
3,005
|
|
|||||
|
Non-interest income:
|
|||||||||||
|
Intercompany service charges
|
600
|
|
600
|
|
600
|
|
|||||
|
Other
|
—
|
|
—
|
|
3
|
|
|||||
|
Total other income
|
600
|
|
600
|
|
603
|
|
|||||
|
Non-interest expenses:
|
|||||||||||
|
Salaries and employee benefits
|
4,981
|
|
5,411
|
|
4,607
|
|
|||||
|
Professional services
|
980
|
|
972
|
|
645
|
|
|||||
|
Office property and equipment
|
13
|
|
13
|
|
13
|
|
|||||
|
Other operating expenses
|
20
|
|
68
|
|
330
|
|
|||||
|
Total non-interest expenses
|
5,994
|
|
6,464
|
|
5,595
|
|
|||||
|
Loss before income taxes
|
(2,720
|
)
|
(3,143
|
)
|
(1,987
|
)
|
|||||
|
Income tax (benefit) expense
|
(1,951
|
)
|
(304
|
)
|
696
|
|
|||||
|
Loss before undistributed earnings of subsidiaries
|
(769
|
)
|
(2,839
|
)
|
(2,683
|
)
|
|||||
|
Equity in undistributed earnings of subsidiaries:
|
|||||||||||
|
Third Federal Savings and Loan
|
11,769
|
|
8,327
|
|
11,933
|
|
|||||
|
Non-thrift subsidiaries
|
479
|
|
3,852
|
|
2,088
|
|
|||||
|
Net income
|
$
|
11,479
|
|
$
|
9,340
|
|
$
|
11,338
|
|
||
136
|
|
Years Ended September 30,
|
||||||||||
|
|
2012
|
2011
|
2010
|
||||||||
|
Statements of Cash Flows
|
|||||||||||
|
Cash flows from operating activities:
|
|||||||||||
|
Net income
|
$
|
11,479
|
|
$
|
9,340
|
|
$
|
11,338
|
|
||
|
Adjustments to reconcile net income to net cash provided by operating activities:
|
|||||||||||
|
Equity in undistributed earnings of subsidiaries:
|
|||||||||||
|
Third Federal Savings and Loan
|
(11,769
|
)
|
(8,327
|
)
|
(11,933
|
)
|
|||||
|
Non-thrift subsidiaries
|
(479
|
)
|
(3,852
|
)
|
(2,088
|
)
|
|||||
|
Deferred income taxes
|
530
|
|
1,432
|
|
3,781
|
|
|||||
|
Stock-based compensation expense
|
2,787
|
|
3,372
|
|
2,632
|
|
|||||
|
Excess tax benefit deficiency related to stock-based compensation
|
—
|
|
(230
|
)
|
—
|
|
|||||
|
Net (increase) decrease in interest receivable and other assets
|
(712
|
)
|
(364
|
)
|
593
|
|
|||||
|
Net increase in accrued expenses and other liabilities
|
65
|
|
561
|
|
77
|
|
|||||
|
Other
|
(6
|
)
|
46
|
|
10
|
|
|||||
|
Net cash provided by operating activities
|
1,895
|
|
1,978
|
|
4,410
|
|
|||||
|
Cash flows from investing activities:
|
|||||||||||
|
Principal collected on loans, net of originations
|
42
|
|
4
|
|
4
|
|
|||||
|
Proceeds from principal repayments and maturities of securities available for sale
|
612
|
|
846
|
|
4,164
|
|
|||||
|
Purchase of securities available for sale
|
—
|
|
—
|
|
(4,094
|
)
|
|||||
|
(Increase) decrease in balances lent to Third Federal Savings and Loan
|
(7,536
|
)
|
143,422
|
|
4,324
|
|
|||||
|
Capital contributions to insured thrift institution subsidiaries
|
—
|
|
(150,000
|
)
|
—
|
|
|||||
|
Net cash (used in) provided by investing activities
|
(6,882
|
)
|
(5,728
|
)
|
4,398
|
|
|||||
|
Cash flows from financing activities:
|
|||||||||||
|
Principal reduction of ESOP loan
|
3,210
|
|
3,109
|
|
4,236
|
|
|||||
|
Purchase of treasury shares
|
—
|
|
—
|
|
(1,810
|
)
|
|||||
|
Dividends paid to common stockholders
|
—
|
|
—
|
|
(15,561
|
)
|
|||||
|
Excess tax effect related to stock-based compensation
|
—
|
|
—
|
|
57
|
|
|||||
|
Net increase in borrowings from non-thrift subsidiaries
|
2,420
|
|
1,506
|
|
4,375
|
|
|||||
|
Net cash provided by (used in) financing activities
|
5,630
|
|
4,615
|
|
(8,703
|
)
|
|||||
|
Net increase in cash and cash equivalents
|
643
|
|
865
|
|
105
|
|
|||||
|
Cash and cash equivalents—beginning of year
|
1,063
|
|
198
|
|
93
|
|
|||||
|
Cash and cash equivalents—end of year
|
$
|
1,706
|
|
$
|
1,063
|
|
$
|
198
|
|
||
19. EARNINGS PER SHARE
Basic earnings per share is the amount of earnings available to each share of common stock outstanding during the reporting period. Diluted earnings per share is the amount of earnings available to each share of common stock outstanding during the reporting period adjusted to include the effect of potentially dilutive common shares. For purposes of computing earnings per share amounts, outstanding shares include shares held by the public, shares held by the ESOP that have been allocated to participants or committed to be released for allocation to participants, the
227,119,132
shares held by Third Federal Savings, MHC, and, for purposes of computing dilutive earnings per share, stock options and restricted stock units with a dilutive impact. At
September 30, 2012
and
2011
, respectively, the ESOP held
7,475,110
and
7,908,450
shares that were neither allocated to participants nor committed to be released to participants.
137
The following is a summary of the Company’s earnings per share calculations.
|
|
For the Year Ended September 30, 2012
|
|||||||||
|
|
Income
|
Shares
|
Per share
amount
|
|||||||
|
|
(Dollars in thousands, except per share data)
|
|||||||||
|
Net income
|
$
|
11,479
|
|
|||||||
|
Less: income allocated to restricted stock units
|
60
|
|
||||||||
|
Basic earnings per share:
|
||||||||||
|
Income available to common shareholders
|
11,419
|
|
301,226,639
|
|
$
|
0.04
|
|
|||
|
Diluted earnings per share:
|
||||||||||
|
Effect of dilutive potential common shares
|
543,699
|
|
||||||||
|
Income available to common shareholders
|
$
|
11,419
|
|
301,770,338
|
|
$
|
0.04
|
|
||
|
|
For the Year Ended September 30, 2011
|
|||||||||
|
|
Income
|
Shares
|
Per share
amount
|
|||||||
|
|
(Dollars in thousands, except per share data)
|
|||||||||
|
Net income
|
$
|
9,340
|
|
|||||||
|
Less: income allocated to restricted stock units
|
50
|
|
||||||||
|
Basic earnings per share:
|
||||||||||
|
Income available to common shareholders
|
9,290
|
|
300,358,096
|
|
$
|
0.03
|
|
|||
|
Diluted earnings per share:
|
||||||||||
|
Effect of dilutive potential common shares
|
611,748
|
|
||||||||
|
Income available to common shareholders
|
$
|
9,290
|
|
300,969,844
|
|
$
|
0.03
|
|
||
|
|
For the Year Ended September 30, 2010
|
|||||||||
|
|
Income
|
Shares
|
Per share
amount
|
|||||||
|
|
(Dollars in thousands, except per share data)
|
|||||||||
|
Net income
|
$
|
11,338
|
|
|||||||
|
Less: income allocated to restricted stock units
|
334
|
|
||||||||
|
Basic earnings per share:
|
||||||||||
|
Income available to common shareholders
|
11,004
|
|
299,795,588
|
|
$
|
0.04
|
|
|||
|
Diluted earnings per share:
|
||||||||||
|
Effect of dilutive potential common shares
|
457,325
|
|
||||||||
|
Income available to common shareholders
|
$
|
11,004
|
|
300,252,913
|
|
$
|
0.04
|
|
||
Outstanding stock options and restricted stock units are excluded from the computation of diluted earnings per share when their inclusion would be anti-dilutive.The following is a summary of outstanding stock options and restricted stock units that are excluded from the computation of diluted earnings per share because their inclusion would be anti-dilutive.
|
|
For the Year Ended September 30,
|
|||||||
|
|
2012
|
2011
|
2010
|
|||||
|
Options to purchase shares
|
6,199,591
|
|
5,005,925
|
|
5,030,925
|
|
||
|
Restricted stock units
|
30,000
|
|
—
|
|
—
|
|
||
20. RELATED PARTY TRANSACTIONS
The Company, through an indirect, majority-owned subsidiary, receives real estate and management services from an
138
entity under the control of a former Director. His directorship ended February 25, 2010. Management fees of
$635
,
$694
, and
$693
were paid to the entity under the control of the former Director for the years ended
September 30, 2012
,
2011
, and
2010
, respectively.
The Company has made loans and extensions of credit, in the ordinary course of business, to certain Directors. These loans were under normal credit terms, including interest rate and collateralization, and do not represent more than the normal risk of collection. The aggregate amount of loans to such related parties at
September 30, 2012
and
2011
was
$213
and
$1,030
, respectively.
None
of these loans were past due, considered impaired or on nonaccrual at
September 30, 2012
.
21. RECENT ACCOUNTING PRONOUNCEMENTS
Pending as of
September 30, 2012
FASB Accounting Standards Update (“ASU”) 2011-12, “Comprehensive Income (Topic 220), Deferral of the Effective Date for Amendments to the Presentation of Reclassifications of Items Out of Accumulated Other Comprehensive Income in Accounting Standards Update No. 2011-05” defers indefinitely the provisions of FASB ASU 2011-05 that require entities to present reclassification adjustments for items that are reclassified from other comprehensive income (“OCI”) to net income by component in both the statement in which net income is presented and the statement in which OCI is presented. The only impact of these amendments on the Company's consolidated financial statements would be a change in the presentation of OCI.
FASB ASU 2011-05, “Presentation of Comprehensive Income” eliminates the option to present OCI in the statement of shareholders' equity and provides an entity the option to present the total of comprehensive income, the components of net income, and the components of OCI either in a single continuous statement of comprehensive income or in two separate but consecutive statements. In both choices, an entity is required to present each component of net income along with total net income, each component of OCI along with a total for OCI, and a total amount for comprehensive income. Regardless of whether an entity chooses to present comprehensive income in a single continuous statement or in two separate but consecutive statements, the entity is required to present on the face of the financial statements reclassification adjustments for items that are reclassified from OCI to net income in the statement(s). The amendments in this update will be applied retrospectively for all periods presented and are effective for the Company for the interim and annual periods beginning October 1, 2012, with early adoption permitted. The only impact of these amendments on the Company's consolidated financial statements will be a change in the presentation of OCI.
FASB ASU 2011-08, “Intangibles - Goodwill and Other (Topic 350): Testing Goodwill for Impairment” was issued in September 2011 to reduce the cost and complexity of performing the first step of the two-step goodwill impairment test. This amendment permits an entity to first assess qualitative factors to determine whether the existence of events or circumstances leads to a more likely than not (more than
50%
likelihood) outcome that the fair value of the reporting unit is less than its carrying amount. The performance of the two-step impairment test becomes unnecessary if, after assessing the totality of events and circumstances, the entity determines that it is not more likely than not that the fair value of the reporting unit is less than its carrying amount. The amendment is effective for fiscal years beginning after December 15, 2011, with early adoption permitted. The Company is adopting this guidance for the fiscal year beginning October 1, 2012. The adoption of this guidance is not expected to have a material impact on the Company's consolidated financial statements.
Adopted in fiscal year ended
September 30, 2012
FASB ASU 2011-04, “Amendments to Achieve Common Fair Value Measurement and Disclosure Requirements in U.S. GAAP and IFRS” eliminates unnecessary wording differences between U.S. GAAP and International Financial Reporting Standards, clarifies the intent of existing fair value measurements, and expands disclosure requirements. ASU 2011-04 indicates that the highest and best use and valuation premise in a fair value measurement only apply to nonfinancial assets. In addition, ASU 2011-04 expands qualitative and quantitative fair value disclosures including those related to descriptions of valuation processes used, the sensitivity of the fair value to changes in unobservable inputs and the interrelationships between those inputs, and quantitative disclosures about unobservable inputs and assumptions. The amendments in ASU 2011-04 are effective for interim and annual reporting periods beginning after December 15, 2011. The adoption of this guidance did not have a material impact on the Company's consolidated financial statements. The new and amended disclosures are included in Note 10, Fair Value.
FASB ASU 2011-03, “Reconsideration of Effective Control for Repurchase Agreements” eliminates from U.S. GAAP the requirement for entities to consider whether a transferor (i.e., seller) has the ability to repurchase the financial assets in a repurchase agreement (“repo”). This requirement was one of the criteria under ASC 860 that entities used to determine whether the transferor maintained effective control. Although entities must consider all the effective control criteria under ASC 860, the elimination of this requirement may lead to more conclusions that a repurchase arrangement should be accounted for as a
139
secured borrowing rather than as a sale. The amendments in ASU 2011-03 are effective for interim and annual reporting periods beginning after December 15, 2011. The adoption of this guidance did not have a material impact on the Company's consolidated financial statements.
The Company has determined that all other recently issued accounting pronouncements will not have a material impact on the Company's consolidated financial statements or do not apply to its operations.
22. SELECTED QUARTERLY DATA (UNAUDITED)
The following tables are a summary of certain quarterly financial data for the fiscal years ended
September 30, 2012
and
2011
.
|
|
Fiscal 2012 Quarter Ended
|
||||||||||||||
|
|
December 31
|
March 31
|
June 30
|
September 30
|
|||||||||||
|
|
(In thousands, except per share data)
|
||||||||||||||
|
Interest income
|
$
|
105,535
|
|
$
|
104,818
|
|
$
|
104,225
|
|
$
|
103,275
|
|
|||
|
Interest expense
|
41,280
|
|
39,033
|
|
38,361
|
|
36,972
|
|
|||||||
|
Net interest income
|
64,255
|
|
65,785
|
|
65,864
|
|
66,303
|
|
|||||||
|
Provision for loan losses
|
15,000
|
|
27,000
|
|
31,000
|
|
29,000
|
|
|||||||
|
Net interest income after provision for loan losses
|
49,255
|
|
38,785
|
|
34,864
|
|
37,303
|
|
|||||||
|
Non-interest income
|
5,709
|
|
6,411
|
|
6,311
|
|
5,963
|
|
|||||||
|
Non-interest expense
|
42,479
|
|
43,320
|
|
40,742
|
|
44,448
|
|
|||||||
|
Earnings (loss) before income tax
|
12,485
|
|
1,876
|
|
433
|
|
(1,182
|
)
|
|||||||
|
Income tax expense (benefit)
|
4,026
|
|
854
|
|
(459
|
)
|
(2,288
|
)
|
|||||||
|
Net earnings
|
$
|
8,459
|
|
$
|
1,022
|
|
$
|
892
|
|
$
|
1,106
|
|
|||
|
Earnings per share—basic and diluted
|
$
|
0.03
|
|
$
|
—
|
|
$
|
—
|
|
$
|
—
|
|
|||
|
|
Fiscal 2011 Quarter Ended
|
||||||||||||||
|
|
December 31
|
March 31
|
June 30
|
September 30
|
|||||||||||
|
|
(In thousands, except per share data)
|
||||||||||||||
|
Interest income
|
$
|
107,441
|
|
$
|
105,733
|
|
$
|
107,286
|
|
$
|
107,033
|
|
|||
|
Interest expense
|
47,755
|
|
44,832
|
|
44,241
|
|
43,017
|
|
|||||||
|
Net interest income
|
59,686
|
|
60,901
|
|
63,045
|
|
64,016
|
|
|||||||
|
Provision for loan losses
|
34,500
|
|
22,500
|
|
22,500
|
|
19,000
|
|
|||||||
|
Net interest income after provision for loan losses
|
25,186
|
|
38,401
|
|
40,545
|
|
45,016
|
|
|||||||
|
Non-interest income
|
6,819
|
|
8,267
|
|
8,759
|
|
7,137
|
|
|||||||
|
Non-interest expense
|
42,944
|
|
43,975
|
|
39,552
|
|
41,584
|
|
|||||||
|
(Loss) earnings before income tax
|
(10,939
|
)
|
2,693
|
|
9,752
|
|
10,569
|
|
|||||||
|
Income tax (benefit) expense
|
(3,591
|
)
|
469
|
|
3,767
|
|
2,090
|
|
|||||||
|
Net (loss) earnings
|
$
|
(7,348
|
)
|
$
|
2,224
|
|
$
|
5,985
|
|
$
|
8,479
|
|
|||
|
(Loss) earnings per share—basic and diluted
|
$
|
(0.02
|
)
|
$
|
0.01
|
|
$
|
0.02
|
|
$
|
0.03
|
|
|||
Per share amounts for the full fiscal year, as reported in the Consolidated Statements of Income may differ from the totals of the four fiscal quarters as presented above, due to rounding.
140
FORM 10-K EXHIBIT INDEX
|
Exhibit
Number
|
Description of Exhibit
|
If Incorporated by Reference, Documents with
Which Exhibit was Previous Filed with SEC
|
||
|
2.1
|
TFS Financial Corporation Stock Issuance Plan, dated May 25, 2006
|
Registration Statement on Form S-1 No. 333-139295 (filed with the SEC on December 13, 2006; Exhibit 2 therein)
|
||
|
3.1
|
Amended and Restated Charter of TFS Financial Corporation, dated January 16, 2007
|
Amendment No. 2 to Registration Statement on Form S-1 No. 333-139295 (filed with the SEC on February 9, 2006; Exhibit 3.2 therein)
|
||
|
3.2
|
Amended and Restated Bylaws of TFS Financial Corporation
|
Current Report on Form 8K No. 001-33390 (filed with the SEC on April 28, 2008; Exhibit 3.2 therein)
|
||
|
4.1
|
Form of Common Stock Certificate of TFS Financial Corporation
|
Registration Statement on Form S-1 No. 333-139295 (filed with the SEC on December 13, 2006; Exhibit 4 therein)
|
||
|
10.1
|
Employee Stock Ownership Plan, dated January 1, 2006
|
Registration Statement on Form S-1 No. 333-139295 (filed with the SEC on December 13, 2006; Exhibit 10.1 therein)
|
||
|
10.2
|
Financial, Retirement & Estate Planning Program as amended and restated January 1, 2006
|
Registration Statement on Form S-1 No. 333-139295 (filed with the SEC on December 13, 2006; Exhibit 10.2 therein)
|
||
|
10.3
|
Resolution Regarding Executive Physical Program, dated May 16, 2002
|
Registration Statement on Form S-1 No. 333-139295 (filed with the SEC on December 13, 2006; Exhibit 10.3 therein)
|
||
|
10.4
|
Company Car Program, dated February 24, 1995
|
Registration Statement on Form S-1 No. 333-139295 (filed with the SEC on December 13, 2006; Exhibit 10.4 therein)
|
||
|
10.5
|
Executive Retirement Benefit Plan I, dated January 1, 2006
|
Registration Statement on Form S-1 No. 333-139295 (filed with the SEC on December 13, 2006; Exhibit 10.5 therein)
|
||
|
10.6
|
Benefit Equalization Plan, dated January 1, 2005
|
Registration Statement on Form S-1 No. 333-139295 (filed with the SEC on December 13, 2006; Exhibit 10.6 therein)
|
||
|
10.7
|
Split Dollar Agreement, dated January 29, 2002
|
Registration Statement on Form S-1 No. 333-139295 (filed with the SEC on December 13, 2006; Exhibit 10.7 therein)
|
||
|
10.8
|
Resolution Regarding Supplemental Split Dollar Life Insurance Plan, dated August 22, 2002
|
Registration Statement on Form S-1 No. 333-139295 (filed with the SEC on December 13, 2006; Exhibit 10.8 therein)
|
||
|
10.9
|
Amendment No. 1 to Employee Stock Ownership Plan, dated February 22, 2007
|
Quarterly Report on Form 10-Q No. 001-33390 (filed with the SEC on May 15, 2007; Exhibit 10.9 therein)
|
||
|
10.10
|
2008 Equity Incentive Plan
|
Current Report on Form 8K No. 001-33390 (filed with the SEC on May 30, 2008; Exhibit 10.1 therein)
|
||
|
10.11
|
Management Incentive Compensation Plan
|
Current Report on Form 8K No. 001-33390 (filed with the SEC on May 30, 2008; Exhibit 10.2 therein)
|
||
|
10.12
|
First Amendment to the Restricted Stock Unit Award Agreement (August 11, 2008 award), dated August 9, 2012
|
Current Report on Form 8K No. 001-33390 (filed with the SEC on August 9, 2012; Exhibit 10.1 therein)
|
||
141
|
Exhibit
Number
|
Description of Exhibit
|
If Incorporated by Reference, Documents with
Which Exhibit was Previous Filed with SEC
|
||
|
10.13
|
First Amendment to the Restricted Stock Unit Award Agreement (May 12, 2009 award), dated August 9, 2012
|
Current Report on Form 8K No. 001-33390 (filed with the SEC on August 9, 2012; Exhibit 10.2 therein)
|
||
|
10.14
|
First Amendment to the Restricted Stock Unit Award Agreement (May 14, 2010 award), dated August 9, 2012
|
Current Report on Form 8K No. 001-33390 (filed with the SEC on August 9, 2012; Exhibit 10.3 therein)
|
||
|
14
|
Code of Ethics
|
Available on our website, www.thirdfederal.com
|
||
|
21.1
|
Subsidiaries of Registrant
|
Registration Statement on Form S-1 No. 333-139295 (filed with the SEC on December 13, 2006; Exhibit 21 therein)
|
||
|
23.1
|
Consent of Independent Registered Public Accounting Firm
|
Filed herewith
|
||
|
31.1
|
Certification of chief executive officer pursuant to Rule 13a-14(a) of the Securities Exchange Act of 1934
|
Filed herewith
|
||
|
31.2
|
Certification of chief financial officer pursuant to Rule 13a-14(a) of the Securities Exchange Act of 1934
|
Filed herewith
|
||
|
32
|
Certification of chief executive officer and chief financial officer pursuant to Rule 13a-14(b) of the Securities Exchange Act of 1934 and 18 U.S.C. Section 1350
|
Filed herewith
|
||
|
100
|
XBRL related documents
|
The following financial statements from TFS Financial Corporation’s Annual Report on Form 10-K for the year ended September 30, 2012, filed on November 29, 2012, formatted in XBRL: (i) Consolidated Statements of Income, (ii) Condensed Consolidated Balance Sheets, (iii) Condensed Consolidated Statements of Cash Flows, (iv) Consolidated Statements of Equity, (v) the Notes to Condensed Consolidated Financial Statements.
|
||
|
101.INS
|
Interactive datafile
|
XBRL Instance Document
|
||
|
101.SCH
|
Interactive datafile
|
XBRL Taxonomy Extension Schema Document
|
||
|
101.CAL
|
Interactive datafile
|
XBRL Taxonomy Extension Calculation Linkbase Document
|
||
|
101.DEF
|
Interactive datafile
|
XBRL Taxonomy Extension Definition Linkbase Document
|
||
|
101.LAB
|
Interactive datafile
|
XBRL Taxonomy Extension Label Linkbase Document
|
||
|
101.PRE
|
Interactive datafile
|
XBRL Taxonomy Extension Presentation Linkbase Document
|
||
142
SIGNATURES
Pursuant to the requirements of Section 13 or 15(d) the Securities Exchange Act of 1934, the Registrant has duly caused this report to be signed on its behalf by the undersigned thereunto duly authorized.
TFS Financial Corporation
|
Dated:
|
November 29, 2012
|
|
|
/
S
/ M
ARC
A. S
TEFANSKI
|
|
|
|
|
Marc A. Stefanski
Chairman of the Board, President
and Chief Executive Officer
(Principal Executive Officer)
|
|||
Pursuant to the requirements of the Securities Exchange Act of 1934, this report has been signed below by the following persons on behalf of the Registrant and in the capacities and on the dates indicated.
|
Dated:
|
November 29, 2012
|
|
|
/
S
/ M
ARC
A. S
TEFANSKI
|
|
|
|
|
|
|
Marc A. Stefanski
Chairman of the Board, President
and Chief Executive Officer
(Principal Executive Officer)
|
|
|
Dated:
|
November 29, 2012
|
|
|
/
S
/ D
AVID
S. H
UFFMAN
|
|
|
|
|
David S. Huffman
Chief Financial Officer and Secretary
(Principal Financial Officer)
|
|||
|
Dated:
|
November 29, 2012
|
|
|
/
S
/ P
AUL
J. H
UML
|
|
|
|
|
Paul J. Huml
Chief Accounting Officer
(Principal Accounting Officer)
|
|||
|
Dated:
|
November 29, 2012
|
|
|
/
S
/ A
NTHONY
J. A
SHER
|
|
|
|
|
Anthony J. Asher, Director
|
|||
|
Dated:
|
November 29, 2012
|
|
|
/
S
/ M
ARTIN
J. C
OHEN
|
|
|
|
|
Martin J. Cohen, Director
|
|||
|
Dated:
|
November 29, 2012
|
|
|
/
S
/ R
OBERT
A. F
IALA
|
|
|
|
|
Robert A. Fiala, Director
|
|||
|
Dated:
|
November 29, 2012
|
|
|
/
S
/ R
OBERT
B. H
EISLER
J
R
.
|
|
|
|
|
Robert B. Heisler Jr., Director
|
|||
|
Dated:
|
November 29, 2012
|
|
|
/
S
/ B
ERNARD
S. K
OBAK
|
|
|
|
|
Bernard S. Kobak, Director
|
|||
|
Dated:
|
November 29, 2012
|
|
|
/
S
/ W
ILLIAM
C. M
ULLIGAN
|
|
|
|
|
William C. Mulligan, Director
|
|||
|
Dated:
|
November 29, 2012
|
|
|
/
S
/ T
ERRENCE
R. O
ZAN
|
|
|
|
|
Terrence R. Ozan, Director
|
|||
|
Dated:
|
November 29, 2012
|
|
|
/
S
/ M
ARIANNE
P
ITERANS
|
|
|
|
|
Marianne Piterans, Director
|
|||
|
Dated:
|
November 29, 2012
|
|
|
/
S
/ P
AUL
W. S
TEFANIK
|
|
|
|
|
Paul W. Stefanik, Director
|
|||
|
Dated:
|
November 29, 2012
|
|
|
/
S
/ B
EN
S. S
TEFANSKI
III
|
|
|
|
|
Ben S. Stefanski III, Director
|
|||
143
TABLE OF CONTENTS
Part IItem 1. BusinessItem 1A. Risk FactorsNote 5. Loans and Allowance For Loan LossesItem 1A. Risk FactorsItem 1B. Unresolved Staff CommentsItem 2. PropertiesItem 3. Legal ProceedingsItem 4. Mine Safety DisclosuresPart IIItem 5. Market For Registrant S Common Equity, Related Stockholder Matters and Issuer Purchases Of Equity SecuritiesItem 6. Selected Financial DataItem 7. Management S Discussion and Analysis Of Financial Condition and Results Of OperationItem 7A. Quantitative and Qualitative Disclosures About Market RiskItem 8. Financial Statements and Supplementary DataItem 9. Changes in and Disagreements with Accountants on Accounting and Financial DisclosureItem 9A. Controls and ProceduresItem 9B. Other InformationPart IIIItem 10. Directors, Executive Officers and Corporate GovernanceItem 11. Executive CompensationItem 12. Security Ownership Of Certain Beneficial Owners and Management and Related Stockholder MattersItem 13. Certain Relationships and Related Transactions, and Director IndependenceItem 14. Principal Accounting Fees and ServicesPart IVItem 15. Exhibits and Financial Statement SchedulesNote 12. Income Taxes