|
|
|
|
|
|
|
|
|
|
|
|
|
|
|
|
|
|
|
|
|
|
|
|
|
|
|
|
|
|
|
|
|
|
|
|
|
|
|
|
|
|
|
|
|
|
|
|
|
|
|
|
|
|
|
|
Table of Contents
SECURITIES AND EXCHANGE COMMISSION
WASHINGTON, D.C. 20549
FORM 10-K
(Mark One)
| x | ANNUAL REPORT PURSUANT TO SECTION 13 OR 15(d) OF THE SECURITIES EXCHANGE ACT OF 1934 |
For the fiscal year ended December 31, 2012 or
| ¨ | TRANSITION REPORT PURSUANT TO SECTION 13 OR 15(d) OF THE SECURITIES EXCHANGE ACT OF 1934 |
For the transition period from to .
Commission file number 1-5353
TELEFLEX INCORPORATED
(Exact name of registrant as specified in its charter)
| Delaware | 23-1147939 | |
|
(State or other jurisdiction of incorporation or organization) |
(I.R.S. employer identification no.) | |
|
155 South Limerick Road, Limerick, Pennsylvania |
19468 | |
| (Address of principal executive offices) | (Zip Code) | |
Registrant’s telephone number, including area code: (610) 948-5100
Securities registered pursuant to Section 12(b) of the Act:
|
Title of Each Class |
Name of Each Exchange On Which Registered |
|||
|
Common Stock, par value $1 per share |
New York Stock Exchange | |||
|
Preference Stock Purchase Rights |
New York Stock Exchange |
Securities registered pursuant to Section 12(g) of the Act:
NONE
Indicate by check mark if the registrant is a well-known seasoned issuer, as defined in Rule 405 of the Securities Act. Yes x No ¨
Indicate by check mark if the registrant is not required to file reports pursuant to Section 13 or Section 15(d) of the Act. Yes ¨ No x
Indicate by check mark whether the registrant (1) has filed all reports required to be filed by Section 13 or 15(d) of the Securities Exchange Act of 1934 during the preceding 12 months (or for such shorter period that the registrant was required to file such reports), and (2) has been subject to such filing requirements for the past 90 days. Yes x No ¨
Indicate by check mark whether the registrant has submitted electronically and posted on its corporate Web site, if any, every Interactive Data File required to be submitted and posted pursuant to Rule 405 of Regulation S-T during the preceding 12 months (or for such shorter period that the registrant was required to submit and post such files). Yes x No ¨
Indicate by check mark if disclosure of delinquent filers pursuant to Item 405 of Regulation S-K is not contained herein, and will not be contained, to the best of the registrant’s knowledge, in definitive proxy or information statements incorporated by reference in Part III of this Form 10-K or any amendment to this Form 10-K. ¨
Indicate by check mark whether the registrant is a large accelerated filer, an accelerated filer, a non-accelerated filer, or a smaller reporting company. See the definitions of “large accelerated filer,” “accelerated filer” and “smaller reporting company” in Rule 12b-2 of the Exchange Act.
|
Large accelerated filer x |
Accelerated filer | ¨ | Non-accelerated filer ¨ | Smaller reporting company | ¨ |
Indicate by check mark whether the registrant is a shell company (as defined in Rule 12b-2 of the Act). Yes ¨ No x
The aggregate market value of the Common Stock of the registrant held by non-affiliates of the registrant (32,243,334 shares) on July 1, 2012 (the last business day of the registrant’s most recently completed fiscal second quarter) was $1,963,941,473 (1) . The aggregate market value was computed by reference to the closing price of the Common Stock on such date.
The registrant had 40,974,639 Common Shares outstanding as of February 11, 2013.
DOCUMENT INCORPORATED BY REFERENCE:
Certain provisions of the registrant’s definitive proxy statement in connection with its 2012 Annual Meeting of Shareholders, to be filed within 120 days of the close of the registrant’s fiscal year, are incorporated by reference in Part III hereof.
| (1) | For the purposes of this definition only, the registrant has defined “affiliate” as including executive officers and directors of the registrant and owners of more than five percent of the common stock of the registrant, without conceding that all such persons are “affiliates” for purposes of the federal securities laws. |
Table of Contents
TELEFLEX INCORPORATED
ANNUAL REPORT ON FORM 10-K
FOR THE FISCAL YEAR ENDED DECEMBER 31, 2012
Table of Contents
Information Concerning Forward-Looking Statements
All statements made in this Annual Report on Form 10-K, other than statements of historical fact, are forward-looking statements. The words “anticipate,” “believe,” “estimate,” “expect,” “intend,” “may,” “plan,” “will,” “would,” “should,” “guidance,” “potential,” “continue,” “project,” “forecast,” “confident,” “prospects” and similar expressions typically are used to identify forward-looking statements. Forward-looking statements are based on the then-current expectations, beliefs, assumptions, estimates and forecasts about our business and the industry and markets in which we operate. These statements are not guarantees of future performance and are subject to risks, uncertainties and assumptions which are difficult to predict. Therefore, actual outcomes and results may differ materially from what is expressed or implied by these forward-looking statements due to a number of factors, including changes in business relationships with and purchases by or from major customers or suppliers, including delays or cancellations in shipments; demand for and market acceptance of new and existing products; our ability to integrate acquired businesses into our operations, realize planned synergies and operate such businesses profitably in accordance with expectations; our ability to effectively execute our restructuring programs; competitive market conditions and resulting effects on revenues and pricing; increases in raw material costs that cannot be recovered in product pricing; and global economic factors, including currency exchange rates, interest rates and sovereign debt issues; difficulties entering new markets; and general economic conditions. For a further discussion of the risks relating to our business, see Item 1A “Risk Factors” in this Annual Report on Form 10-K. We expressly disclaim any obligation to update these forward-looking statements, except as otherwise specifically stated by us or as required by law or regulation.
3
Table of Contents
|
|
Teleflex Incorporated is referred to herein as “we,” “us,” “our,” “Teleflex” and the “Company.”
THE COMPANY
Teleflex is a global provider of medical technology products that enhance clinical benefits, improve patient and provider safety and reduce total procedural costs. We primarily design, develop, manufacture and supply single-use medical devices used by hospitals and healthcare providers for common diagnostic and therapeutic procedures in critical care and surgical applications. We sell our products to hospitals and healthcare providers in more than 140 countries through a combination of our direct sales force and distributors. Because our products are used in numerous markets and for a variety of procedures, we are not dependent upon any one end-market or procedure.
We are focused on achieving consistent, sustainable and profitable growth by increasing our market share and improving our operating efficiencies through:
| • |
the development of new products and product line extensions; |
| • |
the investment in new technologies and broadening their applications; |
| • |
the expansion of the use of our products in existing markets, as well as the introduction of our products into new geographic markets; |
| • |
leveraging our direct sales force and distribution network with new products, manufacturing and distribution facility rationalization and achieving economies of scale as we continue to expand; and |
| • |
the potential broadening of our product portfolio through select acquisitions, licensing arrangements and partnerships that enhance, extend or expedite our development initiatives or our ability to increase our market share. |
Our research and development capabilities, commitment to engineering excellence and focus on low-cost manufacturing enable us to consistently bring cost effective, innovative products to market that improve the safety, efficacy and quality of healthcare. Our research and development initiatives focus on developing new, innovative products for existing and new therapeutic applications as well as enhancements to, and line extensions of, existing products. We introduced 20 new products and line extensions during 2012. Our portfolio of existing products and pipeline of potential new products consist primarily of Class I and Class II devices, which require 510(k) clearance by the FDA for sale in the United States. We believe that 510(k) clearance reduces our research and development costs and risks, and typically results in a shorter timetable for new product introductions as compared to the premarket approval, or PMA, process that would be required for Class III devices.
Over the past several years we have evolved into a pure-play medical technology company. Through an extensive acquisition and divestiture program, we have significantly changed the composition of our portfolio of businesses, expanding our presence in the medical technology industry, while divesting all of our businesses serving the aerospace and commercial markets.
During 2012, we continued to expand our presence in the anesthesia market through the acquisition of substantially all of the assets of LMA International N.V. (“LMA”) a global market leader in laryngeal masks with a portfolio of innovative products used extensively in anesthesia and emergency care. In addition, consistent with our strategy to invest in new technologies and research and development to support our future growth, we completed four late-stage technology acquisitions in 2012. See Note 3 to the consolidated financial statements included in this report for a discussion of the acquisitions.
4
Table of Contents
During 2012, we sold the orthopedics business line of our OEM Segment. See Note 19 to the consolidated financial statements included in this report for a discussion of the disposition.
OUR BUSINESS
We provide a broad-based platform of products, which we categorize into four groups: Critical Care, Surgical Care, Cardiac Care and OEM and Development Services.
Net Revenues
The following table sets forth our net revenues for 2012, 2011 and 2010 by product category.
| 2012 | 2011 | 2010 | ||||||||||
| (Dollars in thousands) | ||||||||||||
|
Critical Care |
$ | 1,040,547 | $ | 1,003,792 | $ | 943,367 | ||||||
|
Surgical Care |
291,219 | 277,440 | 262,683 | |||||||||
|
Cardiac Care |
78,584 | 79,961 | 70,559 | |||||||||
|
OEM and Development Services |
140,230 | 129,630 | 118,364 | |||||||||
|
Other |
429 | 1,705 | 2,749 | |||||||||
|
|
|
|
|
|
|
|||||||
|
Total net revenues |
$ | 1,551,009 | $ | 1,492,528 | $ | 1,397,722 | ||||||
|
|
|
|
|
|
|
|||||||
Our products generally serve three end-markets: hospitals and healthcare providers, medical device manufacturers and home care. These markets are influenced by a number of factors, including demographics, utilization and reimbursement patterns. The following table sets forth the percentage of net revenues for 2012, 2011 and 2010 by end market.
| 2012 | 2011 | 2010 | ||||||||||
|
Hospitals / Healthcare Providers |
84 | % | 83 | % | 84 | % | ||||||
|
Medical Device Manufacturers |
10 | % | 9 | % | 9 | % | ||||||
|
Home Care |
6 | % | 8 | % | 7 | % | ||||||
We sell and market our products in over 140 countries through a combination of our direct sales force and independent distributors. The following table sets forth the percentage of net revenues (based on business unit location) for 2012, 2011 and 2010 derived from the major geographic areas we serve.
| 2012 | 2011 | 2010 | ||||||||||
|
United States |
51 | % | 51 | % | 54 | % | ||||||
|
Europe, Middle East and Africa (“EMEA”) |
34 | % | 37 | % | 36 | % | ||||||
|
Asia, Latin America and Canada |
15 | % | 12 | % | 10 | % | ||||||
Additional geographic information is presented in Note 17 to our consolidated financial statements included in this Annual Report on Form 10-K.
We operate 25 manufacturing sites, with major manufacturing operations located in the Czech Republic, Malaysia, Mexico and the United States.
Critical Care
We are a leading provider of specialty products for critical care, which is predominantly comprised of single-use products. The large majority of our sales for single-use products are made to the hospital/healthcare provider market, with a smaller percentage sold to alternate sites.
Critical Care is our largest product group representing 67% of net revenues in 2012. Our products are used in a wide range of critical care procedures for vascular access, anesthesia and airway management, respiratory therapy, treatment of urologic conditions and other specialty procedures.
5
Table of Contents
Vascular Access Products
Our vascular access products, which accounted for 36 percent of our Critical Care net revenues in 2012, are generally catheter-based products used in a variety of clinical procedures to facilitate a variety of critical care therapies, including the administration of intravenous medications and other therapies and the measurement of blood pressure and taking of blood samples through a single puncture site.
Our vascular access catheters and related devices consist principally of central venous access catheters such as the following:
| • |
the ARROW multi-lumen catheter, a catheter equipped with three or four channels, or lumens; |
| • |
ARROW double-and single-lumen catheters, which are designed for use in a number of clinical procedures; |
| • |
the ARROW pressure injectable central venous catheter, or CVC, which gives clinicians who perform contrast-enhanced CT scans the ability to use an indwelling pressure injectable ARROW CVC to inject contrast dye for their scan without having to insert a second catheter; |
| • |
ARROW percutaneous sheath introducers, which are used to insert cardiovascular and other catheterization devices into the vascular system during critical care procedures; and |
| • |
ARROW arterial catheterization sets, which facilitate arterial pressure monitoring and blood withdrawal for glucose, blood-gas and electrolyte measurement in a wide variety of critical care and intensive care settings. |
Many of our vascular access catheters are treated with the ARROWg+ard or ARROWg+ard Blue Plus antimicrobial surface treatments to reduce the risk of catheter related bloodstream infection. ARROWg+ard Blue Plus provides antimicrobial treatment of the interior lumens and hubs of each catheter.
We also provide a range of peripherally inserted central catheters, or PICCs, which are soft, flexible catheters inserted in the upper arm and advanced into the superior vena cava that are used to administer various types of intravenous medications and therapies. Our offerings include a pressure injectable peripherally inserted catheter, which addresses the therapeutic need for a catheter that can withstand the higher pressures required by the injection of contrast media for CT scans. The two newest additions to the PICC portfolio in the United States include:
| • |
ARROWEVOLUTION PICC with Chlorag+ard technology, a pressure-injectable PICC treated with a chlorhexidine-based solution from tip to hub on both the inner and outer lumen surfaces. Introduced in 2010, Chlorag+ard is our newest coating technology for use on some peripherally inserted central catheters, providing a reduction in colonization of pathogens responsible for causing catheter-related bloodstream infections for up to 30 days. |
| • |
ARROW’s VasoNova Positioning System (VPS) collects data from its single use biosensor and uses proprietary algorithms to accurately confirm catheter location in the vasculature. The biosensor can be used with any suitable diameter CVC or PICC catheter. It is FDA cleared as an alternative to chest x-ray confirmation, shortening hospital stays and lowering costs associated with catheter insertion procedures. |
As part of our ongoing efforts to meet physicians’ needs for safety and management of risk of infection in the hospital setting, we offer many of our vascular access catheters in a Maximal Barrier Precautions Tray. The tray is available for central venous (CVC), multi access (MAC) and peripheral venous access (PICC) and includes a full body drape, coated or non-coated catheter and other accessories. These kits were created to assist healthcare providers in complying with guidelines for reducing catheter-related bloodstream infections that have been established by a variety of health regulatory agencies, such as the Centers for Disease Control and Prevention and the Joint Commission on the Accreditation of Healthcare Organizations.
6
Table of Contents
Our newest offering is the ErgoPack system designed to support consistent compliance with established guidelines for infection prevention and safety measures during catheter insertion. The system provides components which are packaged in the tray in the order in which they will be needed during the procedure and incorporates features intended to enhance ease of use and patient and provider safety. The ErgoPack system is offered for CVC, PICC, MAC and Acute Hemodialysis product offerings.
These advanced ErgoPack systems are designed to reduce procedural time and the risk of catheter-related blood stream infection. Combined with the ARROW VPS™ system, which has been approved by the FDA as a replacement for chest x-ray following the insertion of a central venous catheter, these products collectively offer the opportunity to reduce injuries to the healthcare provider, expedite placement of a central venous catheter, reduce patient exposure to x-ray, expedite infusion of medication and reduce the risk of catheter related infection and thrombosis for the patient. The intended net result is a more cost-effective and safer approach to management of the insertion and use of central venous catheter.
Anesthesia
Our anesthesia portfolio, which includes airway and pain management products, accounted for 23 percent of our Critical Care product net revenues in 2012. Teleflex airway management products are used to maintain a patent airway for patients in surgical, critical care and emergency settings. These products are primarily marketed under the Rusch ® brand and include endotracheal tubes, tracheostomy tubes, oral and nasal airways, laryngoscopes, face masks, and anesthesia circuits.
In 2012, Teleflex expanded our anesthesia franchise with the acquisition of LMA International N.V. (“LMA”). LMA ® is a global market leader in laryngeal masks with a portfolio of innovative products used extensively in anesthesia and emergency care. The addition of this business significantly strengthens and expands our global anesthesia product portfolio, providing opportunities with respect to key clinical U.S. and international call points, while also further strengthening our Group Purchasing Organizations (GPO) relationships.
Teleflex also acquired and commercialized a late-stage airway management technology in 2012. The Rusch ® EZ-Blocker™ disposable catheter is an innovative technology that improves Teleflex’s competitive position. The EZ-Blocker catheter is used in lung isolation procedures to achieve one-lung ventilation and is designed to provide benefits that overcome the significant drawbacks of currently used products. The design of the EZ-Blocker catheter allows for use in combination with a standard endotracheal tube and enables positioning over the carina. We acquired the device in May of 2012.
Our pain management, or regional anesthesia, products include epidural catheters and trays, spinal needles and trays and peripheral nerve block needles, catheters and trays. Teleflex’s comprehensive portfolio of pain management products are marketed under the ARROW ® brand and are designed to provide pain relief during a broad range of surgical and obstetric procedures to help clinicians better manage each patient’s individual pain, while reducing complications and associated costs.
In 2012, we strengthened our Pain Management portfolio with the launch of the ARROW ® FlexTip ® Plus Multi-Port Catheter, an epidural catheter that uses the same technology as our ARROW ® FlexTip Plus open tip, single-port catheter, which has been proven to significantly reduce complications, such as vein cannulations and paresthesia. The unique polyurethane FlexTip Plus Multi-Port catheter provides a solution for clinicians who believe a better block is achieved with a multi-orifice catheter rather than with a single-hole, open tip catheter.
In late 2012, the Anesthesia business also launched the ARROW ® FlexBlock™ Continuous Peripheral Nerve Block Catheter, which is intended for clinicians who use ultrasound-guidance when placing continuous peripheral nerve block catheters. The FlexBlock catheter’s coil-reinforced, polyurethane body is designed to help improve continuous nerve blocking by providing clinicians with
7
Table of Contents
an echogenic catheter. The coil reinforcement also makes FlexBlock kink resistant to better maintain patency, even in some situations that might cause ordinary nylon catheters to fail. The unique Tuohy introducer needles are designed to enable clinicians to retract the catheter back into the needle, if necessary, without withdrawing the needle and resticking the patient.
Respiratory Care
Teleflex’s respiratory products accounted for 16 percent of our Critical Care product net revenues in 2012. Our Hudson RCI brand has been a leader in respiratory care for more than 65 years, providing innovative products that are designed to help clinicians improve patient outcomes while reducing costs. Our comprehensive portfolio is used in a variety of care settings and includes:
| • |
oxygen therapy products, including oxygen masks, cannulas, humidifiers and tubing; |
| • |
aerosol therapy products, including small and large volume nebulizers, peak flow meters and aerosol chambers; |
| • |
spirometry products, including incentive breathing exercisers; and |
| • |
ventilation management products, including ventilator circuits, humidification devices and bacteria/virus filters. |
In 2012, we launched several new products to complement the popular ConchaTherm ® Neptune ® Heated Humidifier. The ConchaTherm Neptune enables clinicians to optimize humidification to improve patient outcomes. Featuring adjustable temperature and gradient control, the ConchaTherm ® Neptune ® supports clinical practice guidelines for humidification delivery during invasive and noninvasive ventilation. Because of the ConchaTherm ® Neptune ® ’s flexibility in operation, therapists can easily adjust the humidifier after routine clinical assessments.
Launched in late 2012, ISO-Gard ® Circuit Technology is used in conjunction with the ConchaTherm Neptune. This disposable circuit promotes a closed system ventilation approach by integrating reservoirs into the breathing circuit that collect excess condensate or secretions, which can be easily emptied with a suction wand. This closed system minimizes circuit breaks, which reduces the risk of cross contamination and eliminates the need to interrupt ventilation. As a result, the ISO-Gard Circuit Technology helps to reduce both patient and clinician exposure to mucosal secretions and supports strategies for reducing the risk of ventilator-associated pneumonia in acute care hospitals.
In 2012, Teleflex also launched the Softech ® Plus line of adult, pediatric, infant and neonatal oxygen cannulas that feature a new material blend resulting in softness that provides optimal patient comfort with an ideal fit. The Softech Plus’ non-DEHP construction helps customers comply with evolving patient safety standards.
Specialty Markets
Teleflex’s Specialty products accounted for 25 percent of our Critical Care product net revenues in 2012. Our Specialty Markets business sells Respiratory, Anesthesia, Interventional Access and Urology products into the Homecare and other alternative channels of care.
Our line of Urology products provides bladder management for patients in the hospital and home care markets. Our product portfolio consists principally of a wide range of catheters (including Foley, intermittent, external and suprapubic), urine collectors, catheterization accessories and products for operative endurology marketed under the Rusch ® brand name.
Our Urology business serves home care markets and patient care outside of the hospital. Over the past few years, we have expanded our offerings for these markets to include a wider range of intermittent catheters, catheter insertion kits and accessories used by quadriplegic and paraplegic people. Many of these products are designed to support patient safety and infection prevention
8
Table of Contents
efforts. For example, we market an intermittent catheter with hydrophilic coating, an Ergothan tip, protective sleeve and saline solution in our EMEA region. In the United States, we recently expanded our hydrophilic coated intermittent catheter line to include female lengths as well as complete sterile insertion kits for both standard (male) and female lengths. The uncoated intermittent catheter line in the United States was also expanded recently to include a full range of female length catheters and a complete offering of sterile insertion kits for the standard (male), Coudé, and female styles.
Home care markets are subject to local and regional reimbursement regulations that can impact volumes and pricing. For example, in the United States, reimbursement regulations were implemented in 2008 that permit reimbursement for up to 200 catheters per month, replacing the previous limit of four catheters per month. The change promoted a shift from re-useable catheters, with their inherent risk of infections, to single-use intermittent catheters. Sales of our intermittent catheters in the United States have benefited from this change in reimbursement policy.
The Gibeck ® TRACH-VENT ® HME (Heat & Moisture Exchanger) family of products are designed to provide excellent humidification for spontaneously breathing tracheostomized patients. In November 2012, we introduced the Gibeck ® TRACH VENT T with 5mm Collar. This HME provides optimal moisture via Gibeck Microwell paper while accommodating all patient sizes.
Interventional Access products include tunneled hemodialysis catheters, acute hemodialysis catheters, Percutaneous transluminal angioplasty (PTA) balloons, embolectomy balloons, a mechanical thrombectomy device, reinforced percutaneous sheath introducers and diagnostic and drainage kits.
The line of tunneled dialysis catheters offers antegrade and retrograde catheters in the split tipped ARROW Edge Catheter and the ARROW Cannon II Plus Catheter. In the step tip catheter the antegrade and retrograde NextStep Catheter is offered with a reverse port configuration. The acute hemodialysis catheters are treated with the ARROWg+ard antimicrobial surface treatments to reduce the risk of catheter related bloodstream infection. In May of 2012, we acquired Semprus BioSciences, a biomedical company that developed Sustain™, a long-lasting, covalently bonded, non-leaching polymer designed to reduce infections and thrombus related complications. Our tunneled hemodialysis catheters will be treated with Sustain™, in order to reduce the attachment of platelets and blood proteins at the device surface.
In connection with the acquisition of Hotspur Technologies, a developer of catheter-based technologies designed to restore blood flow in patients with obstructed vessels, we obtained the VisioValve™ Injection System, a patented technology that is the basis for a portfolio of multi-function catheters, such as the GPSCath Balloon Dilitation Catheter. The GPSCath is a specialty two-in-one device intended for dialysis access and peripheral vascular interventions that enables physicians to conduct angioplasty and inject fluid while maintaining guidewire position.
Surgical Care
Surgical Care, which is predominantly comprised of single-use products, represented 19 percent of net revenues in 2012. Our surgical products include: ligation and closure products, including appliers, clips and sutures used in a variety of surgical procedures; access ports used in minimally invasive surgical procedures, including robotic surgery; and fluid management products used for chest drainage. Our surgical products also include reusable hand-held instruments for general and specialty surgical procedures. We market surgical products under the Deknatel, Pilling, Pleur-evac, Taut and Weck brand names. In April 2012 we expanded our Surgical product offerings through acquisition of technology enabling us to launch the Weck EFx TM Endo Fascial Closure System, a port site closure device used in laparoscopic surgical procedures.
Hem-o-lok, a significant part of the Weck portfolio, is a unique locking polymer ligation clip that combines the security of a suture with the speed of a metal clip for open and laparoscopic surgery. Hem-o-lok clips have special applications in robotic, laparoscopic and cardiovascular surgery.
9
Table of Contents
In addition to the launch of the Weck EFx TM Endo Fascial Closure System, recently introduced products include a new comprehensive line of bladeless laparoscopic access ports under the Weck brand featuring optical trocars, universal balloons and a line of sustainable, reusable obturators and Deklene Maxx, a line of high performing polypropylene sutures utilized extensively in Cardiovascular surgery.
Cardiac Care
Cardiac Care products accounted for approximately 5 percent of net revenues in 2012. Products in this category include diagnostic catheters and capital equipment. Our diagnostic catheters include thermodilution and wedge pressure catheters; specialized angiographic catheters, such as Berman and Reverse Berman catheters; therapeutic delivery catheters, such as temporary pacing catheters; sheaths for femoral and trans-radial aortic access used in diagnostic and therapeutic procedures; and intra-aortic balloon, or IAB, catheters. Capital equipment includes our intra-aortic balloon pump, or IABP, consoles. IABP products are used to augment oxygen delivery to the cardiac muscle and reduce the oxygen demand after cardiac surgery, serious heart attack or interventional procedures.
The IAB and IABP product lines feature the AutoCAT 2 WAVE console and the FiberOptix catheter, which together utilize fiber optic technology for arterial pressure signal acquisition and enable the patented WAVE timing algorithm to support the broadest range of patient heart rhythms, including severely arrhythmic patients.
OEM and Development Services
Customized extrusion, performance fibers and devices sold to original equipment manufacturers, or OEMs, represented 9 percent of our net revenues in 2012. Teleflex Medical OEM designs and delivers products that have applications for a wide variety of organs and systems in the human body. We offer comprehensive product development and outsourcing services, which include design, engineering, regulatory affairs, prototyping, manufacturing, assembly and packaging.
Our OEM products which are marketed under the TFX OEM brand name, include custom-manufactured extrusions, catheters, introducers, dilators and other devices. OEM also markets specialty sutures, resins and yarns for cardiovascular and orthopedic applications under the Deknatel brand.
HISTORY AND RECENT DEVELOPMENTS
Teleflex was founded in 1943 as a manufacturer of precision mechanical push/pull controls for military aircraft. From this original single market, single product orientation, we have grown through an active program of development of new products, introduction of products into new geographic or end-markets and through acquisitions of companies with related market, technology or industry expertise. Throughout our history, we have continually focused on providing innovative, technology-driven, specialty-engineered products that help our customers meet their business requirements.
Over the past several years, we have significantly changed the composition of our portfolio of businesses, expanding our presence in the medical device industry, while divesting all of our businesses serving the aerospace and commercial markets. The most significant of these transactions occurred in 2007 with our acquisition of Arrow International, a leading global supplier of catheter-based medical technology products used for vascular access and cardiac care, and the divestiture of our automotive and industrial businesses. Our acquisition of Arrow significantly expanded our single-use product offerings for critical care, enhanced our global footprint and added to our research and development capabilities. With the divestitures of our marine business and cargo container and systems businesses in 2011, we have become exclusively a medical device company.
We expect to continue to increase the relative composition of our business through a combination of portfolio management and organic growth initiatives. From time to time, we explore and engage in discussions regarding acquisitions that would augment our existing technology platform.
10
Table of Contents
CHANGE IN REPORTING SEGMENTS AND BUSINESS UNIT STRUCTURE
Effective January 1, 2012, we changed our segment reporting from a single reportable segment to four reportable segments. As initially changed, our reportable segments included three geographically-based segments, North America, EMEA (representing our operations in Europe, the Middle East and Africa) and AJLA (representing our Asian and Latin American operations) and a fourth reportable segment comprised of our OEM business. In addition, in the first quarter of 2012, we changed the number of our reporting units. Previously, we had six reporting units comprised of North America, EMEA, OEM, Japan, Asia Pacific and Latin America. In 2012, in addition to establishing a new North America segment, we established five reporting units within that segment: Vascular, Anesthesia/Respiratory, Cardiac, Surgical and Specialty. Due to the change in the reporting unit structure in North America, we were required to conduct a goodwill impairment test with respect to each of the North American reporting units in the first quarter of 2012, and determined that the goodwill of three of the reporting units was impaired. As a result, we recorded a goodwill impairment charge of $332 million in the first quarter of 2012. See Note 5 to the consolidated financial statements included in this report for a discussion of the goodwill impairment.
During the third quarter of 2012, due to changes in our management and internal reporting structure, our Latin America operations were moved from the AJLA Segment into the North America Segment. As a result of this change, the North America Segment is now referred to as the Americas Segment and the AJLA Segment is now referred to as the Asia Segment. The change did not affect our reporting unit structure. All prior comparative periods have been restated to reflect this change. See Note 17 to the consolidated financial statements included in this report for a discussion of the segments.
GOVERNMENT REGULATION
Government agencies in a number of countries regulate our products and the products sold by our customers that incorporate our products. The U.S. Food and Drug Administration and government agencies in other countries regulate the approval, manufacturing, sale and marketing of many of our healthcare products. For more information, see “We are subject to extensive government regulation, which may require us to incur significant expenses to ensure compliance. Our failure to comply with those regulations could have a material adverse effect on our business, results of operations and financial condition.” appearing in Item 1A. “Risk Factors” of this report.
COMPETITION
The medical device industry is highly competitive. We compete with many companies, ranging from small start-up enterprises to companies that are larger and more established than us and have access to significantly greater financial resources. Furthermore, extensive product research and development and rapid technological advances characterize the market in which we compete. We must continue to develop and acquire new products and technologies for our businesses to remain competitive. We believe that we compete primarily on the basis of clinical superiority and innovative features that enhance patient benefit, product reliability, performance, customer and sales support, and cost-effectiveness. Our competitors include C. R. Bard, Inc., Covidien and CareFusion.
SALES AND MARKETING
Our products are sold directly to hospitals, healthcare providers, distributors and to original equipment manufacturers of medical devices through our own sales forces and through independent representatives and independent distributor networks.
11
Table of Contents
BACKLOG
Most of our products are sold to hospitals or healthcare providers on orders calling for delivery within a few days or weeks, with longer order times for products sold to medical device manufacturers. Therefore, our backlog of orders is not indicative of probable revenues in any future 12-month period.
PATENTS AND TRADEMARKS
We own a portfolio of patents, patents pending and trademarks. We also license various patents and trademarks. Patents for individual products extend for varying periods according to the date of patent filing or grant and the legal term of patents in the various countries where patent protection is obtained. Trademark rights may potentially extend for longer periods of time and are dependent upon national laws and use of the marks. All capitalized product names throughout this document are trademarks owned by, or licensed to, us or our subsidiaries. Although these have been of value and are expected to continue to be of value in the future, we do not consider any single patent or trademark, except for the Teleflex and Arrow brands, to be essential to the operation of our business.
SUPPLIERS AND MATERIALS
Materials used in the manufacture of our products are purchased from a large number of suppliers in diverse geographic locations. We are not dependent on any single supplier for a substantial amount of the materials used or components supplied for our overall operations. Most of the materials and components we use are available from multiple sources, and where practical, we attempt to identify alternative suppliers. Volatility in commodity markets, particularly steel and plastic resins, can have a significant impact on the cost of producing certain of our products. We may not be able to successfully pass these cost increases through to all of our customers, particularly original equipment manufacturers.
RESEARCH AND DEVELOPMENT
We are engaged in both internal and external research and development. Our research and development costs principally relate to our efforts to bring innovative new products to the markets we serve, and our efforts to enhance the clinical value, ease of use, safety and reliability of our existing product lines. Our research and development efforts support our strategic objectives to provide safe and effective products that reduce infections, improve patient and clinician safety, enhance patient outcomes and enable less invasive procedures.
We also acquire or license products and technologies that are consistent with our strategic objectives and enhance our ability to provide a full range of product and service options to our customers.
SEASONALITY
Portions of our revenues are subject to seasonal fluctuations. Incidence of flu and other disease patterns as well as the frequency of elective medical procedures affect revenues related to single-use products.
EMPLOYEES
We employed approximately 11,600 full-time and temporary employees at December 31, 2012. Of these employees, approximately 3,100 were employed in the United States and 8,500 in countries outside of the United States. Less than 5% of our employees in the United States were covered by union contracts. We also have collective-bargaining arrangements or union contracts that cover employees in other countries. We believe we have good relationships with our employees.
12
Table of Contents
INVESTOR INFORMATION
We are subject to the reporting requirements of the Securities Exchange Act of 1934, as amended (the “Exchange Act”). Therefore, we file reports, proxy statements and other information with the Securities and Exchange Commission (SEC). Copies of such reports, proxy statements, and other information may be obtained by visiting the Public Reference Room of the SEC at 100 F Street, NE, Washington, DC 20549 or by calling the SEC at 1-800-SEC-0330. In addition, the SEC maintains a website (http://www.sec.gov) that contains reports, proxy and information statements and other information regarding issuers that file electronically with the SEC.
You can access financial and other information about us in the Investors section of our website, which can be accessed at www.teleflex.com. We make available through our website, free of charge, copies of our annual report on Form 10-K, quarterly reports on Form 10-Q, current reports on Form 8-K and amendments to those reports filed with or furnished to the SEC under Section 13(a) or 15(d) of the Exchange Act as soon as reasonably practicable after electronically filing or furnishing such material to the SEC. The information on our website is not part of this Annual Report on Form 10-K. The reference to our website address is intended to be an inactive textual reference only.
We are a Delaware corporation incorporated in 1943. Our executive offices are located at 155 South Limerick Road, Limerick, PA 19468. Our telephone number is (610) 948-5100.
EXECUTIVE OFFICERS
The names and ages of all of our executive officers and the positions and offices held by each such officer are as follows:
|
Name |
Age |
Positions and Offices with Company |
||||
|
Benson F. Smith |
65 | Chairman, President, Chief Executive Officer and Director | ||||
|
Liam Kelly |
46 | Executive Vice President and President, International | ||||
|
Laurence G. Miller |
58 | Executive Vice President, Chief Administrative Officer, General Counsel and Secretary | ||||
|
Thomas E. Powell |
51 | Executive Vice President and Chief Financial Officer | ||||
Mr. Smith has been our Chairman, President and Chief Executive Officer since January 2011, and has served as a Director since April 2005. Prior to January 2011, Mr. Smith was the managing partner of Sales Research Group, a research and consulting organization. From 1999 to January 2011, he also served as the Chief Executive Officer of BFS & Associates LLC, which specialized in strategic planning and venture investing. From 2000 until 2005, Mr. Smith also served as a speaker and author at The Gallup Organization, a global research-based consultancy firm. Prior to that, Mr. Smith worked for C.R. Bard, Inc., a company specializing in medical devices, for approximately 25 years, where he held various executive and senior level positions most recently as President and Chief Operating Officer from 1994 to 1998.
Mr. Kelly has been our Executive Vice President, President, International since June 2012. From June 2011 to June 2012, he served as President, EMEA. From November 2009 to June 2011, Mr. Kelly served as Executive Vice President, EMEA. From April 2009 to November 2009, he served as Vice President of Marketing, EMEA. Prior to joining Teleflex, Mr. Kelly held various senior level positions with Hill-Rom Holdings, Inc., a medical device company, from October 2002 to August 2009, serving as its Vice President of International Marketing and R&D from August 2006 to February 2009.
Mr. Miller has been our Executive Vice President, General Counsel and Secretary since February 2008 and has also served as Chief Administrative Officer since April 26, 2011. From November 2004 to February 2008, Mr. Miller was Senior Vice President, General Counsel and Secretary. From November 2001 until November 2004, he was Senior Vice President and Associate General Counsel
13
Table of Contents
for the Food & Support Services division of Aramark Corporation, a diversified management services company providing food, refreshment, facility and other support services for a variety of organizations.
Mr. Powell has been our Executive Vice President and Chief Financial Officer since February 2013. From March 2012 to February 2013, Mr. Powell was Senior Vice President and Chief Financial Officer. He joined Teleflex in August 2011 as Senior Vice President, Global Finance. Prior to joining Teleflex, Mr. Powell served as Chief Financial Officer and Treasurer of Tomotherapy Incorporated, a medical device company, from June 2009 until June 2011. In 2008, he served as Chief Financial Officer of Textura Corporation, a software provider. From April 2001 until January 2008, Mr. Powell was employed by Midway Games, Inc., a software provider, serving as its Executive Vice President, CFO and Treasurer from September 2001 until January 2008. Mr. Powell has also held leadership positions with Dade Behring, Inc. (now Siemens Healthcare Diagnostics), PepsiCo, Bain & Company, Tenneco Inc. and Arthur Andersen & Company.
Our officers are elected annually by our board of directors. Each officer serves at the discretion of the board.
|
|
FACTORS |
We are subject to risks that could adversely affect our business, financial condition and results of operations. These risks include, but are not limited to the following:
We face strong competition. Our failure to successfully develop and market new products could adversely affect our business.
The medical device industry is highly competitive. We compete with many domestic and foreign medical device companies ranging from small start-up enterprises that might sell only a single or limited number of competitive products or compete only in a specific market segment, to companies that are larger and more established than us, have a broad range of competitive products, participate in numerous markets and have access to significantly greater financial and marketing resources than we do.
In addition, the medical device industry is characterized by extensive product research and development and rapid technological advances. The future success of our business will depend, in part, on our ability to design and manufacture new competitive products and enhance existing products. Our product development efforts may require us to make substantial investments. There can be no assurance that unforeseen problems will not occur with respect to the development, performance or market acceptance of new technologies or products, such as our inability to:
| • |
identify viable new products; |
| • |
obtain adequate intellectual property protection; |
| • |
gain market acceptance of new products; or |
| • |
successfully obtain regulatory approvals. |
In addition, our competitors currently may be developing, or may develop in the future, products that are more effective than those that we currently offer or subsequently develop. Our failure to successfully develop and market new products or enhance existing products could have an adverse effect on our business, financial condition and results of operations.
Our customers depend on third party coverage and reimbursements and the failure of healthcare programs to provide coverage and reimbursement, or the reduction in levels of reimbursement, for our medical products could adversely affect us.
The ability of our customers to obtain coverage and reimbursements for our products is important to our business. Demand for many of our existing and new medical products is, and will continue to be, affected by the extent to which government healthcare programs and private health insurers reimburse
14
Table of Contents
our customers for patients’ medical expenses in the countries where we do business. Even when we develop or acquire a promising new product, demand for the product may be limited unless reimbursement approval is obtained from private and governmental third party payors. Internationally, healthcare reimbursement systems vary significantly, with medical centers in some countries having fixed budgets, regardless of the extent of patient treatment. Other countries require application for, and approval of, government or third party reimbursement. Without both favorable coverage determinations by, and the financial support of, government and third party insurers, the market for many of our medical products would be adversely affected.
We cannot be sure that third party payors will maintain the current level of coverage and reimbursements to our customers for use of our existing products. Adverse coverage determinations or any reduction in the amount of reimbursements could harm our business by reducing potential customers’ selection of our products and the prices they are willing to pay. In addition, as a result of their purchasing power, third party payors are implementing cost cutting measures such as seeking discounts, price reductions or other incentives from medical products suppliers and imposing limitations on coverage and reimbursements for medical technologies and procedures. These trends could compel us to reduce prices for our existing products and potential new products and could cause a decrease in the size of the market or a potential increase in competition that could negatively affect our business, financial condition and results of operations.
We may incur material losses and costs as a result of product liability and warranty claims that may be brought against us and recalls, which may adversely affect our results of operations and financial condition. Furthermore, as a medical device company, we face an inherent risk of damage to our reputation if one or more of our products are, or are alleged to be, defective.
Our businesses expose us to potential product liability risks that are inherent in the design, manufacture and marketing of our products. In particular, our medical device products are often used in surgical and intensive care settings with seriously ill patients. In addition, many of our products are designed to be implanted in the human body for varying periods of time. Product defects or inadequate disclosure of product-related risks with respect to products we manufacture or sell could result in patient injury or death. Product liability and warranty claims often involve very large or indeterminate amounts, including punitive damages. The magnitude of potential losses from product liability lawsuits may remain unknown for substantial periods of time, and the cost to defend against these lawsuits may be significant. We could experience material warranty or product liability losses in the future and incur significant costs to defend these claims.
In addition, if any of our products are, or are alleged to be, defective, we may voluntarily participate, or be required by regulatory authorities to participate, in a recall of that product. In the event of a recall, we may experience lost sales and be exposed to individual or class-action litigation claims. Moreover, our reputation could be damaged if one or more of our products are, or are alleged to be, defective. Product liability, warranty and recall costs may have a material adverse effect on our business, financial condition and results of operations.
We are subject to extensive government regulation, which may require us to incur significant expenses to ensure compliance. Our failure to comply with those regulations could have a material adverse effect on our business, results of operations and financial condition.
Our products are classified as medical devices and are subject to extensive regulation in the United States by the FDA and by comparable government agencies in other countries. The regulations govern the development, design, approval, manufacturing, labeling, importing and exporting and sale and marketing of many of our products. Moreover, these regulations are subject to future change. Failure to comply with applicable regulations could lead to manufacturing shutdowns, product shortages, delays in product manufacturing, product seizures, recalls, operating restrictions, withdrawal or suspension of required licenses, and prohibitions against exporting of products to, or importing
15
Table of Contents
products from, countries outside the United States. We could be required to expend significant financial and human resources to remediate failures to comply with applicable regulations and quality assurance guidelines. In addition, civil and criminal penalties, including exclusion under Medicaid or Medicare, could result from regulatory violations. Any one or more of these events could have a material adverse effect on our business, financial condition and results of operations.
In the United States, before we can market a new medical device, or a new use of, or claim for, or significant modification to, an existing product, we generally must first receive either 510(k) clearance or approval of a premarket approval, or PMA, application from the FDA. In order for us to obtain 510(k) clearance, the FDA must determine that our proposed product is “substantially equivalent” to a device legally on the market, known as a “predicate” device, with respect to intended use, technology and safety and effectiveness. Obtaining PMA approval is more difficult, requiring us to demonstrate the safety and effectiveness of the device based, in part, on data obtained in human clinical trials. Similarly, most major markets for medical devices outside the United States also require clearance, approval or compliance with certain standards before a product can be commercially marketed. The process of obtaining regulatory clearances and approvals to market a medical device, particularly from the FDA and certain foreign governmental authorities, can be costly and time consuming, and clearances and approvals might not be granted for new products on a timely basis, if at all. In addition, once a device has been cleared or approved, a new clearance or approval may be required before the device may be modified or its labeling changed. Furthermore, the FDA or a foreign governmental authority may make its review and clearance or approval process more rigorous, which could require us to generate additional clinical or other data, and expend more time and effort, in obtaining future product clearances or approvals. The regulatory clearance and approval process may result in, among other things, delayed realization of product revenues, substantial additional costs or limitations on indicated uses of products, any one of which could have a material adverse effect on our financial condition and results of operations.
Even after a product has received marketing approval or clearance, such product approval or clearance can be withdrawn or limited due to unforeseen problems with the device or issues relating to its application. Violations of FDA requirements for medical devices could result in FDA enforcement actions, including warning letters, fines, delays in obtaining new regulatory clearances, product seizures or recalls, injunctions, advisories or other field actions, and/or operating restrictions. Medical devices are cleared or approved for one or more specific intended uses. Promoting a device for an off-label use could result in government enforcement action.
Furthermore, our facilities are subject to periodic inspection by the FDA and other federal, state and foreign government authorities, which require manufacturers of medical devices to adhere to certain regulations, including the FDA’s Quality System Regulation, which requires periodic audits, design controls, quality control testing and documentation procedures, as well as complaint evaluations and investigation. The FDA also requires the reporting of certain adverse events and may require the reporting of recalls or other field safety corrective actions. Issues identified through such inspections and reports may result in warning letters, manufacturing shutdowns, product shortages, product seizures or recalls, fines and delays in product manufacturing, and may require significant resources to resolve.
We may not be successful in achieving expected operating efficiencies and sustaining or improving operating expense reductions, and may experience business disruptions associated with restructuring, facility consolidations, realignment, cost reduction and other strategic initiatives.
Over the past several years we have implemented a number of restructuring, realignment and cost reduction initiatives, including the realignment of our North American organizational structure, facility consolidations and reductions in our workforce. While we have realized some efficiencies from these actions, we may not realize the benefits of these initiatives to the extent we anticipated. Further, such
16
Table of Contents
benefits may be realized later than expected, and the ongoing difficulties in implementing these measures may be greater than anticipated, which could cause us to incur additional costs or result in business disruptions. In addition, if these measures are not successful or sustainable, we may undertake additional realignment and cost reduction efforts, which could result in significant additional charges. Moreover, if our restructuring and realignment efforts prove ineffective, our ability to achieve our other strategic goals and business plans may be adversely affected.
In addition, as part of our efforts to increase operating efficiencies, we commenced efforts in 2012 to transition our businesses to a single enterprise resource planning, or ERP, system. In the event we encounter any problems with this transition, we could experience business disruptions, which could adversely affect customer relationships and divert the attention of management away from daily operations. In addition, any delays in the implementation of the ERP system could cause us to incur additional unexpected costs. Should we experience such difficulties, our business, cash flows and results of operations could be adversely affected.
Our strategic initiatives, including acquisitions, may not produce the intended growth in revenue and operating income.
Our strategies include making significant investments to achieve revenue growth and margin improvement targets. If we do not achieve the expected benefits from these investments or otherwise fail to execute on our strategic initiatives, we may not achieve the growth improvement we are targeting and our results of operations may be adversely affected.
In addition, as part of our strategy for growth, we have made, and may continue to make, acquisitions and divestitures and enter into strategic alliances such as joint ventures and joint development agreements. However, we may not be able to identify suitable acquisition candidates, complete acquisitions or integrate acquisitions successfully, and our strategic alliances may not prove to be successful. In this regard, acquisitions involve numerous risks, including difficulties in the integration of acquired operations, technologies, services and products and the diversion of management’s attention from other business concerns. Although our management will endeavor to evaluate the risks inherent in any particular transaction, there can be no assurance that we will identify all such risks or the magnitude of the risks. In addition, prior acquisitions have resulted, and future acquisitions could result, in the incurrence of substantial additional indebtedness and other expenses. Future acquisitions may also result in potentially dilutive issuances of equity securities. There can be no assurance that difficulties encountered with acquisitions will not have a material adverse effect on our business, financial condition and results of operations.
An interruption in our manufacturing or distribution operations or our supply of raw materials may adversely affect our business.
Many of our key products are manufactured at or distributed from single locations, and the availability of alternate facilities is limited. If operations at one or more of our facilities is suspended due to natural disasters or other events, we may not be able to timely manufacture or distribute the relevant products at previous levels or at all. In addition, in the event of delays or cancellations in shipments of raw materials by our suppliers, we may not be able to timely manufacture or supply the affected products at previous levels or at all. Furthermore, our ability to establish replacement facilities or to substitute suppliers may be delayed due to regulations and requirements of the FDA and other regulatory authorities regarding the manufacture of our products. A reduction or interruption in manufacturing or distribution, or our inability to secure suitable alternative sources of raw materials or components, could have a material adverse effect on our business, results of operations and financial condition.
Our ability to attract, train, develop and retain key employees is important to our success.
Our success depends, in part, on our ability to continue to retain our key personnel, including our executive officers and other members of our senior management team. Our success also depends, in
17
Table of Contents
part, on our ability to attract, train, develop and retain other key employees, including research and development, sales, marketing and operations personnel. Achieving this objective may be difficult due to many factors, including:
| • |
the intense competition for skilled personnel in our industry; |
| • |
fluctuations in global economic and industry conditions; |
| • |
changes in our organizational structure; |
| • |
our restructuring initiatives; |
| • |
competitors’ hiring practices; and |
| • |
the effectiveness of our compensation programs. |
Our inability to attract, train, develop and retain such personnel could have an adverse effect on our results of operations and financial condition.
The ongoing volatility in the domestic and global financial markets, including the European sovereign debt crisis, combined with a continuation of constrained global credit markets could adversely impact our operating results, financial condition and liquidity.
We are subject to risks arising from adverse changes in general domestic and global economic conditions, including the economic slowdown and disruption of credit markets in recent years. In particular, the European sovereign debt crisis and its collateral effects on global financial markets may have a negative impact on our business. The credit and capital markets experienced extreme volatility and disruption in recent years, leading to recessionary conditions and depressed levels of consumer and commercial spending. These recessionary conditions have caused customers to reduce, delay or cancel purchases of our products and services. While recent economic indicators suggest improvement in the United States and global economy, we cannot predict the duration or extent of any economic recovery or the extent to which our customers will return to more normalized spending behaviors. If the recessionary conditions worsen, our customers may terminate existing purchase orders or reduce the volume of products or services they purchase from us.
Adverse economic and financial market conditions may also cause our suppliers to be unable to meet their commitments to us or may cause them to make changes in the credit terms they extend to us, such as shortening the required payment period for our accounts payable or reducing the maximum amount of trade credit available to us. These types of actions could significantly affect our liquidity and could have a material adverse effect on our results of operations.
Additionally, our customers, particularly in the European region, have extended or delayed payments for products and services already provided, which may lead to collectability concerns regarding our accounts receivable from these customers. We currently do not foresee any difficulties in meeting our cash requirements or accessing credit as needed in the next twelve months. To date, we have not experienced an inordinate amount of payment defaults by our customers, and we have sufficient lending commitments in place to enable us to fund our anticipated additional operating needs. However, in light of the ongoing volatility in the domestic and global financial markets, including the European sovereign debt crisis, combined with a continuation of constrained global credit markets there is a risk that our customers and suppliers may be unable to access liquidity. As of December 31, 2012 and December 31, 2011, our aggregate net receivables in Italy, Spain, Portugal and Greece were $101.0 million and $108.5 million, respectively. In 2012, 2011 and 2010, net revenues from these countries was approximately 9% of total net revenues in each of the years, and average days that accounts receivable were outstanding were 288, 318 and 217 days, respectively. Although we maintain allowances for doubtful accounts to cover the estimated losses which may occur when customers cannot make their required payments, we cannot be assured that we will continue to experience the same loss rate in the future given the volatility in the worldwide economy. If our allowance for doubtful
18
Table of Contents
accounts is insufficient to address receivables we ultimately determine are uncollectible, we would be required to incur additional charges, which could materially adversely affect our operating results. Moreover, our inability to collect outstanding receivables could adversely affect our financial condition and cash flow from operations.
In addition, adverse economic and financial market conditions may result in future charges to recognize impairment in the carrying value of our goodwill and other intangible assets, which would not directly affect our liquidity but could have a material adverse effect on our reported financial results.
We are subject to healthcare fraud and abuse laws, regulation and enforcement; our failure to comply with those laws could have a material adverse effect on our results of operations and financial condition.
We are subject to healthcare fraud and abuse regulation and enforcement by the federal government and the states and foreign governments in which we conduct our business. The laws that may affect our ability to operate include:
| • |
the federal healthcare programs’ Anti-Kickback Law, which prohibits, among other things, persons from knowingly and willfully offering or paying remuneration to induce either the referral of an individual for, or the purchase, order or recommendation of, any good or service for which payment may be made under federal healthcare programs such as the Medicare and Medicaid programs, or soliciting payment for such referrals, purchases, orders and recommendations; |
| • |
federal false claims laws which prohibit, among other things, individuals or entities from knowingly presenting, or causing to be presented, false or fraudulent claims for payment from Medicare, Medicaid, or other third-party payors; |
| • |
the federal Health Insurance Portability and Accountability Act of 1996 (“HIPAA”), which prohibit schemes to defraud any healthcare benefit program and false statements relating to healthcare matters; and |
| • |
state law equivalents of each of the above federal laws, such as anti-kickback and false claims laws which may apply to items or services reimbursed by any third-party payor, including commercial insurers. |
If our operations are found to be in violation of any of the laws described above or any other governmental regulations, we may be subject to penalties, including civil and criminal penalties, damages, fines, the curtailment or restructuring of our operations, the exclusion from participation in federal and state healthcare programs and imprisonment, any of which could adversely affect our ability to operate our business and our financial results. The risk of our being found in violation of these laws is increased by the fact that many of them have not been fully interpreted by the regulatory authorities or the courts, and their provisions are open to a variety of interpretations.
Further, the Patient Protection and Affordable Care Act, as amended by the Health Care and Education Affordability Reconciliation Act (collectively, the “Healthcare Reform Act”), imposes new reporting and disclosure requirements on device manufacturers for any “transfer of value” made or distributed to prescribers and other healthcare providers, effective March 30, 2013. Such information will be made publicly available in a searchable format beginning September 30, 2013. In addition, device manufacturers will also be required to report and disclose any investment interests held by physicians and their immediate family members during the preceding calendar year. Failure to submit required information may result in civil monetary penalties of up to an aggregate of $150,000 per year (and up to an aggregate of $1 million per year for “knowing failures”), for all payments, transfers of value or ownership or investment interests not reported in an annual submission.
In addition, there has been a recent trend of increased federal and state regulation of payments made to healthcare providers. Some states, such as California, Massachusetts and Vermont, mandate implementation of compliance programs that include the tracking and reporting of gifts, compensation
19
Table of Contents
for consulting and other services, and other remuneration to healthcare providers. The shifting commercial compliance environment and the need to build and maintain robust and expandable systems to comply with multiple jurisdictions with different compliance and/or reporting requirements increases the possibility that a healthcare company may run afoul of one or more of the requirements and may result in increased compliance costs, which could adversely impact our results of operations.
Health care reform may have a material adverse effect on our industry and our business.
Political, economic and regulatory developments have effected fundamental changes in the healthcare industry. The Healthcare Reform Act, enacted in March 2010, substantially changes the way health care is financed by both government and private insurers, encourages improvements in the quality of health care products and services, and significantly impacts the U.S. pharmaceutical and medical device industries. Among other things, the Healthcare Reform Act:
| • |
establishes a 2.3% deductible excise tax on sales of medical devices with respect to any entity that manufactures or imports specified medical devices offered for sale in the United States, beginning in 2013; |
| • |
establishes a new Patient-Centered Outcomes Research Institute to oversee, identify priorities in and conduct comparative clinical effectiveness research; |
| • |
implements payment system reforms, including a national pilot program to encourage hospitals, physicians and other providers to improve the coordination, quality and efficiency of certain health care services through bundled payment models; and |
| • |
creates an independent payment advisory board that will submit recommendations to reduce Medicare spending if projected Medicare spending exceeds a specified growth rate. |
Based on our current product portfolio and sales volumes, we currently estimate the impact of the 2.3% deductible excise tax to be approximately $15.0 million annually. However, we cannot predict at this time the full impact of the Healthcare Reform Act or other healthcare reform measures that may be adopted in the future on our financial condition, results of operations and cash flow.
We depend upon relationships with physicians and other health care professionals.
Research and development for some of our products is dependent on our maintaining strong working relationships with physicians and other healthcare professionals. We rely on these professionals to provide us with considerable knowledge and experience regarding the development and use of our products. Physicians assist us as researchers, product consultants, inventors and public speakers. If we fail to maintain our working relationships with physicians and receive the benefits of their knowledge and advice, our products may not be developed in a manner that is responsive to the needs and expectations of the professionals who use and support our products, which could have a material adverse effect on our business, financial condition and results of operations.
We are subject to risks associated with our non-U.S. operations.
We have significant manufacturing and distribution facilities, research and development facilities, sales personnel and customer support operations outside the United States in a number of countries, including Canada, Belgium, the Czech Republic, France, Germany, Ireland, Malaysia, Mexico, and Singapore. As of December 31, 2012, approximately 39% of our net property, plant and equipment was located outside the United States and 73% of our full-time and temporary employees were employed in countries outside of the United States. In addition, in 2012, approximately 49% of our net revenues (based on business unit location) were derived from operations outside the United States.
Our international operations are subject to risks inherent in doing business outside the United States, including:
| • |
exchange controls, currency restrictions and fluctuations in currency values; |
| • |
trade protection measures; |
20
Table of Contents
| • |
potentially costly and burdensome import or export requirements; |
| • |
laws and business practices that favor local companies; |
| • |
changes in non-U.S. medical reimbursement policies and procedures; |
| • |
subsidies or increased access to capital for firms that currently are or may emerge as competitors in countries in which we have operations; |
| • |
substantial foreign tax liabilities, including potentially negative consequences from changes in tax laws; |
| • |
restrictions and taxes related to the repatriation of foreign earnings; |
| • |
differing labor regulations; |
| • |
additional U.S. and foreign government controls or regulations; |
| • |
difficulties in the protection of intellectual property; and |
| • |
unsettled political and economic conditions and possible terrorist attacks against American interests. |
In addition, the U.S. Foreign Corrupt Practices Act (the “FCPA”) and similar worldwide anti-bribery laws in non-U.S. jurisdictions generally prohibit companies and their intermediaries from making improper payments to non-U.S. officials for the purpose of obtaining or retaining business. The FCPA also imposes accounting standards and requirements on publicly traded U.S. corporations and their foreign affiliates, which, among other things, are intended to prevent the diversion of corporate funds to the payment of bribes and other improper payments, and to prevent the establishment of “off the books” slush funds from which such improper payments can be made. Because of the predominance of government-sponsored health care systems around the world, many of our customer relationships outside of the United States are with governmental entities and are therefore subject to such anti-bribery laws. Our policies mandate compliance with these anti-bribery laws. However, despite meaningful measures that we undertake to facilitate lawful conduct, which include training and compliance programs and internal control policies and procedures, we may not always prevent reckless or criminal acts by our employees or agents, or employees or agents of businesses or operations we may acquire. Violations of these laws, or allegations of such violations, could disrupt our operations, involve significant management distraction and have a material adverse effect on our business, financial condition and results of operations. We also could be subject to severe penalties, including criminal and civil penalties, disgorgement, further changes or enhancements to our procedures, policies and controls, personnel changes and other remedial actions.
Furthermore, we are subject to the export controls and economic embargo rules and regulations of the United States, including the Export Administration Regulations and trade sanctions against embargoed countries, which are administered by the Office of Foreign Assets Control within the Department of the Treasury, as well as other laws and regulations administered by the Department of Commerce. These regulations limit our ability to market, sell, distribute or otherwise transfer our products or technology to prohibited countries or persons. While we train our employees and contractually obligate our distributors to comply with these regulations, we cannot assure that a violation will not occur, whether knowingly or inadvertently. Failure to comply with these rules and regulations may result in substantial civil and criminal penalties, including fines and the disgorgement of profits, the imposition of a court-appointed monitor, the denial of export privileges and debarment from participation in U.S. government contracts.
The risks relating to our foreign operations may have a material adverse effect on our international operations or on our business, results of operations and financial condition generally.
21
Table of Contents
Foreign currency exchange rate, commodity price and interest rate fluctuations may adversely affect our results.
We are exposed to a variety of market risks, including the effects of changes in foreign currency exchange rates, commodity prices and interest rates. We expect revenue from products manufactured in, and sold into, non-U.S. markets to continue to represent a significant portion of our net revenue. Our consolidated financial statements reflect translation of financial statements denominated in non-U.S. currencies to U.S. dollars, our reporting currency. When the U.S. dollar strengthens or weakens in relation to the foreign currencies of the countries where we sell or manufacture our products, such as the euro, our U.S. dollar-reported revenue and income will fluctuate. Although we have entered into forward contracts with several major financial institutions to hedge a portion of projected cash flows denominated in non-functional currency in order to reduce the effects of currency rate fluctuations, changes in the relative values of currencies may, in some instances, have a significant effect on our results of operations.
Many of our products have significant plastic resin content. We also use quantities of other commodities, such as aluminum. Increases in the prices of these commodities could increase the costs of our products and services. We may not be able to pass on these costs to our customers, particularly with respect to those products we sell under group purchase agreements, which could have a material adverse effect on our results of operations and cash flows.
Increases in interest rates may adversely affect the financial health of our customers and suppliers and thus adversely affect their ability to buy our products and supply the components or raw materials we need, which could have a material adverse effect on our results of operations and cash flows.
Fluctuations in our effective tax rate and changes to tax laws may adversely affect our results.
As a company with significant operations outside of the United States, we are subject to taxation in numerous countries, states and other jurisdictions. Our effective tax rate is derived from a combination of applicable tax rates in the various countries, states and other jurisdictions in which we operate. In preparing our financial statements, we estimate the amount of tax that will become payable in each of the jurisdictions in which we operate. Our effective tax rate may, however, differ from the estimated amount due to numerous factors, including a change in the mix of our profitability from country to country, changes in accounting for income taxes and changes in tax laws. Any of these factors could cause us to experience an effective tax rate significantly different from previous periods or our current expectations, which could have an adverse effect on our business and results of operations.
In addition, unfavorable results of tax audits and changes in tax laws in jurisdictions in which we operate could adversely affect our results of operations and cash flows.
Our technology is important to our success, and our failure to protect our intellectual property rights could put us at a competitive disadvantage.
We rely on the patent, trademark, copyright and trade secret laws of the United States and other countries to protect our proprietary rights. Although we own numerous U.S. and foreign patents and have submitted numerous patent applications, we cannot be assured that any pending patent applications will issue, or that any patents, issued or pending, will provide us with any competitive advantage or will not be challenged, invalidated or circumvented by third parties. In addition, we rely on confidentiality and non-disclosure agreements with employees and take other measures to protect our know-how and trade secrets. The steps we have taken may not prevent unauthorized use of our technology by competitors or other persons who may copy or otherwise obtain and use these products or technology, particularly in foreign countries where the laws may not protect our proprietary rights as fully as in the United States. There is no guarantee that current and former employees, contractors and other parties will not breach their confidentiality agreements with us, misappropriate proprietary information or copy or otherwise obtain and use our information and proprietary technology without
22
Table of Contents
authorization or otherwise infringe on our intellectual property rights. Moreover, there can be no assurance that others will not independently develop the know-how and trade secrets or develop better technology than our own, which could reduce or eliminate any competitive advantage we have developed. Our inability to protect our proprietary technology could adversely affect our business.
Our products or processes may infringe the intellectual property rights of others, which may cause us to pay unexpected litigation costs or damages or prevent us from selling our products.
We cannot be certain that our products do not and will not infringe issued patents or other intellectual property rights of third parties. We may be subject to legal proceedings and claims in the ordinary course of our business, including claims of alleged infringement of the intellectual property rights of third parties. Any such claims, whether or not meritorious, could result in litigation and divert the efforts of our personnel. If we are found liable for infringement, we may be required to enter into licensing agreements (which may not be available on acceptable terms or at all) or to pay damages and to cease making or selling certain products. We may need to redesign some of our products or processes to avoid future infringement liability. Any of the foregoing could be detrimental to our business.
Other pending and future litigation may lead us to incur significant costs and have an adverse effect on our business.
We also are party to various lawsuits and claims arising in the normal course of business involving, among other things, contracts, intellectual property, import and export regulations, employment and environmental matters. The defense of these lawsuits may divert our management’s attention, and we may incur significant expenses in defending these lawsuits. In addition, we may be required to pay damage awards or settlements, or become subject to injunctions or other equitable remedies, that could have a material adverse effect on our financial condition and results of operations. While we do not believe that any litigation in which we are currently engaged would have such an adverse effect, the outcome of litigation, including regulatory matters, is often difficult to predict, and we cannot assure that the outcome of pending or future litigation will not have a material adverse effect on our business, financial condition or results of operations.
Our operations expose us to the risk of material environmental liabilities.
We are subject to numerous foreign, federal, state and local environmental protection and health and safety laws governing, among other things:
| • |
the generation, storage, use and transportation of hazardous materials; |
| • |
emissions or discharges of substances into the environment; and |
| • |
the health and safety of our employees. |
These laws and regulations are complex, change frequently and have tended to become more stringent over time. We cannot provide assurance that our costs of complying with current or future environmental protection and health and safety laws, or our liabilities arising from past or future releases of, or exposures to, hazardous substances will not exceed our estimates or will not adversely affect our financial condition and results of operations. Moreover, we may become subject to additional environmental claims, which may include claims for personal injury or cleanup, based on our past, present or future business activities, which could also adversely affect our financial condition and results of operations.
Our workforce covered by collective bargaining and similar agreements could cause interruptions in our provision of products and services.
For the fiscal year ended December 31, 2012, approximately 5% of our net revenues were generated by operations for which a significant part of our workforce is covered by collective bargaining
23
Table of Contents
agreements and similar agreements in foreign jurisdictions. It is likely that a portion of our workforce will remain covered by collective bargaining and similar agreements for the foreseeable future. Strikes or work stoppages could occur that would adversely impact our relationships with our customers and our ability to conduct our business.
Our substantial indebtedness could adversely affect our business, financial condition or results of operations.
As of December 31, 2012, we had total consolidated indebtedness of $970.0 million.
Our substantial level of indebtedness increases the risk that we may be unable to generate cash sufficient to pay amounts due in respect of our indebtedness. It could also have significant effects on our business. For example, it could:
| • |
increase our vulnerability to general adverse economic and industry conditions; |
| • |
require us to dedicate a substantial portion of our cash flow from operations to payments on our indebtedness, thereby reducing the availability of our cash flow to fund working capital, capital expenditures, research and development efforts and other general corporate purposes; |
| • |
limit our ability to borrow additional funds for such general corporate purposes; |
| • |
limit our flexibility in planning for, or reacting to, changes in our business and the industry in which we operate; |
| • |
restrict us from exploiting business opportunities; and |
| • |
place us at a competitive disadvantage compared to our competitors that have less indebtedness. |
If we do not generate sufficient cash flow from operations or if future borrowings are not available to us in an amount sufficient to pay our indebtedness or to fund our other liquidity needs, we may be forced to:
| • |
refinance all or a portion of our indebtedness on or before the maturity thereof; |
| • |
sell assets; |
| • |
reduce or delay capital expenditures; or |
| • |
seek to raise additional capital. |
We may not be able to effect any of these actions on commercially reasonable terms or at all. Our ability to refinance our indebtedness will depend on our financial condition at the time, the restrictions in the instruments governing our outstanding indebtedness and other factors, including market conditions.
Our inability to generate sufficient cash flow to satisfy our debt service obligations, or to refinance or restructure our obligations on commercially reasonable terms or at all, could have a material adverse effect on our business, financial condition and results of operations.
Our debt agreements impose restrictions on our business, which could prevent us from capitalizing on business opportunities and taking some corporate actions and may adversely affect our ability to respond to changes in our business and manage our operations.
The credit agreement governing our credit facilities and the indenture governing our 6.875% senior subordinated notes contain covenants that, among other things, impose significant restrictions on our business. The restrictions that these covenants place on us and our restricted subsidiaries include limitations on our and their ability to:
| • |
incur additional indebtedness or issue disqualified stock or preferred stock; |
| • |
create liens; |
24
Table of Contents
| • |
pay dividends, make investments or make other restricted payments; |
| • |
sell assets; |
| • |
merge, consolidate, sell or otherwise dispose of all or substantially all of our assets; |
| • |
enter into transactions with our affiliates; |
| • |
permit layering of debt; |
| • |
designate subsidiaries as unrestricted; and |
| • |
use the proceeds of permitted sales of our assets. |
In addition, the credit agreement governing our credit facilities also contains financial covenants. A breach of any covenants under any one or more of these debt agreements could result in a default, which if not cured or waived, could result in the acceleration of all our debts. In addition, any debt agreements we enter into in the future may further limit our ability to enter into certain types of transactions.
We may not pay dividends on our common stock in the future.
Holders of our common stock are entitled to receive dividends only as our board of directors may declare out of funds legally available for such payments. The declaration and payment of future dividends to holders of our common stock will be at the discretion of our board of directors and will depend upon many factors, including our financial condition, earnings, compliance with debt instruments, legal requirements and other factors as our board of directors deems relevant. We cannot assure you that our cash dividend will not be reduced, or eliminated, in the future.
The contingent conversion features of our convertible notes, if triggered, may adversely affect our financial condition.
In August 2010, we issued $400 million in aggregate principal amount of convertible senior subordinated notes due 2017, which we refer to as the “Convertible Notes.” The Convertible Notes are convertible under certain circumstances, including the attainment of 130% of the conversion price (approximately $79.72) of the Company’s closing stock price during a certain number of days at the end of a fiscal quarter. The Company’s closing stock price has recently approached this amount, which increases the possibility that the Convertible Notes could become convertible in the near future, at which point the Convertible Notes would be classified as a current liability and would result in a material reduction of our net working capital. The Company has elected a net settlement method to satisfy its conversion obligation, under which the Company may settle the principal amount of the Convertible Notes in cash and settle the excess conversion value in shares, plus cash in lieu of fractional shares. The Company believes that it has the ability to raise sufficient cash to repay the principal amounts due through a combination of utilizing our existing cash on hand, accessing our credit facility, or raising money in the capital markets, however, doing so could adversely affect our results of operations and liquidity. See “Convertible Notes” under Note 9 to our consolidated financial statements included in this Annual Report on Form 10-K for a further discussion regarding the conversion terms of the Convertible Notes.
The convertible note hedge transactions and warrant transactions entered into in connection with the issuance of our Convertible Notes may affect the value of our common stock.
In connection with our issuance of the Convertible Notes, we entered into privately negotiated hedge transactions with third parties, which we refer to as the hedge counterparties. The hedge transactions cover, subject to customary anti-dilution adjustments, the number of shares of our common stock that underlie the Convertible Notes and are expected to reduce our exposure to potential dilution with respect to our common stock and/or reduce our exposure to potential cash
25
Table of Contents
payments that may be required to be made by us upon conversion of the Convertible Notes. Separately, we also entered into privately negotiated warrant transactions relating to the same number of shares of our common stock with the hedge counterparties with a strike price of $74.648, subject to customary anti-dilution adjustments, pursuant to which we may be obligated to issue shares of our common stock. The warrant transactions could have a dilutive effect with respect to our common stock or, if we so elect, obligate us to make cash payments to the extent that the market price per share of our common stock exceeds the strike price of the warrants on any expiration date of the warrants.
In connection with establishing its initial hedges of the convertible note hedge transactions and the warrant transactions, the hedge counterparties (and/or their affiliates) entered into various cash-settled over-the-counter derivative transactions with respect to our common stock concurrently with, or shortly following, the pricing of the Convertible Notes. The hedge counterparties (and/or their affiliates) may, in their sole discretion, with or without notice, modify their hedge positions from time to time (and are likely to do so during any conversion period related to the conversion of the Convertible Notes) by entering into or unwinding various over-the-counter derivative transactions with respect to shares of our common stock, and/or by purchasing or selling shares of our common stock or Convertible Notes in privately negotiated transactions and/or open market transactions. The effect, if any, of these transactions and activities on the market price of our common stock will depend in part on market conditions and cannot be ascertained at this time, but any of these activities could adversely affect the value of our common stock.
We are subject to counterparty risk with respect to the convertible note hedge transactions.
Each hedge counterparty is a financial institution or the affiliate of a financial institution, and we will be subject to the risk that one or more hedge counterparties may default under the Convertible Note hedge transactions. Our exposure to the credit risk of each hedge counterparty will not be secured by any collateral. If a hedge counterparty becomes subject to insolvency proceedings, we will become an unsecured creditor in those proceedings with a claim equal to our exposure at that time under the Convertible Note hedge transaction with that hedge counterparty. Our exposure will depend on many factors but, generally, the increase in our exposure will be correlated to the increase in our stock market price and in volatility of our common stock. In addition, upon a default by a hedge counterparty, we may suffer adverse tax consequences and dilution with respect to our common stock. We can provide no assurances as to the financial stability or viability of the hedge counterparties.
We may issue additional shares of our common stock or instruments convertible into our common stock, including in connection with conversions of our Convertible Notes, which could lower the price of our common stock.
We are not restricted from issuing additional shares of our common stock or other instruments convertible into our common stock. As of December 31, 2012, we had outstanding approximately 41.0 million shares of our common stock, options to purchase approximately 1.1 million shares of our common stock (of which approximately 0.6 million were vested as of that date), approximately 0.4 million of restricted stock awards (which are expected to vest over the next three years) and approximately 20,000 shares of our common stock to be distributed from our deferred compensation plan. In addition, a substantial number of shares of our common stock is reserved for issuance upon the exercise of stock options, upon conversion of the Convertible Notes and upon the exercise of the warrants issued in connection with the Convertible Notes. We cannot predict the size of future issuances or the effect, if any, that they may have on the market price for our common stock.
If we issue additional shares of our common stock or instruments convertible into our common stock, it may materially and adversely affect the price of our common stock. Furthermore, the conversion of some or all of the Convertible Notes may dilute the ownership interests of existing stockholders, and any sales in the public market of such shares of our common stock issuable upon any conversion of the Convertible Notes could adversely affect prevailing market prices of our common stock. In addition, the anticipated issuance and sale of substantial amounts of common stock or
26
Table of Contents
conversion of the Convertible Notes into shares of our common stock could depress the price of our common stock.
Certain provisions of our corporate governing documents, Delaware law and our Convertible Notes could discourage, delay, or prevent a merger or acquisition.
Provisions of our certificate of incorporation and bylaws could impede a merger, takeover or other business combination involving us or discourage a potential acquirer from making a tender offer for our common stock. For example, our certificate of incorporation authorizes our board of directors to determine the number of shares in a series, the consideration, dividend rights, liquidation preferences, terms of redemption, conversion or exchange rights and voting rights, if any, of unissued series of preferred stock, without any vote or action by our stockholders. Thus, our board of directors can authorize and issue shares of preferred stock with voting or conversion rights that could adversely affect the voting or other rights of holders of our common stock. We are also subject to Section 203 of the Delaware General Corporation Law, which imposes restrictions on mergers and other business combinations between us and any holder of 15% or more of our common stock. These provisions could have the effect of delaying or deterring a third party to acquire us even if an acquisition might be in the best interest of our stockholders, and accordingly could reduce the market price of our common stock.
Certain provisions in the Convertible Notes and the indenture governing the Convertible Notes could make it more difficult or more expensive for a third party to acquire us. For example, if an acquisition event constitutes a “fundamental change,” as defined in the indenture, holders of the Convertible Notes will have the right to require us to purchase their notes in cash. In addition, if an acquisition event constitutes a “make-whole fundamental change,” as defined in the indenture, we may be required to increase the conversion rate for holders who convert their notes in connection with such acquisition event. In either case, and in other cases, our obligations under the Convertible Notes and the indenture could increase the cost of acquiring us or otherwise discourage a third party from acquiring us or removing incumbent management, and accordingly could reduce the market price of our common stock.
|
|
STAFF COMMENTS |
Not applicable.
|
|
We own or lease approximately 72 properties consisting of plants, engineering and research centers, distribution warehouses, offices and other facilities. We believe that the properties are maintained in good operating condition and are suitable for their intended use. In general, our facilities meet current operating requirements for the activities currently conducted therein.
27
Table of Contents
Our major facilities are as follows:
|
Location |
Square
Footage |
Owned or
Leased |
||||||
|
Olive Branch, MS |
428,000 | Leased | ||||||
|
Haslet, TX |
303,000 | Leased | ||||||
|
Nuevo Laredo, Mexico |
277,000 | Leased | ||||||
|
Asheboro, NC |
204,000 | Owned | ||||||
|
Durham, NC |
199,000 | Leased | ||||||
|
Reading, PA |
166,000 | Owned | ||||||
|
Chihuahua, Mexico |
154,000 | Owned | ||||||
|
Research Triangle Park, NC |
147,000 | Owned | ||||||
|
Kernen, Germany |
145,000 | Leased | ||||||
|
Zdar nad Sazavou, Czech Republic |
108,000 | Owned | ||||||
|
Tongeren, Belgium |
108,000 | Leased | ||||||
|
Kamunting, Malaysia |
102,000 | Owned | ||||||
|
Everett, MA |
100,000 | Leased | ||||||
|
Tecate, Mexico |
96,000 | Leased | ||||||
|
Hradec Kralove, Czech Republic |
92,000 | Owned | ||||||
|
Arlington Heights, IL |
86,000 | Leased | ||||||
|
Kamunting, Malaysia |
82,000 | Leased | ||||||
|
Kernen, Germany |
73,000 | Owned | ||||||
|
Wyomissing, PA |
66,000 | Leased | ||||||
|
Jaffrey, NH |
65,000 | Owned | ||||||
|
Limerick, Ireland |
54,000 | Leased | ||||||
|
Bad Liebenzell, Germany |
53,000 | Leased | ||||||
|
Ramseur, NC |
52,000 | Leased | ||||||
|
Asheboro, NC |
50,000 | Leased | ||||||
In addition to the properties listed above, we own or lease approximately 700,000 square feet of warehousing, manufacturing and office space located in the United States, Canada, Mexico, South America, Europe, Asia and Africa. We also own or lease several properties that are no longer being used in our operations, which we are actively marketing for sale or sublease. At December 31, 2012, three unused owned properties were classified as held for sale.
In December 2012, we entered into an agreement for the lease of approximately 84,000 square feet of office space in Wayne, Pennsylvania, which we intend to use as our new corporate headquarters commencing in the first half of 2014. The lease has a term of 10 years and 8 months from the commencement date with an option to renew for an additional ten years.
|
|
PROCEEDINGS |
The Company is party to various lawsuits and claims arising in the normal course of business. These lawsuits and claims include actions involving product liability and product warranty, intellectual property, employment and environmental matters. As of December 31, 2012, the Company has recorded reserves of approximately $11.1 million in connection with such contingencies, representing our best estimate of the cost within the range of possible loss to resolve these matters. Based on information currently available, advice of counsel, established reserves and other resources, we do not believe that any such actions are likely to be, individually or in the aggregate, material to our business, financial condition, results of operations or liquidity. However, in the event of unexpected further developments, it is possible that the ultimate resolution of these matters, or other similar matters, if unfavorable, may be materially adverse to our business, financial condition, results of operations or liquidity.
|
|
SAFETY DISCLOSURES |
Not applicable.
28
Table of Contents
|
|
FOR REGISTRANT’S COMMON EQUITY, RELATED STOCKHOLDER MATTERS AND ISSUER PURCHASES OF EQUITY SECURITIES |
Our common stock is listed on the New York Stock Exchange, Inc. (symbol “TFX”). Our quarterly high and low stock prices and dividends for 2012 and 2011 are shown below.
Price Range and Dividends of Common Stock
|
2012 |
High | Low | Dividends | |||||||||
|
First Quarter |
$ | 63.91 | $ | 57.78 | $ | 0.34 | ||||||
|
Second Quarter |
$ | 64.79 | $ | 57.26 | $ | 0.34 | ||||||
|
Third Quarter |
$ | 70.78 | $ | 59.96 | $ | 0.34 | ||||||
|
Fourth Quarter |
$ | 71.59 | $ | 65.07 | $ | 0.34 | ||||||
|
2011 |
High | Low | Dividends | |||||||||
|
First Quarter |
$ | 61.58 | $ | 53.05 | $ | 0.34 | ||||||
|
Second Quarter |
$ | 64.05 | $ | 56.59 | $ | 0.34 | ||||||
|
Third Quarter |
$ | 64.56 | $ | 49.40 | $ | 0.34 | ||||||
|
Fourth Quarter |
$ | 62.22 | $ | 50.50 | $ | 0.34 | ||||||
The terms of our senior credit facility and our 6.875% senior subordinated notes due 2019 limit our ability to repurchase shares of our stock and pay cash dividends. Under the most restrictive of these provisions, on an annual basis $397 million of retained earnings was available for dividends and stock repurchases at December 31, 2012. On February 20, 2013, the Board of Directors declared a quarterly dividend of $0.34 per share on our common stock, which is payable on March 15, 2013 to holders of record on March 5, 2013. As of February 20, 2013, we had approximately 657 holders of record of our common stock.
On June 14, 2007, our Board of Directors authorized the repurchase of up to $300 million of our outstanding common stock. Through December 31, 2012, no shares have been purchased under this Board authorization. See “Stock Repurchase Programs” contained in “Management Discussion and Analysis of Financial Condition and Results of Operations” in Item 7 of this report for more information.
29
Table of Contents
Stock Performance Graph
The following graph provides a comparison of five year cumulative total stockholder returns of Teleflex common stock, the Standard & Poor’s (S&P) 500 Stock Index and the S&P 500 Healthcare Equipment & Supply Index. The annual changes for the five-year period shown on the graph are based on the assumption that $100 had been invested in Teleflex common stock and each index on December 31, 2007 and that all dividends were reinvested.
MARKET PERFORMANCE
Comparison of Cumulative Five Year Total Return
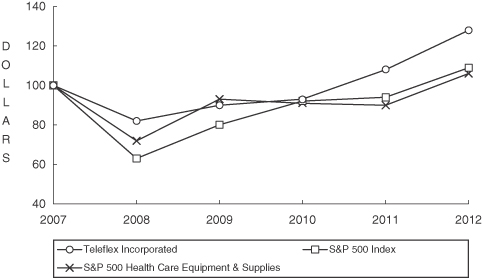
|
Company / Index |
2007 | 2008 | 2009 | 2010 | 2011 | 2012 | ||||||||||||||||||
|
Teleflex Incorporated |
100 | 82 | 90 | 93 | 108 | 128 | ||||||||||||||||||
|
S&P 500 Index |
100 | 63 | 80 | 92 | 94 | 109 | ||||||||||||||||||
|
S&P 500 Healthcare Equipment & Supply Index |
100 | 72 | 93 | 91 | 90 | 106 | ||||||||||||||||||
30
Table of Contents
|
|
FINANCIAL DATA |
The selected financial data in the following table includes the results of operations for acquired companies from the respective date of acquisition. See note (4) below for a description of special charges included in the 2008 financial results.
| 2012 | 2011 | 2010 | 2009 | 2008 | ||||||||||||||||
| (Dollars in thousands, except per share) | ||||||||||||||||||||
|
Statement of Income Data (1) : |
||||||||||||||||||||
|
Net revenues |
$ | 1,551,009 | $ | 1,492,528 | $ | 1,397,722 | $ | 1,394,906 | $ | 1,426,160 | ||||||||||
|
Income (loss) from continuing operations before interest, loss on extinguishments of debt and taxes |
$ | (97,375 | ) (2) | $ | 229,570 | $ | 230,290 | $ | 246,487 | $ | 201,156 | (4) | ||||||||
|
Income (loss) from continuing operations |
$ | (181,782 | ) (2) | $ | 119,322 | $ | 87,672 | (3) | $ | 124,189 | $ | 55,799 | (4) | |||||||
|
Amounts attributable to common shareholders for income (loss) from continuing operations |
$ | (182,737 | ) (2) | $ | 118,301 | $ | 86,811 | (3) | $ | 123,557 | $ | 55,358 | (4) | |||||||
|
Per Share Data (1) : |
||||||||||||||||||||
|
Income (loss) from continuing operations — basic |
$ | (4.47 | ) | $ | 2.92 | $ | 2.18 | (3) | $ | 3.11 | $ | 1.40 | ||||||||
|
Income (loss) from continuing operations — diluted |
$ | (4.47 | ) | $ | 2.90 | $ | 2.16 | (3) | $ | 3.09 | $ | 1.39 | ||||||||
|
Cash dividends |
$ | 1.36 | $ | 1.36 | $ | 1.36 | $ | 1.36 | $ | 1.34 | ||||||||||
|
Balance Sheet Data: |
||||||||||||||||||||
|
Total assets |
$ | 3,739,497 | $ | 3,924,103 | $ | 3,643,155 | $ | 3,839,005 | $ | 3,926,744 | ||||||||||
|
Long-term borrowings, less current portion |
$ | 965,280 | $ | 954,809 | $ | 813,409 | $ | 1,192,491 | $ | 1,437,538 | ||||||||||
|
Shareholders’ equity |
$ | 1,778,950 | $ | 1,980,588 | $ | 1,783,376 | $ | 1,580,241 | $ | 1,246,455 | ||||||||||
|
Statement of Cash Flows Data (1) : |
||||||||||||||||||||
|
Net cash provided by operating activities from continuing operations |
$ | 193,853 | $ | 94,357 | $ | 143,834 | (6) | $ | 113,999 | (6) | $ | 62,574 | (6) | |||||||
|
Net cash (used in) provided by investing activities from continuing operations |
$ | (385,854 | ) | $ | 300,723 | $ | 152,138 | $ | 288,877 | $ | (15,714 | ) | ||||||||
|
Net cash (used in) provided by financing activities from continuing operations |
$ | (47,292 | ) | $ | (5,159 | ) | $ | (335,499 | ) | $ | (401,918 | ) | $ | (180,327 | ) | |||||
|
Free cash flow (5) |
$ | 128,459 | $ | 49,775 | $ | 114,504 | $ | 89,200 | $ | 39,126 | ||||||||||
Certain financial information is presented on a rounded basis, which may cause minor differences.
| (1) | Amounts exclude the impact of certain businesses which have been presented in our consolidated financial results as discontinued operations. |
| (2) | Includes a pretax goodwill impairment charge of $332.1 million, or $315.1 million net of tax. See Note 5 to the consolidated financial statements included in this report for a discussion on the goodwill impairment charge. |
| (3) | Includes a $29.7 million, net of tax, or a $0.74 per share loss (basic and diluted) on extinguishments of debt. |
31
Table of Contents
| (4) | The table below sets forth the effect of the write-off of a fair value adjustment to inventory acquired through our acquisition of Arrow International, Inc. on our results for 2008. |
| 2008 Impact | ||||||||
|
Income
from
Continuing Operations Before Interest, Loss on Extinguishments of Debt and Taxes |
Income from
Continuing Operations |
|||||||
| (Dollars in thousands) | ||||||||
|
Write-off of inventory fair value adjustment |
$ | 6,936 | $ | 4,449 | ||||
| (5) | Free cash flow is calculated by subtracting capital expenditures from cash provided by operating activities from continuing operations. Free cash flow is considered a non-GAAP financial measure. We use this financial measure for internal managerial purposes, when publicly providing guidance on possible future results, and to evaluate period-to-period comparisons. This financial measure is used in addition to and in conjunction with results presented in accordance with GAAP and should not be relied upon to the exclusion of GAAP financial measures. Management believes that free cash flow is a useful measure to investors because it facilitates an assessment of funds available to satisfy current and future obligations, pay dividends and fund acquisitions. Free cash flow is not a measure of cash available for discretionary expenditures since we have certain non-discretionary obligations, such as debt service, that are not deducted from the measure. We strongly encourage investors to review our financial statements and publicly-filed reports in their entirety and not to rely on any single financial measure. The following is a reconciliation of free cash flow to the most comparable GAAP measure. |
| 2012 | 2011 | 2010 | 2009 | 2008 | ||||||||||||||||
| (Dollars in thousands) | ||||||||||||||||||||
|
Net cash provided by operating activities from continuing operations |
$ | 193,853 | $ | 94,357 | $ | 143,834 | $ | 113,999 | $ | 62,574 | ||||||||||
|
Less: Capital expenditures |
65,394 | 44,582 | 29,330 | 24,799 | 23,448 | |||||||||||||||
|
|
|
|
|
|
|
|
|
|
|
|||||||||||
|
Free cash flow |
$ | 128,459 | $ | 49,775 | $ | 114,504 | $ | 89,200 | $ | 39,126 | ||||||||||
|
|
|
|
|
|
|
|
|
|
|
|||||||||||
| (6) | 2009 and 2008 cash flow from continuing operations reflect the impact of estimated tax payments made in connection with businesses divested of $97.5 million and $90.2 million, respectively, and 2010 cash flow reflects the impact of a refund of $59.5 million of the estimated tax payments. |
32
Table of Contents
| ITEM 7. | MANAGEMENT’S DISCUSSION AND ANALYSIS OF FINANCIAL CONDITION AND RESULTS OF OPERATIONS |
Overview
We are a global provider of medical technology products that enhance clinical benefits, improve patient and provider safety and reduce total procedural costs. We primarily design, develop, manufacture and supply single-use medical devices used by hospitals and healthcare providers for common diagnostic and therapeutic procedures in critical care and surgical applications. We sell our products to hospitals and healthcare providers in more than 140 countries through a combination of our direct sales force and distributors. Because our products are used in numerous markets and for a variety of procedures, we are not dependent upon any one end-market or procedure.
We categorize our products into four groups: Critical Care, Surgical Care, Cardiac Care and Original Equipment Manufacturer and Development Services (“OEM”). Critical Care, representing our largest product group, includes medical devices used in vascular access, anesthesia, urology and respiratory care applications; Surgical Care includes surgical instruments and devices; and Cardiac Care includes cardiac assist devices and equipment. OEM designs and manufactures instruments and devices for other medical device manufacturers.
Over the past several years we have evolved into a pure-play medical technology company. Through an extensive acquisition and divestiture program, we significantly changed the composition of our portfolio of businesses, expanding our presence in the medical technology industry, while divesting all of our businesses serving the aerospace and commercial markets. The following is a listing of our more significant acquisitions and divestitures that have occurred since 2010. With respect to divested businesses listed below, we have reported results of operations, cash flows and (gains) losses on the disposition of these businesses as discontinued operations for all periods presented. See Note 19 to our consolidated financial statements included in this Annual Report on Form 10-K for additional information regarding our significant divestitures.
Medical Device Business Transactions
| • |
October 2012 — Acquired substantially all of the assets of LMA International N.V. (“LMA”), a global provider of laryngeal masks with a portfolio of innovative products used extensively in anesthesia and emergency care, for $292.2 million in cash. In a separate transaction, acquired the LMA branded laryngeal mask supraglottic airway business and certain other products in the United Kingdom, Ireland and Channel Islands from the shareholders of Intravent Direct Limited and affiliates for $19.9 million in cash. |
| • |
August 2012 — Sold the orthopedic business for $45.2 million in cash and realized a loss of $25 thousand, net of tax, from the sale of the business. |
| • |
June 2012 — Acquired Hotspur Technologies, a developer of catheter-based technologies designed to restore blood flow in patients with obstructed vessels, for an initial payment of $15.0 million in cash. |
| • |
May 2012 — Acquired Semprus BioSciences, a biomedical company that developed a long-lasting, covalently bonded, non-leaching polymer designed to reduce infections and thrombus related complications, for an initial payment of $30.0 million in cash. |
| • |
May 2012 — Acquired substantially all of the assets of Axiom Technology Partners, LLC, constituting its EFx laparoscopic fascial closure system, which is designed for the closure of abdominal trocar defects through which access ports and instruments were used during laparoscopic surgeries, for an initial payment of $7.5 million in cash. |
| • |
April 2012 — Acquired the EZ-Blocker product line, a single-use catheter used to perform lung isolation and one-lung ventilation, for an initial payment of $3.3 million in cash. |
33
Table of Contents
| • |
January 2011 — Acquired VasoNova Inc., a privately-held company with proprietary intra-vascular catheter navigation technology, for an initial payment of $25 million in cash. |
| • |
March 2010 — Sold SSI Surgical Services Inc. business (“SSI”), a surgical service provider, for approximately $25 million and realized a gain of $2.2 million, net of tax. |
We may be required to pay contingent consideration in connection with some of the acquisitions listed above. The amount of contingent consideration we ultimately will pay will be based upon the achievement of specified objectives, including regulatory approvals and sales targets. For additional information on the contingent consideration, see Note 3, “Acquisitions” to our consolidated financial statements included in this report.
Former Aerospace Segment Divestitures
| • |
December 2011 — Sold the cargo systems and container businesses for approximately $280 million and realized a gain of $126.8 million, net of tax. |
| • |
December 2010 — Sold the actuation business of our subsidiary Telair International Incorporated, an aftermarket service and support provider for commercial and military aircraft actuators, for approximately $94 million and realized a gain of $51.0 million, net of tax. |
Former Commercial Segment Divestitures
| • |
March 2011— Sold the marine businesses that were engaged in the design, manufacture and distribution of steering and throttle controls and engine and drive assemblies for the recreational marine market, heaters for commercial vehicles and burner units for military field feeding appliances for $123.1 million, consisting of $101.6 million in cash, net of $1.5 million of cash included in the marine business as part of the net assets sold, plus a subordinated promissory note in the amount of $4.5 million (which has subsequently been repaid in full) and the assumption by the buyer of approximately $15.5 million in liabilities related to the marine business. We realized a gain of $57.3 million, net of tax benefits, in connection with the sale. |
| • |
June 2010 — Sold the rigging products and services business (“Heavy Lift”), a supplier of customized heavy-duty wire rope, wire and synthetic rope assemblies, and related rigging hardware products, for approximately $50 million and realized a gain of $17.0 million, net of tax. |
Change in Reporting Segments and Business Unit Structure
Effective January 1, 2012, we changed our segment reporting from a single reportable segment to four reportable segments, three of which are geographically based. As initially changed, the three geographic segments were North America, EMEA (representing our operations in Europe, the Middle East and Africa) and AJLA (representing our Asian and Latin American operations). The fourth reportable segment is comprised of our OEM business. In addition, in the first quarter of 2012, we changed the number of our reporting units. In 2011, we had six reporting units comprised of North America, EMEA, OEM, Japan, Asia Pacific and Latin America. In 2012, in addition to establishing a new North America segment, we established five reporting units in that segment: Vascular, Anesthesia/Respiratory, Cardiac, Surgical and Specialty. Due to the change in the reporting unit structure in North America, we were required to conduct a goodwill impairment test with respect to each of the North American reporting units in the first quarter of 2012, and determined that the goodwill of three of the reporting units (Vascular, Anesthesia/Respiratory and Cardiac) was impaired. As a result, we recorded a goodwill impairment charge of $332 million in the first quarter of 2012. See Note 5 to the consolidated financial statements included in this report for a discussion of the goodwill impairment.
The impairment charge does not reflect any significant business change or any change in our expectations regarding the future operating results or liquidity of the North American segment. Rather, it is attributable to the creation of five new reporting units out of the North American reporting unit. In
34
Table of Contents
the fourth quarter of 2011, we determined the fair value of the North American reporting unit exceeded its carrying value, and thus there was no further analysis to determine if there was an impairment of goodwill. In the first quarter of 2012, we determined the relative fair values of each reporting unit and allocated the goodwill assigned to the North American reporting unit to each of the new reporting units based on relative fair value. We subsequently allocated all assets and liabilities other than goodwill to the reporting unit based on specific identification and the reporting unit’s respective operating activities. The resulting allocation of the carrying amounts was different from the allocation of the relative fair value. Accordingly, while there was very little change between the fourth quarter of 2011 and the first quarter of 2012 in the total fair value and carrying value of the sum of the five reporting units compared to the North American reporting unit, the relative values were different for each of the five new reporting units. For some reporting units the fair value exceeded the carrying value, and in other situations the carrying value exceeded fair value of the reporting unit, which resulted in further analysis to determine the implied fair value of the goodwill and the resulting impairment charge. This charge was primarily attributable to the fact that the fair value of assets other than goodwill increased which results in a decrease in the assumed fair value of goodwill.
In the third quarter of 2012, due to changes in our management and internal reporting structure, our Latin America operations were moved from the AJLA Segment into the North America Segment. As a result of this change, the North America Segment is now referred to as the Americas Segment and the AJLA Segment is now referred to as the Asia Segment. The change did not affect our reporting unit structure. Segment disclosures for all prior comparative periods have been restated to reflect this change. See Note 17 to the consolidated financial statements included in this report for a discussion of the segments.
Health Care Reform
On March 23, 2010 the Patient Protection and Affordable Care Act was signed into law. This legislation will have a significant impact on our business. For medical device companies such as Teleflex, the expansion of medical insurance coverage should lead to greater utilization of the products we manufacture, but this legislation also contains provisions designed to contain the cost of healthcare, which could negatively affect pricing of our products. In addition, commencing in 2013, the legislation imposes a 2.3% excise tax on sales of medical devices. As implementation of this tax begins and as the taxing authorities clarify aspects of the application of the tax relevant to us, we will be in a better position to ascertain its impact on our business. We currently estimate the impact of the medical device excise tax will be approximately $15 million annually, beginning in 2013.
Global Economic Conditions
Global economic conditions have had adverse impacts on market activities including, among other things, failure of financial institutions, falling asset values, diminished liquidity, and reduced demand for products and services. In response, we adjusted production levels and engaged in new restructuring activities and we continue to review and evaluate our manufacturing, warehousing and distribution processes to maximize efficiencies through the elimination of redundancies and the consolidation of facilities. Although, on a consolidated basis, the economic conditions did not have a significant adverse impact on our financial position, results of operations or liquidity, healthcare policies and practice trends vary by country, and the impact of the global economic downturn was felt to varying degrees in each of our regional markets over the last three years, the continuation of the present broad economic trends of weak economic growth, constricted credit and public sector austerity measures in response to growing public budget deficits could adversely affect our operations in the future, as described below. The potential effect of these factors on our current and future liquidity is discussed below.
Hospitals in some regions of the United States experienced a decline in admissions, a weaker payor mix, and a reduction in elective procedures. Hospitals consequently took actions to reduce their costs, including limiting their capital spending. Distributors in the supply chain reduced inventory levels
35
Table of Contents
and generally have not replenished inventories to pre-recession levels. The impact of these actions is most pronounced in capital goods markets, which affected our surgical instrument and cardiac assist businesses. More recently, the economic environment has improved somewhat, but has not returned to pre-recession levels, and challenges persist, particularly in some European countries, as discussed below. Approximately 91 percent of our net revenues come from single-use products used in critical care and surgical applications, and our sales volume could be negatively impacted if hospital admission rates or payor mix decline further as a result of continuing high unemployment rates (and subsequent loss of insurance coverage by consumers).
In Europe, some countries have taken austerity measures due to the current economic climate. Elective surgeries have been delayed and hospital budgets have been reduced. In certain countries (mainly Germany) we have seen changes in the local reimbursement to home care patients and pricing impacts on business awarded through the tendering process. These markets have introduced more buying groups and group purchasing organizations, or GPOs, resulting in reductions in commodity product pricing. It is possible that funding for publically funded healthcare institutions could be affected in the future as governments make further spending adjustments and enact healthcare reform measures to lower overall healthcare costs. The public healthcare systems in certain countries in Western Europe, most notably Greece, Spain, Portugal and Italy, have experienced significantly reduced liquidity due to recessionary conditions, which has resulted in a slowdown in payments to us. We believe this situation will continue and may worsen unless and until these countries are able to find alternative means of funding their respective public healthcare sectors.
In Asia, recovery from the global recession has varied by country. China has announced plans for major healthcare investment targeted at second tier cities and hospitals, which may provide future growth opportunities for us, while slow economic growth and continued pursuit of reimbursement cuts by the public hospital sector in Japan is expected to limit growth in that market.
Results of Operations
The following comparisons exclude the impact of the operations of the orthopedic and SSI businesses and businesses in our former Commercial and Aerospace segments, which have been presented in our consolidated financial results as discontinued operations (see Note 19 to our consolidated financial statements included in this Annual Report on Form 10-K and “Discontinued Operations” in this “Management’s Discussion and Analysis of Financial Condition and Results of Operations” for discussion of discontinued operations). Discussion of constant currency excludes the impact of translating the results of international subsidiaries at different currency exchange rates from year to year. Certain financial information is presented on a rounded basis, which may cause minor differences.
Revenues
Information regarding net revenues by product group is provided in the following table:
| Year Ended December 31 | % Increase/(Decrease) | |||||||||||||||||||
| 2012 | 2011 | 2010 | 2012 vs 2011 | 2011 vs 2010 | ||||||||||||||||
| (Dollars in millions) | ||||||||||||||||||||
|
Critical Care |
$ | 1,040.5 | $ | 1,003.8 | $ | 943.4 | 3.7 | 6.4 | ||||||||||||
|
Surgical Care |
291.1 | 277.4 | 262.7 | 5.0 | 5.6 | |||||||||||||||
|
Cardiac Care |
78.6 | 79.9 | 70.6 | (1.7 | ) | 13.3 | ||||||||||||||
|
OEM and Development Services |
140.3 | 129.6 | 118.4 | 8.2 | 9.5 | |||||||||||||||
|
Other |
0.5 | 1.8 | 2.6 | (74.7 | ) | (34.4 | ) | |||||||||||||
|
|
|
|
|
|
|
|||||||||||||||
|
Net Revenues |
$ | 1,551.0 | $ | 1,492.5 | $ | 1,397.7 | 3.9 | 6.8 | ||||||||||||
|
|
|
|
|
|
|
|||||||||||||||
36
Table of Contents
The following table presents the percentage increases or (decreases) in product group net revenues during the years ended December 31, 2012 and 2011 compared to the respective prior years on a constant currency basis, the impact of foreign currency fluctuations on those revenues and the total increase or (decrease) in net revenues for the periods presented taking into account the impact of foreign currency fluctuations as defined in note 1 below:
| % Increase/(Decrease) | ||||||||||||||||||||||||
| 2012 vs 2011 | 2011 vs 2010 | |||||||||||||||||||||||
|
Constant
Currency (1) |
Currency
Impact |
Total
Change |
Constant
Currency (1) |
Currency
Impact |
Total
Change |
|||||||||||||||||||
|
Critical Care |
6.6 | (2.9 | ) | 3.7 | 4.1 | 2.3 | 6.4 | |||||||||||||||||
|
Surgical Care |
7.8 | (2.8 | ) | 5.0 | 3.0 | 2.6 | 5.6 | |||||||||||||||||
|
Cardiac Care |
2.2 | (3.9 | ) | (1.7 | ) | 10.0 | 3.3 | 13.3 | ||||||||||||||||
|
OEM and Development Services |
9.5 | (1.3 | ) | 8.2 | 8.6 | 0.9 | 9.5 | |||||||||||||||||
|
Other |
(70.9 | ) | (3.8 | ) | (74.7 | ) | (47.1 | ) | 12.7 | (34.4 | ) | |||||||||||||
|
Total Change |
6.8 | (2.9 | ) | 3.9 | 4.4 | 2.4 | 6.8 | |||||||||||||||||
| (1) | Constant currency is a non-GAAP financial measure that measures the change in net revenues between current and prior year periods by excluding the impact of translating the results of international subsidiaries at different currency exchange rates from period to period. The constant currency increase/decrease percentage is calculated by translating the prior year period’s local currency net revenues into an amount reflecting the current year period’s foreign currency exchange rates and calculating the percentage difference between net revenues for the current year period and net revenues for the prior year period, as so translated. Management believes this measure is useful to investors because it eliminates items that do not reflect our day-to-day operations. In addition, management uses this financial measure for internal managerial purposes, when publicly providing guidance on possible future results, and to assist in our evaluation of period-to-period comparisons. This financial measure may not be comparable to similarly titled measures used by other companies, is presented in addition to results presented in accordance with GAAP and should not be relied upon as a substitute for GAAP financial measures. |
Comparison of 2012 and 2011
Net revenues increased 3.9% in 2012 to $1,551.0 million from $1,492.5 million in 2011. The $58.5 million increase in net revenues was largely due to higher volume (approximately $39.7 million), reflecting core growth in all segments, acquisitions (approximately $25.3 million), primarily from our acquisition of LMA (approximately $24.4 million), price increases (approximately $18.6 million) across all segments and new products (approximately $17.5 million) in North America and EMEA. These increases were partly offset by the $42.3 million unfavorable impact of foreign currency exchange rates in 2012.
Critical Care net revenues increased 3.7% in 2012 to $1,040.5 million from $1,003.8 million in 2011. Excluding the impact of foreign currency exchange rates, net revenues increased 6.6% over the corresponding prior year period. The increase in net revenues was due to higher sales of vascular access, anesthesia, urology and respiratory products.
Surgical Care net revenues increased 5.0% in 2012 to $291.1 million from $277.4 million in 2011. Excluding the impact of foreign currency exchange rates, net revenues increased 7.8% over the corresponding prior year period. The increase in net revenues was due to higher sales of ligation, general surgical instruments and closure products.
Cardiac Care net revenues decreased 1.7% in 2012 to $78.6 million from $79.9 million in 2011. Excluding the impact of foreign currency exchange rates, net revenues increased 2.2% over the corresponding prior year period. The increase in net revenues was due to higher sales of intra-aortic pumps and catheters.
37
Table of Contents
OEM net revenues increased 8.2% in 2012 to $140.3 million from $129.6 million in 2011. Excluding the impact of foreign currency exchange rates, net revenues increased 9.5% over the corresponding prior year period. The increase in net revenues was due to higher sales of specialty suture and catheter fabrication products.
Comparison of 2011 and 2010
Net revenues increased 6.8% in 2011 to $1,492.5 million from $1,397.7 million in 2010. The $94.8 million increase in net revenues was largely due to higher volumes in all segments and favorable foreign currency rates (approximately $32.7 million). In addition, net revenues in 2010 were lower by approximately $16.8 million due to the recall of custom IV tubing during the first quarter of 2010.
Critical Care net revenues increased 6.4% in 2011 to $1,003.8 million from $943.4 million in 2010. Excluding the impact of favorable foreign currency exchange rates, net revenues increased 4.1% primarily due to higher sales of vascular access and anesthesia products in North America, Europe and Asia/Latin America, respiratory products in North America, Europe and Asia and urology products in Europe and Latin America. In addition, net revenues in 2010 were lower by approximately $16.8 million due to the recall of custom IV tubing during the first quarter of 2010.
Surgical Care net revenues increased 5.6% in 2011 to $277.4 million from $262.7 million in 2010. Excluding the impact of favorable foreign currency exchange rates, net revenues increased 3.0% principally due to higher sales of ligation products in each of our regions.
Cardiac Care net revenues increased 13.3% in 2011 to $79.9 million, from $70.6 million in 2010. Excluding the impact of favorable foreign currency exchange rates, net revenues increased 10.0% largely attributable to higher sales of intra-aortic balloon pump catheters in each of our regions.
OEM net revenues increased 9.5% in 2011 to $129.6 million, from $118.4 million in 2010. Excluding the impact of favorable foreign currency exchange rates, net revenues increased 8.6% due to higher sales of specialty suture and catheter fabrication products.
Gross profit
| 2012 | 2011 | 2010 | ||||||||||
| (Dollars in millions) | ||||||||||||
|
Gross profit |
$ | 748.2 | $ | 708.8 | $ | 678.8 | ||||||
|
Percentage of revenues |
48.2 | % | 47.5 | % | 48.6 | % | ||||||
Comparison of 2012 and 2011
Gross profit as a percentage of revenues increased 0.7% in 2012 to 48.2% from 47.5% in 2011. The increase is primarily due to price increases in all segments and lower manufacturing costs in North America. In addition, 2011 included charges related to stock keeping unit (“SKU”) rationalization to eliminate SKUs based on low sales volume or insufficient margins to help improve future profitability. The increases were partly offset by the unfavorable impact of foreign currency exchange rates, higher manufacturing costs in EMEA and inventory write-offs for excess and slow moving product and damaged product in Asia (approximately $4.9 million).
Comparison of 2011 and 2010
Gross profit as a percentage of net revenues decreased 1.1% in 2011 to 47.5% from 48.6% in 2010. The decrease was primarily related to higher manufacturing, raw material and fuel-related freight costs and a $2.0 million pre-tax charge to cost of goods sold attributable to the SKU rationalization implemented at the end of 2011. Our ability to increase prices to offset the impact of higher commodity costs has been mixed, as price increases in Asia, Latin America and North America were offset by price erosion in Europe during 2011.
38
Table of Contents
Selling, general and administrative
| 2012 | 2011 | 2010 | ||||||||||
| (Dollars in millions) | ||||||||||||
|
Selling, general and administrative |
$ | 454.5 | $ | 423.9 | $ | 403.6 | ||||||
|
Percentage of revenues |
29.3 | % | 28.4 | % | 28.9 | % | ||||||
Comparison of 2012 and 2011
Selling, general and administrative expenses increased $30.6 million in 2012. The increase is primarily due to higher general and administrative costs across all segments, principally on higher employee related costs ($15.1 million), incremental operating expenses associated with the businesses acquired ($14.7 million), a $7.6 million loss on foreign currency forward exchange contracts entered into in anticipation of the acquisition of substantially all of the assets of LMA, acquisition related costs ($7.2 million) and higher selling costs ($4.8 million), driven by the increased revenue volumes and support of new products. These increases were partly offset by favorable foreign currency exchange rates ($11.1 million). In addition, 2011 expenses included increases in the valuation allowance with respect to the Greek government bonds that we received in 2011 in settlement of trade receivables due to us from sales to the public hospital system in Greece ($4.5 million); approximately $2.2 million of net separation costs for our former CEO (comprised of $5.5 million of payments under his employment agreement, less approximately $3.3 million of stock option and restricted share forfeitures) and increases in litigation reserves ($1.7 million). For additional information on the Greek government bonds, see Note 11, “Fair Value Measurement” to our consolidated financial statements included in this Annual Report on form 10-K.
During the third quarter of 2012, we entered into forward exchange contracts for Singapore dollars and US dollars in anticipation of the acquisition of substantially all of the assets of LMA. In accordance with FASB guidance, a forecasted transaction is not eligible for hedge accounting if the forecasted transaction involves a business combination. Therefore, gains and losses relating to this arrangement were recognized as incurred. We realized a pre-tax loss of $7.6 million upon settlement of the forward exchange contracts. For additional information regarding the acquisition of LMA and the forward exchange contracts, see Note 3 and Note 10 to our consolidated financial statements included in this Annual Report on form 10-K.
Comparison of 2011 and 2010
Selling, general and administrative expenses as a percentage of revenues were 28.4% in 2011 compared to 28.9% in 2010. The increase in selling, general and administrative expenses in 2011, as compared with 2010, was primarily attributable to increased spending related to sales, marketing and clinical education initiatives of $18.5 million and a $4.5 million loss pertaining to our zero-coupon Greek government bonds. In addition, increases in litigation reserves during 2011 increased selling, general and administrative expenses by approximately $1.7 million. The above increases were partially offset by the fact that the 2010 period included approximately $10.0 million of costs associated with the product recall and remediation activities of our custom IV tubing product.
Selling, general and administrative expenses for 2011 also include approximately $2.2 million of net separation costs for our former chief executive officer (comprised of $5.5 million of payments under his employment agreement, less approximately $3.3 million of stock option and restricted share forfeitures).
The overall increase in selling, general and administrative expenses for 2011 also included $4.9 million of costs related to VasoNova, a company we acquired in January 2011.
39
Table of Contents
Research and development
| 2012 | 2011 | 2010 | ||||||||||
| (Dollars in millions) | ||||||||||||
|
Research and development |
$ | 56.3 | $ | 48.7 | $ | 42.4 | ||||||
|
Percentage of revenues |
3.6 | % | 3.3 | % | 3.0 | % | ||||||
Comparison of 2012 and 2011
The increase in research and development expenses in 2012, compared to 2011, principally reflects continued investment in the new technologies obtained in the second quarter of 2012 through acquisitions and increased investments related to vascular products in North America.
Comparison of 2011 and 2010
The increase in research and development expenses during 2011 compared to 2010 primarily reflect increased investments related to catheter tip positioning technologies.
Interest income and expense
| 2012 | 2011 | 2010 | ||||||||||
| (Dollars in millions) | ||||||||||||
|
Interest expense |
$ | 69.6 | $ | 70.3 | $ | 79.8 | ||||||
|
Average interest rate on debt during the year |
4.15 | % | 5.18 | % | 5.59 | % | ||||||
|
Interest income |
$ | (1.6 | ) | $ | (1.3 | ) | $ | (0.7 | ) | |||
Interest expense decreased $0.7 million in 2012 compared to 2011 due to lower average interest rates, partially offset by approximately $15 million higher average outstanding debt.
Interest expense decreased $9.5 million in 2011 compared to 2010 due to a reduction of approximately $156 million in average outstanding debt and lower average interest rates.
| 2012 | 2011 | 2010 | ||||||||||
| (Dollars in millions) | ||||||||||||
|
Loss on extinguishments of debt |
$ | — | $ | 15.4 | $ | 46.6 | ||||||
During 2011, we recorded losses on the extinguishment of debt of $15.4 million as a result of the prepayment, in the first quarter of 2011, of the remaining outstanding principal amount of our senior notes issued in 2004 (the “2004 Notes”) and the $125 million repayment, in the second quarter of 2011, of term loan borrowings under our senior credit facility. In connection with the prepayment of our 2004 Notes, we recognized debt extinguishment costs of approximately $14.6 million related to the prepayment “make-whole” amount of $13.9 million paid to the holders of the 2004 Notes and the write-off of $0.7 million of unamortized debt issuance costs that we incurred prior to the prepayment of the 2004 Notes. During the second quarter of 2011, we recorded a $0.8 million write-off of unamortized debt issuance costs as a loss on extinguishment of debt in connection with the $125 million repayment of term loan borrowings.
In 2010, we recognized losses on the extinguishment of debt of $46.6 million as a result of our refinancing transactions in the third quarter of 2010 and prepayment of notes in the fourth quarter of 2010. In connection with our refinancing transactions in the third quarter of 2010, we prepaid our senior notes issued in 2007 (the “2007 Notes” and, together with the 2004 Notes, the “Senior Notes”) and recognized debt extinguishment costs of approximately $28.8 million comprised of a prepayment make-whole fee of $28.1 million, the write-off of $0.6 million of unamortized debt issuance costs incurred prior to the refinancing transactions and related legal fees. Also in connection with our refinancing transactions in the third quarter of 2010, we prepaid $200 million of our senior credit facility and recognized additional losses on the extinguishment of debt of $1.6 million related to the write-off of
40
Table of Contents
unamortized debt issuance costs incurred prior to the refinancing transactions. In the fourth quarter of 2010, we prepaid $165.8 million in aggregate principal amount of our 2004 Notes and recognized a loss on extinguishment of debt of approximately $16.3 million comprised of a prepayment make-whole fee of $15.5 million, the write-off of $0.7 million of unamortized debt issuance costs incurred prior to the refinancing transactions and related legal fees. See Note 9 to our consolidated financial statements included in this Annual Report on Form 10-K for further information.
Taxes on income from continuing operations
| 2012 | 2011 | 2010 | ||||||||||
|
Effective income tax rate |
(9.9 | %) | 17.8 | % | 16.2 | % | ||||||
The effective income tax rate in 2012 was (9.9%) compared to 17.8% in 2011. Taxes on income from continuing operations in 2012 was $16.4 million compared to $25.8 million in 2011. The decrease in the effective tax rate was impacted by the Company’s ability to deduct only $45 million of the $332 million goodwill impairment charge recorded in the first quarter of 2012. Accordingly, the reduction in the tax rate reflects the Company’s ability to realize only a limited tax benefit related to this charge.
The effective tax rate in 2011 was 17.8% compared to 16.2% in 2010. Taxes on income from continuing operations in 2011 was $25.8 million compared to $16.9 million in 2010. The increase in the effective tax rate reflects lower beneficial discrete charges offset by a tax benefit with respect to foreign earnings.
Restructuring and other impairment charges
| 2012 | 2011 | 2010 | ||||||||||
| (Dollars in millions) | ||||||||||||
|
LMA restructuring program |
$ | 2.5 | $ | — | $ | — | ||||||
|
2012 restructuring charges |
2.4 | — | — | |||||||||
|
2011 restructuring program |
— | 3.0 | — | |||||||||
|
2007 Arrow integration program |
(1.9 | ) | 0.5 | 2.9 | ||||||||
|
Aggregate impairment charges — investments and certain fixed assets |
— | 2.5 | — | |||||||||
|
|
|
|
|
|
|
|||||||
|
Total |
$ | 3.0 | $ | 6.0 | $ | 2.9 | ||||||
|
|
|
|
|
|
|
|||||||
LMA Restructuring Program
In connection with the acquisition of LMA, we formulated a plan related to the future integration of LMA and our businesses. The integration plan focuses on the closure of LMA corporate functions and the consolidation of manufacturing, sales, marketing, and distribution functions in North America, Europe and Asia. We estimate that an aggregate of up to approximately $16 million will be charged to restructuring and other impairment charges over the term of this restructuring program. Of this amount, $5 million relates to employee termination costs, $10 million relates to termination of certain distributor agreements and $1 million relates to facility closure costs and other actions. During 2012, we incurred restructuring charges of $2.5 million under this program primarily related to employee severance costs. We expect to realize annual pre-tax savings in the range of $15-$20 million by the end of 2015 when these restructuring actions are complete.
2012 Restructuring Charges
We regularly evaluate opportunities to consolidate facilities, lower costs and optimize operating efficiencies. In 2012, we identified opportunities to improve our supply chain strategy by consolidating three of our North American warehouses into one centralized warehouse, and lower costs and improve operating efficiencies through the termination of certain distributor agreements in Europe, the closure of certain North American facilities and workforce reductions. These projects will entail costs related to reductions in force, contract terminations related to distributor agreements and leases, and facility
41
Table of Contents
closure and other costs. During 2012, we incurred restructuring charges of $2.4 million and, as of December 31, 2012, we had recorded a reserve $2.2 million related to these projects. We expect to complete the projects over a one year period. We anticipate future payments of $5.9 million and incurring additional charges of $3.7 million related to these initiatives.
2011 Restructuring Program
In 2011, we initiated a restructuring program at three facilities to consolidate operations and reduce costs. In connection with this program, we recorded contract termination costs of approximately $2.6 million associated with a lease termination, as we vacated 50% of the premises during 2011. In addition, we recorded approximately $0.4 million for employee termination benefits in connection with workforce consolidations. We expect to incur additional contract termination costs of approximately $2.7 million when we have completely exited a leased facility. The payment of the lease contract termination costs will continue until 2015.
2007 Arrow Integration Program
In connection with our acquisition of Arrow International, Inc. (“Arrow”) in 2007, we formulated a plan to integrate Arrow and our other businesses. Costs related to actions that affected employees and facilities of Teleflex were charged to earnings and included in restructuring and other impairment charges within the consolidated statement of operations. In 2012 we reversed approximately $2.0 million of contract termination costs related to a settlement of a dispute involving the termination of a European distributor agreement that was established in connection with our acquisition of Arrow. As of December 31, 2012, we expect future restructuring and impairment charges that we will incur in connection with the Arrow integration plan, if any, will be nominal.
Impairment Charges
During 2011, we recognized net impairment charges of $2.5 million related to the decline in value of our investments in affiliates that are considered to be other than temporary. In making this determination, we considered multiple factors, including our intent and ability to hold investments, operating losses of investees that demonstrate an inability to recover the carrying value of the investments, the investee’s liquidity and cash position and market acceptance of the investee’s products and services.
For additional information regarding our restructuring programs and impairment charges, see Note 4 to our consolidated financial statements included in this Annual Report on Form 10-K.
Goodwill impairment
In the first quarter of 2012, we changed our North America reporting unit structure from a single reporting unit to five reporting units comprised of Vascular, Anesthesia/Respiratory, Cardiac, Surgical and Specialty. We allocated the assets and liabilities of our North America Segment among the new reporting units based on their respective operating activities, and then allocated goodwill among the reporting units using a relative fair value approach, as required by FASB Accounting Standards Codification (“ASC”) Topic 350.
Following this allocation, we performed goodwill impairment tests on these new reporting units in the first quarter of 2012. As a result of these tests, we determined that three of the reporting units in our North America Segment were impaired, and we recorded goodwill impairment charges of $220 million in our Vascular reporting unit, $107 million in our Anesthesia/Respiratory reporting unit and $5 million in our Cardiac reporting unit in the first quarter of 2012.
42
Table of Contents
Segment Reviews
Segment Net Revenues
| Year Ended December 31 | % Increase/(Decrease) | |||||||||||||||||||
| 2012 | 2011 | 2010 | 2012 vs 2011 | 2011 vs 2010 | ||||||||||||||||
| (Dollars in millions) | ||||||||||||||||||||
|
Americas |
$ | 726.8 | $ | 688.0 | $ | 669.5 | 5.6 | 2.8 | ||||||||||||
|
EMEA |
510.2 | 525.3 | 479.2 | (2.9 | ) | 9.6 | ||||||||||||||
|
Asia |
173.7 | 149.6 | 130.6 | 16.1 | 14.5 | |||||||||||||||
|
OEM |
140.3 | 129.6 | 118.4 | 8.2 | 9.5 | |||||||||||||||
|
|
|
|
|
|
|
|||||||||||||||
|
Segment Net Revenues |
$ | 1,551.0 | $ | 1,492.5 | $ | 1,397.7 | 3.9 | 6.8 | ||||||||||||
|
|
|
|
|
|
|
|||||||||||||||
Segment Operating Profit
| Year Ended December 31 | % Increase/(Decrease) | |||||||||||||||||||
| 2012 | 2011 | 2010 | 2012 vs 2011 | 2011 vs 2010 | ||||||||||||||||
| (Dollars in millions) | ||||||||||||||||||||
|
Americas |
$ | 88.5 | $ | 86.4 | $ | 97.2 | 2.5 | (11.1 | ) | |||||||||||
|
EMEA |
56.3 | 75.9 | 72.8 | (25.9 | ) | 4.3 | ||||||||||||||
|
Asia |
61.1 | 49.2 | 40.9 | 24.2 | 20.3 | |||||||||||||||
|
OEM |
31.6 | 24.7 | 21.9 | 27.9 | 12.8 | |||||||||||||||
|
|
|
|
|
|
|
|||||||||||||||
|
Segment Operating Profit (1) |
$ | 237.5 | $ | 236.2 | $ | 232.8 | 0.6 | 1.5 | ||||||||||||
|
|
|
|
|
|
|
|||||||||||||||
| (1) | See Note 17 of our consolidated financial statements included in this report for a reconciliation of segment operating profit to our consolidated income/(loss) from continuing operations before interest, loss on extinguishments of debt and taxes. |
The following is a discussion of our segment operating results.
Comparison of 2012 and 2011
Americas
Americas net revenues increased 5.6% in 2012 compared to the corresponding period in 2011. The increase includes approximately $14.6 million related to acquisitions in 2012, primarily LMA; $9.5 million related to new product sales, primarily in vascular, anesthesia, respiratory and surgical products; price increases of approximately $9.6 million, primarily in surgical, vascular and Latin America products; and approximately $6.4 million due to higher volume, primarily in anesthesia, respiratory, Latin America and surgical products.
Americas segment operating profit increased 2.5% in 2012 compared to the corresponding period in 2011. The increase reflects the favorable impact of higher net revenues and lower manufacturing costs. These increases were partly offset by higher selling, general and administrative expenses ($28.5 million) and higher research and development expenses ($7.6 million). The increase in selling, general and administrative expenses is largely due to employee related costs, operating expenses and acquisition costs associated with the businesses acquired in 2012 ($11.7 million) and higher sales and marketing expenses (approximately $4.0 million), primarily in support of new products. The increase in research and development expenses is due to costs associated with the new technologies obtained in the second quarter of 2012 through acquisitions ($5.6 million), In addition, 2011 included a SKU rationalization charge (approximately $1.3 million) to eliminate SKUs based on low sales volumes or insufficient margins.
43
Table of Contents
EMEA
EMEA net revenues decreased 2.9% in 2012 compared to the corresponding period in 2011. The decrease reflects the unfavorable impact of foreign currency exchange rates (approximately $39.1 million). The foreign currency exchange rate impact was partly offset by higher volume of approximately $13.1 million, primarily in urology, surgical and anesthesia products, partly offset by a decline in cardiac products, 2012 acquisitions ($5.6 million), primarily LMA, new product sales ($3.5 million) and price increases ($1.8 million).
EMEA segment operating profit decreased 25.9% in 2012 compared to the corresponding period in 2011. The decrease was primarily due to the unfavorable impact of foreign currency exchange rates ($13.3 million), operating expenses and acquisition costs associated with 2012 acquisitions ($8.7 million), a loss on foreign currency forward exchange contracts entered into in anticipation of the acquisition of substantially all of the assets of LMA ($7.6 million) and higher manufacturing costs, partly offset by higher revenues. In addition, EMEA segment operating profit in 2011 included an increase in the valuation allowance related to the Greek government bonds ($4.5 million).
Asia
Asia net revenues increased 16.1% in 2012 compared to the corresponding period in 2011. The increase was due to higher volume of approximately $15.5 million, mostly due to sales growth in the Asia Pacific region, particularly in China, $5.1 million related to acquisitions in 2012, primarily LMA, and $4.1 million related to price increases.
Asia segment operating profit increased 24.2% in 2012 compared to the corresponding period in 2011. The increase is due to the increase in revenues, partly offset by inventory write-offs for excess, slow moving and damaged product (approximately $4.9 million) and operating expenses and acquisitions costs associated with acquisitions we completed in 2012 ($1.4 million).
OEM
OEM net revenues increased 8.2% in 2012 compared to the corresponding period in 2011. The increase was due to higher volume of approximately $4.7 million, which benefited from core growth, new products ($4.5 million) and price increases ($3.1 million).
OEM segment operating profit increased 27.9% in 2012 compared to the corresponding period in 2011. The increase reflects the higher net revenues and lower manufacturing costs, partly offset by higher general and administrative costs.
Comparison of 2011 and 2010
Americas
Americas net revenues increased 2.8% in 2011 compared to the corresponding period in 2010. The increase was primarily due to higher sales of vascular access and anesthesia and respiratory products. In addition, net revenues in 2010 were approximately $16.8 million lower due to the recall of custom IV tubing during the first quarter of 2010.
Americas segment operating profit decreased 11.1% in 2011 compared to the corresponding period in 2010. The decrease was due to higher manufacturing, raw material and fuel related freight costs, the SKU rationalization charge (approximately $1.3 million), increased spending related to marketing and clinical education (approximately $6.8 million) and higher research and development expenses ($5.5 million) primarily related to catheter tip positioning technologies. In addition, 2010 segment operating profit reflected approximately $4.4 million of costs associated with the product recall and remediation activities related to our custom IV tubing product.
44
Table of Contents
EMEA
EMEA net revenues increased 9.6% in 2011 compared to the corresponding period in 2010. The increase reflects the favorable impact of foreign currency exchange rates (approximately $24.0 million) and higher volume primarily in vascular access, anesthesia, respiratory and urology products.
EMEA segment operating profit increased 4.3% in 2011 compared to the corresponding period in 2010. The increase was primarily due to higher revenues and the favorable impact of foreign currency exchange rates. These increases were partly offset by increased spending related to selling expenses (approximately $10.2 million) and an increase in the valuation allowance related to the Greek government bonds ($4.5 million). In addition, 2010 segment operating profit reflected approximately $4.5 million of costs associated with the product recall and remediation activities related to our custom IV tubing product.
Asia
Asia net revenues increased 14.5% in 2011 compared to the corresponding period in 2010. The increase was due to higher volume primarily with respect to our vascular access, anesthesia and respiratory products, and the favorable impact of foreign currency exchange rates.
Asia segment operating profit increased 20.3% in 2011 compared to the corresponding period in 2010. The increase is due to the increase in revenues and the favorable impact of foreign currency exchange rates. These increases were partly offset by increased spending related to selling and marketing expenses (approximately $3.0 million). In addition, 2010 segment operating profit reflected approximately $0.8 million of costs associated with the product recall and remediation activities related to our custom IV tubing product.
OEM
The OEM net revenues increased approximately 9.5% in 2011 compared to the corresponding period in 2010. The increase was due to higher sales of specialty suture, catheter fabrication and orthopedic implant products.
OEM segment operating profit increased 12.8% in 2011 compared to the corresponding period in 2010. The increase is primarily due to the increase in revenues and lower operating expenses.
Liquidity and Capital Resources
We assess our liquidity in terms of our ability to generate cash to fund our operating, investing and financing activities. Our principal source of liquidity is operating cash flows. In addition to operating cash flows, other significant factors that affect our overall management of liquidity include: capital expenditures, acquisitions, pension funding, dividends, adequacy of available bank lines of credit, and access to capital markets.
We currently do not foresee any difficulties in meeting our cash requirements or accessing credit as needed in the next twelve months. To date, we have not experienced an inordinate amount of payment defaults by our customers, and we have sufficient lending commitments in place to enable us to fund our anticipated additional operating needs. However, as discussed above in Global Economic Conditions, the ongoing volatility in the domestic and global financial markets, including the European sovereign debt crisis, combined with a continuation of constrained global credit markets there is a risk that our customers and suppliers may be unable to access liquidity. Consequently, we continue to monitor our credit risk related to countries in Europe. As of December 31, 2012, our net receivables from publicly funded hospitals in Italy, Spain, Portugal and Greece were $70.6 million compared to $78.8 million as of December 31, 2011. In 2012, 2011 and 2010, net revenues from these countries was approximately 9% of total net revenues in each of the years, and average days that accounts receivable were outstanding were 288, 318 and 217 days, respectively. As of December 31, 2012 and
45
Table of Contents
December 31, 2011, net trade receivables from these countries were approximately 34% and 38%, respectively, of consolidated accounts receivable, net. If global economic conditions deteriorate, we may experience delays in customer payments and reductions in our customers’ purchases from us. Also, we may incur higher credit losses related to the public hospital systems in these countries, which could have a material adverse effect on our results of operations and cash flows in 2013 and beyond.
We completed four late-stage technology acquisitions and expanded our presence in the anesthesia market through the acquisition of all of the assets of LMA International N.V. during 2012. The aggregate fair value of the consideration paid was approximately $422.2 million, which includes initial consideration of approximately $367.9 million, contingent consideration arrangements related to the businesses acquired, which were valued at $55.8 million and a $1.5 million favorable working capital adjustment related to the LMA acquisition. As of December 31, 2012, the aggregate amount of actual contingent consideration could be up to $74 million. We allocated the fair value of the $422.2 million consideration paid to assets acquired of $476.3 million, net of liabilities assumed of $54.1 million. The assets acquired included intangibles for technology, in-process research and development, customer lists, tradenames and goodwill, aggregating approximately $391.5 million. See Note 3 to our consolidated financial statements included in this Annual Report on Form 10-K for additional information regarding our acquisitions.
We manage our worldwide cash requirements by monitoring the funds available among our subsidiaries and determining the extent to which we can access those funds on a cost effective basis. At December 31, 2012, of our $337.0 million of cash and cash equivalents, $264.0 million was held at foreign subsidiaries. We are not aware of any restrictions on repatriation of these funds and, subject to cash payment of additional U.S. income taxes or foreign withholding taxes, these funds could be repatriated, if necessary. Any additional taxes could be offset, at least in part, by foreign tax credits. The amount of any cash taxes, which could be significant, and the application of tax credits would be determined based on income tax laws in effect at the time of such repatriation. We do not expect any such repatriation to result in additional tax expense as taxes have been provided for on unremitted foreign earnings that we do not consider permanently reinvested.
We depend on foreign sources of cash to fund a portion of our debt service requirements, substantially all of which relate to United States indebtedness, because the net cash provided by U.S.-based operating activities alone is not sufficient. Accordingly, we repatriated approximately $56 million and $70 million in 2012 and 2011, respectively, of cash from our foreign subsidiaries to help fund debt service and other cash requirements. These cash distributions are subject to tax in the U.S. at the corporate tax rate reduced by applicable foreign tax credits for foreign taxes paid on distributed earnings. Approximately $46.1 million of our $193.9 million of net cash provided by operating activities in 2012 was generated in the U.S., and approximately $9.8 million of our $94.4 million of net cash provided by operating activities in 2011 was generated in the U.S.
We have no scheduled principal payments under our senior credit facility until 2014. We anticipate our domestic interest payments for 2013 will be approximately $60.4 million. To the extent we cannot, or choose not to, repatriate cash from foreign subsidiaries to meet quarterly debt service or other requirements, our revolving credit facility can be utilized as a source of liquidity until such cash can be repatriated in a cost effective manner.
During 2011, we received $9.6 million of zero-coupon Greek government bonds (the “Greek Bonds”) in settlement of trade receivables due us from sales to the public hospital system in Greece for 2007, 2008 and 2009. At December 31, 2010, we had an allowance of $2.2 million on receivables to be settled by the bonds. During 2011, we recorded additional losses of $4.5 million and received $2.3 million in proceeds from the sale of approximately $5.4 million in principal amount of these Greek Bonds. At December 31, 2011, we had approximately $0.9 million of the Greek Bonds remaining on our balance sheet which were sold in January of 2012. The $0.9 million fair value of the bonds at December 31, 2011 reflected the final value received from the January 2012 sale of the remaining
46
Table of Contents
bonds. For additional information regarding the fair value of the Greek Bonds, see Note 11 to our consolidated financial statements included in this Annual Report on Form 10-K.
We believe our cash flow from operations, available cash and cash equivalents, borrowings under our revolving credit facility and sales of accounts receivable under our securitization program will enable us to fund our operating requirements, capital expenditures and debt obligations for the next 12 months and the foreseeable future.
During 2011, we completed a series of transactions that significantly restructured our debt obligations and borrowing capacity.
| • |
Prepayment of 2004 Notes . We prepaid the entire outstanding $165.8 million principal amount of our senior notes issued in 2004 (“2004 Notes”). In connection with this prepayment we paid a make-whole payment to the holders of the 2004 Notes of approximately $13.9 million and paid accrued and unpaid interest of approximately $1.7 million. We used $150.0 million of borrowings under our revolving credit facility and available cash to fund these payments. |
| • |
Revolving Credit Facility Borrowings and Repayment . We borrowed $165.0 million under our revolving credit facility, of which $150.0 million was used to fund the prepayment of our 2004 Notes described above and the remainder was used to fund a portion of the purchase price for the VasoNova acquisition. We repaid the $165.0 million using $80.0 million of the proceeds from an additional term loan borrowing under our senior credit facility as described below, and $85.0 million in proceeds from our sale of the marine business. |
| • |
Term Loan Borrowings and Repayment; Extension of Maturities . |
| • |
We entered into an agreement with lenders under our senior credit facility that provided an additional principal amount of $100.0 million in term loan borrowings and used $80.0 million of the proceeds to repay a portion of the borrowings under our revolving credit facility described above. We subsequently repaid $125.0 million of term loan borrowings under our senior credit facility using a portion of the proceeds of the 6.875% Senior Subordinated Notes due 2019 that we issued in June 2011. |
| • |
We obtained lender agreements to extend the maturity of $36.1 million of term loans from October 1, 2012 to October 1, 2014 and to extend the termination of $33.7 million of revolving credit facility commitments from October 1, 2012 to October 1, 2014. |
| • |
6.875% Senior Subordinated Notes due 2019 . On June 13, 2011, we issued $250.0 million of 6.875% Senior Subordinated Notes due 2019 (the “2019 Notes”). We pay interest on the 2019 Notes semi-annually on June 1 and December 1 at a rate of 6.875% per year. The 2019 Notes will mature on June 1, 2019, unless earlier redeemed. We incurred transaction fees of approximately $3.7 million, including underwriters’ discounts and commissions, in connection with the public offering of the 2019 Notes. As noted above, we used $125.0 million of the net proceeds to repay term loan borrowings under our senior credit facility. We also recorded a $0.8 million write-off of unamortized debt issuance costs as a loss on extinguishment of debt in the second quarter of 2011. |
| • |
Termination of Interest Rate Swap. In December 2011, we terminated our interest rate swap agreement that, at the date of termination, had a notional amount of $350 million. The interest rate swap was designated as a cash flow hedge against the term loan under our senior credit facility. At the date of termination, the interest rate swap was in a liability position resulting in a cash payment of approximately $14.8 million, which included $3.1 million of accrued interest. The termination of the interest rate swap resulted in an $11.7 million cash outflow as reported in operating activities in the consolidated statements of cash flows. As of December 31, 2012, all unrealized losses within accumulated other comprehensive income associated with this interest rate swap have been reclassified as interest expense in the consolidated statements of income (loss). |
47
Table of Contents
Cash Flows
The following table provides a summary of our cash flows for the periods presented:
| Year Ended December 31, | ||||||||||||
| 2012 | 2011 | 2010 | ||||||||||
| (Dollars in millions) | ||||||||||||
|
Cash flows from continuing operations provided by (used in): |
||||||||||||
|
Operating activities |
$ | 193.9 | $ | 94.4 | $ | 143.8 | ||||||
|
Investing activities |
(385.9 | ) | 300.7 | 152.1 | ||||||||
|
Financing activities |
(47.3 | ) | (5.2 | ) | (335.5 | ) | ||||||
|
Cash flows (used in) provided by discontinued operations |
(10.1 | ) | (2.8 | ) | 63.8 | |||||||
|
Effect of exchange rate changes on cash and cash equivalents |
2.4 | (11.5 | ) | (4.1 | ) | |||||||
|
|
|
|
|
|
|
|||||||
|
Increase (decrease) in cash and cash equivalents |
$ | (247.0 | ) | $ | 375.6 | $ | 20.1 | |||||
|
|
|
|
|
|
|
|||||||
Comparison of 2012 and 2011
Cash Flow from Operating Activities
Operating activities from continuing operations provided net cash of approximately $193.9 million during 2012 compared to $94.4 million during 2011. The $99.5 million increase is primarily due to favorable year-over-year changes in working capital items, primarily accounts receivable (favorable year-over-year by $40.6 million), inventory (favorable year-over-year by $31.8 million) and prepaid expenses and other current assets (favorable year-over-year by $18.1 million). The year-over-year improvement in working capital from accounts receivable reflects a significant collection of receivables from the Spanish government (approximately $17.5 million) during the second quarter of 2012, largely offset by higher net revenues in 2012 in the Americas and EMEA. The comparatively unfavorable change in accounts receivable in 2011 reflected the effect of the termination of a factoring agreement in Italy (approximately $30.4 million) and a slowdown in collections particularly in Italy, Spain and Greece (approximately $18.1 million). The year-over-year improvement in working capital related to inventories reflects a 2012 reduction in the build-up of inventory in 2011 and inventory write-offs of excess, slow moving and damaged product in Asia in 2012. The 2011 increase in inventory reflected a planned worldwide build-up of inventory primarily to improve service levels by accelerating fulfillment of customer orders. The inventory increases in 2011 also included a $7.1 million increase in the Asia Pacific region to stock a new distribution facility in Singapore. The year-over-year improvement in working capital from prepaid expenses and other current assets primarily reflects the collection of outstanding 2011 VAT claims in 2012. These favorable year-over-year comparisons were partly offset by a reduction in deferred tax liability associated with potential future repatriation of non-permanently reinvested foreign earnings in 2012.
Cash Flow from Investing Activities
Net cash used in investing activities from continuing operations was $385.9 million during 2012 reflecting payments for businesses acquired of $387.0 million, principally LMA, and capital expenditures of $65.4 million, partly offset by the proceeds from sales of businesses and assets of $66.7 million. The payments for businesses acquired includes the aggregate initial consideration we paid in connection with the acquisitions and approximately $17.7 million for contingent consideration payments related to our acquisitions of VasoNova, Inc. (“VasoNova” acquired in 2011), Semprus BioSciences, Axiom Technology Partners LLC and the EZ Blocker product line acquired in 2012. The proceeds from sales of businesses and assets include $45.1 million from the sale of the orthopedic business, $16.8 million that we received as a working capital adjustment pursuant to the terms of the agreement related to the sale of the cargo systems and container businesses of our former Aerospace Segment, $4.5 million from the payment of a subordinated promissory note related to the sale of the marine business of our former Commercial Segment and proceeds of $0.3 million from the sale of a building.
48
Table of Contents
Cash Flow from Financing Activities
Net cash used in financing activities from continuing operations was $47.3 million in 2012, primarily due to dividend payments of $55.6 million, partly offset by $9.0 million in proceeds from the exercise of outstanding stock options issued under our stock compensation plans, compared to net cash used in financing activities from continuing operations of $5.2 million in 2011.
Comparison of 2011 and 2010
Cash Flow from Operating Activities
Net cash provided by operating activities from continuing operations totaled $94.4 million during the twelve months ended December 31, 2011, compared to $143.8 million during the twelve months ended December 31, 2010. The decrease primarily reflects the fact that we received a significant tax refund of $59.5 million in 2010, which favorably affected cash flow in the 2010 period. In addition, the 2011 decrease reflects a $33.8 million increase in worldwide inventory levels, which was $12.4 million greater than the $21.4 million increase in inventory during the 2010 period. We increased our inventory levels in 2011 principally to improve our service levels by accelerating fulfillment of customer orders. The inventory increase also included a $7.1 million increase in the Asia Pacific region to stock a new distribution facility in Singapore. These operating cash flow decreases as compared to the prior period were somewhat offset by a modestly smaller increase in accounts receivable during the twelve months ended December 31, 2011 as compared to the prior year period. The accounts receivable increase in the 2011 period was $43.6 million, $6.5 million less than the increase during the same period in 2010. However, $39.7 million of the increase in 2010 resulted from a change in accounting guidance that caused trade receivables under our asset securitization program to be included as accounts receivable on our balance sheet. Prior to the change in accounting guidance, the trade receivables were treated as sold and were not included in our balance sheet. The increase in accounts receivable during the twelve months of 2011 reflects higher accounts receivable in Europe of $49.9 million, primarily due to the termination of a factoring agreement in Italy (approximately $30.4 million), and a slowdown in payments, particularly in Italy and Spain (approximately $18.1 million).
During 2011, we recognized additional litigation reserves of $17.1 million associated with retained liabilities related to businesses that have been divested. Of the $17.1 million recorded, $7.5 million was associated with recall costs related to defective products, which was a subject of pending litigation related to our former Commercial Segment. During the third quarter of 2011, we settled the litigation as it related to the recall costs and, as part of the settlement, paid $7.6 million in September 2011.
Cash Flow from Investing Activities
Net cash provided by investing activities from continuing operations totaled $300.7 million during the twelve months ended December 31, 2011 compared to $152.1 million during the twelve months ended December 31, 2010. Cash provided by investing activities from continuing operations during 2011 includes $372.1 million in proceeds, net of cash and closing costs associated with the sale of the marine and aerospace businesses plus $3.9 million related to the sale of a building that was previously held for sale, partly offset by cash paid of $30.6 million for the acquisition of VasoNova and capital expenditures of $44.6 million. The $30.6 million paid for the acquisition of VasoNova includes the initial payment of $24.9 million plus a $6.0 million contingent payment made to the former VasoNova security holders upon receiving 510(k) clearance from the U.S. Food and Drug Administration less a hold back fee and cash in the business obtained in the acquisition.
Cash Flow from Financing Activities
Net cash used in financing activities from continuing operations totaled $5.2 million during the twelve months ended December 31, 2011, which included proceeds from additional borrowings of $515.0 million, including the issuance of our 2019 Notes. This additional indebtedness was partially
49
Table of Contents
offset by repayments of outstanding debt totaling $455.8 million, including the prepayment of the 2004 Notes totaling $165.8 million and the repayment of $125.0 million under our senior credit facility. We incurred costs of $18.5 million associated with the repayments of these amounts (including the related make whole amounts paid to the holders of the 2004 Notes and related fees) and our additional borrowings. We also paid $25.0 million against our securitization program, made dividend payments of $55.1 million and recognized proceeds of $34.0 million from the exercise of outstanding stock options issued under our stock compensation plans.
Financing Arrangements
The following table provides our net debt to total capital ratio:
| 2012 | 2011 | |||||||
| (Dollars in millions) | ||||||||
|
Net debt includes: |
||||||||
|
Current borrowings |
$ | 4.7 | $ | 5.0 | ||||
|
Long-term borrowings |
965.3 | 954.8 | ||||||
|
|
|
|
|
|||||
|
Total debt |
970.0 | 959.8 | ||||||
|
Less: Cash and cash equivalents |
337.0 | 584.1 | ||||||
|
|
|
|
|
|||||
|
Net debt |
$ | 633.0 | $ | 375.7 | ||||
|
|
|
|
|
|||||
|
Total capital includes: |
||||||||
|
Net debt |
$ | 633.0 | $ | 375.7 | ||||
|
Shareholders’ equity |
1,779.0 | 1,980.6 | ||||||
|
|
|
|
|
|||||
|
Total capital |
$ | 2,412.0 | $ | 2,356.3 | ||||
|
|
|
|
|
|||||
|
Percent of net debt to total capital |
26 | % | 16 | % | ||||
The increase in percentage of net debt to total capital in 2012 compared to 2011 was largely due to reductions in cash and cash equivalents and shareholders’ equity. The decrease in cash was primarily a result of the purchase of LMA in October of 2012. The decrease in shareholders’ equity was primarily a result of the $332 million goodwill impairment charge recorded in the first quarter of 2012.
Fixed rate borrowings comprised 63% of total borrowings at December 31, 2012 and December 31, 2011.
Our senior credit agreement and the indenture under which we issued our 2019 Notes contain covenants that, among other things, limit or restrict our ability, and the ability of our subsidiaries, to incur debt, create liens, consolidate, merge or dispose of certain assets, make certain investments, engage in acquisitions, pay dividends on, repurchase or make distributions in respect of capital stock and enter into swap agreements. Our senior credit agreement also requires us to maintain a consolidated leverage ratio of not more than 4.0:1 and a consolidated interest coverage ratio (generally, Consolidated EBITDA to Consolidated Interest Expense, each as defined in the senior credit agreement) of not less than 3.50:1 as of the last day of any period of four consecutive fiscal quarters calculated pursuant to the definitions and methodology set forth in the senior credit agreement. At December 31, 2012, our consolidated leverage ratio was 2.88:1 and our interest coverage ratio was 5.37:1, both of which are in compliance with the limits described in the preceding sentence.
At December 31, 2012, we had no borrowings outstanding and approximately $2.4 million in outstanding standby letters of credit under our $400.0 million revolving credit facility. This facility is used principally for seasonal working capital needs. The availability of loans under our revolving credit facility is dependent upon our ability to maintain our financial condition and our continued compliance with the covenants contained in our senior credit agreement. Moreover, additional borrowings would be prohibited if a Material Adverse Effect (as defined in the senior credit agreement) were to occur. Notwithstanding these restrictions, we believe our revolving credit facility provides us with significant flexibility to meet our foreseeable working capital needs. At our current level of EBITDA (as defined in
50
Table of Contents
the senior credit agreement) for the year ended December 31, 2012, we would have been permitted $397.3 million of additional debt beyond the levels outstanding at December 31, 2012. Moreover, additional capacity would be available if borrowed funds were used to acquire a business or businesses through the purchase of assets or controlling equity interests so long as the aforementioned leverage and interest coverage ratios are met after calculating EBITDA on a proforma basis to give effect to the acquisition.
As of December 31, 2012, we were in compliance with all other terms of our senior credit agreement and our 2019 Notes, and we expect to continue to be in compliance with the terms of these agreements, including the leverage and interest coverage ratios under our senior credit agreement, throughout 2013.
In addition, we have an accounts receivable securitization facility under which we sell a security interest in domestic accounts receivable for consideration of up to $50.0 million to a commercial paper conduit. As of December 31, 2012, the maximum amount available for borrowing was $44.0 million. This facility is utilized from time to time to provide increased flexibility in funding short term working capital requirements. The agreement governing the accounts receivable securitization facility contains certain covenants and termination events. An occurrence of an event of default or a termination event under this facility may give rise to the right of our counterparty to terminate this facility. As of December 31, 2012 and 2011, we had $4.7 million of outstanding borrowings under our accounts receivable securitization facility.
Our 3.875% Convertible Senior Subordinated Notes due 2017 (the “Convertible Notes”) are included in the dilutive earnings per share calculation using the treasury stock method. Under the treasury stock method, we must calculate the number of shares issuable under the terms of these notes based on the average market price of our common stock during the applicable reporting period, and include that number in the total diluted shares figure for the period. At the time we sold our convertible notes, we entered into convertible note hedge and warrant agreements that together are intended to have the economic effect of reducing the net number of shares that will be issued upon conversion of the notes by, in effect, increasing the conversion price of the Convertible Notes, from our economic standpoint, to $74.65. However, under accounting principles generally accepted in the United States of America (“U.S. GAAP”), since the impact of the convertible note hedge agreements is anti-dilutive, we exclude from the calculation of fully diluted shares the number of shares of our common stock that we would receive from the counterparties to these agreements upon settlement.
Under the treasury stock method, changes in the share price of our common stock can have a significant impact on the number of shares that we must include in the fully diluted earnings per share calculation. The following table provides examples of how changes in our stock price would impact the number of additional shares included in the denominator of the fully diluted earnings per share calculation (“Total Treasury Stock Method Incremental Shares”). The table also reflects the impact on the number of shares we could expect to issue upon concurrent settlement of the Convertible Notes, the warrant and the convertible note hedge (“Incremental Shares Issued by Teleflex upon Conversion”):
|
Share Price |
Convertible
Note Shares |
Warrant
Shares |
Total Treasury
Stock Method Incremental Shares (1) |
Shares Due to
Teleflex under Note Hedge |
Incremental
Shares Issued by Teleflex upon Conversion (2) |
|||||||||||||||
|
$65 |
370 | — | 370 | (370 | ) | — | ||||||||||||||
|
$75 |
1,190 | 31 | 1,221 | (1,190 | ) | 31 | ||||||||||||||
|
$85 |
1,817 | 794 | 2,611 | (1,817 | ) | 794 | ||||||||||||||
|
$95 |
2,313 | 1,398 | 3,711 | (2,313 | ) | 1,398 | ||||||||||||||
|
$105 |
2,714 | 1,886 | 4,600 | (2,714 | ) | 1,886 | ||||||||||||||
|
$115 |
3,045 | 2,289 | 5,334 | (3,045 | ) | 2,289 | ||||||||||||||
| (1) | Represents the number of incremental shares that must be included in the calculation of fully diluted shares under U.S. GAAP. |
| (2) | Represents the number of incremental shares to be issued by us upon conversion of the convertible notes, assuming concurrent settlement of the convertible note hedges and warrants. |
51
Table of Contents
Our 3.875% Convertible Notes are convertible under certain circumstances, including the attainment of 130% of the conversion price (approximately $79.72) of the Company’s closing stock price during a certain number of days at the end of a fiscal quarter. The Company’s closing stock price has recently approached this amount, which increases the possibility that the Convertible Notes could become convertible in the near future, at which point the Convertible Notes would be classified as a current liability. The Company has elected a net settlement method to satisfy its conversion obligation, under which the Company may settle the principal amount of the Convertible Notes in cash and settle the excess conversion value in shares, plus cash in lieu of fractional shares. The Company believes that it has the ability to raise sufficient cash to repay the principal amounts due through a combination of utilizing our existing cash on hand, accessing our credit facility, or raising money in the capital markets.
For additional information regarding our indebtedness, please see Note 9 to our consolidated financial statements included in this Annual Report on Form 10-K.
Stock Repurchase Programs
On June 14, 2007, our Board of Directors authorized the repurchase of up to $300 million of our outstanding common stock. Repurchases of our stock under the Board authorization may be made from time to time in the open market and may include privately-negotiated transactions as market conditions warrant and subject to regulatory considerations. The stock repurchase program has no expiration date and our ability to execute on the program will depend on, among other factors, cash requirements for acquisitions, cash generated from operations, debt repayment obligations, market conditions and regulatory requirements. In addition, our senior credit facility and our 2019 Notes limit our ability to repurchase shares and make other restricted payments. Accordingly, these provisions may limit our ability to repurchase shares under this Board authorization. Through December 31, 2012, no shares have been purchased under this Board authorization.
Contractual Obligations
Contractual obligations at December 31, 2012 are as follows:
| Payments due by period | ||||||||||||||||||||
| Total |
Less
than 1 year |
1-3
years |
4-5
years |
More
than 5 years |
||||||||||||||||
| (Dollars in thousands) | ||||||||||||||||||||
|
Total borrowings |
$ | 1,029,700 | $ | 4,700 | $ | 375,000 | $ | 400,000 | $ | 250,000 | ||||||||||
|
Interest obligations (1) |
203,038 | 45,035 | 74,827 | 58,878 | 24,298 | |||||||||||||||
|
Operating lease obligations |
108,834 | 21,921 | 31,519 | 20,402 | 34,992 | |||||||||||||||
|
Minimum purchase obligations (2) |
23,415 | 23,342 | 73 | — | — | |||||||||||||||
|
Other postretirement benefits |
34,797 | 3,199 | 6,683 | 7,050 | 17,865 | |||||||||||||||
|
|
|
|
|
|
|
|
|
|
|
|||||||||||
|
Total contractual obligations |
$ | 1,399,784 | $ | 98,197 | $ | 488,102 | $ | 486,330 | $ | 327,155 | ||||||||||
|
|
|
|
|
|
|
|
|
|
|
|||||||||||
| (1) | Interest payments on floating rate debt are based on the interest rate in effect on December 31, 2012. |
| (2) | Purchase obligations are defined as agreements to purchase goods or services that are enforceable and legally binding and that specify all significant terms, including fixed or minimum quantities to be purchased, fixed, minimum or variable pricing provisions and the approximate timing of the transactions. These obligations relate primarily to material purchase requirements. |
We recently announced that we will be relocating our corporate headquarters in the first half of 2014. In connection with the relocation, in December 2012 we entered into a lease for approximately 84,000 square feet of office space in Wayne, Pennsylvania. The lease has an initial lease term of 10 years and 8 months, with an option to renew for an additional ten years. Aggregate rental payments during the initial term of the lease are expected to be approximately $30 million.
52
Table of Contents
We have recorded a noncurrent liability for uncertain tax positions of $68.3 million and $61.7 million as of December 31, 2012 and December 31, 2011, respectively. Due to uncertainties regarding the ultimate resolution of ongoing or future tax examinations we are not able to reasonably estimate the amount of any income tax payments to settle uncertain income tax positions or the periods in which any such payments will be made.
In 2012, cash contributions to all defined benefit pension plans were $17.6 million, and we estimate the amount of cash contributions will be approximately $7.1 million in 2013. Due to the potential impact of future plan investment performance, changes in interest rates, changes in other economic and demographic assumptions and changes in legislation in the United States and other foreign jurisdictions, we are not able to reasonably estimate the timing and amount of contributions that may be required to fund our defined benefit plans for periods beyond 2013.
See Notes 15 and 16 to our consolidated financial statements included in this Annual Report on Form 10-K for additional information.
Critical Accounting Estimates
The preparation of consolidated financial statements in conformity with GAAP requires management to make estimates and assumptions that affect the reported amounts of assets and liabilities and disclosure of contingent assets and liabilities at the date of the financial statements and the reported amounts of revenues and expenses during the reporting period. Actual results could differ from those estimates and assumptions.
We have identified the following as critical accounting estimates, which are defined as those that are reflective of significant judgments and uncertainties, are the most pervasive and important to the presentation of our financial condition and results of operations and could potentially result in materially different results under different assumptions and conditions.
Accounting for Allowance for Doubtful Accounts
In the ordinary course of business, we grant non-interest bearing trade credit to our customers on normal credit terms. In an effort to reduce our credit risk, we (i) establish credit limits for all of our customer relationships, (ii) perform ongoing credit evaluations of our customers’ financial condition, (iii) monitor the payment history and aging of our customers’ receivables, and (iv) monitor open orders against an individual customer’s outstanding receivable balance.
An allowance for doubtful accounts is maintained for accounts receivable based on our historical collection experience and expected collectability of the accounts receivable, considering the period an account is outstanding, the financial position of the customer and information provided by credit rating services. The adequacy of this allowance is reviewed each reporting period and adjusted as necessary.
In light of the disruptions in global economic markets, we instituted enhanced measures to facilitate customer-by-customer risk assessment when estimating the allowance for doubtful accounts. Such measures included, among others, monthly credit control committee meetings, at which customer credit risks are identified after review of, among other things, accounts that exceed specified credit limits, payment delinquencies and other customer problems. In addition, for some of our non-government customers, we instituted measures designed to reduce our risk exposures, including issuing dunning letters, reducing credit limits, requiring that payments accompany orders and instituting legal action with respect to delinquent accounts. With respect to government customers, we evaluate receivables for potential collection risks associated with the availability of government funding and reimbursement practices.
Some of our customers, particularly in Europe, have extended or delayed payments for products and services already provided. Collectability concerns regarding our accounts receivable from these
53
Table of Contents
customers, for the most part in Greece, Italy, Spain and Portugal, is the primary cause for the increase in the allowance. At December 31, 2012, these countries accounted for 34% of our consolidated accounts receivable, net. If the financial condition of these customers or the healthcare systems in these countries continue to deteriorate such that the ability of an increasing number of customers to make payments is uncertain, additional allowances may be required in future periods. Our allowance for doubtful accounts was $7.8 million at December 31, 2012 and $6.5 million at December 31, 2011 which was 2.4% and 2.2%, respectively, of gross accounts receivable.
Although we maintain allowances for doubtful accounts to cover the estimated losses which may occur when customers cannot make their required payments, we cannot be assured that we will continue to experience the same loss rate in the future given the volatility in the worldwide economy. If our allowance for doubtful accounts is insufficient to address receivables we ultimately determine are uncollectible, we would be required to incur additional charges, which could materially adversely affect our operating results. Moreover, our inability to collect outstanding receivables could adversely affect our financial condition and cash flow from operations.
Distributor Rebates
We offer rebates to certain distributors and reserve an estimate for the rebate as a reduction of revenues at the time of sale. The estimate is based on an historical experience rate of rebate claims by distributors over the previous 12 months for specific product lines. The reserve for estimated rebates was $19.5 million and $9.6 million at December 31, 2012 and December 31, 2011, respectively. The increase in rebates in 2012 compared to 2011 is primarily due to the acquisition of LMA.
Inventory Utilization
Inventories are valued at the lower of cost or market. Accordingly, we maintain a reserve for excess and obsolete inventory to reduce the carrying value of our inventories to reflect the diminution of value resulting from product obsolescence, damage or other issues affecting marketability by an amount equal to the difference between the cost of the inventory and its estimated market value. Factors utilized in the determination of estimated market value include (i) current sales data and historical return rates, (ii) estimates of future demand, (iii) competitive pricing pressures, (iv) new product introductions, (v) product expiration dates, and (vi) component and packaging obsolescence.
The adequacy of this reserve is reviewed each reporting period and adjusted as necessary. We regularly compare inventory quantities on hand against historical usage or forecasts related to specific items in order to evaluate obsolescence and excessive quantities. In assessing historical usage, we also qualitatively assess business trends to evaluate the reasonableness of using historical information as an estimate of future usage.
Our inventory reserve was $31.7 million at December 31, 2012 and $32.9 million at December 31, 2011 which equaled 8.9% and 9.9% of gross inventories, respectively.
Accounting for Long-Lived Assets and Investments
The ability to realize long-lived assets is evaluated periodically as events or circumstances indicate a possible inability to recover their carrying amount. The evaluation is based on various analyses, including undiscounted cash flow projections. The analyses necessarily involve significant management judgment. Any impairment loss, if indicated, equals the amount by which the carrying amount of the asset exceeds the estimated fair value of the asset.
54
Table of Contents
Accounting for Goodwill and Other Intangible Assets
Goodwill and intangible assets at December 31, 2012 were as follows:
| Total | ||||
| (Dollars in millions) | ||||
|
Goodwill |
$ | 1,249.5 | ||
|
Intangible assets: |
||||
|
Indefinite lived |
432.6 | |||
|
Finite lived |
626.2 | |||
|
|
|
|||
|
Goodwill and intangible assets |
$ | 2,308.3 | ||
|
|
|
|||
|
Number of reporting units |
10 | |||
Intangible assets may represent indefinite-lived assets (e.g., certain trademarks or brands), determinable-lived intangibles (e.g., certain trademarks or brands, customer relationships, patents and technologies) or goodwill. Of these, only the costs of determinable-lived intangibles are amortized to expense over their estimated life. Determining the useful life of an intangible asset requires considerable judgment as different types of intangible assets will have different useful lives. Goodwill and indefinite-lived intangibles assets, primarily trademarks and brand names, are not amortized but are tested annually for impairment during the fourth quarter, using the first day of the quarter as the measurement date, or earlier upon the occurrence of certain events or substantive changes in circumstances that indicate the carrying value may not be recoverable. Such conditions may include an economic downturn in a geographic market or a change in the assessment of future operations. Our impairment testing for goodwill is performed separately from our impairment testing of indefinite-lived intangibles.
Considerable management judgment is necessary to evaluate the impact of operating and macroeconomic changes and to estimate future cash flows to measure fair value. Assumptions used in our impairment evaluations, such as forecasted growth rates and cost of capital, are consistent with internal projections and operating plans. We believe such assumptions and estimates are also comparable to those that would be used by other marketplace participants.
Goodwill
Goodwill impairment assessments are performed at a reporting unit level; our reporting units are generally businesses one level below the respective operating segment. In applying the goodwill impairment test, we may assess qualitative factors to determine whether it is more likely than not that the fair value of a reporting unit is less than its carrying value. Qualitative factors may include, but are not limited to, macroeconomic conditions, industry conditions, the competitive environment, changes in the market for our products and services, regulatory and political developments, entity specific factors such as strategies and financial performance. If, after completing such assessment, it is determined more likely than not that the fair value of a reporting unit is less than its carrying value, we proceed to a two-step quantitative impairment test. Alternatively, we may proceed directly to testing goodwill for impairment through the two-step impairment test without conducting the qualitative analysis. In the fourth quarter of 2012, we performed a qualitative assessment on six of our reporting units that carry goodwill and determined, based on the qualitative assessment, that the fair value of each reporting unit was more likely than not higher than its carrying value. For the two remaining reporting units that carry goodwill, the Vascular and Anesthesia/Respiratory reporting units, we elected to forgo the qualitative assessment and test them through the two-step quantitative impairment test as discussed below.
The first step of the two-step impairment test is to quantitatively compare the fair value of a reporting unit, including goodwill, with its carrying value. In performing the first step, we calculate fair values of the various reporting units using equal weighting of two methods; one which estimates the discounted cash flows (“DCF”) of each of the reporting units based on projected earnings in the future (the Income Approach) and one which is based on sales of similar assets in actual transactions (the
55
Table of Contents
Market Approach). If the fair value exceeded the carrying value, there is no impairment. If the reporting unit carrying amount exceeded the fair value, the second step of the goodwill impairment test would be performed to measure the amount of the impairment loss, if any.
Determining fair value requires the exercise of significant judgment. The more significant judgments and assumptions made to determine the fair value of our reporting units were (1) the amount and timing of expected future cash flows which are based primarily on our estimates of future sales, operating income, industry trends and the regulatory environment of the individual reporting units, (2) the expected long-term growth rates for each of our reporting units, which approximate the expected long-term growth rate of the global economy and of the medical device industry, (3) discount rates that are used to discount future cash flows to their present values, which are based on an assessment of the risk inherent in the future cash flows of the respective reporting units along with various market based inputs, (4) determination of appropriate revenue and EBITDA multiples used to estimate a reporting unit’s fair value under the Market Approach and the selection of appropriate comparable companies to be used for purposes of determining those multiples. There were no changes to the underlying methods used in 2012 as compared to the prior year valuations of our reporting units. The DCF analysis utilized in the fourth quarter 2012 impairment test was performed over a ten year time horizon for each reporting unit. The discount rate was 10.0% for all reporting units. A perpetual growth rate of 2.5% was assumed for all reporting units.
In arriving at our estimate of the fair value of each reporting unit, we considered the results of both the Income and the Market approach and determined the fair value of each reporting unit based on the average of the results yielded by the two methods. In addition, our current market capitalization was reconciled to the sum of the estimated fair values of the individual reporting units, plus a control premium, to ensure the fair value conclusions were reasonable in light of current market capitalization. The control premium implied by our analysis was approximately 30%, which was deemed to be within a reasonable range of observed average industry control premiums.
No impairment in the carrying value of any of our reporting units was evident as a result of the assessment of their respective fair values as determined under the methodology described above in the fourth quarter 2012 impairment test. In 2012, the fair value of our Vascular and Anesthesia/Respiratory reporting units exceed its respective carrying value by more than 20%.
Our expected future growth rates estimated for purposes of the goodwill impairment test are based on our estimates of future sales, operating income and cash flow and are consistent with our internal budgets and business plans which reflect a modest amount of core revenue growth coupled with the successful launch of new products each year, that collectively, more than offset volume losses from products that are expected to reach the end of their life cycle. Under the Income Approach, significant changes in assumptions would be required for these reporting units to fail the step one test. For example, an increase of over 1.5% in the discount rate or a decrease of over 10% percent in the compound annual growth rate of operating income would be required to indicate impairment for these reporting units. Nevertheless, while we believe the assumed growth rates of sales and cash flows are reasonable and achievable the possibility remains that the constant currency revenue growth of this reporting unit may not perform as expected, and, as a result, the estimated fair value may decline. If our strategy and/or new products are not successful and we do not achieve core revenue growth in the future the goodwill in the Vascular and Anesthesia/Respiratory reporting units may become impaired and, in such case, we may incur material impairment charges.
In the first quarter of 2012, we changed our North America reporting unit structure from a single reporting unit to five reporting units comprised of Vascular, Anesthesia/Respiratory, Cardiac, Surgical and Specialty. We allocated the assets and liabilities of our North America Segment among the new reporting units based on their respective operating activities, and then allocated goodwill among the reporting units using a relative fair value approach, as required by FASB Accounting Standards Codification (“ASC”) Topic 350.
56
Table of Contents
Following this allocation, we performed goodwill impairment tests on these new reporting units in the first quarter of 2012. As a result of these tests, we determined that three of the reporting units in our North America Segment were impaired, and we recorded goodwill impairment charges of $220 million in our Vascular reporting unit, $107 million in our Anesthesia/Respiratory reporting unit and $5 million in our Cardiac reporting unit in the first quarter of 2012.
Intangible Assets
Intangible assets are assets acquired that lack physical substance and that meet the specified criteria for recognition apart from goodwill. Intangible assets we obtained through acquisitions are comprised mainly of technology, customer relationships, and trade names. The fair value of acquired technology and trade names is estimated by the use of a relief from royalty method, which values an intangible asset by estimating the royalties saved through the ownership of an asset. Under this method, an owner of an intangible asset determines the arm’s length royalty that likely would have been charged if the owner had to license the asset from a third party. The royalty, which is based on the estimated rate applied against forecasted sales, is tax-effected and discounted to present value using a discount rate commensurate with the relative risk of achieving the cash flow attributable to the asset. The fair value of acquired customer relationships is estimated by the use of an income approach known as the excess earnings method. The excess earnings method measures economic benefit of an asset indirectly by calculating residual profit attributable to the asset after appropriate returns are paid with respect to complementary or contributory assets. The residual profit is tax-effected and discounted to present value at an appropriate discount rate that reflects the risk factors associated with the estimated income stream.
Management tests indefinite-lived intangible assets for impairment annually, and more frequently if events or changes in circumstances indicate it is more likely than not that the asset is impaired. Similar to the goodwill impairment test process, we may assess qualitative factors to determine whether it is more likely than not that the fair value of an indefinite-lived intangible asset is less than its carrying value. If, after completing such qualitative assessment, we determine it is not more likely than not that the fair value of the indefinite-lived intangible asset is less than its carrying amount, the asset is not impaired. If we conclude it is more likely than not that the fair value of the indefinite-lived intangible assets is less than the carrying value, we then proceed to a quantitative impairment test, which consists of a comparison of the fair value of the intangible assets to their carrying amounts. Alternatively, we may elect to forgo the qualitative analysis and proceed directly to testing the indefinite-lived intangible asset for impairment through the quantitative impairment test. In the fourth quarter of 2012, we performed a qualitative assessment on all of our indefinite-lived assets, except for our Taut tradename, and determined, based on the qualitative assessment, that their fair value was more likely than not higher than its carrying value. For the Taut tradename, we elected to test it through the quantitative impairment test as discussed below.
In connection with the quantitative impairment test, management tests for impairment by comparing the carrying value of intangible assets to their estimated fair values. Since quoted market prices are seldom available for intangible assets, we utilize present value techniques to estimate fair value. Common among such approaches is the relief from royalty methodology described above, under which management estimates the direct cash flows associated with the intangible asset. Management must estimate the hypothetical royalty rate, discount rate, and residual growth rate to estimate the forecasted cash flows associated with the asset.
Discount rates and perpetual growth rates utilized in the impairment test of the indefinite-lived asset during the fourth quarter of 2012 is comparable to the rates utilized in the impairment test of goodwill. The compound annual growth rate in revenues projected to be generated from the trade name was 4% and a royalty rate of 4% was assumed. Discount rate assumptions are based on an assessment of the risk inherent in the future cash flows generated as a result of the respective intangible assets. Assumptions about royalty rates are based on the rates at which similar trademarks or technologies are being licensed in the marketplace.
57
Table of Contents
No impairment in the carrying value of our indefinite-lived intangible asset was evident as a result of the assessment of its respective fair value as determined under the methodology described above.
We are not required to perform an annual impairment test for long-lived assets, including finite-lived intangible assets (e.g., customer relationships); instead, long-lived assets are tested for impairment upon the occurrence of a triggering event. Triggering events include the likely (i.e., more likely than not) disposal of a portion of such assets or the occurrence of an adverse change in the market involving the business employing the related assets. Significant judgments in this area involve determining whether a triggering event has occurred and re-assessing the reasonableness of the remaining useful lives of finite-lived assets by, among other things, assessing customer attrition rates.
Accounting for Pensions and Other Postretirement Benefits
We provide a range of benefits to eligible employees and retired employees, including pensions and postretirement healthcare benefits. Several statistical and other factors which are designed to project future events are used in calculating the expense and liability related to these plans. These factors include actuarial assumptions about discount rates, expected rates of return on plan assets, compensation increases, turnover rates and healthcare cost trend rates. We review the actuarial assumptions on an annual basis and make modifications to the assumptions based on current rates and trends when appropriate.
The weighted average assumptions for U.S. and foreign plans used in determining net benefit cost were as follows:
| Pension | Other Benefits | |||||||||||||||||||||||
| 2012 | 2011 | 2010 | 2012 | 2011 | 2010 | |||||||||||||||||||
|
Discount rate |
4.28 | % | 5.50 | % | 5.78 | % | 3.95 | % | 5.10 | % | 5.60 | % | ||||||||||||
|
Rate of return |
8.27 | % | 8.31 | % | 8.27 | % | — | — | — | |||||||||||||||
|
Initial healthcare trend rate |
— | — | — | 8.5 | % | 8.0 | % | 9.0 | % | |||||||||||||||
|
Ultimate healthcare trend rate |
— | — | — | 5.0 | % | 5.0 | % | 5.0 | % | |||||||||||||||
Significant differences in our actual experience or significant changes in our assumptions may materially affect our pension and other postretirement obligations and our future expense. The following table shows the sensitivity of plan expenses and benefit obligations to changes in the weighted average assumptions:
|
Assumed Discount
Rate |
Expected Return
on Plan Assets |
Assumed
Healthcare Trend Rate |
||||||||||||||||||
|
50 Basis
Point Increase |
50 Basis
Point Decrease |
50 Basis
Point Change |
1.0%
Increase |
1.0%
Decrease |
||||||||||||||||
| (Dollars in millions) | ||||||||||||||||||||
|
Net periodic pension and postretirement healthcare expense |
$ | (0.6 | ) | $ | 0.6 | $ | 1.2 | $ | 0.3 | $ | (0.2 | ) | ||||||||
|
Projected benefit obligation |
$ | (29.5 | ) | $ | 32.9 | N/A | $ | 4.6 | $ | (4.0 | ) | |||||||||
Product Warranty Liability
We warrant to the original purchaser of certain of our products that we will, at our option, repair or replace, without charge, such products if they fail due to a manufacturing defect. Warranty periods vary by product. We have recourse provisions for certain products that would enable recovery from third parties for amounts paid under the warranty. We accrue for product warranties when, based on available information, it is probable that customers will make claims under warranties relating to products that have been sold, and a reasonable estimate of the costs (based on historical claims experience relative to sales) can be made. Our estimated product warranty liability was $0.5 million and $7.9 million at December 31, 2012 and December 31, 2011, respectively. The decrease in the reserve is due to a settlement in 2012 of a retained liability related to a divested business.
58
Table of Contents
Share-based Compensation
We estimate the fair value of share-based awards on the date of grant using an option pricing model. The value of the portion of the award that is ultimately expected to vest is recognized as expense over the requisite service periods. Share-based compensation expense is measured using a Black-Scholes option pricing model that takes into account highly subjective and complex assumptions with respect to expected life of options, volatility, risk-free interest rate and expected dividend yield. The expected life of options granted represents the period of time that options granted are expected to be outstanding, which is derived from the vesting period of the award, as well as historical exercise behavior. Expected volatility is based on a blend of historical volatility and implied volatility derived from publicly traded options to purchase our common stock, which we believe is more reflective of the market conditions and a better indicator of expected volatility than solely using historical volatility. The risk-free interest rate is the implied yield currently available on U.S. Treasury zero-coupon issues with a remaining term equal to the expected life of the option.
Accounting for Income Taxes
Our annual provision for income taxes and determination of the deferred tax assets and liabilities require management to assess uncertainties, make judgments regarding outcomes and utilize estimates. We conduct a broad range of operations around the world, subjecting us to complex tax regulations in numerous international jurisdictions, resulting at times in tax audits, disputes with tax authorities and potential litigation, the outcome of which is uncertain. Management must make judgments about such uncertainties and determine estimates of our tax assets and liabilities. Deferred tax assets and liabilities are measured and recorded using currently enacted tax rates, which we expect will apply to taxable income in the years in which those temporary differences are recovered or settled. The likelihood of a material change in our expected realization of these assets is dependent on future taxable income, our ability to use foreign tax credit carryforwards and carrybacks, final U.S. and foreign tax settlements, and the effectiveness of our tax planning strategies in the various relevant jurisdictions. While management believes that its judgments and interpretations regarding income taxes are appropriate, significant differences in actual experience may require future adjustments to our tax assets and liabilities, which could be material.
We are also required to assess the realizability of our deferred tax assets. We evaluate all positive and negative evidence and use judgments regarding past and future events, including operating results and available tax planning strategies that could be implemented to realize the deferred tax assets. Based on this assessment, we determine when it is more likely than not that all or some portion of our deferred tax assets may not be realized, in which case we apply a valuation allowance to offset our deferred tax assets in an amount equal to future tax benefits that may not be realized. To the extent facts and circumstances change in the future, adjustments to the valuation allowances may be required.
The valuation allowance for deferred tax assets of $70.5 million and $66.3 million at December 31, 2012 and December 31, 2011, respectively, relates principally to the uncertainty of the utilization of tax loss and credit carryforwards in various jurisdictions. We believe that we will generate sufficient future taxable income to realize the tax benefits related to the remaining net deferred tax asset. The valuation allowance was calculated in accordance with the provisions under ASC topic 740 “Income Taxes,” which requires that a valuation allowance be established and maintained when it is “more likely than not” that all or a portion of deferred tax assets will not be realized.
Significant judgment is required in determining income tax provisions and in evaluating tax positions. We establish additional provisions for income taxes when, despite the belief that tax positions are supportable, there remain certain positions that do not meet the minimum probability threshold, which is a tax position that is more likely than not to be sustained upon examination by the applicable taxing authority. In the normal course of business, we are examined by various Federal,
59
Table of Contents
State and foreign tax authorities. We regularly assess the potential outcomes of these examinations and any future examinations for the current or prior years in determining the adequacy of our provision for income taxes. We adjust the income tax provision, the current tax liability and deferred taxes in any period in which facts that give rise to an adjustment become known. Specifically, we are currently in the midst of examinations by the U.S., Canadian, Czech Republic, and Austrian taxing authorities with respect to our income tax returns for those countries for various tax years. The ultimate outcomes of the examinations of these returns could result in increases or decreases to our recorded tax liabilities, which would affect our financial results.
See Note 14 to our consolidated financial statements in this Annual Report on Form 10-K for additional information regarding our uncertain tax positions.
New Accounting Standards
See Note 2 to our consolidated financial statements included in this Annual Report on Form 10-K for a discussion on recently issued accounting standards, including estimated effects, if any, on our consolidated financial statements.
| ITEM 7A. | QUANTITATIVE AND QUALITATIVE DISCLOSURES ABOUT MARKET RISK |
Market Risk
We are exposed to certain financial risks, specifically fluctuations in market interest rates, foreign currency exchange rates and, to a lesser extent, commodity prices. We use derivative financial instruments to manage or reduce the impact of some of these risks. We do not enter into derivative instruments for trading purposes. We are also exposed to changes in the market traded price of our common stock as it influences the valuation of stock options and their effect on earnings.
Interest Rate Risk
We are exposed to changes in interest rates as a result of our borrowing activities and our cash balances. The table below provides information regarding the amortization and related interest rates by year of maturity for our fixed and variable rate debt obligations. Variable interest rates shown below are the weighted average rates of the debt portfolio based on interest rates in effect on December 31, 2012.
| Year of Maturity | ||||||||||||||||||||||||||||
| 2013 | 2014 | 2015 | 2016 | 2017 | Thereafter | Total | ||||||||||||||||||||||
| (Dollars in thousands) | ||||||||||||||||||||||||||||
|
Fixed rate debt |
$ | — | $ | — | $ | — | $ | — | $ | 400,000 | $ | 250,000 | $ | 650,000 | ||||||||||||||
|
Average interest rate |
— | — | — | — | 3.875 | % | 6.875 | % | 5.03 | % | ||||||||||||||||||
|
Variable rate debt |
$ | 4,700 | $ | 375,000 | $ | — | $ | — | $ | — | $ | — | $ | 379,700 | ||||||||||||||
|
Average interest rate |
1.0 | % | 2.75 | % | — | — | — | — | 2.73 | % | ||||||||||||||||||
A change of 1.0% in variable interest rates would adversely or positively impact our expected net earnings by approximately $2.4 million for the year ended December 31, 2013.
Foreign Currency Risk
We are exposed to currency fluctuations in connection with transactions denominated in currencies other than the functional currencies of certain subsidiaries. We have entered into forward contracts with several major financial institutions to hedge a portion of projected cash flows from these exposures. These are primarily contracts to buy or sell a foreign currency against the U.S. dollar or the Euro. The fair value of the open forward contracts as of December 31, 2012 was a net loss of $0.4 million. The following table provides information regarding our open forward currency contracts as of December 31, 2012, which mature in 2013. Forward contract notional amounts presented below are expressed in the stated currencies. The total notional amount for all contracts translates to approximately $66.9 million.
60
Table of Contents
Forward Currency Contracts:
| Buy/(Sell) | ||||
| (in thousands) | ||||
|
Japanese yen |
(230,699 | ) | ||
|
United States dollars |
(15,600 | ) | ||
|
Euros |
(9,332 | ) | ||
|
British pound |
(1,440 | ) | ||
|
Mexican peso |
92,842 | |||
|
Czech koruna |
143,511 | |||
|
Chinese renminbi |
(47,269 | ) | ||
|
Singapore dollar |
27,000 | |||
|
South African rand |
(9,225 | ) | ||
|
Malaysian ringgits |
31,685 | |||
|
Canadian dollars |
(4,919 | ) | ||
A strengthening of 10% in the value of the U.S. dollar against foreign currencies would, on a combined basis, adversely impact the translation of our non-US subsidiary net earnings and transactions in currencies other than the functional currency of certain subsidiaries by approximately $12.1 million for the year ended December 31, 2013.
|
|
STATEMENTS AND SUPPLEMENTARY DATA |
The financial statements and supplementary data required by this Item are included herein, commencing on page F-1.
| ITEM 9. | CHANGES IN AND DISAGREEMENTS WITH ACCOUNTANTS ON ACCOUNTING AND FINANCIAL DISCLOSURE |
None.
|
|
AND PROCEDURES |
(a) Evaluation of Disclosure Controls and Procedures
Our management, with the participation of our Chief Executive Officer and Chief Financial Officer, evaluated the effectiveness of our disclosure controls and procedures as of the end of the period covered by this report. Based on that evaluation, the Chief Executive Officer and Chief Financial Officer concluded that our disclosure controls and procedures as of the end of the period covered by this report are functioning effectively to provide reasonable assurance that the information required to be disclosed by us in reports filed under the Securities Exchange Act of 1934 is (i) recorded, processed, summarized and reported within the time periods specified in the SEC’s rules and forms and (ii) accumulated and communicated to our management, including the Chief Executive Officer and Chief Financial Officer, as appropriate to allow timely decisions regarding disclosure. A controls system cannot provide absolute assurance, however, that the objectives of the controls system are met, and no evaluation of controls can provide absolute assurance that all control issues and instances of fraud, if any, within a company have been detected.
(b) Management’s Report on Internal Control Over Financial Reporting
Our management’s report on internal control over financial reporting is set forth on page F-2 of this Annual Report on Form 10-K and is incorporated by reference herein.
(c) Change in Internal Control over Financial Reporting
No change in our internal control over financial reporting occurred during our most recent fiscal quarter that has materially affected, or is reasonably likely to materially affect, our internal control over financial reporting.
|
|
INFORMATION |
None.
61
Table of Contents
|
|
EXECUTIVE OFFICERS AND CORPORATE GOVERNANCE |
For the information required by this Item 10, other than with respect to our Executive Officers, see “Election Of Directors,” “Nominees for Election to the Board of Directors,” “Corporate Governance” and “Section 16(a) Beneficial Ownership Reporting Compliance,” in the Proxy Statement for our 2013 Annual Meeting, which information is incorporated herein by reference. The Proxy Statement for our 2013 Annual Meeting will be filed within 120 days of the close of our fiscal year.
For the information required by this Item 10 with respect to our Executive Officers, see Part I of this report on pages 11—12.
|
|
COMPENSATION |
For the information required by this Item 11, see “Executive Compensation,” “Compensation Committee Report on Executive Compensation” and “Compensation Committee Interlocks and Insider Participation” in the Proxy Statement for our 2013 Annual Meeting, which information is incorporated herein by reference.
|
|
OWNERSHIP OF CERTAIN BENEFICIAL OWNERS AND MANAGEMENT AND RELATED STOCKHOLDER MATTERS |
For the information required by this Item 12 with respect to beneficial ownership of our common stock, see “Security Ownership of Certain Beneficial Owners and Management” in the Proxy Statement for our 2013 Annual Meeting, which information is incorporated herein by reference.
The following table sets forth certain information as of December 31, 2012 regarding our 2000 Stock Compensation Plan and 2008 Stock Incentive Plan:
|
Plan Category |
Number of Securities
to be Issued Upon Exercise of Outstanding Options, Warrants and Rights |
Weighted-Average
Exercise Price of Outstanding Options, Warrants and Rights |
Number of Securities
Remaining Available for Future Issuance Under Equity Compensation Plans (Excluding Securities Reflected in Column (A)) |
|||||||||
| (A) | (B) | (C) | ||||||||||
|
Equity compensation plans approved by security holders |
1,084,193 | 58.43 | 2,041,588 | |||||||||
|
|
RELATIONSHIPS AND RELATED TRANSACTIONS, AND DIRECTOR INDEPENDENCE |
For the information required by this Item 13, see “Certain Transactions” and “Corporate Governance” in the Proxy Statement for our 2013 Annual Meeting, which information is incorporated herein by reference.
|
|
ACCOUNTING FEES AND SERVICES |
For the information required by this Item 14, see “Audit and Non-Audit Fees” and “Policy on Audit Committee Pre-Approval of Audit and Non-Audit Services of Independent Registered Public Accounting Firm” in the Proxy Statement for our 2013 Annual Meeting, which information is incorporated herein by reference.
62
Table of Contents
|
|
FINANCIAL STATEMENT SCHEDULES |
(a) Consolidated Financial Statements:
The Index to Consolidated Financial Statements and Schedule is set forth on page F-1 hereof.
(b) Exhibits:
The Exhibits are listed in the Index to Exhibits.
63
Table of Contents
Pursuant to the requirements of Section 13 or 15(d) of the Securities Exchange Act of 1934, the registrant has duly caused this Annual Report to be signed on its behalf by the undersigned, thereunto duly authorized as of the date indicated below.
| TELEFLEX INCORPORATED | ||
| By: |
/ S / B ENSON F. S MITH |
|
|
Benson F. Smith (Principal Executive Officer) Chairman, President and Chief Executive Officer |
||
Pursuant to the requirements of the Securities Exchange Act of 1934, this report has been signed below by the following persons on behalf of the registrant and in the capacities and as of the date indicated below.
| By: |
/ S / T HOMAS E. P OWELL |
|
|
Thomas E. Powell (Principal Financial and Accounting Officer) Executive Vice President and Chief Financial Officer |
| By: |
/ S / G EORGE B ABICH , J R . George Babich, Jr. Director |
By: |
/ S / S IGISMUNDUS W.W. L UBSEN Sigismundus W.W. Lubsen Director |
|||
| By: |
/ S / P ATRICIA C. B ARRON Patricia C. Barron Director |
By: |
/ S / S TUART A. R ANDLE Stuart A. Randle Director |
|||
| By: |
/ S / W ILLIAM R. C OOK William R. Cook Director |
By: |
/ S / B ENSON F. S MITH Benson F. Smith Chairman, President, Chief Executive Officer & Director |
|||
| By: |
/ S / D R . J EFFREY A. G RAVES Dr. Jeffrey A. Graves Director |
By: |
/ S / H AROLD L. Y OH III Harold L. Yoh III Director |
|||
| By: |
/ S / S TEPHEN K. K LASKO Stephen K. Klasko Director |
By: |
/ S / J AMES W. Z UG James W. Zug Director |
|||
Dated: February 22, 2013
64
Table of Contents
TELEFLEX INCORPORATED
INDEX TO CONSOLIDATED FINANCIAL STATEMENTS
CONSOLIDATED FINANCIAL STATEMENTS
FINANCIAL STATEMENT SCHEDULE
| Page | ||||
| F-68 | ||||
F-1
Table of Contents
MANAGEMENT’S REPORT ON INTERNAL CONTROL OVER FINANCIAL REPORTING
The management of Teleflex Incorporated and its subsidiaries (the “Company”) is responsible for establishing and maintaining adequate internal control over financial reporting. Internal control over financial reporting is a process designed to provide reasonable assurance regarding the reliability of financial reporting and the preparation of financial statements for external purposes in accordance with generally accepted accounting principles. A company’s internal control over financial reporting includes those policies and procedures that pertain to the maintenance of records that, in reasonable detail, accurately and fairly reflect the transactions and dispositions of the assets of the company; provide reasonable assurance that transactions are recorded as necessary to permit preparation of financial statements in accordance with generally accepted accounting principles, and that receipts and expenditures of the company are being made only in accordance with authorizations of management and directors of the company; and provide reasonable assurance regarding prevention or timely detection of unauthorized acquisition, use, or disposition of the company’s assets that could have a material effect on the financial statements.
Because of its inherent limitations, internal control over financial reporting may not prevent or detect misstatements. Also, projections of any evaluation of effectiveness to future periods are subject to the risk that controls may become inadequate because of changes in conditions, or that the degree of compliance with the policies or procedures may deteriorate.
Management assessed the effectiveness of the Company’s internal control over financial reporting as of December 31, 2012. In making this assessment, management used the framework established in Internal Control — Integrated Framework issued by the Committee of Sponsoring Organizations of the Treadway Commission (COSO). As a result of this assessment and based on the criteria in the COSO framework, management has concluded that, as of December 31, 2012, the Company’s internal control over financial reporting was effective.
In October of 2012, the Company acquired substantially all of the assets of LMA International N.V. (“LMA”) and the LMA branded laryngeal mask supraglottic airway business and certain other products of Intavent Direct Limited and its affiliates (the “LMA Businesses”). Management has excluded the LMA Businesses from its evaluation of the effectiveness of the Company’s internal control over financial reporting as of December 31, 2012. The net revenues attributable to the LMA Businesses totaled approximately $24 million from the date of acquisition through December 31, 2012, representing approximately 2 percent of the Company’s consolidated net revenues for the year ended December 31, 2012, and the aggregate total assets of the LMA Businesses at December 31, 2012 were $402 million, representing approximately 11 percent of the Company’s consolidated total assets as of December 31, 2012.
The effectiveness of the Company’s internal control over financial reporting as of December 31, 2012 has been audited by PricewaterhouseCoopers LLP, an independent registered public accounting firm, as stated in their report which appears herein.
|
/ S / B ENSON F. S MITH Benson F. Smith Chairman, President and Chief Executive Officer |
/ S / T HOMAS E. P OWELL Thomas E. Powell Executive Vice President and Chief Financial Officer |
February 22, 2013
F-2
Table of Contents
REPORT OF INDEPENDENT REGISTERED PUBLIC ACCOUNTING FIRM
To the Board of Directors and Shareholders of Teleflex Incorporated:
In our opinion, the consolidated financial statements listed in the accompanying index appearing on page F-1 present fairly, in all material respects, the financial position of Teleflex Incorporated and its subsidiaries at December 31, 2012 and 2011, and the results of their operations and their cash flows for each of the three years in the period ended December 31, 2012 in conformity with accounting principles generally accepted in the United States of America. In addition, in our opinion, the financial statement schedule listed in the accompanying index appearing on page F-1 presents fairly, in all material respects, the information set forth therein when read in conjunction with the related consolidated financial statements. Also in our opinion, the Company maintained, in all material respects, effective internal control over financial reporting as of December 31, 2012, based on criteria established in Internal Control — Integrated Framework issued by the Committee of Sponsoring Organizations of the Treadway Commission (COSO). The Company’s management is responsible for these financial statements and financial statement schedule, for maintaining effective internal control over financial reporting and for its assessment of the effectiveness of internal control over financial reporting, included in “Management’s Report on Internal Control over Financial Reporting” appearing on page F-2. Our responsibility is to express opinions on these financial statements, on the financial statement schedule, and on the Company’s internal control over financial reporting based on our integrated audits. We conducted our audits in accordance with the standards of the Public Company Accounting Oversight Board (United States). Those standards require that we plan and perform the audits to obtain reasonable assurance about whether the financial statements are free of material misstatement and whether effective internal control over financial reporting was maintained in all material respects. Our audits of the financial statements included examining, on a test basis, evidence supporting the amounts and disclosures in the financial statements, assessing the accounting principles used and significant estimates made by management, and evaluating the overall financial statement presentation. Our audit of internal control over financial reporting included obtaining an understanding of internal control over financial reporting, assessing the risk that a material weakness exists, and testing and evaluating the design and operating effectiveness of internal control based on the assessed risk. Our audits also included performing such other procedures as we considered necessary in the circumstances. We believe that our audits provide a reasonable basis for our opinions.
A company’s internal control over financial reporting is a process designed to provide reasonable assurance regarding the reliability of financial reporting and the preparation of financial statements for external purposes in accordance with generally accepted accounting principles. A company’s internal control over financial reporting includes those policies and procedures that (i) pertain to the maintenance of records that, in reasonable detail, accurately and fairly reflect the transactions and dispositions of the assets of the company; (ii) provide reasonable assurance that transactions are recorded as necessary to permit preparation of financial statements in accordance with generally accepted accounting principles, and that receipts and expenditures of the company are being made only in accordance with authorizations of management and directors of the company; and (iii) provide reasonable assurance regarding prevention or timely detection of unauthorized acquisition, use, or disposition of the company’s assets that could have a material effect on the financial statements.
Because of its inherent limitations, internal control over financial reporting may not prevent or detect misstatements. Also, projections of any evaluation of effectiveness to future periods are subject to the risk that controls may become inadequate because of changes in conditions, or that the degree of compliance with the policies or procedures may deteriorate.
F-3
Table of Contents
As described in “Management’s Report on Internal Control over Financial Reporting” appearing on page F-2, Management has excluded the LMA Businesses (as defined in “Management’s Report on Internal Control over Financial Reporting”) from its assessment of internal control over financial reporting as of December 31, 2012, because the LMA Businesses were acquired by the Company in a purchase business combination during 2012. We also excluded the LMA Businesses from our audit of internal control over financial reporting. The LMA Businesses comprise assets and wholly-owned subsidiaries of Teleflex Incorporated whose total assets and total revenues represent 11% and 2%, respectively, of the related consolidated financial statement amounts as of and for the year ended December 31, 2012.
/s/ PricewaterhouseCoopers LLP
Philadelphia, Pennsylvania
February 22, 2013
F-4
Table of Contents
TELEFLEX INCORPORATED AND SUBSIDIARIES
| Year Ended December 31, | ||||||||||||
| 2012 | 2011 | 2010 | ||||||||||
|
(Dollars and shares in thousands,
except per share) |
||||||||||||
|
Net revenues |
$ | 1,551,009 | $ | 1,492,528 | $ | 1,397,722 | ||||||
|
Cost of goods sold |
802,784 | 783,750 | 718,883 | |||||||||
|
|
|
|
|
|
|
|||||||
|
Gross profit |
748,225 | 708,778 | 678,839 | |||||||||
|
Selling, general and administrative expenses |
454,489 | 423,909 | 403,635 | |||||||||
|
Research and development expenses |
56,278 | 48,712 | 42,380 | |||||||||
|
Goodwill impairment |
332,128 | — | — | |||||||||
|
Restructuring and other impairment charges |
3,037 | 6,005 | 2,875 | |||||||||
|
Net (gain) loss on sales of businesses and assets |
(332 | ) | 582 | (341 | ) | |||||||
|
|
|
|
|
|
|
|||||||
|
Income (loss) from continuing operations before interest, loss on extinguishments of debt and taxes |
(97,375 | ) | 229,570 | 230,290 | ||||||||
|
Interest expense |
69,565 | 70,317 | 79,789 | |||||||||
|
Interest income |
(1,571 | ) | (1,260 | ) | (719 | ) | ||||||
|
Loss on extinguishments of debt |
— | 15,413 | 46,630 | |||||||||
|
|
|
|
|
|
|
|||||||
|
Income (loss) from continuing operations before taxes |
(165,369 | ) | 145,100 | 104,590 | ||||||||
|
Taxes on income (loss) from continuing operations |
16,413 | 25,778 | 16,918 | |||||||||
|
|
|
|
|
|
|
|||||||
|
Income (loss) from continuing operations |
(181,782 | ) | 119,322 | 87,672 | ||||||||
|
|
|
|
|
|
|
|||||||
|
Operating income (loss) from discontinued operations (including gain on disposal of $2,205, $270,630, and $114,702, respectively) |
(9,207 | ) | 292,683 | 168,829 | ||||||||
|
Taxes on income (loss) from discontinued operations |
(1,887 | ) | 87,038 | 54,046 | ||||||||
|
|
|
|
|
|
|
|||||||
|
Income (loss) from discontinued operations |
(7,320 | ) | 205,645 | 114,783 | ||||||||
|
|
|
|
|
|
|
|||||||
|
Net income (loss) |
(189,102 | ) | 324,967 | 202,455 | ||||||||
|
Less: Income from continuing operations attributable to noncontrolling interest |
955 | 1,021 | 861 | |||||||||
|
Income from discontinued operations attributable to noncontrolling interest |
— | 617 | 500 | |||||||||
|
|
|
|
|
|
|
|||||||
|
Net income (loss) attributable to common shareholders |
$ | (190,057 | ) | $ | 323,329 | $ | 201,094 | |||||
|
|
|
|
|
|
|
|||||||
|
Earnings per share available to common shareholders: |
||||||||||||
|
Basic: |
||||||||||||
|
Income (loss) from continuing operations |
$ | (4.47 | ) | $ | 2.92 | $ | 2.18 | |||||
|
Income (loss) from discontinued operations |
(0.18 | ) | 5.06 | 2.86 | ||||||||
|
|
|
|
|
|
|
|||||||
|
Net income (loss) |
$ | (4.65 | ) | $ | 7.98 | $ | 5.04 | |||||
|
|
|
|
|
|
|
|||||||
|
Diluted: |
||||||||||||
|
Income (loss) from continuing operations |
$ | (4.47 | ) | $ | 2.90 | $ | 2.16 | |||||
|
Income (loss) from discontinued operations |
(0.18 | ) | 5.02 | 2.83 | ||||||||
|
|
|
|
|
|
|
|||||||
|
Net income (loss) |
$ | (4.65 | ) | $ | 7.92 | $ | 4.99 | |||||
|
|
|
|
|
|
|
|||||||
|
Dividends per share |
$ | 1.36 | $ | 1.36 | $ | 1.36 | ||||||
|
Weighted average common shares outstanding: |
||||||||||||
|
Basic |
40,859 | 40,501 | 39,906 | |||||||||
|
Diluted |
40,859 | 40,801 | 40,280 | |||||||||
|
Amounts attributable to common shareholders: |
||||||||||||
|
Income (loss) from continuing operations, net of tax |
$ | (182,737 | ) | $ | 118,301 | $ | 86,811 | |||||
|
Income (loss) from discontinued operations, net of tax |
(7,320 | ) | 205,028 | 114,283 | ||||||||
|
|
|
|
|
|
|
|||||||
|
Net income (loss) |
$ | (190,057 | ) | $ | 323,329 | $ | 201,094 | |||||
|
|
|
|
|
|
|
|||||||
The accompanying notes are an integral part of the consolidated financial statements.
F-5
Table of Contents
TELEFLEX INCORPORATED AND SUBSIDIARIES
CONSOLIDATED STATEMENTS OF COMPREHENSIVE INCOME (LOSS)
| Year Ended December 31, | ||||||||||||
| 2012 | 2011 | 2010 | ||||||||||
| (Dollars in thousands) | ||||||||||||
|
Net income (loss) |
$ | (189,102 | ) | $ | 324,967 | $ | 202,455 | |||||
|
Other comprehensive income (loss), net of tax: |
||||||||||||
|
Foreign currency: |
||||||||||||
|
Foreign currency translation continuing operations adjustments, net of tax ($1,210, $(161), $(1,910), respectively) |
13,071 | (53,386 | ) | (23,105 | ) | |||||||
|
Foreign currency translation discontinued operations |
— | — | 4,703 | |||||||||
|
Foreign currency translation divestiture of businesses |
— | (23,687 | ) | — | ||||||||
|
|
|
|
|
|
|
|||||||
|
Foreign currency translation, net of tax |
13,071 | (77,073 | ) | (18,402 | ) | |||||||
|
|
|
|
|
|
|
|||||||
|
Pension and other postretirement benefits plans: |
||||||||||||
|
Prior service cost recognized in net periodic cost, net of tax ($(8), $(9), $(10), respectively) |
(12 | ) | (15 | ) | (15 | ) | ||||||
|
Transition obligation recognized in net periodic cost, net of tax ($35, $42, $41, respectively) |
62 | 68 | 69 | |||||||||
|
Unamortized gain (loss) arising during the period, net of tax ($2,285, $(28,841), $(2,207), respectively) |
2,910 | (50,421 | ) | (3,670 | ) | |||||||
|
Net loss recognized in net periodic cost, net of tax ($2,537, $1,399, $1,434, respectively) |
4,621 | 2,488 | 2,597 | |||||||||
|
Settlement, net of tax ($40, $(2), $(17), respectively) |
66 | (3 | ) | (23 | ) | |||||||
|
Curtailment, net of tax of $(44) in 2012 |
(74 | ) | — | — | ||||||||
|
Tax rate adjustments |
(114 | ) | 62 | (293 | ) | |||||||
|
Discontinued operations, net of tax of $(262) in 2010 |
— | — | (440 | ) | ||||||||
|
Divestiture of businesses, net of tax of $4,865 in 2011 |
— | 9,076 | — | |||||||||
|
Foreign currency translation, net of tax ($(58), $(20), $151, respectively) |
(168 | ) | (57 | ) | 383 | |||||||
|
|
|
|
|
|
|
|||||||
|
Pension and other postretirement benefits plans adjustment, net of tax |
7,291 | (38,802 | ) | (1,392 | ) | |||||||
|
|
|
|
|
|
|
|||||||
|
Derivatives qualifying as hedges: |
||||||||||||
|
Unrealized gain (loss) on derivatives arising during the period, net of tax ($102, $(830), $(4,472), respectively) |
515 | (1,812 | ) | (5,873 | ) | |||||||
|
Reclassification adjustment on derivatives included in net income, net of tax ($3,832, $5,757, $5,668, respectively) |
6,361 | 9,990 | 7,881 | |||||||||
|
Tax rate adjustments |
— | (108 | ) | 33 | ||||||||
|
Discontinued operations, net of tax ($(39), $24 in 2011 and 2010, respectively) |
— | (65 | ) | 40 | ||||||||
|
|
|
|
|
|
|
|||||||
|
Derivatives qualifying as hedges, net of tax |
6,876 | 8,005 | 2,081 | |||||||||
|
|
|
|
|
|
|
|||||||
|
Other comprehensive income (loss), net of tax |
27,238 | (107,870 | ) | (17,713 | ) | |||||||
|
|
|
|
|
|
|
|||||||
|
Comprehensive income (loss) |
(161,864 | ) | 217,097 | 184,742 | ||||||||
|
Less: comprehensive income attributable to noncontrolling interest |
888 | 1,241 | 1,408 | |||||||||
|
|
|
|
|
|
|
|||||||
|
Comprehensive income (loss) attributable to common shareholders |
$ | (162,752 | ) | $ | 215,856 | $ | 183,334 | |||||
|
|
|
|
|
|
|
|||||||
The accompanying notes are an integral part of the consolidated financial statements.
F-6
Table of Contents
TELEFLEX INCORPORATED AND SUBSIDIARIES
| December 31, | ||||||||
| 2012 | 2011 | |||||||
|
(Dollars and shares in
thousands) |
||||||||
| ASSETS | ||||||||
|
Current assets |
||||||||
|
Cash and cash equivalents |
$ | 337,039 | $ | 584,088 | ||||
|
Accounts receivable, net |
297,976 | 286,226 | ||||||
|
Inventories, net |
323,347 | 298,775 | ||||||
|
Prepaid expenses and other current assets |
28,712 | 33,405 | ||||||
|
Prepaid taxes |
27,160 | 28,846 | ||||||
|
Deferred tax assets |
46,882 | 41,014 | ||||||
|
Assets held for sale |
7,963 | 7,902 | ||||||
|
|
|
|
|
|||||
|
Total current assets |
1,069,079 | 1,280,256 | ||||||
|
Property, plant and equipment, net |
297,945 | 251,912 | ||||||
|
Goodwill |
1,249,456 | 1,438,542 | ||||||
|
Intangibles assets, net |
1,058,792 | 879,787 | ||||||
|
Investments in affiliates |
2,066 | 2,008 | ||||||
|
Deferred tax assets |
296 | 278 | ||||||
|
Other assets |
61,863 | 71,320 | ||||||
|
|
|
|
|
|||||
|
Total assets |
$ | 3,739,497 | $ | 3,924,103 | ||||
|
|
|
|
|
|||||
| LIABILITIES AND EQUITY | ||||||||
|
Current liabilities |
||||||||
|
Notes payable |
$ | 4,700 | $ | 4,986 | ||||
|
Accounts payable |
75,165 | 67,092 | ||||||
|
Accrued expenses |
65,064 | 74,207 | ||||||
|
Current portion of contingent consideration |
23,693 | 3,953 | ||||||
|
Payroll and benefit-related liabilities |
74,586 | 64,386 | ||||||
|
Derivative liabilities |
598 | 633 | ||||||
|
Accrued interest |
9,418 | 10,960 | ||||||
|
Income taxes payable |
15,573 | 21,084 | ||||||
|
Current liability for uncertain tax positions |
4,684 | 22,656 | ||||||
|
Deferred tax liabilities |
924 | 1,050 | ||||||
|
|
|
|
|
|||||
|
Total current liabilities |
274,405 | 271,007 | ||||||
|
Long-term borrowings |
965,280 | 954,809 | ||||||
|
Deferred tax liabilities |
419,266 | 420,833 | ||||||
|
Pension and postretirement benefit liabilities |
170,946 | 194,984 | ||||||
|
Noncurrent liability for uncertain tax positions |
68,292 | 61,688 | ||||||
|
Other liabilities |
59,771 | 37,999 | ||||||
|
|
|
|
|
|||||
|
Total liabilities |
1,957,960 | 1,941,320 | ||||||
|
Commitments and contingencies (See Note 16) |
||||||||
|
Common shareholders’ equity |
||||||||
|
Common shares, $1 par value Issued: 2012 — 43,102 shares; 2011 — 42,923 shares |
43,102 | 42,923 | ||||||
|
Additional paid-in capital |
394,384 | 380,965 | ||||||
|
Retained earnings |
1,601,460 | 1,847,106 | ||||||
|
Accumulated other comprehensive income (loss) |
(132,048 | ) | (159,353 | ) | ||||
|
|
|
|
|
|||||
| 1,906,898 | 2,111,641 | |||||||
|
Less: Treasury stock, at cost |
127,948 | 131,053 | ||||||
|
|
|
|
|
|||||
|
Total common shareholders’ equity |
1,778,950 | 1,980,588 | ||||||
|
|
|
|
|
|||||
|
Noncontrolling interest |
2,587 | 2,195 | ||||||
|
|
|
|
|
|||||
|
Total equity |
1,781,537 | 1,982,783 | ||||||
|
|
|
|
|
|||||
|
Total liabilities and equity |
$ | 3,739,497 | $ | 3,924,103 | ||||
|
|
|
|
|
|||||
The accompanying notes are an integral part of the consolidated financial statements.
F-7
Table of Contents
TELEFLEX INCORPORATED AND SUBSIDIARIES
| Year Ended December 31, | ||||||||||||
| 2012 | 2011 | 2010 | ||||||||||
| (Dollars in thousands) | ||||||||||||
|
Cash Flows from Operating Activities of Continuing Operations: |
||||||||||||
|
Net income (loss) |
$ | (189,102 | ) | $ | 324,967 | $ | 202,455 | |||||
|
Adjustments to reconcile net income to net cash provided by operating activities: |
||||||||||||
|
Loss (income) from discontinued operations |
7,320 | (205,645 | ) | (114,783 | ) | |||||||
|
Depreciation expense |
36,204 | 40,336 | 41,225 | |||||||||
|
Amortization expense of intangible assets |
44,264 | 42,634 | 40,765 | |||||||||
|
Amortization expense of deferred financing costs and debt discount |
14,416 | 13,526 | 7,750 | |||||||||
|
Loss on extinguishments of debt |
— | 15,413 | 46,630 | |||||||||
|
Interest rate swap buyout |
— | (11,695 | ) | — | ||||||||
|
Gain on call options and warrants |
— | — | (407 | ) | ||||||||
|
Debt modification costs |
— | — | 2,843 | |||||||||
|
Stock-based compensation |
8,623 | 4,532 | 8,521 | |||||||||
|
Net (gain) loss on sales of businesses and assets |
(332 | ) | 582 | (341 | ) | |||||||
|
Impairment of investments in affiliates |
— | 2,499 | — | |||||||||
|
Goodwill impairment |
332,128 | — | — | |||||||||
|
Deferred income taxes, net |
(39,178 | ) | (14,067 | ) | (165 | ) | ||||||
|
Other |
(3,468 | ) | (2,447 | ) | (24,195 | ) | ||||||
|
Changes in operating assets and liabilities, net of effects of acquisitions and disposals: |
||||||||||||
|
Accounts receivable |
(2,932 | ) | (43,561 | ) | (50,088 | ) | ||||||
|
Inventories |
(1,970 | ) | (33,819 | ) | (21,421 | ) | ||||||
|
Prepaid expenses and other current assets |
9,595 | (8,473 | ) | (7,865 | ) | |||||||
|
Accounts payable and accrued expenses |
(1,457 | ) | (1,616 | ) | (11,135 | ) | ||||||
|
Income taxes receivable and payable, net |
(20,258 | ) | (28,809 | ) | 24,045 | |||||||
|
|
|
|
|
|
|
|||||||
|
Net cash provided by operating activities from continuing operations |
193,853 | 94,357 | 143,834 | |||||||||
|
|
|
|
|
|
|
|||||||
|
Cash Flows from Investing Activities of Continuing Operations: |
||||||||||||
|
Expenditures for property, plant and equipment |
(65,394 | ) | (44,582 | ) | (29,330 | ) | ||||||
|
Payments for businesses and intangibles acquired, net of cash acquired |
(387,040 | ) | (30,570 | ) | (82 | ) | ||||||
|
Proceeds from sales of businesses and assets, net of cash sold |
66,660 | 376,025 | 181,550 | |||||||||
|
Investments in affiliates |
(80 | ) | (150 | ) | — | |||||||
|
|
|
|
|
|
|
|||||||
|
Net cash (used in) provided by investing activities from continuing operations |
(385,854 | ) | 300,723 | 152,138 | ||||||||
|
|
|
|
|
|
|
|||||||
|
Cash Flows from Financing Activities of Continuing Operations: |
||||||||||||
|
Proceeds from long-term borrowings |
— | 515,000 | 490,000 | |||||||||
|
Repayment of long-term borrowings |
— | (455,800 | ) | (716,570 | ) | |||||||
|
Debt extinguishment, issuance and amendment fees |
— | (18,518 | ) | (65,226 | ) | |||||||
|
(Decrease) increase in notes payable and current borrowings |
(706 | ) | (24,714 | ) | 29,700 | |||||||
|
Proceeds from stock compensation plans |
9,003 | 34,009 | 10,657 | |||||||||
|
Payments to noncontrolling interest shareholders |
— | — | (1,148 | ) | ||||||||
|
Dividends |
(55,589 | ) | (55,136 | ) | (54,312 | ) | ||||||
|
Purchase of call options |
— | — | (88,000 | ) | ||||||||
|
Proceeds from sale of warrants |
— | — | 59,400 | |||||||||
|
|
|
|
|
|
|
|||||||
|
Net cash used in financing activities from continuing operations |
(47,292 | ) | (5,159 | ) | (335,499 | ) | ||||||
|
|
|
|
|
|
|
|||||||
|
Cash Flows from Discontinued Operations: |
||||||||||||
|
Net cash (used in) provided by operating activities |
(7,799 | ) | 121 | 69,268 | ||||||||
|
Net cash used in investing activities |
(2,351 | ) | (2,875 | ) | (4,336 | ) | ||||||
|
Net cash used in financing activities |
— | — | (1,128 | ) | ||||||||
|
|
|
|
|
|
|
|||||||
|
Net cash (used in) provided by discontinued operations |
(10,150 | ) | (2,754 | ) | 63,804 | |||||||
|
|
|
|
|
|
|
|||||||
|
Effect of exchange rate changes on cash and cash equivalents |
2,394 | (11,531 | ) | (4,130 | ) | |||||||
|
|
|
|
|
|
|
|||||||
|
Net (decrease) increase in cash and cash equivalents |
(247,049 | ) | 375,636 | 20,147 | ||||||||
|
Cash and cash equivalents at the beginning of the year |
584,088 | 208,452 | 188,305 | |||||||||
|
|
|
|
|
|
|
|||||||
|
Cash and cash equivalents at the end of the year |
$ | 337,039 | $ | 584,088 | $ | 208,452 | ||||||
|
|
|
|
|
|
|
|||||||
|
Cash interest paid |
$ | 46,683 | $ | 45,336 | $ | 76,396 | ||||||
|
|
|
|
|
|
|
|||||||
|
Income taxes paid |
$ | 85,628 | $ | 77,233 | $ | 97,536 | ||||||
|
|
|
|
|
|
|
|||||||
The accompanying notes are an integral part of the consolidated financial statements.
F-8
Table of Contents
TELEFLEX INCORPORATED AND SUBSIDIARIES
CONSOLIDATED STATEMENTS OF CHANGES IN EQUITY
| Common Stock |
Additional
Paid in Capital |
Retained
Earnings |
Accumulated
Other Comprehensive Income (loss) |
Treasury
Stock |
Noncontrolling
Interest |
Total
Equity |
||||||||||||||||||||||||||||||
| Shares | Dollars | Shares | Dollars | |||||||||||||||||||||||||||||||||
| (Dollars and shares in thousands, except per share) | ||||||||||||||||||||||||||||||||||||
|
Balance at December 31, 2009 |
42,033 | $ | 42,033 | $ | 277,050 | $ | 1,431,878 | $ | (34,120 | ) | 2,278 | $ | (136,600 | ) | $ | 4,833 | $ | 1,585,074 | ||||||||||||||||||
|
Net income |
201,094 | 1,361 | 202,455 | |||||||||||||||||||||||||||||||||
|
Cash dividends ($1.36 per share) |
(54,312 | ) | (54,312 | ) | ||||||||||||||||||||||||||||||||
|
Other comprehensive loss |
(17,760 | ) | 47 | (17,713 | ) | |||||||||||||||||||||||||||||||
|
Convertible debt discount, net of tax of $29,532 |
51,702 | 51,702 | ||||||||||||||||||||||||||||||||||
|
Call options, net of tax
|
(58,602 | ) | (58,602 | ) | ||||||||||||||||||||||||||||||||
|
Warrants |
60,775 | 60,775 | ||||||||||||||||||||||||||||||||||
|
Distributions to noncontrolling interest shareholders |
(1,974 | ) | (1,974 | ) | ||||||||||||||||||||||||||||||||
|
Deconsolidation of VIE |
253 | (365 | ) | (112 | ) | |||||||||||||||||||||||||||||||
|
Shares issued under compensation plans |
212 | 212 | 18,231 | (22 | ) | 1,302 | 19,745 | |||||||||||||||||||||||||||||
|
Deferred compensation |
(6 | ) | 240 | 240 | ||||||||||||||||||||||||||||||||
|
|
|
|
|
|
|
|
|
|
|
|
|
|
|
|
|
|
|
|||||||||||||||||||
|
Balance at December 31, 2010 |
42,245 | 42,245 | 349,156 | 1,578,913 | (51,880 | ) | 2,250 | (135,058 | ) | 3,902 | 1,787,278 | |||||||||||||||||||||||||
|
Net income |
323,329 | 1,638 | 324,967 | |||||||||||||||||||||||||||||||||
|
Cash dividends ($1.36 per share) |
(55,136 | ) | (55,136 | ) | ||||||||||||||||||||||||||||||||
|
Other comprehensive loss |
(107,473 | ) | (397 | ) | (107,870 | ) | ||||||||||||||||||||||||||||||
|
Disposition of noncontrolling interest |
(2,830 | ) | (2,830 | ) | ||||||||||||||||||||||||||||||||
|
Distributions to noncontrolling interest shareholders |
(118 | ) | (118 | ) | ||||||||||||||||||||||||||||||||
|
Shares issued under compensation plans |
678 | 678 | 31,848 | (63 | ) | 3,829 | 36,355 | |||||||||||||||||||||||||||||
|
Deferred compensation |
(39 | ) | (4 | ) | 176 | 137 | ||||||||||||||||||||||||||||||
|
|
|
|
|
|
|
|
|
|
|
|
|
|
|
|
|
|
|
|||||||||||||||||||
|
Balance at December 31, 2011 |
42,923 | 42,923 | 380,965 | 1,847,106 | (159,353 | ) | 2,183 | (131,053 | ) | 2,195 | 1,982,783 | |||||||||||||||||||||||||
|
Net income (loss) |
(190,057 | ) | 955 | (189,102 | ) | |||||||||||||||||||||||||||||||
|
Cash dividends ($1.36 per share) |
(55,589 | ) | (55,589 | ) | ||||||||||||||||||||||||||||||||
|
Other comprehensive income |
27,305 | (67 | ) | 27,238 | ||||||||||||||||||||||||||||||||
|
Distributions to noncontrolling interest shareholders |
(496 | ) | (496 | ) | ||||||||||||||||||||||||||||||||
|
Shares issued under compensation plans |
179 | 179 | 13,429 | (49 | ) | 2,989 | 16,597 | |||||||||||||||||||||||||||||
|
Deferred compensation |
(10 | ) | (4 | ) | 116 | 106 | ||||||||||||||||||||||||||||||
|
|
|
|
|
|
|
|
|
|
|
|
|
|
|
|
|
|
|
|||||||||||||||||||
|
Balance at December 31, 2012 |
43,102 | $ | 43,102 | $ | 394,384 | $ | 1,601,460 | $ | (132,048 | ) | 2,130 | $ | (127,948 | ) | $ | 2,587 | $ | 1,781,537 | ||||||||||||||||||
|
|
|
|
|
|
|
|
|
|
|
|
|
|
|
|
|
|
|
|||||||||||||||||||
The accompanying notes are an integral part of the consolidated financial statements.
F-9
Table of Contents
TELEFLEX INCORPORATED AND SUBSIDIARIES
NOTES TO CONSOLIDATED FINANCIAL STATEMENTS
(Dollars in millions, except per share)
Consolidation: The consolidated financial statements include the accounts of Teleflex Incorporated and its subsidiaries (the “Company”). Intercompany transactions are eliminated in consolidation. Investments in affiliates over which the Company has significant influence but not a controlling equity interest, including variable interest entities where the Company is not the primary beneficiary, are carried on the equity basis. Investments in affiliates over which the Company does not have significant influence are accounted for by the cost method of accounting. These consolidated financial statements have been prepared in conformity with accounting principles generally accepted in the United States of America and include management’s estimates and assumptions that affect the recorded amounts.
Use of estimates: The preparation of financial statements in conformity with accounting principles generally accepted in the United States of America requires management to make estimates and assumptions that affect the reported amounts of assets and liabilities and disclosure of contingent assets and liabilities at the date of the financial statements and the reported amounts of net revenues and expenses during the reporting period. Actual results could differ from those estimates.
Cash and cash equivalents: All highly liquid debt instruments with an original maturity of three months or less are classified as cash equivalents. The carrying value of cash equivalents approximates their current market value.
Accounts receivable: Accounts receivable represents amounts due from customers related to the sale of products and provision of services. An allowance for doubtful accounts is maintained and represents the Company’s estimate of the amount of receivables it will be unable to collect. The allowance is provided at such time that management believes reasonable doubt exists that such balances will be collected within a reasonable period of time. The allowance is based on the Company’s historical experience, the length of time an account is outstanding, the financial position of the customer and information provided by credit rating services. The allowance for doubtful accounts was $7.8 million and $6.5 million as of December 31, 2012 and December 31, 2011, respectively. See Note 10, “Financial instruments” for information on the Company’s concentration of credit risk.
Inventories: Inventories are valued at the lower of cost or market. The cost of the Company’s inventories is determined by the average cost method. Elements of cost in inventory include raw materials, direct labor, and manufacturing overhead. In estimating market value, the Company evaluates inventory for excess and obsolete quantities based on estimated usage and sales.
Property, plant and equipment: Property, plant and equipment are stated at cost, net of accumulated depreciation. Costs incurred to develop internal-use computer software during the application development stage generally are capitalized. Costs of enhancements to internal-use computer software are capitalized, provided that these enhancements result in additional functionality. Other additions and those improvements which increase the capacity or lengthen the useful lives of the assets are also capitalized. With minor exceptions, composite useful lives for property, plant and equipment, which are depreciated on a straight-line basis are as follows: land improvements — 5 years; buildings — 30 years ; machinery and equipment — 3 to 10 years; computer equipment and software — 3 to 10 years. Leasehold improvements are depreciated over the remaining lease periods. Repairs and maintenance costs are expensed as incurred.
Goodwill and other intangible assets: Goodwill and other intangible assets with indefinite lives are not amortized but are tested for impairment at least annually, during the fourth quarter or more frequently if events or changes in circumstances indicate the carrying value may not be recoverable. Impairment losses, if any, are included in income from operations. The goodwill impairment test is
F-10
Table of Contents
TELEFLEX INCORPORATED AND SUBSIDIARIES
NOTES TO CONSOLIDATED FINANCIAL STATEMENTS — (Continued)
applied to each of the Company’s reporting units that carry goodwill. For purposes of this assessment, a reporting unit is the operating segment, or a business one level below that operating segment (the component level) if discrete financial information is prepared and regularly reviewed by segment management. However, components are aggregated as a single reporting unit if they have similar economic characteristics.
Goodwill and other intangible assets with indefinite lives are not amortized but are tested for impairment at least annually, during the fourth quarter or more frequently if events or changes in circumstances indicate the carrying value may not be recoverable. Impairment losses, if any, are included in income from operations. The goodwill impairment test is applied to each of the Company reporting units who carry goodwill. For purposes of this assessment, a reporting unit is the operating segment, or a business one level below that operating segment (the component level) if discrete financial information is prepared and regularly reviewed by segment management. However, components are aggregated as a single reporting unit if they have similar economic characteristics.
In applying the goodwill impairment test, the Company may assess qualitative factors to determine whether it is more likely than not that the fair value of a reporting unit is less than its carrying value. Qualitative factors may include, but are not limited to, macroeconomic conditions, industry conditions, the competitive environment, changes in the market for our products and services, regulatory and political developments, entity specific factors such as strategies and financial performance. If, after completing such assessment, it is determined more likely than not that the fair value of a reporting unit is less than its carrying value, the Company proceeds to a two-step quantitative impairment test. Alternatively, the Company may proceed directly to testing goodwill for impairment through the two-step impairment test without conducting the qualitative analysis. In the fourth quarter of 2012, the Company performed a qualitative assessment on six of its reporting units that carry goodwill and determined, based on the qualitative assessment, that the fair value of each reporting unit was more likely than not higher than its carrying value. For the two remaining reporting units that carry goodwill, the Vascular and Anesthesia/Respiratory reporting units, the Company elected to forgo the qualitative assessment and test them through the two-step quantitative impairment test as discussed below.
The first step of the two-step impairment test is to quantitatively compare the fair value of a reporting unit, including goodwill, with its carrying value. In performing the first step, the Company calculated fair values of the various reporting units using equal weighting of two methods; one which estimates the discounted cash flows (“DCF”) of each of the reporting units based on projected earnings in the future (the Income Approach) and one which is based on sales of similar assets in actual transactions (the Market Approach). If the fair value exceeded the carrying value, there is no impairment. If the reporting unit carrying amount exceeded the fair value, the second step of the goodwill impairment test would be performed to measure the amount of the impairment loss, if any. No impairment in the carrying value of any of the Company’s reporting units was evident as a result of the assessment of their respective fair values as determined under the methodology described above in the fourth quarter 2012 impairment test.
The Company’s intangible assets consist of customer lists, intellectual property distribution rights and trade names. The Company tests its intangible assets for impairment annually, and more frequently if events or changes in circumstances indicate it is more likely than not that the asset is impaired. Similar to the goodwill impairment test process, the Company may assess qualitative factors to determine whether it is more likely than not that the fair value of an indefinite-lived intangible asset is less than its carrying value. If, after completing such qualitative assessment, the Company determines it is not more likely than not that the fair value of the indefinite-lived intangible asset is less than its carrying amount, the asset is not impaired. If the Company concludes it is more likely than not that the fair value of the indefinite-lived intangible assets is less than the carrying value, the Company then
F-11
Table of Contents
TELEFLEX INCORPORATED AND SUBSIDIARIES
NOTES TO CONSOLIDATED FINANCIAL STATEMENTS — (Continued)
proceeds to a quantitative impairment test, which consists of a comparison of the fair value of the intangible assets to their carrying amounts. Alternatively, the Company may elect to forgo the qualitative analysis and proceed directly to testing the indefinite-lived intangible asset for impairment through the quantitative impairment test. In the fourth quarter of 2012, the Company performed a qualitative assessment on all of its indefinite-lived assets, except for its Taut tradename, and determined, based on the qualitative assessment, that their fair value was more likely than not higher than its carrying value. For the Taut tradename, the Company elected to test it through the quantitative impairment test, which consists of a comparison of the fair value of the intangible asset to its carry amount. Based on the quantitative test, no impairment of the intangible asset was evident.
Intangible assets consisting of intellectual property, customer lists and distribution rights are being amortized over their estimated useful lives, which are as follows: intellectual property, 3 to 20 years; customer lists, 5 to 30 years; distribution rights, 3 to 22 years. The weighted average amortization period is approximately 14 years. Trade names of $379.4 million and in-process research and development of $53.2 million are considered indefinite lived. The Company periodically evaluates the reasonableness of the useful lives of these assets.
Long-lived assets: The ability to realize long-lived assets is evaluated when events or circumstances indicate a possible inability to recover their carrying amount. Such evaluation is based on various analyses, including undiscounted cash flow and profitability projections that incorporate, as applicable, the impact on the existing business. The analyses necessarily involve significant management judgment. Any impairment loss, if indicated, is measured as the amount by which the carrying amount of the asset exceeds the estimated fair value of the asset.
Product warranty liability: The Company warrants to the original purchaser of certain of its products that it will, at its option, repair or replace, without charge, such products if they fail due to a manufacturing defect. Warranty periods vary by product. The Company has recourse provisions for certain products that would enable recovery from third parties for amounts paid under the warranty. The Company accrues for product warranties when, based on available information, it is probable that customers will make claims under warranties relating to products that have been sold, and a reasonable estimate of the costs (based on historical claims experience relative to sales) can be made.
Foreign currency translation: Assets and liabilities of non-domestic subsidiaries denominated in local currencies are translated into U.S. dollars at the rates of exchange at the balance sheet date; income and expenses are translated at the average rates of exchange prevailing during the year. The translation adjustments are reported as a component of accumulated other comprehensive income.
Derivative financial instruments: The Company uses derivative financial instruments primarily for purposes of hedging exposures to fluctuations in interest rates and foreign currency exchange rates. All instruments are entered into for other than trading purposes. All derivatives are recognized on the balance sheet at fair value. Changes in the fair value of derivatives are recorded in earnings or other comprehensive income, based on whether the instrument is designated as part of a hedge transaction and, if so, the type of hedge transaction. Gains or losses on derivative instruments reported in other comprehensive income are reclassified to earnings in the period in which earnings are affected by the underlying hedged item. The ineffective portion of all hedges is recognized in current period earnings. If the hedging relationship ceases to be highly effective or it becomes probable that an expected transaction will no longer occur, gains or losses on the derivative are recorded in current period earnings.
Share-based compensation: The Company estimates the fair value of share-based awards on the date of grant using an option pricing model. The value of the portion of the award that is ultimately expected to vest is recognized as expense over the requisite service periods. Share-based
F-12
Table of Contents
TELEFLEX INCORPORATED AND SUBSIDIARIES
NOTES TO CONSOLIDATED FINANCIAL STATEMENTS — (Continued)
compensation expense is measured using a Black-Scholes option pricing model that takes into account highly subjective and complex assumptions. The expected life of options granted is derived from the vesting period of the award, as well as historical exercise behavior, and represents the period of time that options granted are expected to be outstanding. Expected volatility is based on a blend of historical volatility and implied volatility derived from publicly traded options to purchase the Company’s common stock, which the Company believes is more reflective of the market conditions and a better indicator of expected volatility than would be the case if the Company only used historical volatility. The risk-free interest rate is the implied yield currently available on U.S. Treasury zero-coupon issues with a remaining term equal to the expected life of the option.
Share-based compensation expense for 2012, 2011 and 2010 was $8.6 million, $4.5 million and $8.5 million, respectively and is included in selling, general and administrative expenses. The total income tax benefit recognized for share-based compensation arrangements for 2012, 2011 and 2010 was $2.7 million, $2.5 million and $2.2 million, respectively. The reduction in share-based compensation expense for 2011 is primarily the result of stock option and restricted share forfeitures of approximately $3 million related to the separation of the Company’s former chief executive officer.
As of December 31, 2012, unamortized share-based compensation cost related to non-vested stock options, net of expected forfeitures, was $3.7 million, which is expected to be recognized over a weighted-average period of 1.87 years. Unamortized share-based compensation cost related to non-vested shares (restricted stock), net of expected forfeitures, was $9.1 million, which is expected to be recognized over a weighted-average period of 1.78 years.
Share-based compensation expense recognized during a period is based on the value of the portion of stock-based awards that is ultimately expected to vest during the period less estimated forfeitures. Forfeitures are required to be estimated at the time of grant. To minimize fluctuations in share-based compensation expense, management reviews and revises the estimate of forfeitures for all share-based awards on a quarterly basis based on management’s expectation of the awards that will ultimately vest. The Company issued 178,690, 175,291 and 169,751 of non-vested shares (restricted stock) in 2012, 2011 and 2010, respectively, the majority of which vest on the third anniversary of the grant date (cliff vesting).
Income taxes: The provision for income taxes is determined using the asset and liability approach of accounting for income taxes. Under this approach, deferred tax assets and liabilities are recognized to reflect the future tax consequences attributable to the differences between the financial statement carrying amounts of existing assets and liabilities and their tax bases, and to reflect operating loss and tax credit carryforwards. The provision for income taxes represents income taxes paid or payable for the current year plus the change in deferred taxes during the year. Provision has been made for income taxes on unremitted earnings of subsidiaries and affiliates, except for subsidiaries in which earnings are deemed to be permanently re-invested.
Significant judgment is required in determining income tax provisions and in evaluating tax positions. The Company establishes additional provisions for income taxes when, despite the belief that tax positions are supportable, there remain certain positions that do not meet the minimum probability threshold, which is a tax position that is more likely than not to be sustained upon examination by the applicable taxing authority. In the normal course of business, the Company and its subsidiaries are examined by various Federal, State and foreign tax authorities. The Company regularly assesses the potential outcomes of these examinations and any future examinations for the current or prior years in determining the adequacy of its provision for income taxes. Interest accrued related to unrecognized tax benefits and income tax related penalties are both included in taxes on income from continuing operations. The Company periodically assesses the likelihood and amount of
F-13
Table of Contents
TELEFLEX INCORPORATED AND SUBSIDIARIES
NOTES TO CONSOLIDATED FINANCIAL STATEMENTS — (Continued)
potential adjustments and adjusts the income tax provision, the current tax liability and deferred taxes in the period in which the facts that give rise to an adjustment become known.
Pensions and other postretirement benefits: The Company provides a range of benefits to eligible employees and retired employees, including pensions and postretirement healthcare. The Company records annual amounts relating to these plans based on calculations which include various actuarial assumptions such as discount rates, expected rates of return on plan assets, compensation increases, turnover rates and healthcare cost trend rates. The Company reviews its actuarial assumptions on an annual basis and makes modifications to the assumptions based on current rates and trends when appropriate. The effect of the modifications is generally amortized over future periods.
Restructuring costs: Restructuring costs, which include termination benefits, facility closure costs, contract termination costs and other restructuring costs are recorded at estimated fair value. Key assumptions in calculating the restructuring costs include the terms and payments that may be negotiated to terminate certain contractual obligations and the timing of reductions in force.
Revenue recognition: The Company recognizes revenues from product sales, including sales to distributors, or services provided when the following revenue recognition criteria are met: persuasive evidence of an arrangement exists, delivery has occurred or services have been rendered, the selling price is fixed or determinable and collectability is reasonably assured. This generally occurs when products are shipped, when services are rendered or upon customers’ acceptance. Revenues are net of estimated returns and other allowances. The Company’s estimated returns and allowances are calculated based on historical experience and current trends.
The Company’s normal policy is to accept returns only in cases in which the product is defective and covered under the Company’s standard warranty provisions. However, in the limited cases where an arrangement provides a right of return to the customer, including a distributor, the Company believes it has the ability to reasonably estimate the amount of returns based on its substantial historical experience with respect to these arrangements. The Company accrues any costs or losses that may be expected in connection with any returns in accordance with ASC topic 450, “Contingencies.” Revenues and cost of goods sold are reduced to reflect estimated returns.
Allowances related to customer incentive programs, which include discounts or rebates, are estimated and provided for in the period that the related sales are recorded. These allowances are recorded as a reduction of revenue.
Reclassifications: Certain reclassifications have been made to the prior years’ consolidated financial statements to conform to current year presentation. Certain financial information is presented on a rounded basis, which may cause minor differences.
The Company adopted the following new accounting standards as of January 1, 2012, the first day of its 2012 fiscal year:
Amendment to Guidance on Fair Value Measurement: In May 2011, the FASB amended guidance relating to fair value measurement and disclosure so that the requirements under GAAP and International Financial Reporting Standards (“IFRS”) are the same. The guidance clarifies the FASB’s intent about the application of existing fair value measurements and requires enhanced disclosures, most significantly related to unobservable inputs used in a fair value measurement that is categorized within Level 3 of the fair value hierarchy. The amendment became effective prospectively for interim and annual periods beginning after December 15, 2011.
F-14
Table of Contents
TELEFLEX INCORPORATED AND SUBSIDIARIES
NOTES TO CONSOLIDATED FINANCIAL STATEMENTS — (Continued)
Amendment to Guidance on Comprehensive Income: In June 2011, the FASB amended guidance relating to the presentation of comprehensive income within an entity’s financial statements. Under the guidance, an entity has the option to present the total of comprehensive income, the components of net income, and the components of other comprehensive income in a single continuous statement or in two separate but consecutive statements. The amended guidance eliminates the previously available option of presenting the components of other comprehensive income as part of the statement of changes in equity. The amendment became effective for fiscal years beginning after December 15, 2011 and is applied retrospectively. The Company has elected to present the total of comprehensive income and the components of other comprehensive income in a separate statement immediately following the statement of income.
The Company adopted the following new accounting standard in the fourth quarter of 2012:
Amendment to Guidance on Intangibles-Goodwill and Other: In July 2012, the FASB issued updated guidance on the periodic testing of indefinite-lived intangible assets, other than goodwill, for impairment. This updated guidance permits companies to first assess qualitative factors to determine whether it is necessary to perform the quantitative impairment test required under applicable accounting standards. Under the amended guidance, a company is no longer required to perform the quantitative impairment tests unless the company determines, based on a qualitative assessment, that it is more likely than not that the fair value of the asset is less than its carrying amount. This guidance is effective for annual and interim impairment tests performed for fiscal years beginning after September 15, 2012, with early adoption permitted.
The Company made the following acquisitions during 2012, all of which were accounted for as business combinations:
| • |
On October 23, 2012, the Company acquired substantially all of the assets of LMA International N.V. (“LMA”), a global provider of laryngeal masks whose products are used in anesthesia and emergency care. The Company paid $292.2 million in cash as initial consideration for the business. On October 23, 2012, in a separate transaction, the Company also acquired the LMA branded laryngeal mask supraglottic airway business and certain other products in the United Kingdom, Ireland and Channel Islands from the shareholders of Intravent Direct Limited and affiliates for $19.9 million in cash. In February 2013, the Company received $1.5 million in cash from the sellers of the LMA business related to a working capital adjustment provided for under the terms of the purchase agreement. These acquisitions complement the anesthesia product portfolio in the Company’s Critical Care division. |
| • |
On June 22, 2012, the Company acquired Hotspur Technologies, a developer of catheter-based technologies designed to restore blood flow in patients with obstructed vessels. The acquisition of this business complements the dialysis access product line in the Company’s Cardiac Care division. The Company paid $15.0 million in cash as initial consideration for the business. |
| • |
On May 22, 2012, the Company acquired Semprus BioSciences, a biomedical company that developed a long-lasting, covalently bonded, non-leaching polymer designed to reduce infections and thrombus related complications. While the Company will explore opportunities |
F-15
Table of Contents
TELEFLEX INCORPORATED AND SUBSIDIARIES
NOTES TO CONSOLIDATED FINANCIAL STATEMENTS — (Continued)
|
to apply this technology to a broad array of its product offerings, the initial focus for the technology will be with respect to vascular devices within the Company’s Critical Care division. The Company paid $30.0 million in cash as initial consideration for the business. |
| • |
On May 3, 2012, the Company acquired substantially all of the assets of Axiom Technology Partners, LLC, constituting its EFx laparoscopic fascial closure system, which is designed for the closure of abdominal trocar defects through which access ports and instruments were used during laparoscopic surgeries. The acquisition of this business complements the surgical closure product line in the Company’s Surgical Care division. The Company paid $7.5 million in cash as initial consideration for the business. |
| • |
On April 5, 2012, the Company acquired the EZ-Blocker product line, a single-use catheter used to perform lung isolation and one-lung ventilation. The acquisition of this product line complements the Anesthesia product portfolio in the Company’s Critical Care division. The Company paid $3.3 million in cash as initial consideration for the business. |
In connection with the acquisitions, the Company agreed to pay contingent consideration based on the achievement of specified objectives, including regulatory approvals and sales targets. The range of undiscounted amounts the Company could be required to pay under these contingent consideration arrangements is between $2.0 million to $90.0 million.
The total fair value of consideration for the acquisitions is estimated at $422.2 million, which includes the initial payments of $367.9 million in cash and the estimated fair value of the contingent consideration to be paid to the sellers of $55.8 million, partially offset by a $1.5 million favorable working capital adjustment related to the LMA acquisition. The fair value of each component of contingent consideration was estimated based on the probability of achieving the specified objective using a probability-weighted discounted cash flow model. This fair value measurement is based on significant inputs not observed in the market and thus represents a Level 3 measurement as defined in connection with the fair value hierarchy (see Note 11, “Fair value measurements”). Any future change in the estimated fair value of the contingent consideration will be recognized in selling, general and administrative expenses in the statement of income for the period in which the estimated fair value changes. A change in fair value of the contingent consideration could have a material effect on the Company’s results of operations and financial position for the period in which the change in estimate occurs.
Transaction expenses associated with the acquisitions, which are included in selling, general and administrative expenses on the consolidated statements of income (loss) were $7.2 million for the year ended December 31, 2012. The Company has recorded an aggregate segment operating loss of approximately $8.1 million in connection with the businesses acquired in 2012. The loss is primarily related to operating losses associated with the late-stage technology acquisitions (approximately $12.7 million). The results of operations of the acquired businesses and assets are included in the consolidated statements of income (loss) from their respective acquisition date. Pro forma information is not presented as the operations of the acquired businesses are not significant compared to the overall operations of the Company.
F-16
Table of Contents
TELEFLEX INCORPORATED AND SUBSIDIARIES
NOTES TO CONSOLIDATED FINANCIAL STATEMENTS — (Continued)
The following table presents the purchase price allocation among the assets acquired and liabilities assumed in the acquisitions that occurred during the year ended December 31, 2012:
| (Dollars in millions) | ||||
|
Assets |
||||
|
Current assets |
$ | 62.8 | ||
|
Property, plant and equipment |
22.0 | |||
|
Intangible assets: |
||||
|
Intellectual property |
70.7 | |||
|
Tradenames |
65.3 | |||
|
In-process research and development (“IPR&D”) |
46.9 | |||
|
Customer lists |
44.6 | |||
|
Goodwill |
164.0 | |||
|
|
|
|||
|
Total assets acquired |
476.3 | |||
|
|
|
|||
|
Less: |
||||
|
Current liabilities |
21.4 | |||
|
Deferred tax liabilities |
24.3 | |||
|
Other long term liabilities |
8.4 | |||
|
|
|
|||
|
Liabilities assumed |
54.1 | |||
|
|
|
|||
|
Net assets acquired |
$ | 422.2 | ||
|
|
|
|||
In the third quarter of 2012, the Company refined the purchase price allocation, principally with respect to contingent consideration, due to changes in probabilities of achieving specified objectives and changes in discount rates. These changes also impacted the fair values of the acquired intangibles and deferred taxes. The Company is continuing to evaluate the initial purchase price allocation of all 2012 acquisitions. Further adjustments may be necessary as a result of the Company’s assessment of additional information related to the fair values of assets acquired and liabilities assumed.
Certain assets acquired in the acquisitions constitute intangible assets, apart from goodwill. The estimated fair values of intangible assets acquired include intellectual property of $70.7 million, tradenames of $65.3 million, in-process research and development (IPR&D) of $46.9 million and customer lists of $44.6 million. Intellectual property has useful lives ranging from 10 to 20 years, customer lists have a useful life of 15 years and finite tradenames have a useful life of 10 years. Tradenames of approximately $63.3 million have an indefinite useful life. IPR&D has an indefinite life and is not amortized until completion and development of the related project, at which time the IPR&D becomes an amortizable asset. If the related project is not completed in a timely manner, the Company may incur an impairment charge related to the IPR&D, calculated as the excess of the asset’s carrying value over its fair value. The goodwill resulting from the acquisitions primarily reflects the expected revenue growth attributable to anticipated increased market penetration from future products and customers. Goodwill and the step-up in basis of the intangible assets in connection with the acquisitions are not deductible for tax purposes.
F-17
Table of Contents
TELEFLEX INCORPORATED AND SUBSIDIARIES
NOTES TO CONSOLIDATED FINANCIAL STATEMENTS — (Continued)
The amounts recognized in restructuring and other impairment charges for 2012, 2011 and 2010 consisted of the following:
| 2012 | 2011 | 2010 | ||||||||||
| (Dollars in thousands) | ||||||||||||
|
LMA restructuring program |
$ | 2,515 | $ | — | $ | — | ||||||
|
2012 restructuring charges |
2,459 | — | — | |||||||||
|
2011 restructuring program |
— | 3,047 | — | |||||||||
|
2007 Arrow integration program |
(1,937 | ) | 461 | 2,875 | ||||||||
|
Aggregate impairment charges — investments and certain fixed assets |
— | 2,497 | — | |||||||||
|
|
|
|
|
|
|
|||||||
|
Restructuring and other impairment charges |
$ | 3,037 | $ | 6,005 | $ | 2,875 | ||||||
|
|
|
|
|
|
|
|||||||
LMA Restructuring Program
In connection with the acquisition of LMA, the Company has formulated a plan related to the future integration of LMA and the Company’s businesses. The integration plan focuses on the closure of LMA corporate functions and the consolidation of manufacturing, sales, marketing, and distribution functions in North America, Europe and Asia. The Company estimates that it will incur an aggregate of up to approximately $16 million in restructuring and other impairment charges over the term of this restructuring program. Of this amount, $5 million relates to employee termination costs, $10 million relates to termination of certain distributor agreements and $1 million relates to facility closures costs and other actions. The charges associated with this restructuring program that are included in restructuring and other impairment charges during 2012 were as follows:
| 2012 | ||||
| (Dollars in thousands) | ||||
|
Termination benefits |
$ | 2,229 | ||
|
Facility closure costs |
— | |||
|
Contract termination costs |
274 | |||
|
Other restructuring costs |
12 | |||
|
|
|
|||
| $ | 2,515 | |||
|
|
|
|||
A reconciliation of the changes in accrued liabilities associated with the LMA restructuring program from December 31, 2011 through December 31, 2012 is set forth in the following tables:
|
Termination
benefits |
Contract
Termination Costs |
Other
Restructuring Costs |
Total | |||||||||||||
| (Dollars in thousands) | ||||||||||||||||
|
Balance at December 31, 2011 |
$ | — | $ | — | $ | — | $ | — | ||||||||
|
Subsequent accruals |
2,229 | 274 | 12 | 2,515 | ||||||||||||
|
Cash payments |
(488 | ) | — | — | (488 | ) | ||||||||||
|
Foreign currency translation |
3 | 3 | — | 6 | ||||||||||||
|
|
|
|
|
|
|
|
|
|||||||||
|
Balance at December 31, 2012 |
$ | 1,744 | $ | 277 | $ | 12 | $ | 2,033 | ||||||||
|
|
|
|
|
|
|
|
|
|||||||||
2012 Restructuring Charges
The Company regularly evaluates opportunities to consolidate facilities, lower costs and optimize operating efficiencies. In 2012, the Company identified opportunities to improve its supply chain
F-18
Table of Contents
TELEFLEX INCORPORATED AND SUBSIDIARIES
NOTES TO CONSOLIDATED FINANCIAL STATEMENTS — (Continued)
strategy by consolidating its three North American warehouses into one centralized warehouse and lower costs and improve operating efficiencies through the termination of certain distributor agreements in Europe, the closure of certain North American facilities and workforce reductions. These projects will entail costs related to reductions in force, contract terminations related distributor agreements and leases, and facility closure and other costs. During 2012, the Company incurred restructuring charges of $2.4 million related to these projects. The Company expects to complete the projects over a one year period and anticipates incurring additional charges of $3.7 million related to these initiatives.
2011 Restructuring Program
In 2011, the Company initiated a restructuring program at three facilities to consolidate operations and reduce costs. In connection with this program, the Company recorded contract termination costs of approximately $2.6 million associated with a lease termination, as the Company has vacated 50% of the premises during 2011. In addition, the Company recorded approximately $0.4 million for employee termination benefits in connection with workforce consolidations. The Company expects to incur additional contract termination costs of approximately $2.7 million when it has completely exited a leased facility. The payment of the lease contract termination costs will continue until 2015.
2007 Arrow Integration Program
The charges associated with the 2007 Arrow integration program that were included in restructuring and other impairment charges for the years ended 2012, 2011, and 2010 were as follows:
| 2012 | 2011 | 2010 | ||||||||||
| (Dollars in thousands) | ||||||||||||
|
Termination benefits |
$ | 20 | $ | (16 | ) | $ | 1,015 | |||||
|
Facility closure costs |
230 | 166 | 812 | |||||||||
|
Contract termination costs |
(2,166 | ) | 311 | 1,503 | ||||||||
|
Gain on sale of assets |
— | — | (458 | ) | ||||||||
|
Other restructuring costs |
(21 | ) | — | 3 | ||||||||
|
|
|
|
|
|
|
|||||||
| $ | (1,937 | ) | $ | 461 | $ | 2,875 | ||||||
|
|
|
|
|
|
|
|||||||
A reconciliation of the changes in accrued liabilities associated with the 2007 Arrow integration program from December 31, 2010 through December 31, 2012 is set forth in the following tables:
|
Termination
benefits |
Facility
Closure Costs |
Contract
Termination Costs |
Other
Restructuring Costs |
Total | ||||||||||||||||
| (Dollars in thousands) | ||||||||||||||||||||
|
Balance at December 31, 2010 |
$ | 600 | $ | — | $ | 2,138 | $ | 22 | $ | 2,760 | ||||||||||
|
Subsequent accruals |
(16 | ) | 166 | 311 | — | 461 | ||||||||||||||
|
Cash payments |
(268 | ) | (166 | ) | (414 | ) | — | (848 | ) | |||||||||||
|
Foreign currency translation |
4 | — | 98 | (1 | ) | 101 | ||||||||||||||
|
|
|
|
|
|
|
|
|
|
|
|||||||||||
|
Balance at December 31, 2011 |
320 | — | 2,133 | 21 | 2,474 | |||||||||||||||
|
Subsequent accruals |
20 | 230 | (2,166 | ) | (21 | ) | (1,937 | ) | ||||||||||||
|
Cash payments |
(11 | ) | (230 | ) | — | — | (241 | ) | ||||||||||||
|
Foreign currency translation |
1 | — | 80 | — | 81 | |||||||||||||||
|
|
|
|
|
|
|
|
|
|
|
|||||||||||
|
Balance at December 31, 2012 |
$ | 330 | $ | — | $ | 47 | $ | — | $ | 377 | ||||||||||
|
|
|
|
|
|
|
|
|
|
|
|||||||||||
F-19
Table of Contents
TELEFLEX INCORPORATED AND SUBSIDIARIES
NOTES TO CONSOLIDATED FINANCIAL STATEMENTS — (Continued)
The reduction in the accrual for contract termination costs in 2012 relates to a revised estimate for the settlement of a dispute involving the termination of a European distributor agreement that was established in connection with the acquisition of Arrow in 2007.
As of December 31, 2012, the Company expects future restructuring expenses associated with the 2007 Arrow integration program, if any, to be nominal.
Impairment Charges
During 2011, the Company recognized impairment charges of $2.5 million related to the decline in value of its investments in affiliates that are considered to be other than temporary. In making this determination, the Company considered multiple factors, including its intent and ability to hold investments, operating losses of investees that demonstrate an inability to recover the carrying value of the investments, the investee’s liquidity and cash position and market acceptance of the investee’s products and services.
In the first quarter of 2012, the Company changed its North America reporting unit structure from a single reporting unit to five reporting units comprised of Vascular, Anesthesia/Respiratory, Cardiac, Surgical and Specialty. The Company allocated the assets and liabilities of the North America Segment among the new reporting units based on their respective operating activities, and then allocated goodwill among the reporting units using a relative fair value approach, as required by ASC Topic 350. The fair value of each reporting unit was determined based on a weighted combination of (i) estimation of the discounted cash flows of each of the reporting units based on projected earnings in the future (the income approach) and (ii) analysis of sales of similar assets in actual transactions (the market approach).
Following the fair value allocation, the Company performed goodwill impairment tests on these new reporting units. As a result of these tests, the Company determined that three of the reporting units in the North America Segment were impaired, and it recorded goodwill impairment charges of $220 million in the Vascular reporting unit, $107 million in the Anesthesia/Respiratory reporting unit and $5 million in the Cardiac reporting unit in the first quarter of 2012.
Inventories at year end consisted of the following:
| 2012 | 2011 | |||||||
| (Dollars in thousands) | ||||||||
|
Raw materials |
$ | 84,636 | $ | 87,621 | ||||
|
Work-in-process |
47,440 | 45,486 | ||||||
|
Finished goods |
222,974 | 198,587 | ||||||
|
|
|
|
|
|||||
| 355,050 | 331,694 | |||||||
|
Less: Inventory reserves |
(31,703 | ) | (32,919 | ) | ||||
|
|
|
|
|
|||||
|
Inventories, net |
$ | 323,347 | $ | 298,775 | ||||
|
|
|
|
|
|||||
F-20
Table of Contents
TELEFLEX INCORPORATED AND SUBSIDIARIES
NOTES TO CONSOLIDATED FINANCIAL STATEMENTS — (Continued)
The major classes of property, plant and equipment, at cost, at year end are as follows:
| 2012 | 2011 | |||||||
| (Dollars in thousands) | ||||||||
|
Land, buildings and leasehold improvements |
$ | 201,155 | $ | 189,817 | ||||
|
Machinery and equipment |
313,325 | 285,771 | ||||||
|
Computer equipment and software |
70,618 | 64,076 | ||||||
|
Construction in progress |
41,424 | 26,390 | ||||||
|
|
|
|
|
|||||
| 626,522 | 566,054 | |||||||
|
Less: Accumulated depreciation |
(328,577 | ) | (314,142 | ) | ||||
|
|
|
|
|
|||||
|
Property, plant and equipment, net |
$ | 297,945 | $ | 251,912 | ||||
|
|
|
|
|
|||||
In the first quarter of 2012, the Company changed its reporting structure to four reportable segments, three of which are geographically-based and one of which is comprised of the Company’s original equipment manufacturer (OEM) business. In the third quarter of 2012, due to changes in the Company’s management and internal reporting structure, the Company’s Latin America operations were moved from the AJLA Segment into the North America Segment. As a result of this change, the North America Segment is now referred to as the Americas Segment and the AJLA Segment is now referred to as the Asia Segment. All prior comparative periods have been restated to reflect this change. See Note 17, “Business segment information” for additional information on the Company’s new reporting structure, and Note 5, “Impairment of Goodwill” for additional information on goodwill impairment charges in 2012.
Changes in the carrying amount of goodwill, by reporting segment, for 2012 and 2011 are as follows:
|
Americas
Segment |
EMEA
Segment |
Asia
Segment |
OEM
Segment |
Total | ||||||||||||||||
| (Dollars in thousands) | ||||||||||||||||||||
|
Balance as of December 31, 2011 |
||||||||||||||||||||
|
Goodwill |
$ | 1,005,021 | $ | 283,362 | $ | 121,983 | $ | 28,176 | $ | 1,438,542 | ||||||||||
|
Accumulated impairment losses |
— | — | — | — | — | |||||||||||||||
|
|
|
|
|
|
|
|
|
|
|
|||||||||||
| 1,005,021 | 283,362 | 121,983 | 28,176 | 1,438,542 | ||||||||||||||||
|
Goodwill impairment charges |
(332,128 | ) | — | — | — | (332,128 | ) | |||||||||||||
|
Goodwill related to acquisitions |
78,875 | 69,723 | 15,384 | — | 163,982 | |||||||||||||||
|
Goodwill related to dispositions |
— | — | — | (28,176 | ) | (28,176 | ) | |||||||||||||
|
Translation adjustment |
2,132 | 876 | 4,228 | — | 7,236 | |||||||||||||||
|
Transfer of goodwill |
679 | (679 | ) | — | — | — | ||||||||||||||
|
|
|
|
|
|
|
|
|
|
|
|||||||||||
|
Balance as of December 31, 2012 |
||||||||||||||||||||
|
Goodwill |
1,086,707 | 353,282 | 141,595 | — | 1,581,584 | |||||||||||||||
|
Accumulated impairment losses |
(332,128 | ) | — | — | — | (332,128 | ) | |||||||||||||
|
|
|
|
|
|
|
|
|
|
|
|||||||||||
| $ | 754,579 | $ | 353,282 | $ | 141,595 | $ | — | $ | 1,249,456 | |||||||||||
|
|
|
|
|
|
|
|
|
|
|
|||||||||||
F-21
Table of Contents
TELEFLEX INCORPORATED AND SUBSIDIARIES
NOTES TO CONSOLIDATED FINANCIAL STATEMENTS — (Continued)
|
Americas
Segment |
EMEA
Segment |
Asia
Segment |
OEM
Segment |
Former
Commercial Segment |
Total | |||||||||||||||||||
| (Dollars in thousands) | ||||||||||||||||||||||||
|
Balance as of December 31, 2010 |
||||||||||||||||||||||||
|
Goodwill |
$ | 996,899 | $ | 294,213 | $ | 115,633 | $ | 28,176 | $ | 7,490 | $ | 1,442,411 | ||||||||||||
|
Accumulated impairment losses |
— | — | — | — | — | — | ||||||||||||||||||
|
|
|
|
|
|
|
|
|
|
|
|
|
|||||||||||||
| 996,899 | 294,213 | 115,633 | 28,176 | 7,490 | 1,442,411 | |||||||||||||||||||
|
Goodwill related to acquisitions |
12,973 | — | — | — | — | 12,973 | ||||||||||||||||||
|
Goodwill related to dispositions |
— | — | — | — | (7,490 | ) | (7,490 | ) | ||||||||||||||||
|
Reversal of Arrow integration accrual, net of tax |
— | (81 | ) | — | — | — | (81 | ) | ||||||||||||||||
|
Translation adjustment |
(4,851 | ) | (10,770 | ) | 6,350 | — | — | (9,271 | ) | |||||||||||||||
|
|
|
|
|
|
|
|
|
|
|
|
|
|||||||||||||
|
Balance as of December 31, 2011 |
||||||||||||||||||||||||
|
Goodwill |
1,005,021 | 283,362 | 121,983 | 28,176 | — | 1,438,542 | ||||||||||||||||||
|
Accumulated impairment losses |
— | — | — | — | — | — | ||||||||||||||||||
|
|
|
|
|
|
|
|
|
|
|
|
|
|||||||||||||
| $ | 1,005,021 | $ | 283,362 | $ | 121,983 | $ | 28,176 | $ | — | $ | 1,438,542 | |||||||||||||
|
|
|
|
|
|
|
|
|
|
|
|
|
|||||||||||||
Intangible assets at year end consisted of the following:
| Gross Carrying Amount |
Accumulated
Amortization |
|||||||||||||||
| 2012 | 2011 | 2012 | 2011 | |||||||||||||
| (Dollars in thousands) | ||||||||||||||||
|
Customer lists |
$ | 580,151 | $ | 537,094 | $ | (141,520 | ) | $ | (117,505 | ) | ||||||
|
In-process research and development |
53,157 | — | — | — | ||||||||||||
|
Intellectual property |
276,458 | 221,171 | (95,967 | ) | (85,402 | ) | ||||||||||
|
Distribution rights |
16,567 | 16,669 | (13,880 | ) | (13,484 | ) | ||||||||||
|
Trade names |
384,131 | 322,404 | (305 | ) | (1,160 | ) | ||||||||||
|
|
|
|
|
|
|
|
|
|||||||||
| $ | 1,310,464 | $ | 1,097,338 | $ | (251,672 | ) | $ | (217,551 | ) | |||||||
|
|
|
|
|
|
|
|
|
|||||||||
The increase in intangible assets during 2012 primarily reflects the effect of the Company’s acquisitions. See Note 3 for discussion of Company’s acquisitions.
Amortization expense related to intangible assets was $44.3 million, $42.6 million, and $40.8 million for 2012, 2011 and 2010, respectively. Estimated annual amortization expense for each of the five succeeding years is as follows:
| (Dollars in thousands) | ||||
|
2013 |
$ | 49,300 | ||
|
2014 |
45,800 | |||
|
2015 |
40,200 | |||
|
2016 |
39,900 | |||
|
2017 |
39,500 | |||
Acquired in-process research and development is indefinite-lived until the completion of the associated efforts, at which point the technology will start to be amortized.
F-22
Table of Contents
TELEFLEX INCORPORATED AND SUBSIDIARIES
NOTES TO CONSOLIDATED FINANCIAL STATEMENTS — (Continued)
The components of long-term debt at year end are as follows:
| 2012 | 2011 | |||||||
| (Dollars in thousands) | ||||||||
|
Senior Credit Facility: |
||||||||
|
Term loan facility, at a rate of 2.75% at December 31, 2012, due 10/1/2014 |
$ | 375,000 | $ | 375,000 | ||||
|
3.875% Convertible Senior Subordinated Notes due 2017 |
400,000 | 400,000 | ||||||
|
6.875% Senior Subordinated Notes due 2019 |
250,000 | 250,000 | ||||||
|
|
|
|
|
|||||
| 1,025,000 | 1,025,000 | |||||||
|
Less: Unamortized debt discount on 3.875% Convertible Senior Subordinated Notes due 2017 |
(59,720 | ) | (70,191 | ) | ||||
|
|
|
|
|
|||||
| $ | 965,280 | $ | 954,809 | |||||
|
|
|
|
|
|||||
Senior Credit Facility
The Company’s senior credit facility is comprised of a term loan facility due October 2014 and a revolving credit facility. As of December 31, 2012, there were no borrowings under the revolving credit facility and $375.0 million outstanding under the term loan facility. The following is a discussion of amendments to the credit facility and a discussion of the revolving credit facility borrowings.
Amendments to Credit Facility
In March 2011, the Company entered into an agreement (the “Incremental Agreement”), which supplemented the Credit Agreement, dated as of October 1, 2007 (the “Credit Agreement”) among the Company, the guarantors party thereto, the lending institutions identified in the Credit Agreement, Bank of America, N.A., as syndication agent, and JPMorgan Chase Bank, N.A., as administrative agent and collateral agent. The Incremental Agreement provided for additional term loan borrowings under the Credit Agreement in an aggregate principal amount of $100 million (the “Incremental Term Loans”). The proceeds of the Incremental Term Loans were used to repay $80 million of borrowings under the Company’s revolving credit facility that were borrowed to fund the VasoNova acquisition and the retirement of the 2004 Notes.
In addition, in March 2011, $36.1 million of term loans maturing on October 1, 2012 were converted to term loans with a new maturity date of October 1, 2014. Furthermore, all of the Company’s $33.7 million of revolving credit facility commitments with a termination date of October 1, 2012 were converted to revolving credit facility commitments with a new termination date of October 1, 2014. In connection with the extension of these maturity dates, the range of the applicable interest rate margins, and the commitment fee rate on unused but committed portions of the revolving credit facility were increased. As described below under “Revolving Credit Facility Borrowings,” the Company incurred transaction fees of approximately $0.3 million in connection with the maturity date extensions, which will be amortized over the extended term of the facility as interest expense.
As a result of the Incremental Term Loans, the amendment to the Credit Agreement and repayment of $125 million in term borrowings using the proceeds of the offering of its 6.875% Senior Subordinated Notes, the Company had $375 million of term loans outstanding on December 31, 2012. All of the term loans will mature on October 1, 2014.
The term loans bear interest at an applicable rate elected by the Company equal to either the “base rate” (the greater of either the federal funds effective rate plus 0.5%, the prime rate or one month
F-23
Table of Contents
TELEFLEX INCORPORATED AND SUBSIDIARIES
NOTES TO CONSOLIDATED FINANCIAL STATEMENTS — (Continued)
LIBOR plus 1.0%) plus an applicable margin of 0.50% to 1.75%, or a “LIBOR rate” for the period corresponding to the applicable interest period of the borrowings plus an applicable margin of 1.50% to 2.75%. The actual amount of the applicable margin will be based on the ratio of Consolidated Total Indebtedness to Consolidated EBITDA (each as defined in the Credit Agreement). At December 31, 2012, all outstanding term loans were subject to the “LIBOR rate” of 0.25% plus an applicable margin of 2.5%, resulting in an interest rate of 2.75%.
Revolving Credit Facility Borrowings
In 2011, the Company borrowed $165 million under its $400 million revolving credit facility to fund the VasoNova acquisition and the retirement of the 2004 Notes. The borrowings were subsequently repaid with the proceeds from the sale of the marine business (for additional information regarding the sale of the marine business, see Note 19, “Divestiture related activities”) and borrowings under the Incremental Term Loans. As of December 31, 2012, the Company had no outstanding borrowings and approximately $2.4 million in outstanding standby letters of credit issued under its revolving credit facility. The Company has approximately $397.6 million available in committed financing under the revolving credit facility.
In connection with the extension of term loan maturities that occurred in March 2011, the commitment fee rate on unused but committed portions of the revolving credit facility increased to a range of 0.375% to 0.50%. The actual amount of the commitment fee rate is based on the ratio of Consolidated Total Indebtedness to Consolidated EBITDA (each as defined in the Credit Agreement). At December 31, 2012, the commitment fee rate was 0.50%.
Convertible Notes
On August 9, 2010, the Company issued $400.0 million of 3.875% Convertible Senior Subordinated Notes due 2017 (the “Convertible Notes”). The Company pays interest on the Convertible Notes semi-annually on February 1 and August 1 of each year at a rate of 3.875% per year. The Convertible Notes mature on August 1, 2017. The Convertible Notes are the Company’s unsecured senior subordinated obligations and are (i) not guaranteed by any of the Company’s subsidiaries; (ii) subordinated in right of payment to all of the Company’s existing and future senior indebtedness; and (iii) junior to the Company’s existing and future secured indebtedness to the extent of the value of the assets securing such indebtedness.
The Convertible Notes will be convertible at the option of the holder only under the following circumstances (i) during any fiscal quarter, if the last reported sales price of the Company’s common stock for at least 20 trading days during a period of 30 consecutive trading days ending on the last trading day of the immediately preceding fiscal quarter exceeds 130% of the conversion price on each applicable trading day; or (ii) during the five business day period after any five consecutive trading day period (the “measurement period”) in which the trading price per $1,000 principal amount of Convertible Notes is less than 98% of the product of the last reported sale price of the common stock and the applicable conversion rate on each trading day during the measurement period; or (iii) upon the occurrence of specified corporate events; or (iv) at any time on or after May 1, 2017 up to and including July 28, 2017. The Convertible Notes are convertible at a conversion rate of 16.3084 shares of common stock per $1,000 principal amount of Convertible Notes, which is equivalent to a conversion price of approximately $61.32. The conversion rate is subject to adjustment upon certain events. Upon conversion, the Company’s conversion obligation may be satisfied, at the Company’s option, in shares of common stock, cash or a combination of cash and shares of common stock. The Company has elected a net-settlement method to satisfy its conversion obligation. Under the net-settlement method,
F-24
Table of Contents
TELEFLEX INCORPORATED AND SUBSIDIARIES
NOTES TO CONSOLIDATED FINANCIAL STATEMENTS — (Continued)
the Company may settle the $1,000 principal amount of the Convertible Notes in cash and settle the excess conversion value in shares, plus cash in lieu of fractional shares.
In connection with the issuance of the Convertible Notes, the Company entered into convertible note hedge transactions with two counterparties pursuant to which it purchased call options for $88.0 million ($56.0 million net of tax) in private transactions. The call options allow the Company to receive, in effect for no additional consideration, shares of the Company’s common stock and/or cash from counterparties equal to the amounts of common stock and/or cash related to the excess value over the conversion price that it would pay to the holders of the Convertible Notes upon conversion. These call options will terminate upon the earlier of July 28, 2017 or the first day all of the related Convertible Notes are no longer outstanding due to conversion or otherwise.
The Company also entered into privately negotiated warrant transactions with the same counterparties generally relating to the same number of shares of common stock with each of the option counterparties. Under certain circumstances, the Company may be required under the terms of the warrant transactions to issue up to 19.99% of the shares of common stock outstanding on August 3, 2010, which equals 7,981,422 shares of common stock (subject to adjustments). The warrants have been divided into components that expire ratably over a 180 day period commencing November 1, 2017. The strike price of the warrants is approximately $74.65 per share of common stock, subject to customary anti-dilution adjustments. Proceeds received from the issuance of the warrants totaled approximately $59.4 million.
The convertible note hedge and warrant transactions described above are intended to reduce the potential dilution with respect to the Company’s common stock and/or reduce the Company’s exposure to potential cash payments that the Company may be required to make upon conversion of the Convertible Notes by, in effect, increasing the conversion price, from the Company’s economic standpoint, to $74.65 per share. However, the warrant transactions could have a dilutive effect with respect to the common stock or, if the Company so elects, obligate the Company to make cash payments to the extent that the market price per share of common stock exceeds $74.65 per share on any expiration date of the warrants.
The Company allocated the proceeds of the Convertible Notes between the liability and equity components of the debt. The initial $316.3 million liability component was determined based on the fair value of a similar debt instrument excluding the conversion feature. The initial $83.7 million ($53.3 million net of tax) equity component represented the difference between the fair value or carrying value of $316.3 million of the debt and the $400.0 million of proceeds. The related debt discount of $83.7 million will be amortized under the interest method over the remaining life of the Convertible Notes, which, at December 31, 2012, is approximately 4.6 years. An effective interest rate of 7.814% was used to calculate the debt discount on the Convertible Notes. The following table provides interest expense amounts related to the Convertible Notes for the periods presented:
| (in millions) |
Year Ended
December 31, 2012 |
Year Ended
December 31, 2011 |
Year Ended
December 31, 2010 |
|||||||||
|
Interest cost related to contractual interest coupon |
$ | 15.5 | $ | 15.5 | $ | 6.2 | ||||||
|
Interest cost related to amortization of the discount |
$ | 10.5 | $ | 9.7 | $ | 3.8 | ||||||
F-25
Table of Contents
TELEFLEX INCORPORATED AND SUBSIDIARIES
NOTES TO CONSOLIDATED FINANCIAL STATEMENTS — (Continued)
The following table provides the carrying value of the Convertible Notes as of December 31, 2012 and December 31, 2011:
| (in millions) |
December 31,
2012 |
December 31,
2011 |
||||||
|
Principal amount of the Convertible Notes |
$ | 400.0 | $ | 400.0 | ||||
|
Unamortized discount |
(59.7 | ) | (70.2 | ) | ||||
|
|
|
|
|
|||||
|
Net carrying amount |
$ | 340.3 | $ | 329.8 | ||||
|
|
|
|
|
|||||
6.875% Senior Subordinated Notes
On June 13, 2011, the Company issued $250.0 million of 6.875% Senior Subordinated Notes due 2019 (the “Notes”). The Company pays interest on the Notes semi-annually on June 1 and December 1. The Notes will mature on June 1, 2019, unless earlier redeemed or purchased by the Company at the holder’s option under specified circumstances following a Change of Control or Asset Sale (each as defined in the Indenture) or upon the Company’s election to exercise its optional redemption rights, as described below. The Company incurred transaction fees of approximately $3.7 million, including underwriters’ discounts and commissions in connection with the public offering of the Notes. The Company used $125 million of the proceeds to repay term loan borrowings under its senior credit facility and recorded a $0.8 million write-off of unamortized debt issuance costs as a loss on extinguishment of debt in the second quarter of 2011.
The Notes constitute the Company’s general unsecured senior subordinated obligations and are subordinated in right of payment to all of the Company’s existing and future senior indebtedness, including the Company’s indebtedness under its senior credit facilities, and will be equal in right of payment with all of the Company’s existing and future senior subordinated indebtedness, including the Company’s 3.875% Convertible Senior Subordinated Notes due 2017. The obligations under the Notes are guaranteed, jointly and severally, by each of the Company’s existing and future domestic subsidiaries that is a guarantor or other obligor under the Company’s senior credit facilities and by certain of the Company’s other domestic subsidiaries. The guarantees are full and unconditional, subject to certain customary automatic release provisions. The guarantees of the Notes will be subordinated in right of payment to all of the existing and future senior indebtedness of such Guarantors and will be equal in right of payment with all of the future senior subordinated indebtedness of such Guarantors. The Notes and the guarantees will be junior to the existing and future secured indebtedness of the Company and the Guarantors to the extent of the value of the assets securing such indebtedness and will be structurally subordinated to all of the existing and future indebtedness and other liabilities of the Company’s non-guarantor subsidiaries.
At any time on or after June 1, 2015, the Company may redeem some or all of the Notes at a redemption price of 103.438% of the principal amount of the Notes subject to redemption, declining to 100% of the principal amount on June 1, 2017, plus accrued and unpaid interest. In addition, at any time prior to June 1, 2015, the Company may, on one or more occasions, redeem some or all of the Notes at a redemption price equal to 100% of the principal amount of the Notes redeemed plus a “make-whole” premium and any accrued and unpaid interest. The “make-whole” premium is the greater of (i) 1.0% of the principal amount of the Notes subject to redemption or (ii) the excess, if any, over the principal amount of the notes of the present value, on the redemption date, of the sum of (a) the June 1, 2015 optional redemption price, plus (b) all required interest payments on the Notes through June 1, 2015 (other than accrued and unpaid interest to the redemption date), calculated based on a specified Treasury rate for the period most closely corresponding to the period from the redemption
F-26
Table of Contents
TELEFLEX INCORPORATED AND SUBSIDIARIES
NOTES TO CONSOLIDATED FINANCIAL STATEMENTS — (Continued)
date to June 1, 2015, plus 50 basis points. In addition, at any time prior to June 1, 2014, the Company may redeem up to 35% of the aggregate principal amount of the Notes, using the proceeds of certain specified Company equity offerings, at a redemption price equal to 106.875% of the principal amount of the Notes redeemed, plus accrued and unpaid interest.
Interest Rate Swap
In 2011, the Company terminated its interest rate swap agreement that, at the date of termination, had a notional amount of $350 million. The interest rate swap was designated as a cash flow hedge against the term loan under the Company’s senior credit facility. At the date of termination, the interest rate swap was in a liability position resulting in a cash payment by the Company to the counterparties of approximately $14.8 million, which included $3.1 million of accrued interest. The cash flows from the termination of the interest rate swap has been reported as an operating activity in the consolidated statements of cash flows. As of December 31, 2012, all unrealized losses within accumulated other comprehensive income (“AOCI”) associated with this interest rate swap have been reclassified into earnings.
Prepayment of Senior Notes Issued in 2004
During 2011, the Company prepaid the entire outstanding $165.8 million principal amount of its Senior Notes issued in 2004 (“2004 Notes”). In addition, the Company paid the holders of the 2004 Notes a $13.9 million prepayment make-whole amount and accrued and unpaid interest. The Company recorded the prepayment make-whole amount and a $0.7 million write-off of unamortized debt issuance costs incurred prior to the prepayment of the 2004 Notes as a loss on extinguishment of debt during 2011. The Company used $150 million in borrowings under its revolving credit facility and available cash to fund the prepayment of the 2004 Notes.
Fair Value of Long-Term Debt
The carrying amount of long-term debt reported in the consolidated balance sheet as of December 31, 2012 is $965.3 million. The Company uses a discounted cash flow technique that incorporates a market interest yield curve with adjustments for duration, optionality, and risk profile to determine the fair value of its debt. The Company’s implied credit rating is a factor in determining the market interest yield curve. The following table provides the fair value of the Company’s debt by fair value hierarchy level (see Note 11, “Fair value measurement,” for further information) as of December 31, 2012:
| Fair value of debt | ||||
|
(Dollars in
thousands) |
||||
|
Level 1 |
$ | 782,377 | ||
|
Level 2 |
382,634 | |||
|
|
|
|||
|
Total |
$ | 1,165,011 | ||
|
|
|
|||
Securitization Program
The Company has an accounts receivable securitization facility under which accounts receivable of certain domestic subsidiaries are sold on a non-recourse basis to a special purpose entity (“SPE”), which is a bankruptcy-remote, consolidated subsidiary of Teleflex. Accordingly, the assets of the SPE are not available to satisfy the obligations of Teleflex or any of its subsidiaries. The SPE then sells undivided interests in those receivables to an asset backed commercial paper conduit for consideration
F-27
Table of Contents
TELEFLEX INCORPORATED AND SUBSIDIARIES
NOTES TO CONSOLIDATED FINANCIAL STATEMENTS — (Continued)
of up to $50.0 million. As of December 31, 2012, the maximum amount available for borrowing under this facility was $44.0 million. This facility is utilized from time to time for increased flexibility in funding short term working capital requirements. The agreement governing the accounts receivable securitization facility contains certain covenants and termination events. An occurrence of an event of default or a termination event under this facility may give rise to the right of its counterparty to terminate this facility. As of December 31, 2012 and 2011, the Company had $4.7 million of outstanding borrowings under its accounts receivable securitization facility.
Debt Maturities
As of December 31, 2012, the aggregate amounts of long-term debt, demand loans and debt under the Company’s securitization program that will mature during each of the next four fiscal years and thereafter were as follows:
| (Dollars in thousands) | ||||
|
2013 |
$ | 4,700 | ||
|
2014 |
375,000 | |||
|
2015 |
— | |||
|
2016 |
— | |||
|
2017 and thereafter |
650,000 | |||
The 3.875% Convertible Notes are convertible under certain circumstances, including the attainment of 130% of the conversion price (approximately $79.72) of the Company’s closing stock price during a certain number of days at the end of a fiscal quarter. The Company’s closing stock price has recently approached this amount, which increases the possibility that the Convertible Notes could become convertible in the near future, at which point the Convertible Notes would be classified as a current liability.
The Company uses derivative instruments for risk management purposes. Forward rate contracts are used to manage foreign currency transaction exposure. These derivative instruments are designated as cash flow hedges and are recorded on the balance sheet at fair market value. The effective portion of the gains or losses on derivatives are reported as a component of other comprehensive income and reclassified into earnings in the same period or periods during which the hedged transaction affects earnings. Gains and losses on the derivative representing either hedge ineffectiveness or hedge components excluded from the assessment of effectiveness are recognized in current earnings. Approximately $0.4 million of loss of the amount in accumulated other comprehensive income at December 31, 2012 would be reclassified as expense to the consolidated statement of income (loss) during 2013 should foreign currency exchange rates remain at December 31, 2012 levels. See Note 11, “Fair Value Measurement” for additional information.
F-28
Table of Contents
TELEFLEX INCORPORATED AND SUBSIDIARIES
NOTES TO CONSOLIDATED FINANCIAL STATEMENTS — (Continued)
The location and fair values of derivative instruments designated as hedging instruments in the consolidated balance sheet are as follows:
|
December 31, 2012
Fair Value |
December 31, 2011
Fair Value |
|||||||
| (Dollars in thousands) | ||||||||
|
Asset derivatives: |
||||||||
|
Foreign exchange contracts: |
||||||||
|
Other assets — current |
$ | 1,279 | $ | 204 | ||||
|
|
|
|
|
|||||
|
Total asset derivatives |
$ | 1,279 | $ | 204 | ||||
|
|
|
|
|
|||||
|
Liability derivatives: |
||||||||
|
Foreign exchange contracts: |
||||||||
|
Derivative liabilities — current |
$ | 598 | $ | 633 | ||||
|
|
|
|
|
|||||
|
Total liability derivatives |
$ | 598 | $ | 633 | ||||
|
|
|
|
|
|||||
The location and amount of the gains and losses for derivatives in cash flow hedging relationships that were reported in other comprehensive income (“OCI”), and the location on the consolidated statements of income (loss) of amounts of AOCI reclassified from AOCI into income for the years ended December 31, 2012, 2011 and 2010 are as follows:
|
After Tax Gain/(Loss)
Recognized in OCI |
||||||||||||
| 2012 | 2011 | 2010 | ||||||||||
| (Dollars in thousands) | ||||||||||||
|
Interest rate swap |
$ | 7,032 | $ | 8,330 | $ | 2,248 | ||||||
|
Foreign exchange contracts |
(156 | ) | (325 | ) | (167 | ) | ||||||
|
|
|
|
|
|
|
|||||||
|
Total |
$ | 6,876 | $ | 8,005 | $ | 2,081 | ||||||
|
|
|
|
|
|
|
|||||||
|
Pre-Tax (Gain)/Loss Reclassified
from AOCI into Income |
||||||||||||
| 2012 | 2011 | 2010 | ||||||||||
| (Dollars in thousands) | ||||||||||||
|
Interest rate swap: |
||||||||||||
|
Interest expense |
$ | 11,057 | $ | 15,769 | $ | 17,331 | ||||||
|
Foreign exchange contracts: |
||||||||||||
|
Net revenues |
34 | — | (266 | ) | ||||||||
|
Cost of goods sold |
(898 | ) | (22 | ) | (3,516 | ) | ||||||
|
Income from discontinued operations |
— | (536 | ) | (169 | ) | |||||||
|
|
|
|
|
|
|
|||||||
|
Total |
$ | 10,193 | $ | 15,211 | $ | 13,380 | ||||||
|
|
|
|
|
|
|
|||||||
For the years ended December 31, 2012, December 31, 2011 and December 31, 2010, there was no ineffectiveness related to the Company’s derivatives.
During 2012, the Company entered into forward exchange contracts for Singapore dollars and US dollars in anticipation of the acquisition of substantially all of the assets of LMA. In accordance with applicable accounting guidance, a forecasted transaction is not eligible for hedge accounting if the forecasted transaction involves a business combination. Therefore, gains and losses relating to this arrangement were recognized as incurred. The Company realized a pre-tax loss of $7.6 million upon settlement of the forward exchange contracts. See Note 3, “Acquisitions” for additional information on the LMA acquisition.
F-29
Table of Contents
TELEFLEX INCORPORATED AND SUBSIDIARIES
NOTES TO CONSOLIDATED FINANCIAL STATEMENTS — (Continued)
In 2011, the Company terminated its interest rate swap covering a notional amount of $350 million designated as a hedge against the variability of the cash flows in the interest payments under the Company’s term loan. As of December 31, 2012, all unrealized losses within AOCI associated with this interest rate swap has been reclassified into earnings. See Note 9, “Borrowings” for additional information on the termination of the interest rate swap.
After-tax loss (gain) reclassified from AOCI into income with respect to the Company’s terminated interest rate swap and forward rate contracts hedge results contributed approximately $7.0 million and $(0.7) million, respectively, to the increase (decrease) in other comprehensive income for 2012 and approximately $10.0 million and $(0.4) million, respectively, to the increase (decrease) in other comprehensive income for 2011.
Concentration of Credit Risk
Concentrations of credit risk with respect to trade accounts receivable are generally limited due to the Company’s large number of customers and their diversity across many geographic areas. A portion of the Company’s trade accounts receivable outside the United States, however, include sales to government-owned or supported healthcare systems in several countries which are subject to payment delays. Payment is dependent upon the financial stability and creditworthiness of those countries’ economies.
In the ordinary course of business, the Company grants non-interest bearing trade credit to its customers on normal credit terms. In an effort to reduce its credit risk, the Company (i) establishes credit limits for all of its customer relationships, (ii) performs ongoing credit evaluations of its customers’ financial condition, (iii) monitors the payment history and aging of its customers’ receivables, and (iv) monitors open orders against an individual customer’s outstanding receivable balance.
An allowance for doubtful accounts is maintained for accounts receivable based on the Company’s historical collection experience and expected collectability of the accounts receivable, considering the period an account is outstanding, the financial position of the customer and information provided by credit rating services. The adequacy of this allowance is reviewed each reporting period and adjusted as necessary.
In light of the disruptions in global economic markets, the Company instituted enhanced measures to facilitate customer-by-customer risk assessment when estimating the allowance for doubtful accounts. Such measures included, among others, monthly credit control committee meetings, at which customer credit risks are identified after review of, among other things, accounts that exceed specified credit limits, payment delinquencies and other customer problems. In addition, for some of the Company’s non-government customers, the Company instituted measures designed to reduce its risk exposures, including issuing dunning letters, reducing credit limits, requiring that payments accompany orders and instituting legal action with respect to delinquent accounts. With respect to government customers, the Company evaluates receivables for potential collection risks associated with the availability of government funding and reimbursement practices.
Some of the Company’s customers, particularly in Europe, have extended or delayed payments for products and services already provided. Collectability concerns regarding the Company’s accounts receivable from these customers, for the most part in Greece, Italy, Spain and Portugal resulted in an increase in the allowance for doubtful accounts related to these countries. If the financial condition of these customers or the healthcare systems in these countries continue to deteriorate such that the ability of an increasing number of customers to make payments is uncertain, additional allowances
F-30
Table of Contents
TELEFLEX INCORPORATED AND SUBSIDIARIES
NOTES TO CONSOLIDATED FINANCIAL STATEMENTS — (Continued)
may be required in future periods. The Company’s aggregate accounts receivable, net of the allowance for doubtful accounts, in Spain, Italy, Greece and Portugal as a percent of the Company’s total accounts receivable at the end of the period are as follows:
| December 31, 2012 | December 31, 2011 | |||||||
| (Dollars in thousands) | ||||||||
|
Accounts receivable (net of allowances of $6.3 million and $4.9 million in 2012 and 2011, respectively) in Spain, Italy, Greece and Portugal |
$ | 101,009 | $ | 108,545 | ||||
|
Percentage of total accounts receivable, net |
34 | % | 38 | % | ||||
For the years ended December 31, 2012, December 31, 2011 and December 31, 2010, net revenues to customers in Spain, Italy, Greece and Portugal were $132.5 million, $138.4 million and $128.1 million, respectively. In the second quarter of 2012, the Company collected approximately $17.5 million from the Spanish government related to past due receivables. In the third quarter of 2012, the Company collected approximately $6.5 million from the Italian government related to past due receivables.
The following tables provide the financial assets and liabilities carried at fair value measured on a recurring basis as of December 31, 2012 and December 31, 2011:
|
Total
carrying value at December 31, 2012 |
Quoted prices in
active markets (Level 1) |
Significant
other observable inputs (Level 2) |
Significant
unobservable inputs (Level 3) |
|||||||||||||
| (Dollars in thousands) | ||||||||||||||||
|
Investments in marketable securities |
$ | 4,785 | $ | 4,785 | $ | — | $ | — | ||||||||
|
Derivative assets |
1,279 | — | 1,279 | — | ||||||||||||
|
Derivative liabilities |
598 | — | 598 | — | ||||||||||||
|
Contingent consideration liabilities |
51,196 | — | — | 51,196 | ||||||||||||
|
Total
carrying value at December 31, 2011 |
Quoted prices in
active markets (Level 1) |
Significant
other observable inputs (Level 2) |
Significant
unobservable inputs (Level 3) |
|||||||||||||
| (Dollars in thousands) | ||||||||||||||||
|
Cash and cash equivalents |
$ | 40,005 | $ | 40,005 | $ | — | $ | — | ||||||||
|
Bonds — foreign government |
880 | 880 | — | — | ||||||||||||
|
Investments in marketable securities |
4,189 | 4,189 | — | — | ||||||||||||
|
Derivative assets |
204 | — | 204 | — | ||||||||||||
|
Derivative liabilities |
633 | — | 633 | — | ||||||||||||
|
Contingent consideration liabilities |
9,676 | — | — | 9,676 | ||||||||||||
F-31
Table of Contents
TELEFLEX INCORPORATED AND SUBSIDIARIES
NOTES TO CONSOLIDATED FINANCIAL STATEMENTS — (Continued)
The following table provides a reconciliation of changes in Level 3 financial liabilities measured at fair value on a recurring basis for the years ended December 31, 2012 and December 31, 2011:
|
Contingent
consideration |
||||||||
| 2012 | 2011 | |||||||
| (Dollars in thousands) | ||||||||
|
Beginning balance |
$ | 9,676 | $ | — | ||||
|
Initial estimate upon acquisition |
58,895 | 15,400 | ||||||
|
Payment |
(18,426 | ) | (6,000 | ) | ||||
|
Revaluations |
1,055 | 276 | ||||||
|
Translation adjustment |
(4 | ) | — | |||||
|
|
|
|
|
|||||
|
Ending balance |
$ | 51,196 | $ | 9,676 | ||||
|
|
|
|
|
|||||
See Note 9, “Borrowings,” for a discussion of the fair value of the Company’s long-term debt.
Valuation Hierarchy
The Derivatives and Hedging Standard under the FASB accounting standards codification establishes a valuation hierarchy of the inputs (i.e. assumptions that market participants would use in pricing an asset or liability) used to measure fair value. This hierarchy prioritizes the inputs into three broad levels as follows:
Level 1 inputs — quoted prices (unadjusted) in active markets for identical assets or liabilities that the Company has the ability to access at the measurement date.
Level 2 inputs — inputs other than quoted prices included within Level 1 that are observable for the asset or liability, either directly or indirectly. If the asset or liability has a specified (contractual) term, a Level 2 input must be observable for substantially the full term of the asset or liability. Level 2 inputs include:
| 1. | Quoted prices for similar assets or liabilities in active markets. |
| 2. | Quoted prices for identical or similar assets or liabilities in markets that are not active. |
| 3. | Inputs other than quoted prices that are observable for the asset or liability. |
| 4. | Inputs that are derived principally from or corroborated by observable market data by correlation or other means. |
Level 3 inputs — unobservable inputs for the asset or liability. Unobservable inputs may be used to measure fair value only when observable inputs are not available. Unobservable inputs reflect the Company’s assumptions about the assumptions market participants would use in pricing the asset or liability in achieving the fair value measurement objective of an exit price perspective. An exit price is the price that would be received to sell an asset or paid to transfer a liability.
A financial asset or liability’s classification within the hierarchy is determined based on the lowest level input that is significant to the fair value measurement.
Valuation Techniques Used to Determine Fair Value
The Company’s cash and cash equivalents valued based upon Level 1 inputs are comprised of overnight investments in money market funds. The funds invest in obligations of the U.S. Treasury, including Treasury bills, bonds and notes. The funds seek to maintain a net asset value of $1.00 per share.
F-32
Table of Contents
TELEFLEX INCORPORATED AND SUBSIDIARIES
NOTES TO CONSOLIDATED FINANCIAL STATEMENTS — (Continued)
The Company’s financial assets valued based upon Level 1 inputs are comprised of investments in marketable securities held in trust, which are available to pay benefits under certain deferred compensation plans and other compensatory arrangements. The investment assets of the trust are valued using quoted market prices.
The Company’s financial assets and liabilities valued based upon Level 2 inputs are comprised of foreign exchange contracts. The Company uses foreign exchange contracts to manage foreign currency transaction exposure. The fair value of the foreign exchange contracts represents the amount required to enter into offsetting contracts with similar remaining maturities based on quoted market prices. The Company has taken into account the creditworthiness of the counterparties in measuring fair value. See Note 10, “Financial instruments” for additional information.
During 2011, the Company received $9.6 million of zero-coupon Greek government bonds (the “Greek Bonds”) in settlement of trade receivables due to the Company from sales to the public hospital system in Greece for 2007, 2008 and 2009. Initially, the Company reported the Greek Bonds as a Level 1 financial asset based on quoted prices for identical assets in active markets. As the year progressed, the market activity slowed for these bonds and the Company changed the status of the Greek Bonds to Level 2 based on quoted prices for identical assets. During the fourth quarter of 2011, the Company sold a large portion of the bonds and sold the remainder of the bonds in January 2012. At December 31, 2011, the fair value of the Greek Bonds recorded on the Company’s balance sheet was approximately $0.9 million, which represented the final value received from the January 2012 sale of the remaining bonds. Since the fair value represented a quoted price based on the final sales price of the Greek Bonds, the Company has changed the status of the Greek Bonds back to a Level 1 financial asset.
The Company’s financial liabilities valued based upon Level 3 inputs are comprised of contingent consideration arrangements pertaining to the Company’s acquisitions. The Company accounts for contingent consideration in accordance with applicable accounting guidance pertaining to business combinations. The Company is contractually obligated to pay contingent consideration upon the achievement of specified objectives, including regulatory approvals, sales targets and, in some instances, the passage of time, referred to as milestone payments, and therefore recorded contingent consideration liabilities at the time of the acquisitions. The Company updates its assumptions each reporting period based on new developments and records such amounts at fair value based on the revised assumptions, until such consideration is satisfied through payment upon the achievement of the specified objectives or eliminated upon failure to achieve the specified objectives.
It is estimated that milestone payments will occur in 2013 and may extend until 2018 or later. As of December 31, 2012, the range of undiscounted amounts the Company could be required to pay for contingent consideration arrangements is between $7.0 million and $94.4 million. The Company has determined the fair value of the liabilities for the contingent consideration based on a probability-weighted discounted cash flow analysis. This fair value measurement is based on significant inputs not observable in the market and thus represents a Level 3 measurement within the fair value hierarchy. The fair value of the contingent consideration liability associated with future milestone payments was based on several factors including:
| • |
estimated cash flows projected from the success of market launches; |
| • |
the estimated time and resources needed to complete the development of the acquired technologies; |
| • |
the uncertainty of obtaining regulatory approvals within the required time periods; and |
| • |
the risk adjusted discount rate for fair value measurement. |
F-33
Table of Contents
TELEFLEX INCORPORATED AND SUBSIDIARIES
NOTES TO CONSOLIDATED FINANCIAL STATEMENTS — (Continued)
The following table provides information regarding the valuation techniques and inputs used in determining the fair value of assets or liabilities categorized as Level 3 measurements:
|
Valuation Technique |
Unobservable Input |
Range (Weighted Average) | ||||||
|
Contingent consideration |
Discounted cash flow | Discount rate | 2.8% - 10%(6%) | |||||
| Probability of payment | 0-100%(60%) | |||||||
As of December 31, 2012, of the $51.2 million of total contingent consideration, the Company has recorded approximately $23.7 million in Current portion of contingent consideration and the remaining $27.5 million in Other liabilities.
The authorized capital of the Company is comprised of 200 million common shares, $1 par value, and 500,000 preference shares. No preference shares have been outstanding during the last three years.
On June 14, 2007, the Company’s Board of Directors authorized the repurchase of up to $300 million of outstanding Company common stock. Repurchases of Company stock under the Board authorization may be made from time to time in the open market and may include privately-negotiated transactions as market conditions warrant and subject to regulatory considerations. The stock repurchase program has no expiration date, and the Company’s ability to execute on the program will depend on, among other factors, cash requirements for acquisitions, cash generation from operations, debt repayment obligations, market conditions and regulatory requirements. In addition, under the Company’s senior credit and Senior Note agreements, the Company is subject to certain restrictions relating to its ability to repurchase shares in the event the Company’s consolidated leverage ratio exceeds certain levels, which may further limit the Company’s ability to repurchase shares under this Board authorization. Through December 31, 2012, no shares have been purchased under this Board authorization.
Basic earnings per share is computed by dividing net income by the weighted average number of common shares outstanding during the period. Diluted earnings per share is computed in the same manner except that the weighted average number of shares is increased for dilutive securities. The difference between basic and diluted weighted average common shares results from the assumption that dilutive stock options were exercised. A reconciliation of basic to diluted weighted average shares outstanding is as follows:
| 2012 | 2011 | 2010 | ||||||||||
| (Shares in thousands) | ||||||||||||
|
Basic shares |
40,859 | 40,501 | 39,906 | |||||||||
|
Dilutive shares assumed issued |
— | 300 | 374 | |||||||||
|
|
|
|
|
|
|
|||||||
|
Diluted shares |
40,859 | 40,801 | 40,280 | |||||||||
|
|
|
|
|
|
|
|||||||
Weighted average stock options having 9,041 thousand, 8,825 thousand and 4,391 thousand underlying shares for 2012, 2011 and 2010, respectively, were antidilutive and therefore not included in the calculation of earnings per share.
F-34
Table of Contents
TELEFLEX INCORPORATED AND SUBSIDIARIES
NOTES TO CONSOLIDATED FINANCIAL STATEMENTS — (Continued)
Changes in accumulated other comprehensive income (loss) for 2012 and 2011 are as follows:
|
Cash Flow
Hedges |
Pension and
Other Postretirement Benefit Plans |
Foreign
Currency Translation Adjustment |
Accumulated
Other Comprehensive Income (Loss) |
|||||||||||||
| (Dollars in thousands) | ||||||||||||||||
|
Balance at December 31, 2010 |
$ | (15,262 | ) | $ | (95,746 | ) | $ | 59,128 | $ | (51,880 | ) | |||||
|
Current-period other comprehensive income (loss) |
8,070 | (47,878 | ) | (52,989 | ) | (92,797 | ) | |||||||||
|
Divestiture of businesses |
— | 9,076 | (23,687 | ) | (14,611 | ) | ||||||||||
|
Discontinued operations |
(65 | ) | — | — | (65 | ) | ||||||||||
|
|
|
|
|
|
|
|
|
|||||||||
|
Balance at December 31, 2011 |
(7,257 | ) | (134,548 | ) | (17,548 | ) | (159,353 | ) | ||||||||
|
Current-period other comprehensive income |
6,876 | 7,291 | 13,138 | 27,305 | ||||||||||||
|
|
|
|
|
|
|
|
|
|||||||||
|
Balance at December 31, 2012 |
$ | (381 | ) | $ | (127,257 | ) | $ | (4,410 | ) | $ | (132,048 | ) | ||||
|
|
|
|
|
|
|
|
|
|||||||||
The Company has two stock-based compensation plans under which equity-based awards may be made. The Company’s 2000 Stock Compensation Plan (the “2000 plan”) provides for the granting of incentive and non-qualified stock options and restricted stock units to directors, officers and key employees. Under the 2000 plan, the Company is authorized to issue up to 4 million shares of common stock, but no more than 800,000 of those shares may be issued as restricted stock. Options granted under the 2000 plan have an exercise price equal to the average of the high and low sales prices of the Company’s common stock on the date of the grant, rounded to the nearest $0.25. Generally, options granted under the 2000 plan are exercisable three to five years after the date of the grant and expire no more than ten years from the grant date. Outstanding restricted stock units generally vest in one to three years. In 2012, the Company granted incentive and non-qualified options to purchase 32,076 shares of common stock and granted restricted stock units representing 9,960 shares of common stock under the 2000 plan. The unrecognized compensation expense for these awards as of the grant date was $1.0 million, which will be recognized over the vesting period of the awards. As of December 31, 2012, 789,538 shares were available for future grants under the 2000 plan.
The Company’s 2008 Stock Incentive Plan (the “2008 plan”) provides for the granting of various types of equity-based awards to directors, officers and key employees. These awards include incentive and non-qualified stock options, stock appreciation rights, stock awards and other stock-based awards. Under the 2008 plan, the Company is authorized to issue up to 2.5 million shares of common stock, but grants of awards other than stock options and stock appreciation rights may not exceed 875,000 shares. Options granted under the 2008 plan have an exercise price equal to the closing price of the Company’s common stock on the date of grant. In 2012, the Company granted incentive and non-qualified options to purchase 399,591 shares of common stock and granted restricted stock units representing 168,730 shares of common stock under the 2008 plan. The unrecognized compensation expense for these awards as of the grant date was $14.3 million, which will be recognized over the vesting period of the awards. As of December 31, 2012, 1,252,050 shares were available for future grants under the 2008 plan.
F-35
Table of Contents
TELEFLEX INCORPORATED AND SUBSIDIARIES
NOTES TO CONSOLIDATED FINANCIAL STATEMENTS — (Continued)
The fair value for options granted in 2012, 2011 and 2010 was estimated at the date of grant using a multiple point Black-Scholes option pricing model. The following weighted-average assumptions were used:
| 2012 | 2011 | 2010 | ||||||||||
|
Risk-free interest rate |
0.81 | % | 1.92 | % | 2.12 | % | ||||||
|
Expected life of option |
4.85 yrs. | 4.70 yrs. | 4.66 yrs. | |||||||||
|
Expected dividend yield |
2.28 | % | 2.34 | % | 2.22 | % | ||||||
|
Expected volatility |
28.46 | % | 26.82 | % | 26.42 | % | ||||||
The fair value for non-vested shares granted in 2012, 2011 and 2010 was estimated at the date of grant based on the market price for the underlying stock on the grant date discounted for the risk free interest rate and the present value of expected dividends over the vesting period. The following weighted-average assumptions were used:
| 2012 | 2011 | 2010 | ||||||||||
|
Risk-free interest rate |
0.37 | % | 1.04 | % | 1.25 | % | ||||||
|
Expected dividend yield |
2.24 | % | 2.34 | % | 2.24 | % | ||||||
The Company applied a simplified method to establish the beginning balance of the additional paid-in capital pool (“APIC Pool”) related to the tax effects of employee stock-based compensation and to determine the subsequent impact on the APIC Pool and consolidated statements of cash flows of the tax effects of employee stock-based compensation awards that are outstanding.
The following table summarizes the option activity during 2012:
|
Shares
Subject to Options |
Weighted
Average Exercise Price |
Weighted
Average Remaining Contractual Life In Years |
Aggregate Intrinsic
Value |
|||||||||||||
| (Dollars in thousands) | ||||||||||||||||
|
Outstanding, beginning of the year |
1,132,546 | $ | 57.17 | |||||||||||||
|
Granted |
431,667 | 59.85 | ||||||||||||||
|
Exercised |
(204,082 | ) | 51.66 | |||||||||||||
|
Forfeited or expired |
(275,938 | ) | 60.50 | |||||||||||||
|
|
|
|||||||||||||||
|
Outstanding, end of the year |
1,084,193 | $ | 58.43 | 7.0 | $ | 14,037 | ||||||||||
|
|
|
|
|
|
|
|
|
|||||||||
|
Exercisable, end of the year |
558,768 | $ | 57.53 | 5.4 | $ | 7,772 | ||||||||||
|
|
|
|
|
|
|
|
|
|||||||||
The weighted average grant date fair value was $11.78, $11.45 and $12.29 for options granted during 2012, 2011 and 2010, respectively. The total intrinsic value of options exercised was $2.7 million, $6.9 million and $2.3 million during 2012, 2011 and 2010, respectively.
The Company recorded $2.9 million of expense related to the portion of the shares underlying options that vested during 2012, which is included in selling, general and administrative expenses.
F-36
Table of Contents
TELEFLEX INCORPORATED AND SUBSIDIARIES
NOTES TO CONSOLIDATED FINANCIAL STATEMENTS — (Continued)
The following table summarizes the non-vested restricted stock unit activity during 2012:
|
Number of
Non-Vested Shares |
Weighted
Average Grant- Date Fair Value |
Weighted
Average Remaining Contractual Life In Years |
Aggregate Intrinsic
Value |
|||||||||||||
| (Dollars in thousands) | ||||||||||||||||
|
Outstanding, beginning of the year |
334,459 | $ | 56.60 | |||||||||||||
|
Granted |
178,690 | 56.95 | ||||||||||||||
|
Vested |
(78,753 | ) | 45.54 | |||||||||||||
|
Forfeited |
(69,608 | ) | 54.92 | |||||||||||||
|
|
|
|||||||||||||||
|
Outstanding, end of the year |
364,788 | $ | 55.77 | 1.3 | $ | 26,013 | ||||||||||
|
|
|
|
|
|
|
|
|
|||||||||
The weighted average grant-date fair value for non-vested restricted stock units granted during 2012, 2011 and 2010 was $56.95, $54.33 and $57.09, respectively.
The Company recorded $5.7 million of expense related to the portion of the restricted stock units that vested during 2012, which is included in selling, general and administrative expenses.
The following table summarizes the components of the provision for income taxes from continuing operations:
| 2012 | 2011 | 2010 | ||||||||||
| (Dollars in thousands) | ||||||||||||
|
Current: |
||||||||||||
|
Federal |
$ | 20,959 | $ | (2,604 | ) | $ | (37,361 | ) | ||||
|
State |
3,623 | 4,621 | 3,665 | |||||||||
|
Foreign |
30,476 | 48,600 | 51,674 | |||||||||
|
Deferred: |
||||||||||||
|
Federal |
(34,629 | ) | (20,584 | ) | (1,213 | ) | ||||||
|
State |
(720 | ) | (961 | ) | (2,568 | ) | ||||||
|
Foreign |
(3,296 | ) | (3,294 | ) | 2,721 | |||||||
|
|
|
|
|
|
|
|||||||
| $ | 16,413 | $ | 25,778 | $ | 16,918 | |||||||
|
|
|
|
|
|
|
|||||||
In December 2011, the Company sold its cargo and container businesses and recorded a gain on sale of $217.8 million along with related taxes of $91.0 million. The gain and related taxes are reported as discontinued operations. A significant portion of these tax charges are included as part of the deferred tax liability for unremitted foreign earnings.
At December 31, 2012, the cumulative unremitted earnings of other subsidiaries outside the United States, considered permanently reinvested, for which no income or withholding taxes have been provided, approximated $677.0 million. Such earnings are expected to be reinvested indefinitely and, as a result, no deferred tax liability has been recognized with regard to such earnings. It is not practicable to estimate the income tax liability that might be incurred if such earnings were remitted to the United States.
F-37
Table of Contents
TELEFLEX INCORPORATED AND SUBSIDIARIES
NOTES TO CONSOLIDATED FINANCIAL STATEMENTS — (Continued)
The following table summarizes the U.S. and non-U.S. components of income from continuing operations before taxes:
| 2012 | 2011 | 2010 | ||||||||||
| (Dollars in thousands) | ||||||||||||
|
United States |
$ | (315,928 | ) | $ | (10,952 | ) | $ | (10,337 | ) | |||
|
Other |
150,559 | 156,052 | 114,927 | |||||||||
|
|
|
|
|
|
|
|||||||
| $ | (165,369 | ) | $ | 145,100 | $ | 104,590 | ||||||
|
|
|
|
|
|
|
|||||||
Reconciliations between the statutory federal income tax rate and the effective income tax rate are as follows:
| 2012 | 2011 | 2010 | ||||||||||
|
Federal statutory rate |
35.00 | % | 35.00 | % | 35.00 | % | ||||||
|
Goodwill Impairment |
(60.84 | )% | — | — | ||||||||
|
Tax effect of International items |
11.88 | % | (15.36 | )% | (8.20 | )% | ||||||
|
State taxes, net of federal benefit |
(0.90 | )% | 1.18 | % | (0.48 | )% | ||||||
|
Uncertain tax contingencies |
4.85 | % | (2.66 | )% | (3.33 | )% | ||||||
|
Other, net |
0.08 | % | (0.39 | )% | (6.81 | )% | ||||||
|
|
|
|
|
|
|
|||||||
| (9.93 | )% | 17.77 | % | 16.18 | % | |||||||
|
|
|
|
|
|
|
|||||||
The effective income tax rate for 2012 was (9.9%) compared to 17.8% for 2011. The decrease in the effective tax rate for 2012 was impacted by the Company’s ability to deduct only $45 million of the $332 million goodwill impairment charge recorded in the first quarter of 2012. Accordingly, the reduction in the tax rate for 2012 reflects the Company’s ability to realize only a limited tax benefit related to this charge.
On January 2, 2013, the ‘fiscal cliff’ agreement was enacted into law extending several expired or expiring tax provisions retroactively to 2012. In accordance with U.S. GAAP, impacts of extensions are required to be reported by the Company in a quarter in which the legislation was enacted (i.e. first quarter of 2013). The Company is still quantifying the impact of the legislation, however, it estimates that the retroactive 2012 benefit of the law would be approximately $0.9 million.
The Company and its subsidiaries are routinely subject to examinations by various taxing authorities. In conjunction with these examinations and as a regular practice, the Company establishes and adjusts reserves with respect to its uncertain tax positions to address developments related to those positions. The Company realized a net benefit of approximately $8.0 million, $3.9 million and $3.5 million in 2012, 2011 and 2010, respectively, as a result of reducing its reserves with respect to uncertain tax positions. These reductions principally resulted from the conclusion of various audits, the expiration of a number of applicable statutes of limitations and adjustments to reserves for prior tax years.
In the third quarter of 2010, the Company determined that an out-of-period adjustment associated with tax returns filed and tax audit conclusions was required, which reduced income tax expense by approximately $5.7 million. Management determined that this adjustment was not material on a quantitative or qualitative basis to the prior period financial statements.
F-38
Table of Contents
TELEFLEX INCORPORATED AND SUBSIDIARIES
NOTES TO CONSOLIDATED FINANCIAL STATEMENTS — (Continued)
Significant components of the Company’s deferred tax assets and liabilities at year end were as follows:
| 2012 | 2011 | |||||||
| (Dollars in thousands) | ||||||||
|
Deferred tax assets: |
||||||||
|
Tax loss and credit carryforwards |
$ | 87,537 | $ | 70,452 | ||||
|
Pension |
63,737 | 74,775 | ||||||
|
Reserves and accruals |
39,502 | 42,272 | ||||||
|
Other |
21,275 | 25,808 | ||||||
|
Less: valuation allowances |
(70,469 | ) | (66,305 | ) | ||||
|
|
|
|
|
|||||
|
Total deferred tax assets |
141,582 | 147,002 | ||||||
|
|
|
|
|
|||||
|
Deferred tax liabilities: |
||||||||
|
Property, plant and equipment |
24,440 | 24,877 | ||||||
|
Intangibles — stock acquisitions |
325,244 | 317,271 | ||||||
|
Unremitted foreign earnings |
151,780 | 166,764 | ||||||
|
Other |
13,130 | 18,681 | ||||||
|
|
|
|
|
|||||
|
Total deferred tax liabilities |
514,594 | 527,593 | ||||||
|
|
|
|
|
|||||
|
Net deferred tax liability |
$ | (373,012 | ) | $ | (380,591 | ) | ||
|
|
|
|
|
|||||
Under the tax laws of various jurisdictions in which the Company operates, deductions or credits that cannot be fully utilized for tax purposes during the current year may be carried forward, subject to statutory limitations, to reduce taxable income or taxes payable in a future tax year. At December 31, 2012, the tax effect of such carry forwards approximated $87.5 million. Of this amount, $12.3 million has no expiration date, $0.8 million expires after 2012 but before the end of 2017 and $74.4 million expires after 2017. A portion of these carry forwards consists of tax losses and credits which were acquired in acquisitions by the Company and the utilization of these tax attributes are subject to an annual limitation imposed by Section 382 of the Internal Revenue Code, which limits a company’s ability to deduct prior net operating losses following a more than 50 percent change in ownership. The Hotspur Technologies acquisition in June 2012 included $10.8 million of tax losses, $2.5 million of which will not be realized as a result of the Section 382 limitation. A full valuation allowance on this component of the acquired tax losses was recorded in conjunction with the acquisition. Except as described above, with respect to Hotspur Technologies, it is not expected that the Section 382 limitation will prevent the Company from utilizing its loss carryforwards. The determination of state net operating loss carry forwards is dependent upon the U.S. subsidiaries’ taxable income or loss, apportionment percentages and other respective state laws, which can change from year to year and impact the amount of such carry forward.
The valuation allowance for deferred tax assets of $70.5 million and $66.3 million at December 31, 2012 and December 31, 2011, respectively, relates principally to the uncertainty of the Company’s ability to utilize certain deferred tax assets, primarily tax loss and credit carry forwards in various jurisdictions. The valuation allowance was calculated in accordance with accounting standards, which require that a valuation allowance be established and maintained when it is “more likely than not” that all or a portion of deferred tax assets will not be realized.
F-39
Table of Contents
TELEFLEX INCORPORATED AND SUBSIDIARIES
NOTES TO CONSOLIDATED FINANCIAL STATEMENTS — (Continued)
Uncertain Tax Positions : A reconciliation of the beginning and ending balances for liabilities associated with unrecognized tax benefits is as follows:
| 2012 | 2011 | 2010 | ||||||||||
| (Dollars in thousands) | ||||||||||||
|
Balance at January 1 |
$ | 75,026 | $ | 89,281 | $ | 113,232 | ||||||
|
Increase in unrecognized tax benefits related to prior years |
7,645 | 1,855 | 6,226 | |||||||||
|
Decrease in unrecognized tax benefits related to prior years |
(6,134 | ) | (6,415 | ) | (10,887 | ) | ||||||
|
Unrecognized tax benefits related to the current year |
4,256 | 4,246 | 1,956 | |||||||||
|
Reductions in unrecognized tax benefits due to settlements |
(8,816 | ) | (7,678 | ) | (2,011 | ) | ||||||
|
Reductions in unrecognized tax benefits due to lapse of applicable statute of limitations |
(3,503 | ) | (5,852 | ) | (16,209 | ) | ||||||
|
Increase (decrease) in unrecognized tax benefits due to foreign currency translation |
169 | (411 | ) | (3,026 | ) | |||||||
|
|
|
|
|
|
|
|||||||
|
Balance at December 31 |
$ | 68,643 | $ | 75,026 | $ | 89,281 | ||||||
|
|
|
|
|
|
|
|||||||
The total liabilities associated with the unrecognized tax benefits that, if recognized would impact the effective tax rate for continuing operations, were $26.5 million at December 31, 2012.
The Company accrues interest and penalties associated with unrecognized tax benefits in income tax expense in the consolidated statements of operations, and the corresponding liability is included in the consolidated balance sheets. The interest (benefit) expense (net of related tax benefits where applicable) and penalties reflected in income from continuing operations for the year ended December 31, 2012 was $0.8 million and $0.2 million, respectively, ($(0.1) million and $0.3 million, respectively, for the year ended December 31, 2011 and $(2.5) million and $1.8 million, respectively, for the year ended December 31, 2010). The corresponding liabilities in the consolidated balance sheets for interest and penalties were $6.7 million and $9.2 million, respectively, at December 31, 2012 ($11.8 million and $9.2 million, respectively, at December 31, 2011).
The taxable years that remain subject to examination by major tax jurisdictions are as follows:
| Beginning | Ending | |||||||
|
United States |
2007 | 2012 | ||||||
|
Canada |
2005 | 2012 | ||||||
|
China |
2007 | 2012 | ||||||
|
Czech Republic |
2001 | 2012 | ||||||
|
France |
2010 | 2012 | ||||||
|
Germany |
2007 | 2012 | ||||||
|
Ireland |
2008 | 2012 | ||||||
|
Italy |
2008 | 2012 | ||||||
|
Malaysia |
2007 | 2012 | ||||||
|
Singapore |
2006 | 2012 | ||||||
The Company and its subsidiaries are routinely subject to income tax examinations by various taxing authorities. As of December 31, 2012, the most significant tax examinations in process are in the jurisdictions of the U.S., Canada, the Czech Republic and Austria. The date at which these examinations may be concluded and the ultimate outcome of such examinations is uncertain. As a result of the uncertain outcome of these ongoing examinations, future examinations or the expiration of statutes of limitation, it is reasonably possible that the related unrecognized tax benefits for tax positions taken could materially change from those recorded as liabilities at December 31, 2012. Due
F-40
Table of Contents
TELEFLEX INCORPORATED AND SUBSIDIARIES
NOTES TO CONSOLIDATED FINANCIAL STATEMENTS — (Continued)
to the potential for resolution of certain examinations, and the expiration of various statutes of limitation, it is reasonably possible that the Company’s unrecognized tax benefits may change within the next twelve months by a range of zero to $7.6 million.
The Company has a number of defined benefit pension and other postretirement plans covering eligible U.S. and non-U.S. employees. The defined benefit pension plans are noncontributory. The benefits under these plans are based primarily on years of service and employees’ pay near retirement. The Company’s funding policy for U.S. plans is to contribute annually, at a minimum, amounts required by applicable laws and regulations. Obligations under non-U.S. plans are systematically provided for by depositing funds with trustees or by book reserves. In 2008 the Company amended the Teleflex Retirement Income Plan (“TRIP”) to cease future benefit accruals for all employees, other than those subject to a collective bargaining agreement, and amended its Supplemental Executive Retirement Plans (“SERP”) for all executives to cease future benefit accruals for both employees and executives as of December 31, 2008. The Company replaced the non-qualified defined benefits provided under the SERP with a non-qualified defined contribution arrangement under the Company’s Deferred Compensation Plan, effective January 1, 2009. In addition, in 2008, the Company’s other postretirement benefit plans were amended to eliminate future benefits for employees, other than those subject to a collective bargaining agreement, who had not attained age 50 and whose age plus years of service totaled less than 65. In 2012, the Company reached an agreement with U.S. plan participants covered under a collective bargaining agreement to cease future benefit accruals under the TRIP. As a result of this action, all of the Company’s U.S. defined benefit pension plans are effectively frozen as of December 31, 2012.
In March 2011, in connection with the Company’s sale of its marine business and the assumption by the buyer of specified defined benefit plan obligations related to the business, the Company revalued, at fair value, its obligations and assets under its domestic pension and other postretirement plans, resulting in a net actuarial decrease in the obligation of approximately $5.6 million. In connection with the sale, approximately $24.4 million of the pension obligations, approximately $7.4 million of other postretirement obligations and approximately $17.7 million of related pension assets were initially assigned to the buyer. In the fourth quarter of 2011, pursuant to the terms of the marine sale agreement, the Company refined its estimate of the pension and postretirement obligations assumed by the buyer and pension assets assigned to the buyer, which resulted in a decrease in the Company’s gain on sale of the marine business of approximately $2.4 million. A transfer of all obligations and assets related to the marine business’s pensions and other postretirement plans adjusted for participant and market activity from the date of sale through the date of transfer was completed during the fourth quarter of 2011. For additional information regarding the sale of the marine business, see Note 19, “Divestiture related activities.”
The Company and certain of its subsidiaries provide medical, dental and life insurance benefits to pensioners and survivors. The associated plans are unfunded and approved claims are paid from Company funds.
F-41
Table of Contents
TELEFLEX INCORPORATED AND SUBSIDIARIES
NOTES TO CONSOLIDATED FINANCIAL STATEMENTS — (Continued)
Net benefit cost of pension and postretirement benefit plans for continuing operations consisted of the following:
| Pension (1) | Other Benefits (1) | |||||||||||||||||||||||
| 2012 | 2011 | 2010 | 2012 | 2011 | 2010 | |||||||||||||||||||
| (Dollars in thousands) | ||||||||||||||||||||||||
|
Service cost |
$ | 2,331 | $ | 2,297 | $ | 2,229 | $ | 704 | $ | 479 | $ | 690 | ||||||||||||
|
Interest cost |
16,561 | 17,284 | 17,141 | 2,122 | 2,054 | 2,310 | ||||||||||||||||||
|
Expected return on plan assets |
(20,245 | ) | (19,998 | ) | (16,753 | ) | — | — | — | |||||||||||||||
|
Net amortization and deferral |
6,474 | 4,018 | 4,013 | 761 | (45 | ) | 105 | |||||||||||||||||
|
Curtailment gain |
(197 | ) | (37 | ) | (52 | ) | — | — | — | |||||||||||||||
|
Settlement gain |
106 | (5 | ) | (40 | ) | — | — | — | ||||||||||||||||
|
|
|
|
|
|
|
|
|
|
|
|
|
|||||||||||||
|
Net benefit cost |
$ | 5,030 | $ | 3,559 | $ | 6,538 | $ | 3,587 | $ | 2,488 | $ | 3,105 | ||||||||||||
|
|
|
|
|
|
|
|
|
|
|
|
|
|||||||||||||
| (1) | All periods have been adjusted to remove amounts related to discontinued operations. |
The weighted average assumptions for U.S. and foreign plans used in determining net benefit cost were as follows:
| Pension | Other Benefits | |||||||||||||||||||||||
| 2012 | 2011 | 2010 | 2012 | 2011 | 2010 | |||||||||||||||||||
|
Discount rate |
4.28 | % | 5.50 | % | 5.78 | % | 3.95 | % | 5.10 | % | 5.60 | % | ||||||||||||
|
Rate of return |
8.27 | % | 8.31 | % | 8.27 | % | — | — | — | |||||||||||||||
|
Initial healthcare trend rate |
— | — | — | 8.5 | % | 8.0 | % | 9.0 | % | |||||||||||||||
|
Ultimate healthcare trend rate |
— | — | — | 5.0 | % | 5.0 | % | 5.0 | % | |||||||||||||||
F-42
Table of Contents
TELEFLEX INCORPORATED AND SUBSIDIARIES
NOTES TO CONSOLIDATED FINANCIAL STATEMENTS — (Continued)
Summarized information on the Company’s pension and postretirement benefit plans, measured as of year end, and the amounts recognized in the consolidated balance sheet and in accumulated other comprehensive income with respect to the plans were as follows:
| Pension | Other Benefits | |||||||||||||||
| 2012 | 2011 | 2012 | 2011 | |||||||||||||
| Under Funded | Under Funded | |||||||||||||||
| (Dollars in thousands) | ||||||||||||||||
|
Benefit obligation, beginning of year |
$ | 393,794 | $ | 354,125 | $ | 49,508 | $ | 55,522 | ||||||||
|
Service cost |
2,331 | 2,297 | 704 | 479 | ||||||||||||
|
Interest cost |
16,561 | 17,284 | 2,122 | 2,054 | ||||||||||||
|
Actuarial loss |
2,345 | 65,636 | 6,161 | 5,047 | ||||||||||||
|
Divestiture of businesses |
— | (28,568 | ) | — | (10,361 | ) | ||||||||||
|
Currency translation |
678 | 200 | — | — | ||||||||||||
|
Benefits paid |
(16,227 | ) | (15,507 | ) | (3,106 | ) | (3,466 | ) | ||||||||
|
Medicare Part D reimbursement |
— | — | 220 | 233 | ||||||||||||
|
Settlements |
(767 | ) | (173 | ) | — | — | ||||||||||
|
Administrative costs |
(1,452 | ) | (1,463 | ) | — | — | ||||||||||
|
Curtailments |
(79 | ) | (37 | ) | — | — | ||||||||||
|
|
|
|
|
|
|
|
|
|||||||||
|
Projected benefit obligation, end of year |
397,184 | 393,794 | 55,609 | 49,508 | ||||||||||||
|
|
|
|
|
|
|
|
|
|||||||||
|
Fair value of plan assets, beginning of year |
243,324 | 261,934 | — | — | ||||||||||||
|
Actual return on plan assets |
33,946 | 11,419 | — | — | ||||||||||||
|
Contributions |
17,567 | 6,451 | — | — | ||||||||||||
|
Divestiture of businesses |
— | (19,619 | ) | — | — | |||||||||||
|
Benefits paid |
(16,227 | ) | (15,507 | ) | — | — | ||||||||||
|
Settlements paid |
(767 | ) | (173 | ) | — | — | ||||||||||
|
Administrative costs |
(1,452 | ) | (1,463 | ) | — | — | ||||||||||
|
Currency translation |
472 | 282 | — | — | ||||||||||||
|
|
|
|
|
|
|
|
|
|||||||||
|
Fair value of plan assets, end of year |
276,863 | 243,324 | — | — | ||||||||||||
|
|
|
|
|
|
|
|
|
|||||||||
|
Funded status, end of year |
$ | (120,321 | ) | $ | (150,470 | ) | $ | (55,609 | ) | $ | (49,508 | ) | ||||
|
|
|
|
|
|
|
|
|
|||||||||
The summarized 2011 information in the table above excludes the activity pertaining to discontinued operations. The “Divestiture of businesses” lines remove the beginning of the year balances for all discontinued operations that had pension or other postretirement benefits.
The following table sets forth information as to amounts recognized in the consolidated balance sheet with respect to the plans:
| Pension | Other Benefits | |||||||||||||||
| 2012 | 2011 | 2012 | 2011 | |||||||||||||
| (Dollars in thousands) | ||||||||||||||||
|
Payroll and benefit-related liabilities |
$ | (1,784 | ) | $ | (1,813 | ) | $ | (3,200 | ) | $ | (3,181 | ) | ||||
|
Pension and postretirement benefit liabilities |
(118,537 | ) | (148,657 | ) | (52,409 | ) | (46,327 | ) | ||||||||
|
Accumulated other comprehensive loss |
186,916 | 204,508 | 12,254 | 6,854 | ||||||||||||
|
|
|
|
|
|
|
|
|
|||||||||
| $ | 66,595 | $ | 54,038 | $ | (43,355 | ) | $ | (42,654 | ) | |||||||
|
|
|
|
|
|
|
|
|
|||||||||
F-43
Table of Contents
TELEFLEX INCORPORATED AND SUBSIDIARIES
NOTES TO CONSOLIDATED FINANCIAL STATEMENTS — (Continued)
Amounts recognized in accumulated other comprehensive (income) loss with respect to the plans are set forth below:
| Pension | ||||||||||||||||
|
Prior Service
Cost (Credit) |
Net (Gain)
or Loss |
Deferred
Taxes |
Accumulated
Other Comprehensive (Income) Loss, Net of Tax |
|||||||||||||
| (Dollars in thousands) | ||||||||||||||||
|
Balance at December 31, 2010 |
$ | 431 | $ | 143,206 | $ | (52,313 | ) | $ | 91,324 | |||||||
|
Reclassification adjustments related to components of Net Periodic Benefit Cost recognized during the period: |
||||||||||||||||
|
Net amortization and deferral |
(32 | ) | (3,986 | ) | 1,449 | (2,569 | ) | |||||||||
|
Settlement |
— | 5 | (2 | ) | 3 | |||||||||||
|
Amounts arising during the period: |
||||||||||||||||
|
Tax rate adjustments |
— | — | (58 | ) | (58 | ) | ||||||||||
|
Actuarial changes in benefit obligation |
— | 74,215 | (26,959 | ) | 47,256 | |||||||||||
|
Divestiture of businesses |
(148 | ) | (9,260 | ) | 3,415 | (5,993 | ) | |||||||||
|
Impact of currency translation |
— | 77 | (20 | ) | 57 | |||||||||||
|
|
|
|
|
|
|
|
|
|||||||||
|
Balance at December 31, 2011 |
251 | 204,257 | (74,488 | ) | 130,020 | |||||||||||
|
Reclassification adjustments related to components of Net Periodic Benefit Cost recognized during the period: |
||||||||||||||||
|
Net amortization and deferral |
(35 | ) | (6,439 | ) | 2,287 | (4,187 | ) | |||||||||
|
Curtailment |
— | 118 | (44 | ) | 74 | |||||||||||
|
Settlement |
— | (106 | ) | 40 | (66 | ) | ||||||||||
|
Amounts arising during the period: |
||||||||||||||||
|
Tax rate adjustments |
— | — | 115 | 115 | ||||||||||||
|
Actuarial changes in benefit obligation |
— | (11,356 | ) | 4,581 | (6,775 | ) | ||||||||||
|
Impact of currency translation |
— | 226 | (58 | ) | 168 | |||||||||||
|
|
|
|
|
|
|
|
|
|||||||||
|
Balance at December 31, 2012 |
$ | 216 | $ | 186,700 | $ | (67,567 | ) | $ | 119,349 | |||||||
|
|
|
|
|
|
|
|
|
|||||||||
F-44
Table of Contents
TELEFLEX INCORPORATED AND SUBSIDIARIES
NOTES TO CONSOLIDATED FINANCIAL STATEMENTS — (Continued)
| Other Benefits | ||||||||||||||||||||
|
Prior Service
Cost (Credit) |
Initial
Obligation |
Net
(Gain) or Loss |
Deferred
Taxes |
Accumulated
Other Comprehensive (Income) Loss, Net of Tax |
||||||||||||||||
| (Dollars in thousands) | ||||||||||||||||||||
|
Balance at December 31, 2010 |
$ | 509 | $ | 364 | $ | 5,422 | $ | (1,873 | ) | $ | 4,422 | |||||||||
|
Reclassification adjustments related to components of Net Periodic Benefit Cost recognized during the period: |
||||||||||||||||||||
|
Net Amortization and deferral |
56 | (110 | ) | 99 | (17 | ) | 28 | |||||||||||||
|
Amounts Arising During the period: |
||||||||||||||||||||
|
Tax rate adjustments |
— | — | — | (4 | ) | (4 | ) | |||||||||||||
|
Divestiture of businesses |
(658 | ) | (152 | ) | (3,723 | ) | 1,450 | (3,083 | ) | |||||||||||
|
Actuarial changes in benefit obligation |
— | — | 5,047 | (1,882 | ) | 3,165 | ||||||||||||||
|
|
|
|
|
|
|
|
|
|
|
|||||||||||
|
Balance at December 31, 2011 |
(93 | ) | 102 | 6,845 | (2,326 | ) | 4,528 | |||||||||||||
|
Reclassification adjustments related to components of Net Periodic Benefit Cost recognized during the period: |
||||||||||||||||||||
|
Net Amortization and deferral |
55 | (97 | ) | (719 | ) | 277 | (484 | ) | ||||||||||||
|
Amounts Arising During the period: |
||||||||||||||||||||
|
Tax rate adjustments |
— | — | — | (1 | ) | (1 | ) | |||||||||||||
|
Actuarial changes in benefit obligation |
— | — | 6,161 | (2,296 | ) | 3,865 | ||||||||||||||
|
|
|
|
|
|
|
|
|
|
|
|||||||||||
|
Balance at December 31, 2012 |
$ | (38 | ) | $ | 5 | $ | 12,287 | $ | (4,346 | ) | $ | 7,908 | ||||||||
|
|
|
|
|
|
|
|
|
|
|
|||||||||||
The summarized 2011 information in the table above excludes the activity pertaining to discontinued operations. The “Divestiture of businesses” lines remove the beginning of the year balances for all discontinued operations that had pension or other postretirement benefits.
The weighted average assumptions for U.S. and foreign plans used in determining benefit obligations were as follows:
| Pension | Other Benefits | |||||||||||||||
| 2012 | 2011 | 2012 | 2011 | |||||||||||||
|
Discount rate |
4.27 | % | 4.28 | % | 3.83 | % | 3.95 | % | ||||||||
|
Rate of compensation increase |
3.0 | % | 3.0 | % | — | — | ||||||||||
|
Initial healthcare trend rate |
— | — | 8.15 | % | 8.5 | % | ||||||||||
|
Ultimate healthcare trend rate |
— | — | 5.0 | % | 5.0 | % | ||||||||||
The discount rate represents the interest rate used to determine the present value of future cash flows currently expected to be required to settle the Company’s pension and other benefit obligations. In 2012, the Company changed the yield curve used to determine the Company’s discount rate for its U.S. pension plans and other benefit plans from the Citigroup Pension Discount Curve to the AON Hewitt AA Above Median yield curve. The Company believes that the AA Above Median yield curve provides a better estimate of the Company’s liabilities relative to assets that would be purchased to settle such liabilities. The weighted average discount rates for U.S. pension plans and other benefit plans of 4.31% and 3.83%, respectively, were established by comparing the projection of expected benefit payments to the AA Above Median yield curve as of December 31, 2012. The expected benefit payments are discounted by each corresponding discount rate on the yield curve. For payments beyond 30 years, the Company extends the curve assuming that the discount rate derived in year 30 is
F-45
Table of Contents
TELEFLEX INCORPORATED AND SUBSIDIARIES
NOTES TO CONSOLIDATED FINANCIAL STATEMENTS — (Continued)
extended to the end of the plan’s payment expectations. Once the present value of the string of benefit payments is established, the Company determines the single rate on the yield curve that, when applied to all obligations of the plan, will exactly match the previously determined present value.
As part of its evaluation of the pension and other postretirement assumptions in 2011, the Company revised its assumptions for mortality and healthcare cost trends. The mortality assumption was enhanced to incorporate generational white and blue collar mortality trends. The generational tables take into consideration increases in plan participant longevity resulting in less significant increases in plan obligations in the future. This assumption change resulted in increases to 2011’s pension obligation and other postretirement obligation by approximately $17.5 million and $1.4 million, respectively. Also in 2011, the healthcare cost trend rate was increased to 8.5% based on the continued rise in healthcare costs, which resulted in an increase to the other postretirement obligation by approximately $0.9 million. These increases in the obligation are reflected in the amounts recognized in the summarized information for Under Funded benefits in actuarial losses.
The Company’s assumption for the Expected Return on Plan Assets is primarily based on the determination of an expected return for its current portfolio. This determination is made using assumptions for return and volatility of the portfolio. Asset class assumptions are set using a combination of empirical and forward-looking analysis. To the extent that historical results have been affected by unsustainable trends or events, the effects of those trends are quantified and removed. The Company applies a variety of models for filtering historical data and isolating the fundamental characteristics of asset classes. These models provide empirical return estimates for each asset class, which are then reviewed and combined with a qualitative assessment of long term relationships between asset classes before a return estimate is finalized. This provides an additional means for correcting for the effect of unrealistic or unsustainable short-term valuations or trends, resulting in return levels and behavior the Company believes is more likely to prevail over long periods.
Increasing the assumed healthcare trend rate by 1% would increase the benefit obligation by $4.6 million and would increase the 2012 benefit expense by $0.3 million. Decreasing the trend rate by 1% would decrease the benefit obligation by $4.0 million and would decrease the 2012 benefit expense by $0.2 million.
The accumulated benefit obligation for all U.S. and foreign defined benefit pension plans was $396.7 million and $393.4 million for 2012 and 2011, respectively.
The projected benefit obligation, accumulated benefit obligation, and fair value of plan assets for U.S. and foreign plans with accumulated benefit obligations in excess of plan assets were $397.2 million, $396.7 million and $276.9 million, respectively for 2012 and $393.0 million, $392.7 million and $242.6 million, respectively, for 2011.
The Company’s investment objective is to achieve an enhanced long-term rate of return on plan assets, subject to a prudent level of portfolio risk, for the purpose of enhancing the security of benefits for participants. These investments are held primarily in equity and fixed income mutual funds. The Company’s other investments are largely comprised of a hedge fund of funds and a structured credit fund. The equity funds are diversified in terms of domestic and international equity securities, as well as small, middle and large capitalization stocks. The domestic mutual funds held in the plans are subject to the diversification standards and industry limitations on concentration of holdings set forth in the Investment Company Act of 1940, as amended. The Company’s target allocation percentage is as follows: equity securities (45%); fixed-income securities (35%) and other securities (20%). The portfolio allocation was changed during 2012. The changes increase diversification of the portfolio and reduce expected variability of the portfolio returns, while maintaining the same expected return level. The new
F-46
Table of Contents
TELEFLEX INCORPORATED AND SUBSIDIARIES
NOTES TO CONSOLIDATED FINANCIAL STATEMENTS — (Continued)
composition is expected to bring a better balance of return and risk expectations of the pension plan. Equity funds are held for their expected return over inflation. Fixed-income funds are held for diversification relative to equities and as a partial hedge of interest rate risk to plan liabilities. The other investments are held to further diversify assets within the plans and are designed to provide a mix of equity and bond like return with a bond like risk profile. The plans may also hold cash to meet liquidity requirements. Actual performance may not be consistent with the respective investment strategies. Investment risks and returns are measured and monitored on an on-going basis through annual liability measurements and investment portfolio reviews to determine whether the asset allocation targets continue to represent an appropriate balance of expected risk and reward.
The fair values of the Company’s pension plan assets at December 31, 2012 by asset category are as follows:
| Fair Value Measurements at 12/31/12 | ||||||||||||||||
|
Asset Category (a) |
Total |
Quoted Prices in
Active Markets for Identical Assets (Level 1) |
Significant
Observable Inputs (Level 2) |
Significant
Unobservable Inputs (Level 3) |
||||||||||||
| (Dollars in thousands) | ||||||||||||||||
|
Cash |
$ | 408 | $ | 408 | $ | — | $ | — | ||||||||
|
Money market funds |
361 | 361 | — | — | ||||||||||||
|
Equity securities: |
||||||||||||||||
|
Managed volatility (b) |
66,413 | 66,413 | — | — | ||||||||||||
|
U.S. small/mid-cap equity (d) |
16,543 | 16,543 | — | — | ||||||||||||
|
World Equity (excluding United States) (e) |
27,257 | 27,257 | — | — | ||||||||||||
|
Common Equity Securities — Teleflex Incorporated |
8,336 | 8,336 | — | — | ||||||||||||
|
Diversified United Kingdom Equity |
6,681 | 6,681 | — | — | ||||||||||||
|
Diversified Global (excluding United Kingdom) |
3,267 | 3,267 | — | — | ||||||||||||
|
Fixed income securities: |
||||||||||||||||
|
Long duration bond fund (f) |
73,370 | 73,370 | — | — | ||||||||||||
|
High yield bond fund (g) |
10,896 | 10,896 | — | — | ||||||||||||
|
Emerging markets debt fund (h) |
8,453 | 8,453 | — | — | ||||||||||||
|
Corporate, government and foreign bonds |
5,675 | — | 5,675 | — | ||||||||||||
|
Asset backed — home loans |
1,005 | — | 1,005 | — | ||||||||||||
|
Other types of investments: |
||||||||||||||||
|
Structured credit (i) |
26,828 | — | — | 26,828 | ||||||||||||
|
Hedge fund of funds (j) |
21,365 | — | — | 21,365 | ||||||||||||
|
Other |
5 | — | — | 5 | ||||||||||||
|
|
|
|
|
|
|
|
|
|||||||||
|
Total |
$ | 276,863 | $ | 221,985 | $ | 6,680 | $ | 48,198 | ||||||||
|
|
|
|
|
|
|
|
|
|||||||||
F-47
Table of Contents
TELEFLEX INCORPORATED AND SUBSIDIARIES
NOTES TO CONSOLIDATED FINANCIAL STATEMENTS — (Continued)
The fair values of the Company’s pension plan assets at December 31, 2011 by asset category are as follows:
| Fair Value Measurements at 12/31/11 | ||||||||||||||||
|
Asset Category (a) |
Total |
Quoted Prices in
Active Markets for Identical Assets (Level 1) |
Significant
Observable Inputs (Level 2) |
Significant
Unobservable Inputs (Level 3) |
||||||||||||
| (Dollars in thousands) | ||||||||||||||||
|
Cash |
$ | 432 | $ | 432 | $ | — | $ | — | ||||||||
|
Money market funds |
2,987 | 2,987 | — | — | ||||||||||||
|
Equity securities: |
||||||||||||||||
|
U.S. large-cap disciplined equity (c) |
67,089 | 67,089 | — | — | ||||||||||||
|
U.S. small/mid-cap equity (d) |
18,290 | 18,290 | — | — | ||||||||||||
|
World Equity (excluding United States) (e) |
42,260 | 42,260 | — | — | ||||||||||||
|
Common Equity Securities — Teleflex Incorporated |
7,165 | 7,165 | — | — | ||||||||||||
|
Diversified United Kingdom Equity |
5,681 | 5,681 | — | — | ||||||||||||
|
Diversified Global (excluding United Kingdom) |
2,860 | 2,860 | — | — | ||||||||||||
|
Fixed income securities: |
||||||||||||||||
|
Long duration bond fund (f) |
71,057 | 71,057 | — | — | ||||||||||||
|
Corporate, government and foreign bonds |
2,573 | — | 2,573 | — | ||||||||||||
|
Asset backed — home loans |
1,008 | — | 1,008 | — | ||||||||||||
|
Other types of investments: |
||||||||||||||||
|
Hedge fund of funds (j) |
20,624 | — | — | 20,624 | ||||||||||||
|
General Fund — Japan |
767 | — | 767 | — | ||||||||||||
|
Other |
531 | — | — | 531 | ||||||||||||
|
|
|
|
|
|
|
|
|
|||||||||
|
Total |
$ | 243,324 | $ | 217,821 | $ | 4,348 | $ | 21,155 | ||||||||
|
|
|
|
|
|
|
|
|
|||||||||
| (a) | Information on asset categories described in notes (b)-(j) is derived from prospectuses and other material provided by the respective funds comprising the respective asset categories. |
| (b) | This category comprises mutual funds that invest in securities of U.S. and non-U.S. companies of all capitalization ranges that exhibit relatively low volatility. |
| (c) | This category comprises a mutual fund that invests at least 80% of its net assets in equity securities of large companies. These securities include common stocks, preferred stocks, warrants, exchange traded funds based on a large cap equity index and derivative instruments whose value is based on an underlying equity security or a basket of equity securities. The fund invests primarily in common stocks of U.S. companies with market capitalizations in the range of companies in the S&P 500 Composite Stock Price Index (S&P 500 Index). |
| (d) | This category comprises a mutual fund that invests at least 80% of its net assets in equity securities of small and mid-sized companies. The fund invests in common stocks or exchange traded funds holding common stock of U.S. companies with market capitalizations in the range of companies in the Russell 2500 Index. |
| (e) |
This category comprises a mutual fund that invests at least 80% of its net assets in equity securities of foreign companies. These securities may include common stocks, preferred stocks, warrants, exchange traded funds based on an international equity index and derivative instruments whose value is based on an international equity index and derivative instruments whose value is based on an underlying equity security or a basket of equity securities. The fund invests in securities of foreign issuers located in developed and emerging market countries. |
F-48
Table of Contents
TELEFLEX INCORPORATED AND SUBSIDIARIES
NOTES TO CONSOLIDATED FINANCIAL STATEMENTS — (Continued)
| However, the fund will not invest more than 30% of its assets in the common stocks or other equity securities of issuers located in emerging market countries. |
| (f) | This category comprises a mutual fund that invests in instruments or derivatives having economic characteristics similar to fixed income securities. The fund invests in investment grade fixed income instruments, including securities issued or guaranteed by the U.S. Government and its agencies and instrumentalities, corporate bonds, asset-backed securities, exchange traded funds, mortgage-backed securities and collateralized mortgage-backed securities. The fund invests primarily in long duration government and corporate fixed income securities, and uses derivative instruments, including interest rate swap agreements and Treasury futures contracts, for the purpose of managing the overall duration and yield curve exposure of the Fund’s portfolio of fixed income securities. |
| (g) | This category comprises a mutual fund that invests at least 80% of its net assets in higher-yielding fixed income securities, including corporate bonds and debentures, convertible and preferred securities and zero coupon obligations. |
| (h) | This category comprises a mutual fund that invests at least 80% of its net assets in fixed income securities of emerging market issuers, primarily in U.S. dollar-denominated debt of foreign governments, government-related and corporate issuers in emerging market countries and entities organized to restructure the debt of those issuers. |
| (i) | This category comprises of a fund that invests primarily in collateralized debt obligations (“CDOs”) and other structured credit vehicles. The fund investments may include fixed income securities, loan participants, credit-linked notes, medium-term notes, pooled investment vehicles and derivative instruments. |
| (j) | This category comprises a hedge fund that invests in various other hedge funds. As of December 31, 2012 and December 31, 2011: |
| • |
approximately 22% and 20%, respectively, of the assets of the hedge fund were invested in equity hedge based funds, including equity long/short and equity market neutral strategies; |
| • |
approximately 30% and 27%, respectively, of the assets were held in tactical/directional based funds, including global macro, long/short equity, commodity and systematic quantitative strategies; |
| • |
approximately 25% and 29%, respectively, of the assets were held in relative value based funds, including convertible and fixed income arbitrage, credit long/short and volatility arbitrage strategies; |
| • |
approximately 17% and 17%, respectively, of the assets were held in funds with an event driven strategy; and |
| • |
approximately 6% and 7%, respectively, of the assets were held in cash. |
The following table provides a reconciliation of changes in Level 3 pension assets measured at fair value on a recurring basis from December 31, 2010 through December 31, 2012:
|
Hedge Fund
of Funds |
Structured
Credit |
Other
Investments |
||||||||||
| (Dollars in thousands) | ||||||||||||
|
Balance at December 31, 2010 |
$ | 20,689 | $ | — | $ | 498 | ||||||
|
Actual return on assets |
(65 | ) | — | 25 | ||||||||
|
Foreign currency adjustment |
— | — | 8 | |||||||||
|
|
|
|
|
|
|
|||||||
|
Balance at December 31, 2011 |
20,624 | — | 531 | |||||||||
|
Purchases |
— | 26,000 | — | |||||||||
|
Sales/redemptions |
— | — | (509 | ) | ||||||||
|
Actual return on assets |
741 | 828 | (35 | ) | ||||||||
|
Foreign currency adjustment |
— | — | 18 | |||||||||
|
|
|
|
|
|
|
|||||||
|
Balance at December 31, 2012 |
$ | 21,365 | $ | 26,828 | $ | 5 | ||||||
|
|
|
|
|
|
|
|||||||
F-49
Table of Contents
TELEFLEX INCORPORATED AND SUBSIDIARIES
NOTES TO CONSOLIDATED FINANCIAL STATEMENTS — (Continued)
The Company’s contributions to U.S. and foreign pension plans during 2013 are expected to be approximately $7.1 million. Contributions to postretirement healthcare plans during 2013 are expected to be approximately $3.2 million.
The Company’s expected benefit payments for U.S. and foreign plans for each of the five succeeding years and the aggregate of the five years thereafter, net of the annual average Medicare Part D subsidy of approximately $0.3 million, is as follows:
| Pension | Other Benefits | |||||||
| (Dollars in thousands) | ||||||||
|
2013 |
$ | 16,316 | $ | 3,199 | ||||
|
2014 |
16,625 | 3,314 | ||||||
|
2015 |
17,249 | 3,369 | ||||||
|
2016 |
17,949 | 3,511 | ||||||
|
2017 |
18,540 | 3,539 | ||||||
|
Years 2018 — 2022 |
103,552 | 17,865 | ||||||
The Company maintains a number of defined contribution savings plans covering eligible U.S. and non-U.S. employees. The Company partially matches employee contributions. Costs related to these plans were $10.1 million, $10.2 million and $9.0 million for 2012, 2011 and 2010, respectively.
Product warranty liability: The Company warrants to the original purchaser of certain of its products that it will, at its option, repair or replace, without charge, such products if they fail due to a manufacturing defect. Warranty periods vary by product. The Company has recourse provisions for certain products that would enable recovery from third parties for amounts paid under the warranty. The Company accrues for product warranties when, based on available information, it is probable that customers will make claims under warranties relating to products that have been sold, and a reasonable estimate of the costs (based on historical claims experience relative to sales) can be made. Set forth below is a reconciliation of the Company’s estimated product warranty liability for 2012:
| Product Warranty | ||||
| (Dollars in thousands) | ||||
|
Balance — December 31, 2011 |
$ | 7,935 | ||
|
Accrued for warranties issued in 2012 |
94 | |||
|
Settlements (cash and in kind) (a) |
(6,313 | ) | ||
|
Accruals related to pre-existing warranties (a) |
(1,319 | ) | ||
|
Translation |
75 | |||
|
|
|
|||
|
Balance — December 31, 2012 |
$ | 472 | ||
|
|
|
|||
| (a) | Including those related to divested businesses. See Note 19, “Divestiture-related activities” for additional information. |
Operating leases: The Company uses various leased facilities and equipment in its operations. The lease terms for these assets vary depending on the lease agreement. At December 31, 2012, the Company had no residual value guarantees related to its operating leases.
F-50
Table of Contents
TELEFLEX INCORPORATED AND SUBSIDIARIES
NOTES TO CONSOLIDATED FINANCIAL STATEMENTS — (Continued)
Future minimum lease payments as of December 31, 2012 under noncancelable operating leases are as follows:
|
Future Lease
Payments |
||||
| (Dollars in thousands) | ||||
|
2013 |
$ | 21,900 | ||
|
2014 |
18,200 | |||
|
2015 |
13,300 | |||
|
2016 |
10,800 | |||
|
2017 and thereafter |
44,600 | |||
Rental expense under operating leases was $24.0 million, $26.3 million and $24.9 million in 2012, 2011 and 2010, respectively.
Environmental: The Company is subject to contingencies as a result of environmental laws and regulations that in the future may require the Company to take further action to correct the effects on the environment of prior disposal practices or releases of chemical or petroleum substances by the Company or other parties. Much of this liability results from the U.S. Comprehensive Environmental Response, Compensation and Liability Act (“CERCLA”), often referred to as Superfund, the U.S. Resource Conservation and Recovery Act (“RCRA”) and similar state laws. These laws require the Company to undertake certain investigative and remedial activities at sites where the Company conducts or once conducted operations or at sites where Company-generated waste was disposed.
Remediation activities vary substantially in duration and cost from site to site. These activities, and their associated costs, depend on the mix of unique site characteristics, evolving remediation technologies, the regulatory agencies involved and their enforcement policies, as well as the presence or absence of other potentially responsible parties. At December 31, 2012, the Company has recorded approximately $1.9 million in accrued liabilities and approximately $6.9 million in other liabilities relating to these matters. Considerable uncertainty exists with respect to these liabilities and, if adverse changes in circumstances occur, potential liability may exceed the amount accrued as of December 31, 2012. The time frame over which the accrued amounts may be paid out, based on past history, is estimated to be 15-20 years.
Litigation: The Company is a party to various lawsuits and claims arising in the normal course of business. These lawsuits and claims include actions involving product liability, intellectual property, employment and environmental matters. As of December 31, 2012, the Company has recorded reserves of approximately $11.1 million in connection with such contingencies, representing its best estimate of the cost within the range of estimated possible loss that will be incurred to resolve these matters. Based on information currently available, advice of counsel, established reserves and other resources, the Company does not believe that any such actions are likely to be, individually or in the aggregate, material to its business, financial condition, results of operations or liquidity. However, in the event of unexpected further developments, it is possible that the ultimate resolution of these matters, or other similar matters, if unfavorable, may be materially adverse to the Company’s business, financial condition, results of operations or liquidity. Legal costs such as outside counsel fees and expenses are charged to expense in the period incurred.
Other: The Company has various purchase commitments for materials, supplies and items of permanent investment incident to the ordinary conduct of business. On average, such commitments are not at prices in excess of current market prices.
F-51
Table of Contents
TELEFLEX INCORPORATED AND SUBSIDIARIES
NOTES TO CONSOLIDATED FINANCIAL STATEMENTS — (Continued)
In the first quarter of 2012, as a result of a reorganization of the Company’s internal business unit reporting structure and related internal financial reporting, the Company changed its segment reporting from a single operating segment to four operating segments, three of which are geographically based. As initially changed, the three geographic segments were North America, EMEA (representing the Company’s operations in Europe, the Middle East and Africa) and AJLA (representing Asian and Latin America operations). The Company’s fourth reportable segment is comprised of the Company’s OEM businesses. During the third quarter of 2012, due to changes in the Company’s management and internal reporting structure, the Company’s Latin America operations were moved from the AJLA Segment into the North America Segment. As a result of this change, the North America Segment is now referred to as the Americas Segment and the AJLA Segment is now referred to as the Asia Segment. The change did not affect the Company’s reporting unit structure. All prior comparative periods have been restated to reflect this change.
An operating segment is a component of the Company (a) that engages in business activities from which it may earn revenues and incur expenses, (b) whose operating results are regularly reviewed by the Company’s chief operating decision maker to make decisions about resources to be allocated to the segment and to assess its performance, and (c) for which discrete financial information is available. Based on these criteria, the Company identified its four operating segments, which also comprise its four reportable segments.
The Company’s Americas, EMEA and Asia Segments design, manufacture and distribute medical devices primarily used in critical care, surgical applications and cardiac care and generally serve two end markets: (1) hospitals and healthcare providers, and (2) home care. The products of these segments are most widely used in the acute care setting for a range of diagnostic and therapeutic procedures and in general and specialty surgical applications. The Company’s OEM Segment designs, manufactures and supplies devices and instruments for other medical device manufacturers.
The following tables present the Company’s segment results for the years ended December 31, 2012, December 31, 2011 and December 31, 2010:
| Year Ended December 31, 2012 | ||||||||||||||||||||
| Segment Results | Americas | EMEA | Asia | OEM | Totals | |||||||||||||||
| (Dollars in thousands) | ||||||||||||||||||||
|
Segment net revenues from external customers |
$ | 726,810 | $ | 510,248 | $ | 173,721 | $ | 140,230 | $ | 1,551,009 | ||||||||||
|
Segment depreciation and amortization |
64,174 | 22,974 | 3,653 | 4,083 | 94,884 | |||||||||||||||
|
Segment operating profit (1) |
88,502 | 56,245 | 61,126 | 31,585 | 237,458 | |||||||||||||||
|
Segment assets |
1,953,393 | 985,069 | 245,578 | 33,236 | 3,217,276 | |||||||||||||||
|
Segment expenditures for property, plant and equipment |
32,023 | 14,717 | 472 | 10,830 | 58,042 | |||||||||||||||
|
Intersegment revenues |
135,499 | 76,967 | 4,660 | 422 | ||||||||||||||||
F-52
Table of Contents
TELEFLEX INCORPORATED AND SUBSIDIARIES
NOTES TO CONSOLIDATED FINANCIAL STATEMENTS — (Continued)
| Year Ended December 31, 2011 | ||||||||||||||||||||
| Segment Results | Americas | EMEA | Asia | OEM | Totals | |||||||||||||||
| (Dollars in thousands) | ||||||||||||||||||||
|
Segment net revenues from external customers |
$ | 688,036 | $ | 525,277 | $ | 149,585 | $ | 129,630 | $ | 1,492,528 | ||||||||||
|
Segment depreciation and amortization |
65,580 | 23,419 | 3,848 | 3,649 | 96,496 | |||||||||||||||
|
Segment operating profit (1) |
86,355 | 75,883 | 49,229 | 24,690 | 236,157 | |||||||||||||||
|
Segment assets |
2,078,850 | 789,978 | 199,684 | 27,240 | 3,095,752 | |||||||||||||||
|
Segment expenditures for property, plant and equipment |
23,203 | 11,843 | 804 | 5,565 | 41,415 | |||||||||||||||
|
Intersegment revenues |
137,499 | 67,199 | 1 | 464 | ||||||||||||||||
| Year Ended December 31, 2010 | ||||||||||||||||||||
| Segment Results | Americas | EMEA | Asia | OEM | Totals | |||||||||||||||
| (Dollars in thousands) | ||||||||||||||||||||
|
Segment net revenues from external customers |
$ | 669,510 | $ | 479,247 | $ | 130,601 | $ | 118,364 | $ | 1,397,722 | ||||||||||
|
Segment depreciation and amortization |
63,996 | 19,486 | 2,979 | 3,279 | 89,740 | |||||||||||||||
|
Segment operating profit (1) |
97,219 | 72,782 | 40,872 | 21,951 | 232,824 | |||||||||||||||
|
Segment assets |
2,074,407 | 748,180 | 169,435 | 26,155 | 3,018,177 | |||||||||||||||
|
Segment expenditures for property, plant and equipment |
18,326 | 6,364 | 345 | 2,872 | 27,907 | |||||||||||||||
|
Intersegment revenues |
112,023 | 64,272 | 19 | 437 | ||||||||||||||||
| (1) | Segment operating profit includes a segment’s net revenues from external customers reduced by its cost of goods sold, selling, general and administrative expenses, research and development expenses and an allocation of corporate expenses. Segment operating profit excludes goodwill impairment charges, restructuring and impairment charges, net (gain) loss on sales of businesses and assets, interest income and expense, loss on extinguishment of debt and taxes on income. |
The following tables present reconciliations of segment results to the Company’s consolidated results for the years ended December 31, 2012, December 31, 2011 and December 31, 2010:
Reconciliation of Segment Operating Profit to Income (Loss) from Continuing Operations Before Interest, Loss on Extinguishments of Debt and Taxes
| Year Ended | ||||||||||||
| 2012 | 2011 | 2010 | ||||||||||
| (Dollars in thousands) | ||||||||||||
|
Segment operating profit |
$ | 237,458 | $ | 236,157 | $ | 232,824 | ||||||
|
Goodwill impairment |
(332,128 | ) | — | — | ||||||||
|
Restructuring and other impairment charges |
(3,037 | ) | (6,005 | ) | (2,875 | ) | ||||||
|
Net gain (loss) on sales of businesses and assets |
332 | (582 | ) | 341 | ||||||||
|
|
|
|
|
|
|
|||||||
|
Income (loss) from continuing operations before interest, loss on extinguishments of debt and taxes |
$ | (97,375 | ) | $ | 229,570 | $ | 230,290 | |||||
|
|
|
|
|
|
|
|||||||
F-53
Table of Contents
TELEFLEX INCORPORATED AND SUBSIDIARIES
NOTES TO CONSOLIDATED FINANCIAL STATEMENTS — (Continued)
Reconciliation of Segment Assets to Consolidated Total Assets
| Year Ended | ||||||||||||
| 2012 | 2011 | 2010 | ||||||||||
| (Dollars in thousands) | ||||||||||||
|
Segment assets |
$ | 3,217,276 | $ | 3,095,752 | $ | 3,018,177 | ||||||
|
Corporate assets |
514,258 | 767,231 | 369,668 | |||||||||
|
Assets of businesses divested |
— | 53,218 | 247,351 | |||||||||
|
Assets held for sale |
7,963 | 7,902 | 7,959 | |||||||||
|
|
|
|
|
|
|
|||||||
|
Total assets |
$ | 3,739,497 | $ | 3,924,103 | $ | 3,643,155 | ||||||
|
|
|
|
|
|
|
|||||||
Reconciliation of Segment Expenditures for Property, Plant and Equipment to Consolidated Total Expenditures for Property, Plant and Equipment
| Year Ended | ||||||||||||
| 2012 | 2011 | 2010 | ||||||||||
| (Dollars in thousands) | ||||||||||||
|
Segment expenditures for property, plant and equipment |
$ | 58,042 | $ | 41,415 | $ | 27,907 | ||||||
|
Corporate expenditures for property, plant and equipment |
7,352 | 3,167 | 1,423 | |||||||||
|
|
|
|
|
|
|
|||||||
|
Total expenditures for property, plant and equipment |
$ | 65,394 | $ | 44,582 | $ | 29,330 | ||||||
|
|
|
|
|
|
|
|||||||
The following table provides total net revenues and total net property, plant and equipment by geographic region for the years ended December 31, 2012, December 31, 2011 and December 31, 2010:
| Year Ended | ||||||||||||
| 2012 | 2011 | 2010 | ||||||||||
| (Dollars in thousands) | ||||||||||||
|
Net revenues (based on business unit location): |
||||||||||||
|
United States |
$ | 789,771 | $ | 762,957 | $ | 752,074 | ||||||
|
Other Americas |
53,665 | 55,228 | 49,557 | |||||||||
|
Germany |
123,355 | 128,072 | 120,033 | |||||||||
|
Other Europe |
393,627 | 403,274 | 364,617 | |||||||||
|
All Other |
190,591 | 142,997 | 111,441 | |||||||||
|
|
|
|
|
|
|
|||||||
| $ | 1,551,009 | $ | 1,492,528 | $ | 1,397,722 | |||||||
|
|
|
|
|
|
|
|||||||
|
Net property, plant and equipment: |
||||||||||||
|
United States |
$ | 180,833 | $ | 159,042 | $ | 165,287 | ||||||
|
Other Americas |
12,828 | 12,492 | 25,988 | |||||||||
|
Germany |
12,197 | 8,549 | 19,630 | |||||||||
|
Other Europe |
58,843 | 53,775 | 55,848 | |||||||||
|
All Other |
33,244 | 18,054 | 20,952 | |||||||||
|
|
|
|
|
|
|
|||||||
| $ | 297,945 | $ | 251,912 | $ | 287,705 | |||||||
|
|
|
|
|
|
|
|||||||
In June 2011, Teleflex Incorporated (referred to below as “Parent Company”) issued $250 million of 6.875% senior subordinated notes through a registered public offering. The notes are guaranteed, jointly and severally, by certain of the Parent Company’s subsidiaries (each, a “Guarantor Subsidiary”
F-54
Table of Contents
TELEFLEX INCORPORATED AND SUBSIDIARIES
NOTES TO CONSOLIDATED FINANCIAL STATEMENTS — (Continued)
and collectively, the “Guarantor Subsidiaries”). The guarantees are full and unconditional, subject to certain customary release provisions. Each Guarantor Subsidiary is 100% owned by the Parent Company. The Company’s condensed consolidated statements of income (loss) and comprehensive income (loss) and condensed consolidated statements of cash flows for the years ended December 31, 2012, December 31, 2011 and December 31, 2010 and condensed consolidated balance sheets as of December 31, 2012 and December 31, 2011, each of which are set forth below, provide consolidated information for:
| a. | Parent Company, the issuer of the guaranteed obligations; |
| b. | Guarantor Subsidiaries, on a combined basis; |
| c. | Non-guarantor subsidiaries, on a combined basis; and |
| d. | Parent Company and its subsidiaries on a consolidated basis. |
The same accounting policies as described in the consolidated financial statements are used by each entity in the condensed consolidated financial information, except for the use by the Parent Company and Guarantor Subsidiaries of the equity method of accounting to reflect ownership interests in subsidiaries which are eliminated upon consolidation.
Consolidating entries and eliminations in the following consolidated financial statements represent adjustments to (a) eliminate intercompany transactions between or among the Parent Company, the Guarantor Subsidiaries and the Non-guarantor subsidiaries, (b) eliminate the investments in subsidiaries and (c) record consolidating entries.
F-55
Table of Contents
TELEFLEX INCORPORATED AND SUBSIDIARIES
NOTES TO CONSOLIDATED FINANCIAL STATEMENTS — (Continued)
TELEFLEX INCORPORATED AND SUBSIDIARIES CONDENSED CONSOLIDATED STATEMENTS OF INCOME (LOSS) AND COMPREHENSIVE INCOME (LOSS)
| Year Ended December 31, 2012 | ||||||||||||||||||||
|
Parent
Company |
Guarantor
Subsidiaries |
Non-Guarantor
Subsidiaries |
Eliminations |
Condensed
Consolidated |
||||||||||||||||
| (Dollars in thousands) | ||||||||||||||||||||
|
Net revenues |
$ | — | $ | 950,888 | $ | 833,903 | $ | (233,782 | ) | $ | 1,551,009 | |||||||||
|
Cost of goods sold |
— | 552,726 | 482,881 | (232,823 | ) | 802,784 | ||||||||||||||
|
|
|
|
|
|
|
|
|
|
|
|||||||||||
|
Gross profit |
— | 398,162 | 351,022 | (959 | ) | 748,225 | ||||||||||||||
|
Selling, general and administrative expenses |
34,657 | 259,476 | 160,089 | 267 | 454,489 | |||||||||||||||
|
Research and development expenses |
— | 48,649 | 7,629 | — | 56,278 | |||||||||||||||
|
Goodwill impairment |
— | 331,779 | 349 | — | 332,128 | |||||||||||||||
|
Restructuring and other impairment charges |
— | 598 | 2,439 | — | 3,037 | |||||||||||||||
|
Net gain on sales of businesses and assets |
(116,193 | ) | (149,240 | ) | (332 | ) | 265,433 | (332 | ) | |||||||||||
|
|
|
|
|
|
|
|
|
|
|
|||||||||||
|
Income (loss) from continuing operations before interest and taxes |
81,536 | (93,100 | ) | 180,848 | (266,659 | ) | (97,375 | ) | ||||||||||||
|
Interest expense |
143,653 | (81,328 | ) | 7,240 | — | 69,565 | ||||||||||||||
|
Interest income |
(372 | ) | (23 | ) | (1,176 | ) | — | (1,571 | ) | |||||||||||
|
|
|
|
|
|
|
|
|
|
|
|||||||||||
|
Income (loss) from continuing operations before taxes |
(61,745 | ) | (11,749 | ) | 174,784 | (266,659 | ) | (165,369 | ) | |||||||||||
|
Taxes (benefit) on income (loss) from continuing operations |
(63,806 | ) | 45,068 | 35,670 | (519 | ) | 16,413 | |||||||||||||
|
Equity in net income (loss) of consolidated subsidiaries |
(190,742 | ) | 124,918 | — | 65,824 | — | ||||||||||||||
|
|
|
|
|
|
|
|
|
|
|
|||||||||||
|
Income (loss) from continuing operations |
(188,681 | ) | 68,101 | 139,114 | (200,316 | ) | (181,782 | ) | ||||||||||||
|
|
|
|
|
|
|
|
|
|
|
|||||||||||
|
Operating income (loss) from discontinued operations |
(2,647 | ) | (9,179 | ) | 2,619 | — | (9,207 | ) | ||||||||||||
|
Taxes (benefit) on income (loss) from discontinued operations |
(1,271 | ) | (129 | ) | (487 | ) | — | (1,887 | ) | |||||||||||
|
|
|
|
|
|
|
|
|
|
|
|||||||||||
|
Income (loss) from discontinued operations |
(1,376 | ) | (9,050 | ) | 3,106 | — | (7,320 | ) | ||||||||||||
|
|
|
|
|
|
|
|
|
|
|
|||||||||||
|
Net income (loss) |
(190,057 | ) | 59,051 | 142,220 | (200,316 | ) | (189,102 | ) | ||||||||||||
|
Less: Income from continuing operations attributable to noncontrolling interests |
— | — | 955 | — | 955 | |||||||||||||||
|
|
|
|
|
|
|
|
|
|
|
|||||||||||
|
Net income (loss) attributable to common shareholders |
(190,057 | ) | 59,051 | 141,265 | (200,316 | ) | (190,057 | ) | ||||||||||||
|
Other comprehensive income attributable to common shareholders |
27,305 | 10,475 | 8,907 | (19,382 | ) | 27,305 | ||||||||||||||
|
|
|
|
|
|
|
|
|
|
|
|||||||||||
|
Comprehensive income (loss) attributable to common shareholders |
$ | (162,752 | ) | $ | 69,526 | $ | 150,172 | $ | (219,698 | ) | $ | (162,752 | ) | |||||||
|
|
|
|
|
|
|
|
|
|
|
|||||||||||
F-56
Table of Contents
TELEFLEX INCORPORATED AND SUBSIDIARIES
NOTES TO CONSOLIDATED FINANCIAL STATEMENTS — (Continued)
| Year Ended December 31, 2011 | ||||||||||||||||||||
|
Parent
Company |
Guarantor
Subsidiaries |
Non-Guarantor
Subsidiaries |
Eliminations |
Condensed
Consolidated |
||||||||||||||||
| (Dollars in thousands) | ||||||||||||||||||||
|
Net revenues |
$ | — | $ | 923,000 | $ | 804,867 | $ | (235,339 | ) | $ | 1,492,528 | |||||||||
|
Cost of goods sold |
— | 552,606 | 467,711 | (236,567 | ) | 783,750 | ||||||||||||||
|
|
|
|
|
|
|
|
|
|
|
|||||||||||
|
Gross profit |
— | 370,394 | 337,156 | 1,228 | 708,778 | |||||||||||||||
|
Selling, general and administrative expenses |
39,614 | 231,490 | 152,573 | 232 | 423,909 | |||||||||||||||
|
Research and development expenses |
— | 41,648 | 7,064 | — | 48,712 | |||||||||||||||
|
Restructuring and other impairment charges |
11 | 4,615 | 1,379 | — | 6,005 | |||||||||||||||
|
Net loss on sales of businesses and assets |
— | — | 582 | — | 582 | |||||||||||||||
|
|
|
|
|
|
|
|
|
|
|
|||||||||||
|
Income (loss) from continuing operations before interest, loss on extinguishments of debt and taxes |
(39,625 | ) | 92,641 | 175,558 | 996 | 229,570 | ||||||||||||||
|
Interest expense |
138,460 | (68,926 | ) | 783 | — | 70,317 | ||||||||||||||
|
Interest income |
(384 | ) | (67 | ) | (809 | ) | — | (1,260 | ) | |||||||||||
|
Loss on extinguishments of debt |
15,413 | — | — | — | 15,413 | |||||||||||||||
|
|
|
|
|
|
|
|
|
|
|
|||||||||||
|
Income (loss) from continuing operations before taxes |
(193,114 | ) | 161,634 | 175,584 | 996 | 145,100 | ||||||||||||||
|
Taxes (benefit) on income (loss) from continuing operations |
(73,608 | ) | 52,667 | 47,044 | (325 | ) | 25,778 | |||||||||||||
|
Equity in net income of consolidated subsidiaries |
473,311 | 397,131 | — | (870,442 | ) | — | ||||||||||||||
|
|
|
|
|
|
|
|
|
|
|
|||||||||||
|
Income from continuing operations |
353,805 | 506,098 | 128,540 | (869,121 | ) | 119,322 | ||||||||||||||
|
|
|
|
|
|
|
|
|
|
|
|||||||||||
|
Operating income (loss) from discontinued operations |
(55,872 | ) | 40,287 | 308,268 | — | 292,683 | ||||||||||||||
|
Taxes (benefit) on income (loss) from discontinued operations |
(25,396 | ) | 88,582 | 23,852 | — | 87,038 | ||||||||||||||
|
|
|
|
|
|
|
|
|
|
|
|||||||||||
|
Income (loss) from discontinued operations |
(30,476 | ) | (48,295 | ) | 284,416 | — | 205,645 | |||||||||||||
|
|
|
|
|
|
|
|
|
|
|
|||||||||||
|
Net income |
323,329 | 457,803 | 412,956 | (869,121 | ) | 324,967 | ||||||||||||||
|
Less: Income from continuing operations attributable to noncontrolling interests |
— | — | 1,021 | — | 1,021 | |||||||||||||||
|
Income from discontinued operations attributable to noncontrolling interest |
— | — | 617 | — | 617 | |||||||||||||||
|
|
|
|
|
|
|
|
|
|
|
|||||||||||
|
Net income attributable to common shareholders |
323,329 | 457,803 | 411,318 | (869,121 | ) | 323,329 | ||||||||||||||
|
Other comprehensive income (loss) attributable to common shareholders |
(107,473 | ) | (75,928 | ) | (75,737 | ) | 151,665 | (107,473 | ) | |||||||||||
|
|
|
|
|
|
|
|
|
|
|
|||||||||||
|
Comprehensive income attributable to common shareholders |
$ | 215,856 | $ | 381,875 | $ | 335,581 | $ | (717,456 | ) | $ | 215,856 | |||||||||
|
|
|
|
|
|
|
|
|
|
|
|||||||||||
F-57
Table of Contents
TELEFLEX INCORPORATED AND SUBSIDIARIES
NOTES TO CONSOLIDATED FINANCIAL STATEMENTS — (Continued)
| Year Ended December 31, 2010 | ||||||||||||||||||||
|
Parent
Company |
Guarantor
Subsidiaries |
Non-Guarantor
Subsidiaries |
Eliminations |
Condensed
Consolidated |
||||||||||||||||
| (Dollars in thousands) | ||||||||||||||||||||
|
Net revenues |
$ | — | $ | 893,671 | $ | 756,517 | $ | (252,466 | ) | $ | 1,397,722 | |||||||||
|
Cost of goods sold |
— | 504,802 | 459,698 | (245,617 | ) | 718,883 | ||||||||||||||
|
|
|
|
|
|
|
|
|
|
|
|||||||||||
|
Gross profit |
— | 388,869 | 296,819 | (6,849 | ) | 678,839 | ||||||||||||||
|
Selling, general and administrative expenses |
42,335 | 232,728 | 128,402 | 170 | 403,635 | |||||||||||||||
|
Research and development expenses |
— | 37,092 | 5,288 | — | 42,380 | |||||||||||||||
|
Restructuring and other impairment charges |
458 | 2,098 | 319 | — | 2,875 | |||||||||||||||
|
Net (gain) loss on sales of businesses and assets |
(420 | ) | 262 | (183 | ) | — | (341 | ) | ||||||||||||
|
|
|
|
|
|
|
|
|
|
|
|||||||||||
|
Income (loss) from continuing operations before interest, loss on extinguishments of debt and taxes |
(42,373 | ) | 116,689 | 162,993 | (7,019 | ) | 230,290 | |||||||||||||
|
Interest expense |
133,873 | (75,472 | ) | 21,388 | — | 79,789 | ||||||||||||||
|
Interest income |
(3 | ) | (141 | ) | (575 | ) | — | (719 | ) | |||||||||||
|
Loss on extinguishments of debt |
46,630 | — | — | — | 46,630 | |||||||||||||||
|
|
|
|
|
|
|
|
|
|
|
|||||||||||
|
Income (loss) from continuing operations before taxes |
(222,873 | ) | 192,302 | 142,180 | (7,019 | ) | 104,590 | |||||||||||||
|
Taxes (benefit) on income (loss) from continuing operations |
(84,729 | ) | 49,417 | 54,481 | (2,251 | ) | 16,918 | |||||||||||||
|
Equity in net income of consolidated subsidiaries |
323,824 | 135,392 | — | (459,216 | ) | — | ||||||||||||||
|
|
|
|
|
|
|
|
|
|
|
|||||||||||
|
Income from continuing operations |
185,680 | 278,277 | 87,699 | (463,984 | ) | 87,672 | ||||||||||||||
|
|
|
|
|
|
|
|
|
|
|
|||||||||||
|
Operating income from discontinued operations |
13,999 | 15,180 | 139,650 | — | 168,829 | |||||||||||||||
|
Taxes (benefit) on income from discontinued operations |
(1,415 | ) | 7,624 | 47,837 | — | 54,046 | ||||||||||||||
|
|
|
|
|
|
|
|
|
|
|
|||||||||||
|
Income from discontinued operations |
15,414 | 7,556 | 91,813 | — | 114,783 | |||||||||||||||
|
|
|
|
|
|
|
|
|
|
|
|||||||||||
|
Net income |
201,094 | 285,833 | 179,512 | (463,984 | ) | 202,455 | ||||||||||||||
|
Less: Income from continuing operations attributable to noncontrolling interests |
— | — | 861 | — | 861 | |||||||||||||||
|
Income from discontinued operations attributable to noncontrolling interest |
— | — | 500 | — | 500 | |||||||||||||||
|
|
|
|
|
|
|
|
|
|
|
|||||||||||
|
Net income attributable to common shareholders |
201,094 | 285,833 | 178,151 | (463,984 | ) | 201,094 | ||||||||||||||
|
Other comprehensive income (loss) attributable to common shareholders |
(17,760 | ) | (11,721 | ) | (27,334 | ) | 39,055 | (17,760 | ) | |||||||||||
|
|
|
|
|
|
|
|
|
|
|
|||||||||||
|
Comprehensive income attributable to common shareholders |
$ | 183,334 | $ | 274,112 | $ | 150,817 | $ | (424,929 | ) | $ | 183,334 | |||||||||
|
|
|
|
|
|
|
|
|
|
|
|||||||||||
F-58
Table of Contents
TELEFLEX INCORPORATED AND SUBSIDIARIES
NOTES TO CONSOLIDATED FINANCIAL STATEMENTS — (Continued)
TELEFLEX INCORPORATED AND SUBSIDIARIES
CONDENSED CONSOLIDATED BALANCE SHEETS
| December 31, 2012 | ||||||||||||||||||||
|
Parent
Company |
Guarantor
Subsidiaries |
Non-Guarantor
Subsidiaries |
Eliminations |
Condensed
Consolidated |
||||||||||||||||
| (Dollars in thousands) | ||||||||||||||||||||
| ASSETS | ||||||||||||||||||||
|
Current assets |
||||||||||||||||||||
|
Cash and cash equivalents |
$ | 70,860 | $ | 1,989 | $ | 264,190 | $ | — | $ | 337,039 | ||||||||||
|
Accounts receivable, net |
2,147 | 774,280 | 511,609 | (990,060 | ) | 297,976 | ||||||||||||||
|
Inventories, net |
— | 202,748 | 136,492 | (15,893 | ) | 323,347 | ||||||||||||||
|
Prepaid expenses and other current assets |
7,769 | 5,294 | 15,649 | — | 28,712 | |||||||||||||||
|
Prepaid taxes |
11,079 | — | 19,217 | (3,136 | ) | 27,160 | ||||||||||||||
|
Deferred tax assets |
13,987 | 27,130 | 6,810 | (1,045 | ) | 46,882 | ||||||||||||||
|
Assets held for sale |
— | 2,738 | 5,225 | — | 7,963 | |||||||||||||||
|
|
|
|
|
|
|
|
|
|
|
|||||||||||
|
Total current assets |
105,842 | 1,014,179 | 959,192 | (1,010,134 | ) | 1,069,079 | ||||||||||||||
|
Property, plant and equipment, net |
7,258 | 168,451 | 122,236 | — | 297,945 | |||||||||||||||
|
Goodwill |
— | 702,947 | 546,509 | — | 1,249,456 | |||||||||||||||
|
Intangibles assets, net |
— | 782,631 | 276,161 | — | 1,058,792 | |||||||||||||||
|
Investments in affiliates |
5,226,567 | 1,281,201 | 21,379 | (6,527,081 | ) | 2,066 | ||||||||||||||
|
Deferred tax assets |
59,644 | — | 3,197 | (62,545 | ) | 296 | ||||||||||||||
|
Other assets |
33,937 | 2,707,264 | 720,184 | (3,399,522 | ) | 61,863 | ||||||||||||||
|
|
|
|
|
|
|
|
|
|
|
|||||||||||
|
Total assets |
$ | 5,433,248 | $ | 6,656,673 | $ | 2,648,858 | $ | (10,999,282 | ) | $ | 3,739,497 | |||||||||
|
|
|
|
|
|
|
|
|
|
|
|||||||||||
| LIABILITIES AND EQUITY | ||||||||||||||||||||
|
Current liabilities |
||||||||||||||||||||
|
Current borrowings |
$ | — | $ | — | $ | 4,700 | $ | — | $ | 4,700 | ||||||||||
|
Accounts payable |
80,495 | 873,754 | 114,140 | (993,224 | ) | 75,165 | ||||||||||||||
|
Accrued expenses |
11,338 | 20,471 | 33,255 | — | 65,064 | |||||||||||||||
|
Current portion of contingent consideration |
— | 21,115 | 2,578 | — | 23,693 | |||||||||||||||
|
Payroll and benefit-related liabilities |
24,633 | 19,799 | 30,154 | — | 74,586 | |||||||||||||||
|
Derivative liabilities |
598 | — | — | — | 598 | |||||||||||||||
|
Accrued interest |
9,413 | — | 5 | — | 9,418 | |||||||||||||||
|
Income taxes payable |
— | — | 18,709 | (3,136 | ) | 15,573 | ||||||||||||||
|
Current liability for uncertain tax positions |
— | 427 | 4,257 | — | 4,684 | |||||||||||||||
|
Deferred tax liabilities |
— | 704 | 1,265 | (1,045 | ) | 924 | ||||||||||||||
|
|
|
|
|
|
|
|
|
|
|
|||||||||||
|
Total current liabilities |
126,477 | 936,270 | 209,063 | (997,405 | ) | 274,405 | ||||||||||||||
|
Long-term borrowings |
965,280 | — | — | — | 965,280 | |||||||||||||||
|
Deferred tax liabilities |
— | 427,146 | 54,664 | (62,544 | ) | 419,266 | ||||||||||||||
|
Pension and other postretirement benefit liabilities |
114,257 | 37,269 | 19,420 | — | 170,946 | |||||||||||||||
|
Noncurrent liability for uncertain tax positions |
13,131 | 28,440 | 26,721 | — | 68,292 | |||||||||||||||
|
Other liabilities |
2,435,153 | 35,543 | 991,327 | (3,402,252 | ) | 59,771 | ||||||||||||||
|
|
|
|
|
|
|
|
|
|
|
|||||||||||
|
Total liabilities |
3,654,298 | 1,464,668 | 1,301,195 | (4,462,201 | ) | 1,957,960 | ||||||||||||||
|
Total common shareholders’ equity |
1,778,950 | 5,192,005 | 1,345,076 | (6,537,081 | ) | 1,778,950 | ||||||||||||||
|
Noncontrolling interest |
— | — | 2,587 | — | 2,587 | |||||||||||||||
|
|
|
|
|
|
|
|
|
|
|
|||||||||||
|
Total equity |
1,778,950 | 5,192,005 | 1,347,663 | (6,537,081 | ) | 1,781,537 | ||||||||||||||
|
|
|
|
|
|
|
|
|
|
|
|||||||||||
|
Total liabilities and equity |
$ | 5,433,248 | $ | 6,656,673 | $ | 2,648,858 | $ | (10,999,282 | ) | $ | 3,739,497 | |||||||||
|
|
|
|
|
|
|
|
|
|
|
|||||||||||
F-59
Table of Contents
TELEFLEX INCORPORATED AND SUBSIDIARIES
NOTES TO CONSOLIDATED FINANCIAL STATEMENTS — (Continued)
| December 31, 2011 | ||||||||||||||||||||
|
Parent
Company |
Guarantor
Subsidiaries |
Non-Guarantor
Subsidiaries |
Eliminations |
Condensed
Consolidated |
||||||||||||||||
| (Dollars in thousands) | ||||||||||||||||||||
| ASSETS | ||||||||||||||||||||
|
Current assets |
||||||||||||||||||||
|
Cash and cash equivalents |
$ | 114,531 | $ | — | $ | 469,557 | $ | — | $ | 584,088 | ||||||||||
|
Accounts receivable, net |
269 | 304,813 | 464,834 | (483,690 | ) | 286,226 | ||||||||||||||
|
Inventories, net |
— | 201,147 | 107,188 | (9,560 | ) | 298,775 | ||||||||||||||
|
Prepaid expenses and other current assets |
7,203 | 3,675 | 22,527 | — | 33,405 | |||||||||||||||
|
Prepaid taxes |
24,006 | — | 4,869 | (29 | ) | 28,846 | ||||||||||||||
|
Deferred tax assets |
8,659 | 26,886 | 5,883 | (414 | ) | 41,014 | ||||||||||||||
|
Assets held for sale |
— | 2,738 | 5,164 | — | 7,902 | |||||||||||||||
|
|
|
|
|
|
|
|
|
|
|
|||||||||||
|
Total current assets |
154,668 | 539,259 | 1,080,022 | (493,693 | ) | 1,280,256 | ||||||||||||||
|
Property, plant and equipment, net |
8,208 | 149,300 | 94,404 | — | 251,912 | |||||||||||||||
|
Goodwill |
— | 1,001,353 | 437,189 | — | 1,438,542 | |||||||||||||||
|
Intangibles assets, net |
— | 711,962 | 167,825 | — | 879,787 | |||||||||||||||
|
Investments in affiliates |
5,244,275 | 922,208 | 20,327 | (6,184,802 | ) | 2,008 | ||||||||||||||
|
Deferred tax assets |
65,400 | — | 2,387 | (67,509 | ) | 278 | ||||||||||||||
|
Other assets |
42,183 | 2,534,124 | 164,662 | (2,669,649 | ) | 71,320 | ||||||||||||||
|
|
|
|
|
|
|
|
|
|
|
|||||||||||
|
Total assets |
$ | 5,514,734 | $ | 5,858,206 | $ | 1,966,816 | $ | (9,415,653 | ) | $ | 3,924,103 | |||||||||
|
|
|
|
|
|
|
|
|
|
|
|||||||||||
| LIABILITIES AND EQUITY | ||||||||||||||||||||
|
Current liabilities |
||||||||||||||||||||
|
Current borrowings |
$ | — | $ | — | $ | 4,986 | $ | — | $ | 4,986 | ||||||||||
|
Accounts payable |
101,907 | 387,612 | 64,694 | (487,121 | ) | 67,092 | ||||||||||||||
|
Accrued expenses |
23,208 | 21,454 | 29,545 | — | 74,207 | |||||||||||||||
|
Current portion of contingent consideration |
— | 3,953 | — | — | 3,953 | |||||||||||||||
|
Payroll and benefit-related liabilities |
24,031 | 13,867 | 26,488 | — | 64,386 | |||||||||||||||
|
Derivative liabilities |
633 | — | — | — | 633 | |||||||||||||||
|
Accrued interest |
10,948 | — | 12 | — | 10,960 | |||||||||||||||
|
Income taxes payable |
— | — | 21,113 | (29 | ) | 21,084 | ||||||||||||||
|
Current liability for uncertain tax positions |
— | — | 22,656 | — | 22,656 | |||||||||||||||
|
Deferred tax liabilities |
— | — | 1,465 | (415 | ) | 1,050 | ||||||||||||||
|
|
|
|
|
|
|
|
|
|
|
|||||||||||
|
Total current liabilities |
160,727 | 426,886 | 170,959 | (487,565 | ) | 271,007 | ||||||||||||||
|
Long-term borrowings |
954,809 | — | — | — | 954,809 | |||||||||||||||
|
Deferred tax liabilities |
— | 433,078 | 55,264 | (67,509 | ) | 420,833 | ||||||||||||||
|
Pension and other postretirement benefit liabilities |
145,533 | 34,034 | 15,417 | — | 194,984 | |||||||||||||||
|
Noncurrent liability for uncertain tax positions |
12,678 | 18,437 | 30,573 | — | 61,688 | |||||||||||||||
|
Other liabilities |
2,260,399 | 5,583 | 443,875 | (2,671,858 | ) | 37,999 | ||||||||||||||
|
|
|
|
|
|
|
|
|
|
|
|||||||||||
|
Total liabilities |
3,534,146 | 918,018 | 716,088 | (3,226,932 | ) | 1,941,320 | ||||||||||||||
|
Total common shareholders’ equity |
1,980,588 | 4,940,188 | 1,248,533 | (6,188,721 | ) | 1,980,588 | ||||||||||||||
|
Noncontrolling interest |
— | — | 2,195 | — | 2,195 | |||||||||||||||
|
|
|
|
|
|
|
|
|
|
|
|||||||||||
|
Total equity |
1,980,588 | 4,940,188 | 1,250,728 | (6,188,721 | ) | 1,982,783 | ||||||||||||||
|
|
|
|
|
|
|
|
|
|
|
|||||||||||
|
Total liabilities and equity |
$ | 5,514,734 | $ | 5,858,206 | $ | 1,966,816 | $ | (9,415,653 | ) | $ | 3,924,103 | |||||||||
|
|
|
|
|
|
|
|
|
|
|
|||||||||||
F-60
Table of Contents
TELEFLEX INCORPORATED AND SUBSIDIARIES
NOTES TO CONSOLIDATED FINANCIAL STATEMENTS — (Continued)
TELEFLEX INCORPORATED AND SUBSIDIARIES
CONDENSED CONSOLIDATED STATEMENTS OF CASH FLOWS
| Year Ended December 31, 2012 | ||||||||||||||||
|
Parent
Company |
Guarantor
Subsidiaries |
Non-Guarantor
Subsidiaries |
Condensed
Consolidated |
|||||||||||||
| (Dollars in thousands) | ||||||||||||||||
|
Net cash (used in) provided by operating activities from continuing operations |
$ | (179,859 | ) | $ | 238,771 | $ | 134,941 | $ | 193,853 | |||||||
|
|
|
|
|
|
|
|
|
|||||||||
|
Cash Flows from Investing Activities of Continuing Operations: |
||||||||||||||||
|
Expenditures for property, plant and equipment |
(7,352 | ) | (39,118 | ) | (18,924 | ) | (65,394 | ) | ||||||||
|
Proceeds from sales of businesses and assets, net of cash sold |
4,301 | 45,204 | 17,155 | 66,660 | ||||||||||||
|
Payments for businesses and intangibles acquired, net of cash acquired |
— | (121,484 | ) | (265,556 | ) | (387,040 | ) | |||||||||
|
Investments in affiliates |
(80 | ) | — | — | (80 | ) | ||||||||||
|
|
|
|
|
|
|
|
|
|||||||||
|
Net cash used in investing activities from continuing operations |
(3,131 | ) | (115,398 | ) | (267,325 | ) | (385,854 | ) | ||||||||
|
|
|
|
|
|
|
|
|
|||||||||
|
Cash Flows from Financing Activities of Continuing Operations: |
||||||||||||||||
|
Decrease in notes payable and current borrowings |
— | (421 | ) | (285 | ) | (706 | ) | |||||||||
|
Proceeds from stock compensation plans |
9,003 | — | — | 9,003 | ||||||||||||
|
Dividends |
(55,589 | ) | — | — | (55,589 | ) | ||||||||||
|
Intercompany transactions |
197,927 | (122,835 | ) | (75,092 | ) | — | ||||||||||
|
|
|
|
|
|
|
|
|
|||||||||
|
Net cash provided by (used in) financing activities from continuing operations |
151,341 | (123,256 | ) | (75,377 | ) | (47,292 | ) | |||||||||
|
|
|
|
|
|
|
|
|
|||||||||
|
Cash Flows from Discontinued Operations: |
||||||||||||||||
|
Net cash (used in) provided by operating activities |
(12,022 | ) | 4,223 | — | (7,799 | ) | ||||||||||
|
Net cash used in investing activities |
— | (2,351 | ) | — | (2,351 | ) | ||||||||||
|
|
|
|
|
|
|
|
|
|||||||||
|
Net cash (used in) provided by discontinued operations |
(12,022 | ) | 1,872 | — | (10,150 | ) | ||||||||||
|
|
|
|
|
|
|
|
|
|||||||||
|
Effect of exchange rate changes on cash and cash equivalents |
— | — | 2,394 | 2,394 | ||||||||||||
|
|
|
|
|
|
|
|
|
|||||||||
|
Net (decrease) increase in cash and cash equivalents |
(43,671 | ) | 1,989 | (205,367 | ) | (247,049 | ) | |||||||||
|
Cash and cash equivalents at the beginning of the period |
114,531 | — | 469,557 | 584,088 | ||||||||||||
|
|
|
|
|
|
|
|
|
|||||||||
|
Cash and cash equivalents at the end of the period |
$ | 70,860 | $ | 1,989 | $ | 264,190 | $ | 337,039 | ||||||||
|
|
|
|
|
|
|
|
|
|||||||||
F-61
Table of Contents
TELEFLEX INCORPORATED AND SUBSIDIARIES
NOTES TO CONSOLIDATED FINANCIAL STATEMENTS — (Continued)
| Year Ended December 31, 2011 | ||||||||||||||||
|
Parent
Company |
Guarantor
Subsidiaries |
Non-Guarantor
Subsidiaries |
Condensed
Consolidated |
|||||||||||||
| (Dollars in thousands) | ||||||||||||||||
|
Net cash (used in) provided by operating activities from continuing operations |
$ | (108,729 | ) | $ | 147,249 | $ | 55,837 | $ | 94,357 | |||||||
|
|
|
|
|
|
|
|
|
|||||||||
|
Cash Flows from Investing Activities of Continuing Operations: |
||||||||||||||||
|
Expenditures for property, plant and equipment |
(3,167 | ) | (25,840 | ) | (15,575 | ) | (44,582 | ) | ||||||||
|
Payments for businesses and intangibles acquired, net of cash acquired |
— | (30,570 | ) | — | (30,570 | ) | ||||||||||
|
Proceeds from sales of businesses and assets, net of cash sold |
— | 58,986 | 317,039 | 376,025 | ||||||||||||
|
Investments in affiliates |
(150 | ) | — | — | (150 | ) | ||||||||||
|
|
|
|
|
|
|
|
|
|||||||||
|
Net cash (used in) provided by investing activities from continuing operations |
(3,317 | ) | 2,576 | 301,464 | 300,723 | |||||||||||
|
|
|
|
|
|
|
|
|
|||||||||
|
Cash Flows from Financing Activities of Continuing Operations: |
||||||||||||||||
|
Proceeds from long-term borrowings |
515,000 | — | — | 515,000 | ||||||||||||
|
Repayment of long-term borrowings |
(455,800 | ) | — | — | (455,800 | ) | ||||||||||
|
Debt extinguishment, issuance and amendment fees |
(18,518 | ) | — | — | (18,518 | ) | ||||||||||
|
Decrease (increase) in notes payable and current borrowings |
(25,000 | ) | — | 286 | (24,714 | ) | ||||||||||
|
Proceeds from stock compensation plans |
34,009 | — | — | 34,009 | ||||||||||||
|
Dividends |
(55,136 | ) | — | — | (55,136 | ) | ||||||||||
|
Intercompany transactions |
221,752 | (158,626 | ) | (63,126 | ) | — | ||||||||||
|
|
|
|
|
|
|
|
|
|||||||||
|
Net cash provided by (used in) financing activities from continuing operations |
216,307 | (158,626 | ) | (62,840 | ) | (5,159 | ) | |||||||||
|
|
|
|
|
|
|
|
|
|||||||||
|
Cash Flows from Discontinued Operations: |
||||||||||||||||
|
Net cash (used in) provided by operating activities |
(12,359 | ) | 9,306 | 3,174 | 121 | |||||||||||
|
Net cash used in investing activities |
(3 | ) | (505 | ) | (2,367 | ) | (2,875 | ) | ||||||||
|
|
|
|
|
|
|
|
|
|||||||||
|
Net cash (used in) provided by discontinued operations |
(12,362 | ) | 8,801 | 807 | (2,754 | ) | ||||||||||
|
|
|
|
|
|
|
|
|
|||||||||
|
Effect of exchange rate changes on cash and cash equivalents |
— | — | (11,531 | ) | (11,531 | ) | ||||||||||
|
|
|
|
|
|
|
|
|
|||||||||
|
Net increase in cash and cash equivalents |
91,899 | — | 283,737 | 375,636 | ||||||||||||
|
Cash and cash equivalents at the beginning of the period |
22,632 | — | 185,820 | 208,452 | ||||||||||||
|
|
|
|
|
|
|
|
|
|||||||||
|
Cash and cash equivalents at the end of the period |
$ | 114,531 | $ | — | $ | 469,557 | $ | 584,088 | ||||||||
|
|
|
|
|
|
|
|
|
|||||||||
F-62
Table of Contents
TELEFLEX INCORPORATED AND SUBSIDIARIES
NOTES TO CONSOLIDATED FINANCIAL STATEMENTS — (Continued)
| Year Ended December 31, 2010 | ||||||||||||||||
|
Parent
Company |
Guarantor
Subsidiaries |
Non-Guarantor
Subsidiaries |
Condensed
Consolidated |
|||||||||||||
| (Dollars in thousands) | ||||||||||||||||
|
Net cash (used in) provided by operating activities from continuing operations |
$ | (102,497 | ) | $ | 164,368 | $ | 81,963 | $ | 143,834 | |||||||
|
|
|
|
|
|
|
|
|
|||||||||
|
Cash Flows from Investing Activities of Continuing Operations: |
||||||||||||||||
|
Expenditures for property, plant and equipment |
(1,422 | ) | (19,908 | ) | (8,000 | ) | (29,330 | ) | ||||||||
|
Payments for businesses and intangibles acquired, net of cash acquired |
— | (82 | ) | — | (82 | ) | ||||||||||
|
Proceeds from sales of businesses and assets, net of cash sold |
53,466 | 33,091 | 94,993 | 181,550 | ||||||||||||
|
|
|
|
|
|
|
|
|
|||||||||
|
Net cash provided by investing activities from continuing operations |
52,044 | 13,101 | 86,993 | 152,138 | ||||||||||||
|
|
|
|
|
|
|
|
|
|||||||||
|
Cash Flows from Financing Activities of Continuing Operations: |
||||||||||||||||
|
Proceeds from long-term borrowings |
490,000 | — | — | 490,000 | ||||||||||||
|
Repayment of long-term borrowings |
(716,570 | ) | — | — | (716,570 | ) | ||||||||||
|
Debt extinguishment, issuance and amendment fees |
(65,226 | ) | — | — | (65,226 | ) | ||||||||||
|
Increase in notes payable and current borrowings |
29,700 | — | — | 29,700 | ||||||||||||
|
Proceeds from stock compensation plans |
10,657 | — | — | 10,657 | ||||||||||||
|
Payments to noncontrolling interest shareholders |
— | — | (1,148 | ) | (1,148 | ) | ||||||||||
|
Dividends |
(54,312 | ) | — | — | (54,312 | ) | ||||||||||
|
Purchase of call options |
(88,000 | ) | — | — | (88,000 | ) | ||||||||||
|
Proceeds from sale of warrants |
59,400 | — | — | 59,400 | ||||||||||||
|
Intercompany transactions |
373,228 | (184,527 | ) | (188,701 | ) | — | ||||||||||
|
|
|
|
|
|
|
|
|
|||||||||
|
Net cash provided by (used in) financing activities from continuing operations |
38,877 | (184,527 | ) | (189,849 | ) | (335,499 | ) | |||||||||
|
|
|
|
|
|
|
|
|
|||||||||
|
Cash Flows from Discontinued Operations: |
||||||||||||||||
|
Net cash provided by operating activities |
2,223 | 7,769 | 59,276 | 69,268 | ||||||||||||
|
Net cash provided by (used in) investing activities |
208 | (711 | ) | (3,833 | ) | (4,336 | ) | |||||||||
|
Net cash used in financing activities |
— | — | (1,128 | ) | (1,128 | ) | ||||||||||
|
|
|
|
|
|
|
|
|
|||||||||
|
Net cash provided by discontinued operations |
2,431 | 7,058 | 54,315 | 63,804 | ||||||||||||
|
|
|
|
|
|
|
|
|
|||||||||
|
Effect of exchange rate changes on cash and cash equivalents |
— | — | (4,130 | ) | (4,130 | ) | ||||||||||
|
|
|
|
|
|
|
|
|
|||||||||
|
Net (decrease) increase in cash and cash equivalents |
(9,145 | ) | — | 29,292 | 20,147 | |||||||||||
|
Cash and cash equivalents at the beginning of the period |
31,777 | — | 156,528 | 188,305 | ||||||||||||
|
|
|
|
|
|
|
|
|
|||||||||
|
Cash and cash equivalents at the end of the period |
$ | 22,632 | $ | — | $ | 185,820 | $ | 208,452 | ||||||||
|
|
|
|
|
|
|
|
|
|||||||||
F-63
Table of Contents
TELEFLEX INCORPORATED AND SUBSIDIARIES
NOTES TO CONSOLIDATED FINANCIAL STATEMENTS — (Continued)
Continuing Operations
As dispositions occur in the normal course of business, gains or losses on the sale of such businesses are recognized in the income statement line item Net (gain) loss on sales of businesses and assets.
Net (gain) loss on sales of businesses and assets consists of the following for the years ended December 31:
| 2012 | 2011 | 2010 | ||||||||||
| (Dollars in thousands) | ||||||||||||
|
Net (gain) loss on sales of businesses and assets |
$ | (332 | ) | $ | 582 | $ | (341 | ) | ||||
During 2012, the Company sold a building, with a net book value of zero, that had been classified as an asset held for sale and realized a gain of approximately $0.3 million.
During 2011, the Company sold a building that had been classified as held for sale. The company recognized net proceeds of $3.6 million and a loss on the sale of approximately $0.6 million.
During 2010, the Company recognized the following:
| • |
$0.2 million gain on the sale of its interest in an affiliate in India. |
| • |
$0.4 million gain on the disposal of an asset held for sale. |
| • |
$0.3 million loss on the sale of its interest in an affiliate in Japan. |
Assets Held for Sale
The table below provides information regarding assets held for sale at December 31, 2012 and 2011. At December 31, 2012, these assets consisted of three buildings which the Company is actively marketing.
| 2012 | 2011 | |||||||
| (Dollars in thousands) | ||||||||
|
Assets held for sale: |
||||||||
|
Property, plant and equipment |
$ | 7,963 | $ | 7,902 | ||||
|
|
|
|
|
|||||
|
Total assets held for sale |
$ | 7,963 | $ | 7,902 | ||||
|
|
|
|
|
|||||
Discontinued Operations
The Company has recorded $2.7 million and $17.1 million of expense during 2012 and 2011, respectively, associated with retained liabilities related to businesses that have been divested. Of the $17.1 million recorded in 2011, $7.5 million was associated with recall costs related to defective products, which was a subject of pending litigation related to the Company’s former Commercial Segment. During the third quarter of 2011, the Company settled the litigation as it related to the recall costs and, as part of the settlement, paid $7.6 million in September 2011.
On August 26, 2012, the Company completed the sale of the orthopedic business of its OEM Segment to Tecomet for $45.2 million in cash and realized a loss of $39 thousand, net of tax, from the sale of the business.
On December 2, 2011, the Company completed the sale of its business units that design, engineer and manufacture air cargo systems and air cargo containers and pallets to a subsidiary of AAR CORP. for $280.0 million in cash and realized a gain of $126.8 million, net of tax, from the sale. In 2012, the
F-64
Table of Contents
TELEFLEX INCORPORATED AND SUBSIDIARIES
NOTES TO CONSOLIDATED FINANCIAL STATEMENTS — (Continued)
Company received an additional $16.8 million in proceeds as a working capital adjustment pursuant to the terms of the agreement related to the sale of the business, which resulted in recognition of an additional gain on sale of $2.2 million, net of tax. These business units represented the sole remaining businesses in the Company’s former Aerospace Segment.
On March 22, 2011, the Company completed the sale of its marine business to an affiliate of H.I.G. Capital, LLC for consideration of $123.1 million (consisting of $103.1 million in cash, plus a subordinated promissory note in the amount of $4.5 million and the assumption by the buyer of approximately $15.5 million in liabilities related to the marine business). Net assets transferred to the buyer in the sale included $1.5 million of cash, resulting in net cash proceeds to the Company of $101.6 million. The Company realized a gain of $57.3 million, net of tax benefits, from the sale of the business. As a result of the disposition, the Company realized accumulated losses from pension and postretirement obligations of approximately $8.4 million and cumulative translation gains of approximately $33.4 million as part of the gain on sale, resulting in a net change of approximately $25.0 million in accumulated other comprehensive income. In 2012, the $4.5 million subordinated promissory note plus related accrued interest of $0.7 million was paid by the buyer. The marine business consisted of the Company’s businesses that were engaged in the design, manufacture and distribution of steering and throttle controls and engine and drive assemblies for the recreational marine market, heaters for commercial vehicles and burner units for military field feeding appliances. The marine business represented the sole remaining business in the Company’s former Commercial Segment.
On December 31, 2010, the Company completed the sale of the actuation business of its subsidiary Telair International Incorporated to TransDigm Group, Incorporated for approximately $94 million and realized a gain of $51.0 million, net of tax, from the sale of the business.
On June 25, 2010, the Company completed the sale of its rigging products and services business (“Heavy Lift”), a reporting unit within its Commercial Segment, to Houston Wire & Cable Company for $50 million and realized a gain of $17.0 million, net of tax, from the sale of the business.
On March 2, 2010, the Company completed the sale of its SSI Surgical Services Inc. business to a privately-owned multi-service line healthcare company for approximately $25 million and realized a gain of $2.2 million, net of tax.
The results of the Company’s discontinued operations for the years 2012, 2011 and 2010 were as follows:
| 2012 | 2011 | 2010 | ||||||||||
| (Dollars in thousands) | ||||||||||||
|
Net revenues |
$ | 16,616 | $ | 277,972 | $ | 465,504 | ||||||
|
Costs and other expenses |
18,328 | 255,919 | 411,377 | |||||||||
|
Goodwill impairment (1) |
9,700 | — | — | |||||||||
|
Gain on disposition (2) |
2,205 | 270,630 | 114,702 | |||||||||
|
|
|
|
|
|
|
|||||||
|
Income (loss) from discontinued operations before income taxes |
(9,207 | ) | 292,683 | 168,829 | ||||||||
|
Taxes (benefit) on income (loss) from discontinued operations |
(1,887 | ) | 87,038 | 54,046 | ||||||||
|
|
|
|
|
|
|
|||||||
|
Income (loss) from discontinued operations |
(7,320 | ) | 205,645 | 114,783 | ||||||||
|
Less: Income from discontinued operations attributable to noncontrolling interest |
— | 617 | 500 | |||||||||
|
|
|
|
|
|
|
|||||||
|
Income (loss) from discontinued operations attributable to common shareholders |
$ | (7,320 | ) | $ | 205,028 | $ | 114,283 | |||||
|
|
|
|
|
|
|
|||||||
| (1) | During 2012, the Company recognized a non-cash goodwill impairment charge of $9.7 million to adjust the carrying value of the orthopedic business to its estimated fair value. |
F-65
Table of Contents
TELEFLEX INCORPORATED AND SUBSIDIARIES
NOTES TO CONSOLIDATED FINANCIAL STATEMENTS — (Continued)
| (2) | The $2.2 million pre-tax gain on disposition during 2012 primarily reflects the gain recognized on the working capital adjustment related to the sale of the cargo systems and cargo container businesses. |
Net assets and liabilities of discontinued operations sold in 2012 are as follows:
| (Dollars in thousands) | ||||
|
Net assets |
$ | 46,209 | ||
|
Net liabilities |
(1,457 | ) | ||
|
|
|
|||
| $ | 44,752 | |||
|
|
|
|||
F-66
Table of Contents
|
First
Quarter (2),(3) |
Second
Quarter (2) |
Third
Quarter |
Fourth
Quarter |
|||||||||||||
| (Dollars in thousands, except per share) | ||||||||||||||||
|
2012 (1) : |
||||||||||||||||
|
Net revenues |
$ | 380,567 | $ | 383,332 | $ | 368,054 | $ | 419,056 | ||||||||
|
Gross profit |
184,114 | 184,364 | 180,567 | 199,180 | ||||||||||||
|
Income (loss) from continuing operations before interest and taxes |
(270,378 | ) | 64,722 | 49,841 | 58,440 | |||||||||||
|
Income (loss) from continuing operations |
(284,113 | ) | 47,266 | 24,451 | 30,614 | |||||||||||
|
Income (loss) from discontinued operations |
605 | (4,367 | ) | (2,521 | ) | (1,037 | ) | |||||||||
|
Net income (loss) |
(283,508 | ) | 42,899 | 21,930 | 29,577 | |||||||||||
|
Less: Income from continuing operations attributable to noncontrolling interest |
227 | 286 | 188 | 254 | ||||||||||||
|
Net income (loss) attributable to common shareholders |
(283,735 | ) | 42,613 | 21,742 | 29,323 | |||||||||||
|
Earnings per share available to common shareholders — basic (4) : |
||||||||||||||||
|
Income (loss) from continuing operations |
$ | (6.97 | ) | $ | 1.15 | $ | 0.59 | $ | 0.74 | |||||||
|
Income (loss) from discontinued operations |
0.01 | (0.11 | ) | (0.06 | ) | (0.02 | ) | |||||||||
|
|
|
|
|
|
|
|
|
|||||||||
|
Net income (loss) |
$ | (6.96 | ) | $ | 1.04 | $ | 0.53 | $ | 0.72 | |||||||
|
|
|
|
|
|
|
|
|
|||||||||
|
Earnings per share available to common shareholders — diluted (4) : |
||||||||||||||||
|
Income (loss) from continuing operations |
$ | (6.97 | ) | $ | 1.14 | $ | 0.58 | $ | 0.72 | |||||||
|
Income (loss) from discontinued operations |
0.01 | (0.10 | ) | (0.06 | ) | (0.02 | ) | |||||||||
|
|
|
|
|
|
|
|
|
|||||||||
|
Net income (loss) |
$ | (6.96 | ) | $ | 1.04 | $ | 0.52 | $ | 0.70 | |||||||
|
|
|
|
|
|
|
|
|
|||||||||
|
2011 (1) : |
||||||||||||||||
|
Net revenues |
$ | 345,581 | $ | 381,168 | $ | 362,741 | $ | 403,038 | ||||||||
|
Gross profit |
162,047 | 181,351 | 175,630 | 189,750 | ||||||||||||
|
Income from continuing operations before interest, loss on extinguishments of debt and taxes |
48,711 | 55,882 | 61,905 | 63,072 | ||||||||||||
|
Income from continuing operations |
13,500 | 31,098 | 32,921 | 41,803 | ||||||||||||
|
Income from discontinued operations |
64,694 | 3,389 | 11,144 | 126,418 | ||||||||||||
|
Net income |
78,194 | 34,487 | 44,065 | 168,221 | ||||||||||||
|
Less: Income from continuing operations attributable to noncontrolling interest |
223 | 258 | 289 | 251 | ||||||||||||
|
Income from discontinued operations attributable to noncontrolling interest |
159 | 159 | 125 | 174 | ||||||||||||
|
Net income attributable to common shareholders |
77,812 | 34,070 | 43,651 | 167,796 | ||||||||||||
|
Earnings per share available to common shareholders — basic (4) : |
||||||||||||||||
|
Income from continuing operations |
$ | 0.33 | $ | 0.76 | $ | 0.80 | $ | 1.02 | ||||||||
|
Income from discontinued operations |
1.61 | 0.08 | 0.27 | 3.10 | ||||||||||||
|
|
|
|
|
|
|
|
|
|||||||||
|
Net income |
$ | 1.94 | $ | 0.84 | $ | 1.07 | $ | 4.12 | ||||||||
|
|
|
|
|
|
|
|
|
|||||||||
|
Earnings per share available to common shareholders — diluted (4) : |
||||||||||||||||
|
Income from continuing operations |
$ | 0.33 | $ | 0.75 | $ | 0.80 | $ | 1.01 | ||||||||
|
Income from discontinued operations |
1.59 | 0.08 | 0.27 | 3.09 | ||||||||||||
|
|
|
|
|
|
|
|
|
|||||||||
|
Net income |
$ | 1.92 | $ | 0.83 | $ | 1.07 | $ | 4.10 | ||||||||
|
|
|
|
|
|
|
|
|
|||||||||
| (1) | Amounts reflect the retrospective impact of reporting the orthopedic business as discontinued operations. See Note 19. |
| (2) | The Company identified $0.1 million and $0.4 million, net of tax, of environmental costs related to discontinued operations that were erroneously reported in continuing operations during the first and second quarters of 2011, respectively, which did not change diluted earnings per share for the first quarter and increased diluted earnings per share by $0.01 for the second quarter. The Company has classified these environmental costs as income from discontinued operations. Management has determined that the impact of this error was not material on a quantitative or qualitative basis to the financial statements for the first and second quarters of fiscal 2011. |
| (3) | Amounts include a pretax goodwill impairment charge of $332.1 million, or $315.1 million, net of tax. See Note 5. |
| (4) | Each quarter is calculated as a discrete period; the sum of the four quarters may not equal the calculated full year amount. |
F-67
Table of Contents
TELEFLEX INCORPORATED
SCHEDULE II — VALUATION AND QUALIFYING ACCOUNTS
ALLOWANCE FOR DOUBTFUL ACCOUNTS
|
Balance at
Beginning of Year |
Dispositions |
Additions
Charged to Income |
Accounts
Receivable Write-offs |
Translation
and Other |
Balance at
End of Year |
|||||||||||||||||||
|
December 31, 2012 |
$ | 6,452 | $ | — | $ | 1,730 | $ | (483 | ) | $ | 119 | $ | 7,818 | |||||||||||
|
December 31, 2011 |
$ | 4,138 | $ | (497 | ) | $ | 3,245 | $ | (884 | ) | $ | 450 | $ | 6,452 | ||||||||||
|
December 31, 2010 |
$ | 7,117 | $ | (1,075 | ) | $ | 491 | $ | (2,051 | ) | $ | (344 | ) | $ | 4,138 | |||||||||
INVENTORY RESERVE
|
Balance at
Beginning of Year |
Dispositions |
Additions
Charged to Income |
Inventory
Write-offs |
Translation
and Other |
Balance at
End of Year |
|||||||||||||||||||
|
December 31, 2012 |
||||||||||||||||||||||||
|
Raw material |
$ | 9,095 | $ | (504 | ) | $ | 5,206 | $ | (4,346 | ) | $ | (57 | ) | $ | 9,394 | |||||||||
|
Work-in-process |
2,742 | — | 1,107 | (2,204 | ) | 1 | 1,646 | |||||||||||||||||
|
Finished goods |
21,082 | — | 13,175 | (12,183 | ) | (1,411 | ) | 20,663 | ||||||||||||||||
|
|
|
|
|
|
|
|
|
|
|
|
|
|||||||||||||
| $ | 32,919 | $ | (504 | ) | $ | 19,488 | $ | (18,733 | ) | $ | (1,467 | ) | $ | 31,703 | ||||||||||
|
|
|
|
|
|
|
|
|
|
|
|
|
|||||||||||||
|
December 31, 2011 |
||||||||||||||||||||||||
|
Raw material |
$ | 15,717 | $ | (5,064 | ) | $ | 877 | $ | (715 | ) | $ | (1,720 | ) | $ | 9,095 | |||||||||
|
Work-in-process |
5,908 | (478 | ) | 382 | (355 | ) | (2,715 | ) | 2,742 | |||||||||||||||
|
Finished goods |
16,659 | (2,399 | ) | 15,604 | (14,426 | ) | 5,644 | 21,082 | ||||||||||||||||
|
|
|
|
|
|
|
|
|
|
|
|
|
|||||||||||||
| $ | 38,284 | $ | (7,941 | ) | $ | 16,863 | $ | (15,496 | ) | $ | 1,209 | $ | 32,919 | |||||||||||
|
|
|
|
|
|
|
|
|
|
|
|
|
|||||||||||||
|
December 31, 2010 |
||||||||||||||||||||||||
|
Raw material |
$ | 12,207 | $ | (1,022 | ) | $ | 5,502 | $ | (1,445 | ) | $ | 475 | $ | 15,717 | ||||||||||
|
Work-in-process |
3,528 | — | 4,229 | (1,831 | ) | (18 | ) | 5,908 | ||||||||||||||||
|
Finished goods |
19,524 | (1,918 | ) | 3,440 | (5,694 | ) | 1,307 | 16,659 | ||||||||||||||||
|
|
|
|
|
|
|
|
|
|
|
|
|
|||||||||||||
| $ | 35,259 | $ | (2,940 | ) | $ | 13,171 | $ | (8,970 | ) | $ | 1,764 | $ | 38,284 | |||||||||||
|
|
|
|
|
|
|
|
|
|
|
|
|
|||||||||||||
DEFERRED TAX ASSET VALUATION ALLOWANCE
|
Balance at
Beginning of Year |
Additions
Charged to Expense |
Reductions
Credited to Expense |
Translation
and Other |
Balance at
End of Year |
||||||||||||||||
|
December 31, 2012 |
$ | 66,305 | $ | 6,103 | $ | (4,888 | ) | $ | 2,949 | $ | 70,469 | |||||||||
|
December 31, 2011 |
$ | 49,522 | $ | 26,743 | $ | (2,206 | ) | $ | (7,754 | ) | $ | 66,305 | ||||||||
|
December 31, 2010 |
$ | 49,243 | $ | 4,670 | $ | (3,408 | ) | $ | (983 | ) | $ | 49,522 | ||||||||
F-68
Table of Contents
The following exhibits are filed as part of, or incorporated by reference into, this report:
| Exhibit No. |
|
Description |
||
| *3.1.1 | — | Articles of Incorporation of the Company are incorporated by reference to Exhibit 3(a) to the Company’s Form 10-Q for the period ended June 30, 1985. | ||
| *3.1.2 | — | Amendment to Article Thirteenth of the Company’s Articles of Incorporation is incorporated by reference to Exhibit 3 of the Company’s Form 10-Q for the period ended June 28, 1987. | ||
| *3.1.3 | — | Amendment to the first paragraph of Article Fourth of the Company’s Articles of Incorporation is incorporated by reference to Proposal 2 of the Company’s Proxy Statement filed on March 29, 2007. | ||
| *3.2 | — | Amended and Restated Bylaws of the Company (incorporated by reference to Exhibit 3.2 to the Company’s Form 8-K filed on May 7, 2009). | ||
| *4.1.1 | — | Indenture, dated August 2, 2010, between the Company and Wells Fargo Bank, N.A., as trustee (incorporated by reference to Exhibit 4.4 to the Company’s registration statement on Form S-3 (Registration No. 333-168464) filed on August 2, 2010). | ||
| *4.1.2 | — | First Supplemental Indenture, dated August 9, 2010, between the Company and Wells Fargo Bank, N.A., as trustee (incorporated by reference to Exhibit 4.2 to the Company’s Form 8-K filed on August 9, 2010). | ||
| *4.1.3 | — | Form of 3.875% Convertible Senior Subordinated Notes due 2017 (incorporated by reference to Exhibit A in Exhibit 4.2 to the Company’s Form 8-K filed on August 9, 2010). | ||
| *4.1.4 | — | Second Supplemental Indenture, dated June 13, 2011, between the Company and Wells Fargo Bank, N.A., as trustee (incorporated by reference to Exhibit 4.2 to the Company’s Form 8-K filed on June 13, 2011). | ||
| *4.1.5 | — | Form of 6.875% Senior Subordinated Notes due 2019 (incorporated by reference to Exhibit A in Exhibit 4.2 to the Company’s Form 8-K filed on June 13, 2011). | ||
| *10.1.1 | — | Teleflex Incorporated Retirement Income Plan, as amended and restated effective January 1, 2002 (incorporated by reference to Exhibit 10.2 to the Company’s Form 10-K filed on February 25, 2010). | ||
| *10.1.2 | — | First Amendment to the Teleflex Incorporated Retirement Income Plan, effective as of March 22, 2011 (incorporated by reference to Exhibit 10.1 to the Company’s Form 10-K filed on February 24, 2012). | ||
| 10.1.3 | — | Second Amendment to the Teleflex Incorporated Retirement Income Plan, dated as of December 26, 2012. | ||
| +10.2 | — | Amended and Restated Teleflex Incorporated Deferred Compensation Plan, dated December 26, 2012. | ||
| *10.3.1 | — | Amended and Restated Teleflex 401(k) Savings Plan, effective as of January 1, 2004 (incorporated by reference to Exhibit 10.4 to the Company’s Form 10-K filed on February 25, 2010). | ||
| *10.3.2 | — | First Amendment to Amended and Restated Teleflex 401(k) Savings Plan, effective as of January 1, 2011 (incorporated by reference to Exhibit 10.4 to the Company’s Form 10-K filed on February 25, 2011). | ||
| *10.3.3 | — | Second Amendment to Amended and Restated Teleflex 401(k) Savings Plan, effective as of January 10, 2011 (incorporated by reference to Exhibit 10.3.1 to the Company’s Form 10-K filed on February 24, 2012). | ||
| *10.3.4 | — | Third Amendment to Amended and Restated Teleflex 401(k) Savings Plan effective as of August 12, 2011 (incorporated by reference to Exhibit 10.3.2 to the Company’s Form 10-K filed on February 24, 2012). | ||
| 10.3.5 | — | Fourth Amendment to Amended and Restated Teleflex 401(k) Savings Plan, dated August 30, 2012. |
Table of Contents
| Exhibit No. |
|
Description |
||||
| 10.3.6 | — | Fifth Amendment to Amended and Restated Teleflex 401(k) Savings Plan, dated December 26, 2012. | ||||
| +*10.4.1 | — | 2000 Stock Compensation Plan (incorporated by reference to the Company’s registration statement on Form S-8 (Registration No. 333-38224), filed on May 31, 2000). | ||||
| +*10.4.2 | — | Amendment dated March 28, 2012, to 2000 Stock Compensation Plan (incorporated by reference to Exhibit 10.2 to the Company’s Form 10-Q filed on May 1, 2012). | ||||
| +*10.5.1 | — | 2008 Stock Incentive Plan (incorporated by reference to Appendix A to the Company’s definitive Proxy Statement for the 2008 Annual Meeting of Stockholders filed on March 21, 2008). | ||||
| +*10.5.2 | — | Amendment dated March 28, 2012, to 2008 Stock Incentive Plan (incorporated by reference to Exhibit 10.3 to the Company’s Form 10-Q filed on May 1, 2012). | ||||
| +*10.6 | — | Teleflex Incorporated 2011 Executive Incentive Plan (incorporated by reference to Appendix A to the Company’s definitive Proxy Statement for the 2011 Annual Meeting of Stockholders filed on March 25, 2011). | ||||
| +*10.7 | — | Letter Agreement, dated September 23, 2004, between the Company and Laurence G. Miller (incorporated by reference to Exhibit 10(j) to the Company’s Form 10-K filed on March 9, 2005). | ||||
| +*10.8.1 | — | Executive Change In Control Agreement, dated June 21, 2005, between the Company and Laurence G. Miller (incorporated by reference to Exhibit 10(o) to the Company’s Form 10-Q filed on July 27, 2005). | ||||
| +*10.8.2 | — | First Amendment to Executive Change In Control Agreement, effective as of January 1, 2009, between the Company and Laurence G. Miller (incorporated by reference to Exhibit 10.10 to the Company’s Form 10-K filed on February 25, 2009). | ||||
| +*10.9 | — | Executive Change In Control Agreement, dated December 15, 2011, between the Company and Benson F. Smith (incorporated by reference to Exhibit 10.1 to the Company’s Form 8-K filed on December 16, 2011). | ||||
| +*10.10 | — | Executive Change In Control Agreement, dated July 30, 2012, between the Company and Liam Kelly (incorporated by reference to Exhibit 10.3 to the Company’s Form 10-Q filed on July 31, 2012). | ||||
| +*10.11.1 | — | Senior Executive Officer Severance Agreement, dated March 26, 2007, between the Company and Laurence G. Miller (incorporated by reference to Exhibit 10.2 to the Company’s Form 10-Q filed on May 1, 2007). | ||||
| +*10.11.2 | — | First Amendment to Executive Officer Severance Agreement, effective as of January 1, 2009, between the Company and Laurence G. Miller (incorporated by reference to Exhibit 10.19 to the Company’s Form 10-K filed on February 25, 2009). | ||||
| +*10.12 | — | Senior Executive Officer Severance Agreement, dated March 25, 2011, between the Company and Benson F. Smith (incorporated by reference to Exhibit 10.1 to the Company’s Form 10-Q filed on April 26, 2011). | ||||
| +10.13 | — | Senior Executive Officer Severance Agreement, dated July 30, 2012, between the Company and Liam Kelly. | ||||
| +*10.14 | — | Executive Employment Agreement, dated July 30, 2012, between Teleflex Medical Europe Limited and Liam Kelly (incorporated by reference to Exhibit 10.1 to the Company’s Form 10-Q filed on July 31, 2012). | ||||
| *10.15.1 | — | Credit Agreement, dated October 1, 2007, among the Company and JPMorgan Chase Bank, N.A., as administrative agent and as collateral agent, Bank of America, N.A., as syndication agent, the guarantors party thereto, the lenders party thereto and each other party thereto (“Credit Agreement”) (incorporated by reference to Exhibit 10.1 to the Company’s Form 8-K filed on October 5, 2007). | ||||
Table of Contents
| Exhibit No. |
|
Description |
||||
| *10.15.2 | — | Amendment No. 1 to the Credit Agreement dated as of December 22, 2008 (incorporated by reference to Exhibit 10.10 to the Company’s Form 10-K filed on February 25, 2009). | ||||
| *10.15.3 | — | Amendment No. 2 to the Credit Agreement dated as of October 26, 2009 (incorporated by reference to Exhibit 10.20 to the Company’s Form 10-K filed on February 25, 2010). | ||||
| *10.15.4 | — | Amendment No. 3 to the Credit Agreement dated as of August 2, 2010 (incorporated by reference to Exhibit 10.1 to the Company’s Form 8-K/A filed on August 3, 2010). | ||||
| *10.15.5 | — | Amendment No. 4 to the Credit Agreement dated as of March 4, 2011 (incorporated by reference to Exhibit 10.2 to the Company’s Form 8-K filed on March 10, 2011). | ||||
| *10.16 | — | Series A Incremental Term Loan Agreement, dated March 4, 2011, among the Company, the guarantors party thereto, the lenders party thereto and JPMorgan Chase Bank, N.A. , as administrative agent (incorporated by reference to Exhibit 10.1 to the Company’s Form 8-K filed on March 10, 2011). | ||||
| *10.17 | — | Convertible Bond Hedge Transaction Confirmation, dated August 3, 2010, between the Company and Bank of America, National Association, as dealer (incorporated by reference to Exhibit 10.1 to the Company’s Form 8-K filed on August 9, 2010). | ||||
| *10.18 | — | Convertible Bond Hedge Transaction Confirmation, dated August 3, 2010, between the Company and J.P. Morgan Securities Inc., as agent for JPMorgan Chase Bank, National Association, as dealer (incorporated by reference to Exhibit 10.2 to the Company’s Form 8-K filed on August 9, 2010). | ||||
| *10.19 | — | Issuer Warrant Transaction Confirmation, dated August 3, 2010, between the Company and Bank of America, National Association, as dealer (incorporated by reference to Exhibit 10.3 to the Company’s Form 8-K filed on August 9, 2010). | ||||
| *10.20 | — | Issuer Warrant Transaction Confirmation, dated August 3, 2010, between the Company and J.P. Morgan Securities Inc., as agent for JPMorgan Chase Bank, National Association, as dealer (incorporated by reference to Exhibit 10.4 to the Company’s Form 8-K filed on August 9, 2010). | ||||
| 12.1 | — | Computation of ratio of earnings to fixed charges. | ||||
| *14 | — | Code of Ethics policy applicable to the Company’s Chief Executive Officer and senior financial officers (incorporated by reference to Exhibit 14 of the Company’s Form 10-K filed on March 11, 2004). | ||||
| 21 | — | Subsidiaries of the Company. | ||||
| 23 | — | Consent of Independent Registered Public Accounting Firm. | ||||
| 31.1 | — | Certification of Chief Executive Officer pursuant to Rule 13a-14(a) under the Exchange Act. | ||||
| 31.2 | — | Certification of Chief Financial Officer pursuant to Rule 13a-14(a) under the Exchange Act. | ||||
| 32.1 | — | Certification of Chief Executive Officer pursuant to Rule 13a-14(b) under the Exchange Act. | ||||
| 32.2 | — | Certification of Chief Financial Officer pursuant to Rule 13a-14(b) under the Exchange Act. | ||||
| 101.1 | — | The following materials from the Company’s Annual Report on Form 10-K for the year ended December 31, 2012, formatted in XBRL (eXtensible Business Reporting Language): (i) the Consolidated Statements of Income (Loss) for the years ended December 31, 2012, December, 2011 and December 31, 2010; (ii) the Consolidated Statements of Comprehensive Income (Loss) for the years ended December 31, 2012, December 31, 2011 and December 31, 2010; (iii) the Consolidated Balance Sheets as of December 31, 2012 and December 31, 2011; (iv) the Consolidated Statements of Cash Flows for the years ended December 31, 2012, December 31, 2011 and December 31, 2010; (v) the Consolidated Statements of Changes in Equity for the years ended December 31, 2012, December 31, 2011 and December 31, 2010; and (vi) Notes to Consolidated Financial Statements. | ||||
| * | Each such exhibit has previously been filed with the Securities and Exchange Commission as part of the filing indicated and is incorporated herein by reference. |
| + | Indicates management contract or compensatory plan or arrangement required to be filed pursuant to Item 15(b) of this report. |