TREDEGAR CORP
10-Ks and 10-Qs
|
|
|
|
|
|
|
|
|
|
|
|
|
|
|
|
|
|
|
|
|
|
|
|
|
|
|
|
|
|
|
|
|
|
|
|
|
|
|
|
|
|
|
|
|
|
|
|
|
|
|
|
|
UNITED STATES
SECURITIES AND EXCHANGE COMMISSION
Washington, D.C. 20549
FORM 10-Q
(Mark One)
|
x
|
QUARTERLY REPORT PURSUANT TO SECTION 13 OR 15(d) OF THE SECURITIES EXCHANGE ACT OF 1934
|
For the quarterly period ended
June 30, 2015
OR
|
¨
|
TRANSITION REPORT PURSUANT TO SECTION 13 OR 15(d) OF THE SECURITIES EXCHANGE ACT OF 1934
|
For the transition period from
to
Commission file number
1-10258
Tredegar Corporation
(Exact Name of Registrant as Specified in Its Charter)
|
Virginia
|
|
54-1497771
|
|
(State or Other Jurisdiction of
Incorporation or Organization)
|
|
(I.R.S. Employer
Identification No.)
|
|
1100 Boulders Parkway
Richmond, Virginia
|
|
23225
|
|
(Address of Principal Executive Offices)
|
|
(Zip Code)
|
Registrant’s Telephone Number, Including Area Code:
(804) 330-1000
Indicate by check mark whether the registrant (1) has filed all reports required to be filed by Section 13 or 15(d) of the Securities Exchange Act of 1934 during the preceding 12 months (or for such shorter period that the registrant was required to file such reports), and (2) has been subject to such filing requirements for the past 90 days. Yes
x
No
¨
Indicate by check mark whether the registrant has submitted electronically and posted on its corporate Web site, if any, every Interactive Data File required to be submitted and posted pursuant to Rule 405 of Regulation S-T (232.405 of this chapter) during the preceding 12 months (or for such shorter period that the registrant was required to submit and post such files). Yes
x
No
¨
Indicate by check mark whether the registrant is a large accelerated filer, an accelerated filer, a non-accelerated filer, or a smaller reporting company. See the definitions of “large accelerated filer,” “accelerated filer” and “smaller reporting company” in Rule 12b-2 of the Exchange Act.
|
Large accelerated filer
|
x
|
Accelerated filer
|
¨
|
||
|
Non-accelerated filer
|
¨
(Do not check if a smaller reporting company)
|
Smaller reporting company
|
¨
|
||
Indicate by check mark whether the registrant is a shell company (as defined in Rule 12b-2 of the Exchange Act). Yes
¨
No
x
The number of shares of Common Stock, no par value, outstanding as of
July 27, 2015
:
32,674,891
.
|
Item 1.
|
Financial Statements.
|
Tredegar Corporation
(In Thousands, Except Share Data)
(Unaudited)
|
June 30,
|
December 31,
|
||||||
|
2015
|
2014
|
||||||
|
Assets
|
|||||||
|
Current assets:
|
|||||||
|
Cash and cash equivalents
|
$
|
47,405
|
|
$
|
50,056
|
|
|
|
Accounts and other receivables, net of allowance for doubtful accounts and sales returns of $2,830 in 2015 and $2,610 in 2014
|
112,471
|
|
113,341
|
|
|||
|
Income taxes recoverable
|
3,679
|
|
877
|
|
|||
|
Inventories
|
73,400
|
|
74,308
|
|
|||
|
Deferred income taxes
|
8,431
|
|
8,877
|
|
|||
|
Prepaid expenses and other
|
8,017
|
|
8,283
|
|
|||
|
Total current assets
|
253,403
|
|
255,742
|
|
|||
|
Property, plant and equipment, at cost
|
772,414
|
|
790,622
|
|
|||
|
Less accumulated depreciation
|
(521,955
|
)
|
(520,665
|
)
|
|||
|
Net property, plant and equipment
|
250,459
|
|
269,957
|
|
|||
|
Goodwill and other intangibles, net
|
206,844
|
|
215,129
|
|
|||
|
Other assets and deferred charges
|
47,283
|
|
47,798
|
|
|||
|
Total assets
|
$
|
757,989
|
|
$
|
788,626
|
|
|
|
Liabilities and Shareholders’ Equity
|
|||||||
|
Current liabilities:
|
|||||||
|
Accounts payable
|
$
|
84,817
|
|
$
|
94,131
|
|
|
|
Accrued expenses
|
36,211
|
|
32,049
|
|
|||
|
Total current liabilities
|
121,028
|
|
126,180
|
|
|||
|
Long-term debt
|
135,000
|
|
137,250
|
|
|||
|
Deferred income taxes
|
32,953
|
|
39,255
|
|
|||
|
Other noncurrent liabilities
|
113,153
|
|
113,912
|
|
|||
|
Total liabilities
|
402,134
|
|
416,597
|
|
|||
|
Commitments and contingencies (Notes 1 and 13)
|
|
|
|||||
|
Shareholders’ equity:
|
|||||||
|
Common stock, no par value (issued and outstanding - 32,705,198 at June 30, 2015 and 32,422,082 at December 31, 2014)
|
29,954
|
|
24,364
|
|
|||
|
Common stock held in trust for savings restoration plan (66,823 shares at June 30, 2015 and 66,255 shares at December 31, 2014)
|
(1,452
|
)
|
(1,440
|
)
|
|||
|
Accumulated other comprehensive income (loss):
|
|||||||
|
Foreign currency translation adjustment
|
(76,366
|
)
|
(47,270
|
)
|
|||
|
Gain (loss) on derivative financial instruments
|
(985
|
)
|
656
|
|
|||
|
Pension and other post-retirement benefit adjustments
|
(98,536
|
)
|
(103,581
|
)
|
|||
|
Retained earnings
|
503,240
|
|
499,300
|
|
|||
|
Total shareholders’ equity
|
355,855
|
|
372,029
|
|
|||
|
Total liabilities and shareholders’ equity
|
$
|
757,989
|
|
$
|
788,626
|
|
|
See accompanying notes to financial statements.
2
Tredegar Corporation
(In Thousands, Except Per Share Data)
(Unaudited)
|
Three Months Ended June 30,
|
Six Months Ended June 30,
|
||||||||||||||
|
|
2015
|
2014
|
2015
|
2014
|
|||||||||||
|
Revenues and other items:
|
|||||||||||||||
|
Sales
|
$
|
221,245
|
|
$
|
236,965
|
|
$
|
455,416
|
|
$
|
472,178
|
|
|||
|
Other income (expense), net
|
124
|
|
(10,136
|
)
|
232
|
|
(10,230
|
)
|
|||||||
|
221,369
|
|
226,829
|
|
455,648
|
|
461,948
|
|
||||||||
|
Costs and expenses:
|
|||||||||||||||
|
Cost of goods sold
|
183,754
|
|
192,084
|
|
373,185
|
|
382,778
|
|
|||||||
|
Freight
|
7,743
|
|
6,401
|
|
15,068
|
|
13,171
|
|
|||||||
|
Selling, general and administrative
|
21,898
|
|
16,512
|
|
38,971
|
|
34,831
|
|
|||||||
|
Research and development
|
4,267
|
|
3,012
|
|
8,152
|
|
5,991
|
|
|||||||
|
Amortization of intangibles
|
1,040
|
|
1,427
|
|
2,123
|
|
2,822
|
|
|||||||
|
Interest expense
|
893
|
|
531
|
|
1,778
|
|
1,161
|
|
|||||||
|
Asset impairments and costs associated with exit and disposal activities, net of adjustments
|
277
|
|
946
|
|
225
|
|
2,191
|
|
|||||||
|
Total
|
219,872
|
|
220,913
|
|
439,502
|
|
442,945
|
|
|||||||
|
Income before income taxes
|
1,497
|
|
5,916
|
|
16,146
|
|
19,003
|
|
|||||||
|
Income taxes
|
903
|
|
2,164
|
|
5,682
|
|
6,772
|
|
|||||||
|
Net income
|
$
|
594
|
|
$
|
3,752
|
|
$
|
10,464
|
|
$
|
12,231
|
|
|||
|
Earnings per share:
|
|||||||||||||||
|
Basic
|
$
|
0.02
|
|
$
|
0.12
|
|
$
|
0.32
|
|
$
|
0.38
|
|
|||
|
Diluted
|
$
|
0.02
|
|
$
|
0.11
|
|
$
|
0.32
|
|
$
|
0.37
|
|
|||
|
Shares used to compute earnings per share:
|
|||||||||||||||
|
Basic
|
32,609
|
|
32,312
|
|
32,546
|
|
32,277
|
|
|||||||
|
Diluted
|
32,746
|
|
32,641
|
|
32,687
|
|
32,631
|
|
|||||||
|
Dividends per share
|
$
|
0.11
|
|
$
|
0.09
|
|
$
|
0.20
|
|
$
|
0.16
|
|
|||
See accompanying notes to financial statements.
3
Tredegar Corporation
Consolidated Statements of Comprehensive Income (Loss)
(In Thousands)
(Unaudited)
|
Three Months Ended June 30,
|
|||||||
|
|
2015
|
2014
|
|||||
|
Net income
|
$
|
594
|
|
$
|
3,752
|
|
|
|
Other comprehensive income (loss):
|
|||||||
|
Foreign currency translation adjustment (net of tax of $225 in 2015 and tax of $125 in 2014)
|
5,557
|
|
4,145
|
|
|||
|
Derivative financial instruments adjustment (net of tax benefit of $591 in 2015 and tax of $50 in 2014)
|
(979
|
)
|
81
|
|
|||
|
Amortization of prior service costs and net gains or losses (net of tax of $1,462 in 2015 and $997 in 2014)
|
2,523
|
|
1,740
|
|
|||
|
Other comprehensive income (loss)
|
7,101
|
|
5,966
|
|
|||
|
Comprehensive income (loss)
|
$
|
7,695
|
|
$
|
9,718
|
|
|
|
|
Six Months Ended June 30,
|
||||||
|
|
2015
|
2014
|
|||||
|
Net income
|
$
|
10,464
|
|
$
|
12,231
|
|
|
|
Other comprehensive income (loss):
|
|||||||
|
Foreign currency translation adjustment (net of tax benefit of $1,384 in 2015 and tax of $250 in 2014)
|
(29,096
|
)
|
9,240
|
|
|||
|
Derivative financial instruments adjustment (net of tax benefit of $990 in 2015 and tax of $167 in 2014)
|
(1,641
|
)
|
273
|
|
|||
|
Amortization of prior service costs and net gains or losses (net of tax of $2,924 in 2015 and $1,994 in 2014)
|
5,045
|
|
3,480
|
|
|||
|
Other comprehensive income (loss)
|
(25,692
|
)
|
12,993
|
|
|||
|
Comprehensive income (loss)
|
$
|
(15,228
|
)
|
$
|
25,224
|
|
|
See accompanying notes to financial statements.
4
Tredegar Corporation
(In Thousands)
(Unaudited)
|
Six Months Ended June 30,
|
|||||||
|
|
2015
|
2014
|
|||||
|
Cash flows from operating activities:
|
|||||||
|
Net income
|
$
|
10,464
|
|
$
|
12,231
|
|
|
|
Adjustments for noncash items:
|
|||||||
|
Depreciation
|
15,872
|
|
18,163
|
|
|||
|
Amortization of intangibles
|
2,123
|
|
2,822
|
|
|||
|
Deferred income taxes
|
(3,990
|
)
|
(5,318
|
)
|
|||
|
Accrued pension and post-retirement benefits
|
6,258
|
|
3,983
|
|
|||
|
Loss on investment accounted for under the fair value method
|
—
|
|
1,100
|
|
|||
|
Loss on asset impairments and divestitures
|
—
|
|
799
|
|
|||
|
Net gain on disposal of assets
|
—
|
|
(837
|
)
|
|||
|
Changes in assets and liabilities, net of effects of acquisitions and divestitures:
|
|||||||
|
Accounts and other receivables
|
(3,627
|
)
|
(13,399
|
)
|
|||
|
Inventories
|
(2,956
|
)
|
906
|
|
|||
|
Income taxes recoverable/payable
|
(3,046
|
)
|
(2,477
|
)
|
|||
|
Prepaid expenses and other
|
(847
|
)
|
1,124
|
|
|||
|
Accounts payable and accrued expenses
|
(3,938
|
)
|
(3,623
|
)
|
|||
|
Other, net
|
3,050
|
|
1,340
|
|
|||
|
Net cash provided by operating activities
|
19,363
|
|
16,814
|
|
|||
|
Cash flows from investing activities:
|
|||||||
|
Capital expenditures
|
(14,358
|
)
|
(22,884
|
)
|
|||
|
Proceeds from the sale of assets and other
|
585
|
|
4,723
|
|
|||
|
Net cash used in investing activities
|
(13,773
|
)
|
(18,161
|
)
|
|||
|
Cash flows from financing activities:
|
|||||||
|
Borrowings
|
59,000
|
|
32,000
|
|
|||
|
Debt principal payments and financing costs
|
(61,328
|
)
|
(34,250
|
)
|
|||
|
Dividends paid
|
(6,536
|
)
|
(5,176
|
)
|
|||
|
Proceeds from exercise of stock options and other
|
2,794
|
|
(106
|
)
|
|||
|
Net cash used in financing activities
|
(6,070
|
)
|
(7,532
|
)
|
|||
|
Effect of exchange rate changes on cash
|
(2,171
|
)
|
270
|
|
|||
|
Increase (decrease) in cash and cash equivalents
|
(2,651
|
)
|
(8,609
|
)
|
|||
|
Cash and cash equivalents at beginning of period
|
50,056
|
|
52,617
|
|
|||
|
Cash and cash equivalents at end of period
|
$
|
47,405
|
|
$
|
44,008
|
|
|
See accompanying notes to financial statements.
5
Tredegar Corporation
Consolidated Statement of Shareholders’ Equity
(In Thousands, Except Share and Per Share Data)
(Unaudited)
|
|
|
Accumulated Other
Comprehensive Income (Loss)
|
|
||||||||||||||||||||||||
|
|
Common
Stock
|
Retained
Earnings
|
Trust for
Savings
Restoration
Plan
|
Foreign
Currency
Translation
|
Gain
(Loss) on
Derivative
Financial
Instruments
|
Pension &
Other
Post-retirement
Benefit
Adjust.
|
Total
Shareholders’
Equity
|
||||||||||||||||||||
|
Balance at January 1, 2015
|
$
|
24,364
|
|
$
|
499,300
|
|
$
|
(1,440
|
)
|
$
|
(47,270
|
)
|
$
|
656
|
|
$
|
(103,581
|
)
|
$
|
372,029
|
|
||||||
|
Net income
|
—
|
|
10,464
|
|
—
|
|
—
|
|
—
|
|
—
|
|
10,464
|
|
|||||||||||||
|
Other comprehensive income (loss):
|
|||||||||||||||||||||||||||
|
Foreign currency translation adjustment (net of tax benefit of $1,384)
|
—
|
|
—
|
|
—
|
|
(29,096
|
)
|
—
|
|
—
|
|
(29,096
|
)
|
|||||||||||||
|
Derivative financial instruments adjustment (net of tax benefit of $990)
|
—
|
|
—
|
|
—
|
|
—
|
|
(1,641
|
)
|
—
|
|
(1,641
|
)
|
|||||||||||||
|
Amortization of prior service costs and net gains or losses (net of tax of $2,924)
|
—
|
|
—
|
|
—
|
|
—
|
|
—
|
|
5,045
|
|
5,045
|
|
|||||||||||||
|
Cash dividends declared ($0.20 per share)
|
—
|
|
(6,536
|
)
|
—
|
|
—
|
|
—
|
|
—
|
|
(6,536
|
)
|
|||||||||||||
|
Stock-based compensation expense
|
3,129
|
|
—
|
|
—
|
|
—
|
|
—
|
|
—
|
|
3,129
|
|
|||||||||||||
|
Issued upon exercise of stock options & other
|
2,461
|
|
—
|
|
—
|
|
—
|
|
—
|
|
—
|
|
2,461
|
|
|||||||||||||
|
Tredegar common stock purchased by trust for savings restoration plan
|
—
|
|
12
|
|
(12
|
)
|
—
|
|
—
|
|
—
|
|
—
|
|
|||||||||||||
|
Balance at June 30, 2015
|
$
|
29,954
|
|
$
|
503,240
|
|
$
|
(1,452
|
)
|
$
|
(76,366
|
)
|
$
|
(985
|
)
|
$
|
(98,536
|
)
|
$
|
355,855
|
|
||||||
See accompanying notes to financial statements.
6
TREDEGAR CORPORATION
NOTES TO THE CONSOLIDATED INTERIM FINANCIAL STATEMENTS
(Unaudited)
|
1.
|
In the opinion of management, the accompanying consolidated financial statements of Tredegar Corporation and its subsidiaries (“Tredegar,” “the Company,” “we,” “us” or “our”) contain all adjustments necessary to state fairly, in all material respects, Tredegar’s consolidated financial position as of
June 30, 2015
, the consolidated results of operations for the three and
six months
ended
June 30, 2015
and
2014
, the consolidated cash flows for the
six months
ended
June 30, 2015
and
2014
, and the consolidated changes in shareholders’ equity for the
six months
ended
June 30, 2015
. All such adjustments, unless otherwise detailed in the notes to the consolidated interim financial statements, are deemed to be of a normal, recurring nature. The financial position data as of
December 31, 2014
that is included herein was derived from the audited consolidated financial statements provided in the Company’s Annual Report on Form 10-K for the year ended
December 31, 2014
(“
2014
Form 10-K”) but does not include all disclosures required by United States generally accepted accounting principles (“U.S. GAAP
”)
. These financial statements should be read in conjunction with the consolidated financial statements and related notes included in the Company’s
2014
Form 10-K. The results of operations for the
three and six
months ended
June 30, 2015
, are not necessarily indicative of the results to be expected for the full year.
|
|
2.
|
Plant shutdowns, asset impairments, restructurings and other charges are shown in the net sales and operating profit by segment table in Note 9, and unless otherwise noted below, are also included in “Asset impairments and costs associated with exit and disposal activities, net of adjustments” in the consolidated statements of income.
|
Plant shutdowns, asset impairments, restructurings and other charges in the
second quarter
of
2015
include:
|
•
|
Pretax charges of
$3.9 million
(included in “Selling, general and administrative expense” in the consolidated statements of income and “Corporate expenses, net” in the statement of net sales and operating profit by segment included in Note 9) for severance and other employee-related costs associated with the resignation of the Company’s former chief executive and chief financial officers;
|
|
•
|
Pretax charges of
$0.3 million
for severance and other-employee-related costs associated with restructurings in Film Products; and
|
|
•
|
Pretax charges of
$18,000
associated with the shutdown of the aluminum extrusions manufacturing facility in Kentland, Indiana.
|
Plant shutdowns, asset impairments, restructurings and other charges in the first
six months
of
2015
include:
|
•
|
Pretax charges of
$3.9 million
(included in “Selling, general and administrative expense” in the consolidated statements of income and “Corporate expenses, net” in the statement of net sales and operating profit by segment included in Note 9) for severance and other employee-related costs associated with the resignation of the Company’s former chief executive and chief financial officers;
|
|
•
|
Pretax charge of
$0.2 million
for severance and other employee-related costs associated with restructurings in Film Products; and
|
|
•
|
Pretax charges of
$33,000
associated with the shutdown of the aluminum extrusions manufacturing facility in Kentland, Indiana.
|
Plant shutdowns, asset impairments, restructurings and other charges in the
second quarter
of
2014
include:
|
•
|
Pretax charge of
$10 million
(included in “Other income (expense), net” in the consolidated statements of income) associated with a one-time, lump sum license payment to the 3M Company (“3M”) after the Company settled all litigation issues associated with a patent infringement complaint (see Note 13 for additional detail on this legal matter);
|
|
•
|
Pretax charges of
$0.6 million
associated with severance and other employee-related costs associated with restructurings in Film Products;
|
|
•
|
Pretax charges of
$0.3 million
associated with the shutdown of the film products manufacturing facility in Red Springs, North Carolina, which includes severance and other employee-related costs of
$0.2 million
and asset impairment and other shutdown-related charges of
$0.1 million
;
|
|
•
|
Pretax charges of
$0.2 million
related to expected future environmental costs at the Company’s aluminum extrusions manufacturing facility in Newnan, Georgia (included in “Cost of goods sold” in the consolidated statements of income); and
|
7
|
•
|
Pretax charges of
$24,000
associated with the shutdown of the aluminum extrusions manufacturing facility in Kentland, Indiana.
|
Plant shutdowns, asset impairments, restructurings and other charges in the first
six months
of
2014
include:
|
•
|
Pretax charge of
$10 million
associated with a one-time, lump sum license payment to 3M after the Company settled all litigation issues associated with a patent infringement complaint (see Note 13 for additional detail on this legal matter);
|
|
•
|
Pretax charges of
$1.4 million
associated with severance and other employee-related costs associated with restructurings in Film Products;
|
|
•
|
Pretax charges of
$0.7 million
associated with the shutdown of the film products manufacturing facility in Red Springs, North Carolina, which includes severance and other employee-related costs of
$0.4 million
and asset impairment and other shutdown-related charges of
$0.3 million
;
|
|
•
|
Pretax charges of
$0.2 million
related to expected future environmental costs at the Company’s aluminum extrusions manufacturing facility in Newnan, Georgia (included in “Cost of goods sold” in the consolidated statements of income); and
|
|
•
|
Pretax charges of
$24,000
associated with the shutdown of the aluminum extrusions manufacturing facility in Kentland, Indiana.
|
Results in the
second quarter
and first
six months
of
2014
include unrealized gains on the Company’s investment in kaleo, Inc (“kaléo”), which is accounted for under the fair value method (included in “Other income (expense), net” in the consolidated statements of income), of
$1.1 million
(
$0.7 million
after taxes). Unrealized losses (included in “Other income (expense), net” in the consolidated statements of income and “Corporate expenses, net” in the statement of net sales and operating profit by segment) on the Company’s investment in the Harbinger Capital Partners Special Situations Fund, L.P. (“Harbinger Fund”), which is accounted for under the cost method, of
$0.3 million
(
$0.2 million
after taxes) and
$0.6 million
(
$0.4 million
after taxes) in the
second quarter
and first
six months
of
2014
, respectively, as a result of a reduction in the value of the investment that is not expected to be temporary. The Company realized a gain (included in “Other income (expense), net” in the consolidated statements of income) of
$1.2 million
(
$0.8 million
after taxes) on the sale of a portion of its investment property in Alleghany and Bath counties in Virginia in the
second quarter
of
2014
. See Note 6 for additional information on investments.
A reconciliation of the beginning and ending balances of accrued expenses associated with “Asset impairments and costs associated with exit and disposal activities, net of adjustments” in the consolidated statements of income for the
six months ended
June 30, 2015
is as follows:
|
(In Thousands)
|
Severance
|
Other (a)
|
Total
|
||||||||
|
Balance at January 1, 2015
|
$
|
246
|
|
$
|
201
|
|
$
|
447
|
|
||
|
Changes in 2015:
|
|||||||||||
|
Charges
|
192
|
|
33
|
|
225
|
|
|||||
|
Cash spent
|
(361
|
)
|
(91
|
)
|
(452
|
)
|
|||||
|
Balance at June 30, 2015
|
$
|
77
|
|
$
|
143
|
|
$
|
220
|
|
||
|
(a)
|
Other includes other shutdown-related costs associated with the shutdown of the Company’s aluminum extrusions manufacturing facility in Kentland, Indiana.
|
In July 2015, the Company announced its intention to consolidate its domestic production for film products by restructuring its manufacturing facility in Lake Zurich, Illinois. Efforts to transition domestic production from the Lake Zurich manufacturing facility will require various machinery upgrades and equipment transfers to its other manufacturing facilities. Given Film Products’ focus on maintaining product quality and customer satisfaction, the Company anticipates that these activities will require
21
-
24
months to execute.
The Company expects to recognize costs associated with the exit and disposal activities of approximately $4-5 million over the next 21-24 months. Exit and disposal costs include severance charges and other employee-related expenses arising from the termination of employees of approximately $2-3 million and equipment transfers, asset impairments and other shutdown-related costs of approximately
$2 million
. During the same period of time, operating expenses will include the acceleration of approximately
$3 million
of non-cash depreciation expense for certain machinery and equipment at the Lake Zurich manufacturing facility.
8
Total estimated cash expenditures of $13-14 million over the next
21
-
24
months include the following:
|
•
|
Cash outlays associated with previously discussed exit and disposal expenses of approximately
$4 million
;
|
|
•
|
Capital expenditures associated with equipment upgrades at other film products manufacturing facilities in the United States of approximately
$8 million
;
|
|
•
|
Cash incentives of approximately
$1 million
in connection with meeting safety and quality standards while production ramps down at the Lake Zurich manufacturing facility; and
|
|
•
|
Additional operating expenses of approximately
$1 million
associated with customer product qualifications on upgraded and transferred production lines.
|
|
3.
|
The components of inventories are as follows:
|
|
June 30,
|
December 31,
|
|||||||
|
(In Thousands)
|
2015
|
2014
|
||||||
|
Finished goods
|
$
|
15,526
|
|
$
|
17,559
|
|
||
|
Work-in-process
|
10,586
|
|
10,089
|
|
||||
|
Raw materials
|
25,644
|
|
25,227
|
|
||||
|
Stores, supplies and other
|
21,644
|
|
21,433
|
|
||||
|
Total
|
$
|
73,400
|
|
$
|
74,308
|
|
||
|
4.
|
Basic earnings per share is computed by dividing net income by the weighted average number of shares of common stock outstanding. Diluted earnings per share is computed by dividing net income by the weighted average common and potentially dilutive common equivalent shares outstanding, determined as follows:
|
|
Three Months Ended
|
Six Months Ended
|
||||||||||
|
|
June 30,
|
June 30,
|
|||||||||
|
(In Thousands)
|
2015
|
2014
|
2015
|
2014
|
|||||||
|
Weighted average shares outstanding used to compute basic earnings per share
|
32,609
|
|
32,312
|
|
32,546
|
|
32,277
|
|
|||
|
Incremental dilutive shares attributable to stock options and restricted stock
|
137
|
|
329
|
|
141
|
|
354
|
|
|||
|
Shares used to compute diluted earnings per share
|
32,746
|
|
32,641
|
|
32,687
|
|
32,631
|
|
|||
Incremental shares attributable to stock options and restricted stock are computed under the treasury stock method using the average market price during the related period. For the three and
six months ended
June 30, 2015
, average out-of-the-money options to purchase shares that were excluded from the calculation of incremental shares attributable to stock options and restricted stock were
327,697
and
356,228
, respectively. For the three and
six months ended
June 30, 2014
, average out-of-the-money options to purchase shares that were excluded from the calculation of incremental shares attributable to stock options and restricted stock were
227,094
and
170,972
, respectively.
|
5.
|
The following table summarizes the after-tax changes in accumulated other comprehensive income (loss) for the
six months ended
June 30, 2015
:
|
|
(In Thousands)
|
Foreign
currency
translation
adjustment
|
Gain (loss) on
derivative
financial
instruments
|
Pension and
other
post-retirement
benefit
adjustments
|
Total
|
|||||||||||
|
Beginning balance, January 1, 2015
|
$
|
(47,270
|
)
|
$
|
656
|
|
$
|
(103,581
|
)
|
$
|
(150,195
|
)
|
|||
|
Other comprehensive income (loss) before reclassifications
|
(29,096
|
)
|
(1,950
|
)
|
—
|
|
(31,046
|
)
|
|||||||
|
Amounts reclassified from accumulated other comprehensive income (loss)
|
—
|
|
309
|
|
5,045
|
|
5,354
|
|
|||||||
|
Net other comprehensive income (loss) - current period
|
(29,096
|
)
|
(1,641
|
)
|
5,045
|
|
(25,692
|
)
|
|||||||
|
Ending balance, June 30, 2015
|
$
|
(76,366
|
)
|
$
|
(985
|
)
|
$
|
(98,536
|
)
|
$
|
(175,887
|
)
|
|||
9
The following table summarizes the after-tax changes in accumulated other comprehensive income (loss) for the
six months ended
June 30, 2014
:
|
(In Thousands)
|
Foreign
currency translation adjustment |
Gain (loss) on
derivative financial instruments |
Pension and
other post-retirement benefit adjustments |
Total
|
|||||||||||
|
Beginning balance, January 1, 2014
|
$
|
(19,205
|
)
|
$
|
765
|
|
$
|
(71,848
|
)
|
$
|
(90,288
|
)
|
|||
|
Other comprehensive income (loss) before reclassifications
|
9,240
|
|
302
|
|
—
|
|
9,542
|
|
|||||||
|
Amounts reclassified from accumulated other comprehensive income (loss)
|
—
|
|
(29
|
)
|
3,480
|
|
3,451
|
|
|||||||
|
Net other comprehensive income (loss) - current period
|
9,240
|
|
273
|
|
3,480
|
|
12,993
|
|
|||||||
|
Ending balance, June 30, 2014
|
$
|
(9,965
|
)
|
$
|
1,038
|
|
$
|
(68,368
|
)
|
$
|
(77,295
|
)
|
|||
Reclassifications of balances out of accumulated other comprehensive income (loss) into net income for the three months
June 30, 2015
are summarized as follows:
|
(In Thousands)
|
Amount
reclassified from other comprehensive income |
Location of gain
(loss) reclassified from accumulated other comprehensive income to net income |
|||
|
Gain (loss) on derivative financial instruments:
|
|||||
|
Aluminum future contracts, before taxes
|
$
|
(481
|
)
|
Cost of sales
|
|
|
Foreign currency forward contracts, before taxes
|
16
|
|
Cost of sales
|
||
|
Total, before taxes
|
(465
|
)
|
|||
|
Income tax expense (benefit)
|
(176
|
)
|
Income taxes
|
||
|
Total, net of tax
|
$
|
(289
|
)
|
||
|
Amortization of pension and other post-retirement benefits:
|
|||||
|
Actuarial gain (loss) and prior service costs, before taxes
|
$
|
(3,985
|
)
|
(a)
|
|
|
Income tax expense (benefit)
|
(1,462
|
)
|
Income taxes
|
||
|
Total, net of tax
|
$
|
(2,523
|
)
|
||
|
(a)
|
This component of accumulated other comprehensive income is included in the computation of net periodic pension cost (see Note 8 for additional detail).
|
10
Reclassifications of balances out of accumulated other comprehensive income (loss) into net income for the
six months ended
June 30, 2015
are summarized as follows:
:
|
(In Thousands)
|
Amount
reclassified from
other
comprehensive
income
|
Location of gain
(loss) reclassified
from accumulated
other
comprehensive
income to net
income
|
|||
|
Gain (loss) on derivative financial instruments:
|
|||||
|
Aluminum future contracts, before taxes
|
$
|
(529
|
)
|
Cost of sales
|
|
|
Foreign currency forward contracts, before taxes
|
31
|
|
Cost of sales
|
||
|
Total, before taxes
|
(498
|
)
|
|||
|
Income tax expense (benefit)
|
(189
|
)
|
Income taxes
|
||
|
Total, net of tax
|
$
|
(309
|
)
|
||
|
Amortization of pension and other post-retirement benefits:
|
|||||
|
Actuarial gain (loss) and prior service costs, before taxes
|
$
|
(7,969
|
)
|
(a)
|
|
|
Income tax expense (benefit)
|
(2,924
|
)
|
Income taxes
|
||
|
Total, net of tax
|
$
|
(5,045
|
)
|
||
|
(a)
|
This component of accumulated other comprehensive income is included in the computation of net periodic pension cost (see Note 8 for additional detail).
|
Reclassifications of balances out of accumulated other comprehensive income (loss) into net income for the three months
June 30, 2014
are summarized as follows:
|
(In Thousands)
|
Amount
reclassified from other comprehensive income |
Location of gain
(loss) reclassified from accumulated other comprehensive income to net income |
|||
|
Gain (loss) on derivative financial instruments:
|
|||||
|
Aluminum future contracts, before taxes
|
$
|
83
|
|
Cost of sales
|
|
|
Foreign currency forward contracts, before taxes
|
—
|
|
|||
|
Total, before taxes
|
83
|
|
|||
|
Income tax expense (benefit)
|
31
|
|
Income taxes
|
||
|
Total, net of tax
|
$
|
52
|
|
||
|
Amortization of pension and other post-retirement benefits:
|
|||||
|
Actuarial gain (loss) and prior service costs, before taxes
|
$
|
(2,737
|
)
|
(a)
|
|
|
Income tax expense (benefit)
|
(997
|
)
|
Income taxes
|
||
|
Total, net of tax
|
$
|
(1,740
|
)
|
||
|
(a)
|
This component of accumulated other comprehensive income is included in the computation of net periodic pension cost (see Note 8 for additional detail).
|
11
Reclassifications of balances out of accumulated other comprehensive income (loss) into net income for the
six months ended
June 30, 2014
are summarized as follows:
|
(In Thousands)
|
Amount
reclassified from other comprehensive income |
Location of gain
(loss) reclassified from accumulated other comprehensive income to net income |
|||
|
Gain (loss) on derivative financial instruments:
|
|||||
|
Aluminum future contracts, before taxes
|
$
|
46
|
|
Cost of sales
|
|
|
Foreign currency forward contracts, before taxes
|
—
|
|
|||
|
Total, before taxes
|
46
|
|
|||
|
Income tax expense (benefit)
|
17
|
|
Income taxes
|
||
|
Total, net of tax
|
$
|
29
|
|
||
|
Amortization of pension and other post-retirement benefits:
|
|||||
|
Actuarial gain (loss) and prior service costs, before taxes
|
$
|
(5,474
|
)
|
(a)
|
|
|
Income tax expense (benefit)
|
(1,994
|
)
|
Income taxes
|
||
|
Total, net of tax
|
$
|
(3,480
|
)
|
||
|
(a)
|
This component of accumulated other comprehensive income is included in the computation of net periodic pension cost (see Note 8 for additional detail).
|
|
6.
|
In August 2007 and December 2008, the Company made an aggregate investment of
$7.5 million
in kaléo, a privately held specialty pharmaceutical company. The mission of kaléo is to set a new standard in life-saving personal medical products designed to enable superior treatment outcomes, improved cost effectiveness and intuitive patient administration. Tredegar’s ownership interest on a fully diluted basis is approximately
20%
, and the investment is accounted for under the fair value method. At the time of the initial investment, the Company elected the fair value option over the equity method of accounting since its investment objectives were similar to those of venture capitalists, which typically do not have controlling financial interests.
|
The estimated fair value of the investment in kaléo (also the carrying value, which is included in “Other assets and deferred charges” in the consolidated balance sheet) was
$39.1 million
at
June 30, 2015
and
December 31, 2014
, respectively. The fair value estimates are based upon significant unobservable (Level 3) inputs since there is no secondary market for our ownership interest. Accordingly, until the next round of financing or other significant financial transaction, value estimates will primarily be based on assumptions relating to meeting product development and commercialization milestones, corresponding cash flow projections (projections of sales, costs, expenses, capital expenditures and working capital investment) and discounting of these factors for the high degree of risk. Adjustments to the estimated fair value of the Company’s investment in kaléo will be made in the period during which changes can be quantified.
The Company recognized an unrealized loss on its investment in kaléo (included in “Other income (expense), net” in the consolidated statements of income) of
$1.1 million
in the
second quarter
and first
six months
of
2014
(none in the
second quarter
and first
six months
of
2015
). The unrealized loss in the second quarter of 2014 was primarily attributed to adjustments in the timing of cash flows associated with achieving product development and commercialization milestones.
The fair market valuation of the Company’s interest in kaléo is sensitive to changes in the weighted average cost of capital used to discount cash flow projections for the high degree of risk associated with meeting development and commercialization milestones as anticipated. The weighted average cost of capital used in the fair market valuation of Tredegar’s interest in kaléo was
45%
at
June 30, 2015
and
December 31, 2014
. At
June 30, 2015
, the effect of a 500 basis point decrease in the weighted average cost of capital assumption would have increased the fair value of the interest in kaléo by approximately
$7 million
, and a 500 basis point increase in the weighted average cost of capital assumption would have decreased the fair value of the interest by approximately
$5 million
.
12
Had the Company not elected to account for its investment under the fair value method, it would have been required to use the equity method of accounting. The condensed balance sheets for kaléo at
June 30, 2015
and
December 31, 2014
and condensed statement of operations for the
three and six
months ended
June 30, 2015
and
2014
, as reported to the Company by kaléo, are provided below:
|
(In Thousands)
|
June 30, 2015
|
December 31, 2014
|
|
June 30, 2015
|
December 31, 2014
|
|||||||||||
|
Assets:
|
Liabilities & Equity:
|
|||||||||||||||
|
Cash & short-term investments
|
$
|
101,407
|
|
$
|
117,589
|
|
||||||||||
|
Restricted cash
|
8,289
|
|
14,498
|
|
Other current liabilities
|
$
|
6,792
|
|
$
|
8,123
|
|
|||||
|
Other current assets
|
21,609
|
|
17,916
|
|
Other noncurrent liabilities
|
1,182
|
|
1,247
|
|
|||||||
|
Property & equipment
|
9,526
|
|
10,824
|
|
Long term debt, net (b)
|
146,984
|
|
146,629
|
|
|||||||
|
Patents
|
2,749
|
|
2,702
|
|
Redeemable preferred stock
|
23,430
|
|
22,946
|
|
|||||||
|
Other long-term assets (b)
|
669
|
|
15
|
|
Equity
|
(34,139
|
)
|
(15,401
|
)
|
|||||||
|
Total assets
|
$
|
144,249
|
|
$
|
163,544
|
|
Total liabilities & equity
|
$
|
144,249
|
|
$
|
163,544
|
|
|||
|
Three Months Ended June 30,
|
Six Months Ended June 30,
|
||||||||||||||
|
|
2015
|
2014
|
2015
|
2014
|
|||||||||||
|
Revenues & Expenses:
|
|||||||||||||||
|
Revenues
|
$
|
10,068
|
|
$
|
4,410
|
|
$
|
14,918
|
|
$
|
6,968
|
|
|||
|
Cost of goods sold
|
(2,807
|
)
|
—
|
|
(5,137
|
)
|
—
|
|
|||||||
|
Expenses and other, net (a)
|
(14,006
|
)
|
(14,658
|
)
|
(28,390
|
)
|
(22,974
|
)
|
|||||||
|
Income tax benefit (expense)
|
—
|
|
3,892
|
|
(4
|
)
|
6,131
|
|
|||||||
|
Net income (loss)
|
$
|
(6,745
|
)
|
$
|
(6,356
|
)
|
$
|
(18,613
|
)
|
$
|
(9,875
|
)
|
|||
(a) “Expenses and other, net” includes selling, general and administrative expense, research and development expense, interest expense and other income (expense), net.
(b) Certain prior year balances have been reclassified to conform with current year presentation.
The Company’s investment in the Harbinger Fund had a carrying value (included in “Other assets and deferred charges”) of
$1.8 million
at
June 30, 2015
and
December 31, 2014
, respectively. The carrying value at
June 30, 2015
reflected Tredegar’s cost basis in its investment in the Harbinger Fund, net of total withdrawal proceeds received and unrealized losses. The Company recorded unrealized losses of
$0.3 million
and
$0.6 million
in the
second quarter
and first
six months
of
2014
, respectively, on its investment in the Harbinger Fund (included in “Other income (expense), net” in the consolidated statements of income) as a result of a reduction in the value of the investment that is not expected to be temporary (none in the
second quarter
and first
six months
of
2015
). Withdrawal proceeds were
$0.2 million
in the first
six months
of
2014
(none in the first
six months
of
2015
). The timing and amount of future installments of withdrawal proceeds, which commenced in August 2010, were not known as of
June 30, 2015
. Gains on the Company’s investment in the Harbinger Fund will be recognized when the amounts expected to be collected from any withdrawal from the investment are known, which will likely be when cash in excess of the remaining carrying value is received. Losses will be recognized when management believes it is probable that future withdrawal proceeds will not exceed the remaining carrying value.
Tredegar has investment property in Alleghany and Bath Counties, Virginia. The Company realized a gain (included in “Other income (expense), net” in the consolidated statements of income) of
$1.2 million
(
$0.8 million
after taxes) on the sale of a portion of this investment property in the second quarter of 2014. The carrying value in this investment property (included in “Other assets and deferred charges” on the consolidated balance sheets) was
$2.6 million
at
June 30, 2015
and
December 31, 2014
.
|
7.
|
The Company uses derivative financial instruments for the purpose of hedging margin exposure from fixed-price forward sales contracts in Aluminum Extrusions and currency exchange rate exposures that exist due to specified transactions. When possible, derivative financial instruments utilized by Tredegar are designated as and qualify as cash flow hedges and are recognized in the balance sheet at fair value. A change in the fair value of derivatives that are highly effective and that are designated and qualify as cash flow hedges is recorded in other comprehensive income
|
13
(loss). Gains and losses reported in other comprehensive income (loss) are reclassified to earnings in the periods in which earnings are affected by the variability of cash flows of the hedged transaction. Such gains and losses are reported on the same line as the underlying hedged item. Any hedge ineffectiveness (which represents the amount by which the changes in the fair value of the derivative exceed the variability in the cash flows of the forecasted transaction) is recorded in current period earnings. The amount of gains and losses recognized for hedge ineffectiveness was not material to the
three and six
month periods ended
June 30, 2015
and
2014
.
The fair value of derivative instruments recorded on the consolidated balance sheets is based upon Level 2 inputs within the corresponding commodity or foreign currency markets. If individual derivative instruments with the same counterparty can be settled on a net basis, the Company records the corresponding derivative fair values as a net asset or net liability.
In the normal course of business, the Company enters into fixed-price forward sales contracts with certain customers for the future sale of fixed quantities of aluminum extrusions at scheduled intervals. In order to hedge the margin exposure created from the fixing of future sales prices relative to volatile raw material (aluminum) costs, the Company enters into a combination of forward purchase commitments and futures contracts to acquire or hedge aluminum, based on the scheduled purchases for the firm sales commitments. The fixed-price firm sales commitments and related hedging instruments generally have durations of not more than 12 months, and the notional amount of aluminum futures contracts that hedged future purchases of aluminum to meet fixed-price forward sales contract obligations was
$23.3 million
(
23.8 million
pounds of aluminum) at
June 30, 2015
and
$8.6 million
(
7.8 million
pounds of aluminum) at
December 31, 2014
.
The table below summarizes the location and gross amounts of aluminum futures contract fair values in the consolidated balance sheets as of
June 30, 2015
and
December 31, 2014
:
|
|
June 30, 2015
|
December 31, 2014
|
|||||||||
|
(In Thousands)
|
Balance Sheet
Account
|
Fair
Value
|
Balance Sheet
Account
|
Fair
Value
|
|||||||
|
Derivatives Designated as Hedging Instruments
|
|||||||||||
|
Asset derivatives:
Aluminum futures contracts |
Accrued expenses
|
$
|
—
|
|
Accrued expenses
|
$
|
82
|
|
|||
|
Liability derivatives:
Aluminum futures contracts |
Accrued expenses
|
$
|
(2,836
|
)
|
Accrued expenses
|
$
|
(318
|
)
|
|||
|
Derivatives Not Designated as Hedging Instruments
|
|||||||||||
|
Asset derivatives:
Aluminum futures contracts |
Accrued expenses
|
$
|
29
|
|
Accrued expenses
|
$
|
7
|
|
|||
|
Liability derivatives:
Aluminum futures contracts |
Accrued expenses
|
$
|
(29
|
)
|
Accrued expenses
|
$
|
(7
|
)
|
|||
|
Net asset (liability)
|
$
|
(2,836
|
)
|
$
|
(236
|
)
|
|||||
In the event that the counterparty to an aluminum fixed-price forward sales contract chooses to not take delivery of its aluminum extrusions, the customer is contractually obligated to compensate us for any losses on the related aluminum futures and/or forward purchase contracts through the date of cancellation. The offsetting asset and liability positions for derivatives not designated as hedging instruments are associated with the unwinding of aluminum futures contracts that relate to such cancellations.
Film Products utilized future fixed Euro-denominated contractual payments for equipment being purchased as part of our multi-year capacity expansion project at our film products manufacturing facility in Cabo de Santo Agostinho, Brazil. The Company used fixed-rate Euro forward contracts with various settlement dates to hedge exchange rate exposure on these obligations. The Company did not have any fixed-rate forward contracts with outstanding notional amounts as of
June 30, 2015
or
December 31, 2014
.
These derivative contracts involve elements of market risk that are not reflected on the consolidated balance sheet, including the risk of dealing with counterparties and their ability to meet the terms of the contracts. The counterparties to any forward purchase commitments are major aluminum brokers and suppliers, and the counterparties to any aluminum futures contracts are major financial institutions. Fixed-price forward sales contracts are only made available to the best and most credit-worthy customers. The counterparties to our foreign currency futures and zero-cost collar contracts are major financial institutions.
14
The effect on net income and other comprehensive income (loss) of derivative instruments classified as cash flow hedges and described in the previous paragraphs for the
three and six
month periods ended
June 30, 2015
and
2014
is summarized in the table below:
|
(In Thousands)
|
Cash Flow Derivative Hedges
|
||||||||||||||
|
|
Aluminum Futures
Contracts
|
Foreign Currency
Forwards
|
|||||||||||||
|
|
Three Months Ended June 30,
|
||||||||||||||
|
|
2015
|
2014
|
2015
|
2014
|
|||||||||||
|
Amount of pre-tax gain (loss) recognized in other comprehensive income
|
$
|
(2,035
|
)
|
$
|
233
|
|
$
|
—
|
|
$
|
(13
|
)
|
|||
|
Location of gain (loss) reclassified from accumulated other comprehensive income into net income (effective portion)
|
Cost of
sales |
|
Cost of
sales |
|
Cost of
sales |
|
|||||||||
|
Amount of pre-tax gain (loss) reclassified from accumulated other comprehensive income to net income (effective portion)
|
$
|
(481
|
)
|
$
|
83
|
|
$
|
16
|
|
$
|
—
|
|
|||
|
|
Aluminum Futures
Contracts
|
Foreign Currency
Forwards
|
|||||||||||||
|
|
Six Months Ended June 30,
|
||||||||||||||
|
|
2015
|
2014
|
2015
|
2014
|
|||||||||||
|
Amount of pre-tax gain (loss) recognized in other comprehensive income
|
$
|
(3,129
|
)
|
$
|
497
|
|
$
|
—
|
|
$
|
(5
|
)
|
|||
|
Location of gain (loss) reclassified from accumulated other comprehensive income into net income (effective portion)
|
Cost of
sales |
|
Cost of
sales |
|
Cost of
sales |
|
|||||||||
|
Amount of pre-tax gain (loss) reclassified from accumulated other comprehensive income to net income (effective portion)
|
$
|
(529
|
)
|
$
|
46
|
|
$
|
31
|
|
$
|
—
|
|
|||
As of
June 30, 2015
, the Company expects
$1.8 million
of unrealized after-tax losses on derivative instruments reported in accumulated other comprehensive income (loss) to be reclassified to earnings within the next 12 months. For the
three and six
month periods ended
June 30, 2015
and
2014
, net gains or losses realized on previously unrealized net gains or losses from hedges that had been discontinued were not significant.
15
|
8.
|
The Company sponsors noncontributory defined benefit (pension) plans covering most employees. The plans for salaried and hourly employees currently in effect are based on a formula using the participant’s years of service and compensation or using the participant’s years of service and a dollar amount. The plan is closed to new participants, and based on plan changes announced in 2006, pay for active plan participants was frozen as of December 31, 2007. Beginning in the first quarter of 2014, with the exception of plan participants at two of Tredegar’s U.S. manufacturing facilities, the plan no longer accrued benefits associated with crediting employees for service, thereby freezing future benefits under the plan.
|
The components of net periodic benefit cost for our pension and other post-retirement benefit programs reflected in consolidated results are shown below:
|
Pension Benefits
|
Other Post-Retirement Benefits
|
||||||||||||||
|
|
Three Months Ended June 30,
|
Three Months Ended June 30,
|
|||||||||||||
|
(In Thousands)
|
2015
|
2014
|
2015
|
2014
|
|||||||||||
|
Service cost
|
$
|
144
|
|
$
|
105
|
|
$
|
12
|
|
$
|
13
|
|
|||
|
Interest cost
|
3,313
|
|
3,342
|
|
83
|
|
93
|
|
|||||||
|
Expected return on plan assets
|
(4,407
|
)
|
(4,558
|
)
|
—
|
|
—
|
|
|||||||
|
Amortization of prior service costs, gains or losses and net transition asset
|
4,024
|
|
2,814
|
|
(40
|
)
|
(77
|
)
|
|||||||
|
Net periodic benefit cost
|
$
|
3,074
|
|
$
|
1,703
|
|
$
|
55
|
|
$
|
29
|
|
|||
|
Pension Benefits
|
Other Post-Retirement Benefits
|
||||||||||||||
|
|
Six Months Ended June 30,
|
Six Months Ended June 30,
|
|||||||||||||
|
|
2015
|
2014
|
2015
|
2014
|
|||||||||||
|
Service cost
|
$
|
288
|
|
$
|
649
|
|
$
|
24
|
|
$
|
26
|
|
|||
|
Interest cost
|
6,625
|
|
6,683
|
|
167
|
|
186
|
|
|||||||
|
Expected return on plan assets
|
(8,814
|
)
|
(9,116
|
)
|
—
|
|
—
|
|
|||||||
|
Amortization of prior service costs, (gains) losses and net transition asset
|
8,048
|
|
5,628
|
|
(80
|
)
|
(154
|
)
|
|||||||
|
Curtailment charge
|
—
|
|
81
|
|
—
|
|
—
|
|
|||||||
|
Net periodic benefit cost
|
$
|
6,147
|
|
$
|
3,925
|
|
$
|
111
|
|
$
|
58
|
|
|||
Pension and other post-retirement liabilities were
$102.8 million
and
$104.8 million
at
June 30, 2015
and
December 31, 2014
, respectively (
$0.6 million
included in “Accrued expenses” at
June 30, 2015
and
December 31, 2014
, with the remainder included in “Other noncurrent liabilities” in the consolidated balance sheets). The Company’s required contributions are expected to be approximately
$2.4 million
in
2015
. Tredegar funds its other post-retirement benefits (life insurance and health benefits) on a claims-made basis, which the Company anticipates will be consistent with amounts paid for the year ended
December 31, 2014
, or
$0.3 million
.
16
|
9.
|
The Company's business segments are Film Products and Aluminum Extrusions. Information by business segment is reported below. There are no accounting transactions between segments and no allocations to segments. Net sales (sales less freight) and operating profit from ongoing operations are the measures of sales and operating profit used by the chief operating decision maker for purposes of assessing performance. The following table presents net sales and operating profit by segment for the
three and six
month periods ended
June 30, 2015
and
2014
:
|
|
Three Months Ended June 30,
|
Six Months Ended June 30,
|
||||||||||||||
|
(In Thousands)
|
2015
|
2014
|
2015
|
2014
|
|||||||||||
|
Net Sales
|
|||||||||||||||
|
Film Products
|
$
|
115,299
|
|
$
|
146,016
|
|
$
|
248,500
|
|
$
|
295,176
|
|
|||
|
Aluminum Extrusions
|
98,203
|
|
84,548
|
|
191,848
|
|
163,831
|
|
|||||||
|
Total net sales
|
213,502
|
|
230,564
|
|
440,348
|
|
459,007
|
|
|||||||
|
Add back freight
|
7,743
|
|
6,401
|
|
15,068
|
|
13,171
|
|
|||||||
|
Sales as shown in the Consolidated Statements of Income
|
221,245
|
|
236,965
|
|
455,416
|
|
472,178
|
|
|||||||
|
Operating Profit
|
|||||||||||||||
|
Film Products:
|
|||||||||||||||
|
Ongoing operations
|
6,178
|
|
14,963
|
|
23,795
|
|
31,685
|
|
|||||||
|
Plant shutdowns, asset impairments, restructurings and other
|
(259
|
)
|
(10,923
|
)
|
(192
|
)
|
(12,168
|
)
|
|||||||
|
Aluminum Extrusions:
|
|||||||||||||||
|
Ongoing operations
|
8,299
|
|
8,050
|
|
13,591
|
|
12,811
|
|
|||||||
|
Plant shutdowns, asset impairments, restructurings and other
|
(18
|
)
|
(174
|
)
|
(33
|
)
|
(174
|
)
|
|||||||
|
Total
|
14,200
|
|
11,916
|
|
37,161
|
|
32,154
|
|
|||||||
|
Interest income
|
82
|
|
107
|
|
171
|
|
302
|
|
|||||||
|
Interest expense
|
893
|
|
531
|
|
1,778
|
|
1,161
|
|
|||||||
|
Gain (loss) on investment accounted for under fair value method
|
—
|
|
(1,100
|
)
|
—
|
|
(1,100
|
)
|
|||||||
|
Gain on sale of investment property
|
—
|
|
1,208
|
|
—
|
|
1,208
|
|
|||||||
|
Stock option-based compensation costs
|
198
|
|
345
|
|
498
|
|
586
|
|
|||||||
|
Corporate expenses, net
|
11,694
|
|
5,339
|
|
18,910
|
|
11,814
|
|
|||||||
|
Income before income taxes
|
1,497
|
|
5,916
|
|
16,146
|
|
19,003
|
|
|||||||
|
Income taxes
|
903
|
|
2,164
|
|
5,682
|
|
6,772
|
|
|||||||
|
Net income
|
$
|
594
|
|
$
|
3,752
|
|
$
|
10,464
|
|
$
|
12,231
|
|
|||
The following table presents identifiable assets by segment at
June 30, 2015
and
December 31, 2014
:
|
(In Thousands)
|
June 30, 2015
|
December 31, 2014
|
|||||
|
Film Products
|
$
|
506,707
|
|
$
|
546,210
|
|
|
|
Aluminum Extrusions
|
152,277
|
|
143,328
|
|
|||
|
Subtotal
|
658,984
|
|
689,538
|
|
|||
|
General corporate
|
51,600
|
|
49,032
|
|
|||
|
Cash and cash equivalents
|
47,405
|
|
50,056
|
|
|||
|
Total
|
$
|
757,989
|
|
$
|
788,626
|
|
|
17
|
10.
|
The effective tax rate in the first
six months
of
2015
was
35.2%
compared to
35.6%
in the first
six months
of
2014
. The significant differences between the U.S. federal statutory rate and the effective income tax rate for the
six months
ended
June 30, 2015
and
2014
are as follows:
|
|
|
Percent of Income
Before Income Taxes
|
||||
|
Six Months Ended June 30,
|
2015
|
2014
|
|||
|
Income tax expense at federal statutory rate
|
35.0
|
|
35.0
|
|
|
|
State taxes, net of federal income tax benefit
|
2.1
|
|
2.0
|
|
|
|
Income tax contingency accruals and tax settlements
|
2.1
|
|
1.7
|
|
|
|
Non-deductible expenses
|
1.0
|
|
0.2
|
|
|
|
Valuation allowance for foreign operating loss carry-forwards
|
1.0
|
|
—
|
|
|
|
Unremitted earnings from foreign operations
|
0.5
|
|
1.0
|
|
|
|
Foreign tax incentives
|
—
|
|
(0.5
|
)
|
|
|
Changes in estimates related to prior year tax provision
|
(0.4
|
)
|
0.3
|
|
|
|
Foreign rate differences
|
(0.5
|
)
|
(0.4
|
)
|
|
|
Valuation allowance for capital loss carry-forwards
|
(1.9
|
)
|
(1.3
|
)
|
|
|
Domestic production activities deduction
|
(3.7
|
)
|
(2.3
|
)
|
|
|
Other
|
—
|
|
(0.1
|
)
|
|
|
Effective income tax rate
|
35.2
|
|
35.6
|
|
|
In 2014, the Brazilian federal statutory income tax rate was a composite of
34.0%
(
25.0%
of income tax and
9.0%
of social contribution on income). Terphane Holdings, LLC’s (“Terphane
”
) manufacturing facility in Brazil is the beneficiary of certain income tax incentives that allow for a reduction in the statutory Brazilian federal income tax rate levied on the operating profit of its products. These incentives produced a current effective tax rate of
15.25%
for Terphane Ltda. (
6.25%
of income tax and
9.0%
social contribution on income). These incentives expired at the end of 2014. The Company anticipates that it will qualify for additional incentives that extend beyond 2014, but the future benefit will not be recorded until the amount and extent of these incentives are more fully known. The benefit from tax incentives was
$0.1 million
(
$0.00
per share) in the first
six months
of
2014
.
In connection with its capacity expansion project in Brazil, the Company has paid certain social taxes associated with the purchase of machinery and equipment and construction of buildings and other long-term assets. Payments of these taxes in Brazil were included in “Net cash used in investing activities” given the nature of the underlying use of cash (e.g. the purchase of property, plant and equipment). The Company can recover tax credits associated with the purchase of machinery and equipment at different points over a period up to
24
months. Once the machinery and equipment was placed into service, the Company started applying these tax credits against various other taxes due in Brazil, with their recovery being reflected as cash received from investing activities, consistent with the classification of the original payments.
Income taxes in
2015
included a partial reversal of a valuation allowance of
$0.3 million
related to the expected limitations on the utilization of assumed capital losses on certain investments that were recognized in prior years. Income taxes in
2014
included the partial reversal of a valuation allowance of
$0.2 million
related to the expected limitations on the utilization of assumed capital losses on certain investments. The Company has a valuation allowance for excess capital losses from investments and other related items of
$11.1 million
at
June 30, 2015
. Tredegar continues to evaluate opportunities to utilize these loss carryforwards prior to their expiration at various dates in the future. As events and circumstances warrant, allowances will be reversed when it is more likely than not that future taxable income will exceed deductible amounts, thereby resulting in the realization of deferred tax assets.
Tredegar and its subsidiaries file income tax returns in the U.S., various states and jurisdictions outside the U.S. With few exceptions, Tredegar and its subsidiaries are no longer subject to U.S. federal, state or non-U.S. income tax examinations by tax authorities for years before 2011.
18
|
11.
|
On March 31, 2015, Tredegar entered into Amendment No. 2 (the “Amendment”) to its
$350 million
five
-year, unsecured revolving credit facility (as amended, the “Credit Agreement”) dated as of April 23, 2012. The Amendment removes the negative covenant prohibiting Consolidated Stockholders’ Equity, at any time, to be less than
$320 million
increased on a cumulative basis at the end of each fiscal quarter, beginning with the fiscal quarter ending March 31, 2012, by an amount equal to
50%
of Consolidated Net Income (to the extent positive) for the fiscal quarter then ended.
|
|
12.
|
Pursuant to the Second Amended and Restated Rights Agreement (the “Rights Agreement”), dated as of November 18, 2013, with Computershare Trust Company, N.A., as Rights Agent,
one
purchase right (a “Right”) was attached to each outstanding share of the Company’s Common Stock. Each Right entitled the registered holder to purchase from Tredegar one one-hundredth of a share of our Series A Participating Cumulative Preferred Stock (the “Preferred Stock”) at an exercise price of
$150
, subject to adjustment (the “Purchase Price”). Unless otherwise noted in the Rights Agreement, the Rights would have become exercisable, if not earlier redeemed, only if a person or group (i) acquired beneficial ownership of
20%
or more of the outstanding shares of our Common Stock or (ii) commenced, or publicly disclosed an intention to commence, a tender offer or exchange offer that would have resulted in beneficial ownership by a person or group of
20%
or more of the outstanding shares of our Common Stock.
|
On February 19, 2014, the Company’s Board of Directors authorized the termination of the Rights Agreement and the redemption of all of the outstanding Rights, at a redemption price of
$.01
per Right to be paid in cash to shareholders of record as of the close of business on March 3, 2014. The corresponding redemption payment of
$0.3 million
was made in the first quarter of 2014.
|
13.
|
In November 2009, 3M filed a patent infringement complaint in the United States District Court for the District of Minnesota (“Minnesota District Court”) against the Company’s film products business. The complaint alleged infringement upon elastic film technology patents held by 3M and sought unspecified compensatory and enhanced damages associated with our sales of certain elastic film product lines, which include our FabriFlex™ and FlexFeel™ family of products.
|
The Company and 3M settled all pending matters between the parties related to the patent infringement lawsuits filed by 3M. While the Company is confident in its position on the issues, because of the inherent risks associated with litigating patent lawsuits and the significant legal expenses expected to be incurred, the Company, without any admission of wrongdoing or fault of any kind, entered into a non-exclusive worldwide license agreement with 3M on June 26, 2014 for certain elastic film products, and on June 30, 2014, made a one-time, lump-sum payment of
$10 million
to 3M.
In 2011, Tredegar was notified by U.S. Customs and Border Protection (“U.S. Customs”) that certain film products exported by Terphane to the U.S. since November 6, 2008 could be subject to duties associated with an antidumping duty order on imported PET films from Brazil. The Company contested the applicability of these antidumping duties to the films exported by Terphane, and it filed a request with the U.S. Department of Commerce (“Commerce”) for clarification about whether the film products at issue are within the scope of the antidumping duty order. On January 8, 2013, Commerce issued a scope ruling confirming that the films are not subject to the order, provided that Terphane can establish to the satisfaction of U.S. Customs that the performance enhancing layer on those films is greater than
0.00001
inches thick. The films at issue are manufactured to specifications that exceed that threshold. On February 6, 2013, certain U.S. producers of PET film filed a summons with the U.S. Court of International Trade to appeal the scope ruling from Commerce. If U.S. Customs ultimately were to require the collection of anti-dumping duties because Commerce’s scope ruling was overturned on appeal, or otherwise, indemnifications for related liabilities are specifically provided for under the purchase agreement pursuant to which the Company acquired Terphane. In December 2014, the U.S. International Trade Commission voted to revoke the anti-dumping duty order on imported PET films from Brazil. The revocation, as a result of the vote by the U.S. International Trade Commission, was effective as of November 2013. On February 20, 2015, certain U.S. producers of PET Film filed a summons with the U.S. Court of International Trade to appeal the determination by the U.S. International Trade Commission.
19
|
14.
|
In May 2014, the Financial Accounting Standards Board (“FASB”) and International Accounting Standards Board (“IASB”) issued their converged standard on revenue recognition. The revised revenue standard contains principles that an entity will apply to direct the measurement of revenue and timing of when it is recognized. The core principle of the guidance is that the recognition of revenue should depict the transfer of promised goods or services to customers in an amount that reflects the consideration to which an entity expects to be entitled in exchange for those goods and services. To achieve that core principle, an entity will utilize a principle-based five-step approach model. The converged standard also includes more robust disclosure requirements which will require entities to provide sufficient information to enable users of financial statements to understand the nature, amount, timing and uncertainty of revenue and cash flows arising from contracts with customers. In July 2015, the FASB delayed the effective date of this revised standard to annual reporting periods beginning after December 15, 2017, including interim periods within that reporting period. Early application is permitted as of annual reporting periods beginning after December 15, 2016, including interim reporting periods within that annual reporting period. The converged standard can be adopted either retrospectively or through the use of a practical expedient. The Company is still assessing the impact of this new guidance.
|
In June 2014, the FASB issued a new standard to eliminate the concept of development stage entities and all related specified presentation and reporting requirements under U.S. GAAP. In addition, the amended standard eliminated the scope exception for development stage entities when evaluating the sufficiency of equity at risk for a variable interest entity (“VIE”), thereby changing consolidation conclusions in some situations. Except for the elimination of the scope exception for development stage entities when evaluating the sufficiency of equity at risk for a VIE, the revised guidance is effective for annual reporting periods beginning after December 15, 2014, including interim periods within that reporting period. The amendments to the consolidation guidance are effective for annual reporting periods beginning after December 15, 2015, including interim periods within that reporting period. The new standard is not expected to impact the Company.
In April 2015, the FASB issued new guidance requiring that debt issuance costs related to a recognized debt liability be presented in the balance sheet as a direct reduction from the carrying amount of that corresponding debt liability, consistent with debt discounts, rather than as a deferred charge (e.g. an asset). The new guidance will be effective for annual reporting periods beginning after December 15, 2015, including interim periods within that reporting period. The guidance requires that all prior period balance sheets be adjusted retrospectively, and early adoption is permitted. The Company expects to adopt the guidance by the first quarter of 2016. Deferred debt issuance costs associated with the Company’s Credit Agreement were
$1.0 million
and
$1.1 million
(included in “Other assets and deferred charges” in the consolidated balance sheet) at
June 30, 2015
and
December 31, 2014
, respectively.
In May 2015, the FASB issued new guidance for investments measured at net asset value (“NAV”). Under the new guidance, investments measured at NAV, as a practical expedient for fair value, are excluded from the fair value hierarchy. Removing investments measured using the practical expedient from the fair value hierarchy is intended to eliminate diversity in practice that currently exists with respect to the categorization of these investments. The new guidance is effective for fiscal years, and interim periods within those fiscal years, beginning after December 15, 2015 for public business entities. Early adoption is permitted, including for financial statement periods that have not yet been issued. The Company is currently assessing the impact of this new guidance on its disclosures.
20
|
Item 2.
|
Management’s Discussion and Analysis of Financial Condition and Results of Operations.
|
Forward-looking and Cautionary Statements
Some of the information contained in this Quarterly Report on Form 10-Q (“Form 10-Q”) may constitute “forward-looking statements” within the meaning of the “safe harbor” provisions of the Private Securities Litigation Reform Act of 1995. When using the words “believe,” “estimate,” “anticipate,” “expect,” “project,” “likely,” “may” and similar expressions, Tredegar does so to identify forward-looking statements. Such statements are based on then current expectations and are subject to a number of risks and uncertainties that could cause actual results to differ materially from those addressed in the forward-looking statements. It is possible that actual results and financial condition may differ, possibly materially, from the anticipated results and financial condition indicated in or implied by these forward-looking statements. Accordingly, you should not place undue reliance on these forward-looking statements. Factors that could cause actual results to differ from expectations include, without limitation: acquired businesses, including Terphane Holdings LLC (“Terphane”) and AACOA, Inc. (“AACOA”), may not achieve expected levels of revenue, profit, productivity or otherwise perform as expected; acquisitions, including the acquisitions of Terphane and AACOA, involve special risks, including without limitation, diversion of management’s time and attention to the Company’s existing businesses, the potential assumption of unanticipated liabilities and contingencies and potential difficulties in integrating acquired businesses and achieving anticipated operational improvements; Film Products is highly dependent on sales to one customer — The Procter & Gamble Company (“P&G”) and Film Products may not be able to mitigate the impact of the expected decline in net sales to P&G on operating profit from ongoing operations; growth of Film Products depends on its ability to develop and deliver new products at competitive prices; sales volume and profitability of Aluminum Extrusions are cyclical and highly dependent on economic conditions of end-use markets in the U.S., particularly in the building and construction sector, and are also subject to seasonal slowdowns; Aluminum Extrusions’ efforts to expand product offerings and broaden its customer base may not be successful; substantial international operations subject Tredegar to risks of doing business in countries outside the U.S., which could adversely affect Tredegar’s business, financial condition and results of operations; future performance is influenced by costs incurred by Tredegar’s operating companies, including, for example, the cost of energy and raw materials; and the other factors discussed in the reports Tredegar files with or furnishes to the Securities and Exchange Commission (the “SEC”) from time to time, including the risks and important factors set forth in additional detail in “Risk Factors” in Part I, Item 1A of Tredegar’s
2014
Annual Report on Form 10-K (the “
2014
Form 10-K”) filed with the SEC. Readers are urged to review and carefully consider the disclosures Tredegar makes in its filings with the SEC, including the
2014
Form 10-K. Tredegar does not undertake, and expressly disclaims any duty, to update any forward-looking statement to reflect any change in management’s expectations or any change in conditions, assumptions or circumstances on which such statements are based, except as required by applicable law.
References herein to “Tredegar,” “the Company,” “we,” “us” and “our” are to Tredegar Corporation and its subsidiaries, collectively, unless the context otherwise indicates or requires.
Executive Summary
Second-quarter
2015
net income was
$0.6 million
(
2 cent
s per share) compared with
$3.8 million
(
11 cent
s per share) in the
second quarter
of
2014
. Net income from continuing operation was
$10.5 million
(
32 cent
s per share) in first
six months
of
2015
and
$12.2 million
(
37 cent
s per share) in the first
six months
of
2014
. Losses related to plant shutdowns, asset impairments, restructurings and other items are described in Note 2 on page 7. Net sales (sales less freight) and operating profit (loss) from ongoing operations are the measures of sales and operating profit used by the chief operating decision maker of each segment for purposes of assessing performance.
On June 26, 2015, Tredegar announced changes in its chief executive and chief financial officers. Prior management had disclosed and updated performance targets for volume, adjusted EBITDA (earnings before interest, taxes, depreciation and amortization) and return on invested capital. Given recent performance, such targets are no longer considered appropriate guidance for future performance. Current management has no immediate plans to provide updated or new performance targets.
21
The following table presents Tredegar’s net sales and operating profit by segment for the three and
six months
ended
June 30, 2015
and
2014
:
|
Three Months Ended June 30,
|
Six Months Ended June 30,
|
||||||||||||||
|
(In Thousands)
|
2015
|
2014
|
2015
|
2014
|
|||||||||||
|
Net Sales
|
|||||||||||||||
|
Film Products
|
$
|
115,299
|
|
$
|
146,016
|
|
$
|
248,500
|
|
$
|
295,176
|
|
|||
|
Aluminum Extrusions
|
98,203
|
|
84,548
|
|
191,848
|
|
163,831
|
|
|||||||
|
Total net sales
|
213,502
|
|
230,564
|
|
440,348
|
|
459,007
|
|
|||||||
|
Add back freight
|
7,743
|
|
6,401
|
|
15,068
|
|
13,171
|
|
|||||||
|
Sales as shown in the Consolidated Statements of Income
|
221,245
|
|
236,965
|
|
455,416
|
|
472,178
|
|
|||||||
|
Operating Profit
|
|||||||||||||||
|
Film Products:
|
|||||||||||||||
|
Ongoing operations
|
6,178
|
|
14,963
|
|
23,795
|
|
31,685
|
|
|||||||
|
Plant shutdowns, asset impairments, restructurings and other
|
(259
|
)
|
(10,923
|
)
|
(192
|
)
|
(12,168
|
)
|
|||||||
|
Aluminum Extrusions:
|
|||||||||||||||
|
Ongoing operations
|
8,299
|
|
8,050
|
|
13,591
|
|
12,811
|
|
|||||||
|
Plant shutdowns, asset impairments, restructurings and other
|
(18
|
)
|
(174
|
)
|
(33
|
)
|
(174
|
)
|
|||||||
|
Total
|
14,200
|
|
11,916
|
|
37,161
|
|
32,154
|
|
|||||||
|
Interest income
|
82
|
|
107
|
|
171
|
|
302
|
|
|||||||
|
Interest expense
|
893
|
|
531
|
|
1,778
|
|
1,161
|
|
|||||||
|
Gain (loss) on investment accounted for under fair value method
|
—
|
|
(1,100
|
)
|
—
|
|
(1,100
|
)
|
|||||||
|
Gain on sale of investment property
|
—
|
|
1,208
|
|
—
|
|
1,208
|
|
|||||||
|
Stock option-based compensation costs
|
198
|
|
345
|
|
498
|
|
586
|
|
|||||||
|
Corporate expenses, net
|
11,694
|
|
5,339
|
|
18,910
|
|
11,814
|
|
|||||||
|
Income before income taxes
|
1,497
|
|
5,916
|
|
16,146
|
|
19,003
|
|
|||||||
|
Income taxes
|
903
|
|
2,164
|
|
5,682
|
|
6,772
|
|
|||||||
|
Net income
|
$
|
594
|
|
$
|
3,752
|
|
$
|
10,464
|
|
$
|
12,231
|
|
|||
Film Products
A summary of operating results from ongoing operations for Film Products is provided below:
|
|
Three Months Ended
|
Favorable/
(Unfavorable) % Change |
Six Months Ended
|
Favorable/
(Unfavorable) % Change |
|||||||||||||||||
|
June 30,
|
June 30,
|
||||||||||||||||||||
|
(In Thousands, Except Percentages)
|
2015
|
2014
|
2015
|
2014
|
|||||||||||||||||
|
Sales volume (pounds)
|
56,613
|
|
60,729
|
|
(6.8
|
)%
|
119,316
|
|
123,352
|
|
(3.3
|
)%
|
|||||||||
|
Net sales
|
$
|
115,299
|
|
$
|
146,016
|
|
(21.0
|
)%
|
$
|
248,500
|
|
$
|
295,176
|
|
(15.8
|
)%
|
|||||
|
Operating profit from ongoing operations
|
$
|
6,178
|
|
$
|
14,963
|
|
(58.7
|
)%
|
$
|
23,795
|
|
$
|
31,685
|
|
(24.9
|
)%
|
|||||
22
Second-Quarter
Results vs. Prior Year
Second Quarter
Net sales (sales less freight) in the
second quarter
of
2015
decreased by
$30.7 million
versus
2014
primarily due to:
|
•
|
The loss of business to Film Products’ largest customer related to certain babycare elastic laminate films sold in North America (approximately $8.1 million) and to the unfavorable impact of various product transitions in personal care materials (approximately $4.4 million);
|
|
•
|
Lower net sales for flexible packaging films of approximately $4.0 million, or 14.7%, (despite an increase in volume of 5.5%) due to changes in product mix and competitive pricing pressures driven by continued unfavorable economic conditions in its primary market of Brazil and excess global capacity in the industry;
|
|
•
|
The unfavorable impact of approximately $7.0 million from the change in the U.S. dollar value of currencies for polyethylene film operations outside of the U.S.; and
|
|
•
|
Estimated reductions in average selling prices in polyethylene films of approximately $4.3 million primarily due to the contractual pass-through of lower average resin prices.
|
Operating profit from ongoing operations in the
second quarter
of
2015
decreased by
$8.8 million
in versus
2014
primarily due to:
|
•
|
Lower volumes in polyethylene films, primarily in personal care materials from the previously referenced lost business and various product transitions for Film Products’ largest customer, which had an adverse impact of approximately $4.3 million;
|
|
•
|
An increase in the operating loss from ongoing operations for flexible packaging films to $3.1 million in the second quarter of 2015 versus $1.1 million in 2014;
|
|
•
|
The estimated unfavorable impact in polyethylene films from the quarterly lag in the pass-through of average resin costs of approximately $1.6 million; and
|
|
•
|
Other factors with an unfavorable impact in polyethylene films of approximately $0.9 million, which included higher selling, general and administrative expenses primarily related to inflationary increases and the timing of certain costs as well as the change in the U.S. dollar value of currencies for operations outside of the U.S.
|
Year-To-Date Results vs. Prior Year-To-Date
Net sales in the first
six months
of
2015
decreased by
$46.7 million
versus
2014
primarily due to:
|
•
|
The loss of business to Film Products’ largest customer related to certain babycare elastic laminate films sold in North America (approximately $16.2 million) and to the unfavorable impact of various product transitions in personal care materials (approximately $7.9 million);
|
|
•
|
A decline in net sales for flexible packaging films of $5.3 million, or 9.5%, (despite an increase in volume of 11.0%) due to mix changes and competitive pricing pressures;
|
|
•
|
The unfavorable impact of approximately $13.0 million from the change in the U.S. dollar value of currencies for polyethylene film operations outside of the U.S.; and
|
|
•
|
Estimated reductions in average selling prices in polyethylene films of approximately $5.0 million attributable to the unfavorable impact of competitive pricing pressures and the contractual pass-through of lower average resin prices.
|
Operating profit from ongoing operations in the first
six months
of
2015
decreased by
$7.9 million
versus
2014
primarily due to:
|
•
|
Lower volumes in polyethylene films, primarily in personal care materials from the previously referenced lost business and various product transitions for Film Products’ largest customer, which had an adverse impact of approximately $7.0 million;
|
|
•
|
An increase in the operating loss from ongoing operations for flexible packaging films to $2.2 million in the first six months of 2015 versus $0.9 million in 2014;
|
|
•
|
The unfavorable impact from the change in the U.S. dollar value of currencies for polyethylene film operations outside the U.S. of approximately $2.4 million;
|
23
|
•
|
The estimated favorable impact in polyethylene films from the quarterly lag in the pass-through of average resin costs of approximately $0.6 million; and
|
|
•
|
Other factors with a favorable impact in polyethylene films of approximately $2.2 million, which are primarily lower fixed costs associated with the shutdown of the manufacturing facility in Red Springs, North Carolina and other cost savings, partially offset by lower margins from pricing pressures.
|
Capital expenditures in Film Products were
$9.0 million
in the first
six months
of
2015
compared to
$18.8 million
in the first
six months
of
2014
. Capital expenditures for the first
six months
of
2014
included approximately
$10.6 million
to expand capacity at the Company’s manufacturing facility in Cabo de Santo Agostinho, Brazil. The additional capacity from this project became available for commercial production at the end of the third quarter of 2014, and production volumes began to ramp-up in the fourth quarter of 2014. Film Products currently estimates that capital expenditures in
2015
will total approximately
$26 million
, including approximately
$12 million
for routine capital expenditures required to support operations. Depreciation expense was
$11.5 million
in the first
six months
of
2015
and
$14.1 million
in the first
six months
of
2014
. Depreciation expense is projected to be approximately
$23 million
in
2015
. Amortization expense was
$1.6 million
in the first
six months
of
2015
and
$1.9 million
in the first
six months
of
2014
, and is projected to be approximately
$3 million
in
2015
.
Outlook
Film Products believes that most of its growth in the demand for its products will come from markets outside of North America. In recent years, Film Products has made significant capacity investments in foreign markets to better meet its customers’ desire for local supply. With increasing levels of production shifting to the film products manufacturing facilities located outside of North America, Film Products believes that consolidating its domestic film products manufacturing facilities provides an opportunity to reduce fixed manufacturing costs.
On July 7, 2015, the Company announced its intention to consolidate its domestic production for film products by restructuring its manufacturing facility in Lake Zurich, Illinois. Efforts to transition domestic production from the Lake Zurich manufacturing facility will require various machinery upgrades and equipment transfers to its other manufacturing facilities. Given Film Products’ focus on maintaining product quality and customer satisfaction, the Company anticipates that these activities will require 21-24 months to execute. Total pre-tax cash expenditures associated with restructuring the Lake Zurich manufacturing facility are expected to be approximately $13-14 million over this period, and once complete, annual pre-tax cash cost savings are expected to be approximately $5-6 million.
The Company expects to recognize costs associated with the exit and disposal activities of approximately $4-5 million over the next 21-24 months. Exit and disposal costs include severance charges and other employee-related expenses arising from the termination of employees of approximately $2-3 million and equipment transfers, asset impairments and other shutdown-related costs of approximately $2 million. During the same period of time, operating expenses will include the acceleration of approximately $3 million of non-cash depreciation expense for certain machinery and equipment at the Lake Zurich manufacturing facility.
Total estimated cash expenditures of $13-14 million over the next 21-24 months include the following:
|
•
|
Cash outlays associated with previously discussed exit and disposal expenses of approximately $4 million;
|
|
•
|
Capital expenditures associated with equipment upgrades at other film products manufacturing facilities in the United States of approximately $8 million;
|
|
•
|
Cash incentives of approximately $1 million in connection with meeting safety and quality standards while production ramps down at the Lake Zurich manufacturing facility; and
|
|
•
|
Additional operating expenses of approximately $1 million associated with customer product qualifications on upgraded and transferred production lines.
|
Operating profit from ongoing operations for Film Products in the second quarter of 2015 was
$6.2 million
, down significantly from $15.0 million in the second quarter of 2014. Film Products’ operating profit from ongoing operations includes operating losses from ongoing operations for flexible packaging films of $3.1 million in the second quarter of 2015 and $1.1 million in the second quarter of 2014. The operating loss from ongoing operations and positive adjusted EBITDA for flexible packaging films were $4.1 million and $6.0 million for the 12 months ended June 30, 2015, respectively. Adjusted EBITDA for the 12 months ended June 30, 2015 was computed as the operating loss from ongoing operations of $4.1 million plus depreciation and amortization expense of $10.1 million. Adjusted EBITDA is a non-GAAP financial measure that is not intended to represent net income (loss) or cash flows from operations as defined under U.S. GAAP and should not be considered as either an alternative to net income (loss) (as an indicator of operating performance) or to cash flow (as a measure of liquidity). Tredegar uses adjusted EBITDA as a measure of unlevered (debt-free) operating cash flow.
24
The operations of flexible packaging films continue to be adversely impacted by competitive pressures that are primarily related to continuing unfavorable economic conditions in its primary market of Brazil and excess global capacity in the industry. The Company’s management is currently estimating the projected timing of a recovery. The value of this business (which represents the PET Films reporting unit) is dependent upon the timing and extent of the market recovery, and changes in the Company’s previous assessment could trigger an impairment of certain intangible assets. The total carrying value of the net assets for the flexible packaging films was approximately $200 million as of June 30, 2015, including intangible assets not currently subject to amortization of $55 million.
Operating profit from ongoing operations in the second quarter of 2015 for the remainder of Film Products excluding flexible packaging films was $9.3 million, down significantly from $16.1 million in the second quarter of 2014. Much of this decrease was related to a decline in business in personal care materials, including the previously discussed lost net sales to Film Products’ largest customer of approximately $12.5 million. Lower net sales to this customer include the aforementioned loss of certain babycare elastic laminate volumes, which is now substantially complete. The loss of certain elastic laminate volumes had an unfavorable impact on operating profit from ongoing operations of approximately $0.9 million in the second quarter of 2015 and $2.1 million in the first six months of 2015. The unfavorable impact on net sales of previously disclosed product transitions is expected to total $25-35 million by the end of 2016.
The challenges described above are expected to continue in the near term. Film Products is looking at opportunities to improve the efficiencies of its operations, as demonstrated by the decision to restructure its North American film manufacturing operations to meet changing customer demands while driving cost savings. Film Products is also investing $10 million in new assets in Europe to provide elastic capabilities to our customers in Europe, Middle East and Africa.
Aluminum Extrusions
A summary of operating results from ongoing operations for Aluminum Extrusions is provided below:
|
Three Months Ended
|
Favorable/
(Unfavorable) % Change |
Six Months Ended
|
Favorable/
(Unfavorable) % Change |
||||||||||||||||||
|
June 30,
|
June 30,
|
||||||||||||||||||||
|
(In Thousands, Except Percentages)
|
2015
|
2014
|
2015
|
2014
|
|||||||||||||||||
|
Sales volume (pounds)
|
42,919
|
|
38,168
|
|
12.4
|
%
|
82,373
|
|
74,816
|
|
10.1
|
%
|
|||||||||
|
Net sales
|
$
|
98,203
|
|
$
|
84,548
|
|
16.2
|
%
|
$
|
191,848
|
|
$
|
163,831
|
|
17.1
|
%
|
|||||
|
Operating profit from ongoing operations
|
$
|
8,299
|
|
$
|
8,050
|
|
3.1
|
%
|
$
|
13,591
|
|
$
|
12,811
|
|
6.1
|
%
|
|||||
Second-Quarter
Results vs. Prior Year
Second Quarter
Net sales in the second quarter of 2015 increased versus 2014 primarily due to higher sales volumes and an increase in average selling prices. Higher sales volumes, primarily in the nonresidential building and construction and automotive markets, had a favorable impact of approximately $11.5 million in the second quarter of 2015. The increase in nonresidential building and construction volumes was consistent with market growth for the period. Higher average selling prices, which had a positive impact on net sales of approximately $2.1 million, can be primarily attributed to inflationary price increases and higher average aluminum costs.
Operating profit from ongoing operations increased only 3.1% despite 12.4% higher volume. Profit growth was hampered by hiring and training expenses of approximately $0.8 million for additional labor to meet production demands, which pushed average capacity utilization to approximately 90%, and construction-related expenses of $0.3 million associated with the project to expand and upgrade anodizing capacity. These factors had an adverse impact on the growth rate in profits of over 12%. Other factors impacting operating profit from ongoing operations, which had a favorable impact of approximately $1.3 million, include higher sales volumes that were partially offset by higher operating expenses and inflationary costs increases.
25
Year-To-Date Results vs. Prior Year-To-Date
Net sales in the first six months of 2015 increased versus 2014 primarily due to higher sales volumes and an increase in average selling prices. Higher sales volumes, primarily in the nonresidential building and construction and automotive markets, had a favorable impact of approximately $19.4 million in the first six months of 2015. Higher average selling prices, which had a positive impact on net sales of approximately $8.6 million, can be primarily attributed to inflationary price increases and higher average aluminum costs.
Operating profit from ongoing operations in the first six months of 2015, which increased versus 2014 by $0.8 million, or 6.1%, on higher volume of 10.1%, was primarily driven by the following factors:
|
•
|
The favorable impact on profits of higher sales volume of approximately $4.0 million;
|
|
•
|
Higher production and hiring costs of approximately $2.5 million from significantly higher volume levels; and
|
|
•
|
Construction-related expenses associated with the project to expand and upgrade anodizing capacity of approximately $0.7 million.
|
Capital expenditures for Aluminum Extrusions were
$5.3 million
in the first
six months
of
2015
compared to
$4.0 million
in the first
six months
of
2014
. Capital expenditures in the first six months of 2015 were primarily related to the project to expand and upgrade anodizing capacity at the aluminum extrusions manufacturing facility in Carthage, Tennessee. Capital expenditures are projected to be approximately
$10 million
in
2015
, which includes approximately
$5 million
for routine capital expenditures required to support operations. Depreciation expense was
$4.3 million
in the first
six months
of
2015
compared to
$4.1 million
in the first
six months
of
2014
, and is projected to be approximately
$8 million
in
2015
. Amortization expense was
$0.5 million
in the first
six months
of
2015
and
$0.9 million
in the first
six months
of
2014
, and is projected to be approximately
$1 million
in
2015
.
Corporate Expenses, Interest and Taxes
Pension expense was
$6.1 million
in the first
six months
of
2015
, an unfavorable change of
$2.2 million
from the first
six months
of
2014
. Most of the pension impact on earnings is reflected in “Corporate expenses, net” in the net sales and operating profit by segment table. Corporate expenses, net increased in
2015
versus
2014
primarily due to the previously noted increase in pension expense, higher stock-based employee benefit costs and corporate severance charges. In 2015, corporate expenses, net included severance and other employee-related charges of $3.9 million associated with the resignations of the Company’s former chief executive and chief financial officers in the second quarter of 2015. In 2014, corporate expenses, net included non-recurring costs of $0.9 million.
Interest expense was
$1.8 million
in the first
six months
of
2015
in comparison to
$1.2 million
in the first
six months
of
2014
as a result of higher average debt balances.
The effective tax rate used to compute income taxes was
35.2
% in the first
six months
of
2015
compared to
35.6
% in the first
six months
of
2014
. Significant differences between the estimated effective tax rate for income and the U.S. federal statutory rate for
2015
and
2014
are provided in the table provided in Note 10 on page 18.
Net capitalization and other credit measures are provided in the liquidity and capital resources section beginning on page 31.
Critical Accounting Policies
In the ordinary course of business, the Company makes a number of estimates and assumptions relating to the reporting of results of operations and financial position in the preparation of financial statements in conformity with generally accepted accounting principles in the United States (“U.S. GAAP”). The Company believes the estimates, assumptions and judgments described in the section “Management’s Discussion and Analysis of Financial Condition and Results of Operations – Critical Accounting Policies” of the
2014
Form 10-K have the greatest potential impact on our financial statements, so Tredegar considers these to be its critical accounting policies. These policies include accounting for impairment of long-lived assets and goodwill, investment accounted for under the fair value method, pension benefits and income taxes. These policies require management to exercise judgments that are often difficult, subjective and complex due to the necessity of estimating the effect of matters that are inherently uncertain. Actual results could differ significantly from those estimates under different assumptions and conditions. The Company believes the consistent application of these policies enables it to provide readers of
26
the financial statements with useful and reliable information about our operating results and financial condition. Since December 31,
2014
, there have been no changes in these policies that have had a material impact on results of operations or financial position.
In May 2014, the Financial Accounting Standards Board (“FASB”) and International Accounting Standards Board (“IASB”) issued their converged standard on revenue recognition. The revised revenue standard contains principles that an entity will apply to direct the measurement of revenue and timing of when it is recognized. The core principle of the guidance is that the recognition of revenue should depict the transfer of promised goods or services to customers in an amount that reflects the consideration to which an entity expects to be entitled in exchange for those goods and services. To achieve that core principle, an entity will utilize a principle-based five-step approach model. The converged standard also includes more robust disclosure requirements which will require entities to provide sufficient information to enable users of financial statements to understand the nature, amount, timing and uncertainty of revenue and cash flows arising from contracts with customers. In July 2015, the FASB delayed the effective date of this revised standard to annual reporting periods beginning after December 15, 2017, including interim periods within that reporting period. Early application is permitted as of annual reporting periods beginning after December 15, 2016, including interim reporting periods within that annual reporting period. The converged standard can be adopted either retrospectively or through the use of a practical expedient. The Company is still assessing the impact of this new guidance.
In June 2014, the FASB issued a new standard to eliminate the concept of development stage entities and all specified presentation and reporting requirement under U.S. GAAP. In addition, the amended standard eliminated the scope exception for development stage entities when evaluating the sufficiency of equity at risk for a variable interest entity (“VIE”), thereby changing consolidation conclusions in some situations. Except for the elimination of the scope exception for development stage entities when evaluating the sufficiency of equity at risk for a VIE, the revised guidance is effective for annual reporting periods beginning after December 15, 2014, including interim periods within that reporting period. The amendments to the consolidation guidance are effective for annual reporting periods beginning after December 15, 2015, including interim periods within that reporting period. The new standard is not expected to impact the Company.
In April 2015, the FASB issued new guidance requiring that debt issuance costs related to a recognized debt liability be presented in the balance sheet as a direct reduction from the carrying amount of that corresponding debt liability, consistent with debt discounts, rather than as a deferred charge (e.g. an asset). The new guidance will be effective for annual reporting periods beginning after December 15, 2015, including interim periods within that reporting period. The guidance requires that all prior period balance sheets be adjusted retrospectively, and early adoption is permitted. The Company expects to adopt the guidance by the first quarter of 2016. Deferred debt issuance costs associated with the Company’s credit agreement were $1.0 million and $1.1 million (included in “Other assets and deferred charges” in the consolidated balance sheet) at
June 30, 2015
and
December 31, 2014
, respectively.
In May 2015, the FASB issued new guidance for investments measured at net asset value (“NAV”). Under the new guidance, investments measured at NAV, as a practical expedient for fair value, are excluded from the fair value hierarchy. Removing investments measured using the practical expedient from the fair value hierarchy is intended to eliminate diversity in practice that currently exists with respect to the categorization of these investments. The new guidance is effective for fiscal years, and interim periods within those fiscal years, beginning after December 15, 2015 for public business entities. Early adoption is permitted, including for financial statement periods that have not yet been issued. The Company is currently assessing the impact of this new guidance on its disclosures.
Results of Operations
Second Quarter
of
2015
Compared with the
Second Quarter
of
2014
Overall, sales in the
second quarter
of
2015
decreased by
6.6%
compared with the
second quarter
of
2014
. Net sales decreased
21.0%
in Film Products primarily due to lower volumes, a decrease in average selling prices and the negative impact of the change in the U.S. dollar value of currencies for operations outside the U.S. Net sales increased
16.2%
in Aluminum Extrusions primarily due to higher sales volumes and an increase in average selling prices driven by various factors, primarily including higher average aluminum costs and inflationary price increases. For more information on net sales and volume, see the executive summary beginning on page 21.
Consolidated gross profit (sales minus cost of goods sold and freight) as a percentage of sales was
13.4%
in the
second quarter
of
2015
compared to
16.2%
in the
second quarter
of
2014
. Gross profit as a percentage of sales was negatively impacted by higher pension expenses in the
second quarter
of
2015
compared to the
second quarter
of
2014
. As previously
27
noted, most of the impact of higher pension expense is not allocated to Film Products and Aluminum Extrusions. The gross profit margin in Film Products decreased due to lower volumes, competitive pricing pressures and the unfavorable impact of quarterly lag in the pass-through of average resin costs, partially offset by lower production costs. The gross profit margin in Aluminum Extrusions decreased primarily as a result of an increase in manufacturing costs, most notably higher direct labor costs, partially offset by higher volumes.
As a percentage of sales, selling, general and administrative and R&D expenses were
11.8%
in the
second quarter
of
2015
, which was higher than
8.2%
in the
second quarter
of last year. The increase can be primarily attributed to higher R&D expenditures, inflationary increases and the timing of certain selling, general and administrative expenses.
Plant shutdowns, asset impairments, restructurings and other items in the
second quarter
of
2015
shown in the segment operating profit table on page 22 include:
|
•
|
Pretax charges of
$3.9 million
(included in “Selling, general and administrative expense” in the consolidated statements of income and “Corporate expenses, net” in the statement of net sales and operating profit by segment included in Note 9) for severance and other employee-related costs associated with the resignation of the Company’s former chief executive and chief financial officers;
|
|
•
|
Pretax charges of
$0.3 million
associated with severance and other-employee-related costs associated with restructurings in Film Products; and
|
|
•
|
Pretax charges of
$18,000
associated with the shutdown of the aluminum extrusions manufacturing facility in Kentland, Indiana.
|
Plant shutdowns, asset impairments, restructurings and other charges in the
second quarter
of
2014
shown in the segment operating profit table on page 22 include:
|
•
|
Pretax charge of
$10 million
(included in “Other income (expense), net” in the consolidated statements of income) associated with a one-time, lump sum license payment to the 3M Company (“3M”) after the Company settled all litigation issues associated with a patent infringement complaint (see Note 13 for additional detail on this legal matter);
|
|
•
|
Pretax charges of
$0.6 million
associated with severance and other employee-related costs associated with restructurings in Film Products;
|
|
•
|
Pretax charges of
$0.3 million
associated with the shutdown of the film products manufacturing facility in Red Springs, North Carolina, which includes severance and other employee-related costs of
$0.2 million
and asset impairment and other shutdown-related charges of
$0.1 million
;
|
|
•
|
Pretax charges of
$0.2 million
related to expected future environmental costs at the Company’s aluminum extrusions manufacturing facility in Newnan, Georgia (included in “Cost of goods sold” in the consolidated statements of income); and
|
|
•
|
Pretax charges of
$24,000
associated with the shutdown of the aluminum extrusions manufacturing facility in Kentland, Indiana.
|
Results in the
second quarter
of
2014
include an unrealized loss on the Company’s investment in kaleo, Inc. (“kaléo”), which is accounted for under the fair value method, of
$1.1 million
(
$0.7 million
after taxes) (none in the
second quarter
of
2015
). Unrealized losses (included in “Other income (expense), net” in the consolidated statements of income and “Corporate expenses, net” in the statement of net sales and operating profit by segment) on the Company’s investment in the Harbinger Capital Partners Special Situations Fund, L.P. (“Harbinger Fund”), which is accounted for under the cost method, of
$0.3 million
(
$0.2 million
) in the
second quarter
of
2014
as a result of a reduction in the value of the investment that is not expected to be temporary (none in the
second quarter
of
2015
). The Company realized a gain (included in “Other income (expense), net” in the consolidated statements of income) of
$1.2 million
(
$0.8 million
after taxes) on the sale of a portion of its investment property in Alleghany and Bath Counties, Virginia in the
second quarter
of
2014
. See Note 6 beginning on page 12 for additional information on investments.
28
Interest income, which is included in “Other income (expense), net” in the consolidated statements of income, was
$0.1 million
and
$0.1 million
in the
second quarter
of
2015
and
2014
, respectively. Interest expense increased from
$0.5 million
in the
second quarter
of
2014
to
$0.9 million
in the
second quarter
of
2015
as a result of higher average outstanding debt balances. Average debt outstanding and interest rates were as follows:
|
Three Months Ended June 30,
|
|||||||
|
(In Millions)
|
2015
|
2014
|
|||||
|
Floating-rate debt with interest charged on a rollover basis at one-month LIBOR plus a credit spread:
|
|||||||
|
Average outstanding debt balance
|
$
|
140.7
|
|
$
|
130.7
|
|
|
|
Average interest rate
|
2.0
|
%
|
1.9
|
%
|
|||
|
Fixed-rate and other debt:
|
|||||||
|
Average outstanding debt balance
|
$
|
—
|
|
$
|
—
|
|
|
|
Average interest rate
|
n/a
|
|
n/a
|
|
|||
|
Total debt:
|
|||||||
|
Average outstanding debt balance
|
$
|
140.7
|
|
$
|
130.7
|
|
|
|
Average interest rate
|
2.0
|
%
|
1.9
|
%
|
|||
The effective tax rate used to compute income taxes from continuing operations in the
second quarter
of
2015
was
60.3%
compared to
36.6%
in the
second quarter
of
2014
.
The change in the effective tax rate for the
second quarter
reflects the impact to income taxes during the
second quarter
to adjust the effective tax rate for the first
six months
of the year to the estimated rate for the entire year. The significant differences between the U.S. federal statutory rate and the effective tax rate for the first
six months
is shown in the table provided in Note 10 on page 18.
First
Six Months
of
2015
Compared with First
Six Months
of
2014
Overall, sales in the first
six months
of
2015
decreased by
3.5%
compared with the first
six months
of
2014
. Net sales decreased
15.8%
in Film Products primarily due to lower volumes, a decrease in average selling prices and the unfavorable impact of the change in the U.S. dollar value of currencies for operations outside the U.S. Net sales increased
17.1%
in Aluminum Extrusions primarily due to higher sales volumes and an increase in average selling prices driven by various factors, primarily including higher average aluminum costs and inflationary price increases. For more information on net sales and volume, see the executive summary beginning on page 21.
Consolidated gross profit (sales minus cost of goods sold and freight) as a percentage of sales decreased from
16.1%
in the first
six months
of
2014
to
14.7%
in the first
six months
of
2015
. Gross profit as a percentage of sales was negatively impacted by higher pension expenses in the first
six months
of
2015
compared to the first
six months
of
2014
. As previously noted, most of the impact of higher pension expense is not allocated to Film Products and Aluminum Extrusions. The gross profit margin in Film Products decreased due to lower volumes, competitive pricing pressures and the unfavorable impact of quarterly lag in the pass-through of average resin costs, partially offset by favorable impact of lower production costs. The gross profit margin in Aluminum Extrusions decreased primarily as a result of an increase in manufacturing costs, most notably higher direct labor costs, partially offset by higher volumes.
As a percentage of sales, selling, general and administrative and R&D expenses were
10.3%
in the first
six months
of
2015
, which increased from
8.6%
in the first
six months
of last year. The increase can be primarily attributed to higher R&D expenditures, inflationary increases, higher employee medical benefit costs and the timing of certain selling, general and administrative expenses.
29
Plant shutdowns, asset impairments, restructurings and other items in the first
six months
of
2015
shown in the segment operating profit table on page 22 include:
|
•
|
Pretax charges of
$3.9 million
(included in “Selling, general and administrative expense” in the consolidated statements of income and “Corporate expenses, net” in the statement of net sales and operating profit by segment included in Note 9) for severance and other employee-related costs associated with the resignation of the Company’s former chief executive and chief financial officers;
|
|
•
|
Pretax adjustment of
$0.2 million
to reverse previously accrued severance and other employee-related costs associated with restructurings in Film Products; and
|
|
•
|
Pretax charges of
$33,000
associated with the shutdown of the aluminum extrusions manufacturing facility in Kentland, Indiana.
|
Plant shutdowns, asset impairments, restructurings and other items in the first
six months
of
2014
shown in the segment operating profit table on page 22 include:
|
•
|
Pretax charge of
$10 million
associated with a one-time, lump sum license payment to 3M after the Company settled all litigation issues associated with a patent infringement complaint (see Note 13 for additional detail on this legal matter);
|
|
•
|
Pretax charges of
$1.4 million
associated with severance and other employee-related costs associated with restructurings in Film Products;
|
|
•
|
Pretax charges of
$0.7 million
associated with the shutdown of the film products manufacturing facility in Red Springs, North Carolina, which includes severance and other employee-related costs of
$0.4 million
and asset impairment and other shutdown-related charges of
$0.3 million
;
|
|
•
|
Pretax charges of
$0.2 million
related to expected future environmental costs at the Company’s aluminum extrusions manufacturing facility in Newnan, Georgia (included in “Cost of goods sold” in the consolidated statements of income); and
|
|
•
|
Pretax charges of
$24,000
associated with the shutdown of the aluminum extrusions manufacturing facility in Kentland, Indiana.
|
Results in the first
six months
of
2014
include an unrealized loss on the Company’s investment in kaléo (included in “Other income (expense), net” in the consolidated statements of income), of
$1.1 million
(
$0.7 million
after taxes) (none in the first
six months
of
2015
). Unrealized losses on the Company’s investment in the Harbinger Fund (included in “Other income (expense), net” in the consolidated statements of income and “Corporate expenses, net” in the statement of net sales and operating profit by segment) were
$0.6 million
(
$0.4 million
after taxes) in the first
six months
of
2014
(none in the first
six months
of
2015
) as a result of a reduction in the value of our investment that is not expected to be temporary. See Note 6 beginning on page 12 for additional information on investments.
Interest income, which is included in “Other income (expense), net” in the consolidated statements of income, was
$0.2 million
and
$0.3 million
in the first
six months
of
2015
and
2014
, respectively. Interest expense increased from
$1.2 million
in the first
six months
of
2014
to
$1.8 million
in the first
six months
of
2015
as a result of higher average outstanding debt balances. Average debt outstanding and interest rates were as follows:
|
Six Months Ended June 30,
|
|||||||
|
(In Millions)
|
2015
|
2014
|
|||||
|
Floating-rate debt with interest charged on a rollover basis at one-month LIBOR plus a credit spread:
|
|||||||
|
Average outstanding debt balance
|
$
|
140.7
|
|
$
|
133.2
|
|
|
|
Average interest rate
|
2.0
|
%
|
1.9
|
%
|
|||
|
Fixed-rate and other debt:
|
|||||||
|
Average outstanding debt balance
|
$
|
—
|
|
$
|
—
|
|
|
|
Average interest rate
|
n/a
|
|
n/a
|
|
|||
|
Total debt:
|
|||||||
|
Average outstanding debt balance
|
$
|
140.7
|
|
$
|
133.2
|
|
|
|
Average interest rate
|
2.0
|
%
|
1.9
|
%
|
|||
30
The effective tax rate used to compute income taxes in the first
six months
of
2015
was
35.2%
compared to
35.6%
in the first
six months
of
2014
.
Income taxes in the first
six months
of
2015
and
2014
was relatively consistent with the federal statutory rate as a result of various mitigating factors. The significant differences between the U.S. federal statutory rate and the effective tax rate for the first
six months
is shown in the table provided in Note 10 on page 18.
Liquidity and Capital Resources
Tredegar’s management continues to focus on improving working capital management, and measures such as days sales outstanding (“DSO”), days inventory outstanding (“DIO”) and days payables outstanding (“DPO”) are used to evaluate changes in working capital. Changes in operating assets and liabilities from
December 31, 2014
to
June 30, 2015
are summarized as follows:
|
•
|
Accounts and other receivables decreased
$0.9 million
(
0.8%
).
|
|
•
|
Accounts receivable in Film Products decreased by $8.6 million primarily due to lower sales and the timing of cash receipts. DSO (represents trailing 12 months net sales divided by a rolling 12-month average of accounts and other receivables balances) was approximately 48.8 days for the 12 months ended
June 30, 2015
and 46.2 days for the 12 months ended
December 31, 2014
.
|
|
•
|
Accounts receivable in Aluminum Extrusions increased by $7.0 million primarily due to the timing of cash receipts. DSO was approximately 46.2 days for the 12 months ended
June 30, 2015
and 45.3 days for the 12 months ended
December 31, 2014
.
|
|
•
|
Inventories decreased
$0.9 million
(
1.2%
).
|
|
•
|
Inventories in Film Products decreased by approximately $2.8 million primarily due to the lower production volumes and the timing of shipments. DIO (represents trailing 12 months costs of goods sold calculated on a first-in, first-out basis divided by a rolling 12-month average of inventory balances calculated on the first-in, first-out basis) was approximately 55.3 days for the 12 months ended
June 30, 2015
and 52.0 days for the 12 months ended
December 31, 2014
.
|
|
•
|
Inventories in Aluminum Extrusions increased by $1.9 million due to requirements to support recent capacity expansions. DIO was approximately 26.7 days for the 12 months ended
June 30, 2015
and 24.1 days for the 12 months ended
December 31, 2014
.
|
|
•
|
Net property, plant and equipment decreased
$19.5 million
(
7.2%
) primarily due to depreciation expenses of
$15.9 million
and a change in the value of the U.S. Dollar relative to foreign currencies ($18.3 million decrease), partially offset by capital expenditures of
$14.4 million
.
|
|
•
|
Accounts payable decreased
$9.3 million
(
9.9%
).
|
|
•
|
Accounts payable in Film Products decreased $8.7 million due to the normal volatility associated with the timing of payments. DPO (represents trailing 12 months costs of goods sold calculated on a first-in, first-out basis divided by a rolling 12-month average of accounts payable balances) was approximately 37.2 days for the 12 months ended
June 30, 2015
and 36.0 days for the 12 months ended
December 31, 2014
.
|
|
•
|
Accounts payable in Aluminum Extrusions decreased by $0.4 million primarily due to the normal volatility associated with the timing of payments. DPO was approximately 49.5 days for the 12 months ended
June 30, 2015
and 48.0 days for the 12 months ended
December 31, 2014
.
|
|
•
|
Accrued expenses increased by
$4.2 million
(
13.0%
) primarily due to higher severance accruals, changes in the fair value of aluminum derivative contracts and timing differences associated with various miscellaneous accruals.
|
|
•
|
Income taxes receivable increased by
$2.8 million
primarily due to the timing of payments.
|
Cash provided by operating activities was
$19.4 million
in the first
six months
of
2015
compared with
$16.8 million
in the first
six months
of
2014
. The change is primarily related to normal volatility of working capital components.
Cash used in investing activities was
$13.8 million
in the first
six months
of
2015
compared with
$18.2 million
in the first
six months
of
2014
. Cash used in investing activities in
2015
primarily represents capital expenditures of
$14.4 million
.
Cash used in financing activities was
$6.1 million
in the first
six months
of
2015
and was primarily related to the payment of regular quarterly dividends of
$6.5 million
(
20 cent
s per share) and net debt repayments of $2.25 million, partially offset by proceeds from the exercise of stock options of $2.8 million. Cash used in financing activities was
$7.5 million
in the
31
first
six months
of
2014
and was primarily related to the payment of regular quarterly dividends of
$5.2 million
(
16 cent
s per share) and net debt repayments of $2.3 million.
Further information on cash flows for the
six months
ended
June 30, 2015
and
2014
is provided in the consolidated statements of cash flows on page 5.
The Company has in place a five-year, unsecured revolving credit facility that expires on April 23, 2017. Net capitalization and indebtedness as defined under our existing revolving credit agreement as of
June 30, 2015
were as follows:
|
Net Capitalization and Indebtedness as of June 30, 2015
|
|||
|
(In Thousands)
|
|||
|
Net capitalization:
|
|||
|
Cash and cash equivalents
|
$
|
47,405
|
|
|
Debt:
|
|||
|
$350 million revolving credit agreement maturing April 23, 2017
|
135,000
|
|
|
|
Other debt
|
—
|
|
|
|
Total debt
|
135,000
|
|
|
|
Debt, net of cash and cash equivalents
|
87,595
|
|
|
|
Shareholders’ equity
|
355,855
|
|
|
|
Net capitalization
|
$
|
443,450
|
|
|
Indebtedness as defined in revolving credit agreement:
|
|||
|
Total debt
|
$
|
135,000
|
|
|
Face value of letters of credit
|
2,884
|
|
|
|
Other
|
250
|
|
|
|
Indebtedness
|
$
|
138,134
|
|
The credit spread and commitment fees charged on the unused amount under our revolving credit agreement at various indebtedness-to-adjusted EBITDA levels are as follows:
|
Pricing Under Revolving Credit Agreement (Basis Points)
|
|||||
|
Indebtedness-to-Adjusted EBITDA Ratio
|
Credit Spread
Over LIBOR
|
Commitment
Fee
|
|||
|
> 2.0x but <= 3.0x
|
200
|
|
35
|
|
|
|
> 1.0x but <= 2.0x
|
175
|
|
30
|
|
|
|
<= 1.0x
|
150
|
|
25
|
|
|
At
June 30, 2015
, the interest rate on debt under the revolving credit facility existing at that date was priced at one-month LIBOR plus the applicable credit spread of 175 basis points. Under the revolving credit agreement, borrowings are permitted up to $350 million, and approximately
$123 million
was available to borrow at
June 30, 2015
based upon the most restrictive covenants.
The computations of adjusted EBITDA, adjusted EBIT, the leverage ratio and interest coverage ratio as defined in the revolving credit agreement are presented below. Adjusted EBITDA and adjusted EBIT as defined in the revolving credit agreement are not intended to represent net income (loss) or cash flow from operations as defined by U.S. GAAP and should not be considered as an alternative to either net income or to cash flow.
32
|
Computations of Adjusted EBITDA, Adjusted EBIT, Leverage Ratio and Interest Coverage Ratio as Defined in the Revolving Credit Agreement Along with Related Most Restrictive Covenants As of and for the Twelve Months Ended June 30, 2015 (In Thousands)
|
|||
|
Computations of adjusted EBITDA and adjusted EBIT as defined in revolving credit agreement for the twelve months ended June 30, 2015:
|
|||
|
Net income
|
$
|
35,112
|
|
|
Plus:
|
|||
|
After-tax losses related to discontinued operations
|
—
|
|
|
|
Total income tax expense for continuing operations
|
8,297
|
|
|
|
Interest expense
|
3,330
|
|
|
|
Depreciation and amortization expense for continuing operations
|
37,828
|
|
|
|
All non-cash losses and expenses, plus cash losses and expenses not to exceed $10,000, for continuing operations that are classified as unusual, extraordinary or which are related to plant shutdowns, asset impairments and/or restructurings (cash-related of $4,429)
|
5,902
|
|
|
|
Charges related to stock option grants and awards accounted for under the fair value-based method
|
1,184
|
|
|
|
Losses related to the application of the equity method of accounting
|
—
|
|
|
|
Losses related to adjustments in the estimated fair value of assets accounted for under the fair value method of accounting
|
—
|
|
|
|
Minus:
|
|||
|
After-tax income related to discontinued operations
|
(850
|
)
|
|
|
Total income tax benefits for continuing operations
|
—
|
|
|
|
Interest income
|
(457
|
)
|
|
|
All non-cash gains and income, plus cash gains and income in excess of $10,000, for continuing operations that are classified as unusual, extraordinary or which are related to plant shutdowns, asset impairments and/or restructurings
|
—
|
|
|
|
Income related to changes in estimates for stock option grants and awards accounted for under the fair value-based method
|
—
|
|
|
|
Income related to the application of the equity method of accounting
|
—
|
|
|
|
Income related to adjustments in the estimated fair value of assets accounted for under the fair value method of accounting
|
(3,100
|
)
|
|
|
Plus cash dividends declared on investments accounted for under the equity method of accounting
|
—
|
|
|
|
Plus or minus, as applicable, pro forma EBITDA adjustments associated with acquisitions and asset dispositions
|
—
|
|
|
|
Adjusted EBITDA as defined in revolving credit agreement
|
87,246
|
|
|
|
Less: Depreciation and amortization expense for continuing operations (including pro forma for acquisitions and asset dispositions)
|
(37,828
|
)
|
|
|
Adjusted EBIT as defined in revolving credit agreement
|
$
|
49,418
|
|
|
Computations of leverage and interest coverage ratios as defined in revolving credit agreement at June 30, 2015:
|
|||
|
Leverage ratio (indebtedness-to-adjusted EBITDA)
|
1.58x
|
|
|
|
Interest coverage ratio (adjusted EBIT-to-interest expense)
|
14.84x
|
|
|
|
Most restrictive covenants as defined in revolving credit agreement:
|
|||
|
Maximum permitted aggregate amount of dividends that can be paid by Tredegar during the term of the revolving credit agreement ($100,000 plus 50% of net income generated beginning January 1, 2012)
|
$
|
148,771
|
|
|
Maximum leverage ratio permitted
|
3.00x
|
|
|
|
Minimum interest coverage ratio permitted
|
2.50x
|
|
|
As of
June 30, 2015
, Tredegar was in compliance with all financial covenants outlined in our revolving credit agreement. Noncompliance with any one or more of the debt covenants may have a material adverse effect on the Company’s financial condition or liquidity in the event such noncompliance cannot be cured or should the Company be unable to obtain a waiver from the lenders as we would not be permitted to borrow under the credit facility and any amounts outstanding would become due and payable. Renegotiation of the covenant(s) through an amendment to the revolving credit agreement could effectively cure the noncompliance, but could have an effect on financial condition or liquidity depending upon how the covenant is renegotiated.
33
At
June 30, 2015
, the Company had cash and cash equivalents of
$47.4 million
, including funds held in locations outside the U.S. of
$37.4 million
. Tredegar accrues U.S. federal income taxes on unremitted earnings of all foreign subsidiaries except Terphane Ltda. (a subsidiary of Film Products). Deferred U.S. federal income taxes have not been provided on the undistributed earnings for Terphane Ltda. because of the Company’s intent to permanently reinvest these earnings. Because of the accumulation of significant losses related to foreign currency translations at Terphane Ltda., there were no unrecorded deferred tax liabilities at
June 30, 2015
and
December 31, 2014
associated with the U.S. federal income taxes and foreign withholding taxes on undistributed earnings indefinitely invested outside the U.S. The Company believes that existing borrowing availability, current cash balances and cash flow from operations will be sufficient to satisfy its working capital, capital expenditure and dividend requirements for the next 12 months.
|
Item 3.
|
Quantitative and Qualitative Disclosures About Market Risk.
|
Tredegar has exposure to the volatility of interest rates, polyethylene and polypropylene resin prices, Terephtalic Acid (“PTA”) and Monoethylene Glycol (“MEG”) prices, aluminum ingot and scrap prices, energy prices, foreign currencies and emerging markets. See the liquidity and capital resources section beginning on page 31 regarding credit agreement and interest rate exposures.
Changes in resin, PTA and MEG prices, and the timing of those changes, could have a significant impact on profit margins in Film Products. Profit margins in Aluminum Extrusions are sensitive to fluctuations in aluminum ingot and scrap prices as well as natural gas prices (natural gas is the principal energy source used to operate our casting furnaces). There is no assurance of our ability to pass through higher raw material and energy costs to our customers.
See the executive summary beginning on page 21 for discussion regarding the impact of the lag in the pass-through of resin price changes. The volatility of average quarterly prices of low density polyethylene resin in the U.S. (a primary raw material for Film Products) is shown in the chart below.

|
Source: Quarterly averages computed by Tredegar using monthly data provided by Chemical Data Inc. (“CDI”).
|
Resin prices in Europe, Asia and South America have historically exhibited similar long-term trends. The price of resin is driven by several factors, including supply and demand and the price of oil, ethylene and natural gas. Due to supply constraints, the increase in resin prices in Europe in the second quarter of 2015 was significantly greater than the observed trends in other regions of the world. The discrepancy is not expected to continue in the long term, but the Company will continue to monitor pricing in Europe compared to the U.S., Asia and South America.
To address fluctuating resin prices, Film Products has index-based pass-through raw material cost agreements for the majority of its business. However, under certain agreements, changes in resin prices are not passed through for an average period of 90 days. Pricing on the remainder of the business is based upon raw material costs and supply/demand dynamics within the markets that the Company competes.
34
Polyester resins, MEG and PTA used in flexible packaging films produced in Brazil are primarily purchased domestically, with other sources available mostly from Asia and the U.S. Given the nature of these products as commodities, pricing is derived from Asian pricing indexes. The volatility of the average quarterly prices for polyester fibers in Asia, which is representative of polyester resin (a primary raw material for polyester film products) pricing trends, is shown in the chart below:

|
Source: Quarterly averages computed by Tredegar using monthly data from CMAI Global Index data.
|
The volatility of average quarterly prices of PTA and MEG in Asia (raw materials used in the production of polyester resins produced by Film Products) is shown in the chart below:

|
Source: Quarterly averages computed by Tredegar using monthly data from CMAI Global Index data.
|
In the normal course of business, Aluminum Extrusions enters into fixed-price forward sales contracts with certain customers for the sale of fixed quantities of aluminum extrusions at scheduled intervals. In order to hedge its exposure to aluminum price volatility (see the chart below) under these fixed-price arrangements, which generally have a duration of not more than 12 months, the Company enters into a combination of forward purchase commitments and futures contracts to acquire or hedge aluminum, based on the scheduled deliveries. See Note 7 on page 13 for additional information.
35
The volatility of quarterly average aluminum prices is shown in the chart below.

|
Source: Quarterly averages computed using daily Midwest average prices provided by Platts.
|
From time-to-time, Aluminum Extrusions hedges a portion of its exposure to natural gas price volatility by entering into fixed-price forward purchase contracts with the Company’s natural gas suppliers. The Company estimates that, in an unhedged situation, every $1 per mmBtu per month change in the market price of natural gas has an
$87,000
impact on the continuing monthly operating profit in Aluminum Extrusions. The Company has an energy surcharge for its aluminum extrusions business in the U.S. to be applied when the NYMEX natural gas price is in excess of $8.85 per mmBtu.
The volatility of quarterly average natural gas prices is shown in the chart below.

|
Source: Quarterly averages computed by Tredegar using monthly NYMEX settlement prices.
|
36
The Company sells to customers in foreign markets through its foreign operations and through exports from U.S. plants. The percentage of sales for manufacturing operations related to foreign markets for the first
six months
of
2015
and
2014
are as follows:
|
Percentage of Net Sales from Ongoing
Operations Related to Foreign Markets*
|
|||||||||||
|
|
Six Months Ended June 30,
|
||||||||||
|
|
2015
|
2014
|
|||||||||
|
|
Exports
From U.S.
|
Foreign
Operations
|
Exports
From U.S.
|
Foreign
Operations
|
|||||||
|
Canada
|
5
|
%
|
—
|
%
|
5
|
%
|
—
|
%
|
|||
|
Europe
|
1
|
|
10
|
|
1
|
|
12
|
|
|||
|
Latin America
|
—
|
|
10
|
|
—
|
|
10
|
|
|||
|
Asia
|
8
|
|
3
|
|
7
|
|
4
|
|
|||
|
Total
|
14
|
%
|
23
|
%
|
13
|
%
|
26
|
%
|
|||
|
*
|
The percentages for foreign markets are relative to Tredegar’s total net sales from ongoing operations
|
The Company attempts to match the pricing and cost of polyethylene and polypropylene resin-based products in the same currency and generally views the volatility of foreign currencies (see trends for the Euro and Chinese Yuan in the chart below) and emerging markets, and the corresponding impact on earnings and cash flow, as part of the overall risk of operating in a global environment. Exports from the U.S. are generally denominated in U.S. Dollars. Foreign currency exposure on income from foreign operations relates to the Euro, the Brazilian Real, the Chinese Yuan, the Hungarian Forint and the Indian Rupee.
For polyester film-based products manufactured in Brazil, the Company prices its products in U.S. Dollars, and key raw materials are also priced in U.S. Dollars. However, certain production costs, such as conversion costs and other fixed costs, are priced in Brazilian Real, which exposes our operating margins to some currency exposure. In general, when the U.S. Dollar is strengthening versus the Brazilian Real, operating results will benefit from relatively lower costs, and when the U.S. Dollar is weakening versus the Brazilian Real, operating results will be negatively impacted from relatively higher costs. The Company is generally able to match the currency of its sales and costs for the remaining portion of its Film Products.
The Company estimates that the unfavorable impact from the change in the value of foreign currencies relative to the U.S. Dollar on polyethylene film operating results was approximately
$0.7 million
in the
second quarter
of
2015
compared with the
second quarter
of
2014
and approximately
$2.4 million
in the first
six months
of
2015
compared with the first
six months
of
2014
.
Trends for the Euro exchange rates relative to the U.S. Dollar are shown in the chart below.
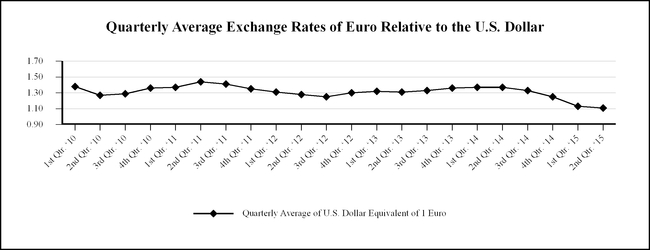
|
Source: Quarterly averages computed by Tredegar using daily closing data provided by Bloomberg.
|
37
Trends for the Brazilian Real and Chinese Yuan exchange rates relative to the U.S. Dollar are shown in the chart below.

|
Source: Quarterly averages computed by Tredegar using daily closing data provided by Bloomberg.
|
|
Item 4.
|
Controls and Procedures.
|
Pursuant to Rule 13a-15(b) under the Securities Exchange Act of 1934, as amended, we carried out an evaluation, with the participation of our management, including our principal executive officer and principal financial officer, of the effectiveness of our disclosure controls and procedures (as defined under Rule 13a-15(e) under the Securities Exchange Act of 1934) as of the end of the period covered by this report. Based upon that evaluation, the principal executive officer and principal financial officer concluded that the Company’s disclosure controls and procedures are effective to ensure that information required to be disclosed by us in the reports that we file or submit under the Securities Exchange Act of 1934, is recorded, processed, summarized and reported, within the time periods specified in the SEC’s rules and forms, and that such information is accumulated and communicated to our management, including the principal executive officer and principal financial officer, as appropriate, to allow timely decisions regarding required disclosure.
There has been no change in the Company’s internal control over financial reporting during the quarter ended
June 30, 2015
, that has materially affected, or is reasonably likely to materially affect, its internal control over financial reporting.
|
Item 1A.
|
Risk Factors.
|
There are a number of risks and uncertainties that can have a material effect on the operating results of our businesses and our financial condition. These risk factors have not changed materially since the filing the
2014
Form 10-K.
38
|
Item 6.
|
Exhibits.
|
|
Exhibit
Nos.
|
|
|
|
3.2
|
Amended and Restated Bylaws of Tredegar Corporation, as of June 25, 2015 (filed as Exhibit 3.2 to Tredegar Corporation’s Current Report on Form 8-K (File No. 1-10258) filed on June 29, 2015, and incorporated herein by reference).
|
|
|
10.1
|
Separation, Waiver and Release Agreement with Nancy M. Taylor, dated June 25, 2015 (filed as Exhibit 10.1 to Tredegar Corporation’s Current Report on Form 8-K (File No. 1-10258) filed on June 29, 2015, and incorporated herein by reference).
|
|
|
10.2
|
Separation, Waiver and Release Agreement with Kevin A. O’Leary, dated June 25, 2015 (filed as Exhibit 10.2 to Tredegar Corporation’s Current Report on Form 8-K (File No. 1-10258) filed on June 29, 2015, and incorporated herein by reference).
|
|
|
10.3
|
Severance Agreement with D. Andrew Edwards, dated June 25, 2015 (filed as Exhibit 10.3 to Tredegar Corporation’s Current Report on Form 8-K (File No. 1-10258) filed on June 29, 2015, and incorporated herein by reference).
|
|
|
31.1
|
|
Certification of John D. Gottwald, Interim President and Chief Executive Officer of Tredegar Corporation, pursuant to Rules 13a-14(a) and 15d-14(a) promulgated under the Securities Exchange Act of 1934, as adopted pursuant to Section 302 of the Sarbanes-Oxley Act of 2002.
|
|
31.2
|
|
Certification of D. Andrew Edwards, Vice President, Chief Financial Officer and Treasurer (Principal Financial Officer) of Tredegar Corporation, pursuant to Rules 13a-14(a) and 15d-14(a) promulgated under the Securities Exchange Act of 1934, as adopted pursuant to Section 302 of the Sarbanes-Oxley Act of 2002.
|
|
32.1
|
|
Certification of John D. Gottwald, Interim President and Chief Executive Officer of Tredegar Corporation, pursuant to 18 U.S.C. Section 1350, as adopted pursuant to Section 906 of the Sarbanes-Oxley Act of 2002.
|
|
32.2
|
|
Certification of D. Andrew Edwards, Vice President, Chief Financial Officer and Treasurer (Principal Financial Officer) of Tredegar Corporation, pursuant to 18 U.S.C. Section 1350, as adopted pursuant to Section 906 of the Sarbanes-Oxley Act of 2002.
|
|
101
|
|
XBRL Instance Document and Related Items.
|
39
SIGNATURES
Pursuant to the requirements of the Securities Exchange Act of 1934, the Registrant has duly caused this report to be signed on its behalf by the undersigned thereunto duly authorized.
|
Tredegar Corporation
|
||||
|
(Registrant)
|
||||
|
Date:
|
July 30, 2015
|
/s/ John D. Gottwald
|
||
|
John D. Gottwald
|
||||
|
Interim President and Chief Executive Officer
|
||||
|
(Principal Executive Officer)
|
||||
|
Date:
|
July 30, 2015
|
/s/ D. Andrew Edwards
|
||
|
D. Andrew Edwards
|
||||
|
Vice President, Chief Financial Officer and Treasurer
|
||||
|
(Principal Financial Officer)
|
||||
|
Date:
|
July 30, 2015
|
/s/ Frasier W. Brickhouse, II
|
||
|
Frasier W. Brickhouse, II
|
||||
|
Corporate Controller and Assistant Treasurer
|
||||
|
(Principal Accounting Officer)
|
||||
TABLE OF CONTENTS
Part I - Financial InformationItem 1. Financial StatementsItem 2. Management S Discussion and Analysis Of Financial Condition and Results Of OperationsItem 3. Quantitative and Qualitative Disclosures About Market RiskItem 4. Controls and ProceduresPart II - Other InformationItem 1A. Risk FactorsItem 6. Exhibits