TREDEGAR CORP
10-Ks and 10-Qs
|
|
|
|
|
|
|
|
|
|
|
|
|
|
|
|
|
|
|
|
|
|
|
|
|
|
|
|
|
|
|
|
|
|
|
|
|
|
|
|
|
|
|
|
|
|
|
|
|
|
|
|
|
UNITED STATES
SECURITIES AND EXCHANGE COMMISSION
Washington, D.C. 20549
FORM 10-Q
(Mark One)
|
x
|
QUARTERLY REPORT PURSUANT TO SECTION 13 OR 15(d) OF THE SECURITIES EXCHANGE ACT OF 1934
|
For the quarterly period ended
September 30, 2016
OR
|
¨
|
TRANSITION REPORT PURSUANT TO SECTION 13 OR 15(d) OF THE SECURITIES EXCHANGE ACT OF 1934
|
For the transition period from
to
Commission file number
1-10258
Tredegar Corporation
(Exact Name of Registrant as Specified in Its Charter)
|
Virginia
|
|
54-1497771
|
|
(State or Other Jurisdiction of
Incorporation or Organization)
|
|
(I.R.S. Employer
Identification No.)
|
|
1100 Boulders Parkway
Richmond, Virginia
|
|
23225
|
|
(Address of Principal Executive Offices)
|
|
(Zip Code)
|
Registrant’s Telephone Number, Including Area Code:
(804) 330-1000
Indicate by check mark whether the registrant (1) has filed all reports required to be filed by Section 13 or 15(d) of the Securities Exchange Act of 1934 during the preceding 12 months (or for such shorter period that the registrant was required to file such reports), and (2) has been subject to such filing requirements for the past 90 days. Yes
x
No
¨
Indicate by check mark whether the registrant has submitted electronically and posted on its corporate Web site, if any, every Interactive Data File required to be submitted and posted pursuant to Rule 405 of Regulation S-T (232.405 of this chapter) during the preceding 12 months (or for such shorter period that the registrant was required to submit and post such files). Yes
x
No
¨
Indicate by check mark whether the registrant is a large accelerated filer, an accelerated filer, a non-accelerated filer, or a smaller reporting company. See the definitions of “large accelerated filer,” “accelerated filer” and “smaller reporting company” in Rule 12b-2 of the Exchange Act.
|
Large accelerated filer
|
x
|
Accelerated filer
|
¨
|
||
|
Non-accelerated filer
|
¨
(Do not check if a smaller reporting company)
|
Smaller reporting company
|
¨
|
||
Indicate by check mark whether the registrant is a shell company (as defined in Rule 12b-2 of the Exchange Act). Yes
¨
No
x
The number of shares of Common Stock, no par value, outstanding as of
October 27, 2016
: 32,921,549
|
Item 1.
|
Financial Statements.
|
Tredegar Corporation
(In Thousands, Except Share Data)
(Unaudited)
|
September 30,
|
December 31,
|
||||||
|
2016
|
2015
|
||||||
|
Assets
|
|||||||
|
Current assets:
|
|||||||
|
Cash and cash equivalents
|
$
|
28,356
|
|
$
|
44,156
|
|
|
|
Accounts and other receivables, net of allowance for doubtful accounts and sales returns of $3,206 in 2016 and $3,746 in 2015
|
104,394
|
|
94,217
|
|
|||
|
Income taxes recoverable
|
4,622
|
|
360
|
|
|||
|
Inventories
|
73,273
|
|
65,325
|
|
|||
|
Prepaid expenses and other
|
6,351
|
|
6,946
|
|
|||
|
Total current assets
|
216,996
|
|
211,004
|
|
|||
|
Property, plant and equipment, at cost
|
795,087
|
|
754,678
|
|
|||
|
Less accumulated depreciation
|
(538,308
|
)
|
(523,363
|
)
|
|||
|
Net property, plant and equipment
|
256,779
|
|
231,315
|
|
|||
|
Goodwill and other intangibles, net
|
152,505
|
|
153,072
|
|
|||
|
Other assets and deferred charges
|
29,490
|
|
27,869
|
|
|||
|
Total assets
|
$
|
655,770
|
|
$
|
623,260
|
|
|
|
Liabilities and Shareholders’ Equity
|
|||||||
|
Current liabilities:
|
|||||||
|
Accounts payable
|
$
|
88,073
|
|
$
|
84,148
|
|
|
|
Accrued expenses
|
36,871
|
|
33,653
|
|
|||
|
Total current liabilities
|
124,944
|
|
117,801
|
|
|||
|
Long-term debt
|
91,750
|
|
104,000
|
|
|||
|
Deferred income taxes
|
19,813
|
|
18,656
|
|
|||
|
Other noncurrent liabilities
|
101,345
|
|
110,055
|
|
|||
|
Total liabilities
|
337,852
|
|
350,512
|
|
|||
|
Commitments and contingencies (Notes 1 and 12)
|
|
|
|||||
|
Shareholders’ equity:
|
|||||||
|
Common stock, no par value (issued and outstanding - 32,921,549 at September 30, 2016 and 32,682,162 at December 31, 2015)
|
32,268
|
|
29,467
|
|
|||
|
Common stock held in trust for savings restoration plan (69,207 shares at September 30, 2016 and 67,726 shares at December 31, 2015)
|
(1,490
|
)
|
(1,467
|
)
|
|||
|
Accumulated other comprehensive income (loss):
|
|||||||
|
Foreign currency translation adjustment
|
(89,878
|
)
|
(112,807
|
)
|
|||
|
Gain/(loss) on derivative financial instruments
|
590
|
|
(373
|
)
|
|||
|
Pension and other post-retirement benefit adjustments
|
(88,966
|
)
|
(95,539
|
)
|
|||
|
Retained earnings
|
465,394
|
|
453,467
|
|
|||
|
Total shareholders’ equity
|
317,918
|
|
272,748
|
|
|||
|
Total liabilities and shareholders’ equity
|
$
|
655,770
|
|
$
|
623,260
|
|
|
See accompanying notes to financial statements.
2
Tredegar Corporation
(In Thousands, Except Per Share Data)
(Unaudited)
|
Three Months Ended September 30,
|
Nine Months Ended September 30,
|
||||||||||||||
|
|
2016
|
2015
|
2016
|
2015
|
|||||||||||
|
Revenues and other items:
|
|||||||||||||||
|
Sales
|
$
|
207,702
|
|
$
|
223,772
|
|
$
|
623,569
|
|
$
|
679,188
|
|
|||
|
Other income (expense), net
|
388
|
|
147
|
|
1,481
|
|
379
|
|
|||||||
|
208,090
|
|
223,919
|
|
625,050
|
|
679,567
|
|
||||||||
|
Costs and expenses:
|
|||||||||||||||
|
Cost of goods sold
|
166,622
|
|
182,442
|
|
499,504
|
|
555,627
|
|
|||||||
|
Freight
|
7,153
|
|
7,862
|
|
21,221
|
|
22,930
|
|
|||||||
|
Selling, general and administrative
|
17,383
|
|
14,709
|
|
57,027
|
|
53,680
|
|
|||||||
|
Research and development
|
4,519
|
|
3,774
|
|
14,458
|
|
11,926
|
|
|||||||
|
Amortization of intangibles
|
1,019
|
|
990
|
|
2,965
|
|
3,113
|
|
|||||||
|
Interest expense
|
886
|
|
901
|
|
2,918
|
|
2,679
|
|
|||||||
|
Asset impairments and costs associated with exit and disposal activities, net of adjustments
|
1,129
|
|
2,117
|
|
2,355
|
|
2,342
|
|
|||||||
|
Goodwill impairment charge
|
—
|
|
44,465
|
|
—
|
|
44,465
|
|
|||||||
|
Total
|
198,711
|
|
257,260
|
|
600,448
|
|
696,762
|
|
|||||||
|
Income (loss) before income taxes
|
9,379
|
|
(33,341
|
)
|
24,602
|
|
(17,195
|
)
|
|||||||
|
Income taxes (benefit)
|
(2,669
|
)
|
3,382
|
|
1,864
|
|
9,064
|
|
|||||||
|
Net income (loss)
|
$
|
12,048
|
|
$
|
(36,723
|
)
|
$
|
22,738
|
|
$
|
(26,259
|
)
|
|||
|
Earnings (loss)
per share:
|
|||||||||||||||
|
Basic
|
$
|
0.37
|
|
$
|
(1.13
|
)
|
$
|
0.69
|
|
$
|
(0.81
|
)
|
|||
|
Diluted
|
$
|
0.37
|
|
$
|
(1.13
|
)
|
$
|
0.69
|
|
$
|
(0.81
|
)
|
|||
|
Shares used to compute earnings (loss) per share:
|
|||||||||||||||
|
Basic
|
32,818
|
|
32,605
|
|
32,730
|
|
32,566
|
|
|||||||
|
Diluted
|
32,828
|
|
32,605
|
|
32,733
|
|
32,566
|
|
|||||||
|
Dividends per share
|
$
|
0.11
|
|
$
|
0.11
|
|
$
|
0.33
|
|
$
|
0.31
|
|
|||
See accompanying notes to financial statements.
3
Tredegar Corporation
Consolidated Statements of Comprehensive Income (Loss)
(In Thousands)
(Unaudited)
|
Three Months Ended September 30,
|
|||||||
|
|
2016
|
2015
|
|||||
|
Net income (loss)
|
$
|
12,048
|
|
$
|
(36,723
|
)
|
|
|
Other comprehensive income (loss):
|
|||||||
|
Foreign currency translation adjustment (net of tax benefit of $77 in 2016 and tax benefit of $122 in 2015)
|
(719
|
)
|
(35,526
|
)
|
|||
|
Derivative financial instruments adjustment (net of tax benefit of $31 in 2016 and tax benefit of $92 in 2015)
|
(54
|
)
|
(155
|
)
|
|||
|
Amortization of prior service costs and net gains or losses (net of tax of $1,120 in 2016 and tax of $1,478 in 2015)
|
1,966
|
|
2,550
|
|
|||
|
Other comprehensive income (loss)
|
1,193
|
|
(33,131
|
)
|
|||
|
Comprehensive income (loss)
|
$
|
13,241
|
|
$
|
(69,854
|
)
|
|
|
|
Nine Months Ended September 30,
|
||||||
|
|
2016
|
2015
|
|||||
|
Net income (loss)
|
$
|
22,738
|
|
$
|
(26,259
|
)
|
|
|
Other comprehensive income (loss):
|
|||||||
|
Foreign currency translation adjustment (net of tax benefit of $307 in 2016 and tax benefit of $1,506 in 2015)
|
22,929
|
|
(64,622
|
)
|
|||
|
Derivative financial instruments adjustment (net of tax of $567 in 2016 and tax benefit of $1,082 in 2015)
|
963
|
|
(1,796
|
)
|
|||
|
Amortization of prior service costs and net gains or losses (net of tax of $3,186 in 2016 and tax of $4,402 in 2015)
|
6,573
|
|
7,595
|
|
|||
|
Other comprehensive income (loss)
|
30,465
|
|
(58,823
|
)
|
|||
|
Comprehensive income (loss)
|
$
|
53,203
|
|
$
|
(85,082
|
)
|
|
See accompanying notes to financial statements.
4
Tredegar Corporation
(In Thousands)
(Unaudited)
|
Nine Months Ended September 30,
|
|||||||
|
|
2016
|
2015
|
|||||
|
Cash flows from operating activities:
|
|||||||
|
Net income (loss)
|
$
|
22,738
|
|
$
|
(26,259
|
)
|
|
|
Adjustments for noncash items:
|
|||||||
|
Depreciation
|
21,004
|
|
23,932
|
|
|||
|
Amortization of intangibles
|
2,965
|
|
3,113
|
|
|||
|
Goodwill impairment charge
|
—
|
|
44,465
|
|
|||
|
Deferred income taxes
|
(5,122
|
)
|
(7,526
|
)
|
|||
|
Accrued pension and post-retirement benefits
|
8,168
|
|
9,358
|
|
|||
|
Loss on investment accounted for under the fair value method
|
200
|
|
—
|
|
|||
|
Loss on asset impairments and divestitures
|
412
|
|
319
|
|
|||
|
Net gain on disposal of assets
|
—
|
|
(11
|
)
|
|||
|
Gain from insurance recoveries
|
(1,634
|
)
|
—
|
|
|||
|
Changes in assets and liabilities, net of effects of acquisitions and divestitures:
|
|||||||
|
Accounts and other receivables
|
(4,919
|
)
|
(4,725
|
)
|
|||
|
Inventories
|
(5,188
|
)
|
1,205
|
|
|||
|
Income taxes recoverable/payable
|
(4,095
|
)
|
184
|
|
|||
|
Prepaid expenses and other
|
(514
|
)
|
(1,141
|
)
|
|||
|
Accounts payable and accrued expenses
|
4,857
|
|
(9,028
|
)
|
|||
|
Other, net
|
(4,450
|
)
|
(544
|
)
|
|||
|
Net cash provided by operating activities
|
34,422
|
|
33,342
|
|
|||
|
Cash flows from investing activities:
|
|||||||
|
Capital expenditures
|
(30,912
|
)
|
(23,382
|
)
|
|||
|
Proceeds from the sale of assets and other
|
1,399
|
|
949
|
|
|||
|
Net cash used in investing activities
|
(29,513
|
)
|
(22,433
|
)
|
|||
|
Cash flows from financing activities:
|
|||||||
|
Borrowings
|
61,000
|
|
88,000
|
|
|||
|
Debt principal payments
|
(73,250
|
)
|
(91,250
|
)
|
|||
|
Dividends paid
|
(10,834
|
)
|
(10,130
|
)
|
|||
|
Debt financing costs
|
(2,509
|
)
|
(78
|
)
|
|||
|
Proceeds from exercise of stock options and other
|
2,073
|
|
2,794
|
|
|||
|
Net cash used in financing activities
|
(23,520
|
)
|
(10,664
|
)
|
|||
|
Effect of exchange rate changes on cash
|
2,811
|
|
(3,692
|
)
|
|||
|
Decrease in cash and cash equivalents
|
(15,800
|
)
|
(3,447
|
)
|
|||
|
Cash and cash equivalents at beginning of period
|
44,156
|
|
50,056
|
|
|||
|
Cash and cash equivalents at end of period
|
$
|
28,356
|
|
$
|
46,609
|
|
|
See accompanying notes to financial statements.
5
Tredegar Corporation
Consolidated Statement of Shareholders’ Equity
(In Thousands, Except Share and Per Share Data)
(Unaudited)
|
|
|
Accumulated Other
Comprehensive Income (Loss)
|
|
||||||||||||||||||||||||
|
|
Common
Stock
|
Retained
Earnings
|
Trust for
Savings
Restoration
Plan
|
Foreign
Currency
Translation
|
Gain
(Loss) on
Derivative
Financial
Instruments
|
Pension &
Other
Post-retirement
Benefit
Adjust.
|
Total
Shareholders’
Equity
|
||||||||||||||||||||
|
Balance at January 1, 2016
|
$
|
29,467
|
|
$
|
453,467
|
|
$
|
(1,467
|
)
|
$
|
(112,807
|
)
|
$
|
(373
|
)
|
$
|
(95,539
|
)
|
$
|
272,748
|
|
||||||
|
Net income
|
—
|
|
22,738
|
|
—
|
|
—
|
|
—
|
|
—
|
|
22,738
|
|
|||||||||||||
|
Other comprehensive income (loss):
|
|||||||||||||||||||||||||||
|
Foreign currency translation adjustment (net of tax benefit of $307)
|
—
|
|
—
|
|
—
|
|
22,929
|
|
—
|
|
—
|
|
22,929
|
|
|||||||||||||
|
Derivative financial instruments adjustment (net of tax of $567)
|
—
|
|
—
|
|
—
|
|
—
|
|
963
|
|
—
|
|
963
|
|
|||||||||||||
|
Amortization of prior service costs and net gains or losses (net of tax of $3,186)
|
—
|
|
—
|
|
—
|
|
—
|
|
—
|
|
6,573
|
|
6,573
|
|
|||||||||||||
|
Cash dividends declared ($0.33 per share)
|
—
|
|
(10,834
|
)
|
—
|
|
—
|
|
—
|
|
—
|
|
(10,834
|
)
|
|||||||||||||
|
Stock-based compensation expense
|
1,308
|
|
—
|
|
—
|
|
—
|
|
—
|
|
—
|
|
1,308
|
|
|||||||||||||
|
Issued upon exercise of stock options & other
|
1,493
|
|
—
|
|
—
|
|
—
|
|
—
|
|
—
|
|
1,493
|
|
|||||||||||||
|
Tredegar common stock purchased by trust for savings restoration plan
|
—
|
|
23
|
|
(23
|
)
|
—
|
|
—
|
|
—
|
|
—
|
|
|||||||||||||
|
Balance at September 30, 2016
|
$
|
32,268
|
|
$
|
465,394
|
|
$
|
(1,490
|
)
|
$
|
(89,878
|
)
|
$
|
590
|
|
$
|
(88,966
|
)
|
$
|
317,918
|
|
||||||
See accompanying notes to financial statements.
6
TREDEGAR CORPORATION
NOTES TO THE CONSOLIDATED INTERIM FINANCIAL STATEMENTS
(Unaudited)
|
1.
|
In the opinion of management, the accompanying consolidated financial statements of Tredegar Corporation and its subsidiaries (“Tredegar,” “the Company,” “we,” “us” or “our”) contain all adjustments necessary to state fairly, in all material respects, Tredegar’s consolidated financial position as of
September 30, 2016
, the consolidated results of operations for the
three and nine
months ended
September 30, 2016
and
2015
, the consolidated cash flows for the
nine months
ended
September 30, 2016
and
2015
, and the consolidated changes in shareholders’ equity for the
nine months
ended
September 30, 2016
. All such adjustments, unless otherwise detailed in the notes to the consolidated interim financial statements, are deemed to be of a normal, recurring nature. The financial position data as of
December 31, 2015
that is included herein was derived from the audited consolidated financial statements provided in the Company’s Annual Report on Form 10-K/A for the year ended
December 31, 2015
(“
2015
Form 10-K”) but does not include all disclosures required by United States generally accepted accounting principles (“GAAP”). These financial statements should be read in conjunction with the consolidated financial statements and related notes included in the Company’s
2015
Form 10-K. The results of operations for the
three and nine
months ended
September 30, 2016
, are not necessarily indicative of the results to be expected for the full year.
|
|
2.
|
Plant shutdowns, asset impairments, restructurings and other items are shown in the net sales and operating profit by segment table in Note 9 and are also included in “Asset impairments and costs associated with exit and disposal activities, net of adjustments” in the consolidated statements of income, unless otherwise noted below.
|
Plant shutdowns, asset impairments, restructurings and other items in the
third quarter
of
2016
include:
|
•
|
Net pretax income of
$1.7 million
related to the explosion that occurred in the second quarter of 2016 at Bonnell’s aluminum extrusions manufacturing facility in Newnan, Georgia, which includes the recognition of a gain of
$1.9 million
for a portion of the insurance recoveries approved by the insurer to begin the replacement of capital equipment, offset by the impairment of equipment damaged by the explosion of
$0.3 million
(net amount included in “Other income (expense), net” in the consolidated statements of income), and the reversal of an accrual for costs related to the explosion of
$50,000
(included in “Selling, general and administrative expenses” in the consolidated statements of income).
|
|
•
|
Pretax charges of
$1.1 million
associated with the consolidation of domestic PE Films’ manufacturing facilities, which consists of severance and other employee-related costs of
$0.3 million
, asset impairments of
$0.1 million
, accelerated depreciation of
$0.1 million
(included in “Cost of goods sold” in the consolidated statements of income) and other facility consolidation-related expenses of
$0.6 million
(
$0.4 million
included in “Cost of goods sold” in the consolidated statements of income);
|
|
•
|
Pretax charges of
$0.3 million
for severance and other employee-related costs associated with restructurings in PE Films (
$0.1 million
) and Corporate (
$0.2 million
) (included in “Corporate expenses, net” in the statement of net sales and operating profit by segment); and
|
|
•
|
Pretax charges of
$0.3 million
associated with the shutdown of the aluminum extrusions manufacturing facility in Kentland, Indiana.
|
Plant shutdowns, asset impairments, restructurings and other items in the first
nine months
of
2016
include:
|
•
|
Net pretax income of
$1.1 million
related to the explosion that occurred in the second quarter of 2016 at Bonnell’s aluminum extrusions manufacturing facility in Newnan, Georgia, which includes the recognition of a gain of
$1.9 million
for a portion of the insurance recoveries approved by the insurer to begin the replacement of capital equipment, offset by the impairment of equipment damaged by the explosion of
$0.3 million
(net amount included in “Other income (expense), net” in the consolidated statements of income) and other costs related to the explosion not recoverable from insurance of
$0.5 million
(included in “Selling, general and administrative expenses” in the consolidated statements of income).
|
|
•
|
Pretax charges of
$3.6 million
associated with the consolidation of domestic PE Films’ manufacturing facilities, which consists of severance and other employee-related costs of
$0.9 million
, asset impairments of
$0.4 million
, accelerated depreciation of
$0.4 million
(included in “Cost of goods sold” in the consolidated statements of income) and other facility consolidation-related expenses of
$1.9 million
(
$1.4 million
is included in “Cost of goods sold” in the consolidated statements of income);
|
7
|
•
|
Pretax charges of
$0.4 million
associated with a non-recurring business development project (included in “Selling, general and administrative expense” in the consolidated statements of income and “Corporate expenses, net” in the statement of net sales and operating profit by segment);
|
|
•
|
Pretax charges of
$0.3 million
for severance and other employee-related costs associated with restructurings in PE Films (
$0.1 million
) and Corporate (
$0.2 million
) (included in “Corporate expenses, net” in the statement of net sales and operating profit by segment); and
|
|
•
|
Pretax charges of
$0.3 million
associated with the shutdown of the aluminum extrusions manufacturing facility in Kentland, Indiana.
|
Plant shutdowns, asset impairments, restructurings and other items in the
third quarter
of
2015
include:
|
•
|
Pretax charges of
$1.2 million
associated with the consolidation of domestic PE Films’ manufacturing facilities, which consists of severance and other employee-related costs of
$0.3 million
, asset impairments of
$0.3 million
, accelerated depreciation of
$0.2 million
(included in “Cost of goods sold” in the consolidated statements of income) and other facility consolidation-related expenses of
$0.3 million
(
$46,000
is included in “Cost of goods sold” in the consolidated statements of income);
|
|
•
|
Pretax charges of
$0.9 million
for severance and other employee-related costs associated with restructurings in PE Films (
$0.9 million
), Aluminum Extrusions (
$35,000
) and Corporate (
$26,000
) (included in “Corporate expenses, net” in the statement of net sales and operating profit by segment); and
|
|
•
|
Pretax charges of
$0.3 million
associated with the shutdown of the aluminum extrusions manufacturing facility in Kentland, Indiana.
|
Plant shutdowns, asset impairments, restructurings and other items in the first
nine months
of
2015
include:
|
•
|
Pretax charges of
$3.9 million
(included in “Selling, general and administrative expense” in the consolidated statements of income and “Corporate expenses, net” in the statement of net sales and operating profit by segment) for severance and other employee-related costs associated with the resignation of the Company’s former chief executive and chief financial officers;
|
|
•
|
Pretax charges of
$1.2 million
associated with the consolidation of domestic PE Films’ manufacturing facilities, which consists of severance and other employee-related costs of
$0.3 million
, asset impairments of
$0.3 million
, accelerated depreciation of
$0.2 million
(included in “Cost of goods sold” in the consolidated statements of income) and other facility consolidation-related expenses of
$0.3 million
(
$46,000
is included in “Cost of goods sold” in the consolidated statements of income);
|
|
•
|
Pretax charge of
$1.1 million
for severance and other employee-related costs associated with restructurings in PE Films (
$0.9 million
), Flexible Packaging Films (
$0.2 million
), Aluminum Extrusions (
$35,000
) and Corporate (
$26,000
) (included in “Corporate expenses, net” in the statement of net sales and operating profit by segment); and
|
|
•
|
Pretax charges of
$0.3 million
associated with the shutdown of the aluminum extrusions manufacturing facility in Kentland, Indiana.
|
Results in the
third quarter
and first
nine months
of
2016
include an unrealized loss on the Company’s investment in kaleo, Inc (“kaléo”), which is accounted for under the fair value method (included in “Other income (expense), net” in the consolidated statements of income), of
$1.3 million
(
$1.0 million
after taxes) and
$0.2 million
(
$0.2 million
after taxes), respectively (no unrealized gains or losses were recorded in the first
nine months
of
2015
). See Note 6 for additional information on investments.
8
A
reconciliation of the beginning and ending balances of accrued expenses associated with
exit and disposal activities and charges associated with asset impairments
and reported as “Asset impairments and costs associated with exit and disposal activities, net of adjustments” in the consolidated statements of income for the
nine months ended
September 30, 2016
is as follows:
|
(In Thousands)
|
Severance
|
Asset Impairments
|
Other (a)
|
Total
|
|||||||||||
|
Balance at January 1, 2016
|
$
|
1,462
|
|
$
|
—
|
|
$
|
405
|
|
$
|
1,867
|
|
|||
|
Changes in 2016:
|
|||||||||||||||
|
Charges
|
1,216
|
|
412
|
|
727
|
|
2,355
|
|
|||||||
|
Cash spent
|
(833
|
)
|
—
|
|
(593
|
)
|
(1,426
|
)
|
|||||||
|
Charges against assets
|
—
|
|
(412
|
)
|
—
|
|
(412
|
)
|
|||||||
|
Balance at September 30, 2016
|
$
|
1,845
|
|
$
|
—
|
|
$
|
539
|
|
$
|
2,384
|
|
|||
|
(a) Other includes other facility consolidation-related costs associated with the consolidation of North American PE Films manufacturing facilities and other shutdown-related costs associated with the shutdown of the Company’s aluminum extrusions manufacturing facility in Kentland, Indiana.
|
|||||||||||||||
In July 2015, the Company announced its intention to consolidate its domestic production for PE Films by restructuring the operations in its manufacturing facility in Lake Zurich, Illinois. Efforts to transition domestic production from the Lake Zurich manufacturing facility will require various machinery upgrades and equipment transfers to its other manufacturing facilities. Given PE Films’ focus on maintaining product quality and customer satisfaction, the Company anticipates that these activities will be completed in the middle of 2017. Total pre-tax cash expenditures associated with restructuring the Lake Zurich manufacturing facility are expected to be approximately $17 million over the project period, and once complete, annual pre-tax cash cost savings are expected to be approximately $5-6 million.
The Company expects to recognize costs associated with the exit and disposal activities of approximately $5-6 million over the project period. Exit and disposal costs include severance charges and other employee-related expenses arising from the termination of employees of approximately $3-4 million and equipment transfers and other facility consolidation-related costs of approximately
$2 million
.
During the same period of time, operating expenses will include the acceleration of approximately
$3 million
of non-cash depreciation expense for certain machinery and equipment at the Lake Zurich manufacturing facility. Total expenses associated with the North American facility consolidation project were
$1.1 million
and
$3.6 million
in the
third quarter
and first
nine months
of
2016
, respectively (
$0.6 million
and
$1.8 million
, respectively, included in “Asset impairments and costs associated with exit and disposal activities, net of adjustments” and
$0.5 million
and
$1.8 million
, respectively, included in “Cost of goods sold” in the consolidated statements of income). As of September 30, 2016, total expenses incurred since the project began in the third quarter of 2015 were
$5.7 million
.
Total estimated cash expenditures of $16-17 million over the project period include the following:
|
•
|
Cash outlays associated with previously discussed exit and disposal expenses of approximately
$5 million
, including additional operating expenses of approximately
$1 million
associated with customer product qualifications on upgraded and transferred production lines;
|
|
•
|
Capital expenditures associated with equipment upgrades at other PE Films manufacturing facilities in the U.S. of approximately
$11 million
; and
|
|
•
|
Cash incentives of approximately
$1 million
in connection with meeting safety and quality standards while production ramps down at the Lake Zurich manufacturing facility.
|
Cash expenditures for the North American facility consolidation project were
$3.2 million
and
$9.0 million
in the
third quarter
and first
nine months
of
2016
, respectively, which includes capital expenditures of
$2.6 million
and
$7.1 million
, respectively. As of September 30, 2016, total cash expenditures since the project began in the third quarter of 2015 were
$12.5 million
, which includes
$10.0 million
for capital expenditures.
9
|
3.
|
The components of inventories are as follows:
|
|
September 30,
|
December 31,
|
|||||||
|
(In Thousands)
|
2016
|
2015
|
||||||
|
Finished goods
|
$
|
17,255
|
|
$
|
13,935
|
|
||
|
Work-in-process
|
10,736
|
|
9,249
|
|
||||
|
Raw materials
|
26,553
|
|
22,149
|
|
||||
|
Stores, supplies and other
|
18,729
|
|
19,992
|
|
||||
|
Total
|
$
|
73,273
|
|
$
|
65,325
|
|
||
|
4.
|
Basic earnings (loss) per share is computed by dividing net income (loss) by the weighted average number of shares of common stock outstanding. Diluted earnings (loss) per share is computed by dividing net income (loss) by the weighted average common and potentially dilutive common equivalent shares outstanding, determined as follows:
|
|
Three Months Ended
|
Nine Months Ended
|
||||||||||
|
|
September 30,
|
September 30,
|
|||||||||
|
(In Thousands)
|
2016
|
2015
|
2016
|
2015
|
|||||||
|
Weighted average shares outstanding used to compute basic earnings per share
|
32,818
|
|
32,605
|
|
32,730
|
|
32,566
|
|
|||
|
Incremental dilutive shares attributable to stock options and restricted stock
|
10
|
|
—
|
|
3
|
|
—
|
|
|||
|
Shares used to compute diluted earnings per share
|
32,828
|
|
32,605
|
|
32,733
|
|
32,566
|
|
|||
Incremental shares attributable to stock options and restricted stock are computed under the treasury stock method using the average market price during the related period. For the three and
nine months ended
September 30, 2016
, average out-of-the-money options to purchase shares that were excluded from the calculation of incremental shares attributable to stock options and restricted stock were
493,119
and
643,010
, respectively. For the three and
nine months ended
September 30, 2015
, average out-of-the-money options to purchase shares that were excluded from the calculation of incremental shares attributable to stock options and restricted stock were
735,248
and
482,568
, respectively.
|
5.
|
The following table summarizes the after-tax changes in accumulated other comprehensive income (loss) for the
nine months ended
September 30, 2016
:
|
|
(In Thousands)
|
Foreign
currency
translation
adjustment
|
Gain (loss) on
derivative
financial
instruments
|
Pension and
other
post-retirement
benefit
adjustments
|
Total
|
|||||||||||
|
Beginning balance, January 1, 2016
|
$
|
(112,807
|
)
|
$
|
(373
|
)
|
$
|
(95,539
|
)
|
$
|
(208,719
|
)
|
|||
|
Other comprehensive income (loss) before reclassifications
|
22,929
|
|
(60
|
)
|
—
|
|
22,869
|
|
|||||||
|
Amounts reclassified from accumulated other comprehensive income (loss)
|
—
|
|
1,023
|
|
6,573
|
|
7,596
|
|
|||||||
|
Net other comprehensive income (loss) - current period
|
22,929
|
|
963
|
|
6,573
|
|
30,465
|
|
|||||||
|
Ending balance, September 30, 2016
|
$
|
(89,878
|
)
|
$
|
590
|
|
$
|
(88,966
|
)
|
$
|
(178,254
|
)
|
|||
10
The following table summarizes the after-tax changes in accumulated other comprehensive income (loss) for the
nine months ended
September 30, 2015
:
|
(In Thousands)
|
Foreign
currency translation adjustment |
Gain (loss) on
derivative financial instruments |
Pension and
other post-retirement benefit adjustments |
Total
|
|||||||||||
|
Beginning balance, January 1, 2015
|
$
|
(47,270
|
)
|
$
|
656
|
|
$
|
(103,581
|
)
|
$
|
(150,195
|
)
|
|||
|
Other comprehensive income (loss) before reclassifications
|
(64,622
|
)
|
(2,930
|
)
|
—
|
|
(67,552
|
)
|
|||||||
|
Amounts reclassified from accumulated other comprehensive income (loss)
|
—
|
|
1,134
|
|
7,595
|
|
8,729
|
|
|||||||
|
Net other comprehensive income (loss) - current period
|
(64,622
|
)
|
(1,796
|
)
|
7,595
|
|
(58,823
|
)
|
|||||||
|
Ending balance, September 30, 2015
|
$
|
(111,892
|
)
|
$
|
(1,140
|
)
|
$
|
(95,986
|
)
|
$
|
(209,018
|
)
|
|||
Reclassifications of balances out of accumulated other comprehensive income (loss) into net income for the three months ended
September 30, 2016
are summarized as follows:
|
(In Thousands)
|
Amount
reclassified from other comprehensive income (loss) |
Location of gain
(loss) reclassified from accumulated other comprehensive income (loss) to net income |
|||
|
Gain (loss) on derivative financial instruments:
|
|||||
|
Aluminum future contracts, before taxes
|
$
|
(160
|
)
|
Cost of sales
|
|
|
Foreign currency forward contracts, before taxes
|
15
|
|
Cost of sales
|
||
|
Total, before taxes
|
(145
|
)
|
|||
|
Income tax expense (benefit)
|
(53
|
)
|
Income taxes
|
||
|
Total, net of tax
|
$
|
(92
|
)
|
||
|
Amortization of pension and other post-retirement benefits:
|
|||||
|
Actuarial gain (loss) and prior service costs, before taxes
|
$
|
(3,086
|
)
|
(a)
|
|
|
Income tax expense (benefit)
|
(1,120
|
)
|
Income taxes
|
||
|
Total, net of tax
|
$
|
(1,966
|
)
|
||
|
(a)
|
This component of accumulated other comprehensive income (loss) is included in the computation of net periodic pension cost (see Note 8 for additional detail).
|
11
Reclassifications of balances out of accumulated other comprehensive income (loss) into net income for the
nine months
ended
September 30, 2016
are summarized as follows:
|
(In Thousands)
|
Amount
reclassified from other comprehensive income (loss) |
Location of gain
(loss) reclassified from accumulated other comprehensive income (loss) to net income |
|||
|
Gain (loss) on derivative financial instruments:
|
|||||
|
Aluminum future contracts, before taxes
|
$
|
(1,669
|
)
|
Cost of sales
|
|
|
Foreign currency forward contracts, before taxes
|
46
|
|
Cost of sales
|
||
|
Total, before taxes
|
(1,623
|
)
|
|||
|
Income tax expense (benefit)
|
(600
|
)
|
Income taxes
|
||
|
Total, net of tax
|
$
|
(1,023
|
)
|
||
|
Amortization of pension and other post-retirement benefits:
|
|||||
|
Actuarial gain (loss) and prior service costs, before taxes
|
$
|
(9,759
|
)
|
(a)
|
|
|
Income tax expense (benefit)
|
(3,186
|
)
|
Income taxes
|
||
|
Total, net of tax
|
$
|
(6,573
|
)
|
||
|
(a)
|
This component of accumulated other comprehensive income (loss) is included in the computation of net periodic pension cost (see Note 8 for additional detail).
|
Reclassifications of balances out of accumulated other comprehensive income (loss) into net income (loss) for the three months ended
September 30, 2015
are summarized as follows:
|
(In Thousands)
|
Amount
reclassified from other comprehensive income (loss) |
Location of gain
(loss) reclassified from accumulated other comprehensive income (loss) to net income (loss) |
|||
|
Gain (loss) on derivative financial instruments:
|
|||||
|
Aluminum future contracts, before taxes
|
$
|
(1,338
|
)
|
Cost of sales
|
|
|
Foreign currency forward contracts, before taxes
|
15
|
|
Cost of sales
|
||
|
Total, before taxes
|
(1,323
|
)
|
|||
|
Income tax expense (benefit)
|
(498
|
)
|
Income taxes
|
||
|
Total, net of tax
|
$
|
(825
|
)
|
||
|
Amortization of pension and other post-retirement benefits:
|
|||||
|
Actuarial gain (loss) and prior service costs, before taxes
|
$
|
(4,028
|
)
|
(a)
|
|
|
Income tax expense (benefit)
|
(1,478
|
)
|
Income taxes
|
||
|
Total, net of tax
|
$
|
(2,550
|
)
|
||
|
(a)
|
This component of accumulated other comprehensive income (loss) is included in the computation of net periodic pension cost (see Note 8 for additional detail).
|
12
Reclassifications of balances out of accumulated other comprehensive income (loss) into net income (loss) for the
nine months
ended
September 30, 2015
are summarized as follows:
|
(In Thousands)
|
Amount
reclassified from other comprehensive income (loss) |
Location of gain
(loss) reclassified from accumulated other comprehensive income (loss) to net income (loss) |
|||
|
Gain (loss) on derivative financial instruments:
|
|||||
|
Aluminum future contracts, before taxes
|
$
|
(1,867
|
)
|
Cost of sales
|
|
|
Foreign currency forward contracts, before taxes
|
46
|
|
Cost of sales
|
||
|
Total, before taxes
|
(1,821
|
)
|
|||
|
Income tax expense (benefit)
|
(687
|
)
|
Income taxes
|
||
|
Total, net of tax
|
$
|
(1,134
|
)
|
||
|
Amortization of pension and other post-retirement benefits:
|
|||||
|
Actuarial gain (loss) and prior service costs, before taxes
|
$
|
(11,997
|
)
|
(a)
|
|
|
Income tax expense (benefit)
|
(4,402
|
)
|
Income taxes
|
||
|
Total, net of tax
|
$
|
(7,595
|
)
|
||
|
(a)
|
This component of accumulated other comprehensive income (loss) is included in the computation of net periodic pension cost (see Note 8 for additional detail).
|
|
6.
|
In August 2007 and December 2008, the Company made an aggregate investment of
$7.5 million
in kaléo, a privately held specialty pharmaceutical company dedicated to building innovative solutions for serious and life-threatening medical conditions. The mission of kaléo is to provide products that empower patients to confidently take control of their medical conditions. Tredegar’s ownership interest on a fully diluted basis was approximately
19%
at
September 30, 2016
, and the investment is accounted for under the fair value method. At the time of the initial investment, the Company elected the fair value option over the equity method of accounting since its investment objectives were similar to those of venture capitalists, which typically do not have controlling financial interests.
|
The estimated fair value of the investment in kaléo (also the carrying value, which is included in “Other assets and deferred charges” in the consolidated balance sheets) was
$18.4 million
at
September 30, 2016
and
$18.6 million
at
December 31, 2015
. Unrealized losses of
$1.3 million
and
$0.2 million
were recognized in the
third quarter
and first
nine months
of
2016
, respectively (no unrealized gains or losses were recorded in the first
nine months
of
2015
). The change in the estimated fair value of the Company’s holding in kaléo in the
third quarter
of
2016
primarily related to the continuing assessment of market dynamics and pricing uncertainties associated with the reintroduction of the Auvi-Q product, with current quarter changes in the projections being revised to reflect a more conservative outlook. The change in the estimated fair value of the Company’s holding in kaléo in the first
nine months
of
2016
was primarily attributed to the aforementioned uncertainties about reintroducing Auvi-Q, partially offset by favorable adjustments in the fair value for the passage of time and with the negotiated terms of the termination of Sanofi’s exclusive rights license for Auvi-Q and Allerject in North America and the return of such rights to kaléo.
Unrealized gains (losses) associated with this investment are included in “Other income (expense), net” in the consolidated statements of income and separately stated in the net sales and operating profit by segment table in Note 9. Subsequent to its most recent investment (December 15, 2008), and until the next round of financing, the Company believes fair value estimates are based upon Level 3 inputs since there is no secondary market for its ownership interest. Accordingly, until the next round of financing or any other significant financial transaction, value estimates will primarily be based on assumptions relating to achieving product development and commercialization milestones, cash flow projections (projections of sales, costs, expenses, capital expenditures and working capital investment) and discounting of these factors for their high degree of risk. If kaléo does not meet its development and commercialization milestones or there are indications that the amount or timing of its projected cash flows or related risks are unfavorable versus the most recent valuation, or a new round of financing or other significant financial transaction indicates a lower enterprise value, then the Company’s estimate of the fair value of its ownership interest in kaléo is likely to decline. Adjustments to the estimated fair value of this investment will be made in the period upon which such changes can be quantified.
13
In addition to the impact on valuation of the possible changes in assumptions, Level 3 inputs and projections from changes in business conditions, the fair market valuation of the Company’s interest in kaléo is sensitive to changes in the weighted average cost of capital used to discount cash flow projections for the high degree of risk associated with meeting development and commercialization milestones as anticipated. The weighted average cost of capital used in the fair market valuation of Tredegar’s interest in kaléo was
45%
at both
September 30, 2016
and
December 31, 2015
. At
September 30, 2016
, the effect of a 500 basis point decrease in the weighted average cost of capital assumption would have increased the fair value of the Company’s interest in kaléo by approximately
$5 million
, and a 500 basis point increase in the weighted average cost of capital assumption would have decreased the fair value of the Company’s interest by approximately
$4 million
.
Had the Company not elected to account for its investment under the fair value method, it would have been required to use the equity method of accounting. The condensed balance sheets for kaléo at
September 30, 2016
and
December 31, 2015
and condensed statements of operations for the
three and nine
months ended
September 30, 2016
and
2015
, as reported to the Company by kaléo, are provided below:
|
(In Thousands)
|
September 30, 2016
|
December 31, 2015
|
|
September 30, 2016
|
December 31, 2015
|
|||||||||||
|
Assets:
|
Liabilities & Equity:
|
|||||||||||||||
|
Cash & short-term investments
|
$
|
111,305
|
|
$
|
91,844
|
|
||||||||||
|
Restricted cash
|
30
|
|
8,182
|
|
||||||||||||
|
Other current assets
|
16,361
|
|
9,070
|
|
Current liabilities
|
$
|
54,434
|
|
$
|
10,261
|
|
|||||
|
Property & equipment
|
14,072
|
|
8,453
|
|
Long term debt, net
|
143,212
|
|
142,696
|
|
|||||||
|
Patents
|
2,865
|
|
2,811
|
|
Other noncurrent liabilities
|
767
|
|
552
|
|
|||||||
|
Other long-term assets
|
93
|
|
92
|
|
Equity
|
(53,687
|
)
|
(33,057
|
)
|
|||||||
|
Total assets
|
$
|
144,726
|
|
$
|
120,452
|
|
Total liabilities & equity
|
$
|
144,726
|
|
$
|
120,452
|
|
|||
|
Three Months Ended September 30,
|
Nine Months Ended September 30,
|
||||||||||||||
|
|
2016
|
2015
|
2016
|
2015
|
|||||||||||
|
Revenues & Expenses:
|
|||||||||||||||
|
Revenues, net
|
$
|
17,377
|
|
$
|
28,084
|
|
$
|
29,347
|
|
$
|
43,002
|
|
|||
|
Cost of goods sold
|
(2,956
|
)
|
(3,438
|
)
|
(10,564
|
)
|
(8,575
|
)
|
|||||||
|
Expenses and other, net (a)
|
(22,216
|
)
|
(17,337
|
)
|
(39,815
|
)
|
(45,727
|
)
|
|||||||
|
Income tax benefit (expense)
|
—
|
|
—
|
|
(8
|
)
|
(4
|
)
|
|||||||
|
Net income (loss)
|
$
|
(7,795
|
)
|
$
|
7,309
|
|
$
|
(21,040
|
)
|
$
|
(11,304
|
)
|
|||
|
(a) “Expenses and other, net” includes selling, general and administrative expense, research and development expense, gain on contract termination, interest expense and other income (expense), net. Excluding the gain on contract termination, “Expenses and other, net” would have been a net deduction of $22.2 million and $57.9 million in the third quarter and first nine months of 2016, respectively.
|
|||||||||||||||
The Company’s investment in the Harbinger Capital Partners Special Situations Fund, L.P. (“Harbinger Fund”) had a carrying value (included in “Other assets and deferred charges”) of
$1.7 million
at
September 30, 2016
and
December 31, 2015
. The carrying value at
September 30, 2016
reflected Tredegar’s cost basis in its investment in the Harbinger Fund, net of total withdrawal proceeds received and unrealized losses. Withdrawal proceeds received were
$0.1 million
in the first
nine months
of
2015
(none in 2016). The timing and amount of future installments of withdrawal proceeds, which commenced in August 2010, were not known as of
September 30, 2016
. Gains on the Company’s investment in the Harbinger Fund will be recognized when the amounts expected to be collected from any withdrawal from the investment are known, which will likely be when cash in excess of the remaining carrying value is received. Losses will be recognized when management believes it is probable that future withdrawal proceeds will not exceed the remaining carrying value.
|
7.
|
Tredegar uses derivative financial instruments for the purpose of hedging margin exposure from fixed-price forward sales contracts in Aluminum Extrusions and currency exchange rate exposures that exist as part of ongoing PE Films and Flexible Packaging Films business operations. These derivative financial instruments are designated as and qualify as cash flow hedges and are recognized in the consolidated balance sheet at fair value. The fair value of derivative instruments recorded on the consolidated balance sheets are based upon Level 2 inputs. If individual derivative
|
14
instruments with the same counterparty can be settled on a net basis, the Company records the corresponding derivative fair values as a net asset or net liability.
In the normal course of business, Aluminum Extrusions enters into fixed-price forward sales contracts with certain customers for the future sale of fixed quantities of aluminum extrusions at scheduled intervals. In order to hedge margin exposure created from the fixing of future sales prices relative to volatile raw material (aluminum) costs, Aluminum Extrusions enters into a combination of forward purchase commitments and futures contracts to acquire or hedge aluminum, based on the scheduled purchases for the firm sales commitments. The fixed-price firm sales commitments and related hedging instruments generally have durations of not more than 12 months, and the notional amount of aluminum futures contracts that hedged future purchases of aluminum to meet fixed-price forward sales contract obligations was
$10.5 million
(
12.9 million
pounds of aluminum) at
September 30, 2016
and
$16.6 million
(
18.9 million
pounds of aluminum) at
December 31, 2015
.
The table below summarizes the location and gross amounts of aluminum futures contract fair values in the consolidated balance sheets as of
September 30, 2016
and
December 31, 2015
:
|
|
September 30, 2016
|
December 31, 2015
|
|||||||||
|
(In Thousands)
|
Balance Sheet
Account
|
Fair
Value
|
Balance Sheet
Account
|
Fair
Value
|
|||||||
|
Derivatives Designated as Hedging Instruments
|
|||||||||||
|
Asset derivatives:
Aluminum futures contracts |
Accrued expenses
|
$
|
59
|
|
Accrued expenses
|
$
|
44
|
|
|||
|
Liability derivatives:
Aluminum futures contracts |
Accrued expenses
|
$
|
(236
|
)
|
Accrued expenses
|
$
|
(1,797
|
)
|
|||
|
Derivatives Not Designated as Hedging Instruments
|
|||||||||||
|
Asset derivatives:
Aluminum futures contracts |
Accrued expenses
|
$
|
—
|
|
Accrued expenses
|
$
|
—
|
|
|||
|
Liability derivatives:
Aluminum futures contracts |
Accrued expenses
|
$
|
—
|
|
Accrued expenses
|
$
|
—
|
|
|||
|
Net asset (liability)
|
$
|
(177
|
)
|
$
|
(1,753
|
)
|
|||||
In the event that a counterparty to an aluminum fixed-price forward sales contract chooses not to take delivery of its aluminum extrusions, the customer is contractually obligated to compensate Aluminum Extrusions for any losses on the related aluminum futures and/or forward contracts through the date of cancellation.
These derivative contracts involve elements of market risk that are not reflected on the consolidated balance sheet, including the risk of dealing with counterparties and their ability to meet the terms of the contracts. The counterparties to any forward purchase commitments are major aluminum brokers and suppliers, and the counterparties to any aluminum futures contracts are major financial institutions. Fixed-price forward sales contracts are only made available to the best and most credit-worthy customers. The counterparties to our foreign currency futures and zero-cost collar contracts are major financial institutions.
15
The effect on net income (loss) and other comprehensive income (loss) of derivative instruments classified as cash flow hedges and described in the previous paragraphs for the
three and nine
month periods ended
September 30, 2016
and
2015
is summarized in the table below:
|
(In Thousands)
|
Cash Flow Derivative Hedges
|
||||||||||||||
|
|
Aluminum Futures Contracts
|
Foreign Currency Forwards
|
|||||||||||||
|
|
Three Months Ended September 30,
|
||||||||||||||
|
|
2016
|
2015
|
2016
|
2015
|
|||||||||||
|
Amount of pre-tax gain (loss) recognized in other comprehensive income (loss)
|
$
|
(230
|
)
|
$
|
(1,570
|
)
|
$
|
—
|
|
$
|
—
|
|
|||
|
Location of gain (loss) reclassified from accumulated other comprehensive income (loss) into net income (loss) (effective portion)
|
Cost of
sales |
|
Cost of
sales |
|
Cost of
sales |
|
Cost of
sales |
|
|||||||
|
Amount of pre-tax gain (loss) reclassified from accumulated other comprehensive income (loss) to net income (loss) (effective portion)
|
$
|
(160
|
)
|
$
|
(1,338
|
)
|
$
|
15
|
|
$
|
15
|
|
|||
|
|
Aluminum Futures Contracts
|
Foreign Currency Forwards
|
|||||||||||||
|
|
Nine Months Ended September 30,
|
||||||||||||||
|
|
2016
|
2015
|
2016
|
2015
|
|||||||||||
|
Amount of pre-tax gain (loss) recognized in other comprehensive income (loss)
|
$
|
(93
|
)
|
$
|
(4,699
|
)
|
$
|
—
|
|
$
|
—
|
|
|||
|
Location of gain (loss) reclassified from accumulated other comprehensive income (loss) into net income (loss) (effective portion)
|
Cost of
sales |
|
Cost of
sales |
|
Cost of
sales |
|
Cost of
sales |
|
|||||||
|
Amount of pre-tax gain (loss) reclassified from accumulated other comprehensive income (loss) to net income (loss) (effective portion)
|
$
|
(1,669
|
)
|
$
|
(1,867
|
)
|
$
|
46
|
|
$
|
46
|
|
|||
As of
September 30, 2016
, the Company expects
$0.1 million
of unrealized after-tax losses on derivative instruments reported in accumulated other comprehensive income (loss) to be reclassified to earnings within the next 12 months. For the
three and nine
month periods ended
September 30, 2016
and
2015
, net gains or losses realized, from previously unrealized net gains or losses on hedges that had been discontinued, were not material.
16
|
8.
|
The Company sponsors noncontributory defined benefit (pension) plans covering most employees. The plans for salaried and hourly employees currently in effect are based on a formula using the participant’s years of service and compensation or using the participant’s years of service and a dollar amount. The plan was closed to new participants in 2006 and pay for active plan participants was frozen as of December 31, 2007. With the exception of plan participants at one of Tredegar’s U.S. manufacturing facilities, the plan no longer accrues benefits associated with crediting employees for service, thereby freezing future benefits under the plan.
|
The components of net periodic benefit cost for the pension and other post-retirement benefit programs reflected in consolidated results are shown below:
|
Pension Benefits
|
Other Post-Retirement Benefits
|
||||||||||||||
|
|
Three Months Ended September 30,
|
Three Months Ended September 30,
|
|||||||||||||
|
(In Thousands)
|
2016
|
2015
|
2016
|
2015
|
|||||||||||
|
Service cost
|
$
|
54
|
|
$
|
110
|
|
$
|
8
|
|
$
|
9
|
|
|||
|
Interest cost
|
3,263
|
|
3,288
|
|
67
|
|
77
|
|
|||||||
|
Expected return on plan assets
|
(4,070
|
)
|
(4,413
|
)
|
—
|
|
—
|
|
|||||||
|
Amortization of prior service costs, gains or losses and net transition asset
|
3,135
|
|
4,094
|
|
(49
|
)
|
(65
|
)
|
|||||||
|
Net periodic benefit cost
|
$
|
2,382
|
|
$
|
3,079
|
|
$
|
26
|
|
$
|
21
|
|
|||
|
Pension Benefits
|
Other Post-Retirement Benefits
|
||||||||||||||
|
|
Nine Months Ended September 30,
|
Nine Months Ended September 30,
|
|||||||||||||
|
|
2016
|
2015
|
2016
|
2015
|
|||||||||||
|
Service cost
|
$
|
178
|
|
$
|
398
|
|
$
|
29
|
|
$
|
33
|
|
|||
|
Interest cost
|
9,993
|
|
9,913
|
|
236
|
|
244
|
|
|||||||
|
Expected return on plan assets
|
(12,027
|
)
|
(13,227
|
)
|
—
|
|
—
|
|
|||||||
|
Amortization of prior service costs, (gains) losses and net transition asset
|
9,903
|
|
12,142
|
|
(144
|
)
|
(145
|
)
|
|||||||
|
Net periodic benefit cost
|
$
|
8,047
|
|
$
|
9,226
|
|
$
|
121
|
|
$
|
132
|
|
|||
Pension and other post-retirement liabilities were
$92.2 million
and
$101.0 million
at
September 30, 2016
and
December 31, 2015
, respectively (
$0.6 million
included in “Accrued expenses” at
September 30, 2016
and
December 31, 2015
, with the remainder included in “Other noncurrent liabilities” in the consolidated balance sheets). The Company’s required contributions are expected to be approximately
$8 million
in
2016
. Contributions to the pension plan during the first
nine months
of
2016
were
$6.9 million
. Tredegar funds its other post-retirement benefits (life insurance and health benefits) on a claims-made basis, which the Company anticipates will be consistent with amounts paid for the year ended
December 31, 2015
, or
$0.3 million
.
|
9.
|
The Company’s business segments are PE Films, Flexible Packaging and Aluminum Extrusions. Information by business segment is reported below. There are no accounting transactions between segments and no allocations to segments. Net sales (sales less freight) and operating profit from ongoing operations are the measures of sales and operating profit used by the chief operating decision maker for purposes of assessing performance.
|
17
The following table presents net sales and operating profit by segment for the
three and nine
-month periods ended
September 30, 2016
and
2015
:
|
Three Months Ended September 30,
|
Nine Months Ended September 30,
|
||||||||||||||
|
(In Thousands)
|
2016
|
2015
|
2016
|
2015
|
|||||||||||
|
Net Sales
|
|||||||||||||||
|
PE Films
|
$
|
82,179
|
|
$
|
93,943
|
|
$
|
251,473
|
|
$
|
292,259
|
|
|||
|
Flexible Packaging Films
|
27,303
|
|
27,155
|
|
80,888
|
|
77,339
|
|
|||||||
|
Aluminum Extrusions
|
91,067
|
|
94,812
|
|
269,987
|
|
286,660
|
|
|||||||
|
Total net sales
|
200,549
|
|
215,910
|
|
602,348
|
|
656,258
|
|
|||||||
|
Add back freight
|
7,153
|
|
7,862
|
|
21,221
|
|
22,930
|
|
|||||||
|
Sales as shown in the Consolidated Statements of Income
|
$
|
207,702
|
|
$
|
223,772
|
|
$
|
623,569
|
|
$
|
679,188
|
|
|||
|
Operating Profit
|
|||||||||||||||
|
PE Films:
|
|||||||||||||||
|
Ongoing operations
|
$
|
9,011
|
|
$
|
9,745
|
|
$
|
23,564
|
|
$
|
35,849
|
|
|||
|
Plant shutdowns, asset impairments, restructurings and other
|
(1,187
|
)
|
(2,044
|
)
|
(3,678
|
)
|
(2,051
|
)
|
|||||||
|
Flexible Packaging Films:
|
|||||||||||||||
|
Ongoing operations
|
93
|
|
4,102
|
|
1,184
|
|
1,793
|
|
|||||||
|
Plant shutdowns, asset impairments, restructurings and other
|
—
|
|
—
|
|
—
|
|
(185
|
)
|
|||||||
|
Goodwill impairment charge
|
—
|
|
(44,465
|
)
|
—
|
|
(44,465
|
)
|
|||||||
|
Aluminum Extrusions:
|
|||||||||||||||
|
Ongoing operations
|
9,427
|
|
7,272
|
|
27,786
|
|
20,863
|
|
|||||||
|
Plant shutdowns, asset impairments, restructurings and other
|
1,405
|
|
(331
|
)
|
840
|
|
(364
|
)
|
|||||||
|
Total
|
18,749
|
|
(25,721
|
)
|
49,696
|
|
11,440
|
|
|||||||
|
Interest income
|
70
|
|
76
|
|
158
|
|
247
|
|
|||||||
|
Interest expense
|
886
|
|
901
|
|
2,918
|
|
2,679
|
|
|||||||
|
Loss on investment accounted for under fair value method
|
(1,300
|
)
|
—
|
|
(200
|
)
|
—
|
|
|||||||
|
Stock option-based compensation costs
|
31
|
|
73
|
|
24
|
|
571
|
|
|||||||
|
Corporate expenses, net
|
7,223
|
|
6,722
|
|
22,110
|
|
25,632
|
|
|||||||
|
Income (loss) before income taxes
|
9,379
|
|
(33,341
|
)
|
24,602
|
|
(17,195
|
)
|
|||||||
|
Income taxes (benefit)
|
(2,669
|
)
|
3,382
|
|
1,864
|
|
9,064
|
|
|||||||
|
Net income (loss)
|
$
|
12,048
|
|
$
|
(36,723
|
)
|
$
|
22,738
|
|
$
|
(26,259
|
)
|
|||
The following table presents identifiable assets by segment at
September 30, 2016
and
December 31, 2015
:
|
(In Thousands)
|
September 30, 2016
|
December 31, 2015
|
|||||
|
PE Films
|
$
|
287,516
|
|
$
|
270,236
|
|
|
|
Flexible Packaging Films
|
157,069
|
|
146,253
|
|
|||
|
Aluminum Extrusions
|
149,187
|
|
136,935
|
|
|||
|
Subtotal
|
593,772
|
|
553,424
|
|
|||
|
General corporate
|
33,642
|
|
25,680
|
|
|||
|
Cash and cash equivalents
|
28,356
|
|
44,156
|
|
|||
|
Total
|
$
|
655,770
|
|
$
|
623,260
|
|
|
18
|
10.
|
Tredegar recorded tax expense of
$1.9 million
on pre-tax net income of
$24.6 million
in the first
nine months
of
2016
, which included the recognition of a
$5.7 million
tax benefit related to the repatriation of cash from operations in Brazil. For the first nine months of 2015, Tredegar recorded tax expense of
$9.1 million
on pre-tax net losses from continuing operations of
$17.2 million
due to a non-deductible goodwill impairment charge of
$44.5 million
. Therefore, the effective tax rate in the first
nine months
of
2016
was
7.6%
, compared to
(52.7)%
in the first
nine months
of
2015
. The significant differences between the U.S. federal statutory rate and the effective income tax rate for the
nine months
ended
September 30, 2016
and
2015
are as follows:
|
|
|
Percent of Income
Before Income Taxes
|
||||
|
Nine Months Ended September 30,
|
2016
|
2015
|
|||
|
Income tax expense at federal statutory rate
|
35.0
|
|
35.0
|
|
|
|
Non-deductible expenses
|
1.6
|
|
(1.7
|
)
|
|
|
Income tax contingency accruals and tax settlements
|
1.3
|
|
(2.8
|
)
|
|
|
Foreign rate differences
|
1.1
|
|
2.8
|
|
|
|
State taxes, net of federal income tax benefit
|
0.7
|
|
(2.4
|
)
|
|
|
Valuation allowance for foreign operating loss carry-forwards
|
0.3
|
|
(1.0
|
)
|
|
|
Foreign investment write-up
|
0.1
|
|
—
|
|
|
|
Valuation allowance for capital loss carry-forwards
|
(0.4
|
)
|
1.8
|
|
|
|
Unremitted earnings from foreign operations
|
(1.1
|
)
|
(2.0
|
)
|
|
|
Changes in estimates related to prior year tax provision
|
(1.6
|
)
|
2.9
|
|
|
|
Research and development tax credit
|
(1.8
|
)
|
—
|
|
|
|
Domestic production activities deduction
|
(3.8
|
)
|
5.1
|
|
|
|
Remitted earnings from foreign operations
|
(23.8
|
)
|
—
|
|
|
|
Goodwill impairment charge
|
—
|
|
(90.5
|
)
|
|
|
Other
|
—
|
|
0.1
|
|
|
|
Effective income tax rate
|
7.6
|
|
(52.7
|
)
|
|
Tredegar accrues U.S. federal income taxes on unremitted earnings of all foreign subsidiaries. Prior to the second quarter of 2016, deferred U.S. federal income taxes had not been recorded for the undistributed earnings for Terphane Ltda. because the Company had intended to permanently reinvest these earnings. Due to concerns about the current political and economic conditions in Brazil, Terphane Ltda. has begun making cash distributions to the Company. During the second quarter of 2016, Terphane Ltda. paid a dividend of
$10.7 million
to the Company. The 2016 low effective tax rate is due to the
$5.7 million
tax benefit from excess foreign tax credits that are related to the repatriation of cash from Brazil. The recognition in the third quarter of 2016, instead of the second quarter of 2016, is due to an accounting method change that was filed along with the Federal income tax return in the third quarter. Because of the accumulation of significant losses related to foreign currency translations at Terphane Ltda., there were no unrecorded deferred tax liabilities associated with the U.S. federal income taxes and foreign withholding taxes on Terphane Ltda.’s undistributed earnings as of
September 30, 2016
and
December 31, 2015
.
The Brazilian federal statutory income tax rate is a composite of
34.0%
(
25.0%
of income tax and
9.0%
of social contribution on income). Terphane Holdings LLC’s (“Terphane”) manufacturing facility in Brazil is the beneficiary of certain income tax incentives that allow for a reduction in the statutory Brazilian federal income tax rate to
15.25%
levied on the operating profit on certain of its products. The incentives have been granted for a
10
-year period, which has a retroactive commencement date of January 1, 2015. No benefit was recognized from these tax incentives in the first
nine months
of
2016
or
2015
.
In connection with its capacity expansion project in Brazil, the Company paid certain social taxes associated with the purchase of machinery and equipment and construction of buildings and other long-term assets. Payments of these taxes in Brazil were included in “Net cash used in investing activities” given the nature of the underlying use of cash (e.g. the purchase of property, plant and equipment). The Company can recover tax credits associated with the purchase of machinery and equipment at different points over a period up to
24
months. Once the machinery and equipment was placed into service in the fourth quarter of 2014, the Company started applying these tax credits against various other taxes due in Brazil, with their recovery being reflected as cash received from investing activities, consistent with the classification of the original payments.
19
Income taxes in
2016
included a partial reversal of a valuation allowance of
$0.1 million
related to the expected limitations on the utilization of assumed capital losses on certain investments that were recognized in prior years. Income taxes in
2015
included the partial reversal of a valuation allowance of
$0.3 million
related to the expected limitations on the utilization of assumed capital losses on certain investments. The Company had a valuation allowance for excess capital losses from investments and other related items of
$10.8 million
at
September 30, 2016
. Tredegar continues to evaluate opportunities to utilize these loss carryforwards prior to their expiration at various dates in the future. As events and circumstances warrant, allowances will be reversed when it is more likely than not that future taxable income will exceed deductible amounts, thereby resulting in the realization of deferred tax assets.
Tredegar and its subsidiaries file income tax returns in the U.S., various states and jurisdictions outside the U.S. With few exceptions, Tredegar and its subsidiaries are no longer subject to U.S. federal, state or non-U.S. income tax examinations by tax authorities for years before 2013.
|
11.
|
On March 1, 2016, Tredegar entered into a
$400 million
five
-year, secured revolving credit facility (“Credit Agreement”), with an option to increase that amount by
$50 million
. The Credit Agreement replaced the Company’s previous
$350 million
five-year, unsecured revolving credit facility that was due to expire on April 17, 2017. In connection with the refinancing, the Company borrowed
$107 million
under the Credit Agreement, which was used, together with available cash on hand, to repay all indebtedness under the previous revolving credit facility.
|
Borrowings under the Credit Agreement bear an interest rate of LIBOR plus a credit spread and commitment fees charged on the unused amount under the Credit Agreement at various indebtedness-to-adjusted EBITDA levels as follows:
|
Pricing Under Credit Revolving Agreement (Basis Points)
|
||||||
|
Indebtedness-to-Adjusted EBITDA Ratio
|
Credit Spread
Over LIBOR
|
Commitment
Fee
|
||||
|
> 3.5x but <= 4.0x
|
250
|
|
45
|
|
||
|
> 3.0x but <= 3.5x
|
225
|
|
40
|
|
||
|
> 2.0x but <= 3.0x
|
200
|
|
35
|
|
||
|
> 1.0x but <= 2.0x
|
175
|
|
30
|
|
||
|
<= 1.0x
|
150
|
|
25
|
|
||
At
September 30, 2016
, the interest cost on debt borrowed under the Credit Agreement was priced at one-month LIBOR plus the applicable credit spread of 175 basis points.
The most restrictive covenants in the Credit Agreement include:
|
•
|
Maximum indebtedness-to-adjusted EBITDA (“Leverage Ratio:) of
4.00x
;
|
|
•
|
Minimum adjusted EBIT-to-interest expense of
2.50x
; and
|
|
•
|
Maximum aggregate distributions to shareholders over the term of the Credit Agreement of
$100,000
plus, beginning with the fiscal quarter ended March 31, 2016,
50%
of net income and, at a Leverage Ratio of equal to or greater than
3.00
x, a limitation on such payments for the succeeding quarter at the greater of (i)
$4 million
and (ii)
50%
of consolidated net income for the most recent fiscal quarter, and, at a Leverage Ratio of equal to or greater than
3.50
x, the prevention of such payments for the succeeding quarter unless the fixed charge coverage ratio is equal to or greater than
1.20
x.
|
The Credit Agreement is secured by substantially all of the Company’s and its domestic subsidiaries’ assets, including equity in certain material first-tier foreign subsidiaries. As of
September 30, 2016
, Tredegar was in compliance with all financial covenants outlined in the Credit Agreement.
20
|
12.
|
In 2011, Tredegar was notified by U.S. Customs and Border Protection (“U.S. Customs”) that certain film products exported by Terphane to the U.S. since November 6, 2008 could be subject to duties associated with an antidumping duty order on imported PET films from Brazil. The Company contested the applicability of these antidumping duties to the films exported by Terphane, and it filed a request with the U.S. Department of Commerce (“Commerce”) for clarification about whether the film products at issue are within the scope of the antidumping duty order. On January 8, 2013, Commerce issued a scope ruling confirming that the films are not subject to the order, provided that Terphane can establish to the satisfaction of U.S. Customs that the performance enhancing layer on those films is greater than
0.00001
inches thick. The films at issue are manufactured to specifications that exceed that threshold. On February 6, 2013, certain U.S. producers of PET film filed a summons with the U.S. Court of International Trade to appeal the scope ruling from Commerce. If U.S. Customs ultimately were to require the collection of anti-dumping duties because Commerce’s scope ruling was overturned on appeal, or otherwise, indemnifications for related liabilities are specifically provided for under the purchase agreement pursuant to which the Company acquired Terphane. In December 2014, the U.S. International Trade Commission voted to revoke the anti-dumping duty order on imported PET films from Brazil. The revocation, as a result of the vote by the U.S. International Trade Commission, was effective as of November 2013. On February 20, 2015, certain U.S. producers of PET films filed a summons with the U.S. Court of International Trade to appeal the determination by the U.S. International Trade Commission. The Court granted a motion by the plaintiffs to stay the appeal of the revocation decision pending the resolution of the scope appeal. A decision by the Court in the scope appeal remains pending.
|
|
13.
|
In May 2014, the Financial Accounting Standards Board (“FASB”) and International Accounting Standards Board (“IASB”) issued their converged standard on revenue recognition. The revised revenue standard contains principles that an entity will apply to direct the measurement of revenue and timing of when it is recognized. The core principle of the guidance is that the recognition of revenue should depict the transfer of promised goods or services to customers in an amount that reflects the consideration to which an entity expects to be entitled in exchange for those goods and services. To achieve that core principle, an entity will utilize a principle-based five-step approach model. The converged standard also includes more robust disclosure requirements which will require entities to provide sufficient information to enable users of financial statements to understand the nature, amount, timing and uncertainty of revenue and cash flows arising from contracts with customers. In March 2016, amended guidance was issued regarding clarifying the implementation guidance on principal versus agent considerations and in April 2016, clarifying guidance was issued relating to identifying performance obligations and licensing implementation. The effective date of this revised standard is for annual reporting periods beginning after December 15, 2017, including interim periods within that reporting period. Early application is permitted as of annual reporting periods beginning after December 15, 2016, including interim reporting periods within that annual reporting period. The converged standard can be adopted either retrospectively or through the use of a practical expedient. The Company is currently assessing the impact of this standard.
|
In July 2015, the FASB issued new guidance for the measurement of inventories. Inventories within the scope of the revised guidance should be measured at the lower of cost or net realizable value. The previous guidance dictated that inventory should be measured at the lower of cost or market, with market being either replacement cost, net realizable value or net realizable value less an approximation of normal profit margin. Net realizable value is the estimated selling prices in the ordinary course of business, less reasonably predictable costs of completion, disposal and transportation. Subsequent measurement is unchanged for inventories measured using LIFO or the retail inventory method. The new guidance is effective for fiscal years beginning after December 31, 2016, including the interim periods within those fiscal years. The amendments should be applied prospectively, with early adoption permitted. The Company is not expecting to be materially impacted by this amended guidance.
In January 2016, the FASB issued amended guidance associated with accounting for equity investments measured at fair value. The amended guidance requires all equity investments to be measured at fair value with changes in the fair value recognized through net income (other than those accounted for under equity method of accounting or those that result in consolidation of the investee). The amended guidance also requires an entity to present separately in other comprehensive income the portion of the total change in the fair value of a liability resulting from a change in the instrument-specific credit risk when the entity has elected to measure the liability at fair value in accordance with the fair value option for financial instruments. In addition, the amendments in this update eliminate the requirement to disclose the fair value of financial instruments measured at amortized cost for entities that are not public business entities and the requirement to disclose the method(s) and significant assumptions used to estimate the fair value that is required to be disclosed for financial instruments measured at amortized cost on the balance sheet for public business entities. The amended guidance is effective for fiscal years beginning after December 31, 2017, including the interim periods within those fiscal years. The amendments should be applied by means of a cumulative-effect adjustment to the balance sheet as of the beginning of the fiscal year of adoption. The amendments related to equity securities without readily
21
determinable fair values (including disclosure requirements) should be applied prospectively to equity investments that exist as of the date of adoption of the update. Early adoption is permitted under limited, specific circumstances. The Company is still assessing the impact of this amended guidance.
In February 2016, the FASB issued a revised standard on lease accounting. Lessees will need to recognize virtually all of their leases on the balance sheet, by recording a right-of-use asset and lease liability. The revised standard requires additional analysis of the components of a transaction to determine if a right-to-use asset is embedded in the transaction that needs to be treated as a lease. Substantial additional disclosures are also required by the revised standard. The revised standard is effective for fiscal years beginning after December 31, 2018, including the interim periods within those fiscal years. The revised standard should be applied on a modified retrospective approach or through the use of a practical expedient, with early adoption permitted. The Company is still assessing the impact of this revised standard.
In March 2016, the FASB issued amended guidance to simplify several aspects of the accounting for share-based payment transactions, including the income tax consequences, classification of awards as either equity or liabilities, and classification on the statement of cash flows. The updated guidance is effective for fiscal years beginning after December 31, 2016, including the interim periods within those fiscal years. The updated standard can be applied on a retrospective or modified retrospective basis, with early adoption permitted. The Company is not expecting to be materially impacted by this amended guidance.
In June 2016, the FASB issued new accounting guidance that will require the earlier recognition of credit losses on loans and other financial instruments based on an expected loss model, replacing the incurred loss model that is currently in use. Under the new guidance, an entity will measure all expected credit losses for financial instruments held at the reporting date based on historical experience, current conditions and reasonable and supportable forecasts. The expected loss model will apply to loans and leases, unfunded lending commitments, held-to-maturity (HTM) debt securities and other debt instruments measured at amortized cost and accounts receivable. The new guidance is effective for fiscal years beginning after December 31, 2019, including the interim periods within those fiscal years, with early adoption allowed for fiscal years beginning after December 31, 2018. The new guidance must be applied on a modified retrospective basis, with a cumulative effect adjustment recorded to opening retained earnings. The Company is not expecting to be materially impacted by this new guidance.
22
|
Item 2.
|
Management’s Discussion and Analysis of Financial Condition and Results of Operations.
|
Forward-looking and Cautionary Statements
Some of the information contained in this Quarterly Report on Form 10-Q (“Form 10-Q”) may constitute “forward-looking statements” within the meaning of the “safe harbor” provisions of the Private Securities Litigation Reform Act of 1995. When using the words “believe,” “estimate,” “anticipate,” “expect,” “project,” “likely,” “may” and similar expressions, Tredegar does so to identify forward-looking statements. Such statements are based on then current expectations and are subject to a number of risks and uncertainties that could cause actual results to differ materially from those addressed in the forward-looking statements. It is possible that actual results and financial condition may differ, possibly materially, from the anticipated results and financial condition indicated in or implied by these forward-looking statements. Accordingly, you should not place undue reliance on these forward-looking statements. Factors that could cause actual results to differ from expectations include, without limitation, the following: we have an underfunded defined benefit (pension) plan to which we will be required to make contributions; our performance is influenced by costs incurred by our operating companies, including, for example, the cost of raw materials and energy; our substantial international operations subject us to risks of doing business in countries outside the U.S., which could adversely affect our consolidated financial condition, results of operations and cash flows; we may not be able to successfully identify, complete or integrate strategic acquisitions; acquired businesses may not achieve the levels of revenue, profit, productivity, or otherwise perform as we expect; acquisitions involve special risks, including without limitation, diversion of management’s time and attention from our existing businesses, the potential assumption of unanticipated liabilities and contingencies and potential difficulties in integrating acquired businesses and achieving anticipated operational improvements; PE Films is highly dependent on sales associated with its top five customers, the largest of which is The Procter & Gamble Company, and the loss or significant reduction of sales associated with one or more of these customers could have a material adverse effect on our business; growth of PE Films depends on its ability to develop and deliver new products at competitive prices; the failure of PE Films’ customers, who are subject to cyclical downturns, to achieve success or maintain market share could adversely impact its sales and operating margins; uncertain economic conditions in Brazil could adversely impact the financial condition, results of operations and cash flows of Flexible Packaging Films; an impairment on our long-lived intangible assets, including goodwill, could have a material non-cash impact on our results of operations; and the other factors discussed in the reports Tredegar files with or furnishes to the Securities and Exchange Commission (“the SEC”) from time to time, including the risks and important factors set forth in additional detail in “Risk Factors” in Part II, Item 5 and and in Part I, Item 1A of Tredegar’s 2015 Annual Report on Form 10-K/A (the “2015 Form 10-K”) filed with the SEC. Readers are urged to review and consider carefully the disclosures Tredegar makes in its filings with the SEC, including the 2015 Form 10-K. Tredegar does not undertake, and expressly disclaims any duty, to update any forward-looking statement to reflect any change in management’s expectations or any change in conditions, assumptions or circumstances on which such statements are based, except as required by applicable law.
References herein to “Tredegar,” “the Company,” “we,” “us” and “our” are to Tredegar Corporation and its subsidiaries, collectively, unless the context otherwise indicates or requires.
Executive Summary
Tredegar is a manufacturer of polyethylene plastic films through its PE Films segment, polyester films through its Flexible Packaging segment and aluminum extrusions through its Aluminum Extrusions segment. PE Films is comprised of personal care materials, surface protection films, polyethylene overwrap films and films for other markets. Flexible Packaging Films produces polyester-based films for use in packaging applications that have specialized properties, such as heat resistance, strength, barrier protection and the ability to accept high-quality print graphics. Aluminum Extrusions produces high-quality, soft-alloy and medium-strength aluminum extrusions primarily for building and construction, automotive, consumer durables, machinery and equipment, electrical and distribution market
s.
Third-quarter
2016
net income was
$12.0 million
(
$0.37
per share) compared with a net loss of
$36.7 million
(
$1.13
per share) in the
third quarter
of
2015
. Net income was
$22.7 million
(
$0.69
per share) in the first
nine months
of
2016
compared with a net loss of
$26.3 million
(
$0.81
per share) in the first
nine months
of
2015
. The net loss in the third quarter and first nine months of 2015 included the the write-off of all goodwill associated with Flexible Packaging Films ($44.5 million). Other losses related to plant shutdowns, asset impairments, restructurings and other items are described in Note 2 on page 7. Net sales (sales less freight) and operating profit from ongoing operations are the measures of sales and operating profit used by the chief operating decision maker of each segment for purposes of assessing performance. See the table in Note 9 on page 17 for a presentation of Tredegar’s net sales and operating profit by segment for the
three and nine
months ended
September 30, 2016
and
2015
.
23
PE Films
A summary of operating results from ongoing operations for PE Films is provided below:
|
|
Three Months Ended
|
Favorable/
(Unfavorable) % Change |
Nine Months Ended
|
Favorable/
(Unfavorable) % Change |
|||||||||||||||||
|
(In Thousands, Except Percentages)
|
September 30,
|
September 30,
|
|||||||||||||||||||
|
2016
|
2015
|
2016
|
2015
|
||||||||||||||||||
|
Sales volume (lbs)
|
33,754
|
|
40,023
|
|
(15.7
|
)%
|
106,214
|
|
121,866
|
|
(12.8
|
)%
|
|||||||||
|
Net sales
|
$
|
82,179
|
|
$
|
93,943
|
|
(12.5
|
)%
|
$
|
251,473
|
|
$
|
292,259
|
|
(14.0
|
)%
|
|||||
|
Operating profit from ongoing operations
|
$
|
9,011
|
|
$
|
9,745
|
|
(7.5
|
)%
|
$
|
23,564
|
|
$
|
35,849
|
|
(34.3
|
)%
|
|||||
Third-Quarter
Results vs. Prior Year
Third Quarter
Results
Net sales (sales less freight) in the
third quarter
of
2016
decreased by
$11.8 million
versus
2015
primarily due to:
|
•
|
The wind down of volume related to lost business in personal care materials with PE Films’ largest customer ($6.3 million) and other personal care customers ($1.2 million) (see discussion below);
|
|
•
|
Lower volume in personal care materials primarily due to the timing of product transitions ($3.8 million);
|
|
•
|
An increase in surface protection films revenue ($1.8 million) primarily due to an improved sales mix; and
|
|
•
|
Lower volume of low margin overwrap films ($2.3 million) primarily due to the loss of business with a large customer.
|
As noted above, current year sales volume has declined in part due to the wind down of shipments for certain personal care materials related to previously announced known lost business, primarily with PE Films’ largest customer. The restructuring project to consolidate domestic manufacturing facilities in PE Films, which commenced in the third quarter of 2015 (“North American facility consolidation”), is expected to be completed in the middle of 2017. Once complete, annual pre-tax cash cost savings are expected to be approximately $5-6 million on cash-related expenditures. Exit costs are expected to be approximately $17 million. The table below summarizes the pro forma operating profit from ongoing operations for the third quarters of 2016 and 2015, had the impact of the events noted above been fully realized:
|
Three Months Ended September 30,
|
||||||
|
(In Thousands)
|
2016
|
2015
|
||||
|
Operating profit from ongoing operations, as reported
|
$
|
9,011
|
|
$
|
9,745
|
|
|
Contribution to operating profit from ongoing operations associated with known product transitions & other losses before restructurings & fixed costs reduction
|
236
|
|
3,023
|
|
||
|
Operating profit from ongoing operations net of the impact of known business that will be fully eliminated in future periods
|
8,775
|
|
6,722
|
|
||
|
Estimated future benefit of North American facility consolidation
|
1,300
|
|
1,300
|
|
||
|
Pro forma estimated operating profit from ongoing operations
|
$
|
10,075
|
|
$
|
8,022
|
|
Net sales associated with known lost business that have yet to be fully eliminated were $0.9 million and $8.4 million in the third quarters of 2016 and 2015, respectively.
Net of the impact of known lost business, pro forma estimated operating profit from ongoing operations in the third quarter of 2016 increased by $2.1 million versus the third quarter of 2015 primarily due to:
|
•
|
Higher contribution to profits from surface protection films ($1.2 million), primarily due to a favorable sales mix;
|
|
•
|
Lower contribution to profits in personal care materials primarily due to sales declines resulting from the timing of product transitions ($0.4 million);
|
|
•
|
Higher contribution to profits from other products in PE Films ($1.0 million); and
|
|
•
|
Higher research and development (“R&D”) expenses to support new product opportunities ($0.7 million), offset by lower general, sales and administrative expenses and productivity improvements ($0.9 million).
|
24
The Company has increased R&D spending in 2016 in PE Films and expects to spend approximately $4 million more on R&D than in 2015, with a focus on developing materials that improve cost and performance for customers.
The surface protection operating segment of the PE Films reporting segment supports manufacturers of optical and other specialty substrates used in flat panel display products. These films are primarily used by customers to protect components of displays in the manufacturing and transportation process and then discarded.
As previously discussed, the Company believes that over the next few years, there is an increased risk that a portion of its film used in surface protection applications will be made obsolete by possible future customer product transitions to less costly alternative processes or materials. The Company estimates on a preliminary basis that the annual adverse impact on ongoing operating profit from customer shifts to alternative processes or materials in surface protection is in the range of up to $5 to $10 million. Given the technological and commercial complexity involved in bringing these alternative processes and materials to market, the Company is very uncertain as to the timing and ultimate amount of the possible transitions. In response, the Company is aggressively pursuing new surface protection products, applications and customers.
The Company continues to anticipate a significant additional product transition in its personal care business after 2018 that has an estimated annual adverse impact on ongoing operating profit of $10 million. The competitive dynamics in the personal care business require continuous development of new materials for customers, which include the leading global and regional personal care producers.
The product development process for personal care materials, which spans from idea inception to product commercialization, is typically 24 to 48 months.
Amounts estimated for the expected impact on future profits of lost business and product transitions are provided on a stand-alone basis and do not include any potential offsets such as sales growth, cost reductions or new product developments.
Year-To-Date
Results vs. Prior Year
Year-To-Date
Results
Net sales in the first
nine months
of
2016
decreased by
$40.8 million
versus
2015
primarily due to:
|
•
|
The loss of business with PE Films’ largest customer related to various products in personal care materials ($17.1 million) and other personal care materials customers ($6.4 million);
|
|
•
|
Lower volume in personal care materials primarily due to the timing of product transitions ($8.0 million);
|
|
•
|
A decline in volume in surface protection films ($3.5 million) that is believed to be the result of lower consumer demand for products with flat panel display screens in the first half of 2016; and
|
|
•
|
Lower volume of low margin overwrap films ($7.1 million) primarily due to the loss of business with a large customer, partially offset by sales growth in other areas ($1.3 million).
|
The table below summarizes the pro forma operating results for the first nine months of 2016 and 2015 had the impact of known lost business and efforts to consolidate domestic PE Films manufacturing facilities been fully realized:
|
Nine Months Ended September 30,
|
||||||
|
(In Thousands)
|
2016
|
2015
|
||||
|
Operating profit from ongoing operations, as reported
|
$
|
23,564
|
|
$
|
35,849
|
|
|
Contribution to operating profit from ongoing operations associated with known product transitions & other losses before restructurings & fixed costs reduction
|
2,843
|
|
10,638
|
|
||
|
Operating profit from ongoing operations net of the impact of known business that will be fully eliminated in future periods
|
20,721
|
|
25,211
|
|
||
|
Estimated future benefit of North American facility consolidation
|
3,900
|
|
3,900
|
|
||
|
Pro forma estimated operating profit from ongoing operations
|
$
|
24,621
|
|
$
|
29,111
|
|
Net sales associated with known lost business that have yet to be fully eliminated were $8.6 million and $32.1 million in the first nine months of 2016 and 2015, respectively.
Net of the impact of known lost business, pro forma estimated operating profit from ongoing operations in the first nine months of 2016 decreased by $4.5 million versus the first nine months of 2015 primarily due to:
|
•
|
Lower contribution to profits from surface protection films ($2.9 million) primarily due to lower volume and unfavorable sales mix changes;
|
25
|
•
|
Lower contribution to profits in personal care materials primarily due to volume declines resulting from the timing of product transitions ($3.0 million);
|
|
•
|
Higher contribution to profits from other products in PE Films ($0.5 million); and
|
|
•
|
Higher research and development expenses to support new product opportunities ($2.6 million), offset by lower general, sales and administrative expenses ($2.0 million) and lower depreciation ($1.2 million).
|
Restructuring
In July 2015, the Company announced its intention to consolidate its domestic production for PE Films by restructuring the operations in its manufacturing facility in Lake Zurich, Illinois. Efforts to transition domestic production from the Lake Zurich manufacturing facility will require various machinery upgrades and equipment transfers to its other manufacturing facilities. Given PE Films’ focus on maintaining product quality and customer satisfaction, the Company anticipates that these activities will be completed in the middle of 2017. Total pre-tax cash expenditures associated with restructuring the Lake Zurich manufacturing facility are expected to be approximately $17 million over the project period, and once complete, annual pre-tax cash cost savings are expected to be approximately $5-6 million.
The Company expects to recognize costs associated with the exit and disposal activities of approximately $5-6 million over the project period. Exit and disposal costs include severance charges and other employee-related expenses arising from the termination of employees of approximately $3-4 million and equipment transfers and other facility consolidation-related costs of approximately
$2 million
.
During the same period of time, operating expenses will include the acceleration of approximately
$3 million
of non-cash depreciation expense for certain machinery and equipment at the Lake Zurich manufacturing facility. Total expenses associated with the North American facility consolidation project were
$1.1 million
and
$3.6 million
in the
third quarter
and first
nine months
of
2016
, respectively (
$0.6 million
and
$1.8 million
, respectively, included in “Asset impairments and costs associated with exit and disposal activities, net of adjustments” and
$0.5 million
and
$1.8 million
, respectively, included in “Cost of goods sold” in the consolidated statements of income). As of September 30, 2016, total expenses incurred since the project began in the third quarter of 2015 were
$5.7 million
.
Total estimated cash expenditures of $16-17 million over the project period include the following:
|
•
|
Cash outlays associated with previously discussed exit and disposal expenses of approximately
$5 million
, including additional operating expenses of approximately
$1 million
associated with customer product qualifications on upgraded and transferred production lines;
|
|
•
|
Capital expenditures associated with equipment upgrades at other PE Films manufacturing facilities in the U.S. of approximately
$11 million
; and
|
|
•
|
Cash incentives of approximately
$1 million
in connection with meeting safety and quality standards while production ramps down at the Lake Zurich manufacturing facility.
|
Cash expenditures for the North American facility consolidation project were
$3.2 million
and
$9.0 million
in the
third quarter
and first
nine months
of
2016
, which includes
$2.6 million
and
$7.1 million
, respectively, for capital expenditures. As of September 30, 2016, total cash expenditures since the project began in the third quarter of 2015 were
$12.5 million
, which includes
$10.0 million
for capital expenditures.
Capital Expenditures, Depreciation & Amortization
Capital expenditures in PE Films were
$20.0 million
in the first
nine months
of
2016
compared to
$13.8 million
in the first
nine months
of
2015
.
PE Films currently estimates that total capital expenditures in
2016
will be
$27 million
, including approximately
$10 million
for routine capital expenditures required to support operations. Capital spending for strategic projects in 2016 includes: expansion of elastics capacity in Europe, the North American facility consolidation, added capacity for the production of a new topsheet for feminine hygiene products, and expansion of surface protection films capacity in China.
Depreciation expense was
$10.0 million
in the first
nine months
of
2016
and
$12.1 million
in the first
nine months
of
2015
. Depreciation expense is projected to be
$13 million
in
2016
.
26
Flexible Packaging Films
The operations of Flexible Packaging Films, which is also referred to as Terphane, continue to be adversely impacted by competitive pressures that are primarily related to ongoing unfavorable economic conditions in its primary market of Brazil and excess global capacity in the industry, particularly in Latin America. The Company believes that these conditions have shifted the competitive environment from a regional to a global landscape and have driven price convergence and lower product margins for Terphane in Brazil. The Company expects Terphane’s future operating results to continue to be volatile until industry utilization and the Brazilian business environment improve.
A summary of operating results from ongoing operations for Flexible Packaging Films is provided below:
|
Three Months Ended
|
Favorable/
(Unfavorable) % Change |
Nine Months Ended
|
Favorable/
(Unfavorable) % Change |
||||||||||||||||||
|
(In Thousands, Except Percentages)
|
September 30,
|
September 30,
|
|||||||||||||||||||
|
2016
|
2015
|
2016
|
2015
|
||||||||||||||||||
|
Sales volume (lbs)
|
23,204
|
|
22,495
|
|
3.2
|
%
|
66,222
|
|
59,968
|
|
10.4
|
%
|
|||||||||
|
Net sales
|
$
|
27,303
|
|
$
|
27,155
|
|
0.5
|
%
|
$
|
80,888
|
|
$
|
77,339
|
|
4.6
|
%
|
|||||
|
Operating profit from ongoing operations
|
$
|
93
|
|
$
|
4,102
|
|
(97.7
|
)%
|
$
|
1,184
|
|
$
|
1,793
|
|
(34.0
|
)%
|
|||||
Third-Quarter
Results vs. Prior Year
Third Quarter
Results
Sales volume improved by 3.2% from the third quarter of 2015 to the third quarter of 2016 primarily due to improvement in production output that led to additional sales. Net sales in the third quarter of 2016 increased 0.5% versus the third quarter of 2015.
Operating profit from ongoing operations in the third quarter of 2016 versus the third quarter of 2015 decreased by $4.0 million primarily due to:
|
•
|
Net refunds of $2.0 million in the third quarter of 2015 (none in 2016) received as a result of the reinstatement by the U.S. of the Generalized System of Preferences (GSP) program for allowing duty-free shipment of Terphane’s products to the U.S.; and
|
|
•
|
Foreign currency transaction gains of $0.1 million in the third quarter of 2016 versus $2.2 million in the third quarter of 2015, associated with U.S. dollar denominated export sales in Brazil.
|
Year-To-Date
Results vs. Prior Year
Year-To-Date
Results
Sales volume improved by 10.4% from the first nine months of 2015 to the first nine months of 2016 primarily due to improvement in production output that led to additional sales. Net sales in the first nine months of 2016 increased 4.6% versus the first nine months of 2015 primarily due to the increase in sales volume offset by lower pricing as a result of lower raw material prices.
Operating profit from ongoing operations in the first nine months of 2016 was $1.2 million versus $1.8 million the first nine months of 2015 primarily due to:
|
•
|
Foreign currency transaction losses of $3.2 million in the first nine months of 2016 versus foreign currency transaction gains of $3.6 million in the first nine months of 2015, associated with U.S. dollar denominated export sales in Brazil;
|
|
•
|
Higher volume ($2.7 million) and operating efficiencies ($3.2 million);
|
|
•
|
Net refunds of $1.5 million in the first nine months of 2015 received as a result of the reinstatement of the GSP program (none in 2016);
|
|
•
|
The estimated lag in the pass through of lower raw material costs of $1.2 million in the first nine months of 2016 versus $0.1 million in the first nine months of 2015; and
|
|
•
|
Lower depreciation and amortization costs ($0.4 million) and other costs and expenses ($0.3 million).
|
Capital Expenditures, Depreciation & Amortization
Capital expenditures in Terphane were
$2.0 million
in the first
nine months
of
2016
compared to
$2.5 million
in the first
nine months
of
2015
.
Terphane currently estimates that total capital expenditures in
2016
will be
$5 million
, including
$3 million
for routine capital expenditures required to support operations. Depreciation expense was
$4.9 million
in the first
nine
27
months
of
2016
and
$5.2 million
in the first
nine months
of
2015
. Depreciation expense is projected to be
$7 million
in
2016
. Amortization expense was
$2.1 million
in the first
nine months
of
2016
and
$2.2 million
in the first
nine months
of
2015
, and is projected to be
$3 million
in
2016
.
Aluminum Extrusions
A summary of operating results from ongoing operations for Aluminum Extrusions is provided below:
|
Three Months Ended
|
Favorable/
(Unfavorable) % Change |
Nine Months Ended
|
Favorable/
(Unfavorable) % Change |
||||||||||||||||||
|
(In Thousands, Except Percentages)
|
September 30,
|
September 30,
|
|||||||||||||||||||
|
2016
|
2015
|
2016
|
2015
|
||||||||||||||||||
|
Sales volume (lbs)
|
43,549
|
|
44,811
|
|
(2.8
|
)%
|
129,872
|
|
127,184
|
|
2.1
|
%
|
|||||||||
|
Net sales
|
$
|
91,067
|
|
$
|
94,812
|
|
(3.9
|
)%
|
$
|
269,987
|
|
$
|
286,660
|
|
(5.8
|
)%
|
|||||
|
Operating profit from ongoing operations
|
$
|
9,427
|
|
$
|
7,272
|
|
29.6
|
%
|
$
|
27,786
|
|
$
|
20,863
|
|
33.2
|
%
|
|||||
Third-Quarter
Results vs. Prior Year
Third Quarter
Results
Net sales in the third quarter of 2016 decreased versus 2015 primarily due to lower sales volume and a decrease in average selling prices. Lower sales volume, primarily in building and construction, reflected a slowdown in demand in the nonresidential market versus rising demand in 2015. The lower sales volume, partially offset by higher sales in the automotive market, had a net negative impact of $2.9 million on sales in the third quarter of 2016 versus the third quarter of 2015. Lower average net selling prices, primarily attributed to a decrease in aluminum market prices, had an unfavorable impact on net sales of $0.9 million.
Operating profit from ongoing operations in the third quarter of 2016 increased in comparison to the third quarter of 2015 by $2.2 million, as a result of production efficiencies ($0.6 million), improved management of freight logistics and lower utility costs ($0.6 million), and lower materials, supply and other net costs ($1.0 million).
Year-To-Date
Results vs. Prior Year
Year-To-Date
Results
Net sales in the first nine months of 2016 decreased versus 2015 primarily due to a decrease in average selling prices, partially offset by higher sales volume. Higher sales volume, primarily in the nonresidential building and construction and automotive markets, had a favorable impact of $4.5 million on sales in the first nine months of 2016 versus the first nine months of 2015. Lower average selling prices, which had an unfavorable impact on net sales of $21.5 million, can be primarily attributed to a decrease in average aluminum market prices.
Operating profit from ongoing operations in the first nine months of 2016 increased in comparison to the first nine months of 2015 by $6.9 million, as a result of higher volume ($0.8 million), improved management of freight logistics and lower utility costs ($2.0 million), lower hiring and training expenses for new hires ($1.3 million), and lower materials, supply and other net costs ($2.8 million, including $0.7 million of construction-related costs incurred in 2015 for the anodizing upgrade project).
Cast House Explosion
O
n June 29, 2016, the Bonnell Aluminum plant in Newnan, Georgia suffered an explosion in the casting department, resulting in injuries to five employees, one seriously. The explosion caused significant damage to the cast house and related equipment. Production in the extrusion and finishing areas of the plant resumed on June 30, 2016. The Company is in the process of replacing the damaged casting equipment and expects the cast house to be back in production by the end of the second quarter of 2017. The Newnan plant is now sourcing raw materials for its extrusion process from other Bonnell plants and from third party vendors.
Bonnell Aluminum has various forms of insurance to cover losses in the event of such incidents. These policies cover damage to buildings and equipment, workers compensation claims, third party claims, business interruption losses and additional expenses incurred as a result of the explosion.
28
During the third quarter of 2016, Bonnell recognized a gain of $1.9 million for insurance recoveries to-date associated with assets destroyed or damaged (included in “Other income (expense), net” in the
Selling, general and administrative expenses” in the Consolidated Statements of Income - see Note 2
for additional details). The Company also incurred $2.6 million of additional costs during the third quarter, which have been fully offset by insurance recoveries (netted in “Cost of goods sold” in the
Consolidated Statements of Income). As the insurance recovery process progresses, additional insurance recoveries are expected and any associated gains will be recorded.
Capital Expenditures, Depreciation & Amortization
Capital expenditures in Aluminum Extrusions were
$8.5 million
in the first
nine months
of
2016
compared to
$7.1 million
in the first
nine months
of
2015
. Capital expenditures are projected to be approximately
$17 million
in
2016
, which includes approximately
$5 million
for routine capital expenditures required to support operations and
$11 million
of a total
$18 million
projected to add extrusions capacity at the Niles, Michigan manufacturing facility. Projections of capital expenditures for Bonnell Aluminum in 2016 include expenditures to fix the damage caused by the cast house explosion net of related insurance recoveries. Additional cast house expenditures will continue into the early part of 2017 and will include equipment and facility upgrades of approximately $2 million that will not be covered by insurance reimbursements. Depreciation expense was
$6.1 million
in the first
nine months
of
2016
compared to
$6.5 million
in the first
nine months
of
2015
, and is projected to be approximately
$8 million
in
2016
. Amortization expense was
$0.8 million
in the first
nine months
of
2016
and
$0.8 million
in the first
nine months
of
2015
, and is projected to be approximately
$1 million
in
2016
.
Corporate Expenses, Interest and Taxes
Pension expense was
$8.0 million
in the first
nine months
of
2016
, a favorable change of
$1.2 million
from the first
nine months
of
2015
. Most of the impact on earnings from pension expense is reflected in “Corporate expenses, net” in the net sales and operating profit by segment table in Note 9. Pension expense is projected to be approximately
$10.7 million
in 2016. Corporate expenses, net, decreased in 2016 versus 2015. Expenses in the prior year included severance and other employee-related charges of $3.9 million associated with the resignations of the Company’s former chief executive and chief financial officers in the second quarter of 2015. Higher business development costs of $0.4 million in 2016 were offset by the lower pension expense.
Interest expense was
$2.9 million
in the first
nine months
of
2016
in comparison to
$2.7 million
in the first
nine months
of
2015
. Interest expense in 2016 included the write off of $0.2 million in unamortized loan fees from the credit facility that was refinanced in the first quarter of 2016.
The effective tax rate used to compute income taxes in the first
nine months
of
2016
was
7.6%
compared to
(52.7)%
in the first
nine months
of
2015
; the negative rate in 2015 was due to net losses from continuing operations associated with a non-deductible goodwill impairment charge of $44.5 million. The significant differences between the U.S. federal statutory rate and the effective tax rate for the first
nine months
is shown in the table provided in Note 10 on page 19.
Net capitalization and other credit measures are provided in
Liquidity and Capital Resources
beginning on page 32.
Critical Accounting Policies
In the ordinary course of business, the Company makes a number of estimates and assumptions relating to the reporting of results of operations and financial position in the preparation of financial statements in conformity with generally accepted accounting principles in the United States (“GAAP”). The Company believes the estimates, assumptions and judgments described in the section “Management’s Discussion and Analysis of Financial Condition and Results of Operations – Critical Accounting Policies” of the
2015
Form 10-K have the greatest potential impact on our financial statements, so Tredegar considers these to be its critical accounting policies. These policies include accounting for impairment of long-lived assets and goodwill, investment accounted for under the fair value method, pension benefits and income taxes. These policies require management to exercise judgments that are often difficult, subjective and complex due to the necessity of estimating the effect of matters that are inherently uncertain. Actual results could differ significantly from those estimates under different assumptions and conditions. The Company believes the consistent application of these policies enables it to provide readers of the financial statements with useful and reliable information about our operating results and financial condition. Since December 31,
2015
, there have been no changes in these policies that have had a material impact on results of operations or financial position. For more information on new accounting pronouncements, see Note 13 on page 22 for additional detail.
29
Results of Operations
Third Quarter
of
2016
Compared with the
Third Quarter
of
2015
Overall, sales in the
third quarter
of
2016
decreased by
7.2%
compared with the
third quarter
of
2015
. Net sales decreased
12.5%
in PE Films primarily due to lost business and reduced volume for low margin overwrap films products, partially offset by an improved sales mix of surface protection films. Net sales in Flexible Packaging Films increased
0.5%
due to higher volume driven by improved production output, partially offset by lower average selling prices as a result of the pass-through to customers of lower market-driven raw material costs. Net sales decreased
3.9%
in Aluminum Extrusions primarily due to lower sales volumes and a decrease in average selling prices as a result of the pass-through to customers of lower market-driven raw material costs. For more information on net sales and volume, see the
Executive Summary
beginning on page 24.
Consolidated gross profit (sales minus cost of goods sold and freight) as a percentage of sales was
16.3%
in the
third quarter
of
2016
compared to
15.0%
in the
third quarter
of
2015
. The gross profit margin in PE Films increased due to an improved sales mix of surface protection films and lower costs and productivity improvements partially offset by lower volume due to lost business. The gross profit margin in Flexible Packaging Films decreased due to higher costs in 2016 than 2015, as a GSP refund of $2.0 million was received in the third quarter of 2015. The gross profit margin in Aluminum Extrusions increased primarily as a result of operational efficiencies and lower utility, freight and supply costs.
As a percentage of sales, general and administrative (“SG&A”) and R&D expenses were
10.5%
in the
third quarter
of
2016
, compared with
8.3%
in the
third quarter
of last year. SG&A expenses increased in 2016 due to higher R&D costs incurred in the development of new products. R&D expenses at PE Films increased by $0.7 million in 2016 as the competitive dynamics of this industry require continuous development of new materials through R&D to improve cost and performance for customers. The Company expects spending by PE Films for R&D in 2016 to be higher than 2015 by approximately $4 million.
Plant shutdowns, asset impairments, restructurings and other items in the
third quarter
of
2016
and
2015
are shown in the segment operating profit table in Note 9 and are described in detail in Note 2. A discussion of unrealized gains and losses on investments can also be found in Note 6.
Average debt outstanding and interest rates were as follows:
|
Three Months Ended September 30,
|
|||||||
|
(In Millions)
|
2016
|
2015
|
|||||
|
Floating-rate debt with interest charged on a rollover basis at one-month LIBOR plus a credit spread:
|
|||||||
|
Average outstanding debt balance
|
$
|
99.2
|
|
$
|
137.2
|
|
|
|
Average interest rate
|
2.3
|
%
|
2.0
|
%
|
|||
|
Fixed-rate and other debt:
|
|||||||
|
Average outstanding debt balance
|
$
|
—
|
|
$
|
—
|
|
|
|
Average interest rate
|
n/a
|
|
n/a
|
|
|||
|
Total debt:
|
|||||||
|
Average outstanding debt balance
|
$
|
99.2
|
|
$
|
137.2
|
|
|
|
Average interest rate
|
2.3
|
%
|
2.0
|
%
|
|||
First
Nine Months
of
2016
Compared with the First
Nine Months
of
2015
Overall, sales in the first
nine months
of
2016
decreased by
8.2%
compared with the first
nine months
of
2015
. Net sales decreased
14.0%
in PE Films primarily due to lower volume primarily related to lost business, the timing of certain product transitions in personal care films and a decline in market demand for surface protection films during the first half of 2016. Net sales in Flexible Packaging Films increased
4.6%
due to improvement in production output. Net sales decreased
5.8%
in Aluminum Extrusions primarily due to lower average selling prices as a result of the pass-through to customers of lower market-driven raw material costs, partially offset by higher sales volume.
Consolidated gross profit as a percentage of sales was
16.5%
in the first
nine months
of
2016
compared to
14.8%
in the first
nine months
of
2015
. Gross profit as a percentage of sales was positively impacted by lower pension expenses in the first
nine months
of
2016
compared to the first
nine months
of
2015
. As previously noted, most of the impact of pension expense is
30
not allocated to the Company’s operating segments. The gross profit margin in PE Films decreased due to lower volume from lost business and lower demand for surface protection films during the first half of 2016, partially offset by lower depreciation expense. The gross profit margin in Flexible Packaging Films increased due to higher volume and operating efficiencies, partially offset by lower pricing driven by competitive pressures and lower material prices. The gross profit margin in Aluminum Extrusions increased primarily as a result of higher volume, lower utility, freight and supply costs.
As a percentage of sales, SG&A and R&D expenses were
11.5%
in the first
nine months
of
2016
, compared with
9.7%
in the first
nine months
of last year. R&D expenses at PE Films were higher in the 2016 as the competitive dynamics of this industry require continuous development of new materials through R&D to improve cost and performance for customers.
Plant shutdowns, asset impairments, restructurings and other items in the first
nine months
of
2016
and
2015
are shown in the segment operating profit table in Note 9 and are described in detail in Note 2. A discussion of unrealized gains and losses on investments can also be found in Note 6.
Interest expense increased from
$2.7 million
in the first
nine months
of
2015
to
$2.9 million
in the first
nine months
of
2016
. Interest expense in 2016 included the write off of $0.2 million in unamortized loan fees from the credit facility that was refinanced. Average debt outstanding and interest rates were as follows:
|
Nine Months Ended September 30,
|
|||||||
|
(In Millions)
|
2016
|
2015
|
|||||
|
Floating-rate debt with interest charged on a rollover basis at one-month LIBOR plus a credit spread:
|
|||||||
|
Average outstanding debt balance
|
$
|
104.8
|
|
$
|
139.5
|
|
|
|
Average interest rate
|
2.3
|
%
|
2.0
|
%
|
|||
|
Fixed-rate and other debt:
|
|||||||
|
Average outstanding debt balance
|
$
|
—
|
|
$
|
—
|
|
|
|
Average interest rate
|
n/a
|
|
n/a
|
|
|||
|
Total debt:
|
|||||||
|
Average outstanding debt balance
|
$
|
104.8
|
|
$
|
139.5
|
|
|
|
Average interest rate
|
2.3
|
%
|
2.0
|
%
|
|||
Liquidity and Capital Resources
Tredegar’s management continues to focus on improving working capital management, and measures such as days sales outstanding (“DSO”), days inventory outstanding (“DIO”) and days payables outstanding (“DPO”) are used to evaluate changes in working capital. Changes in operating assets and liabilities from
December 31, 2015
to
September 30, 2016
are summarized as follows:
|
•
|
Accounts and other receivables increased
$10.2 million
(
10.8%
).
|
|
•
|
Accounts receivable in PE Films increased by $3.7 million primarily due to the timing of cash receipts. DSO (represents trailing 12 months net sales divided by a rolling 12-month average of accounts and other receivables balances) was approximately 44.2 days for the 12 months ended
September 30, 2016
and 42.7 days for the 12 months ended
December 31, 2015
.
|
|
•
|
Accounts receivable in Flexible Packaging Films decreased by $1.5 million primarily due to lower sales and due to the timing of cash receipts. DSO was approximately 53.7 days for the 12 months ended
September 30, 2016
and 68.9 days for the 12 months ended
December 31, 2015
.
|
|
•
|
Accounts receivable in Aluminum Extrusions increased by $7.9 million primarily due to the recording of an insurance receivable of $2.5 million related to the Bonnell cast house explosion and the timing of cash receipts. DSO was approximately 42.9 days for the 12 months ended
September 30, 2016
and 45.1 days for the 12 months ended
December 31, 2015
.
|
|
•
|
Inventories increased
$7.9 million
(
12.2%
).
|
|
•
|
Inventories in PE Films increased by approximately $4.8 million primarily due to the timing of raw material purchases. DIO (represents trailing 12 months costs of goods sold calculated on a first-in, first-out basis divided by a rolling 12-month average of inventory balances calculated on the first-in, first-out basis) was approximately 51.0 days for the 12 months ended
September 30, 2016
and 48.3 days for the 12 months ended
December 31, 2015
.
|
31
|
•
|
Inventories in Flexible Packaging Films increased by approximately $0.4 million primarily due to the timing of raw material purchases. DIO was approximately 77.6 days for the 12 months ended
September 30, 2016
and 81.6 days for the 12 months ended
December 31, 2015
.
|
|
•
|
Inventories in Aluminum Extrusions increased by $2.6 million due to third party purchases of raw materials due to the explosion at the Bonnell cast house and the timing of purchases. DIO was approximately 27.0 days for the 12 months ended
September 30, 2016
and 29.8 days for the 12 months ended
December 31, 2015
.
|
|
•
|
Net property, plant and equipment increased
$25.5 million
(
11.0%
) primarily due to capital expenditures of
$30.9 million
and a change in the value of the U.S. Dollar relative to foreign currencies ($15.5 million increase), partially offset by depreciation expenses of
$21.0 million
.
|
|
•
|
Accounts payable increased
$3.9 million
(
4.7%
).
|
|
•
|
Accounts payable in PE Films decreased $1.8 million due to the normal volatility associated with the timing of payments. DPO (represents trailing 12 months costs of goods sold calculated on a first-in, first-out basis divided by a rolling 12-month average of accounts payable balances) was approximately 39.4 days for the 12 months ended
September 30, 2016
and 39.0 days for the 12 months ended
December 31, 2015
.
|
|
•
|
Accounts payable in Flexible Packaging Films increased $2.4 million due to an effort implemented to increase payment terms with suppliers. DPO was approximately 36.9 days for the 12 months ended
September 30, 2016
and 34.2 days for the 12 months ended
December 31, 2015
.
|
|
•
|
Accounts payable in Aluminum Extrusions increased by $4.5 million primarily due to the normal volatility associated with the timing of inventory purchases. DPO was approximately 45.1 days for the 12 months ended
September 30, 2016
and 48.0 days for the 12 months ended
December 31, 2015
.
|
Cash provided by operating activities was
$34.4 million
in the first
nine months
of
2016
compared with
$33.3 million
in the first
nine months
of
2015
. The change is primarily related to normal volatility of working capital components.
Cash used in investing activities was
$29.5 million
in the first
nine months
of
2016
compared with
$22.4 million
in the first
nine months
of
2015
. Cash used in investing activities primarily represents capital expenditures, which were
$30.9 million
and
$23.4 million
in the first
nine months
of
2016
and
2015
, respectively.
Cash used in financing activities was
$23.5 million
in the first
nine months
of
2016
and was primarily related to the payment of regular quarterly dividends of
$10.8 million
(
33 cent
s per share) and net repayments of debt and refinancing costs of
$14.8 million
. Cash used in financing activities was
$10.7 million
in the first
nine months
of
2015
and was primarily related to the payment of regular quarterly dividends of
$10.1 million
(
31 cent
s per share) and net debt payments of $3.3 million, partially offset by the exercise of stock options of $2.8 million.
Further information on cash flows for the
nine months
ended
September 30, 2016
and
2015
is provided in the consolidated statements of cash flows on page 5.
32
On March 1, 2016, the Company executed a new five-year, $400 million secured revolving credit agreement that expires on March 1, 2021, replacing the previous $350 million unsecured revolving credit agreement. Net capitalization and indebtedness as defined under our existing revolving credit agreement as of
September 30, 2016
were as follows:
|
Net Capitalization and Indebtedness as of September 30, 2016
|
|||
|
(In Thousands)
|
|||
|
Net capitalization:
|
|||
|
Cash and cash equivalents
|
$
|
28,356
|
|
|
Debt:
|
|||
|
$400 million revolving credit agreement maturing March 1, 2021
|
91,750
|
|
|
|
Other debt
|
—
|
|
|
|
Total debt
|
91,750
|
|
|
|
Debt, net of cash and cash equivalents
|
63,394
|
|
|
|
Shareholders’ equity
|
317,918
|
|
|
|
Net capitalization
|
$
|
381,312
|
|
|
Indebtedness as defined in revolving credit agreement:
|
|||
|
Total debt
|
$
|
91,750
|
|
|
Face value of letters of credit
|
2,685
|
|
|
|
Other
|
533
|
|
|
|
Indebtedness
|
$
|
94,968
|
|
The credit spread and commitment fees charged on the unused amount under our revolving credit agreement at various indebtedness-to-adjusted EBITDA levels are as follows:
|
Pricing Under Revolving Credit Agreement (Basis Points)
|
|||||
|
Indebtedness-to-Adjusted EBITDA Ratio
|
Credit Spread
Over LIBOR
|
Commitment
Fee
|
|||
|
> 3.5x but <= 4.0x
|
250
|
|
45
|
|
|
|
> 3.0x but <= 3.5x
|
225
|
|
40
|
|
|
|
> 2.0x but <= 3.0x
|
200
|
|
35
|
|
|
|
> 1.0x but <= 2.0x
|
175
|
|
30
|
|
|
|
<= 1.0x
|
150
|
|
25
|
|
|
At
September 30, 2016
, the interest rate on debt under the revolving credit agreement existing at that date was priced at one-month LIBOR plus the applicable credit spread of 175 basis points. Under the revolving credit agreement, borrowings are permitted up to $400 million, and approximately
$237 million
was available to borrow at
September 30, 2016
based upon the most restrictive covenants.
33
The computations of adjusted EBITDA, adjusted EBIT, the leverage ratio and interest coverage ratio as defined in the revolving credit agreement are presented below. Adjusted EBITDA and adjusted EBIT as defined in the revolving credit agreement are not intended to represent net income (loss) or cash flow from operations as defined by GAAP and should not be considered as an alternative to either net income or to cash flow.
|
Computations of Adjusted EBITDA, Adjusted EBIT, Leverage Ratio and Interest Coverage Ratio as Defined in the Revolving Credit Agreement Along with Related Most Restrictive Covenants as of and for the Twelve Months Ended September 30, 2016 (In Thousands)
|
|||
|
Computations of adjusted EBITDA and adjusted EBIT as defined in revolving credit agreement for the twelve months ended September 30, 2016:
|
|||
|
Net income (loss)
|
$
|
16,863
|
|
|
Plus:
|
|||
|
After-tax losses related to discontinued operations
|
—
|
|
|
|
Total income tax expense for continuing operations
|
1,728
|
|
|
|
Interest expense
|
3,741
|
|
|
|
Depreciation and amortization expense for continuing operations
|
31,907
|
|
|
|
All non-cash losses and expenses, plus cash losses and expenses not to exceed $10,000, for continuing operations that are classified as unusual, extraordinary or which are related to plant shutdowns, asset impairments and/or restructurings (cash-related of $7,518)
|
8,347
|
|
|
|
Charges related to stock option grants and awards accounted for under the fair value-based method
|
—
|
|
|
|
Losses related to the application of the equity method of accounting
|
—
|
|
|
|
Losses related to adjustments in the estimated fair value of assets accounted for under the fair value method of accounting
|
20,700
|
|
|
|
Minus:
|
|||
|
After-tax income related to discontinued operations
|
—
|
|
|
|
Total income tax benefits for continuing operations
|
—
|
|
|
|
Interest income
|
(205
|
)
|
|
|
All non-cash gains and income, plus cash gains and income in excess of $10,000, for continuing operations that are classified as unusual, extraordinary or which are related to plant shutdowns, asset impairments and/or restructurings
|
—
|
|
|
|
Income related to changes in estimates for stock option grants and awards accounted for under the fair value-based method
|
(64
|
)
|
|
|
Income related to the application of the equity method of accounting
|
—
|
|
|
|
Income related to adjustments in the estimated fair value of assets accounted for under the fair value method of accounting
|
—
|
|
|
|
Plus cash dividends declared on investments accounted for under the equity method of accounting
|
—
|
|
|
|
Plus or minus, as applicable, pro forma EBITDA adjustments associated with acquisitions and asset dispositions
|
—
|
|
|
|
Adjusted EBITDA as defined in revolving credit agreement
|
83,017
|
|
|
|
Less: Depreciation and amortization expense for continuing operations (including pro forma for acquisitions and asset dispositions)
|
(31,907
|
)
|
|
|
Adjusted EBIT as defined in revolving credit agreement
|
$
|
51,110
|
|
|
Computations of leverage and interest coverage ratios as defined in revolving credit agreement at September 30, 2016:
|
|||
|
Leverage ratio (indebtedness-to-adjusted EBITDA)
|
1.14x
|
|
|
|
Interest coverage ratio (adjusted EBIT-to-interest expense)
|
13.66x
|
|
|
|
Most restrictive covenants as defined in revolving credit agreement:
|
|||
|
Maximum permitted aggregate amount of dividends that can be paid by Tredegar during the term of the revolving credit agreement ($100,000 plus 50% of net income generated for each quarter beginning January 1, 2016)
|
$
|
111,369
|
|
|
Maximum leverage ratio permitted
|
4.00
|
|
|
|
Minimum interest coverage ratio permitted
|
2.50
|
|
|
34
As of
September 30, 2016
, Tredegar was in compliance with all financial covenants in our revolving credit agreement. Noncompliance with any one or more of the debt covenants may have a material adverse effect on the Company’s financial condition or liquidity in the event such noncompliance cannot be cured or should the Company be unable to obtain a waiver from the lenders as we would not be permitted to borrow under the credit facility and any amounts outstanding would become due and payable. Renegotiation of the covenant(s) through an amendment to the revolving credit agreement could effectively cure the noncompliance, but could have an effect on financial condition or liquidity depending upon how the covenant is renegotiated.
At
September 30, 2016
, the Company had cash and cash equivalents of
$28.4 million
, including funds held in locations outside the U.S. of
$27.8 million
. Tredegar accrues U.S. federal income taxes on unremitted earnings of all foreign subsidiaries. Prior to the second quarter of 2016, deferred U.S. federal income taxes had not been recorded for the undistributed earnings for Terphane Ltda. because the Company had intended to permanently reinvest these earnings. Due to concerns about the current political and economic conditions in Brazil, Terphane Ltda. has begun making cash distributions to the Company. During the second quarter of 2016, Terphane Ltda. paid a dividend of
$10.7 million
to the Company. Because of the accumulation of significant losses related to foreign currency translations at Terphane Ltda., there were no unrecorded deferred tax liabilities associated with the U.S. federal income taxes and foreign withholding taxes on Terphane Ltda.’s undistributed earnings as of
September 30, 2016
and
December 31, 2015
. The Company believes that existing borrowing availability, current cash balances and cash flow from operations will be sufficient to satisfy its working capital, capital expenditure and dividend requirements for the next 12 months.
|
Item 3.
|
Quantitative and Qualitative Disclosures About Market Risk.
|
Tredegar has exposure to the volatility of interest rates, polyethylene and polypropylene resin prices, Terephtalic Acid (“PTA”) and Monoethylene Glycol (“MEG”) prices, aluminum ingot and scrap prices, energy prices, foreign currencies and emerging markets. See
Liquidity and Capital Resources
beginning on page 32 regarding credit agreement and interest rate exposures.
Changes in polyethylene resin prices, and the timing of those changes, could have a significant impact on profit margins in PE Films. Changes in polyester resin, PTA and MEG prices, and the timing of those changes, could have a significant impact on profit margins in Flexible Packaging Films. Profit margins in Aluminum Extrusions are sensitive to fluctuations in aluminum ingot and scrap prices as well as natural gas prices (natural gas is the principal energy source used to operate its casting furnaces). There is no assurance of the Company’s ability to pass through higher raw material and energy costs to its customers.
The volatility of average quarterly prices of low density polyethylene resin in the U.S. (a primary raw material for PE Films) is shown in the chart below.
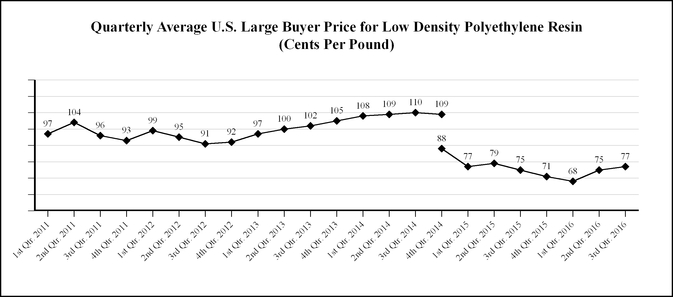
|
Source: Quarterly averages computed by Tredegar using monthly data provided by IHS, Inc. In January 2015, IHS reflected a 21 cents per pound non-market adjustment based on their estimate of the growth of discounts in prior periods. The 4th quarter 2014 average rate of $1.09 per pound is shown on a pro forma basis as if the non-market adjustment was made in the fourth quarter of 2014.
|
35
Polyethylene resin prices in Europe, Asia and South America have exhibited similar long-term trends. The price of resin is driven by several factors, including supply and demand and the price of oil, ethylene and natural gas. To address fluctuating resin prices, PE Films has index-based pass-through raw material cost agreements for the majority of its business. However, under certain agreements, changes in resin prices are not passed through for an average period of 90 days (see
Executive Summary
on page 24 and Note 9
on page 17 for more information). Pricing on the remainder of the business is based upon raw material costs and supply/demand dynamics within the markets that the Company competes.
Polyester resins, MEG and PTA used in flexible packaging films produced in Brazil are primarily purchased domestically, with other sources available mostly from Asia and the U.S. Given the nature of these products as commodities, pricing is derived from Asian pricing indexes. The volatility of the average quarterly prices for polyester fibers in Asia, which is representative of polyester resin (a primary raw material for Flexible Packaging Films) pricing trends, is shown in the chart below:
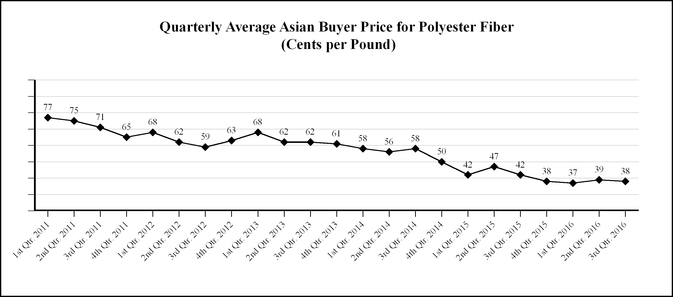
|
Source: Quarterly averages computed by Tredegar using monthly data from CMAI Global Index data.
|
The volatility of average quarterly prices of PTA and MEG in Asia (raw materials used in the production of polyester resins produced by Flexible Packaging Films) is shown in the chart below:
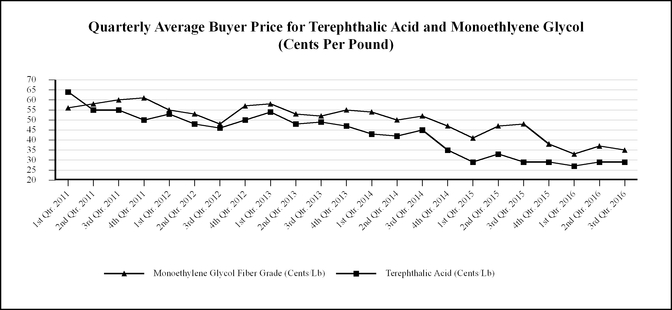
|
Source: Quarterly averages computed by Tredegar using monthly data from CMAI Global Index data.
|
36
In the normal course of business, Aluminum Extrusions enters into fixed-price forward sales contracts with certain customers for the sale of fixed quantities of aluminum extrusions at scheduled intervals. In order to hedge its exposure to aluminum price volatility (see the chart below) under these fixed-price arrangements, which generally have a duration of not more than 12 months, the Company enters into a combination of forward purchase commitments and futures contracts to acquire or hedge aluminum, based on the scheduled deliveries. See Note 7 on page 14 for additional information.
The volatility of quarterly average aluminum prices is shown in the chart below.
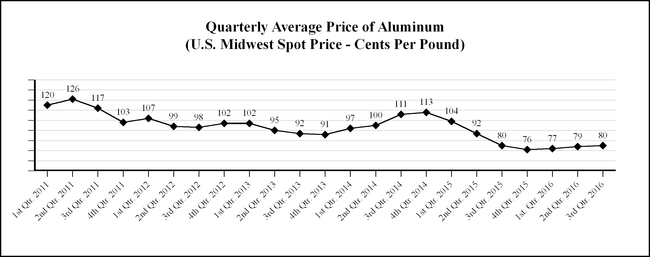
|
Source: Quarterly averages computed using daily Midwest average prices provided by Platts.
|
From time-to-time, Aluminum Extrusions hedges a portion of its exposure to natural gas price volatility by entering into fixed-price forward purchase contracts with the Company’s natural gas suppliers. The Company estimates that, in an unhedged situation, every $1 per mmBtu per month change in the market price of natural gas has a
$85,000
impact on the continuing monthly operating profit in Aluminum Extrusions. The Company has an energy surcharge for its aluminum extrusions business in the U.S. to be applied when the NYMEX natural gas price is in excess of $8.85 per mmBtu.
The volatility of quarterly average natural gas prices is shown in the chart below.
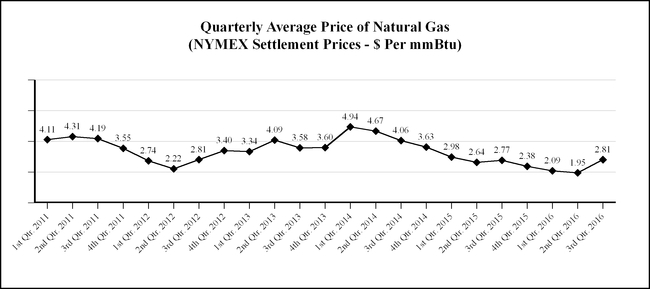
|
Source: Quarterly averages computed by Tredegar using monthly NYMEX settlement prices.
|
37
The Company sells to customers in foreign markets through its foreign operations and through exports from U.S. plants. The percentage of sales for manufacturing operations related to foreign markets for the first
nine months
of
2016
and
2015
are as follows:
|
Percentage of Net Sales from Ongoing
Operations Related to Foreign Markets*
|
|||||||||||
|
|
Nine Months Ended September 30,
|
||||||||||
|
|
2016
|
2015
|
|||||||||
|
|
Exports
From U.S.
|
Foreign
Operations
|
Exports
From U.S.
|
Foreign
Operations
|
|||||||
|
Canada
|
6
|
%
|
—
|
%
|
5
|
%
|
—
|
%
|
|||
|
Europe
|
1
|
|
10
|
|
1
|
|
10
|
|
|||
|
Latin America
|
—
|
|
11
|
|
—
|
|
10
|
|
|||
|
Asia
|
9
|
|
3
|
|
8
|
|
3
|
|
|||
|
Total
|
16
|
%
|
24
|
%
|
14
|
%
|
23
|
%
|
|||
|
* The percentages for foreign markets are relative to Tredegar’s total net sales from ongoing operations
|
|||||||||||
Tredegar attempts to match the pricing and cost of its products in the same currency and generally view the volatility of foreign currencies (see trends for the Euro, Brazilian Real and Chinese Yuan in the charts on page 40) and emerging markets, and the corresponding impact on earnings and cash flow, as part of the overall risk of operating in a global environment. Exports from the U.S. are generally denominated in U.S. Dollars. The Company’s foreign currency exposure on income from continuing foreign operations relates to the Euro, the Chinese Yuan, the Hungarian Forint, the Brazilian Real and the Indian Rupee.
PE Films is generally able to match the currency of its sales and costs for its product lines. For flexible packaging films produced in Brazil, selling prices and key raw material costs are principally determined in U.S. Dollars and are impacted by local economic conditions, including the value of the Brazilian Real in U.S. Dollars and local supply and demand factors. Certain production costs, such as conversion costs and other fixed costs, are priced in Brazilian Real and adversely impacted by high inflation levels in Brazil. Moreover, the value of the Brazilian Real when compared to the U.S. Dollar is impacted by many variables, including inflation differentials between the U.S. and Brazil. In general, local currency inflationary cost increases in Brazil will be offset when converting to U.S. Dollars by decreases in the value of the Brazilian Real relative to the U.S. Dollar that is related to high Brazil inflation versus lower U.S. inflation. Accordingly, because of the many volatile economic variables at play in Brazil, it is not practical to isolate to one measure the economic impact on Flexible Packaging Films’ operating profit from changes in the U.S. Dollar value versus the Brazilian Real.
Tredegar estimates that the change in the value of foreign currencies relative to the U.S. Dollar on PE Films had an unfavorable impact on operating profit from ongoing operations in PE Films of
$0.3 million
in the
third quarter
of
2016
compared with the
third quarter
of
2015
and
$0.3 million
in the first
nine months
of
2016
compared with the first
nine months
of
2015
.
38
Trends for the Euro exchange rates relative to the U.S. Dollar are shown in the chart below.
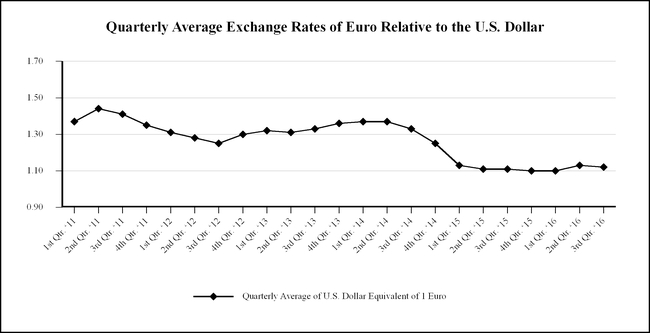
|
Source: Quarterly averages computed by Tredegar using daily closing data provided by Bloomberg.
|
Trends for the Brazilian Real and Chinese Yuan exchange rates relative to the U.S. Dollar are shown in the chart below.
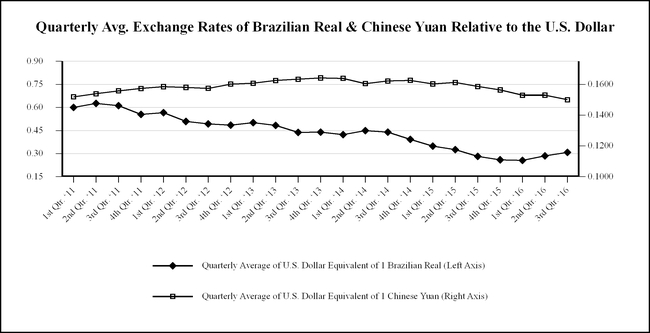
|
Source: Quarterly averages computed by Tredegar using daily closing data provided by Bloomberg.
|
|
Item 4.
|
Controls and Procedures.
|
Pursuant to Rule 13a-15(b) under the Securities Exchange Act of 1934, as amended, we carried out an evaluation, with the participation of our management, including our principal executive officer and principal financial officer, of the effectiveness of our disclosure controls and procedures (as defined under Rule 13a-15(e) under the Securities Exchange Act of
39
1934) as of the end of the period covered by this report. Based upon that evaluation, the principal executive officer and principal financial officer concluded that the Company’s disclosure controls and procedures are effective to ensure that information required to be disclosed by us in the reports that we file or submit under the Securities Exchange Act of 1934, is recorded, processed, summarized and reported, within the time periods specified in the SEC’s rules and forms, and that such information is accumulated and communicated to our management, including the principal executive officer and principal financial officer, as appropriate, to allow timely decisions regarding required disclosure.
There has been no change in the Company’s internal control over financial reporting during the quarter ended
September 30, 2016
, that has materially affected, or is reasonably likely to materially affect, its internal control over financial reporting.
|
Item 1A.
|
Risk Factors.
|
As disclosed in “Item 1A. Risk Factors” in our 2015 Form 10-K, there are a number of risks and uncertainties that can have a material effect on the operating results of our businesses and our financial condition. There are no additional material updates or changes to our other risk factors since the filing of our 2015 Form 10-K, except as follows.
The following amends and replaces the third paragraph of the PE Films risk factor titled “
PE Films is highly dependent on sales associated with its top five customers, the largest of which is P&G
” included in our 2015 Form 10-K.
PE Films anticipates further exposure to product transitions and lost business in certain personal care and surface protection materials that could negatively affect future operating profit from ongoing operations by, in the case of personal care materials, approximately $10 million annually, likely beginning after 2018, and in the case of surface protection materials, estimated to be in the range of up to $5 to $10 million, although the timing and ultimate amount of the possible transitions for surface protection are uncertain. While it continues to identify new business opportunities with its existing customers, PE Films is also working to expand its customer base in order to create long-term growth and profitability by actively competing for new business with various customers across its full product portfolio and introducing new products and/or improvements to existing applications. There is no assurance that these efforts to expand the revenue base and mitigate this or any future loss of sales and profits from significant customers will be successful.
The following is a new General risk factor:
An impairment of our long-lived intangible assets, including goodwill, could have a material non-cash adverse impact on our results of operations.
As of September 30, 2016, reporting units in PE Films and Aluminum Extrusions carried goodwill balances of $104.1 million and $13.7 million, respectively. The Company assesses goodwill for impairment when events or circumstances indicate that the carrying value may not be recoverable, or, at a minimum, on an annual basis. The valuation of goodwill depends on a variety of factors, including the success of the Company’s business, global market and economic conditions, earnings growth and expected cash flows. Impairments to goodwill and other intangible assets may be caused by factors outside the Company’s control, such as increasing competitive pricing pressures, changes in foreign exchange rates, lower than expected sales and profit growth rates, and various other factors. Significant and unanticipated changes could require a non-cash charge for impairment in a future period, which may significantly affect the Company’s results of operations in the period of such charge.
40
|
Item 6.
|
Exhibits.
|
|
Exhibit
Nos.
|
|
|
|
31.1
|
|
Certification of John D. Gottwald, President and Chief Executive Officer of Tredegar Corporation, pursuant to Rules 13a-14(a) and 15d-14(a) promulgated under the Securities Exchange Act of 1934, as adopted pursuant to Section 302 of the Sarbanes-Oxley Act of 2002.
|
|
31.2
|
|
Certification of D. Andrew Edwards, Vice President and Chief Financial Officer of Tredegar Corporation, pursuant to Rules 13a-14(a) and 15d-14(a) promulgated under the Securities Exchange Act of 1934, as adopted pursuant to Section 302 of the Sarbanes-Oxley Act of 2002.
|
|
32.1
|
|
Certification of John D. Gottwald, President and Chief Executive Officer of Tredegar Corporation, pursuant to 18 U.S.C. Section 1350, as adopted pursuant to Section 906 of the Sarbanes-Oxley Act of 2002.
|
|
32.2
|
|
Certification of D. Andrew Edwards, Vice President and Chief Financial Officer of Tredegar Corporation, pursuant to 18 U.S.C. Section 1350, as adopted pursuant to Section 906 of the Sarbanes-Oxley Act of 2002.
|
|
101
|
|
XBRL Instance Document and Related Items.
|
41
SIGNATURES
Pursuant to the requirements of the Securities Exchange Act of 1934, the Registrant has duly caused this report to be signed on its behalf by the undersigned thereunto duly authorized.
|
Tredegar Corporation
|
||||
|
(Registrant)
|
||||
|
Date:
|
November 1, 2016
|
/s/ John D. Gottwald
|
||
|
John D. Gottwald
|
||||
|
President and Chief Executive Officer
|
||||
|
(Principal Executive Officer)
|
||||
|
Date:
|
November 1, 2016
|
/s/ D. Andrew Edwards
|
||
|
D. Andrew Edwards
|
||||
|
Vice President and Chief Financial Officer
|
||||
|
(Principal Financial Officer)
|
||||
|
Date:
|
November 1, 2016
|
/s/ Frasier W. Brickhouse, II
|
||
|
Frasier W. Brickhouse, II
|
||||
|
Corporate Treasurer and Controller
|
||||
|
(Principal Accounting Officer)
|
||||
TABLE OF CONTENTS
Part I - Financial InformationItem 1. Financial StatementsItem 2. Management S Discussion and Analysis Of Financial Condition and Results Of OperationsItem 3. Quantitative and Qualitative Disclosures About Market RiskItem 4. Controls and ProceduresPart II - Other InformationItem 1A. Risk FactorsItem 6. Exhibits