TREDEGAR CORP
10-Ks and 10-Qs
|
|
|
|
|
|
|
|
|
|
|
|
|
|
|
|
|
|
|
|
|
|
|
|
|
|
|
|
|
|
|
|
|
|
|
|
|
|
|
|
|
|
|
|
|
|
|
|
|
|
|
|
|
UNITED STATES
SECURITIES AND EXCHANGE COMMISSION
Washington, D.C. 20549
FORM 10-Q
(Mark One)
|
x
|
QUARTERLY REPORT PURSUANT TO SECTION 13 OR 15(d) OF THE SECURITIES EXCHANGE ACT OF 1934
|
For the quarterly period ended
June 30, 2017
OR
|
¨
|
TRANSITION REPORT PURSUANT TO SECTION 13 OR 15(d) OF THE SECURITIES EXCHANGE ACT OF 1934
|
For the transition period from
to
Commission file number
1-10258
Tredegar Corporation
(Exact Name of Registrant as Specified in Its Charter)
|
Virginia
|
|
54-1497771
|
|
(State or Other Jurisdiction of
Incorporation or Organization)
|
|
(I.R.S. Employer
Identification No.)
|
|
1100 Boulders Parkway
Richmond, Virginia
|
|
23225
|
|
(Address of Principal Executive Offices)
|
|
(Zip Code)
|
Registrant’s Telephone Number, Including Area Code:
(804) 330-1000
Indicate by check mark whether the registrant (1) has filed all reports required to be filed by Section 13 or 15(d) of the Securities Exchange Act of 1934 during the preceding 12 months (or for such shorter period that the registrant was required to file such reports), and (2) has been subject to such filing requirements for the past 90 days. Yes
x
No
¨
Indicate by check mark whether the registrant has submitted electronically and posted on its corporate Web site, if any, every Interactive Data File required to be submitted and posted pursuant to Rule 405 of Regulation S-T (232.405 of this chapter) during the preceding 12 months (or for such shorter period that the registrant was required to submit and post such files). Yes
x
No
¨
Indicate by check mark whether the registrant is a large accelerated filer, an accelerated filer, a non-accelerated filer, a smaller reporting company, or an emerging growth company. See the definitions of “large accelerated filer,” “accelerated filer,” “smaller reporting company,” and “emerging growth company” in Rule 12b-2 of the Exchange Act.
|
Large accelerated filer
|
¨
|
Accelerated filer
|
x
|
Smaller reporting company
|
¨
|
||
|
Non-accelerated filer
|
¨
(Do not check if a smaller reporting company)
|
Emerging growth company
|
¨
|
||||
If an emerging growth company, indicate by check mark if the registrant has elected not to use the extended transition period for complying with any new or revised financial accounting standards provided pursuant to Section 13(a) of the Exchange Act.
¨
Indicate by check mark whether the registrant is a shell company (as defined in Rule 12b-2 of the Exchange Act). Yes
¨
No
x
The number of shares of Common Stock, no par value, outstanding as of
July 28, 2017
: 33,030,190
|
Item 1.
|
Financial Statements.
|
Tredegar Corporation
(In Thousands, Except Share Data)
(Unaudited)
|
June 30,
|
December 31,
|
||||||
|
2017
|
2016
|
||||||
|
Assets
|
|||||||
|
Current assets:
|
|||||||
|
Cash and cash equivalents
|
$
|
24,026
|
|
$
|
29,511
|
|
|
|
Accounts and other receivables, net of allowance for doubtful accounts and sales returns of $2,694 in 2017 and $3,102 in 2016
|
129,164
|
|
97,388
|
|
|||
|
Income taxes recoverable
|
13,691
|
|
7,518
|
|
|||
|
Inventories
|
84,359
|
|
66,069
|
|
|||
|
Prepaid expenses and other
|
7,176
|
|
7,738
|
|
|||
|
Total current assets
|
258,416
|
|
208,224
|
|
|||
|
Property, plant and equipment, at cost
|
861,363
|
|
797,630
|
|
|||
|
Less accumulated depreciation
|
(556,833
|
)
|
(536,905
|
)
|
|||
|
Net property, plant and equipment
|
304,530
|
|
260,725
|
|
|||
|
Goodwill and other intangibles, net
|
189,442
|
|
151,423
|
|
|||
|
Other assets and deferred charges
|
55,573
|
|
30,790
|
|
|||
|
Total assets
|
$
|
807,961
|
|
$
|
651,162
|
|
|
|
Liabilities and Shareholders’ Equity
|
|||||||
|
Current liabilities:
|
|||||||
|
Accounts payable
|
$
|
95,706
|
|
$
|
81,342
|
|
|
|
Accrued expenses
|
38,323
|
|
38,647
|
|
|||
|
Total current liabilities
|
134,029
|
|
119,989
|
|
|||
|
Long-term debt
|
187,250
|
|
95,000
|
|
|||
|
Deferred income taxes
|
25,717
|
|
21,110
|
|
|||
|
Other noncurrent liabilities
|
101,537
|
|
104,280
|
|
|||
|
Total liabilities
|
448,533
|
|
340,379
|
|
|||
|
Commitments and contingencies (Notes 1 and 12)
|
|
|
|||||
|
Shareholders’ equity:
|
|||||||
|
Common stock, no par value (issued and outstanding - 33,030,190 at June 30, 2017 and 32,933,807 at December 31, 2016)
|
33,505
|
|
32,007
|
|
|||
|
Common stock held in trust for savings restoration plan (70,390 shares at June 30, 2017 and 69,622 shares at December 31, 2016)
|
(1,512
|
)
|
(1,497
|
)
|
|||
|
Accumulated other comprehensive income (loss):
|
|||||||
|
Foreign currency translation adjustment
|
(91,296
|
)
|
(93,970
|
)
|
|||
|
Gain on derivative financial instruments
|
825
|
|
863
|
|
|||
|
Pension and other post-retirement benefit adjustments
|
(86,227
|
)
|
(90,127
|
)
|
|||
|
Retained earnings
|
504,133
|
|
463,507
|
|
|||
|
Total shareholders’ equity
|
359,428
|
|
310,783
|
|
|||
|
Total liabilities and shareholders’ equity
|
$
|
807,961
|
|
$
|
651,162
|
|
|
See accompanying notes to financial statements.
2
Tredegar Corporation
(In Thousands, Except Per Share Data)
(Unaudited)
|
Three Months Ended June 30,
|
Six Months Ended June 30,
|
||||||||||||||
|
|
2017
|
2016
|
2017
|
2016
|
|||||||||||
|
Revenues and other items:
|
|||||||||||||||
|
Sales
|
$
|
247,347
|
|
$
|
208,533
|
|
$
|
468,372
|
|
$
|
415,867
|
|
|||
|
Other income (expense), net
|
34,735
|
|
322
|
|
38,022
|
|
1,092
|
|
|||||||
|
282,082
|
|
208,855
|
|
506,394
|
|
416,959
|
|
||||||||
|
Costs and expenses:
|
|||||||||||||||
|
Cost of goods sold
|
197,372
|
|
169,830
|
|
379,220
|
|
332,882
|
|
|||||||
|
Freight
|
7,912
|
|
7,066
|
|
16,218
|
|
14,067
|
|
|||||||
|
Selling, general and administrative
|
21,730
|
|
19,782
|
|
42,224
|
|
39,644
|
|
|||||||
|
Research and development
|
5,014
|
|
4,962
|
|
9,572
|
|
9,939
|
|
|||||||
|
Amortization of intangibles
|
1,652
|
|
990
|
|
2,893
|
|
1,946
|
|
|||||||
|
Interest expense
|
1,642
|
|
947
|
|
2,822
|
|
2,032
|
|
|||||||
|
Asset impairments and costs associated with exit and disposal activities, net of adjustments
|
(271
|
)
|
553
|
|
293
|
|
1,226
|
|
|||||||
|
Total
|
235,051
|
|
204,130
|
|
453,242
|
|
401,736
|
|
|||||||
|
Income before income taxes
|
47,031
|
|
4,725
|
|
53,152
|
|
15,223
|
|
|||||||
|
Income taxes
|
2,827
|
|
1,317
|
|
5,246
|
|
4,533
|
|
|||||||
|
Net income
|
$
|
44,204
|
|
$
|
3,408
|
|
$
|
47,906
|
|
$
|
10,690
|
|
|||
|
Earnings
per share:
|
|||||||||||||||
|
Basic
|
$
|
1.34
|
|
$
|
0.10
|
|
$
|
1.45
|
|
$
|
0.33
|
|
|||
|
Diluted
|
$
|
1.34
|
|
$
|
0.10
|
|
$
|
1.45
|
|
$
|
0.33
|
|
|||
|
Shares used to compute earnings per share:
|
|||||||||||||||
|
Basic
|
32,961
|
|
32,716
|
|
32,941
|
|
32,685
|
|
|||||||
|
Diluted
|
33,051
|
|
32,716
|
|
32,999
|
|
32,685
|
|
|||||||
|
Dividends per share
|
$
|
0.11
|
|
$
|
0.11
|
|
$
|
0.22
|
|
$
|
0.22
|
|
|||
See accompanying notes to financial statements.
3
Tredegar Corporation
Consolidated Statements of Comprehensive Income (Loss)
(In Thousands)
(Unaudited)
|
Three Months Ended June 30,
|
|||||||
|
|
2017
|
2016
|
|||||
|
Net income
|
$
|
44,204
|
|
$
|
3,408
|
|
|
|
Other comprehensive income (loss):
|
|||||||
|
Foreign currency translation adjustment (net of tax of $173 in 2017 and tax of $270 in 2016)
|
(1,958
|
)
|
11,069
|
|
|||
|
Derivative financial instruments adjustment (net of tax benefit of $248 in 2017 and tax benefit of $442 in 2016)
|
(412
|
)
|
755
|
|
|||
|
Amortization of prior service costs and net gains or losses (net of tax of $1,111 in 2017 and tax of $1,211 in 2016)
|
1,950
|
|
2,125
|
|
|||
|
Other comprehensive income (loss)
|
(420
|
)
|
13,949
|
|
|||
|
Comprehensive income (loss)
|
$
|
43,784
|
|
$
|
17,357
|
|
|
|
|
Six Months Ended June 30,
|
||||||
|
|
2017
|
2016
|
|||||
|
Net income
|
$
|
47,906
|
|
$
|
10,690
|
|
|
|
Other comprehensive income (loss):
|
|||||||
|
Foreign currency translation adjustment (net of tax of $230 in 2017 and tax benefit of $230 in 2016)
|
2,674
|
|
23,648
|
|
|||
|
Derivative financial instruments adjustment (net of tax benefit of $24 in 2017 and tax of $598 in 2016)
|
(38
|
)
|
1,017
|
|
|||
|
Amortization of prior service costs and net gains or losses (net of tax of $2,222 in 2017 and tax of $2,066 in 2016)
|
3,900
|
|
4,607
|
|
|||
|
Other comprehensive income (loss)
|
6,536
|
|
29,272
|
|
|||
|
Comprehensive income (loss)
|
$
|
54,442
|
|
$
|
39,962
|
|
|
See accompanying notes to financial statements.
4
Tredegar Corporation
(In Thousands)
(Unaudited)
|
Six Months Ended June 30,
|
|||||||
|
|
2017
|
2016
|
|||||
|
Cash flows from operating activities:
|
|||||||
|
Net income
|
$
|
47,906
|
|
$
|
10,690
|
|
|
|
Adjustments for noncash items:
|
|||||||
|
Depreciation
|
15,993
|
|
13,847
|
|
|||
|
Amortization of intangibles
|
2,893
|
|
1,946
|
|
|||
|
Deferred income taxes
|
2,000
|
|
(3,563
|
)
|
|||
|
Accrued pension and post-retirement benefits
|
5,264
|
|
5,759
|
|
|||
|
(Gain)/loss on investment accounted for under the fair value method
|
(24,800
|
)
|
(1,100
|
)
|
|||
|
(Gain)/loss on asset impairments and divestitures
|
50
|
|
339
|
|
|||
|
Net (gain)/loss on disposal of assets
|
307
|
|
—
|
|
|||
|
Changes in assets and liabilities, net of effects of acquisitions and divestitures:
|
|||||||
|
Accounts and other receivables
|
(20,197
|
)
|
(4,278
|
)
|
|||
|
Inventories
|
(7,261
|
)
|
1,490
|
|
|||
|
Income taxes recoverable/payable
|
(6,120
|
)
|
(1,099
|
)
|
|||
|
Prepaid expenses and other
|
735
|
|
(737
|
)
|
|||
|
Accounts payable and accrued expenses
|
6,178
|
|
(5,554
|
)
|
|||
|
Pension and postretirement benefit plan contributions
|
(2,106
|
)
|
(1,077
|
)
|
|||
|
Other, net
|
1,126
|
|
1,600
|
|
|||
|
Net cash provided by operating activities
|
21,968
|
|
18,263
|
|
|||
|
Cash flows from investing activities:
|
|||||||
|
Capital expenditures
|
(26,692
|
)
|
(19,018
|
)
|
|||
|
Acquisition
|
(87,110
|
)
|
—
|
|
|||
|
Proceeds from the sale of assets and other
|
95
|
|
1,104
|
|
|||
|
Net cash used in investing activities
|
(113,707
|
)
|
(17,914
|
)
|
|||
|
Cash flows from financing activities:
|
|||||||
|
Borrowings
|
148,750
|
|
28,500
|
|
|||
|
Debt principal payments
|
(56,500
|
)
|
(38,500
|
)
|
|||
|
Dividends paid
|
(7,268
|
)
|
(7,213
|
)
|
|||
|
Debt financing costs
|
—
|
|
(2,508
|
)
|
|||
|
Proceeds from exercise of stock options and other
|
695
|
|
(118
|
)
|
|||
|
Net cash provided by (used) in financing activities
|
85,677
|
|
(19,839
|
)
|
|||
|
Effect of exchange rate changes on cash
|
577
|
|
2,831
|
|
|||
|
Decrease in cash and cash equivalents
|
(5,485
|
)
|
(16,659
|
)
|
|||
|
Cash and cash equivalents at beginning of period
|
29,511
|
|
44,156
|
|
|||
|
Cash and cash equivalents at end of period
|
$
|
24,026
|
|
$
|
27,497
|
|
|
See accompanying notes to financial statements.
5
Tredegar Corporation
Consolidated Statement of Shareholders’ Equity
(In Thousands, Except Share and Per Share Data)
(Unaudited)
|
|
|
Accumulated Other
Comprehensive Income (Loss)
|
|
||||||||||||||||||||||||
|
|
Common
Stock
|
Retained
Earnings
|
Trust for
Savings
Restoration
Plan
|
Foreign
Currency
Translation
|
Gain
(Loss) on
Derivative
Financial
Instruments
|
Pension &
Other
Post-retirement
Benefit
Adjust.
|
Total
Shareholders’
Equity
|
||||||||||||||||||||
|
Balance at January 1, 2017
|
$
|
32,007
|
|
$
|
463,507
|
|
$
|
(1,497
|
)
|
$
|
(93,970
|
)
|
$
|
863
|
|
$
|
(90,127
|
)
|
$
|
310,783
|
|
||||||
|
Net income
|
—
|
|
47,906
|
|
—
|
|
—
|
|
—
|
|
—
|
|
47,906
|
|
|||||||||||||
|
Other comprehensive income (loss):
|
|||||||||||||||||||||||||||
|
Foreign currency translation adjustment (net of tax of $230)
|
—
|
|
—
|
|
—
|
|
2,674
|
|
—
|
|
—
|
|
2,674
|
|
|||||||||||||
|
Derivative financial instruments adjustment (net of tax benefit of $24)
|
—
|
|
—
|
|
—
|
|
—
|
|
(38
|
)
|
—
|
|
(38
|
)
|
|||||||||||||
|
Amortization of prior service costs and net gains or losses (net of tax of $2,222)
|
—
|
|
—
|
|
—
|
|
—
|
|
—
|
|
3,900
|
|
3,900
|
|
|||||||||||||
|
Cash dividends declared ($0.22 per share)
|
—
|
|
(7,268
|
)
|
—
|
|
—
|
|
—
|
|
—
|
|
(7,268
|
)
|
|||||||||||||
|
Stock-based compensation expense
|
776
|
|
—
|
|
—
|
|
—
|
|
—
|
|
—
|
|
776
|
|
|||||||||||||
|
Issued upon exercise of stock options & other
|
695
|
|
—
|
|
—
|
|
—
|
|
—
|
|
—
|
|
695
|
|
|||||||||||||
|
Cumulative effect adjustment for adoption of stock-based comp accounting guidance
|
27
|
|
(27
|
)
|
—
|
|
—
|
|
—
|
|
—
|
|
—
|
|
|||||||||||||
|
Tredegar common stock purchased by trust for savings restoration plan
|
—
|
|
15
|
|
(15
|
)
|
—
|
|
—
|
|
—
|
|
—
|
|
|||||||||||||
|
Balance at June 30, 2017
|
$
|
33,505
|
|
$
|
504,133
|
|
$
|
(1,512
|
)
|
$
|
(91,296
|
)
|
$
|
825
|
|
$
|
(86,227
|
)
|
$
|
359,428
|
|
||||||
See accompanying notes to financial statements.
6
TREDEGAR CORPORATION
NOTES TO THE CONSOLIDATED INTERIM FINANCIAL STATEMENTS
(Unaudited)
|
1.
|
In the opinion of management, the accompanying consolidated financial statements of Tredegar Corporation and its subsidiaries (“Tredegar,” “the Company,” “we,” “us” or “our”) contain all adjustments necessary to state fairly, in all material respects, Tredegar’s consolidated financial position as of
June 30, 2017
, the consolidated results of operations for the
three and six
months ended
June 30, 2017
and
2016
, the consolidated cash flows for the
six months
ended
June 30, 2017
and
2016
, and the consolidated changes in shareholders’ equity for the
six months
ended
June 30, 2017
. All such adjustments, unless otherwise detailed in the notes to the consolidated interim financial statements, are deemed to be of a normal, recurring nature.
|
The Company operates on a calendar fiscal year except for the Aluminum Extrusions segment, which operates on a 52/53-week fiscal year basis. As such, the fiscal second quarter for 2017 and 2016 for this segment references 13-week periods ended June 25, 2017 and June 26, 2016, respectively. The Company does not believe the impact of reporting the results of this segment as stated above is material to the consolidated financial results.
The financial position data as of
December 31, 2016
that is included herein was derived from the audited consolidated financial statements provided in the Company’s Annual Report on Form 10-K for the year ended
December 31, 2016
(“
2016
Form 10-K”) but does not include all disclosures required by United States generally accepted accounting principles (“GAAP”). These financial statements should be read in conjunction with the consolidated financial statements and related notes included in the Company’s
2016
Form 10-K. The results of operations for the
three and six
months ended
June 30, 2017
, are not necessarily indicative of the results to be expected for the full year. Certain prior year balances have been reclassified to conform with current year presentation (see Note 13 for additional detail).
|
2.
|
On February 15, 2017, Bonnell Aluminum acquired
100%
of the stock of Futura Industries Corporation (“Futura”) on a net debt-free basis for approximately
$92 million
(the “Initial Purchase Price”). The amount actually funded in cash at the transaction date was approximately
$87.0 million
(the “Initial Cash Funding”), which was the Initial Purchase Price net of preliminary closing adjustments for working capital and seller transaction-related obligations assumed and subsequently paid by Bonnell Aluminum. The acquisition, which was funded using Tredegar’s existing revolving credit facility, was treated as an asset purchase for U.S. federal income tax purposes.
|
Futura, headquartered in Clearfield, Utah, with a national sales presence and particular strength in the western U.S., designs and manufactures a wide range of extruded aluminum products, including branded flooring trims and TSLOTS
TM
, as well as OEM (original equipment manufacturer) components for truck grills, solar panels, fitness equipment and other applications. As a result of this transaction, Futura is now a wholly-owned subsidiary of the William L. Bonnell Company, Inc. (which is a wholly-owned subsidiary of Tredegar) and operates as a division of Bonnell Aluminum, and its results of operations are included in Tredegar’s consolidated financial statements from the date of acquisition.
Under the terms of the transaction,
$5 million
of the Initial Cash Funding was placed in escrow (the “Earnout Escrow”) and will be returned to Bonnell Aluminum if Futura does not achieve a targeted EBITDA level (as defined) for the last eleven months of the fiscal year ending December 2017. At the acquisition date, the Company performed a probability weighted assessment in order to determine the fair value of this contingent asset. The assessment estimated a fair value of
$4.3 million
, which would be returned to Bonnell Aluminum in early 2018, and accordingly, a receivable of
$4.3 million
(“Initial Earnout Receivable”) was recorded by Bonnell Aluminum. In the second quarter of 2017, the Company updated its valuation of this contingent asset, which resulted in a fair value of
$5.0 million
. The receivable was increased to
$5.0 million
, and
$0.7 million
was recognized as income in Other income (expense), net in the Consolidated Statements of Income.
7
The net purchase price for financial reporting purposes was set at approximately
$82.9 million
(the “Adjusted Net Purchase Price”), which was the Initial Cash Funding less the Initial Earnout Receivable and the net settlement of certain post-closing adjustments of
$0.1 million
paid to the seller during the second quarter of 2017. Adjustments to the purchase price were made retrospectively as if the accounting had been completed on the acquisition date. Based upon management’s valuation of the fair value of tangible and intangible assets acquired (net of cash acquired) and liabilities assumed, the allocation of the Adjusted Net Purchase Price is as follows:
|
(in Thousands)
|
|||
|
Accounts receivable
|
$
|
6,680
|
|
|
Inventories
|
10,342
|
|
|
|
Prepaid expenses and other current assets
|
240
|
|
|
|
Property, plant & equipment
|
32,662
|
|
|
|
Identifiable intangible assets:
|
|||
|
Customer relationships
|
24,000
|
|
|
|
Trade names
|
6,700
|
|
|
|
Trade payables & accrued expenses
|
(8,135
|
)
|
|
|
Total identifiable net assets
|
72,489
|
|
|
|
Adjusted Net Purchase Price
|
82,860
|
|
|
|
Goodwill
|
$
|
10,371
|
|
The goodwill and other intangible asset balances associated with this acquisition will be deductible for tax purposes on a straight-line basis over a period of approximately
15
years. For financial reporting purposes, customer relationships are being amortized over
12
years and trade names are being amortized over
13
years. Goodwill is not subject to amortization for financial reporting purposes. Customer relationships were valued using the excess earnings approach. Trade names were valued using a relief-from-royalty approach. The Company does not anticipate marketing Futura’s products under a different brand in light of its strong name recognition and competitive advantage in its target markets.
For the three and six month periods ended
June 30, 2017
(for Futura, the period from the acquisition on February 15, 2017 to
June 30, 2017
), Tredegar’s consolidated results of operations and its Aluminum Extrusions business segment included the following Futura results: sales of
$22.5 million
and
$30.8 million
, respectively, operating profit from ongoing operations of
$2.8 million
and
$3.8 million
, respectively, depreciation and amortization of
$1.4 million
and
$1.9 million
, respectively, and capital expenditures of
$0.5 million
and
$0.9 million
, respectively.
The following unaudited supplemental pro forma data presents Tredegar’s consolidated sales, net income and related earnings per share as if the acquisition of Futura had been consummated at the beginning of 2016, and is not necessarily indicative of the Company’s financial performance if the acquisition had actually been consummated as of that date, or of future performance. The supplemental unaudited pro forma measures for the three and six months ended
June 30,
2017 and 2016 are presented below:
|
Tredegar Pro Forma Results with Futura Acquisition
|
Three Months Ended
|
Six Months Ended
|
|||||||||||||
|
|
June 30,
|
June 30,
|
|||||||||||||
|
(In Thousands, Except Per Share Data)
|
2017
|
2016
|
2017
|
2016
|
|||||||||||
|
Sales
|
$
|
247,347
|
|
$
|
226,849
|
|
$
|
475,383
|
|
$
|
453,510
|
|
|||
|
Net income
|
$
|
44,204
|
|
$
|
4,202
|
|
$
|
47,562
|
|
$
|
12,334
|
|
|||
|
Earnings per share:
|
|||||||||||||||
|
Basic
|
$
|
1.34
|
|
$
|
0.13
|
|
$
|
1.44
|
|
$
|
0.38
|
|
|||
|
Diluted
|
$
|
1.34
|
|
$
|
0.13
|
|
$
|
1.44
|
|
$
|
0.38
|
|
|||
Futura’s pre-acquisition results for the period from January 1 to February 14, 2017, and therefore the pro forma information for 2017 presented above, were adversely impacted by significant disruptions to manufacturing operations and sales caused by the renovation of its anodizing line. The actual accretion to Tredegar’s diluted earnings per share from Futura since the acquisition date was
four cents per share f
or the second quarter of 2017 and
five cents per share
for the first six months of 2017.
8
The Company’s pro forma net income was computed for the periods shown as: (i) the Company’s reported net income, plus (ii) Futura’s historical pre-acquisition period earnings before interest, taxes, depreciation and amortization and excluding one-time purchase accounting and transaction-related expenses, minus (iii) the pro forma pre-acquisition period depreciation and amortization for Futura under purchase accounting for the Company, minus (iv) the pro forma pre-acquisition period interest expense for the Company applied at an annual rate of
3.0%
to the
$87.0 million
Initial Cash Funding, minus (v) the pro forma pre-acquisition period income taxes applied at a rate of
39.1%
to the pro forma pre-acquisition earnings before income taxes computed from items (ii) through (iv).
|
3.
|
Plant shutdowns, asset impairments, restructurings and other items are shown in the net sales and operating profit by segment table in Note 10 and are also included in “Asset impairments and costs associated with exit and disposal activities, net of adjustments” in the consolidated statements of income, unless otherwise noted below.
|
Plant shutdowns, asset impairments, restructurings and other items in the
second quarter
of
2017
include:
|
•
|
Pretax income of
$11.9 million
related to the settlement of an escrow arrangement established upon the acquisition of Terphane in 2011 (included in “Other income (expense), net” in the consolidated statements of income). In settling the escrow arrangement, the Company assumed the risk of the claims (and associated legal fees) against which the escrow previously secured the Company. While the ultimate amount of such claims is unknown, the Company believes that it is reasonably possible that it could be liable for some portion of these claims, and currently estimates the amount of such future claims at approximately
$3.5 million
;
|
|
•
|
Pretax charges of
$1.0 million
related to estimated excess costs associated with the ramp-up of new product offerings and additional expenses related to strategic capacity expansion projects by PE Films of
$0.9 million
and by Bonnell of
$0.1 million
(included in “Cost of goods sold” in the consolidated statements of income);
|
|
•
|
Pretax income of
$0.9 million
related to the explosion that occurred in the second quarter of 2016 at the aluminum extrusions manufacturing facility in Newnan, Georgia, for the expected recovery of excess production costs of
$0.6 million
incurred in 2016 and
$0.3 million
incurred in the first quarter of 2017 for which recovery from insurance carriers was not previously considered to be reasonably assured (included in “Cost of goods sold” in the consolidated statements of income);
|
|
•
|
Pretax income of
$0.7 million
related to the fair valuation of an earnout provision from the acquisition of Futura (included in “Other income (expense), net” in the consolidated statements of income);
|
|
•
|
Pretax charges of
$0.6 million
associated with a business development project (included in “Selling, general and administrative expense” in the consolidated statements of income); and
|
|
•
|
Pretax charges of
$0.3 million
associated with the consolidation of domestic PE Films’ manufacturing facilities, which consists of facility consolidation-related expenses of
$0.2 million
and accelerated depreciation of
$0.1 million
(included in “Cost of goods sold” in the consolidated statements of income), offset by pretax income of
$0.3 million
related to a reduction of severance and other employee-related accrued costs.
|
Plant shutdowns, asset impairments, restructurings and other items in the first
six months
of
2017
include:
|
•
|
Pretax income of
$11.9 million
related to the settlement of an escrow arrangement established upon the acquisition of Terphane in 2011 (included in “Other income (expense), net” in the consolidated statements of income). In settling the escrow arrangement, the Company assumed the risk of the claims (and associated legal fees) against which the escrow previously secured the Company. While the ultimate amount of such claims is unknown, the Company believes that it is reasonably possible that it could be liable for some portion of these claims, and currently estimates the amount of such future claims at approximately
$3.5 million
;
|
|
•
|
Pretax charges of
$3.3 million
related to the acquisition of Futura, i) associated with accounting adjustments of
$1.7 million
made to the value of inventory sold by Aluminum Extrusions after its acquisition of Futura (included in “Cost of goods sold” in the consolidated statements of income), ii) acquisition costs of
$1.5 million
and, iii) integration costs of
$0.1 million
(included in “Selling, general and administrative expenses” in the consolidated statements of income), offset by pretax income of
$0.7 million
related to the fair valuation of an earnout provision (included in “Other income (expense), net” in the consolidated statements of income);
|
|
•
|
Pretax charges of
$2.8 million
related to estimated excess costs associated with the ramp-up of new product offerings and additional expenses related to strategic capacity expansion projects by PE Films of
$2.4 million
|
9
and by Aluminum Extrusions of
$0.4 million
(included in “Cost of goods sold” in the consolidated statements of income);
|
•
|
Pretax income of
$0.5 million
related to the explosion that occurred in the second quarter of 2016 at the aluminum extrusions manufacturing facility in Newnan, Georgia, which includes the expected recovery of excess production costs of
$0.6 million
incurred in 2016 for which recovery from insurance carriers was not previously considered to be reasonably assured (included in “Cost of goods sold” in the consolidated statements of income), partially offset by legal and consulting fees of
$0.1 million
(included in “Selling, general and administrative expenses” in the consolidated statements of income).
|
|
•
|
Pretax charges of
$0.7 million
associated with the consolidation of domestic PE Films’ manufacturing facilities, which consists of asset impairments of
$0.1 million
, accelerated depreciation of
$0.2 million
(included in “Cost of goods sold” in the consolidated statements of income) and other facility consolidation-related expenses of
$0.4 million
(
$0.3 million
included in “Cost of goods sold” in the consolidated statements of income), offset by pretax income of
$0.1 million
related to a reduction of severance and other employee-related accrued costs;
|
|
•
|
Pretax charges of
$0.3 million
related to expected future environmental costs at the aluminum extrusions manufacturing facility in Carthage, Tennessee (included in “Cost of goods sold” in the consolidated statements of income);
|
|
•
|
Pretax charges of
$0.9 million
associated with a business development project (included in “Selling, general and administrative expense” in the consolidated statements of income); and
|
|
•
|
Pretax charges of
$0.3 million
for severance and other employee-related costs associated with restructurings in Corporate.
|
Plant shutdowns, asset impairments, restructurings and other charges in the
second quarter
of
2016
include:
|
•
|
Pretax charges of
$1.4 million
associated with the consolidation of domestic PE Films’ manufacturing facilities, which includes severance and other employee-related costs of
$0.4 million
, asset impairments of
$0.1 million
, accelerated depreciation of
$0.1 million
(included in “Cost of goods sold” in the consolidated statements of income) and other facility consolidation-related expenses of
$0.8 million
(
$0.7 million
is included in “Cost of goods sold” in the consolidated statements of income); and
|
|
•
|
Pretax charges of
$0.6 million
related to an explosion that occurred in the second quarter of 2016 at the aluminum extrusions manufacturing facility in Newnan, Georgia (included in “Selling, general and administrative expense” in the consolidated statements of income).
|
Plant shutdowns, asset impairments, restructurings and other charges in the first
six months
of
2016
include:
|
•
|
Pretax charges of
$2.5 million
associated with the consolidation of domestic PE Films’ manufacturing facilities, which includes severance and other employee-related costs of
$0.7 million
, asset impairments of
$0.3 million
, accelerated depreciation of
$0.2 million
(included in “Cost of goods sold” in the consolidated statements of income) and other facility consolidation-related expenses of
$1.3 million
(
$1.1 million
is included in “Cost of goods sold” in the consolidated statements of income);
|
|
•
|
Pretax charges of
$0.6 million
related to an explosion that occurred in the second quarter of 2016 at the aluminum extrusions manufacturing facility in Newnan, Georgia (included in “Selling, general and administrative expense” in the consolidated statements of income); and
|
|
•
|
Pretax charges of
$0.4 million
associated with a business development project (included in “Selling, general and administrative expense” in the consolidated statements of income).
|
Results in the
second quarter
and first
six months
of
2017
include unrealized gains of
$21.5 million
(
$15.7 million
after taxes) and
$24.8 million
(
$18.2 million
after taxes), respectively, compared to unrealized gains of
$0.3 million
(
$0.2 million
after taxes) and
$1.1 million
(
$0.8 million
after taxes), in the
second quarter
and first
six months
of
2016
, respectively, on the Company’s investment in kaleo, Inc. (“kaléo”), which is accounted for under the fair value method (included in “Other income (expense), net” in the consolidated statements of income). The change in the estimated fair value of the Company’s holding in kaléo was based primarily on changes in projected future cash flows that are discounted at
45%
for their high degree of risk. See Note 7 for additional information on investments.
10
A
reconciliation of the beginning and ending balances of accrued expenses associated with
exit and disposal activities and charges associated with asset impairments
and reported as “Asset impairments and costs associated with exit and disposal activities, net of adjustments” in the consolidated statements of income for the
six months ended
June 30, 2017
is as follows:
|
(In Thousands)
|
Severance
|
Asset Impairments
|
Other (a)
|
Total
|
|||||||||||
|
Balance at January 1, 2017
|
$
|
1,854
|
|
$
|
—
|
|
$
|
554
|
|
$
|
2,408
|
|
|||
|
Changes in 2017:
|
|||||||||||||||
|
Charges
|
172
|
|
50
|
|
71
|
|
293
|
|
|||||||
|
Cash spent
|
(482
|
)
|
—
|
|
(76
|
)
|
(558
|
)
|
|||||||
|
Charges against assets
|
—
|
|
(50
|
)
|
—
|
|
(50
|
)
|
|||||||
|
Balance at June 30, 2017
|
$
|
1,544
|
|
$
|
—
|
|
$
|
549
|
|
$
|
2,093
|
|
|||
|
(a) Other includes other facility consolidation-related costs associated with the consolidation of North American PE Films manufacturing facilities and other shutdown-related costs associated with the shutdown and sale of the Company’s aluminum extrusions manufacturing facility in Kentland, Indiana.
|
|||||||||||||||
In July 2015, the Company announced its intention to consolidate its domestic production for PE Films by restructuring the operations in its manufacturing facility in Lake Zurich, Illinois. Efforts to transition domestic production from the Lake Zurich manufacturing facility have required various machinery upgrades and equipment transfers to its other manufacturing facilities. The Company anticipates that these activities will be completed in the fourth quarter of 2017. Total pretax cash expenditures associated with this restructuring and consolidation are expected to be approximately $17 million over the project period, and once complete, annual pretax cash cost savings are expected to be approximately $5-6 million.
Total expenses associated with the North American facility consolidation project were
$0.6 million
in the first
six months
of
2017
(included in “Cost of goods sold” in the consolidated statements of income). As of
June 30, 2017
, total expenses incurred since the project began in the third quarter of 2015 were
$7.1 million
.
Total estimated cash expenditures of $17 million over the project period include the following:
|
•
|
Cash outlays associated with previously discussed exit and disposal expenses of approximately
$5 million
, including additional operating expenses of approximately
$1 million
associated with customer product qualifications on upgraded and transferred production lines;
|
|
•
|
Capital expenditures associated with equipment upgrades at other PE Films manufacturing facilities in the U.S. of approximately
$11 million
; and
|
|
•
|
Cash incentives of approximately
$1 million
in connection with meeting safety and quality standards while production ramps down at the Lake Zurich manufacturing facility.
|
Cash expenditures for the North American facility consolidation project were
$0.5 million
in the first
six months
of
2017
, which includes capital expenditures of
$0.1 million
. As of
June 30, 2017
, total cash expenditures since the project began in the third quarter of 2015 were
$14.4 million
, which includes
$11.2 million
for capital expenditures.
|
4.
|
The components of inventories are as follows:
|
|
June 30,
|
December 31,
|
|||||||
|
(In Thousands)
|
2017
|
2016
|
||||||
|
Finished goods
|
$
|
22,602
|
|
$
|
16,215
|
|
||
|
Work-in-process
|
10,598
|
|
8,590
|
|
||||
|
Raw materials
|
32,888
|
|
23,733
|
|
||||
|
Stores, supplies and other
|
18,271
|
|
17,531
|
|
||||
|
Total
|
$
|
84,359
|
|
$
|
66,069
|
|
||
11
|
5.
|
Basic earnings per share is computed by dividing net income by the weighted average number of shares of common stock outstanding. Diluted earnings per share is computed by dividing net income by the weighted average common and potentially dilutive common equivalent shares outstanding, determined as follows:
|
|
Three Months Ended
|
Six Months Ended
|
||||||||||
|
|
June 30,
|
June 30,
|
|||||||||
|
(In Thousands)
|
2017
|
2016
|
2017
|
2016
|
|||||||
|
Weighted average shares outstanding used to compute basic earnings per share
|
32,961
|
|
32,716
|
|
32,941
|
|
32,685
|
|
|||
|
Incremental dilutive shares attributable to stock options and restricted stock
|
90
|
|
—
|
|
58
|
|
—
|
|
|||
|
Shares used to compute diluted earnings per share
|
33,051
|
|
32,716
|
|
32,999
|
|
32,685
|
|
|||
Incremental shares attributable to stock options and restricted stock are computed under the treasury stock method using the average market price during the related period. For the three and
six months ended
June 30, 2017
, average out-of-the-money options to purchase shares that were excluded from the calculation of incremental shares attributable to stock options and restricted stock were
416,941
and
340,268
, respectively. For the three and
six months ended
June 30, 2016
, average out-of-the-money options to purchase shares that were excluded from the calculation of incremental shares attributable to stock options and restricted stock were
673,882
and
717,955
, respectively.
|
6.
|
The following table summarizes the after-tax changes in accumulated other comprehensive income (loss) for the
six months ended
June 30, 2017
:
|
|
(In Thousands)
|
Foreign
currency
translation
adjustment
|
Gain (loss) on
derivative
financial
instruments
|
Pension and
other
post-retirement
benefit
adjustments
|
Total
|
|||||||||||
|
Beginning balance, January 1, 2017
|
$
|
(93,970
|
)
|
$
|
863
|
|
$
|
(90,127
|
)
|
$
|
(183,234
|
)
|
|||
|
Other comprehensive income (loss) before reclassifications
|
2,674
|
|
335
|
|
—
|
|
3,009
|
|
|||||||
|
Amounts reclassified from accumulated other comprehensive income (loss)
|
—
|
|
(373
|
)
|
3,900
|
|
3,527
|
|
|||||||
|
Net other comprehensive income (loss) - current period
|
2,674
|
|
(38
|
)
|
3,900
|
|
6,536
|
|
|||||||
|
Ending balance, June 30, 2017
|
$
|
(91,296
|
)
|
$
|
825
|
|
$
|
(86,227
|
)
|
$
|
(176,698
|
)
|
|||
The following table summarizes the after-tax changes in accumulated other comprehensive income (loss) for the
six months ended
June 30, 2016
:
|
(In Thousands)
|
Foreign
currency translation adjustment |
Gain (loss) on
derivative financial instruments |
Pension and
other post-retirement benefit adjustments |
Total
|
|||||||||||
|
Beginning balance, January 1, 2016
|
$
|
(112,807
|
)
|
$
|
(373
|
)
|
$
|
(95,539
|
)
|
$
|
(208,719
|
)
|
|||
|
Other comprehensive income (loss) before reclassifications
|
23,648
|
|
86
|
|
—
|
|
23,734
|
|
|||||||
|
Amounts reclassified from accumulated other comprehensive income (loss)
|
—
|
|
931
|
|
4,607
|
|
5,538
|
|
|||||||
|
Net other comprehensive income (loss) - current period
|
23,648
|
|
1,017
|
|
4,607
|
|
29,272
|
|
|||||||
|
Ending balance, June 30, 2016
|
$
|
(89,159
|
)
|
$
|
644
|
|
$
|
(90,932
|
)
|
$
|
(179,447
|
)
|
|||
12
Reclassifications of balances out of accumulated other comprehensive income (loss) into net income (loss) for the three months ended
June 30, 2017
are summarized as follows:
|
(In Thousands)
|
Amount
reclassified from other comprehensive income (loss) |
Location of gain
(loss) reclassified from accumulated other comprehensive income (loss) to net income (loss) |
|||
|
Gain (loss) on derivative financial instruments:
|
|||||
|
Aluminum future contracts, before taxes
|
$
|
321
|
|
Cost of sales
|
|
|
Foreign currency forward contracts, before taxes
|
16
|
|
Cost of sales
|
||
|
Total, before taxes
|
337
|
|
|||
|
Income tax expense (benefit)
|
125
|
|
Income taxes
|
||
|
Total, net of tax
|
$
|
212
|
|
||
|
Amortization of pension and other post-retirement benefits:
|
|||||
|
Actuarial gain (loss) and prior service costs, before taxes
|
$
|
(3,061
|
)
|
(a)
|
|
|
Income tax expense (benefit)
|
(1,111
|
)
|
Income taxes
|
||
|
Total, net of tax
|
$
|
(1,950
|
)
|
||
|
(a)
|
This component of accumulated other comprehensive income (loss) is included in the computation of net periodic pension cost (see Note 9 for additional detail).
|
Reclassifications of balances out of accumulated other comprehensive income (loss) into net income (loss) for the
six months ended
June 30, 2017
are summarized as follows:
|
(In Thousands)
|
Amount
reclassified from other comprehensive income (loss) |
Location of gain
(loss) reclassified from accumulated other comprehensive income (loss) to net income (loss) |
|||
|
Gain (loss) on derivative financial instruments:
|
|||||
|
Aluminum future contracts, before taxes
|
$
|
554
|
|
Cost of sales
|
|
|
Foreign currency forward contracts, before taxes
|
31
|
|
Cost of sales
|
||
|
Total, before taxes
|
585
|
|
|||
|
Income tax expense (benefit)
|
212
|
|
Income taxes
|
||
|
Total, net of tax
|
$
|
373
|
|
||
|
Amortization of pension and other post-retirement benefits:
|
|||||
|
Actuarial gain (loss) and prior service costs, before taxes
|
$
|
(6,122
|
)
|
(a)
|
|
|
Income tax expense (benefit)
|
(2,222
|
)
|
Income taxes
|
||
|
Total, net of tax
|
$
|
(3,900
|
)
|
||
|
(a)
|
This component of accumulated other comprehensive income (loss) is included in the computation of net periodic pension cost (see Note 9 for additional detail).
|
13
Reclassifications of balances out of accumulated other comprehensive income (loss) into net income (loss) for the three months ended
June 30, 2016
are summarized as follows:
|
(In Thousands)
|
Amount
reclassified from other comprehensive income (loss) |
Location of gain
(loss) reclassified from accumulated other comprehensive income (loss) to net income (loss) |
|||
|
Gain (loss) on derivative financial instruments:
|
|||||
|
Aluminum future contracts, before taxes
|
$
|
(525
|
)
|
Cost of sales
|
|
|
Foreign currency forward contracts, before taxes
|
16
|
|
Cost of sales
|
||
|
Total, before taxes
|
(509
|
)
|
|||
|
Income tax expense (benefit)
|
(182
|
)
|
Income taxes
|
||
|
Total, net of tax
|
$
|
(327
|
)
|
||
|
Amortization of pension and other post-retirement benefits:
|
|||||
|
Actuarial gain (loss) and prior service costs, before taxes
|
$
|
(3,336
|
)
|
(a)
|
|
|
Income tax expense (benefit)
|
(1,211
|
)
|
Income taxes
|
||
|
Total, net of tax
|
$
|
(2,125
|
)
|
||
|
(a)
|
This component of accumulated other comprehensive income (loss) is included in the computation of net periodic pension cost (see Note 9 for additional detail).
|
Reclassifications of balances out of accumulated other comprehensive income (loss) into net income (loss) for the
six months
ended
June 30, 2016
are summarized as follows:
|
(In Thousands)
|
Amount
reclassified from other comprehensive income (loss) |
Location of gain
(loss) reclassified from accumulated other comprehensive income (loss) to net income (loss) |
|||
|
Gain (loss) on derivative financial instruments:
|
|||||
|
Aluminum future contracts, before taxes
|
$
|
(1,509
|
)
|
Cost of sales
|
|
|
Foreign currency forward contracts, before taxes
|
31
|
|
Cost of sales
|
||
|
Total, before taxes
|
(1,478
|
)
|
|||
|
Income tax expense (benefit)
|
(547
|
)
|
Income taxes
|
||
|
Total, net of tax
|
$
|
(931
|
)
|
||
|
Amortization of pension and other post-retirement benefits:
|
|||||
|
Actuarial gain (loss) and prior service costs, before taxes
|
$
|
(6,673
|
)
|
(a)
|
|
|
Income tax expense (benefit)
|
(2,066
|
)
|
Income taxes
|
||
|
Total, net of tax
|
$
|
(4,607
|
)
|
||
|
(a)
|
This component of accumulated other comprehensive income (loss) is included in the computation of net periodic pension cost (see Note 9 for additional detail).
|
|
7.
|
In August 2007 and December 2008, the Company made an aggregate investment of
$7.5 million
in kaléo, a privately held specialty pharmaceutical company dedicated to building innovative solutions for serious and life-threatening medical conditions. Tredegar’s ownership interest on a fully diluted basis was approximately
20%
at
June 30, 2017
, and the investment is accounted for under the fair value method. At the time of the initial investment, the Company elected the fair value option over the equity method of accounting since its investment objectives were similar to those of venture capitalists, which typically do not have controlling financial interests.
|
14
The estimated fair value of the investment in kaléo (also the carrying value, which is included in “Other assets and deferred charges” in the consolidated balance sheets) was
$45.0 million
at
June 30, 2017
and
$20.2 million
at
December 31, 2016
. Unrealized gains of
$21.5 million
and
$0.3 million
were recognized in the
second quarter
of
2017
and
2016
, respectively. Unrealized gains of
$24.8 million
and
$1.1 million
were recognized in the first
six months
of
2017
and
2016
, respectively. Unrealized gains (losses) associated with this investment are included in “Other income (expense), net” in the consolidated statements of income and separately stated in the net sales and operating profit by segment table in Note 10.
The change in the estimated fair value of the Company’s holding in kaléo in the
second quarter
of
2017
primarily related to recent favorable operating results and projections. Kaléo’s stock is not publicly traded. In addition, kaléo has not completed a full year of operations since the re-launch of its Auvi-Q
®
product during the first quarter of 2017, including the key third quarter back-to-school season. The valuation estimate in this situation is more of an art than a science, and while performed in good faith, is based on projection assumptions or Level 3 inputs that have a wide range of possible outcomes. Consequently, the present value of kaléo’s projected future cash flows is determined at a discount rate of
45%
for their high degree of risk. Ultimately, the true value of the Company’s ownership interest in kaléo will be determined if and when a liquidity event occurs, and the ultimate value could be materially different from the
$45.0 million
estimated fair value reflected in the Company’s financial statements at
June 30, 2017
.
In addition to the impact on valuation of the possible changes in assumptions, Level 3 inputs and projections from changes in business conditions, the fair market valuation of the Company’s interest in kaléo is sensitive to changes in the weighted average cost of capital used to discount cash flow projections. The weighted average cost of capital used in the fair market valuation of Tredegar’s interest in kaléo was
45%
at both
June 30, 2017
and
December 31, 2016
. At
June 30, 2017
, the effect of a 500 basis point decrease in the weighted average cost of capital assumption would have increased the fair value of the Company’s interest in kaléo by approximately
$9 million
, and a 500 basis point increase in the weighted average cost of capital assumption would have decreased the fair value of the Company’s interest by approximately
$8 million
.
Had the Company not elected to account for its investment under the fair value method, it would have been required to use the equity method of accounting. The condensed balance sheets for kaléo at
June 30, 2017
and
December 31, 2016
and condensed statements of operations for the
three and six
months ended
June 30, 2017
and
2016
, as reported to the Company by kaléo, are provided below:
|
(In Thousands)
|
June 30, 2017
|
December 31, 2016
|
|
June 30, 2017
|
December 31, 2016
|
|||||||||||
|
Assets:
|
Liabilities & Equity:
|
|||||||||||||||
|
Cash & short-term investments
|
$
|
108,740
|
|
$
|
102,329
|
|
||||||||||
|
Restricted cash
|
30
|
|
31
|
|
Current liabilities
|
$
|
97,258
|
|
$
|
50,134
|
|
|||||
|
Other current assets
|
51,125
|
|
15,391
|
|
Long term debt, net
|
143,692
|
|
143,380
|
|
|||||||
|
Property & equipment
|
11,157
|
|
13,011
|
|
Other noncurrent liabilities
|
828
|
|
822
|
|
|||||||
|
Other long-term assets
|
510
|
|
472
|
|
Equity
|
(70,216
|
)
|
(63,102
|
)
|
|||||||
|
Total assets
|
$
|
171,562
|
|
$
|
131,234
|
|
Total liabilities & equity
|
$
|
171,562
|
|
$
|
131,234
|
|
|||
|
Three Months Ended June 30,
|
Six Months Ended June 30,
|
||||||||||||||
|
(In Thousands)
|
2017
|
2016
|
2017
|
2016
|
|||||||||||
|
Revenues
|
$
|
67,451
|
|
$
|
15,020
|
|
$
|
89,939
|
|
$
|
11,970
|
|
|||
|
Cost of goods sold, R&D and SG&A expenses
before depreciation & amortization
|
(52,071
|
)
|
(15,903
|
)
|
(85,339
|
)
|
(31,394
|
)
|
|||||||
|
Depreciation & amortization
|
(1,241
|
)
|
(1,437
|
)
|
(2,478
|
)
|
(2,199
|
)
|
|||||||
|
Operating income (loss)
|
14,139
|
|
(2,320
|
)
|
2,122
|
|
(21,623
|
)
|
|||||||
|
Gain on contract termination
|
—
|
|
58
|
|
—
|
|
18,075
|
|
|||||||
|
Net interest expense and other net
|
(4,815
|
)
|
(4,844
|
)
|
(9,641
|
)
|
(9,688
|
)
|
|||||||
|
Income tax benefit (expense)
|
(490
|
)
|
—
|
|
(490
|
)
|
(9
|
)
|
|||||||
|
Net income (loss)
|
$
|
8,834
|
|
$
|
(7,106
|
)
|
$
|
(8,009
|
)
|
$
|
(13,245
|
)
|
|||
The Company’s investment in the Harbinger Capital Partners Special Situations Fund, L.P. (“Harbinger Fund”) had a carrying value (included in “Other assets and deferred charges”) of
$1.7 million
at
June 30, 2017
and
December 31, 2016
. The carrying value at
June 30, 2017
reflected Tredegar’s cost basis in its investment in the
15
Harbinger Fund, net of total withdrawal proceeds received and unrealized losses. No withdrawal proceeds were received in the first
six months
of
2016
or 2017. The timing and amount of future installments of withdrawal proceeds, which commenced in August 2010, were not known as of
June 30, 2017
. Gains on the Company’s investment in the Harbinger Fund will be recognized when the amounts expected to be collected from any withdrawal from the investment are known, which will likely be when cash in excess of the remaining carrying value is received. Losses will be recognized when management believes it is probable that future withdrawal proceeds will not exceed the remaining carrying value.
|
8.
|
Tredegar uses derivative financial instruments for the purpose of hedging margin exposure from fixed-price forward sales contracts in Aluminum Extrusions and currency exchange rate exposures that exist as part of ongoing PE Films and Flexible Packaging Films business operations. These derivative financial instruments are designated as and qualify as cash flow hedges and are recognized in the consolidated balance sheet at fair value. The fair value of derivative instruments recorded on the consolidated balance sheets are based upon Level 2 inputs. If individual derivative instruments with the same counterparty can be settled on a net basis, the Company records the corresponding derivative fair values as a net asset or net liability.
|
In the normal course of business, Aluminum Extrusions enters into fixed-price forward sales contracts with certain customers for the future sale of fixed quantities of aluminum extrusions at scheduled intervals. In order to hedge margin exposure created from the fixing of future sales prices relative to volatile raw material (aluminum) costs, Aluminum Extrusions enters into a combination of forward purchase commitments and futures contracts to acquire or hedge aluminum, based on the scheduled purchases for the firm sales commitments. The fixed-price firm sales commitments and related hedging instruments generally have durations of not more than 12 months, and the notional amount of aluminum futures contracts that hedged future purchases of aluminum to meet fixed-price forward sales contract obligations was
$8.1 million
(
8.9 million
pounds of aluminum) at
June 30, 2017
and
$8.0 million
(
9.6 million
pounds of aluminum) at
December 31, 2016
.
The table below summarizes the location and gross amounts of aluminum futures contract fair values in the consolidated balance sheets as of
June 30, 2017
and
December 31, 2016
:
|
|
June 30, 2017
|
December 31, 2016
|
|||||||||
|
(In Thousands)
|
Balance Sheet
Account
|
Fair
Value
|
Balance Sheet
Account
|
Fair
Value
|
|||||||
|
Derivatives Designated as Hedging Instruments
|
|||||||||||
|
Asset derivatives:
Aluminum futures contracts |
Prepaid expenses and other
|
$
|
411
|
|
Prepaid expenses and other
|
$
|
308
|
|
|||
|
Liability derivatives:
Aluminum futures contracts |
Prepaid expenses and other
|
$
|
(170
|
)
|
Prepaid expenses and other
|
$
|
(37
|
)
|
|||
|
Net asset (liability)
|
$
|
241
|
|
$
|
271
|
|
|||||
In the event that a counterparty to an aluminum fixed-price forward sales contract chooses not to take delivery of its aluminum extrusions, the customer is contractually obligated to compensate Aluminum Extrusions for any losses on the related aluminum futures and/or forward contracts through the date of cancellation.
These derivative contracts involve elements of market risk that are not reflected on the consolidated balance sheet, including the risk of dealing with counterparties and their ability to meet the terms of the contracts. The counterparties to any forward purchase commitments are major aluminum brokers and suppliers, and the counterparties to any aluminum futures contracts are major financial institutions. Fixed-price forward sales contracts are only made available to the best and most credit-worthy customers. The counterparties to our foreign currency futures and zero-cost collar contracts are major financial institutions.
16
The effect on net income (loss) and other comprehensive income (loss) of derivative instruments classified as cash flow hedges and described in the previous paragraphs for the
three and six
month periods ended
June 30, 2017
and
2016
is summarized in the table below:
|
(In Thousands)
|
Cash Flow Derivative Hedges
|
||||||||||||||
|
|
Aluminum Futures Contracts
|
Foreign Currency Forwards
|
|||||||||||||
|
|
Three Months Ended June 30,
|
||||||||||||||
|
|
2017
|
2016
|
2017
|
2016
|
|||||||||||
|
Amount of pretax gain (loss) recognized in other comprehensive income (loss)
|
$
|
(322
|
)
|
$
|
686
|
|
$
|
—
|
|
$
|
—
|
|
|||
|
Location of gain (loss) reclassified from accumulated other comprehensive income (loss) into net income (loss) (effective portion)
|
Cost of
sales |
|
Cost of
sales |
|
Cost of
sales |
|
Cost of
sales |
|
|||||||
|
Amount of pretax gain (loss) reclassified from accumulated other comprehensive income (loss) to net income (loss) (effective portion)
|
$
|
321
|
|
$
|
(525
|
)
|
$
|
16
|
|
$
|
16
|
|
|||
|
|
Aluminum Futures Contracts
|
Foreign Currency Forwards
|
|||||||||||||
|
|
Six Months Ended June 30,
|
||||||||||||||
|
|
2017
|
2016
|
2017
|
2016
|
|||||||||||
|
Amount of pre-tax gain (loss) recognized in other comprehensive income (loss)
|
$
|
524
|
|
$
|
137
|
|
$
|
—
|
|
$
|
—
|
|
|||
|
Location of gain (loss) reclassified from accumulated other comprehensive income (loss) into net income (loss) (effective portion)
|
Cost of
sales |
|
Cost of
sales |
|
Cost of
sales |
|
Cost of
sales |
|
|||||||
|
Amount of pre-tax gain (loss) reclassified from accumulated other comprehensive income (loss) to net income (loss) (effective portion)
|
$
|
554
|
|
$
|
(1,509
|
)
|
$
|
31
|
|
$
|
31
|
|
|||
As of
June 30, 2017
, the Company expects
$0.2 million
of unrealized after-tax gains on derivative instruments reported in accumulated other comprehensive income (loss) to be reclassified to earnings within the next 12 months. For the
three and six
month periods ended
June 30, 2017
and
2016
, net gains or losses realized, from previously unrealized net gains or losses on hedges that had been discontinued, were not material.
17
|
9.
|
The Company sponsors noncontributory defined benefit (pension) plans covering certain current and former employees. The plan for salaried and hourly employees currently in effect is based on a formula using the participant’s years of service and compensation or using the participant’s years of service and a dollar amount. The plan was closed to new participants and pay for active plan participants for benefit calculations was frozen as of December 31, 2007. With the exception of plan participants at one of Tredegar’s U.S. manufacturing facilities, the plan no longer accrues benefits associated with crediting employees for service, thereby freezing future benefits under the plan.
|
The components of net periodic benefit cost for the pension and other post-retirement benefit programs reflected in consolidated results are shown below:
|
Pension Benefits
|
Other Post-Retirement Benefits
|
||||||||||||||
|
|
Three Months Ended June 30,
|
Three Months Ended June 30,
|
|||||||||||||
|
(In Thousands)
|
2017
|
2016
|
2017
|
2016
|
|||||||||||
|
Service cost
|
$
|
58
|
|
$
|
52
|
|
$
|
9
|
|
$
|
10
|
|
|||
|
Interest cost
|
3,164
|
|
3,365
|
|
77
|
|
84
|
|
|||||||
|
Expected return on plan assets
|
(3,737
|
)
|
(3,979
|
)
|
—
|
|
—
|
|
|||||||
|
Amortization of prior service costs, gains or losses and net transition asset
|
3,122
|
|
3,384
|
|
(62
|
)
|
(47
|
)
|
|||||||
|
Net periodic benefit cost
|
$
|
2,607
|
|
$
|
2,822
|
|
$
|
24
|
|
$
|
47
|
|
|||
|
Pension Benefits
|
Other Post-Retirement Benefits
|
||||||||||||||
|
|
Six Months Ended June 30,
|
Six Months Ended June 30,
|
|||||||||||||
|
|
2017
|
2016
|
2017
|
2016
|
|||||||||||
|
Service cost
|
$
|
116
|
|
$
|
124
|
|
$
|
18
|
|
$
|
21
|
|
|||
|
Interest cost
|
6,328
|
|
6,730
|
|
153
|
|
169
|
|
|||||||
|
Expected return on plan assets
|
(7,473
|
)
|
(7,957
|
)
|
—
|
|
—
|
|
|||||||
|
Amortization of prior service costs, (gains) losses and net transition asset
|
6,245
|
|
6,768
|
|
(123
|
)
|
(95
|
)
|
|||||||
|
Net periodic benefit cost
|
$
|
5,216
|
|
$
|
5,665
|
|
$
|
48
|
|
$
|
95
|
|
|||
Pension and other post-retirement liabilities were
$93.0 million
and
$96.0 million
at
June 30, 2017
and
December 31, 2016
, respectively (
$0.6 million
included in “Accrued expenses” at
June 30, 2017
and
December 31, 2016
, with the remainder included in “Other noncurrent liabilities” in the consolidated balance sheets). The Company’s required contributions are expected to be approximately
$6 million
in
2017
. Contributions to the pension plan during the first
six months
of
2017
were
$1.9 million
. Tredegar funds its other post-retirement benefits (life insurance and health benefits) on a claims-made basis, which the Company anticipates will be consistent with amounts paid for the year ended
December 31, 2016
, or
$0.3 million
.
|
10.
|
The Company’s business segments are PE Films, Flexible Packaging and Aluminum Extrusions. Information by business segment is reported below. There are no accounting transactions between segments and no allocations to segments. Net sales (sales less freight) and operating profit from ongoing operations are the measures of sales and operating profit used by the chief operating decision maker for purposes of assessing performance.
|
18
The following table presents net sales and operating profit by segment for the
three and six
-month periods ended
June 30, 2017
and
2016
:
|
Three Months Ended June 30,
|
Six Months Ended June 30,
|
||||||||||||||
|
(In Thousands)
|
2017
|
2016
|
2017
|
2016
|
|||||||||||
|
Net Sales
|
|||||||||||||||
|
PE Films
|
$
|
89,639
|
|
$
|
80,813
|
|
$
|
176,050
|
|
$
|
169,295
|
|
|||
|
Flexible Packaging Films
|
26,588
|
|
27,207
|
|
53,297
|
|
53,585
|
|
|||||||
|
Aluminum Extrusions
|
123,208
|
|
93,447
|
|
222,807
|
|
178,920
|
|
|||||||
|
Total net sales
|
239,435
|
|
201,467
|
|
452,154
|
|
401,800
|
|
|||||||
|
Add back freight
|
7,912
|
|
7,066
|
|
16,218
|
|
14,067
|
|
|||||||
|
Sales as shown in the Consolidated Statements of Income
|
$
|
247,347
|
|
$
|
208,533
|
|
$
|
468,372
|
|
$
|
415,867
|
|
|||
|
Operating Profit (Loss)
|
|||||||||||||||
|
PE Films:
|
|||||||||||||||
|
Ongoing operations
|
$
|
10,682
|
|
$
|
4,318
|
|
$
|
19,713
|
|
$
|
14,553
|
|
|||
|
Plant shutdowns, asset impairments, restructurings and other
|
(904
|
)
|
(1,356
|
)
|
(2,972
|
)
|
(2,491
|
)
|
|||||||
|
Flexible Packaging Films:
|
|||||||||||||||
|
Ongoing operations
|
(319
|
)
|
(942
|
)
|
(2,317
|
)
|
1,090
|
|
|||||||
|
Plant shutdowns, asset impairments, restructurings and other
|
11,856
|
|
—
|
|
11,856
|
|
—
|
|
|||||||
|
Aluminum Extrusions:
|
|||||||||||||||
|
Ongoing operations
|
11,772
|
|
10,859
|
|
21,601
|
|
18,359
|
|
|||||||
|
Plant shutdowns, asset impairments, restructurings and other
|
1,571
|
|
(558
|
)
|
(2,769
|
)
|
(565
|
)
|
|||||||
|
Total
|
34,658
|
|
12,321
|
|
45,112
|
|
30,946
|
|
|||||||
|
Interest income
|
55
|
|
51
|
|
129
|
|
88
|
|
|||||||
|
Interest expense
|
1,642
|
|
947
|
|
2,822
|
|
2,032
|
|
|||||||
|
Gain on investment accounted for under fair value method
|
21,500
|
|
300
|
|
24,800
|
|
1,100
|
|
|||||||
|
Stock option-based compensation costs
|
38
|
|
31
|
|
41
|
|
(7
|
)
|
|||||||
|
Corporate expenses, net
|
7,502
|
|
6,969
|
|
14,026
|
|
14,886
|
|
|||||||
|
Income before income taxes
|
47,031
|
|
4,725
|
|
53,152
|
|
15,223
|
|
|||||||
|
Income taxes
|
2,827
|
|
1,317
|
|
5,246
|
|
4,533
|
|
|||||||
|
Net income
|
$
|
44,204
|
|
$
|
3,408
|
|
$
|
47,906
|
|
$
|
10,690
|
|
|||
The following table presents identifiable assets by segment at
June 30, 2017
and
December 31, 2016
:
|
(In Thousands)
|
June 30, 2017
|
December 31, 2016
|
|||||
|
PE Films
|
$
|
296,728
|
|
$
|
278,558
|
|
|
|
Flexible Packaging Films
|
152,311
|
|
156,836
|
|
|||
|
Aluminum Extrusions
|
267,549
|
|
147,639
|
|
|||
|
Subtotal
|
716,588
|
|
583,033
|
|
|||
|
General corporate
|
67,347
|
|
38,618
|
|
|||
|
Cash and cash equivalents
|
24,026
|
|
29,511
|
|
|||
|
Total
|
$
|
807,961
|
|
$
|
651,162
|
|
|
19
|
11.
|
Tredegar recorded tax expense of
$5.2 million
on pretax net income of
$53.2 million
in the first
six months
of
2017
. Therefore, the effective tax rate in the first
six months
of
2017
was
9.9%
, compared to
29.8%
in the first
six months
of
2016
. The significant differences between the U.S. federal statutory rate and the effective income tax rate for the
six months
ended
June 30, 2017
and
2016
are as follows:
|
|
|
Percent of Income
Before Income Taxes
|
||||
|
Six Months Ended June 30,
|
2017
|
2016
|
|||
|
Income tax expense at federal statutory rate
|
35.0
|
|
35.0
|
|
|
|
Foreign rate differences
|
1.7
|
|
0.1
|
|
|
|
State taxes, net of federal income tax benefit
|
1.2
|
|
0.5
|
|
|
|
Changes in estimates related to prior year tax provision
|
0.6
|
|
(1.3
|
)
|
|
|
Valuation allowance for foreign operating loss carry-forwards
|
0.5
|
|
0.3
|
|
|
|
Non-deductible expenses
|
0.4
|
|
1.6
|
|
|
|
Income tax contingency accruals and tax settlements
|
0.2
|
|
1.5
|
|
|
|
Valuation allowance for capital loss carry-forwards
|
—
|
|
(0.7
|
)
|
|
|
Unremitted earnings from foreign operations
|
(0.2
|
)
|
(2.0
|
)
|
|
|
Research and development tax credit
|
(0.5
|
)
|
(1.6
|
)
|
|
|
Domestic production activities deduction
|
(0.7
|
)
|
(2.2
|
)
|
|
|
Remitted earnings from foreign operations
|
(0.8
|
)
|
(0.8
|
)
|
|
|
Foreign investment write-up
|
(4.4
|
)
|
(0.6
|
)
|
|
|
Settlement of Terphane acquisition escrow
|
(7.9
|
)
|
—
|
|
|
|
Worthless stock deduction
|
(15.2
|
)
|
—
|
|
|
|
Effective income tax rate
|
9.9
|
|
29.8
|
|
|
During the second quarter of 2017, the Company initiated a plan to liquidate for tax purposes one of its domestic subsidiaries, which will allow it to claim an income tax benefit on the write-off of the stock basis of one of the Company’s U.S. subsidiaries (“worthless stock deduction”) on its 2017 federal income tax return. The Company recorded an income tax benefit during the second quarter of 2017 of
$8.1 million
related to the worthless stock deduction, net of valuation allowances and accrual for uncertain tax positions. Also during the second quarter of 2017, the Company recognized a net tax benefit of
$0.4 million
associated with additional U.S. tax related to the repatriation of cash from Brazil in the third quarter of 2016 offset by the reversal of related tax contingencies.
Tredegar accrues U.S. federal income taxes on unremitted earnings of all foreign subsidiaries. Prior to the second quarter of 2016, deferred U.S. federal income taxes had not been recorded for the undistributed earnings for Terphane Ltda. because the Company had intended to permanently reinvest these earnings. Due to concerns about the political and economic conditions in Brazil, Terphane Ltda. began making cash distributions to the Company in 2016. During the second quarter of 2016, Terphane Ltda. paid a dividend of
$10.7 million
to the Company. Because of the accumulation of significant losses related to foreign currency translations at Terphane Ltda., there were no unrecorded deferred tax liabilities associated with the U.S. federal income taxes and foreign withholding taxes on Terphane Ltda.’s undistributed earnings as of
June 30, 2017
and
December 31, 2016
.
The Brazilian federal statutory income tax rate is a composite of
34.0%
(
25.0%
of income tax and
9.0%
of social contribution on income). Terphane Holdings LLC’s (“Terphane”) manufacturing facility in Brazil is the beneficiary of certain income tax incentives that allow for a reduction in the statutory Brazilian federal income tax rate to
15.25%
levied on the operating profit on certain of its products. The incentives have been granted for a
10
-year period, which has a retroactive commencement date of January 1, 2015. No benefit was recognized from these tax incentives in the first
six months
of
2017
or
2016
.
Income taxes in
2017
included a partial reversal of a valuation allowance of less than
$0.1 million
related to the expected limitations on the utilization of assumed capital losses on certain investments that were recognized in prior years. Income taxes in
2016
included the partial reversal of a valuation allowance of
$0.1 million
related to the expected limitations on the utilization of assumed capital losses on certain investments. The Company had a valuation allowance for excess capital losses from investments and other related items of
$11.2 million
at
June 30, 2017
. Tredegar continues to evaluate opportunities to utilize these loss carryforwards prior to their expiration at various dates in the future. As
20
events and circumstances warrant, allowances will be reversed when it is more likely than not that future taxable income will exceed deductible amounts, thereby resulting in the realization of deferred tax assets.
Tredegar and its subsidiaries file income tax returns in the U.S., various states and jurisdictions outside the U.S. With few exceptions, Tredegar and its subsidiaries are no longer subject to U.S. federal, state or non-U.S. income tax examinations by tax authorities for years before 2013.
|
12.
|
In 2011, Tredegar was notified by U.S. Customs and Border Protection (“U.S. Customs”) that certain film products exported by Terphane to the U.S. since November 6, 2008 could be subject to duties associated with an antidumping duty order on imported PET films from Brazil. The Company contested the applicability of these antidumping duties to the films exported by Terphane, and it filed a request with the U.S. Department of Commerce (“Commerce”) for clarification about whether the film products at issue are within the scope of the antidumping duty order. On January 8, 2013, Commerce issued a scope ruling confirming that the films are not subject to the order, provided that Terphane can establish to the satisfaction of U.S. Customs that the performance enhancing layer on those films is greater than
0.00001
inches thick. The films at issue are manufactured to specifications that exceed that threshold. On February 6, 2013, certain U.S. producers of PET film filed a summons with the U.S. Court of International Trade to appeal the scope ruling from Commerce. In December 2014, the U.S. International Trade Commission voted to revoke the anti-dumping duty order on imported PET films from Brazil. The revocation, as a result of the vote by the U.S. International Trade Commission, was effective as of November 2013. On February 20, 2015, certain U.S. producers of PET films filed a summons with the U.S. Court of International Trade to appeal the determination by the U.S. International Trade Commission. The Court granted a motion by the plaintiffs to stay the appeal of the revocation decision pending the resolution of the scope appeal. On June 18, 2017, the U.S. Court of International Trade remanded the scope determination to Commerce for re-consideration of certain scope issues.
|
|
13.
|
In May 2014, the Financial Accounting Standards Board (“FASB”) and International Accounting Standards Board (“IASB”) issued their converged standard on revenue recognition. The revised revenue standard contains principles that an entity will apply to direct the measurement of revenue and timing of when it is recognized. The core principle of the guidance is that the recognition of revenue should depict the transfer of promised goods or services to customers in an amount that reflects the consideration to which an entity expects to be entitled in exchange for those goods and services. To achieve that core principle, an entity will utilize a principle-based five-step approach model. The converged standard also includes more robust disclosure requirements which will require entities to provide sufficient information to enable users of financial statements to understand the nature, amount, timing and uncertainty of revenue and cash flows arising from contracts with customers. In March 2016, amended guidance was issued regarding clarifying the implementation guidance on principal versus agent considerations and in April 2016, clarifying guidance was issued relating to identifying performance obligations and licensing implementation. The effective date of this revised standard is for annual reporting periods beginning after December 15, 2017, including interim periods within that reporting period. Early application is permitted as of annual reporting periods beginning after December 15, 2016, including interim reporting periods within that annual reporting period. The converged standard can be adopted either retrospectively or through the use of a practical expedient. The Company has made substantial progress towards assessing the impact of this standard. The Company has a team in place to analyze the impact of the standard, and the related guidance issued, across all revenue streams to evaluate the impact of the new standard on revenue contracts. This includes reviewing current accounting policies and practices to identify potential differences that would result from applying the requirements under the new standard. In 2016, the Company made progress on contract reviews, which were completed and validated in the first half of 2017. The Company has also started evaluating the new disclosure requirements and expects to complete its evaluations of the impacts of the accounting and disclosure requirements on its business processes, controls and systems by the end of 2017. The Company is still evaluating the method of adoption of the standard, which will occur in the first quarter of 2018.
|
In July 2015, the FASB issued new guidance for the measurement of inventories. Inventories within the scope of the revised guidance should be measured at the lower of cost or net realizable value. The previous guidance dictated that inventory should be measured at the lower of cost or market, with market being either replacement cost, net realizable value or net realizable value less an approximation of normal profit margin. Net realizable value is the estimated selling prices in the ordinary course of business, less reasonably predictable costs of completion, disposal and transportation. Subsequent measurement is unchanged for inventories measured using LIFO or the retail inventory method. The amendments should be applied prospectively, with early adoption permitted. The Company adopted the new guidance prospectively in the first quarter of 2017, and the adoption of this guidance did not have a material impact on the Company’s consolidated financial statements.
21
In January 2016, the FASB issued amended guidance associated with accounting for equity investments measured at fair value. The amended guidance requires all equity investments to be measured at fair value with changes in the fair value recognized through net income (other than those accounted for under equity method of accounting or those that result in consolidation of the investee). The amended guidance also requires an entity to present separately in other comprehensive income the portion of the total change in the fair value of a liability resulting from a change in the instrument-specific credit risk when the entity has elected to measure the liability at fair value in accordance with the fair value option for financial instruments. In addition, the amendments in this update eliminate the requirement to disclose the fair value of financial instruments measured at amortized cost for entities that are not public business entities and the requirement to disclose the method(s) and significant assumptions used to estimate the fair value that is required to be disclosed for financial instruments measured at amortized cost on the balance sheet for public business entities. The amended guidance is effective for fiscal years beginning after December 31, 2017, including the interim periods within those fiscal years. The amendments should be applied by means of a cumulative-effect adjustment to the balance sheet as of the beginning of the fiscal year of adoption. The amendments related to equity securities without readily determinable fair values (including disclosure requirements) should be applied prospectively to equity investments that exist as of the date of adoption of the update. Early adoption is permitted under limited, specific circumstances. The guidance is not expected to have a material impact on the Company’s consolidated financial statements.
In February 2016, the FASB issued a revised standard on lease accounting. Lessees will need to recognize virtually all of their leases on the balance sheet, by recording a right-of-use asset and lease liability. The revised standard requires additional analysis of the components of a transaction to determine if a right-to-use asset is embedded in the transaction that needs to be treated as a lease. Substantial additional disclosures are also required by the revised standard. The revised standard is effective for fiscal years beginning after December 31, 2018, including the interim periods within those fiscal years. The revised standard should be applied on a modified retrospective approach or through the use of a practical expedient, with early adoption permitted. The Company is still assessing the impact of this revised standard.
In March 2016, the FASB issued amended guidance to simplify several aspects of the accounting for share-based payment transactions, including the income tax consequences, classification of awards as either equity or liabilities, and classification on the statements of cash flows. The Company adopted the new guidance in the first quarter of 2017. Under the new guidance, excess tax benefits related to equity compensation were recognized in "Income taxes" in the consolidated statements of income rather than in "Common stock" in the consolidated balance sheets and were applied on a prospective basis. If these amounts had been included in the consolidated statements of income in previous years, net income would have been reduced by
$0.5 million
in the first six months of 2016 (none in the second quarter of 2016) (
$1.1 million
for the full year 2016). Changes to the statements of cash flows related to the classification of excess tax benefits and employee taxes paid for share-based payment arrangements were implemented on a retrospective basis. In addition, the updated guidance allows the Company to make an accounting policy election related to how forfeitures will impact the recognition of stock compensation cost. Previously, entities were required to estimate forfeitures at the grant date, accounting for estimated forfeitures over the requisite service period. Under the updated guidance, the Company can choose, and the Company has elected, to account for forfeitures as they occur. The Company adopted the updated guidance in the first quarter of 2017, and the adoption of this guidance did not have a material impact on the Company’s consolidated financial statements.
In October 2016, the FASB issued guidance that requires an entity to recognize the income tax consequences of an intra-entity transfer of an asset other than inventory when the transfer occurs. The amendments are effective for fiscal years, and interim periods within those fiscal years, beginning after December 15, 2017, and should be applied on a modified retrospective basis through a cumulative-effect adjustment directly to retained earnings at the beginning period of adoption. Early adoption is permitted in the first interim period of an annual reporting period for which financial statements have not been issued. The Company is currently evaluating the impact of adopting this guidance.
In January 2017, the FASB issued guidance to assist with evaluating when a set of transferred assets and activities (collectively, the "set") is a business and provides a screen to determine when such a set is not a business. Under the new guidance, when substantially all of the fair value of gross assets acquired (or disposed of) is concentrated in a single identifiable asset, or group of similar assets, the assets acquired would not represent a business. Also, to be considered a business, an acquisition would have to include an input and a substantive process that together significantly contribute to the ability to produce outputs. The new standard is effective for fiscal years, and interim periods within those fiscal years, beginning after December 15, 2017, and should be applied on a prospective basis to any transactions occurring within the period of adoption. Early adoption is permitted for interim or annual periods in which the financial statements have not been issued. The Company is currently evaluating the impact of adopting this guidance.
22
In January 2017, the FASB issued amended guidance that eliminates the requirement to determine the fair value of individual assets and liabilities of a reporting unit to measure goodwill impairment. Under the amendments in the new guidance, goodwill impairment testing will be performed by comparing the fair value of the reporting unit with its carrying amount and recognizing an impairment charge for the amount by which the carrying amount exceeds the reporting unit’s fair value. The new standard is effective for annual and interim goodwill impairment tests in fiscal years beginning after December 15, 2019, and should be applied on a prospective basis. Early adoption is permitted for annual or interim goodwill impairment testing performed after January 1, 2017. The Company is currently evaluating the impact of adopting this guidance.
In March 2017, the FASB issued final guidance on the presentation of net periodic pension and postretirement benefit cost (net benefit cost). Currently, net benefit cost is reported as an employee cost within operating income. This new guidance requires the bifurcation of net periodic pension and postretirement benefit costs. Service cost will be part of operating income (and is the only piece eligible to be capitalized). All other components will be shown outside of operations. The new standard is effective for annual and interim periods in fiscal years beginning after December 15, 2017, and should be applied on a retrospective basis. Early adoption is permitted only in the first quarter of the reporting year. The Company is currently evaluating the impact of adopting this guidance.
|
Item 2.
|
Management’s Discussion and Analysis of Financial Condition and Results of Operations.
|
Forward-looking and Cautionary Statements
Some of the information contained in this Quarterly Report on Form 10-Q (“Form 10-Q”) may constitute “forward-looking statements” within the meaning of the “safe harbor” provisions of the Private Securities Litigation Reform Act of 1995. When using the words “believe,” “estimate,” “anticipate,” “expect,” “project,” “likely,” “may” and similar expressions, Tredegar does so to identify forward-looking statements. Such statements are based on then current expectations and are subject to a number of risks and uncertainties that could cause actual results to differ materially from those addressed in the forward-looking statements. It is possible that actual results and financial condition may differ, possibly materially, from the anticipated results and financial condition indicated in or implied by these forward-looking statements. Accordingly, you should not place undue reliance on these forward-looking statements. Factors that could cause actual results to differ from expectations include, without limitation, the following:
|
•
|
the achievement or inability to achieve sales to new customers to replace lost business;
|
|
•
|
the loss or gain of sales to significant customers on which our business is highly dependent;
|
|
•
|
the achievement or inability to achieve sales to new customers to replace lost business;
|
|
•
|
our ability to develop and deliver new products at competitive prices;
|
|
•
|
the failure of our customers to achieve success or maintain market share;
|
|
•
|
failure to protect our intellectual property rights;
|
|
•
|
the risks of doing business in countries outside the U.S. that affect our substantial international operations;
|
|
•
|
political, economic, and regulatory factors concerning our products;
|
|
•
|
uncertain economic conditions in countries in which we do business;
|
|
•
|
competition from other manufacturers, including manufacturers in lower-cost countries and manufacturers benefiting from government subsidies;
|
|
•
|
the impact of fluctuations in foreign exchange rates;
|
|
•
|
a change in the amount of our underfunded defined benefit (pension) plan liability;
|
|
•
|
an increase in the operating costs incurred by our operating companies, including, for example, the cost of raw materials and energy;
|
|
•
|
the inability to successfully identify, complete or integrate strategic acquisitions; the failure to realize the expected benefits of such acquisitions and the assumption of unanticipated risks in such acquisitions;
|
|
•
|
disruption to our manufacturing facilities;
|
|
•
|
the occurrence or threat of extraordinary events, including natural disasters and terrorist attacks;
|
|
•
|
an information technology system failure or breach;
|
23
|
•
|
the volatility and uncertainty of the valuation of our cost-basis investment in kaléo;
|
|
•
|
the possibility of the imposition of tariffs on imported aluminum billet used in our aluminum extrusions;
|
and the other factors discussed in the reports Tredegar files with or furnishes to the Securities and Exchange Commission (“the SEC”) from time to time, including the risks and important factors set forth in additional detail in “Risk Factors” Part II, Item 5 of the Form 10-Q and in Part I, Item 1A of Tredegar’s 2016 Annual Report on Form 10-K (the “2016 Form 10-K”) filed with the SEC. Readers are urged to review and consider carefully the disclosures Tredegar makes in its filings with the SEC, including the 2016 Form 10-K.
Tredegar does not undertake, and expressly disclaims any duty, to update any forward-looking statement to reflect any change in management’s expectations or any change in conditions, assumptions or circumstances on which such statements are based, except as required by applicable law.
References herein to “Tredegar,” “the Company,” “we,” “us” and “our” are to Tredegar Corporation and its subsidiaries, collectively, unless the context otherwise indicates or requires.
Executive Summary
Tredegar is a manufacturer of polyethylene plastic films through its PE Films segment, polyester films through its Flexible Packaging segment and aluminum extrusions through its Aluminum Extrusions segment. PE Films is comprised of personal care materials, surface protection films, polyethylene overwrap films and films for other markets. Flexible Packaging Films produces polyester-based films for use in packaging applications that have specialized properties, such as heat resistance, strength, barrier protection and the ability to accept high-quality print graphics. Aluminum Extrusions produces high-quality, soft-alloy and medium-strength aluminum extrusions primarily for building and construction, automotive, consumer durables, machinery and equipment, electrical and distribution market
s.
Second-quarter
2017
net income was
$44.2 million
(
$1.34
per share) compared with net income of
$3.4 million
(
$0.10
per share) in the
second quarter
of
2016
. Net income was
$47.9 million
(
$1.45
per share) in the first
six months
of
2017
compared with
$10.7 million
(
$0.33
per share) in the first
six months
of
2016
. Net income for the second quarter of 2017 included the following:
|
•
|
An unrealized after-tax gain on the Company’s investment in kaléo of $15.7 million ($0.47 per share), which is accounted for under the fair value method (see Note 7 for more details);
|
|
•
|
An after-tax gain of $11.9 million ($0.36 per share) from the settlement of an escrow agreement related to the Terphane acquisition in 2011; and
|
|
•
|
An income tax benefit of $8.1 million ($0.25 per share) associated with the write-off of the stock basis of one of the Company’s U.S. subsidiaries (see Note 11 for more details).
|
Other losses related to plant shutdowns, asset impairments, restructurings and other items are described in Note 3. Net sales (sales less freight) and operating profit from ongoing operations are the measures of sales and operating profit used by the chief operating decision maker of each segment for purposes of assessing performance. See the table in Note 10 for a presentation of Tredegar’s net sales and operating profit by segment for the
three and six
months ended
June 30, 2017
and
2016
.
24
On February 15, 2017, Bonnell Aluminum acquired Futura on a net debt-free basis for approximately $92 million. The amount actually funded in cash at the transaction date was approximately $87.0 million, which was net of preliminary closing adjustments for working capital and seller transaction-related obligations assumed and subsequently paid by Bonnell Aluminum. The Company may be refunded up to $5 million if Futura does not meet certain performance requirements for the 2017 fiscal year. The acquisition, which was funded using Tredegar’s secured revolving credit agreement, is being treated as an asset purchase for U.S. federal income tax purposes.
See Note 2 for more details on the acquisition of Futura.
PE Films
A summary of operating results from ongoing operations for PE Films is provided below:
|
|
Three Months Ended
|
Favorable/
(Unfavorable) % Change |
Six Months Ended
|
Favorable/
(Unfavorable) % Change |
|||||||||||||||||
|
(In Thousands, Except Percentages)
|
June 30,
|
June 30,
|
|||||||||||||||||||
|
2017
|
2016
|
2017
|
2016
|
||||||||||||||||||
|
Sales volume (lbs)
|
34,166
|
|
34,574
|
|
(1.2
|
)%
|
69,222
|
|
72,460
|
|
(4.5
|
)%
|
|||||||||
|
Net sales
|
$
|
89,639
|
|
$
|
80,813
|
|
10.9
|
%
|
$
|
176,050
|
|
$
|
169,295
|
|
4.0
|
%
|
|||||
|
Operating profit from ongoing operations
|
$
|
10,682
|
|
$
|
4,318
|
|
147.4
|
%
|
$
|
19,713
|
|
$
|
14,553
|
|
35.5
|
%
|
|||||
Second-Quarter
Results vs. Prior Year
Second Quarter
Results
Net sales (sales less freight) in the
second quarter
of
2017
increased
by
$8.8 million
versus
2016
primarily due to:
|
•
|
An increase in surface protection films revenue ($5.7 million) primarily due to a stronger LCD market and improved sales mix; and
|
|
•
|
Higher volume for elastics and acquisition distribution layers materials and favorable sales mix in personal care materials ($5.2 million), partially offset by volume reductions from the winding down of known lost business in personal care ($1.2 million), which was substantially completed by the end of 2016, and lower volume of overwrap products ($0.8 million).
|
Operating profit from ongoing operations in the
second quarter
of
2017
increased
by
$6.4 million
versus the
second quarter
of
2016
primarily due to:
|
•
|
Higher contribution to profits from surface protection films ($5.5 million), primarily due to higher volume, a favorable sales mix, and production efficiencies;
|
|
•
|
Higher contribution to profits from personal care materials ($2.5 million), primarily due to favorable mix, partially offset by known lost business in personal care ($0.7 million);
|
|
•
|
Higher selling and general expenses ($1.2 million), primarily associated with hiring and employee incentive costs; and
|
|
•
|
Realized cost savings of $0.6 million associated with the previously announced project to consolidate domestic manufacturing facilities in PE Films (“North American facility consolidation”).
|
The North American facility consolidation is expected to be completed in the fourth quarter of 2017. Once complete, annualized pretax cash cost savings are expected to be approximately $5-6 million. Total pretax cash expenditures for this multi-year project are expected to be approximately $17 million (which includes $11 million of capital expenditures), of which $14.4 million has been spent as of June 30, 2017.
See Note 3 for more details.
The surface protection operating segment of the PE Films reporting segment supports manufacturers of optical and other specialty substrates used in flat panel display products. These films are primarily used by customers to protect components of displays in the manufacturing and transportation process and then discarded.
As previously discussed, the Company believes that over the next few years, there is an increased risk that a portion of its film used in surface protection applications will be made obsolete by possible future customer product transitions to less costly alternative processes or materials. The Company estimates on a preliminary basis that the annual adverse impact on ongoing operating profit from customer shifts to alternative processes or materials in surface protection is in the range of up to $5 to $10 million. Given the technological and commercial complexity involved in bringing these alternative processes or
25
materials to market, the Company is very uncertain as to the timing and ultimate amount of the possible transitions. In response, the Company is aggressively pursuing new surface protection products, applications and customers.
The Company continues to anticipate a significant additional product transition in its personal care business after 2018 that could have an adverse impact on ongoing operating profit, but the impact is uncertain at this time. The competitive dynamics in the personal care business require continuous development of new materials for customers, which include the leading global and regional personal care producers.
The product development process for personal care materials, which spans from idea inception to product commercialization, is typically 24 to 48 months.
R&D spending in PE Films has increased significantly over the past several years, and was approximately $12 million in 2014, $16 million in 2015 and $19 million in 2016. R&D spending in 2017 is projected to be comparable to 2016.
Amounts estimated for the expected impact on future profits of lost business and product transitions are provided on a stand-alone basis and do not include any potential offsets such as sales growth, cost reductions or new product developments.
Year-To-Date Results vs. Prior Year Year-To-Date Results
Net sales (sales less freight) in the first
six months
of
2017
increased
by
$6.8 million
versus
2016
primarily due to:
|
•
|
Higher sales from surface protection films ($7.1 million), primarily due to higher volume and a favorable sales mix;
|
|
•
|
Higher volume for acquisition distribution layers materials and favorable sales mix in personal care materials ($5.4 million), partially offset by volume reductions from the winding down of known lost business in personal care that was substantially completed by the end of 2016 ($5.1 million); and
|
|
•
|
Lower net volume primarily related to other personal care materials ($0.7 million).
|
Operating profit from ongoing operations in the first
six months
of
2017
increased
by
$5.2 million
versus the second quarter of
2016
primarily due to:
|
•
|
Higher contribution to profits from surface protection films ($6.0 million), mostly in the second quarter, primarily due to higher volume, a favorable sales mix, and production efficiencies;
|
|
•
|
Higher contribution to profits from personal care materials and other PE Films products ($1.7 million), primarily due to improved volume and inflation-driven price increases, more than offset by known lost business in personal care ($2.0 million);
|
|
•
|
The unfavorable lag in the pass-through of average resin costs of $0.7 million in the first six months of 2017 versus the unfavorable lag of $0.2 million in 2016; and
|
|
•
|
Realized cost savings of $1.0 million associated with the previously announced project to consolidate domestic manufacturing facilities in PE Films, more than offset by higher net general, selling and plant expenses ($1.3 million), primarily associated with strategic hires and an increase in employee incentive costs.
|
Capital Expenditures, Depreciation & Amortization
Capital expenditures in PE Films were
$
7.8 million
in the first
six months
of
2017
compared to
$13.9 million
in the first
six months
of
2016
.
PE Films currently estimates that total capital expenditures in
2017
will be
$26 million
, including approximately
$10 million
for routine capital expenditures required to support operations. Capital spending for strategic projects in 2017 includes capacity expansion for elastics and acquisition distribution layer materials, in addition to other growth and strategic projects. Depreciation expense was
$6.9 million
in the first
six months
of
2017
and
$6.6 million
in the first
six months
of
2016
. Depreciation expense is projected to be
$15 million
in
2017
.
26
Flexible Packaging Films
A summary of operating results from ongoing operations for Flexible Packaging Films is provided below:
|
|
Three Months Ended
|
Favorable/
(Unfavorable) % Change |
Six Months Ended
|
Favorable/
(Unfavorable) % Change |
|||||||||||||||||
|
(In Thousands, Except Percentages)
|
June 30,
|
June 30,
|
|||||||||||||||||||
|
2017
|
2016
|
2017
|
2016
|
||||||||||||||||||
|
Sales volume (lbs)
|
21,966
|
|
22,355
|
|
(1.7
|
)%
|
44,028
|
|
43,017
|
|
2.4
|
%
|
|||||||||
|
Net sales
|
$
|
26,588
|
|
$
|
27,207
|
|
(2.3
|
)%
|
$
|
53,297
|
|
$
|
53,585
|
|
(0.5
|
)%
|
|||||
|
Operating profit (loss) from ongoing operations
|
$
|
(319
|
)
|
$
|
(942
|
)
|
66.1
|
%
|
$
|
(2,317
|
)
|
$
|
1,090
|
|
NA
|
|
|||||
Second-Quarter
Results vs. Prior Year
Second Quarter
Results
Sales volume decreased
1.7%
in the
second quarter
of
2017
compared with the
second quarter
of
2016
primarily due to higher demand, primarily in its markets outside of Brazil. Net sales in the
second quarter
of
2017
decreased
2.3%
versus the
second quarter
of
2016
due to lower sales volume and lower prices in a competitive market partially offset by a favorable sales mix.
Terphane’s operating results from ongoing operations in the
second quarter
of
2017
showed an improvement of
$0.6 million
versus the
second quarter
of
2016
primarily due to:
|
•
|
Foreign currency transaction gains of $0.2 million in the second quarter of 2017 versus $1.6 million of losses in the second quarter of 2016, associated with U.S. Dollar denominated export sales in Brazil; and
|
|
•
|
The unfavorable lag in the pass-through of raw material costs of $1.0 million in the second quarter of 2017 versus the favorable lag of $0.2 million in 2016.
|
Year-To-Date Results vs. Prior Year Year-To-Date Results
Sales volume improved by
2.4%
in the first
six months
of
2017
compared with the first
six months
of
2016
primarily due to higher demand, primarily in its markets outside of Brazil. Net sales in the first
six months
of
2017
decreased
0.5%
versus the first
six months
of
2016
due to lower prices in a competitive market and a less favorable sales mix partially offset by higher sales volume.
Terphane had an operating loss from ongoing operations in the first
six months
of
2017
of
$2.3 million
versus an operating profit from ongoing operations in the first
six months
of
2016
of
$1.1 million
. The resulting unfavorable change of
$3.4 million
for the period was primarily due to:
|
•
|
Lower margins from competitive pricing pressures that primarily relate to ongoing excess global capacity in the industry (particularly in Latin America), unfavorable economic conditions in Brazil, and inefficiencies from lower-than-planned production in the first quarter of 2017, partially offset by higher volume (net unfavorable impact of $0.6 million);
|
|
•
|
Foreign currency transaction losses of $0.1 million in the first six months of 2017 versus $3.3 million of losses in the first six months of 2016, associated with U.S. Dollar denominated export sales in Brazil;
|
|
•
|
The unfavorable lag in the pass-through of raw material costs of $2.1 million in the first six months of 2017 versus the favorable lag of $1.2 million in 2016; and
|
|
•
|
Higher costs and expenses of $2.8 million primarily related to the adverse impact of high inflation in Brazil and the appreciation by approximately 17% of the average exchange rate for the Brazilian Real relative to the U.S. Dollar.
|
The Company expects Terphane’s future operating results to continue to be volatile until industry capacity utilization and the competitive dynamics in Latin America improve. Additional capacity from a competitor in Latin America is expected to come on-line in the third quarter of 2017. A non-cash impairment charge associated with Terphane’s trade name intangibles not subject to amortization (balance of $6.3 million at June 30, 2017) and depreciable and amortizable assets could be triggered depending on expectations of the future prospects of this business.
27
Capital Expenditures, Depreciation & Amortization
Capital expenditures in Terphane were
$1.2 million
in the first
six months
of
2017
compared to
$1.2 million
in the first
six months
of
2016
.
Terphane currently estimates that total capital expenditures in
2017
will be
$3 million
,
all for routine capital expenditures required to support operations. Depreciation expense was
$3.7 million
in the first
six months
of
2017
and
$3.1 million
in the first
six months
of
2016
. Depreciation expense is projected to be
$7 million
in
2017
. Amortization expense was
$1.5 million
in the first
six months
of
2017
and
$1.4 million
in the first
six months
of
2016
, and is projected to be
$3 million
in
2017
.
Aluminum Extrusions
A summary of operating results from ongoing operations for Aluminum Extrusions is provided below:
|
|
Three Months Ended
|
Favorable/
(Unfavorable) % Change |
Six Months Ended
|
Favorable/
(Unfavorable) % Change |
|||||||||||||||||
|
(In Thousands, Except Percentages)
|
June 30,
|
June 30,
|
|||||||||||||||||||
|
2017
|
2016
|
2017
|
2016
|
||||||||||||||||||
|
Sales volume (lbs) *
|
44,962
|
|
44,855
|
|
0.2
|
%
|
87,357
|
|
86,323
|
|
1.2
|
%
|
|||||||||
|
Net sales
|
$
|
123,208
|
|
$
|
93,447
|
|
31.8
|
%
|
$
|
222,807
|
|
$
|
178,920
|
|
24.5
|
%
|
|||||
|
Operating profit from ongoing operations
|
$
|
11,772
|
|
$
|
10,859
|
|
8.4
|
%
|
$
|
21,601
|
|
$
|
18,359
|
|
17.7
|
%
|
|||||
|
* Excludes sales volume associated with Futura, acquired on February 15, 2017.
|
|||||||||||||||||||||
Second-Quarter
Results vs. Prior Year
Second Quarter
Results
Net sales in the second quarter of 2017 increased versus 2016 primarily due to the addition of Futura. Futura contributed net sales of $22.5 million in the second quarter of 2017. Excluding the impact of Futura, net sales were higher as a result of an increase in average selling prices primarily due to the pass-through to customers of higher market-driven raw material costs.
Volume on an organic basis (which excludes the impact of the Futura acquisition) in the second quarter of 2017 was relatively flat versus 2016. Higher volume in specialty markets was largely offset by decreases in the building & construction and automotive markets. The Company believes that lower sales volume in these markets was largely tied to the timing of customer orders. Higher average net selling prices, primarily attributed to an increase in aluminum market prices, had a favorable impact on net sales of $7.9 million.
Operating profit from ongoing operations in the second quarter of 2017 increased by $0.9 million in comparison to the second quarter of 2016. Excluding the favorable profit impact of Futura ($2.8 million), operating profit from ongoing operations decreased $1.9 million, primarily as a result of higher operating costs, including supplies and maintenance, utilities and employee-related expenses, partially offset by higher inflation-related sales prices net of increased material costs ($0.8 million). In addition, operating profit was lower due to disruptions to normal production ($1.0 million) associated with the transition to the new extrusion line in Niles, Michigan, which began its ramp-up at the end of the second quarter.
Year-To-Date Results vs. Prior Year Year-To-Date Results
Net sales in the first half of 2017 increased $43.9 million versus 2016 primarily due to the addition of Futura. Futura has contributed net sales of $30.8 million since its acquisition in the first quarter of 2017. Excluding the impact of Futura, net sales were higher primarily as a result of an increase in average selling prices due to the pass-through to customers of higher market-driven raw material costs and slightly higher volumes. Higher average net selling prices, primarily attributed to an increase in aluminum market prices, had a favorable impact on net sales of $12.4 million.
Volume on an organic basis (which excludes the impact of the Futura acquisition) in the first half of 2017 increased slightly versus 2016. Higher volume in the specialty and automotive markets was largely offset by decreases in building & construction market. The Company believes that lower year-to-date sales volume in this market has resulted primarily from downtime associated with upgrades made to a paint line that serves this market in the first quarter and the timing of customer orders in the second quarter.
Operating profit from ongoing operations in the first half of 2017 increased by $3.2 million versus the first half of 2016. Excluding the favorable profit impact of Futura ($3.8 million), operating profit from ongoing operations decreased $0.6 million, primarily due to disruptions to normal production associated with the transition to the new extrusion line in Niles, Michigan, which began its ramp-up at the end of the second quarter.
28
Cast House Explosion
On June 29, 2016, the Bonnell Aluminum plant in Newnan, Georgia suffered an explosion in the casting department, resulting in injuries to five employees. The explosion caused significant damage to the cast house and related equipment. The Company is in the process of replacing the damaged casting equipment and expects the cast house to be back in production in the third quarter of 2017. The Newnan plant is currently sourcing raw materials for its extrusion process from other Bonnell plants and from third party vendors. Bonnell Aluminum has various forms of insurance to cover losses associated with this type of event.
During the first six months of 2017, Bonnell incurred $4.2 million of additional expenses associated with the explosion, and $4.1 million of this amount has been fully offset by anticipated insurance recoveries.
Additionally, $0.6 million of additional expenses incurred in 2016 that were not reasonably assured of being covered by insurance recoveries are now expected to be recovered and are included as an offset to expenses in “Plant shutdowns, asset impairments, restructurings and other” in the Net Sales and Operating Profit by Segment and in “Cost of goods sold” in the
Consolidated Statements of Income. As the insurance recovery process progresses, additional insurance recoveries are expected. In the second half of 2017, Bonnell expects to record a gain associated with the involuntary conversion of the old cast house.
Capital Expenditures, Depreciation & Amortization
Capital expenditures in Aluminum Extrusions were
$17.7 million
in the
first
six months
of
2017
(including $0.9 million associated with Futura since it was acquired), compared to
$3.6 million
in the first
six months
of
2016
.
Capital expenditures are projected to total
$25 million
in
2017
, including $9 million used to complete the extrusions capacity expansion project at the Niles, Michigan plant, expenditures to repair the damage caused by the cast house explosion net of related insurance recoveries (facility upgrades of approximately $2 million will not be covered by insurance reimbursements),
$9 million
for routine items required to support legacy operations, and $2 million to support the operations of Futura. Depreciation expense was
$5.3 million
in the first
six months
of
2017
, which included $1.1 million from the addition of Futura, compared to
$4.1 million
in the first
six months
of
2016
, and is projected to be approximately
$11 million
in
2017
. Amortization expense was
$1.4 million
in the first
six months
of
2017
, which included $0.8 million from the addition of Futura, and
$0.5 million
in the first
six months
of
2016
, and is projected to be approximately
$3 million
in
2017
.
Corporate Expenses, Interest and Taxes
Pension expense was
$5.2 million
in the first
six months
of
2017
, a favorable change of
$0.4 million
from the first
six months
of
2016
. Most of the impact on earnings from pension expense is reflected in “Corporate expenses, net” in the net sales and operating profit by segment table in Note 10. Pension expense is projected to be approximately
$10.4 million
in 2017. Corporate expenses, net, decreased in the first six months of 2017 versus 2016 primarily due to lower pension expense and stock-based employee benefit costs, partially offset by higher incentive accruals.
Interest expense was
$2.8 million
in the first
six months
of
2017
in comparison to
$2.0 million
in the first
six months
of
2016
. Interest expense in 2016 included the write off of $0.2 million in unamortized loan fees from the credit facility that was refinanced in the first quarter of 2016.
The effective tax rate used to compute income taxes in the first
six months
of
2017
was
9.9%
compared to
29.8%
in the first
six months
of
2016
. The significant differences between the U.S. federal statutory rate and the effective tax rate for the first
six months
is shown in the table provided in Note 11.
Net capitalization and other credit measures are provided in
Liquidity and Capital Resources
.
Critical Accounting Policies
In the ordinary course of business, the Company makes a number of estimates and assumptions relating to the reporting of results of operations and financial position in the preparation of financial statements in conformity with generally accepted accounting principles in the United States (“GAAP”). The Company believes the estimates, assumptions and judgments described in the section “Management’s Discussion and Analysis of Financial Condition and Results of Operations – Critical Accounting Policies” of the
2016
Form 10-K have the greatest potential impact on our financial statements, so Tredegar considers these to be its critical accounting policies. These policies include accounting for impairment of long-lived assets and goodwill, investment accounted for under the fair value method, pension benefits and income taxes. These policies require management to exercise judgments that are often difficult, subjective and complex due to the necessity of estimating the effect of matters that are inherently uncertain. Actual results could differ significantly from those estimates under different assumptions and conditions. The Company believes the consistent application of these policies enables it to provide readers of
29
the financial statements with useful and reliable information about our operating results and financial condition. Since December 31,
2016
, there have been no changes in these policies that have had a material impact on results of operations or financial position. For more information on new accounting pronouncements see Note 13.
Results of Operations
Second Quarter
of
2017
Compared with the
Second Quarter
of
2016
Overall, sales in the
second quarter
of
2017
increased by
18.6%
compared with the
second quarter
of
2016
. Net sales increased
10.9%
in PE Films primarily due to a market driven increase in surface protection films sales and higher elastic and acquisition distribution layer films sales, partially offset by known lost business and product transitions. Net sales in Flexible Packaging Films decreased
2.3%
due to lower export sales volume and lower prices in a competitive market. Net sales increased
31.8%
in Aluminum Extrusions primarily due to the acquisition of Futura, higher sales volumes and an increase in average selling prices as a result of the pass-through to customers of higher market-driven raw material costs. For more information on net sales and volume, see the
Executive Summary
.
Consolidated gross profit (sales minus cost of goods sold and freight) as a percentage of sales was
17.0%
in the
second quarter
of
2017
compared to
15.2%
in the
second quarter
of
2016
. The gross profit margin in PE Films increased due to higher volume in surface protection films and elastic and acquisition distribution layer materials, partially offset by lower volume as a result of lost business and product transitions. The gross profit margin in Flexible Packaging Films decreased significantly due to higher costs in 2017 compared to 2016, primarily due to an unfavorable lag in the pass through of higher material costs to customers, the adverse impact of high inflation in Brazil and the appreciation of the Brazilian Real relative to the U.S. Dollar. The gross profit margin in Aluminum Extrusions increased primarily as a result of the operating performance by Futura, which completed its first full quarter since it was acquired in February 2017.
As a percentage of sales, general and administrative (“SG&A”) and R&D expenses were
10.8%
in the
second quarter
of
2017
, compared with
11.9%
in the
second quarter
of last year, but total SG&A expenses increased as a result of the Futura acquisition and related acquisition and integration costs and other business development costs.
Plant shutdowns, asset impairments, restructurings and other items in the
second quarter
of
2017
and
2016
are shown in the segment operating profit table in Note 10 and are described in detail in Note 3. A discussion of unrealized gains and losses on investments can also be found in Note 7.
Interest expense increased from
$0.9 million
in the
second quarter
of
2016
to
$1.6 million
in the
second quarter
of
2017
. In February 2017, the Company borrowed $87 million under its Credit Agreement (as defined in Liquidity and Capital Resources) to fund the acquisition of Futura. Interest expense in 2016 included the write off of $0.2 million in unamortized loan fees from the credit facility that was refinanced in the first quarter of 2016.
30
Average debt outstanding and interest rates were as follows:
|
Three Months Ended June 30,
|
|||||||
|
(In Millions)
|
2017
|
2016
|
|||||
|
Floating-rate debt with interest charged on a rollover basis at one-month LIBOR plus a credit spread:
|
|||||||
|
Average outstanding debt balance
|
$
|
193.6
|
|
$
|
109.9
|
|
|
|
Average interest rate
|
2.9
|
%
|
2.3
|
%
|
|||
|
Fixed-rate and other debt:
|
|||||||
|
Average outstanding debt balance
|
$
|
—
|
|
$
|
—
|
|
|
|
Average interest rate
|
n/a
|
|
n/a
|
|
|||
|
Total debt:
|
|||||||
|
Average outstanding debt balance
|
$
|
193.6
|
|
$
|
109.9
|
|
|
|
Average interest rate
|
2.9
|
%
|
2.3
|
%
|
|||
First Six Months of
2017
Compared with the First Six Months of
2016
Overall, sales in the first
six months
of
2017
increased by
12.6%
compared with the first
six months
of
2016
. Net sales increased
4.0%
in PE Films primarily due to a market driven increase in surface protection films sales and higher elastic and acquisition distribution layer materials, partially offset by known lost business and product transitions. Net sales in Flexible Packaging Films decreased
0.5%
due to lower sales prices in a competitive market and an unfavorable sales mix. Net sales increased
24.5%
in Aluminum Extrusions primarily due to the acquisition of Futura and an increase in average selling prices as a result of the pass-through to customers of higher market-driven raw material costs. For more information on net sales and volume, see the
Executive Summary
.
Consolidated gross profit (sales minus cost of goods sold and freight) as a percentage of sales was
15.6%
in the first
six months
of
2017
compared to
16.6%
in the first
six months
of
2016
. The gross profit margin in PE Films increased due to higher volume in surface protection films and elastic and acquisition distribution layer materials, partially offset by lower volume as a result of lost business and product transitions and volume reductions for other personal care products. The gross profit margin in Flexible Packaging Films decreased significantly due to higher costs in 2017 compared to 2016, primarily due to an unfavorable lag in the pass through of higher material costs to customers, the adverse impact of high inflation in Brazil and the appreciation of the Brazilian Real relative to the U.S. Dollar, partially offset by foreign currency losses in the prior year associated with U.S. Dollar denominated export sales in Brazil. The gross profit margin in Aluminum Extrusions increased primarily as a result of higher margins achieved by Futura, partially offset by inefficiencies related to the startup of a new line at Niles, Michigan.
As a percentage of sales, general and administrative (“SG&A”) and R&D expenses were
11.1%
in the first
six months
of
2017
, compared with
11.9%
in the first
six months
of last year, basically flat with the prior year. SG&A expense decreases in 2017 included lower pension expense and stock-based employee benefit and other costs, partially offset by Futura acquisition and integration costs and business development costs.
31
Plant shutdowns, asset impairments, restructurings and other items in the
six months
of
2017
and
2016
are shown in the segment operating profit table in Note 10 and are described in detail in Note 3. A discussion of unrealized gains and losses on investments can also be found in Note 7.
Interest expense increased from $
2.0 million
in the first
six months
of
2016
to $
2.8 million
in the first
six months
of
2017
. In February 2017, the Company borrowed $87 million under its Credit Agreement to fund the acquisition of Futura. Interest expense in 2016 included the write off of $0.2 million in unamortized loan fees from the credit facility that was refinanced in the first quarter of 2016.
Average debt outstanding and interest rates were as follows:
|
Six Months Ended June 30,
|
|||||||
|
(In Millions)
|
2017
|
2016
|
|||||
|
Floating-rate debt with interest charged on a rollover basis at one-month LIBOR plus a credit spread:
|
|||||||
|
Average outstanding debt balance
|
$
|
171.4
|
|
$
|
107.7
|
|
|
|
Average interest rate
|
2.8
|
%
|
2.3
|
%
|
|||
|
Fixed-rate and other debt:
|
|||||||
|
Average outstanding debt balance
|
$
|
—
|
|
$
|
—
|
|
|
|
Average interest rate
|
n/a
|
|
n/a
|
|
|||
|
Total debt:
|
|||||||
|
Average outstanding debt balance
|
$
|
171.4
|
|
$
|
107.7
|
|
|
|
Average interest rate
|
2.8
|
%
|
2.3
|
%
|
|||
Liquidity and Capital Resources
Tredegar’s management continues to focus on improving working capital management, and measures such as days sales outstanding (“DSO”), days inventory outstanding (“DIO”) and days payables outstanding (“DPO”) are used to evaluate changes in working capital. Changes in operating assets and liabilities from
December 31, 2016
to
June 30, 2017
are summarized as follows:
|
•
|
Accounts and other receivables increased
$31.8 million
(
32.6%
).
|
|
•
|
Accounts receivable in PE Films increased by
$7.6 million
primarily due to higher volume, for surface protection films and the timing of cash receipts. DSO (represents trailing 12 months net sales divided by a rolling 12-month average of accounts and other receivables balances) was approximately
47.9
days for the 12 months ended
June 30, 2017
and
45.7
days for the 12 months ended
December 31, 2016
.
|
|
•
|
Accounts receivable in Flexible Packaging Films were relatively flat. DSO was approximately
52.0
days for the 12 months ended
June 30, 2017
and
51.8
days for the 12 months ended
December 31, 2016
.
|
|
•
|
Accounts and other receivables in Aluminum Extrusions increased by
$24.3 million
primarily due to the addition of balances from the acquisition of Futura, including the recording of a contingent receivable of $5 million related to an earnout provision in the Purchase Agreement (see Note 2 for more details), the recording of a receivable of $1.9 million related to expected insurance recoveries associated with the Bonnell cast house explosion, and higher net sales. DSO was approximately
43.4
days for the 12 months ended
June 30, 2017
and
43.3
days for the 12 months ended
December 31, 2016
.
|
|
•
|
Inventories increased
$18.3 million
(
27.7%
).
|
|
•
|
Inventories in PE Films increased by approximately
$6.5 million
primarily due to increased production to accommodate higher demand and the timing of raw material purchases. DIO (represents trailing 12 months costs of goods sold calculated on a first-in, first-out basis divided by a rolling 12-month average of inventory balances calculated on the first-in, first-out basis) was approximately
54.9
days for the 12 months ended
June 30, 2017
and
52.2
days for the 12 months ended
December 31, 2016
.
|
|
•
|
Inventories in Flexible Packaging Films increased by approximately
$0.8 million
primarily due to the timing of raw material purchases. DIO was approximately
71.5
days for the 12 months ended
June 30, 2017
and
77.0
days for the 12 months ended
December 31, 2016
.
|
32
|
•
|
Inventories in Aluminum Extrusions increased by
$10.9 million
due to the addition of balances from the acquisition of Futura and the timing of purchases. DIO was approximately
28.6
days for the 12 months ended
June 30, 2017
and
26.5
days for the 12 months ended
December 31, 2016
.
|
|
•
|
Net property, plant and equipment increased
$43.8 million
(
16.8%
) primarily due to property and equipment added from the acquisition of Futura of $32.7 million, capital expenditures of
$26.7 million
and a change in the value of the U.S. dollar relative to foreign currencies ($1.3 million increase) and partially offset by depreciation expenses of
$16.0 million
.
|
|
•
|
Goodwill and other intangibles increased by
$38.0 million
(
25.1%
) primarily due to balances added from the acquisition of Futura of $41.1 million, partially offset by amortization expense of $2.9 million. Identifiable intangible assets and goodwill associated with the Futura acquisition were $30.7 million and $10.4 million, respectively.
|
|
•
|
Accounts payable increased
$14.4 million
(
17.7%
).
|
|
•
|
Accounts payable in PE Films increased
$1.4 million
due to the normal volatility associated with the timing of payments. DPO (represents trailing 12 months costs of goods sold calculated on a first-in, first-out basis divided by a rolling 12-month average of accounts payable balances) was approximately
39.0
days for the 12 months ended
June 30, 2017
and
38.5
days for the 12 months ended
December 31, 2016
.
|
|
•
|
Accounts payable in Flexible Packaging Films decreased
$1.6 million
due to the normal volatility associated with the timing of payments. DPO was approximately
42.4
days for the 12 months ended
June 30, 2017
and
39.5
days for the 12 months ended
December 31, 2016
.
|
|
•
|
Accounts payable in Aluminum Extrusions increased by
$15.0 million
primarily due to the addition of balances from the acquisition of Futura, a one-time extension of payment terms with a major supplier and the normal volatility associated with the timing of payments. DPO was approximately
47.7
days for the 12 months ended
June 30, 2017
and
45.4
days for the 12 months ended
December 31, 2016
.
|
|
•
|
Accrued expenses decreased by
$0.3 million
(
0.8%
) from December 31, 2016 due to normal fluctuations in the accounts.
|
Cash provided by operating activities was
$22.0 million
in the first
six months
of
2017
compared with
$18.3 million
in the first
six months
of
2016
. The change is primarily related to normal volatility of working capital components.
Cash used in investing activities was
$113.7 million
in the first
six months
of
2017
compared with
$17.9 million
in the first
six months
of
2016
. Cash used in investing activities primarily represents the acquisition of Futura in 2017 for $87.1 million (which includes the net settlement of post-closing adjustments of $0.1 million) and capital expenditures, which were
$26.7 million
and
$19.0 million
in the first
six months
of
2017
and
2016
, respectively.
Cash provided by financing activities was
$85.7 million
in the first
six months
of
2017
and was primarily related to net borrowings under the Credit Agreement to fund the acquisition of Futura for $87.1 million (including $5.0 million paid into the Earnout Escrow and the net settlement of post-closing adjustments of $0.1 million; see Note 2 for more details) and the payment of regular quarterly dividends of
$7.3 million
(
22 cent
s per share). Cash used in financing activities was
$19.8 million
in the first
six months
of
2016
and was primarily related to the payment of regular quarterly dividends of
$7.2 million
(
22 cent
s per share), partially offset by net debt repayments of $10.0 million.
Further information on cash flows for the
six months
ended
June 30, 2017
and
2016
is provided in the consolidated statements of cash flows.
33
On March 1, 2016, the Company executed its new five-year, $400 million secured revolving credit agreement that expires on March 1, 2021 (“Credit Agreement”), replacing the previous $350 million unsecured revolving credit agreement. Net capitalization and indebtedness as defined under the Credit Agreement as of
June 30, 2017
were as follows:
|
Net Capitalization and Indebtedness as of June 30, 2017
|
|||
|
(In Thousands)
|
|||
|
Net capitalization:
|
|||
|
Cash and cash equivalents
|
$
|
24,026
|
|
|
Debt:
|
|||
|
Credit Agreement
|
187,250
|
|
|
|
Debt, net of cash and cash equivalents
|
163,224
|
|
|
|
Shareholders’ equity
|
359,428
|
|
|
|
Net capitalization
|
$
|
522,652
|
|
|
Indebtedness as defined in Credit Agreement:
|
|||
|
Total debt
|
$
|
187,250
|
|
|
Face value of letters of credit
|
2,685
|
|
|
|
Other
|
450
|
|
|
|
Indebtedness
|
$
|
190,385
|
|
The credit spread and commitment fees charged on the unused amount under the Credit Agreement at various indebtedness-to-adjusted EBITDA levels are as follows:
|
Pricing Under The Credit Agreement (Basis Points)
|
|||||
|
Indebtedness-to-Adjusted EBITDA Ratio
|
Credit Spread
Over LIBOR
|
Commitment
Fee
|
|||
|
> 3.5x but <= 4.0x
|
250
|
|
45
|
|
|
|
> 3.0x but <= 3.5x
|
225
|
|
40
|
|
|
|
> 2.0x but <= 3.0x
|
200
|
|
35
|
|
|
|
> 1.0x but <= 2.0x
|
175
|
|
30
|
|
|
|
<= 1.0x
|
150
|
|
25
|
|
|
At
June 30, 2017
, the interest rate on debt under the Credit Agreement existing at that date was priced at one-month LIBOR plus the applicable credit spread of 200 basis points. Under the Credit Agreement, borrowings are permitted up to $400 million, and approximately
$193 million
was available to borrow at
June 30, 2017
based upon the most restrictive covenants.
34
The computations of adjusted EBITDA, adjusted EBIT, the leverage ratio and interest coverage ratio as defined in the Credit Agreement are presented below. Adjusted EBITDA and adjusted EBIT as defined in the Credit Agreement are not intended to represent net income (loss) or cash flow from operations as defined by GAAP and should not be considered as an alternative to either net income or to cash flow.
|
Computations of Adjusted EBITDA, Adjusted EBIT, Leverage Ratio and Interest Coverage Ratio as Defined in the Credit Agreement Along with Related Most Restrictive Covenants as of and for the Twelve Months Ended June 30, 2017 (In Thousands)
|
|||
|
Computations of adjusted EBITDA and adjusted EBIT as defined in the Credit Agreement for the twelve months ended June 30, 2017:
|
|||
|
Net income (loss)
|
$
|
61,683
|
|
|
Plus:
|
|||
|
After-tax losses related to discontinued operations
|
—
|
|
|
|
Total income tax expense for continuing operations
|
3,930
|
|
|
|
Interest expense
|
4,596
|
|
|
|
Depreciation and amortization expense for continuing operations
|
35,565
|
|
|
|
All non-cash losses and expenses, plus cash losses and expenses not to exceed $10,000, for continuing operations that are classified as unusual, extraordinary or which are related to plant shutdowns, asset impairments and/or restructurings (cash-related of $9,628)
|
12,900
|
|
|
|
Charges related to stock option grants and awards accounted for under the fair value-based method
|
104
|
|
|
|
Losses related to the application of the equity method of accounting
|
—
|
|
|
|
Losses related to adjustments in the estimated fair value of assets accounted for under the fair value method of accounting
|
—
|
|
|
|
Minus:
|
|||
|
After-tax income related to discontinued operations
|
—
|
|
|
|
Total income tax benefits for continuing operations
|
—
|
|
|
|
Interest income
|
(302
|
)
|
|
|
All non-cash gains and income, plus cash gains and income in excess of $10,000, for continuing operations that are classified as unusual, extraordinary or which are related to plant shutdowns, asset impairments and/or restructurings
|
(4,728
|
)
|
|
|
Income related to changes in estimates for stock option grants and awards accounted for under the fair value-based method
|
—
|
|
|
|
Income related to the application of the equity method of accounting
|
—
|
|
|
|
Income related to adjustments in the estimated fair value of assets accounted for under the fair value method of accounting
|
(25,300
|
)
|
|
|
Plus cash dividends declared on investments accounted for under the equity method of accounting
|
—
|
|
|
|
Plus or minus, as applicable, pro forma EBITDA adjustments associated with acquisitions and asset dispositions
|
7,423
|
|
|
|
Adjusted EBITDA as defined in the Credit Agreement
|
95,871
|
|
|
|
Less: Depreciation and amortization expense for continuing operations (including pro forma for acquisitions and asset dispositions)
|
(39,003
|
)
|
|
|
Adjusted EBIT as defined in the Credit Agreement
|
$
|
56,868
|
|
|
Computations of leverage and interest coverage ratios as defined in the Credit Agreement at June 30, 2017:
|
|||
|
Leverage ratio (indebtedness-to-adjusted EBITDA)
|
1.99x
|
|
|
|
Interest coverage ratio (adjusted EBIT-to-interest expense)
|
12.37x
|
|
|
|
Most restrictive covenants as defined in the Credit Agreement:
|
|||
|
Maximum permitted aggregate amount of dividends that can be paid by Tredegar during the term of the Credit Agreement ($100,000 plus 50% of net income generated for each quarter beginning January 1, 2016)
|
$
|
136,186
|
|
|
Maximum leverage ratio permitted
|
4.00
|
|
|
|
Minimum interest coverage ratio permitted
|
2.50
|
|
|
35
As of
June 30, 2017
, Tredegar was in compliance with all financial covenants in the Credit Agreement. Noncompliance with any one or more of the debt covenants may have a material adverse effect on the Company’s financial condition or liquidity in the event such noncompliance cannot be cured or should the Company be unable to obtain a waiver from the lenders as we would not be permitted to borrow under the credit facility and any amounts outstanding would become due and payable. Renegotiation of the covenant(s) through an amendment to the Credit Agreement could effectively cure the noncompliance, but could have an effect on financial condition or liquidity depending upon how the covenant is renegotiated.
At
June 30, 2017
, the Company had cash and cash equivalents of
$24.0 million
, including funds held in locations outside the U.S. of
$21.7 million
. Tredegar accrues U.S. federal income taxes on unremitted earnings of all foreign subsidiaries. The Company believes that existing borrowing availability, current cash balances and cash flow from operations will be sufficient to satisfy its working capital, capital expenditure and dividend requirements for the next 12 months.
|
Item 3.
|
Quantitative and Qualitative Disclosures About Market Risk.
|
Tredegar has exposure to the volatility of interest rates, polyethylene and polypropylene resin prices, Terephtalic Acid (“PTA”) and Monoethylene Glycol (“MEG”) prices, aluminum ingot and scrap prices, energy prices, foreign currencies and emerging markets. See
Liquidity and Capital Resources
regarding credit agreement and interest rate exposures.
Changes in polyethylene resin prices, and the timing of those changes, could have a significant impact on profit margins in PE Films. Changes in polyester resin, PTA and MEG prices, and the timing of those changes, could have a significant impact on profit margins in Flexible Packaging Films. Profit margins in Aluminum Extrusions are sensitive to fluctuations in aluminum ingot and scrap prices as well as natural gas prices (natural gas is the principal energy source used to operate its casting furnaces). There is no assurance of the Company’s ability to pass through higher raw material and energy costs to its customers.
The volatility of average quarterly prices of low density polyethylene resin in the U.S. (a primary raw material for PE Films) is shown in the chart below.
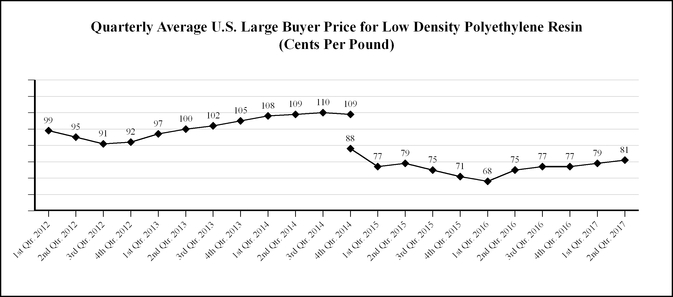
|
Source: Quarterly averages computed by Tredegar using monthly data provided by IHS, Inc. In January 2015, IHS reflected a 21 cents per pound non-market adjustment based on their estimate of the growth of discounts in prior periods. The 4th quarter 2014 average rate of $1.09 per pound is shown on a pro forma basis as if the non-market adjustment was made in the fourth quarter of 2014.
|
Polyethylene resin prices in Europe, Asia and South America have exhibited similar long-term trends. The price of resin is driven by several factors, including supply and demand and the price of oil, ethylene and natural gas. To address fluctuating resin prices, PE Films has index-based pass-through raw material cost agreements for the majority of its business. However, under certain agreements, changes in resin prices are not passed through for an average period of 90 days (see
Executive Summary
and Note 10
for more information). Pricing on the remainder of the business is based upon raw material costs and supply/demand dynamics within the markets that the Company competes.
36
Polyester resins, MEG and PTA used in flexible packaging films produced in Brazil are primarily purchased domestically, with other sources available mostly from Asia and the U.S. Given the nature of these products as commodities, pricing is derived from Asian pricing indexes. The volatility of the average quarterly prices for polyester fibers in Asia, which is representative of polyester resin (a primary raw material for Flexible Packaging Films) pricing trends, is shown in the chart below:
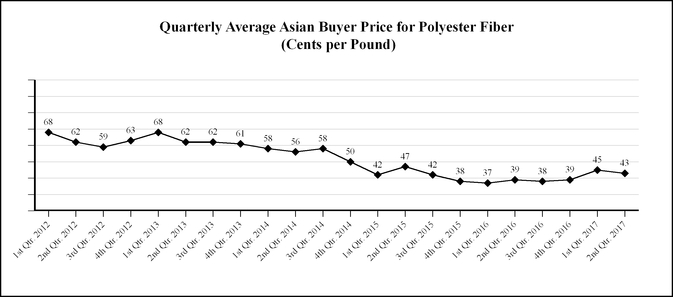
|
Source: Quarterly averages computed by Tredegar using monthly data from CMAI Global Index data.
|
The volatility of average quarterly prices of PTA and MEG in Asia (raw materials used in the production of polyester resins produced by Flexible Packaging Films) is shown in the chart below:
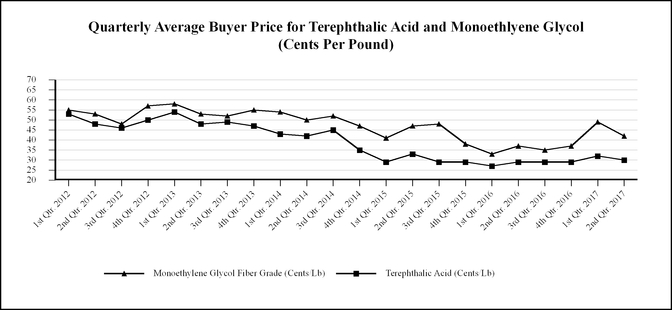
|
Source: Quarterly averages computed by Tredegar using monthly data from CMAI Global Index data.
|
In the normal course of business, Aluminum Extrusions enters into fixed-price forward sales contracts with certain customers for the sale of fixed quantities of aluminum extrusions at scheduled intervals. In order to hedge its exposure to aluminum price volatility (see the chart below) under these fixed-price arrangements, which generally have a duration of not more than 12 months, the Company enters into a combination of forward purchase commitments and futures contracts to acquire or hedge aluminum, based on the scheduled deliveries. See Note 8 for additional information.
37
The volatility of quarterly average aluminum prices is shown in the chart below.
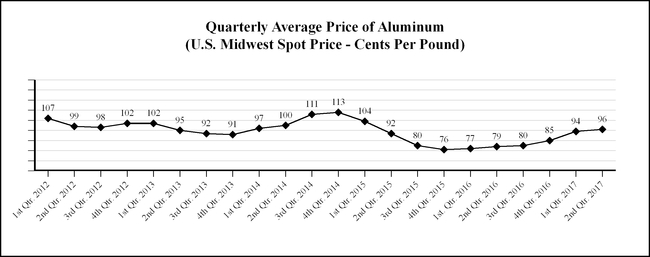
|
Source: Quarterly averages computed using daily Midwest average prices provided by Platts.
|
From time-to-time, Aluminum Extrusions hedges a portion of its exposure to natural gas price volatility by entering into fixed-price forward purchase contracts with the Company’s natural gas suppliers. The Company estimates that, in an unhedged situation, every $1 per mmBtu per month change in the market price of natural gas has a
$74,000
impact on the continuing monthly operating profit in Aluminum Extrusions. The Company has an energy surcharge for its aluminum extrusions business in the U.S. to be applied when the NYMEX natural gas price is in excess of $8.85 per mmBtu.
The volatility of quarterly average natural gas prices is shown in the chart below.
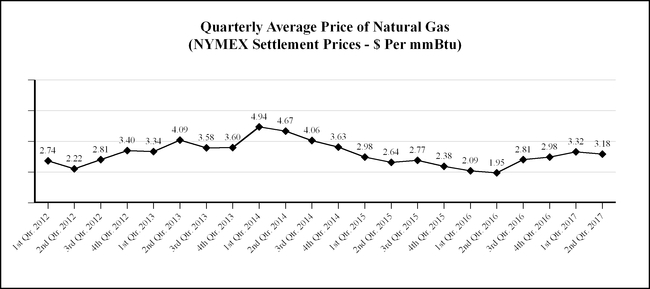
|
Source: Quarterly averages computed by Tredegar using monthly NYMEX settlement prices.
|
38
The Company sells to customers in foreign markets through its foreign operations and through exports from U.S. plants. The percentage of sales for manufacturing operations related to foreign markets for the first
six months
of
2017
and
2016
are as follows:
|
Percentage of Net Sales from Ongoing
Operations Related to Foreign Markets*
|
|||||||||||
|
|
Six Months Ended June 30,
|
||||||||||
|
|
2017
|
2016
|
|||||||||
|
|
Exports
From U.S.
|
Foreign
Operations
|
Exports
From U.S.
|
Foreign
Operations
|
|||||||
|
Canada
|
5
|
%
|
—
|
%
|
5
|
%
|
—
|
%
|
|||
|
Europe
|
1
|
|
8
|
|
1
|
|
10
|
|
|||
|
Latin America
|
2
|
|
9
|
|
—
|
|
11
|
|
|||
|
Asia
|
9
|
|
2
|
|
9
|
|
3
|
|
|||
|
Total
|
17
|
%
|
19
|
%
|
15
|
%
|
24
|
%
|
|||
|
* The percentages for foreign markets are relative to Tredegar’s total net sales from ongoing operations
|
|||||||||||
Tredegar attempts to match the pricing and cost of its products in the same currency and generally view the volatility of foreign currencies (see trends for the Euro, Brazilian Real and Chinese Yuan in the charts on the following page) and emerging markets, and the corresponding impact on earnings and cash flow, as part of the overall risk of operating in a global environment. Exports from the U.S. are generally denominated in U.S. Dollars. The Company’s foreign currency exposure on income from continuing foreign operations relates to the Euro, the Chinese Yuan, the Hungarian Forint, the Brazilian Real and the Indian Rupee.
PE Films is generally able to match the currency of its sales and costs for its product lines. For flexible packaging films produced in Brazil, selling prices and key raw material costs are principally determined in U.S. Dollars and are impacted by local economic conditions. Competition in Brazil, Terphane’s primary market, has been exacerbated by global overcapacity in the polyester industry generally, and by particularly acute overcapacity in Latin America. Additional PET capacity from a competitor in Latin America is expected to come on line in the third quarter of 2017. These factors have resulted in significant competitive pricing pressures and U.S. Dollar equivalent margin compression. Moreover, variable conversion, fixed conversion and general, sales and administrative costs for operations in Brazil are expected to be adversely impacted by inflation in Brazil that is higher than in the U.S. Flexible Packaging is exposed to additional foreign exchange translation risk because almost 90% of Flexible Packaging’s Brazilian sales are quoted or priced in U.S. Dollars while a large majority of its Brazilian costs are quoted or priced in Brazilian Real. This mismatch, together with a variety of economic variables impacting currency exchange rates, causes volatility that could negatively or positively impact operating profit for Flexible Packaging.
Tredegar estimates that the change in the value of foreign currencies relative to the U.S. Dollar on PE Films had an unfavorable impact on operating profit from ongoing operations in PE Films of
$0.2 million
in the
second quarter
of
2017
compared with the
second quarter
of
2016
and
$0.4 million
in the first
six months
of
2017
compared to the first
six months
of
2016
.
39
Trends for the Euro exchange rates relative to the U.S. Dollar are shown in the chart below.
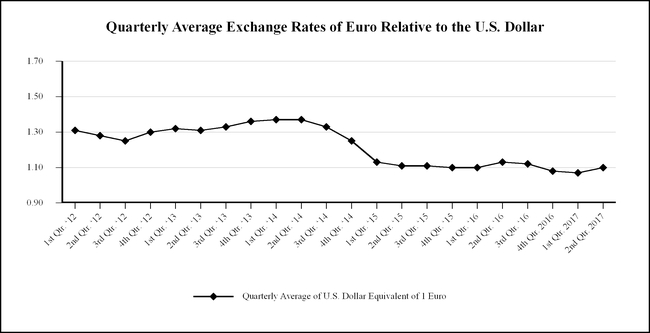
|
Source: Quarterly averages computed by Tredegar using daily closing data provided by Bloomberg.
|
Trends for the Brazilian Real and Chinese Yuan exchange rates relative to the U.S. Dollar are shown in the chart below.
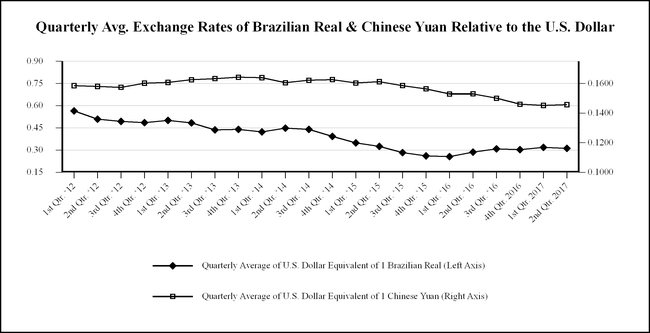
|
Source: Quarterly averages computed by Tredegar using daily closing data provided by Bloomberg.
|
|
Item 4.
|
Controls and Procedures.
|
Pursuant to Rule 13a-15(b) under the Securities Exchange Act of 1934, as amended, we carried out an evaluation, with the participation of our management, including our principal executive officer and principal financial officer, of the
40
effectiveness of our disclosure controls and procedures (as defined under Rule 13a-15(e) under the Securities Exchange Act of 1934) as of the end of the period covered by this report. Based upon that evaluation, the principal executive officer and principal financial officer concluded that the Company’s disclosure controls and procedures are effective to ensure that information required to be disclosed by us in the reports that we file or submit under the Securities Exchange Act of 1934, is recorded, processed, summarized and reported, within the time periods specified in the SEC’s rules and forms, and that such information is accumulated and communicated to our management, including the principal executive officer and principal financial officer, as appropriate, to allow timely decisions regarding required disclosure.
There has been no change in the Company’s internal control over financial reporting during the quarter ended
June 30, 2017
, that has materially affected, or is reasonably likely to materially affect, its internal control over financial reporting.
|
Item 5.
|
Risk Factors.
|
As disclosed in “Item 1A. Risk Factors” in our 2016 Form 10-K, there are a number of risks and uncertainties that can have a material effect on the operating results of our businesses and our financial condition. There are no additional material updates or changes to our other risk factors since the filing of our 2016 Form 10-K, except for the following:
The imposition of tariffs or duties on imported aluminum products could significantly increase the price of Aluminum Extrusions’ main raw material, which could adversely impact demand for its products.
On April 27, 2017, President Trump directed the U.S. Department of Commerce to begin an investigation under Section 232 of the Trade Expansion Act regarding the effects on U.S. economic and national security of aluminum imports into the U.S. It is unknown at this time if
the President will take any action as a result of the Section 232 investigation, and, if action is taken, what the impact of that action would be on Bonnell. However, the President could impose tariffs on aluminum imports to the U.S. Bonnell Aluminum and other major U.S. aluminum industries are net importers of aluminum raw materials. If high tariffs are imposed on imported aluminum billet purchased by Bonnell, then the aggregate cost of aluminum extrusions produced by Bonnell could rise significantly. Bonnell would expect to be able to pass through the higher aluminum costs to its customers. However, a higher cost for aluminum extrusions could result in product substitutions in place of aluminum extrusions, which could materially and negatively affect Bonnell and other U.S. aluminum extrusion businesses and their results of operations.
|
Item 6.
|
Exhibits.
|
|
Exhibit
Nos.
|
|
|
|
31.1
|
|
Certification of John D. Gottwald, President and Chief Executive Officer of Tredegar Corporation, pursuant to Rules 13a-14(a) and 15d-14(a) promulgated under the Securities Exchange Act of 1934, as adopted pursuant to Section 302 of the Sarbanes-Oxley Act of 2002.
|
|
31.2
|
|
Certification of D. Andrew Edwards, Vice President and Chief Financial Officer of Tredegar Corporation, pursuant to Rules 13a-14(a) and 15d-14(a) promulgated under the Securities Exchange Act of 1934, as adopted pursuant to Section 302 of the Sarbanes-Oxley Act of 2002.
|
|
32.1
|
|
Certification of John D. Gottwald, President and Chief Executive Officer of Tredegar Corporation, pursuant to 18 U.S.C. Section 1350, as adopted pursuant to Section 906 of the Sarbanes-Oxley Act of 2002.
|
|
32.2
|
|
Certification of D. Andrew Edwards, Vice President and Chief Financial Officer of Tredegar Corporation, pursuant to 18 U.S.C. Section 1350, as adopted pursuant to Section 906 of the Sarbanes-Oxley Act of 2002.
|
|
101
|
|
XBRL Instance Document and Related Items.
|
41
SIGNATURES
Pursuant to the requirements of the Securities Exchange Act of 1934, the Registrant has duly caused this report to be signed on its behalf by the undersigned thereunto duly authorized.
|
Tredegar Corporation
|
||||
|
(Registrant)
|
||||
|
Date:
|
August 2, 2017
|
/s/ John D. Gottwald
|
||
|
John D. Gottwald
|
||||
|
President and Chief Executive Officer
|
||||
|
(Principal Executive Officer)
|
||||
|
Date:
|
August 2, 2017
|
/s/ D. Andrew Edwards
|
||
|
D. Andrew Edwards
|
||||
|
Vice President and Chief Financial Officer
|
||||
|
(Principal Financial Officer)
|
||||
|
Date:
|
August 2, 2017
|
/s/ Frasier W. Brickhouse, II
|
||
|
Frasier W. Brickhouse, II
|
||||
|
Corporate Treasurer and Controller
|
||||
|
(Principal Accounting Officer)
|
||||
TABLE OF CONTENTS
Part I - Financial InformationItem 1. Financial StatementsItem 2. Management S Discussion and Analysis Of Financial Condition and Results Of OperationsItem 3. Quantitative and Qualitative Disclosures About Market RiskItem 4. Controls and ProceduresPart II - Other InformationItem 5. Risk FactorsItem 6. Exhibits