UNITED STATES
SECURITIES AND EXCHANGE COMMISSION
WASHINGTON, D.C. 20549
FORM 10-K
(Mark One)
|
x
|
ANNUAL REPORT PURSUANT TO SECTION 13 OR 15(d) OF THE SECURITIES EXCHANGE ACT OF 1934
|
For the Fiscal Year Ended
December 31, 2016
or
|
¨
|
TRANSITION REPORT PURSUANT TO SECTION 13 OR 15(d) OF THE SECURITIES EXCHANGE ACT OF 1934
|
Commission file number 001-37365
Tallgrass Energy GP, LP
(Exact name of registrant as specified in its charter)
|
Delaware
|
46-3159268
|
|||
|
(State or other Jurisdiction of Incorporation or Organization)
|
(IRS Employer Identification Number)
|
|||
|
4200 W. 115th Street, Suite 350
|
||||
|
Leawood, Kansas
|
66211
|
|||
|
(Address of Principal Executive Offices)
|
(Zip Code)
|
|||
(913) 928-6060
(Registrant's Telephone Number, Including Area Code)
Securities registered pursuant to Section 12(b) of the Act:
|
Title of each class
|
Name of each exchange on which registered
|
|
|
Class A Shares Representing Limited Partner Interests
|
New York Stock Exchange
|
|
Securities registered pursuant to Section 12(g) of the Act:
None
Indicate by check mark if the registrant is a well-known seasoned issuer, as defined in Rule 405 of the Securities Act. Yes
x
No
¨
Indicate by check mark if the registrant is not required to file reports pursuant to Section 13 or Section 15(d) of the Act. Yes
¨
No
x
Indicate by check mark whether the registrant (1) has filed all reports required to be filed by Section 13 or 15(d) of the Securities Exchange Act of 1934 during the preceding 12 months (or for such shorter period that the registrant was required to file such reports), and (2) has been subject to such filing requirements for the past 90 days. Yes
x
No
¨
Indicate by check mark whether the registrant has submitted electronically and posted on its corporate Web site, if any, every Interactive Data File required to be submitted and posted pursuant to Rule 405 of Regulation S-T (§232.405 of this chapter) during the preceding 12 months (or for such shorter period that the registrant was required to submit and post such files). Yes
x
No
¨
Indicate by check mark if disclosure of delinquent filers pursuant to Item 405 of Regulation S-K (§229.405 of this chapter) is not contained herein, and will not be contained, to the best of registrant's knowledge, in definitive proxy or information statements incorporated by reference in Part III of this Form 10-K or any amendment to this Form 10-K.
¨
Indicate by check mark whether the registrant is a large accelerated filer, an accelerated filer, a non-accelerated filer, or a smaller reporting company. See the definitions of "large accelerated filer", "accelerated filer", and "smaller reporting company" in Rule 12b-2 of the Exchange Act. (Check one):
|
Large accelerated filer
|
|
x
|
|
Accelerated filer
|
|
¨
|
|
Non-accelerated filer
|
|
¨
(Do not check if a smaller reporting company)
|
|
Smaller reporting company
|
|
¨
|
Indicate by check mark whether the registrant is a shell company (as defined in Rule 12b-2 of the Exchange Act). Yes
¨
No
x
The aggregate market value of voting and non-voting common equity held by non-affiliates on June 30, 2016, the last business day of the Registrant's most recently completed second fiscal quarter (based on the closing sale price of $22.57 of the Registrant's Class A shares, as reported by the New York Stock Exchange on such date) was approximately
$1,057.7 million
. On
February 15, 2017
, the Registrant had
58,075,000
Class A shares and
99,154,440
Class B shares outstanding.
TALLGRASS ENERGY GP, LP
TABLE OF CONTENTS
|
PART
I
|
|
Glossary of Common Industry and Measurement Terms
Bakken oil production area:
Montana and North Dakota in the United States and Saskatchewan and Manitoba in Canada.
Barrel (or bbl):
forty-two U.S. gallons.
Base Gas (or Cushion Gas):
the volume of gas that is intended as permanent inventory in a storage reservoir to maintain adequate pressure and deliverability rates.
BBtu:
one billion British Thermal Units.
Bcf:
one billion cubic feet.
British Thermal Units or Btus:
the amount of heat energy needed to raise the temperature of one pound of water by one degree Fahrenheit.
Commodity sensitive contracts or arrangements:
contracts or other arrangements, including tariff provisions, that are directly tied to increases and decreases in the price of commodities such as crude oil, natural gas and NGLs. Examples are Keep Whole Processing Contracts and Percent of Proceeds Processing Contracts, as well as pipeline loss allowances on our pipelines.
Condensate:
an NGL with a low vapor pressure, mainly composed of propane, butane, pentane and heavier hydrocarbon fractions.
Contract barrels:
barrels of crude oil that our customers have contractually agreed to ship in exchange for firm service assurance of capacity and deliverability to delivery points.
Delivery point:
any point at which product in a pipeline is delivered to or for the account of a customer.
Dry gas:
a gas primarily composed of methane and ethane where heavy hydrocarbons and water either do not exist or have been removed through processing.
Dth:
a dekatherm, which is a unit of energy equal to 10 therms or one million British thermal units.
End-user markets:
the ultimate users and consumers of transported energy products.
EPA:
the United States Environmental Protection Agency.
FERC:
Federal Energy Regulatory Commission.
Firm fee contracts:
contracts or other arrangements, including tariff provisions, that generally obligate our customers to pay a fixed recurring charge to reserve an agreed upon amount of capacity and/or deliverability on our assets, regardless if the contracted capacity is actually used by the customer. Such contracts are also commonly known as "take-or-pay" contracts.
Firm services:
services pursuant to which customers receive firm assurances regarding the availability of capacity and/or deliverability of natural gas, crude oil or other hydrocarbons or water on our assets up to a contracted amount.
Fractionation:
the process by which NGLs are further separated into individual, typically more valuable components including ethane, propane, butane, isobutane and natural gasoline.
GAAP:
generally accepted accounting principles in the United States of America.
GHGs:
greenhouse gases.
Header system:
networks of medium-to-large-diameter high pressure pipelines that connect local gathering systems to large diameter high pressure long-haul transportation pipelines.
Interruptible services:
services pursuant to which customers receive limited, or no, assurances regarding the availability of capacity and deliverability in our assets.
Keep Whole Processing Contracts:
natural gas processing contracts in which we are required to replace the Btu content of the NGLs extracted from inlet wet gas processed with purchased dry natural gas.
Line fill:
the volume of oil, in barrels, in the pipeline from the origin to the destination.
Liquefied natural gas or LNG:
natural gas that has been cooled to minus 161 degrees Celsius for transportation, typically by ship. The cooling process reduces the volume of natural gas by 600 times.
Local distribution company or LDC:
LDCs are involved in the delivery of natural gas to end users within a specific geographic area.
Long-term:
with respect to any contract, a contract with an initial duration greater than one year.
MMBtu:
one million British Thermal Units.
Mcf:
one thousand cubic feet.
MDth:
one thousand dekatherms.
MMcf:
one million cubic feet.
Natural gas liquids or NGLs:
those hydrocarbons in natural gas that are separated from the natural gas as liquids through the process of absorption, condensation, adsorption or other methods in natural gas processing or cycling plants. Generally, such liquids consist of propane and heavier hydrocarbons and are commonly referred to as lease condensate, natural gasoline and liquefied petroleum gases. Natural gas liquids include natural gas plant liquids (primarily ethane, propane, butane and isobutane) and lease condensate (primarily pentanes produced from natural gas at lease separators and field facilities).
Natural Gas Processing:
the separation of natural gas into pipeline-quality natural gas and a mixed NGL stream.
Non-contract barrels (or walk-up barrels):
barrels of crude oil that our customers ship based solely on availability of capacity and deliverability with no assurance of future capacity.
No-notice service:
those services pursuant to which customers receive the right to transport or store natural gas on assets outside of the daily nomination cycle without incurring penalties.
NYMEX:
New York Mercantile Exchange.
Park and loan services:
those services pursuant to which customers receive the right to store natural gas in (park), or borrow gas from (loan), our facilities.
Percent of Proceeds Processing Contracts:
natural gas processing contracts in which we process our customer's natural gas, sell the resulting NGLs and residue gas and divide the proceeds of those sales between us and the customer. Some percent of proceeds contracts may also require our customers to pay a monthly reservation fee for processing capacity.
PHMSA:
the United States Department of Transportation's Pipeline and Hazardous Materials Safety Administration.
Play:
a proven geological formation that contains commercial amounts of hydrocarbons.
Produced water:
all water removed from a well as a byproduct of the production of hydrocarbons and water removed from a well in connection with operations being conducted on the well, including naturally occurring water in the recovery formation, flow back water recovered during completion and fracturing operations and water entering the recovery formation through water flooding techniques.
Receipt point:
the point where a product is received by or into a gathering system, processing facility, or transportation pipeline.
Reservoir:
a porous and permeable underground formation containing an individual and separate natural accumulation of producible hydrocarbons (such as crude oil and/or natural gas) which is confined by impermeable rock or water barriers and is characterized by a single natural pressure system.
Residue gas:
the natural gas remaining after being processed or treated.
Shale gas:
natural gas produced from organic (black) shale formations.
Tailgate:
the point at which processed natural gas and NGLs leave a processing facility for transportation to end-user markets.
TBtu:
one trillion British Thermal Units.
Tcf:
one trillion cubic feet.
Throughput:
the volume of products, such as crude oil, natural gas or water, transported or passing through a pipeline, plant, terminal or other facility during a particular period.
Uncommitted shippers (or walk-up shippers):
customers that have not signed long-term shipper contracts and have rights under the FERC tariff as to rates and capacity allocation that are different than long-term committed shippers.
Volumetric fee contracts:
contracts or other arrangements, including tariff provisions, that generally obligate a customer to pay fees based upon the extent to which such customer utilizes our assets for midstream energy services. Unlike firm fee contracts, under volumetric fee contracts our customers are not generally required to pay a charge to reserve an agreed upon amount of capacity and/or deliverability.
Wellhead:
the equipment at the surface of a well that is used to control the well's pressure; also, the point at which the hydrocarbons and water exit the ground.
Working gas:
the volume of gas in the storage reservoir that is in addition to the cushion or base gas. It may or may not be completely withdrawn during any particular withdrawal season. Conditions permitting, the total working capacity could be used more than once during any season.
Working gas storage capacity:
the maximum volume of natural gas that can be cost-effectively injected into a storage facility and extracted during the normal operation of the storage facility. Effective working gas storage capacity excludes base gas and non-cycling working gas.
X/d:
the applicable measurement metric per day. For example, MMcf/d means one million cubic feet per day.
As used in this Annual Report, unless the context otherwise requires, "we," "us," "our," the "Partnership," "TEGP" and similar terms refer to Tallgrass Energy GP, LP, in its individual capacity or to Tallgrass Energy GP, LP and its consolidated subsidiaries collectively (including Tallgrass Equity, TEP and their respective subsidiaries), as the context requires. References to "Tallgrass Equity" refer to Tallgrass Equity, LLC. References to "TEP" refer to Tallgrass Energy Partners, LP. The term our "general partner" refers to TEGP Management, LLC. References to "Tallgrass Development" or "TD" refer to Tallgrass Development, LP. References to "Kelso" are to Kelso & Company and its affiliated investment funds and, as the context may require, other entities under its control, and references to "EMG" are to The Energy & Minerals Group, its affiliated investment funds and, as the context may require, other entities under its control.
A reference to a "Note" herein refers to the accompanying Notes to Consolidated Financial Statements contained in Item 8.
—
Financial Statements and Supplementary Data. In addition, please read "Cautionary Statement Regarding Forward-Looking Statements" and "Risk Factors" for information regarding certain risks inherent in our business.
Cautionary Statement Regarding Forward-Looking Statements
This Annual Report and the documents incorporated by reference herein contain forward-looking statements concerning our operations, economic performance and financial condition. Forward-looking statements give our current expectations, contain projections of results of operations or of financial condition, or forecasts of future events. Words such as "could," "will," "may," "assume," "forecast," "position," "predict," "strategy," "expect," "intend," "plan," "estimate," "anticipate," "believe," "project," "budget," "potential," or "continue," and similar expressions are used to identify forward-looking statements. Without limiting the generality of the foregoing, forward-looking statements contained in this Annual Report include our expectations of plans, strategies, objectives, growth and anticipated financial and operational performance, including guidance regarding our and Tallgrass Development's infrastructure programs, revenue projections, capital expenditures and tax position. Forward-looking statements can be affected by assumptions used or by known or unknown risks or uncertainties. Consequently, no forward-looking statements can be guaranteed.
A forward-looking statement may include a statement of the assumptions or bases underlying the forward-looking statement. We believe that we have chosen these assumptions or bases in good faith and that they are reasonable. However, when considering these forward-looking statements, you should keep in mind the risk factors and other cautionary statements in this Annual Report. Actual results may vary materially. You are cautioned not to place undue reliance on any forward-looking statements. You should also understand that it is not possible to predict or identify all such factors and should not consider the following list to be a complete statement of all potential risks and uncertainties. Factors that could cause our actual results to differ materially from the results contemplated by such forward-looking statements include:
|
•
|
our ability to pay distributions to our Class A shareholders;
|
|
•
|
our receipt of, and amount of, distributions from Tallgrass Equity;
|
|
•
|
TEP's ability to complete and integrate acquisitions from Tallgrass Development or from third parties, including its acquisition of a 100% membership interest in Tallgrass NatGas Operator, LLC and Tallgrass Terminals, LLC that was completed in January 2017, and its acquisition of a 25% membership interest in Rockies Express Pipeline LLC from a unit of Sempra U.S. Gas and Power that was completed in May 2016;
|
|
•
|
the demand for TEP's services, including crude oil transportation, storage and terminalling services, natural gas transportation, storage and processing services and water business services;
|
|
•
|
large or multiple customer defaults, including defaults resulting from actual or potential insolvencies;
|
|
•
|
our ability to successfully implement our business plan;
|
|
•
|
changes in general economic conditions;
|
|
•
|
competitive conditions in our industry;
|
|
•
|
the effects of existing and future laws and governmental regulations;
|
|
•
|
actions taken by third-party operators, processors and transporters;
|
|
•
|
our ability to complete internal growth projects on time and on budget;
|
|
•
|
the price and availability of debt and equity financing;
|
|
•
|
the level of production of crude oil, natural gas and other hydrocarbons and the resultant market prices of crude oil, natural gas, natural gas liquids, and other hydrocarbons;
|
1
|
•
|
the availability and price of natural gas and crude oil, and fuels derived from both, to the consumer compared to the price of alternative and competing fuels;
|
|
•
|
competition from the same and alternative energy sources;
|
|
•
|
energy efficiency and technology trends;
|
|
•
|
operating hazards and other risks incidental to transporting, storing and terminalling crude oil, transporting, storing and processing natural gas, and transporting, gathering and disposing of water produced in connection with hydrocarbon exploration and production activities;
|
|
•
|
environmental liabilities or events that are not covered by an indemnity, insurance or existing reserves;
|
|
•
|
natural disasters, weather-related delays, casualty losses and other matters beyond our control;
|
|
•
|
interest rates;
|
|
•
|
labor relations;
|
|
•
|
changes in tax status;
|
|
•
|
the effects of future litigation; and
|
|
•
|
certain factors discussed elsewhere in this Annual Report.
|
Forward-looking statements speak only as of the date on which they are made. While we may update these statements from time to time, we are not required to do so other than pursuant to the securities laws.
Overview
TEGP is a limited partnership formed in 2015 that has elected to be treated as a corporation for U.S. federal income tax purposes. We were formed as part of a reorganization involving entities that were previously controlled by Tallgrass Equity to effect the initial public offering of our Class A shares of TEGP (the "TEGP IPO"), which was completed on May 12, 2015. Our sole cash-generating asset is an approximate
36.94%
controlling membership interest in Tallgrass Equity. Tallgrass Equity's sole cash-generating assets consist of the direct and indirect partnership interests in TEP as described below:
|
•
|
Tallgrass Equity owns
100%
of the outstanding membership interests in Tallgrass MLP GP, LLC ("TEP GP"), which owns all of the general partner interest in TEP as well as all of the TEP incentive distribution rights ("IDRs"). The general partner interest in TEP is represented by
834,391
general partner units, representing an approximate
1.14%
general partner interest in TEP at
February 15, 2017
.
|
|
•
|
Tallgrass Equity owns
20,000,000
TEP common units, representing an approximately
27.41%
limited partner interest in TEP at
February 15, 2017
.
|
TEP is a publicly traded, growth-oriented limited partnership formed in 2013 to own, operate, acquire and develop midstream energy assets in North America. TEP's operations are located in and provide services to certain key United States hydrocarbon basins, including the Denver-Julesburg, Powder River, Wind River, Permian and Hugoton-Anadarko Basins and the Niobrara, Mississippi Lime, Eagle Ford, Bakken, Marcellus, and Utica shale formations. TEP intends to continue to leverage its relationship with Tallgrass Development and utilize the significant experience of its management team to execute its growth strategy of acquiring midstream assets from Tallgrass Development and third parties, increasing utilization of its existing assets and expanding its systems through construction of additional assets. For more information, see
"Tallgrass Development"
below.
TEP's reportable business segments are:
|
•
|
Crude Oil Transportation & Logistics—the ownership and operation of a FERC-regulated crude oil pipeline system and crude oil storage and terminalling facilities;
|
|
•
|
Natural Gas Transportation & Logistics—the ownership and operation of FERC-regulated interstate natural gas pipelines and integrated natural gas storage facilities; and
|
|
•
|
Processing & Logistics—the ownership and operation of natural gas processing, treating and fractionation facilities, the provision of water business services primarily to the oil and gas exploration and production industry, and the transportation of NGLs.
|
2
Additional segment and financial information is contained in TEP's segment results included in Item 7.—Management's Discussion and Analysis of Financial Condition and Results of Operations and the notes to our consolidated financial statements included in Item 8.—Financial Statements and Supplementary Data of this Annual Report.
TEP's Assets
The following map shows TEP's primary assets, which consist of crude oil transportation, storage and terminalling assets, natural gas transportation, storage and processing assets and water business services assets, excluding TEP's West Texas water business services assets. Each of these assets are described in more detail below.

Crude Oil Transportation & Logistics Segment
Pony Express.
TEP currently provides crude oil transportation to customers in Wyoming, Colorado, and the surrounding regions through its 98% membership interest in Tallgrass Pony Express Pipeline, LLC ("Pony Express"). Pony Express owns an approximately 764-mile crude oil pipeline commencing in Guernsey, Wyoming, and terminating in Cushing, Oklahoma, with delivery points at the Ponca City Refinery and in Cushing, Oklahoma, and a lateral in Northeast Colorado that commences in Weld County, Colorado, and interconnects with the pipeline just east of Sterling, Colorado (the "Pony Express System"). TEP believes the Pony Express System is positioned as a low-cost, competitive "base load" transportation system with access to Bakken Shale, DJ Basin and Powder River Basin production.
The table below sets forth certain information regarding the Pony Express System as of
December 31, 2016
and for the periods indicated:
|
Approximate Design Capacity
(bbls/d) (1) |
Approximate Contractible Capacity Under Contract
(1)(2)
|
Weighted Average Remaining Firm Contract Life
(3)
|
Approximate Average Daily Throughput (bbls/d)
|
||||||||||
|
Year Ended December 31,
|
|||||||||||||
|
2016
|
2015
|
||||||||||||
|
320,000
|
|
100
|
%
|
3 years
|
285,507
|
|
236,256
|
|
(4)
|
||||
|
(1)
|
Excludes additional capacity related to the Pony Express System's ability to inject drag reducing agent, which is an additive that increases pipeline flow efficiency.
|
3
|
(2)
|
TEP is required to make no less than 10% of design capacity available for non-contract, or "walk-up", shippers. Approximately 100% of the remaining design capacity (or available contractible capacity) is committed under contract.
|
|
(3)
|
Based on the average annual reservation capacity for each such contract's remaining life.
|
|
(4)
|
Approximate average daily throughput for the three months ended December 31, 2015 was 288,362 bbls/d. Approximate average daily throughput for the year ended December 31, 2015 reflects the volumetric ramp-up during the year due to the construction and expansion efforts of the Pony Express lateral in Northeast Colorado and third-party pipelines with which Pony Express shares joint tariffs.
|
Terminals.
TEP provides crude oil storage and terminalling services through TEP's 100% membership interest in Tallgrass Terminals, LLC ("Terminals"), which TEP acquired from Tallgrass Development effective January 1, 2017. Terminals owns and operates several assets providing storage capacity and additional injection points for the Pony Express System, including the crude oil terminal near Sterling, Colorado with approximately
1.3 million
bbls of storage capacity (the "Sterling Terminal") and the crude oil terminal in Weld County, Colorado with four truck unloading skids capable of receiving up to
16,000
bbls per day (the "Buckingham Terminal"). Terminals also owns a
20%
interest in Deeprock Development, LLC ("Deeprock Development"), which owns a crude oil terminal in Cushing, Oklahoma with approximately
2.3 million
bbls of storage capacity (the "Cushing Terminal"). In addition, Terminals owns projects currently under development to provide additional storage capacity and other potential service opportunities, including approximately
550
acres in Cushing, Oklahoma and approximately
250
acres in Guernsey, Wyoming.
Natural Gas Transportation & Logistics Segment
Rockies Express Pipeline
. TEP owns a 25% membership interest in Rockies Express Pipeline, LLC ("Rockies Express") which owns the Rockies Express Pipeline, a FERC-regulated natural gas pipeline system with approximately 1,712 miles of transportation pipelines, including laterals, extending from Opal, Wyoming and Meeker, Colorado to Clarington, Ohio (the "Rockies Express Pipeline") and consists of three zones:
|
•
|
Zone 1 - 328 miles of mainline pipeline from the Meeker Hub in Northwest Colorado, across Southern Wyoming to the Cheyenne Hub in Weld County, Colorado capable of transporting 2.0 Bcf/d of natural gas from west-to-east;
|
|
•
|
Zone 2 - 714 miles of mainline pipeline from the Cheyenne Hub to an interconnect in Audrain County, Missouri capable of transporting 1.8 Bcf/d of natural gas from west-to-east; and
|
|
•
|
Zone 3 - 643 miles of mainline pipeline from Audrain County, Missouri to Clarington, Ohio, which is bi-directional and capable of transporting 1.8 Bcf/d of natural gas from west-to-east and 2.6 Bcf/d of natural gas from east-to-west.
|
For the year ended
December 31, 2016
, approximately 98% of Rockies Express' revenues were generated under firm fee contracts.
The following tables provide information regarding the Rockies Express Pipeline as of
December 31, 2016
and for the
years ended December 31, 2016
,
2015
, and
2014
:
|
Year Ended December 31,
|
||||||||
|
2016
|
2015
|
2014
|
||||||
|
Approximate average daily deliveries (Bcf/d)
(1)
|
3.2
|
|
2.5
|
|
1.7
|
|
||
|
Approximate Capacity
|
Total Firm Contracted Capacity
(2)
|
Approximate % of Capacity Subscribed under Firm Contracts
|
Weighted Average Remaining Firm Contract Life
(3)
|
|||||
|
West-to-east
|
2.0 Bcf/d
|
1.5 Bcf/d
|
75
|
%
|
4 years
|
|||
|
East-to-west
|
2.6 Bcf/d
|
(4)
|
2.6 Bcf/d
|
100
|
%
|
16 years
|
||
|
(1)
|
Reflects average total daily deliveries for the Rockies Express Pipeline, regardless of flow direction or distance traveled.
|
|
(2)
|
Reflects total capacity reserved under long-term firm fee contracts as of
December 31, 2016
. West-to-east firm contracted capacity excludes the 0.2 Bcf/d to be contracted with Ultra as part of the settlement agreement discussed in
"Recent Developments"
in Item 7.—Management's Discussion and Analysis of Financial Condition and Results of Operations.
|
4
|
(3)
|
Weighted by contracted capacity as of
December 31, 2016
. Weighted average remaining firm contract life of west-to-east contracts excludes the 0.2 Bcf/d contract with Ultra beginning December 1, 2019 as discussed under
"Recent Developments"
in Item 7.—Management's Discussion and Analysis of Financial Condition and Results of Operations. After giving effect to the Ultra contract agreement reached in January 2017, the weighted average life of the west-to-east contract lives would be approximately 5 years.
|
|
(4)
|
East-to-west capacity of 2.6 Bcf/d is inclusive of the Rockies Express Zone 3 Capacity Enhancement Project completed in January 2017 that added an incremental 0.8 Bcf/d of east-to-west capacity within Zone 3.
|
TIGT System.
TEP owns a 100% membership interest in Tallgrass Interstate Gas Transmission, LLC ("TIGT"), which owns the Tallgrass Interstate Gas Transmission system, a FERC-regulated natural gas transportation and storage system with approximately 4,655 miles of varying diameter transportation pipelines serving Wyoming, Colorado, Kansas, Missouri and Nebraska (the "TIGT System"). The TIGT System includes the Huntsman natural gas storage facility located in Cheyenne County, Nebraska. The TIGT System primarily provides transportation and storage services to on-system customers such as local distribution companies and industrial users, including ethanol plants, and irrigation and grain drying operations, which depend on the TIGT System's interconnections to their facilities to meet their demand for natural gas and a majority of whom pay FERC-approved recourse rates. For the
year ended December 31, 2016
, approximately 88% of the TIGT System's transportation revenue was generated from contracts with on-system customers.
Trailblazer Pipeline.
TEP owns a 100% membership interest in Trailblazer Pipeline Company LLC ("Trailblazer"), which owns the Trailblazer Pipeline system, a FERC-regulated natural gas pipeline system with approximately 454 miles of transportation pipelines, including laterals, that begins along the border of Wyoming and Colorado and extends to Beatrice, Nebraska (the "Trailblazer Pipeline"). During the
year ended December 31, 2016
, substantially all of Trailblazer Pipeline's operationally available long-haul capacity was contracted under firm transportation contracts.
The following tables provide information regarding the TIGT System and Trailblazer Pipeline as of
December 31, 2016
and for the
years ended December 31, 2016
,
2015
, and
2014
:
|
Year Ended December 31,
|
||||||||
|
2016
|
2015
|
2014
|
||||||
|
Approximate average daily deliveries (Bcf/d)
(1)
|
1.1
|
|
1.1
|
|
1.0
|
|
||
|
Approximate Number of Miles
|
Approximate Capacity
|
Total Firm Contracted Capacity
(1)
|
Approximate % of Capacity Subscribed under Firm Contracts
|
Weighted Average Remaining Firm Contract Life
(2)
|
|||||||
|
Transportation
|
5,109
|
|
2.0 Bcf/d
|
1.6 Bcf/d
|
79
|
%
|
3 years
|
||||
|
Storage
|
n/a
|
|
15.974 Bcf
|
(3)
|
11 Bcf
|
69
|
%
|
5 years
|
|||
|
(1)
|
Reflects total capacity reserved under long-term firm fee contracts, including backhaul service, as of
December 31, 2016
.
|
|
(2)
|
Weighted by contracted capacity as of
December 31, 2016
.
|
|
(3)
|
The FERC certificated working gas storage capacity.
|
NatGas.
Effective January 1, 2017, TEP acquired 100% of the issued and outstanding membership interests in Tallgrass NatGas Operator, LLC ("NatGas") from Tallgrass Development. NatGas is the operator of the Rockies Express Pipeline and receives a fee from Rockies Express as compensation for its services.
5
Processing & Logistics Segment
Midstream Facilities.
TEP owns a 100% membership interest in Tallgrass Midstream, LLC ("TMID"), which owns and operates natural gas processing plants in Casper and Douglas, Wyoming and a natural gas treating facility at West Frenchie Draw, Wyoming (collectively, the "Midstream Facilities"). The Casper and Douglas plants currently have combined processing capacity of approximately 190 MMcf/d. The Casper plant also has an NGL fractionator with a capacity of approximately 3,500 barrels per day. The natural gas processed and treated at these facilities primarily comes from the Wind River Basin and the Powder River Basin, both in central Wyoming. TMID also owns and operates an NGL pipeline with an approximate capacity of 19,500 barrels per day that transports NGLs from a processing plant in Northeast Colorado to an interconnect with Overland Pass Pipeline, and TMID owns an NGL pipeline which was placed into service on January 1, 2017 that originates at our Douglas facility and interconnects with ONEOK's Bakken NGL Pipeline. As of
December 31, 2016
, approximately
99%
of TEP's reserved processing capacity was subject to firm or volumetric fee contracts, with the majority of fee revenue based on the volumes actually processed. The remaining
1%
was subject to commodity sensitive contracts. Each of TEP's NGL pipelines are supported by 10-year leases for 100% of their respective pipeline capacity, with the lease for the NGL pipeline in Northeast Colorado having commenced in October 2015, and the lease for the NGL pipeline from our Douglas facility having commenced on January 1, 2017.
The table below sets forth certain information regarding the Midstream Facilities as of
December 31, 2016
and for the
years ended December 31, 2016
,
2015
, and
2014
:
|
Approximate Plant Capacity (MMcf/d)
(1)
|
Approximate Capacity Under Contract
|
Weighted Average Remaining Contract Life
(2)
|
Approximate Average Inlet Volumes (MMcf/d)
|
||||||||||||
|
Year Ended December 31,
|
|||||||||||||||
|
2016
|
2015
|
2014
|
|||||||||||||
|
190
|
|
79
|
%
|
2 years
|
103
|
|
122
|
|
152
|
|
|||||
|
(1)
|
The West Frenchie Draw natural gas treating facility treats natural gas before it flows into the Casper and Douglas plants and therefore does not result in additional inlet capacity.
|
|
(2)
|
Based on the average annual reservation capacity for each such contract's remaining life.
|
Water Solutions.
TEP provides water business services through its 100% membership interest in BNN Water Solutions, LLC ("Water Solutions"). Water Solutions owns and operates a freshwater delivery and storage system and a produced water gathering and disposal system in Weld County, Colorado. Water Solutions is also the sole voting member and owns a 70% membership interest in BNN West Texas, LLC ("West Texas"), which owns a produced water gathering and disposal system in Reeves and Reagan County, Texas that is operated by Water Solutions. These systems are used to support third party exploration, development, and production of oil and natural gas. Water Solutions also sources treated wastewater from municipalities in Texas and recycles
f
lowback water and other water produced in association with the production of oil and gas in Colorado.
The table below sets forth certain information regarding the Water Solutions assets as of December 31, 2016 and for the years ended December 31, 2016, 2015, and 2014:
|
Approximate Capacity Under Contract
|
Approximate Current Design Capacity (bbls/d)
|
Remaining Contract Life
|
Approximate Average Volumes (bbls/d)
|
||||||||||||||
|
Year Ended December 31,
|
|||||||||||||||||
|
2016
|
2015
|
2014
|
|||||||||||||||
|
Freshwater
|
56
|
%
|
30,863
|
|
4 years
|
13,201
|
|
14,579
|
|
16,433
|
|
||||||
|
Gathering and Disposal
|
63
|
%
|
45,000
|
|
(1)
|
8 years
|
11,307
|
|
7,951
|
|
—
|
|
|||||
|
(1)
|
Represents the combined daily disposal well injection capacity for the BNN Western, LLC ("Western") produced water gathering and disposal system acquired in December 2015 and the West Texas produced water gathering and disposal system which commenced operations by Water Solutions in March 2016.
|
Major Customers
For the
year ended December 31, 2016
, Continental Resources, Inc. ("Continental Resources") and Shell Trading (US) Company ("Shell") accounted for approximately
16%
and
13%
of our revenues on a consolidated basis, respectively. The loss of these customers could have a material adverse effect on our financial results.
6
Organizational Structure
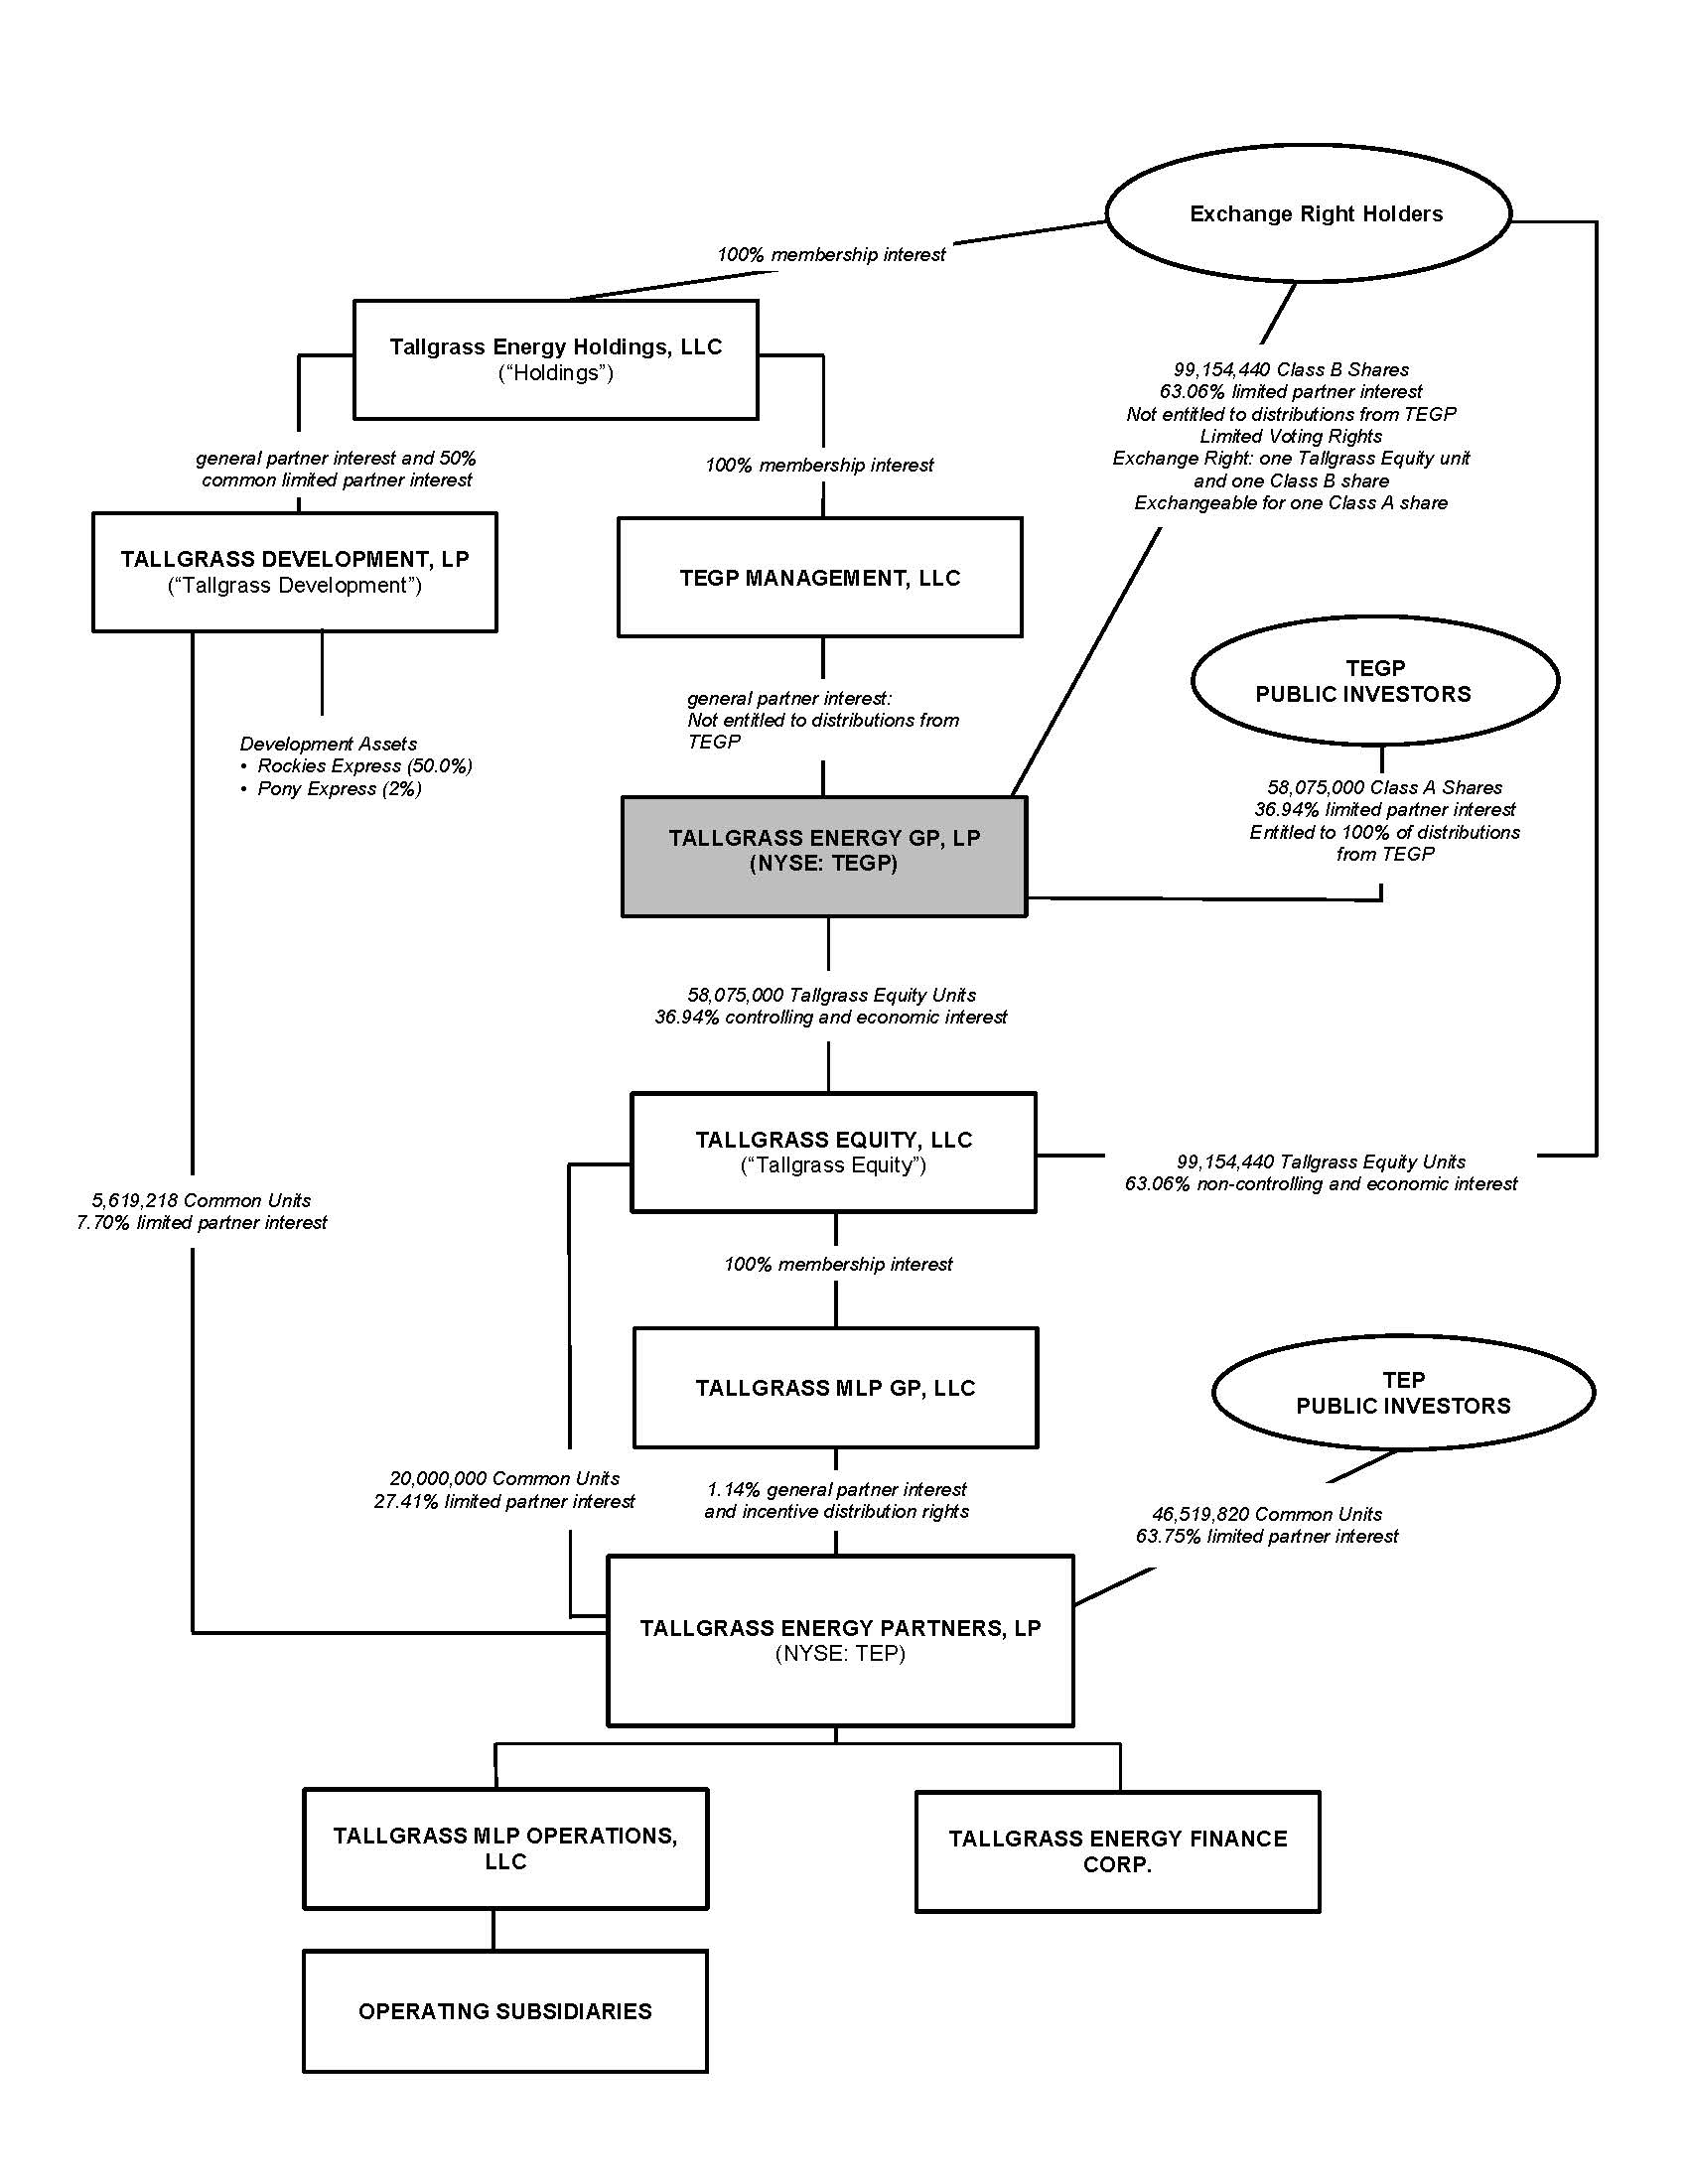
Our general partner interest is held by TEGP Management, LLC, whose sole member is Tallgrass Energy Holdings. Tallgrass Energy Holdings is also the general partner of Tallgrass Development. A group of persons, which we refer to as the Exchange Right Holders, collectively own 100% of the voting power of Tallgrass Energy Holdings, all of our outstanding Class B shares and an equivalent number of Tallgrass Equity units. The Exchange Right Holders are entitled to exercise the right to exchange their Tallgrass Equity units (together with an equivalent number of Class B shares) for Class A shares at an exchange ratio of one Class A share for each Tallgrass Equity unit exchanged. The Exchange Right Holders primarily consist of Kelso, EMG, and Tallgrass KC. Tallgrass KC refers to Tallgrass KC, LLC, which is an entity owned by certain members of our and TEP's management.
While we, like TEP, are structured as a limited partnership, our capital structure and cash distribution policy differ materially from those of TEP. Most notably, (i) we have elected to be treated as a corporation for U.S. federal income tax purposes, (ii) neither our general partner nor the holders of our Class B shares are entitled to receive any distributions from us and (iii) our capital structure does not include incentive distribution rights. Therefore, our distributions will be made exclusively to our Class A shares. However, holders of our Class A shares and Class B shares vote together as a single class on all matters presented to our shareholders for their vote or approval, except as otherwise required by applicable law or our partnership agreement. The term "shares" used in this annual report refers to both the Class A shares and Class B shares representing limited partner interests in us. References to our "shareholders" refer to the holders of our Class A and Class B shares.
Our operations are conducted directly and indirectly through, and our operating assets are owned by, our subsidiaries. Our general partner is responsible for conducting our business and managing our operations. However, Tallgrass Energy Holdings effectively controls our business and affairs through the exercise of its rights as the sole member of our general partner, including its right to appoint members to the board of directors of our general partner.
7
The chart below shows the structure of Tallgrass Energy Holdings and its subsidiaries as of
February 15, 2017
in a summary format.
8
Tallgrass Development
Tallgrass Development is controlled by its general partner, Tallgrass Energy Holdings, which also controls our general partner. In connection with TEP's initial public offering on May 17, 2013 (the "TEP IPO"), Tallgrass Development contributed to TEP 100% of the membership interests in TIGT and TMID. Since then, TEP has acquired the following additional assets from Tallgrass Development: (1) in April 2014, a 100% membership interest in Trailblazer, (2) in three separate transactions, the most recent of which was effective on January 1, 2016, a 98% membership interest in Pony Express, and (3) in January 2017, a 100% membership interest in NatGas and Terminals. In addition, in May 2016 Tallgrass Development assigned TEP its right to purchase a 25% membership interest in Rockies Express from a unit of Sempra U.S. Gas and Power ("Sempra") pursuant to the purchase agreement originally entered into between Tallgrass Development's wholly-owned subsidiary and Sempra in March 2016. Tallgrass Development continues to own a 50% interest in Rockies Express and a 2% interest in Pony Express.
Pursuant to an Omnibus Agreement entered into upon the closing of the TEP IPO, among TEP, TEP GP, Tallgrass Development and Tallgrass Energy Holdings (the "TEP Omnibus Agreement"), Tallgrass Development granted TEP a right of first offer to acquire certain assets held by Tallgrass Development at the time of the TEP IPO, which we refer to as the Retained Assets, if Tallgrass Development decides to sell such assets. The Retained Assets include Tallgrass Development's 50% interest in Rockies Express and Tallgrass Development's remaining 2% noncontrolling interest in Pony Express. Tallgrass Development is otherwise under no obligation to offer to sell TEP additional assets or to pursue acquisitions jointly with TEP, and TEP is under no obligation to buy any assets from Tallgrass Development or pursue any such joint acquisitions. However, given the significant economic interest in TEP held by Tallgrass Development and its affiliates, including Tallgrass Energy Holdings, we believe Tallgrass Development will be incentivized to offer TEP the opportunity to acquire the Retained Assets.
Further, in connection with the closing of the TEGP IPO, we, our general partner, Tallgrass Equity and Tallgrass Energy Holdings entered into an omnibus agreement (the "TEGP Omnibus Agreement"), that addresses the following matters:
|
•
|
Tallgrass Equity's obligation to reimburse Tallgrass Energy Holdings and its affiliates for expenses incurred (i) on our behalf, (ii) on behalf of our general partner and (iii) for any other purposes related to our business and activities or those of our general partner, including our public company expenses and general and administrative expenses; and
|
|
•
|
Our use of the names "TEP" and "Tallgrass" and any associated or related marks.
|
Acquisitions
The acquisition of midstream assets and businesses that are strategic and complementary to TEP's existing operations constitutes an integral component of its business strategy and growth objectives. Such assets and businesses include crude oil transportation, storage and terminalling assets, natural gas transportation, storage and processing assets and water business services assets and other energy assets that have characteristics and provide opportunities similar to TEP's existing business lines and enable TEP to leverage its assets, knowledge and skill sets. Below are summaries of significant acquisitions TEP completed in 2016 and in January 2017. See
Note 4
–
Acquisitions
to our Consolidated Financial Statements in Item 8.—Financial Statements and Supplementary Data for a full discussion regarding our acquisition activities.
|
•
|
Additional Membership Interest in Pony Express
. Effective January 1, 2016, TEP acquired an additional 31.3% membership interest in Pony Express in exchange for cash consideration of $475 million and 6,518,000 TEP common units (valued at approximately $268.6 million based on the December 31, 2015 closing price of our common units), issued to Tallgrass Development, for total consideration of approximately $743.6 million. The transaction increased TEP's aggregate membership interest in Pony Express to 98%.
|
|
•
|
Rockies Express Pipeline LLC
. Effective May 6, 2016, TEP acquired a 25% membership interest in Rockies Express from Sempra for cash consideration of approximately $436 million, or an enterprise value of approximately $1.08 billion when adjusted for our proportionate share of outstanding indebtedness at Rockies Express as of the acquisition date.
|
|
•
|
Additional Membership Interest in Water Solutions
. On July 1, 2016, TEP acquired the remaining 8% noncontrolling equity interest in Water Solutions and additional interests in Water Solutions' subsidiaries from Regency Investments I, LLC and BSEG Water Group LLC for total cash consideration of $6.0 million. Subsequent to the closing of the transaction, TEP's aggregate membership interest in Water Solutions is 100%.
|
|
•
|
Terminals and NatGas.
Effective January 1, 2017, TEP acquired 100% of the issued and outstanding membership interests in Terminals and 100% of the issued and outstanding membership interests in NatGas from Tallgrass Development for total cash consideration of $140 million.
|
9
Competition
All of TEP's businesses face strong competition for acquisitions and development of new projects from both established and start-up companies. Competition may increase the cost to acquire existing facilities or businesses and may result in fewer commitments and lower returns for new pipelines or other development projects. TEP's competitors may have greater financial resources than TEP possesses or may be willing to accept lower returns or greater risks. Competition differs by region and by the nature of the business or the project involved.
Additionally, pending and future construction projects, if and when brought online, may also compete with TEP's crude oil transportation, storage and terminalling services, natural gas transportation, storage and processing services and water transportation, gathering and disposal services. Further, natural gas as a fuel, and fuels derived from crude oil, compete with other forms of energy available to users, including electricity, coal, other liquid fuels and alternative energy. Increased demand for such forms of energy at the expense of natural gas or fuels derived from crude oil could lead to a reduction in demand for TEP's services. Moreover, several other factors may influence the demand for natural gas and crude oil which in turn influences the demand for TEP's services, including price changes, the availability of natural gas and crude oil and other forms of energy, the level of business activity, conservation, legislation and governmental regulations, weather, and the ability to convert to alternative fuels.
Pony Express encounters competition in the crude oil transportation business. A number of pipeline companies compete with Pony Express to service takeaway volumes in markets that Pony Express currently serves, including pipelines owned and operated by Spectra Energy, Sinclair, Plains All American, Suncor, SemGroup, Magellan Midstream Partners, Anadarko, NGL Energy Partners, Energy Transfer Partners, and Enbridge Energy Partners. Pony Express also competes with rail facilities, which can provide more delivery optionality to crude oil producers and marketers looking to capitalize on basis differentials between two primary crude oil price benchmarks (West Texas Intermediate Crude and Brent Crude), and with refineries that source barrels in areas served by Pony Express. In addition, Terminals encounters competition in the crude oil storage and terminalling business from similar facilities owned by Arc Logistics Partners LP, Magellan Midstream Partners, and NGL Energy Partners, that provide similar services near its Buckingham Terminal.
TEP's principal competitors in its natural gas transportation and storage business include companies that own major natural gas pipelines, such as Spectra Energy, Wyoming Interstate Company, LLC, Colorado Interstate Gas Company, LLC, Cheyenne Plains Gas Pipeline Company, LLC, Northern Natural Gas Company, and Southern Star Central Gas Pipeline, Inc., some of whom also have existing storage facilities connected to their transportation systems that compete with TEP's storage facilities. In addition to this competition, which is primarily comprised of other pipeline companies that transport gas out of the Rocky Mountain region, Trailblazer also delivers gas into a very competitive marketplace that receives gas from the developing shale plays like the Bakken, Marcellus and Utica. As these supplies increase, it reduces the need for traditional Rockies gas production that is accessible from Trailblazer.
TEP also experiences competition in the natural gas processing business. TEP's principal competitors for processing business include other facilities that service its supply areas, such as the other regional processing and treating facilities in the greater Powder River Basin which include plants owned and operated by Kinder Morgan, Inc., which we refer to as Kinder Morgan, ONEOK Partners, LP, Western Gas Partners, LP, Williams Partners L.P. and Meritage Midstream Services II, LLC. In addition, due to the competitive nature of the liquids-rich plays in the Wind River Basin and Powder River Basin, it is possible that one of TEP's competitors could build additional processing facilities that service TEP's supply areas. Further, TEP experiences competition in the water business services. TEP's principal competitors in such business are other midstream companies, such as NGL Energy Partners, who compete with Water Solutions in areas of concentrated production activity.
Regulatory Environment
Federal Energy Regulatory Commission
TEP provides open-access interstate transportation service on its natural gas transportation systems pursuant to tariffs approved by the FERC. As interstate transportation and storage systems, the rates, terms of service and continued operations of the Rockies Express Pipeline, the TIGT System and the Trailblazer Pipeline are subject to regulation by the FERC, under among other statutes, the Natural Gas Act of 1938, or NGA, the Natural Gas Policy Act of 1978, or the NGPA, and the Energy Policy Act of 2005, or EPAct 2005. The rates and terms of service on the Pony Express System are subject to regulation by the FERC under the Interstate Commerce Act, or the ICA, and the Energy Policy Act of 1992. TEP provides interstate transportation service on the Pony Express System pursuant to tariffs on file with the FERC. TEP's NGL pipeline that interconnects with Overland Pass Pipeline is leased to a third party who has obtained a waiver for itself from the FERC from the tariff, filing and reporting requirements of the ICA, and TEP's NGL pipeline that interconnects with the ONEOK's Bakken NGL Pipeline is leased to a third party who is obligated to operate the leased pipeline in conformance with the ICA as a FERC regulated NGL pipeline.
10
The FERC has jurisdiction over, among other things, the construction, ownership and commercial operation of pipelines and related facilities used in the transportation and storage of natural gas in interstate commerce, including the modification, extension, enlargement and abandonment of such facilities. The FERC also has jurisdiction over the rates, charges and terms and conditions of service for the transportation and storage of natural gas in interstate commerce. The FERC's authority over interstate crude oil pipelines is less broad than its authority over interstate natural gas pipelines and includes rates, rules and regulations for service, the form of tariffs governing service, the maintenance of accounts and records, and depreciation and amortization policies.
The rates and terms for access to interstate natural gas pipeline transportation services are subject to extensive regulation and the FERC has undertaken various initiatives to increase competition within the natural gas industry. As a result of these initiatives, interstate natural gas transportation and marketing entities have been substantially restructured to remove barriers and practices that historically limited non-pipeline natural gas sellers, including producers, from competing effectively with interstate pipelines for sales to local distribution companies and large industrial and commercial customers. The FERC's regulations require, among other things, that interstate natural gas pipelines provide firm and interruptible transportation service on an open access basis, provide internet access to current information about available pipeline capacity and other relevant information, and permit pipeline shippers under certain circumstances to release contracted transportation and storage capacity to other shippers, thereby creating secondary markets for such services. The result of the FERC's initiatives has been to eliminate interstate natural gas pipelines' historical role of providing bundled sales service of natural gas and to require pipelines to offer unbundled storage and transportation services on a not unduly discriminatory or preferential basis. The rates for such transportation and storage services are subject to the FERC's ratemaking authority, and the FERC exercises its authority by applying cost-of-service principles to limit the maximum and minimum levels of tariff-based recourse rates; however, it also allows for discounted or negotiated rates as an alternative to cost-based rates and may grant market-based rates in certain circumstances, typically with respect to storage services. The FERC regulations also restrict interstate natural gas pipelines from sharing certain transportation or customer information with marketing affiliates and require that the transmission function personnel of interstate natural gas pipelines operate independently of the marketing function personnel of the pipeline or its affiliates.
FERC; Market Behavior Rules; Posting and Reporting Requirement; Other Enforcement Authorities
EPAct 2005, among other matters, amended the NGA to add an anti-manipulation provision that makes it unlawful for any entity to engage in prohibited behavior in contravention of rules and regulations to be prescribed by the FERC and, furthermore, provides the FERC with additional civil penalty authority. The FERC adopted rules implementing the anti-manipulation provision of EPAct 2005 that make it unlawful for any entity, directly or indirectly in connection with the purchase or sale of natural gas transportation services subject to the jurisdiction of the FERC to (1) use or employ any device, scheme or artifice to defraud; (2) to make any untrue statement of material fact or omit to make any such statement necessary to make the statements made not misleading; or (3) to engage in any act or practice that operates as a fraud or deceit upon any person.
These anti-manipulation rules apply to interstate gas pipelines and storage companies and intrastate gas pipelines and storage companies that provide interstate services as well as otherwise non-jurisdictional entities to the extent the activities are conducted "in connection with" gas sales, purchases or transportation subject to FERC jurisdiction. EPAct 2005 also amended the NGA and the NGPA to give the FERC authority to impose civil penalties for violations of these statutes of more than $1 million per day per violation. In connection with this enhanced civil penalty authority, the FERC issued policy statements on enforcement to provide guidance regarding the enforcement of the statutes, orders, rules and regulations it administers, including factors to be considered in determining the appropriate enforcement action to be taken. Should we fail to comply with all applicable FERC-administered statutes, rule, regulations and orders, we could be subject to substantial penalties and fines, including the disgorgement of unjust profits.
EPAct 2005 also amended the NGA to authorize the FERC to facilitate price transparency in markets for the sale or transportation of physical natural gas in interstate commerce. The FERC has taken steps to enhance its market oversight and monitoring of the natural gas industry by adopting rules that (1) require buyers and sellers of annual quantities of 2,200,000 MMBtu or more of gas in any year to report by May on the aggregate volumes of natural gas they purchased or sold at wholesale in the prior calendar year; (2) report whether they provide prices to any index publishers and, if so, whether their reporting complies with the FERC's policy statement on price reporting; and (3) increase the Internet posting obligations of interstate pipelines.
In addition, the Commodity Futures Trading Commission, or CFTC, is directed under the Commodities Exchange Act, or CEA, to prevent price manipulations for the commodity and futures markets, including the energy futures markets. Pursuant to the Dodd-Frank Wall Street Reform and Consumer Protection Act, or Dodd-Frank Act, in July 2010 and other authority, the CFTC has adopted anti-market manipulation regulations that prohibit fraud and price manipulation in the commodity and futures markets. The CFTC also has statutory authority to seek civil penalties of up to the greater of more than $1 million or triple the monetary gain to the violator for violations of the anti-market manipulation sections of the CEA.
11
Further, the Federal Trade Commission, or FTC, has the authority under the Federal Trade Commission Act, or FTCA, and the Energy Independence and Security Act of 2007, or EISA, to regulate wholesale petroleum markets. The FTC has adopted anti-market manipulation rules, including prohibiting fraud and deceit in connection with the purchase or sale of certain petroleum products, and prohibiting omissions of material information which distort or are likely to distort market conditions for such products. In addition to other enforcement powers it has under the FTCA, the FTC can sue violators under EISA and request that a court impose fines of more than $1 million per violation per day.
The FERC also has the authority under the ICA to regulate the interstate transportation of petroleum on common carrier pipelines, including whether a pipeline's rates or rules and regulations for service are "just and reasonable." Among other enforcement powers, FERC can order prospective rate changes, suspend the effectiveness of rates, and order reparations for damages. In addition, the ICA imposes potential criminal liability for certain violations of the statute.
Certain Outstanding Notices Issued by the FERC
FERC Advanced Notice of Proposed Rulemaking, Revisions to Indexing Policies and Page 700 of FERC Form No. 6, Docket No. RM17-1-000
On November 2, 2016, the FERC issued an Advanced Notice of Proposed Rulemaking, under which the FERC is proposing changes to its regulation of oil pipelines in two different areas: (1) its policies regarding the permissible scope of rate increases based on its annual issuance of changes to the generic oil pipeline index, based on specific pipelines' earnings or their specific changes to costs; and (2) the reporting requirements for page 700 of FERC Form No. 6, Annual Report of Oil Pipeline Companies. The FERC's Advanced Notice of Proposed Rulemaking does not propose specific regulations, and may be followed by a Notice of Proposed Rulemaking proposing specific regulations or a Policy Statement announcing new or changed policies. Initial comments to such notice were required to be submitted by January 19, 2017.
Inquiry Regarding the FERC's Policy for Recovery of Income Tax Costs
On December 15, 2016, the FERC issued a Notice of Inquiry regarding the FERC's policy for recovery of income tax costs in pipeline cost of service rates. The FERC is seeking comments regarding how to address any double recovery resulting from the FERC's current income tax allowance and rate of return policies. This Notice of Inquiry follows the U.S. Court of Appeals for the District of Columbia Circuit holding in
United Airlines, Inc., et al. v. FERC
that the FERC failed to demonstrate that there is no double recovery of taxes for a partnership pipeline as a result of the income tax allowance and return on equity determined pursuant to the discounted cash flow methodology. The FERC has set a deadline for initial comments to be submitted by March 8, 2017.
Certain of our Dockets at the FERC
Rockies Express Zone 3 Capacity Enhancement Project
On March 31, 2015 in Docket No. CP15-137-000, Rockies Express filed with the FERC an application for authorization to construct and operate (1) three new mainline compressor stations located in Pickaway and Fayette Counties, Ohio and Decatur County, Indiana; (2) additional compression at one existing compressor station in Muskingum County, Ohio; and (3) certain ancillary facilities. As proposed, the facilities would increase the Rockies Express Zone 3 east-to-west mainline capacity by 0.8 Bcf/d. Pursuant to the FERC's obligations under the National Environmental Policy Act, FERC staff issued an Environmental Assessment for the project on August 31, 2015. On February 25, 2016, the FERC issued a Certificate of Public Convenience and Necessity authorizing Rockies Express to proceed with the project. On March 14, 2016, Rockies Express commenced construction of the project facilities. The project was placed in-service for the 0.8 Bcf/d on January 6, 2017.
Rockies Express Seneca Lateral Facilities Conversion
On March 2, 2015 in Docket No. CP15-102-000, Rockies Express filed with the FERC an application for (1) authorization to convert certain existing and operating pipeline and compression facilities located in Noble and Monroe Counties, Ohio (Seneca Lateral Facilities described in Docket Nos. CP13-539-000 and CP14-194-000) from NGPA Section 311 authority to NGA Section 7 jurisdiction, and (2) issuance of a certificate of public convenience and necessity authorizing Rockies Express to operate and maintain the Seneca Lateral Facilities. On April 7, 2016, the FERC issued a Certificate to Rockies Express granting its requested authorizations and on June 1, 2016 Rockies Express commenced NGA service on the Seneca Lateral.
12
TIGT 2015 General Rate Case Filing
On October 30, 2015, TIGT filed a general rate case with the FERC pursuant to Section 4 of the NGA. The rate case proposed a general system-wide increase in the maximum tariff rates for all firm and interruptible services offered by TIGT. In addition, TIGT proposed certain changes to the transportation rate design of its system to replace the current rate zone structure with a single "postage stamp" rate. TIGT also proposed new incremental charges, including (i) a charge for deliveries made to points without certain electronic flow measurement equipment, and (ii) a Cost Recovery Mechanism ("CRM") charge to completely or partially reimburse TIGT for certain expenses and costs it incurs to comply with anticipated new PHMSA and EPA regulations. TIGT also proposed to replace its fixed fuel and lost and unaccounted for ("FL&U") charge with a FL&U tracker that would compensate TIGT for its actual FL&U expenses and adjust each year to reflect the previous period's under/over collection and the forecasted FL&U expense for the upcoming period. TIGT also proposed to implement a power cost tracker to recover the actual power costs incurred by TIGT to power its compressors. Finally, TIGT proposed certain revisions to its FERC Gas Tariff addressing a number of other rate and non-rate matters. Under the NGA and the FERC's regulations, TIGT's shippers and other interested parties, including the FERC's Trial Staff, have a right to challenge any aspect of TIGT's rate case filing. Accordingly, numerous TIGT customers protested aspects of TIGT's NGA Section 4 rate filing.
On November 30, 2015, the FERC issued an order accepting and suspending the proposed rates and a majority of the proposed tariff records to be effective upon motion May 1, 2016, subject to refund, certain modifications to TIGT's proposed CRM charge, and the outcome of an evidentiary hearing before a FERC Administrative Law Judge (the "TIGT Suspension Order"). In the TIGT Suspension Order, the FERC also accepted two tariff records related to
force majeure
events and reservation charge crediting to be effective December 1, 2015, subject to certain modifications. On December 21, 2015, TIGT made a compliance filing with the FERC to modify TIGT's proposed CRM charge and update the tariff records related to
force majeure
events and reservation charge crediting as directed by the FERC in the TIGT Suspension Order. No comments or protests were filed in response to the compliance filing and the FERC accepted the compliance filing on February 1, 2016. On March 31, 2016, the FERC issued an order denying certain rehearing requests pertaining to the proposed CRM charge and removed from hearing the non-rate issues related to proposed pro forma tariff records, placing the non-rate issues under a separate review process, and allowing interveners further opportunity to comment on the pro forma tariff. TIGT and certain intervenors have since filed additional information and/or comments with respect to the proposed pro forma tariff. On February 3, 2017, the FERC accepted TIGT's pro forma tariff records, subject to conditions, and directed TIGT to file the actual tariff records within 30 days.
On June 8, 2016, TIGT filed an Offer of Settlement ("TIGT Rate Case Settlement") with the FERC, which resolved all issues set for hearing. On July 14, 2016, the presiding Administrative Law Judge certified the TIGT Rate Case Settlement to the FERC, finding that settlement was uncontested, presented no issues of first impression, had no FERC policy implications, and appeared to be just, reasonable and in the public interest. On November 2, 2016, the FERC issued an order approving the TIGT Rate Case Settlement, finding that it appeared to be fair and reasonable and in the public interest. The FERC also directed TIGT to file revised tariff records to implement the TIGT Rate Case Settlement, which TIGT filed, and the FERC subsequently approved on December 23, 2016. The November 2, 2016 order also terminated all matters in the TIGT rate case, apart from the non-rate issues related to the pro forma tariff which remain pending before the FERC. Per the terms of the TIGT Rate Case Settlement, TIGT is required to file a new general rate case on May 1, 2019 (provided that such rate case is not pre-empted by a pre-filing settlement), and no Supporting/Non-Contesting Participant, as defined in the TIGT Rate Case Settlement, is permitted to,
inter alia
, file to change the settlement rates or any other provisions set forth in the TIGT Rate Case Settlement prior to May 1, 2019.
For additional information, see
Note 18
–
Regulatory Matters
to our Consolidated Financial Statements in Item 8.—Financial Statements and Supplementary Data in this Form 10-K.
Pipeline and Hazardous Materials Safety Administration
TEP is also subject to safety regulations imposed by PHMSA, including those regulations requiring TEP to develop and maintain integrity management programs to comprehensively evaluate certain areas along TEP's pipelines and take additional measures to protect pipeline segments located in areas, which are referred to as high consequence areas, or HCAs, where a leak or rupture could potentially do the most harm.
13
In January 2012, the Pipeline Safety, Regulatory Certainty, and Job Creation Act of 2011, or The Pipeline Safety Act of 2011, which amended the Pipeline Safety Improvement Act of 2002, increased penalties for violations of safety laws and rules, among other matters, and may result in the imposition of more stringent regulations in the next few years. This legislation also requires the U.S. Department of Transportation to study and report to Congress on other areas of pipeline safety, including expanding the reach of the integrity management regulations beyond high consequence areas, but restricts the U.S. Department of Transportation from promulgating expanded integrity management rules during the review period and for a period following submission of its report to Congress unless the rulemaking is needed to address a present condition that poses a risk to public safety, property or the environment. PHMSA issued a final rule effective October 25, 2013 that implemented aspects of the new legislation. Among other things, the final rule increases the maximum civil penalties for violations of pipeline safety statutes or regulations, broadens PHMSA's authority to submit information requests, and provides additional detail regarding PHMSA's corrective action authority. In addition, the Protecting our Infrastructure of Pipelines and Enhancing Safety Act of 2016, or PIPES Act, reauthorized PHMSA's oil and gas pipeline programs through 2019 and gave PHMSA power to issue emergency orders upon finding an imminent hazard, required PHMSA to issue safety standards for underground natural gas storage facilities, set deadlines for conducting post-inspection briefings and making findings, required liquid pipeline operators to undertake new safety measures, and required certain updates to the PHMSA website.
Additionally, PHMSA is also currently considering changes to its regulations. On December 14, 2016, PHMSA issued an interim final rule, or IFR, that addresses safety issues related to downhole facilities, including well integrity, well bore tubing and casing at underground natural gas storage facilities. The IFR incorporates by reference two of the American Petroleum Institute’s Recommended Practice standards and mandates certain reporting requirements for operators of underground natural gas storage facilities. Operators of natural gas storage facilities have one year from January 18, 2017, the effective date of the IFR, to implement this first set of PHMSA regulations governing underground storage fields. On January 13, 2017, PHMSA finalized new hazardous liquid pipeline safety regulations. Among other things, the final rule requires additional event-driven and periodic inspections, requires the use of leak detection systems on all hazardous liquid pipelines, modifies repair criteria, and requires certain pipelines to eventually accommodate in-line inspection tools. Because the rule was finalized at the end of the Obama Administration, the rule is subject to a regulatory freeze pending review by the Trump Administration, unless exempted due to health and safety considerations. Assuming the rule survives the review process or is exempted from the regulatory freeze, the rule will become effective six months after its publication in the Federal Register, although certain provisions of the Final Rule will have longer compliance periods. Also, on April 8, 2016, PHMSA published a notice of proposed rule-making, or NPRM, addressing natural gas transmission and gathering lines. The proposed rule would include changes to existing integrity management requirements and would expand assessment and repair requirements to pipelines in areas with medium population densities (referred to as Moderate Consequence Areas or MCAs), along with other changes. This NPRM builds on an Advisory Bulletin PHMSA issued in May 2012, which advised pipeline operators of anticipated changes in annual reporting requirements and that if they are relying on design, construction, inspection, testing, or other data to determine the pressures at which their pipelines should operate, the records of that data must be traceable, verifiable and complete. Locating such records and, in the absence of any such records, verifying maximum pressures through physical testing (including hydrotesting) or modifying or replacing facilities to meet the demands of such pressures, could significantly increase our costs. TIGT continues to investigate and, when necessary, report to PHMSA the miles of pipeline for which it has incomplete records for maximum allowable operating pressure, or MAOP. We are currently undertaking an extensive internal record review in view of the anticipated PHMSA annual reporting requirements. Additionally, failure to locate such records or verify maximum pressures could result in reductions of allowable operating pressures, which would reduce available capacity on our pipelines. At the state level, several states have passed legislation or promulgated rulemaking dealing with pipeline safety. There can be no assurance as to the amount or timing of future expenditures for pipeline integrity regulation, and actual future expenditures may be different from the amounts we currently anticipate. Regulations, changes to regulations or an increase in public expectations for pipeline safety may require additional reporting, the replacement of some of our pipeline segments, the addition of monitoring equipment and more frequent inspection or testing of our pipeline facilities. Any repair, remediation, preventative or mitigating actions may require significant capital and operating expenditures.
Pipeline Integrity Issues
The ultimate costs of compliance with the integrity management rules are difficult to predict. Changes such as advances of in-line inspection tools, identification of additional threats to a pipeline's integrity and changes to the amount of pipe determined to be located in HCAs or expansion of integrity management requirements to areas outside of HCAs can have a significant impact on the costs to perform integrity testing and repairs. TEP will continue pipeline integrity testing programs to assess and maintain the integrity of its existing and future pipelines as required by the U.S. Department of Transportation regulations. The results of these tests could cause TEP to incur significant and unanticipated capital and operating expenditures for repairs or upgrades deemed necessary to ensure the continued safe and reliable operation of its pipelines, which expenditures could be material.
14
From time to time, TEP's pipelines may experience integrity issues. These integrity issues may cause explosions, fire, damage to the environment, damage to property and/or personal injury or death. In connection with these incidents, TEP may be sued for damages caused by an alleged failure to properly mark the locations of its pipelines and/or to properly maintain its pipelines. Depending upon the facts and circumstances of a particular incident, state and federal regulatory authorities may seek civil and/or criminal fines and penalties and TEP may also be subject to private civil liability for such matters.
Trailblazer
Trailblazer is currently operating at less than its current MAOP, public notice of which was first provided in June 2014. As a result of smart tool surveys in 2014, Trailblazer has identified approximately
25
-
35
miles of pipe that will likely need to be repaired or replaced in order for the pipeline to operate at its MAOP of
1,000
pounds per square inch across all segments of the Trailblazer Pipeline. Such repair or replacement will likely occur over a period of years, depending upon the remediation and repair plan implemented by Trailblazer. Segments of the Trailblazer Pipeline that require full replacement could cost as much as
$2.7 million
per mile and repair costs on sections of the pipeline that do not require full replacement are expected to be less on a per mile basis. The current pressure reduction is not expected to prevent Trailblazer from fulfilling its firm service obligations at existing subscription levels and to date it has not had a material adverse financial impact on us.
With respect to the approximately
25
-
35
miles of pipe that has been identified, Trailblazer completed
32
excavation digs in 2015 at an aggregate cost of approximately
$1.3 million
. During 2016, Trailblazer completed additional excavation digs and replaced approximately
8
miles of pipe at an aggregate cost of approximately
$19.0 million
. Trailblazer is currently exploring all possible cost recovery options to recover such out of pocket costs, including recovery through a general rate increase, negotiated rate agreements with its customers, or other FERC-approved recovery mechanisms.
In connection with our acquisition of the Trailblazer Pipeline, TD agreed to contractually indemnify TEP for any out of pocket costs incurred between April 1, 2014 and April 1, 2017 related to repairing or remediating the Trailblazer Pipeline, to the extent that such actions are necessitated by external corrosion caused by the pipeline's disbonded Hi-Melt CTE coating. The contractual indemnity provided by TD is capped at
$20 million
and is subject to an annual
$1.5 million
deductible. In connection with the 2016 repairs and remediation on the Trailblazer Pipeline, TEP has received
$17.9 million
from TD pursuant to the contractual indemnity.
Pony Express
In connection with certain crack tool runs on the Pony Express System completed in 2015 and 2016, Pony Express completed approximately
$9.8 million
of remediation in 2016 for anomalies identified on the Pony Express System associated with portions of the pipeline that were converted from natural gas to crude oil service, and expects to complete additional remediation in 2017 on the Pony Express System of approximately
$9 million
.
Environmental, Health and Safety Matters
General
The ownership, operation and expansion of TEP's assets are subject to federal, state and local laws, regulations and potential liabilities arising under or relating to the protection or preservation of the environment, natural resources and human health. These laws and regulations can restrict or impact TEP's business activities in many ways, such as restricting the way TEP can handle or dispose of its wastes, requiring remedial action to mitigate pollution conditions that may be caused by its operations or that are attributable to former operations, regulating future construction activities to mitigate harm to threatened or endangered species, wetlands and migratory birds, and requiring the installation and operation of pollution control or seismic monitoring equipment. The cost of complying with these laws and regulations can be significant, and TEP expects to incur significant compliance costs in the future as new, more stringent requirements are adopted and implemented.
Failure to comply with existing environmental laws, regulations, permits, approvals or authorizations or to meet the requirements of new environmental laws, regulations or permits, approvals and authorizations may trigger a variety of administrative, civil and criminal enforcement measures, including the assessment of monetary penalties and/or temporary or permanent interruptions in TEP's operations that could influence its business, financial position, results of operations and prospects. Certain environmental statutes impose strict joint and several liability for costs required to clean up and restore sites where hazardous substances, hydrocarbons or wastes have been disposed or otherwise released. The costs and liabilities resulting from a failure to comply with environmental laws and regulations could negatively affect TEP's business, financial position, results of operations and prospects. Moreover, it is not uncommon for neighboring landowners and other third parties to file claims for personal injury and property damage allegedly caused by the release of hazardous substances, hydrocarbons or other waste products into the environment.
15
In addition, TEP has agreed to a number of conditions in its environmental permits, approvals and authorizations that require the implementation of environmental habitat restoration, enhancement and other mitigation measures that involve, among other things, ongoing maintenance and monitoring. Governmental authorities may require, and community groups and private persons may seek to require, additional mitigation measures in the future to further protect ecologically sensitive areas where TEP currently operates, and would operate in the future, and TEP is unable to predict the effect that any such measures would have on its business, financial position, results of operations or prospects.
TEP is also subject to the requirements of the Occupational Health and Safety Act, or OSHA, the Pipeline Safety Act and other comparable federal and state statutes. In general, TEP expects that it may have to increase expenditures in the future to comply with higher industry and regulatory safety standards. Such increases in expenditures could become significant over time.
Historically, TEP's total expenditures for environmental control measures and for remediation have not been significant in relation to TEP's consolidated financial position or results of operations. It is reasonably likely, however, that the long-term trend in environmental legislation and regulations will continue towards more restrictive standards. Compliance with these standards is expected to increase the cost of conducting business.
For additional information regarding Environmental, Health and Safety Matters, please read Item 1A.—Risk Factors.
Air Emissions
TEP's operations are subject to the federal Clean Air Act, or CAA, and comparable state laws and regulations. These laws and regulations regulate emissions of air pollutants from various industrial sources, including natural gas processing plants and compressor stations, and also impose various monitoring and reporting requirements. Such laws and regulations may require that TEP obtains pre-approval for the construction or modification of certain projects or facilities expected to produce air emissions or result in the increase of existing air emissions (including GHG emissions, as discussed below), obtain and strictly comply with air permits containing various emissions and operational limitations and/or install emission control equipment. TEP may be required to incur certain capital expenditures in the future for air pollution control equipment and technology in connection with obtaining and maintaining operating permits and approvals for air emissions.
The EPA finalized a rule, effective August 2, 2016, under the New Source Performance Standard Program, or NSPS Program, to limit methane emissions from the oil and gas and transmission sectors. The rule sets additional emissions limits for volatile organic compounds and regulates methane emissions for new and modified sources in the oil and gas industry. The EPA also finalized a rule regarding the alternative criteria for aggregating multiple small surface sites into a single source for air-quality permitting purposes. Also, effective January 17, 2017 the Bureau of Land Management of the U.S. Department of the Interior, or BLM, imposed new rules to reduce venting, flaring and leaks during oil and natural gas production activities on onshore Federal and Indian lands.
Developments in GHG Regulations
Methane, a primary component of natural gas, and carbon dioxide, a byproduct of the burning of natural gas and products produced from crude oil, are examples of GHGs. The EPA has determined that the emission of GHGs present an endangerment to public health and the environment because emissions of such gases contribute to the warming of the Earth's atmosphere and other climatic changes. Various laws and regulations exist or are under development that seek to regulate the emission of such GHGs, including the EPA programs to control GHG emissions and state actions to develop statewide or regional programs. In recent years, the U.S. Congress has considered, but not adopted, legislation to reduce emissions of GHGs. There have also been efforts to regulate GHGs at an international level, most recently in the Paris Agreement, which was signed on April 22, 2016 by 175 countries, including the United States. The Paris Agreement will require countries to review and "represent a progression" in their intended, nationally-determined contributions, which set GHG emission reduction goals, every five years beginning in 2020.
16
Because TEP's operations, including its compressor stations, emit various types of GHGs, primarily methane and carbon dioxide, such new legislation or regulation could increase its costs related to operating and maintaining its facilities. Depending on the particular new law, regulation or program adopted, TEP could be required to incur capital expenditures for installing new emission controls on its facilities, acquire permits or other authorizations for emissions of GHGs from its facilities, acquire and surrender allowances for its GHG emissions, pay taxes related to its GHG emissions and administer and manage a GHG emissions program. TEP is not able at this time to estimate such increased costs; however, as is the case with similarly situated entities in the industry, they could be significant to TEP. While TEP may be able to include some or all of such increased costs in the rates charged by its pipelines, such recovery of costs in all cases is uncertain and may depend on events beyond its control including the outcome of future rate proceedings before the FERC and the provisions of any final legislation or other regulations. Similarly, while TEP may be able to recover some or all of such increased costs in the rates charged by its processing facilities, such recovery of costs is uncertain and may depend on the terms of its contracts with its customers. In addition, new laws, regulations, or programs adopted could also impact TEP's customers' operations or the overall demand for fossil fuels. Any of the foregoing could have an adverse effect on TEP's business, financial position, results of operations and prospects.
Regulation of Hydraulic Fracturing
A sizeable portion of the hydrocarbons TEP transports, processes, and stores comes from hydraulically fractured wells. Hydraulic fracturing is an important and common practice that is used to stimulate production of hydrocarbons from tight formations. The process typically involves the injection of water, sand and a small percentage of chemicals under pressure into the formation to fracture the surrounding rock and stimulate production. The process is regulated by state agencies, typically the state's oil and gas commission; however, the EPA has asserted federal regulatory authority over certain hydraulic fracturing activities involving diesel under the federal Safe Drinking Water Act, or SDWA and has released draft permitting guidance for hydraulic fracturing activities that use diesel in fracturing fluids in those states where the EPA is the permitting authority. A number of federal agencies, including the EPA and the U.S. Department of Energy, are analyzing, or have been requested to review, a variety of environmental issues associated with hydraulic fracturing. In addition, some states, including those in which TEP operates, have adopted, and other states are considering adopting, regulations that could impose more stringent disclosure and/or well construction requirements on hydraulic fracturing operations. Other states, including states in which TEP operates, have restrictions on produced water storage from hydraulic fracturing operations and the operation of produced water disposal wells. Local government also may seek to adopt ordinances within their jurisdictions regulating the time, place and manner of drilling activities in general or hydraulic fracturing activities in particular, and in some cases, may seek to ban hydraulic fracturing entirely. Some state and local authorities have considered or imposed new laws and rules related to hydraulic fracturing, including temporary or permanent bans, additional permit requirements, operational restrictions and chemical disclosure obligations on hydraulic fracturing in certain jurisdictions or in environmentally sensitive areas.
If new laws or regulations that significantly restrict hydraulic fracturing are adopted, such laws could make it more difficult or costly for TEP's customers to perform fracturing to stimulate production from tight formations. Restrictions on hydraulic fracturing could also reduce the volume of crude oil, natural gas, and NGLs that TEP's customers produce, and could thereby adversely affect TEP's revenues and results of operations.
Hazardous Substances and Waste
TEP's operations are subject to environmental laws and regulations relating to the management and release of hazardous substances, nonhazardous and hazardous wastes and petroleum hydrocarbons. These laws generally regulate the generation, storage, treatment, transportation and disposal of nonhazardous and hazardous waste and may impose strict joint and several liability for the investigation and remediation of affected areas where hazardous substances may have been released or disposed. For instance, the Comprehensive Environmental Response, Compensation, and Liability Act, or CERCLA, and comparable state laws impose liability, without regard to fault or the legality of the original conduct, on certain classes of persons that contributed to the release or threatened release of a hazardous substance into the environment. TEP may handle hazardous substances within the meaning of CERCLA, or analogous state laws, in the course of its ordinary operations and, as a result, may be jointly and severally liable under CERCLA for all or part of the costs required to clean up sites at which these hazardous substances have been released or threatened to be released into the environment.
TEP also generates wastes that are subject to the Resource Conservation and Recovery Act, or RCRA, and comparable state laws. RCRA regulates both nonhazardous and hazardous solid wastes, but it imposes strict requirements on the generation, storage, treatment, transportation and disposal of hazardous wastes. It is possible that wastes resulting from TEP's operations that are currently treated as non-hazardous wastes could be designated as "hazardous wastes" in the future, subjecting TEP to more rigorous and costly management and disposal requirements. It is also possible that federal or state regulatory agencies will adopt stricter management or disposal standards for non-hazardous wastes, including natural gas wastes. Any such changes in the laws and regulations could have a material adverse effect on TEP's business, financial position, results of operations and prospects or otherwise impose limits or restrictions on its operations or those of its customers.
17
In some cases, TEP owns or leases properties where hydrocarbons are being or have been handled for many years. Hydrocarbons or other wastes may have been disposed of or released on or under the properties owned or leased by TEP or on or under the locations where these hydrocarbons and wastes have been transported for treatment or disposal. TEP could also have liability for releases or disposal on properties owned or leased by others. These properties and the wastes disposed thereon may be subject to CERCLA, RCRA and analogous state laws. Under these laws, TEP could be required to remove or remediate previously disposed wastes (including wastes disposed of or released by prior owners and operators), to clean up contaminated property (including contaminated groundwater) or to perform remedial operations to prevent future contamination.
TEP's produced water disposal operations require it to comply with the Class II well standards under the federal SDWA. The SDWA imposes requirements on owners and operators of Class II wells through the EPA's Underground Injection Control program, including construction, operating, monitoring and testing, reporting and closure requirements. TEP's disposal wells are also subject to comparable state laws and regulations. Compliance with current and future laws and regulations regarding TEP's produced water disposal wells may impose substantial costs and restrictions on its produced water disposal operations, as well as adversely affect demand for its produced water disposal services. State and federal regulatory agencies recently have focused on a possible connection between the operation of produced water injection wells used for oil and gas waste disposal and seismic activity and tremors. When caused by human activity, such events are called induced seismicity. In some instances, operators of produced water injection wells in the vicinity of minor seismic events have been ordered to reduce produced water injection volumes or suspend operations. Regulatory agencies are continuing to study possible linkage between produced water injection activity and induced seismicity. These developments could result in additional regulation of produced water injection wells, such regulations could impose additional costs and restrictions on TEP's produced water disposal operations.
Federal and State Waters
The Federal Water Pollution Control Act, also known as the Clean Water Act, or the CWA, and comparable state laws impose restrictions and strict controls regarding the discharge of pollutants, including petroleum products, into state waters or waters of the United States. The EPA and the U.S. Army Corps of Engineers recently adopted a rule to clarify the meaning of the term "waters of the United States" with respect to federal jurisdiction; that rule is currently stayed nationwide. Many interested parties believe that the rule expands federal jurisdiction under the CWA. Regulations promulgated pursuant to the CWA and analogous state laws require that entities that discharge into federal and/or state waters obtain National Pollutant Discharge Elimination System, or NPDES, permits and/or state permits authorizing these discharges. The CWA and analogous state laws assess administrative, civil and criminal penalties for discharges of unauthorized pollutants into the water and impose substantial liability for the costs of removing spills from such waters. In addition, the CWA and analogous state laws require that individual permits or coverage under general permits be obtained by covered facilities for discharges of storm water runoff. Some states also maintain groundwater protection programs that require permits for discharges or operations that may impact groundwater. We believe that TEP is in substantial compliance with the CWA permitting requirements as well as the conditions imposed thereunder and that continued compliance with such existing permit conditions will not have a material effect on its results of operations.
The primary federal law related to oil spill liability is the Oil Pollution Act, or OPA, which amends and augments oil spill provisions of the CWA and imposes certain duties and liabilities on certain "responsible parties" related to the prevention of oil spills and damages resulting from such spills in or threatening United States waters or adjoining shorelines. Spill prevention, control and countermeasure requirements of federal laws and analogous state laws require TEP to maintain spill prevention control and countermeasure plans. These laws also require appropriate containment berms and similar structures to help prevent the contamination of regulated waters in the event of a hydrocarbon tank spill, rupture or leak. Regulations promulgated pursuant to OPA further require certain facilities to maintain oil spill prevention and oil spill contingency plans. A liable "responsible party" includes the owner or operator of a facility, vessel or pipeline that is a source of an oil discharge or that poses the substantial threat of discharge, or in the case of offshore facilities, the lessee or permittee of the area in which a discharging facility is located. OPA assigns joint and several liability, without regard to fault, to each liable party for oil removal costs and a variety of public and private damages. Although defenses exist to the liability imposed by OPA, they are limited. In the event of an oil discharge or substantial threat of discharge, TEP may be liable for costs and damages.
Endangered Species
The Endangered Species Act, or ESA, restricts activities that may affect endangered or threatened species or their habitats. While some of TEP's operations may be located in areas that are designated as habitats for endangered or threatened species, we believe that TEP is in substantial compliance with the ESA. However, the designation of previously unlisted endangered or threatened species could cause TEP to incur additional costs or become subject to operating restrictions or bans or limit future development in the affected areas.
18
National Environmental Policy Act
The National Environmental Policy Act, or NEPA, establishes a national environmental policy and goals for the protection, maintenance and enhancement of the environment and provides a process for implementing these goals within federal agencies. A major federal agency action having the potential to significantly impact the environment requires review under NEPA and, as a result, many activities requiring FERC or other federal approval must undergo a NEPA review. A NEPA review can create delays and increased costs that could materially adversely affect TEP's operations.
Employee Safety
TEP is subject to the requirements of OSHA and comparable state statutes that regulate the protection of the health and safety of workers. In addition, the OSHA hazard communication standard requires that information be maintained about hazardous materials used or produced in operations and that this information be provided to employees, state and local government authorities and citizens. We believe that TEP's operations are in substantial compliance with OSHA requirements, including general industry standards, record keeping requirements, and monitoring of occupational exposure to regulated substances.
Seasonality
Weather generally impacts natural gas demand for power generation, heating purposes and other natural gas usages, which in turn influences the value of transportation and storage. Price volatility also affects gas prices, which in turn influences drilling and production. Peak demand for natural gas typically occurs during the winter months, caused by heating demand. Nevertheless, because a high percentage of TEP's natural gas transportation and storage and crude oil transportation revenues are derived from firm capacity reservation fees under long-term firm fee contracts, TEP's revenues attributable to those segments are not generally seasonal in nature. TEP experiences some seasonality in its processing segment, as volumes at its processing facilities are slightly higher in the summer months. TEP also experiences some seasonality in its maintenance, repair, overhaul, integrity, and other projects, as warm weather months are most conducive to efficient execution of these activities.
Title to Properties and Rights-of-Way
TEP's real property generally falls into two categories: (i) parcels that it owns in fee and (ii) parcels in which its interest derives from leases, easements, rights-of-way, permits, surface use agreements, or licenses from landowners or governmental authorities, permitting the use of such land for its operations. Portions of the land on which its pipelines and facilities are located are owned by TEP in fee title, and we believe that TEP has satisfactory title to these lands. The remainder of the land on which TEP's pipelines and facilities are located are held by TEP pursuant primarily to leases, easements, rights-of-way, permits, surface use agreements or licenses between TEP, as grantee, and a third party, as grantor. We believe that TEP has satisfactory title to all of its material parcels that TEP owns in fee and the material parcels in which TEP's interest derives from leases, easements, rights-of-way, permits and licenses, and TEP has no knowledge of any challenge that TEP expects will impact its title to such assets or their underlying fee title in any material respect.
Some of the leases, easements, rights-of-way, permits and licenses TEP acquires, including those TEP acquired in the TEP IPO, require the consent of the grantor for the assignment/conveyance of such rights, which in certain instances is a governmental entity. The transferor, such as Tallgrass Development or its affiliates, may continue to hold record title to portions of certain assets until TEP makes the appropriate filings in the jurisdictions in which such assets are located and obtain any consents and approvals that are not obtained prior to transfer. Such consents and approvals would include those required by federal and state agencies or political subdivisions. In some cases, Tallgrass Development may, where required consents or approvals have not been obtained, temporarily hold record title to property as nominee for TEP's benefit and in other cases may, on the basis of expense and difficulty associated with the conveyance of title, cause its affiliates to retain title, as nominee for TEP's benefit, until a future date. TEP anticipates that there will be no material change in the tax treatment of TEP common units resulting from Tallgrass Development holding the title to any part of such assets subject to future conveyance or as its nominee.
Insurance
We generally share insurance coverage with Tallgrass Development, for which we reimburse Tallgrass Development and its affiliates for our share of the cost pursuant to the terms of the TEGP Omnibus Agreement and TEP Omnibus Agreement. This shared insurance program includes general and excess liability insurance, auto liability insurance, workers' compensation insurance, pollution, business interruption and property and director and officer liability insurance. All insurance coverage is in amounts which management believes are reasonable and appropriate.
19
Employees
We do not have any employees. We are managed and operated by the board of directors and executive officers of our general partner. All of our employees are employed by an affiliate of Tallgrass Energy Holdings and devote the portion of their time to our business and affairs that is reasonably required to manage and conduct our operations. Under the terms of the TEGP Omnibus Agreement, the TEP Omnibus Agreement and our partnership agreement, we reimburse Tallgrass Development and our general partner, respectively, for the provision of various general and administrative services for our benefit and for direct expenses incurred by Tallgrass Development or our general partner on our behalf, including services performed and expenses incurred by our executive management personnel in connection with our business and affairs.
Available Information
We make certain filings with the SEC, including our Annual Report on Form 10-K, quarterly reports on Form 10-Q, current reports on Form 8-K, and all amendments and exhibits to those reports. We make such filings available free of charge through our website, www.tallgrassenergy.com, as soon as reasonably practicable after they are filed with the SEC. The filings are also available through the SEC's website, www.sec.gov, at the SEC's Public Reference Room at 100 F Street, N.E., Washington, D.C. 20549 or by calling 1-800-SEC-0330. Our press releases and recent presentations are also available on our website.
Limited partner interests are inherently different from shares of capital stock of a corporation, although many of the business risks to which we are subject are similar to those that would be faced by a corporation engaged in similar businesses. If any of the following risks were to occur, our business, financial condition or results of operations could be materially adversely affected. In that case, we might not be able to pay quarterly distributions on our Class A shares at the current distribution level, or pay any distribution at all, and the trading price of our Class A shares could decline. References to "us," "we," and "our" in this Item 1A refer to Tallgrass Energy GP, LP in its individual capacity.
Risks Inherent in an Investment in Us
Our only cash-generating asset is a
36.94%
membership interest in Tallgrass Equity and therefore our cash flow is entirely dependent upon the ability of TEP to make cash distributions to Tallgrass Equity, and the ability of Tallgrass Equity to make cash distributions to us.
Our only current source of earnings and cash flow is cash distributions from Tallgrass Equity, which currently consists exclusively of cash distributions from TEP. The amount of cash that TEP can distribute to its partners, including Tallgrass Equity, each quarter principally depends upon the amount of cash it generates from its business. For a description of certain factors that can cause fluctuations in the amount of cash that TEP generates from its business, please read the section entitled "Risks Related to TEP's Business." TEP may not have sufficient available cash each quarter to continue paying distributions at its current level or at all. If TEP reduces its per unit distribution, either because of reduced operating cash flow, higher expenses, capital requirements or otherwise, we will have less cash available for distribution to you and would likely be required to reduce our per share distribution to you. You should also be aware that the amount of cash TEP has available for distribution depends primarily upon TEP's distributable cash flow, including cash flow from the release of financial reserves as well as borrowings, not profitability, which will be affected by non-cash items. As a result, TEP may make cash distributions during periods when it records losses and may not make cash distributions during periods when it records profits.
Furthermore, Tallgrass Equity's ability to distribute cash to us and our ability to distribute cash received from Tallgrass Equity to our Class A shareholders is limited by a number of factors, including:
|
•
|
Tallgrass Equity's payment of costs and expenses associated with our, our general partner's, Tallgrass Energy Holdings', and Tallgrass Equity's respective operations, including expenses we incur as a result of being a public company, which costs and expenses are not subject to a limit pursuant to the TEGP Omnibus Agreement;
|
|
•
|
our payment of any income taxes;
|
|
•
|
interest expense and principal payments on any indebtedness incurred by TEP, Tallgrass Equity, TEP GP or us;
|
|
•
|
restrictions on distributions contained in Tallgrass Equity's and TEP's respective revolving credit facilities, the indenture governing TEP's 5.50% senior notes due 2024 and any future debt agreements entered into by Tallgrass Equity, TEP, TEP GP or us;
|
|
•
|
reserves created by our general partner as necessary to permit Tallgrass Equity to make capital contributions to TEP GP, including for it to maintain or attain up to a 2.0% general partner interest in TEP; and
|
20
|
•
|
reserves our general partner or TEP GP establish for the proper conduct of our, Tallgrass Equity's or TEP's business, including reserves to comply with applicable law or any agreement binding on us for future distributions, our subsidiaries, Tallgrass Equity, Tallgrass Equity's subsidiaries, TEP and TEP's subsidiaries, which reserves are not subject to a limit pursuant to our partnership agreement, TEP's partnership agreement or Tallgrass Equity's limited liability company agreement.
|
A material increase in amounts paid or reserved with respect to any of these factors could restrict our ability to pay quarterly distributions to our Class A shareholders.
We may limit, modify or eliminate the incentive distributions that Tallgrass Equity is entitled to receive through its ownership of TEP's incentive distribution rights without the consent of our shareholders, which may reduce cash distributions to you.
We own a
36.94%
membership interest in Tallgrass Equity, which, through its ownership of all the membership interests in TEP GP, is entitled to receive increasing percentages (up to a maximum of 48%, to the extent not modified or eliminated) of any cash distributed by TEP in excess of $0.3048 per TEP common unit in any quarter. The majority of the cash flow we received from Tallgrass Equity in 2016 was derived from its ownership of these IDRs.
TEP, like other publicly traded partnerships, generally targets acquisitions or expansion capital projects that, after giving effect to related costs and expenses, would be expected to be accretive, meaning they would increase cash distributions per unit in future periods. Because Tallgrass Equity, through its ownership of TEP GP, currently participates in the IDRs at all levels, including the highest sharing level of 48%, it is harder for an acquisition or capital project to show accretion for the common unitholders of TEP than if the IDRs received less incremental cash flow. As a result, our general partner may agree to allow TEP's general partner to modify, reduce or eliminate the IDRs to facilitate a particular acquisition or expansion capital project. Any such modification, reduction or elimination of IDRs would likely reduce the amount of cash that would have otherwise been distributed by Tallgrass Equity to us, which could in turn reduce the cash distributions we would otherwise be able to pay to you. Our shareholders are not able to vote on or otherwise prohibit TEP's general partner from modifying or eliminating the TEP IDRs, and our general partner may agree to allow TEP's general partner to reduce, modify or eliminate the IDRs without considering the interests of the holders of our Class A shares. In addition, there can be no guarantee that the expected benefits of any IDR modification, reduction or elimination will be realized.
A reduction in TEP's distributions will disproportionately affect the amount of cash distributions to which Tallgrass Equity is currently entitled.
Tallgrass Equity's indirect ownership of TEP's IDRs entitle it to receive increasing percentages, ranging from 13% up to 48%, to the extent not reduced, modified or eliminated, of all cash distributed by TEP in excess of $0.3048 per TEP common unit per quarter. A decrease in the amount of distributions paid by TEP to less than $0.4313 per TEP common unit per quarter would reduce Tallgrass Equity's percentage of incremental cash distributions in excess of $0.3048 per TEP common unit per quarter from 48% to as low as 13%. A decrease in the amount of distributions paid by TEP to less than $0.3048 per TEP common unit per quarter would result in Tallgrass Equity not receiving any incremental cash distributions with respect to the IDRs for such quarter. As a result, any such reduction in quarterly cash distributions from TEP would have the effect of disproportionately reducing the amount of distributions that Tallgrass Equity receives from TEP in respect of the IDRs as compared to cash distributions TEP makes with respect to its common units and general partner interest.
Our distributions to our Class A shareholders are not cumulative.
Our distributions to our Class A shareholders are not cumulative. Consequently, if distributions on our Class A shares are not paid with respect to any fiscal quarter then our Class A shareholders will not be entitled to receive that quarter's payments in the future.
The amount of cash that we and TEP distribute each quarter may limit our ability to grow.
Because we distribute all of our available cash, our growth may not be as fast as the growth of businesses that reinvest their available cash to expand ongoing operations. In fact, because our cash flow is generated solely from distributions we receive from Tallgrass Equity, which are derived from Tallgrass Equity's direct and indirect partnership interests in TEP, our growth is currently completely dependent upon TEP. The amount of distributions received by Tallgrass Equity, including distributions in respect of the IDRs, is based on distributions paid on each TEP common unit, the number of TEP common units outstanding, the number of TEP common units owned by Tallgrass Equity and the general partnership interest owned by TEP GP. If we issue additional Class A shares without canceling an equivalent number of Class B shares, Tallgrass Equity incurs additional debt, we incur debt or we or Tallgrass Equity are required to pay taxes, the payment of distributions on those additional Class A shares or interest on that debt or payment of such taxes could increase the risk that we will be unable to maintain or increase our cash distribution levels.
21
Our rate of growth will be reduced to the extent we purchase additional equity interests from TEP, which will reduce the percentage of our cash flow that we receive from the IDRs.
Our business strategy includes, where appropriate, supporting the growth of TEP through the use of our capital resources, including by potentially purchasing TEP common units or lending funds to TEP to finance acquisitions or internal growth projects. To the extent we purchase common units or securities not entitled to a current distribution from TEP, the rate of our distribution growth will be reduced, at least in the short-term, because a smaller percentage of our cash distributions would come from our ownership of the IDRs, which increase at a faster rate than TEP's common units and any similar equity interests TEP may issue in the future.
Restrictions in Tallgrass Equity's and TEP's respective revolving credit facilities and the indenture governing TEP's 5.50% senior notes due 2024 could limit Tallgrass Equity's ability to make distributions to us, thereby limiting our ability to make distributions to our Class A shareholders. Any credit facility we enter into in the future could pose similar restrictions that would further limit our ability to make distributions.
Tallgrass Equity's and TEP's respective revolving credit facilities contain various operating and financial restrictions and covenants. Tallgrass Equity's and TEP's respective ability to comply with these restrictions and covenants may be affected by events beyond their control, including prevailing economic, financial and industry conditions. If Tallgrass Equity or TEP is unable to comply with these restrictions and covenants, any indebtedness under these revolving credit facilities may become immediately due and payable and Tallgrass Equity's and TEP's respective lenders' commitment to make further loans under these revolving credit facilities may terminate. Tallgrass Equity or TEP might not have, or be able to obtain, sufficient funds to make these accelerated payments.
Tallgrass Equity's payment of principal and interest on indebtedness reduces its cash distributions to us, thereby reducing our cash available for distribution on our Class A shares. Tallgrass Equity's revolving credit facility would effectively prevent us from paying distributions to our Class A shareholders to the extent Tallgrass Equity is prohibited from making cash distributions during an event of default or if an event of default would result from the distribution.
We may enter into a credit facility in the future that would impose similar restrictions to those discussed above. In addition, our payment of principal and interest on any future indebtedness would reduce our cash available for distribution to our Class A shares.
For more information regarding Tallgrass Equity's revolving credit facility, please see
Note 11
–
Long-term Debt
to the Consolidated Financial Statements in Item 8.—Financial Statements and Supplementary Data. For more information regarding TEP's revolving credit facility, please see the section "—
Risks Related to TEP's Business - TEP's revolving credit facility and the indenture governing TEP's 5.50% senior notes due 2024 contain certain restrictions which could adversely affect its business, financial condition, results of operations and ability to make quarterly cash distributions to its unitholders.
"
Tallgrass Equity's ownership in TEP's IDRs, TEP's common units and TEP's general partner interest, are pledged under Tallgrass Equity's revolving credit facility.
Tallgrass Equity's direct ownership of the 20,000,000 TEP common units and its direct ownership of TEP's general partner (which owns the IDRs and general partner interest) are pledged as security under Tallgrass Equity's revolving credit facility. Tallgrass Equity's revolving credit facility contains customary and other events of default. Upon an event of default, the lenders under Tallgrass Equity's revolving credit facility could foreclose on Tallgrass Equity's ownership interest in TEP GP and the 20,000,000 TEP common units owned by Tallgrass Equity, which are the only assets from which our cash flows are derived. Additionally, this foreclosure could ultimately result in a change in control of TEP GP, which would constitute an immediate event of default under TEP's credit facility. This would have a material adverse effect on our business, financial condition and results of operations.
Our shareholders do not vote in the election of our general partner's directors. The Exchange Right Holders own a sufficient number of shares to allow them to prevent the removal of our general partner.
Our shareholders have only limited voting rights on matters affecting our business and, therefore, limited ability to influence management's decisions regarding our business. The board of directors of our general partner, including our independent directors, is designated and elected by Tallgrass Energy Holdings or its designees. Our shareholders do not have the ability to elect our general partner or the members of the board of directors of our general partner.
22
In addition, if our Class A shareholders are dissatisfied with the performance of our general partner, they have little ability to remove our general partner. Our general partner may not be removed except by vote of the holders of at least 80% of our outstanding shares, voting together as a single class. The Exchange Right Holders own
63.06%
of our outstanding shares. This ownership level enables the Exchange Right Holders to prevent our general partner's removal.
As a result of these provisions, the price at which our shares trade may be lower because of the absence or reduction of a takeover premium in the trading price.
If TEP's unitholders remove TEP GP, TEP GP may be required to sell or exchange its IDRs and general partner interest and TEP GP would lose the ability to manage and control TEP.
TEP's partnership agreement gives unitholders of TEP the right to remove TEP GP upon the affirmative vote of holders of 66 2/3% of TEP's outstanding units. If TEP GP withdraws as general partner in compliance with TEP's partnership agreement or is removed as general partner of TEP where cause (as defined in TEP's partnership agreement) does not exist and a successor general partner is elected in accordance with TEP's partnership agreement, TEP GP could elect to receive cash in exchange for its IDRs and general partner interest. If TEP GP withdraws in circumstances other than those described in the preceding sentence and a successor general partner is elected in accordance with TEP's partnership agreement, the successor general partner will have the option to purchase the IDRs and general partner interest for their fair market value. If TEP GP or the successor general partner do not exercise their options, TEP GP's interests would be converted into common units based on an independent valuation. In each case, TEP GP would also lose its ability to manage TEP.
In addition, if TEP GP is removed as general partner of TEP, we would face an increased risk of being deemed an investment company. Please read the section entitled
"
—
If in the future we cease to manage and control TEP, we may be deemed to be an investment company under the Investment Company Act of 1940."
Our general partner may cause us to issue additional Class A shares or other equity securities, including equity securities that are senior to our Class A shares, without your approval, which may adversely affect you.
Our general partner may cause us to issue an unlimited number of additional Class A shares, or other equity securities of equal rank with the Class A shares, without shareholder approval. In addition, we may issue an unlimited number of shares that are senior to our Class A shares in right of distribution, liquidation and voting. Except for Class A shares issued in connection with the exercise by any Exchange Right Holder of its right to exchange a Class B share for a Class A share (the "Exchange Right"), each of which will result in the cancellation of an equivalent number of Class B shares and therefore have no effect on the total number of outstanding shares, the issuance of additional Class A shares, or other equity securities of equal or senior rank, may have the following effects:
|
•
|
each shareholder's proportionate ownership interest in us may decrease;
|
|
•
|
the amount of cash available for distribution on each Class A share may decrease;
|
|
•
|
the relative voting strength of each previously outstanding Class A share may be diminished;
|
|
•
|
the ratio of taxable income to distributions may increase; and
|
|
•
|
the market price of the Class A shares may decline.
|
You may not have limited liability if a court finds that shareholder action constitutes control of our business.
Under Delaware law, you could be held liable for our obligations to the same extent as a general partner if a court determined that the right or the exercise of the right by our shareholders (who hold limited partner interests despite the fact that we use the term "shareholder" in this Annual Report) as a group to remove or replace our general partner, to approve some amendments to the partnership agreement or to take other action under our partnership agreement constituted participation in the "control" of our business. Additionally, the limitations on the liability of holders of limited partner interests for the liabilities of a limited partnership have not been clearly established in many jurisdictions.
Furthermore, Section 17-607 of the Delaware Revised Uniform Limited Partnership Act provides that, under some circumstances, a shareholder may be liable to us for the amount of a distribution for a period of three years from the date of the distribution.
If in the future we cease to manage and control TEP we may be deemed to be an investment company under the Investment Company Act of 1940.
If we cease to indirectly manage and control TEP and are deemed to be an investment company under the Investment Company Act of 1940, we would have to register as an investment company under the Investment Company Act of 1940, obtain exemptive relief from the SEC or modify our organizational structure or our contractual rights to fall outside the definition of an investment company. Registering as an investment company could, among other things, materially limit our ability to engage in transactions with affiliates, including the purchase and sale of certain securities or other property to or from
23
our affiliates, restrict the ability of TEP GP, Tallgrass Equity, TEP and us to borrow funds or engage in other transactions involving leverage, require us to add additional directors who are independent of us and our affiliates, and adversely affect the price of our Class A shares.
Our partnership agreement restricts the rights of shareholders owning 20% or more of our shares.
Our shareholders' voting rights are restricted by the provision in our partnership agreement generally providing that any shares held by a person or group that owns 20% or more of any class of shares then outstanding, other than our general partner, the Exchange Right Holders or their respective affiliates and persons who acquired such shares with the prior approval of our general partner's board of directors, cannot be voted on any matter. In addition, our partnership agreement contains provisions limiting the ability of our shareholders to call meetings or to acquire information about our operations, as well as other provisions limiting our shareholders' ability to influence the manner or direction of our management. As a result, the price at which our Class A shares trade may be lower because of the absence or reduction of a takeover premium in the trading price.
If TEP GP, which is owned by Tallgrass Equity, is not fully reimbursed or indemnified for obligations and liabilities it incurs in managing the business and affairs of TEP, its value, and, therefore, the value of our Class A shares, could decline.
TEP GP and its affiliates may make expenditures on behalf of TEP for which TEP GP will seek reimbursement from TEP. Under Delaware partnership law, TEP GP has unlimited liability for the obligations of TEP, such as its debts and environmental liabilities, except for those contractual obligations of TEP that are expressly made without recourse to the general partner. To the extent TEP GP incurs obligations on behalf of TEP, it is entitled to be reimbursed or indemnified by TEP. If TEP is unable or unwilling to reimburse or indemnify TEP GP, TEP GP may not be able to satisfy those liabilities or obligations, which would reduce TEP GP's cash distributions to Tallgrass Equity and ultimately to us for the benefit of our Class A shareholders.
Our Class A shares and TEP's common units may not trade in relation or proportion to one another.
Our Class A shares and TEP's common units may not trade in simple relation or proportion to one another. Instead, while the trading prices of our Class A shares and TEP's common units may follow generally similar broad trends, the trading prices may diverge because, among other things:
|
•
|
TEP's cash distributions to its common unitholders have a priority over distributions on its IDRs;
|
|
•
|
we participate in the distributions on the IDRs and general partner interest in TEP while TEP's common unitholders do not;
|
|
•
|
we expect to pay U.S. federal income taxes in the future; and
|
|
•
|
we may pursue business opportunities separate and apart from TEP or any of its affiliates.
|
An increase in interest rates may cause the market price of our shares to decline.
Like all equity investments, an investment in our Class A shares is subject to certain risks. In exchange for accepting these risks, investors may expect to receive a higher rate of return than would otherwise be obtainable from lower-risk investments. Accordingly, as interest rates rise, the ability of investors to obtain higher risk-adjusted rates of return by purchasing government-backed debt securities may cause a corresponding decline in demand for riskier investments generally, including yield-based equity investments such as publicly traded limited partner interests. Reduced demand for our Class A shares resulting from investors seeking other more favorable investment opportunities may cause the trading price of our Class A shares to decline.
Future sales of our Class A shares in the public market, including sales of Class A shares by the Exchange Right Holders after the exercise of the Exchange Right, could reduce our Class A share price, and any additional capital raised by us through the sale of equity or convertible securities may dilute your ownership in us.
Subject to certain limitations and exceptions, the Exchange Right Holders may cause the exchange of their Tallgrass Equity units (together with a corresponding number of Class B shares) for Class A shares (on a one-for-one basis, subject to customary conversion rate adjustments for equity splits and reclassification and other similar transactions) and then sell those Class A shares. Pursuant to a shareholder and registration rights agreement entered into with the Exchange Right Holders, we have registered the resale of all 109,504,440 Class A shares issuable upon exercise of the Exchange Right pursuant to our Form S-3/A (File No. 333-210976) filed with the SEC on August 8, 2016, which became effective August 10, 2016. Following such registration, certain participating Exchange Right Holders sold 10,350,000 Class A Shares in a secondary offering that closed on November 22, 2016. We may also issue additional Class A shares or convertible securities in subsequent public or private offerings.
We cannot predict the size of future issuances of our Class A shares or securities convertible into Class A shares or the effect, if any, that future issuances and sales of our Class A shares, including sales of Class A shares by the Exchange Right Holders after the exercise of the Exchange Right, will have on the market price of our Class A shares. Sales of substantial
24
amounts of our Class A shares (including shares issued in connection with an acquisition), or the perception that such sales could occur, may adversely affect prevailing market prices of our Class A shares.
Tallgrass Energy Holdings has sole authority to elect the board of directors of our general partner.
Tallgrass Energy Holdings has the ability to elect all of the members of our board of directors. In addition, Tallgrass Energy Holdings is able to determine the outcome of nearly all matters requiring shareholder approval, including certain mergers and other material transactions, and is able to cause or prevent a change in the composition of our board of directors or a change in control of our company that could deprive our shareholders of an opportunity to receive a premium for their Class A shares as part of a sale of our company. The Exchange Right Holders currently own 100% of the voting interests in Tallgrass Energy Holdings and entities and/or investment funds affiliated with (i) The Energy & Minerals Group, (ii) Kelso & Company and (iii) members of our and TEP's management each have the right to designate two members of the board of managers of Tallgrass Energy Holdings for so long as they maintain certain ownership percentages in Tallgrass Energy Holdings. Tallgrass Energy Holdings currently has a six-person board of managers. Tallgrass Energy Holdings continues to be able to strongly influence all matters requiring shareholder approval, regardless of whether or not shareholders believe that the transaction is in their own best interests.
A valuation allowance on our deferred tax asset could reduce our earnings.
A significant deferred tax asset was recorded as a result of certain reorganization transactions completed in connection with the TEGP IPO. In November 2016, TEGP completed a Secondary Offering of Class A shares, which resulted in the recognition of an additional deferred tax asset. The aggregate deferred tax asset was
$521.5 million
as of
December 31, 2016
. GAAP requires that a valuation allowance must be established for deferred tax assets when it is more likely than not that they will not be realized. If we were to determine that a valuation allowance was appropriate for our deferred tax asset, we would be required to take an immediate charge to earnings with a corresponding reduction of partners' equity and increase in balance sheet leverage as measured by debt to total capitalization.
The NYSE does not require a limited partnership like us or TEP to comply with certain of its corporate governance requirements.
Because we and TEP are limited partnerships, the New York Stock Exchange, or NYSE, does not require our general partner or TEP's general partner to have a majority of independent directors on their respective board of directors. The NYSE also does not require our general partner or TEP's general partner to establish a compensation committee or a nominating and corporate governance committee. Accordingly, our shareholders and TEP's unitholders do not have the same protections afforded to certain corporations that are subject to all of the NYSE corporate governance requirements. In addition, as limited partnerships, we and TEP are not required to seek shareholder or unitholder approval, as appropriate, for issuances of Class A shares or TEP common units, respectively, including issuances in excess of 20% of outstanding equity securities, or for issuances of equity to certain affiliates.
We may incur liability as a result of our ownership of TEP's general partner.
Under Delaware law, a general partner of a limited partnership is generally liable for the debts and liabilities of the partnership for which it serves as general partner, subject to the terms of any indemnification agreements contained in the partnership agreement and except to the extent the partnership's contracts are non-recourse to the general partner. As a result of our structure, we indirectly own and control the general partner of TEP. To the extent the indemnification provisions in TEP's partnership agreement or non-recourse provisions in our contracts are not sufficient to protect TEP GP from such liability, we may in the future incur liabilities as a result of our indirect ownership of TEP's general partner. Please read the section entitled
"
—
Risks Related to Conflicts of Interest."
If we fail to develop or maintain an effective system of internal controls, we may not be able to accurately report our financial results or prevent fraud. As a result, shareholders could lose confidence in our financial reporting, which would harm our business and the trading price of our Class A shares.
Effective internal controls are necessary for us to provide reliable financial reports, prevent fraud and operate successfully as a publicly traded partnership. If we cannot provide reliable financial reports or prevent fraud, our reputation and operating results will be harmed. We cannot be certain that our efforts to develop and maintain our internal controls will be successful, that we will be able to maintain adequate controls over our financial processes and reporting in the future or that we will be able to comply with our obligations under Section 404 of the Sarbanes Oxley Act of 2002. Any failure to develop or maintain effective internal controls, or difficulties encountered in implementing or improving our internal controls, could harm our operating results or cause us to fail to meet our reporting obligations. Ineffective internal controls could also cause investors to lose confidence in our reported financial information, which would likely have a negative effect on the trading price of our Class A shares.
25
Risks Related to Conflicts of Interest
Our existing organizational structure and the relationships among us, TEP, our respective general partners, Tallgrass Energy Holdings, the owners of Tallgrass Energy Holdings, including the Exchange Right Holders, and their affiliated entities present the potential for conflicts of interest. Moreover, additional conflicts of interest may arise in the future among us and the entities affiliated with any general partner or similar interests we acquire or among TEP and such entities.
Conflicts of interest may arise as a result of our organizational structure and the relationships among us, TEP, our respective general partners, TEGP, the owners of Tallgrass Energy Holdings, including the Exchange Right Holders, and their affiliated entities.
Our partnership agreement defines the duties of our general partner (and, by extension, its officers and directors). Our general partner's board of directors or its conflicts committee has authority on our behalf to resolve any conflict involving us and they have broad latitude to consider the interests of all parties to the conflict.
Conflicts of interest may arise between us and our shareholders, on the one hand, and our general partner and its direct and indirect owners, including Tallgrass Energy Holdings and the Exchange Right Holders, and affiliated entities, on the other hand, or between us and our shareholders, on the one hand, and TEP and its unitholders, on the other hand. The resolution of these conflicts may not always be in our best interest or that of our shareholders.
The Exchange Right Holders own 100% of the voting interests in Tallgrass Energy Holdings and hold a majority of the combined voting power of our Class A and Class B shares.
The Exchange Right Holders own 100% of the voting interests in Tallgrass Energy Holdings and hold approximately
63.06%
of the combined voting power of our Class A and Class B shares. Although each of the Exchange Right Holders are entitled to act separately in their own respective interests with respect to their ownership interest in Tallgrass Energy Holdings and us, the Exchange Right Holders collectively have the ability to elect all of the members of Tallgrass Energy Holdings' board of managers, each of whom serves as a member of the board of directors of our general partner. So long as any of the Exchange Right Holders continue to own a significant amount of the voting interests in Tallgrass Energy Holdings, they will continue to be able to control our management and affairs.
Tallgrass Energy Holdings may have interests that conflict with holders of our Class A shares.
Tallgrass Energy Holdings owns our general partner and may have conflicting interests with holders of Class A shares.
Furthermore, conflicts of interest could arise in the future between us, on the one hand, and Tallgrass Energy Holdings or TEP, on the other hand, concerning, among other things, a decision whether to modify or limit the IDRs in the future or potential competitive business activities or business opportunities. These conflicts of interest may not be resolved in our favor.
Our partnership agreement replaces our general partner's fiduciary duties to holders of our Class A shares with contractual standards governing its duties.
Our partnership agreement contains provisions that eliminate the fiduciary standards to which our general partner would otherwise be held by state fiduciary duty law and replaces those duties with several different contractual standards. For example, our partnership agreement permits our general partner to make a number of decisions in its individual capacity, as opposed to in its capacity as our general partner, free of any duties to us and our shareholders other than the implied contractual covenant of good faith and fair dealing, which means that a court will enforce the reasonable expectations of the shareholders where the language in the partnership agreement does not provide for a clear course of action. This provision entitles our general partner to consider only the interests and factors that it desires and relieves it of any duty or obligation to give any consideration to any interest of, or factors affecting, us, our affiliates or our shareholders. Examples of decisions that our general partner may make in its individual capacity include:
|
•
|
how to allocate business opportunities among us and its affiliates;
|
|
•
|
whether to exercise its limited call right;
|
|
•
|
whether to seek approval of the resolution of a conflict of interest by the conflicts committee of the board of directors of our general partner;
|
|
•
|
how to exercise its voting rights with respect to the units it owns; and
|
|
•
|
whether or not to consent to any merger, consolidation or conversion of the partnership or amendment to the partnership agreement.
|
In addition, our partnership agreement provides that any construction or interpretation of our partnership agreement and any action taken pursuant thereto or any determination, in each case, made by our general partner in good faith, shall be conclusive and binding on all shareholders.
26
By purchasing shares, you agree to become bound by the provisions in the partnership agreement, including the provisions discussed above.
Our partnership agreement restricts the remedies available to holders of our Class A shares for actions taken by our general partner that might otherwise constitute breaches of fiduciary duty.
Our partnership agreement contains provisions that restrict the remedies available to shareholders for actions taken by our general partner that might otherwise constitute breaches of fiduciary duty under state fiduciary duty law. For example, our partnership agreement provides that:
|
•
|
whenever our general partner, the board of directors of our general partner or any committee thereof (including the conflicts committee) makes a determination or takes, or declines to take, any other action in their respective capacities, our general partner, the board of directors of our general partner and any committee thereof (including the conflicts committee), as applicable, is required to make such determination, or take or decline to take such other action, in good faith, meaning that it subjectively believed that the decision was in the best interests of our partnership, and, except as specifically provided by our partnership agreement, will not be subject to any other or different standard imposed by our partnership agreement, Delaware law, or any other law, rule or regulation, or at equity;
|
|
•
|
our general partner will not have any liability to us or our shareholders for decisions made in its capacity as a general partner so long as such decisions are made in good faith;
|
|
•
|
our general partner and its officers and directors will not be liable for monetary damages to us or our limited partners resulting from any act or omission unless there has been a final and non-appealable judgment entered by a court of competent jurisdiction determining that our general partner or its officers and directors, as the case may be, acted in bad faith or engaged in fraud or willful misconduct or, in the case of a criminal matter, acted with knowledge that the conduct was criminal; and
|
|
•
|
our general partner will not be in breach of its obligations under the partnership agreement (including any duties to us or our shareholders) if a transaction with an affiliate or the resolution of a conflict of interest is:
|
|
◦
|
approved by the conflicts committee of the board of directors of our general partner (although our general partner is not obligated to seek such approval);
|
|
◦
|
approved by the vote of a majority of the outstanding voting shares, excluding any shares owned by our general partner and its affiliates;
|
|
◦
|
determined by the board of directors of our general partner to be on terms no less favorable to us than those generally being provided to or available from unrelated third parties; or
|
|
◦
|
determined by the board of directors of our general partner to be fair and reasonable to us, taking into account the totality of the relationships among the parties involved, including other transactions that may be particularly favorable or advantageous to us.
|
In connection with a situation involving a transaction with an affiliate or a conflict of interest, any determination by our general partner or the conflicts committee must be made in good faith. If an affiliate transaction or the resolution of a conflict of interest is not approved by our shareholders or the conflicts committee and the board of directors of our general partner determines that the resolution or course of action taken with respect to the affiliate transaction or conflict of interest satisfies either of the standards set forth in the last two bullets above, then it will be presumed that, in making its decision, the board of directors acted in good faith, and in any proceeding brought by or on behalf of any limited partner or the partnership challenging such determination, the person bringing or prosecuting such proceeding will have the burden of overcoming such presumption.
Our general partner's affiliates and Tallgrass Energy Holdings may compete with us.
Our partnership agreement provides that our general partner is restricted from engaging in any business activities other than acting as our general partner and those activities incidental to its ownership of interests in us. The restrictions contained in our general partner's limited liability company agreement are subject to a number of exceptions. For example, affiliates of our general partner, including Tallgrass Energy Holdings, the Exchange Right Holders, and their respective affiliates, are not prohibited from engaging in other businesses or activities that might be in direct competition with us.
Our general partner has a call right that may require you to sell your Class A shares at an undesirable time or price.
If at any time more than 80% of our outstanding shares (including Class A shares issuable upon the exchange of Class B shares) are owned by our general partner, Tallgrass Energy Holdings or their respective affiliates, our general partner has the right (which it may assign to any of its affiliates, Tallgrass Energy Holdings or us), but not the obligation, to acquire all, but not less than all, of the remaining Class A shares held by public shareholders at a price equal to the greater of (x) the highest cash
27
price paid by our general partner, Tallgrass Energy Holdings, or their respective affiliates for any shares purchased within the 90 days preceding the date on which our general partner first mails notice of its election to purchase those shares and (y) the current market price calculated in accordance with our partnership agreement as of the date three business days before the date the notice is mailed. As a result, you may be required to sell your Class A shares at an undesirable time or price and may not receive any return of or on your investment. The Board of Directors of Tallgrass Energy Holdings recently authorized an equity purchase program under which Tallgrass Development may initially purchase up to an aggregate of $100 million of our outstanding Class A shares. You may also incur a tax liability upon a sale of your Class A shares.
Risks Related to TEP's Business
TEP may not have sufficient cash from operations following the establishment of cash reserves and payment of fees and expenses, including cost reimbursements to its general partner and its affiliates, to enable TEP to pay the quarterly distribution at the current distribution level, or at all, to holders of TEP common units.
TEP may not have sufficient available cash from operating surplus each quarter to enable it to pay the quarterly distribution at the current distribution level, at the minimum quarterly distribution level, or at all. The amount of cash TEP can distribute on its units principally depends upon the amount of cash TEP generates from its operations, which will fluctuate from quarter to quarter based on, among other things:
|
•
|
the level of firm services TEP provides to customers pursuant to firm fee contracts and the volume of customer products TEP transports, stores, processes, gathers, treats and disposes using its assets;
|
|
•
|
its ability to renew or replace expiring long-term firm fee contracts with other long-term firm fee contracts;
|
|
•
|
the creditworthiness of its customers, particularly customers who are subject to firm fee contracts;
|
|
•
|
its ability to complete and integrate acquisitions from Tallgrass Development or from third parties;
|
|
•
|
the level of production of crude oil, natural gas and other hydrocarbons and the resultant market prices of natural gas, NGLs, crude oil and other hydrocarbons;
|
|
•
|
the actual and anticipated future prices, and the volatility thereof, of natural gas, crude oil and other commodities;
|
|
•
|
changes in the fees TEP charges for its services, including firm services and interruptible services;
|
|
•
|
TEP's ability to identify, develop, and complete internal growth projects or expansion capital expenditures on favorable terms to improve optimization of its current assets;
|
|
•
|
regional, domestic and foreign supply and perceptions of supply of natural gas, crude oil and other hydrocarbons;
|
|
•
|
the level of demand and perceptions of demand in end-user markets TEP directly or indirectly serves;
|
|
•
|
applicable laws and regulations affecting TEP and its customers' business, including the market for natural gas, crude oil, other hydrocarbons and water, the rates TEP can charge on its assets, how TEP contracts for services, its existing contracts, its operating costs or its operating flexibility;
|
|
•
|
prevailing economic conditions.
|
|
•
|
the effect of seasonal variations in temperature and climate on the amount of customer products TEP is able to transport, store, process, gather, treat and dispose using its assets;
|
|
•
|
the realized pricing impacts on revenues and expenses that are directly related to commodity prices;
|
|
•
|
the level of competition from other midstream energy companies in its geographic markets;
|
|
•
|
the level of its operating and maintenance costs;
|
|
•
|
damage to its assets and surrounding properties caused by earthquakes, floods, fires, severe weather, explosions and other natural disasters or acts of terrorism;
|
|
•
|
outages in its assets;
|
|
•
|
the relationship between natural gas and NGL prices and resulting effect on processing margins; and
|
|
•
|
leaks or accidental releases of hazardous materials into the environment, whether as a result of human error or otherwise.
|
In addition, the actual amount of cash TEP will have available for distribution will depend on other factors, including:
|
•
|
its ability to borrow funds and access capital markets;
|
28
|
•
|
the level, timing and characterization of capital expenditures TEP makes;
|
|
•
|
the level of its general and administrative expenses, including reimbursements to its general partner and its affiliates, including Tallgrass Development, for services provided to TEP;
|
|
•
|
the cost of pursuing and completing acquisitions, if any;
|
|
•
|
its debt service requirements and other liabilities;
|
|
•
|
fluctuations in its working capital needs;
|
|
•
|
restrictions contained in its debt agreements;
|
|
•
|
the amount of cash reserves established by its general partner; and
|
|
•
|
other business risks affecting its cash levels.
|
If TEP is not able to renew or replace expiring customer contracts at favorable rates or on a long-term basis, its financial condition, results of operations, cash flows and ability to make cash distributions to its unitholders will be adversely affected.
A substantial majority of TEP's contracts for transporting, storing, and processing its customers' products on TEP's systems are long-term firm fee contracts with terms of various durations. For the
year ended December 31, 2016
, approximately 89% of its crude oil transportation revenues were generated under firm fee transportation contracts and approximately 92% of its natural gas transportation and storage revenues were generated under firm fee transportation and storage contracts. As of
December 31, 2016
, the weighted average remaining life of its oil transportation contracts was approximately
three
years, the weighted average remaining life of its long-term natural gas transportation contracts and natural gas storage contracts at TIGT and Trailblazer was approximately
three
years and
five
years, respectively, and the weighted average remaining life of its natural gas processing contracts was approximately
two
years. In addition, a majority of Rockies Express' west-to-east pipeline capacity is subject to long-term firm fee contracts that expire in 2019 and a significant amount of Rockies Express' revenue in 2016 was derived under these contracts.
TEP may be unable to maintain the long-term nature and economic structure of its current contract portfolio over time. Depending on prevailing market conditions at the time of a contract renewal, its natural gas transportation, storage and processing customers with long-term fee-based contracts may desire to enter into contracts with reduced fees, and may be unwilling to enter into long-term contracts at all. In addition, most of the long-term contracts for the Pony Express Pipeline expire in 2019 and those customers may unilaterally decide whether to renew such contract. If those customers do not renew their contract, under current FERC policy, Pony Express is generally prohibited from entering into new long-term contracts that grant contract shippers priorities in prorationing under the ICA unless such contract relates to an increase in the capacity of the Pony Express Pipeline.
TEP's ability to renew or replace its expiring contracts on terms similar to, or more attractive than, those of its existing contracts is uncertain and depends on a number of factors beyond its control, including:
|
•
|
the level of existing and new competition to provide competing services to its markets;
|
|
•
|
the macroeconomic factors affecting crude oil and natural gas economics for our current and potential customers;
|
|
•
|
the balance of supply and demand for natural gas, crude oil and other hydrocarbons, on a short-term, seasonal and long-term basis, in the markets TEP serves;
|
|
•
|
the extent to which the current and potential customers in its markets are willing to provide firm fee commitments on a long-term basis; and
|
|
•
|
the effects of federal, state or local laws or regulations on the contracting practices of its customers.
|
In the current commodity environment, which included significant price reduction and volatility in crude oil, natural gas and other hydrocarbons from the second half of 2014 through the first half of 2016, TEP expects customers will generally continue to be less likely to enter into long-term firm fee contracts until prices recover and stability returns to the commodity markets. Customers who do enter into long-term contracts may only be willing to provide acreage dedications to TEP's assets rather than firm fee commitments. Acreage dedications typically do not require TEP's customers to pay TEP unless they utilize its assets, and they may also be subject to challenge in bankruptcy proceedings.
To the extent TEP is unable to renew or replace its existing contracts on terms that are favorable to TEP or successfully manage the long-term nature and economic structure of its contract profile over time, TEP's revenues and cash flows could decline and its ability to make distributions to its unitholders could be materially and adversely affected.
29
TEP is exposed to the creditworthiness and performance of its customers, suppliers and contract counterparties, and any material nonpayment or nonperformance by one or more of these parties could adversely affect its financial condition, cash flows, and operating results.
Although TEP attempts to assess the creditworthiness of its customers, suppliers and contract counterparties, there can be no assurance that its assessments will be accurate or that there will not be a rapid or unanticipated deterioration in their creditworthiness, which may have an adverse impact on its business, results of operations, financial condition and ability to make cash distributions to its unitholders. TEP's long-term firm fee contracts obligate its customers to pay demand charges regardless of whether they utilize its assets, except for certain circumstances outlined in applicable customer agreements. As a result, during the term of its long-term firm fee contracts and absent an event of force majeure, its revenues will generally depend on its customers' financial condition and their ability to pay rather than upon the extent to which our customers actually utilize our assets. The decline and volatility in natural gas and crude oil prices during the second half of 2014 through the first half of 2016 negatively impacted the financial condition of TEP's customers and future declines, lower prices, or volatility could impact their ability to meet their financial obligations to TEP. Further, TEP's contract counterparties may not perform or adhere to TEP's existing or future contractual arrangements. To the extent one or more of TEP's contract counterparties is in financial distress or commences bankruptcy proceedings, contracts with these counterparties may be subject to renegotiation or rejection under applicable provisions of the United States Bankruptcy Code. Any material nonpayment or nonperformance by TEP's contract counterparties due to inability or unwillingness to perform or adhere to contractual arrangements could have a material adverse impact on its business, results of operations, financial condition and ability to make cash distributions to its unitholders.
For example, in 2016, Ultra Resources, Inc., or Ultra, defaulted on its firm transportation service agreement with Rockies Express for approximately 0.2 Bcf/d through November 11, 2019, and as a result Rockies Express filed a lawsuit seeking approximately $303 million in damages and other relief. Approximately 13% of Rockies Express' revenue in 2015 was derived from the Ultra contract. In April 2016 Ultra filed for bankruptcy protection. On January 12, 2017, Rockies Express and Ultra agreed to settle Rockies Express’s claim against Ultra's bankruptcy estate. The settlement includes Ultra's agreement to pay Rockies Express $150 million in cash no later than October 30, 2017 and enter into a new, seven-year firm transportation agreement with Rockies Express commencing December 1, 2019, for west-to-east service of 0.2 Bcf/d at a rate of approximately $0.37, or approximately $26.8 million annually. The settlement is part of Ultra's Chapter 11 reorganization plan, and therefore subject to the approval of the U.S. Bankruptcy Court. There is no assurance that Ultra's Chapter 11 reorganization plan will be approved or that Ultra will meet the terms and conditions for such plan to become effective.
In addition, Triad Hunter, LLC, or Triad, sought bankruptcy relief in December 2015. At the time Triad commenced the bankruptcy proceedings, Triad and Rockies Express were parties to a precedent agreement that provided Triad with an approximate 0.1 Bcf/d of firm capacity in connection with the Rockies Express Zone 3 Capacity Enhancement Project. In order to settle its claim, Rockies Express agreed to amend certain material terms of the precedent agreement, including reducing Triad's firm capacity under the precedent agreement to an approximate 0.05 Bcf/d.
Although the Triad and Ultra claims were ultimately settled, and on terms TEP and Rockies Express view as favorable, the settlements will not deliver the same benefits as the underlying contract at issue in each circumstance.
The procedures and policies TEP uses to manage its exposure to credit risk, such as credit analysis, credit monitoring and, in some cases, requiring credit support, cannot fully eliminate counterparty credit risks. In accordance with FERC regulations and its own internal credit policies, counterparties with investment grade credit ratings are deemed able to meet their financial obligations to TEP without requiring credit support in the form of a letter of credit or prepayment. With the decline and volatility in natural gas and crude oil prices over the last two years and the corresponding deterioration of the financial condition of some of its customers, the percent of TEP's revenue from customers with investment grade credit ratings fell to slightly under
45%
during the year ended December 31, 2016. Although TEP asks for credit support from customers without investment grade credit ratings, some customers may be unwilling or unable to provide it due to liquidity constraints. To the extent its procedures and policies prove to be inadequate or TEP is unable to obtain credit support, its financial position and results of operations may be negatively impacted.
Some of TEP's counterparties may be highly leveraged or have limited financial resources and are subject to their own operating and regulatory risks. Even if its credit review and analysis mechanisms work properly, TEP may experience financial losses in its dealings with such parties. As seen with the decline and volatility in crude oil prices from the second half of 2014 through the first half of 2016, prices for crude oil and natural gas are subject to large fluctuations in response to changes in supply and demand, market uncertainty and a variety of other factors that are beyond its control. Such volatility in commodity prices might have an impact on many of TEP's counterparties and their ability to borrow and obtain additional capital on attractive terms, which, in turn, could have a negative impact on their ability to meet their obligations to TEP and may also increase the magnitude of these obligations.
30
Any material nonpayment or nonperformance by TEP's counterparties could require TEP to pursue substitute counterparties for the affected operations, reduce operations or provide alternative services. There can be no assurance that any such efforts would be successful or would provide similar financial and operational results.
TEP depends on certain key customers for a significant portion of its revenues and is exposed to credit risks of these customers. The loss of or material nonpayment or nonperformance by any of these key customers could adversely affect its cash flow and results of operations.
TEP relies on certain key customers for a portion of revenues. For example, for the year ended December 31, 2016, Continental Resources and Shell accounted for approximately
16%
and
13%
of our revenues on a consolidated basis, respectively. In addition, for the year ended December 31, 2016, approximately 60% of its consolidated revenues were represented by the top ten customers on its Pony Express System. TEP owns a 25% membership interest in Rockies Express, which is not consolidated for financial reporting purposes. Approximately
23%
,
12%
,
10%
, and
10%
, respectively, of Rockies Express' total revenues as of December 31, 2016 were represented by Rockies Express' four largest non-affiliated shippers.
TEP may be unable to negotiate extensions or replacements of contracts with key customers on favorable terms. For additional detail, see
"
—
If TEP is not able to renew or replace expiring customer contracts at favorable rates or on a long-term basis, its financial condition, results of operations, cash flows and ability to make cash distributions to its unitholders will be adversely affected."
In addition, some of these key customers may experience financial problems that could have a significant effect on their creditworthiness. For example, Rockies Express terminated its contract with its third largest non-affiliated shipper by total 2015 revenue, Ultra, in March 2016. For more detail regarding Ultra, see
"
—
TEP is exposed to the creditworthiness and performance of its customers, suppliers and contract counterparties, and any material nonpayment or nonperformance by one or more of these parties could adversely affect its financial condition, cash flows, and operating results."
Severe financial problems encountered by its customers could limit its ability to collect amounts owed to TEP, or to enforce performance of obligations under contractual arrangements. To the extent one or more of TEP's key customers is in financial distress or commences bankruptcy proceedings, contracts with these customers may be subject to renegotiation or rejection under applicable provisions of the United States Bankruptcy Code. Additionally, many of its customers finance their activities through cash flow from operations, the incurrence of indebtedness or the issuance of equity. The combination of reduction of cash flow resulting from declines in commodity prices, a reduction in borrowing bases under credit facilities and the lack of availability of debt or equity financing may result in a significant reduction of TEP's customers' liquidity and limit their ability to make payments or perform on their obligations to TEP. Furthermore, some of TEP's customers may be highly leveraged and subject to their own operating and regulatory risks, which increases the risk that they may default on their obligations to TEP. The loss of all or even a portion of the contracted volumes of these key customers, as a result of competition, creditworthiness or otherwise, could have a material adverse effect on its business, cash flows, ability to make distributions to its unitholders, the price of its units, its results of operations and ability to conduct its business.
If TEP is unable to make acquisitions on economically acceptable terms from Tallgrass Development or third parties, its future growth will be limited, and the acquisitions TEP does make may reduce, rather than increase, its cash generated from operations on a per unit basis.
TEP's ability to grow depends, in part, on its ability to make acquisitions that increase its cash generated from operations on a per unit basis.
The acquisition component of TEP's strategy is based, in part, on its expectation of ongoing divestitures of midstream energy assets by industry participants, including Tallgrass Development. Many factors could impair TEP's access to future midstream assets, including a change in control of Tallgrass Development. A material decrease in divestitures of midstream energy assets from Tallgrass Development or otherwise would limit TEP's opportunities for future acquisitions and could have a material adverse effect on its business, results of operations, financial condition and ability to make quarterly cash distributions to its unitholders.
TEP's future growth and ability to increase distributions will be limited if TEP is unable to make accretive acquisitions from Tallgrass Development or third parties because, among other reasons, (i) Tallgrass Development elects not to sell or contribute additional assets to TEP or to offer acquisition opportunities to TEP, (ii) TEP is unable to identify attractive third-party acquisition opportunities, (iii) TEP is unable to negotiate acceptable purchase contracts with Tallgrass Development or third parties, (iv) TEP is unable to obtain financing for these acquisitions on economically acceptable terms, (v) TEP is outbid by competitors or (vi) TEP is unable to obtain necessary governmental or third-party consents. Furthermore, even if TEP does make acquisitions that TEP believes will be accretive, these acquisitions may nevertheless result in a decrease in the cash generated from operations on a per unit basis. For example, TEP acquired a 25% membership interest in Rockies Express in May 2016, and if certain risks or unanticipated liabilities were to arise, the desired benefits of the acquisition may not be fully realized and TEP's future financial performance and results of operations could be negatively impacted.
31
Any acquisition involves potential risks, including, among other things:
|
•
|
mistaken assumptions about volumes, revenue and costs, including synergies and potential growth;
|
|
•
|
an inability to maintain or secure adequate customer commitments to use the acquired systems or facilities;
|
|
•
|
an inability to successfully integrate the assets or businesses TEP acquires;
|
|
•
|
the assumption of unknown liabilities for which TEP is not indemnified or for which its indemnity is inadequate;
|
|
•
|
the diversion of management's and employees' attention from other business concerns;
|
|
•
|
unforeseen difficulties operating in new geographic areas or business lines; and
|
|
•
|
a decrease in liquidity and increased leverage as a result of using significant amounts of available cash or debt to finance an acquisition.
|
If any acquisition eventually proves not to be accretive to TEP's distributable cash flow per unit, it could have a material adverse effect on its business, results of operations, financial condition and ability to make quarterly cash distributions to its unitholders.
If TEP is unable to obtain needed capital or financing on satisfactory terms to fund expansions of its asset base, its ability to make quarterly cash distributions may be diminished or its financial leverage could increase.
In order to expand TEP's asset base through acquisitions or capital projects, TEP may need to make expansion capital expenditures. If TEP does not make sufficient or effective expansion capital expenditures, TEP will be unable to expand its business operations and may be unable to maintain or raise the level of its quarterly cash distributions. TEP could be required to use cash from its operations or incur borrowings or sell additional common units or other limited partner interests in order to fund its expansion capital expenditures. Using cash from operations will reduce cash available for distribution to its common unitholders. TEP's ability to obtain bank financing or to access the capital markets for future equity or debt offerings may be limited by its financial condition at the time of any such financing or offering as well as the covenants in its debt agreements, general economic conditions and contingencies and uncertainties that are beyond its control. Even if TEP is successful in obtaining funds for expansion capital expenditures through equity or debt financings, the terms thereof could limit its ability to pay distributions to its common unitholders. In addition, incurring additional debt may significantly increase its interest expense and financial leverage, and issuing additional limited partner interests may result in significant common unitholder dilution and increase the aggregate amount of cash required to maintain the then-current distribution rate, which could materially decrease its ability to pay distributions at the then-current distribution rate. TEP does not currently have any commitment with its general partner or other affiliates, including Tallgrass Development, for them to provide any direct or indirect financial assistance to TEP.
The Throughput and Deficiency Agreements for the Pony Express System and some of TEP's service agreements with respect to its water business services contain provisions that can reduce the cash flow stability that the agreements were designed to achieve.
The Throughput and Deficiency Agreements, or TDAs, for the Pony Express System and some of TEP's service agreements with respect to its water services business are firm fee contracts with minimum volume commitments that are designed to generate stable cash flows and minimize direct commodity price risk. Under these minimum volume commitments, its customers agree to ship a minimum volume of crude oil or to have a minimum volume of water serviced, as the case may be, over certain periods during the term of the applicable agreement.
If a customer's actual throughput volumes or volumes serviced are less than its minimum volume commitment for the applicable period, it must make a deficiency payment at the end of the applicable period based upon the difference between the minimum volume commitment and the actual amounts serviced. A customer may apply any deficiency payments it makes as a credit against payment for volumes transported or serviced by TEP in excess of its minimum volume commitment in future periods. Upon termination of the Pony Express TDAs, customers may continue to use any remaining deficiency credits against any volumes serviced by TEP for a period of six months following termination, even though such customers may no longer have a minimum volume commitment.
To the extent that a customer's actual throughput volumes or volumes serviced are above its minimum volume commitment for the applicable period, the customer may use the excess volumes to credit against future deficiency payments in subsequent periods. As of December 31, 2016, Pony Express had a cumulative net deficiency balance of
$60.6 million
and a cumulative shipper incremental balance of
$24.4 million
.
Some or all of these provisions can apply in combination with one another. As a result, in the future TEP may not receive any cash payments for volumes shipped or serviced by TEP, and TEP may not receive deficiency payments as a result of excess volumes shipped in prior periods. This would result in reduced revenue and cash flows to TEP.
32
TEP may not be able to compete effectively in its midstream services activities and its business is subject to the risk of a capacity overbuild of midstream energy infrastructure in the areas where TEP operates.
TEP faces competition in all aspects of its business and may not be able to compete effectively against its competitors. In general, competition comes from a wide variety of players in a wide variety of contexts, including new entrants and existing players and in connection with day-to-day business, expansion capital projects, acquisitions and joint venture activities. Some of its competitors have capital resources greater than TEP's and control greater supplies of crude oil, natural gas or NGLs.
TEP's ability to renew or replace its existing contracts at rates sufficient to maintain current revenues and current cash flows could be adversely affected by the activities of its competitors. Some of its competitors have assets in closer proximity to certain hydrocarbon supplies and have available idle capacity in existing assets that may require no or minimal new capital investments for use. For example, several pipelines access many of the same basins as TEP's assets and transport to customers in the Rocky Mountain, Appalachian Mountain and Midwest regions of the United States, such as the Saddlehorn-Grand Mesa Pipeline and White Cliffs Pipeline that compete with the Pony Express Pipeline. Pony Express also competes with rail facilities, which can provide more delivery optionality to crude oil producers and marketers looking to capitalize on basis differentials between two primary crude oil benchmarks (West Texas Intermediate Crude and Brent Crude). Furthermore, Tallgrass Development and its affiliates are not limited in their ability to compete with TEP.
TEP's competitors may expand or construct new midstream services assets that would create additional competition for the services TEP provides to its customers, or its customers may develop their own facilities in lieu of using TEP's. A significant driver of competition in some of the markets where TEP operates (including, for example, the Rocky Mountain and Appalachian Mountain regions) has been the rapid development of new midstream energy infrastructure capacity in recent years. As a result, TEP is exposed to the risk that the areas in which TEP operates become overbuilt, resulting in an excess of midstream energy infrastructure capacity. If TEP experiences a significant capacity overbuild in one or more of the areas where TEP operates, it could have a significant adverse impact on its financial position, cash flows and ability to pay or increase distributions to its unitholders. For example, TEP's competitors in these areas could substantially decrease the prices at which they offer their services, and TEP may be unable to compete effectively. This could materially impair its cash flows and ability to make distributions to its unitholders.
Further, natural gas as a fuel, and fuels derived from crude oil, compete with other forms of energy available to users, including electricity, coal, other liquid fuels and alternative energy. Increased demand for such forms of energy at the expense of natural gas or fuels derived from crude oil could lead to a reduction in demand for TEP's services.
All of these competitive pressures could make it more difficult for TEP to renew its existing long-term firm fee contracts when they expire or to attract new customers as TEP seeks to expand its business, which could have a material adverse effect on its business, financial condition, results of operations and prospects. In addition, competition could intensify the negative impact of factors that decrease demand for natural gas and crude oil in the markets TEP serves, such as adverse economic conditions, weather, higher fuel costs and taxes or other governmental or regulatory actions decreasing demand.
Constructing new assets subjects TEP to risks of project delays, cost overruns and lower-than-anticipated volumes of natural gas or crude oil once a project is completed. TEP's operating cash flows from its capital projects may not be immediate or meet its expectations.
One of the ways TEP may grow its business is by constructing additions or modifications to its existing facilities. TEP also may construct new facilities, either near its existing operations or in new areas. Construction projects require significant amounts of capital and involve numerous regulatory, environmental, political, legal and operational uncertainties, many of which are beyond its control. TEP may be unable to complete announced construction projects on schedule, at the budgeted cost, or at all, which could have a material adverse effect on its business and results of operations. For example, on June 17, 2014, Michels Corporation, or Michels, filed a complaint and request for relief against Rockies Express as a result of work performed by Michels to construct the Seneca Lateral Pipeline in Ohio. Michels sought unspecified damages from Rockies Express and asserted claims of breach of contract, negligent misrepresentation, unjust enrichment and quantum meruit, and also filed notices of Mechanic's Liens in Monroe and Noble Counties, asserting $24.2 million as the amount due. On February 2, 2017, Rockies Express and Michels entered into a binding settlement agreement to resolve the claims brought by Michels in exchange for a $10 million cash payment by Rockies Express.
These projects also involve numerous economic uncertainties and the cash flow generated from these projects may not meet expectations or project estimates. Moreover, TEP may not receive any material increase in operating cash flow from a project for some time or at all. For instance, with respect to the Rockies Express Zone 3 Capacity Enhancement Project, substantially all of the construction expenditures have been incurred during 2015 and 2016, yet Rockies Express will only receive increases in cash flow from the project now that it is completed and was placed in service in January 2017.
33
The project specifications and expectations regarding project cost, timing, asset performance, investment returns and other matters usually rely in part on the expertise of third parties such as engineers, technical experts and construction contractors. These estimates may prove to be inaccurate because of numerous operational, technological, economic and other uncertainties. TEP also relies in part on estimates from producers regarding the timing and volume of anticipated natural gas and crude oil production. Production estimates are subject to numerous uncertainties, nearly all of which are beyond its control. These estimates may prove to be inaccurate, and new facilities may not attract sufficient volumes to achieve its expected cash flow and investment return.
TEP has certain long-term fixed priced natural gas and crude oil transportation contracts that cannot be adjusted even if its costs increase. As a result, its costs could exceed its revenues.
As of December 31, 2016, approximately 40% of TEP's contracted natural gas transportation firm capacity was provided under long-term, fixed price "negotiated or discount rate" contracts that are not subject to adjustment, even if its cost to perform such services exceeds the revenues received from such contracts, and, as a result, its costs could exceed its revenues received under such contracts. It is possible that costs to perform services under its "negotiated or discount rate" contracts will exceed the negotiated or discounted rates. It is also possible with respect to discounted rates that if its filed "recourse rates" should ever be reduced below applicable discounted rates, TEP would only be allowed by the FERC to charge the lower recourse rates, since FERC policy does not allow discount rates to be charged to the extent that they exceed applicable recourse rates. If these events were to occur, it could decrease the cash flow realized by TEP's assets and, therefore, the cash TEP has available for distributions to its unitholders.
Under FERC policy, a regulated service provider and a customer may mutually agree to sign a contract for service at a "negotiated rate," which is generally fixed between the natural gas pipeline and the shipper for the contract term and does not necessarily vary with changes in the level of cost-based "recourse rates," provided that the affected customer is willing to agree to such rates and that the FERC has accepted the negotiated rate agreement. These "negotiated or discount rate" contracts are not generally subject to adjustment for increased costs which could be caused by inflation or other factors relating to the specific facilities being used to perform the services. Any shortfall of revenue, representing the difference between "recourse rates" (if higher) and negotiated or discounted rates, under current FERC policy, may be recoverable from other shippers in certain circumstances. For example, the FERC may recognize this shortfall in the determination of prospective rates in a future rate case. However, if the FERC were to disallow the recovery of such costs from other customers, it could decrease the cash flow realized by its assets and, therefore, the cash TEP has available for distributions to its unitholders.
Rates under Pony Express' TDAs are typically subject to change only per contract terms and conditions, including Pony Express' right to file changes to contract rates to reflect annual index percentage adjustments published by the FERC. TEP generally cannot file for rate increases with respect to committed shippers who have signed TDAs, other than to reflect annual index adjustments or to recover compliance costs imposed by governmental actions.
A significant amount of the revenue currently generated by the Pony Express System, and a significant amount of Rockies Express' revenue, are from contracts that contain most favored nations rights, limiting its flexibility to offer certain capacity to new shippers.
Approximately 90% of the Pony Express System's current available capacity is provided to committed shippers under long-term TDAs. Some of the TDAs contain most favored nations rights, or MFNs, which could result in lower rates being charged to certain committed shippers to ensure that the rates such shippers are paying are no greater than ninety to one hundred percent of the rates being charged to other similarly situated shippers for similar service at similar volumes and terms. Triggering the MFNs on the TDAs could lead to a reduction in revenue generated by Pony Express, which could have a material adverse effect on our revenues, cash flow, results of operations, and TEP's ability to make distributions to its unitholders.
Rockies Express' foundation and anchor shippers for west-to-east service hold certain MFNs granting them a right to a rate reduction in certain instances where Rockies Express provides service to another shipper at a rate lower than the foundation or anchor shipper rate for a term of one year or greater or, in the case of the foundation shipper, from certain specified receipt locations. The MFNs effectively limit Rockies Express' flexibility in negotiating rates for some of its services with other shippers, because triggering the MFNs of the foundation and anchor shippers could lead to a reduction in the rates that Rockies Express charges, which could have a material adverse effect on Rockies Express' revenues, cash flow and results of operations, which in turn could impair TEP's ability to make distributions to TEP's unitholders.
If third-party pipelines or other facilities interconnected to TEP's systems become partially or fully unavailable, or if the volumes TEP transports do not meet the quality requirements of such pipelines or facilities, its revenues and its ability to make distributions to its unitholders could be adversely affected.
TEP's assets typically connect to other pipelines or facilities owned, leased and/or operated by unaffiliated third parties, such as the ONEOK Bakken Pipeline, L.L.C., Deeprock Development, LLC, Whiting, and others. For example, TEP's Pony Express System connects to upstream joint tariff pipelines, including the Belle Fourche Pipeline owned by the True Companies
34
(which also own and operate the Bridger Pipeline upstream of the Belle Fourche Pipeline) and the Double H Pipeline owned by Kinder Morgan, which are responsible for delivering a substantial portion of the crude oil for transportation on the Pony Express System. In addition, part of the crude oil TEP transports on the Pony Express System is either stored in crude oil tanks located on, or pumped over to downstream pipelines that interconnect through, the Cushing Terminal, which TEP does not operate.
The continuing operation of such third-party facilities and other midstream facilities is not within its control. These pipelines, plants and other midstream facilities may become unavailable to TEP for any number of reasons, including because of testing, turnarounds, line repair, extended unscheduled maintenance, reduced operating pressure, lack of operating capacity, regulatory requirements, curtailments of receipt or deliveries due to insufficient capacity or because of damage from weather events or other operational hazards. For example, the operations of the Bridger Pipeline's Poplar System were down for approximately five months during the first half of 2015 due to a pipeline release. Bridger declared a force majeure as a result of this event and temporarily lacked the capacity to make up volumes on other lines that directly or indirectly deliver crude oil into designated origin points on the Pony Express System or the Belle Fourche Pipeline. The largest committed shipper on the Pony Express System also declared a force majeure as a result of this incident.
If the costs to TEP to access and transport on these third-party pipelines or any alternative pipelines significantly increase, if any of these pipelines or other midstream facilities become unable to receive, transport, store or process products from its assets, or if the volumes TEP transports or processes do not meet the quality requirements of such pipelines or facilities, its revenues and its ability to make quarterly cash distributions to its unitholders could be adversely affected.
The lack of diversification of TEP's assets and geographic locations could adversely affect its ability to make distributions to its common unitholders.
TEP relies on revenues generated from its assets, which are primarily located in the Rocky Mountain, Appalachian Mountain and Midwest regions of the United States. Revenues on its assets primarily depend on exploration and production activities of its customers located in these regions. Due to its lack of diversification in assets and geographic location, an adverse development in these businesses or its customers' areas of operations, including adverse developments due to catastrophic events, weather, regulatory action and decreases in supply or demand for hydrocarbons, could have a significantly greater impact on its results of operations and cash available for distribution to its common unitholders than if TEP maintained more diverse assets and locations. For example, its water business services are concentrated in a limited number of assets and primarily consists of its water business operations in Weld County, Colorado. Thus, the growth and profitability of its water business services will be especially vulnerable to conditions and fluctuations in the local Weld County economy and subject to changes in local government regulations and priorities.
TEP's operations are dependent on its rights and ability to receive or renew the required permits and other approvals from governmental authorities and other third parties.
Performance of TEP's operations requires that TEP obtains and maintains numerous environmental and land use permits and other approvals authorizing its business activities. A decision by a governmental authority or other third party to deny, delay or restrictively condition the issuance of a new or renewed permit or other approval, or to revoke or substantially modify an existing permit or other approval, could have a material adverse effect on its ability to initiate or continue operations at the affected location or facility. Expansion of its existing operations is also predicated on securing the necessary environmental or land use permits and other approvals, which TEP may not receive in a timely manner or at all.
In order to obtain permits and renewals of permits and other approvals in the future, TEP may be required to prepare and present data to governmental authorities pertaining to the potential adverse impact that any proposed activities may have on the environment, individually or in the aggregate, including on public and Indian lands. Certain approval procedures may require preparation of archaeological surveys, endangered species studies and other studies to assess the environmental impact of new sites or the expansion of existing sites. Compliance with these regulatory requirements is expensive and significantly lengthens the time needed to develop a site or pipeline alignment. Also, obtaining or renewing required permits or other approvals is sometimes delayed or prevented due to community opposition and other factors beyond its control. The denial of a permit or other approval essential to its operations or the imposition of restrictive conditions with which it is not practicable or feasible to comply could impair or prevent its ability to develop or expand a property or right-of-way. Significant opposition to a permit or other approval by neighboring property owners, members of the public or non-governmental organizations, or other third parties or delay in the environmental review and permitting process also could impair or delay its ability to develop or expand a property or right-of-way. New legal requirements, including those related to the protection of the environment, could be adopted at the federal, state and local levels that could materially adversely affect its operations, its cost structure or its customers' ability to use its services. Such current or future regulations could have a material adverse effect on its business and TEP may not be able to obtain or renew permits or other approvals in the future.
35
Difficult conditions in the global capital markets, the credit markets and the economy in general could negatively affect TEP's business and results of operations.
TEP's business may be negatively impacted by adverse economic conditions or future disruptions in the global financial markets. Included among these potential negative impacts are reduced energy demand and lower prices for its services and increased difficulty in collecting amounts owed to TEP by its customers which could reduce its access to credit markets, raise the cost of such access or require TEP to provide additional collateral to its counterparties. TEP's ability to access available capacity under its revolving credit facility could be impaired if one or more of its lenders fails to honor its contractual obligation to lend to TEP. If financing is not available when needed, or is available only on unfavorable terms, TEP may be unable to implement its business plans or otherwise take advantage of business opportunities or respond to competitive pressures.
The amount of cash TEP has available for distribution to unitholders depends primarily on its cash flow rather than on its profitability, which may prevent TEP from making distributions, even during periods in which TEP records net income.
The amount of cash TEP has available for distribution depends primarily upon its cash flow and not solely on profitability, which will be affected by non-cash items. As a result, TEP may make cash distributions during periods when TEP records losses for financial accounting purposes and may not make cash distributions during periods when TEP records net earnings for financial accounting purposes.
The revenue in TEP's Processing & Logistics segment largely depends on the amount of natural gas that its customers actually deliver to its natural gas processing plants.
As of
December 31, 2016
, approximately
99%
of TEP's reserved capacity at its Casper and Douglas natural gas processing plants was subject to firm or volumetric fee contracts, with the majority of the fee revenue being based on the volumes actually processed (the remaining
1%
was subject to commodity sensitive contracts such as percent of proceeds or keep whole processing contracts). On these volumetric fee contracts, TEP's revenue is largely tied to the amount of natural gas that its customers actually deliver to its Casper and Douglas plants for processing. Unlike many pipeline transportation customers, TEP's natural gas processing customers are not generally subject to "take or pay" obligations. Thus, if its natural gas processing customers do not produce natural gas and deliver that natural gas to its processing plants to be processed, revenue for its Processing & Logistics segment will decline. As natural gas, crude oil or NGL prices decline, which was the case from the second half of 2014 through the first half of 2016, TEP's customers will likely make less money from the production of natural gas, crude oil or NGLs than it costs them to produce it. If that happens, its customers may not continue to produce natural gas and its revenue will decline. The decreased commodity prices in late 2014 through 2016 contributed to a significant drop in actual and anticipated volumes from several producers from which TMID receives natural gas for processing. If a gradual recovery of commodity prices and a corresponding increase in volumes over time to TMID does not occur, we could have an impairment of the goodwill at the TMID reporting unit, which is a component of our Processing & Logistics segment, and our revenue will decline. In addition, the fees its customers pay to reserve capacity at its processing plants may not deter those customers from processing their natural gas volumes at other facilities, with whom they may have had prior arrangements or otherwise.
TEP is exposed to direct commodity price risk with respect to some of its processing revenues, and its exposure to direct commodity price risk may increase in the future.
TEP's Processing & Logistics segment operates under three types of contracts, two of which directly expose its cash flows to increases and decreases in the price of natural gas and NGLs: percent of proceeds and keep whole processing contracts. As of
December 31, 2016
, approximately
1%
of the reserved capacity in its Processing & Logistics segment was contracted under percent of proceeds or keep whole processing contracts. TEP does not currently hedge the commodity exposure inherent in these types of processing contracts, and as a result, its revenues and results of operations are impacted by fluctuations in the prices of natural gas and NGLs.
Percent of proceeds processing contracts generally provide upside in high commodity price environments, but result in lower margins in low commodity price environments. Under keep whole processing contracts, TEP's revenues and its cash flows generally increase or decrease as the prices of natural gas and NGLs fluctuate. The relationship between natural gas prices and NGL prices may also affect its profitability. When natural gas prices are low relative to NGL prices, it is more profitable for TEP to process natural gas under keep whole arrangements. When natural gas prices are high relative to NGL prices, it is less profitable for TEP and its customers to process natural gas both because of the higher value of natural gas and the increased cost (principally that of natural gas as a feedstock and a fuel) of separating the mixed NGLs from the natural gas. As a result, TEP may experience periods in which higher natural gas prices relative to NGL prices reduce its processing margins or reduce the volume of natural gas processed at some of its plants. In addition, NGL prices have historically been related to the market price of oil and as a result any significant changes in oil prices could also indirectly impact its operations. Indirectly, reduced commodity prices impact TEP through reduced exploration and production activity, which results in fewer opportunities for new business to offset natural volume declines. NGL and natural gas prices are volatile and are impacted by
36
changes in the supply and demand for NGLs and natural gas, as well as market uncertainty. From the second half of 2014 through the first half of 2016, natural gas and crude oil prices declined substantially and these declines directly and indirectly resulted in lower processing volumes and realizations on its percent of proceeds and keep whole processing contracts.
TEP's success depends on the supply and demand for natural gas and crude oil.
The success of TEP's business is in many ways impacted by the supply and demand for natural gas and crude oil. For example, its business can be negatively impacted by sustained downturns in supply and demand for natural gas and crude oil in the markets that TEP serves, including reductions in its ability to renew contracts on favorable terms and to construct new infrastructure. Further, a portion of the demand for its water business services depends substantially on the level of expenditures by the oil and gas industry for the exploration, development and production of oil and natural gas reserves. These expenditures are generally dependent on the industry's view of future oil and natural gas prices and are sensitive to the industry's view of future economic growth and the resulting impact on demand for oil and natural gas. Declines, as well as anticipated declines, in oil and gas prices could also result in project modifications, delays or cancellations, general business disruptions, and delays in, or nonpayment of, amounts that are owed to TEP. These effects could have a material adverse effect on its financial condition, results of operations and cash flows.
One of the major factors that will impact natural gas demand will be the potential growth of the demand for natural gas in the power generation market, particularly driven by the speed and level of existing coal-fired power generation that is replaced with natural gas-fired power generation. One of the major factors impacting domestic natural gas and crude oil supplies has been the significant growth in unconventional sources such as shale plays and the continued progression of hydraulic fracturing technology. The supply and demand for natural gas and crude oil, and therefore the future rate of growth of TEP's business, depends on these and many other factors outside of its control, including, but not limited to:
|
•
|
adverse changes in general global economic conditions;
|
|
•
|
adverse changes in domestic regulations;
|
|
•
|
technological advancements that may drive further increases in production and reduction in costs of developing crude oil and natural gas shale plays;
|
|
•
|
the price and availability of other forms of energy, including alternative energy which may benefit from government subsidies;
|
|
•
|
prices for natural gas, crude oil and NGLs;
|
|
•
|
decisions of the members of the Organization of the Petroleum Exporting Countries, or OPEC, regarding price and production controls;
|
|
•
|
increased costs to explore for, develop, produce, gather, process and transport natural gas and crude oil;
|
|
•
|
weather conditions, seasonal trends and hurricane disruptions;
|
|
•
|
the nature and extent of, and changes in, governmental regulation, for example GHG legislation, taxation and hydraulic fracturing;
|
|
•
|
perceptions of customers on the availability and price volatility of its services and natural gas and crude oil prices, particularly customers' perceptions on the volatility of natural gas and crude oil prices over the long-term;
|
|
•
|
capacity and transportation service into, or out of, its markets; and
|
|
•
|
petrochemical demand for NGLs.
|
The oil and gas industry historically has experienced periodic downturns, and from the second half of 2014 through the first half of 2016 experienced a sustained period of decline and volatility in natural gas and crude oil prices. Any prolonged downturns in the oil and gas industry could result in a reduction in demand for TEP's services and could adversely affect its financial condition, results of operations and cash flows.
Any significant decrease in available supplies of hydrocarbons in TEP's areas of operation, or redirection of existing hydrocarbon supplies to other markets, could adversely affect its business and operating results. If recent lower commodity prices are prolonged beyond its contract lives, TEP will likely experience lower throughput volumes and reduced cash flows.
TEP's business is dependent on the continued availability of natural gas and crude oil production and reserves. Production from existing wells and natural gas and crude oil supply basins with access to its assets will naturally decline over time. The amount of natural gas and crude oil reserves underlying these wells may also be less than anticipated, and the rate at which production from these reserves declines may be greater than anticipated. Accordingly, to maintain or increase the contracted capacity and/or the volume of products utilizing its assets, its customers must continually obtain adequate supplies of natural gas and crude oil.
37
However, the development of additional natural gas and crude oil reserves requires significant capital expenditures by others for exploration and development drilling and the installation of production, storage, transportation and other facilities that permit natural gas and crude oil to be produced and products delivered to TEP's facilities. In addition, low prices for natural gas and crude oil, regulatory limitations, including environmental regulations, or the lack of available capital for these projects could have a material adverse effect on the development and production of additional reserves, as well as storage, pipeline transportation, and import and export of natural gas and crude oil supplies. The volatility and sustained lower prices for crude oil and refined products from the second half of 2014 through the first half of 2016 led to a decline in drilling activity, production and refining of crude oil, and import levels in these areas. For example, in response to recent declines in crude oil prices, a number of producers in its areas of operation significantly reduced their capital budgets and drilling plans in 2015 and 2016. Even if those producers increase their capital budgets in areas TEP serves in 2017, it may take months before the increased capital spending has the possibility of resulting in increased utilization of TEP's assets. In addition, production may fluctuate for other reasons, including, for example, in the case of crude oil, the extent to which the members of OPEC abide by recent agreements regarding production controls. Furthermore, competition for natural gas and crude oil supplies to serve other markets could reduce the amount of natural gas and crude oil supply available for its customers. Accordingly, to maintain or increase the contracted capacity and/or the volume of products utilizing its assets, its customers must compete with others to obtain adequate supplies of natural gas and crude oil.
If new supplies of natural gas and crude oil are not obtained to replace the natural decline in volumes from existing supply basins, if natural gas and crude oil supplies are diverted to serve other markets, if environmental regulations restrict new natural gas and crude oil drilling or if OPEC does maintain production controls, the overall demand for services on TEP's systems will likely decline, which could have a material adverse effect on its ability to renew or replace its current customer contracts when they expire and on its business, financial condition, results of operations and ability to make quarterly cash distributions to its unitholders.
TEP's natural gas and crude oil operations are subject to extensive regulation by federal, state and local regulatory authorities, which could have a material adverse effect on its business, financial condition, and results of operations.
TEP provides open-access interstate transportation service on its interstate natural gas transportation systems pursuant to tariffs approved by the FERC. TEP's interstate natural gas transportation and storage operations are regulated by the FERC, under the NGA, the NGPA, and the EPAct 2005. The Rockies Express Pipeline, the TIGT System and the Trailblazer Pipeline each operate under a tariff approved by the FERC that establishes rates and terms and conditions of service to its customers. The rates and terms of service on the Pony Express System are subject to regulation by the FERC under the ICA, and the Energy Policy Act of 1992. TEP provides interstate transportation service on the Pony Express System pursuant to tariffs on file with the FERC. TEP's NGL pipeline that interconnects with Overland Pass Pipeline is leased to a third party who has obtained a waiver for itself from the FERC from the tariff, filing and reporting requirements of the ICA, and TEP's NGL pipeline that interconnects with the ONEOK's Bakken NGL Pipeline is leased to a third party who is obligated to operate the leased pipeline in conformance with the ICA as a FERC regulated NGL pipeline.
Generally, the FERC's authority over natural gas facilities extends to:
|
•
|
rates, operating terms and conditions of service;
|
|
•
|
the form of tariffs governing service;
|
|
•
|
the types of services TEP may offer to its customers;
|
|
•
|
the certification and construction of new, or the expansion of existing, facilities;
|
|
•
|
the acquisition, extension, disposition or abandonment of facilities;
|
|
•
|
customer creditworthiness and credit support requirements;
|
|
•
|
the maintenance of accounts and records;
|
|
•
|
relationships among affiliated companies involved in certain aspects of the natural gas business;
|
|
•
|
depreciation and amortization policies; and
|
|
•
|
the initiation and discontinuation of services.
|
The FERC's authority over crude oil pipelines is less broad, extending to:
|
•
|
rates, rules and regulations of service;
|
|
•
|
the form of tariffs governing rates and service;
|
|
•
|
the maintenance of accounts and records; and
|
38
|
•
|
depreciation and amortization policies.
|
Interstate natural gas pipelines subject to the jurisdiction of the FERC may not charge rates or impose terms and conditions of service that, upon review by the FERC, are found to be unjust, unreasonable, unduly discriminatory, or preferential. The maximum recourse rates that TEP may charge for its natural gas transportation and storage services is established through the FERC's ratemaking process. The maximum applicable recourse rates and terms and conditions for service are set forth in its FERC-approved tariffs.
For example, TIGT filed a general rate case with the FERC pursuant to Section 4 of the NGA in October 2015, which resulted in the TIGT Rate Case Settlement that was approved by an order issued by the FERC on November 2, 2016. The TIGT Rate Case Settlement established settlement rates to be effective through at least April 30, 2019. In the event the assumptions relied upon during settlement negotiations were incorrect or the actual costs incurred to operate the TIGT System increase, TIGT's cash flows and its results of operations could be adversely affected.
Pursuant to the NGA, existing interstate natural gas transportation and storage rates and terms and conditions of service may be challenged by complaint and are subject to prospective change by the FERC. Additionally, rate increases and changes to terms and conditions of service proposed by a regulated interstate pipeline may be protested and such increases or changes can be delayed and may ultimately be rejected by the FERC. TEP currently holds authority from the FERC to charge and collect (i) "recourse rates" (i.e., the maximum cost-based rates an interstate natural gas pipeline may charge for its services under its tariff); (ii) "discount rates" (i.e., rates offered by the natural gas pipeline to shippers at discounts vis-à-vis the recourse rates and that fall within the cost-based maximum and minimum rate levels set forth in the natural gas pipeline's tariff); and (iii) "negotiated rates" (i.e., rates negotiated and agreed to by the pipeline and the shipper for the contract term that may fall within or outside of the cost-based maximum and minimum rate levels set forth in the tariff, and which are individually filed with the FERC for review and acceptance). When capacity is available and offered for sale, the rates (which include reservation, commodity, surcharges, and FL&U) at which such capacity is sold are subject to regulatory approval and oversight. Regulators and customers on its natural gas pipeline systems have the right to protest or otherwise challenge the rates that TEP charges under a process prescribed by applicable regulations. The FERC may also initiate reviews of its rates. Customers on its interstate natural gas pipeline systems may also dispute terms and conditions contained in its agreements, as well as the interpretation and application of its tariffs, among other things.
Rates for interstate crude oil transportation service must be filed as a tariff with the FERC and are subject to applicable FERC regulation. The filed tariff rates include contract rates entered into with shippers willing to make long-term commitments to the pipeline to support new pipeline capacity. Contract rates generally are not subject to regulation or change by the FERC. Non-contract "walk-up" rates are available to uncommitted non-contract shippers and generally are subject to regulation and change by the FERC. Interstate crude oil pipelines typically must reserve at least ten percent of their capacity for walk-up shippers. Contract tariff rates may be changed by Pony Express on an annual basis to reflect annual FERC index adjustments to the extent permitted by contract. Non-contract rates may be adjusted, positively or negatively, on an annual basis pursuant to a FERC indexing procedure. An interstate crude oil pipeline may also file new tariff rates at any time, subject to contract restrictions and provisions, and FERC regulatory procedures. The filing of any indexed rate increase or other rate increase may be protested by parties having standing, subject to applicable regulatory and contract provisions, and thereby be subjected to cost-of-service review by the FERC to determine whether the proposed new rate is just and reasonable.
Under the ICA, which applies to the Pony Express System, parties having standing and not restricted by contract may protest newly filed rates and terms and conditions of service within a prescribed notice period. The FERC is authorized to suspend, subject to refund, the effectiveness of a protested rate for up to seven months while it determines if the protested rate is just and reasonable. TEP's rates may be reduced and TEP may be required to issue refunds as a result of settlement or by an order of the FERC following a hearing finding that a protested rate is unjust and unreasonable. Parties having standing and not restricted by contract may file a complaint at any time regarding existing rates and terms and conditions of service. If the complaint is not resolved by settlement, the FERC may conduct a hearing and order the crude oil pipeline to make reparations going back for up to two years prior to the date on which a complaint was filed if a rate is found to be unjust and unreasonable. TEP cannot guarantee that any new or existing local or joint tariff rate for service on the Pony Express System would not be rejected or modified by the FERC, or subjected to refunds or reparations. While the FERC regulates rates and terms and conditions of service for transportation of crude oil in interstate commerce by pipeline, state agencies may also regulate facilities (including construction, acquisition, disposition, financing, and abandonment), rates, and terms and conditions of service for crude oil pipeline transportation in intrastate commerce. Any successful challenge by a regulator or shipper in any of these matters could have a material adverse effect on its business, financial condition and results of operations.
39
Pony Express Pipeline's tariff rates may not always be eligible for increases to reflect a FERC index adjustment. For example, on November 2, 2016, the FERC issued an Advanced Notice of Proposed Rulemaking, under which the FERC is proposing changes to its policies regarding the permissible scope of rate increases based on its annual issuance of changes to the generic oil pipeline index, based on specific pipelines' earnings or their specific changes to costs. The FERC's Advanced Notice of Proposed Rulemaking does not propose specific regulations, and may be followed by a Notice of Proposed Rulemaking proposing specific regulations or a Policy Statement announcing new or changed policies.
The FERC's jurisdiction over natural gas facilities extends to the certification and construction of interstate transportation and storage facilities, including, but not limited to, acquisitions, facility maintenance and upgrades, expansions, and abandonment of facilities and services. With some exceptions applicable to smaller projects, auxiliary facilities, and certain facility replacements, prior to commencing construction and/or operation of new or existing interstate natural gas transportation and storage facilities, an interstate natural gas pipeline must obtain a certificate authorizing the construction from, or file to amend its existing certificate with, the FERC. Typically, a significant expansion project requires review by a number of governmental agencies, including state and local agencies, whose cooperation is important in completing the regulatory process on schedule. Any delay or refusal by an agency to issue authorizations or permits as requested for one or more of these projects may mean that they will be constructed in a manner or with capital requirements that TEP did not anticipate or that TEP will not be able to pursue these projects. Such delay, modification or refusal could materially and negatively impact the additional revenues expected from these projects. The FERC does not regulate the construction, expansion, or abandonment of crude oil or NGL pipelines, whether interstate or intrastate, nor the initiation or discontinuation of services on those pipelines, provided that the action taken is not discriminatory or preferential among similarly situated shippers.
The FERC has the authority to conduct audits of regulated entities to assess compliance with FERC regulations and policies. The FERC also conducts audits to verify that the websites of interstate natural gas pipelines accurately provide information on the operations and availability of services on the pipeline. FERC regulations also require entities providing interstate natural gas and crude oil transportation services to comply with uniform terms and conditions for service, as set forth in publicly available tariffs or, as it concerns natural gas facilities, agreements for transportation and storage services executed between interstate pipelines and their customers. Natural gas transportation service agreements are generally required to conform, in all material respects, with the standard form of service agreements set forth in the natural gas pipeline's FERC-approved tariff. The pipeline and a customer may choose to enter into a non-conforming service agreement so long as the agreement is filed with, and accepted by, the FERC. In the event that the FERC finds that a natural gas transportation agreement, in whole or part, is materially non-conforming, the FERC could reject the agreement or require TEP to modify the agreement, or alternatively require TEP to modify its tariff so that the non-conforming provisions are generally available to all customers. Transportation agreements entered into with crude oil shippers are generally not subject to FERC regulation or required to be available for FERC or public review, but the rates and terms and services provided to similarly situated shippers may not be unduly discriminatory or preferential.
The FERC has promulgated rules and policies covering many aspects of its natural gas pipeline business, including regulations that require TEP to provide firm and interruptible transportation service on an open access basis that is not unduly discriminatory or preferential, provide internet access to current information about its available pipeline capacity and other relevant transmission information, and permit pipeline shippers to release contracted transportation and storage capacity to other shippers, thereby creating secondary markets for such services. FERC regulations also prevent interstate natural gas pipelines from sharing customer information with marketing affiliates, and restrict how interstate natural gas pipelines share transportation information with marketing affiliates. FERC regulations require that certain transmission function personnel of interstate natural gas pipelines function independently of personnel engaged in natural gas marketing functions. Crude oil pipelines subject to the ICA must comply with FERC regulations that require the pipeline to act as a common carrier and not engage in undue discrimination or preferential treatment with respect to shippers. The ICA also prevents crude oil and NGL pipelines from disclosing certain shipper information.
FERC policies also govern how interstate natural gas pipelines respond to interconnection requests from third party facilities, including other pipelines. Generally, an interstate natural gas pipeline must grant an interconnection request upon the satisfaction of several conditions. As a consequence, an interstate natural gas pipeline faces the risk that an interconnecting third-party pipeline may pose a risk of additional competition to serve a particular market or customer. Failure to comply with applicable provisions of the NGA, NGPA, EPAct 2005 and certain other laws, as well as with the regulations, rules, orders, restrictions and conditions associated with these laws, could result in the imposition of administrative and criminal remedies, including without limitation, revocation of certain authorities, disgorgement of ill-gotten gains, and civil penalties of more than $1 million per day, per violation. Violations of the ICA, the Energy Policy Act of 1992, or regulations and orders promulgated by the FERC are also subject to administrative and criminal penalties and remedies, including forfeiture and individual liability.
40
In addition, new laws or regulations or different interpretations of existing laws or regulations applicable to TEP's pipeline systems or midstream facilities could have a material adverse effect on its business, financial condition, results of operations and prospects. For example, the FERC may not continue to pursue its approach of pro-competitive policies as it considers matters such as interstate pipeline rates and rules and policies that may affect rights of access to natural gas transportation capacity and transportation and storage facilities. TEP may face challenges to its rates or terms of service in the future. Any successful challenge could materially and adversely affect its future earnings and cash flows.
The rates and terms and conditions of TEP's regulated assets are subject to review and possible adjustment by federal and state regulators, which could adversely affect its business, results of operations, financial condition and ability to make quarterly cash distributions to its unitholders.
TEP's shippers or other interested stakeholders, such as state natural gas utility regulatory agencies, may challenge the rates or the terms and conditions of service applicable to its natural gas or crude oil pipeline tariffs, unless they have entered into agreements not to challenge such tariffs. The FERC has authority to investigate its rates and terms and conditions of service pursuant to NGA Section 5 for natural gas pipelines and the ICA for common carrier oil pipelines. TEP's crude oil contract shippers have generally agreed not to complain or protest rates unless they are in conflict with their contracts. FERC generally does not regulate crude oil transportation contracts, but contract rates must be filed with FERC and tariff rules and regulations generally apply to contract shippers.
On TEP's interstate crude oil pipeline system, the Pony Express System, shippers may generally challenge new or existing rates at any time unless they have contractually agreed not to. As a result of settlement or by order of the FERC following hearing, its rates may be reduced. If a shipper files a lawful complaint, and if the complaint is not resolved with that shipper, to the extent the FERC determines after hearing that TEP has collected payment on rates that were not previously just and reasonable, TEP may be required to pay reparations to that shipper for up to two years prior to the date on which a complaint was filed. Regardless of the prospective just and reasonable rate, reparations may not be required below the last rates determined by the FERC to be just and reasonable. In other words, crude oil pipelines are not required to make reparations that refund revenues collected pursuant to rates previously determined to be just and reasonable.
Further, the FERC's actions are subject to court challenge, which may have broader implications for other regulated pipelines. For example, in July 2016, the United States Court of Appeals for the District of Columbia Circuit issued its opinion in United Airlines, Inc., et al. v. FERC, finding that the FERC had acted arbitrarily and capriciously when it failed to demonstrate that permitting an interstate petroleum products pipeline organized as a limited partnership to include an income tax allowance in the cost of service underlying its rates in addition to the discounted cash flow return on equity would not result in the pipeline partnership owners double-recovering their income taxes. The court vacated the FERC's order and remanded to the FERC to consider mechanisms for demonstrating that there is no double recovery as a result of the income tax allowance.
On December 15, 2016, the FERC issued a Notice of Inquiry regarding the FERC's policy for recovery of income tax costs in pipeline cost of service rates. The FERC is seeking comments regarding how to address any double recovery resulting from the FERC's current income tax allowance and rate of return policies following the holding in
United Airlines, Inc., et al. v. FERC
. The FERC has set a deadline for initial comments to be submitted by March 8, 2017.
There is not likely to be a definitive resolution of these issues for some time, and the ultimate outcome of this proceeding is not certain and could result in changes going forward to the FERC's treatment of income tax allowances in the cost of service or to the discounted cash flow return on equity. Depending upon the resolution of these issues, the cost of service rates of TEP's interstate natural gas pipelines and interstate crude oil pipeline could be affected to the extent TEP proposes new rates or changes to its existing rates or if its rates are subject to complaint or challenge by the FERC.
Successful challenges to rates charged on TEP's natural gas and crude oil pipeline systems, or to the terms and conditions of service on those systems, could have a material adverse effect on its business, results of operations, financial condition and ability to make quarterly cash distributions to its unitholders.
TEP is subject to numerous hazards and operational risks.
TEP's operations are subject to all the risks and hazards typically associated with transportation, storage, terminalling, processing, gathering and disposing of hydrocarbons and water. These operating risks include, but are not limited to:
|
•
|
damage to pipelines, facilities, equipment and surrounding properties caused by hurricanes, earthquakes, tornadoes, floods, fires or other adverse weather conditions and other natural disasters and acts of terrorism;
|
|
•
|
inadvertent damage from construction, vehicles, farm and utility equipment;
|
|
•
|
uncontrolled releases of crude oil, natural gas and other hydrocarbons or hazardous materials, including water from hydraulic fracturing;
|
|
•
|
leaks, migrations or losses of natural gas and crude oil as a result of the malfunction of equipment or facilities;
|
41
|
•
|
outages at its facilities;
|
|
•
|
ruptures, fires, leaks and explosions; and
|
|
•
|
other hazards that could also result in personal injury and loss of life, pollution and other environmental risks, and suspension of operations.
|
These risks could result in substantial losses due to personal injury and/or loss of life, severe damage to and destruction of property and equipment and pollution or other environmental damage. The location of TEP's assets, including certain segments of its pipeline systems in or near populated areas, including residential areas, commercial business centers, industrial sites and other public gathering areas could increase the level of damages resulting from these risks. Despite the precautions TEP takes, events could cause considerable harm to people or property, could result in loss of service available to customers, and could have a material adverse effect on its financial condition and results of operations and ability to make distributions to unitholders. For example, approximately
10,000
bbls of crude oil were released at the Sterling Terminal in January 2017. Our initial review indicates that the release was restricted to the containment area located at the Sterling Terminal and was the result of a defective roof drain system on a storage tank. While approximately
9,000
bbls have been recovered and we do not anticipate that our total costs to remediate such release will exceed
$500,000
, our ultimate remediation costs may exceed our estimates.
In addition, maintenance, repair and remediation activities could result in service interruptions on segments of TEP's systems or alter the operational profile of its systems. Any such service interruption or alteration could limit TEP's ability to satisfy customer requirements, could obligate TEP to provide reservation charge credits to customers for constrained capacity, or could allow existing customers to be solicited by other companies for potential new projects that would compete directly with TEP's services.
TEP could be required by regulatory authorities to test or undertake modifications to its systems, operations or both that could result in a material adverse impact on its business, financial condition and results of operations. Such actions, including those required by PHMSA, could materially and adversely impact its ability to meet contractual obligations and retain customers, with a resulting material adverse impact on its business and results of operations, and could also limit or prevent its ability to make quarterly cash distributions to its unitholders. Some or all of its costs arising from these operational risks may not be recoverable under insurance, contractual indemnification or increases in rates charged to its customers.
TEP's insurance coverage may not be adequate.
TEP is not insured or fully insured against all risks that could affect its business, including losses from environmental accidents or cyber security threats. For example, TEP does not maintain business interruption insurance in the type and amount to cover all possible losses. In addition, TEP does not carry insurance for certain environmental exposures, including but not limited to potential environmental fines and penalties, certain business interruptions, named windstorm or hurricane exposures and, in limited circumstances, certain political risk exposures. Further, in the event there is a total or partial loss of one or more of its insured assets, any insurance proceeds that TEP may receive in respect thereof may be insufficient to effect a restoration of such asset to the condition that existed prior to such loss. In addition, TEP is either not insured or not fully insured with respect to the legal proceedings described in
Note 18
–
Legal and Environmental Matters
to the consolidated financial statements and may, depending upon the circumstances, need to pay self-insured retention amounts prior to having losses covered by the insurance providers. The occurrence of any operating risks not fully covered by insurance could have a material adverse effect on its business, financial condition, results of operations and cash flows.
Furthermore, TEP may not be able to maintain or obtain insurance of the type and amount TEP desires at reasonable rates, and TEP has elected and may elect in the future to self-insure a portion of its risks of loss. As a result of market conditions, premiums and deductibles for certain types of insurance policies may substantially increase, and in some instances, certain types of insurance could become unavailable or available only for reduced amounts of coverage. Any insurance coverage TEP does obtain may contain large deductibles or fail to cover certain hazards or cover all potential losses.
TEP's pipeline integrity program may impose significant costs and liabilities on TEP, while increased regulatory requirements relating to the integrity of its pipeline systems may require TEP to make additional capital and operating expenditures to comply with such requirements.
TEP is subject to extensive laws and regulations related to pipeline integrity. There are, for example, federal requirements set by PHMSA for owners and operators of pipelines in the areas of pipeline design, construction, and testing, the qualification of personnel and the development of operations and emergency response plans. The rules require pipeline operators to develop integrity management programs to comprehensively evaluate their pipelines and take measures to protect pipeline segments located in what the rules refer to as HCAs.
42
TEP's pipeline operations are subject to pipeline safety regulations administered by PHMSA. These regulations, among other things, include requirements to monitor and maintain the integrity of its pipeline systems and determine the pressures at which its pipeline systems can operate. The Pipeline Safety Act of 2011, enacted January 3, 2012, amends the Pipeline Safety Improvement Act of 2002 in a number of significant ways, including:
|
•
|
reauthorizing funding for federal pipeline safety programs, increasing penalties for safety violations and establishing additional safety requirements for newly constructed pipelines;
|
|
•
|
requiring PHMSA to adopt appropriate regulations within two years and requiring the use of automatic or remote- controlled shutoff valves on new or rebuilt pipeline facilities;
|
|
•
|
requiring operators of pipelines to verify MAOP and report exceedances within five days; and
|
|
•
|
requiring studies of certain safety issues that could result in the adoption of new regulatory requirements for new and existing pipelines, including changes to integrity management requirements for HCAs, and expansion of those requirements to areas outside of HCAs.
|
In August 2012, PHMSA published rules to update pipeline safety regulations to reflect provisions included in the Pipeline Safety Act of 2011, including increasing maximum civil penalties from $0.1 million to $0.2 million per violation per day of violation and from $1.0 million to $2.0 million as a maximum amount for a related series of violations as well as changing PHMSA's enforcement process. PHMSA recently published an IFR that will increase the per-day violation penalty to $205,638 and the maximum penalty for a related series of violations to $2,056,380, effective August 1, 2016. On January 13, 2017, PHMSA finalized new hazardous liquid pipeline safety regulations extending certain regulatory reporting requirements to all hazardous liquid gathering (including oil) pipelines. The final rule requires additional event-driven and periodic inspections, requires the use of leak detection systems on all hazardous liquid pipelines, modifies repair criteria, and requires certain pipelines to eventually accommodate in-line inspection tools. Because the rule was finalized at the end of the Obama Administration, the rule is subject to a regulatory freeze pending review by the Trump Administration, unless exempted due to a determination by PHMSA and OMB to allow its effect due to health and safety considerations. Assuming the rule survives the review process or is exempted from the regulatory freeze, the rule will become effective six months after its publication in the Federal Register, although certain provisions of the Final Rule will have longer compliance periods. In addition, on April 8, 2016, PHMSA published a notice of proposed rule-making, or NPRM, addressing natural gas transmission and gathering lines. The proposed rule would include changes to existing integrity management requirements and would expand assessment and repair requirements to pipelines in MCAs, along with other changes. Further, this NPRM would build on the requirements in an Advisory Bulletin PHMSA issued in May 2012, which advised pipeline operators of anticipated changes in annual reporting requirements and that if they are relying on design, construction, inspection, testing, or other data to determine the pressures at which their pipelines should operate, the records of that data must be traceable, verifiable and complete. Comments on the NPRM were due on July 7, 2016; further action is pending. TEP is still monitoring and evaluating the effects of these proposed and recently finalized requirements on its operations.
On June 22, 2016, President Obama signed the PIPES Act, that reauthorizes PHMSA's oil and gas pipeline programs through 2019 and provides for the following new mandates, among others:
|
•
|
Empowers PHMSA to issue emergency orders to individual operators, groups of operators, or the industry upon a written finding that an unsafe condition or practice constitutes or is causing an imminent hazard;
|
|
•
|
Requires PHMSA, in consultation with other Federal agencies, to issue minimum safety standards for underground natural gas storage facilities within two years;
|
|
•
|
Requires PHMSA to conduct post-inspection briefings outlining any concerns within 30 days and providing written preliminary findings within 90 days to the extent practicable;
|
|
•
|
Requires liquid pipeline operators to provide safety data sheets on spilled product to the designated Federal On-Scene Coordinator and appropriate State and local emergency responders within 6 hours of telephonic or electronic notice of an accident to the National Response Center; and
|
|
•
|
Requires PHMSA to publish updates on its website every 90 days on the status of an outstanding final rule required by a statutory mandate.
|
On December 14, 2016, PHMSA issued an IFR that addresses safety issues related to downhole facilities, including well integrity, well bore tubing and casing at underground natural gas storage facilities. The IFR incorporates by reference two of the American Petroleum Institute’s Recommended Practice standards and mandates certain reporting requirements for operators of underground natural gas storage facilities. Operators of natural gas storage facilities will have one year from January 18, 2017, the effective date of the IFR, to implement this first set of PHMSA regulations governing underground storage fields.
43
The ultimate costs of compliance with the integrity management rules are difficult to predict. Changes such as advances of in-line inspection tools, identification of additional threats to a pipeline's integrity and changes to the amount of pipe determined to be located in HCAs or expansion of integrity management requirements to areas outside of HCAs, such as the MCAs proposed by the April 2016 NPRM, can have a significant impact on the costs to perform integrity testing and repairs.
For example, Trailblazer is currently operating at less than its current MAOP, public notice of which was first provided in June 2014. As a result of smart tool surveys in 2014, Trailblazer has identified approximately
25
-
35
miles of pipe that will likely need to be repaired or replaced in order for the pipeline to operate at its MAOP of
1,000
pounds per square inch across all segments of the Trailblazer Pipeline. Such repair or replacement will likely occur over a period of years, depending upon the remediation and repair plan implemented by Trailblazer. Segments of the Trailblazer Pipeline that require full replacement could cost as much as
$2.7 million
per mile and repair costs on sections of the pipeline that do not require full replacement are expected to be less on a per mile basis.
With respect to the approximately
25
-
35
miles of pipe that has been identified, Trailblazer completed
32
excavation digs in 2015 at an aggregate cost of approximately
$1.3 million
. During 2016, Trailblazer completed additional excavation digs and replaced approximately
8
miles of pipe at an aggregate cost of approximately
$19.0 million
. Trailblazer may not recover all such out of pocket costs through the available cost recovery options, such as a general rate increase, negotiated rate agreements with its customers, or other FERC-approved recovery mechanisms.
Additionally, in connection with certain crack tool runs on the Pony Express System completed in 2015 and 2016, Pony Express completed approximately
$9.8 million
of remediation in 2016 for anomalies identified on the Pony Express System associated with portions of the pipeline converted from natural gas to crude oil service, and expects to complete additional remediation in 2017 on the Pony Express System of approximately
$9 million
. There can be no assurance as to the amount or timing of future expenditures required to remediate or resolve these issues, and actual future expenditures may be different from the amounts we currently anticipate. These integrity issues could have a material adverse effect on our business, financial position, results of operations and prospects.
We will continue pipeline integrity testing programs to assess and maintain the integrity of our existing and future pipelines as required by the U.S. Department of Transportation regulations. The results of these tests could cause us to incur potentially material or unanticipated capital and operating expenditures for repairs or upgrades.
Further, additional laws, regulations and policies that may be enacted or adopted in the future or a new interpretation of existing laws and regulations could significantly increase the amount of these expenditures. For example, PHMSA issued an Advisory Bulletin in May 2012 which advised pipeline operators that they must have records to document the MAOP for each section of their pipeline and that the records must be traceable, verifiable and complete. Locating such records and, in the absence of any such records, verifying maximum pressures through physical testing (including hydrotesting) or modifying or replacing facilities to meet the demands of verifiable pressures, could significantly increase its costs. TIGT continues to investigate and, when necessary, report to PHMSA the miles of pipeline for which it has incomplete records for MAOP. TEP is currently undertaking an extensive internal record review in view of the anticipated PHMSA annual reporting requirements. Additionally, failure to locate such records or verify maximum pressures could require TEP to operate at reduced pressures, which would reduce available capacity on its natural gas pipeline systems. These specific requirements do not currently apply to crude oil pipelines, but proposed regulations implementing the Pipeline Safety Act of 2011 and future regulations implementing the PIPES Act likely will expand the scope of regulation applicable to crude oil pipelines. There can be no assurance as to the amount or timing of future expenditures required to comply with pipeline integrity regulation, and actual future expenditures may be different from the amounts TEP currently anticipates. In addition, TEP may be subject to enforcement actions and penalties for failure to comply with pipeline regulations. Revised or additional regulations that result in increased compliance costs or additional operating restrictions could have a material adverse effect on its business, financial position, results of operations and prospects. In addition, TEP may be subject to enforcement actions and penalties for failure to comply with pipeline regulations.
TEP's operations are subject to governmental laws and regulations relating to the protection of the environment, which may expose TEP to significant costs, liabilities and expenditures that could exceed its current expectations.
Substantial costs, liabilities, delays and other significant issues related to environmental laws and regulations are inherent in TEP's crude oil transportation, storage and terminalling, natural gas transportation, storage and processing, NGL transportation and water business services, and as a result, TEP may be required to make substantial expenditures that could exceed current expectations. TEP's operations are subject to extensive federal, state, and local laws and regulations governing health and safety aspects of its operations, environmental protection, including the discharge of materials into the environment, and the security of chemical and industrial facilities. These laws include, but are not limited to, the following:
|
•
|
CAA and analogous state and local laws, which impose obligations related to air emissions and which the EPA has relied upon as authority for adopting climate change regulatory initiatives;
|
44
|
•
|
CWA and analogous state and local laws, which regulate discharge of pollutants or fill material from its facilities to state and federal waters, including wetlands and which require compliance with state water quality standards;
|
|
•
|
CERCLA and analogous state and local laws, which regulate the cleanup of hazardous substances that may have been released at properties currently or previously owned or operated by TEP or locations to which TEP has sent wastes for disposal;
|
|
•
|
RCRA and analogous state and local laws, which impose requirements for the handling and discharge of hazardous and nonhazardous solid waste from its facilities;
|
|
•
|
The SDWA, which ensures the quality of the nation's public drinking water through adoption of drinking water standards and controls the waste fluids from disposal wells into below-ground formations;
|
|
•
|
OSHA and analogous state and local laws, which establish workplace standards for the protection of the health and safety of employees, including the implementation of hazard communications programs designed to inform employees about hazardous substances in the workplace, potential harmful effects of these substances, and appropriate control measures;
|
|
•
|
NEPA and analogous state and local laws, which require federal agencies to evaluate major agency actions having the potential to significantly impact the environment and which may require the preparation of Environmental Assessments and more detailed Environmental Impact Statements that may be made available for public review and comment;
|
|
•
|
The Migratory Bird Treaty Act, or MBTA, and analogous state and local laws, which implement various treaties and conventions between the United States and certain other nations for the protection of migratory birds and, pursuant to which the taking, killing or possessing of migratory birds is unlawful without a permit, thereby potentially requiring the implementation of operating restrictions or a temporary, seasonal, or permanent ban in affected areas;
|
|
•
|
ESA and analogous state and local laws, which seek to ensure that activities do not jeopardize endangered or threatened animals, fish and plant species, nor destroy or modify the critical habitat of such species;
|
|
•
|
Bald and Golden Eagle Protection Act, or BGEPA, and analogous state and local laws, which prohibit anyone, without a permit issued by the Secretary of the Interior, from "taking" bald or golden eagles, including their parts, nests, or eggs, and defines "take" as "pursue, shoot, shoot at, poison, wound, kill, capture, trap, collect, molest or disturb;"
|
|
•
|
OPA and analogous state and local laws, which impose liability for discharges of oil into waters of the United States and requires facilities which could be reasonably expected to discharge oil into waters of the United States to maintain and implement appropriate spill contingency plans; and
|
|
•
|
National Historic Preservation Act, or NHPA, and analogous state and local laws, which are intended to preserve and protect historical and archeological sites.
|
Various governmental authorities, including but not limited to the EPA, the U.S. Department of the Interior, the U.S. Department of Homeland Security, and analogous federal, state and local agencies have the power to enforce compliance with these and other similar laws and regulations and the permits and related plans issued under them, oftentimes requiring difficult and costly actions. Failure to comply with these and other similar laws, regulations, permits, plans and agreements may result in the assessment of administrative, civil and criminal penalties, the imposition of remedial obligations, the imposition of stricter conditions on or revocation of permits, the issuance of injunctions limiting or preventing some or all of TEP's operations, and delays in granting permits.
There is inherent risk of the incurrence of environmental costs and liabilities in TEP's business, some of which may be material, due to its handling of the products TEP transports, processes, treats, disposes, gathers, or stores, air emissions related to its operations, historical industry operations, and waste disposal practices, such as the prior use of flow meters and manometers containing mercury. These activities are subject to stringent and complex federal, state and local laws and regulations governing environmental protection, including the discharge of materials into the environment and the protection of plants, wildlife, and natural and cultural resources. These laws and regulations can restrict or impact its business activities in many ways, such as restricting the way TEP handles or disposes of wastes or requiring remedial action to mitigate pollution conditions that may be caused by its operations or that are attributable to former operators. Joint and several, strict liability may be incurred without regard to fault under certain environmental laws and regulations, including but not limited to CERCLA, RCRA and analogous state laws, for the remediation of contaminated areas and in connection with spills or releases of materials associated with oil, natural gas and wastes on, under, or from its properties and facilities, many of which have been used for midstream activities for a number of years, oftentimes by third parties not under its control. TEP is generally responsible for all liabilities associated with the environmental condition of its facilities and assets, whether acquired or developed, regardless of when the liabilities arose and whether they are known or unknown. In connection with certain acquisitions and divestitures, TEP could acquire, or be required to provide indemnification against, environmental liabilities
45
that could expose TEP to material losses, which may not be covered by insurance. In addition, the steps TEP could be required to take to bring certain facilities into compliance could be prohibitively expensive, and TEP might be required to shut down, divest or alter the operation of those facilities, which might cause TEP to incur losses. TEP is currently conducting remediation at several sites to address contamination. For these ongoing environmental remediation projects, TEP spent approximately $497,000 in 2015, approximately $990,000 in 2016 and TEP has budgeted approximately $718,000 for 2017.
Private parties, including but not limited to the owners of properties through which TEP's pipelines pass and facilities where its wastes are taken for reclamation or disposal, may have the right to pursue legal actions to enforce compliance as well as to seek damages for non-compliance with environmental laws, regulations and permits issued thereunder, or for personal injury or property damage arising from its operations. Some sites at which TEP operates are located near current or former third-party hydrocarbon storage, processing, operations or other facilities, and there is a risk that contamination has migrated from those sites to TEP's that could result in remedial action. In addition, increasingly strict laws, regulations and enforcement policies could materially increase its compliance costs and the cost of any remediation that may become necessary. TEP's insurance does not cover all environmental risks and costs and may not provide sufficient coverage if an environmental claim is made against TEP.
In June 2013, the EPA extended its National Enforcement Initiatives, enforcement priorities list, including an initiative related to Energy Extraction Activities, for 2014 through 2016, and the EPA plans to retain the Energy Extraction Activities initiative for an additional three years, effective October 2016. TEP cannot predict what the results of the current initiative or any future initiative will be, or whether federal, state or local laws or regulations will be enacted in this area. If new regulations are imposed related to oil and gas extraction, the volumes of products, including hydrocarbons and water, that TEP transports, stores, gathers, disposes and/or processes could decline and its results of operations could be materially and adversely affected.
TEP's business may be materially and adversely affected by changed regulations and increased costs due to stricter pollution control requirements or liabilities resulting from non-compliance with required operating or other regulatory permits or plans developed thereunder. Also, TEP might not be able to obtain or maintain from time to time all required environmental regulatory approvals for its operations, or may have to implement contingencies or conditions in order to obtain such approvals. If there is a delay in obtaining any required environmental regulatory approvals, or if TEP fails to obtain and comply with them, the operation, maintenance or construction of its facilities could be prevented or become subject to additional costs, resulting in potentially material adverse consequences to its business, financial condition, results of operations and cash flows. For instance, on November 25, 2014, the Wyoming Department of Environmental Quality issued a Notice of Violation for violations of Part 60 Subpart OOOO related to the Casper Gas Plant Depropanizer project. TMID had discussed the issues in a meeting with WDEQ in Cheyenne on November 17, 2014 and submitted a disclosure on November 20, 2014 detailing the regulatory issues and potential violations. The project triggered a modification of the CAA's NSPS Subpart OOOO for the entire plant. The project equipment as well as plant equipment subjected to Subpart OOOO was not monitored timely, and initial notification was not made timely. Settlement negotiations with WDEQ are currently ongoing. Costs associated with penalties and to comply with the terms of any consent decree or settlement, as well as with Subpart OOOO, could be material.
TEP is also generally responsible for all liabilities associated with the environmental condition of its facilities and assets, whether acquired or developed, regardless of when the liabilities arose and whether they are known or unknown. In connection with certain acquisitions and divestitures, TEP could acquire, or be required to provide indemnification against, environmental liabilities that could expose TEP to material losses, which may not be covered by insurance. In addition, the steps TEP could be required to take to bring certain facilities into compliance could be prohibitively expensive, and TEP might be required to shut down, divest or alter the operation of those facilities, which might cause TEP to incur losses. As an example, the Casper Gas Plant is part of the Mystery Bridge Road/U.S. Highway 20 Superfund Site also known as Casper Mystery Bridge Superfund Site. Remediation work at the Casper Gas Plant has been completed, and TEP has requested that the portion of the site attributable to TEP be delisted from the National Priorities List. As another example, in August 2011, the EPA and the Wyoming Department of Environmental Quality conducted an inspection of the Leak Detection and Repair Program, or LDAR, at the Casper Plant in Wyoming. In September 2011, TMID received a letter from the EPA alleging violations of the Standards of Performance of Equipment Leaks for Onshore Natural Gas Processing Plant requirements under the CAA. TMID received a letter from the EPA concerning settlement of this matter in April 2013 and received additional settlement communications from the EPA and Department of Justice beginning in July 2014. In July 2014, the EPA provided TMID with a draft Consent Decree that has been the basis for subsequent settlement negotiations. Subsequently, the EPA indicated that it intends to join TIGT as a defendant in this matter based on TIGT's ownership of the compressor station located adjacent to the Casper Gas Plant in order to address alleged LDAR issues at the compressor station. Most recently, the parties held a settlement meeting in August 2015. Following the settlement meeting, negotiations are continuing and the parties have entered into tolling agreements that have tolled the statute of limitations until January 31, 2017. TEP is not currently able to estimate the costs that may be associated with a settlement or other resolution of this matter, which could be material.
46
TEP has agreed to a number of conditions in its environmental permits and associated plans, approvals and authorizations that require the implementation of environmental habitat restoration, enhancement and other mitigation measures that involve, among other things, ongoing maintenance and monitoring. Governmental authorities may require, and community groups and private persons may seek to require, additional mitigation measures in the future to further protect ecologically sensitive areas where TEP currently operates, and would operate if its facilities are extended or expanded, or if TEP constructs new facilities, and TEP is unable to predict the effect that any such measures would have on its business, financial position, results of operations or prospects.
Also, on June 29, 2015, the EPA and the U.S. Army Corps of Engineers, or Corps, issued a final rule to clarify the term "waters of the United States" as it pertains to federal jurisdiction under the CWA. The rule is currently stayed nationwide. Although it is unclear how the Corps and the EPA will implement this rule if the stay is lifted, the rule may require additional Corps or the EPA authorizations or involvement in TEP's future operations, for instance, if TEP extends its pipelines into or across areas (such as certain ditches) newly considered "waters of the United States" under the final rule.
The trend in environmental regulation is to place more restrictions and limitations on activities that may affect the environment. There can be no assurance as to the amount or timing of future expenditures for environmental compliance or remediation, and actual future expenditures may be materially different from the amounts TEP currently anticipates. Revised or additional regulations that result in increased compliance costs or additional operating restrictions, particularly if those costs are not fully recoverable from its customers, could have a material adverse effect on TEP's business, financial position, results of operations and prospects.
Climate change regulation at the federal, state or regional levels could result in increased operating and capital costs for TEP and reduced demand for its services.
The United States Congress has from time to time considered adopting legislation to reduce emissions of GHGs, and there has been a wide-ranging policy debate, both nationally and internationally, regarding the impact of these gases and possible means for their regulation. In addition, efforts have been made and continue to be made in the international community toward the adoption of international treaties or protocols that would address global climate change issues. In 2015, the United States participated in the United Nations Conference on Climate Change, which led to the creation of the Paris Agreement. On April 22, 2016, 175 countries, including the United States, signed the Paris Agreement. The Paris Agreement will require countries to review and "represent a progression" in their intended nationally determined contributions, which set GHG emission reduction goals, every five years beginning in 2020. Following a finding by the EPA that certain GHGs represent an endangerment to human health, the EPA adopted two sets of rules regulating GHG emissions under the CAA, one that requires a reduction in emissions of GHGs from motor vehicles and another that regulates emissions of GHGs from certain large stationary sources. The EPA also expanded its existing GHG emissions reporting requirements to include upstream petroleum and natural gas systems that emit 25,000 metric tons or more of CO2 equivalent per year. Some of our facilities are required to report under this rule, and operational and/or regulatory changes could require additional facilities to comply with GHG emissions reporting requirements. Furthermore, the EPA adopted a final rule, effective August 2, 2016, imposing more stringent controls on methane and volatile organic compounds emissions from oil and gas development, production, and transportation operations under the New Source Performance Standard, or NSPS, program. EPA also finalized a rule regarding the alternative criteria for aggregating multiple small surface sites into a single source for air quality permitting purposes. This rule could cause small facilities, on an aggregate basis, to be deemed a major source, thereby triggering more stringent air permitting processes and requirements across the oil and gas industry. On November 10, 2016, the EPA issued a final information collection request that requires oil and gas companies to provide EPA with extensive information that EPA could use in crafting regulations of existing methane sources under CAA Section 111(d). The BLM also adopted new rules, effective January 17, 2017, to reduce venting, flaring, and leaks during oil and natural gas production activities on onshore Federal and Indian leases. In addition, many states have already taken legal measures to reduce emissions of GHGs, primarily through the planned development of GHG emission inventories and/or regional GHG cap and trade programs. Most of these cap and trade programs work by requiring either major sources of emissions, such as electric power plants, or major producers of fuels, to acquire and surrender emission allowances with the number of allowances available for purchase reduced each year until the overall GHG emission reduction goal is achieved.
The adoption of legislation or regulations imposing reporting or permitting obligations on, or limiting emissions of GHGs from, TEP's equipment and operations could require TEP to incur additional costs to reduce emissions of GHGs associated with its operations, could adversely affect its operations in the absence of any permits that may be required to regulate emission of GHGs, or could adversely affect demand for the crude oil and natural gas TEP gathers, processes, or otherwise handles. For instance, EPA recently finalized NSPS rules or future rules under CAA Section 111(d) could result in the direct regulation of GHGs associated with its operations, including the operations of Rockies Express. TEP is not able at this time to estimate such increased costs; however, they could be significant. While TEP may be able to recover some or all of such increased costs in the rates charged by its processing facilities, such recovery of costs is uncertain and may depend on the terms of its contracts with its customers.
47
If new laws or regulations that significantly restrict GHGs are adopted, such laws could also make it more difficult or costly for TEP's customers to operate, which could reduce its customers' production and therefore the demand for its services. While TEP is not able at this time to estimate such additional costs, as is the case with similarly situated entities in the industry, they could be significant for TEP. Restrictions on GHG emissions could also reduce the volume of natural gas that its customers produce, and could thereby adversely affect its revenues and results of operations. Compliance with such rules could also generally result in additional costs, including increased capital expenditures and operating costs, for TEP and its customers, which could ultimately decrease end-user demand for its services and could have a material adverse effect on its business. In addition, to the extent financial markets view climate change and GHG emissions as a financial risk, this could materially and adversely impact its cost of and access to capital. Legislation or regulations that may be adopted to address climate change, or incentives to conserve energy or use alternative energy sources, could also affect the markets for its services by making natural gas and crude oil products less desirable than competing sources of energy.
Increased regulation of hydraulic fracturing and other oil and natural gas processing operations could affect TEP's operations and result in reductions or delays in production by its customers, which could have a material adverse impact on its revenues.
A sizeable portion of the production by TEP's customers comes from hydraulically fractured wells. Hydraulic fracturing is an important and common practice that is used to stimulate production of hydrocarbons from tight formations. The process typically involves the injection of water, sand and a small percentage of chemicals under pressure into the formation to fracture the surrounding rock and stimulate production. The process is regulated by state agencies, typically the state's oil and gas commission; however, the EPA has asserted federal regulatory authority over certain hydraulic fracturing activities involving diesel under the SDWA and has released draft permitting guidance for hydraulic fracturing activities that use diesel in fracturing fluids in those states where the EPA is the permitting authority. A number of federal agencies, including the EPA and the U.S. Department of Energy, are analyzing, or have been requested to review, a variety of environmental issues associated with hydraulic fracturing. For example, on May 19, 2014, the EPA published an advance notice of rulemaking under the Toxic Substances Control Act, to gather information regarding the potential regulation of chemical substances and mixtures used in oil and gas exploration and production. In May 2016, the EPA issued final rules that update new source performance standard requirements and that will impose more stringent controls on methane and volatile organic compounds emissions from oil and gas development and production operations, including hydraulic fracturing and other well completion activity. The EPA also issued a final rule in June 2016 that prohibits the discharge of hydraulic fracturing wastewater from onshore unconventional oil and gas extraction facilities into publicly owned sewage treatment plants. Also, effective June 24, 2015, the BLM adopted rules regarding well stimulation, chemical disclosures, water management, and other requirements for hydraulic fracturing on federal and Indian lands, but a Wyoming federal judge struck down the rules in June 2016, finding that the BLM lacked congressional authority to promulgate them. The BLM is appealing this decision to the U.S. Court of Appeals for the Tenth Circuit. The BLM also adopted new rules effective January 17, 2017, to reduce venting, flaring, and leaks during oil and natural gas production activities on onshore federal and Indian leases.
Congress from time to time has considered the adoption of legislation to provide for federal regulation of hydraulic fracturing under the SDWA and to require disclosure of the chemicals used in the hydraulic fracturing process. In addition, some states, including those in which we operate, have adopted, and other states are considering adopting, regulations that could impose more stringent disclosure and/or well construction requirements on hydraulic fracturing operations. Local government also may seek to adopt ordinances within their jurisdictions regulating the time, place and manner of drilling activities in general or hydraulic fracturing activities in particular, and in some cases, may seek to ban hydraulic fracturing entirely. Some state and local authorities have considered or imposed new laws and rules related to hydraulic fracturing, including temporary or permanent bans, additional permit requirements, operational restrictions and chemical disclosure obligations on hydraulic fracturing in certain jurisdictions or in environmentally sensitive areas. Other governmental agencies, including the U.S. Department of Energy and the EPA, have evaluated or are evaluating various other aspects of hydraulic fracturing such as the potential environmental effects of hydraulic fracturing on drinking water and groundwater. On December 13, 2016, the EPA released a study of the potential adverse effects that hydraulic fracturing may have on water quality and public health, concluding that there is scientific evidence that hydraulic fracturing activities potentially can impact drinking water resources in the United States under some circumstances.
If new laws or regulations that significantly restrict hydraulic fracturing are adopted, such laws could make it more difficult or significantly more costly for TEP's customers to perform fracturing to stimulate production from tight formations. Restrictions on hydraulic fracturing could also reduce the volume of crude oil, natural gas or other hydrocarbons that its customers produce, and could thereby adversely affect its revenues and results of operations. Compliance with such rules could also generally result in additional costs, including increased capital expenditures and operating costs, for TEP and its customers, which could ultimately decrease end-user demand for its services and could have a material adverse effect on its business.
48
TEP's produced water disposal operations may be subject to additional regulation and liability or claims of environmental damages.
TEP operates produced water disposal wells which are regulated under the federal SDWA as Class II wells and under state laws. State laws and regulations that govern these operations can be more stringent than the SDWA. In addition, the possibility exists that stricter laws, regulations or enforcement policies could significantly increase its compliance costs and the cost of any remediation that may become necessary. TEP may also incur material environmental costs and liabilities. Furthermore, its insurance may not provide sufficient coverage in the event an environmental claim is made against TEP. In addition, although the disposal wells have received certain governmental regulatory licenses, permits or approvals, this does not shield TEP from potential claims from third parties claiming contamination of their water supply or other environmental damages. Remediation of environmental contamination or damages can be extremely costly and such costs, if TEP were found liable, may have a material adverse effect on its business, financial condition and results of operations.
Produced water injection well operations and hydraulic fracturing may cause induced seismicity.
State and federal regulatory agencies recently have focused on a possible connection between hydraulic fracturing related activities and the increased occurrence of seismic activity. When caused by human activity, such events are called induced seismicity. In a few instances, operators of produced water injection wells in the vicinity of seismic events have been ordered to reduce produced water injection volumes or suspend operations. Some state regulatory agencies, including those in Colorado and Texas, have modified their regulations to account for induced seismicity. Regulatory agencies at all levels are continuing to study the possible linkage between oil and gas activity and induced seismicity. In 2015, the United States Geological Study identified eight states, including Colorado, Oklahoma and Texas, with areas of increased rates of induced seismicity that could be attributed to fluid injection or oil and gas extraction. In addition, a number of lawsuits have been filed, most recently in Oklahoma, alleging that produced water disposal well operations have caused damage to neighboring properties or otherwise violated state and federal rules regulating waste disposal. The Oklahoma Corporation Commission has also adopted a plan calling for mandatory reductions in oil and gas wastewater disposal well volumes, the implementation of which, has involved reductions of injection or shut-ins of disposal wells. These developments could result in additional regulation and restrictions on the use of produced water injection wells and hydraulic fracturing. Such regulations and restrictions could have a material adverse effect on TEP's business, financial condition and results of operations.
TEP is exposed to costs associated with lost and unaccounted for volumes.
A certain amount of natural gas and crude oil may be lost or unaccounted for in normal operations in connection with their transportation across a pipeline system. Under TEP's tariffs and contractual arrangements with its customers TEP is entitled to retain a specified volume of natural gas and crude oil in order to compensate TEP for such lost and unaccounted for volumes, as well as the natural gas used to run its natural gas compressor stations, which we refer to collectively to as fuel usage. TEP's pipeline tariffs currently contain fuel usage true-up mechanisms. The use of fuel (natural gas, electric and lost and unaccounted for gas) trackers on the Rockies Express Pipeline, the TIGT System, and the Trailblazer Pipeline, while minimizing risk over time, nevertheless leaves the systems exposed to the possibility of under- or over-collections on an annual basis. The level of lost and unaccounted for volumes, and natural gas fuel usage, on its pipeline systems may exceed the natural gas and crude oil volumes retained from its customers as compensation for its lost and unaccounted for volumes, and fuel usage, pursuant to its tariffs and contractual agreements, and it may be necessary to purchase natural gas or crude oil in the market to make up for the difference, which exposes TEP to commodity price risk. Future exposure to the volatility of natural gas and crude oil prices as a result of lost and unaccounted for volume imbalances could have a material adverse effect on its business, financial condition, results of operations and ability to make quarterly cash distributions to its unitholders.
Any significant and prolonged change in or stabilization of natural gas prices could have a negative impact on TEP's natural gas storage business.
Historically, natural gas prices have been seasonal and volatile, which has enhanced demand for TEP's storage services. The natural gas storage business has benefited from significant price fluctuations resulting from seasonal price sensitivity, which impacts the level of demand for its services and the rates TEP is able to charge for such services. On a system-wide basis, natural gas is typically injected into storage between April and October when natural gas prices are generally lower and withdrawn during the winter months of November through March when natural gas prices are typically higher. However, the market for natural gas may not continue to experience volatility and seasonal price sensitivity in the future at the levels previously seen. If volatility and seasonality in the natural gas industry decrease, because of increased production capacity or otherwise, then demand for its storage services and the prices that TEP will be able to charge for those services may decline.
In addition to volatility and seasonality, an extended period of high natural gas prices would increase the cost of acquiring base gas and likely place upward pressure on the costs of associated storage expansion activities. Alternatively, an extended period of low seasonal volatility in natural gas prices could adversely impact storage values for some period of time until market conditions adjust. These commodity price impacts could have a negative impact on TEP's business, financial condition, results of operations and ability to make distributions to its unitholders.
49
Certain portions of TEP's transportation, storage and processing facilities have been in service for several decades. There could be unknown events or conditions or increased maintenance or repair expenses and downtime associated with its facilities that could have a material adverse effect on its business and results of operations.
Significant portions of TEP's transportation, storage and processing systems have been in service for several decades. The age and condition of its facilities could result in increased maintenance or repair expenditures, and any downtime associated with increased maintenance and repair activities could materially reduce its revenue. Any significant increase in maintenance and repair expenditures or loss of revenue due to the age or condition of its facilities could adversely affect its business and results of operations and its ability to make cash distributions to its unitholders.
TEP's revolving credit facility and the indenture governing TEP's 5.50% senior notes due 2024 contain certain restrictions which could adversely affect its business, financial condition, results of operations and ability to make quarterly cash distributions to its unitholders.
TEP is dependent upon certain earnings and cash flow generated by its operations in order to meet its debt service obligations. TEP's revolving credit facility and the indenture governing its 5.50% senior notes due 2024 (the "2024 Notes") contain, and any future financing agreements may contain, operating and financial restrictions and covenants that could restrict its ability to finance future operations or capital needs, or to expand or pursue our business activities, which may, in turn, limit its ability to make cash distributions to its unitholders. For example, TEP's revolving credit facility limits our ability to, among other things:
|
•
|
incur or guarantee additional indebtedness;
|
|
•
|
redeem or repurchase units or make distributions under certain circumstances;
|
|
•
|
make certain investments and acquisitions;
|
|
•
|
incur certain liens or permit them to exist;
|
|
•
|
enter into certain types of transactions with affiliates;
|
|
•
|
merge or consolidate with another company; and
|
|
•
|
transfer, sell or otherwise dispose of assets.
|
TEP's revolving credit facility also contains covenants requiring TEP to maintain certain financial ratios. TEP's ability to meet those financial ratios and tests can be affected by events beyond its control, and TEP cannot assure you that it will meet those ratios and tests. Further, TEP's obligations under the revolving credit facility are (i) guaranteed by TEP and each of its existing and subsequently acquired or organized direct or indirect wholly-owned domestic subsidiaries, subject to its ability to designate certain subsidiaries as "Unrestricted Subsidiaries," and (ii) secured by a first priority lien on substantially all of the present and after acquired property owned by TEP and each guarantor (other than real property interests related to its pipelines).
Similarly, the indenture governing TEP's 2024 Notes contains covenants that, among other things, limit its ability and the ability of its restricted subsidiaries to: (i) incur, assume or guarantee additional indebtedness or issue preferred units; (ii) create liens to secure indebtedness; (iii) pay distributions on equity interests, repurchase equity securities or redeem subordinated securities; (iv) make investments; (v) restrict distributions, loans or other asset transfers from our restricted subsidiaries; (vi) consolidate with or merge with or into, or sell substantially all of our properties to, another person; (vii) sell or otherwise dispose of assets, including equity interests in subsidiaries; and (viii) enter into transactions with affiliates.
The provisions of TEP's revolving credit facility and indenture governing the 2024 Notes may affect TEP's ability to obtain future financing and pursue attractive business opportunities and its flexibility in planning for, and reacting to, changes in business conditions. In addition, a failure to comply with the provisions of its revolving credit facility or the indenture governing the 2024 Notes, including a failure to meet any of the required financial ratios and tests, could result in a default or an event of default that could enable its lenders or the holders of the 2024 Notes to declare the outstanding principal of that indebtedness, together with accrued and unpaid interest, to be immediately due and payable, and in the case of the revolving credit facility, would prohibit TEP's ability to make quarterly distributions. If the payment of its indebtedness is accelerated and TEP is unable to repay the indebtedness in full, its lenders could foreclose on the assets pledged by TEP and the guarantors under the revolving credit facility. In that case, its assets may be insufficient to repay such indebtedness in full, and its unitholders could experience a partial or total loss of their investment.
Tallgrass Equity's ownership in TEP's IDRs, TEP's common units and TEP's general partner interest, are pledged under Tallgrass Equity's revolving credit facility.
Tallgrass Equity's direct ownership of 20,000,000 TEP common units and its direct ownership of its general partner (which owns TEP's IDRs and general partner interest), are pledged as security under Tallgrass Equity's revolving credit facility. Tallgrass Equity's revolving credit facility contains customary and other events of default. Upon an event of default, the lenders
50
under Tallgrass Equity's revolving credit facility could foreclose on Tallgrass Equity's ownership interest in TEP GP and the 20,000,000 TEP common units owned by Tallgrass Equity. This could ultimately result in a change in control of TEP GP, which would constitute an immediate event of default under TEP's credit facility. This would have a material adverse effect on TEP's business, financial condition and results of operations.
TEP's future indebtedness levels may limit its flexibility to obtain financing and to pursue other business opportunities.
TEP's level of indebtedness could have important consequences to TEP, including the following:
|
•
|
its ability to obtain additional financing, if necessary, for working capital, capital expenditures, acquisitions or other purposes may be impaired or such financing may not be available on favorable terms;
|
|
•
|
its funds available for operations, future business opportunities and distributions to unitholders will be reduced by that portion of its cash flow required to make interest payments on its indebtedness;
|
|
•
|
TEP may be more vulnerable to competitive pressures or a downturn in its business or the economy generally; and
|
|
•
|
its flexibility in responding to changing business and economic conditions may be limited.
|
TEP's ability to service its indebtedness depends upon, among other things, its future financial and operating performance, which will be affected by prevailing economic conditions and financial, business, regulatory and other factors, some of which are beyond its control. If its operating results are not sufficient to service its current or future indebtedness, TEP will be forced to take actions such as reducing distributions, reducing or delaying its business activities, acquisitions, investments or capital expenditures, selling assets or seeking additional equity capital. Taking any of these actions is likely to reduce the value of an investment in TEP. Plus, TEP may not be able to effect any of these actions on satisfactory terms or at all.
Increases in interest rates could adversely impact TEP's unit price, its ability to issue equity or incur indebtedness for acquisitions or other purposes and its ability to make cash distributions at its intended levels.
The interest rate on borrowings under TEP's revolving credit facility float based upon one or more of the prime rate, the U.S. federal funds rate or LIBOR. As a result, those borrowings, as well as borrowings under its possible future credit facilities or debt offerings, could be higher than current levels, causing its financing costs to increase accordingly. TEP does not currently hedge the interest rate risk on borrowings under its revolving credit facility.
As with other yield-oriented securities, TEP's unit price is impacted by the level of its cash distributions and implied distribution yield. The distribution yield is often used by investors to compare and rank yield-oriented securities for investment decision-making purposes. Therefore, changes in interest rates, either positive or negative, may affect the yield requirements of investors who invest in its units, and a rising interest rate environment could have an adverse impact on its unit price, its ability to issue equity or incur indebtedness for acquisitions or other purposes and its ability to make cash distributions at its intended levels.
Rockies Express has a substantial amount of indebtedness and Rockies Express may not be able to generate a sufficient amount of cash flow to meet its debt service obligations.
As of
December 31, 2016
Rockies Express had approximately
$2.575 billion
of total indebtedness outstanding. In addition, Rockies Express has a revolving credit facility, which will mature on January 31, 2020, with approximately
$150 million
of additional borrowing capacity available as of
December 31, 2016
.
The scheduled maturities of Rockies Express' outstanding indebtedness balances as of
December 31, 2016
are summarized as follows (in millions):
|
Year
|
Scheduled Maturities
|
|||
|
2018
|
$
|
550.0
|
|
|
|
2019
|
525.0
|
|
||
|
2020
|
750.0
|
|
||
|
Thereafter
|
750.0
|
|
||
The substantial indebtedness held by Rockies Express could have important consequences. For example, it could:
|
•
|
make it more difficult for Rockies Express to satisfy its obligations with respect to its indebtedness;
|
|
•
|
increase the vulnerability of Rockies Express to general adverse economic and industry conditions;
|
|
•
|
limit the ability of Rockies Express to obtain additional financing for future working capital, capital expenditures and other general business purposes;
|
51
|
•
|
require Rockies Express to dedicate a substantial portion of its cash flow from operations to payments on its indebtedness, thereby reducing the availability of cash flow for operations and other purposes;
|
|
•
|
limit its flexibility in planning for, or reacting to, changes in its business and the industry in which Rockies Express operates;
|
|
•
|
place Rockies Express at a competitive disadvantage compared to its competitors that have less indebtedness; and
|
|
•
|
have a material adverse effect if Rockies Express fails to comply with the covenants in the indenture relating to its notes or in the instruments governing its other indebtedness.
|
The terms of the indentures governing the existing Rockies Express notes do not restrict the amount of additional unsecured indebtedness Rockies Express may incur, and the agreement governing its credit facility permits additional unsecured borrowings. If new indebtedness is added to the current indebtedness levels, these related risks could increase.
Rockies Express' ability to make scheduled payments or to refinance its obligations with respect to its indebtedness will depend on its financial and operating performance, which, in turn, is subject to prevailing economic conditions and to financial, business, and other factors beyond its control. In addition, a significant amount of Rockies Express' revenue in 2016 was generated by long-term contracts that expire in 2019 and Rockies Express may not be able to renew or replace expiring contracts at favorable rates or on a long-term basis, which may result in lower cash flows in periods subsequent to 2019. TEP cannot assure you that Rockies Express' operating performance, cash flow and capital resources will be sufficient for payment of its indebtedness in the future. In the event that Rockies Express is required to dispose of material assets or restructure its indebtedness to meet its debt service and other obligations, TEP cannot assure you as to the terms of any such transaction or how soon any such transaction could be completed.
If Rockies Express' cash flow and capital resources are insufficient to fund its debt service obligations, it may be forced to sell material assets, obtain additional capital, including through capital contributions from its members, or restructure its indebtedness. The payment of additional capital contributions by us to Rockies Express to fund such obligations would reduce the amount of cash available to make distributions to TEP's unitholders.
Rockies Express' revolving credit facility contains certain restrictions which could limit its financial flexibility and increase its financing costs.
Rockies Express' revolving credit facility contains restrictive covenants that may prevent it from engaging in various transactions that Rockies Express deems beneficial and that may be beneficial to Rockies Express. The revolving credit facility generally requires Rockies Express to comply with various affirmative and negative covenants, including a limit on the leverage ratio (as defined in the credit agreement) of Rockies Express and restrictions on:
|
•
|
incurring secured indebtedness;
|
|
•
|
entering into mergers, consolidations and sales of assets;
|
|
•
|
granting liens;
|
|
•
|
entering into transactions with affiliates; and
|
|
•
|
making restricted payments.
|
The instruments governing any future indebtedness may contain similar or more restrictive provisions. Rockies Express' ability to respond to changes in business and economic conditions and to obtain additional financing, if needed, may be restricted.
TEP does not own most of the land on which its assets are located, which could disrupt its operations and subject TEP to increased costs.
TEP does not own in fee but rather have leases, easements, rights-of-way, permits, surface use agreements, and licenses for most of the land on which its assets are located, and TEP is therefore subject to the possibility of more onerous terms and/or increased costs to retain necessary land use if TEP does not have valid interests in the land, if such interests in the land lapse or terminate or if its facilities are not properly located within the boundaries of such interests in the land. For example, the West Frenchie Draw treating facility is located on land leased from the Wyoming Board of Land Commissioners pursuant to a contract that can be terminated at any time. Although many of these rights are perpetual in nature, TEP occasionally obtains the right to construct and operate pipelines on other owners' land for a specific period of time. If TEP was to be unsuccessful in renegotiating its leases, easements, rights-of-way, permits, surface use agreements and licenses, TEP might incur increased costs to maintain its assets, which could have a material adverse effect on its business, results of operations, financial condition and ability to make distributions to its unitholders. In addition, TEP is subject to the possibility of increased costs under its rental agreements with landowners, primarily through rental increases and renewals of expired agreements.
52
Some leases, easements, rights-of-way, permits, surface use agreements and licenses for TEP's assets are shared with other pipeline systems and other assets owned by third parties. TEP or owners of the other pipeline systems or assets may not have commenced or concluded eminent domain proceedings for some rights-of-way. In some instances, lands over which leases, easements, rights-of-way, permits, surface use agreements and licenses have been obtained are subject to prior liens which have not been subordinated to the grants to TEP.
TEP's interstate natural gas pipeline systems have federal eminent domain authority. Whether TEP has the power of eminent domain for the Pony Express crude oil pipeline varies from state to state, depending upon the laws of the particular state. Regardless, TEP must compensate landowners for the use of their property, which may include any loss of value to the remainder of their property not being used by TEP, which are sometimes referred to as "severance damages." Severance damages are often difficult to quantify and their amount can be significant. In eminent domain actions, such compensation may be determined by a court. TEP's inability to exercise the power of eminent domain could negatively affect its business if TEP was to lose the right to use or occupy the property on which its crude oil or natural gas pipeline systems are located.
A shortage of skilled labor in the midstream industry could reduce labor productivity and increase costs, which could have a material adverse effect on TEP's business and results of operations.
The transportation, storage and terminalling of crude oil, the transportation, storage and processing of natural gas, and the transportation, gathering and disposal of water requires skilled laborers in multiple disciplines such as equipment operators, mechanics and engineers, among others. If TEP experiences shortages of skilled labor in the future, its labor and overall productivity or costs could be materially and adversely affected. If its labor prices increase or if TEP experiences materially increased health and benefit costs for employees, its results of operations could be materially and adversely affected.
If TEP fails to develop or maintain an effective system of internal controls, TEP may not be able to report its financial results accurately or prevent fraud, which would likely have a negative impact on the market price of its common units.
Upon the completion of the TEP IPO, TEP became subject to the public reporting requirements of the Securities Exchange Act of 1934, as amended. Effective internal controls are necessary for TEP to provide reliable financial reports, prevent fraud and to operate successfully as a publicly traded partnership. TEP's efforts to develop and maintain its internal controls may not be successful, and TEP may be unable to maintain effective controls over its financial processes and reporting in the future or to comply with its obligations under Section 404 of the Sarbanes-Oxley Act of 2002, or which we refer to as Section 404. For example, Section 404 requires TEP, among other things, to annually review and report on, and its independent registered public accounting firm to attest to, the effectiveness of its internal controls over financial reporting. Any failure to develop, implement or maintain effective internal controls or to improve its internal controls could harm its operating results or cause TEP to fail to meet its reporting obligations. Given the difficulties inherent in the design and operation of internal controls over financial reporting, TEP can provide no assurance as to its, or TEP's independent registered public accounting firm's, conclusions about the effectiveness of its internal controls, and TEP may incur significant costs in its efforts to comply with Section 404. Ineffective internal controls will subject TEP to regulatory scrutiny and a loss of confidence in its reported financial information, which could have an adverse effect on its business and would likely have a negative effect on the trading price of its units.
New technologies, including those involving recycling of produced water or the replacement of water in fracturing fluid, may adversely affect TEP's future results of operations and financial condition.
The produced water disposal industry is subject to the introduction of new waste treatment and disposal techniques and services using new technologies including those involving recycling of produced water, some of which may be subject to patent protection. As competitors and others use or develop new technologies or technologies comparable to TEP's water business services in the future, TEP may lose market share or be placed at a competitive disadvantage. For example, some companies have successfully used propane as the fracturing fluid instead of water. Further, TEP may face competitive pressure to implement or acquire certain new technologies at a substantial cost. Some of its competitors may have greater financial, technical and personnel resources than TEP does, which may allow them to gain technological advantages or implement new technologies before TEP can. Additionally, TEP may be unable to implement new technologies or products at all, on a timely basis or at an acceptable cost. New technology could also make it easier for TEP's customers to vertically integrate their operations or reduce the amount of waste produced in oil and natural gas drilling and production activities, thereby reducing or eliminating the need for third-party disposal. Limits on its ability to effectively use or implement new technologies, including in its water business services, may have a material adverse effect on its business, financial condition and results of operations.
TEP's business could be negatively impacted by security threats, including cyber security threats, and related disruptions.
TEP relies on its information technology infrastructure to process, transmit and store electronic information, including information TEP uses to safely operate its assets. TEP may face cyber security and other security threats to its information technology infrastructure, which could include threats to its operational and safety systems that operate its pipelines, plants and
53
assets. TEP could face unlawful attempts to gain access to its information technology infrastructure, including coordinated attacks from hackers, whether state-sponsored groups, "hacktivists," or private individuals. The age, operating systems or condition of its current information technology infrastructure and software assets and its ability to maintain and upgrade such assets could affect its ability to resist cyber security threats. TEP could also face attempts to gain access to information related to its assets through unauthorized access by targeting acts of deception against individuals with legitimate access to physical locations or information, otherwise known as "social engineering."
TEP's information technology infrastructure is critical to the efficient operation of its business and essential to its ability to perform day-to-day operations. Breaches in its information technology infrastructure or physical facilities, or other disruptions, could result in damage to its assets, service interruptions, safety incidents, damage to the environment, potential liability or the loss of contracts, and have a material adverse effect on its operations, financial position, results of operations and prospects.
If TEP is unable to protect its information and telecommunication systems against disruptions or failures, its operations could be disrupted.
TEP relies extensively on computer systems to process transactions, maintain information and manage its business. Disruptions in the availability of its computer systems could impact its ability to service its customers and adversely affect its sales and results of operations. TEP is dependent on internal and third-party information technology networks and systems, including the Internet, wired, and wireless communications, to process, transmit and store electronic information. TEP's computer systems are subject to damage or interruption due to system replacements, implementations and conversions, power outages, computer or telecommunication failures, computer viruses, security breaches, catastrophic events such as fires, tornadoes, snowstorms and floods and usage errors by its employees, consultants and contractors. If its computer systems are damaged or cease to function properly, TEP may have to make a significant investment to fix or replace them, and TEP may have interruptions in its ability to service its customers. Although TEP attempts to eliminate or reduce these risks by using redundant systems, this disruption caused by the unavailability of TEP's computer systems could nevertheless significantly disrupt its operations or may result in financial damage or loss due to, among other things, lost or misappropriated information.
TEP's investment in Rockies Express is a minority interest and could be adversely affected by its lack of sole decision-making authority.
As a minority-interest partner in Rockies Express, TEP does not control Rockies Express. Thus, TEP's investment in Rockies Express involves risks that are not present when TEP is able to exercise control over an asset, including the possibility that the other members of Rockies Express might become bankrupt, fail to fund their required capital contributions or otherwise attempt to make business decisions with respect to Rockies Express that TEP does not believe are in its best interest. Moreover, under the Rockies Express limited liability company agreement, TEP is required to provide certain capital contributions in order to fund expenditures contemplated by Rockies Express' annual budget, and may be required to provide capital contributions under certain circumstances specified in the Rockies Express limited liability company agreement if determined to be reasonably necessary by a vote of Rockies Express' members.
The other members of Rockies Express may have economic or other business interests or goals that are inconsistent with TEP's business interests or goals. The Rockies Express limited liability company agreement expressly permits Rockies Express members, including Tallgrass Development, to make decisions with respect to their ownership interest without taking into account the interests of Rockies Express or any other member of Rockies Express, and TEP does not have a voting trust or other arrangement in place requiring us or Tallgrass Development to vote jointly. Under the limited liability company agreement of Rockies Express, as amended, substantially all matters are decided by a vote of 80% of the membership interests, other than certain fundamental decisions that require a vote of 90% of the membership interests. As a result, all of the decisions of the Rockies Express members effectively require unanimous approval of all three members of Rockies Express, including Tallgrass Development and Phillips 66.
TEP's membership interest in Rockies Express is subject to a right of first refusal, which may make it more difficult to sell its interest in Rockies Express in the future.
Under the terms of Rockies Express' limited liability company agreement, if any member desires to transfer its membership interest to an unaffiliated third party, each other member first has a right to purchase its proportionate share of the membership interest being sold. If TEP desires to sell all or any portion of our interest in Rockies Express in the future, TEP will be required to first offer the sale of its membership interest to the other members, who will have 30 days to elect to purchase their proportionate interest before any sale or transfer to a third party may be consummated. This requirement could make it difficult for TEP to sell its interest in Rockies Express.
54
Tax Risks
As our only cash-generating assets consist of our membership interest in Tallgrass Equity and its related direct and indirect interests in TEP, our tax risks are primarily derivative of the tax risks associated with an investment in TEP.
The tax treatment of TEP depends on its status as a partnership for U.S. federal income tax purposes, as well as it not being subject to a material amount of entity-level taxation by individual states. If the Internal Revenue Service ("IRS") were to treat TEP as a corporation for U.S. federal income tax purposes, or TEP becomes subject to material additional amounts of entity-level taxation for state tax purposes, it would reduce the amount of cash available for distribution to us and increase the portion of our distributions treated as taxable dividends.
We own a
36.94%
membership interest in Tallgrass Equity, which directly owns the Acquired TEP Units and indirectly owns all of TEP's IDRs and TEP's general partner interest (which was approximately
1.14%
as of
February 15, 2017
). Accordingly, the value of our indirect investment in TEP, as well as the anticipated after-tax economic benefit of an investment in our Class A shares, depends largely on TEP being treated as a partnership for U.S. federal income tax purposes, which requires that 90% or more of TEP's gross income for every taxable year consist of qualifying income, as defined in Section 7704 of the Internal Revenue Code of 1986, as amended (the "Code").
Despite the fact that TEP is a limited partnership under Delaware law and, unlike us, has not elected to be treated as a corporation for U.S. federal income tax purposes, it is possible, under certain circumstances, for a publicly traded partnership such as TEP to be treated as a corporation for U.S. federal income tax purposes. Although we do not believe based upon TEP's current operations that TEP is so treated, a change in TEP's business could cause it to be treated as a corporation for U.S. federal income tax purposes or otherwise subject it to U.S. federal income taxation as an entity.
For example, from time to time, members of the U.S. Congress propose and consider substantive changes to the U.S. federal income tax laws that affect publicly traded partnerships. TEP is unable to predict whether any such changes or proposals will be considered or will ultimately be enacted or whether judicial or administrative interpretations of applicable law will change. Any such changes could negatively impact the value of our indirect investment in TEP. Any modification to the U.S. federal income tax laws may be applied retroactively and could make it more difficult or impossible to meet the exception for certain publicly traded partnerships to be treated as partnerships for U.S. federal income tax purposes.
On January 24, 2017, final regulations by the IRS and the U.S. Department of the Treasury were published in the Federal Register that provide industry-specific guidance regarding whether income earned from certain activities will constitute qualifying income. We believe that TEP will continue to be able to meet the exception to be treated as a partnership for U.S. federal income tax purposes under the new rules.
If TEP were treated as a corporation for U.S. federal income tax purposes, it would pay U.S. federal income tax on its taxable income at the corporate tax rate, which is currently a maximum of 35%, and would likely pay state income taxes at varying rates. Distributions to TEP's partners, including Tallgrass Equity, would generally be taxed again as corporate distributions, and no income, gains, losses or deductions would flow through to TEP's partners. Because a tax would be imposed upon TEP as a corporation, its cash available for distribution would be substantially reduced. Therefore, treatment of TEP as a corporation would result in a material reduction in TEP's anticipated cash flow and after-tax return to us, likely causing a substantial reduction in the value of our Class A shares.
At the state level, several states are evaluating ways to subject partnerships to entity-level taxation through the imposition of state income, franchise and other forms of taxation. Imposition of such a tax on TEP by any state will reduce the cash available for distributions to TEP unitholders, likely causing a substantial reduction in the value of our Class A shares.
TEP's partnership agreement provides that if a law is enacted or existing law is modified or interpreted in a manner that subjects TEP to taxation as a corporation or otherwise subjects TEP to entity-level taxation for U.S. federal income tax purposes, TEP's minimum quarterly distribution and target distribution amounts will be adjusted to reflect the impact of that law on TEP. If this were to happen, the amount of distributions Tallgrass Equity receives from TEP and our resulting cash flows could be reduced substantially, which would adversely affect our ability to pay distributions.
Moreover, if TEP were treated as a corporation we would not be entitled to the deductions associated with our initial acquisition of interests in Tallgrass Equity or subsequent exchanges of retained Tallgrass Equity interests and Class B shares for our Class A shares. As a result, if TEP were treated as a corporation, (i) our liability for taxes would likely be higher, further reducing our cash available for distribution and (ii) a greater portion of the cash we are able to distribute would be treated as a taxable dividend.
55
We may incur substantial corporate income tax liabilities on our allocable share of TEP income.
We are classified as a corporation for U.S. federal income tax purposes and, in most states in which TEP does business, for state income tax purposes. To the extent that TEP allocates to us net taxable income in any year, current law provides that we will be subject to U.S. federal income tax at rates of up to 35% (and a 20% alternative minimum tax in certain cases), and to state income tax at rates that vary from state to state. The amount of cash available for distribution to you will be reduced by the amount of any such income taxes payable by us for which we establish reserves.
The sale or exchange of 50% or more of TEP's capital and profits interests during any twelve-month period will result in its termination as a partnership for U.S. federal income tax purposes.
TEP will be considered to have technically terminated as a partnership for U.S. federal income tax purposes if there is a sale or exchange of 50% or more of the total interests in its capital and profits within a twelve-month period. Tallgrass Development and its direct and indirect owners own a substantial interest in the capital and profits of TEP. Therefore, a transfer by them of all or a portion of their interests in TEP could result in a termination of TEP for U.S. federal income tax purposes. For purposes of determining whether the 50% threshold has been met, multiple sales of the same interest will be counted only once. TEP's termination would, among other things, result in a deferral of depreciation deductions allowable in computing TEP's taxable income. A deferral of depreciation deductions could increase the amount of taxable income allocated to us from TEP which could increase our tax liabilities and thereby reduce the amount of cash available for distribution. TEP's termination currently would not affect its classification as a partnership for U.S. federal income tax purposes, but could cause it to be subject to penalties if it were unable to determine that a termination occurred.
Compliance with and changes in tax laws could adversely affect our performance.
We are subject to extensive tax laws and regulations, including federal and state income tax laws and transactional tax laws such as excise, sales/use, payroll, franchise and ad valorem tax laws. New tax laws and regulations and changes in existing tax laws and regulations are continuously being enacted that could result in increased tax expenditures in the future. Further, taxing authorities may change their application of existing taxes, so that additional entities or transactions may become subject to an existing tax. Many of these tax liabilities are subject to audits by the respective taxing authority. These audits may result in additional tax payments, as well as interest and penalties. In one such audit, Rockies Express has appealed an excise tax assessment on the gross receipts from certain transactions issued by the Ohio Department of Taxation. If the appeal is unsuccessful, Rockies Express may be subject to substantial additional excise taxes in the future, and imposition of such excise taxes could reduce the cash available for distribution to our shareholders.
If the IRS makes audit adjustments to TEP's income tax returns for tax years beginning after 2017, it may collect any resulting taxes (including any applicable penalties and interest) directly from TEP, in which case TEP's cash available for distribution to TEP's unitholders might be substantially reduced.
Pursuant to the Bipartisan Budget Act of 2015, if the IRS makes audit adjustments to TEP's income tax returns for tax years beginning after 2017, it may collect any resulting taxes (including any applicable penalties and interest) directly from TEP. TEP will generally have the ability to shift any such tax liability to its general partner and its unitholders in accordance with their interests in TEP during the year under audit, but there can be no assurance that TEP will be able to (or will choose to) do so under all circumstances. If TEP is required to make payments of taxes, penalties and interest resulting from audit adjustments, its cash available for distribution to its unitholders might be substantially reduced.
Taxable gain or loss on the sale of our Class A shares could be more or less than expected.
If a holder sells our Class A shares, the holder will recognize a gain or loss equal to the difference between the amount realized and the holder's tax basis in those Class A shares. To the extent that the amount of our distributions exceeds our current and accumulated earnings and profits, the distributions will be treated as a tax-free return of capital and will reduce a holder's tax basis in the Class A shares. Because our distributions in excess of our earnings and profits decrease a holder's tax basis in Class A shares, such excess distributions will result in a corresponding increase in the amount of gain, or a corresponding decrease in the amount of loss, recognized by the holder upon the sale of the Class A shares.
Our current tax treatment may change, which could affect the value of our Class A shares or reduce our cash available for distribution.
Changes in U.S. federal income tax law relating to our tax treatment as a corporation could result in (i) our being subject to additional taxation at the entity level with the result that we would have less cash available for distribution and (ii) a greater portion of our distributions being treated as taxable dividends. Moreover, we are subject to tax in numerous jurisdictions. Changes in current law in these jurisdictions, particularly relating to the treatment of deductions attributable to acquisitions of interests in Tallgrass Equity, could result in our being subject to additional taxation at the entity level with the result that we would have less cash available for distribution.
56
Any decrease in our Class A share price could adversely affect our amount of cash available for distribution.
Changes in certain market conditions may cause our Class A share price to decrease. If the Exchange Right Holders exercise their Exchange Right when our Class A share price is less than the price at which the Class A shares were sold in the TEGP IPO, the ratio of our income tax deductions to gross income would decline. This decline could result in our being subject to tax sooner than expected, our tax liability being greater than expected, or a greater portion of our distributions being treated as taxable dividends.
The IRS Form 1099-DIV that you receive from your broker may over-report your dividend income with respect to our shares for U.S. federal income tax purposes, and failure to report your dividend income in a manner consistent with the IRS Form 1099-DIV that you receive from your broker may cause the IRS to assert audit adjustments to your U.S. federal income tax return. If you are a non-U.S. holder of our shares, your broker or other withholding agent may overwithhold taxes from dividends paid to you, in which case you generally would have to timely file a U.S. tax return or an appropriate claim for refund in order to claim a refund of the overwithheld taxes.
Distributions we pay with respect to our shares will constitute "dividends" for U.S. federal income tax purposes only to the extent of our current and accumulated earnings and profits. Distributions we pay in excess of our earnings and profits will not be treated as "dividends" for U.S. federal income tax purposes; instead, they will be treated first as a tax-free return of capital to the extent of your tax basis in your shares and then as capital gain realized on the sale or exchange of such shares. We may be unable to timely determine the portion of our distributions that is a "dividend" for U.S. federal income tax purposes.
If you are a U.S. holder of our Class A shares, the IRS Form 1099-DIV may not be consistent with our determination of the amount that constitutes a "dividend" to you for U.S. federal income tax purposes or you may receive a corrected IRS Form 1099-DIV (and you may therefore need to file an amended federal, state or local income tax return). We will attempt to timely notify you of available information to assist you with your income tax reporting (such as posting the correct information on our website). However, the information that we provide to you may be inconsistent with the amounts reported to you by your broker on IRS Form 1099-DIV, and the IRS may disagree with any such information and may make audit adjustments to your tax return.
If you are a non-U.S. holder of our Class A shares, "dividends" for U.S. federal income tax purposes will be subject to withholding of U.S. federal income tax at a 30% rate (or such lower rate as may be specified by an applicable income tax treaty) unless the dividends are effectively connected with your conduct of a U.S. trade or business. In the event that we are unable to timely determine the portion of our distributions that is a "dividend" for U.S. federal income tax purposes, or your broker or withholding agent chooses to withhold taxes from distributions in a manner inconsistent with our determination of the amount that constitutes a "dividend" for such purposes, your broker or other withholding agent may overwithhold taxes from distributions paid to you. In such a case, you generally would have to timely file a U.S. tax return or an appropriate claim for refund in order to obtain a refund of the overwithheld tax.
None.
A description of our properties is contained in Item 1.—Business, "Our Assets" of this Annual Report.
Our principal executive offices are located at 4200 W. 115th Street, Suite 350, Leawood, KS 66211 and our telephone number is 913-928-6060.
We own two office buildings in Lakewood, Colorado, with a portion being leased to a third party pursuant to a lease with an initial term through 2020. In addition, we lease our principal executive offices in Leawood, Kansas. Tallgrass Development pays a proportionate share of the costs to occupy the building to us pursuant to the TEP Omnibus Agreement.
See
Note 19
–
Legal and Environmental Matters
to the consolidated financial statements included in Part II—Item 8.—Financial Statements and Supplementary Data of this Annual Report, which is incorporated by reference into this Part I—Item 3 of this Annual Report.
Not applicable.
57
Market Information
Our Class A shares have been listed and traded on the NYSE under the symbol "TEGP" since the completion of the TEGP IPO on May 12, 2015. Our Class B shares are not listed or traded on any stock exchange. The following table sets forth the high and low sales prices of the Class A shares, as reported by the NYSE, as well as the amount of cash distributions per share declared for the periods indicated:
|
Quarter Ended
|
High
|
Low
|
Distribution per Class A Share
|
||||||||||
|
December 31, 2016
|
$
|
27.29
|
|
$
|
21.74
|
|
$
|
0.2775
|
|
||||
|
September 30, 2016
|
$
|
25.99
|
|
$
|
21.88
|
|
$
|
0.2625
|
|
||||
|
June 30, 2016
|
$
|
26.81
|
|
$
|
16.14
|
|
$
|
0.2450
|
|
||||
|
March 31, 2016
|
$
|
18.68
|
|
$
|
9.66
|
|
$
|
0.2100
|
|
||||
|
December 31, 2015
|
$
|
26.10
|
|
$
|
13.30
|
|
$
|
0.1730
|
|
||||
|
September 30, 2015
|
$
|
32.18
|
|
$
|
17.67
|
|
$
|
0.1440
|
|
||||
|
June 30, 2015
|
$
|
34.98
|
|
$
|
30.08
|
|
$
|
0.0730
|
|
(1)
|
|||
|
(1)
|
The first quarterly distribution declared on July 15, 2015 was prorated for the number of days between the closing of TEGP's initial public offering on May 12, 2015 and the end of the second quarter.
|
Holders
As of
February 15, 2017
, there was one shareholder of record of our Class A shares. This number does not include shareholders whose shares are held in trust by other entities. The actual number of beneficial shareholders is greater than the number of holders of record. In addition, as of
February 15, 2017
, 8 shareholders of record owned all
99,154,440
of our Class B shares.
Equity Compensation Plan
See Item 12.—Security Ownership of Certain Beneficial Owners and Management and Related Stockholder Matters for information regarding our Equity Compensation Plan.
Distributions of Available Cash
General
. Our partnership agreement requires that, within 55 days after the end of each quarter beginning with the quarter ending June 30, 2015, we distribute our available cash to Class A Shareholders of record on the applicable record date.
Definition of Available Cash
. Available cash is defined in our partnership agreement and generally means, with respect to any calendar quarter, all cash and cash equivalents on hand at the date of determination of available cash for the distribution in respect of such quarter (including expected distributions from Tallgrass Equity in respect of such quarter), less the amount of cash reserves established by our general partner, which will not be subject to a cap, to:
|
•
|
comply with applicable law;
|
|
•
|
comply with any agreement binding upon us or our subsidiaries (exclusive of TEP and its subsidiaries);
|
|
•
|
provide for future capital expenditures, debt service and other credit needs as well as any federal, state, provincial or other income tax that may affect us in the future;
|
|
•
|
permit us to pay a ratable amount to Tallgrass Equity as necessary to permit Tallgrass Equity to make capital contributions to TEP GP for it to maintain or attain up to a 2.0% general partner interest in TEP; or
|
|
•
|
otherwise provide for the proper conduct of our business.
|
Our available cash includes cash on hand resulting from borrowings made after the end of the quarter.
Our Sources of Available Cash.
Our only cash-generating assets consist of our indirect partnership interests in TEP through our
36.94%
membership interest in Tallgrass Equity. Therefore, our cash flow and resulting ability to make distributions will be completely dependent upon the ability of TEP to make distributions.
58
The actual amount of cash that TEP, and correspondingly Tallgrass Equity, will have available for distribution will primarily depend on the amount of cash TEP generates from its operations. For a description of factors that may impact our results and TEP's results, please read "Item 1A.—Risk Factors."
In addition, the actual amount of cash that TEP and Tallgrass Equity will have available for distribution will depend on other factors, some of which are beyond our control, including:
|
•
|
the level of revenue TEP is able to generate from its respective business;
|
|
•
|
the level of capital expenditures TEP or Tallgrass Equity makes;
|
|
•
|
the level of TEP's and Tallgrass Equity's operating, maintenance and general and administrative expenses or related obligations;
|
|
•
|
the cost of acquisitions, if any;
|
|
•
|
TEP's and Tallgrass Equity's debt service requirements and other liabilities;
|
|
•
|
TEP's and Tallgrass Equity's working capital needs;
|
|
•
|
restrictions on distributions contained in TEP's or Tallgrass Equity's debt agreements and any future debt agreements;
|
|
•
|
TEP's and Tallgrass Equity's ability to borrow under their respective revolving credit agreements to make distributions; and
|
|
•
|
the amount, if any, of cash reserves established by each of TEP GP and our general partner, in their sole discretion, for the proper conduct of TEP's and our business.
|
Performance Graph
The following performance graph compares the performance of our Class A shares with the NYSE Composite Index Total Return and the Alerian Total Return MLP Index during the period beginning on May 12, 2015, and ending on
December 31, 2016
. The graph assumes a $100 investment in our Class A shares and in each of the indices at the beginning of the period and a reinvestment of distributions/dividends paid on such investments throughout the period.

Recent Sales of Unregistered Equity Securities
None.
59
Repurchase of Equity by Tallgrass Energy GP, LP or Affiliated Purchasers
None.
The historical financial statements included in this Annual Report reflect the consolidated results of operations of TEGP's membership interest in Tallgrass Equity, Tallgrass Equity's 100% membership interest in TEP GP, which owns all of the IDRs, and all of the outstanding general partner units in TEP, and Tallgrass Equity's 20 million TEP common units it acquired at the closing of the TEGP IPO. In connection with the closing of the TEGP IPO on May 12, 2015, the following transactions (the "Reorganization Transactions") occurred (i) Tallgrass Equity distributed its interests in Tallgrass Energy Holdings and Tallgrass Energy Holdings distributed its existing limited partner interest in TEGP, respectively, to the Exchange Right Holders that also collectively own 100% of the voting power of Tallgrass Energy Holdings; (ii) TEGP issued 47,725,000 Class A shares to the public (including 6,225,000 Class A shares issued in connection with the underwriters' exercise of the overallotment option) for net proceeds of approximately $1.3 billion; (iii) the existing limited partner interests in TEGP held by the Exchange Right Holders were converted into 115,729,440 Class B shares, 6,225,000 of which were automatically cancelled in connection with the underwriters' exercise of its overallotment option; (iv) Tallgrass Equity issued 41,500,000 Tallgrass Equity units to TEGP in exchange for approximately $1.1 billion in net proceeds from the issuance of TEGP's Class A shares to the public and amended the limited liability company agreement of Tallgrass Equity to, among other things, provide that TEGP is the managing member of Tallgrass Equity; (v) TEGP used the net proceeds from the purchase of the 6,225,000 overallotment option shares to purchase a like amount of Tallgrass Equity units from the Exchange Right Holders; and (vi) Tallgrass Equity entered into a $150 million revolving credit facility and borrowed $150 million thereunder, using the aggregate proceeds from such borrowings, together with the net proceeds from the TEGP IPO that Tallgrass Equity received from TEGP, to purchase 20 million TEP common units from Tallgrass Development, LP at $47.68 per TEP common unit (the "Acquired TEP Units") and pay offering expenses and other transaction costs. Tallgrass Equity distributed the remaining proceeds (the "Excess Proceeds") to the Exchange Right Holders. The following discussion analyzes the financial condition and results of operations of TEGP, which for periods prior to the completion of the TEGP IPO on May 12, 2015 includes the financial condition and results of operations of TEGP Predecessor, which refers to TEGP as recast to show the effects of the Reorganization Transactions.
In certain circumstances and for ease of reading we discuss the financial results of these entities prior to their respective acquisitions as being "our" financial results during historic periods, although Trailblazer was owned by TD from November 13, 2012 to March 31, 2014, and Pony Express was wholly-owned by TD from November 13, 2012 to August 31, 2014. As used in this Annual Report, unless the context otherwise requires, "we," "us," "our," the "Partnership," "TEGP" and similar terms refer to Tallgrass Energy GP, LP, together with its consolidated subsidiaries (including Tallgrass Equity, TEP and their respective subsidiaries). The term our "general partner" refers to TEGP Management, LLC. References to "Tallgrass Development" or "TD" refer to Tallgrass Development, LP.
The following discussion and analysis of our financial condition and results of operations should be read in conjunction with the consolidated financial statements and related notes thereto included elsewhere in this Annual Report. A reference to a "Note" herein refers to the accompanying Notes to Consolidated Financial Statements contained in Item 8.
—
Financial Statements. In addition, please read "Cautionary Statement Regarding Forward-Looking Statements" and "Risk Factors" for information regarding certain risks inherent in our business.
The following table shows selected historical financial and operating data of TEGP for the periods and as of the dates indicated. The selected historical financial data for periods prior to the completion of the TEGP IPO on May 12, 2015 includes the financial condition and results of operations of TEGP Predecessor, which refers to TEGP as recast to show the effects of the Reorganization Transactions.
We derived the information in the following table from, and that information should be read together with and is qualified in its entirety by reference to, the consolidated financial statements and the accompanying notes included elsewhere in this Annual Report.
60
Our operating results incorporate a number of significant estimates and uncertainties. Such matters could cause the data included herein to not be indicative of our future financial condition or results of operations. A discussion of our critical accounting estimates is included in "Management's Discussion and Analysis of Financial Condition and Results of Operations" in Item 7.
|
Year Ended December 31,
|
Period from November 13 to December 31, 2012
|
||||||||||||||||||
|
2016
|
2015
|
2014
|
2013
|
||||||||||||||||
|
Statement of operations data:
|
(in thousands, except per unit amounts)
|
||||||||||||||||||
|
Revenue
|
$
|
605,122
|
|
$
|
536,197
|
|
$
|
371,556
|
|
$
|
290,526
|
|
$
|
38,572
|
|
||||
|
Operating income
|
$
|
254,174
|
|
$
|
196,631
|
|
$
|
53,413
|
|
$
|
33,999
|
|
$
|
69
|
|
||||
|
Equity in earnings of unconsolidated investments
(1)
|
$
|
51,780
|
|
$
|
—
|
|
$
|
717
|
|
$
|
—
|
|
$
|
—
|
|
||||
|
Net income (loss) before tax
|
$
|
260,785
|
|
$
|
180,714
|
|
$
|
59,329
|
|
$
|
7,624
|
|
$
|
(2,618
|
)
|
||||
|
Net income (loss)
|
$
|
243,044
|
|
$
|
187,991
|
|
$
|
59,329
|
|
$
|
7,624
|
|
$
|
(2,618
|
)
|
||||
|
Net income (loss) attributable to TEGP
|
$
|
26,794
|
|
$
|
31,956
|
|
$
|
10,914
|
|
$
|
1,501
|
|
$
|
(362
|
)
|
||||
|
Basic net income per Class A share
|
$
|
0.55
|
|
$
|
0.51
|
|
N/A
|
|
N/A
|
|
N/A
|
|
|||||||
|
Diluted net income per Class A share
|
$
|
0.55
|
|
$
|
0.51
|
|
N/A
|
|
N/A
|
|
N/A
|
|
|||||||
|
Balance sheet data (at end of period):
|
|||||||||||||||||||
|
Property, plant and equipment, net
|
$
|
2,012,263
|
|
$
|
2,025,018
|
|
$
|
1,853,081
|
|
$
|
1,116,806
|
|
$
|
726,754
|
|
||||
|
Unconsolidated investments
(2)
|
$
|
461,915
|
|
$
|
—
|
|
$
|
—
|
|
$
|
1,255
|
|
$
|
—
|
|
||||
|
Total assets
|
$
|
3,542,238
|
|
$
|
3,016,660
|
|
$
|
2,457,197
|
|
$
|
1,631,413
|
|
$
|
1,238,598
|
|
||||
|
Long-term debt, net
|
$
|
1,555,981
|
|
$
|
901,000
|
|
$
|
559,000
|
|
$
|
135,000
|
|
$
|
390,491
|
|
||||
|
Other:
|
|||||||||||||||||||
|
Distributions declared per Class A share
|
$
|
1.00
|
|
$
|
0.39
|
|
N/A
|
|
N/A
|
|
N/A
|
|
|||||||
|
(1)
|
Represents equity in earnings of our 25% membership interest in Rockies Express beginning in 2016, and our 50% equity interest in Grasslands Water Services I, LLC ("GWSI") in periods prior to May 2014. For more information see
Note 9
–
Investments in Unconsolidated Affiliates
to our Consolidated Financial Statements in Item 8.—Financial Statements and Supplementary Data.
|
Overview
TEGP is a limited partnership that has elected to be treated as a corporation for U.S. federal income tax purposes. We were formed as part of a reorganization involving entities that were previously controlled by Tallgrass Equity to effect the TEGP IPO, which was completed on May 12, 2015.
Our sole cash-generating asset is an approximate
36.94%
controlling membership interest in Tallgrass Equity. Tallgrass Equity's sole cash-generating assets consist of the direct and indirect partnership interests in TEP as described below:
|
•
|
100% of the outstanding membership interests in TEP GP, which owns all of the general partner interest in TEP as well as all of the TEP IDRs. The general partner interest in TEP is represented by
834,391
general partner units, representing an approximate
1.14%
general partner interest in TEP at
February 15, 2017
.
|
|
•
|
20,000,000
TEP common units, representing an approximate
27.41%
limited partner interest in TEP at
February 15, 2017
.
|
TEP is a publicly traded, growth-oriented limited partnership formed in 2013 to own, operate, acquire and develop midstream energy assets in North America. TEP's operations are located in and provide services to certain key United States hydrocarbon basins, including the Denver-Julesburg, Powder River, Wind River, Permian and Hugoton-Anadarko Basins and the Niobrara, Mississippi Lime, Eagle Ford, Bakken, Marcellus, and Utica shale formations.
TEP intends to continue to leverage its relationship with TD and utilize the significant experience of its management team to execute its growth strategy of acquiring midstream assets from TD and third parties, increasing utilization of its existing assets and expanding its systems through construction of additional assets. TEP''s reportable business segments are:
61
|
•
|
Crude Oil Transportation & Logistics—the ownership and operation of a FERC-regulated crude oil pipeline system and crude oil storage and terminalling facilities;
|
|
•
|
Natural Gas Transportation & Logistics—the ownership and operation of FERC-regulated interstate natural gas pipelines and integrated natural gas storage facilities; and
|
|
•
|
Processing & Logistics—the ownership and operation of natural gas processing, treating and fractionation facilities, the provision of water business services primarily to the oil and gas exploration and production industry and the transportation of NGLs.
|
Additional information about TEP's operations and assets is contained in the business overview included in Item 1.—Business under
"Overview"
and
"TEP's Assets."
Financial Presentation
TEGP has no operations outside of its indirect ownership interests in TEP. TEGP is the managing member of and therefore controls Tallgrass Equity. Tallgrass Equity, in turn, controls TEP through the direct ownership of 100% of TEP GP, TEP's general partner. As a result, under GAAP, TEGP consolidates Tallgrass Equity, TEP GP, TEP, and TEP's subsidiaries. As such, TEGP's results of operations will not differ materially from the results of operations of TEP. The most noteworthy reconciling items between TEGP's consolidated financial statements and TEP's consolidated financial statements primarily relate to (i) the inclusion of the Tallgrass Equity revolving credit facility, (ii) the impact of TEGP's election to be treated as a corporation for U.S. federal income tax purposes and (iii) the presentation of noncontrolling interests in Tallgrass Equity and TEP. The interests in Tallgrass Equity and TEP that are not directly or indirectly owned by TEGP will be reflected as being attributable to noncontrolling interests in TEGP's consolidated financial statements.
In addition, historical results of operations for periods prior to May 12, 2015 do not reflect TEGP's incremental general and administrative costs associated with becoming a separate publicly traded entity, including expenses associated with (i) compensation for new directors, (ii) incremental director and officer liability insurance, (iii) listing on the NYSE, (iv) investor relations, (v) legal, (vi) tax and (vii) accounting.
Summary of Results for the Year Ended
December 31, 2016
During
2016
, TEP completed the acquisitions of an additional 31.3% membership interest in Pony Express, a 25% membership interest in Rockies Express and an additional 8% membership interest in Water Solutions. In addition, TEP issued $400 million in aggregate principal amount of 5.50% senior notes due 2024 (the "2024 Notes") and received aggregate net proceeds of $427.7 million from the issuance of 10,113,695 common units through a combination of public and private issuances. As discussed in
Note 12
–
Partnership Equity and Distributions
, on November 16, 2016 TEGP completed a Secondary Offering of Class A shares, which effectively increased our ownership interest in Tallgrass Equity from 30.35% to
36.94%
.
Operating income for the
year ended December 31, 2016
was
$254.2 million
compared to
$196.6 million
for the
year ended December 31, 2015
. The increase in operating income was primarily driven by the ramping up of commercial operations at Pony Express and the lateral in Northeast Colorado, and TEP's acquisition of an additional 31.3% membership interest in Pony Express on January 1, 2016.
Recent Developments
TEGP Distribution Declared
On January 24, 2017, the Board of Directors of our general partner declared a cash distribution for the quarter ended
December 31, 2016
of
$0.2775
per Class A share. The distribution was paid on February 14, 2017, to Class A shareholders of record on February 3, 2017.
TEP Distribution Declared
On January 24, 2017, the Board of Directors of TEP's general partner declared a cash distribution for the quarter ended
December 31, 2016
of
$0.815
per common unit. The distribution was paid on February 14, 2017, to TEP unitholders of record on February 3, 2017.
Exercise of Call Option and Repurchase of Additional TEP Common Units Owned by TD
On
February 1, 2017
, TEP exercised the remainder of the call option granted by TD, as discussed in
Note 4
–
Acquisitions
, covering
1,703,094
TEP common units for a cash payment of
$72.4 million
, and repurchased
736,262
TEP common units from TD for a negotiated cash payment of approximately
$35.3 million
, or
$47.99
per common unit, which repurchase was approved by the conflicts committee of the board of directors of TEP's general partner. These
2,439,356
TEP common units in the
62
aggregate equal the number of common units sold under TEP's equity distribution agreements since November 3, 2016 and were deemed canceled and no longer issued and outstanding as of such transaction date.
Acquisition of Tallgrass Terminals, LLC and Tallgrass NatGas Operator, LLC
Effective January 1, 2017, TEP acquired
100%
of the issued and outstanding membership interests in Terminals and
100%
of the issued and outstanding membership interests in NatGas from TD for total cash consideration of
$140 million
.
Terminals owns and operates several fully operational assets providing storage capacity and additional injection points for the Pony Express System, including the Sterling Terminal near Sterling, Colorado, with approximately 1.3 million bbls of storage capacity and the Buckingham Terminal in Weld County, Colorado, with four truck unloading skids capable of receiving up to approximately 16,000 bbls per day. Terminals also owns a
20%
interest in the Deeprock Development, which owns the Cushing Terminal in Cushing, Oklahoma, with approximately 2.3 million bbls of storage capacity. In addition, Terminals owns projects currently under development, including approximately 550 acres in Cushing, Oklahoma and approximately 250 acres in Guernsey, Wyoming which is under development to provide additional storage capacity and other potential service opportunities.
NatGas is the operator of the Rockies Express Pipeline and receives a fee from Rockies Express as compensation for its services.
Ultra Settlement
In early 2016, Ultra defaulted on its firm transportation service agreement with Rockies Express for approximately
0.2
Bcf/d through November 11, 2019 on the Rockies Express Pipeline and on April 14, 2016, Rockies Express filed a lawsuit against Ultra for breach of contract and damages in Harris County, Texas, seeking approximately
$303 million
in damages and other relief. On April 29, 2016, Ultra and certain of its debtor affiliates filed for protection under Chapter 11 of the U.S. Bankruptcy Code in U.S. Bankruptcy Court for the Southern District of Texas, which operated as a stay of the Harris County state court proceeding.
On January 12, 2017, Rockies Express and Ultra entered an agreement to settle Rockies Express' approximately $303 million claim against Ultra's bankruptcy estate. The settlement agreement includes Ultra's agreement to: (i) make a cash payment to Rockies Express of $150 million in accordance with the plan of reorganization, but no later than October 30, 2017; and (ii) enter a new, seven-year firm transportation agreement with Rockies Express commencing December 1, 2019, for west-to-east service of 0.2 Bcf/d at a rate of approximately $0.37, or approximately $26.8 million annually. The settlement is part of Ultra's Chapter 11 reorganization plan, which must be submitted to the U.S. Bankruptcy Court for approval.
Factors and Trends Impacting Our Business
Our sole cash-generating asset is an approximate
36.94%
controlling membership interest in Tallgrass Equity. Tallgrass Equity's sole cash-generating assets consist of direct and indirect partnership interests in TEP, as detailed above in
"—Overview"
. As a result, we expect to continue to be affected by certain key factors and trends impacting TEP's business as described below. Our expectations are based on assumptions made by us and information currently available to us. To the extent our underlying assumptions about, or interpretations of, available information prove to be incorrect, our actual results may vary materially from our expected results. See also Item 1A.
—
Risk Factors.
Long-Term U.S. Crude Oil and Natural Gas Prospects
Crude oil, natural gas, and products derived from both continue to be critical components of energy supply and demand in the United States. Although crude oil and natural gas prices declined significantly from the second half of 2014 through the first half of 2016, and could experience further declines or remain at or near current levels for the foreseeable future, we nevertheless believe that prices may have stabilized during the latter part of 2016 and that the long-term prospects for continued crude oil and natural gas production increases are favorable.
We believe long-term growth will be driven, in part, by a combination of increased domestic demand resulting from population and economic growth, higher industrial consumption in the U.S. spurred by the lower commodity price of feedstock and fuel, and a desire to reduce domestic reliance on imports. One example is that we expect natural gas to gradually displace coal-fired electricity generation due to the low prices of natural gas and stricter environmental regulations on the mining and burning of coal. We expect productivity of oil and natural gas wells to continue increasing over the long-term in some basins across the United States because of the increasing precision and efficiency of horizontal drilling and hydraulic fracturing in oil and natural gas extraction. We also believe there is a substantial inventory of drilled but uncompleted wells in the basins we serve, including the Bakken shale and Denver-Julesburg basin, that are likely to be completed and turned into production as commodity prices continue to recover and stabilize.
63
Current Commodity Environment
Starting in the second half of 2014, the prices of crude oil, natural gas, and NGLs were extremely volatile and declined significantly. This volatility and downward pressure on commodity prices continued through the first half of 2016. Such volatility and reduced prices impact our business in several ways.
Demand for our services depends, in part, on the development of additional natural gas and crude oil reserves by third parties. This requires significant capital expenditures by others to install facilities that extract natural gas and crude oil. However, low commodity prices may result in a lack of available capital for these types of expenditures. To the extent our customers cannot finance these activities, we expect they may be less likely to enter into demand based, long-term firm fee contracts until there is further commodity price recovery and stability in the markets. The commodity price declines over the past two years may also negatively impact the financial condition of our customers and could impact their ability to meet their financial obligations to us.
Additionally, lower commodity prices may lead to reduced utilization of our assets. For example, reduced utilization could result in increased deficiency balances held by customers of our Pony Express System. For additional information see Item 1A.
—
Risk Factors,
"The Throughput and Deficiency Agreements for the Pony Express System and some of TEP's service agreements with respect to its water business services contain provisions that can reduce the cash flow stability that the agreements were designed to achieve."
Growth Associated with Acquisitions and Expansion Projects
Growth associated with acquisitions
We believe that we are well-positioned to grow through accretive acquisitions. We intend to pursue acquisition opportunities from third parties as they become available and expect to continue to acquire assets from TD's portfolio of midstream assets, which includes TD's 50% interest in the Rockies Express Pipeline. We expect TD to retain its 2% ownership interest in Pony Express for the foreseeable future. Pursuant to the TEP Omnibus Agreement, TD granted us the right of first offer to acquire each of the remaining Retained Assets if TD decides to sell those assets. Other than its obligations under the TEP Omnibus Agreement, TD is under no obligation to offer to sell us additional assets or to pursue acquisitions jointly with us, and we are under no obligation to buy any assets from TD or pursue any such joint acquisitions. However, given the significant economic interest in us held by TD and its affiliates, we believe TD will be incentivized to offer us the opportunity to acquire its assets.
Growth associated with expansion projects
We also believe that we are well positioned to increase volumes to our systems through cost-effective capacity expansions and other methods for improving efficiency, such as the use of drag reducing agents in our crude oil pipelines. For example, in 2014, Pony Express completed the conversion and construction of its approximately 698-mile crude oil pipeline commencing in Guernsey, Wyoming, and terminating in Cushing, Oklahoma. In 2015, Pony Express completed the construction of an approximately 66-mile lateral in Northeast Colorado commencing in Weld County, Colorado, and interconnecting with the pipeline just east of Sterling, Colorado. In January 2017, Rockies Express placed in service the Rockies Express Zone 3 Capacity Enhancement Project that added an incremental 0.8 Bcf/d of east-to-west capacity within Zone 3 of the Rockies Express Pipeline.
Energy Capital Markets and Interest Rates
During the second half of 2015 and into mid-2016, the energy credit markets experienced a material increase in the yields for long-term debt, which caused an issuance of senior unsecured notes to be a less attractive financing option until the third quarter of 2016, when we were able to issue the 2024 Notes. At the same time, the downturn in commodity prices generally limited the availability of capital through traditional public issuances of common units for much of 2016. While the downturn did not change our business plans, including our growth through acquisitions and expansion projects, it did temporarily alter some of our financing strategies.
In addition, the Federal Reserve increased short-term interest rates which marginally impacted the rates on our floating rate revolving credit facility. If the economy continues to strengthen, it is likely that monetary policy will continue to tighten, resulting in higher interest rates to counter possible inflation. If this occurs, interest rates on our floating rate credit facilities and future offerings in the debt capital markets could be at higher rates, causing our financing costs to increase accordingly. For additional information, please read Item 7A.—Quantitative and Qualitative Disclosures About Market Risk.
How We Evaluate Our Operations
We evaluate our results using, among other measures, cash distributions received from Tallgrass Equity, TEP's contract profile and volumes, and operating costs and expenses of TEGP and its consolidated subsidiaries.
64
Cash Distributions Received from Tallgrass Equity
Our cash flow is currently generated solely by distributions received from Tallgrass Equity. Tallgrass Equity currently receives all of its cash flows from distributions on its direct and indirect partnership interests in TEP. Tallgrass Equity is therefore entirely dependent upon the ability of TEP to make cash distributions to its partners.
TEP's Contract Profile and Volumes
TEP's results are driven primarily by the volume of crude oil transportation, storage and terminalling capacity, natural gas transportation and storage capacity, NGL transportation capacity, and water transportation, gathering and disposal capacity under firm fee contracts, as well as the volume of natural gas that it processes and the fees assessed for such services.
Operating Costs and Expenses
The primary components of TEP's operating costs and expenses that we evaluate include cost of sales, cost of transportation services, operations and maintenance and general and administrative costs. TEP's operating expenses are driven primarily by expenses related to the operation, maintenance and growth of its asset base.
65
Results of Operations
The following provides a summary of our consolidated results of operations for the periods indicated:
|
Year Ended December 31,
|
|||||||||||
|
2016
|
2015
|
2014
|
|||||||||
|
|
(in thousands, except operating data)
|
||||||||||
|
Revenues:
|
|||||||||||
|
Crude oil transportation services
|
$
|
374,949
|
|
$
|
300,436
|
|
$
|
28,343
|
|
||
|
Natural gas transportation services
|
119,962
|
|
119,895
|
|
126,733
|
|
|||||
|
Sales of natural gas, NGLs, and crude oil
|
77,394
|
|
82,133
|
|
181,249
|
|
|||||
|
Processing and other revenues
|
32,817
|
|
33,733
|
|
35,231
|
|
|||||
|
Total Revenues
|
605,122
|
|
536,197
|
|
371,556
|
|
|||||
|
Operating Costs and Expenses:
|
|||||||||||
|
Cost of sales (exclusive of depreciation and amortization shown below)
|
71,920
|
|
75,285
|
|
167,545
|
|
|||||
|
Cost of transportation services (exclusive of depreciation and amortization shown below)
|
58,341
|
|
53,597
|
|
24,109
|
|
|||||
|
Operations and maintenance
|
53,386
|
|
49,138
|
|
39,577
|
|
|||||
|
Depreciation and amortization
|
84,896
|
|
83,476
|
|
47,048
|
|
|||||
|
General and administrative
|
55,829
|
|
51,479
|
|
33,160
|
|
|||||
|
Taxes, other than income taxes
|
24,727
|
|
21,796
|
|
6,704
|
|
|||||
|
Loss on disposal of assets
|
1,849
|
|
4,795
|
|
—
|
|
|||||
|
Total Operating Costs and Expenses
|
350,948
|
|
339,566
|
|
318,143
|
|
|||||
|
Operating Income
|
254,174
|
|
196,631
|
|
53,413
|
|
|||||
|
Other Income (Expense):
|
|||||||||||
|
Interest expense, net
|
(45,601
|
)
|
(18,330
|
)
|
(7,292
|
)
|
|||||
|
Unrealized loss on derivative instrument
|
(1,291
|
)
|
—
|
|
—
|
|
|||||
|
Equity in earnings of unconsolidated investment
|
51,780
|
|
—
|
|
717
|
|
|||||
|
Gain on remeasurement of unconsolidated investment
|
—
|
|
—
|
|
9,388
|
|
|||||
|
Other income, net
|
1,723
|
|
2,413
|
|
3,103
|
|
|||||
|
Total Other Income (Expense)
|
6,611
|
|
(15,917
|
)
|
5,916
|
|
|||||
|
Net income before tax
|
260,785
|
|
180,714
|
|
59,329
|
|
|||||
|
Deferred income tax (expense) benefit
|
(17,741
|
)
|
7,277
|
|
—
|
|
|||||
|
Net income
|
243,044
|
|
187,991
|
|
59,329
|
|
|||||
|
Net income attributable to noncontrolling interests
|
(216,250
|
)
|
(156,035
|
)
|
(48,415
|
)
|
|||||
|
Net income attributable to TEGP
|
$
|
26,794
|
|
$
|
31,956
|
|
$
|
10,914
|
|
||
|
Operating Data:
|
|||||||||||
|
Crude oil transportation average throughput (Bbls/d)
(1)
|
285,507
|
|
236,256
|
|
85,229
|
|
|||||
|
Gas transportation average firm contracted volumes (MMcf/d)
(2)
|
1,627
|
|
1,679
|
|
1,698
|
|
|||||
|
Natural gas processing inlet volumes (MMcf/d)
|
103
|
|
122
|
|
152
|
|
|||||
|
(1)
|
Approximate average daily throughput for the years ended December 31, 2015 and 2014 is reflective of the volumetric ramp up due to commercial in-service of the Pony Express System beginning in October 2014, including the lateral in Northeast Colorado in the second quarter of 2015, and delays in the construction and expansion efforts of third-party pipelines with which Pony Express shares joint tariffs.
|
|
(2)
|
Volumes transported under firm fee contracts, excluding Rockies Express.
|
66
Year Ended December 31, 2016
Compared to the
Year Ended December 31, 2015
Revenues.
Total revenues were
$605.1 million
for the
year ended December 31, 2016
, compared to
$536.2 million
for the
year ended December 31, 2015
, which represents
an increase
of
$68.9 million
, or
13%
, in total revenues. The overall
increase
in revenue was largely driven by
increased
revenues of
$76.3 million
in the Crude Oil Transportation & Logistics segment, partially offset by decreased revenues of
$4.3 million
and
$2.8 million
in the Processing & Logistics and Natural Gas Transportation & Logistics segments, respectively, as discussed further below.
Operating costs and expenses
. Operating costs and expenses were
$350.9 million
for the
year ended December 31, 2016
compared to
$339.6 million
for the
year ended December 31, 2015
, which represents
an increase
of
$11.4 million
, or
3%
. The overall
increase
in operating costs and expenses is primarily driven by
increased
operating costs and expenses of
$20.0 million
in the Crude Oil Transportation & Logistics segment, partially offset by decreased operating costs and expenses of
$10.9 million
and
$0.7 million
in the Natural Gas Transportation & Logistics and Processing & Logistics segments, respectively, as discussed further below, as well as a $3.0 million increase in corporate general and administrative costs due to increased overhead costs allocated from TD.
Interest expense, net.
Interest expense of
$45.6 million
for the
year ended December 31, 2016
was primarily composed of interest and fees associated with the TEP and Tallgrass Equity revolving credit facilities and the 2024 Notes issued on September 1, 2016. Interest expense of
$18.3 million
for the
year ended December 31, 2015
was primarily composed of interest and fees associated with TEP's revolving credit facility and interest and fees associated with Tallgrass Equity's revolving credit facility for periods subsequent to the closing of the TEGP IPO on May 12, 2015, partially offset by interest income of $0.4 million on the cash balance swept to TD under the Pony Express cash management agreement. The increase in interest and fees in 2016 is primarily associated with TEP's revolving credit facility due to increased borrowings to fund a portion of TEP's 2015 acquisitions and recent acquisitions of an additional 31.3% membership interest in Pony Express effective January 1, 2016 and a 25% membership interest in Rockies Express effective May 6, 2016, as well as the higher incremental borrowing rate on the 2024 Notes, the proceeds of which were used to repay borrowings under TEP's revolving credit facility, and a full period of interest and fees associated with outstanding borrowings under the Tallgrass Equity revolving credit facility.
Unrealized loss on derivative instrument.
Unrealized loss on derivative instrument of
$1.3 million
represents the change in fair value of the call option received from TD as part of the acquisition of an additional 31.3% membership interest in Pony Express effective January 1, 2016.
Equity in earnings of unconsolidated investment.
Equity in earnings of unconsolidated investment of
$51.8 million
for the
year ended December 31, 2016
reflects our portion of earnings and the amortization of a negative basis difference of $9.1 million associated with our acquisition of a 25% membership interest in Rockies Express effective May 6, 2016. The equity in earnings for the
year ended December 31, 2016
includes recognition of our portion of the $65 million settlement received by Rockies Express related to the lawsuit between Interior and Rockies Express as discussed in
Note 19
–
Legal and Environmental Matters
.
Other income, net.
Other income, net typically includes rental income and income earned from certain customers related to the capital costs we incurred to connect these customers to our system. Other income for the
year ended December 31, 2016
was
$1.7 million
compared to
$2.4 million
for the
year ended December 31, 2015
. The decrease in other income was driven by lower income related to reimbursable projects at TIGT due to a contract termination during the year ended December 31, 2016.
Deferred income tax (expense) benefit.
Deferred income tax expense for the
year ended December 31, 2016
was
$17.7 million
compared to a deferred income tax benefit of
$7.3 million
for the
year ended December 31, 2015
. The increase in deferred income tax expense was primarily driven by the increase in net income before income taxes and a full year of taxable income in 2016 compared to the period subsequent to the closing of the TEGP IPO from May 12, 2015 to December 31, 2015, as well as a higher effective tax rate for the
year ended December 31, 2016
compared to the
year ended December 31, 2015
as a result of our acquisition of a 25% membership interest in Rockies Express during the second quarter of 2016. The year ended December 31, 2015 also included a $13.8 million deferred income tax benefit associated with a change in applicable state apportionment percentages, which increased the value of expected future state benefits attributable to the excess tax basis of our investment in Tallgrass Equity.
Year Ended December 31, 2015
Compared to the
Year Ended December 31, 2014
Revenues.
Total revenues were
$536.2 million
for the
year ended December 31, 2015
, compared to
$371.6 million
for the
year ended December 31, 2014
, which represents
an increase
of
$164.6 million
, or
44%
, in total revenues. The overall increase in revenue was primarily driven by
increased
revenues of
$275.9 million
in the Crude Oil Transportation & Logistics segment, partially offset by decreases in revenues of
$102.7 million
and
$8.4 million
in the Processing & Logistics and Natural Gas Transportation & Logistics segments, respectively, as discussed further below.
67
Operating costs and expenses
. Operating costs and expenses were
$339.6 million
for the
year ended December 31, 2015
compared to
$318.1 million
for the
year ended December 31, 2014
, which represents an increase of
$21.4 million
, or
7%
. The overall increase in operating costs and expenses was primarily driven by
increased
operating costs and expenses of
$120.0 million
in the Crude Oil Transportation & Logistics segment, partially offset by decreases in operating costs and expenses of
$86.8 million
and
$9.3 million
in the Processing & Logistics and Natural Gas Transportation & Logistics segments, respectively, as discussed further below.
Interest expense, net.
Interest expense of
$18.3 million
for the
year ended December 31, 2015
was primarily composed of interest and fees associated with TEP's and Tallgrass Equity's revolving credit facilities, partially offset by interest income of
$0.4 million
on the cash balance swept to TD under the Pony Express cash management agreement. Interest expense of
$7.3 million
for the
year ended December 31, 2014
was primarily composed of interest and fees associated with TEP's revolving credit facility, partially offset by interest income of
$1.5 million
on the cash balance swept to TD under the Pony Express cash management agreement. The increase in interest and fees in 2015 was driven by borrowings under Tallgrass Equity's revolving credit facility as part of the Reorganization Transactions and increased borrowings under TEP's revolving credit facility throughout 2014 and 2015 to fund the acquisitions of Trailblazer and a 66.7% membership interest in Pony Express.
Gain on remeasurement of unconsolidated investment.
Gain on remeasurement of unconsolidated investment of
$9.4 million
for the
year ended December 31, 2014
was related to the remeasurement to fair value of our original 50% equity investment in Grasslands Water Services I, LLC ("GWSI") in connection with TEP's consolidation of the Water Solutions business on May 13, 2014.
Equity in earnings of unconsolidated investment.
Equity in earnings of unconsolidated investment of
$0.7 million
for the
year ended December 31, 2014
was related to our investment in GWSI prior to TEP's consolidation of the Water Solutions business on May 13, 2014.
Other income, net
. Other income, net typically includes rental income, income earned from certain customers related to the capital costs we incurred to connect these customers to our system, and the allowance for funds used during construction at our regulated entities. Other income for the
year ended December 31, 2015
was
$2.4 million
compared to
$3.1 million
for the
year ended December 31, 2014
.
Deferred income tax expense (benefit).
Deferred income tax benefit for the
year ended December 31, 2015
was
$7.3 million
, and represents a $13.8 million deferred income tax benefit associated with a change in applicable state apportionment percentages, which increased the value of expected future state tax benefits attributable to the excess tax basis of our investment in Tallgrass Equity, partially offset by deferred income tax expense of $6.5 million related to our income for the period from May 12, 2015 to December 31, 2015.
The following provides a summary of our Crude Oil Transportation & Logistics segment results of operations for the periods indicated:
|
Year Ended December 31,
|
|||||||||||
|
Segment Financial Data – Crude Oil Transportation & Logistics
(1)
|
2016
|
2015
|
2014
|
||||||||
|
(in thousands)
|
|||||||||||
|
Revenues:
|
|||||||||||
|
Crude oil transportation services
|
$
|
374,949
|
|
$
|
300,436
|
|
$
|
28,343
|
|
||
|
Sales of natural gas, NGLs, and crude oil
|
5,554
|
|
3,791
|
|
—
|
|
|||||
|
Total revenues
|
380,503
|
|
304,227
|
|
28,343
|
|
|||||
|
Operating costs and expenses:
|
|||||||||||
|
Cost of sales
|
4,728
|
|
4,257
|
|
—
|
|
|||||
|
Cost of transportation services
|
55,519
|
|
47,367
|
|
7,025
|
|
|||||
|
Operations and maintenance
|
13,075
|
|
8,795
|
|
717
|
|
|||||
|
Depreciation and amortization
|
51,362
|
|
47,168
|
|
12,067
|
|
|||||
|
General and administrative
|
20,650
|
|
20,620
|
|
4,683
|
|
|||||
|
Taxes, other than income taxes
|
19,385
|
|
16,553
|
|
250
|
|
|||||
|
Total operating costs and expenses
|
164,719
|
|
144,760
|
|
24,742
|
|
|||||
|
Operating income
|
$
|
215,784
|
|
$
|
159,467
|
|
$
|
3,601
|
|
||
68
|
(1)
|
Segment results as presented represent total revenue and operating income, including intersegment activity. For reconciliations to the consolidated financial data, see
Note 20
–
Reportable Segments
to our Consolidated Financial Statements in Item 8.—Financial Statements and Supplementary Data.
|
Year Ended December 31, 2016
Compared to the
Year Ended December 31, 2015
Revenues.
Crude Oil Transportation & Logistics segment revenues were
$380.5 million
for the
year ended December 31, 2016
, compared to
$304.2 million
for the
year ended December 31, 2015
, which represents
an increase
of
$76.3 million
, or
25%
, in segment revenues due to a
$74.5 million
increase in crude oil transportation services revenue and a
$3.8 million
increase in sales of natural gas, NGLs, and crude oil primarily due to increased volumes sold during the year ended December 31, 2016. The increase in crude oil transportation services was primarily driven by a $42.6 million increase in revenue from a full period of operations on the lateral in Northeast Colorado, which began commercial operations during the second quarter of 2015, a $19.6 million increase related to the activation of one of our joint tariffs in the second quarter of 2015, and lower revenue of $9.8 million during the
year ended December 31, 2015
due to a force majeure at one of our joint tariff partners.
Operating costs and expenses
. Operating costs and expenses in the Crude Oil Transportation & Logistics segment were
$164.7 million
for the
year ended December 31, 2016
compared to
$144.8 million
for the
year ended December 31, 2015
, which represents
an increase
of
$20.0 million
, or
14%
. The overall
increase
in operating costs and expenses was primarily driven by an
$8.2 million
increase in cost of transportation services, primarily due to $4.2 million associated with drag-reduction agents and higher electrical costs at pump stations associated with increased transportation volumes, and increases of
$4.3 million
,
$4.2 million
, and
$2.8 million
in operations and maintenance costs, depreciation and amortization, and taxes, other than income taxes, respectively, all primarily driven by the costs associated with a full period of operations on the lateral in Northeast Colorado.
Year Ended December 31, 2015
Compared to the
Year Ended December 31, 2014
Revenues.
Crude Oil Transportation & Logistics segment revenues were
$304.2 million
for the
year ended December 31, 2015
compared to
$28.3 million
for the
year ended December 31, 2014
. Revenue for the
year ended December 31, 2015
represents a full year of operations at Pony Express, including approximately $62.6 million of revenue from a partial year of operations on the lateral in Northeast Colorado, which began commercial operations during the second quarter of 2015, and approximately $32.8 million related to the activation of one of our joint tariffs in the second quarter of 2015. Revenue for the year ended December 31, 2014 represents a partial year of operations at the mainline portion of the Pony Express System, which began commercial operations in October 2014.
Operating costs and expenses
. Operating costs and expenses in the Crude Oil Transportation & Logistics segment were
$144.8 million
for the
year ended December 31, 2015
compared to
$24.7 million
for the
year ended December 31, 2014
. Operating costs and expenses for the
year ended December 31, 2015
represents a full year of operations at Pony Express as well as a partial year of operations on the lateral in Northeast Colorado, which began commercial operations during the second quarter of 2015. Operating costs and expenses for the
year ended December 31, 2014
represents a partial year of operations at the mainline portion of the Pony Express System, which began commercial operations in October 2014.
69
The following provides a summary of our Natural Gas Transportation & Logistics segment results of operations for the periods indicated:
|
Segment Financial Data – Natural Gas Transportation & Logistics
(1)
|
Year Ended December 31,
|
||||||||||
|
2016
|
2015
|
2014
|
|||||||||
|
|
(in thousands)
|
||||||||||
|
Revenues:
|
|||||||||||
|
Natural gas transportation services
|
$
|
125,603
|
|
$
|
125,279
|
|
$
|
131,990
|
|
||
|
Sales of natural gas, NGLs, and crude oil
|
3,241
|
|
6,346
|
|
7,868
|
|
|||||
|
Processing and other revenues
|
25
|
|
32
|
|
222
|
|
|||||
|
Total revenues
|
128,869
|
|
131,657
|
|
140,080
|
|
|||||
|
Operating costs and expenses:
|
|||||||||||
|
Cost of sales
|
3,804
|
|
6,342
|
|
7,025
|
|
|||||
|
Cost of transportation services
|
5,051
|
|
10,927
|
|
18,090
|
|
|||||
|
Operations and maintenance
|
28,458
|
|
27,767
|
|
27,422
|
|
|||||
|
Depreciation and amortization
|
20,976
|
|
22,927
|
|
23,788
|
|
|||||
|
General and administrative
|
16,335
|
|
17,052
|
|
16,767
|
|
|||||
|
Taxes, other than income taxes
|
4,338
|
|
4,840
|
|
6,101
|
|
|||||
|
Total operating costs and expenses
|
78,962
|
|
89,855
|
|
99,193
|
|
|||||
|
Operating income
|
$
|
49,907
|
|
$
|
41,802
|
|
$
|
40,887
|
|
||
|
(1)
|
Segment results as presented represent total revenue and operating income, including intersegment activity. For reconciliations to the consolidated financial data, see
Note 20
–
Reportable Segments
to our Consolidated Financial Statements in Item 8.—Financial Statements and Supplementary Data.
|
Year Ended December 31, 2016
Compared to the
Year Ended December 31, 2015
Revenues.
Natural Gas Transportation & Logistics segment revenues were
$128.9 million
for the
year ended December 31, 2016
, compared to
$131.7 million
for the
year ended December 31, 2015
, which represents
a decrease
of
$2.8 million
, or
2%
, in segment revenues driven by a
$3.1 million
decrease in sales of natural gas, NGLs, and crude oil as a result of lower volumes of natural gas sold. The decrease in sales of natural gas, NGLs, and crude oil was partially offset by a
$0.3 million
increase
in natural gas transportation services primarily driven by a $2.3 million increase at TIGT, partially offset by a $1.9 million decrease at Trailblazer due to warmer weather in the first quarter of 2016, resulting in lower volumes transported during the year ended December 31, 2016. The increase in natural gas transportation services revenue at TIGT was primarily driven by increased tariff rates, partially offset by a change in the fuel recovery structure, beginning May 1, 2016 as a result of the rate case settlement discussed in
Note 18
–
Regulatory Matters
.
Operating costs and expenses
. Operating costs and expenses in the Natural Gas Transportation & Logistics segment were
$79.0 million
for the
year ended December 31, 2016
compared to
$89.9 million
for the
year ended December 31, 2015
, which represents
a decrease
of
$10.9 million
, or
12%
. The overall
decrease
in operating costs and expenses was primarily driven by a
$5.9 million
decrease in cost of transportation services due to lower costs associated with fuel reimbursements as a result of the change in the fuel recovery structure discussed above, a
$2.5 million
decrease in cost of sales due to lower volumes of natural gas sold, and a
$2.0 million
decrease in depreciation and amortization due to lower depreciation rates as of May 1, 2016 as a result of the TIGT rate case settlement.
Year Ended December 31, 2015
Compared to the
Year Ended December 31, 2014
Revenues.
Natural Gas Transportation & Logistics segment revenues were
$131.7 million
for the
year ended December 31, 2015
, compared to
$140.1 million
for the
year ended December 31, 2014
, which represents an
$8.4 million
, or
6%
,
decrease
in segment revenues primarily due to a
$6.7 million
decrease
in natural gas transportation services revenue driven by lower fuel reimbursements as a result of decreased prices and a
$1.5 million
decrease
in revenue from the sales of natural gas, NGLs, and crude oil as a result of a 46% decrease in natural gas prices, partially offset by favorable hedge settlements and increased volumes sold.
70
Operating costs and expenses
. Operating costs and expenses in the Natural Gas Transportation & Logistics segment were
$89.9 million
for the
year ended December 31, 2015
compared to
$99.2 million
for the
year ended December 31, 2014
, which represents
a decrease
of
$9.3 million
, or
9%
. The overall
decrease
in operating costs and expenses was primarily driven by a
$7.2 million
decrease
in the cost of transportation services, due to lower fuel reimbursements as a result of decreased prices, a
$1.3 million
decrease
in taxes, other than income taxes, due to revised property tax estimates as a result of successful appeals with state taxing authorities on the assessed value of property, a
$0.9 million
decrease
in depreciation and amortization driven by a change in rates at Trailblazer as a result of the rate case settlement in 2014, and a
$0.7 million
decrease
in cost of sales, due to a 51% decrease in natural gas prices, partially offset by increased volumes sold.
The following provides a summary of our Processing & Logistics segment results of operations for the periods indicated:
|
Year Ended December 31,
|
|||||||||||
|
Segment Financial Data – Processing & Logistics
(1)
|
2016
|
2015
|
2014
|
||||||||
|
(in thousands)
|
|||||||||||
|
Revenues:
|
|||||||||||
|
Sales of natural gas, NGLs, and crude oil
|
$
|
68,599
|
|
$
|
71,996
|
|
$
|
173,381
|
|
||
|
Processing and other revenues
|
32,792
|
|
33,701
|
|
35,009
|
|
|||||
|
Total revenues
|
101,391
|
|
105,697
|
|
208,390
|
|
|||||
|
Operating costs and expenses:
|
|||||||||||
|
Cost of sales
|
63,646
|
|
64,686
|
|
160,520
|
|
|||||
|
Cost of transportation services
|
3,154
|
|
687
|
|
236
|
|
|||||
|
Operations and maintenance
|
11,853
|
|
12,576
|
|
11,438
|
|
|||||
|
Depreciation and amortization
|
12,558
|
|
13,381
|
|
11,193
|
|
|||||
|
General and administrative
|
6,246
|
|
4,441
|
|
4,073
|
|
|||||
|
Taxes, other than income taxes
|
1,004
|
|
403
|
|
353
|
|
|||||
|
Loss on disposal of assets
|
1,849
|
|
4,795
|
|
—
|
|
|||||
|
Total operating costs and expenses
|
100,310
|
|
100,969
|
|
187,813
|
|
|||||
|
Operating income
|
$
|
1,081
|
|
$
|
4,728
|
|
$
|
20,577
|
|
||
|
(1)
|
Segment results as presented represent total revenue and operating income, including intersegment activity. For reconciliations to the consolidated financial data, see
Note 20
–
Reportable Segments
to our Consolidated Financial Statements in Item 8.—Financial Statements and Supplementary Data.
|
Year Ended December 31, 2016
Compared to the
Year Ended December 31, 2015
Revenues.
Processing & Logistics segment revenues were
$101.4 million
for the
year ended December 31, 2016
, compared to
$105.7 million
for the
year ended December 31, 2015
, which represents a
$4.3 million
, or
4%
,
decrease
in segment revenues. The
decrease
in segment revenues was primarily due to a
$3.4 million
decrease in the sales of natural gas, NGLs, and crude oil driven by lower NGL and natural gas sales due to lower volumes processed, partially offset by increased NGL prices, and a
$0.9 million
decrease in processing and other revenues driven by lower processing fees of $4.9 million due to decreased volumes processed, partially offset by a $4.0 million increase in revenue primarily attributable to the recently acquired Western and West Texas assets.
Operating costs and expenses
. Operating costs and expenses in the Processing & Logistics segment were
$100.3 million
for the
year ended December 31, 2016
compared to
$101.0 million
for the
year ended December 31, 2015
, which represents
a decrease
of
$0.7 million
, or
1%
. The
decrease
in operating costs and expenses was driven by (i) a decrease of
$2.9 million
in loss on disposal of assets as a result of the $1.8 million loss on assets destroyed by fire as a result of a lightning strike during the
year ended December 31, 2016
, compared to a
$4.8 million
non-cash loss recognized on the sale of compressor and other assets in 2015; (ii) a decrease of
$1.0 million
in cost of sales, driven by decreased NGL volumes processed as discussed above; (iii) a
$0.8 million
decrease in depreciation and amortization driven by an intangible asset becoming fully amortized as of December 31, 2015, partially offset by increased depreciation related to the new NGL transportation line; and (iv) a
$0.7 million
decrease in operations and maintenance costs due to less downtime for plant maintenance activities during the
year ended December 31, 2016
compared to the
year ended December 31, 2015
, partially offset by higher costs associated with the recently acquired Western and West Texas assets. These decreases were partially offset by (i) a
$2.5 million
increase in cost of transportation services due to costs associated with Western, which was acquired on December 16, 2015; (ii) a
$1.8 million
increase in general and administrative costs due to increased costs allocated to Water Solutions as a result of increased
71
operating income related to our acquisitions of Western and West Texas; and (iii) a
$0.6 million
increase in taxes, other than income taxes, due to higher property tax estimates for 2016 as a result of the Western acquisition.
Year Ended December 31, 2015
Compared to the
Year Ended December 31, 2014
Revenues.
Processing & Logistics segment revenues were
$105.7 million
for the
year ended December 31, 2015
, compared to
$208.4 million
for the
year ended December 31, 2014
, which represents a
$102.7 million
, or
49%
,
decrease
in segment revenues. The
decrease
in segment revenues was primarily due to a
$101.4 million
decrease in the sales of natural gas, NGLs, and crude oil driven by a 58% decrease in NGL prices and lower volumes processed, and a
$1.3 million
decrease
in processing and other revenues driven by lower processing fees at TMID due to decreased volumes processed under a large, fee-based contract, partially offset by increased revenue at Water Solutions, including water transportation services and revenue associated with a contract to construct a water pipeline for a customer during the
year ended December 31, 2015
. Prior to its consolidation in May 2014, TEP's investment in Water Solutions was accounted for under the equity method of accounting and as a result TEP recognized no revenues from Water Solutions for the period from January 1, 2014 to May 13, 2014.
Operating costs and expenses
. Operating costs and expenses in the Processing & Logistics segment were
$101.0 million
for the
year ended December 31, 2015
compared to
$187.8 million
for the
year ended December 31, 2014
, which represents
a decrease
of
$86.8 million
, or
46%
. The
decrease
in operating costs and expenses was driven by
a decrease
of
$95.8 million
in cost of sales, primarily due to decreased NGL prices and volumes processed as discussed above. The decrease in cost of sales was partially offset by
$4.8 million
of non-cash losses recognized on the sale of compressor and other assets in 2015, and overall increases in the cost of transportation services, operations and maintenance costs, depreciation and amortization, and general and administrative costs, all primarily driven by the costs associated with Water Solutions, which was consolidated in May 2014.
Liquidity and Capital Resources Overview
Our primary sources of liquidity for the
year ended December 31, 2016
were proceeds from TEP's issuance of long-term debt as discussed further below, borrowings under TEP's revolving credit facility, cash generated from operations, and proceeds from the issuance of TEP common units. We expect our sources of liquidity in the future to include:
|
•
|
cash generated from our operations;
|
|
•
|
borrowing capacity available under TEP's revolving credit facility; and
|
|
•
|
future issuances of additional partnership units and/or debt securities.
|
We believe that cash on hand, cash generated from operations, and availability under TEP's revolving credit facility will be adequate to meet our operating needs, our planned short-term maintenance capital and debt service requirements, and our planned cash distributions to shareholders. We believe that future internal growth projects or potential acquisitions will be funded primarily through a combination of borrowings under TEP's revolving credit facility and issuances of debt and/or equity securities at TEP.
Our total liquidity as of
December 31, 2016
and
2015
was as follows:
|
|
December 31, 2016
|
December 31, 2015
|
|||||
|
|
(in thousands)
|
||||||
|
Cash on hand
|
$
|
2,459
|
|
$
|
2,234
|
|
|
|
Total capacity under the TEP revolving credit facility
(1)
|
1,750,000
|
|
1,100,000
|
|
|||
|
Less: Outstanding borrowings under the TEP revolving credit facility
(2)
|
(1,015,000
|
)
|
(753,000
|
)
|
|||
|
Available capacity under the TEP revolving credit facility
|
735,000
|
|
347,000
|
|
|||
|
Total capacity under the Tallgrass Equity revolving credit facility
|
$
|
150,000
|
|
$
|
150,000
|
|
|
|
Less: Outstanding borrowings under the Tallgrass Equity revolving credit facility
|
$
|
(148,000
|
)
|
(148,000
|
)
|
||
|
Available capacity under the Tallgrass Equity revolving credit facility
|
$
|
2,000
|
|
2,000
|
|
||
|
Total Liquidity
|
$
|
739,459
|
|
$
|
351,234
|
|
|
|
(1)
|
Effective January 4, 2016, in connection with the acquisition of an additional
31.3%
membership interest in Pony Express, TEP exercised the committed accordion feature to increase the total capacity of the revolving credit facility to
$1.5 billion
. In connection with the acquisition of a
25%
membership interest in Rockies Express, TEP amended its revolving credit facility to increase the total capacity to
$1.75 billion
, which increase became effective May 6, 2016.
|
|
(2)
|
As of
February 3, 2017
, outstanding borrowings under the TEP revolving credit facility were approximately
$1.130 billion
.
|
TEP Revolving Credit Facility
TEP has a senior secured revolving credit facility with Barclays Bank PLC, as administrative agent, and a syndicate of lenders (as amended, the "Credit Agreement") which will mature on May 17, 2018. As of December 31, 2016, the revolving credit facility has a total capacity of
$1.75 billion
and includes a
$75 million
sublimit for letters of credit and a
$60 million
sublimit for swing line loans. The unused portion of TEP's revolving credit facility is subject to a commitment fee, which ranges from
0.300%
to
0.500%
, based on TEP's total leverage ratio. As of
December 31, 2016
, the weighted average interest rate on outstanding borrowings under the TEP revolving credit facility was
2.48%
. During the
year ended December 31, 2016
, the weighted average effective interest rate under the TEP revolving credit facility, including the interest on outstanding borrowings, commitment fees, and amortization of deferred financing costs, was
2.75%
.
The revolving credit facility contains various covenants and restrictive provisions that, among other things, limit or restrict TEP's ability (as well as the ability of its restricted subsidiaries) to incur or guarantee additional debt, incur certain liens on assets, dispose of assets, make certain distributions (including distributions from available cash, if a default or event of default under the credit agreement then exists or would result from making such a distribution), change the nature of its business, engage in certain mergers or make certain investments and acquisitions, enter into non-arms-length transactions with affiliates and designate certain subsidiaries as "Unrestricted Subsidiaries." In addition, TEP is required to maintain a consolidated leverage ratio of not more than
4.75
to 1.00 (which will be increased to
5.25
to 1.00 for certain measurement periods following the consummation of certain acquisitions) and a consolidated interest coverage ratio of not less than
2.50
to 1.00. As of
December 31, 2016
, TEP was in compliance with the covenants required under the revolving credit facility.
Tallgrass Equity Revolving Credit Facility
In connection with the TEGP IPO, Tallgrass Equity entered into a
$150 million
senior secured revolving credit facility with Barclays Bank PLC, as administrative agent, and a syndicate of lenders, which will mature on May 12, 2020. The Tallgrass Equity credit facility includes a
$10 million
sublimit for letters of credit and a
$10 million
sublimit for swing line loans. The Tallgrass Equity revolving credit facility also contains an accordion feature whereby Tallgrass Equity can increase the size of the credit facility to an aggregate of
$200 million
, subject to receiving increased or new commitments from lenders and the satisfaction of certain other conditions precedent. Among various other covenants and restrictive provisions, Tallgrass Equity is required to maintain a total leverage ratio of not more than
3.00
to 1.00. As of
December 31, 2016
, Tallgrass Equity was in compliance with the covenants required under its revolving credit facility.
The initial borrowings under the credit facility were used to fund a portion of the purchase of the Acquired TEP Units and to pay origination and arrangement fees associated with the new revolving credit facility and transaction costs associated with the TEGP IPO. Tallgrass Equity's obligations under the revolving credit facility are secured by a first priority lien on all of the present and after acquired equity interests held by Tallgrass Equity in TEP GP and TEP. Borrowings under the credit facility bear interest, at Tallgrass Equity's option, at either (a) a base rate, which will be a rate equal to the greatest of (i) the prime rate, (ii) the U.S. federal funds rate plus
0.5%
and (iii) a one-month reserve adjusted Eurodollar rate plus
1.00%
or (b) a reserve adjusted Eurodollar rate, plus, in each case, an applicable margin. For loans bearing interest based on the base rate, the applicable margin is
1.50%
, and for loans bearing interest based on the reserve adjusted Eurodollar rate, the applicable margin is
2.50%
.
The unused portion of the Tallgrass Equity revolving credit facility is subject to a commitment fee of
0.50%
. As of
December 31, 2016
, the weighted average interest rate on outstanding borrowings under the Tallgrass Equity revolving credit facility was
3.26%
. During the
year ended December 31, 2016
, Tallgrass Equity's weighted average effective interest rate, including the interest on outstanding borrowings, commitment fees, and amortization of deferred financing costs, was
3.33%
.
Senior Unsecured Notes
On September 1, 2016, TEP and Tallgrass Energy Finance Corp. (the "Co-Issuer" and together with TEP, the "Issuers"), the Guarantors named therein and U.S. Bank, National Association, as trustee, entered into an Indenture dated September 1, 2016 (the "Indenture"), pursuant to which the Issuers issued
$400 million
in aggregate principal amount of the Issuers'
5.50%
senior notes due 2024 (the "2024 Notes"). TEP used the net proceeds of the issuance to repay outstanding borrowings under its existing revolving credit facility.
The 2024 Notes are general unsecured senior obligations of the Issuers. The 2024 Notes are unconditionally guaranteed jointly and severally on a senior unsecured basis by TEP's existing direct and indirect wholly owned subsidiaries (other than the Co-Issuer) and certain of TEP's future subsidiaries (the "Guarantors"). The 2024 Notes rank equal in right of payment with all existing and future senior indebtedness of the Issuers, and senior in right of payment to any future subordinated indebtedness of the Issuers. The 2024 Notes will mature on September 15, 2024 and interest on the 2024 Notes is payable in cash semi-annually in arrears on each March 15 and September 15, commencing March 15, 2017. TEP may redeem the 2024 Notes prior to their scheduled maturity at the applicable redemption price set forth in the Indenture, plus accrued and unpaid interest.
The Indenture contains covenants that, among other things, limit TEP's ability and the ability of its restricted subsidiaries to: (i) incur, assume or guarantee additional indebtedness or issue preferred units; (ii) create liens to secure indebtedness; (iii) pay distributions on equity interests, repurchase equity securities or redeem subordinated securities; (iv) make investments; (v) restrict distributions, loans or other asset transfers from TEP's restricted subsidiaries; (vi) consolidate with or merge with or into, or sell substantially all of TEP's properties to, another person; (vii) sell or otherwise dispose of assets, including equity interests in subsidiaries; and (viii) enter into transactions with affiliates. As of
December 31, 2016
, the Issuers and Guarantors are in compliance with the covenants required under the 2024 Notes.
TEP Equity Distribution Agreements
On October 31, 2014, TEP entered into an equity distribution agreement pursuant to which it may sell from time to time through a group of managers, as our sales agents, common units representing limited partner interests having an aggregate offering price of up to
$200 million
. On May 13, 2015, the amount was subsequently amended to
$100.2 million
in order to account for follow-on equity offerings under TEP's S-3 shelf registration statement. On May 17, 2016, TEP entered into a new equity distribution agreement allowing for the sale of common units with an aggregate offering price of up to
$657.5 million
. Sales of common units, if any, will be made by means of ordinary brokers' transactions, to or through a market maker or directly on or through an electronic communication network, a "dark pool" or any similar market venue, or as otherwise agreed by TEP and one or more of the managers. TEP intends to use the net cash proceeds from any sale of the units for general partnership purposes, which may include, among other things, TEP's exercise of the call option with respect to the
6,518,000
common units issued to TD in connection with TEP's acquisition of an additional
31.3%
of Pony Express in January 2016, repayment or refinancing of debt, funding for acquisitions, capital expenditures and additions to working capital.
During the
year ended December 31, 2016
, TEP issued and sold
7,696,708
common units with a weighted average sales price of
$44.46
per unit under its equity distribution agreements for net cash proceeds of approximately
$337.7 million
(net of approximately
$4.5 million
in commissions and professional service expenses). During the period from January 1, 2017 to
February 15, 2017
, TEP issued and sold an additional
2,075,546
common units with a weighted average sales price of
$48.19
per unit under its equity distribution agreements for net cash proceeds of approximately
$99.0 million
(net of approximately
$1.0 million
in commissions and professional service expenses). TEP used the net cash proceeds for general partnership purposes as described above.
During the
year ended December 31, 2015
, TEP issued and sold
65,744
common units with a weighted average sales price of
$45.58
per unit under its equity distribution agreement for net cash proceeds of approximately
$3.0 million
(net of approximately
$30,000
in commissions and professional service expenses). TEP used the net cash proceeds for general partnership purposes as described above.
During the year ended December 31, 2014, TEP issued and sold
28,625
common units with a weighted average sales price of
$44.20
per unit under its equity distribution agreement for net cash proceeds of approximately
$1.1 million
(net of approximately
$215,000
in commissions and professional service expenses). TEP used the net cash proceeds for general partnership purposes as described above.
Private Placement
On April 28, 2016, TEP issued an aggregate of
2,416,987
common units for net cash proceeds of
$90.0 million
in a private placement transaction to certain funds managed by Tortoise Capital Advisors, L.L.C. The units were subsequently registered pursuant to our Form S-3/A (File No. 333-210976) filed with the SEC on May 6, 2016, which became effective May 17, 2016.
72
Working Capital
Working capital is the amount by which current assets exceed current liabilities. While various other factors may impact our working capital requirements from period to period, our working capital requirements have typically been, and we expect will continue to be, driven by changes in accounts receivable, accounts payable and deferred revenue. TEP manages its working capital needs through borrowings and repayments of borrowings under its revolving credit facility. Factors impacting changes in accounts receivable and accounts payable could include the timing of collections from customers, payments to suppliers, and the level of spending for capital expenditures. Changes in the market prices of energy commodities, primarily NGLs, that we buy and sell in the normal course of business can also impact the timing of changes in accounts receivable and accounts payable. Factors impacting deferred revenue include the volume of crude oil transported, the amount of deficiency payments received, and the volume of prior deficiencies utilized during the period.
As of
December 31, 2016
, we had a working capital
deficit
of
$38.0 million
compared to a working capital
deficit
of
$11.2 million
at
December 31, 2015
, which represents
a decrease
in working capital of
$26.8 million
. The overall
decrease
in working capital was primarily attributable to changes in the following components:
|
•
|
an increase
in deferred revenue of
$34.2 million
primarily from deficiency payments collected by Pony Express;
|
|
•
|
an increase
in accrued liabilities of
$6.4 million
primarily due to $7.3 million of interest accrued at December 31, 2016 associated with the 2024 Notes issued on September 1, 2016, partially offset by a decrease in environmental accruals due to remediation spending during the year ended December 31, 2016; and
|
|
•
|
an increase
in accrued taxes of
$2.5 million
as a result of higher tax assessments for 2016 due to the Pony Express lateral in Northeast Colorado and the recently acquired Western assets, partially offset by reduced assessments at certain assets as a result of successful appeals with state taxing authorities on the assessed value of property.
|
These working capital decreases were partially offset by:
|
•
|
an increase
of
$11.0 million
in derivative assets at fair value as a result of the call option derivative asset remaining as of December 31, 2016; and
|
|
•
|
an increase
of
$4.0 million
in prepayments and other current assets as a result of prepayment of insurance policies by TEP, which had previously been paid by TD and reimbursed by TEP as they were incurred.
|
A material adverse change in operations, available financing under our revolving credit facility, or available financing from the equity or debt capital markets could impact our ability to fund our requirements for liquidity and capital resources in the future.
Cash Flows
The following table and discussion presents a summary of our cash flow for the periods indicated:
|
Year Ended December 31,
|
|||||||||||
|
2016
|
2015
|
2014
|
|||||||||
|
|
(in thousands)
|
||||||||||
|
Net cash provided by (used in):
|
|||||||||||
|
Operating activities
|
$
|
403,198
|
|
$
|
285,859
|
|
$
|
79,444
|
|
||
|
Investing activities
|
$
|
(581,703
|
)
|
$
|
(845,270
|
)
|
$
|
(1,102,729
|
)
|
||
|
Financing activities
|
$
|
178,730
|
|
$
|
560,778
|
|
$
|
1,024,152
|
|
||
Year Ended December 31, 2016
Compared to the
Year Ended December 31, 2015
Operating Activities.
Cash flows
provided by
operating activities were
$403.2 million
and
$285.9 million
for the
years ended December 31, 2016
and
2015
, respectively. The
increase
in net cash flows provided by operating activities of
$117.3 million
was primarily driven by the increase in operating results as discussed above,
$51.8 million
of distributions received from Rockies Express, and a net increase in cash inflows from changes in working capital, primarily driven by a
$17.6 million
increase in net cash inflows from accounts receivable due to collection of receivables during the
year ended December 31, 2016
associated primarily with an increase in incremental barrels shipped at Pony Express, and a
$13.2 million
increase in deferred revenue associated primarily with deficiency payments collected by Pony Express during the
year ended December 31, 2016
.
Investing Activities.
Cash flows
used in
investing activities were
$581.7 million
for the
year ended December 31, 2016
. Investing cash outflows for the
year ended December 31, 2016
were primarily driven by:
|
•
|
cash outflows of
$436.0 million
for the acquisition of a 25% membership interest in Rockies Express on May 6, 2016;
|
73
|
•
|
capital expenditures of
$70.7 million
, primarily due to post in-service spending on Pony Express System projects and the Pipeline Integrity Management Program at Trailblazer;
|
|
•
|
cash outflows of
$49.1 million
for a portion of the acquisition of an additional 31.3% membership interest in Pony Express on January 1, 2016, the remainder of which is classified as a financing activity as discussed below; and
|
|
•
|
contributions to Rockies Express in the amount of
$50.0 million
.
|
These cash outflows were partially offset by
$24.1 million
of distributions from Rockies Express in excess of cumulative earnings recognized.
Cash flows
used in
investing activities were
$845.3 million
for the
year ended December 31, 2015
. Investing cash outflows for the
year ended December 31, 2015
were primarily driven by:
|
•
|
the cash outflow of
$700.0 million
for the acquisition of an additional 33.3% membership interest in Pony Express, which allowed TD to continue funding the pipeline construction at Pony Express; and
|
|
•
|
the cash outflow of
$75.0 million
for the acquisition of Western, and capital expenditures of
$65.4 million
, primarily due to construction of the Pony Express System, including the lateral in Northeast Colorado.
|
Financing Activities.
Cash flows
provided by
financing activities were
$178.7 million
for the
year ended December 31, 2016
. Financing cash inflows for the
year ended December 31, 2016
were primarily driven by:
|
•
|
proceeds from TEP's issuance of
$400.0 million
in aggregate principal amount of 5.50% Senior Notes due 2024;
|
|
•
|
TEP's issuance of
7,696,708
common units under the Equity Distribution Agreements for net cash proceeds of
$337.7 million
;
|
|
•
|
net borrowings under the TEP revolving credit facility of
$262.0 million
;
|
|
•
|
the issuance of 2,416,987 TEP common units representing TEP limited partnership interests in a private placement transaction for net cash proceeds of
$90.0 million
; and
|
|
•
|
contributions from TD of
$17.9 million
, which consisted of contributions from TD to TEP in order to indemnify TEP for any out of pocket costs incurred between April 1, 2014 and April 1, 2017 related to repairing or remediating the Trailblazer Pipeline, as discussed further in
Note 19
–
Legal and Environmental Matters
.
|
These financing cash inflows were partially offset by cash outflows of:
|
•
|
$425.9 million
for the portion of the acquisition of an additional 31.3% membership interest in Pony Express which exceeds the cumulative capital spending on the underlying assets acquired;
|
|
•
|
distributions to noncontrolling interests of
$249.1 million
, consisting of distributions to TEP unitholders of
$145.1 million
, Tallgrass Equity distributions to the Exchange Right Holders of
$97.5 million
, and distributions to Pony Express and Water Solutions noncontrolling interests of
$6.5 million
;
|
|
•
|
$204.6 million
for TEP's partial exercise of the call option granted by TD covering
4,814,906
TEP common units; and
|
|
•
|
distributions to Class A shareholders of
$42.5 million
.
|
Cash flows provided by financing activities were
$560.8 million
for the
year ended December 31, 2015
. Financing cash inflows for the
year ended December 31, 2015
were primarily driven by:
|
•
|
$1.3 billion
of net proceeds from the initial public offering of Class A shares in May 2015;
|
|
•
|
net cash proceeds of
$554.1 million
from the issuance of 11,200,000 TEP common units in a public offering and
65,744
common units issued under the TEP Equity Distribution Agreements during 2015; and
|
|
•
|
net borrowings under the TEP and Tallgrass Equity revolving credit facilities of
$342.0 million
;
|
These financing cash inflows were partially offset by cash outflows of:
|
•
|
$953.6 million
for the acquisition of 20,000,000 TEP common units by Tallgrass Equity as part of the TEGP IPO;
|
|
•
|
$334.1 million
for the distribution of proceeds from the TEGP IPO to the Exchange Right Holders as part of the reorganization of entities effective concurrent with the TEGP IPO;
|
|
•
|
$171.9 million
for the acquisition of additional Tallgrass Equity units as part of the reorganization concurrent with the TEGP IPO;
|
74
|
•
|
distributions to noncontrolling interests of
$153.1 million
, consisting of distributions to TEP unitholders of
$99.1 million
, Tallgrass Equity distributions to the Exchange Right Holders of
$28.7 million
, and distributions to Pony Express and Water Solutions noncontrolling interests of $25.3 million;
|
|
•
|
distributions to the members of the TEGP Predecessor of
$13.5 million
; and
|
|
•
|
distributions to TEGP Class A shareholders of
$10.4 million
.
|
Year Ended December 31, 2015
Compared to the
Year Ended December 31, 2014
Operating Activities.
Cash flows
provided by
operating activities were
$285.9 million
and
$79.4 million
for the
years ended December 31, 2015
and
2014
, respectively. The increase in net cash flows provided by operating activities of
$206.4 million
was primarily driven by the increase in operating results and a net increase in cash inflows from changes in working capital, primarily driven by a
$31.7 million
decrease in net cash outflows from accounts payable and accrued liabilities due to increased property tax accruals and related party payables and a
$14.0 million
increase in net cash inflows from deficiency payments received by Pony Express, partially offset by a decrease in net cash inflows of
$15.2 million
from accounts receivable, due to increased receivables at Pony Express.
Investing Activities.
Cash flows used in investing activities were
$845.3 million
for the
year ended December 31, 2015
. Investing cash outflows for the
year ended December 31, 2015
were primarily driven by the acquisitions of Western and an additional 33.3% membership interest in Pony Express, as discussed above.
Cash flows used in investing activities were
$1.1 billion
for the year ended December 31,
2014
. Investing cash outflows for the year ended December 31,
2014
were primarily driven by:
|
•
|
capital expenditures of
$665.7 million
, primarily due to construction at Pony Express, including the lateral in Northeast Colorado, as well as the capacity expansion projects at TMID and other expansion projects at Trailblazer;
|
|
•
|
cash outflows of
$270.0 million
associated with the related party loan to TD under the Pony Express cash management agreement; and
|
|
•
|
cash outflows of
$150.0 million
,
$27.0 million
, and
$7.6 million
for the acquisitions of Trailblazer, Pony Express, and Water Solutions, respectively.
|
These cash outflows were partially offset by cash inflows of $20.0 million from the return of funds deposited with Shell in support of the crude oil resale obligation of Pony Express.
Financing Activities.
Cash flows provided by financing activities were
$560.8 million
for the
year ended December 31, 2015
. Financing cash inflows for the
year ended December 31, 2015
were primarily driven by proceeds from the initial public offering of Class A shares, proceeds from the issuance of TEP common units, and net borrowings under the TEP and Tallgrass Equity revolving credit facilities, partially offset by the acquisition of TEP common units by Tallgrass Equity, and distributions of excess proceeds from the initial public offering and distributions to the TEGP Predecessor, noncontrolling interests, and Class A shareholders as discussed above.
Cash flows provided by financing activities were
$1.0 billion
for the year ended December 31,
2014
. Financing cash inflows for the year ended December 31,
2014
were primarily driven by:
•
net borrowings under the TEP revolving credit facility of
$424.0 million
;
|
•
|
net proceeds of
$320.4 million
from the issuance of 8,050,000 TEP common units in a public offering and
28,625
TEP common units issued under the TEP Equity Distribution Agreements during 2014;
|
•
net contributions from the TEGP Predecessor Member of
$279.5 million
; and
|
•
|
a contribution from TD of
$27.5 million
representing the difference between the carrying amount of the Replacement Gas Facilities, as defined in
Note 5
–
Related Party Transactions
, and the proceeds received from TD.
|
These cash inflows were partially offset by distributions to TEP unitholders of
$35.5 million
.
Distributions
Distributions to our Class A shareholders.
We distribute 100% of our available cash at the end of each quarter to Class A shareholders of record beginning with the quarter ended June 30, 2015. Our sole cash-generating asset is an approximate
36.94%
controlling membership interest in Tallgrass Equity. Tallgrass Equity's sole cash-generating assets consist of direct and indirect partnership interests in TEP, as detailed above in
"—Overview"
. Available cash is generally defined as all of our cash and cash equivalents on hand at the end of each quarter less reserves established in the discretion of our general partner for future requirements. For a discussion of factors and trends impacting TEP's business, which in turn impacts our ability to pay cash distributions to our Class A shareholders, please see
"—Factors and Trends Impacting Our Business"
above.
75
Our distribution for the three months ended
December 31, 2016
, in the amount of
$0.2775
per Class A share, or
$16.1 million
in the aggregate, was announced on January 24, 2017 and paid on February 14, 2017 to Class A shareholders of record on February 3, 2017.
Capital Requirements
The midstream energy business can be capital-intensive, requiring significant investment to maintain and upgrade existing operations. Our capital requirements have consisted primarily of, and we anticipate will continue to consist of, the following:
|
•
|
maintenance capital expenditures, which are cash expenditures incurred (including expenditures for the construction or development of new capital assets) that we expect to maintain our long-term operating income or operating capacity. These expenditures typically include certain system integrity, compliance and safety improvements; and
|
|
•
|
expansion capital expenditures, which are cash expenditures to increase our operating income or operating capacity over the long-term. Expansion capital expenditures include acquisitions or capital improvements (such as additions to or improvements on the capital assets owned, or acquisition or construction of new capital assets).
|
We expect to incur approximately $55 million for capital expenditures in
2017
, of which approximately $39 million is expected for expansion projects and approximately $16 million, net of anticipated reimbursements from affiliates, is expected for maintenance capital expenditures.
The determination of capital expenditures as maintenance or expansion is made at the individual asset level during our budgeting process and as we approve, execute, and monitor our capital spending. The following table summarizes the maintenance and expansion capital expenditures incurred at our consolidated entities:
|
Year Ended December 31,
|
|||||||||||
|
2016
|
2015
|
2014
|
|||||||||
|
|
(in thousands)
|
||||||||||
|
Maintenance capital expenditures
|
$
|
11,323
|
|
$
|
12,123
|
|
$
|
9,913
|
|
||
|
Expansion capital expenditures
|
30,576
|
|
16,859
|
|
193,704
|
|
|||||
|
Total capital expenditures incurred
|
$
|
41,899
|
|
$
|
28,982
|
|
$
|
203,617
|
|
||
Capital expenditures incurred represent capital expenditures paid and accrued during the period. Capital expenditures are presented net of noncontrolling interest, and contributions and reimbursements received. The
decrease
in maintenance capital expenditures to
$11.3 million
for the
year ended December 31, 2016
from
$12.1 million
for the
year ended December 31, 2015
is primarily driven by decreased maintenance capital expenditures in the Processing & Logistics segment. Maintenance capital expenditures on our assets occur on a regular schedule, but most major maintenance projects are not required every year so the level of maintenance capital expenditures naturally varies from year to year and from quarter to quarter. The
increase
in expansion capital expenditures to
$30.6 million
for the
year ended December 31, 2016
from
$16.9 million
for the
year ended December 31, 2015
is primarily driven by increased expansion capital expenditures in the Crude Oil Transportation & Logistics segment due to post in-service spending on Pony Express System projects. Expansion capital expenditures of
$16.9 million
for the
year ended December 31, 2015
consisted primarily of spending on the NGL pipeline in Northeast Colorado. During the year ended December 31, 2015, substantially all of the expansion capital expenditures related to Pony Express System projects were funded by TD as discussed in
Note 4
–
Acquisitions
and
Note 12
–
Partnership Equity and Distributions
.
The
increase
in maintenance capital expenditures to
$12.1 million
for the
year ended December 31, 2015
from
$9.9 million
for the
year ended December 31, 2014
is primarily driven by increased maintenance capital expenditures in the Natural Gas Transportation & Logistics and Processing & Logistics segments. Maintenance capital expenditures on our assets occur on a regular schedule, but most major maintenance projects are not required every year so the level of maintenance capital expenditures naturally varies from year to year and from quarter to quarter. The
decrease
in expansion capital expenditures to
$16.9 million
for the
year ended December 31, 2015
from
$193.7 million
for the
year ended December 31, 2014
is primarily driven by the significant spending on the Pony Express System prior to commencement of commercial operations in October 2014. Expansion capital expenditures of
$16.9 million
for the
year ended December 31, 2015
consisted primarily of spending on the NGL pipeline in Northeast Colorado prior to commencement of commercial service in the fourth quarter of 2015.
In addition, we invested cash in unconsolidated affiliates of
$50.0 million
during the
year ended December 31, 2016
and
$2.0 million
during the
year ended December 31, 2014
to fund our share of capital projects. There were no investments in unconsolidated affiliates during the year ended December 31, 2015. We expect to make contributions to unconsolidated affiliates of approximately $24 million to fund our 25% portion of capital projects at Rockies Express during the year ending December 31, 2017.
76
We intend to make cash distributions to our Class A shareholders. Due to our cash distribution policy, we expect that we will distribute available cash to our Class A shareholders on a quarterly basis. We expect TEP to fund future capital expenditures with funds generated from its operations, borrowings under its revolving credit facility, the issuance of additional partnership units and/or the issuance of long-term debt. If these sources are not sufficient, TEP may reduce its discretionary spending.
Contractual Obligations
Following is a summary of our contractual cash obligations in future periods, representing amounts that were fixed and determinable as of
December 31, 2016
:
|
Payments Due By Period
|
||||||||||||||||||||
|
Contractual Obligations
|
Total
|
Less Than 1 Year
|
1-3 Years
|
3-5 Years
|
More Than 5 Years
|
|||||||||||||||
|
(in thousands)
|
||||||||||||||||||||
|
Debt obligations
(1)
|
$
|
1,563,000
|
|
$
|
—
|
|
$
|
1,015,000
|
|
$
|
148,000
|
|
$
|
400,000
|
|
|||||
|
Interest on debt obligations
(2)
|
220,510
|
|
52,039
|
|
63,104
|
|
45,756
|
|
59,611
|
|
||||||||||
|
Operating lease and service contract obligations
(3)
|
593,239
|
|
28,103
|
|
57,700
|
|
59,858
|
|
447,578
|
|
||||||||||
|
Land site lease and right-of-way
(4)
|
2,440
|
|
274
|
|
416
|
|
475
|
|
1,275
|
|
||||||||||
|
Other purchase commitments
(5)
|
13,989
|
|
7,993
|
|
4,042
|
|
1,885
|
|
69
|
|
||||||||||
|
Total
|
$
|
2,393,178
|
|
$
|
88,409
|
|
$
|
1,140,262
|
|
$
|
255,974
|
|
$
|
908,533
|
|
|||||
|
(1)
|
Debt obligations at
December 31, 2016
consisted of borrowings under the TEP and Tallgrass Equity revolving credit facilities and the 2024 Notes. For additional information, see
Note 11
–
Long-term Debt
to the Consolidated Financial Statements in Item 8.—Financial Statements and Supplementary Data.
|
|
(2)
|
Interest on debt obligations is estimated using current borrowings and interest rates as of
December 31, 2016
. For additional information, see
Note 11
–
Long-term Debt
to the Consolidated Financial Statements in Item 8.—Financial Statements and Supplementary Data.
|
|
(3)
|
Operating leases and service contracts consist of leases for crude oil storage as well as office space and equipment. Lease obligations include approximately $255.8 million in future minimum lease payments to Terminals related to the Sterling Terminal facilities, which TEP acquired effective January 1, 2017. Lease obligations for the crude oil storage at the Sterling and Deeprock Terminals assume renewal for the full 20-year lease term. For additional information, see
Note 13
–
Commitments & Contingent Liabilities
to the Consolidated Financial Statements in Item 8.—Financial Statements and Supplementary Data.
|
|
(4)
|
Land site lease and right-of-way contracts consist of payments to landowners, primarily in our Crude Oil Transportation & Logistics and Natural Gas Transportation & Logistics segments. For additional information, see
Note 13
–
Commitments & Contingent Liabilities
to the Consolidated Financial Statements in Item 8.—Financial Statements and Supplementary Data.
|
|
(5)
|
Other purchase commitments primarily relate to planned non-reimbursable capital expenditures and operating and maintenance expenditures.
|
On May 17, 2013, in connection with the closing of TEP's IPO, TEP and its general partner entered into the TEP Omnibus Agreement, which provides that, among other things, TEP will reimburse TD and its affiliates for all expenses they incur and payments they make on TEP's behalf, including the costs of employee and director compensation and benefits as well as the cost of the provision of certain centralized corporate functions performed by TD, including legal, accounting, cash management, insurance administration and claims processing, risk management, health, safety and environmental, information technology and human resources in each case to the extent reasonably allocable to TEP. In addition, in connection with the closing of the TEGP IPO, TEGP entered into the TEGP Omnibus Agreement with TEGP Management, LLC, Tallgrass Equity and Tallgrass Energy Holdings (which acts as the general partner of TD). Pursuant to the TEGP Omnibus Agreement, Tallgrass Equity pays a quarterly reimbursement to TD for costs associated with TEGP being a public company.
Off-Balance Sheet Arrangements
We do not have any off-balance sheet arrangements.
77
Critical Accounting Policies and Estimates
Our significant accounting policies and the anticipated impact of recently issued accounting standards are described in
Note 2
–
Summary of Significant Accounting Policies
to the consolidated financial statements included in Item 8 of this Annual Report. Management's discussion and analysis of financial condition and results of operations are based upon our financial statements, which have been prepared in accordance with GAAP. The preparation of these financial statements requires management to make estimates and judgments that affect the reported amounts of assets, liabilities, revenues and expenses and the related disclosure of contingent assets and liabilities. The accounting policies discussed below are considered by management to be critical to an understanding of our financial statements as their application places the most significant demands on management's judgment. Due to the inherent uncertainties involved with this type of judgment, actual results could differ significantly from estimates and may have a material adverse impact on our results of operations, equity or cash flows. For additional information concerning our other accounting policies, please read the notes to the financial statements included in this report.
|
Description
|
Judgments and Uncertainties
|
Effect if Actual Results Differ from Assumptions
|
||
|
Impairment of Long-lived Assets
|
||||
|
We periodically evaluate whether the carrying value of long-lived assets has been impaired when circumstances indicate the carrying value of those assets may not be recoverable. This evaluation is based on undiscounted cash flow projections expected to be realized over the remaining useful life of the primary asset. The carrying amount is not recoverable if it exceeds the sum of undiscounted cash flows expected to result from the use and eventual disposition of the asset. If the carrying value is not recoverable, the impairment loss is measured as the excess of the asset's carrying value over its fair value.
|
We review our long-lived assets for impairment whenever events or changes in circumstances indicate that the carrying amount of an asset may not be recoverable. Our impairment analyses require management to apply judgment in estimating future cash flows as well as asset fair values, including forecasting useful lives of the assets, assessing the probability of different outcomes, including anticipated volumes, contract renewals and changes in our regulated rates, and selecting the discount rate that reflects the risk inherent in future cash flows. If the carrying value is not recoverable, we assess the fair value of long-lived assets using a discounted cash flow model and other commonly accepted techniques.
|
Using the impairment review methodology described herein, we have not recorded any impairment charges on long-lived assets during the year ended December 31, 2016. If actual results are not consistent with our assumptions and estimates or our assumptions and estimates change due to new information, we may be exposed to an impairment charge. A prolonged period of lower commodity prices may adversely affect our estimate of future operating results, which could result in future impairment due to the potential impact on our operations and cash flows.
|
||
78
|
Description
|
Judgments and Uncertainties
|
Effect if Actual Results Differ from Assumptions
|
||
|
Impairment of Goodwill
|
||||
|
We evaluate goodwill for impairment annually in the third quarter, and whenever events or changes in circumstances indicate it is more likely than not that the fair value of a reporting unit is less than its carrying amount.
|
We determine fair value using widely accepted valuation techniques, primarily discounted cash flow and market multiple analyses. These techniques are also used when assigning the purchase price to acquired assets and liabilities. These types of analyses require us to make assumptions and estimates regarding industry and economic factors and the profitability of future business strategies. Our impairment analyses require management to apply judgment in estimating future cash flows as well as asset fair values, including forecasting useful lives of the assets, assessing the probability of different outcomes, including anticipated volumes, contract renewals and changes in our regulated rates, and selecting the discount rate that reflects the risk inherent in future cash flows. It is our policy to conduct impairment testing based on our current business strategy in light of present industry and economic conditions, as well as future expectations.
|
We primarily use a discounted cash flow analysis, supplemented by a market approach analysis, to perform the assessment. Key assumptions in the analysis include the use of an appropriate discount rate, terminal year multiples, and estimated future cash flows including an estimate of operating and general and administrative costs. In estimating cash flows, we incorporate current market information, as well as historical and other factors, into our forecasted commodity prices. If our assumptions are not appropriate, or future events indicate that our goodwill is impaired, our net income would be impacted by the amount by which the carrying value exceeds the fair value of the reporting unit, to the extent of the balance of goodwill. A prolonged period of lower commodity prices may adversely affect our estimate of future operating results, which could result in future goodwill impairment for reporting units due to the potential impact on our operations and cash flows. We completed our impairment testing of goodwill in the third quarter of 2016 using the methodology described herein, and determined there was no impairment.
|
||
|
Risk Management Activities
|
||||
|
Derivative assets and liabilities are recorded on our consolidated balance sheets at their estimated fair value as of each reporting date. Changes in the fair value of derivative contracts are recognized in earnings in the period in which the change occurs.
|
When available, quoted market prices or prices obtained through external sources are used to determine a contract's fair value. For contracts with a delivery location or duration for which quoted market prices are not available, fair value is determined based on pricing models developed primarily from historical information and the expected relationship with quoted market prices.
|
If our estimates of fair value are inaccurate, we may be exposed to losses or gains that could be material. See Item 7A.—Quantitative and Qualitative Disclosures About Market Risk for details regarding the impact of potential changes in the crude oil and natural gas forward price curves on our derivative instruments at December 31, 2016.
|
||
|
Equity-Based Compensation
|
||||
|
Equity-based compensation grants are measured at their grant date fair value and related compensation cost is recognized over the vesting period of the grant. Compensation cost for awards with graded vesting provisions is recognized on a straight-line basis over the requisite service period of each separately vesting portion of the award.
|
Estimating the fair value of each award, the number of awards that will ultimately vest, and the forfeiture rate requires management to apply judgment to estimate the tenure of our employees and the achievement of certain performance targets over the performance period.
|
If actual results are not consistent with our assumptions and judgments or our assumptions and estimates change due to new information, we may experience material changes in compensation expense.
|
||
79
|
Description
|
Judgments and Uncertainties
|
Effect if Actual Results Differ from Assumptions
|
||
|
Income Taxes
|
||||
|
Current income tax expense is the amount of income taxes expected to be payable for the current year. A deferred income tax liability or asset is established for the expected future tax consequences resulting from the differences in the financial reporting and tax basis of the assets and liabilities. Each quarter we evaluate the reasonableness of the deferred tax assets and a valuation allowance is provided if it is more likely than not that some or all of the deferred tax assets will not be realized.
|
Deferred income taxes arise from temporary differences between the tax basis of assets and liabilities and their reported amounts in the financial statements, which will result in taxable or deductible amounts in the future. In evaluating our ability to recover our deferred tax assets we consider all available positive and negative evidence, including scheduled reversals of deferred tax liabilities, projected future taxable income, tax-planning strategies, and results of recent operations. In projecting future taxable income, we begin with historical results adjusted for the results of discontinued operations and incorporate assumptions about the amount of future state and federal pretax operating income adjusted for items that do not have tax consequences. The assumptions about future taxable income require the use of significant judgment and are consistent with the plans and estimates we are using to manage the underlying businesses.
|
If our valuation allowance does not appropriately adjust our deferred tax assets to reflect the actual future tax benefits or consequences from the differences between the tax basis of assets and liabilities and their reported amounts in the financial statements: our balance sheet may be overstated or understated resulting in an overstated or understated Income Tax Expense on the Income Statement resulting in either understated or overstated Net Income after Income Tax.
|
||
Commodity Price Risk
As of
December 31, 2016
, approximately
99%
of our reserved processing capacity was subject to firm or volumetric fee contracts, with the majority of fee revenue based on the volumes actually processed. The remaining
1%
was subject to commodity sensitive contracts such as percent of proceeds or keep whole processing contracts. The profitability of our commodity sensitive processing contracts that include keep whole or percent of proceeds components is affected by volatility in prevailing NGL and natural gas prices. We do not currently hedge the commodity exposure in our commodity sensitive contracts in our Processing & Logistics segment and we do not expect to in the foreseeable future. Starting in the second half of 2014, the prices of crude oil, natural gas, and NGLs became extremely volatile and declined significantly. Downward pressure and volatility on commodity prices continued in 2015 before recovering somewhat in 2016. These declines directly and indirectly resulted in lower realizations and processing volumes on our percent of proceeds and keep whole processing contracts. Our Processing & Logistics segment comprised approximately
0.4%
,
2%
and
39%
of our operating income for the years ended
December 31, 2016
,
2015
and
2014
, respectively.
Historically, we have had a limited amount of direct commodity price exposure related to natural gas collected for electrical compression costs and lost and unaccounted for gas on the TIGT System. Accordingly, we have historically entered into derivative contracts with third parties for a substantial majority of the natural gas we expected to collect for the purpose of hedging our commodity price exposures. In 2016, we also entered into long natural gas swaps covering a portion of the natural gas that TMID expects to purchase in 2017. In addition, we have a limited amount of direct commodity price exposure related to crude oil collected as part of our contractual pipeline loss allowance at Pony Express. During 2016, we began entering into derivative contracts for the sale of crude oil inventory.
We measure the risk of price changes in our natural gas swaps utilizing a sensitivity analysis model. The sensitivity analysis measures the potential income or loss (i.e., the change in fair value of the derivative instruments) based upon a hypothetical 10% movement in the underlying quoted market prices. In addition to these variables, the fair value of each portfolio is influenced by fluctuations in the notional amounts of the instruments and the discount rates used to determine the present values. We enter into derivative contracts solely for the purpose of mitigating the risks that accompany certain of our business activities and, therefore, both the sensitivity analysis model and the change in the market value of our outstanding derivative contracts are offset largely by changes in the value of the underlying physical commodity prices.
80
The following table summarizes our commodity derivatives and the change in fair value that would be expected from a 10% price increase or decrease as of
December 31, 2016
, assuming a parallel shift in the forward curve through the end of 2017:
|
Fair Value
|
Effect of 10% Price Increase
|
Effect of 10% Price Decrease
|
|||||||||
|
|
(in thousands)
|
||||||||||
|
Natural gas derivative contracts
(1)
|
$
|
291
|
|
$
|
142
|
|
$
|
(142
|
)
|
||
|
Natural gas derivative contracts
(2)
|
$
|
(116
|
)
|
$
|
(105
|
)
|
$
|
105
|
|
||
|
Crude oil derivative contract
(3)
|
$
|
(440
|
)
|
$
|
(702
|
)
|
$
|
702
|
|
||
|
(1)
|
Represents long natural gas swaps outstanding with a notional volume of approximately
0.4
Bcf covering a portion of the natural gas that is expected to be purchased by our Processing & Logistics segment throughout 2017.
|
|
(2)
|
Represents short natural gas swaps outstanding with a notional volume of approximately
0.3
Bcf covering a portion of the natural gas that is expected to be sold by our Natural Gas Transportation & Logistics segment in the first quarter of 2017.
|
|
(3)
|
Represents the sale of
125,000
barrels of crude oil by our Crude Oil Transportation & Logistics segment which will settle throughout 2017.
|
The Commodity Futures Trading Commission ("CFTC") has promulgated regulations to implement the Dodd-Frank Wall Street Reform and Consumer Protection Act's changes to the Commodity Exchange Act, including the definition of commodity-based swaps subject to those regulations. The CFTC regulations implemented new reporting and record keeping requirements related to those swap transactions and a mandatory clearing and exchange-execution regime for various types, categories or classes of swaps, subject to certain exemptions, including the trade-option and end-user exemptions. Although we anticipate that most, if not all, of our swap transactions should qualify for an exemption to the clearing and exchange-execution requirements, we will still be subject to record keeping and reporting requirements.
Interest Rate Risk
As described in "
Liquidity and Capital Resources Overview
" above, on September 1, 2016 TEP issued
$400 million
in
5.50%
senior notes due 2024. In addition, TEP currently has a $1.75 billion revolving credit facility with borrowings of approximately
$1.0 billion
as of
December 31, 2016
. Borrowings under the revolving credit facility will bear interest, at TEP's option, at either (a) a base rate, which will be a rate equal to the greatest of (i) the prime rate, (ii) the U.S. federal funds rate plus 0.5% and (iii) a one-month reserve adjusted Eurodollar rate plus 1.00% or (b) a reserve adjusted Eurodollar Rate, plus, in each case, an applicable margin. The applicable margin ranges from 0.75% to 2.75%, based upon TEP's total leverage ratio and whether it has elected the base rate or the reserve adjusted Eurodollar rate. Tallgrass Equity currently has an additional $148 million in outstanding borrowings under its revolving credit facility. Borrowings under the credit facility bear interest, at Tallgrass Equity's option, at either (a) a base rate, which will be a rate equal to the greatest of (i) the prime rate, (ii) the U.S. federal funds rate plus 0.5% and (iii) a one-month reserve adjusted Eurodollar rate plus 1.00% or (b) a reserve adjusted Eurodollar rate, plus, in each case, an applicable margin. For loans bearing interest based on the base rate, the applicable margin is 1.50%, and for loans bearing interest based on the reserve adjusted Eurodollar rate, the applicable margin is 2.50%.
We do not currently hedge the interest rate risk on our borrowings under the revolving credit facilities. However, in the future we may consider hedging the interest rate risk or may consider choosing longer Eurodollar borrowing terms in order to fix all or a portion of our borrowings for a period of time. We estimate that a 1% increase in interest rates would decrease the fair value of the debt by
$0.7 million
based on our debt obligations as of
December 31, 2016
.
Credit Risk
We are exposed to credit risk. Credit risk represents the loss that we would incur if a counterparty fails to perform under its contractual obligations. We manage our exposure to credit risk associated with customers to whom we extend credit through a credit approval process which includes credit analysis, the establishment of credit limits and ongoing monitoring procedures. We may request letters of credit, cash collateral, prepayments or guarantees as forms of credit support.
A substantial majority of our revenue is produced under long-term firm fee contracts with high-quality customers. The customer base we currently serve under these contracts generally has a strong credit profile, with slightly under
45%
of our revenues derived from customers who have an investment grade credit rating or are part of corporate families with investment grade credit ratings as of
December 31, 2016
. This represents a decrease in the portion of our revenues derived from customers with an investment grade credit rating from 2015, primarily as a result of credit downgrades at several of our customers and throughout the industry due to the soft commodity price environment.
81
We also have indirect credit risk exposure with respect to our investment in Rockies Express. See Item 1A.
—
Risk Factors for additional information.
82
Report of Independent Registered Public Accounting Firm
To
the Partners of Tallgrass Energy GP, LP
In our opinion, the accompanying consolidated balance sheets and the related consolidated statements of income, equity and cash flows present fairly, in all material respects, the financial position of Tallgrass Energy GP, LP and its subsidiaries
at
December 31, 2016
and 2015, and the results of their operations and their cash flows for each of the three years in the period ended
December 31, 2016,
in conformity with accounting principles generally accepted in the United States of America. Also in our opinion, the Partnership maintained, in all material respects, effective internal control over financial reporting as of December 31, 2016, based on criteria established in
Internal Control - Integrated Framework
(2013)
issued by the Committee of Sponsoring Organizations of the Treadway Commission (COSO). The Partnership's management is responsible for these financial statements, for maintaining effective internal control over financial reporting and for its assessment of the effectiveness of internal control over financial reporting, included in Management's Report on Internal Control over Financial Reporting appearing under Item 9A. Our responsibility is to express opinions on these financial statements and on the Partnership's internal control over financial reporting based on our audits (which was an integrated audit in 2016). We conducted our audits in accordance with the standards of the Public Company Accounting Oversight Board (United States). Those standards require that we plan and perform the audits to obtain reasonable assurance about whether the financial statements are free of material misstatement and whether effective internal control over financial reporting was maintained in all material respects. Our audits of the financial statements included examining, on a test basis, evidence supporting the amounts and disclosures in the financial statements, assessing the accounting principles used and significant estimates made by management, and evaluating the overall financial statement presentation. Our audit of internal control over financial reporting included obtaining an understanding of internal control over financial reporting, assessing the risk that a material weakness exists, and testing and evaluating the design and operating effectiveness of internal control based on the assessed risk. Our audits also included performing such other procedures as we considered necessary in the circumstances. We believe that our audits provide a reasonable basis for our opinions.
A company’s internal control over financial reporting is a process designed to provide reasonable assurance regarding the reliability of financial reporting and the preparation of financial statements for external purposes in accordance with generally accepted accounting principles. A company’s internal control over financial reporting includes those policies and procedures that (i) pertain to the maintenance of records that, in reasonable detail, accurately and fairly reflect the transactions and dispositions of the assets of the company; (ii) provide reasonable assurance that transactions are recorded as necessary to permit preparation of financial statements in accordance with generally accepted accounting principles, and that receipts and expenditures of the company are being made only in accordance with authorizations of management and directors of the company; and (iii) provide reasonable assurance regarding prevention or timely detection of unauthorized acquisition, use, or disposition of the company’s assets that could have a material effect on the financial statements.
Because of its inherent limitations, internal control over financial reporting may not prevent or detect misstatements. Also, projections of any evaluation of effectiveness to future periods are subject to the risk that controls may become inadequate because of changes in conditions, or that the degree of compliance with the policies or procedures may deteriorate.
/s/ PricewaterhouseCoopers LLP
Denver, Colorado
February 15, 2017
83
TALLGRASS ENERGY GP, LP
|
December 31, 2016
|
December 31, 2015
|
||||||
|
|
(in thousands)
|
||||||
|
ASSETS
|
|||||||
|
Current Assets:
|
|||||||
|
Cash and cash equivalents
|
$
|
2,459
|
|
$
|
2,234
|
|
|
|
Accounts receivable, net
|
59,469
|
|
57,757
|
|
|||
|
Gas imbalances
|
1,597
|
|
1,227
|
|
|||
|
Inventories
|
12,805
|
|
13,793
|
|
|||
|
Derivative assets at fair value
|
10,967
|
|
—
|
|
|||
|
Prepayments and other current assets
|
6,820
|
|
2,835
|
|
|||
|
Total Current Assets
|
94,117
|
|
77,846
|
|
|||
|
Property, plant and equipment, net
|
2,012,263
|
|
2,025,018
|
|
|||
|
Goodwill
|
343,288
|
|
343,288
|
|
|||
|
Intangible asset, net
|
93,522
|
|
96,546
|
|
|||
|
Unconsolidated investment
|
461,915
|
|
—
|
|
|||
|
Deferred financing costs, net
|
6,042
|
|
6,638
|
|
|||
|
Deferred tax asset
|
521,454
|
|
452,430
|
|
|||
|
Deferred charges and other assets
|
9,637
|
|
14,894
|
|
|||
|
Total Assets
|
$
|
3,542,238
|
|
$
|
3,016,660
|
|
|
|
LIABILITIES AND EQUITY
|
|||||||
|
Current Liabilities:
|
|||||||
|
Accounts payable (including $10,554 at December 31, 2015 related to variable interest entities)
|
$
|
24,403
|
|
$
|
22,218
|
|
|
|
Accounts payable to related parties
|
5,768
|
|
7,755
|
|
|||
|
Gas imbalances
|
1,239
|
|
1,605
|
|
|||
|
Derivative liabilities at fair value
|
556
|
|
—
|
|
|||
|
Accrued taxes
|
16,328
|
|
13,844
|
|
|||
|
Accrued liabilities
|
16,578
|
|
10,206
|
|
|||
|
Deferred revenue
|
60,757
|
|
26,511
|
|
|||
|
Other current liabilities
|
6,446
|
|
6,880
|
|
|||
|
Total Current Liabilities
|
132,075
|
|
89,019
|
|
|||
|
Long-term debt, net
|
1,555,981
|
|
901,000
|
|
|||
|
Other long-term liabilities and deferred credits
|
7,063
|
|
5,143
|
|
|||
|
Total Long-term Liabilities
|
1,563,044
|
|
906,143
|
|
|||
|
Commitments and Contingencies
|
|
|
|||||
|
Equity:
|
|||||||
|
Class A Shareholders (58,075,000 and 47,725,000 shares outstanding, respectively)
|
250,967
|
|
422,310
|
|
|||
|
Class B Shareholders (99,154,440 and 109,504,440 shares outstanding, respectively)
|
—
|
|
—
|
|
|||
|
Total Partners' Equity
|
250,967
|
|
422,310
|
|
|||
|
Noncontrolling interests
|
1,596,152
|
|
1,599,188
|
|
|||
|
Total Equity
|
1,847,119
|
|
2,021,498
|
|
|||
|
Total Liabilities and Equity
|
$
|
3,542,238
|
|
$
|
3,016,660
|
|
|
The accompanying notes are an integral part of these consolidated financial statements.
84
TALLGRASS ENERGY GP, LP
|
Year Ended December 31,
|
|||||||||||
|
2016
|
2015
|
2014
|
|||||||||
|
(in thousands, except per unit amounts)
|
|||||||||||
|
Revenues:
|
|||||||||||
|
Crude oil transportation services
|
$
|
374,949
|
|
$
|
300,436
|
|
$
|
28,343
|
|
||
|
Natural gas transportation services
|
119,962
|
|
119,895
|
|
126,733
|
|
|||||
|
Sales of natural gas, NGLs, and crude oil
|
77,394
|
|
82,133
|
|
181,249
|
|
|||||
|
Processing and other revenues
|
32,817
|
|
33,733
|
|
35,231
|
|
|||||
|
Total Revenues
|
605,122
|
|
536,197
|
|
371,556
|
|
|||||
|
Operating Costs and Expenses:
|
|||||||||||
|
Cost of sales (exclusive of depreciation and amortization shown below)
|
71,920
|
|
75,285
|
|
167,545
|
|
|||||
|
Cost of transportation services (exclusive of depreciation and amortization shown below)
|
58,341
|
|
53,597
|
|
24,109
|
|
|||||
|
Operations and maintenance
|
53,386
|
|
49,138
|
|
39,577
|
|
|||||
|
Depreciation and amortization
|
84,896
|
|
83,476
|
|
47,048
|
|
|||||
|
General and administrative
|
55,829
|
|
51,479
|
|
33,160
|
|
|||||
|
Taxes, other than income taxes
|
24,727
|
|
21,796
|
|
6,704
|
|
|||||
|
Loss on disposal of assets
|
1,849
|
|
4,795
|
|
—
|
|
|||||
|
Total Operating Costs and Expenses
|
350,948
|
|
339,566
|
|
318,143
|
|
|||||
|
Operating Income
|
254,174
|
|
196,631
|
|
53,413
|
|
|||||
|
Other Income (Expense):
|
|||||||||||
|
Interest expense, net
|
(45,601
|
)
|
(18,330
|
)
|
(7,292
|
)
|
|||||
|
Unrealized loss on derivative instrument
|
(1,291
|
)
|
—
|
|
—
|
|
|||||
|
Equity in earnings of unconsolidated investment
|
51,780
|
|
—
|
|
717
|
|
|||||
|
Gain on remeasurement of unconsolidated investment
|
—
|
|
—
|
|
9,388
|
|
|||||
|
Other income, net
|
1,723
|
|
2,413
|
|
3,103
|
|
|||||
|
Total Other Income (Expense)
|
6,611
|
|
(15,917
|
)
|
5,916
|
|
|||||
|
Net income before tax
|
260,785
|
|
180,714
|
|
|
59,329
|
|
||||
|
Deferred income tax (expense) benefit
|
(17,741
|
)
|
7,277
|
|
—
|
|
|||||
|
Net income
|
243,044
|
|
187,991
|
|
59,329
|
|
|||||
|
Net income attributable to noncontrolling interests
|
(216,250
|
)
|
(156,035
|
)
|
(48,415
|
)
|
|||||
|
Net income attributable to TEGP
|
$
|
26,794
|
|
$
|
31,956
|
|
$
|
10,914
|
|
||
|
Allocation of income:
|
|||||||||||
|
Net income attributable to TEGP
|
$
|
26,794
|
|
$
|
31,956
|
|
|||||
|
Net income attributable to TEGP prior to May 12, 2015
|
—
|
|
(7,393
|
)
|
|||||||
|
Net income attributable to TEGP subsequent to May 12, 2015
|
26,794
|
|
24,563
|
|
|||||||
|
Basic net income per Class A share
|
$
|
0.55
|
|
$
|
0.51
|
|
|||||
|
Diluted net income per Class A share
|
$
|
0.55
|
|
$
|
0.51
|
|
|||||
|
Basic average number of Class A shares outstanding
|
48,856
|
|
47,725
|
|
|||||||
|
Diluted average number of Class A shares outstanding
|
48,889
|
|
47,808
|
|
|||||||
The accompanying notes are an integral part of these consolidated financial statements.
85
TALLGRASS ENERGY GP, LP
CONSOLIDATED STATEMENTS OF EQUITY
|
TEGP Predecessor Equity
|
Partners' Capital
|
Noncontrolling Interests
|
Total Equity
|
||||||||||||||||||||||
|
Class A Shares
|
Class B Shares
|
||||||||||||||||||||||||
|
Shares
|
Amount
|
Shares
|
Amount
|
||||||||||||||||||||||
|
(in thousands)
|
|||||||||||||||||||||||||
|
Balance at January 1, 2014
|
$
|
150,871
|
|
—
|
|
$
|
—
|
|
—
|
|
$
|
—
|
|
$
|
1,158,230
|
|
$
|
1,309,101
|
|
||||||
|
Net income
|
10,914
|
|
—
|
|
—
|
|
—
|
|
—
|
|
48,415
|
|
59,329
|
|
|||||||||||
|
Issuance of TEP units to the public, net of offering costs
|
43,859
|
|
—
|
|
—
|
|
—
|
|
—
|
|
276,526
|
|
320,385
|
|
|||||||||||
|
Noncash compensation expense
|
—
|
|
—
|
|
—
|
|
—
|
|
—
|
|
10,154
|
|
10,154
|
|
|||||||||||
|
Contribution from TD
|
8,344
|
|
—
|
|
—
|
|
—
|
|
—
|
|
19,144
|
|
27,488
|
|
|||||||||||
|
(Distributions to) Contributions from Predecessor Entities, net
|
(23,615
|
)
|
—
|
|
—
|
|
—
|
|
—
|
|
303,161
|
|
279,546
|
|
|||||||||||
|
Contributions from noncontrolling interests
|
—
|
|
—
|
|
—
|
|
—
|
|
—
|
|
5,429
|
|
5,429
|
|
|||||||||||
|
Distributions to noncontrolling interests
|
—
|
|
—
|
|
—
|
|
—
|
|
—
|
|
(40,944
|
)
|
(40,944
|
)
|
|||||||||||
|
Issuance of TEP general partner units
|
80
|
|
—
|
|
—
|
|
—
|
|
—
|
|
183
|
|
263
|
|
|||||||||||
|
Acquisition of Trailblazer
|
(32,992
|
)
|
—
|
|
—
|
|
—
|
|
—
|
|
(117,008
|
)
|
(150,000
|
)
|
|||||||||||
|
Acquisition of Water Solutions
|
—
|
|
—
|
|
—
|
|
—
|
|
—
|
|
1,400
|
|
1,400
|
|
|||||||||||
|
Acquisition of 33.3% Pony Express membership interest
|
(10,595
|
)
|
—
|
|
—
|
|
—
|
|
—
|
|
(16,405
|
)
|
(27,000
|
)
|
|||||||||||
|
Balance at December 31, 2014
|
$
|
146,866
|
|
—
|
|
$
|
—
|
|
—
|
|
$
|
—
|
|
$
|
1,648,285
|
|
$
|
1,795,151
|
|
||||||
|
Net income for the period from January 1, 2015 to May 11, 2015
|
7,393
|
|
—
|
|
—
|
|
—
|
|
—
|
|
32,196
|
|
39,589
|
|
|||||||||||
|
Issuance of TEP units to public, net of offering costs
|
63,464
|
|
—
|
|
—
|
|
—
|
|
—
|
|
487,653
|
|
551,117
|
|
|||||||||||
|
Acquisition of additional 33.3% membership interest in Pony Express
|
(98,446
|
)
|
—
|
|
—
|
|
—
|
|
—
|
|
(601,554
|
)
|
(700,000
|
)
|
|||||||||||
|
Distributions to TEGP Predecessor
|
(4,108
|
)
|
—
|
|
—
|
|
—
|
|
—
|
|
(9,425
|
)
|
(13,533
|
)
|
|||||||||||
|
Issuance of Class A shares to the public, net of offering costs
|
—
|
|
47,725
|
|
1,314,738
|
|
—
|
|
—
|
|
—
|
|
1,314,738
|
|
|||||||||||
|
Issuance of Class B shares to the Exchange Right Holders
|
—
|
|
—
|
|
—
|
|
109,504
|
|
—
|
|
—
|
|
—
|
|
|||||||||||
|
Acquisition of Acquired TEP Units from TD
|
—
|
|
—
|
|
(953,600
|
)
|
—
|
|
—
|
|
—
|
|
(953,600
|
)
|
|||||||||||
|
Distribution of excess TEGP IPO proceeds to Exchange Right Holders
|
—
|
|
—
|
|
(334,068
|
)
|
—
|
|
—
|
|
—
|
|
(334,068
|
)
|
|||||||||||
|
Acquisition of Tallgrass Equity units from Exchange Right Holders
|
—
|
|
—
|
|
(171,948
|
)
|
—
|
|
—
|
|
—
|
|
(171,948
|
)
|
|||||||||||
|
Consolidation of TEGP Predecessor assets
|
(115,169
|
)
|
—
|
|
115,169
|
|
—
|
|
—
|
|
—
|
|
—
|
|
|||||||||||
|
Deferred tax asset
|
—
|
|
—
|
|
445,152
|
|
—
|
|
—
|
|
—
|
|
445,152
|
|
|||||||||||
|
Net income for the period from May 12, 2015 to December 31, 2015
|
—
|
|
—
|
|
24,563
|
|
—
|
|
—
|
|
123,839
|
|
148,402
|
|
|||||||||||
|
Issuance of TEP common units under TEP LTIP plan
|
—
|
|
—
|
|
(665
|
)
|
—
|
|
—
|
|
(5,938
|
)
|
(6,603
|
)
|
|||||||||||
|
Noncash compensation expense
|
—
|
|
—
|
|
493
|
|
—
|
|
—
|
|
9,337
|
|
9,830
|
|
|||||||||||
|
Contributions from noncontrolling interests
|
—
|
|
—
|
|
—
|
|
—
|
|
—
|
|
110,127
|
|
110,127
|
|
|||||||||||
|
Distributions to noncontrolling interests
|
—
|
|
—
|
|
—
|
|
—
|
|
—
|
|
(197,402
|
)
|
(197,402
|
)
|
|||||||||||
|
Distributions to TEP GP Members
|
—
|
|
—
|
|
(7,465
|
)
|
—
|
|
—
|
|
—
|
|
(7,465
|
)
|
|||||||||||
|
Issuance of TEP units to public, net of offering costs
|
—
|
|
—
|
|
297
|
|
—
|
|
—
|
|
2,670
|
|
2,967
|
|
|||||||||||
The accompanying notes are an integral part of these consolidated financial statements.
86
TALLGRASS ENERGY GP, LP
CONSOLIDATED STATEMENTS OF EQUITY
|
Distributions to Class A shareholders
|
—
|
|
—
|
|
(10,356
|
)
|
—
|
|
—
|
|
—
|
|
(10,356
|
)
|
|||||||||||
|
Acquisition of noncontrolling interests
|
—
|
|
—
|
|
—
|
|
—
|
|
—
|
|
(600
|
)
|
(600
|
)
|
|||||||||||
|
Balance at December 31, 2015
|
$
|
—
|
|
47,725
|
|
$
|
422,310
|
|
109,504
|
|
$
|
—
|
|
$
|
1,599,188
|
|
$
|
2,021,498
|
|
||||||
|
Net income
|
—
|
|
—
|
|
26,794
|
|
—
|
|
—
|
|
216,250
|
|
243,044
|
|
|||||||||||
|
Acquisition of additional 31.3% membership interest in Pony Express
|
—
|
|
—
|
|
(255,617
|
)
|
—
|
|
—
|
|
(173,422
|
)
|
(429,039
|
)
|
|||||||||||
|
Issuance of TEP common units to public, net of offering costs
|
—
|
|
—
|
|
28,762
|
|
—
|
|
—
|
|
308,909
|
|
337,671
|
|
|||||||||||
|
Distributions to noncontrolling interests
|
—
|
|
—
|
|
—
|
|
—
|
|
—
|
|
(249,142
|
)
|
(249,142
|
)
|
|||||||||||
|
Partial exercise of call option
|
—
|
|
—
|
|
(27,312
|
)
|
—
|
|
—
|
|
(211,315
|
)
|
(238,627
|
)
|
|||||||||||
|
Issuance of TEP common units in a private placement, net of offering costs
|
—
|
|
—
|
|
7,592
|
|
—
|
|
—
|
|
82,417
|
|
90,009
|
|
|||||||||||
|
Deferred tax asset
|
—
|
|
—
|
|
86,766
|
|
—
|
|
—
|
|
—
|
|
86,766
|
|
|||||||||||
|
TEGP distributions to Class A shareholders
|
—
|
|
—
|
|
(42,499
|
)
|
—
|
|
—
|
|
—
|
|
(42,499
|
)
|
|||||||||||
|
Contributions from noncontrolling interests
|
—
|
|
—
|
|
—
|
|
—
|
|
—
|
|
9,304
|
|
9,304
|
|
|||||||||||
|
Noncash compensation expense
|
—
|
|
—
|
|
1,448
|
|
—
|
|
—
|
|
7,879
|
|
9,327
|
|
|||||||||||
|
Acquisition of membership interest in BNN
|
—
|
|
—
|
|
(464
|
)
|
—
|
|
—
|
|
(5,536
|
)
|
(6,000
|
)
|
|||||||||||
|
Contributions from TD
|
—
|
|
—
|
|
5,827
|
|
—
|
|
—
|
|
12,067
|
|
17,894
|
|
|||||||||||
|
Costs associated with equity issuance
|
—
|
|
—
|
|
(986
|
)
|
—
|
|
—
|
|
—
|
|
(986
|
)
|
|||||||||||
|
Issuance of TEP common units under TEP LTIP plan
|
—
|
|
—
|
|
(51
|
)
|
—
|
|
—
|
|
(447
|
)
|
(498
|
)
|
|||||||||||
|
Distribution of excess TEGP IPO proceeds to Exchange Right Holders
|
—
|
|
—
|
|
(1,603
|
)
|
—
|
|
—
|
|
—
|
|
(1,603
|
)
|
|||||||||||
|
Conversion of Class B shares to Class A shares
|
—
|
|
10,350
|
|
—
|
|
(10,350
|
)
|
—
|
|
—
|
|
—
|
|
|||||||||||
|
Balance at December 31, 2016
|
$
|
—
|
|
58,075
|
|
$
|
250,967
|
|
99,154
|
|
$
|
—
|
|
$
|
1,596,152
|
|
$
|
1,847,119
|
|
||||||
The accompanying notes are an integral part of these consolidated financial statements.
87
TALLGRASS ENERGY GP, LP
|
Year Ended December 31,
|
|||||||||||
|
2016
|
2015
|
2014
|
|||||||||
|
|
(in thousands)
|
||||||||||
|
Cash Flows from Operating Activities:
|
|||||||||||
|
Net income
|
$
|
243,044
|
|
$
|
187,991
|
|
$
|
59,329
|
|
||
|
Adjustments to reconcile net income to net cash flows provided by operating activities:
|
|||||||||||
|
Depreciation and amortization
|
91,886
|
|
87,586
|
|
49,041
|
|
|||||
|
Equity in earnings of unconsolidated investment
|
(51,780
|
)
|
—
|
|
(717
|
)
|
|||||
|
Distributions from unconsolidated investment
|
51,780
|
|
—
|
|
717
|
|
|||||
|
Deferred tax expense (benefit)
|
17,741
|
|
(7,277
|
)
|
—
|
|
|||||
|
Noncash compensation expense
|
5,972
|
|
5,425
|
|
5,136
|
|
|||||
|
Noncash change in the fair value of derivative financial instruments
|
1,556
|
|
—
|
|
—
|
|
|||||
|
Loss on disposal of assets
|
1,849
|
|
4,795
|
|
—
|
|
|||||
|
Gain on remeasurement of unconsolidated affiliate
|
—
|
|
—
|
|
(9,388
|
)
|
|||||
|
Changes in components of working capital:
|
|||||||||||
|
Accounts receivable and other
|
2,041
|
|
(15,570
|
)
|
(348
|
)
|
|||||
|
Gas imbalances
|
1,157
|
|
(757
|
)
|
1,504
|
|
|||||
|
Inventories
|
(938
|
)
|
(5,169
|
)
|
(8,367
|
)
|
|||||
|
Accounts payable and accrued liabilities
|
10,147
|
|
9,888
|
|
(21,787
|
)
|
|||||
|
Deferred revenue
|
33,815
|
|
20,612
|
|
6,619
|
|
|||||
|
Other operating, net
|
(5,072
|
)
|
(1,665
|
)
|
(2,295
|
)
|
|||||
|
Net Cash Provided by Operating Activities
|
403,198
|
|
285,859
|
|
79,444
|
|
|||||
|
Cash Flows from Investing Activities:
|
|||||||||||
|
Capital expenditures
|
(70,719
|
)
|
(65,387
|
)
|
(665,650
|
)
|
|||||
|
Acquisition of unconsolidated affiliate
|
(436,022
|
)
|
—
|
|
—
|
|
|||||
|
Acquisition of Pony Express membership interest
|
(49,118
|
)
|
(700,000
|
)
|
(27,000
|
)
|
|||||
|
Contributions to unconsolidated investment
|
(50,013
|
)
|
—
|
|
(1,999
|
)
|
|||||
|
Distributions from unconsolidated investment in excess of cumulative earnings
|
24,120
|
|
—
|
|
747
|
|
|||||
|
Issuance of related party loan
|
—
|
|
—
|
|
(270,000
|
)
|
|||||
|
Acquisition of Trailblazer
|
—
|
|
—
|
|
(150,000
|
)
|
|||||
|
Acquisition of Western
|
—
|
|
(75,000
|
)
|
—
|
|
|||||
|
Acquisition of additional equity interests in Water Solutions
|
—
|
|
—
|
|
(7,600
|
)
|
|||||
|
Other investing, net
|
49
|
|
(4,883
|
)
|
18,773
|
|
|||||
|
Net Cash Used in Investing Activities
|
(581,703
|
)
|
(845,270
|
)
|
(1,102,729
|
)
|
|||||
|
Cash Flows from Financing Activities:
|
|||||||||||
|
Acquisition of Pony Express membership interest
|
(425,882
|
)
|
—
|
|
—
|
|
|||||
|
Proceeds from issuance of long-term debt
|
400,000
|
|
—
|
|
—
|
|
|||||
|
Proceeds from public offering of TEP common units, net of offering costs
|
337,671
|
|
554,084
|
|
320,385
|
|
|||||
|
Borrowings under revolving credit facilities, net
|
262,000
|
|
342,000
|
|
424,000
|
|
|||||
|
Distributions to noncontrolling interests
|
(249,142
|
)
|
(153,064
|
)
|
(35,538
|
)
|
|||||
|
Partial exercise of call option
|
(204,634
|
)
|
—
|
|
—
|
|
|||||
|
Proceeds from private placement of TEP common units, net of offering costs
|
90,009
|
|
—
|
|
—
|
|
|||||
The accompanying notes are an integral part of these consolidated financial statements.
88
TALLGRASS ENERGY GP, LP
CONSOLIDATED STATEMENTS OF CASH FLOWS
|
TEGP distributions to Class A shareholders
|
(42,499
|
)
|
(10,356
|
)
|
—
|
|
|||||
|
Contributions from noncontrolling interests
|
9,304
|
|
—
|
|
—
|
|
|||||
|
Proceeds from initial public offering of Class A shares, net
|
—
|
|
1,314,738
|
|
—
|
|
|||||
|
Acquisition of Acquired TEP Units
|
—
|
|
(953,600
|
)
|
—
|
|
|||||
|
Distribution of Excess Proceeds to Exchange Right Holders
|
(1,603
|
)
|
(334,068
|
)
|
—
|
|
|||||
|
Acquisition of additional Tallgrass Equity units
|
—
|
|
(171,948
|
)
|
—
|
|
|||||
|
(Distributions to) Contributions from TEGP Predecessor Member, net
|
—
|
|
(13,533
|
)
|
279,546
|
|
|||||
|
Distributions to TEP GP Member, net
|
—
|
|
(7,465
|
)
|
—
|
|
|||||
|
Contribution from TD
|
17,894
|
|
—
|
|
27,488
|
|
|||||
|
Other financing, net
|
(14,388
|
)
|
(6,010
|
)
|
8,271
|
|
|||||
|
Net Cash Provided by Financing Activities
|
178,730
|
|
560,778
|
|
1,024,152
|
|
|||||
|
Net Change in Cash and Cash Equivalents
|
225
|
|
1,367
|
|
867
|
|
|||||
|
Cash and Cash Equivalents, beginning of period
|
2,234
|
|
867
|
|
—
|
|
|||||
|
Cash and Cash Equivalents, end of period
|
$
|
2,459
|
|
$
|
2,234
|
|
$
|
867
|
|
||
|
Supplemental Disclosures:
|
|||||||||||
|
Cash payments for interest, net
|
$
|
(34,367
|
)
|
$
|
(16,432
|
)
|
$
|
(6,801
|
)
|
||
|
Schedule of Noncash Investing and Financing Activities:
|
|||||||||||
|
Property, plant and equipment acquired via the cash management agreement with TD
|
$
|
—
|
|
$
|
138,936
|
|
$
|
158,357
|
|
||
|
Contributions from noncontrolling interests settled via the cash management agreement with TD
|
$
|
—
|
|
$
|
68,277
|
|
$
|
—
|
|
||
|
Distributions to noncontrolling interests settled via the cash management agreement with TD
|
$
|
—
|
|
$
|
(69,017
|
)
|
$
|
(5,361
|
)
|
||
The accompanying notes are an integral part of these consolidated financial statements.
89
TALLGRASS ENERGY GP, LP
NOTES TO CONSOLIDATED FINANCIAL STATEMENTS
1. Description of Business
Tallgrass Energy GP, LP ("TEGP" or the "Partnership") is a limited partnership that has elected to be treated as a corporation for U.S. federal income tax purposes. TEGP was formed as part of the reorganization of entities controlled by Tallgrass Equity, LLC ("Tallgrass Equity") to effect the initial public offering of Class A shares of TEGP (the "TEGP IPO"), which was completed on May 12, 2015. Prior to closing the TEGP IPO, Tallgrass Equity held a
100%
membership interest in Tallgrass Energy Holdings, LLC ("Tallgrass Energy Holdings"). Tallgrass Energy Holdings, in turn, held a
100%
limited partner interest in TEGP and a
100%
membership interest in TEGP Management, LLC ("TEGP Management"), the general partner of TEGP.
In connection with the closing of the TEGP IPO on May 12, 2015, the following transactions (the "Reorganization Transactions") occurred:
|
•
|
Tallgrass Equity distributed its membership interest in Tallgrass Energy Holdings to its members, pro rata, and Tallgrass Energy Holdings distributed its
100%
limited partner interest in TEGP, respectively, to its members, pro rata, which are referred to as the "Exchange Right Holders";
|
|
•
|
TEGP issued
47,725,000
Class A shares to the public for net proceeds of approximately
$1.3 billion
, including
6,225,000
Class A shares issued in connection with the underwriters' exercise of the overallotment option;
|
|
•
|
The existing limited partner interests in TEGP held by the Exchange Right Holders were converted into
115,729,440
Class B shares,
6,225,000
of which were automatically canceled in connection with the underwriters' exercise of the overallotment option, resulting in the Exchange Right Holders owning
109,504,440
Class B shares;
|
|
•
|
Tallgrass Equity issued
41,500,000
Tallgrass Equity units to TEGP in exchange for approximately
$1.1 billion
in net proceeds from the issuance of TEGP's Class A shares to the public and amended the limited liability company agreement of Tallgrass Equity to, among other things, provide that TEGP is the managing member of Tallgrass Equity;
|
|
•
|
TEGP used the net proceeds from the purchase of the
6,225,000
overallotment option shares to purchase Tallgrass Equity units from the Exchange Right Holders; and
|
|
•
|
Tallgrass Equity entered into a
$150 million
revolving credit facility and borrowed
$150 million
thereunder, using the aggregate proceeds from such borrowings together with the net proceeds from the TEGP IPO that Tallgrass Equity received from TEGP, to purchase
20,000,000
common units, representing limited partner interests in Tallgrass Energy Partners, LP ("TEP"), from Tallgrass Development, LP ("TD") at
$47.68
per TEP common unit (the "Acquired TEP Units") and pay offering expenses and other transaction costs. Tallgrass Equity distributed substantially all of the remaining proceeds (the "Excess Proceeds") to the Exchange Right Holders.
|
TEGP's sole cash-generating asset as of
December 31, 2016
is an approximate
36.94%
controlling membership interest in Tallgrass Equity. Tallgrass Equity's sole cash-generating assets consist of direct and indirect partnership interests in TEP, as described below, that were historically owned by entities controlled by Tallgrass Equity, including TD:
|
•
|
100%
of the outstanding membership interests in Tallgrass MLP GP, LLC ("TEP GP"), which owns the general partner interest in TEP as well as all of the TEP incentive distribution rights ("IDRs"). The general partner interest in TEP is represented by
834,391
general partner units, representing an approximate
1.14%
general partner interest in TEP at
December 31, 2016
.
|
|
•
|
The Acquired TEP Units, representing an approximate
27.28%
limited partner interest in TEP at
December 31, 2016
.
|
The term "TEGP Predecessor" refers to TEGP, as recast to show the effects of the Reorganization Transactions, for the periods prior to completion of the TEGP IPO on May 12, 2015. "We," "us," "our" and similar terms refer to TEGP together with its consolidated subsidiaries or to TEGP Predecessor together with its consolidated subsidiaries, as the context requires, including, in both cases, Tallgrass Equity and TEP (and their respective subsidiaries).
TEP is a publicly traded, growth-oriented limited partnership formed to own, operate, acquire and develop midstream energy assets in North America. TEP's operations are located in and provide services to certain key United States hydrocarbon basins, including the Denver-Julesburg, Powder River, Wind River, Permian and Hugoton-Anadarko Basins and the Niobrara, Mississippi Lime, Eagle Ford, Bakken, Marcellus, and Utica shale formations. TEP's reportable business segments are:
|
•
|
Crude Oil Transportation & Logistics—the ownership and operation of a FERC-regulated crude oil pipeline system and crude oil storage and terminalling facilities;
|
|
•
|
Natural Gas Transportation & Logistics—the ownership and operation of FERC-regulated interstate natural gas pipelines and integrated natural gas storage facilities; and
|
90
|
•
|
Processing & Logistics—the ownership and operation of natural gas processing, treating and fractionation facilities, the provision of water business services primarily to the oil and gas exploration and production industry and the transportation of NGLs.
|
Crude Oil Transportation & Logistics.
TEP currently provides crude oil transportation to customers in Wyoming, Colorado, and the surrounding regions through Tallgrass Pony Express Pipeline, LLC ("Pony Express"), which owns a FERC-regulated crude oil pipeline commencing in Guernsey, Wyoming and terminating in Cushing, Oklahoma, which includes a lateral in Northeast Colorado commencing in Weld County, Colorado, and interconnecting with the pipeline just east of Sterling, Colorado (the "Pony Express System"). TEP also provides crude oil storage and terminalling services through TEP's
100%
membership interest in Tallgrass Terminals, LLC ("Terminals") acquired effective January 1, 2017, which owns and operates crude oil terminals near Sterling, Colorado (the "Sterling Terminal") and in Weld County, Colorado (the "Buckingham Terminal"). Terminals also owns a
20%
membership interest in Deeprock Development, LLC ("Deeprock Development"), which owns a crude oil terminal in Cushing, Oklahoma (the "Cushing Terminal").
Natural Gas Transportation & Logistics.
TEP provides natural gas transportation and storage services for customers in the Rocky Mountain, Midwest and Appalachian regions of the United States through: (1) its
25%
membership interest in Rockies Express Pipeline LLC ("Rockies Express"), which owns the Rockies Express Pipeline, a FERC-regulated natural gas pipeline system extending from Opal, Wyoming and Meeker, Colorado to Clarington, Ohio (the "Rockies Express Pipeline") and TEP's
100%
membership interest in Tallgrass NatGas Operator, LLC ("NatGas") acquired effective January 1, 2017, which operates the Rockies Express Pipeline, (2) the Tallgrass Interstate Gas Transmission system, a FERC-regulated natural gas transportation and storage system located in Colorado, Kansas, Missouri, Nebraska and Wyoming (the "TIGT System"), and (3) the Trailblazer Pipeline system, a FERC-regulated natural gas pipeline system extending from the Colorado and Wyoming border to Beatrice, Nebraska (the "Trailblazer Pipeline").
Processing & Logistics.
TEP also provide services for customers in Wyoming at the Casper and Douglas natural gas processing facilities and the West Frenchie Draw natural gas treating facility (collectively, the "Midstream Facilities"), and NGL transportation services in Northeast Colorado and Wyoming. TEP performs water business services, including freshwater transportation and produced water gathering and disposal, in Colorado and Texas through BNN Water Solutions, LLC ("Water Solutions").
2. Summary of Significant Accounting Policies
Basis of Presentation
The accompanying financial statements and related notes were prepared in accordance with the accounting principles contained in the Financial Accounting Standards Board's Accounting Standards Codification, the single source of generally accepted accounting principles in the United States of America ("GAAP"). In this report, the Financial Accounting Standards Board is referred to as the FASB and the FASB Accounting Standards Codification is referred to as the Codification or ASC. Certain prior period amounts have been reclassified to conform to the current presentation.
The accompanying consolidated financial statements of TEGP for periods prior to May 12, 2015 include historical cost basis accounts of the assets of TEGP and were prepared in contemplation of TEGP's initial public offering of Class A shares completed on May 12, 2015 and the acquisition of an approximately
30.35%
interest in Tallgrass Equity as described in
Note 1
–
Description of Business
, which was accounted for as a transaction between entities under common control in accordance with ASC 805. Significant intra-entity items have been eliminated in the presentation. Both TEGP and TEGP Predecessor are considered entities under common control and, as such, the transfer between the entities of the assets and liabilities has been recorded by TEGP at historical cost. TEGP, as used herein, refers to the consolidated financial results and operations for TEGP Predecessor prior to the completion of the TEGP IPO and to TEGP thereafter.
Net income or loss from consolidated subsidiaries that are not wholly-owned by TEGP is attributed to TEGP and noncontrolling interests. This is done in accordance with substantive profit sharing arrangements, which generally follow the allocation of cash distributions and may not follow the respective ownership percentages held by TEGP. Concurrent with TEP's acquisition of an initial
33.3%
membership interest in Pony Express effective September 1, 2014, TEP, TD, and Pony Express entered into the Second Amended and Restated Limited Liability Agreement of Tallgrass Pony Express Pipeline, LLC ("the Second Amended Pony Express LLC Agreement"), which provided TEP a minimum quarterly preference payment of
$16.65 million
(prorated to approximately
$5.4 million
for the quarter ended September 30, 2014) through the quarter ended September 30, 2015. Effective March 1, 2015 with TEP's acquisition of an additional
33.3%
membership interest in Pony Express, the Second Amended Pony Express LLC Agreement was further amended (as amended, "the Pony Express LLC Agreement") to increase the minimum quarterly preference payment to
$36.65 million
(prorated to approximately
$23.5 million
for the quarter ended March 31, 2015) and extend the term of the preference period through the quarter ended December 31, 2015. The Pony Express LLC Agreement provides that the net income or loss of Pony Express be allocated, to the extent possible, consistent with the allocation of Pony Express cash distributions. Under the terms of the Pony Express LLC
91
Agreement, Pony Express distributions and net income for periods beginning after December 31, 2015 are attributed to TEP and its noncontrolling interests in accordance with the respective ownership interests.
A variable interest entity ("VIE") is a legal entity that possesses any of the following characteristics: an insufficient amount of equity at risk to finance its activities, equity owners who do not have the power to direct the significant activities of the entity (or have voting rights that are disproportionate to their ownership interest), or equity owners who do not have the obligation to absorb expected losses or the right to receive the expected residual returns of the entity. Companies are required to consolidate a VIE if they are its primary beneficiary, which is the enterprise that has a variable interest that could be significant to the VIE and the power to direct the activities that most significantly impact the entity's economic performance. We have presented separately in our consolidated balance sheets, to the extent material, the liabilities of our consolidated VIEs for which creditors do not have recourse to our general credit. Our consolidated VIEs do not have material assets that can only be used to settle specific obligations of the consolidated VIEs. Tallgrass Equity is considered to be a VIE under the applicable authoritative guidance. Based on a qualitative analysis in accordance with the applicable authoritative guidance, we have determined that we are the primary beneficiary as we have the right to receive benefits of Tallgrass Equity that could potentially be significant to Tallgrass Equity. Also, as discussed further under "
New Accounting Pronouncements
" below, under the new authoritative guidance effective January 1, 2016, TEP is considered to be a VIE. Based on a qualitative analysis, we have determined that TEP GP is the primary beneficiary of TEP and we continue to consolidate TEP accordingly. Pony Express was considered to be a VIE under the applicable authoritative guidance prior to our acquisition of an additional
31.3%
membership interest effective January 1, 2016. Effective January 1, 2016, Pony Express is no longer considered to be a VIE. We continue to consolidate our membership interest in Pony Express.
Use of Estimates
Certain amounts included in or affecting these consolidated financial statements and related disclosures must be estimated, requiring management to make certain assumptions with respect to values or conditions which cannot be known with certainty at the time the financial statements are prepared. These estimates and assumptions affect the amounts reported for assets, liabilities, revenues, and expenses during the reporting period, and the disclosure of contingent assets and liabilities at the date of the financial statements. Management evaluates these estimates on an ongoing basis, utilizing historical experience, consultation with experts and other methods it considers reasonable in the particular circumstances. Nevertheless, actual results may differ significantly from these estimates. Any effects on our business, financial position or results of operations resulting from revisions to these estimates are recorded in the period in which the facts that give rise to the revision become known.
Cash and Cash Equivalents
We consider all highly liquid investments purchased with an original maturity of three months or less to be cash equivalents.
Net equity distributions of the Predecessor Entities included in the consolidated statements of cash flows represent transfers of cash as a result of TD's centralized cash management systems prior to April 1, 2014 for Trailblazer and September 1, 2014 for Pony Express, under which cash balances were swept daily and recorded as loans from the subsidiaries to TD. These loans were then periodically recorded as equity distributions.
Accounts Receivable and Allowance for Doubtful Accounts
Accounts receivable are carried at their estimated collectible amounts. We make periodic reviews and evaluations of the appropriateness of the allowance for doubtful accounts based on a historical analysis of uncollected amounts, and adjustments are recorded as necessary for changed circumstances and customer-specific information. When specific receivables are determined to be uncollectible, the reserve and receivable are relieved. Our allowance for doubtful accounts totaled
$0.6 million
at
December 31, 2016
and
2015
.
Inventories
Inventories primarily consist of gas in underground storage, materials and supplies, natural gas liquids and crude oil. Gas in underground storage, sometimes referred to as working gas, and natural gas liquids are recorded at the lower of historical cost or market using the average cost method. As discussed further under "
Revenue Recognition
" below, a loss allowance is factored into the crude oil tariffs to offset losses in transit. As crude oil is transported, we earn oil for our services as pipeline allowance oil, which we can then sell. As pipeline allowance oil is accumulated, it is recorded as inventory at the lower of historical cost or market using the average cost method. Materials and supplies are valued at weighted average cost and periodically reviewed for physical deterioration and obsolescence. For additional information, see "
Gas in Underground Storage
" below.
92
Accounting for Regulatory Activities
Regulated activities are accounted for in accordance with the "Regulated Operations" Topic of the Codification. This Topic prescribes the circumstances in which the application of GAAP is affected by the economic effects of regulation. Regulatory assets and liabilities represent probable future revenues or expenses associated with certain charges and credits that will be recovered from or refunded to customers through the ratemaking process. We recorded regulatory assets of approximately
$2.9 million
and
$2.8 million
included in "Deferred charges and other assets" in the consolidated balance sheets at
December 31, 2016
and
2015
, respectively. Regulatory assets at
December 31, 2016
and
December 31, 2015
were primarily attributable to costs associated with both TIGT's 2015 Rate Case Filing and Trailblazer's 2013 Rate Case Filing as well as fuel tracker assets at our regulated natural gas pipelines
.
We recorded regulatory liabilities of approximately
$1.7 million
and
$2.2 million
included in "Other current liabilities" in the consolidated balance sheet at
December 31, 2016
and
2015
, respectively, related to fuel tracker liabilities at our regulated natural gas pipelines. For further information regarding our rate case filings and fuel tracker balances, see
Note 18
–
Regulatory Matters
.
Property, Plant and Equipment
Property, plant and equipment is stated at historical cost, which for constructed plants includes indirect costs such as payroll taxes, other employee benefits, allowance for funds used during construction for regulated assets and other costs directly related to the projects. Expenditures that increase capacities, improve efficiencies or extend useful lives are capitalized and depreciated over the remaining useful life of the asset or major asset component. We also capitalize certain costs related to the construction of assets, including internal labor costs, interest and engineering costs.
Routine maintenance, repairs and renewal costs are expensed as incurred. The cost of normal retirements of the regulated depreciable utility property, plant and equipment, plus the cost of removal less salvage value and any gain or loss recognized, is recorded in accumulated depreciation and/or the negative salvage liability discussed under
"Depreciation and Amortization"
below, as appropriate, with no effect on current period earnings. Gains or losses are recognized upon retirement of non-regulated or regulated property, plant and equipment constituting an operating unit or system, and land, when sold or abandoned and costs of removal or salvage are expensed when incurred.
Intangible Assets
We account for intangible assets in accordance with ASC 805, which established that an intangible asset is identifiable if it meets either the separability criterion or the contractual-legal criterion. Further, in accordance with ASC 805, contract-based intangible assets represent the value of rights that arise from contractual arrangements. Use rights such as drilling, water, air, timber cutting, and route authorities are an example of contract-based intangible assets. Intangible assets arose at Pony Express from the acquisition of rights associated with the ability and regulatory permissions to convert a section of TIGT's natural gas pipeline, which was subsequently purchased by Pony Express, to crude oil and includes the operational and financial benefits that accrue due to those rights and the ability to make that asset more valuable ("the Pony Express oil conversion use rights"). These intangible assets are amortized on a straight-line basis over a period of
35 years
, the period of expected future benefit. Intangible assets arose at BNN Redtail, LLC ("Redtail") as a result of a significant customer contract with favorable market terms which was acquired as part of the Water Solutions transaction discussed in
Note 4
–
Acquisitions
.
This intangible asset was amortized on a straight-line basis over a period of
1.6 years
, the remaining term of the contract at the time of acquisition, and was fully amortized as of December 31, 2015.
Impairment of Long-Lived Assets
We review our long-lived assets for impairment whenever events or changes in circumstances indicate that the carrying amount of an asset or asset group may not be recoverable. An impairment loss results when the estimated undiscounted future net cash flows expected to result from the asset or asset group's use and its eventual disposition are less than its carrying amount. We assess our long-lived assets for impairment in accordance with the relevant Codification guidance. A long-lived asset or asset group is tested for impairment whenever events or changes in circumstances indicate its carrying amount may exceed its fair value.
Examples of long-lived asset impairment indicators include:
|
•
|
a significant decrease in the market value of a long-lived asset or asset group;
|
|
•
|
a significant adverse change in the extent or manner in which a long-lived asset or asset group is being used or in its physical condition;
|
|
•
|
a significant adverse change in legal factors or in the business climate could affect the value of long-lived asset or asset group, including an adverse action or assessment by a regulator which would exclude allowable costs from the rate-making process;
|
93
|
•
|
an accumulation of costs significantly in excess of the amount originally expected for the acquisition or construction of the long-lived asset or asset group;
|
|
•
|
a current period operating cash flow loss combined with a history of operating cash flow losses or a projection or forecast that demonstrates continuing losses associated with the use of a long-lived asset or asset group; and
|
|
•
|
a current expectation that, more likely than not, a long-lived asset or asset group will be sold or otherwise disposed of significantly before the end of its previously estimated useful life.
|
When an impairment indicator is present, we first assess the recoverability of the long-lived assets by comparing the sum of the undiscounted future cash flows expected to result from the use and eventual disposition of the asset or asset group to its carrying amount. If the carrying amount is higher than the undiscounted future cash flows, the fair value of the asset or asset group is assessed using a discounted cash flow analysis and used to determine the amount of impairment, if any, to be recognized.
Gas in Underground Storage
Gas in underground storage represents the cost of base gas, which refers to the volumes necessary to maintain pressure and deliverability requirements in our storage facilities. We record base gas as a component of property, plant and equipment.
We maintain working gas in our underground storage facilities on behalf of certain third parties. We receive a fee for our storage services but do not reflect the value of third-party gas in the accompanying consolidated financial statements. We occasionally acquire volumes of working gas for our own account. These volumes of working gas are recorded as natural gas inventory at the lower of cost or market.
Depreciation and Amortization
For non-regulated assets, we have elected to use the straight-line method of depreciation. For our regulated assets, we have elected to compute depreciation using a composite method employed by applying a single depreciation rate to a group of assets with similar economic characteristics. This composite method of depreciation approximates a straight-line method of depreciation. The depreciation rates for our regulated natural gas pipeline assets include two components, one based on economic service life (capital recovery) and one based on net costs of removal (negative salvage). The accumulated liability related to negative salvage is classified as "Other long-term liabilities and deferred credits" in our consolidated balance sheets.
The rates of depreciation for the various classes of depreciable assets are as follows:
|
Range of Depreciation Rates
|
|
|
Crude oil pipelines
|
2.8%
|
|
Natural gas pipelines
|
0.7 - 5.0%
|
|
Processing & treating assets
|
3.3%
|
|
Water business assets
|
2.3 - 20.0%
|
|
Replacement Gas Facilities
(1)
|
10.0%
|
|
General & other
|
2.9 - 25.0%
|
|
(1)
|
Represents the Replacement Gas Facilities as discussed in
Note 5
–
Related Party Transactions
and
Note 18
–
Regulatory Matters
.
|
Gas Imbalances
Gas imbalances receivable and payable represent the difference between customer nominations and actual gas receipts from and gas deliveries to interconnecting pipelines under various operational balancing and imbalance agreements. Gas imbalances are either made up in-kind or settled in cash, subject to the terms and valuations of the various agreements. Imbalances are valued at applicable average market index prices.
Deferred Financing Costs
Costs incurred in connection with the issuance of long-term debt are deferred and amortized over the related financing period using the effective interest method. Deferred financing costs associated with long-term debt are presented with the corresponding debt in our consolidated balance sheets. Deferred financing costs associated with our revolving credit facility are presented as noncurrent assets in our consolidated balance sheets.
94
Goodwill
We evaluate goodwill for impairment on an annual basis and whenever events or changes in circumstances necessitate an evaluation for impairment. Examples of such facts and circumstances include changes in the magnitude of the excess of fair value over carrying amount in the last valuation or changes in the business environment. Our annual impairment testing date is August 31. We evaluate goodwill for impairment at the reporting unit level, which is an operating segment as defined in the segment reporting guidance of the Codification, using either the qualitative assessment option or the two-step test approach depending on facts and circumstances of the reporting unit. If we, after performing the qualitative assessment, determine it is "more likely than not" that the fair value of a reporting unit is greater than its carrying amount, the two-step impairment test is unnecessary. When goodwill is evaluated for impairment using the two-step test, the carrying amount of the reporting unit is compared to its fair value in Step 1 and if the fair value exceeds the carrying amount, Step 2 is unnecessary. If the carrying amount exceeds the reporting unit's fair value, this could indicate potential impairment and Step 2 of the goodwill evaluation process is required to determine if goodwill is impaired and to measure the amount of impairment loss to recognize, if any. When Step 2 is necessary, the fair value of individual assets and liabilities is determined using valuations, or other observable sources of fair value, as appropriate. If the carrying amount of goodwill exceeds its implied fair value, the excess is recognized as an impairment loss. See
Note 8
–
Goodwill and Other Intangible Assets
for additional information regarding impairment testing performed during 2016.
Investment in Unconsolidated Affiliates
We use the equity method to account for investments in
20%
or greater owned affiliates that are not variable interest entities and where we do not have the ability to exercise control, and for investments in less than
20%
owned affiliates where we have the ability to exercise significant influence.
We evaluate our investments in unconsolidated affiliates for impairment whenever events or changes in circumstances indicate that the carrying value of such investments may have experienced a decline in value. When there is evidence of loss in value, we compare the estimated fair value of the investment to the carrying value of the investment to determine whether impairment has occurred. We assess the fair value of our investments in unconsolidated affiliates using commonly accepted techniques, and may use more than one method, including, but not limited to, recent third party comparable sales and discounted cash flow models. The difference between the carrying amount of the unconsolidated affiliates and their estimated fair value is recognized as an impairment loss when the loss in value is deemed to be other-than-temporary. See
Note 9
–
Investments in Unconsolidated Affiliates
for additional information regarding our investment in unconsolidated affiliates.
Revenue Recognition
We recognize revenues as services are rendered or goods are sold to a purchaser at a fixed and determinable price, delivery has occurred, title has transferred and collectability is reasonably assured. We provide various types of natural gas storage and transportation services and crude oil transportation services to our customers in which the commodity remains the property of these customers at all times.
Crude oil transportation services occur in the Crude Oil Transportation & Logistics segment. We provide various types of crude oil transportation services to our customers and, other than pipeline allowance oil, do not take title to the crude oil and do not incur the risks and rewards of ownership. In many cases the customer has committed to ship a fixed quantity of oil barrels per month. For barrels physically received by us and delivered to the customers' agreed upon destination point, revenue is recognized in the period the service is provided. Shipper deficiencies, or barrels committed by the customer to be transported in a month but not physically received by us for transport or delivered to the customers' agreed upon destination point, are charged at the committed tariff rate per barrel and recorded as a liability until the barrels are physically transported and delivered. In the case of non-committed shippers, revenue is recognized in the same manner utilized for the barrels physically transported and delivered. A loss allowance is factored into the crude oil tariffs to offset losses in transit. As crude oil is transported, we earn oil for our services as pipeline allowance oil. Any pipeline allowance oil that remains after replacing losses in transit can be sold. We take title and record revenue at market prices when the volumes included in the pipeline loss allowance are delivered from the customer. When pipeline loss allowance oil is eventually sold, we record revenue at the contractual sales price and cost of sales at average cost as discussed in
"Inventories"
above.
Natural gas transportation and storage services occur in the Natural Gas Transportation & Logistics segment. In many cases (generally described as "firm service"), the customer pays a two-part rate that includes (i) a fee reserving the right to transport or store natural gas in our facilities and (ii) a per-unit rate for volumes actually transported or injected into/withdrawn from storage. The fee-based component of the overall rate is recognized as revenue in the period the service is provided. The per-unit charge is recognized as revenue when the volumes are delivered to the customers' agreed upon delivery point, or when the volumes are injected into/withdrawn from our storage facilities. In other cases (generally described as "interruptible service"), there is no fixed fee associated with the services because the customer accepts the possibility that service may be interrupted at our discretion in order to serve customers who have purchased firm service. In the case of interruptible service, revenue is recognized in the same manner utilized for the per-unit rate for volumes actually transported under firm service
95
agreements. In addition to "firm" and "interruptible" transportation services, we also provide natural gas park and loan services to assist customers in managing short-term gas surpluses or deficits. Revenues are recognized as services are provided, based on the terms negotiated under these contracts.
Natural gas liquids sales occur in the Processing & Logistics segment and consist of the sale of outputs from our processing plants and the marketing of natural gas liquids that are delivered by our suppliers under either fee-based arrangements or percent-of-proceeds arrangements. Under these arrangements, we treat and process the natural gas delivered by our suppliers, and then sell the resulting NGLs and condensate based on published index market prices. We remit to the producers an agreed-upon percentage of the actual proceeds that we receive from our sales of the NGLs and condensate. We keep the difference between the proceeds received and the amount remitted back to the producer. We generally report gross revenues in the consolidated statements of income, as we typically act as the principal in these transactions, take custody of the product, and incur the risks and rewards of ownership. Processing and other revenues primarily represent fees for processing, treating and fractionation of natural gas and NGLs earned under fee-based arrangements and revenue from water services earned in the Processing & Logistics segment.
Natural gas sales occur in both the Natural Gas Transportation & Logistics segment and in the Processing & Logistics segment. In the Natural Gas Transportation & Logistics segment, transportation services revenue is recognized when a portion of the natural gas transported by customers is collected as a contractual fee to compensate us for fuel consumed by pipeline and storage operations. We take title and record revenue at market prices when the volumes included in the contractual fee are delivered from the customer and injected into our storage facility. When the excess volumes are eventually sold, we record natural gas sales revenue at the contractual sales price and cost of sales at average cost. In addition, when operational conditions allow, we occasionally sell "base gas," which refers to the minimum volume of natural gas required in order to operate the storage facility. In the Processing & Logistics segment, we purchase natural gas primarily for use in our operations and for meeting contractual requirements to deliver natural gas to certain customers. In addition, some of our contractual arrangements allow us to keep a portion of the processed natural gas as compensation for processing services. We generate revenue by selling the volumes of natural gas received or purchased that exceed our business needs.
Commitments and Contingencies
We recognize liabilities for other commitments and contingencies when, after fully analyzing the available information, we determine it is probable that a liability has been incurred and the amount of loss can be reasonably estimated. When a range of probable loss can be estimated, we accrue the most likely amount, or if no amount is more likely than another, we accrue the minimum of the range of probable loss.
Environmental Costs
We expense or capitalize, as appropriate, environmental expenditures that relate to current operations. We expense amounts that relate to an existing condition caused by past operations that do not contribute to current or future revenue generation. We do not discount environmental liabilities to a net present value, and record environmental liabilities when environmental assessments and/or remedial efforts are probable and costs can be reasonably estimated. Recording of these accruals coincides with the completion of a feasibility study or a commitment to a formal plan of action. Estimates of environmental liabilities are based on currently available facts and presently enacted laws and regulations taking into consideration the likely effects of other factors including our prior experience in remediating contaminated sites, other companies' clean-up experience and data released by government organizations. Our estimates are subject to revision in future periods based on actual cost or new information.
Fair Value
Fair value, as defined in the Codification, is the price that would be received to sell an asset or paid to transfer a liability in an orderly transaction between market participants at the measurement date, or exit price. We apply the fair value measurement guidance to financial assets and liabilities in determining the fair value of derivative assets and liabilities, and to nonfinancial assets and liabilities upon the acquisition of a business or in conjunction with the measurement of an impairment loss on an asset group or goodwill under the accounting guidance for the impairment of long-lived assets or goodwill.
The fair value measurement accounting guidance requires that we make assumptions that market participants would use in pricing an asset or liability based on the best information available. These factors include nonperformance risk (the risk that the obligation will not be fulfilled) and credit risk of the reporting entity (for liabilities) and of the counterparty (for assets). The fair value measurement guidance prohibits the inclusion of transaction costs and any adjustments for blockage factors in determining the instruments' fair value. The principal or most advantageous market should be considered from the perspective of the reporting entity.
96
Fair value, where available, is based on observable market prices. Where observable market prices or inputs are not available, different valuation models and techniques are applied. These models and techniques attempt to maximize the use of observable inputs and minimize the use of unobservable inputs. The process involves varying levels of management judgment, the degree of which is dependent on the price transparency of the instruments or market and the instruments' complexity.
To increase consistency and enhance disclosure of fair value, the Codification creates a fair value hierarchy to prioritize the inputs used to measure fair value into three categories. An asset or liability's level within the fair value hierarchy is based on the lowest level of input significant to the fair value measurement, where Level 1 is the highest and Level 3 is the lowest. The three levels are defined as follows:
|
•
|
Level 1 Inputs-quoted prices (unadjusted) in active markets for identical assets or liabilities that the reporting entity has the ability to access at the measurement date;
|
|
•
|
Level 2 Inputs-inputs other than quoted prices included within Level 1 that are observable for the asset or liability, either directly or indirectly. If the asset or liability has a specified (contractual) term, a Level 2 input must be observable for substantially the full term of the asset or liability; and
|
|
•
|
Level 3 Inputs-unobservable inputs for the asset or liability. These unobservable inputs reflect the entity's own assumptions about the assumptions that market participants would use in pricing the asset or liability, and are developed based on the best information available in the circumstances (which might include the reporting entity's own data).
|
Any transfers between levels within the fair value hierarchy are recognized at the end of the reporting period.
For information regarding financial instruments measured at fair value on a recurring basis, see
Note 10
–
Risk Management
. For information regarding the fair value of financial instruments not measured at fair value in the consolidated balance sheets, see
Note 11
–
Long-term Debt
.
Risk Management Activities
We utilize energy derivatives for the purpose of mitigating our risk resulting from fluctuations in the market price of crude oil and natural gas. We record derivative contracts at their estimated fair values as of each reporting date. For more information on our risk management activities, see
Note 10
–
Risk Management
.
Equity-Based Compensation
Equity-based compensation grants are measured at their grant date fair value and related compensation cost is recognized over the vesting period of the grant. Compensation cost for awards with graded vesting provisions is recognized on a straight-line basis over the requisite service period of each separately vesting portion of the award. As discussed in
Note 16
–
Equity-Based Compensation
, a portion of the expense recognized relating to equity-based compensation grants is charged to TD.
Income Taxes
Although TEGP is organized as a limited partnership, we have elected to be treated as a corporation for U.S. federal income tax purposes and are therefore subject to both U.S. federal and state income taxes for periods beginning May 12, 2015. Prior to the completion of the TEGP IPO on May 12, 2015, TEGP Predecessor was comprised primarily of limited liability companies that were flow-through entities (that is, partnerships or disregarded entities) for income tax purposes, with the exception of a single C corporation which did not generate any income. Accordingly, no provision for federal or state income taxes was recorded in the financial statements of TEGP Predecessor and the tax effects of our activities accrued to their respective partners and members for periods prior May 12, 2015. Subsequent to May 12, 2015, TEGP's consolidated subsidiaries consist primarily of entities that are flow-through entities for income tax purposes. On September 14, 2015, TEP, through its membership interest in Pony Express, formed a new C corporation, Tallgrass Colorado Pipeline, Inc. ("Tallgrass Colorado"), which is
99.8%
owned by Pony Express. The remaining
0.2%
interest in Tallgrass Colorado is held by direct and indirect wholly owned subsidiaries of TEP. Tallgrass Colorado was formed for the purpose of the potential construction of a lateral pipeline that would interconnect with the Pony Express System's existing lateral in Northeast Colorado and has not yet commenced operations or generated any income. In addition, during the year ended December 31, 2015, TEP formed Tallgrass Energy Finance Corp., a wholly owned subsidiary that has no material assets and was formed for the sole purpose of being a co-issuer of TEP's senior notes issued on September 1, 2016.
Deferred income taxes are provided for temporary differences arising from differences between the financial statement and tax basis of assets and liabilities existing at each balance sheet date using enacted tax rates expected to be in effect when the related taxes are expected to be paid or recovered. A valuation allowance is established if it is more likely than not that a deferred tax asset will not be realized. In determining the appropriate valuation allowance, we consider projected realization of tax benefits based on expected levels of future taxable income, available tax planning strategies, and our overall deferred tax position.
97
Pursuant to the applicable guidance related to accounting for uncertainty in income taxes, we must recognize the tax benefit from an uncertain tax position only if it is more likely than not that the tax position will be sustained upon examination by the taxing authorities, based on the technical merits of the tax position and also the past administrative practices and precedents of the taxing authority. As of
December 31, 2016
, we had not recognized any material amounts in connection with uncertainty in income taxes.
Accounting Pronouncements Not Yet Adopted
Revenue Recognition
In May 2014, the FASB issued Accounting Standards Update ("ASU") No. 2014-09, Revenue from Contracts with Customers (Topic 606). ASU 2014-09 provides a comprehensive and converged set of principles-based revenue recognition guidelines which supersede the existing industry and transaction-specific standards. The core principle of the new guidance is that an entity should recognize revenue to depict the transfer of promised goods or services to customers in an amount that reflects the consideration to which the entity expects to be entitled in exchange for those goods or services. To achieve this core principle, entities must apply a five-step process to (1) identify the contract with a customer; (2) identify the performance obligations in the contract; (3) determine the transaction price; (4) allocate the transaction price to the performance obligations in the contract; and (5) recognize revenue when (or as) the entity satisfies a performance obligation. ASU 2014-09 also mandates disclosure of sufficient information to enable users of financial statements to understand the nature, amount, timing and uncertainty of revenue and cash flows arising from contracts with customers. The disclosure requirements include qualitative and quantitative information about contracts with customers, significant judgments and changes in judgments, and assets recognized from the costs to obtain or fulfill a contract.
Throughout 2015 and 2016, the FASB has issued a series of subsequent updates to the revenue recognition guidance in Topic 606, including ASU No. 2015-14, Revenue from Contracts with Customers (Topic 606): Deferral of the Effective Date, ASU No. 2016-08, Revenue from Contracts with Customers (Topic 606): Principal versus Agent Considerations (Reporting Revenue Gross versus Net), ASU No. 2016-10, Revenue from Contracts with Customers (Topic 606): Identifying Performance Obligations and Licensing, ASU No. 2016-12, Revenue from Contracts with Customers (Topic 606): Narrow-Scope Improvements and Practical Expedients, and ASU No. 2016-20, Technical Corrections and Improvements to Topic 606, Revenue from Contracts with Customers.
The amendments in ASU 2014-09, ASU 2016-08, ASU 2016-10, ASU 2016-12, and ASU 2016-20 are effective for public entities for annual reporting periods beginning after December 15, 2017, and for interim periods within that reporting period. Early application is permitted for annual reporting periods beginning after December 15, 2016.
We are currently evaluating the impact of our pending adoption of the revised guidance. The status of our implementation is as follows:
|
•
|
We have formed an implementation team that meets to discuss implementation challenges, technical interpretations, industry-specific treatment of certain revenue contract types, and project status.
|
|
•
|
We are currently reviewing contracts for each revenue stream identified within each of our business segments. Through this process, we are determining and documenting expected changes in revenue recognition upon adoption of the revised guidance.
|
|
•
|
We plan to evaluate the potential information technology and internal control changes that will be required for adoption based on the findings from our contract review process.
|
|
•
|
We plan to provide internal training and awareness related to the revised guidance to the key stakeholders throughout our organization.
|
We will continue to conduct our contract review process throughout 2017 and, as a result, areas of impact may be identified. We are in the process of quantifying the impact of adoption but cannot reasonably estimate such amount at this time. We expect to adopt the new standard on January 1, 2018 using the modified retrospective approach. This approach allows us to apply the new standard to (i) all new contracts entered into after January 1, 2018 and (ii) all existing contracts for which all (or substantially all) of the revenue has not been recognized under legacy revenue guidance as of January 1, 2018 through a cumulative adjustment to equity. Consolidated revenues presented in our comparative financial statements for periods prior to January 1, 2018 would not be revised.
ASU No. 2016-02, "Leases (Topic 842)"
In February 2016, the FASB issued ASU No. 2016-02, Leases (Topic 842). ASU 2016-02 provides a comprehensive update to the lease accounting topic in the Codification intended to increase transparency and comparability among organizations by recognizing lease assets and lease liabilities on the balance sheet and disclosing key information about leasing arrangements.
98
The amendments in ASU 2016-02 include a revised definition of a lease as well as certain scope exceptions. The changes primarily impact lessee accounting, while lessor accounting is largely unchanged from previous GAAP.
The amendments in ASU 2016-02 are effective for public entities for annual reporting periods beginning after December 15, 2018, and for interim periods within that reporting period. Early application is permitted. We are currently evaluating the impact of ASU 2016-02.
ASU No. 2016-09, "Compensation - Stock Compensation (Topic 718): Improvements to Employee Share-Based Payment Accounting"
In March 2016, the FASB issued ASU No. 2016-09, Compensation - Stock Compensation (Topic 718): Improvements to Employee Share-Based Payment Accounting. ASU 2016-09 simplifies several aspects of the accounting for share-based payment transactions, including the income tax consequences, classification of awards as either equity or liabilities, and classification on the statement of cash flows. Among other changes, ASU 2016-09 allows an entity to make an entity-wide accounting policy election to either estimate the number of awards expected to vest (consistent with current GAAP) or account for forfeitures when they occur.
The amendments in ASU 2016-09 are effective for public entities for annual periods and interim periods within those annual periods beginning after December 15, 2016. Early adoption is permitted. We are currently evaluating the impact of ASU 2016-09, but do not anticipate a material impact on our consolidated financial statements.
ASU No. 2017-01, "Business Combinations (Topic 805): Clarifying the Definition of a Business"
In January 2017, the FASB issued ASU No. 2017-01, Business Combinations (Topic 805): Clarifying the Definition of a Business. ASU 2017-01 clarifies the definition of a business with the objective of adding guidance to assist entities with evaluating whether transactions should be accounted for as acquisitions (or disposals) of assets or businesses by providing a screen to determine when an integrated set of assets and activities is not a business. The screen requires that when substantially all of the fair value of the gross assets acquired (or disposed of) is concentrated in a single identifiable asset or a group of similar identifiable assets, the set is not a business. This screen reduces the number of transactions that need to be further evaluated. The ASU also narrows the definition of the term "output" so that the term is consistent with how outputs are described under the revenue recognition guidance in Topic 606.
The amendments in ASU 2017-01 are effective for public entities for annual periods and interim periods within those annual periods beginning after December 15, 2017. Early adoption is permitted in certain circumstances. We are currently evaluating the impact of ASU 2017-01, but do not anticipate a material impact on our consolidated financial statements.
ASU No. 2017-04, "Intangibles - Goodwill and Other (Topic 350): Simplifying the Test for Goodwill Impairment"
In January 2017, the FASB issued ASU No. 2017-04, which simplifies the subsequent measurement of goodwill by eliminating "Step 2" from the goodwill impairment test, which involved calculating the implied fair value of goodwill by determining the fair value at the impairment testing date of a reporting unit's assets and liabilities. Instead, under the simplified test approach, and entity should recognize an impairment charge for the amount by which the carrying amount exceeds the reporting unit's fair value; however, the loss recognized should not exceed the total amount of goodwill allocated to that reporting unit.
The amendments in ASU 2017-04 are effective for public entities for annual periods and interim periods within those annual periods beginning after December 15, 2019. Early adoption is permitted for interim or annual goodwill impairment tests performed on testing dates after January 1, 2017. We are currently evaluating the impact of ASU 2017-04.
Accounting Pronouncements Recently Adopted
ASU No. 2016-15, "Statement of Cash Flows (Topic 230), Classification of Certain Cash Receipts and Cash Payments"
In August 2016, the FASB issued ASU No. 2016-15, Statement of Cash Flows (Topic 230), Classification of Certain Cash Receipts and Cash Payments. ASU 2016-15 provides explicit guidance on accounting for eight specific cash flow issues with the objective of reducing diversity in practice, including debt prepayment or debt extinguishment costs, settlement of certain debt instruments, contingent consideration payments made after a business combination, proceeds from the settlement of insurance claims, proceeds from the settlement of corporate owned life insurance policies, distributions received from equity method investees, beneficial interests in securitization transactions and separately identifiable cash flows and application of the predominance principle.
The amendments in ASU 2016-15 are effective for public entities for fiscal years beginning after December 15, 2017, and interim periods within those fiscal years. Early adoption is permitted, including adoption in an interim period. During the third quarter of 2016, we adopted the standard on a retrospective basis for all periods presented. The adoption of ASU 2016-15 did not have a material impact on our financial position, results of operations, or cash flows.
99
ASU No. 2015-17, "Income Taxes (Topic 740): Balance Sheet Classification of Deferred Taxes"
In November 2015, the FASB issued ASU No. 2015-17, Income Taxes (Topic 740): Balance Sheet Classification of Deferred Taxes. ASU 2015-17 simplifies the presentation of deferred income taxes. The amendments in this update require that deferred tax liabilities and assets be classified as noncurrent in a classified statement of financial position.
The amendments in ASU 2015-17 were effective for financial statements issued for annual periods beginning after December 15, 2016, and interim periods within those annual periods. Earlier application is permitted for all entities as of the beginning of an interim or annual reporting period. The adoption of ASU 2015-17 did not have a material impact on our financial position and results of operations.
ASU No. 2015-16, "Business Combinations (Topic 805): Simplifying the Accounting for Measurement-Period Adjustments"
In September 2015, the FASB issued ASU No. 2015-16, Business Combinations (Topic 805): Simplifying the Accounting for Measurement-Period Adjustments. ASU 2015-16 simplifies the accounting for measurement-period adjustments for provisional amounts recognized in a business combination by eliminating the requirement for an acquirer to retrospectively account for measurement-period adjustments. Under the updated guidance, the acquirer must recognize adjustments in the reporting period in which the adjustment amounts are determined and the effect on earnings as a result of the change to the provisional amounts must be calculated as if the accounting had been completed at the acquisition date.
The amendments in ASU 2015-16 were effective for public entities for annual periods and interim periods within those annual periods beginning after December 15, 2015. The adoption of ASU 2015-16 did not have a material impact on our financial position and results of operations.
ASU No. 2015-02, "Consolidation (Topic 810): Amendments to the Consolidation Analysis"
In February 2015, the FASB issued ASU No. 2015-02, Consolidation (Topic 810) - Amendments to the Consolidation Analysis. ASU 2015-02 changes the analysis that a reporting entity must perform to determine whether it should consolidate certain types of legal entities. ASU 2015-02 modifies the evaluation of whether limited partnerships and other similar legal entities are considered VIEs or voting interest entities, eliminates the presumption that a general partner should consolidate a limited partnership, and changes certain aspects of the consolidation analysis for reporting entities that are involved with VIEs, particularly for those with fee arrangements and related party relationships.
The amendments in ASU 2015-02 were effective for public entities for annual periods and interim periods within those annual periods beginning after December 15, 2015. The adoption of ASU 2015-02 did not have a material impact on our financial position and results of operations.
ASU No. 2014-12, "Compensation - Stock Compensation (Topic 718), Accounting for Share-Based Payments When the Terms of an Award Provide That a Performance Target Could Be Achieved after the Requisite Service Period"
In June 2014, the FASB issued ASU No. 2014-12, Compensation - Stock Compensation (Topic 718), Accounting for Share-Based Payments When the Terms of an Award Provide That a Performance Target Could Be Achieved after the Requisite Service Period. ASU 2014-12 provides explicit guidance on accounting for share-based payments requiring a specific performance target to be achieved in order for employees to become eligible to vest in the awards when that performance target may be achieved after the requisite service period for the award. The ASU requires that such performance targets be treated as a performance condition, and should not be reflected in the estimate of the grant-date fair value of the award. Instead, compensation cost should be recognized in the period in which it becomes probable that the performance target will be achieved.
ASU 2014-12 was effective for annual periods and interim periods within those annual periods beginning after December 15, 2015. The adoption of ASU 2014-12 did not have a material impact on our financial position and results of operations.
3. Variable Interest Entities
As discussed in
Note 2
–
Summary of Significant Accounting Policies
,
upon adoption of the accounting guidance in ASU 2015-02 effective January 1, 2016, we determined that TEP is a VIE of which TEP GP, our consolidated subsidiary, is the primary beneficiary. We continue to consolidate TEP accordingly. We have not provided any additional financial support and have no contractual commitments or obligations to provide additional financial support to TEP.
TEGP, as the managing member of Tallgrass Equity, has voting rights disproportionate to its ownership interest. As a result, we have determined that Tallgrass Equity is a VIE of which we are the primary beneficiary and we consolidate Tallgrass Equity accordingly. We have not provided any additional financial support to Tallgrass Equity other than our initial capital contribution to acquire a portion of our controlling interest in Tallgrass Equity and have no contractual commitments or obligations to provide additional financial support to Tallgrass Equity.
100
We also consolidate Pony Express through our indirect ownership of TEP. Prior to January 1, 2016, Pony Express was considered to be a VIE as TEP did not have the obligation to absorb expected losses from Pony Express as a result of the minimum quarterly preference payments as discussed in
Note 4
–
Acquisitions
. In addition, for the period from our acquisition of the initial
33.3%
membership interest effective September 1, 2014 to our acquisition of an additional
33.3%
membership interest effective March 1, 2015, TEP, as the managing member of Pony Express, had voting rights disproportionate to its ownership interest. As a result, we determined that Pony Express was a VIE of which TEP was the primary beneficiary and consolidated Pony Express accordingly. As discussed in
Note 2
–
Summary of Significant Accounting Policies
, in conjunction with our acquisition of an additional
31.3%
membership interest effective January 1, 2016, Pony Express is no longer considered to be a VIE. We continue to consolidate our membership interest in Pony Express.
We have not provided any additional financial support to Pony Express other than TEP's initial capital contribution of
$570 million
and TEP's pro rata portion of expansion capital projects as discussed below, and have no contractual commitments or obligations to provide additional financial support. To the extent the costs of construction of the Pony Express System, including the lateral in Northeast Colorado, exceed the
$270 million
retained by Pony Express as discussed in
Note 4
–
Acquisitions
, TD is obligated to fund the remaining costs. As of December 31, 2015, the costs to complete construction exceeded the amount retained, and as such TD continued to fund remaining costs associated with construction of the mainline and lateral in Northeast Colorado. Although TEP has no obligation to provide further financial support to Pony Express, expansion capital projects are funded by TEP and TD on a pro rata basis in accordance with the Pony Express LLC Agreement. Contributions from TEP to Pony Express to fund expansion capital projects totaled
$4.4 million
for the year ended December 31, 2015.
Other than TEGP's deferred tax asset of approximately
$521.5 million
and
$452.4 million
at
December 31, 2016
and
December 31, 2015
, respectively, the assets and liabilities included in our consolidated balance sheets at
December 31, 2016
and
December 31, 2015
represent the consolidated assets and liabilities of Tallgrass Equity, including the assets and liabilities of TEP and Pony Express.
4. Acquisitions
TEP Acquisition of a
25%
Membership Interest in Rockies Express Pipeline LLC
On May 6, 2016, TD assigned TEP its right to purchase a
25%
membership interest in Rockies Express from a unit of Sempra U.S. Gas and Power ("Sempra") pursuant to the purchase agreement originally entered into between TD's wholly-owned subsidiary and Sempra in March 2016. Subsequently on May 6, 2016, TEP closed the purchase of a
25%
membership interest in Rockies Express from Sempra pursuant to the purchase agreement for cash consideration of approximately
$436.0 million
, after making the adjustments to the purchase price required by the purchase agreement. For additional information, see
Note 9
–
Investments in Unconsolidated Affiliates
.
TEP Acquisitions of
98%
of Pony Express
Effective September 1, 2014, TEP acquired a controlling
33.3%
membership interest in Pony Express for total consideration of approximately
$600 million
. At closing, Pony Express, TD, and TEP entered into the Second Amended Pony Express LLC Agreement, which set forth the relative rights of TD and TEP as the owners of Pony Express. Of the total consideration of
$600 million
, TEP directly paid TD
$30 million
, consisting of
$27 million
in cash and
70,340
TEP common units with an aggregate fair value of approximately
$3 million
, in exchange for the transfer by TD to TEP of a
1.9585%
membership interest in Pony Express (computed before giving effect to the issuance of the new membership interest by Pony Express to TEP). TEP also contributed cash of
$570 million
to Pony Express in exchange for a newly issued membership interest which, when combined with the membership interest transferred from TD and the parties' entry at closing into the Second Amended Pony Express LLC Agreement, constituted TEP's
33.3%
membership interest in Pony Express, which represented
100%
of the preferred membership units issued by Pony Express. Of the
$570 million
cash consideration received by Pony Express,
$300 million
was immediately distributed to TD at closing and
$270 million
was retained by Pony Express to fund the estimated remaining costs of construction for the Pony Express System and the lateral in Northeast Colorado. The
$270 million
cash balance was subsequently swept to TD under a cash management agreement between Pony Express and TD and was recorded as a related party loan which bears interest at TD's incremental borrowing rate. The related party loan was repaid in full in 2015.
The terms of TEP's first acquisition of a
33.3%
membership interest in Pony Express provided TEP a minimum quarterly preference payment of
$16.65 million
through the quarter ended September 30, 2015 (prorated to approximately
$5.4 million
for the quarter ended September 30, 2014) with distributions thereafter shared in accordance with the terms of the Second Amended Pony Express LLC Agreement. At the effective date of that transaction, TEP determined that Pony Express was a VIE of which TEP was the primary beneficiary, and consolidated Pony Express accordingly. For additional discussion and disclosure, see
Note 3
–
Variable Interest Entities
. The acquisition of the initial
33.3%
membership interest in Pony Express represented a transaction between entities under common control and a change in reporting entity.
101
Effective March 1, 2015, TEP acquired an additional
33.3%
membership interest in Pony Express for cash consideration of
$700 million
. At closing, Pony Express, TD, and TEP entered into the Pony Express LLC Agreement, which sets forth the relative rights of TD and TEP as the owners of Pony Express. The terms of the transaction increased the minimum quarterly preference payment provided to TEP to
$36.65 million
through the quarter ending December 31, 2015 (prorated to approximately
$23.5 million
for the quarter ended March 31, 2015) with distributions thereafter shared in accordance with the terms of the Pony Express LLC Agreement.
Upon the effective date of the second acquisition, TEP reevaluated its VIE assessment and determined that Pony Express continued to be considered a VIE of which TEP is the primary beneficiary. The acquisition of the additional
33.3%
membership interest in Pony Express represents a transaction between entities under common control and an acquisition of noncontrolling interests. As a result, financial information for periods prior to the transaction have not been recast to reflect the additional
33.3%
membership interest.
Effective January 1, 2016, TEP acquired an additional
31.3%
membership interest in Pony Express in exchange for cash consideration of
$475 million
and
6,518,000
TEP common units (valued at approximately
$268.6 million
based on the December 31, 2015 closing price of TEP's common units) issued to TD for total consideration of approximately
$743.6 million
. The transaction increased TEP's aggregate membership interest in Pony Express to
98%
. As part of the transaction, TD granted TEP an
18
-month call option covering the newly issued
6,518,000
common units at a price of
$42.50
. On the effective date of the acquisition, the call option was valued at
$46.0 million
. As discussed in
Note 10
–
Risk Management
,
in July 2016 and October 2016, TEP partially exercised the option covering
3,563,146
and
1,251,760
of the common units, respectively. On
February 1, 2017
, TEP exercised the remainder of the call option covering an additional
1,703,094
common units, leaving no remaining common units subject to the call option as of such date. As a result of the partial exercises in 2016, TEP derecognized a portion of the derivative asset balance, recognizing approximately
$34.0 million
through equity for
year ended December 31, 2016
, as discussed further in
Note 12
–
Partnership Equity and Distributions
.
The acquisition of the additional
31.3%
membership interest in Pony Express represents a transaction between entities under common control and an acquisition of noncontrolling interests. As a result, financial information for periods prior to the transaction has not been recast to reflect the additional
31.3%
membership interest.
Cash outflows to acquire an additional noncontrolling interest in Pony Express are classified as an investing activity in the accompanying consolidated statements of cash flows to the extent the consideration paid was used to directly fund the construction of the underlying assets by the noncontrolling member. Cash outflows to acquire an additional noncontrolling interest in excess of the cost to construct the underlying assets are classified as financing activities. For the
year ended December 31, 2016
,
$49.1 million
of the
$475 million
paid to acquire the additional
31.3%
membership interest in Pony Express was classified as an investing activity and
$425.9 million
was classified as a financing activity.
TEP Acquisition of BNN Western, LLC
On December 16, 2015, Whiting Oil and Gas Corporation ("Whiting"), Redtail, and BNN Western, LLC ("Western"), a newly formed Delaware limited liability company, entered into a definitive Transfer, Purchase and Sale Agreement, pursuant to which Redtail acquired
100%
of the outstanding membership interests of Western from Whiting in exchange for total cash consideration of
$75 million
. Western's assets consist of a fresh water delivery and storage system and produced water gathering and produced water disposal system, which together comprise
62
miles of pipeline along with associated fresh water ponds and disposal wells. As part of the transaction with Whiting, Whiting also executed a
five
-year fresh water service contract and a
nine
-year gathering and disposal contract, each of which commenced in December 2015.
At
December 31, 2015
, the assets acquired and liabilities assumed in the acquisition were recorded at provisional amounts based on the preliminary purchase price allocation. The
$75 million
purchase price of the assets was allocated entirely to property, plant and equipment. No adjustments were made to these provisional amounts and the allocation of assets acquired and liabilities assumed in the acquisition was considered final as of September 30, 2016.
Unaudited pro forma revenue and net income attributable to TEGP for the years ended December 31, 2015 and 2014 is presented below as if the acquisition of Western had been completed on January 1, 2014:
|
Year Ended December 31,
|
|||||||
|
2015
|
2014
|
||||||
|
(in thousands)
|
|||||||
|
Revenue
|
$
|
538,033
|
|
$
|
373,470
|
|
|
|
Net income attributable to TEGP
|
$
|
32,022
|
|
$
|
10,982
|
|
|
102
The pro forma financial information is not necessarily indicative of what the actual results of operations or financial position of TEGP would have been if the transactions had in fact occurred on the date or for the period indicated, nor do they purport to project the results of operations or financial position of TEGP for any future periods or as of any date. The pro forma financial information does not give effect to any cost savings, operating synergies, or revenue enhancements expected to result from the transactions or the costs to achieve these cost savings, operating synergies, and revenue enhancements. The pro forma revenue and net income includes adjustments to give effect to TEGP's consolidated interest in the estimated results of operations of Western for the periods presented.
TEP Acquisition of Trailblazer
On April 1, 2014, TEP closed the acquisition of Trailblazer from a wholly owned subsidiary of TD for total consideration valued at approximately
$164 million
, consisting of
$150 million
in cash and the issuance of
385,140
common units (valued at approximately
$14 million
based on the March 31, 2014 closing price of TEP's common units). On that same date, the general partner contributed additional capital in the amount of approximately
$263,000
in exchange for the issuance of
7,860
general partner units in order to maintain its
2%
general partner interest. The acquisition of Trailblazer represents a change in reporting entity and a transaction between entities under common control. The excess purchase price over the net book value of Trailblazer's assets and liabilities was accounted for as a deemed distribution as discussed further in
Note 12
–
Partnership Equity and Distributions
.
Formation of BNN Water Solutions, LLC
On November 26, 2013, TEP, through its wholly-owned subsidiary Tallgrass Energy Investments, LLC ("TEI"), entered into a joint venture agreement with BNN Energy LLC ("BNN") to form Grasslands Water Services I, LLC ("GWSI"), which subsequently built and began operating an intrastate fresh water pipeline in Colorado. TEP accounted for its
50%
equity interest in GWSI as an equity method investment. On May 13, 2014, TEI entered into a contribution agreement with BNN and several other parties to form a new entity known as Water Solutions. Under the terms of the contribution agreement, TEI agreed to contribute its existing
50%
interest in GWSI, along with
$7.6 million
cash, in exchange for an
80%
membership interest in Water Solutions. As part of the transaction, GWSI was renamed Redtail, became a subsidiary of Water Solutions, and issued preferred equity interests to TEI. Among the assets contributed by BNN and the other parties to the transaction were the other
50%
interest in Redtail and a
100%
equity interest in Alpha Reclaim Technology, LLC ("Alpha"), a company which sources treated wastewater from municipalities in Texas. Alpha is wholly-owned by Redtail.
Upon closing of the transaction, TEP obtained a controlling financial interest in Water Solutions and accordingly has accounted for the transaction as a step acquisition under ASC 805. On the acquisition date, TEP remeasured its previously held
50%
equity interest in Redtail to its fair value of
$11.9 million
, recognized a gain of
$9.4 million
, and consolidated Water Solutions. The
20%
equity interest in Water Solutions held by noncontrolling interests was recorded at its acquisition date fair value of
$1.4 million
. The fair values of the previously held equity interest and the noncontrolling interest were determined using a discounted cash flow analysis. These fair value measurements are based on significant inputs that are not observable in the market and thus represent fair value measurements categorized within Level 3 of the fair value hierarchy under ASC 820.
At December 31, 2014, the assets acquired and liabilities assumed in the acquisition were recorded at provisional amounts based on the preliminary purchase price allocation. During the three months ended June 30, 2015, the preliminary purchase price allocation with respect to Water Solutions was finalized with no material adjustments.
On May 20, 2015, TEP acquired an additional
12%
equity interest in Water Solutions from NR2, LLC for cash consideration of
$600,000
, which was accounted for as an acquisition of noncontrolling interest. On July 1, 2016, TEP acquired the remaining
8%
noncontrolling equity interest in Water Solutions and additional interests in certain of Water Solutions' subsidiaries from Regency Investments I, LLC and BSEG Water Group LLC for total cash consideration of
$6.0 million
, which was accounted for as an acquisition of noncontrolling interest. Subsequent to the closing of the transaction, our aggregate membership interest in Water Solutions is
100%
.
5. Related Party Transactions
As a result of our relationship with TD and its affiliates, we have entered into a number of related party transactions. The following disclosure includes those related party disclosures which are not otherwise disclosed in these notes to our consolidated financial statements.
We have no employees. Prior to TEP's initial public offering (the "TEP IPO") TD, through its wholly-owned subsidiary Tallgrass Operations, LLC ("Tallgrass Operations"), provided and charged us for direct and indirect costs of services provided to us or incurred on our behalf including employee labor costs, information technology services, employee health and retirement benefits, and all other expenses necessary or appropriate to the conduct of our business. We recorded these costs on the accrual basis in the period in which TD incurred them. On May 17, 2013, in connection with the closing of the TEP IPO, TEP and its general partner entered into an Omnibus Agreement with TD and certain of its affiliates, including Tallgrass
103
Operations (the "TEP Omnibus Agreement"). The TEP Omnibus Agreement provides that, among other things, TEP will reimburse TD and its affiliates for all expenses they incur and payments they make on TEP's behalf, including the costs of employee and director compensation and benefits as well as the cost of the provision of certain centralized corporate functions performed by TD, including legal, accounting, cash management, insurance administration and claims processing, risk management, health, safety and environmental, information technology and human resources in each case to the extent reasonably allocable to TEP. In addition, in connection with the closing of the TEGP IPO, TEGP entered into an Omnibus Agreement (the "TEGP Omnibus Agreement") with TEGP Management, LLC, Tallgrass Equity and Tallgrass Energy Holdings (which acts as the general partner of TD).
Pursuant to the TEGP Omnibus Agreement, Tallgrass Equity pays a reimbursement to TD for costs associated with TEGP being a public company beginning in the second quarter of 2015, which was
$2.0 million
for the
year ended December 31, 2016
. These amounts will be periodically reviewed and adjusted as necessary to continue to reflect reasonable allocation of costs to TEP and TEGP, respectively.
Due to the cash management agreement discussed in
Note 2
–
Summary of Significant Accounting Policies
, intercompany balances at the Predecessor Entities were periodically settled and treated as equity distributions prior to April 1, 2014 for Trailblazer and prior to September 1, 2014 for Pony Express. Balances lent to TD under the Pony Express cash management agreement effective September 1, 2014 are classified as related party receivables in the consolidated balance sheets. There was no interest income from TD recognized for the
year ended December 31, 2016
. During the
years ended December 31, 2015
and
2014
we recognized interest income from TD of
$0.4 million
and
$1.5 million
, respectively, on the receivable balance under the Pony Express cash management agreement in effect through December 31, 2015.
Totals of transactions with affiliated companies, excluding transactions otherwise disclosed, are as follows:
|
Year Ended December 31,
|
|||||||||||
|
2016
|
2015
|
2014
|
|||||||||
|
|
(in thousands)
|
||||||||||
|
Cost of transportation services
(1)
|
$
|
29,244
|
|
$
|
25,046
|
|
$
|
—
|
|
||
|
Charges to TEGP:
(2)
|
|||||||||||
|
Property, plant and equipment, net
|
$
|
2,741
|
|
$
|
4,320
|
|
$
|
17,936
|
|
||
|
Other deferred charges
|
$
|
44
|
|
$
|
7
|
|
$
|
27
|
|
||
|
Operation and maintenance
|
$
|
24,895
|
|
$
|
23,520
|
|
$
|
18,783
|
|
||
|
General and administrative
|
$
|
39,314
|
|
$
|
34,391
|
|
$
|
23,475
|
|
||
|
(1)
|
Reflects rent expense for the crude oil storage at the Sterling and Deeprock Terminals. For more information, see
Note 13
–
Commitments & Contingent Liabilities
.
|
|
(2)
|
Charges to TEGP, inclusive of Tallgrass Equity, TEP, and Pony Express, include directly charged wages and salaries, other compensation and benefits, and shared services
|
Details of balances with affiliates included in "Receivable from related parties" and "Accounts payable to related parties" in the consolidated balance sheets are as follows:
|
December 31, 2016
|
December 31, 2015
|
||||||
|
|
(in thousands)
|
||||||
|
Receivable from related parties:
|
|||||||
|
Rockies Express Pipeline LLC
|
$
|
560
|
|
$
|
15
|
|
|
|
Total receivable from related parties
|
$
|
560
|
|
$
|
15
|
|
|
|
Accounts payable to related parties:
|
|||||||
|
Tallgrass Operations, LLC
|
$
|
5,755
|
|
$
|
7,731
|
|
|
|
Deeprock Development, LLC
|
13
|
|
17
|
|
|||
|
Rockies Express Pipeline LLC
|
—
|
|
7
|
|
|||
|
Total accounts payable to related parties
|
$
|
5,768
|
|
|
$
|
7,755
|
|
104
Balances of gas imbalances with affiliated shippers are as follows:
|
December 31, 2016
|
December 31, 2015
|
||||||
|
|
(in thousands)
|
||||||
|
Affiliate gas imbalance receivables
|
$
|
177
|
|
$
|
92
|
|
|
|
Affiliate gas imbalance payables
|
$
|
—
|
|
$
|
227
|
|
|
Pursuant to the terms of a Purchase and Sale Agreement dated August 1, 2012, TD, through August 31, 2014, reimbursed TIGT for all costs TIGT incurred with respect to the Pony Express Abandonment, as defined in
Note 18
–
Regulatory Matters
, including, but not limited to, development costs, capital costs and related interest costs associated with the construction of certain gas facilities necessary to maintain existing natural gas service on the TIGT System (the "Replacement Gas Facilities"). The Replacement Gas Facilities are required as part of the Pony Express Abandonment in order for TIGT to continue service to existing customers after having sold approximately
433
miles of natural gas pipeline, and associated rights of way and certain other equipment, to Pony Express in 2013. For more information, see
Note 18
–
Regulatory Matters
. Any costs incurred by TIGT subsequent to August 31, 2014 are reimbursed directly by Pony Express.
TIGT's expenditures for the Replacement Gas Facilities are captured in "Prepayments and other current assets" in the consolidated balance sheets as they are incurred and interest is accrued until reimbursement takes place (which is typically monthly). During the year ended December 31, 2014 we received proceeds from TD of
$69.2 million
and incurred expenditures of
$41.7 million
. We recognized a contribution of
$27.5 million
from TD in our consolidated statement of equity which represents the difference between the carrying amount of the Replacement Gas Facilities and the proceeds received from TD. At December 31, 2016 and 2015, TEP had not incurred any expenditures for the Replacement Gas Facilities that had not been reimbursed.
6. Inventory
The components of inventory at
December 31, 2016
and
2015
consisted of the following:
|
December 31, 2016
|
December 31, 2015
|
||||||
|
|
(in thousands)
|
||||||
|
Crude oil
|
$
|
5,180
|
|
$
|
2,661
|
|
|
|
Materials and supplies
|
6,377
|
|
8,581
|
|
|||
|
Natural gas liquids
|
265
|
|
395
|
|
|||
|
Gas in underground storage
|
983
|
|
2,156
|
|
|||
|
Total inventory
|
$
|
12,805
|
|
$
|
13,793
|
|
|
7. Property, Plant and Equipment
A summary of net property, plant and equipment by classification is as follows:
|
December 31, 2016
|
December 31, 2015
|
||||||
|
|
(in thousands)
|
||||||
|
Crude oil pipelines
|
$
|
1,202,125
|
|
$
|
1,172,684
|
|
|
|
Natural gas pipelines
|
572,150
|
|
550,710
|
|
|||
|
Processing and treating assets
|
256,901
|
|
254,073
|
|
|||
|
Water business assets
|
85,077
|
|
81,098
|
|
|||
|
General and other
|
71,508
|
|
69,181
|
|
|||
|
Construction work in progress
|
18,228
|
|
30,699
|
|
|||
|
Accumulated depreciation and amortization
|
(193,726
|
)
|
(133,427
|
)
|
|||
|
Total property, plant and equipment, net
|
$
|
2,012,263
|
|
$
|
2,025,018
|
|
|
|
(1)
|
Property, plant and equipment, net includes approximately
$435.9 million
of assets at our regulated natural gas pipelines.
|
105
Depreciation expense was approximately
$81.9 million
,
$75.5 million
, and
$40.9 million
for the years ended
December 31, 2016
,
2015
, and
2014
, respectively. Capitalized interest was approximately
$0.6 million
,
$0.9 million
, and
$1.2 million
for the years ended
December 31, 2016
,
2015
, and
2014
, respectively.
Under a lease agreement effective October 3, 2015, Tallgrass Midstream, LLC ("TMID"), as lessor, leases capacity on an NGL pipeline that was constructed for a third party. Rental income was approximately
$3.2 million
and
$0.8 million
for the years ended
December 31, 2016
and
2015
, respectively, and was recorded as "Processing and other revenues" in the accompanying consolidated statements of income. Under a lease agreement initially effective November 13, 2012, TIGT, as lessor, leases a portion of its office space to a third party. Rental income was approximately
$0.8 million
,
$0.8 million
, and
$1.0 million
for the
years ended December 31, 2016
,
2015
, and
2014
, respectively, and was recorded as "Other income, net" in the accompanying consolidated statements of income.
As of
December 31, 2016
, future minimum rental income under non-cancelable operating leases as the lessor were as follows (in thousands):
|
Year
|
Total
|
|||
|
2017
|
$
|
3,967
|
|
|
|
2018
|
3,982
|
|
||
|
2019
|
3,997
|
|
||
|
2020
|
3,385
|
|
||
|
2021
|
3,180
|
|
||
|
Thereafter
|
11,934
|
|
||
|
Total
|
$
|
30,445
|
|
|
8. Goodwill and Other Intangible Assets
Reconciliation of Goodwill
There were no changes in goodwill for the
years ended December 31, 2016
and
2015
. The following table presents the carrying amount of goodwill by segment for the periods indicated:
|
December 31, 2016
|
December 31, 2015
|
||||||
|
|
(in thousands)
|
||||||
|
Natural Gas Transportation & Logistics
|
$
|
255,558
|
|
$
|
255,558
|
|
|
|
Processing & Logistics
|
87,730
|
|
87,730
|
|
|||
|
Total goodwill
|
$
|
343,288
|
|
$
|
343,288
|
|
|
Annual Goodwill Impairment Analysis
We did not elect to apply the qualitative assessment option during our
2016
annual goodwill impairment testing; instead we proceeded directly to the two-step quantitative test. In Step 1 of the two-step quantitative test, we compared the fair value of each reporting unit with its respective book value, including goodwill, by using an income approach based on a discounted cash flow analysis. For the purpose of goodwill impairment testing, goodwill was allocated to our reporting units based on the enterprise value of each reporting unit at the date of acquisition. The fair value of each reporting unit was determined on a stand-alone basis from the perspective of a market participant and included a sensitivity analysis of the impact of changes in various assumptions. This approach required us to make long-term forecasts of future operating results and various other assumptions and estimates, the most significant of which are gross margin, operating expenses, general and administrative expenses, long-term growth rates and the weighted average cost of capital. The fair value of the reporting units was determined using significant unobservable inputs, considered Level 3 under the fair value hierarchy in the Codification. For each reporting unit, the results of the Step 1 impairment analysis indicated no potential impairment as the fair value of the reporting units was greater than their respective book values. As a result, in accordance with the Codification guidance, Step 2 of the impairment analysis was not necessary as part of the annual impairment analysis in
2016
.
106
Other Intangible Assets
A summary of amortized intangible assets is as follows:
|
December 31, 2016
|
December 31, 2015
|
||||||
|
|
(in thousands)
|
||||||
|
Pony Express oil conversion use rights
|
$
|
105,973
|
|
$
|
105,973
|
|
|
|
Accumulated amortization
|
(12,451
|
)
|
(9,427
|
)
|
|||
|
Intangible assets, net
|
$
|
93,522
|
|
$
|
96,546
|
|
|
Amortization of intangible assets was approximately
$3.0 million
,
$8.0 million
, and
$6.2 million
for the
years ended December 31, 2016
,
2015
, and
2014
, respectively. As discussed in
Note 2
–
Summary of Significant Accounting Policies
,
the Redtail customer contract was fully amortized as of December 31, 2015.
Estimated future amortization for the intangible asset is as follows (in thousands):
|
Year
|
Total
|
|||
|
2017
|
$
|
3,028
|
|
|
|
2018
|
3,028
|
|
||
|
2019
|
3,028
|
|
||
|
2020
|
3,028
|
|
||
|
2021
|
3,028
|
|
||
|
Thereafter
|
78,382
|
|
||
|
Total
|
$
|
93,522
|
|
|
9. Investments in Unconsolidated Affiliates
Rockies Express
Our investment in Rockies Express is recorded under the equity method of accounting and reported as "Unconsolidated investment" on our consolidated balance sheets. As of May 6, 2016, the difference between the fair value of our investment in Rockies Express of
$436.0 million
and the book value of the underlying net assets of approximately
$840.7 million
resulted in a negative basis difference of approximately
$404.7 million
. The basis difference was allocated to property, plant and equipment and long-term debt based on their respective fair values at the date of acquisition. The amount of the basis difference allocated to property, plant and equipment is accreted over
35 years
, which equates to the
2.86%
composite depreciation rate utilized by Rockies Express to depreciate the underlying property, plant and equipment. The amount allocated to long-term debt is amortized over the remaining life of the various debt facilities. The basis difference at
December 31, 2016
was allocated as follows:
|
Basis Difference
|
Amortization Period
|
||||
|
|
(in thousands)
|
||||
|
Long-term debt
|
$
|
8,421
|
|
2 - 25 years
|
|
|
Property, plant and equipment
|
(404,046
|
)
|
35 years
|
||
|
Total basis difference
|
$
|
(395,625
|
)
|
||
During the period from May 6, 2016 to
December 31, 2016
, we recognized equity in earnings from Rockies Express of
$51.8 million
, inclusive of the amortization of the negative basis difference discussed above, and received distributions from and made contributions to Rockies Express of
$75.9 million
and
$50.0 million
, respectively.
107
Summarized financial information for Rockies Express is as follows:
|
December 31, 2016
|
|||
|
|
(in thousands)
|
||
|
Current assets
|
$
|
195,698
|
|
|
Noncurrent assets
|
$
|
6,079,292
|
|
|
Current liabilities
|
$
|
188,139
|
|
|
Noncurrent liabilities
|
$
|
2,656,836
|
|
|
Members' equity
|
$
|
3,430,015
|
|
|
Period from May 6, 2016 to December 31, 2016
|
|||
|
|
|||
|
Revenue
|
$
|
421,324
|
|
|
Operating income
|
$
|
190,050
|
|
|
Net income to Members
|
$
|
170,562
|
|
GWSI
Our investment in GWSI, which owns a fresh water transportation pipeline, was initially recorded under the equity method of accounting as we had the ability to exercise significant influence, but not control, over this investment. There was
$0.7 million
equity in earnings recognized for the year ended December 31, 2014. There was no equity in earnings recognized for the years ended December 31, 2015 and 2016. As discussed in
Note 4
–
Acquisitions
, during the year ended December 31, 2014, TEP acquired a controlling interest in GWSI, which was subsequently renamed Redtail, and consolidated its investment in Redtail as of May 13, 2014 accordingly.
10. Risk Management
We occasionally enter into derivative contracts with third parties for the purpose of hedging exposures that accompany our normal business activities. Our normal business activities directly and indirectly expose us to risks associated with changes in the market price of crude oil and natural gas, among other commodities. For example, the risks associated with changes in the market price of crude oil and natural gas include, among others (i) pre-existing or anticipated physical crude oil and natural gas sales, (ii) natural gas purchases and (iii) natural gas system use and storage. We have elected not to apply hedge accounting and changes in the fair value of all derivative contracts are recorded in earnings in the period in which the change occurs.
Fair Value of Derivative Contracts
The following table summarizes the fair values of our derivative contracts included in the consolidated balance sheets:
|
Balance Sheet
Location |
December 31, 2016
|
December 31, 2015
|
|||||||
|
|
|
(in thousands)
|
|||||||
|
Call option derivative
(1)
|
Current assets
|
$
|
10,676
|
|
$
|
—
|
|
||
|
Natural gas derivative contracts
(2)
|
Current assets
|
$
|
291
|
|
$
|
—
|
|
||
|
Natural gas derivative contracts
(2)
|
Current liabilities
|
$
|
116
|
|
$
|
—
|
|
||
|
Crude oil derivative contract
(3)
|
Current liabilities
|
$
|
440
|
|
$
|
—
|
|
||
|
(1)
|
As discussed in
Note 4
–
Acquisitions
, in conjunction with TEP's acquisition of an additional
31.3%
membership interest in Pony Express effective January 1, 2016, TD granted TEP an
18
-month call option covering the
6,518,000
common units issued to TD. As of February 1, 2017, no common units remained subject to the call option.
|
|
(2)
|
As of
December 31, 2016
, the fair value shown for natural gas derivative contracts was comprised of derivative volumes for short and long natural gas fixed-price swaps totaling
0.3
Bcf and
0.4
Bcf, respectively. As of
December 31, 2015
, there were no natural gas derivative contracts outstanding.
|
|
(3)
|
As of
December 31, 2016
, the fair value shown for crude oil derivative contracts was comprised of derivative contracts representing the sale of
125,000
barrels throughout 2017. As of
December 31, 2015
, there were no crude oil derivative contracts outstanding.
|
108
Effect of Derivative Contracts in the Statements of Income
The following table summarizes the impact of derivative contracts for the
years ended December 31, 2016
,
2015
and
2014
:
|
Location of
gain (loss) recognized in income on derivatives |
Amount of gain (loss) recognized in income on derivatives
|
||||||||||||
|
|
Year Ended December 31,
|
||||||||||||
|
2016
|
2015
|
2014
|
|||||||||||
|
|
|
(in thousands)
|
|||||||||||
|
Derivatives not designated as hedging contracts:
|
|||||||||||||
|
Call option derivative
|
Unrealized loss on derivative instrument
|
$
|
(1,291
|
)
|
$
|
—
|
|
$
|
—
|
|
|||
|
Natural gas derivative contracts
|
Sales of natural gas, NGLs, and crude oil
|
$
|
74
|
|
$
|
427
|
|
$
|
(410
|
)
|
|||
|
Crude oil derivative contract
|
Sales of natural gas, NGLs, and crude oil
|
$
|
(40
|
)
|
$
|
—
|
|
$
|
—
|
|
|||
Exercise of Call Option
In July 2016 and October 2016, TEP partially exercised the call option granted by TD in January 2016 as discussed in
Note 4
–
Acquisitions
covering
3,563,146
and
1,251,760
common units, respectively, for cash payments of
$151.4 million
and
$53.2 million
, respectively. On
February 1, 2017
, TEP exercised the remainder of the call option covering an additional
1,703,094
common units for a cash payment of
$72.4 million
. These common units were deemed canceled upon the exercise of the call option and as of such exercise date were no longer issued and outstanding. As of February 1, 2017, no common units remained subject to the call option.
Credit Risk
We have counterparty credit risk as a result of our use of derivative contracts. Counterparties to our crude oil and natural gas derivatives consist of major financial institutions. This concentration of counterparties may impact our overall exposure to credit risk, either positively or negatively, in that the counterparties may be similarly affected by changes in economic, regulatory or other conditions. The counterparty to our call option derivative was TD.
Our over-the-counter swaps are entered into with counterparties outside central trading organizations such as futures, options or stock exchanges. These contracts are with financial institutions with investment grade credit ratings. While we enter into derivative transactions principally with investment grade counterparties and actively monitor their credit ratings, it is nevertheless possible that from time to time losses will result from counterparty credit risk in the future. As of
December 31, 2016
, the fair value of our crude oil and short natural gas derivative contracts were a liability, resulting in no credit exposure from TEP's counterparties as of that date. The maximum potential exposure to credit losses on our long natural gas derivative contract at
December 31, 2016
was:
|
Asset Position
|
|||
|
(in thousands)
|
|||
|
Gross
|
$
|
291
|
|
|
Netting agreement impact
|
(58
|
)
|
|
|
Cash collateral held
|
—
|
|
|
|
Net Exposure
|
$
|
233
|
|
As of
December 31, 2016
and
2015
, we did not have any outstanding letters of credit or cash in margin accounts in support of our hedging of commodity price risks associated with the sale of natural gas nor did we have any margin deposits with counterparties associated with natural gas contract positions.
Fair Value
Derivative assets and liabilities are measured and reported at fair value. Derivative contracts can be exchange-traded or over-the-counter ("OTC"). Exchange-traded derivative contracts typically fall within Level 1 of the fair value hierarchy if they are traded in an active market. We value exchange-traded derivative contracts using quoted market prices for identical securities.
109
OTC commodity derivatives are valued using models utilizing a variety of inputs including contractual terms and commodity and interest rate curves. The selection of a particular model and particular inputs to value an OTC derivative contract depends upon the contractual terms of the instrument as well as the availability of pricing information in the market. We use similar models to value similar instruments. For OTC derivative contracts that trade in liquid markets, such as generic forwards and swaps, model inputs can generally be verified and model selection does not involve significant management judgment. Such contracts are typically classified within Level 2 of the fair value hierarchy. The call option granted by TD is valued using a Black-Scholes option pricing model. Key inputs to the valuation model include the term of the option, risk free rate, the exercise price and current market price, expected volatility and expected distribution yield of the underlying units. The call option valuation is classified within Level 2 of the fair value hierarchy as the value is based on significant observable inputs.
Certain OTC derivative contracts trade in less liquid markets with limited pricing information; as such, the determination of fair value for these derivative contracts is inherently more difficult. Such contracts are classified within Level 3 of the fair value hierarchy. The valuations of these less liquid OTC derivatives are typically impacted by Level 1 and/or Level 2 inputs that can be observed in the market, as well as unobservable Level 3 inputs. Use of a different valuation model or different valuation input values could produce a significantly different estimate of fair value. However, derivative contracts valued using inputs unobservable in active markets are generally not material to our financial statements. When appropriate, valuations are adjusted for various factors including credit considerations. Such adjustments are generally based on available market evidence. In the absence of such evidence, management's best estimate is used.
The following table summarizes the fair value measurements of our derivative contracts as of
December 31, 2016
, based on the fair value hierarchy established by the Codification:
|
|
|
Asset Fair Value Measurements Using
|
|||||||||||||
|
|
Total
|
Quoted prices in
active markets for identical assets (Level 1) |
Significant
other observable inputs (Level 2) |
Significant
unobservable inputs (Level 3) |
|||||||||||
|
|
(in thousands)
|
||||||||||||||
|
As of December 31, 2016
|
|||||||||||||||
|
Call option derivative
|
$
|
10,676
|
|
$
|
—
|
|
$
|
10,676
|
|
$
|
—
|
|
|||
|
Natural gas derivative contracts
|
$
|
291
|
|
$
|
—
|
|
$
|
291
|
|
$
|
—
|
|
|||
|
|
Liability Fair Value Measurements Using
|
||||||||||||||
|
|
Total
|
Quoted prices in
active markets for identical assets (Level 1) |
Significant
other observable inputs (Level 2) |
Significant
unobservable inputs (Level 3) |
|||||||||||
|
|
(in thousands)
|
||||||||||||||
|
As of December 31, 2016
|
|||||||||||||||
|
Crude oil derivative contract
|
$
|
440
|
|
$
|
—
|
|
$
|
440
|
|
$
|
—
|
|
|||
|
Natural gas derivative contracts
|
$
|
116
|
|
$
|
—
|
|
$
|
116
|
|
$
|
—
|
|
|||
110
Long-term debt consisted of the following at
December 31, 2016
and
2015
:
|
December 31, 2016
|
December 31, 2015
|
||||||
|
(in thousands)
|
|||||||
|
Tallgrass Equity revolving credit facility
|
$
|
148,000
|
|
$
|
148,000
|
|
|
|
TEP revolving credit facility
|
1,015,000
|
|
753,000
|
|
|||
|
TEP 5.50% senior notes due September 15, 2024
|
400,000
|
|
—
|
|
|||
|
Less: Deferred financing costs, net
(1)
|
(7,019
|
)
|
—
|
|
|||
|
Total long-term debt, net
|
$
|
1,555,981
|
|
$
|
901,000
|
|
|
|
(1)
|
Deferred financing costs, net as presented above relate solely to the 2024 Notes. Deferred financing costs associated with our revolving credit facility are presented in noncurrent assets on our consolidated balance sheets.
|
TEP Senior Unsecured Notes
On September 1, 2016, TEP and Tallgrass Energy Finance Corp. (the "Co-Issuer" and together with TEP, the "Issuers"), the Guarantors named therein and U.S. Bank, National Association, as trustee, entered into an Indenture dated September 1, 2016 (the "Indenture"), pursuant to which the Issuers issued
$400 million
in aggregate principal amount of
5.50%
senior notes due 2024 (the "2024 Notes"). TEP used the net proceeds of the issuance to repay outstanding borrowings under its existing revolving credit facility.
The 2024 Notes are general unsecured senior obligations of the Issuers. The 2024 Notes are unconditionally guaranteed jointly and severally on a senior unsecured basis by TEP's existing direct and indirect wholly owned subsidiaries (other than the Co-Issuer) and certain of TEP's future subsidiaries (the "Guarantors"). The 2024 Notes rank equal in right of payment with all existing and future senior indebtedness of the Issuers, and senior in right of payment to any future subordinated indebtedness of the Issuers. The 2024 Notes will mature on September 15, 2024 and interest on the 2024 Notes is payable in cash semi-annually in arrears on each March 15 and September 15, commencing March 15, 2017. TEP may redeem the 2024 Notes prior to their scheduled maturity at the applicable redemption price set forth in the Indenture, plus accrued and unpaid interest.
The Indenture contains covenants that, among other things, limit TEP's ability and the ability of its restricted subsidiaries to: (i) incur, assume or guarantee additional indebtedness or issue preferred units; (ii) create liens to secure indebtedness; (iii) pay distributions on equity interests, repurchase equity securities or redeem subordinated securities; (iv) make investments; (v) restrict distributions, loans or other asset transfers from TEP's restricted subsidiaries; (vi) consolidate with or merge with or into, or sell substantially all of TEP's properties to, another person; (vii) sell or otherwise dispose of assets, including equity interests in subsidiaries; and (viii) enter into transactions with affiliates. As of
December 31, 2016
, the Issuers and Guarantors are in compliance with the covenants required under the 2024 Notes.
Tallgrass Equity Revolving Credit Facility
The following table sets forth the available borrowing capacity under the Tallgrass Equity revolving credit facility as of
December 31, 2016
and
2015
:
|
December 31, 2016
|
December 31, 2015
|
||||||
|
|
(in thousands)
|
||||||
|
Total capacity under the Tallgrass Equity revolving credit facility
|
$
|
150,000
|
|
$
|
150,000
|
|
|
|
Less: Outstanding borrowings under the Tallgrass Equity revolving credit facility
|
(148,000
|
)
|
(148,000
|
)
|
|||
|
Available capacity under the Tallgrass Equity revolving credit facility
|
$
|
2,000
|
|
$
|
2,000
|
|
|
In connection with the TEGP IPO, Tallgrass Equity entered into a
$150 million
senior secured revolving credit facility with Barclays Bank PLC, as administrative agent, and a syndicate of lenders, which will mature on May 12, 2020. The Tallgrass Equity credit facility includes a
$10 million
sublimit for letters of credit and a
$10 million
sublimit for swing line loans. The Tallgrass Equity revolving credit facility also contains an accordion feature whereby Tallgrass Equity can increase the size of the credit facility to an aggregate of
$200 million
, subject to receiving increased or new commitments from lenders and the satisfaction of certain other conditions precedent. Among various other covenants and restrictive provisions, Tallgrass Equity is required to maintain a total leverage ratio of not more than
3.00
to 1.00. As of
December 31, 2016
, Tallgrass Equity was in compliance with the covenants required under the revolving credit facility.
111
Tallgrass Equity's obligations under the revolving credit facility are secured by a first priority lien on all of the present and after acquired equity interests held by Tallgrass Equity in TEP GP and TEP. Borrowings under the credit facility bear interest, at Tallgrass Equity's option, at either (a) a base rate, which will be a rate equal to the greatest of (i) the prime rate, (ii) the U.S. federal funds rate plus
0.5%
and (iii) a one-month reserve adjusted Eurodollar rate plus
1.00%
or (b) a reserve adjusted Eurodollar rate, plus, in each case, an applicable margin. For loans bearing interest based on the base rate, the applicable margin is
1.50%
, and for loans bearing interest based on the reserve adjusted Eurodollar rate, the applicable margin is
2.50%
.
The unused portion of the revolving credit facility is subject to a commitment fee of
0.50%
. As of
December 31, 2016
, the weighted average interest rate on outstanding borrowings under the Tallgrass Equity revolving credit facility was
3.26%
. During the
year ended December 31, 2016
, Tallgrass Equity's weighted average effective interest rate, including the interest on outstanding borrowings, commitment fees, and amortization of deferred financing costs, was
3.33%
.
TEP Revolving Credit Facility
On May 17, 2013, in connection with the TEP IPO, TEP entered into a senior secured revolving credit facility with Barclays Bank PLC, as administrative agent, and a syndicate of lenders (as amended, "the Credit Agreement"), which will mature on May 17, 2018. As of December 31, 2016, the TEP revolving credit facility has a total capacity of
$1.75 billion
and includes a
$75 million
sublimit for letters of credit and a
$60 million
sublimit for swing line loans. The unused portion of TEP's revolving credit facility is subject to a commitment fee, which ranges from
0.300%
to
0.500%
, based on TEP's total leverage ratio. As of
December 31, 2016
, the weighted average interest rate on outstanding borrowings under the TEP revolving credit facility was
2.48%
. During the
year ended December 31, 2016
, the weighted average effective interest rate under the TEP revolving credit facility, including the interest on outstanding borrowings, commitment fees, and amortization of deferred financing costs, was
2.75%
.
The following table sets forth the available borrowing capacity under the TEP revolving credit facility as of
December 31, 2016
and
2015
:
|
December 31, 2016
|
December 31, 2015
|
||||||
|
|
(in thousands)
|
||||||
|
Total capacity under the TEP revolving credit facility
(1)
|
$
|
1,750,000
|
|
$
|
1,100,000
|
|
|
|
Less: Outstanding borrowings under the TEP revolving credit facility
(2)
|
(1,015,000
|
)
|
(753,000
|
)
|
|||
|
Available capacity under the TEP revolving credit facility
|
$
|
735,000
|
|
$
|
347,000
|
|
|
|
(1)
|
Effective January 4, 2016, in connection with the acquisition of an additional
31.3%
membership interest in Pony Express, TEP exercised the committed accordion feature to increase the total capacity of the revolving credit facility to
$1.5 billion
. In connection with the acquisition of a
25%
membership interest in Rockies Express, TEP amended its revolving credit facility to increase the total capacity to
$1.75 billion
, which increase became effective May 6, 2016.
|
|
(2)
|
As of
February 3, 2017
, our outstanding borrowings under the revolving credit facility were approximately
$1.130 billion
.
|
TEP's revolving credit facility contains various covenants and restrictive provisions that, among other things, limit or restrict TEP's ability (as well as the ability of its restricted subsidiaries) to incur or guarantee additional debt, incur certain liens on assets, dispose of assets, make certain distributions (including distributions from available cash, if a default or event of default under the credit agreement then exists or would result from making such a distribution), change the nature of its business, engage in certain mergers or make certain investments and acquisitions, enter into non-arms-length transactions with affiliates and designate certain subsidiaries as "Unrestricted Subsidiaries." In addition, TEP is required to maintain a consolidated leverage ratio of not more than
4.75
to 1.00 (which will be increased to
5.25
to 1.00 for certain measurement periods following the consummation of certain acquisitions) and a consolidated interest coverage ratio of not less than
2.50
to 1.00. As of
December 31, 2016
, TEP is in compliance with the covenants required under its revolving credit facility.
112
Fair Value
The following table sets forth the carrying amount and fair value of our long-term debt, which is not measured at fair value in the consolidated balance sheets as of
December 31, 2016
and
2015
, but for which fair value is disclosed:
|
|
Fair Value
|
|
|||||||||||||||||
|
|
Quoted prices
in active markets for identical assets (Level 1) |
Significant
other observable inputs (Level 2) |
Significant
unobservable inputs (Level 3) |
Total
|
Carrying
Amount |
||||||||||||||
|
(in thousands)
|
|||||||||||||||||||
|
As of December 31, 2016:
|
|||||||||||||||||||
|
Revolving credit facilities
|
$
|
—
|
|
$
|
1,163,000
|
|
$
|
—
|
|
$
|
1,163,000
|
|
$
|
1,163,000
|
|
||||
|
2024 Notes
|
$
|
—
|
|
$
|
398,000
|
|
$
|
—
|
|
$
|
398,000
|
|
$
|
392,981
|
|
||||
|
As of December 31, 2015:
|
|||||||||||||||||||
|
Revolving credit facilities
|
$
|
—
|
|
$
|
901,000
|
|
$
|
—
|
|
$
|
901,000
|
|
$
|
901,000
|
|
||||
The long-term debt borrowed under the revolving credit facilities is carried at amortized cost. As of
December 31, 2016
and
2015
, the fair value of borrowings under the revolving credit facilities approximates the carrying amount of the borrowings using a discounted cash flow analysis. The 2024 Notes are carried at amortized cost, net of deferred financing costs. The estimated fair value of the 2024 Notes is based upon quoted market prices adjusted for illiquid markets.
We are not aware of any factors that would significantly affect the estimated fair value subsequent to
December 31, 2016
.
12. Partnership Equity and Distributions
Secondary Offering
On November 17, 2016, TEGP entered into an Underwriting Agreement (the "Underwriting Agreement"), by and among the Partnership and certain selling shareholders named in the Underwriting Agreement (the "Selling Shareholders"), on one hand, and Goldman, Sachs & Co., as the sole underwriter (the "Underwriter"), on the other hand, providing for the offer and sale by the Selling Shareholders (the "Secondary Offering"), and purchase by the Underwriter, of
9,000,000
Class A shares ("Class A Shares") representing limited partner interests, at a price to the public of
$22.00
per share. Pursuant to the Underwriting Agreement, the Selling Shareholders also granted the Underwriter an option for a period of 30 days to purchase up to an additional
1,350,000
Class A shares, on the same terms, which the Underwriter exercised in full.
In connection with the Secondary Offering, Class A Shares were issued to the Selling Shareholders upon the exercise by each Selling Shareholder of its right to exchange all or a portion of its units ("Tallgrass Equity Units") of Tallgrass Equity into Class A Shares at an exchange ratio of one Class A Share for each Tallgrass Equity Unit exchanged (the "Exchange Right"). Pursuant to the terms of the Exchange Right, simultaneously therewith, the exercising Selling Shareholder transferred to the Partnership Class B shares ("Class B Shares") representing limited partner interests in the Partnership in an amount equal to the number of Tallgrass Equity Units exchanged by such exercising Selling Shareholder. Upon each such exchange, the Partnership cancelled the Class B Shares received from the exercising Selling Shareholder. Immediately prior to the Secondary Offering, we and the Exchange Right Holders owned approximately
30.35%
and
69.65%
of the Tallgrass Equity Units, respectively. At the completion of the Secondary Offering, we and the Exchange Right Holders own
36.94%
and
63.06%
of the Tallgrass Equity Units, respectively.
Repurchase of TEP Common Units Owned by TD
Following an offer received from TD with respect to TEP common units owned by TD not subject to the call option, TEP repurchased
736,262
TEP common units from TD at an aggregate price of approximately
$35.3 million
, or
$47.99
per common unit, on
February 1, 2017
, which was approved by the conflicts committee of the board of directors of TEP's general partner. These common units were deemed canceled upon our purchase and as of such transaction date were no longer issued and outstanding.
113
Tallgrass Development Purchase Program
On February 17, 2016, we announced that the Board of Directors of Tallgrass Energy Holdings, LLC, the sole member of TEGP's general partner and the general partner of TD, has authorized an equity purchase program under which TD may initially purchase up to an aggregate of
$100 million
of the outstanding Class A shares of TEGP or the outstanding common units of TEP. TD may purchase Class A shares or Common Units from time to time on the open market or in negotiated purchases. The timing and amounts of any such purchases will be subject to market conditions and other factors, and will be in accordance with applicable securities laws and other legal requirements. The purchase plan does not obligate TD to acquire any specific number of Class A shares or Common Units and may be discontinued at any time. No purchases were made under this program during the
year ended December 31, 2016
.
TEGP Partnership Agreement and Distributions to Holders of Class A Shares
On May 12, 2015, TEGP closed the TEGP IPO and completed the Reorganization Transactions as outlined in
Note 1
–
Description of Business
. In connection with the TEGP IPO, TEGP entered into an amended and restated partnership agreement. The partnership agreement requires TEGP to distribute its available cash to Class A shareholders on a quarterly basis, subject to certain terms and conditions, beginning with the quarter ended June 30, 2015. The following table details the distributions for the periods indicated:
|
Three Months Ended
|
Date Paid
|
Distributions to Class A Shareholders
|
Distributions per Class A Share
|
||||||||
|
(in thousands)
|
|||||||||||
|
December 31, 2016
|
February 14, 2017
|
$
|
16,116
|
|
$
|
0.2775
|
|
||||
|
September 30, 2016
|
November 14, 2016
|
12,528
|
|
0.2625
|
|
||||||
|
June 30, 2016
|
August 12, 2016
|
11,693
|
|
0.2450
|
|
||||||
|
March 31, 2016
|
May 13, 2016
|
10,022
|
|
0.2100
|
|
||||||
|
December 31, 2015
|
February 12, 2016
|
8,256
|
|
0.1730
|
|
||||||
|
September 30, 2015
|
November 13, 2015
|
6,872
|
|
0.1440
|
|
||||||
|
June 30, 2015
|
August 17, 2015
|
3,484
|
|
0.0730
|
|
(1)
|
|||||
|
(1)
|
The first quarterly distribution declared on July 15, 2015 was prorated for the number of days between the closing of TEGP's initial public offering on May 12, 2015 and the end of the second quarter.
|
Exchange Rights
The Exchange Right Holders and any permitted transferees of their Tallgrass Equity units each have the right to exchange all or a portion of their Tallgrass Equity units for Class A shares at an exchange ratio of one Class A share for each Tallgrass Equity unit exchanged, which we refer to as the Exchange Right. The Exchange Right may be exercised only if, simultaneously therewith, an equal number of our Class B shares are transferred by the exercising party to us. Upon such exchange, we will cancel the Class B shares received from the exercising party.
114
Subsidiary Distributions
TEP Distributions
. The following table shows the distributions for the periods indicated:
|
|
|
Distributions
|
Distribution per Limited Partner Common and Subordinated Unit
|
|||||||||||||||||||
|
|
Limited Partner
Common and Subordinated Units |
General Partner
|
|
|||||||||||||||||||
|
Three Months Ended
|
Date Paid
|
Incentive Distribution Rights
|
General Partner Units
|
Total
|
||||||||||||||||||
|
|
|
(in thousands, except per unit amounts)
|
||||||||||||||||||||
|
December 31, 2016
|
February 14, 2017
|
$
|
58,793
|
|
$
|
28,358
|
|
$
|
1,008
|
|
$
|
88,159
|
|
$
|
0.8150
|
|
||||||
|
September 30, 2016
|
November 14, 2016
|
57,332
|
|
26,987
|
|
976
|
|
85,295
|
|
0.7950
|
|
|||||||||||
|
June 30, 2016
|
August 12, 2016
|
54,442
|
|
24,262
|
|
911
|
|
79,615
|
|
0.7550
|
|
|||||||||||
|
March 31, 2016
|
May 13, 2016
|
48,238
|
|
19,816
|
|
830
|
|
68,884
|
|
0.7050
|
|
|||||||||||
|
December 31, 2015
|
February 12, 2016
|
42,984
|
|
15,332
|
|
724
|
|
59,040
|
|
0.6400
|
|
|||||||||||
|
September 30, 2015
|
November 13, 2015
|
36,347
|
|
11,567
|
|
660
|
|
48,574
|
|
0.6000
|
|
|||||||||||
|
June 30, 2015
|
August 14, 2015
|
35,135
|
|
10,418
|
|
627
|
|
46,180
|
|
0.5800
|
|
|||||||||||
|
March 31, 2015
|
May 14, 2015
|
31,322
|
|
6,934
|
|
530
|
|
38,786
|
|
0.5200
|
|
|||||||||||
|
December 31, 2014
|
February 13, 2015
|
23,782
|
|
4,039
|
|
473
|
|
28,294
|
|
0.4850
|
|
|||||||||||
|
September 30, 2014
|
November 14, 2014
|
20,092
|
|
1,208
|
|
363
|
|
21,663
|
|
0.4100
|
|
|||||||||||
|
June 30, 2014
|
August 14, 2014
|
18,596
|
|
758
|
|
330
|
|
19,684
|
|
0.3800
|
|
|||||||||||
|
March 31, 2014
|
May 14, 2014
|
13,288
|
|
126
|
|
274
|
|
13,688
|
|
0.3250
|
|
|||||||||||
TEP Equity Distribution Agreements
On October 31, 2014, TEP entered into an equity distribution agreement pursuant to which it may sell from time to time through a group of managers, as our sales agents, common units representing limited partner interests having an aggregate offering price of up to
$200 million
. On May 13, 2015, the amount was subsequently amended to
$100.2 million
in order to account for follow-on equity offerings under TEP's S-3 shelf registration statement. On May 17, 2016, TEP entered into a new equity distribution agreement allowing for the sale of common units with an aggregate offering price of up to
$657.5 million
. Sales of common units, if any, will be made by means of ordinary brokers' transactions, to or through a market maker or directly on or through an electronic communication network, a "dark pool" or any similar market venue, or as otherwise agreed by TEP and one or more of the managers. TEP intends to use the net cash proceeds from any sale of the units for general partnership purposes, which may include, among other things, TEP's exercise of the call option with respect to the
6,518,000
common units issued to TD in connection with TEP's acquisition of an additional
31.3%
of Pony Express in January 2016, repayment or refinancing of debt, funding for acquisitions, capital expenditures and additions to working capital.
During the
year ended December 31, 2016
, TEP issued and sold
7,696,708
common units with a weighted average sales price of
$44.46
per unit under its equity distribution agreements for net cash proceeds of approximately
$337.7 million
(net of approximately
$4.5 million
in commissions and professional service expenses). During the period from January 1, 2017 to
February 15, 2017
, TEP issued and sold an additional
2,075,546
common units with a weighted average sales price of
$48.19
per unit under its equity distribution agreements for net cash proceeds of approximately
$99.0 million
(net of approximately
$1.0 million
in commissions and professional service expenses). TEP used the net cash proceeds for general partnership purposes as described above.
During the
year ended December 31, 2015
, TEP issued and sold
65,744
common units with a weighted average sales price of
$45.58
per unit under its equity distribution agreement for net cash proceeds of approximately
$3.0 million
(net of approximately
$30,000
in commissions and professional service expenses). TEP used the net cash proceeds for general partnership purposes as described above.
During the year ended December 31, 2014, TEP issued and sold
28,625
common units with a weighted average sales price of
$44.20
per unit under its equity distribution agreements for net cash proceeds of approximately
$1.1 million
(net of approximately
$215,000
in commissions and professional service expenses). TEP used the net cash proceeds for general partnership purposes as described above.
115
Private Placement
On April 28, 2016, TEP issued an aggregate of
2,416,987
common units for net cash proceeds of
$90 million
in a private placement transaction to certain funds managed by Tortoise Capital Advisors, L.L.C. The units were subsequently registered pursuant to our Form S-3/A (File No. 333-210976) filed with the SEC on May 6, 2016, which became effective May 17, 2016.
TEP Public Offerings
On February 27, 2015, TEP sold
10,000,000
common units representing limited partner interests in an underwritten public offering at a price of
$50.82
per unit, or
$49.29
per unit net of the underwriter's discount, for net proceeds of approximately
$492.4 million
after deducting the underwriter's discount and offering expenses. TEP used the net proceeds from the offering to fund a portion of the consideration for the acquisition of an additional
33.3%
membership interest in Pony Express as discussed in
Note 4
–
Acquisitions
. Pursuant to the underwriters' option to purchase additional units, TEP sold an additional
1,200,000
common units representing limited partner interests to the underwriters at a price of
$50.82
per unit, or
$49.29
per unit net of the underwriter's discount, for net proceeds of approximately
$59.3 million
after deducting the underwriter's discount and offering expenses. TEP used the net proceeds from this additional purchase of common units to reduce borrowings under its revolving credit facility, a portion of which were used to fund the March 2015 acquisition of an additional
33.3%
membership interest in Pony Express as discussed in
Note 4
–
Acquisitions
.
On July 25, 2014, TEP sold
8,050,000
common units representing limited partner interests in an underwritten public offering at a price of
$41.07
per unit, or
$39.74
per unit net of the underwriter's discount, for net proceeds of approximately
$319.3 million
after deducting the underwriter's discount and offering expenses. TEP used the net proceeds from the offering to fund a portion of the consideration for the acquisition of the initial
33.3%
membership interest in Pony Express as discussed in
Note 4
–
Acquisitions
.
Noncontrolling Interests
As of
December 31, 2016
, noncontrolling interests in our subsidiaries consisted of a
63.06%
interest in Tallgrass Equity held by the Exchange Right Holders, as defined in
Note 14
–
Net Income per Class A Share
the
72.41%
limited partner interest in TEP held by TD and the public TEP unitholders and the
2.0%
membership interest in Pony Express held by TD. During the
year ended December 31, 2016
, we recognized contributions from and distributions to noncontrolling interests of
$9.3 million
and
$249.1 million
. Contributions from noncontrolling interests consisted primarily of contributions from TD to Pony Express. Distributions to noncontrolling interests consisted of distributions to TEP unitholders of
$145.1 million
, Tallgrass Equity distributions to the Exchange Right Holders of
$97.5 million
, and distributions to Pony Express and Water Solutions noncontrolling interests of
$6.5 million
.
During the
year ended December 31, 2015
, we recognized contributions from and made distributions to noncontrolling interests of
$110.1 million
and
$197.4 million
. Contributions from noncontrolling interests consisting primarily of contributions from TD to Pony Express. Distributions to noncontrolling interests consisted of distributions to TEP unitholders of
$99.1 million
, Tallgrass Equity distributions to the Exchange Right Holders of
$28.7 million
, and distributions to Pony Express and Water Solutions noncontrolling interests of
$69.6 million
.
During the
year ended December 31, 2014
, we recognized contributions from and made distributions to noncontrolling interests of
$5.4 million
and
$40.9 million
. Contributions from noncontrolling interests consisting primarily of contributions from TD to Pony Express. Distributions to noncontrolling interests consisted of distributions to TEP unitholders of
$35.5 million
and distributions to Pony Express and Water Solutions noncontrolling interests of
$5.4 million
.
Other Contributions and Distributions
During the
year ended December 31, 2016
, TEP received contributions from TD of
$17.9 million
to indemnify TEP for costs associated with Trailblazer's Pipeline Integrity Management Program, as discussed in
Note 19
–
Legal and Environmental Matters
. In addition, we distributed the remaining
$1.6 million
in proceeds from the TEGP IPO to the Exchange Right Holders that had been retained from the distribution of Excess Proceeds for short-term working capital needs.
During the
year ended December 31, 2015
, we distributed
$334.1 million
proceeds from the TEGP IPO to the Exchange Right Holders as part of the reorganization of entities effective concurrent with the TEGP IPO. In addition, we received
$7.5 million
of TEP general partner and IDR distributions related to periods prior to the TEGP IPO which were distributed to the previous TEP GP Members and
$13.5 million
of TEP distributions received which were distributed by Tallgrass Equity to the Exchange Right Holders.
116
During the
year ended December 31, 2014
, we recognized net contributions from the Predecessor Entities of
$279.5 million
. This activity represents transfers of cash as a result of TD's centralized cash management systems as discussed in
Note 1
–
Description of Business
, as well as the TEP distributions paid on the Acquired TEP Units and distributions paid for excess offering proceeds. We also recognized a
$27.5 million
contribution from TD representing the difference between the carrying amount of the Replacement Gas Facilities required as part of the Pony Express Abandonment, as discussed in
Note 18
–
Regulatory Matters
, and the proceeds received from TD as reimbursement for the costs to construct those assets.
13. Commitments & Contingent Liabilities
Leases
Rent expense under operating leases and right of way agreements totaled approximately
$30.1 million
,
$25.8 million
, and
$4.7 million
for the
years ended December 31, 2016
,
2015
, and
2014
, respectively.
At
December 31, 2016
, future minimum rental commitments under major, non-cancelable operating leases were as follows (in thousands):
|
Year
|
Total
|
|||
|
2017
|
$
|
28,377
|
|
|
|
2018
|
28,788
|
|
||
|
2019
|
29,328
|
|
||
|
2020
|
29,959
|
|
||
|
2021
|
30,374
|
|
||
|
Thereafter
|
448,853
|
|
||
|
Total
|
$
|
595,679
|
|
|
Operating leases and service contracts consist of leases for crude oil storage as well as office space and equipment.
Pony Express entered into a lease agreement with Deeprock on November 7, 2012 for the use by Pony Express of storage capacity at the Deeprock tank storage facility near Cushing, Oklahoma. The lease has a
five
-year term which commenced on October 7, 2014. Pony Express made upfront payments totaling
$10.9 million
, of which
$4.6 million
was paid in 2013 and
$6.3 million
was paid in 2014. The upfront payments are recorded as "Deferred charges and other assets" on the accompanying consolidated balance sheets and will be amortized over the lease term. Pony Express has the right to extend the term of the lease for additional periods of
five
or
two
years, not to exceed a total of
20
years from when the lease commences. Future minimum rental commitments in the table above assume renewal of the Deeprock lease for the full
20
-year term as the storage capacity at Deeprock is integral to the operations of the Pony Express System and renewal of the lease is reasonably assured as a result.
On August 26, 2014, Pony Express entered into a lease agreement with Sterling for the use by Pony Express of storage capacity at the Sterling tank storage facility in northeast Colorado. The lease has a
five
-year term which commenced on May 1, 2015. Pony Express has the right to extend the term of the lease for additional periods of
five
years, not to exceed a total of
20 years
from the commencement of the lease agreement. Future minimum rental commitments in the table above assume renewal of the Sterling lease for the full
20
-year term as the storage capacity at Sterling is integral to the operations of the lateral in Northeast Colorado and renewal of the lease is reasonably assured as a result. As discussed in
Note 22
–
Subsequent Events
, effective January 1, 2017 we acquired
100%
of the issued and outstanding membership interests in Tallgrass Terminals, LLC ("Terminals"), which owns the Sterling Terminal.
Capital Expenditures
We had committed approximately
$6.5 million
for the future purchase of property, plant and equipment at
December 31, 2016
.
Other Purchase Obligations
Other purchase obligations primarily represent costs associated with Western's freshwater delivery and produced water gathering and disposal systems acquired in December 2015. Actual costs associated with these contracts totaled approximately
$1.4 million
and
$4,000
for the
years ended December 31, 2016
and
2015
, respectively.
117
At
December 31, 2016
, future minimum commitments under long-term, non-cancelable contracts for other purchase obligations were as follows (in thousands):
|
Year
|
Total
|
|||
|
2017
|
$
|
1,843
|
|
|
|
2018
|
1,843
|
|
||
|
2019
|
1,858
|
|
||
|
2020
|
1,858
|
|
||
|
2021
|
27
|
|
||
|
Thereafter
|
69
|
|
||
|
Total
|
$
|
7,498
|
|
|
14. Net Income per Class A Share
Basic net income per Class A share is determined by dividing net income attributable to TEGP by the weighted average number of outstanding Class A shares during the period. Class B shares do not share in the earnings of the Partnership. Accordingly, basic and diluted net income per Class B share has not been presented.
Diluted net income per Class A share is determined by dividing net income attributable to TEGP by the weighted average number of outstanding diluted Class A shares during the period. For purposes of calculating diluted net income per Class A share, we considered the impact of possible future exercises of the Exchange Right by the Exchange Right Holders on both net income attributable to TEGP and the diluted weighted average number of Class A shares outstanding. The Exchange Right Holders refers to the group of persons who collectively own all of TEGP's outstanding Class B shares and an equivalent number of Tallgrass Equity units. The Exchange Right Holders are entitled to exercise the right to exchange their Tallgrass Equity units (together with an equivalent number of TEGP Class B shares) for TEGP Class A shares at an exchange ratio of one TEGP Class A share for each Tallgrass Equity unit exchanged, which we refer to as the Exchange Right. The Exchange Right Holders primarily consist of Kelso & Company and its affiliated investment funds, The Energy & Minerals Group and its affiliated investment funds, and Tallgrass KC, LLC, which is an entity owned by certain members of TEGP's and TEP's management.
Pursuant to the TEGP partnership agreement and the Tallgrass Equity limited liability company agreement, our capital structure and the capital structure of Tallgrass Equity will generally replicate one another in order to maintain the one-for-one exchange ratio between the Tallgrass Equity units and Class B shares, on the one hand, and our Class A shares, on the other hand. As a result, the exchange of any Class B shares for Class A shares does not have a dilutive effect on basic net income per Class A share. However, for the
years ended December 31, 2016
and
2015
, the potential issuance of TEGP Equity Participation Shares would have had a dilutive effect on basic net income per Class A share.
Net income per Class A share is not presented for the year ended December 31, 2014 as there were no Class A shares outstanding during those periods. The TEGP IPO became effective during the second quarter of 2015. As a result, no income from the period from January 1, 2015 through May 11, 2015 is allocated to the Class A shares that were issued on May 12, 2015.
The following table illustrates the calculation of basic and diluted net income per Class A share for the
years ended December 31, 2016
and
2015
:
|
Year Ended December 31,
|
|||||||
|
2016
|
2015
|
||||||
|
|
(in thousands, except per unit amounts)
|
||||||
|
Basic Net Income per Class A Share:
|
|||||||
|
Net income attributable to TEGP
|
$
|
26,794
|
|
$
|
31,956
|
|
|
|
Net income attributable to TEGP prior to May 12, 2015
|
—
|
|
(7,393
|
)
|
|||
|
Net income attributable to TEGP subsequent to May 12, 2015
|
$
|
26,794
|
|
$
|
24,563
|
|
|
|
Basic weighted average Class A Shares outstanding
|
48,856
|
|
47,725
|
|
|||
|
Basic net income per Class A share
|
$
|
0.55
|
|
$
|
0.51
|
|
|
|
Diluted Net Income per Class A Share:
|
|||||||
|
Net income attributable to TEGP subsequent to May 12, 2015
|
$
|
26,794
|
|
$
|
24,563
|
|
|
|
Incremental net income attributable to TEGP including the effect of the assumed issuance of Equity Participation Shares
|
9
|
|
6
|
|
|||
|
Net income attributable to TEGP including incremental net income from assumed issuance of Equity Participation Shares
|
$
|
26,803
|
|
$
|
24,569
|
|
|
|
Basic weighted average Class A Shares outstanding
|
48,856
|
|
47,725
|
|
|||
|
Equity Participation Shares equivalent shares
|
33
|
|
83
|
|
|||
|
Diluted weighted average Class A Shares outstanding
|
48,889
|
|
47,808
|
|
|||
|
Diluted net income per Class A Share
|
$
|
0.55
|
|
$
|
0.51
|
|
|
15. Major Customers and Concentration of Credit Risk
During the
year ended December 31, 2016
two non-affiliated customers, Continental Resources, Inc. ("Continental Resources") and Shell Trading (US) Company ("Shell"), accounted for
$97.8 million
(
16%
) and
$76.2 million
(
13%
) of our total operating revenues, respectively. During the
year ended December 31, 2015
two non-affiliated customers, Continental Resources and Shell, accounted for
$84.5 million
(
16%
) and
$78.6 million
(
15%
) of our total operating revenues, respectively. In 2016 and 2015, revenues from Continental Resources were earned in our Crude Oil Transportation & Logistics segment, while revenues from Shell were earned in our Crude Oil Transportation & Logistics, Processing & Logistics, and Natural Gas Transportation & Logistics segments. During the
year ended December 31, 2014
one non-affiliated customer, Phillips 66, accounted for
$113.6 million
(
31%
) of our total operating revenues. All of the Phillips 66 revenues were earned in our Processing & Logistics segment.
For the
year ended December 31, 2016
, the percentage of segment revenues from the top ten non-affiliated customers for each segment was as follows:
|
Percentage of
Segment Revenue
|
||
|
Crude Oil Transportation & Logistics
|
95%
|
|
|
Natural Gas Transportation & Logistics
|
58%
|
|
|
Processing & Logistics
|
91%
|
|
We attempt to mitigate credit risk by seeking collateral or financial guarantees and letters of credit from customers with specific credit concerns. In support of credit extended to certain customers, we had received prepayments of
$4.9 million
and
$4.7 million
at
December 31, 2016
and
2015
, respectively, included in the caption "Other current liabilities" in the accompanying consolidated balance sheets.
118
16. Equity-Based Compensation
Long-term Incentive Plan
Effective May 12, 2015, our general partner adopted the TEGP Management, LLC Long-Term Incentive Plan ("LTIP") on our behalf of (i) the employees of our general partner and its affiliates who perform services for us, (ii) the non-employee directors of our general partner and (iii) the consultants who perform services for us. Awards under the LTIP may consist of, among others, unrestricted shares, restricted shares, equity participation shares, options and share appreciation rights. The LTIP limits the number of shares that may be delivered pursuant to awards to
3,144,589
Class A shares (subject to any adjustment due to recapitalization, reorganization or a similar event permitted under the LTIP). Shares that are forfeited or withheld to satisfy exercise price or tax withholding obligations are available for delivery pursuant to other awards.
Equity Participation Shares
Vesting of the Equity Participation Shares granted to date is contingent on certain service and performance conditions. The Equity Participation Shares are non-participating; as such participants are not entitled to receive any distributions with respect to the Equity Participation Shares unless the participant receives a separate grant of Distribution Equivalent Rights. At this time, no grants of Distribution Equivalent Rights have been made.
The Equity Participation Share grants under the LTIP are measured at their grant date fair value. The Equity Participation Shares are non-participating; therefore the grant date fair value is discounted from the grant date fair value of TEGP's Class A shares for the present value of the expected future distributions during the vesting period. Total equity-based compensation cost related to the Equity Participation Share grants was approximately
$1.4 million
and
$0.5 million
for the
years ended December 31, 2016
and
2015
, respectively. Of the total compensation cost,
$0.2 million
and
$32,000
for the
years ended December 31, 2016
and
2015
, respectively, were recognized as compensation expense at TEGP and the remainder was allocated to TEP and TD. As of
December 31, 2016
,
$3.4 million
of compensation cost related to non-vested Equity Participation Shares is expected to be recognized over a weighted-average period of
2.3 years
.
The following table summarizes the changes in the Equity Participation Shares outstanding for the
years ended December 31, 2016
and
2015
:
|
Equity Participation Shares
|
Weighted Average
Grant Date Fair Value |
|||||
|
Outstanding at December 31, 2014
|
—
|
|
$
|
—
|
|
|
|
Granted
|
160,000
|
|
27.97
|
|
||
|
Outstanding at December 31, 2015
|
160,000
|
|
27.97
|
|
||
|
Granted
|
45,000
|
|
18.22
|
|
||
|
Outstanding at December 31, 2016
|
205,000
|
|
$
|
25.83
|
|
|
17. Income Taxes
Income tax expense is estimated using the tax rate in effect or to be in effect during the relevant periods in the jurisdictions in which we operate. Deferred income tax assets and liabilities are recognized for temporary differences between the basis of assets and liabilities for financial reporting and tax purposes and are stated at enacted tax rates expected to be in effect when taxes are actually paid or recovered. Changes in tax legislation are included in the relevant computations in the period in which such changes are effective.
The Reorganization Transactions became effective on May 12, 2015. As a result, no income prior to May 12, 2015 is subject to income tax.
U.S. Federal and State Taxes
Although we are organized as a limited partnership, we have elected to be treated as a corporation for U.S. federal income tax purposes and are therefore subject to both U.S. federal and state income taxes. We are projecting a loss for both U.S. federal and state income taxes for the tax year ended
December 31, 2016
. As a result, there is no current provision for income taxes for the year ended
December 31, 2016
.
119
Tax Components
Components of the deferred income tax expense (benefit) are as follows:
|
Year Ended December 31,
|
|||||||
|
2016
|
2015
|
||||||
|
(in thousands)
|
|||||||
|
Deferred tax expense (benefit):
|
|||||||
|
Federal income tax
|
$
|
15,587
|
|
$
|
5,675
|
|
|
|
State income tax
|
2,154
|
|
(12,952
|
)
|
|||
|
Total deferred tax expense (benefit)
|
$
|
17,741
|
|
$
|
(7,277
|
)
|
|
The difference between tax expense based on the statutory federal income tax rate and our effective tax expense is summarized as follows:
|
Year Ended December 31,
|
|||||||
|
2016
|
2015
|
||||||
|
(in thousands)
|
|||||||
|
Income before tax
|
$
|
260,785
|
|
$
|
180,714
|
|
|
|
Less: Net income attributable to TEGP Predecessor
|
—
|
|
(7,393
|
)
|
|||
|
Less: Net income attributable to noncontrolling interests prior to May 12, 2015
|
—
|
|
(32,196
|
)
|
|||
|
Less: Net income attributable to noncontrolling interests subsequent to May 12, 2015
|
(216,250
|
)
|
(123,839
|
)
|
|||
|
Income subject to tax
|
$
|
44,535
|
|
$
|
17,286
|
|
|
|
Federal statutory income tax rate
|
35
|
%
|
35
|
%
|
|||
|
Income tax at statutory rate
|
$
|
15,587
|
|
$
|
6,050
|
|
|
|
State income taxes, net of federal benefit
|
1,592
|
|
449
|
|
|||
|
Change in state tax rate
|
562
|
|
(13,776
|
)
|
|||
|
Total income tax expense (benefit)
|
$
|
17,741
|
|
$
|
(7,277
|
)
|
|
|
Effective tax rate
|
6.8
|
%
|
(4.0
|
)%
|
|||
Deferred tax assets result from the following:
|
December 31, 2016
|
December 31, 2015
|
||||||
|
(in thousands)
|
|||||||
|
Deferred tax assets:
|
|||||||
|
Investment in partnerships
|
$
|
473,888
|
|
$
|
435,512
|
|
|
|
Net operating losses
|
47,566
|
|
16,918
|
|
|||
|
Total deferred tax assets
|
$
|
521,454
|
|
$
|
452,430
|
|
|
On May 12, 2015, as a result of the transfer of the ownership interest in Tallgrass Equity as part of the Reorganization Transactions in connection with the TEGP IPO, we recognized a deferred tax asset of
$445.2 million
. In November 2016, we completed the Secondary Offering as discussed in
Note 12
–
Partnership Equity and Distributions
. In connection with the resulting transfer of Tallgrass Equity Units, we recognized an additional deferred tax asset of
$86.8 million
. These transfers of ownership were accounted for at the historical carrying basis for GAAP accounting purposes, but recorded at the value of the consideration paid for U.S. federal income tax purposes. The tax rates that apply when the deferred tax balances ultimately reverse are inherent in the realization of the deferred tax balances. State tax rates can change from year to year based upon changes in both state apportionment percentages and state tax laws.
120
As of
December 31, 2016
, we had a federal net operating loss carry forward of
$124.8 million
and various state net operating loss carry forwards. The determination of the state net operating loss carry forwards is dependent upon apportionment percentages and state laws that can change from year to year and impact the amount of such carry forwards. If not utilized, the federal net operating loss carry forward will expire in 2036 and the state operating loss carry forwards will expire between 2026 and 2036. The 2015 and 2016 tax years are open to examination for federal and state tax.
18. Regulatory Matters
There are currently no proceedings challenging the currently effective transportation rates of Pony Express, Rockies Express, Tallgrass Interstate Gas Transmission, LLC ("TIGT") or Trailblazer Pipeline Company LLC ("Trailblazer"). Regulators, as well as shippers, do have rights, under circumstances prescribed by applicable law, to challenge the rates that we charge at our regulated entities. Further, applicable law governing service by Pony Express allows parties having standing to file complaints in regard to existing tariff rates and provisions. If the complaint is not resolved, the FERC may conduct a hearing and order a crude oil pipeline like the Pony Express System to make reparations going back for up to two years prior to the date on which a complaint was filed if a rate is found to be unjust and unreasonable. We can provide no assurance that current rates will remain unchallenged. Any successful challenge could have a material, adverse effect on our future earnings and cash flows.
Pony Express
On September 19, 2014 Pony Express filed with the FERC to adopt a tariff for initial local non-contract rates as well as initial Rules and Regulations in accordance with the Interstate Commerce Act to be effective starting on October 1, 2014. Local Contract Tariff rates were filed with the FERC on October 29, 2014 to be effective starting November 1, 2014. Joint Contract Tariff rates for oil received into the Pony Express pipeline system from the Belle Fourche Pipeline were filed on October 16, 2014 to be effective starting November 1, 2014. Joint Contract Tariff rates for oil received into the Pony Express System from Hiland Pipeline Company were filed on February 27, 2015 and effective April 1, 2015.
On May 18, 2015, Pony Express filed with the FERC to implement tariff contract rates for Pony Express' newly constructed lateral in Northeast Colorado effective June 1, 2015.
On May 29, 2015, tariff filings were made with the FERC in Docket No. IS15-492-000 to increase the Pony Express local contract rates for service from the Guernsey origin, and for local non-contract rates from all origins, by amounts reflecting the FERC annual index adjustment of approximately
4.6%
effective July 1, 2015. A tariff filing was also made in Docket No. IS15-493-000 on that date to increase joint tariff contract rates for service on Pony Express by approximately
4.6%
effective July 1, 2015.
On October 29, 2015, Pony Express made a tariff filing with the FERC in Docket No. IS16-42-000 to increase the contract rates under its Local Pipeline Tariff for transportation from receipt points on its lateral in Northeast Colorado to various delivery points in Oklahoma, by an amount reflecting the most recent FERC annual index adjustment of approximately
4.6%
effective December 1, 2015.
On May 25, 2016, Pony Express made a tariff filing with the FERC in Docket No. IS16-326-000 to update its non-contract rates under its Local Pipeline Tariff for local non-contract rates from all origins, by an amount reflecting the most recent FERC annual index adjustment of approximately
0.9799
effective July 1, 2016, which resulted in a reduction of the Pony Express non-contract rates of
2.01%
.
Rockies Express
Petition for Declaratory Order – FERC Docket No. RP13-969-000
In June 2013, in Docket No. RP13-969-000, Rockies Express filed with the FERC a Petition for Declaratory Order which sought a ruling that the "most favored nations" or "MFN" provisions contained in Rockies Express' negotiated rate agreements ("NRAs") with its Foundation and Anchor Shippers would not prevent Rockies Express from providing firm transportation service at rates lower than Foundation and Anchor Shippers' rates that (1) have an east-to-west primary path; (2) are for a term of one year or longer; and (3) are limited to service in one rate zone and therefore do not utilize all of the same facilities or rate zones as the service provided pursuant to the Foundation and Anchor Shipper NRAs.
In September 2014, the FERC accepted amended contracts with three shippers holding MFN rights on Rockies Express, which reflect the terms of settlements between these shippers and Rockies Express. The settlements provide additional clarity with respect to the applicability of the settling shippers' MFN rights, sharing by Rockies Express of certain transportation revenues, and the withdrawal of the settling shippers from the Petition for Declaratory Order proceeding. Prior to December 2015, only one shipper with current MFN rights was still a party to the proceeding.
121
2015 Annual FERC Fuel Tracking Filings - Docket No. RP15-584-000
On February 27, 2015, Rockies Express made its annual fuel tracker filing with a proposed effective date of April 1, 2015 in Docket No. RP15-584-000. This filing incorporated the revised fuel and lost and unaccounted-for and power cost tracker mechanisms filed in Docket No. RP14-1003. The FERC issued an order accepting the filing on March 26, 2015 and on April 9, 2015, accepted an errata to the February 27, 2015 filing reflecting a corrected rate for the Cheyenne Booster rate (PCT Reimbursement Charge).
Seneca Lateral Facilities Conversion – FERC Docket No. CP15-102-000
On March 2, 2015 in Docket No. CP15-102-000, Rockies Express filed with the FERC an application for (1) authorization to convert certain existing and operating pipeline and compression facilities located in Noble and Monroe Counties, Ohio (Seneca Lateral Facilities described in Docket Nos. CP13-539-000 and CP14-194-000) from Natural Gas Policy Act of 1978 Section 311 authority to NGA Section 7 jurisdiction, and (2) issuance of a certificate of public convenience and necessity authorizing Rockies Express to operate and maintain the Seneca Lateral Facilities. On April 7, 2016, the FERC issued a Certificate to Rockies Express granting its requested authorizations and on June 1, 2016 Rockies Express commenced NGA service on the Seneca Lateral.
Rockies Express Zone 3 Capacity Enhancement Project – FERC Docket No. CP15-137-000
On March 31, 2015 in Docket No. CP15-137-000, Rockies Express filed with the FERC an application for authorization to construct and operate (1) three new mainline compressor stations located in Pickaway and Fayette Counties, Ohio and Decatur County, Indiana; (2) additional compressors at an existing compressor station in Muskingum County, Ohio; and (3) certain ancillary facilities. The proposed facilities will increase the Rockies Express Zone 3 east-to-west mainline capacity by
0.8
Bcf/d. Pursuant to the FERC's obligations under the National Environmental Policy Act, FERC staff issued an Environmental Assessment for the project on August 31, 2015. On February 25, 2016, the FERC issued a Certificate of Public Convenience and Necessity authorizing Rockies Express to proceed with the project. On March 14, 2016, Rockies Express commenced construction of the project facilities. The project was placed in-service for the
0.8
Bcf/d on January 6, 2017.
2016 Annual and Interim FERC Fuel Tracking Filings - Docket Nos. RP16-702 and RP17-240
On March 1, 2016, Rockies Express made its annual fuel tracker filing with a proposed effective date of April 1, 2016 in Docket No. RP16-702. The FERC issued an order accepting the filing on March 25, 2016. On December 1, 2016, Rockies Express made an interim fuel tracker filing with a proposed effective date of January 1, 2017 in Docket No. RP17-240. The FERC issued an order accepting the filing on December 29, 2016. The filing reflected a corrected rate for a previous inadvertent error made in the allocation of Overthrust, Echo Springs, and Wamsutter fuel between non-expansion and expansion volumes during the period from July 2014 through July 2016.
Electric Power Charge Clarification - Docket No. RP17-285
On December 21, 2016, in Docket No. RP17-285, Rockies Express proposed certain revisions to the General Terms and Conditions of its tariff to clarify that the electric power costs associated with the operation of gas coolers installed in association with the Zone 3 Capacity Enhancement Project (
i.e.
at both electric and gas powered stations), will be included in the Power Cost Tracker. Several shippers submitted comments on the proposal. The FERC issued an order on January 19, 2017 accepting the proposed revisions permitting the recovery of electric power costs from the operation of both gas and electric powered compressor stations, subject to certain clarifications.
TIGT
Pony Express Abandonment – FERC Docket CP12-495
On August 6, 2012, TIGT filed an application to: (1) abandon for FERC purposes approximately
433
miles of mainline natural gas pipeline facilities, along with associated rights of way and other related equipment (collectively, the "Pony Express Assets"), and the natural gas service therefrom, by transferring those assets to Pony Express, which subsequently converted the Pony Express Assets into crude oil pipeline facilities; and (2) construct and operate certain replacement-type facilities necessary to continue service to existing natural gas firm transportation customers following the conversion, which we refer to as the Replacement Gas Facilities. This project is referred to as the "Pony Express Abandonment." The FERC abandonment does not constitute an abandonment for accounting purposes. Pursuant to the terms of the Purchase and Sale Agreement filed with the FERC and cited by the FERC in approving the Pony Express Abandonment, Pony Express is required to reimburse TIGT for the net book value of the Pony Express Assets plus other TIGT incurred costs required to construct the Replacement Gas Facilities and to arrange substitute gas transportation services to certain TIGT shippers.
122
The Pony Express Abandonment and completion of the Pony Express Project by Pony Express re-deployed existing pipeline assets to meet the growing market need to transport crude oil while at the same time continuing to operate TIGT's natural gas transportation facilities to meet all current and expected needs of its natural gas customers. By a FERC order issued September 12, 2013, TIGT was granted authorization to abandon the Pony Express Assets and construct the Replacement Gas Facilities. On October 7, 2013 TIGT commenced the mobilization of personnel and equipment for the construction of the Replacement Gas Facilities necessary to complete the Pony Express Abandonment to continue service to existing TIGT customers. In December 2013, TIGT removed the Pony Express Assets from gas service and sold those assets to Pony Express. On May 1, 2014, TIGT commenced commercial service through all of the Replacement Gas Facilities, with the exception of Units 3 and 4 at the Tescott Compressor Station. Service through Units 3 and 4 at the Tescott Compressor Station commenced on May 30, 2014.
General Rate Case Filing - FERC Docket RP16-137
On October 30, 2015, TIGT filed a general rate case with the FERC pursuant to Section 4 of the National Gas Act ("NGA"). The rate case proposed a general system-wide increase in the maximum tariff rates for all firm and interruptible services offered by TIGT. In addition, TIGT proposed certain changes to the transportation rate design of its system to replace the current rate zone structure with a single "postage stamp" rate. TIGT also proposed new incremental charges, including (i) a charge for deliveries made to points without certain electronic flow measurement equipment, and (ii) a Cost Recovery Mechanism ("CRM") charge to completely or partially reimburse TIGT for certain expenses and costs it incurs to comply with anticipated new PHMSA and EPA regulations. TIGT also proposed to replace its fixed fuel and lost and unaccounted for ("FL&U") charge with a FL&U tracker that would compensate TIGT for its actual FL&U expenses and adjust each year to reflect the previous period's under/over collection and the forecasted FL&U expense for the upcoming period. TIGT also proposed to implement a power cost tracker to recover the actual power costs incurred by TIGT to power its compressors. Finally, TIGT proposed certain revisions to its FERC Gas Tariff addressing a number of other rate and non-rate matters. Under the NGA and the FERC's regulations, TIGT's shippers and other interested parties, including the FERC's Trial Staff, have a right to challenge any aspect of TIGT's rate case filing. Accordingly, numerous TIGT customers protested aspects of TIGT's NGA Section 4 rate filing.
On November 30, 2015, the FERC issued an order accepting and suspending the proposed rates and a majority of the proposed tariff records to be effective upon motion May 1, 2016, subject to refund, certain modifications to TIGT's proposed CRM charge, and the outcome of an evidentiary hearing before a FERC Administrative Law Judge (the "TIGT Suspension Order"). In the TIGT Suspension Order, the FERC also accepted two tariff records related to
force majeure
events and reservation charge crediting to be effective December 1, 2015, subject to certain modifications. On December 21, 2015, TIGT made a compliance filing with the FERC to modify TIGT's proposed CRM charge and update the tariff records related to
force majeure
events and reservation charge crediting as directed by the FERC in the TIGT Suspension Order. No comments or protests were filed in response to the compliance filing and the FERC accepted the compliance filing on February 1, 2016. On March 31, 2016, the FERC issued an order denying certain rehearing requests pertaining to the proposed CRM charge and removed from hearing the non-rate issues related to proposed pro forma tariff records, placing the non-rate issues under a separate review process, and allowing interveners further opportunity to comment on the pro forma tariff. TIGT and certain intervenors have since filed additional information and/or comments with respect to the proposed pro forma tariff. On February 3, 2017, the FERC accepted TIGT's pro forma tariff records, subject to conditions, and directed TIGT to file the actual tariff records within 30 days.
On June 8, 2016, TIGT filed an Offer of Settlement (the "TIGT Rate Case Settlement") with the FERC, which resolved all issues set for hearing. On July 14, 2016, the presiding Administrative Law Judge certified the TIGT Rate Case Settlement to the FERC, finding that settlement is uncontested, presents no issues of first impression, has no FERC policy implications, and appears to be just, reasonable and in the public interest. On November 2, 2016, the FERC issued an order approving the TIGT Rate Case Settlement, finding that it appears to be fair and reasonable and in the public interest. The FERC also directed TIGT to file revised tariff records to implement the TIGT Rate Case Settlement, which TIGT filed, and the FERC subsequently approved on December 23, 2016. The November 2, 2016 order also terminated all matters in the TIGT rate case, apart from the non-rate issues related to the pro forma tariff which remain pending before the FERC. Per the terms of the TIGT Rate Case Settlement, TIGT is required to file a new general rate case on May 1, 2019 (provided that such rate case is not pre-empted by a pre-filing settlement), and no Supporting/Non-Contesting Participant, as defined in the TIGT Rate Case Settlement, is permitted to,
inter alia
, file to change the settlement rates or any other provisions set forth in the TIGT Rate Case Settlement prior to May 1, 2019.
123
Trailblazer
2013 Rate Case Filing - Docket No. RP13-1031
On January 22, 2014, Trailblazer, the FERC's Trial Staff, and the active parties in the pipeline's general rate case finalized a settlement in principle resolving the pending rate issues, including: (i) establishing transportation rates, as well as fuel and lost and unaccounted for charges; (ii) providing a limited profit sharing arrangement for certain revenues earned from interruptible and short-term firm transport; and (iii) setting the minimum and maximum time that can elapse before Trailblazer's next rate case at the FERC. Trailblazer filed a motion with the FERC's Chief Administrative Law Judge to accept the settlement rates on an interim basis ("Interim Rates") while the participants finalized a definitive settlement. The Chief Administrative Law Judge accepted the Interim Rates effective February 1, 2014. On February 24, 2014, Trailblazer filed an uncontested offer of settlement ("Stipulation and Agreement") among active party shippers. The Stipulation and Agreement established the Interim Rates as final settlement rates effective February 1, 2014, subject to the issuance of refunds to certain shippers for January 2014 transportation services and revised fuel and lost and unaccounted for rates, effective July 1, 2014. On March 11, 2014, the Presiding Administrative Law Judge certified the Stipulation and Agreement. On May 29, 2014, the FERC approved the Stipulation and Agreement. On June 30, 2014, Trailblazer filed tariff sheets to implement the Stipulation and Agreement effective July 1, 2014. Estimated refunds were reserved from revenues recorded in January 2014. On July 1, 2014, Trailblazer submitted refunds to its customers for amounts collected in excess of amounts that would have been collected under the Settlement Rates, with interest, and on July 18, 2014, filed a report of refunds with the FERC. The FERC issued orders accepting the tariff sheets with the requested effective date of July 1, 2014 and accepting the refund report filing on July 25, 2014 and August 7, 2014, respectively. Per the terms of the Stipulation and Agreement, Trailblazer is required to file a new rate case with rates to be effective by January 1, 2019.
2015 Annual Fuel Tracker Filing - Docket No. RP15-841-000
On April 1, 2015, Trailblazer made its annual fuel tracker filing with a proposed effective date of May 1, 2015 in Docket No. RP15-841-000. This filing incorporates the revised fuel tracker and power cost tracker mechanisms agreed to in the Stipulation and Agreement, which resolves all outstanding issues related to Trailblazer fuel recoveries. The FERC approved this filing on April 23, 2015.
2016 Annual Fuel Tracker Filing – Docket Nos. RP16-814-000 and RP16-814-001
On April 1, 2016, Trailblazer made its annual fuel tracker filing with a proposed effective date of May 1, 2016 in Docket No. RP16-814-000. The FERC accepted this filing on April 18, 2016. On May 19, 2016, Trailblazer filed its refund report associated with the April 1, 2016 annual fuel tracker filing, which the FERC accepted on July 11, 2016. On September 7, 2016, Trailblazer filed an adjustment to its April 1, 2016 filing in Docket No. RP16-814-001, which the FERC accepted on October 3, 2016. Trailblazer filed a corresponding refund report on October 14, 2016, which the FERC accepted on November 16, 2016.
19. Legal and Environmental Matters
Legal
In addition to the matters discussed below, we are a defendant in various lawsuits arising from the day-to-day operations of our business. Although no assurance can be given, we believe, based on our experiences to date, that the ultimate resolution of such routine items will not have a material adverse impact on our business, financial position, results of operations, or cash flows.
We have evaluated claims in accordance with the accounting guidance for contingencies that we deem both probable and reasonably estimable and, accordingly, have recorded no reserve for legal claims as of
December 31, 2016
and
2015
.
Rockies Express
Mineral Management Service Lawsuit
On June 30, 2009, Rockies Express filed claims against Mineral Management Service, a former unit of the U.S. Department of Interior (collectively "Interior") for breach of its contractual obligation to sign transportation service agreements for pipeline capacity that it had agreed to take on Rockies Express. The Civilian Board of Contract Appeals ("CBCA") conducted a trial and ruled that Interior was liable for breach of contract, but limited the damages Interior was required to pay. On September 13, 2013, the United States Court of Appeals for the Federal Circuit issued a decision affirming that Interior was liable for its breach of contract, but reversing the CBCA's decision to limit damages. The case was remanded to the CBCA for the purpose of calculating damages at a hearing. On May 20, 2016, Rockies Express and Interior agreed to resolve the claims in this matter in exchange for a
$65 million
cash payment to Rockies Express. Interior paid the amount due Rockies Express on June 23, 2016.
124
Ultra Resources
In early 2016, Ultra Resources, Inc. ("Ultra") defaulted on its firm transportation service agreement for approximately
0.2
Bcf/d through November 11, 2019. In late March 2016, Rockies Express terminated Ultra's service agreement. On April 14, 2016, Rockies Express filed a lawsuit against Ultra for breach of contract and damages in Harris County, Texas, seeking approximately
$303 million
in damages and other relief. On April 29, 2016, Ultra and certain of its debtor affiliates filed for protection under Chapter 11 of the United States Bankruptcy Code in United States Bankruptcy Court for the Southern District of Texas, which operated as a stay of the Harris County state court proceeding.
On January 12, 2017, Rockies Express and Ultra entered into an agreement to settle Rockies Express' approximately
$303 million
claim against Ultra's bankruptcy estate. The settlement agreement includes Ultra's agreement to: (i) make a cash payment to Rockies Express of
$150 million
in accordance with the plan of reorganization, but no later than October 30, 2017; and (ii) enter a new, seven-year firm transportation agreement with Rockies Express commencing December 1, 2019, for west-to-east service of
0.2
Bcf/d at a rate of approximately
$0.37
, or approximately
$26.8 million
annually. The settlement is part of Ultra's Chapter 11 reorganization plan, which must be submitted to the U.S. Bankruptcy Court for approval.
Michels Corporation
On June 17, 2014, Michels Corporation ("Michels") filed a complaint and request for relief against Rockies Express in the Court of Common Pleas, Monroe County, Ohio, as a result of work performed by Michels to construct the Seneca Lateral Pipeline in Ohio. Michels sought unspecified damages from Rockies Express and asserted claims of breach of contract, negligent misrepresentation, unjust enrichment and quantum meruit. Michels also filed notices of Mechanic's Liens in Monroe and Noble Counties, asserting
$24.2 million
as the amount due.
On February 2, 2017, Rockies Express and Michels entered into a binding settlement agreement to resolve the claims brought by Michels in exchange for a
$10 million
cash payment by Rockies Express. The cash payment will be paid promptly after entering into the definitive agreement with respect to the settlement.
Environmental, Health and Safety
We are subject to a variety of federal, state and local laws that regulate permitted activities relating to air and water quality, waste disposal, and other environmental matters. We believe that compliance with these laws will not have a material adverse impact on our business, cash flows, financial position or results of operations. However, there can be no assurances that future events, such as changes in existing laws, the promulgation of new laws, or the development of new facts or conditions will not cause us to incur significant costs. We had environmental reserves of
$4.0 million
and
$4.8 million
at
December 31, 2016
and
2015
, respectively.
TMID
Casper Plant, EPA Notice of Violation
In August 2011, the EPA and the Wyoming Department of Environmental Quality ("WDEQ") conducted an inspection of the Leak Detection and Repair ("LDAR") Program at the Casper Gas Plant in Wyoming. In September 2011, TMID received a letter from the EPA alleging violations of the Standards of Performance of Equipment Leaks for Onshore Natural Gas Processing Plant requirements under the Clean Air Act. TMID received a letter from the EPA concerning settlement of this matter in April 2013 and received additional settlement communications from the EPA and Department of Justice beginning in July 2014. Settlement negotiations are continuing, including the expected inclusion of TIGT as a party to any possible settlement as a result of TIGT owning a compressor that is located adjacent to the Casper Gas Plant site.
Casper Mystery Bridge Superfund Site
The Casper Gas Plant is part of the Mystery Bridge Road/U.S. Highway 20 Superfund Site also known as Casper Mystery Bridge Superfund Site. Remediation work at the Casper Gas Plant has been completed and we have requested that the portion of the site attributable to us be delisted from the National Priorities List.
Casper Gas Plant
On November 25, 2014, WDEQ issued a Notice of Violation for violations of Part 60 Subpart OOOO related to the Depropanizer project (wv-14388, issued 7/9/13) in Docket No. 5506-14. TMID had discussed the issues in a meeting with WDEQ in Cheyenne on November 17, 2014, and submitted a disclosure on November 20, 2014 detailing the regulatory issues and potential violations. The project triggered a modification of Subpart OOOO for the entire plant. The project equipment as well as plant equipment subjected to Subpart OOOO was not monitored timely, and initial notification was not made timely. Settlement negotiations with WDEQ are currently ongoing.
125
Trailblazer
Pipeline Integrity Management Program
Trailblazer is currently operating at less than its current maximum allowable operating pressure ("MAOP"), public notice of which was first provided in June 2014. As a result of smart tool surveys in 2014, Trailblazer has identified approximately
25
-
35
miles of pipe that will likely need to be repaired or replaced in order for the pipeline to operate at its MAOP of
1,000
pounds per square inch across all segments of the Trailblazer Pipeline. Such repair or replacement will likely occur over a period of years, depending upon the remediation and repair plan implemented by Trailblazer. Segments of the Trailblazer Pipeline that require full replacement could cost as much as
$2.7 million
per mile and repair costs on sections of the pipeline that do not require full replacement are expected to be less on a per mile basis. The current pressure reduction is not expected to prevent Trailblazer from fulfilling its firm service obligations at existing subscription levels and to date it has not had a material adverse financial impact on us.
With respect to the approximately
25
-
35
miles of pipe that has been identified, Trailblazer completed
32
excavation digs in 2015 at an aggregate cost of approximately
$1.3 million
. During 2016, Trailblazer completed additional excavation digs and replaced approximately
8
miles of pipe at an aggregate cost of approximately
$19.0 million
. Trailblazer is currently exploring all possible cost recovery options to recover such out of pocket costs, including recovery through a general rate increase, negotiated rate agreements with its customers, or other FERC-approved recovery mechanisms.
In connection with TEP's acquisition of the Trailblazer Pipeline, TD agreed to contractually indemnify TEP for any out of pocket costs incurred between April 1, 2014 and April 1, 2017 related to repairing or remediating the Trailblazer Pipeline, to the extent that such actions are necessitated by external corrosion caused by the pipeline's disbonded Hi-Melt CTE coating. The contractual indemnity provided by TD is capped at
$20 million
and is subject to an annual
$1.5 million
deductible. In connection with the 2016 repairs and remediation on the Trailblazer Pipeline, TEP has received
$17.9 million
from TD pursuant to the contractual indemnity.
Pony Express
Pipeline Integrity
In connection with certain crack tool runs on the Pony Express System completed in 2015 and 2016, Pony Express completed approximately
$9.8 million
of remediation for anomalies identified on the Pony Express System associated with portions of the pipeline converted from natural gas to crude oil service, and expects to complete additional remediation in 2017 on the Pony Express System of approximately
$9 million
.
Terminals
System Failures
In January 2017,
10,000
bbls of crude oil were released at the Sterling Terminal, which was acquired as part of the Terminals acquisition on January 1, 2017 as discussed in
Note 22
–
Subsequent Events
. Initial reviews indicate that the release was restricted to the containment area located at the Sterling Terminal and was the result of a defective roof drain system on a storage tank. To date, approximately
9,000
bbls have been recovered. We believe that the total cost to remediate the release will be less than
$500,000
.
20. Reportable Segments
Our operations are located in the United States. We are organized into
three
reportable segments: (1) Crude Oil Transportation & Logistics, (2) Natural Gas Transportation & Logistics, and (3) Processing & Logistics.
Crude Oil Transportation & Logistics
The Crude Oil Transportation & Logistics segment is engaged in the ownership and operation of the Pony Express System, which is a FERC-regulated crude oil pipeline serving the Bakken Shale, Denver-Julesburg and Powder River Basins, and other nearby oil producing basins. The mainline portion of the Pony Express System was placed in service in October 2014. The Pony Express System also includes a lateral pipeline in Northeast Colorado, which interconnects with the Pony Express System just east of Sterling, Colorado and was placed in service in the second quarter of 2015.
Natural Gas Transportation & Logistics
The Natural Gas Transportation & Logistics segment is engaged in the ownership and operation of FERC-regulated interstate natural gas pipelines and integrated natural gas storage facilities that provide services to on-system customers (such as third-party LDCs), industrial users and other shippers. The Natural Gas Transportation & Logistics segment includes our
25%
membership interest in Rockies Express effective May 6, 2016, as discussed in
Note 4
–
Acquisitions
.
126
Processing & Logistics
The Processing & Logistics segment is engaged in the ownership and operation of natural gas processing, treating and fractionation facilities that produce NGLs and residue gas that is sold in local wholesale markets or delivered into pipelines for transportation to additional end markets, as well as water business services provided primarily to the oil and gas exploration and production industry and the transportation of NGLs.
Corporate and Other
Corporate and Other includes corporate overhead costs that are not directly associated with the operations of our reportable segments, such as interest and fees associated with our revolving credit facility, public company costs, and equity-based compensation expense.
These segments are monitored separately by management for performance and are consistent with internal financial reporting. These segments have been identified based on the differing products and services, regulatory environment and the expertise required for their respective operations.
The following tables set forth our segment information for the periods indicated:
|
Year Ended December 31,
|
|||||||||||||||||||||||||||||||||||
|
|
2016
|
2015
|
2014
|
||||||||||||||||||||||||||||||||
|
Revenue:
|
Total
Revenue |
Inter-
Segment |
External
Revenue |
Total
Revenue |
Inter-
Segment |
External
Revenue |
Total
Revenue |
Inter-
Segment |
External
Revenue |
||||||||||||||||||||||||||
|
|
(in thousands)
|
||||||||||||||||||||||||||||||||||
|
Crude Oil Transportation & Logistics
|
$
|
380,503
|
|
$
|
—
|
|
$
|
380,503
|
|
$
|
304,227
|
|
$
|
—
|
|
$
|
304,227
|
|
$
|
28,343
|
|
$
|
—
|
|
$
|
28,343
|
|
||||||||
|
Natural Gas Transportation & Logistics
|
128,869
|
|
(5,641
|
)
|
123,228
|
|
131,657
|
|
(5,384
|
)
|
126,273
|
|
140,080
|
|
(5,257
|
)
|
134,823
|
|
|||||||||||||||||
|
Processing & Logistics
|
101,391
|
|
—
|
|
101,391
|
|
105,697
|
|
—
|
|
105,697
|
|
208,390
|
|
—
|
|
208,390
|
|
|||||||||||||||||
|
Corporate and Other
|
—
|
|
—
|
|
—
|
|
—
|
|
—
|
|
—
|
|
—
|
|
—
|
|
—
|
|
|||||||||||||||||
|
Total revenue
|
$
|
610,763
|
|
$
|
(5,641
|
)
|
$
|
605,122
|
|
$
|
541,581
|
|
$
|
(5,384
|
)
|
$
|
536,197
|
|
$
|
376,813
|
|
$
|
(5,257
|
)
|
$
|
371,556
|
|
||||||||
|
|
Year Ended December 31, 2016
|
||||||||||
|
Operating Income:
|
Total
Operating Income |
Inter-
Segment |
External
Operating Income |
||||||||
|
|
(in thousands)
|
||||||||||
|
Crude Oil Transportation & Logistics
|
$
|
215,784
|
|
$
|
5,383
|
|
$
|
221,167
|
|
||
|
Natural Gas Transportation & Logistics
|
49,907
|
|
(5,641
|
)
|
44,266
|
|
|||||
|
Processing & Logistics
|
1,081
|
|
258
|
|
1,339
|
|
|||||
|
Corporate and Other
|
(12,598
|
)
|
—
|
|
(12,598
|
)
|
|||||
|
Total Operating Income
|
$
|
254,174
|
|
$
|
—
|
|
$
|
254,174
|
|
||
|
Reconciliation to Net Income:
|
|||||||||||
|
Interest expense, net
|
(45,601
|
)
|
|||||||||
|
Equity in earnings of unconsolidated investment
|
51,780
|
|
|||||||||
|
Unrealized loss on derivative instrument
|
(1,291
|
)
|
|||||||||
|
Other income, net
|
1,723
|
|
|||||||||
|
Net Income before tax
|
$
|
260,785
|
|
||||||||
127
|
|
Year Ended December 31, 2015
|
||||||||||
|
Operating Income:
|
Total
Operating Income |
Inter-
Segment |
External
Operating Income |
||||||||
|
|
(in thousands)
|
||||||||||
|
Crude Oil Transportation & Logistics
|
$
|
159,467
|
|
$
|
5,384
|
|
$
|
164,851
|
|
||
|
Natural Gas Transportation & Logistics
|
41,802
|
|
(5,384
|
)
|
36,418
|
|
|||||
|
Processing & Logistics
|
4,728
|
|
—
|
|
4,728
|
|
|||||
|
Corporate and Other
|
(9,366
|
)
|
—
|
|
(9,366
|
)
|
|||||
|
Total Operating Income
|
$
|
196,631
|
|
$
|
—
|
|
$
|
196,631
|
|
||
|
Reconciliation to Net Income:
|
|||||||||||
|
Interest expense, net
|
(18,330
|
)
|
|||||||||
|
Other income, net
|
2,413
|
|
|||||||||
|
Net Income before tax
|
$
|
180,714
|
|
||||||||
|
|
Year Ended December 31, 2014
|
||||||||||
|
Operating Income:
|
Total
Operating Income |
Inter-
Segment |
External
Operating Income |
||||||||
|
|
(in thousands)
|
||||||||||
|
Crude Oil Transportation & Logistics
|
$
|
3,601
|
|
$
|
—
|
|
$
|
3,601
|
|
||
|
Natural Gas Transportation & Logistics
|
40,887
|
|
$
|
(4,015
|
)
|
36,872
|
|
||||
|
Processing & Logistics
|
20,577
|
|
—
|
|
20,577
|
|
|||||
|
Corporate and Other
|
(7,637
|
)
|
—
|
|
(7,637
|
)
|
|||||
|
Total Operating Income
|
$
|
57,428
|
|
$
|
(4,015
|
)
|
$
|
53,413
|
|
||
|
Reconciliation to Net Income:
|
|||||||||||
|
Interest expense, net
|
(7,292
|
)
|
|||||||||
|
Gain on remeasurement of unconsolidated investment
|
9,388
|
|
|||||||||
|
Equity in earnings of unconsolidated investment
|
717
|
|
|||||||||
|
Other income, net
|
3,103
|
|
|||||||||
|
Net Income before tax
|
$
|
59,329
|
|
||||||||
|
Year Ended December 31,
|
|||||||||||
|
Depreciation and Amortization Expense:
|
2016
|
2015
|
2014
|
||||||||
|
|
(in thousands)
|
||||||||||
|
Crude Oil Transportation & Logistics
|
$
|
51,362
|
|
$
|
47,168
|
|
$
|
12,067
|
|
||
|
Natural Gas Transportation & Logistics
|
20,976
|
|
22,927
|
|
23,788
|
|
|||||
|
Processing & Logistics
|
12,558
|
|
13,381
|
|
11,193
|
|
|||||
|
Corporate and Other
|
—
|
|
—
|
|
—
|
|
|||||
|
Total depreciation and amortization expense
|
$
|
84,896
|
|
$
|
83,476
|
|
$
|
47,048
|
|
||
128
|
Year Ended December 31,
|
|||||||||||
|
Capital Expenditures:
|
2016
|
2015
|
2014
|
||||||||
|
|
(in thousands)
|
||||||||||
|
Crude Oil Transportation & Logistics
|
$
|
29,893
|
|
$
|
38,802
|
|
$
|
631,883
|
|
||
|
Natural Gas Transportation & Logistics
|
28,475
|
|
10,478
|
|
20,580
|
|
|||||
|
Processing & Logistics
|
12,351
|
|
16,107
|
|
13,187
|
|
|||||
|
Corporate and Other
|
—
|
|
—
|
|
—
|
|
|||||
|
Total capital expenditures
|
$
|
70,719
|
|
$
|
65,387
|
|
$
|
665,650
|
|
||
|
Assets:
|
December 31, 2016
|
December 31, 2015
|
|||||
|
|
(in thousands)
|
||||||
|
Crude Oil Transportation & Logistics
|
$
|
1,410,654
|
|
$
|
1,439,418
|
|
|
|
Natural Gas Transportation & Logistics
|
1,176,117
|
|
706,576
|
|
|||
|
Processing & Logistics
|
411,999
|
|
409,795
|
|
|||
|
Corporate and Other
|
543,468
|
|
460,871
|
|
|||
|
Total assets
|
$
|
3,542,238
|
|
$
|
3,016,660
|
|
|
21. Selected Quarterly Financial Data (Unaudited)
The following tables summarize our unaudited quarterly financial data for
2016
and
2015
:
|
Quarter Ended 2016
|
|||||||||||||||
|
First
|
Second
|
Third
|
Fourth
|
||||||||||||
|
(in thousands, except per unit amounts)
|
|||||||||||||||
|
Total revenues
|
$
|
145,405
|
|
$
|
146,931
|
|
$
|
152,125
|
|
$
|
160,661
|
|
|||
|
Operating income
|
$
|
60,469
|
|
$
|
59,347
|
|
$
|
64,030
|
|
$
|
70,328
|
|
|||
|
Net income
|
$
|
40,621
|
|
$
|
84,609
|
|
$
|
56,791
|
|
$
|
61,023
|
|
|||
|
Net income attributable to TEGP
|
$
|
7,589
|
|
$
|
3,448
|
|
$
|
7,041
|
|
$
|
8,716
|
|
|||
|
Net income allocable to noncontrolling interests
|
$
|
(33,032
|
)
|
$
|
(81,161
|
)
|
$
|
(49,750
|
)
|
$
|
(52,307
|
)
|
|||
|
Basic net income per Class A Share
|
$
|
0.16
|
|
$
|
0.07
|
|
$
|
0.15
|
|
$
|
0.17
|
|
|||
|
Diluted net income per Class A Share
|
$
|
0.16
|
|
$
|
0.07
|
|
$
|
0.15
|
|
$
|
0.17
|
|
|||
|
Quarter Ended 2015
|
|||||||||||||||
|
First
|
Second
|
Third
|
Fourth
|
||||||||||||
|
(in thousands, except per unit amounts)
|
|||||||||||||||
|
Total revenues
|
$
|
114,675
|
|
$
|
132,970
|
|
$
|
138,168
|
|
$
|
150,384
|
|
|||
|
Operating income
|
$
|
25,718
|
|
$
|
56,105
|
|
$
|
52,405
|
|
$
|
62,403
|
|
|||
|
Net income
|
$
|
22,990
|
|
$
|
50,623
|
|
$
|
46,097
|
|
$
|
68,281
|
|
|||
|
Net income attributable to TEGP
|
$
|
5,122
|
|
$
|
4,734
|
|
$
|
4,423
|
|
$
|
17,677
|
|
|||
|
Net income allocable to noncontrolling interests
|
$
|
(17,868
|
)
|
$
|
(45,889
|
)
|
$
|
(41,674
|
)
|
$
|
(50,604
|
)
|
|||
|
Basic net income per Class A Share
|
N/A
|
|
$
|
0.05
|
|
$
|
0.09
|
|
$
|
0.37
|
|
||||
|
Diluted net income per Class A Share
|
N/A
|
|
$
|
0.05
|
|
$
|
0.09
|
|
$
|
0.37
|
|
||||
22. Subsequent Events
Acquisition of Tallgrass Terminals, LLC and Tallgrass NatGas Operator, LLC
Effective January 1, 2017, TEP acquired
100%
of the issued and outstanding membership interests in Tallgrass Terminals, LLC ("Terminals") and
100%
of the issued and outstanding membership interests in Tallgrass NatGas Operator, LLC ("NatGas") from TD for total cash consideration of
$140 million
.
129
Terminals owns several fully operational assets providing storage capacity and additional injection points for the Pony Express System, including the Sterling Terminal near Sterling, Colorado, the Buckingham Terminal in northeast Colorado, and a
20%
interest in the Deeprock Development Terminal in Cushing, Oklahoma. Terminals also owns projects currently under development, including acreage in Cushing, Oklahoma and Guernsey, Wyoming which is under development to provide additional storage capacity and other potential opportunities.
NatGas is the operator of the Rockies Express Pipeline and receives a fee from Rockies Express as compensation for its services.
Ultra Settlement
In January 2017, Rockies Express reached an agreement to settle its breach of contract claim against Ultra Resources, Inc. See
Note 19
–
Legal and Environmental Matters
for further discussion.
130
None.
Evaluation of Disclosure Controls and Procedures
As required by Rule 13a-15(b) of the Exchange Act, we have evaluated, under the supervision and with the participation of our management, including our principal executive officer and principal financial officer, the effectiveness of the design and operation of our disclosure controls and procedures (as defined in Rules 13a-15(e) and 15d-15(e) under the Exchange Act) as of the end of the period covered by this report. Our disclosure controls and procedures are designed to provide reasonable assurance that the information required to be disclosed by us in reports that we file or submit under the Exchange Act is recorded, processed, summarized and reported within the time periods specified in the rules and forms of the SEC, and such information is accumulated and communicated to our management, including our principal executive officer and principal financial officer, as appropriate, to allow timely decisions regarding required disclosure. Based upon their evaluation of those controls and procedures performed as of
December 31, 2016
, our principal executive officer and principal financial officer concluded that our disclosure controls and procedures were effective at the reasonable assurance level.
Management's Report on Internal Control over Financial Reporting
Our management is responsible for establishing and maintaining adequate internal control over financial reporting (as defined in Rules 13a-15(f) and 15d-15(f) under the Exchange Act). Our internal control over financial reporting is a process designed under the supervision of our principal executive officer and principal financial officer to provide reasonable assurance regarding the reliability of financial reporting and the preparation of our financial statements for external purposes in accordance with generally accepted accounting principles.
As of
December 31, 2016
, management assessed the effectiveness of our internal control over financial reporting based on the criteria for effective internal control over financial reporting established in the 2013 "Internal Control - Integrated Framework," issued by the Committee of Sponsoring Organizations of the Treadway Commission. Based on this assessment and those criteria, management determined that we maintained effective internal control over financial reporting as of
December 31, 2016
.
Because of its inherent limitations, internal control over financial reporting may not prevent or detect misstatements. Also, projections of any evaluation of effectiveness to future periods are subject to the risk that controls may become inadequate because of changes in conditions, or that the degree of compliance with the policies or procedures may deteriorate.
Our independent registered public accounting firm, PricewaterhouseCoopers LLP, audited the effectiveness of our internal control over financial reporting as of
December 31, 2016
, as stated in their report included in Item 8.—Financial Statements and Supplementary Data of this Annual Report.
Changes in Internal Control over Financial Reporting
There have not been any changes in our internal control over financial reporting (as such term is defined in Rules 13a-15(f) and 15d-15(f) under the Exchange Act) during the quarter ended
December 31, 2016
that have materially affected, or are reasonably likely to materially affect, our internal control over financial reporting.
None.
131
We are a limited partnership and have no officers or directors. Unless otherwise indicated, references to our officers and directors in Items 10 through 14 of this Annual Report refer to the officers and directors of our general partner.
Management of Tallgrass Energy GP, LP
Our general partner's board of directors and executive officers manage our operations and activities. Our general partner is not elected by our Class A shareholders and will not be subject to re-election in the future. Directors of our general partner oversee our operations. Class A shareholders are not entitled to elect the directors of our general partner or directly or indirectly participate in our management or operations.
Unlike shareholders in a publicly traded corporation, our shareholders are not entitled to select our general partner or elect the members of the board of directors of our general partner. Tallgrass Energy Holdings is the sole owner of our general partner and has the right to appoint the entire board of directors of our general partner, including our independent directors. EMG, Kelso and Tallgrass KC own, in the aggregate, approximately 100% of the outstanding membership interests in Tallgrass Energy Holdings. All of the executive officers and certain of the directors of our general partner are also officers and/or directors of TEP GP and Tallgrass Energy Holdings.
Neither we nor our general partner have any employees. Although all of the employees that conduct our business are employed by Tallgrass Management, we sometimes refer to these individuals in this Annual Report as our employees.
As of December 31, 2016, the board of directors of our general partner had eight directors, three of whom the board has determined meet the independence standards established by the NYSE and the Exchange Act. The three independent directors are Jeffrey A. Ball (for purposes of audit committee participation only), Thomas A. Gerke, and W. Curtis Koutelas. The NYSE does not require a publicly-traded limited partnership like ours to have a majority of independent directors on the board of directors of its general partner or to establish a compensation or a nominating and corporate governance committee. However, our general partner is required to have an audit committee of at least three members, and all of its members are required to meet the independence and experience standards established by the NYSE and the Exchange Act. As of December 31, 2016, the audit committee of the board of directors of our general partner had three members, each of whom meet the independence standards established by the NYSE and the Exchange Act.
In evaluating director candidates, Tallgrass Energy Holdings assesses whether a candidate possesses the integrity, judgment, knowledge, experience, skill and expertise that are likely to enhance the board's ability to manage and direct our affairs and business, including, when applicable, to enhance the ability of committees of the board to fulfill their duties.
All of the executive officers of our general partner are also officers of TEP GP, Tallgrass Equity, and Tallgrass Energy Holdings. Our officers will devote such portion of their business time to our business and affairs as they deem reasonably required to manage and conduct our operations. Neither our general partner nor TEP's general partner and its affiliates currently receive any management fee in connection with the management of our business, but Tallgrass Equity reimburses our general partner for all expenses it incurs and payments it makes on our behalf pursuant to our partnership agreement. In addition, Tallgrass Equity reimburses Tallgrass Energy Holdings and its affiliates for all expenses it incurs and payments it makes on our behalf pursuant to the TEGP Omnibus Agreement, including the costs of employee and director compensation and benefits as well as the cost of the provision of certain corporate, general and administrative services in each case to the extent properly allocable to us. Any direct expenses associated with being a separate publicly traded entity are borne by Tallgrass Equity. Neither our partnership agreement nor the TEGP Omnibus Agreement limits the amount of expenses for which our general partner, Tallgrass Energy Holdings and their respective affiliates may be reimbursed. For more information, see "
Certain Relationships and Related Party Transactions, and Director Independence-Omnibus Agreement."
132
Directors and Executive Officers of Our General Partner and TEP GP
The following table sets forth certain information with respect to the executive officers and directors of our general partner as of
February 15, 2017
. The table also shows certain individuals who serve as directors of TEP GP who are not currently directors of our general partner.
|
Name
|
Age
|
Position with Our General Partner
|
Position with TEP GP
|
|||
|
David G. Dehaemers, Jr.
|
56
|
President, Chief Executive Officer and Director
|
President, Chief Executive Officer and Director
|
|||
|
William R. Moler
|
51
|
Executive Vice President, Chief Operating Officer and Director
|
Executive Vice President, Chief Operating Officer and Director
|
|||
|
Gary J. Brauchle
|
43
|
Executive Vice President and Chief Financial Officer
|
Executive Vice President and Chief Financial Officer
|
|||
|
Christopher R. Jones
|
40
|
Vice President, General Counsel and Secretary
|
Vice President, General Counsel and Secretary
|
|||
|
Richard L. Bullock
|
61
|
Vice President, Human Resources, Tax and Risk Management
|
Vice President, Human Resources, Tax and Risk Management
|
|||
|
Gary D. Watkins
|
44
|
Vice President and Chief Accounting Officer
|
Vice President and Chief Accounting Officer
|
|||
|
Frank J. Loverro
|
47
|
Director
|
Director
|
|||
|
Stanley de J. Osborne
|
46
|
Director
|
Director
|
|||
|
Jeffrey A. Ball
|
42
|
Director
|
Director
|
|||
|
John T. Raymond
|
46
|
Director
|
Director
|
|||
|
Thomas A. Gerke
|
60
|
Director
|
n/a
|
|||
|
W. Curtis Koutelas
|
55
|
Director
|
n/a
|
|||
|
Terrance D. Towner
|
58
|
n/a
|
Director
|
|||
|
Roy N. Cook
|
59
|
n/a
|
Director
|
|||
|
Jeffrey R. Armstrong
|
47
|
n/a
|
Director
|
|||
Our directors hold office until the earlier of their death, resignation, removal or disqualification or until their successors are duly elected or qualified. Officers serve at the discretion of the board of directors. There are no family relationships among any of the directors or executive officers of our general partner.
David G. Dehaemers, Jr.
has been a director and the President and Chief Executive Officer of TEP GP since February 2013 and of our general partner since February 2015. Mr. Dehaemers has served as the President and Chief Executive Officer of Tallgrass Equity since February 2013 and as a director and the President and Chief Executive Officer of Tallgrass Energy Holdings since August 2012. Prior to joining our general partner, Mr. Dehaemers served as Co-Founder, Chief Executive Officer and Chief Investment Officer of Tallgrass MLP Fund I, L.P., a private MLP Investment Fund from 2008 to 2012. Mr. Dehaemers also served as Executive Vice President of corporate development at Inergy, LP, or NRGY, from 2003 to 2007. Mr. Dehaemers played a role in NRGY's corporate development group, where he focused on developing its long-term expansion strategies in the midstream area, which included acquisitions and expansion projects in excess of $500 million. Mr. Dehaemers also was an owner of Inergy Holdings, L.P., or NRGP, when that entity went public in 2005. Before Inergy, Mr. Dehaemers was part of the executive management team of Kinder Morgan, Inc. and Kinder Morgan Energy Partners, LP from 1997 to 2003, where he served as the Chief Financial Officer from 1997 to 2000. In 2000, Mr. Dehaemers assumed responsibility for Kinder Morgan's corporate development efforts, in which role he and his team developed and executed Kinder Morgan's growth strategies. Mr. Dehaemers holds an undergraduate degree in Accounting from Creighton University in Omaha, Nebraska and is a Certified Public Accountant. He also holds a Juris Doctorate in Law from University of Missouri-Kansas City. We believe that Mr. Dehaemers' education and experience, coupled with the leadership qualities demonstrated by his executive background, bring important experience and skill to the boards of directors of our general partner and of TEP GP.
William R. Moler
has been a director, Executive Vice President and Chief Operating Officer of TEP GP since February 2013 and of our general partner since February 2015. Mr. Moler has also served as Executive Vice President and Chief Operating Officer of Tallgrass Equity since February 2013 and as a director, Executive Vice President and Chief Operating Officer of Tallgrass Energy Holdings since October 2012. From 2004 until his departure in October 2012, Mr. Moler served in various capacities with Inergy, L.P. and its affiliates, most recently as Senior Vice President and Chief Operating Officer of Inergy Midstream, L.P. and President and Chief Operating Officer—Natural Gas Midstream Operations of Inergy, L.P. Prior to joining Inergy, L.P., Mr. Moler was with Westport Resources Corporation from 2002 to 2004, where he served as both General
133
Manager of Marketing and Transportation Services and General Manager of Westport Field Services, LLC. Prior to Westport, Mr. Moler served in various leadership positions at Kinder Morgan, Inc. and its predecessors from 1988 to 2002. Mr. Moler earned a Bachelor of Science degree in Mechanical Engineering from Texas Tech University in 1988. We believe that as a result of his background and knowledge, as well as the attributes of leadership demonstrated by his executive experience, Mr. Moler brings substantial experience and skill to the boards of directors of our general partner and of TEP GP.
Gary J. Brauchle
has been Executive Vice President and Chief Financial Officer of TEP GP since February 2013 and of our general partner since February 2015. Mr. Brauchle has also served as Executive Vice President and Chief Financial Officer of Tallgrass Equity since February 2013 and of Tallgrass Energy Holdings since November 2012. Prior to joining Tallgrass, Mr. Brauchle was Vice President and Chief Accounting Officer at McDermott International, Inc., a global engineering and construction company serving the oil and gas industry during 2012 and as Corporate Controller from 2010 to 2012. He joined McDermott in 2003 and served in various positions of increasing responsibility, including as Director of Internal Audit from 2005 to 2007 and as Director of Operational Accounting and Assistant Controller for an operating subsidiary from 2007 to 2008 and 2008 to 2010, respectively. Mr. Brauchle also served in the Houston office of PricewaterhouseCoopers' energy and utilities practice from 1997 to 2003, including as a Manager from 2001 to 2003, and with a focus on midstream master limited partnerships, or MLPs. Mr. Brauchle was a postgraduate technical assistant at the Financial Accounting Standards Board (FASB) from 1996 to 1997. Mr. Brauchle is a Certified Public Accountant and a graduate of Texas A&M University, where he received a Master of Science in Accounting in 1996 and a Bachelor of Business Administration in Accounting in 1995.
Christopher R. Jones
has been Vice President, General Counsel and Secretary of our general partner, TEP GP and Tallgrass Energy Holdings since May 2016. Previously, Mr. Jones served as Tallgrass's Assistant General Counsel, beginning in October 2012. Prior to joining Tallgrass, Mr. Jones was an attorney with the law firm that is now known as Stinson Leonard Street LLP from 2003 to 2012, becoming a partner in 2008. Mr. Jones holds an undergraduate degree and a Juris Doctorate in Law from the University of Kansas.
Richard L. Bullock
has been Vice President of Human Resources, Tax and Risk Management of TEP GP since February 2013 and of our general partner since February 2015. Mr. Bullock has also served as Vice President of Human Resources, Tax and Risk Management of Tallgrass Equity since February 2013 and of Tallgrass Energy Holdings since November 2012. Previously, Mr. Bullock served as the Vice President, Chief Financial Officer and Treasurer of Tallgrass Development and its general partner. Mr. Bullock previously served as Vice President and Chief Financial Officer of Tallgrass MLP Fund I, L.P. from 2008 to 2011. Prior to Tallgrass, Mr. Bullock worked at Kinder Morgan Energy Partners, L.P. Mr. Bullock joined Kinder Morgan Energy Partners, L.P. in 1997 where he served as Vice President, Controller and Chief Accounting Officer through 2002 and, thereafter served as Vice President-Tax through October 2008. In those roles, Mr. Bullock was principally responsible for all quarterly and annual SEC filings, integrating the accounting and financial reporting functions for acquisitions, tax compliance and tax planning for both Kinder Morgan Energy Partners, L.P. and Kinder Morgan, Inc. Mr. Bullock is a Certified Public Accountant. He received his undergraduate degree in Accounting from Missouri State University in Springfield, Missouri.
Gary D. Watkins
has been Vice President and Chief Accounting Officer and the principal accounting officer of TEP GP since April 2014 and of our general partner since February 2015. Mr. Watkins has also served as Vice President and Chief Accounting Officer of Tallgrass Equity and of Tallgrass Energy Holdings since February 2015. Previously, Mr. Watkins served as Vice President, Controller and principal accounting officer of DCP Midstream Partners, LP and DCP Midstream, LLC from May 2011 until April 2014. Prior to that, Mr. Watkins had held the positions of Senior Director—Marketing Accounting and Director of Corporate Accounting with DCP Midstream, LLC. Prior to joining DCP Midstream, LLC in November 2004, Mr. Watkins held various positions of increasing responsibility at Advanced Energy Industries, Inc. Mr. Watkins also served in the Denver offices of Arthur Andersen LLP and KPMG LLP from 1996 through 2002.
Frank J. Loverro
has served as a director of TEP GP since February 2013 and of our general partner since February 2015. Mr. Loverro has also served as a director of Tallgrass Energy Holdings since August 2012. Mr. Loverro joined Kelso in 1993, has been Managing Director since 2004 and a Member of Kelso's Management Committee since 2013, and in 2016 became Co-CEO. He spent the preceding three years in the private equity investment and high yield groups at The First Boston Corporation. Mr. Loverro is also a director of Ajax Resources, LLC, Delphin Shipping LLC, Hunt Marcellus, LLC, and Poseidon Containers Holdings LLC. Mr. Loverro was also a director of Buckeye GP LLC. Mr. Loverro received a B.A. in Economics with Distinction from the University of Virginia in 1991. Mr. Loverro has extensive experience in corporate financing and in evaluating the financial performance and operations of companies across a variety of business sectors, including the energy sector. We believe that this background, in addition to Mr. Loverro's valuable experience serving on the boards of various public and private companies, provides an important source of insight and perspective to the boards of directors of our general partner and of TEGP Management.
134
Stanley de J. Osborne
has served as a director of TEP GP since February 2013 and of our general partner since February 2015. Mr. Osborne has also served as a director of Tallgrass Energy Holdings since August 2012. Mr. Osborne joined Kelso in 1998 and has been Managing Director since 2007. He spent the preceding two years as an Associate at Summit Partners. He spent the previous three years at J.P. Morgan & Co. as an Associate in the Private Equity Group and an Analyst in the Financial Institutions Group. Mr. Osborne is also a director of Ajax Resources, LLC, 4Refuel Canada LP, Hunt Marcellus, LLC, Logan's Roadhouse, Inc., Traxys S.a.r.l, Power Team Services, LLC and LBM Acquisition, LLC. Mr. Osborne was also previously a director of CVR Energy, Inc. and Global Geophysical Services, Inc. Mr. Osborne received a B.A. in Government from Dartmouth College in 1993. Mr. Osborne has extensive experience in corporate financing and in evaluating the financial performance and operations of companies across a variety of business sectors, including the energy sector. We believe that this background, in addition to Mr. Osborne's valuable experience serving on the boards of various public and private companies, provides an important source of insight and perspective to the boards of directors of our general partner and of TEGP Management.
Jeffrey A. Ball
has served as a director of TEP GP since May 2013 and of our general partner since February 2015. Mr. Ball has also served as the Chairman of the audit committee of TEP GP since May 2013 and as the Chairman of the audit committee of our general partner since April 2015. Further, Mr. Ball has served as a director of Tallgrass Energy Holdings since August 2012. Mr. Ball is a Managing Director at EMG, a diversified natural resource private equity fund manager, and is responsible for transaction origination, structuring and execution, portfolio company management and investment realization. Prior to joining EMG in October 2007, Mr. Ball was a Director in the investment banking group at Credit Suisse Securities (USA), LLC, covering the energy industry with a particular focus on MLPs and the midstream sector. Mr. Ball has completed over $53 billion of mergers and acquisitions and capital markets financing transactions during his career in the energy and minerals sector. Mr. Ball currently serves on the Boards of Ferus Inc., Ferus GP LLC, Ferus Natural Gas Fuels Inc., Ferus Natural Gas Fuels GP, LLC, Ferus Natural Gas Fuels (CNG), LLC, Ascent Resources, LLC, PRES Holdings, LLC and is a board observer of MarkWest Utica EMG, LLC. Mr. Ball received a B.S. in Economics with honors from the Wharton School at the University of Pennsylvania. We believe that Mr. Ball's experience with mergers & acquisitions and financings of a variety of MLPs and other midstream assets provides a valuable resource to the boards of directors of our general partner and of TEP GP.
John T. Raymond
has served as a director of TEP GP since February 2013 and of our general partner since February 2015. Mr. Raymond has also served as a director of Tallgrass Energy Holdings since August 2012. Mr. Raymond is an owner and founder of The Energy & Minerals Group. EMG is a diversified natural resource private equity fund manager with approximately $14.6 billion of regulatory assets under management (RAUM) as of September 30, 2016. EMG has allocated approximately $9.8 billion in commitments across the energy sector since inception. Mr. Raymond has been Managing Partner and CEO since EMG's inception in 2006. Prior to that time, Mr. Raymond held leadership positions with various energy companies, including President and CEO of Plains Resources Inc., President and Chief Operating Officer of Plains Exploration and Production Company and Director of Development for Kinder Morgan, Inc. Mr. Raymond currently serves on numerous other boards, including the board of directors of each of NGL Energy Holdings, LLC, the general partner of NGL Energy Partners, LP, Plains All American GP LLC, the general partner of Plains All American Pipeline, LP, and PAA GP Holdings LLC, the general partner of Plains GP Holdings, LP. Mr. Raymond received a BSM degree from the A.B. Freeman School of Business at Tulane University with dual concentrations in finance and accounting. We believe that Mr. Raymond's experience with investment in and management of a variety of upstream and midstream assets and operations provides a valuable resource to the boards of directors of our general partner and of TEP GP.
Thomas A. Gerke
has served as a director of our general partner and as a member of the audit committee of our general partner since August 2015. Mr. Gerke is currently serving, and has served as the General Counsel and Chief Administrative Officer since May 1, 2016 at H&R Block, the world's largest consumer tax services provider. Previously, he held the position of Chief Legal Officer at H&R Block from January 1, 2012 to May 1, 2016. From January 2011 to April 2011, Mr. Gerke served as Executive Vice President, General Counsel and Secretary of YRC Worldwide, a leading transportation service provider. From July 2009 to December 2010, Mr. Gerke served as Executive Vice Chairman of CenturyLink, a Fortune 500 integrated communications business. From December 2007 to June 2009, he served as President and Chief Executive Officer at Embarq, then a Fortune 500 integrated communications business. He also held the position of Executive Vice President and General Counsel - Law and External Affairs at Embarq from May 2006 to December 2007. From October 1994 through May 2006, Mr. Gerke held a number of executive and legal positions with Sprint, serving as Executive Vice President and General Counsel for over two years. He currently serves as a member of the Board of Directors for Consolidated Communications. He holds a Bachelor of Science degree in Business Administration from the University of Missouri in Columbia, a Masters of Business Administration degree from Rockhurst University and a Juris Doctorate degree from the University of Missouri School of Law in Kansas City. We believe that Mr. Gerke's leadership roles and board experience at a number of Fortune 500 and other large public companies, as well as his legal acumen and background outside of the energy industry, provides a valuable resource to the board of directors of our general partner.
135
W. Curtis Koutelas
has served as a director of our general partner since May 2016. He is also a member of the audit committee of our general partner. Mr. Koutelas founded Arrowhead Contracting Inc. in 1990 and has served as its President for the past 26 years. Arrowhead provides general construction, remedial construction, environmental engineering, facility operations and maintenance and homeland security services to a broad base of federal agencies and large-business prime contractors. In addition to his work with Arrowhead, Mr. Koutelas is dedicated to serving the Kansas City area by participating in volunteer and outreach programs benefiting small businesses, and providing financial assistance to disadvantaged young men and women attending Rockhurst High School and Rockhurst College. Mr. Koutelas holds a Bachelor of Science degree in Construction Management from Pittsburg State University. We believe that Mr. Koutelas's extensive business experience and leadership provides a valuable resource to the board of directors of our general partner.
Terrance D. Towner
has served as a director of TEP GP and as a member of the audit committee of TEP GP since August 2013. Mr. Towner currently provides advisory services to various private equity clients and private companies. Between 2000 and December 2014, Mr. Towner was employed by Watco Companies, a Kansas based transportation company, in various capacities, including Vice Chairman, President, COO and CFO. As President and COO, Mr. Towner was responsible for all operations, safety, quality, human resources, information services and the financial performance of Watco's transportation, mechanical, and terminal and port divisions. Prior to joining Watco, Mr. Towner spent thirteen years in banking including three years as President and CEO of First State Bank & Trust Company of Pittsburg, Kansas. He also served for five years as President of Pitsco, a company that develops and markets computer based education products, and approximately two years as a financial and strategic consultant with Grant Thornton. Following his departure from Grant Thornton, Mr. Towner acquired Joplin.com, an internet service provider located in Joplin, Missouri and subsequently sold the company to Empire District Electric Company, a public utility. Mr. Towner earned his bachelor's degree in Economics from Pittsburg State University in 1981 and his MBA from Pittsburg State University in 1993. We believe that Mr. Towner's business acumen, and a unique perspective on the midstream services industry, helps provide valuable strategic and practical guidance, insight, and perspective to the board of directors of TEP GP.
Roy N. Cook
has served as a director of TEP GP since September 2013. From 2001 to 2013, Mr. Cook was employed by, and held a variety of roles within, the terminals division of Kinder Morgan, focusing on acquisitions, management, design and operations and specializing in the dry bulk side of the terminals business. Prior to 2001, Mr. Cook owned and managed several businesses in the service industry, including Milwaukee Bulk Terminals, Inc. and Dakota Bulk Terminals, Inc., each of which were sold to Kinder Morgan in 2001. Mr. Cook currently owns several small businesses across diverse industries, including a self-storage business, an electrical service company and a commercial real estate management and development company. He graduated from Kansas State University in 1979 with a B.S. degree in Agriculture Economics. We believe that Mr. Cook's MLP experience, and his intricate knowledge of the terminals business provides valuable strategic and practical insight, and perspective to the board of directors of TEP GP.
Jeffrey R. Armstrong
has served as a director of TEP GP and as a member of the audit committee of TEP GP since April 2014. Mr. Armstrong also serves as a director and a member of the audit committee of the general partner of Arc Logistics Partners LP, a publicly traded limited partnership that is principally engaged in the terminalling, storage, throughput and transloading of crude oil and petroleum products. In August 2014, Mr. Armstrong became the Chief Executive Officer of Zenith Energy, LP, a privately held midstream energy company focused on international matters. In October 2014, Mr. Armstrong became the chairman of MID-SHIP Group, a privately held logistics and transportation company. Mr. Armstrong is the Manager and controlling shareholder of MID-SHIP Capital LLC, which owns 100% of MID-SHIP Securities LLC, a member of the Financial Industry Regulatory Authority, or FINRA. From March 2001 until December 2013, Mr. Armstrong was employed by Kinder Morgan and held various positions within the company including Vice President of Corporate Strategy and President of the Terminals division. Prior to 2001, Mr. Armstrong was employed by GATX Corporation where he held various commercial and operational roles including General Manager of the company's east coast operations. He received his bachelor's degree from the U.S. Merchant Marine Academy and an MBA from the University of Notre Dame. We believe that Mr. Armstrong's extensive experience as it relates both to general corporate strategy and specifically to the terminals business, provides valuable insight and perspective to the board of directors of TEP GP.
Audit Committee
The board of directors of our general partner has a standing audit committee which is currently comprised of three directors, Jeffrey A. Ball, Thomas A. Gerke and W. Curtis Koutelas. Each audit committee member has past experience in accounting or related financial management experience. The board has determined that all of our audit committee members are independent under Section 303A.02 of the NYSE listing standards and Rule 10A-3 of the Securities Exchange Act of 1934, as amended. In making the independence determination, the board considered the requirements of the NYSE, the SEC and our Code of Business Conduct and Ethics. Among other factors, the board considered current or previous employment with us, our auditors or their affiliates by the director or his immediate family members, ownership of our voting securities and other material relationships with us. The audit committee has adopted a charter, which has been ratified and approved by the board of directors.
136
Jeffrey A. Ball has been designated by the board as the audit committee's financial expert meeting the requirements promulgated by the SEC and set forth in Item 407(d) of Regulation S-K of the Securities Exchange Act of 1934, as amended, based upon his education and employment experience as more fully detailed in Mr. Ball's biography set forth above. Mr. Ball also acts as the Chairman of our audit committee.
A copy of the Audit Committee Charter is available to any person, free of charge, at our website at www.tallgrassenergy.com.
Conflicts Committee
Our general partner may, from time to time, have a conflicts committee to which the board of directors will appoint at least two independent directors and which may be asked to review specific matters that the board believes may involve conflicts of interest between us and our general partner or the owners of our general partner or between us and TEP or its affiliates. The conflicts committee will determine if the resolution of any conflict of interest referred to it by our general partner is in the best interests of our partnership. There is no requirement that our general partner seek the approval of the conflicts committee for the resolution of any conflict. The members of the conflicts committee may not be officers or employees of our general partner or directors, officers or employees of its affiliates or TEP GP, may not hold an ownership interest in the general partner or its affiliates other than shares or awards under any long-term incentive plan, equity compensation plan or similar plan implemented by the general partner or us, and must meet the independence and experience standards established by the NYSE and the Exchange Act to serve on an audit committee of a board of directors. Currently, only Mr. Gerke and Mr. Koutelas are eligible to serve on the conflicts committee.
Any matters approved by the conflicts committee will be conclusively deemed to have been approved by all of our partners, and shall not constitute a breach by our general partner of any duties it may owe us or our shareholders. Any shareholder challenging any matter approved by the conflicts committee will have the burden of proving that the members of the conflicts committee did not subjectively believe that the matter was in the best interests of our partnership. Moreover, any acts taken or omitted to be taken in reliance upon the advice or opinions of experts such as legal counsel, accountants, appraisers, management consultants and investment bankers, where our general partner (or any members of the board of directors of our general partner including any member of the conflicts committee) reasonably believes the advice or opinion to be within such person's professional or expert competence, shall be conclusively presumed to have been done or omitted in good faith. Our general partner has not established a conflicts committee.
Corporate Governance Guidelines and Code of Business Conduct and Ethics
Our general partner has adopted Corporate Governance Guidelines and a Code of Business Conduct and Ethics applicable to all of our employees, officers and directors with regard to Partnership-related activities. The Corporate Governance Guidelines and the Code of Business Ethics incorporate guidelines designed to deter wrongdoing and to promote honest and ethical conduct and compliance with applicable laws and regulations. They also incorporate expectations of our employees that enable us to provide accurate and timely disclosure in our filings with the SEC and other public communications. A copy of the Corporate Governance Guidelines and the Code of Business Conduct and Ethics are available to any person, free of charge, at our website at www.tallgrassenergy.com.
The Chairman of the audit committee of our general partner, currently Jeffrey A. Ball, presides over any executive session of the board of directors of our general partner in which the members of our management are not present. Interested parties may communicate directly with the independent members of the board of directors of our general partner by submitting in an envelope marked "Confidential" addressed to the "Independent Members of the Board" in care of the Secretary of the General Partner at: Tallgrass Energy GP, LP, 4200 W. 115th Street, Suite 350, Leawood, Kansas 66211.
Section 16(a) Beneficial Ownership Reporting Compliance
Section 16(a) of the Exchange Act requires members of our general partner's board of directors, executive officers of our general partner, and persons who own more than 10% of a registered class of our equity securities, to file with the SEC, and any exchange or other system on which such securities are traded or quoted, initial reports of ownership and reports of changes in ownership of our Class A shares, Class B shares and other equity securities. Officers, directors and greater than 10% shareholders are required by the SEC's regulations to furnish to us and any exchange or other system on which such securities are traded or quoted with copies of all Section 16(a) forms they file with the SEC.
Based solely upon a review of Forms 3, 4 and 5, and amendments thereto, we know of no director, officer, or beneficial owner of more than 10% of any class of our equity securities registered pursuant to Section 12 of the Exchange Act that failed to file timely any reports required to be furnished during 2016 pursuant to Section 16(a) of the Exchange Act, except that on November 23, 2016, EMG Fund II Management, LP and EMG Fund II Management, LLC filed a Form 3 that was due May 11, 2015.
137
Compensation Discussion and Analysis
Executive Summary and Background
We and our general partner were formed in Delaware in February 2015. Our general partner did not accrue any obligations with respect to management incentive or retirement benefits for its directors and executive officers until after our initial public offering in May 2015. We do not directly employ any of the persons responsible for managing our business. Our business is managed and operated by the directors and executive officers of our general partner. All employees, including our Named Executive Officers (as defined in
"Summary Compensation Table"
below), are employed by an affiliate of our general partner, Tallgrass Management, LLC ("Tallgrass Management").
Compensation of our Named Executive Officers is set and approved by the board of directors of our general partner and by the board of managers of Tallgrass Energy Holdings, which controls our general partner. Tallgrass Energy Holdings owns 100% of Tallgrass Management and 100% of our general partner. Tallgrass Energy Holdings also serves as the general partner of Tallgrass Development. We reimburse Tallgrass Development for all salaries, benefits and other compensation expenses for employees of Tallgrass Management (including the Named Executive Officers) to the extent such employees provide services to us pursuant to an allocation agreed upon between our general partner and Tallgrass Development under the terms of the TEGP Omnibus Agreement. Other than the employment agreement with our Chief Executive Officer, David G. Dehaemers, Jr., none of our Named Executive Officers has entered into any employment agreements with Tallgrass Management, our general partner or any other affiliate of TEGP.
Philosophy and Objectives
Since our initial public offering in May 2015, we have employed a compensation philosophy that emphasizes pay for performance and places the majority of each Named Executive Officer's compensation at risk. We believe our pay-for-performance approach aligns the interests of our Named Executive Officers with that of our Class A shareholders, and at the same time enables us to maintain a lower level of recurring compensation costs in the event our operating or financial performance is below expectations. We design our executive compensation to attract and retain individuals with the background and skills necessary to successfully execute our business model in a demanding environment, to motivate those individuals to reach near-term and long-term goals in a way that aligns their interest with that of our Class A shareholders, and to reward success in reaching such goals.
We use three primary elements of compensation to fulfill that design: salary, cash bonus and long-term equity incentive awards. Cash bonuses and long-term equity incentives (as opposed to salary) generally represent the performance driven elements. They are also flexible in application and can be tailored to meet our objectives. The determination of specific individuals' cash bonuses is based on their relative contribution to achieving or exceeding relative near-term company goals and the determination of specific individuals' long-term incentive equity awards is based on their actual and anticipated contribution to longer term performance objectives. The primary long-term measure of our performance is our ability to increase quarterly distributions to our Class A shareholders while maintaining safe operations and long-term stable cash flow and financial health.
We do not maintain a defined benefit or pension plan for our Named Executive Officers as we believe such plans primarily reward longevity and not performance. We provide a basic benefits package generally to all employees, which includes a 401(k) plan and health, disability and life insurance.
Elements of Compensation
Salary.
We benchmark our salary amounts to comparable companies in our industry. We believe our salaries are generally competitive with the universe of similarly situated master limited partnerships, but are moderate relative to energy industry competitors for people with similar roles and responsibilities.
Cash Bonuses.
Our cash bonuses are annual discretionary bonuses in which all of our current Named Executive Officers potentially participate.
Long-Term Incentive Awards
. Our Named Executive Officers receive grants under both the TEGP and TEP LTIP (as defined below). TEGP and TEP share the same primary long-term performance measure of increasing quarterly distributions while maintaining safe operations and long-term stable cash flow and financial health. As a result of TEGP’s controlling membership interest in Tallgrass Equity and indirect ownership of a 27.41% limited partnership interest in TEP, all of TEP’s general partner interest and all of TEP’s incentive distribution rights, failing to achieve that performance standard at TEP would be detrimental to TEGP, and vice versa. We therefore believe granting our Named Executive Officers equity participation units under the TEP LTIP and equity participation shares under the TEGP LTIP appropriately incentivizes our Named Executive Officers to seek stable distribution growth at both entities. We expect equity participation unit awards under the TEP LTIP will be the primary long-term equity incentive provided to our Named Executive Officers, and that grants of equity participation shares will be made pursuant to the TEGP LTIP on a more limited basis.
138
Long-Term Incentive Awards of TEGP.
Effective May 1, 2015, our general partner adopted a Long-Term Incentive Plan ("TEGP LTIP") pursuant to which awards based on Class A shares of TEGP in the form of restricted shares, equity participation shares, options, share appreciation rights, distribution equivalent rights and share awards may be granted to employees, consultants, and directors of Tallgrass Management and its affiliates who perform services for or on behalf of TEGP or its affiliates, including TEP and Tallgrass Development. As noted above, equity participation shares may be issued under the TEGP LTIP to, in part, align the long-term interests of our Named Executive Officers with those of our Class A shareholders. An equity participation share is the right to receive, upon the satisfaction of vesting criteria specified in the grant, a TEGP Class A share.
In 2015, grants of equity participation shares were made under TEGP LTIP, including a grant made to Mr. Jones and to Mr. Watkins, who are thus far the only Named Executive Officers to receive a grant under the TEGP LTIP. The terms of the awards to Mr. Jones and Mr. Watkins each stipulate that the equity participation shares will generally vest upon the later of the first date on which TEGP pays a regular quarterly distribution of at least $0.35 on each outstanding Class A share (the "TEGP Distribution Date") or May 12, 2019. If TEGP has not distributed at least $0.35 on each outstanding Class A Share for any full quarter ending on or before May 12, 2020, the unvested equity participation shares will expire and no vesting will occur. Mr. Jones and Mr. Watkins must also remain in continuous employment through the vesting date.
Long-Term Incentive Awards of TEP.
Our Named Executive Officers also participate in the Long-Term Incentive Plan established by TEP's general partner effective May 13, 2013 ("TEP LTIP"). Pursuant to the TEP LTIP, awards based on common units of TEP in the form of restricted units, equity participation units, unit options, unit appreciation rights, distribution equivalent rights and unit awards may be granted to employees, consultants, and directors of TEP GP and its affiliates who perform services for or on behalf of TEP or its affiliates, including Tallgrass Development (such awards, collectively with the awards under the TEGP LTIP, the "LTIP Awards"). Historically, we have used equity participation unit grants issued under the TEP LTIP to encourage and reward timely achievement of certain events or TEP distribution levels and, as noted above, align the long-term interests of our Named Executive Officers with those of our Class A shareholders. An equity participation unit is the right to receive, upon the satisfaction of vesting criteria specified in the grant, a TEP common unit.
The vesting conditions applicable to TEP's outstanding equity participation unit awards can generally be divided into three categories. The first category of awards was granted by TEP between June 2013 and September 2014 (prior to our formation) with vesting of such awards contingent upon the Pony Express System going into commercial service, which occurred in October 2014. Thus, the awards in this category will vest as long as the employee satisfies the continuing service requirement set forth in the applicable award agreement. Generally, one-third of the awards in this category vested on May 13, 2015 and the remaining two-thirds will vest on May 13, 2017. All of our Named Executive Officers other than Mr. Dehaemers were granted equity participation unit awards in this category.
The second category of TEP's equity participation unit awards were granted between August 2015 and September 2015 with vesting occurring in two parts. One-half vests on the later to occur of the first date on which we have paid a regular quarterly distribution of at least $0.6875 on each outstanding common unit (the "TEP Distribution Achievement Date") or May 13, 2018, and the other half vesting on the later to occur of the TEP Distribution Achievement Date or May 13, 2019. The TEP Distribution Achievement Date occurred on May 13, 2016, thus the awards in this category will vest as long as the employee satisfies the continuing service requirement set forth in the applicable award agreement. Mr. Jones and Mr. Watkins are the only Named Executive Officers that were granted equity participation units in this second category.
The third category of TEP's equity participation unit awards were granted in November 2016 and will vest on November 1, 2019 as long as the employee satisfies the continuing service requirement set forth in the applicable award agreement. Mr. Jones and Mr. Watkins are the only Named Executive Officers that were granted equity participation units in this third category.
Relation of Compensation Elements to Compensation Objectives
Our compensation program is designed to motivate, reward and retain our Named Executive Officers. Cash bonuses serve as a near-term motivation and reward for achieving positive short-term results, such as meeting specified distribution growth and other financial guidance targets. Longer-term retention is facilitated by the requirement for continued employment or service for specified time periods in order for LTIP Awards to fully vest. The level of cash bonuses and LTIP Awards reflect the moderate salary profile of our Named Executive Officers and the weighting towards performance based, at-risk compensation.
We strive to focus on performance-based compensation elements in an attempt to create a performance-driven environment in which our Named Executive Officers are (i) motivated to perform over both the short-term and the long-term, (ii) appropriately rewarded for their services and (iii) encouraged to remain with us even after meeting long-term performance goals. We believe our compensation philosophy as implemented by application of the three primary compensation elements (i) aligns the interests of our Named Executive Officers with our Class A shareholders, (ii) positions us to achieve our business goals, and (iii) effectively encourages the exercise of sound judgment and risk-taking that is conducive to creating and sustaining long-term value. We believe the processes we employ to apply the elements of compensation (as discussed in more
139
detail below) provide an adequate level of oversight with respect to the degree of risk being taken by management to achieve short-term and long-term performance goals. See
"Relation of Compensation Policies and Practices to Risk Management."
We believe our compensation program has been instrumental in our achievement of stated objectives. One of the primary measures of our performance is our ability to enhance the ability of our assets to generate distributable cash flow that we can use to increase quarterly distributions to TEP's unitholders and our Class A shareholders. In the period since TEP's initial public offering through December 31, 2016, TEP's annual distribution per common unit has grown at a compound annual rate of 35%, and since our initial public offering, our distribution growth rate is 63%. This distribution growth has, in part, supported our decision to pay cash bonuses to our Named Executive Officers over that period.
Application of Compensation Elements
Salary.
We do not make systematic annual adjustments to the salaries of our Named Executive Officers. We do, however, make salary adjustments as necessary to ensure that our salaries remain competitive in the industry marketplace.
Annual Discretionary Cash Bonuses.
Annual discretionary bonuses are determined based on our performance relative to our annual budget, our distribution growth targets, and other quantitative and qualitative goals established each year. Such annual objectives are discussed and reviewed with the board of directors periodically during the year and then again in conjunction with the review and authorization of the annual budget and this annual report.
At the end of each year, the CEO, with assistance from other members of executive management, performs a quantitative and qualitative assessment of our performance relative to our goals. Key quantitative measures include Adjusted EBITDA, distributable cash flow, distribution coverage, and growth in the annualized quarterly distribution level per common unit relative to annual growth targets. We also compare our market performance relative to our MLP peers and major indices. Our primary performance metric is our ability to generate increasing and sustainable cash distributions to our Class A shareholders. Accordingly, although net income and net income per unit are monitored to highlight inconsistencies with our primary performance metrics, we do not consider net income and net income per unit to be key performance measures. Executive management's analysis of our performance examines our accomplishments, shortfalls and overall performance against opportunity, taking into account controllable and non-controllable factors encountered during the year.
After the annual company-level performance analysis is completed by our CEO and other members of executive management, that same group, along with personnel from our human resources department, considers cash bonuses and salary adjustments for our employees, including our Named Executive Officers. There are no set formulas for determining salary adjustments or annual discretionary bonuses for our Named Executive Officers. Factors considered by executive management in determining the level of salary adjustment and bonus in general include (i) whether or not we achieved any goals established for the year and any notable shortfalls relative to expectations; (ii) the level of difficulty associated with achieving any such objectives based on the opportunities and challenges encountered during the year; (iii) current year operating and financial performance relative to both public guidance and prior year's performance; (iv) significant transactions or accomplishments for the period not included in the goals for the year; (v) our prospects at the end of the year with respect to future growth and performance; and (vi) our positioning at the end of the year with respect to our targeted credit profile. The CEO and other members of executive management take these factors into consideration, as well as the relative contributions of each of our Named Executive Officers to the year's performance, in developing recommendations for Named Executive Officer bonus amounts and salary adjustments.
These recommendations for discretionary bonus amounts and salary adjustments for our Named Executive Officers are presented to the board of directors of our general partner and the board of managers of Tallgrass Energy Holdings, adjusted as appropriate, and then formally approved by those boards. In several historical instances, the CEO has requested that his bonus amount be reduced, or eliminated.
Long-Term Incentive Awards.
We do not make systematic annual grants of LTIP Awards to our Named Executive Officers. We have historically attempted to time the granting of LTIP Awards such that the creation of new long-term incentives coincides with the satisfaction of vesting criteria under existing awards. We have not formally decided on a recurring grant cycle for future grants, but we intend for future grants to provide a balance between a meaningful retention period for us and a visible, reasonable, growth-oriented reward for the executive officer. Under existing LTIP Awards, achievement of performance targets does not shorten the minimum service period requirement.
Application in 2016
At the beginning of 2016, our stated financial guidance was to grow distributions to Class A shareholders at approximately two times the distribution growth rate of TEP's cash distributions. In addition, TEP established the following financial performance objectives at TEP for 2016:
|
•
|
Distributable Cash Flow of $285 - 305 million for the year ended December 31, 2016;
|
|
•
|
Distribution coverage of 1.05 - 1.15x for the year ended December 31, 2016; and
|
140
|
•
|
Growth of approximately 20% annualized distribution rate for the calendar year 2016.
|
We and TEP achieved all of these goals:
|
•
|
Our distributions on Class A shares in the fourth quarter of 2016 represented a 60.4% increase from our fourth quarter 2015 distribution on Class A shares, more than two times the distributions growth rate of TEP's cash distributions;
|
|
•
|
TEP's Distributable Cash Flow for the year ended December 31, 2016 was approximately $408.5 million;
|
|
•
|
TEP's distribution coverage for the year ended December 31, 2016 was 1.27x; and
|
|
•
|
TEP grew its annualized distribution rate during calendar year 2016 by 27.3%.
|
Additionally, our internal qualitative goals included (a) advancing multi-year programs and initiatives and preparing the organization for future growth, and (b) continuing to promote a culture of safety and environmental responsibility throughout the organization. We achieved several accomplishments with respect to these qualitative goals, including:
|
•
|
The acquisition by TEP of a 25% membership interest in Rockies Express from a unit of Sempra U.S. Gas and Power in May 2016;
|
|
•
|
The acquisition by TEP of
100%
of the membership interests in Terminals and
100%
of the membership interests in NatGas from Tallgrass Development effective January 1, 2017; and
|
|
•
|
Substantially completing the Rockies Express Zone 3 Capacity Enhancement Project during 2016, for an additional 0.8 Bcf/d of east-to-west Zone 3 mainline capacity.
|
For 2016, the elements of compensation were applied as described below.
Salary.
In 2016, we did not implement material salary increases for our Named Executive Officers.
Cash Bonuses.
Based on the CEO's annual performance review and the individual performance of each of our Named Executive Officers, the board of directors of our general partner approved the annual bonuses for our Named Executive Officers reflected in the Summary Compensation Table and notes thereto. Such amounts take into account performance relative to our 2016 goals; the level of difficulty associated with achieving such objectives; our relative positioning at the end of the year with respect to future growth and performance; the significant transactions or accomplishments for the period not included in the goals for the year; and our positioning at the end of the year with respect to our targeted credit profile. The board of directors of our general partner also considered, on a subjective basis, how well the executive officer performed his or her duties during the year.
Long-Term Incentive Awards.
Pursuant to the TEP LTIP, Mr. Jones and Mr. Watkins each received a grant of 2,000 equity participation units in 2016. No equity participation shares were granted to a Named Executive Officer under the TEGP LTIP in 2016. As noted below, we believe the substantial direct and indirect equity interests held by our management team, including our Named Executive Officers, in TEP, TEGP, Tallgrass Equity and Tallgrass Energy Holdings aligns their interests with those of our Class A shareholders, and is taken into account when considering the level of equity incentives in TEP and TEGP granted to our Named Executive Officers under our compensation programs.
Other Compensation Related Matters
Equity Ownership.
Although we encourage our Named Executive Officers to acquire and retain ownership in TEP common units and TEGP Class A shares, we do not require our Named Executive Officers to maintain a specified equity ownership level. Our policies, including our Insider Trading Policy, strongly discourage our Named Executive Officers from using puts, calls or options to hedge the economic risk of their ownership in TEP or TEGP. Based on the closing price of TEP’s common units and TEGP’s Class A shares on February 15, 2017, the value of the combined equity ownership of our Named Executive Officers discussed below was significantly greater than their combined aggregate salaries and bonuses for 2016. We believe that the substantial direct and indirect equity interests held by our management team in TEGP, Tallgrass Energy Holdings and TEP further aligns their interests with those of our Class A shareholders, and is taken into account when considering the level of equity incentives in TEP and TEGP granted to our Named Executive Officers under our compensation programs.
Equity Ownership in TEGP and Tallgrass Energy Holdings.
Some of our Named Executive Officers directly own Class A shares in TEGP and some of our Named Executive Officers indirectly own equity interests in Tallgrass Energy Holdings, Tallgrass Equity and TEGP through Tallgrass KC, an entity controlled by Mr. Dehaemers. As of February 15, 2017, our Named Executive Officers directly owned, in the aggregate, 572,652 of our Class A shares (excluding any unvested LTIP Awards). As of February 15, 2017, Tallgrass KC owned 27,376,110 Class B Shares in TEGP and 27,376,110 Units in Tallgrass Equity, representing an approximate 17.4% ownership interest in TEGP and Tallgrass Equity, respectively. On such date, Tallgrass KC also owned approximately 27.61% of the outstanding equity interests in Tallgrass Energy Holdings.
141
Equity Ownership in TEP.
In addition to their equity ownership in TEGP and Tallgrass Energy Holdings, our Named Executive Officers collectively own substantial equity in TEP. As of February 15, 2017, our Named Executive Officers directly owned, in the aggregate, 370,101 of our common units (excluding any unvested LTIP Awards).
Recovery of Prior Awards.
Except as provided by applicable laws and regulations, we do not have a policy with respect to adjustment or recovery of awards or payments if relevant company performance measures upon which previous awards were based are restated or otherwise adjusted in a manner that would have reduced the size of such award or payment if previously known.
Section 162(m).
With respect to the deduction limitations under Section 162(m) of the Code, we are a limited partnership and do not fall within the definition of a "corporation" under Section 162(m).
Change-in-Control Triggers and Termination Payments.
The equity participation share and equity participation unit grants to our Named Executive Officers include accelerated vesting triggered upon a change of control, as defined in the respective award agreements. The provision of equity acceleration for defined changes of control help to create a retention tool by assuring the executive that the benefit of the compensation arrangement will be at least partially realized despite the occurrence of an event that could materially alter the executive's employment arrangement. In addition, the employment agreement for Mr. Dehaemers provides for severance in the event his employment is terminated without "cause" or in the event he resigns for "good reason." See
"Potential Payments upon Termination or Change-in-Control."
No other Named Executive Officer has a contractual right to receive severance in the event of a termination of employment.
Relation of Compensation Policies and Practices to Risk Management
Our compensation policies and practices are designed to provide rewards for short-term and long-term performance, both on an individual basis and at the entity level. In general, optimal financial and operational performance, particularly in a competitive business like ours, requires some degree of risk-taking. Accordingly, the use of compensation as an incentive for performance could potentially cause management and others to take unnecessary or excessive risks to reach the performance thresholds. For us, such risks would primarily attach to the execution and financing of capital expansion projects and asset acquisitions and the realization of associated returns from both, as well as to certain commercial activities conducted in our operational segments.
From a risk management perspective, we monitor and structure our commercial activities in a manner intended to control and minimize the potential for unwarranted risk-taking. See
Note 10
–
Risk Management
to our Consolidated Financial Statements in Item 8.—Financial Statements and Supplementary Data. We also monitor and measure our capital projects and acquisitions relative to expectations. In general, we believe our compensation arrangements serve to minimize the incentive for unwarranted risk-taking to achieve short-term, unsustainable results. See
"Compensation Discussion and Analysis
–
Relation of Compensation Elements to Compensation Objectives."
In combination with our risk-management practices, we do not believe that risks arising from our compensation policies and practices for our employees are reasonably likely to have a material adverse effect on us.
142
Summary Compensation Table
The following table reflects the total compensation of the principal executive officer, the principal financial officer and the three other most highly compensated executive officers of our general partner for 2016 (the "Named Executive Officers") for services rendered to all Tallgrass-related entities, including TEP, TEGP, Tallgrass Management and Tallgrass Development, for the fiscal years ending December 31, 2016, 2015 and 2014.
|
|
Year
|
Salary
(1)
|
Bonus
(2)
|
Equity Awards
(3)
|
All Other Compensation
(4)
|
Total
|
|||||||||||||||
|
David G. Dehaemers, Jr.
|
2016
|
$
|
300,000
|
|
$
|
651,467
|
|
$
|
—
|
|
$
|
27,544
|
|
$
|
979,011
|
|
|||||
|
President, Chief Executive
|
2015
|
$
|
300,000
|
|
$
|
601,000
|
|
$
|
—
|
|
$
|
27,796
|
|
$
|
928,796
|
|
|||||
|
Officer and Director
|
2014
|
$
|
300,000
|
|
$
|
251,000
|
|
$
|
—
|
|
$
|
31,274
|
|
$
|
582,274
|
|
|||||
|
William R. Moler
|
2016
|
$
|
300,000
|
|
$
|
576,468
|
|
$
|
—
|
|
$
|
24,544
|
|
$
|
901,012
|
|
|||||
|
Executive Vice President, Chief
|
2015
|
$
|
300,000
|
|
$
|
551,000
|
|
$
|
—
|
|
$
|
27,796
|
|
$
|
878,796
|
|
|||||
|
Operating Officer and Director
|
2014
|
$
|
297,118
|
|
$
|
501,000
|
|
$
|
—
|
|
$
|
30,436
|
|
$
|
828,554
|
|
|||||
|
Gary J. Brauchle
|
2016
|
$
|
294,904
|
|
$
|
576,144
|
|
$
|
—
|
|
$
|
27,537
|
|
$
|
898,585
|
|
|||||
|
Executive Vice President and
|
2015
|
$
|
275,000
|
|
$
|
551,000
|
|
$
|
—
|
|
$
|
27,665
|
|
$
|
853,665
|
|
|||||
|
Chief Financial Officer
|
2014
|
$
|
272,116
|
|
$
|
501,000
|
|
$
|
—
|
|
$
|
26,059
|
|
$
|
799,175
|
|
|||||
|
Christopher R. Jones
(5)
|
2016
|
$
|
240,068
|
|
$
|
426,467
|
|
$
|
69,836
|
|
$
|
24,486
|
|
$
|
760,857
|
|
|||||
|
Vice President, General Counsel
|
|||||||||||||||||||||
|
and Secretary
|
|||||||||||||||||||||
|
Gary D. Watkins
|
2016
|
$
|
222,975
|
|
$
|
201,470
|
|
$
|
69,836
|
|
$
|
23,081
|
|
$
|
517,362
|
|
|||||
|
Vice President and
|
2015
|
$
|
212,322
|
|
$
|
201,000
|
|
$
|
1,226,264
|
|
$
|
22,152
|
|
$
|
1,661,738
|
|
|||||
|
Chief Accounting Officer
|
|||||||||||||||||||||
|
(1)
|
Reflects actual salary received. Salary adjustments are typically implemented during February, which results in odd amounts actually received by the indicated Named Executive Officer. In our annual report on Form 10-K/A for the year ended December 31, 2014, the Named Executive Officer's adjusted annual salary, rather than the actual amount of salary received, was reported in the salary column for 2014.
|
|
(2)
|
Represents discretionary bonuses paid in 2017, 2016 and 2015 based on performance in 2016, 2015 and 2014, respectively, as well as a bonus of $1,000 after tax that was paid to all employees in 2016 and a $1,000 pre-tax bonus that was paid to all employees in 2015 and 2014.
|
|
(3)
|
The amounts in this column include both equity participation units granted pursuant to the TEP LTIP and equity participation shares granted pursuant to the TEGP LTIP. Mr. Jones and Mr. Watkins were the only Named Executive Officers to receive grants under the TEP LTIP during 2016 and Mr. Watkins was the only Named Executive Officer to receive grants under the TEGP LTIP during 2015. In addition, the amounts in this column represent the aggregate grant date fair value determined in accordance with ASC Topic 718 for equity participation units, or EPUs, granted under the TEP LTIP and equity participation shares granted under the TEGP LTIP. Pursuant to SEC rules, the amounts shown in the Summary Compensation Table for awards subject to performance conditions are based on the probable outcome as of the date of grant and exclude the impact of estimated forfeitures. The Equity participation units and equity participation shares are non-participating, therefore the grant date fair value is discounted from the grant date fair value of TEP's common units or TEGP's Class A shares, as appropriate, for the present value of the expected (but non-participating) future dividends during the vesting period. For additional information, see
Note 16
–
Equity-Based Compensation
to our Consolidated Financial Statements in Item 8.—Financial Statements and Supplementary Data. These amounts do not correspond to the actual value that will be recognized by the executive.
|
143
|
(4)
|
The amounts in the column include the following: contributions under the 401(k) savings plan (includes $26,500 for Mr. Dehaemers, $26,500 for Mr. Moler, $26,500 for Mr. Brauchle, $23,629 for Mr. Jones, and $22,297 for Mr. Watkins for the year ended December 31, 2016, $26,500 for Mr. Dehaemers, $26,500 for Mr. Moler, $26,477 for Mr. Brauchle, and $21,232 for Mr. Watkins for the year ended December 31, 2015, and $30,000 for Mr. Dehaemers, $29,615 for Mr. Moler, and $25,519 for Mr. Brauchle for the year ended December 31, 2014) and the dollar value of premiums paid for group life, accidental death and dismemberment insurance.
|
|
(5)
|
Mr. Jones was appointed Vice President, General Counsel and Secretary of TEP and TEGP effective July 1, 2016.
|
Narrative Disclosure to Summary Compensation Table
A narrative description of all material factors necessary to an understanding of the information included in the above Summary Compensation Table is included in
"Compensation Discussion and Analysis"
and in the footnotes to such tables.
Grants of Plan-Based Awards Table
The following table provides information concerning each grant of an award made to a Named Executive Officer for 2016, including, but not limited to awards made under the TEP LTIP and TEGP LTIP.
|
|
Grant Type
|
Grant Date
|
|
Number of Shares or Units
|
Grant Date Fair Value of Awards
(1)
|
||||||
|
Christopher R. Jones
|
|||||||||||
|
Vice President, General Counsel
|
TEP Equity Participation Units
|
11/2/2016
|
|
2,000
|
|
(2)
|
$
|
69,836
|
|
||
|
and Secretary
|
TEGP Equity Participation Shares
|
—
|
|
—
|
|
(3)
|
$
|
—
|
|
||
|
Gary D. Watkins
|
|||||||||||
|
Vice President and
|
TEP Equity Participation Units
|
11/2/2016
|
|
2,000
|
|
(2)
|
$
|
69,836
|
|
||
|
Chief Accounting Officer
|
TEGP Equity Participation Shares
|
—
|
|
—
|
|
(3)
|
$
|
—
|
|
||
|
(1)
|
The amounts in this column include EPUs granted pursuant to the TEP LTIP. In addition, the amounts in this column represent the aggregate grant date fair value determined in accordance with ASC Topic 718 for equity participation units, or EPUs, granted under the TEP LTIP and equity participation shares granted under the TEGP LTIP. Pursuant to SEC rules, the amounts shown in this table for awards subject to performance conditions, if applicable, are based on the probable outcome as of the date of grant and exclude the impact of estimated forfeitures. The EPU and equity participation share grants are measured at their grant date fair value. The EPUs and equity participation shares are non-participating, therefore the grant date fair value is discounted from the grant date fair value of TEP's common units or TEGP's Class A shares, as appropriate, for the present value of the expected (but non-participating) future dividends during the vesting period. For additional information, see
Note 16
–
Equity-Based Compensation
to our Consolidated Financial Statements in Item 8.—Financial Statements and Supplementary Data. These amounts do not correspond to the actual value that will be recognized by the executive.
|
|
(2)
|
Vesting of the equity participation units will occur on November 1, 2019.
|
|
(3)
|
There were no equity participation shares granted under the TEGP LTIP during the year ended December 31, 2016.
|
144
Outstanding Equity Awards at Fiscal Year-End
The following table reflects the outstanding equity awards of our Named Executive Officers as of December 31, 2016 under the TEP LTIP.
|
|
Equity Participation Unit Awards
(1)
|
||||||||||||
|
|
Number of EPU Awards That Have Not Vested
|
Market Value of EPU Awards That Have Not Vested
(2)
|
Number of Unearned EPUs That Have Not Vested
|
Market or Payout Value of Unearned EPUs That Have Not Vested
|
|||||||||
|
David G. Dehaemers, Jr.
|
—
|
|
$
|
—
|
|
—
|
|
$
|
—
|
|
|||
|
William R. Moler
|
33,333
|
|
(3)
|
$
|
1,581,651
|
|
—
|
|
$
|
—
|
|
||
|
Gary J. Brauchle
|
33,333
|
|
(3)
|
$
|
1,581,651
|
|
—
|
|
$
|
—
|
|
||
|
Christopher R. Jones
|
23,800
|
|
(4)
|
$
|
1,129,310
|
|
—
|
|
$
|
—
|
|
||
|
Gary D. Watkins
|
25,066
|
|
(5)
|
$
|
1,189,382
|
|
—
|
|
$
|
—
|
|
||
|
(1)
|
The award agreements pursuant to which the EPUs set forth above were granted provide for the settlement of the EPUs in common units.
|
|
(2)
|
Reflects the closing price of
$47.45
per TEP common unit at December 30, 2016.
|
|
(3)
|
Mr. Moler and Mr. Brauchle each hold 33,333 EPUs that will vest on May 13, 2017.
|
|
(4)
|
Mr. Jones holds 16,000 EPUs that will vest on May 13, 2017, 2,900 EPUs that will vest on May 13, 2018, 2,900 EPUs that will vest on May 13, 2019, and 2,000 EPUs that will vest on November 1, 2019.
|
|
(5)
|
Mr. Watkins holds 16,666 EPUs that will vest on May 13, 2017, 3,200 EPUs that will vest on May 13, 2018, 3,200 EPUs that will vest on May 13, 2019, and 2,000 EPUs that will vest on November 1, 2019.
|
The following table reflects all outstanding equity awards of our named executive officers as of December 31, 2016 under the TEGP LTIP.
|
|
Equity Participation Share Awards
(1)
|
||||||||||||
|
|
Number of Equity Participation Share Awards That Have Not Vested
|
Market Value of Equity Participation Share Awards That Have Not Vested
|
Number of Unearned Equity Participation Shares That Have Not Vested
|
Market or Payout Value of Unearned Equity Participation Shares That Have Not Vested
(2)
|
|||||||||
|
David G. Dehaemers, Jr.
|
—
|
|
$
|
—
|
|
—
|
|
$
|
—
|
|
|||
|
William R. Moler
|
—
|
|
$
|
—
|
|
—
|
|
$
|
—
|
|
|||
|
Gary J. Brauchle
|
—
|
|
$
|
—
|
|
—
|
|
$
|
—
|
|
|||
|
Christopher R. Jones
|
—
|
|
$
|
—
|
|
35,000
|
|
(3)
|
$
|
938,000
|
|
||
|
Gary D. Watkins
|
—
|
|
$
|
—
|
|
35,000
|
|
(3)
|
$
|
938,000
|
|
||
|
(1)
|
The award agreements pursuant to which the equity participation shares set forth above were granted provide for the settlement of the equity participation shares in TEGP Class A Shares.
|
|
(2)
|
Reflects the closing price of
$26.80
per TEGP Class A share at December 30, 2016.
|
|
(3)
|
Mr. Jones and Mr. Watkins each hold 35,000 equity participation shares that will vest upon the later to occur of the TEGP Distribution Achievement Date or May 12, 2019. If TEGP has not distributed at least $0.35 on each outstanding Class A Share for any full quarter ending on or before May 12, 2020, the unvested equity participation shares will expire and no vesting will occur.
|
Units Vested
No TEP LTIP Awards or TEGP Equity Participation Share Awards vested during 2016.
Pension Benefits
We sponsor a 401(k) plan that is available to all employees, but we do not maintain a pension or defined benefit program.
Nonqualified Deferred Compensation and Other Nonqualified Deferred Compensation Plans
We do not have a nonqualified deferred compensation plan or program for our officers or employees.
145
Employment Agreement
On November 2, 2016, Mr. Dehaemers entered into a second amended and restated employment agreement with Tallgrass Management, our general partner, Tallgrass Energy Holdings, Tallgrass Equity and TEP's general partner, pursuant to which he agreed to serve as the President and Chief Executive Officer of our general partner. Under the terms of the employment agreement, Mr. Dehaemers is entitled to receive an annual salary of $300,000. In addition, Mr. Dehaemers is entitled to receive (i) benefits that are normally provided to senior executives of Tallgrass Management, (ii) reimbursement for all ordinary and necessary out-of-pocket expenses incurred by Mr. Dehaemers, and (iii) a policy of director and officer liability insurance. Mr. Dehaemers' employment is "at-will" and may be terminated at any time.
For a discussion of certain payments that Mr. Dehaemers may be entitled to upon the termination of his employment, please read
"Potential Payments Upon Termination or a Change-in-Control."
Potential Payments upon Termination or Change-in-Control
Termination
The employment agreement for Mr. Dehaemers provides that in the event his employment is terminated without "cause" or in the event he resigns for "good reason" he will receive: (i) a severance payment equal to $900,000, payable in a lump sum within 60 days after the termination of his employment; and (ii) directors and officers liability insurance coverage for so long as he is subject to any claim arising from his employment by TEGP and its Affiliates. In addition, upon any such termination, Mr. Dehaemers would receive payments related to his accrued and unpaid expenses, salary and benefits. Under Mr. Dehaemers' employment agreement:
|
•
|
"Cause" means (i) his conviction of, or plea of nolo contendere to, any crime or offense constituting a felony under applicable law; (ii) his commission of fraud or embezzlement against Tallgrass Management or certain of its affiliates; (iii) gross neglect by Mr. Dehaemers of, or gross or willful misconduct of Mr. Dehaemers in connection with the performance of, his duties that is not cured within 30 days of receiving a written notice of such gross neglect or gross or willful misconduct; (iv) Mr. Dehaemers' willful failure or refusal to carry out the reasonable and lawful instructions of the board of managers of the entity with ultimate control over our general partner; (v) Mr. Dehaemers' failure to perform the duties and responsibilities of his office as his primary business activity; (vi) a judicial determination that Mr. Dehaemers has breached his fiduciary duties with respect to Tallgrass Management or certain of its affiliates; or (vii) Mr. Dehaemers' willful and material breach of his obligations under the operating agreements of our general partner or certain affiliates of Tallgrass Management, in his capacity as an officer of such entities.
|
|
•
|
"Good reason" means (i) a material diminution of Mr. Dehaemers' duties and responsibilities to Tallgrass Management or certain of its affiliates to a level inconsistent with those of a chief executive officer; (ii) a material reduction in Mr. Dehaemers' cash compensation or the aggregate welfare benefits provided to him (excluding any reduction that is not limited to him specifically); (iii) a willful or intentional breach of his employment agreement by Tallgrass Management; or (iv) a willful or intentional breach by our general partner or certain affiliates of Tallgrass Management of a material provision of the applicable operating agreements of such entities that has a material and adverse effect on Mr. Dehaemers.
|
Other than the payments to Mr. Dehaemers pursuant to his employment agreement as described above, we are not obligated to make any cash payment or provide any benefit to our Named Executive Officers if their employment is terminated by us or by the Named Executive Officer, other than the payment of accrued and unpaid expenses, salary and benefits. In addition, any LTIP Awards that have not vested and/or become exercisable are terminated upon the termination of such Named Executive Officer's employment.
Change in Control
Employment Agreement.
Upon a change in control, the employment agreement of Mr. Dehaemers generally does not provide for termination or severance benefits or payments in addition to those described above.
LTIP Award Agreements.
In addition to the foregoing payments to Mr. Dehaemers pursuant to his employment agreement, the TEP LTIP Awards and TEGP LTIP Awards held by our Named Executive Officers typically provide for acceleration of vesting in connection with a change in control. The TEP LTIP Awards held by our Named Executive Officers vest and/or become exercisable in full upon a "change in control" of us or our general partner and the TEGP LTIP Awards held by our Named Executive Officers vest and/or become exercisable in full upon a "change in control" of TEGP or TEGP's general partner.
146
Under the TEP LTIP, "change of control" means the occurrence of one or more of the following events:
|
•
|
any Person or group, other than Tallgrass Equity or its affiliates, becomes the owner, by way of merger, consolidation, recapitalization, reorganization or otherwise, of 50% or more of (A) the combined voting power of the equity interests in our general partner, or (B) the general partner interests in TEP (excluding incentive distribution rights);
|
|
•
|
the limited partners of TEP approve, in one or a series of transactions, a plan of complete liquidation of TEP; or
|
|
•
|
the sale or other disposition by TEP of all or substantially all of its assets in one or more transactions to any person other than our general partner or its affiliates.
|
Under the TEGP LTIP, "change of control" means the occurrence of one or more of the following events:
|
•
|
any Person or group, other than Tallgrass Energy Holdings or its affiliates, becomes the owner, by way of merger, consolidation, recapitalization, reorganization or otherwise, of 50% or more of (A) the combined voting power of the equity interests in TEGP Management or (B) the general partner interests in TEGP;
|
|
•
|
the limited partners of TEGP approve, in one or a series of transactions, a plan of complete liquidation of TEGP; or
|
|
•
|
the sale or other disposition by TEGP of all or substantially all of its assets in one or more transactions to any person other than TEGP Management or an affiliate of the TEGP Management.
|
The following table sets forth the value of outstanding LTIP Awards that would have vested and/or become exercisable for each of the Named Executive Officers under the TEP LTIP and TEGP LTIP if a change in control occurred on December 31, 2016.
|
|
Upon a Change in Control
(1)
|
||
|
David G. Dehaemers, Jr.
|
|||
|
TEP LTIP
|
$
|
—
|
|
|
TEGP LTIP
|
$
|
—
|
|
|
William R. Moler
|
|||
|
TEP LTIP
|
$
|
1,581,651
|
|
|
TEGP LTIP
|
$
|
—
|
|
|
Gary J. Brauchle
|
|||
|
TEP LTIP
|
$
|
1,581,651
|
|
|
TEGP LTIP
|
$
|
—
|
|
|
Christopher R. Jones
|
|||
|
TEP LTIP
|
$
|
1,129,310
|
|
|
TEGP LTIP
|
$
|
938,000
|
|
|
Gary D. Watkins
|
|||
|
TEP LTIP
|
$
|
1,189,382
|
|
|
TEGP LTIP
|
$
|
938,000
|
|
|
(1)
|
The stated value upon a change in control is computed by assuming that a triggering change of control occurred on December 30, 2016 and multiplying the closing market price (TEP:
$47.45
and TEGP:
$26.80
) of the relevant units and shares on such date by the number of units and shares that would have vested.
|
Confidentiality, Non-Compete and Non-Solicitation Arrangements
Under the terms of Mr. Dehaemers's employment agreement, he has agreed not to compete with Tallgrass Management or certain of its affiliates and not to solicit Tallgrass Management's or any of its affiliates' employees or interfere with certain business relationships during the term of his employment and for one year thereafter. Each of the Named Executive Officers has signed a confidentiality agreement in connection with their employment by Tallgrass Management.
147
Compensation of TEGP Directors
Officers or employees of Tallgrass Development or its affiliates, including directors affiliated with EMG or Kelso, who also serve as directors of our general partner do not receive additional compensation for such service. In 2016, directors of our general partner who are not also officers or employees of Tallgrass Development or its affiliates or affiliated with EMG or Kelso received quarterly cash payments of $10,000, resulting in an effective annual cash payment of $40,000.
All directors are also reimbursed for out-of-pocket expenses in connection with their service as directors, including costs incurred to attend meetings. Each director is fully indemnified by us for actions associated with being a director to the fullest extent permitted under Delaware law pursuant to our partnership agreement. Directors of our general partner are also eligible to receive grants under the TEGP LTIP.
The following table sets forth certain information with respect to our non-employee director compensation during the year ended December 31, 2016:
|
Equity Participation Share Awards
|
||||||||||||||||
|
Name and Principal Position
|
Fees Earned
|
Grant Date
|
Number of Shares or Units
|
Grant Date Fair Value of Awards
(1)
|
Total
|
|||||||||||
|
Thomas A. Gerke
|
$
|
40,000
|
|
2/17/2016
|
10,000
|
|
(2)
|
$
|
108,414
|
|
$
|
148,414
|
|
|||
|
W. Curtis Koutelas
|
$
|
30,000
|
|
5/11/2016
|
10,000
|
|
(3)
|
$
|
229,153
|
|
$
|
259,153
|
|
|||
|
(1)
|
The amounts in this column represent the aggregate grant date fair value determined in accordance with ASC Topic 718 for equity participation shares granted in 2016 under the TEGP LTIP. The equity participation share grants are measured at their grant date fair value. The equity participation shares are non-participating; therefore the grant date fair value is discounted from the grant date fair value of TEGP's Class A shares for the present value of the expected (but non-participating) future distributions during the vesting period. For additional information, see
Note 16
–
Equity-Based Compensation
to our Consolidated Financial Statements in Item 8.—Financial Statements and Supplementary Data. These amounts do not correspond to the actual value that will be recognized by the executive.
|
|
(2)
|
Of Mr. Gerke's 10,000 equity participation shares, (i) 1/3 vest on the later to occur of the first date on which the issuer has paid a regular quarterly distribution of at least $0.35 on each outstanding Class A Share for any full quarter ending on or after February 17, 2016 (the "Gerke Distribution Achievement Date") or November 1, 2016, (ii) 1/3 vest on the later to occur of the Gerke Distribution Achievement Date or November 1, 2017, and (iii) 1/3 vest on the later to occur of the Gerke Distribution Achievement Date or November 1, 2018. If the Gerke Distribution Achievement Date has not occurred by May 12, 2020, the equity participation shares will expire and terminate and no vesting will occur.
|
|
(3)
|
Of Mr. Koutelas's 10,000 equity participation shares, (i) 1/3 vest on the later to occur of the first date on which the issuer has paid a regular quarterly distribution of at least $0.35 on each outstanding Class A Share for any full quarter ending on or after May 11, 2016 (the "Koutelas Distribution Achievement Date") or May 1, 2017, (ii) 1/3 vest on the later to occur of the Koutelas Distribution Achievement Date or May 1, 2018, and (iii) 1/3 vest on the later to occur of the Koutelas Distribution Achievement Date or May 1, 2019. If the Koutelas Distribution Achievement Date has not occurred by May 12, 2020, the equity participation shares will expire and terminate and no vesting will occur.
|
Compensation Committee Interlocks and Insider Participation
The listing rules of the NYSE do not require us to maintain, and we do not maintain, a compensation committee.
Mr. Dehaemers, as President and Chief Executive Officer, and Mr. Moler, as Executive Vice President and Chief Operating Officer, participate in their capacity as a director of our general partner in the deliberations of the Board concerning executive officer compensation. In addition, Mr. Dehaemers makes recommendations to the board of directors regarding named executive officer compensation, but Mr. Dehaemers is not present for any discussions regarding his performance or compensation.
Compensation Report of the Board of Directors
The Board of Directors of our general partner has reviewed and discussed the compensation discussion and analysis contained in this Annual Report on Form 10-K with management and, based on that review and discussion, has recommended that the compensation discussion and analysis be included in this Annual Report for the year ended December 31, 2016 for filing with the SEC.
David G. Dehaemers, Jr.
William R. Moler
148
Frank J. Loverro
Stanley de J. Osborne
Jeffrey A. Ball
John T. Raymond
Thomas A. Gerke
W. Curtis Koutelas
Tallgrass Energy GP, LP
The following tables set forth certain information regarding the beneficial ownership of our Class A shares and Class B shares as of February 8, 2017 owned by:
|
•
|
each person who is known to us to beneficially own more than 5% of the Class A shares (calculated in accordance with Rule 13d-3);
|
|
•
|
the named executive officers of our general partner;
|
|
•
|
each of the directors of our general partner; and
|
|
•
|
all of the directors and executive officers of our general partner as a group.
|
All information with respect to beneficial ownership has been furnished by the respective directors, officers or 5% or more shareholders, as the case may be. The amounts and percentage of Class A shares and Class B shares beneficially owned are reported on the basis of SEC regulations governing the determination of beneficial ownership of securities. Under the rules of the SEC, a person is deemed to be a "beneficial owner" of a security if that person has or shares "voting power," which includes the power to vote or to direct the voting of such security, or "investment power," which includes the power to dispose of or to direct the disposition of such security. Except as indicated by footnote, the persons named in the table below have sole voting and investment power with respect to all Class A shares and Class B shares shown as beneficially owned by them, subject to community property laws where applicable. Unless otherwise noted, the address of each beneficial owner named in the chart below is 4200 W. 115th Street, Suite 350, Leawood, Kansas 66211, Attn: General Counsel.
149
|
Name and Address of Beneficial Owner
|
Class A shares Beneficially Owned
(1)
|
|
Percentage of Class A shares Beneficially Owned
(2)
|
Combined Voting Power
(3)
|
|||||
|
5% shareholders
|
|||||||||
|
Entities affiliated with Kelso
(4)
|
35,081,202
|
|
37.66
|
%
|
22.83
|
%
|
|||
|
Entities affiliated with EMG
(5)
|
35,889,165
|
|
38.19
|
%
|
17.41
|
%
|
|||
|
Tallgrass KC
(6)
|
27,376,110
|
|
32.04
|
%
|
7.64
|
%
|
|||
|
OppenheimerFunds, Inc.
(7)
|
12,013,817
|
|
20.69
|
%
|
5.09
|
%
|
|||
|
Salient Capital Advisors, LLC
(8)
|
8,007,559
|
|
13.79
|
%
|
5.09
|
%
|
|||
|
Oppenheimer SteelPath MLP Alpha Fund
(9)
|
7,505,163
|
|
12.92
|
%
|
4.77
|
%
|
|||
|
Kayne Anderson Capital Advisors, L.P.
(10)
|
5,429,719
|
|
9.35
|
%
|
3.45
|
%
|
|||
|
Capital World Investors
(11)
|
3,805,000
|
|
6.55
|
%
|
2.42
|
%
|
|||
|
Entities affiliated with Prudential Financial, Inc.
(12)
|
3,224,983
|
|
5.55
|
%
|
2.05
|
%
|
|||
|
Directors and named Executive officers:
|
|||||||||
|
David G. Dehaemers, Jr.
(13)
|
27,921,312
|
|
32.68
|
%
|
17.76
|
%
|
|||
|
William R. Moler
|
—
|
|
—
|
%
|
—
|
%
|
|||
|
Gary J. Brauchle
(14)
|
20,950
|
|
*
|
|
*
|
|
|||
|
Christopher R. Jones
|
—
|
|
—
|
%
|
—
|
%
|
|||
|
Gary D. Watkins
|
6,500
|
|
*
|
|
*
|
|
|||
|
Frank J. Loverro
(4)
|
35,081,202
|
|
37.66
|
%
|
22.31
|
%
|
|||
|
Stanley de J. Osborne
(4)
|
35,081,202
|
|
37.66
|
%
|
22.31
|
%
|
|||
|
Jeffrey A. Ball
|
20,000
|
|
*
|
|
*
|
|
|||
|
John T. Raymond
(15)
|
36,124,165
|
|
38.44
|
%
|
22.98
|
%
|
|||
|
Thomas A. Gerke
|
34,500
|
|
*
|
|
*
|
|
|||
|
W. Curtis Koutelas
|
—
|
|
—
|
%
|
—
|
%
|
|||
|
All directors and executive officers of our general partner as a group (12 persons)
|
99,208,629
|
|
63.42
|
%
|
63.1
|
%
|
|||
|
*
|
Less than 1%.
|
|
(1)
|
Pursuant to Rule 13d-3 under the Exchange Act, a person has beneficial ownership of a security as to which that person, directly or indirectly, through any contract, arrangement, understanding, relationship, or otherwise has or shares voting power and/or investment power of such security and as to which that person has the right to acquire beneficial ownership of such security within 60 days. In addition to Class A shares, this column includes Class B shares beneficially owned by such persons that are, together with a corresponding number of Tallgrass Equity Units, exchangeable at any time and from time to time for Class A shares on a one-for-one basis (subject to the terms of the Tallgrass Equity limited liability company agreement and our partnership agreement). See
"Certain Relationships and Related Party Transactions, and Director Independence-Exchange Right."
|
|
(2)
|
The Class A shares to be issued upon the exchange of Class B shares and Tallgrass Equity Units as described in footnote (1) above are deemed to be outstanding and beneficially owned by the person holding the Class B shares for the purpose of computing the percentage of beneficial ownership of Class A shares for that person and any group of which that person is a member, but are not deemed outstanding for purpose of computing the percentage of beneficial ownership of any other person. As such, the percentage of Class A shares shown as being beneficially owned by each person is based on an assumption that each such person exchanged all of such person's Class B shares, together with a corresponding number of Tallgrass Equity Units, for Class A shares and that no other person made a similar exchange.
|
|
(3)
|
Represents the percentage of voting power of the Class A shares and Class B shares held by such person voting together as a single class.
|
|
(4)
|
Consists of Class B shares held of record by: (i) KIA VIII (Rubicon), L.P., a Delaware limited partnership, or KIA VIII, and (ii) KEP VI AIV (Rubicon), LLC, a Delaware limited liability company, or KEP VI AIV. KIA VIII and KEP VI AIV, due to their common control, could be deemed to beneficially own each of the other's shares. Each of KIA VIII and KEP VI AIV disclaim such beneficial ownership. Frank T. Nickell, Thomas R. Wall, IV, George E. Matelich, Michael B. Goldberg, David I. Wahrhaftig, Frank K. Bynum, Jr., Philip E. Berney, Frank J. Loverro, James J. Connors, II, Church M.
|
150
Moore, Stanley de J. Osborne, Christopher L. Collins, A. Lynn Alexander, Howard A. Matlin, John K. Kim, Henry Mannix, III, Matthew S. Edgerton and Stephen C. Dutton (the "Kelso Individuals") may be deemed to share beneficial ownership of shares held of record or beneficially owned by KIA VIII and KEP VI AIV, by virtue of their status as managing members of KEP VI AIV and of Kelso GP VIII, LLC, a Delaware limited liability company, the principal business of which is serving as the general partner of KIA VIII (Rubicon) GP, L.P., a Delaware limited partnership, the principal business of which is serving as the general partner of KIA VIII. Each of Kelso GP VIII, LLC and KIA VIII (Rubicon) GP, L.P. due to their common control, could be deemed to beneficially own each other's securities and the shares held of record or beneficially owned by KIA VIII and KEP VI AIV, Kelso GP VIII, LLC disclaims beneficial ownership of all of the securities owned of record, or deemed beneficially owned, by KIA VIII (Rubicon) GP, L.P., KIA VII and KEP VI AIV, except to the extent, if any, of its pecuniary interest therein, and the inclusion of these securities in the table above shall not be deemed an admission of beneficial ownership of all the reported securities for any purpose. KIA VIII (Rubicon) GP, L.P. disclaims beneficial ownership of all of the securities owned of record, or deemed beneficially owned, by Kelso GP VIII, LLC, KIA VIII and KEP VI AIV, except to the extent, if any, of its pecuniary interest therein, and the inclusion of these securities in the table above shall not be deemed an admission of beneficial ownership of all the reported securities for any purpose. The Kelso Individuals may be deemed to share beneficial ownership of securities owned of record or beneficially owned by Kelso GP VIII, LLC, KIA VIII (Rubicon) GP, L.P., KIA VIII and KEP VI AIV, by virtue of their status as managing members of Kelso GP VIII, LLC and KEP VI AIV, but disclaim beneficial ownership of such securities, and the inclusion of these securities in the table above shall not be deemed an admission that any of the Kelso Individuals is the beneficial owner of these securities for any purposes. Frank J. Loverro, who serves as a Managing Director and Co-Chief Executive Officer of Kelso & Company, which manages the investments in KIA VIII, KEP VI AIV, is one of our directors. Stanley de J. Osborne, who serves as a Managing Director of Kelso & Company, is also one of our directors. The business address for these persons is c/o Kelso & Company, 320 Park Avenue, 24th Floor, New York, NY 10022.
|
(5)
|
Consists of Class B shares held of record by Tallgrass Holdings, LLC. The manager of Tallgrass Holdings, LLC is EMG Fund II Management, LP. EMG Fund II Management, LP’s general partner is EMG Fund II Management, LLC. John T. Raymond, who serves as one of our directors, is the sole member of EMG Fund II Management, LLC and as such, has sole voting and dispositive power with respect to the shares held by Tallgrass Holdings, LLC; however he disclaims beneficial ownership of those shares except to the extent of his pecuniary interest therein. The address for Tallgrass Holdings, LLC is The Energy & Minerals Group, 811 Main Street, Suite 4200, Houston, TX 77002.
|
|
(6)
|
Consists of Class B shares held of record by Tallgrass KC. David G. Dehaemers, Jr. has sole voting and dispositive power with respect to the Class B shares held by Tallgrass KC; however, he disclaims beneficial ownership of those shares except to the extent of his pecuniary interest therein.
|
|
(7)
|
As reported on Schedule 13G filed with the SEC on January 25, 2017. Consists of Class A shares held of record by OppenheimerFunds, Inc. OppenheimerFunds, Inc. disclaims beneficial ownership pursuant to Rule 13d-4 of the Exchange Act of 1934. The business address for this person is Two World Financial Center, 225 Liberty Street, New York, New York 10281.
|
|
(8)
|
As reported on Schedule 13G filed with the SEC on January 27, 2017. The business address for this person is 4265 San Felipe, 8th Floor, Houston, TX 77027.
|
|
(9)
|
As reported on Schedule 13G filed with the SEC on January 25, 2017. Consists of Class A shares held of record by Oppenheimer SteelPath MLP Alpha Fund. The business address for this person is 6803 S. Tucson Way, Centennial, Colorado 80112.
|
|
(10)
|
As reported on Schedule 13G filed with the SEC on January 25, 2017. Kayne Anderson Capital Advisors, L.P. is the general partner (or general partner of the general partner) of the limited partnerships and investment adviser to the other accounts. Richard A. Kayne is the controlling shareholder of the corporate owner of Kayne Anderson Investment Management, Inc., the general partner of Kayne Anderson Capital Advisors, L.P. Mr. Kayne is also a limited partner of each of the limited partnerships and a shareholder of the registered investment company. Kayne Anderson Capital Advisors, L.P. disclaims beneficial ownership of the shares reported, except those shares attributable to it by virtue of its general partner interests in the limited partnerships. Mr. Kayne disclaims beneficial ownership of the shares reported, except those shares held by him or attributable to him by virtue of his limited partnership interests in the limited partnerships, his indirect interest in the interest of Kayne Anderson Capital Advisors, L.P. in the limited partnerships, and his ownership of common stock of the registered investment company. The business address for these persons is 1800 Avenue of the Stars, Second Floor, Los Angeles California 90067.
|
151
|
(11)
|
As reported on Schedule 13G filed with the SEC on February 16, 2016. Consists of Class A shares for which Capital World Investors is deemed to be the beneficial owner of as a result of Capital World Investors acting as investment adviser to various investment companies registered under Section 8 of the Investment Company Act of 1940. The business address for this person is 333 South Hope Street, Los Angeles, CA 90071.
|
|
(12)
|
As reported on Schedule 13G filed with the SEC on January 24, 2017. Consists of Class A shares of record held by (i) Jennison Associates LLC, or Jennison, and (ii) Quantitative Management Associates LLC, or Quantitative. Prudential Financial, Inc. is the parent holding company and the indirect parent of Jennison and Quantitative, who are the beneficial owners of the Class A shares reported. Prudential Financial, Inc. disclaims beneficial ownership of the Class A shares. The business address for this person is 751 Broad Street, Newark, New Jersey 07102.
|
|
(13)
|
Consists of (i) 27,376,110 Class B shares held of record by Tallgrass KC and (ii) 545,202 Class A shares held indirectly through the David G. Dehaemers, Jr. Revocable Trust, dated April 26, 2006, for which Mr. Dehaemers serves as Trustee. Mr. Dehaemers has sole voting and dispositive power with respect to the shares held by Tallgrass KC; however, he disclaims beneficial ownership of those shares except to the extent of his pecuniary interest therein.
|
|
(14)
|
Gary J. Brauchle indirectly owns the Class A shares through the Brauchle Revocable Trust, under a trust agreement dated April 10, 2014, for which Mr. Brauchle serves as a Trustee.
|
|
(15)
|
Consists of (i) 35,889,165 Class B shares held of record by Tallgrass Holdings, LLC and (ii) 235,000 Class A shares held directly by John T. Raymond. The manager of Tallgrass Holdings, LLC is EMG Fund II Management, LP. EMG Fund II Management, LP’s general partner is EMG Fund II Management, LLC. John T. Raymond, who serves as one of our directors, is the sole member of EMG Fund II Management, LLC and as such, has sole voting and dispositive power with respect to the shares held by Tallgrass Holdings, LLC; however he disclaims beneficial ownership of those shares except to the extent of his indirect pecuniary interest therein.”
|
Ownership of Tallgrass Energy Partners, LP
The following table sets forth, as of February 8, 2017, the number of common units of TEP owned by each person who is known to us to beneficially own more than 5% of the common units of TEP (calculated in accordance with Rule 13d-3), each of the named executive officers and directors of our general partner and all directors and executive officers of our general partner as a group. Unless otherwise noted, the address of each beneficial owner named in the chart below is 4200 W. 115th Street, Suite 350, Leawood, Kansas 66211, Attn: General Counsel.
|
Name of Beneficial Owner
|
Common Units Beneficially Owned
(1)
|
Percentage of Common Units Beneficially Owned
(2)
|
||||
|
Tallgrass Energy Holdings
(3)
|
25,619,218
|
|
35.51
|
%
|
||
|
OppenheimerFunds, Inc.
(4)
|
3,827,358
|
|
5.31
|
%
|
||
|
David G. Dehaemers, Jr.
(5)
|
312,847
|
|
*
|
|
||
|
William R. Moler
(6)
|
14,428
|
|
*
|
|
||
|
Gary J. Brauchle
(7)
|
25,780
|
|
*
|
|
||
|
Christopher R. Jones
|
10,378
|
|
*
|
|
||
|
Gary D. Watkins
|
6,668
|
|
*
|
|
||
|
Frank J. Loverro
|
—
|
|
—
|
|
||
|
Stanley de J. Osborne
|
—
|
|
—
|
|
||
|
Jeffrey A. Ball
|
20,000
|
|
*
|
|
||
|
John T. Raymond
|
100,000
|
|
*
|
|
||
|
Thomas A. Gerke
|
—
|
|
—
|
|
||
|
W. Curtis Koutelas
|
—
|
|
—
|
|
||
|
All directors and executive officers of our general partner as a group (12 persons)
|
501,161
|
|
*
|
|
||
|
*
|
Less than 1%.
|
|
(1)
|
This column reflects the number of TEP common units held of record or owned through a bank, broker or other nominee. The common units of TEP presented as being beneficially owned by our general partner's directors and executive officers do not include the TEP common units held by Tallgrass Equity and Tallgrass Operations that may be attributable to such directors and officers based on their indirect ownership of Tallgrass Equity and Tallgrass Operations.
|
152
|
(2)
|
Based on 72,139,038 TEP common units outstanding as of February 8, 2017.
|
|
(3)
|
Consists of common units held of record by (i) Tallgrass Equity and (ii) Tallgrass Operations. Tallgrass Energy Holdings is the sole member of TEGP Management, LLC, TEGP's general partner. TEGP is the managing member of Tallgrass Equity. As such, Tallgrass Energy Holdings has the sole voting and dispositive power with respect to the common units owned by Tallgrass Equity. Tallgrass Energy Holdings, as the general partner of Tallgrass Development, which is the sole owner of Tallgrass Operations, also has the sole voting and dispositive power with respect to the common units owned by Tallgrass Operations. Tallgrass Energy Holdings is controlled by its board of directors, which currently consists of the following: David G. Dehaemers, Jr., William R. Moler, Frank J. Loverro, Stanley de J. Osborne, Jeffrey A. Ball and John T. Raymond. Each of the members of the board of directors of Tallgrass Energy Holdings may be deemed to beneficially own the common units owned by Tallgrass Equity and Tallgrass Operations; however, each disclaims beneficial ownership.
|
|
(4)
|
As reported on Schedule 13G filed with the SEC on February 6, 2017. Consists of common units of record by OppenheimerFunds, Inc. OppenheimerFunds, Inc. disclaims beneficial ownership pursuant to Rule 13d-4 of the Exchange Act of 1934. The business address for this person is Two World Financial Center, 225 Liberty Street, New York, New York 10281.
|
|
(5)
|
David G. Dehaemers, Jr. indirectly owns the common units through the David G. Dehaemers, Jr. Revocable Trust, dated April 26, 2006, for which Mr. Dehaemers serves as Trustee.
|
|
(6)
|
William R. Moler indirectly owns the common units through the William R. Moler Revocable Trust, under a trust agreement dated August 29, 2013, for which Mr. Moler serves as Trustee.
|
|
(7)
|
Gary J. Brauchle indirectly owns the common units through the Brauchle Revocable Trust, under trust agreement dated April 10, 2014, for which Mr. Brauchle serves as a Trustee.
|
Securities Authorized for Issuance Under Equity Compensation Plans
The following table provides information about our Class A shares that may be issued under equity compensation plans as of December 31, 2016:
|
Plan Category
|
(a)
Number of securities
to be issued
upon exercise of
outstanding options,
warrants and rights
|
(b)
Weighted average
grant date fair value of
outstanding options,
warrants and rights
|
(c)
Number of securities
remaining available
for future issuance
under equity
compensation plans
(excluding securities
reflected in column (a))
|
||||||
|
Equity compensation plans approved by security holders
(1)
|
—
|
|
$
|
—
|
|
—
|
|
||
|
Equity compensation plans not approved by security holders
(2)
|
—
|
|
$
|
—
|
|
—
|
|
||
|
Total
|
—
|
|
$
|
—
|
|
—
|
|
||
|
(1)
|
Amounts shown represent equity participation share awards outstanding under the TEGP LTIP as of December 31, 2016. The outstanding awards will be settled in Class A shares pursuant to the terms of the award agreements and are not subject to an exercise price.
|
|
(2)
|
There are no equity compensation plans in place pursuant to which Class A shares may be issued except for the TEGP LTIP.
|
For additional information regarding the LTIP, see
Note 16
–
Equity-Based Compensation
to our Consolidated Financial Statements in Item 8.
—
Financial Statements and Supplementary Data of this Annual Report.
We are a Delaware limited partnership formed in February 2015. Although we were formed as a limited partnership, we have elected to be taxed as a corporation for U.S. federal income tax purposes.
Our sole asset is Tallgrass Equity units representing
36.94%
of the membership interests in Tallgrass Equity, which directly owns (i) 20 million TEP common units, representing an approximate
27.41%
limited partner interest in TEP as of
February 15, 2017
, and (ii) all of the membership interests of TEP GP. TEP GP owns all of the TEP IDRs and
834,391
general partner units, representing an approximate
1.14%
general partner interest in TEP as of
February 15, 2017
.
153
Before the completion of the TEGP IPO in May 2015, Tallgrass Equity, formerly known as Tallgrass GP Holdings, LLC, was a privately held limited liability company that owned the general partners of Tallgrass Development and TEP. In connection with the completion of the TEGP IPO, the following transactions were effected:
|
•
|
Tallgrass Equity distributed its interests in Tallgrass Energy Holdings and Tallgrass Energy Holdings distributed its existing limited partner interest in TEGP, respectively, to the Exchange Right Holders. Tallgrass Energy Holdings is the owner of our general partner and is the general partner of Tallgrass Development;
|
|
•
|
We issued
47,725,000
Class A shares to the public for approximately
$1.3 billion
of net proceeds;
|
|
•
|
The limited partner interests in TEGP held by the Exchange Right Holders were converted into
109,504,440
Class B shares;
|
|
•
|
Tallgrass Equity issued a 30.35% membership interest in Tallgrass Equity to us in exchange for the
$1.3 billion
net proceeds from the issuance of our Class A shares to the public and the limited liability company agreement of Tallgrass Equity was amended to provide that we are the managing member of Tallgrass Equity; and
|
|
•
|
Tallgrass Equity entered into a
$150 million
revolving credit facility and borrowed
$150 million
thereunder, and used the aggregate proceeds from these borrowings together with the net proceeds from the TEGP IPO that Tallgrass Equity received from us, to purchase
20 million
TEP common units from Tallgrass Development at
$47.68
per TEP common unit and pay offering expenses and other transaction costs. Tallgrass Equity distributed the remaining proceeds to the Exchange Right Holders.
|
Limited Liability Company Agreement of Tallgrass Equity
In accordance with the Tallgrass Equity limited liability company agreement, the net profits and net losses of Tallgrass Equity will generally be allocated to the holders of Tallgrass Equity units on a pro rata basis in accordance with their relative number of Tallgrass Equity units held. Accordingly, net profits and losses of Tallgrass Equity are currently allocated
36.94%
to us and
63.06%
to the Exchange Right Holders. If we cause a distribution to be made, such distribution will be made to the holders of Tallgrass Equity units on a pro rata basis in accordance with their relative number of Tallgrass Equity units held.
For purposes of any transfer or exchange of Tallgrass Equity units initially owned by the Exchange Right Holders and our Class B shares, the Tallgrass Equity limited liability company agreement and our partnership agreement contain provisions linking each such Tallgrass Equity unit with one of our Class B shares. Our Class B shares cannot be transferred without transferring an equal number of Tallgrass Equity units and vice versa.
The Exchange Right Holders and any permitted transferees of their Tallgrass Equity units each have the right to exchange all or a portion of their Tallgrass Equity units into Class A shares at an exchange ratio of one Class A share for each Tallgrass Equity unit exchanged. The above Exchange Right may be exercised only if, simultaneously therewith, an equal number of our Class B shares are transferred by the exercising party to us.
The above mechanisms are subject to customary conversion rate adjustments for equity splits, equity dividends and reclassifications.
In addition, pursuant to our partnership agreement and the Tallgrass Equity limited liability company agreement, our capital structure and the capital structure of Tallgrass Equity generally replicate one another and provide for customary antidilution mechanisms in order to maintain the one-for-one exchange ratio between the Tallgrass Equity units and Class B shares, on the one hand, and our Class A shares, on the other hand.
Omnibus Agreement
In connection with the closing of the TEGP IPO, we, our general partner, Tallgrass Equity and Tallgrass Energy Holdings entered into the TEGP Omnibus Agreement, that addresses the following matters:
|
•
|
Tallgrass Equity's obligation to reimburse Tallgrass Energy Holdings and its affiliates for expenses incurred (i) on our behalf, (ii) on behalf of our general partner and (iii) for any other purposes related to our business and activities or those of our general partner, including our public company expenses and general and administrative expenses; and
|
|
•
|
Our use of the names "TEP" and "Tallgrass" and any associated or related marks.
|
Reimbursement of General and Administrative Expenses
.
Pursuant to the TEGP Omnibus Agreement, Tallgrass Energy Holdings performs, or cause its affiliates to perform, centralized general and administrative services for TEGP, such as accounting, audit, business development, corporate record keeping, treasury services (including cash management), real property/land, legal, operations/engineering, investor relations, risk management, commercial/marketing, information technology, insurance, government relations/compliance, tax, payroll, human resources and environmental, health and safety. In exchange, Tallgrass Equity reimburses Tallgrass Energy Holdings
154
and its affiliates for expenses incurred in providing these services. All reimbursements to our general partner, Tallgrass Energy Holdings and their respective affiliates by Tallgrass Equity will proportionally reduce cash distributions by Tallgrass Equity to its members, which in turn will reduce the amount of cash we distribute to our shareholders. The TEGP Omnibus Agreement further provides that Tallgrass Equity will reimburse Tallgrass Energy Holdings and its affiliates for TEGP's allocable portion of the premiums on any insurance policies covering TEGP's assets.
For the years ended December 31, 2016 and 2015, Tallgrass Equity reimbursed Tallgrass Management and its affiliates
$2.0 million
and $1.3 million, respectively, pursuant to the TEGP Omnibus Agreement.
Amendment and Termination
.
The TEGP Omnibus Agreement can be amended by written agreement of all parties to the TEGP Omnibus Agreement. However, we may not agree to any amendment or modification that would, in the determination of our general partner, be adverse in any material respect to the holders of our Class A shares without the prior approval of the conflicts committee. In the event of (i) a "change in control" (as defined in the TEGP Omnibus Agreement) of us or (ii) the removal of TEGP Management, LLC as our general partner in circumstances where "cause" (as defined in our partnership agreement) does not exist and the Class A shares and Class B shares held by our general partner and its affiliates were not voted in favor of such removal, the TEGP Omnibus Agreement will be terminable by Holdings, and we will have a 90-day transition period to cease our use of the name "Tallgrass" and related marks.
Exchange Right
The Exchange Right Holders and any permitted transferees of their Tallgrass Equity units each have the right to exchange all or a portion of their Tallgrass Equity units into Class A shares at an exchange ratio of one Class A share for each Tallgrass Equity unit exchanged, which we refer to as the Exchange Right. The Exchange Right may be exercised only if, simultaneously therewith, an equal number of our Class B shares are transferred by the exercising party to us. Upon such exchange, we will cancel the Class B shares received from the exercising party.
For purposes of any transfer or exchange of Tallgrass Equity units initially owned by the Exchange Right Holders and our Class B shares, the Tallgrass Equity limited liability company agreement and our partnership agreement contain provisions effectively linking one Tallgrass Equity unit with one of our Class B shares. Class B shares cannot be transferred without transferring an equal number of Tallgrass Equity units and vice versa. In connection with the Secondary Offering completed in November 2016, the participating Exchange Right Holders exercised their Exchange Right with respect to a total of 10,350,000 Tallgrass Equity units and an equal number of Class B shares.
The above mechanisms are subject to customary conversion rate adjustments for equity splits, equity dividends and reclassifications.
Registration Rights Agreement
In connection with the closing of the TEGP IPO, we entered into a shareholder and registration rights agreement, which we refer to as the registration rights agreement, with the Exchange Right Holders. Pursuant to the registration rights agreement, we agreed to register the resale of all 109,504,440 Class A shares issuable upon exercise of the Exchange Right, or the Registrable Securities, held by the Exchange Right Holders or any of their permitted transferees to the registration rights agreement under certain circumstances.
The Registrable Securities were subsequently registered pursuant to our Form S-3/A (File No. 333-210976) filed with the SEC on August 8, 2016, which became effective August 10, 2016. We are required to maintain the effectiveness of such registration statement until the date on which all Registrable Securities covered by the shelf registration statement have been sold thereunder in accordance with the plan and method of distribution disclosed in the annual report included in the shelf registration statement, or otherwise cease to be Registrable Securities under the registration rights agreement.
Demand and Piggyback Rights
The Exchange Right Holders have the right to require that we register their Registrable Securities and/or facilitate an underwritten offering of their Registrable Securities. There is no aggregate limit on the number of such demand requests; however, the demand rights of these holders are subject to a number of size, frequency and other limitations. In November 2016, EMG and Kelso exercised this "demand" registration right under the registration rights agreement and together with the other participating Exchange Right Holders, sold 10,350,000 Class A Shares in the Secondary Offering that closed on November 22, 2016. For a period of 120 days following the closing of the Secondary Offering, the participating Exchange Right Holders are not permitted to exchange any of their Tallgrass Equity units pursuant to the terms of the underwriting agreement.
155
In the event we propose to conduct an underwritten offering of Registrable Securities, then the holders of Registrable Securities will generally have customary rights to participate in such offering, subject to customary offering size limitations and related allocation provisions and other limitations. Similarly, in the event that eligible holders demand that we conduct an underwritten offering of their Registrable Securities, then we will generally have customary rights to participate in such offering, subject to customary offering size limitations and related allocation provisions and other limitations.
Delay Rights
We will not be required to comply with any demand request, and may suspend the holders' ability to use any shelf registration statement, following our delivery of written notice to the holders of customary blackout periods and deferral events.
Expenses
The holders of Registrable Securities will pay certain selling expenses, including any underwriters' discounts and commissions. We will generally cause Tallgrass Equity to pay all other registration expenses in connection with our obligations under the registration rights agreement.
Pursuant to the terms of the registration rights agreement discussed above, the Company was obligated to cause Tallgrass Equity to pay all fees and expenses related to the Secondary Offering, excluding certain selling expenses, including any underwriters' discounts and commissions. The Company did not receive any proceeds from the sale of Class A shares in the Secondary Offering. The total expenses paid by Tallgrass Equity in connection with the Secondary Offering, and associated filings, were approximately $1.0 million.
Referral Fee
One of the underwriters of the TEGP IPO, Wells Fargo Securities, LLC ("WFS") entered into a Referral Agreement with its retail brokerage affiliate, Wells Fargo Advisors, LLC ("WFA"), pursuant to which WFS agreed to pay a referral fee of up to $600,000 to WFA, up to 50% of which may be directed by WFA to Timothy Dehaemers, a financial adviser employed by WFA who is also the brother of our President and Chief Executive Officer, for his introduction and referral of WFS to TEGP. The referral fee paid from WFS to WFA was paid solely from the underwriting commissions received by WFS and did not in any way increase the total fees paid by TEGP to WFS in connection with the TEGP IPO.
Procedures for Review, Approval or Ratification of Transactions with Related Persons
The board of directors of our general partner has adopted a related party transactions policy (the "Policy"), which supplements the conflict of interest provisions in our code of business conduct and ethics. According to the Policy, a "Related Party Transaction" is an actual or proposed transaction, arrangement or relationship (or any series of similar transactions, arrangements or relationships) in which (a) the Partnership, our general partner or Tallgrass Equity (collectively, the "Partnership Group") was, is or will be a participant, (b) the amount involved exceeds $120,000, and (c) in which any Related Party had, has or will have a direct or indirect material interest. The Policy's definition of a "Related Party" is in line with the definition set forth in the instructions to Item 404(a) of Regulation S-K promulgated by the SEC. Transactions resolved under the conflicts provisions of our partnership agreement are not required to be reviewed or approved under the policy.
Under the Policy, the General Counsel and Chief Financial Officer or Chief Accounting Officer are responsible for determining whether a Related Party Transaction requires the approval of the Audit Committee. The Audit Committee is responsible for evaluating and assessing a proposed transaction based on the relevant facts and circumstances, including comparing the terms of the proposed transaction to the terms available to unrelated third parties. The Audit Committee shall approve only those Related Party Transactions that are either (i) on terms no less favorable to the Partnership Group than those generally being provided to or available from unrelated third parties or (ii) are fair and reasonable to the Partnership Group, taking into account the totality of the relationships between the parties involved.
If the General Counsel determines it is impractical or undesirable to wait until an Audit Committee meeting to consummate a Related Party Transaction, the chairman of the Audit Committee may review and approve the Related Party Transaction in accordance with the procedures set forth in the Policy. However, any such approval (and its rationale) must be reported to the Audit Committee at the next regularly scheduled meeting. A Related Party Transaction entered into without pre-approval of the Audit Committee shall not be deemed to violate the Policy, or be invalid or unenforceable, so long as the transaction is brought to the Audit Committee as promptly as reasonably practical after it is entered into and is subsequently ratified by the Audit Committee. If the Audit Committee determines not to ratify a Related Party Transaction that has been commenced without approval, the Audit Committee may direct the immediate discontinuation or rescission of the transaction, or modify the transaction to make it acceptable for ratification.
Director Independence
The information required by Item 407(a) or Regulation S-K is included in Item 10.—Directors, Executive Officers and Corporate Governance.
156
Related Party Transactions of TEP
As of
February 15, 2017
, Tallgrass Development owned
5,619,218
TEP common units representing approximately
7.79%
of TEP's outstanding limited partner common units and Tallgrass Equity owned
20,000,000
common units representing approximately
27.72%
of TEP's outstanding limited partner common units. In addition, TEP GP owns
834,391
general partner units representing an approximate
1.14%
general partner interest in TEP and all of the TEP incentive distribution rights.
Distributions and Payments to TEP GP and Its Affiliates
The following information summarizes the distributions and payments made or to be made by TEP to TEP GP and its affiliates in connection with TEP's formation, ongoing operation and any liquidation of TEP. These distributions and payments were determined by and among affiliated entities and, consequently, are not the result of arm's-length negotiations.
Distributions of available cash to TEP GP and its affiliates
. TEP will generally make distributions of available cash to common unitholders pro rata (including Tallgrass Development as the holder of an aggregate of
5,619,218
TEP common units) and to TEP GP as follows: (1) an approximate
1.14%
general partner interest with respect to its general partner units and (2) as distributions of available cash exceed the MQD and other higher target levels specified in TEP's partnership agreement, increasing percentages of distributions with respect to its IDRs, up to 48% of the distributions above the highest target level. Assuming TEP has sufficient available cash to pay the full MQD on all of its outstanding units for four quarters, TEP GP and its affiliates would receive an annual distribution of approximately
$1.0 million
on their general partner units and approximately
$30.0 million
on their common units based on their ownership as of
February 15, 2017
. TEP has distributed available cash in excess of the MQD since the quarterly period ending September 30, 2013.
Payments to TEP GP and its affiliates
. Neither TEP GP nor Tallgrass Energy Holdings and its affiliates receive a management fee or other compensation for managing TEP. TEP GP and Tallgrass Energy Holdings and its affiliates are reimbursed, however, for all direct and indirect expenses incurred on TEP's behalf pursuant to its partnership agreement and the TEP Omnibus Agreement (defined below). Neither TEP's partnership agreement nor the TEP Omnibus Agreement limit the amount of expenses for which TEP GP or Tallgrass Energy Holdings and its affiliates may be reimbursed. TEP's partnership agreement provides that TEP GP will determine in good faith the expenses that are allocable to TEP.
Withdrawal or removal of TEP GP
. If TEP GP withdraws or is removed, its general partner interest and its IDRs will either be sold to the new general partner for cash or converted into common units, in each case for an amount equal to the fair market value of those interests.
Liquidation Stage
. Upon TEP's liquidation, the partners, including TEP GP, will be entitled to receive liquidating distributions according to their particular capital account balances, as further detailed in TEP's limited partnership agreement.
Omnibus Agreement
Upon the closing of the TEP IPO, TEP entered into an Omnibus Agreement with Tallgrass Development, its general partner, Tallgrass Energy Holdings, and TEP GP, which we refer to as the TEP Omnibus Agreement, that governs TEP's relationship with them regarding the following matters:
|
•
|
the provision by Tallgrass Energy Holdings to TEP of certain administrative services and TEP's agreement to reimburse it for such services;
|
|
•
|
the provision by Tallgrass Energy Holdings of such employees as may be necessary to operate and manage TEP's business, and TEP's agreement to reimburse it for the expenses associated with such employees;
|
|
•
|
certain indemnification obligations;
|
|
•
|
TEP's use of the name "Tallgrass" and related marks; and
|
|
•
|
TEP's right of first offer to acquire certain assets from Tallgrass Development, including each of the Retained Assets, if Tallgrass Development decides to sell such assets.
|
Reimbursement of General and Administrative Expenses
. Pursuant to the TEP Omnibus Agreement, Tallgrass Energy Holdings performs, or causes its affiliates to perform, centralized corporate, general and administrative services for TEP, such as legal, corporate record keeping, planning, budgeting, regulatory, accounting, billing, business development, treasury, insurance administration and claims processing, risk management, health, safety and environmental, information technology, human resources, investor relations, cash management and banking, payroll, internal audit, taxes and engineering. In exchange, TEP reimburse it for expenses incurred in providing these services. The reimbursements to TEP GP and Tallgrass Energy Holdings and its affiliates are made prior to cash distributions to TEP's common unitholders. The TEP Omnibus Agreement further provides that TEP will reimburse Tallgrass Energy Holdings and its affiliates for TEP's allocable portion of the premiums on any insurance policies covering TEP's assets. TEP anticipates reimbursement to Tallgrass Energy Holdings and its affiliates will vary with the size and scale of TEP's operations, among other factors.
157
For the years ended December 31, 2016, 2015 and 2014, TEP reimbursed Tallgrass Energy Holdings
$39.9 million
,
$37.5 million
and
$23.5 million
, respectively, pursuant to the TEP Omnibus Agreement.
Indemnification
. Under the terms of the TEP Omnibus Agreement, Tallgrass Development is required to indemnify TEP from liabilities arising out of any federal, state and local income tax liabilities attributable to the ownership and operation of the assets contributed to us in connection with TEP's IPO until 60 days after the applicable statute of limitations. Tallgrass Development also agreed to use commercially reasonable efforts to obtain indemnification from Kinder Morgan for losses suffered or incurred by TEP with respect to the assets contributed to TEP as part of the TEP IPO, to the extent that Kinder Morgan is obligated to indemnify Tallgrass Development under the purchase and sale agreement pursuant to which Tallgrass Development acquired the contributed assets and remit any proceeds received from Kinder Morgan pursuant to such indemnification obligations to TEP. Kinder Morgan's indemnity obligations under the Kinder Morgan purchase agreement generally survived through February 13, 2014, although certain specified indemnities last for longer periods of time. Under the TEP Omnibus Agreement, TEP has agreed to indemnify Tallgrass Development for events and conditions associated with the operation of the contributed assets that occur on or after the closing of TEP's IPO.
Right of First Offer
. Under the terms of the TEP Omnibus Agreement, Tallgrass Development has granted TEP a right of first offer, for so long as Tallgrass Development or its affiliates, individually or as part of a group, control TEP GP, on (i) the Retained Assets and (ii) any assets that are hereafter developed, constructed or acquired by Tallgrass Development or its subsidiaries (excluding TEP and its subsidiaries) for the purpose of processing natural gas in Natrona, Converse or Campbell counties in Wyoming, which we refer to collectively as the ROFO Assets. If Tallgrass Development or any of its affiliates decide to attempt to sell (other than to an affiliate of Tallgrass Development, excluding TEP and its subsidiaries) a ROFO Asset, Tallgrass Development or its affiliate will notify TEP in advance and, prior to selling such ROFO Asset to a third party, will negotiate with TEP exclusively and in good faith for a period of 45 days in order to give TEP an opportunity to enter into definitive documentation for the purchase and sale of such ROFO Asset on terms that are mutually acceptable to Tallgrass Development or its affiliate and TEP. If TEP and Tallgrass Development or its affiliate have not entered into a letter of intent or a definitive purchase and sale agreement with respect to such ROFO Asset within such 45-day period, Tallgrass Development or its affiliate will have the right to sell such ROFO Asset to a third party following the expiration of such 45-day period on any terms that are acceptable to Tallgrass Development or its affiliate and such third party. TEP's decision to acquire or not to acquire a ROFO Asset pursuant to this right will require the approval of the conflicts committee of the board of directors of TEP GP.
Amendment and Termination
. The TEP Omnibus Agreement can be amended by written agreement of all parties to the agreement. However, TEP may not agree to any amendment or modification that would, in the determination of TEP GP, be adverse in any material respect to the holders of TEP's common units without the prior approval of the conflicts committee. In the event of (i) a "change in control" (as defined in the TEP Omnibus Agreement) of the partnership or (ii) the removal of Tallgrass MLP GP, LLC as TEP's general partner in circumstances where "cause" (as defined in TEP's partnership agreement) does not exist and the common units held by TEP GP and its affiliates were not voted in favor of such removal, the TEP Omnibus Agreement (other than the indemnification and reimbursement provisions therein) will be terminable by Tallgrass Development, and TEP will have a 90-day transition period to cease TEP's use of the name "Tallgrass" and related marks.
Acquisitions from Tallgrass Development
On April 1, 2014, Tallgrass MLP Operations, LLC, a Delaware limited liability company and TEP's wholly-owned subsidiary acquired 100% of the issued and outstanding membership interests in Trailblazer from Tallgrass Operations, LLC, a Delaware limited liability company and wholly-owned direct subsidiary of Tallgrass Development ("Tallgrass Operations"), for total consideration valued at approximately $164 million, pursuant to that certain Contribution and Sale Agreement by and between Tallgrass Development, Tallgrass Operations, and TEP.
Effective September 1, 2014, TEP acquired a 33.3% membership interest in Pony Express, from Tallgrass Development for total consideration of approximately $600 million pursuant to that certain Contribution and Transfer Agreement by and between Tallgrass Development, Pony Express, Tallgrass Operations, and TEP. At closing, TEP entered into a Second Amended and Restated Limited Liability Company Agreement of Pony Express effective September 1, 2014 with Tallgrass Development and Pony Express, which provides TEP a minimum quarterly preference payment of $16.65 million through the quarter ending September 30, 2015 with distributions thereafter shared in accordance with the terms of the Second Amended and Restated Limited Liability Company Agreement. In connection with the transaction, Pony Express entered into a Cash Management Agreement effective August 27, 2014 under which cash balances are swept daily and recorded as loans from Pony Express to Tallgrass Development. $270 million of the total consideration was subsequently swept to Tallgrass Development and was recorded as a related party loan which bears interest at Tallgrass Development's incremental borrowing rate. As of September 1, 2014, balances lent to Tallgrass Development under the cash management agreement are classified as related party receivables on TEP's consolidated balance sheet and will be cash settled.
158
Effective March 1, 2015, TEP acquired an additional 33.3% membership interest in Pony Express from Tallgrass Development for total consideration of approximately $700 million pursuant to that certain Purchase and Sale Agreement by and between Tallgrass Development, Tallgrass Operations and TEP. At closing, TEP, Tallgrass Development and Pony Express entered into a Third Amended and Restated Limited Liability Company Agreement of Pony Express effective March 1, 2015, which provides TEP a minimum quarterly preference payment of $36.65 million through the quarter ending December 31, 2015 with distributions thereafter shared in accordance with the terms of the Third Amended and Restated Limited Liability Company Agreement.
Effective January 1, 2016, TEP acquired an additional 31.3% membership interest in Pony Express from Tallgrass Development for total cash consideration of approximately $475 million and the issuance of 6,518,000 TEP common units, which TEP common units are subject to a call option granted by Tallgrass Operations in favor of TEP, pursuant to that certain Contribution and Transfer Agreement by and between Tallgrass Development, Tallgrass Operations and TEP. In July 2016, October 2016 and on February 1, 2017, TEP exercised the call option granted by Tallgrass Development covering
3,563,146
,
1,251,760
and
1,703,094
common units, respectively. These common units were deemed canceled upon the exercise of the call option and as of such exercise date were no longer issued and outstanding. As of
February 15, 2017
, no common units remained subject to the call option.
On May 6, 2016, Tallgrass Development assigned us its right to purchase a 25% membership interest in Rockies Express from a unit of Sempra U.S. Gas and Power ("Sempra") pursuant to the purchase agreement originally entered into between Tallgrass Development's wholly-owned subsidiary and Sempra in March 2016. Subsequently on May 6, 2016, we closed the purchase of a
25%
membership interest in Rockies Express from Sempra pursuant to the purchase agreement for cash consideration of approximately
$436.0 million
, after making the adjustments to the purchase price required by the purchase agreement.
Effective January 1, 2017, TEP acquired 100% of the issued and outstanding membership interests in Terminals and 100% of the issued and outstanding membership interests in NatGas from TD for total cash consideration of $140 million, pursuant to that certain Purchase and Sale Agreement by and between Tallgrass Development, Tallgrass Operations and TEP.
Following an offer received from Tallgrass Development with respect to common units owned by Tallgrass Development not subject to the call option, we repurchased
736,262
common units from Tallgrass Development at an aggregate price of approximately
$35.3 million
, or
$47.99
per common unit, on
February 1, 2017
, which was approved by the conflicts committee of the board of directors of our general partner.
Competition
Under TEP's partnership agreement, Tallgrass Development and its affiliates are expressly permitted to compete with TEP. Tallgrass Development and any of its affiliates, including EMG and Kelso, may acquire, construct or dispose of additional transportation, storage, terminalling and processing or other assets in the future without any obligation to offer us the opportunity to purchase or construct those assets.
Contracts with Affiliates
Pony Express is party to a terminal lease and operating agreement with Tallgrass Sterling Terminal, LLC ("Sterling Terminal"), which was an indirect wholly-owned subsidiary of Tallgrass Development prior to TEP's acquisition in January 2017. Pursuant to such agreement, Pony Express leases approximately 1.3 million barrels of crude oil storage and Sterling Terminal provides associated crude oil terminalling services. Pony Express pays Sterling Terminal a fixed monthly charge of $942,000 per month, plus a volumetric charge of $0.07 per barrel for each barrel delivered to the terminal in excess of 9,424,000 per month, subject in both cases to an annual 2% escalator. The initial five-year term of the agreement expires in May 2020. Pony Express made lease payments to Sterling Terminal of $11.5 million and $7.6 million during the years ended December 31, 2016 and 2015, respectively, pursuant to the agreement.
In May 2016, Pony Express entered into an electric service master meter agreement with Terminals, which was an indirect wholly-owned subsidiary of Tallgrass Development prior to our acquisition in January 2017. Pursuant to such agreement, Terminals receives electric power from Pony Express at the Sterling Terminal. Terminals pays Pony Express for its usage based on the charges incurred by Pony Express from its third-party electric service provider. Terminals made payments to Pony Express under the agreement of
$0.4 million
during the year ended December 31, 2016.
159
Other Transactions
Tallgrass Management, LLC, an affiliate of our general partner, has one employee who is an immediate family member of a former executive officer of our general partner. Zach Rider, a manager of corporate development, is the son of George Rider, the former Executive Vice President, General Counsel and Secretary of TEP GP. For the years ended December 31, 2016, 2015 and 2014, he received cash compensation of $186,246, $179,357 and $159,846, respectively, and standard employee benefits of approximately $11,725, $9,977 and $13,747, respectively. For the year ended December 31, 2015, he was awarded 3,800 unvested EPUs with a grant date value of $38.62 per EPU on terms consistent with all eligible employees. As of July 1, 2016, George Rider has retired and is no longer employed by Tallgrass Management, LLC.
We have engaged PricewaterhouseCoopers LLP as our independent registered public accounting firm. The following table summarizes fees we were billed by PricewaterhouseCoopers LLP (or included in TD's general and administrative expense allocation to us) for independent auditing, tax and related services for each of the last two fiscal years:
|
Year Ended December 31,
|
||||||||
|
|
2016
|
2015
|
||||||
|
|
(in thousands)
|
|||||||
|
Audit fees
(1)
|
$
|
2,040
|
|
$
|
1,989
|
|
||
|
Audit related fees
(2)
|
—
|
|
—
|
|
||||
|
Tax fees
(3)
|
454
|
|
525
|
|
||||
|
Total
|
$
|
2,494
|
|
$
|
2,514
|
|
||
|
(1)
|
Audit fees represent amounts billed for each of the years presented for professional services rendered in connection with (i) the integrated audit of our annual financial statements and internal control over financial reporting, (ii) the review of our quarterly financial statements or (iii) those services normally provided in connection with statutory and regulatory filings or engagements including comfort letters, consents and other services related to SEC matters. This information is presented as of the latest practicable date for this Annual Report.
|
|
(2)
|
Audit-related fees represent amounts we were billed in each of the years presented for assurance and related services that are reasonably related to the performance of the annual audit or quarterly reviews of our financial statements and are not reported under audit fees.
|
|
(3)
|
Tax fees represent amounts we were billed in each of the years presented for professional services rendered in connection with tax compliance, tax advice and tax planning.
|
All services provided by our independent registered public accountant are subject to pre-approval by the audit committee of our general partner. The audit committee of our general partner is informed of each engagement of the independent registered public accountant to provide services under the policy. The audit committee of our general partner has approved the use of PricewaterhouseCoopers LLP as our independent registered public accounting firm, including all services rendered for the
year ended December 31, 2016
.
160
(1) Financial Statements
Consolidated Financial Statements included in this Item 15:
Financial Statements of Rockies Express Pipeline LLC
161
FINANCIAL STATEMENTS
ROCKIES EXPRESS
PIPELINE LLC
For the
years ended
December 31, 2016
,
2015
and
2014
162
Report of Independent Registered Public Accounting Firm
To the
Board of Directors of Rockies Express Pipeline LLC:
We have audited the accompanying financial statements of Rockies Express Pipeline LLC, which comprise the
balance sheets
as of December 31, 2016
and 2015, and the related statements of income, members’ equity, and cash flows for each of the three years in the period ended December 31, 2016.
Management's Responsibility for the
Financial Statements
Management is responsible for the preparation and fair presentation of the
financial statements in accordance with accounting principles generally accepted in the United States of America; this includes the design, implementation, and maintenance of internal control relevant to the preparation and fair presentation of
financial statements that are free from material misstatement, whether due to fraud or error.
Auditors’ Responsibility
Our responsibility is to express an opinion on the financial statements based on our audits. We conducted our audits in accordance with auditing standards generally accepted in the United States of America. Those standards require that we plan and perform the audit to obtain reasonable assurance about whether the financial statements are free from material misstatement.
An audit involves performing procedures to obtain audit evidence about the amounts and disclosures in the financial statements. The procedures selected depend on our judgment, including the assessment of the risks of material misstatement of the
financial statements, whether due to fraud or error. In making those risk assessments, we consider internal control relevant to the Company's preparation and fair presentation of the financial statements in order to design audit procedures that are appropriate in the circumstances, but not for the purpose of expressing an opinion on the effectiveness of the Company's internal control. Accordingly, we express no such opinion. An audit also includes evaluating the appropriateness of accounting policies used and the reasonableness of significant accounting estimates made by management, as well as evaluating the overall presentation of the financial statements. We believe that the audit evidence we have obtained is sufficient and appropriate to provide a basis for our audit opinion.
Opinion
In our opinion, the financial statements referred to above present fairly, in all material respects, the financial position of Rockies Express Pipeline LLC as of December 31, 2016 and 2015, and the results of its operations and its cash flows for each of the three years in the period ended December 31, 2016, in accordance with accounting principles generally accepted in the United States of America.
Emphasis of Matter
As described in Note 6 to the financial statements, the Company has significant transactions with related parties. Our opinion is not modified with respect to this matter.
/s/ PricewaterhouseCoopers LLP
Denver, Colorado
February 15, 2017
163
ROCKIES EXPRESS PIPELINE LLC
BALANCE SHEETS
|
December 31,
|
|||||||
|
2016
|
2015
|
||||||
|
(in millions)
|
|||||||
|
ASSETS
|
|||||||
|
Current Assets:
|
|||||||
|
Cash and cash equivalents
|
$
|
118.4
|
|
$
|
48.0
|
|
|
|
Accounts receivable, net
|
59.4
|
|
87.6
|
|
|||
|
Regulatory assets
|
12.3
|
|
0.3
|
|
|||
|
Other current assets
|
5.6
|
|
4.0
|
|
|||
|
Total Current Assets
|
195.7
|
|
139.9
|
|
|||
|
Property, plant and equipment, net
|
6,063.7
|
|
5,941.0
|
|
|||
|
Deferred charges and other assets
|
15.6
|
|
19.0
|
|
|||
|
Total Noncurrent Assets
|
6,079.3
|
|
5,960.0
|
|
|||
|
Total Assets
|
$
|
6,275.0
|
|
$
|
6,099.9
|
|
|
|
LIABILITIES AND EQUITY
|
|||||||
|
Current Liabilities:
|
|||||||
|
Accounts payable
|
$
|
38.1
|
|
$
|
29.0
|
|
|
|
Accrued interest
|
56.3
|
|
56.3
|
|
|||
|
Accrued taxes
|
67.7
|
|
68.2
|
|
|||
|
MFN revenue sharing liability
|
9.4
|
|
9.5
|
|
|||
|
Construction advances
|
11.7
|
|
12.3
|
|
|||
|
Accrued other current liabilities
|
4.9
|
|
4.5
|
|
|||
|
Total Current Liabilities
|
188.1
|
|
179.8
|
|
|||
|
Long-term Liabilities and Deferred Credits:
|
|||||||
|
Long-term debt
|
2,561.7
|
|
2,557.9
|
|
|||
|
Other long-term liabilities and deferred credits
|
95.2
|
|
44.0
|
|
|||
|
Total Long-term Liabilities and Deferred Credits
|
2,656.9
|
|
2,601.9
|
|
|||
|
Commitments and Contingencies
|
|||||||
|
Members' Equity:
|
|||||||
|
Members' equity
|
3,430.0
|
|
3,318.2
|
|
|||
|
Total Liabilities and Members' Equity
|
$
|
6,275.0
|
|
$
|
6,099.9
|
|
|
The accompanying notes are an integral part of these financial statements.
164
ROCKIES EXPRESS PIPELINE LLC
STATEMENTS OF INCOME
|
Years Ended December 31,
|
|||||||||||
|
2016
|
2015
|
2014
|
|||||||||
|
(in millions)
|
|||||||||||
|
Revenues:
|
|||||||||||
|
Transportation services
|
$
|
715.1
|
|
$
|
779.0
|
|
$
|
703.6
|
|
||
|
Natural gas sales
|
—
|
|
2.1
|
|
36.7
|
|
|||||
|
Total Revenues
|
715.1
|
|
781.1
|
|
740.3
|
|
|||||
|
Operating Costs and Expenses:
|
|||||||||||
|
Cost of natural gas sales (exclusive of depreciation and amortization shown below)
|
—
|
|
2.3
|
|
32.3
|
|
|||||
|
Cost of transportation services (exclusive of depreciation and amortization shown below)
|
26.5
|
|
30.2
|
|
29.8
|
|
|||||
|
Operations and maintenance
|
24.8
|
|
21.2
|
|
19.4
|
|
|||||
|
Depreciation and amortization
|
204.3
|
|
199.4
|
|
195.1
|
|
|||||
|
General and administrative
|
39.9
|
|
26.7
|
|
21.5
|
|
|||||
|
Taxes, other than income taxes
|
71.9
|
|
73.9
|
|
70.8
|
|
|||||
|
Total Operating Costs and Expenses
|
367.4
|
|
353.7
|
|
368.9
|
|
|||||
|
Operating Income
|
347.7
|
|
427.4
|
|
371.4
|
|
|||||
|
Other (Expense) Income:
|
|||||||||||
|
Interest expense, net
|
(158.6
|
)
|
(170.1
|
)
|
(185.3
|
)
|
|||||
|
Gain on litigation settlement
|
61.7
|
|
—
|
|
—
|
|
|||||
|
Other income, net
|
27.7
|
|
6.6
|
|
3.3
|
|
|||||
|
Total Other Expense, net
|
(69.2
|
)
|
(163.5
|
)
|
(182.0
|
)
|
|||||
|
Net Income to Members
|
$
|
278.5
|
|
$
|
263.9
|
|
$
|
189.4
|
|
||
The accompanying notes are an integral part of these financial statements.
165
ROCKIES EXPRESS PIPELINE LLC
STATEMENTS OF MEMBERS' EQUITY
|
Total
|
Rockies Express Holdings, LLC
|
TEP REX Holdings, LLC
|
Sempra REX Holdings, LLC
|
P66 REX LLC
|
|||||||||||||||
|
(in millions)
|
|||||||||||||||||||
|
Members' Equity:
|
|||||||||||||||||||
|
Balance at December 31, 2013
|
$
|
2,826.8
|
|
$
|
1,413.2
|
|
$
|
—
|
|
$
|
706.8
|
|
$
|
706.8
|
|
||||
|
Net Income to Members
|
189.4
|
|
94.6
|
|
—
|
|
47.4
|
|
47.4
|
|
|||||||||
|
Contributions from Members
|
165.7
|
|
83.1
|
|
—
|
|
41.3
|
|
41.3
|
|
|||||||||
|
Distributions to Members
|
(361.7
|
)
|
(180.9
|
)
|
—
|
|
(90.4
|
)
|
(90.4
|
)
|
|||||||||
|
Balance at December 31, 2014
|
$
|
2,820.2
|
|
$
|
1,410.0
|
|
$
|
—
|
|
$
|
705.1
|
|
$
|
705.1
|
|
||||
|
Net Income to Members
|
263.9
|
|
131.9
|
|
—
|
|
66.0
|
|
66.0
|
|
|||||||||
|
Contributions from Members
|
733.1
|
|
366.5
|
|
—
|
|
183.3
|
|
183.3
|
|
|||||||||
|
Distributions to Members
|
(499.0
|
)
|
(249.4
|
)
|
—
|
|
(124.8
|
)
|
(124.8
|
)
|
|||||||||
|
Balance at December 31, 2015
|
$
|
3,318.2
|
|
$
|
1,659.0
|
|
$
|
—
|
|
$
|
829.6
|
|
$
|
829.6
|
|
||||
|
Net Income to Members
|
278.5
|
|
139.3
|
|
42.6
|
|
27.0
|
|
69.6
|
|
|||||||||
|
Contributions from Members
|
304.9
|
|
152.5
|
|
50.0
|
|
26.2
|
|
76.2
|
|
|||||||||
|
Distributions to Members
|
(471.6
|
)
|
(235.8
|
)
|
(75.9
|
)
|
(42.0
|
)
|
(117.9
|
)
|
|||||||||
|
Transfer of equity interest (see Note 1)
|
—
|
|
—
|
|
840.8
|
|
(840.8
|
)
|
—
|
|
|||||||||
|
Balance at December 31, 2016
|
$
|
3,430.0
|
|
$
|
1,715.0
|
|
$
|
857.5
|
|
$
|
—
|
|
$
|
857.5
|
|
||||
The accompanying notes are an integral part of these financial statements.
166
ROCKIES EXPRESS PIPELINE LLC
STATEMENTS OF CASH FLOWS
|
Years Ended December 31,
|
|||||||||||
|
2016
|
2015
|
2014
|
|||||||||
|
(in millions)
|
|||||||||||
|
Cash Flows from Operating Activities:
|
|||||||||||
|
Net income to Members
|
$
|
278.5
|
|
$
|
263.9
|
|
$
|
189.4
|
|
||
|
Adjustments to reconcile net income to net cash flows from operating activities:
|
|||||||||||
|
Depreciation and amortization
|
209.6
|
|
204.8
|
|
201.1
|
|
|||||
|
Changes in components of working capital:
|
|||||||||||
|
Accounts receivable
|
28.2
|
|
(23.8
|
)
|
6.3
|
|
|||||
|
Current regulatory assets and liabilities, net
|
(12.5
|
)
|
(10.2
|
)
|
(15.2
|
)
|
|||||
|
Other current assets and liabilities
|
(0.7
|
)
|
(0.9
|
)
|
0.6
|
|
|||||
|
Accounts payable
|
12.2
|
|
3.7
|
|
0.8
|
|
|||||
|
Accrued taxes
|
(0.6
|
)
|
3.7
|
|
(3.1
|
)
|
|||||
|
Customer deposits
|
52.9
|
|
32.2
|
|
—
|
|
|||||
|
Other operating, net
|
(22.5
|
)
|
(3.0
|
)
|
(6.9
|
)
|
|||||
|
Net Cash Provided by Operating Activities
|
545.1
|
|
470.4
|
|
373.0
|
|
|||||
|
Cash Flows from Investing Activities:
|
|||||||||||
|
Capital expenditures
|
(305.7
|
)
|
(281.9
|
)
|
(158.6
|
)
|
|||||
|
Other investing, net
|
(2.3
|
)
|
(1.9
|
)
|
(2.0
|
)
|
|||||
|
Net Cash Used in Investing Activities
|
(308.0
|
)
|
(283.8
|
)
|
(160.6
|
)
|
|||||
|
Cash Flows from Financing Activities:
|
|||||||||||
|
Distributions to Members
|
(471.6
|
)
|
(499.0
|
)
|
(361.7
|
)
|
|||||
|
Contributions from Members
|
304.9
|
|
733.1
|
|
165.7
|
|
|||||
|
Repayment of debt
|
—
|
|
(450.0
|
)
|
—
|
|
|||||
|
Payments for deferred financing costs
|
—
|
|
(0.7
|
)
|
—
|
|
|||||
|
Net Cash Used in Financing Activities
|
(166.7
|
)
|
(216.6
|
)
|
(196.0
|
)
|
|||||
|
Net Change in Cash and Cash Equivalents
|
70.4
|
|
(30.0
|
)
|
16.4
|
|
|||||
|
Cash and Cash Equivalents, beginning of period
|
48.0
|
|
78.0
|
|
61.6
|
|
|||||
|
Cash and Cash Equivalents, end of period
|
$
|
118.4
|
|
$
|
48.0
|
|
$
|
78.0
|
|
||
|
Supplemental Disclosure of Cash Flow Information:
|
|||||||||||
|
Cash paid during the period for interest (net of capitalized interest)
|
$
|
155.6
|
|
$
|
170.7
|
|
$
|
181.3
|
|
||
|
Schedule of Noncash Investing and Financing Activities:
|
|||||||||||
|
Increase in accrual for payment of property, plant and equipment
|
$
|
—
|
|
$
|
8.4
|
|
$
|
—
|
|
||
The accompanying notes are an integral part of these financial statements.
167
ROCKIES EXPRESS PIPELINE LLC
NOTES TO FINANCIAL STATEMENTS
1. Description of Business
Rockies Express Pipeline LLC ("Rockies Express") is a Federal Energy Regulatory Commission ("FERC") regulated natural gas transportation system with approximately
1,712
miles of natural gas pipeline, including laterals, extending from Opal, Wyoming and Meeker, Colorado to Clarington, Ohio and consisting of three zones:
|
•
|
Zone 1 - a
328
-mile pipeline from the Meeker Hub in Northwest Colorado, across Southern Wyoming to the Cheyenne Hub in Weld County, Colorado capable of transporting 2.0 Bcf/d of natural gas from west to east;
|
|
•
|
Zone 2 - a
714
-mile pipeline from the Cheyenne Hub to an interconnect in Audrain County, Missouri capable of transporting 1.8 Bcf/d of natural gas from west to east; and
|
|
•
|
Zone 3 - a
643
-mile pipeline from Audrain County, Missouri to Clarington, Ohio, which is bi-directional and capable of transporting 1.8 Bcf/d of natural gas from west to east and 2.6 Bcf/d of natural gas from east to west.
|
The member interests and voting rights in Rockies Express as of
December 31, 2016
are as follows:
|
•
|
50%
- Rockies Express Holdings, LLC ("REX Holdings"), an indirect wholly owned subsidiary of Tallgrass Development, LP ("TD");
|
|
•
|
25%
- TEP REX Holdings, LLC ("TEP REX"), an indirect wholly owned subsidiary of Tallgrass Energy Partners, LP ("TEP"); and
|
|
•
|
25%
- P66REX LLC, formerly known as COPREX LLC, a wholly owned subsidiary of Phillips 66.
|
On March 29, 2016, REX Holdings signed a Purchase Agreement with Sempra REX Holdings, LLC ("Sempra") to acquire Sempra's
25%
membership interest in Rockies Express for cash consideration of
$440 million
, subject to adjustment under the Purchase Agreement. A subsidiary of Phillips 66, which owns a
25%
membership interest in Rockies Express, waived its right to purchase its proportionate share of Sempra's
25%
membership interest. In exchange, TD and Sempra agreed to amend the Rockies Express limited liability company agreement to (i) increase the percentage with respect to matters that require approval, consent, or presence of the members of Rockies Express from
75%
to
80%
, and (ii) with respect to certain fundamental decisions, increase the required vote from
85%
to
90%
of the membership interests (the "REX Amendment").
On May 6, 2016, TEP REX and REX Holdings entered into an Assignment and Assumption Agreement pursuant to which REX Holdings assigned to TEP REX all of its rights under the Purchase Agreement and, in exchange, TEP REX assumed all of the rights and obligations of REX Holdings under the Purchase Agreement. Subsequently on May 6, 2016, TEP REX closed the purchase of a
25%
membership interest in Rockies Express from Sempra pursuant to the Purchase Agreement for cash consideration of approximately
$436.0 million
, after making the adjustments to the purchase price required by the Purchase Agreement. The REX Amendment became effective immediately prior to closing of the sale of the
25%
membership interest.
2. Summary of Significant Accounting Policies
Basis of Presentation
The preparation of financial statements in conformity with accounting principles generally accepted in the United States of America ("GAAP") requires management to make estimates and assumptions. These estimates and assumptions affect the reported amounts of assets and liabilities, the disclosure of contingent assets and liabilities, and the reported amounts of revenues and expenses. Actual results could differ from these estimates. Certain prior year amounts have been reclassified to conform to the current presentation.
Cash and Cash Equivalents
Rockies Express considers all highly liquid investments purchased with an original maturity of three months or less to be cash equivalents.
Accounts Receivable and Allowance for Doubtful Accounts
Accounts receivable are carried at their estimated collectible amounts. Rockies Express makes periodic reviews and evaluations of the appropriateness of the allowance for doubtful accounts based on a statistical analysis of historical defaults, and adjustments are recorded as necessary for changes in circumstances and customer-specific information. When specific receivables are determined to be uncollectible, the reserve and receivable are relieved. Our allowance for doubtful accounts totaled
$2.0 million
and
$1.0 million
at December 31, 2016 and 2015, respectively.
168
Fuel Recovery Mechanism
Rockies Express obtains natural gas quantities from its shippers as reimbursement for fuel consumed at compressor stations and other locations on its system as well as for natural gas quantities lost and otherwise unaccounted for, in accordance with its tariff and applicable contract terms. Rockies Express tracks the volume and value of associated over- or under-collections of fuel and lost and unaccounted for quantities through a tracking mechanism referred to as "fuel tracker." Those amounts are recorded as an addition or reduction to a regulatory asset or liability balance representing the amounts to be recovered from or refunded to customers through the fuel tracker mechanisms. Fuel tracker volumes are valued using a weighted-average monthly index price.
Accounting for Regulatory Activities
Rockies Express' regulated activities are accounted for in accordance with the "Regulated Operations" Topic of the Financial Accounting Standards Board ("FASB") Accounting Standards Codification ("Codification"). This Topic prescribes the circumstances in which the application of GAAP is affected by the economic effects of regulation. Regulatory assets and liabilities represent probable future revenues or expenses to Rockies Express associated with certain charges and credits that will be recovered from or refunded to customers through the ratemaking process. Rockies Express recorded regulatory assets of approximately
$12.3 million
and
$0.3 million
at
December 31, 2016
and
2015
, respectively, and regulatory liabilities of approximately $10,000 and $0.5 million at
December 31, 2016
and
2015
, respectively. Regulatory assets and liabilities at
December 31, 2016
and
2015
were primarily attributable to the fuel tracker discussed in
"Fuel Recovery Mechanism"
above
.
For additional details see
Note 9
–
Regulatory Matters
.
Gas Imbalances
Gas imbalances receivable and payable reflect gas volumes owed between Rockies Express and its customers. Gas imbalances represent the difference between customer nominated versus actual gas receipts from and gas deliveries to interconnecting pipelines under various operational balancing agreements. Gas imbalances are settled in cash or made up in-kind subject to the terms of the various agreements and are valued at the average monthly index price.
Property, Plant and Equipment
Property, plant and equipment is stated at historical cost, which for constructed assets includes indirect costs such as payroll taxes, other employee benefits, allowance for funds used during construction and other costs directly related to the projects. Expenditures that increase capacities, improve efficiencies or extend useful lives are capitalized and depreciated over the remaining useful life of the asset or major asset component. We also capitalize certain costs directly related to the construction of assets, including internal labor costs, interest and engineering costs.
Routine maintenance, repairs and renewal costs are expensed as incurred. The cost of normal retirements of depreciable utility property, plant and equipment, plus the cost of removal less salvage value and any gain or loss recognized, is recorded in accumulated depreciation with no effect on current period earnings. Gains or losses are recognized upon retirement of property, plant and equipment constituting an operating unit or system, and land, when sold or abandoned and costs of removal or salvage are expensed when incurred.
Rockies Express maintains natural gas in its pipeline, known as "line pack," which serves to maintain the necessary pressure to allow efficient transmission of natural gas. Line pack is capitalized within "Property, plant and equipment, net" on the balance sheets and depreciated over the estimated useful life of the pipeline.
Impairment of Long-Lived Assets
Rockies Express reviews its long-lived assets for impairment whenever events or changes in circumstances indicate that the carrying amount of an asset may not be recoverable. An impairment loss results when the estimated undiscounted future net cash flows expected to result from the asset's use and its eventual disposition are less than its carrying amount. Rockies Express assesses its long-lived assets for impairment in accordance with the relevant Codification guidance. A long-lived asset is tested for impairment whenever events or changes in circumstances indicate its carrying amount may exceed its fair value.
Examples of long-lived asset impairment indicators include:
|
•
|
a significant decrease in the market value of a long-lived asset or group;
|
|
•
|
a significant adverse change in the extent or manner in which a long-lived asset or asset group is being used or in its physical condition;
|
|
•
|
a significant adverse change in legal factors or in the business climate could affect the value of a long-lived asset or asset group, including an adverse action or assessment by a regulator which would exclude allowable costs from the rate-making process;
|
169
|
•
|
an accumulation of costs significantly in excess of the amount originally expected for the acquisition or construction of the long-lived asset or asset group;
|
|
•
|
a current period operating cash flow loss combined with a history of operating cash flow losses or a projection or forecast that demonstrates continuing losses associated with the use of a long-lived asset or asset group; and
|
|
•
|
a current expectation that, more likely than not, a long-lived asset or asset group will be sold or otherwise disposed of significantly before the end of its previously estimated useful life.
|
When an impairment indicator is present, Rockies Express first assesses the recoverability of the long-lived assets by comparing the sum of the undiscounted future cash flows expected to result from the use and eventual disposition of the asset to the carrying amount of the asset. If the carrying amount is higher than the undiscounted future cash flows, the fair value of the asset is assessed using a discounted cash flow analysis to determine the amount of impairment, if any, to be recognized.
Depreciation and Amortization
Depreciation is computed based on the straight-line method over the estimated useful lives of property, plant and equipment. The annual composite rate of depreciation for the
years ended
December 31, 2016
,
2015
and
2014
was
2.86%
.
Allowance for Funds Used During Construction
Included in the cost of "Property, plant and equipment, net" on the accompanying balance sheets is an allowance for funds used during construction ("AFUDC"). AFUDC represents the estimated cost of debt, from borrowed funds, or the estimated cost of capital, from equity funds, during the construction period. During the
years ended
December 31, 2016
,
2015
, and
2014
, Rockies Express recognized AFUDC associated with the estimated cost of capital from equity funds of approximately
$24.8 million
,
$6.5 million
, and
$3.3 million
, respectively, recorded as "Other income, net" on the accompanying statements of income.
Revenue Recognition
Rockies Express provides various types of natural gas transportation services to its customers in which the natural gas remains the property of these customers at all times. In many cases (generally described as "firm service"), the customer pays a two-part rate that includes (i) a fixed-fee reserving the right to transport natural gas in Rockies Express' facilities and (ii) a per-unit rate for volumes actually transported. The fixed-fee component of the overall rate is recognized as revenue in the period the service is provided. The per-unit charge is recognized as revenue when the volumes are delivered to the customers' agreed upon delivery point. In other cases (generally described as "interruptible service"), there is no fixed-fee associated with the services because the customer accepts the possibility that service may be interrupted at the discretion of Rockies Express in order to serve customers who have purchased firm service. In the case of interruptible service, revenue is recognized in the same manner utilized for the per-unit rate for volumes transported under firm service agreements.
In addition to its "firm" and "interruptible" transportation services, Rockies Express also provides a natural gas park and loan service to assist customers in managing a short-term gas surplus or deficit and a pooling and wheeling service to assist customers in the aggregation of gas supply from physical point(s) within a specified hub to a central pooling point and the re-delivery of gas supply to physical points within the same hub. Revenues are recognized as services are provided, in accordance with the terms negotiated under these contracts.
Rockies Express recognizes revenue from natural gas sales when the natural gas is sold at a fixed or determinable price, delivery has occurred and title has transferred, and collectability of the revenue is reasonably assured.
Debt Issuance Costs
Debt issuance costs are amortized to interest expense over the life of the debt using the straight-line-method, which approximates the effective interest rate method. Debt issuance costs associated with long-term debt are classified with the corresponding debt on the accompanying balance sheets. Debt issuance costs associated with revolving credit facilities or lines of credit are classified as deferred charges and other assets on the accompanying balance sheets.
Deferred Charges and Deferred Credits
Rockies Express has
$4.5 million
remaining of an initial
$20.0 million
deferred charge and deferred credit relating to a customer contract. The deferred charge is being amortized using a straight-line-method over the life of the related contract. Amortization of the deferred charge for each of the
years ended
December 31, 2016
,
2015
, and
2014
was
$2.0 million
and is included within transportation services revenues in the accompanying statements of income. The deferred credit is payable over a period of
10
years.
170
Environmental Matters
Rockies Express expenses or capitalizes, as appropriate, environmental expenditures that relate to current operations. Rockies Express expenses amounts that relate to an existing condition caused by past operations that do not contribute to current or future revenue generation. Rockies Express does not discount environmental liabilities to a net present value, and records environmental liabilities when environmental assessments and/or remedial efforts are probable and costs can be reasonably estimated. Generally, recording of these accruals coincides with the completion of a feasibility study or a commitment to a formal plan of action.
Fair Value
Fair value, as defined in the fair value measurement accounting guidance, is the price that would be received to sell an asset or paid to transfer a liability in an orderly transaction between market participants at the measurement date, or exit price. The fair value measurement accounting guidance requires that Rockies Express make assumptions that market participants would use in pricing an asset or liability based on the best information available. These factors include nonperformance risk (the risk that an obligation will not be fulfilled) and credit risk of the reporting entity (for liabilities) and of the counterparty (for assets). The fair value measurement guidance prohibits the inclusion of transaction costs and any adjustments for blockage factors in determining the instruments' fair value. The principal or most advantageous market should be considered from the perspective of the reporting entity. The fair value of current financial assets and liabilities approximate their reported carrying amounts as of
December 31, 2016
and
2015
.
Income Taxes
Rockies Express is a limited liability company that has elected to be treated as a partnership for income tax purposes. Accordingly, no provision for federal or state income taxes has been recorded in the financial statements of Rockies Express and the tax effects of Rockies Express' activities accrue to its Members.
New Accounting Pronouncements
Revenue Recognition
In May 2014, the FASB issued Accounting Standards Update ("ASU") No. 2014-09, Revenue from Contracts with Customers (Topic 606). ASU 2014-09 provides a comprehensive and converged set of principles-based revenue recognition guidelines which supersede the existing industry and transaction-specific standards. The core principle of the new guidance is that an entity should recognize revenue to depict the transfer of promised goods or services to customers in an amount that reflects the consideration to which the entity expects to be entitled in exchange for those goods or services. To achieve this core principle, entities must apply a five-step process to (1) identify the contract with a customer; (2) identify the performance obligations in the contract; (3) determine the transaction price; (4) allocate the transaction price to the performance obligations in the contract; and (5) recognize revenue when (or as) the entity satisfies a performance obligation. ASU 2014-09 also mandates disclosure of sufficient information to enable users of financial statements to understand the nature, amount, timing and uncertainty of revenue and cash flows arising from contracts with customers. The disclosure requirements include qualitative and quantitative information about contracts with customers, significant judgments and changes in judgments, and assets recognized from the costs to obtain or fulfill a contract.
Throughout 2015 and 2016, the FASB has issued a series of subsequent updates to the revenue recognition guidance in Topic 606, including ASU No. 2015-14, Revenue from Contracts with Customers (Topic 606): Deferral of the Effective Date, ASU No. 2016-08, Revenue from Contracts with Customers (Topic 606): Principal versus Agent Considerations (Reporting Revenue Gross versus Net), ASU No. 2016-10, Revenue from Contracts with Customers (Topic 606): Identifying Performance Obligations and Licensing, ASU No. 2016-12, Revenue from Contracts with Customers (Topic 606): Narrow-Scope Improvements and Practical Expedients, and ASU No. 2016-20, Technical Corrections and Improvements to Topic 606, Revenue from Contracts with Customers.
The amendments in ASU 2014-09, ASU 2016-08, ASU 2016-10, ASU 2016-12, and ASU 2016-20 are effective for public entities for annual reporting periods beginning after December 15, 2017, and for interim periods within that reporting period. Early application is permitted for annual reporting periods beginning after December 15, 2016.
Rockies Express is currently evaluating the impact of our pending adoption of the revised guidance. The status of its implementation is as follows:
|
•
|
Rockies Express management has formed an implementation team that meets to discuss implementation challenges, technical interpretations, industry-specific treatment of certain revenue contract types, and project status.
|
|
•
|
Rockies Express management is currently reviewing contracts for each revenue stream identified. Through this process, management is determining and documenting expected changes in revenue recognition upon adoption of the revised guidance.
|
171
|
•
|
Rockies Express management plans to evaluate the potential information technology and internal control changes that will be required for adoption based on the findings from its contract review process.
|
|
•
|
Rockies Express management plans to provide internal training and awareness related to the revised guidance to the key stakeholders throughout its organization.
|
Rockies Express will continue to conduct its contract review process throughout 2017 and, as a result, areas of impact may be identified. Rockies Express is in the process of quantifying the impact of adoption but cannot reasonably estimate such amount at this time. Rockies Express expects to adopt the new standard on January 1, 2018 using the modified retrospective approach. This approach allows Rockies Express to apply the new standard to (i) all new contracts entered into after January 1, 2018 and (ii) all existing contracts for which all (or substantially all) of the revenue has not been recognized under legacy revenue guidance as of January 1, 2018 through a cumulative adjustment to members' equity. Consolidated revenues presented in the comparative financial statements for periods prior to January 1, 2018 would not be revised.
ASU No. 2016-02, "Leases (Topic 842)"
In February 2016, the FASB issued ASU No. 2016-02, Leases (Topic 842). ASU 2016-02 provides a comprehensive update to the lease accounting topic in the Codification intended to increase transparency and comparability among organizations by recognizing lease assets and lease liabilities on the balance sheet and disclosing key information about leasing arrangements. The amendments in ASU 2016-02 include a revised definition of a lease as well as certain scope exceptions. The changes primarily impact lessee accounting, while lessor accounting is largely unchanged from previous GAAP.
The amendments in ASU 2016-02 are effective for public entities for annual reporting periods beginning after December 15, 2018, and for interim periods within that reporting period. Early application is permitted. Rockies Express is currently evaluating the impact of ASU 2016-02.
3. Property, Plant and Equipment
Rockies Express' property, plant and equipment, net consisted of the following:
|
December 31,
|
|||||||
|
2016
|
2015
|
||||||
|
(in millions)
|
|||||||
|
Natural gas pipelines
|
$
|
7,085.8
|
|
$
|
7,062.6
|
|
|
|
General and other
|
9.9
|
|
9.2
|
|
|||
|
Construction work in progress
|
503.2
|
|
202.0
|
|
|||
|
Accumulated depreciation and amortization
|
(1,535.2
|
)
|
(1,332.8
|
)
|
|||
|
Total property, plant and equipment, net
|
$
|
6,063.7
|
|
$
|
5,941.0
|
|
|
Depreciation expense was approximately
$204.3 million
,
$199.4 million
and
$195.1 million
for the years ended
December 31, 2016
,
2015
and
2014
, respectively. Capitalized interest was
$9.3 million
,
$2.8 million
, and
$1.0 million
for the years ended
December 31, 2016
,
2015
and
2014
, respectively.
4. Financing
Debt
Total outstanding debt as of
December 31, 2016
and
2015
consisted of the following:
|
December 31,
|
|||||||
|
2016
|
2015
|
||||||
|
(in millions)
|
|||||||
|
6.85% senior notes due July 15, 2018
|
$
|
550.0
|
|
$
|
550.0
|
|
|
|
6.00% senior notes due January 15, 2019
|
525.0
|
|
525.0
|
|
|||
|
5.625% senior notes due April 15, 2020
|
750.0
|
|
750.0
|
|
|||
|
7.50% senior notes due July 15, 2038
|
250.0
|
|
250.0
|
|
|||
|
6.875% senior notes due April 15, 2040
|
500.0
|
|
500.0
|
|
|||
|
Less: Unamortized debt discount and debt issuance costs
|
(13.3
|
)
|
(17.1
|
)
|
|||
|
Total long-term debt
|
$
|
2,561.7
|
|
$
|
2,557.9
|
|
|
172
Rockies Express Senior Notes
The senior notes issued by Rockies Express are redeemable in whole or in part, at Rockies Express' option at any time, at redemption prices defined in the associated indenture agreements.
All payments of principal and interest with respect to the fixed rate senior notes are the sole obligation of Rockies Express. Note holders have no recourse against Rockies Express' Members or their respective officers, directors, employees, shareholders, members, managers, unit holders or affiliates for any failure by Rockies Express to perform or comply with its obligations pursuant to the notes or the indenture. As of
December 31, 2016
, we were in compliance with the covenants required under the senior notes.
Maturities of Debt
The scheduled maturities of Rockies Express' outstanding debt balances as of
December 31, 2016
are summarized as follows (in millions):
|
Year
|
Scheduled Maturities
|
|||
|
2017
|
$
|
—
|
|
|
|
2018
|
550.0
|
|
||
|
2019
|
525.0
|
|
||
|
2020
|
750.0
|
|
||
|
2021
|
—
|
|
||
|
Thereafter
|
750.0
|
|
||
|
Total scheduled maturities
|
2,575.0
|
|
||
|
Unamortized debt discount and debt issuance costs
|
(13.3
|
)
|
||
|
Total debt
|
$
|
2,561.7
|
|
|
Rockies Express Revolving Credit Facility
On October 1, 2015, Rockies Express entered into a
$150 million
senior unsecured revolving credit facility ("the revolving credit facility") with Wells Fargo Bank, N.A., as administrative agent, and a syndicate of lenders, which will mature on January 31, 2020. The revolving credit facility includes a
$75 million
sublimit for letters of credit and a
$20 million
sublimit for swing line loans and may be used for working capital and general company purposes. The revolving credit facility also contains an accordion feature whereby Rockies Express can increase the size of the credit facility to an aggregate of
$200 million
, subject to receiving increased or new commitments from lenders and the satisfaction of certain other conditions precedent. As of
December 31, 2016
, there were no outstanding borrowings or letters of credit issued under the revolving credit facility.
Borrowings under the credit facility bear interest, at Rockies Express' option, at either (a) a base rate, which will be a rate equal to the greatest of (i) the prime rate, (ii) the U.S. federal funds rate plus
0.5%
and (iii) a one-month reserve adjusted Eurodollar rate plus
1.00%
or (b) a reserve adjusted Eurodollar rate, plus, in each case, an applicable margin. For borrowings bearing interest based on the base rate, the applicable margin is initially
1.00%
, and for loans bearing interest based on the reserve adjusted Eurodollar rate, the applicable margin is initially
2.00%
. After the first full fiscal quarter, the applicable margin will range from
0.50%
to
1.25%
for base rate borrowings and
1.50%
to
2.25%
for reserve adjusted Eurodollar rate borrowings, based upon Rockies Express' total leverage ratio. The unused portion of the credit facility is subject to a commitment fee, which ranges from
0.20%
to
0.45%
based upon Rockies Express' total leverage ratio.
Rockies Express has the option to have the applicable margin determined based on Rockies Express' credit ratings should Rockies Express receive an investment grade credit rating from one or more of the ratings agencies in the future. If Rockies Express were to make an election to exercise this option, the applicable margin would range from
0.125%
to
1.00%
for base rate borrowings and
1.125%
to
2.00%
for reserve adjusted Eurodollar borrowings, based on Rockies Express' credit ratings. Under such an election, the commitment fee would range from
0.125%
to
0.40%
, also based on Rockies Express' credit ratings.
The revolving credit facility generally requires Rockies Express to comply with various affirmative and negative covenants, including a limit on the leverage ratio (as defined in the credit agreement) of Rockies Express and restrictions on:
|
•
|
incurring secured indebtedness;
|
|
•
|
entering into mergers, consolidations and sales of assets;
|
|
•
|
granting liens;
|
173
|
•
|
entering into transactions with affiliates; and
|
|
•
|
making restricted payments.
|
As of
December 31, 2016
, we were in compliance with the covenants required under the revolving credit facility.
Repayment of
3.90%
Senior Notes
The board of directors of Rockies Express approved repayment of the
$450 million
3.90%
senior notes due April 15, 2015 ("2015 Notes") which was financed through capital contributions by the Members of Rockies Express in proportion to their respective ownership interests. The capital contribution was made by each Member of Rockies Express in accordance with Section 4.3.1 of Rockies Express' Second Amended and Restated Limited Liability Company Agreement, as amended, and was used to repay the 2015 Notes on April 15, 2015.
Fair Value
The following table sets forth the carrying amount and fair value of our long-term debt, which is not measured at fair value in the accompanying balance sheets as of
December 31, 2016
and
2015
, but for which fair value is disclosed:
|
|
Fair Value
|
|
|||||||||||||||||
|
|
Quoted prices in active markets for identical assets
(Level 1) |
Significant other observable inputs
(Level 2) |
Significant unobservable inputs
(Level 3) |
Total
|
Carrying
Amount |
||||||||||||||
|
|
(in millions)
|
|
|||||||||||||||||
|
December 31, 2016
|
$
|
—
|
|
$
|
2,684.9
|
|
$
|
—
|
|
$
|
2,684.9
|
|
$
|
2,561.7
|
|
||||
|
December 31, 2015
|
$
|
—
|
|
$
|
2,412.6
|
|
$
|
—
|
|
$
|
2,412.6
|
|
$
|
2,557.9
|
|
||||
The long-term debt is carried at amortized cost, net of debt issuance costs. The estimated fair value of Rockies Express' outstanding private placement debt is based upon quoted market prices adjusted for illiquid markets. We are not aware of any factors that would significantly affect the estimated fair value subsequent to
December 31, 2016
.
5. Members' Equity
During the
years ended
December 31, 2016
,
2015
, and
2014
, Rockies Express made distributions to Members of
$471.6 million
,
$499.0 million
, and
$361.7 million
, respectively.
During the
years ended
December 31, 2016
,
2015
, and
2014
, Rockies Express received contributions from Members of
$304.9 million
,
$733.1 million
, and
$165.7 million
, respectively. Contributions from Members during the year ended
December 31, 2016
were primarily used to fund the construction and other costs of the Zone 3 Capacity Enhancement project, as discussed in
Note 9
–
Regulatory Matters
. Contributions from Members during the year ended December 31, 2015 were used to repay the 2015 Notes, as discussed in
Note 4
–
Financing
, fund the construction and other costs of the Zone 3 East-to-West Project facilities and the Zone 3 Capacity Enhancement project and remaining costs associated with the Seneca Lateral Project facilities, and to increase cash on hand for working capital needs. Contributions from Members during the year ended December 31, 2014 were used to fund the construction and other costs of the Seneca Lateral Project facilities as well as to increase cash on hand for working capital needs.
Additional contributions and distributions were made subsequent to
December 31, 2016
. For details see
Note 11
–
Subsequent Events
.
6. Related Party Transactions
Rockies Express has an operating agreement with Tallgrass NatGas Operator, LLC ("NatGas"), a subsidiary of TD, under which NatGas provides and bills Rockies Express for various services at cost including employee labor costs, information technology services, employee health and retirement benefits, and insurance for property and casualty risks. In addition, NatGas receives a management oversight fee in the amount of
1%
of Rockies Express' earnings before interest, taxes, depreciation, and amortization. Effective January 1, 2017, NatGas was acquired by TEP. Rockies Express' practice is to settle receivable and payable balances that exist with affiliates in the following month.
174
Totals of significant transactions with affiliated companies are as follows:
|
Years Ended December 31,
|
|||||||||||
|
2016
|
2015
|
2014
|
|||||||||
|
(in millions)
|
|||||||||||
|
Revenues: Transportation services
(1)
|
$
|
14.4
|
|
$
|
10.8
|
|
$
|
13.5
|
|
||
|
Charges from TD:
|
|||||||||||
|
Compensation, benefits and other charges
|
$
|
20.6
|
|
$
|
18.5
|
|
$
|
17.1
|
|
||
|
General and administrative charges from affiliate
|
$
|
9.4
|
|
$
|
8.6
|
|
$
|
5.9
|
|
||
|
Oversight Fees:
|
|||||||||||
|
Tallgrass NatGas Operator, LLC
|
$
|
6.2
|
|
$
|
6.3
|
|
$
|
5.7
|
|
||
|
(1)
|
Transportation services revenue for the
years ended
December 31, 2016
,
2015
, and
2014
is primarily from Sempra Energy prior to the May 6, 2016 sale of Sempra Energy's ownership to TEP REX Holdings, LLC as described in
Note 1
–
Description of Business
.
|
Balances with affiliated companies included in the accompanying balance sheets are as follows:
|
December 31,
|
|||||||
|
2016
|
2015
|
||||||
|
(in millions)
|
|||||||
|
Receivables from affiliated companies:
|
|||||||
|
Sempra Energy
|
$
|
—
|
|
$
|
1.2
|
|
|
|
Total receivables from affiliated companies
|
$
|
—
|
|
$
|
1.2
|
|
|
|
Payables to affiliated companies:
|
|||||||
|
TD
|
$
|
4.5
|
|
2.8
|
|
||
|
TEP
|
0.6
|
|
—
|
|
|||
|
Total payables to affiliated companies
|
$
|
5.1
|
|
$
|
2.8
|
|
|
Gas imbalances with affiliated shippers are as follows:
|
December 31,
|
|||||||
|
2016
|
2015
|
||||||
|
|
(in millions)
|
||||||
|
Affiliate gas balance receivables
|
$
|
—
|
|
$
|
0.2
|
|
|
|
Affiliate gas balance payables
|
$
|
0.2
|
|
$
|
0.1
|
|
|
175
7. Commitments and Contingent Liabilities
Leases
Total rental expense under operating leases was
$29.2 million
,
$29.2 million
, and
$29.3 million
for the
years ended
December 31, 2016
,
2015
, and
2014
, respectively. Future minimum commitments related to these leases as of
December 31, 2016
are as follows (in millions):
|
Year
|
Future Minimum Lease Payments
|
|||
|
2017
|
$
|
29.2
|
|
|
|
2018
|
29.2
|
|
||
|
2019
|
29.2
|
|
||
|
2020
|
29.2
|
|
||
|
2021
|
29.2
|
|
||
|
Thereafter
|
174.9
|
|
||
|
Total
|
$
|
320.9
|
|
|
The future minimum rental commitments are primarily attributable to a
20
-year capacity lease agreement with Overthrust Pipeline Company ("Overthrust") which commenced on January 1, 2008. The capacity lease provides the right to transport on a firm basis
625
MMcf/d of natural gas through Overthrust's system from either the Williams Field Services Opal Processing Plant or the TEPPCO Pioneer Processing Plant to the Wamsutter interconnect.
Capital Expenditures
Approximately
$54.5 million
of Rockies Express' capital expenditure budget for
2017
had been committed for purchases of property, plant and equipment at
December 31, 2016
.
8. Major Customers
During
2016
, four non-affiliated shippers accounted for
$164.8 million
(
23%
),
$82.9 million
(
12%
),
$71.4 million
(
10%
), and
$70.4 million
(
10%
), respectively of Rockies Express' total revenues. During
2015
, three non-affiliated shippers accounted for
$187.6 million
(
24%
),
$163.0 million
(
21%
), and
$104.6 million
(
13%
), respectively of Rockies Express' total revenues. During
2014
, four non-affiliated shippers accounted for
$186.5 million
(
25%
),
$165.2 million
(
22%
),
$110.2 million
(
15%
), and
$101.4 million
(
14%
), respectively of Rockies Express' total revenues. We attempt to mitigate credit risk by seeking collateral or financial guarantees and letters of credit from customers
9. Regulatory Matters
There are currently no proceedings challenging the currently effective transportation rates of Rockies Express. Regulators, as well as shippers on Rockies Express, do have rights, under circumstances prescribed by applicable law, to challenge the rates Rockies Express charges. Rockies Express can provide no assurance that current rates will remain unchallenged. Any successful challenge could have a material, adverse effect on Rockies Express' future earnings.
Petition for Declaratory Order – FERC Docket No. RP13-969-000
In June 2013, in Docket No. RP13-969-000, Rockies Express filed with the FERC a Petition for Declaratory Order which sought a ruling that the "most favored nations" or "MFN" provisions contained in Rockies Express' negotiated rate agreements ("NRAs") with its Foundation and Anchor Shippers would not prevent Rockies Express from providing firm transportation service at rates lower than Foundation and Anchor Shippers' rates that (1) have an east-to-west primary path; (2) are for a term of one year or longer; and (3) are limited to service in one rate zone and therefore do not utilize all of the same facilities or rate zones as the service provided pursuant to the Foundation and Anchor Shipper NRAs.
In September 2014, the FERC accepted amended contracts with three shippers holding MFN rights on Rockies Express, which reflect the terms of settlements between these shippers and Rockies Express. The settlements provide additional clarity with respect to the applicability of the settling shippers' MFN rights, sharing by Rockies Express of certain transportation revenues, and the withdrawal of the settling shippers from the Petition for Declaratory Order proceeding. Prior to December 2015, only one shipper with current MFN rights was still a party to the proceeding.
176
2015 Annual FERC Fuel Tracking Filings - Docket No. RP15-584-000
On February 27, 2015, Rockies Express made its annual fuel tracker filing with a proposed effective date of April 1, 2015 in Docket No. RP15-584-000. This filing incorporated the revised fuel and lost and unaccounted-for and power cost tracker mechanisms filed in Docket No. RP14-1003. The FERC issued an order accepting the filing on March 26, 2015 and on April 9, 2015, accepted an errata to the February 27, 2015 filing reflecting a corrected rate for the Cheyenne Booster rate (PCT Reimbursement Charge).
Seneca Lateral Facilities Conversion – FERC Docket No. CP15-102-000
On March 2, 2015 in Docket No. CP15-102-000, Rockies Express filed with the FERC an application for (1) authorization to convert certain existing and operating pipeline and compression facilities located in Noble and Monroe Counties, Ohio (Seneca Lateral Facilities described in Docket Nos. CP13-539-000 and CP14-194-000) from Natural Gas Policy Act of 1978 Section 311 authority to NGA Section 7 jurisdiction, and (2) issuance of a certificate of public convenience and necessity authorizing Rockies Express to operate and maintain the Seneca Lateral Facilities. On April 7, 2016, the FERC issued a Certificate to Rockies Express granting its requested authorizations. As directed by the FERC, Rockies Express filed revised rates for NGA service on the Seneca Lateral, and the Seneca Lateral commenced NGA service on June 1, 2016.
Rockies Express Zone 3 Capacity Enhancement Project – FERC Docket No. CP15-137-000
On March 31, 2015 in Docket No. CP15-137-000, Rockies Express filed with the FERC an application for authorization to construct and operate (1) three new mainline compressor stations located in Pickaway and Fayette Counties, Ohio and Decatur County, Indiana; (2) additional compressors at an existing compressor station in Muskingum County, Ohio; and (3) certain ancillary facilities. The proposed facilities will increase the Rockies Express Zone 3 east-to-west mainline capacity by
0.8
Bcf/d. Pursuant to the FERC's obligations under the National Environmental Policy Act, FERC staff issued an Environmental Assessment for the project on August 31, 2015. On February 25, 2016, the FERC issued a Certificate of Public Convenience and Necessity authorizing Rockies Express to proceed with the project. On March 14, 2016, Rockies Express commenced construction of the project facilities. The project was placed in-service for the
0.8
Bcf/d on January 6, 2017.
2016 Annual and Interim FERC Fuel Tracking Filings - Docket Nos. RP16-702 and RP17-240
On March 1, 2016, Rockies Express made its annual fuel tracker filing with a proposed effective date of April 1, 2016 in Docket No. RP16-702. The FERC issued an order accepting the filing on March 25, 2016. On December 1, 2016, Rockies Express made an interim fuel tracker filing with a proposed effective date of January 1, 2017 in Docket No. RP17-240. The FERC issued an order accepting the filing on December 29, 2016. The filing reflected a corrected rate for a previous inadvertent error made in the allocation of Overthrust, Echo Springs, and Wamsutter fuel between non-expansion and expansion volumes during the period from July 2014 through July 2016.
Electric Power Charge Clarification - Docket No. RP17-285
On December 21, 2016, in Docket No. RP17-285, Rockies Express proposed certain revisions to the General Terms and Conditions of its tariff to clarify that the electric power costs associated with the operation of gas coolers installed in association with the Zone 3 Capacity Enhancement Project (i.e. at both electric and gas powered stations), will be included in the Power Cost Tracker. Several shippers submitted comments on the proposal. The FERC issued an order on January 19, 2017 accepting the proposed revisions permitting the recovery of electric power costs from the operation of both gas and electric powered compressor stations, subject to certain clarifications.
10. Legal and Environmental Matters
Legal
In addition to the matters discussed below, Rockies Express is a defendant in various lawsuits arising from the day-to-day operations of its business. Although no assurance can be given, Rockies Express believes, based on its experiences to date, that the ultimate resolution of such routine items will not have a material adverse impact on its business, financial position, results of operations or cash flows.
Rockies Express has evaluated claims in accordance with the accounting guidance for contingencies that it deems both probable and reasonably estimable and, accordingly, have recorded no reserve for legal claims as of
December 31, 2016
and
2015
.
177
Mineral Management Service Lawsuit
On June 30, 2009, Rockies Express filed claims against Mineral Management Service, a former unit of the U.S. Department of Interior (collectively "Interior") for breach of its contractual obligation to sign transportation service agreements for pipeline capacity that it had agreed to take on Rockies Express. The Civilian Board of Contract Appeals ("CBCA") conducted a trial and ruled that Interior was liable for breach of contract, but limited the damages Interior was required to pay. On September 13, 2013, the United States Court of Appeals for the Federal Circuit issued a decision affirming that Interior was liable for its breach of contract, but reversing the CBCA's decision to limit damages. The case was remanded to the CBCA for the purpose of calculating damages at a hearing. On May 20, 2016, Rockies Express and Interior agreed to resolve the claims in this matter in exchange for a
$65 million
cash payment to Rockies Express. Interior paid the amount due Rockies Express on June 23, 2016, at which time Rockies Express recognized a gain on the litigation settlement.
Ultra Resources
In early 2016, Ultra Resources, Inc. ("Ultra") defaulted on its firm transportation service agreement for approximately
0.2
Bcf/d through November 11, 2019. In late March 2016, Rockies Express terminated Ultra's service agreement. On April 14, 2016, Rockies Express filed a lawsuit against Ultra for breach of contract and damages in Harris County, Texas, seeking approximately
$303 million
in damages and other relief. On April 29, 2016, Ultra and certain of its debtor affiliates filed for protection under Chapter 11 of the United States Bankruptcy Code in United States Bankruptcy Court for the Southern District of Texas, which operated as a stay of the Harris County state court proceeding.
On January 12, 2017, Rockies Express and Ultra entered into an agreement to settle Rockies Express' approximately
$303 million
claim against Ultra's bankruptcy estate. The settlement agreement includes Ultra's agreement to: (i) make a cash payment to Rockies Express of
$150 million
in accordance with the plan of reorganization, but no later than October 30, 2017; and (ii) enter a new, seven-year firm transportation agreement with Rockies Express commencing December 1, 2019, for west-to-east service of
0.2
Bcf/d at a rate of approximately
$0.37
, or approximately
$26.8 million
annually. The settlement is part of Ultra's Chapter 11 reorganization plan, which must be submitted to the U.S. Bankruptcy Court for approval.
Michels Corporation
On June 17, 2014, Michels Corporation ("Michels") filed a complaint and request for relief against Rockies Express in the Court of Common Pleas, Monroe County, Ohio, as a result of work performed by Michels to construct the Seneca Lateral Pipeline in Ohio. Michels sought unspecified damages from Rockies Express and asserted claims of breach of contract, negligent misrepresentation, unjust enrichment and quantum meruit. Michels also filed notices of Mechanic's Liens in Monroe and Noble Counties, asserting
$24.2 million
as the amount due.
On February 2, 2017, Rockies Express and Michels entered into a binding settlement agreement to resolve the claims brought by Michels in exchange for a
$10 million
cash payment by Rockies Express. The cash payment will be paid promptly after entering into the definitive agreement with respect to the settlement.
Environmental, Health and Safety
Rockies Express is subject to a variety of federal, state and local laws that regulate permitted activities relating to air and water quality, waste disposal, and other environmental matters. Rockies Express believes that compliance with these laws will not have a material adverse impact on its business, cash flows, financial position or results of operations. However, there can be no assurances that future events, such as changes in existing laws, the promulgation of new laws, or the development of new facts or conditions will not cause Rockies Express to incur significant costs.
11. Subsequent Events
Subsequent events, which are events or transactions that occurred after
December 31, 2016
through the issuance of the accompanying financial statements, have been evaluated through
February 15, 2017
.
Members' Equity
Rockies Express paid distributions of
$43.8 million
to its Members and received contributions from Members of
$11.8 million
in January 2017.
178
(2) Financial Statement Schedules
All schedules are omitted because they are either not applicable or the required information is shown in the Consolidated Financial Statements or notes thereto included in Item 8 of this Form 10-K.
(3) Exhibits
|
Exhibit No.
|
Description
|
|
|
3.1
|
Certificate of Limited Partnership of Tallgrass Energy GP, LP, dated February 10, 2015 (incorporated by reference to Exhibit 3.1 to Tallgrass Energy GP, LP's Registration Statement on Form S-1 filed February 24, 2015).
|
|
|
3.2
|
Amended and Restated Limited Partnership Agreement of Tallgrass Energy GP, LP, dated May 12, 2015 (incorporated by reference to Exhibit 3.1 to Tallgrass Energy GP, LP's Current Report on Form 8-K filed May 12, 2015).
|
|
|
3.3
|
Certificate of Formation of TEGP Management, LLC, dated February 10, 2015 (incorporated by reference to Exhibit 3.3 to Tallgrass Energy GP, LP's Registration Statement on Form S-1 filed February 24, 2015).
|
|
|
3.4
|
Amended and Restated Limited Liability Company Agreement of TEGP Management, LLC, dated May 12, 2015 (incorporated by reference to Exhibit 3.2 to Tallgrass Energy GP, LP's Current Report on Form 8-K filed May 12, 2015).
|
|
|
3.5
|
Certificate of Formation of Tallgrass GP Holdings, LLC, dated March 28, 2013 (now known as Tallgrass Equity, LLC) (incorporated by reference to Exhibit 3.5 to Tallgrass Energy GP, LP's Registration Statement on Form S-1 filed February 24, 2015).
|
|
|
3.6
|
Certificate of Amendment to Certificate of Formation of Tallgrass GP Holdings, LLC, dated February 20, 2015 (now known as Tallgrass Equity, LLC) (incorporated by reference to Exhibit 3.6 to Tallgrass Energy GP, LP's Registration Statement on Form S-1 filed February 24, 2015).
|
|
|
3.7
|
Second Amended and Restated Limited Liability Company Agreement of Tallgrass Equity, LLC, dated May 12, 2015 (incorporated by reference to Exhibit 3.7 to Tallgrass Energy GP, LP's Quarterly Report on Form 10-Q filed on June 18, 2015).
|
|
|
3.8
|
Certificate of Limited Partnership of Tallgrass Energy Partners, LP, dated as of February 6, 2013 (incorporated by reference to Exhibit 3.1 to Tallgrass Energy Partners, LP's Registration Statement on Form S-1 (File No. 333-187595) filed March 28, 2013).
|
|
|
3.9
|
Certificate of Amendment to Certificate of Limited Partnership of Tallgrass Energy Partners, LP, dated as of February 7, 2013 (incorporated by reference to Exhibit 3.2 to Tallgrass Energy Partners, LP's Registration Statement on Form S-1 (File No. 333-187595) filed March 28, 2013).
|
|
|
3.10
|
Amended and Restated Agreement of Limited Partnership of Tallgrass Energy Partners, LP, dated as of May 17, 2013 (incorporated by reference to Exhibit 3.2 to Tallgrass Energy Partners, LP's Current Report on Form 8-K filed May 17, 2013).
|
|
|
3.11
|
Certificate of Formation of Tallgrass MLP GP, LLC, dated as of February 6, 2013 (incorporated by reference to Exhibit 3.4 to Tallgrass Energy Partners, LP's Registration Statement on Form S-1 (File No. 333-187595) filed March 28, 2013).
|
|
|
3.12
|
Second Amended and Restated Limited Liability Company Agreement of Tallgrass MLP GP, LLC dated May 17, 2013 (incorporated by reference to Exhibit 3.4 to Tallgrass Energy Partners, LP's Current Report on Form 8-K filed May 17, 2013).
|
|
|
3.13
|
Amendment No. 1, dated February 19, 2015, to Second Amended and Restated Limited Liability Company Agreement of Tallgrass MLP GP, LLC, dated May 17, 2013 (incorporated by reference to Exhibit 3.8 to Tallgrass Energy Partners, LP's Annual Report on Form 10-K/A filed on June 6, 2015).
|
|
|
3.14
|
Third Amended and Restated Limited Liability Company Agreement of Tallgrass Pony Express Pipeline, LLC, dated as of March 1, 2015, by and among Tallgrass Pony Express Pipeline, LLC, Tallgrass Operations, LLC, and Tallgrass PXP Holdings, LLC (incorporated by reference to Exhibit 10.2 to Tallgrass Energy Partners, LP's Current Report on Form 8-K filed on March 2, 2015).
|
|
|
4.1
|
Specimen certificate representing Class A Shares (incorporated by reference to Exhibit 4.1 to Tallgrass Energy GP, LP's Registration Statement on Form S-1/A filed April 20, 2015).
|
|
|
4.2
|
Registration Rights Agreement, dated May 12, 2015, by and among Tallgrass Energy GP, LP and each of the Initial Holders listed on an annex thereto (incorporated by reference to Exhibit 4.2 to Tallgrass Energy GP, LP's Quarterly Report on Form 10-Q filed on June 18, 2015).
|
|
179
|
4.3
|
Indenture, dated September 1, 2016, among Tallgrass Energy Partners, LP, Tallgrass Energy Finance Corp., the Guarantors named therein and U.S. Bank National Association, as trustee. (incorporated by reference to Exhibit 4.1 to Tallgrass Energy Partners, LP's Current Report on Form 8-K filed on September 1, 2016).
|
|
|
4.4
|
Form of 5.50% Senior Note (included as Exhibit A in Exhibit 4.1 which is incorporated by reference to Exhibit 4.1 to Tallgrass Energy Partners, LP's Current Report on Form 8-K filed on September 1, 2016).
|
|
|
10.1
|
Omnibus Agreement, dated May 12, 2015, by and among Tallgrass Energy Holdings, LLC, Tallgrass Energy GP, LP, TEGP Management, LLC and Tallgrass Equity, LLC (incorporated by reference to Exhibit 10.1 to Tallgrass Energy GP, LP's Current Report on Form 8-K filed May 12, 2015).
|
|
|
10.2
|
Tallgrass Equity Credit Agreement, dated May 12, 2015, by and among Tallgrass Equity, LLC, Barclays Bank PLC, as administrative agent, and a syndicate of lenders named therein (incorporated by reference to Exhibit 10.2 to Tallgrass Energy GP, LP's Current Report on Form 8-K filed May 12, 2015).
|
|
|
10.3†
|
TEGP Management, LLC Long-Term Incentive Plan (incorporated by reference to Exhibit 10.5 to Tallgrass Energy GP, LP's Current Report on Form 8-K filed May 12, 2015).
|
|
|
10.4†
|
Form of Employee Equity Participation Share Agreement (incorporated by reference to Exhibit 4.5 to the Partnership's Registration Statement on Form S-8 filed on July 17, 2015).
|
|
|
10.5
|
Distribution, Assignment and Assumption Agreement (interest in Tallgrass Energy GP, LP), dated May 11, 2015, by and among Tallgrass Holdings, LLC and the Assignees listed therein (incorporated by reference to Exhibit 10.3 to Tallgrass Energy GP, LP's Current Report on Form 8-K filed May 12, 2015).
|
|
|
10.6
|
Tallgrass Equity Unit Issuance Agreement, dated May 12, 2015, by and among Tallgrass Equity, LLC and Tallgrass Energy GP, LP (incorporated by reference to Exhibit 10.4 to Tallgrass Energy GP, LP's Current Report on Form 8-K filed May 12, 2015).
|
|
|
10.7
|
Conveyance Agreement (Common Units of Tallgrass Energy Partners, LP), dated May 12, 2015, by and among Tallgrass Operations, LLC and Tallgrass Equity, LLC (incorporated by reference to Exhibit 10.6 to Tallgrass Energy GP, LP's Current Report on Form 8-K filed May 12, 2015).
|
|
|
10.8†
|
Second Amended and Restated Employment Agreement, dated November 2, 2016, by and among Tallgrass Management, LLC, Tallgrass Energy Holdings, LLC, Tallgrass Equity, LLC, Tallgrass MLP GP, LLC, TEGP Management, LLC and David G. Dehaemers, Jr. (incorporated by reference to Exhibit 10.4 to Tallgrass Energy Partners, LP's Annual Report on Form 10-K filed February 15, 2017).
|
|
|
10.9
|
Omnibus Agreement, dated May 17, 2013, by and among Tallgrass Development, LP, Tallgrass Energy Partners, LP, Tallgrass MLP GP, LLC and Tallgrass Development GP, LLC (incorporated by reference to Exhibit 10.2 to Tallgrass Energy Partners, LP's Current Report on Form 8-K filed May 17, 2013).
|
|
|
10.10
|
Revolving Credit Agreement, dated May 17, 2013, by and among Tallgrass Energy Partners, LP, Barclays Bank PLC, as administrative agent, and a syndicate of lenders named therein (incorporated by reference to Exhibit 10.3 to Tallgrass Energy Partners, LP's Current Report on Form 8-K filed May 17, 2013).
|
|
|
10.11
|
Amendment No. 1, dated June 25, 2014, to the Revolving Credit Agreement, dated May 17, 2013, by and among Tallgrass Energy Partners, LP, Barclays Bank PLC, as administrative agent, and a syndicate of lenders named therein (incorporated by reference to Exhibit 10.1 to Tallgrass Energy Partners, LP's Current Report on Form 8-K filed on June 30, 2014).
|
|
|
10.12
|
Amendment No. 2 to Credit Agreement, dated as of November 24, 2015, by and among Tallgrass Energy Partners, LP, Barclays Bank PLC, as administrative agent, and a syndicate of lenders named therein (incorporated by reference to Exhibit 10.1 to Tallgrass Energy Partners, LP's Current Report on Form 8-K filed on November 30, 2015).
|
|
|
10.13
|
Amendment No. 3 to Credit Agreement, dated January 11, 2016, by and among Tallgrass Energy Partners, LP, Barclays Bank PLC, as administrative agent, and a syndicate of lenders named therein (incorporated by reference to Exhibit 10.10 to Tallgrass Energy Partners, LP's Annual Report on Form 10-K filed on February 17, 2016).
|
|
|
10.14
|
Amendment No. 4 to Credit Agreement, dated as of April 27, 2016, by and among Tallgrass Energy Partners, LP, Barclays Bank PLC, as administrative agent, and a syndicate of lenders named therein (incorporated by reference to Exhibit 10.1 to Tallgrass Energy Partners, LP's Current Report on Form 8-K filed on April 28, 2016).
|
|
|
10.15†
|
Tallgrass MLP GP, LLC Long-Term Incentive Plan (incorporated by reference to Exhibit 10.4 to Tallgrass Energy Partners, LP's Current Report on Form 8-K filed on May 17, 2013).
|
|
|
10.16†
|
Form of Employee Equity Participation Unit Agreement (incorporated by reference to Exhibit 4.5 to Tallgrass Energy Partners, LP's Registration Statement on Form S-8 filed on June 28, 2013).
|
|
180
|
10.17
|
Purchase and Sale Agreement, dated as of March 1, 2015, by and among Tallgrass Energy Partners, LP, Tallgrass Development, LP and Tallgrass Operations, LLC (incorporated by reference to Exhibit 10.1 to Tallgrass Energy Partners, LP's Current Report on Form 8-K filed on March 2, 2015).
|
|
|
10.18
|
Contribution and Transfer Agreement, dated January 1, 2016, by and among Tallgrass Energy Partners, LP, Tallgrass Operations, LLC, and for certain limited purposes, Tallgrass Development, LP (incorporated by reference to Exhibit 10.14 to Tallgrass Energy Partners, LP's Annual Report on Form 10-K filed on February 17, 2016).
|
|
|
10.19
|
Transfer, Purchase and Sale Agreement, dated as of December 16, 2015, by and between Whiting Oil and Gas Corporation, BNN Western, LLC and BNN Redtail, LLC (incorporated by reference to Exhibit 10.1 to Tallgrass Energy Partners, LP's Current Report on Form 8-K filed on December 16, 2015).
|
|
|
10.20
|
Membership Interest Purchase Agreement, dated as of March 29, 2016, by and between Sempra REX Holdings, LLC and TEP REX Holdings, LLC (as successor by assignment to Rockies Express Holdings, LLC) (incorporated by reference to Exhibit 10.2 to the Partnership's Quarterly Report on Form 10-Q filed on August 3, 2016).
|
|
|
10.21
|
Assignment and Assumption Agreement, dated as of May 6, 2016, by and among Rockies Express Holdings, LLC, TEP REX Holdings, LLC and, for the limited purposes set forth therein, Tallgrass Development, LP (incorporated by reference to Exhibit 10.3 to the Partnership's Quarterly Report on Form 10-Q filed on August 3, 2016).
|
|
|
10.22
|
Second Amended and Restated Limited Liability Company Agreement of Rockies Express Pipeline LLC, dated effective as of January 1, 2010, among Rockies Express Holdings, LLC (as successor by assignment to Kinder Morgan W2E Pipeline LLC), TEP REX Holdings, LLC (as successor by assignment to Sempra REX Holdings, LLC and P&S Project I, LLC), and P66REX LLC (f/k/a COPREX LLC) (incorporated by reference to Exhibit 10.4 to the Partnership's Quarterly Report on Form 10-Q filed on August 3, 2016).
|
|
|
10.23
|
Amendment No. 1 to Second Amended and Restated Limited Liability Company Agreement of Rockies Express Pipeline LLC, dated effective as of November 13, 2012, among Kinder Morgan W2E Pipeline LLC, TEP REX Holdings, LLC (as successor by assignment to Sempra REX Holdings, LLC and P&S Project I, LLC), Rockies Express Holdings, LLC and P66REX LLC (f/k/a COPREX LLC) (incorporated by reference to Exhibit 10.5 to the Partnership's Quarterly Report on Form 10-Q filed on August 3, 2016).
|
|
|
10.24
|
Amendment No. 2 to Second Amended and Restated Limited Liability Company Agreement, dated effective as of May 5, 2016, among Sempra REX Holdings, LLC and P&S Project I, LLC, Rockies Express Holdings, LLC and P66REX LLC (incorporated by reference to Exhibit 10.6 to the Partnership's Quarterly Report on Form 10-Q filed on August 3, 2016).
|
|
|
10.25
|
Purchase and Sale Agreement, dated as of January 1, 2017, by and among Tallgrass Energy Partners, LP, Tallgrass Development, LP and Tallgrass Operations, LLC (incorporated by reference to Exhibit 10.1 to the Partnership's Current Report on Form 8-K filed on January 3, 2017).
|
|
|
21.1*
|
List of Subsidiaries of Tallgrass Energy GP, LP.
|
|
|
23.1*
|
Consent of PricewaterhouseCoopers LLP on Consolidated Financial Statements of Tallgrass Energy GP, LP and the effectiveness of Tallgrass Energy GP, LP's internal control over financial reporting.
|
|
|
23.2*
|
Consent of PricewaterhouseCoopers LLP on Financial Statements of Rockies Express Pipeline LLC.
|
|
|
31.1*
|
Rule 13a-14(a)/15d-14(a) Certification of David G. Dehaemers, Jr.
|
|
|
31.2*
|
Rule 13a-14(a)/15d-14(a) Certification of Gary J. Brauchle.
|
|
|
32.1*
|
Section 1350 Certification of David G. Dehaemers, Jr.
|
|
|
32.2*
|
Section 1350 Certification of Gary J. Brauchle.
|
|
|
101.INS*
|
XBRL Instance Document.
|
|
|
101.SCH*
|
XBRL Taxonomy Extension Schema Document.
|
|
|
101.CAL*
|
XBRL Taxonomy Extension Calculation Linkbase Document.
|
|
|
101.DEF*
|
XBRL Taxonomy Extension Definition Linkbase Document.
|
|
|
101.LAB*
|
XBRL Taxonomy Extension Label Linkbase Document.
|
|
|
101.PRE*
|
XBRL Taxonomy Extension Presentation Linkbase Document.
|
|
|
* -
|
filed herewith
|
181
|
† -
|
Management contract of compensatory plan or arrangement required to be filed as an exhibit to this Form 10-K pursuant to Item 15(b).
|
182
Not applicable.
183
SIGNATURES
Pursuant to the requirements of Section 13 or 15(d) of the Securities Exchange Act of 1934, the registrant has duly caused this report to be signed on its behalf by the undersigned, thereunto duly authorized.
Tallgrass Energy GP, LP
|
By:
|
TEGP Management, LLC, its general partner
|
|
|
By:
|
|
/s/ David G. Dehaemers, Jr.
|
|
|
David G. Dehaemers, Jr.
|
|
|
|
President and Chief Executive Officer of TEGP Management, LLC (the general partner of Tallgrass Energy GP, LP)
|
|
Date:
February 15, 2017
184
SIGNATURES
Pursuant to the requirements of the Securities Exchange Act of 1934, this report has been signed below by the following persons on behalf of the registrant and in the capacities and on the dates indicated.
|
Name
|
Title
|
Date
|
||
|
/s/ David G. Dehaemers, Jr.
|
Director, President and Chief Executive Officer
|
February 15, 2017
|
||
|
David G. Dehaemers, Jr.
|
(Principal Executive Officer)
|
|||
|
/s/ Gary J. Brauchle
|
Executive Vice President and Chief Financial Officer
|
February 15, 2017
|
||
|
Gary J. Brauchle
|
(Principal Financial Officer)
|
|||
|
/s/ Gary D. Watkins
|
Vice President and Chief Accounting Officer
|
February 15, 2017
|
||
|
Gary D. Watkins
|
(Principal Accounting Officer)
|
|||
|
/s/ Frank J. Loverro
|
Director
|
February 15, 2017
|
||
|
Frank J. Loverro
|
||||
|
/s/ Stanley de J. Osborne
|
Director
|
February 15, 2017
|
||
|
Stanley de J. Osborne
|
||||
|
/s/ Jeffrey A. Ball
|
Director
|
February 15, 2017
|
||
|
Jeffrey A. Ball
|
||||
|
/s/ John T. Raymond
|
Director
|
February 15, 2017
|
||
|
John T. Raymond
|
||||
|
/s/ William R. Moler
|
Director
|
February 15, 2017
|
||
|
William R. Moler
|
||||
|
/s/ Thomas A. Gerke
|
Director
|
February 15, 2017
|
||
|
Thomas A. Gerke
|
||||
|
/s/ W. Curtis Koutelas
|
Director
|
February 15, 2017
|
||
|
W. Curtis Koutelas
|
||||
185
TABLE OF CONTENTS
Part IItem 1. BusinessItem 1A. Risk FactorsItem 1B. Unresolved Staff CommentsItem 2. PropertiesItem 3. Legal ProceedingsItem 4. Mine Safety DisclosuresPart IIItem 5. Market For Registrant's Common Equity, Related Stockholder Matters and Issuer Purchases Of Equity SecuritiesItem 6. Selected Financial DataItem 7. Management's Discussion and Analysis Of Financial Condition and Results Of OperationsItem 7A. Quantitative and Qualitative Disclosures About Market RiskItem 8. Financial Statements and Supplementary DataItem 9. Changes in and Disagreements with Accountants on Accounting and Financial DisclosuresItem 9A. Controls and ProceduresItem 9B. Other InformationPart IIIItem 10. Directors, Executive Officers and Corporate GovernanceItem 11. Executive CompensationItem 12. Security Ownership Of Certain Beneficial Owners and Management and Related Stockholder MattersItem 13. Certain Relationships and Related Transactions, and Director IndependenceItem 14. Principal Accounting Fees and ServicesPart IVItem 15. Exhibits, Financial Statement SchedulesItem 16. Form 10-k Summary