TARGET CORP
10-Ks and 10-Qs
|
|
|
|
|
|
|
|
|
|
|
|
|
|
|
|
|
|
|
|
|
|
|
|
|
|
|
|
|
|
|
|
|
|
|
|
|
|
|
|
|
|
|
|
|
|
|
|
|
|
|
|
|
|
|
|
|
|
|
|
UNITED STATES
|
||
|
SECURITIES AND EXCHANGE COMMISSION
|
||
|
Washington, D.C. 20549
|
||
|
FORM 10-K
|
||
|
(Mark One)
|
|
|
x
|
ANNUAL REPORT PURSUANT TO SECTION 13 OR 15(d) OF THE SECURITIES EXCHANGE ACT OF 1934
|
|
For the fiscal year ended January 28, 2017
|
|
|
OR
|
|
|
o
|
TRANSITION REPORT PURSUANT TO SECTION 13 OR 15(d) OF THE SECURITIES EXCHANGE ACT OF 1934
|
|
For the transition period from to
|
|
|
Commission file number
1-6049
|
|

TARGET CORPORATION
(Exact name of registrant as specified in its charter)
|
Minnesota
(State or other jurisdiction of
incorporation or organization)
|
|
41-0215170
(I.R.S. Employer
Identification No.)
|
|
1000 Nicollet Mall, Minneapolis, Minnesota
(Address of principal executive offices)
|
|
55403
(Zip Code)
|
Registrant's telephone number, including area code: 612/304-6073
Securities Registered Pursuant To Section 12(B) Of The Act:
|
Title of Each Class
|
|
Name of Each Exchange on Which Registered
|
|
Common Stock, par value $0.0833 per share
|
|
New York Stock Exchange
|
|
Securities registered pursuant to Section 12(g) of the Act:
None
|
||
Indicate by check mark if the registrant is a well-known seasoned issuer, as defined in Rule 405 of the Securities Act. Yes
x
No
o
Indicate by check mark if the registrant is not required to file reports pursuant to Section 13 or Section 15(d) of the Act. Yes
o
No
x
Note
– Checking the box above will not relieve any registrant required to file reports pursuant to Section 13 or 15(d) of the Exchange Act from their obligations under those Sections.
Indicate by check mark whether the registrant (1) has filed all reports required to be filed by Section 13 or 15(d) of the Securities Exchange Act of 1934 during the preceding 12 months (or for such shorter period that the registrant was required to file such reports), and (2) has been subject to such filing requirements for the past 90 days. Yes
x
No
o
Indicate by checkmark whether the registrant has submitted electronically and posted on its corporate Website, if any, every Interactive Data File required to be submitted and posted pursuant to Rule 405 of Regulation S-T (§232.405 of this chapter) during the preceding 12 months (or for such shorter period that the registrant was required to submit and post such files). Yes
x
No
o
Indicate by check mark if disclosure of delinquent filers pursuant to Item 405 of Regulation S-K (§229.405 of this chapter) is not contained herein, and will not be contained, to the best of registrant's knowledge, in definitive proxy or information statements incorporated by reference in Part III of this Form 10-K or any amendment to this Form 10-K.
x
Indicate by check mark whether the registrant is a large accelerated filer, an accelerated filer, a non-accelerated filer, or a smaller reporting company (as defined in Rule 12b-2 of the Act). See the definitions of "large accelerated filer," "accelerated filer" and "smaller reporting company" in Rule 126-2 of the Exchange Act.
|
Large accelerated filer
x
|
Accelerated filer
o
|
Non-accelerated filer
o
(Do not check if a smaller reporting company)
|
Smaller reporting company
o
|
Indicate by check mark whether the registrant is a shell company (as defined in Rule 12b-2 of the Act). Yes
o
No
x
The aggregate market value of the voting stock held by non-affiliates of the registrant as of
July 30, 2016
was
$43,242,921,133
, based on the closing price of $75.33 per share of Common Stock as reported on the New York Stock Exchange Composite Index.
Indicate the number of shares outstanding of each of registrant's classes of Common Stock, as of the latest practicable date. Total shares of Common Stock, par value $0.0833, outstanding at
March 2, 2017
were 552,675,341.
|
DOCUMENTS INCORPORATED BY REFERENCE
|
|
Portions of Target's Proxy Statement to be filed on or about May 1, 2017 are incorporated into Part III.
|
TABLE OF CONTENTS
|
|
|||
|
|
|||
|
|
|||
|
|
|||
|
|
|||
|
|
|||
|
|
|||
|
|
|||
|
|
|||
|
|
|||
|
|
|||
|
|
|||
|
|
|||
|
|
|||
|
|
|||
|
|
|||
|
|
|||
|
|
|||
|
|
|||
|
|
|||
|
|
|||
|
|
|||
|
|
|||
|
|
|||
|
|
|||
1
General
Target Corporation (Target, the Corporation or the Company) was incorporated in Minnesota in 1902. We offer our customers, referred to as "guests," everyday essentials and fashionable, differentiated merchandise at discounted prices. Our ability to deliver a preferred shopping experience to our guests is supported by our supply chain and technology, our devotion to innovation, our loyalty offerings such as REDcard Rewards and Cartwheel, and our disciplined approach to managing our business and investing in future growth. We operate as a single segment designed to enable guests to purchase products seamlessly in stores or through our digital channels. Since 1946, we have given 5 percent of our profit to communities.
We perform account servicing and primary marketing functions for, and earn a substantial portion of the profits generated by, the Target Credit Card and Target MasterCard consumer receivables portfolio, which is underwritten, funded, and owned by TD Bank Group (TD). Refer to Note
9
of the Consolidated Financial Statements included in Item 8, Financial Statements and Supplementary Data (the Financial Statements) for more information on the credit card profit sharing.
Prior to January 15, 2015, we operated a Canadian Segment. On January 15, 2015, we announced our exit from the Canadian market, and Target Canada Co. and certain other wholly owned subsidiaries of Target filed for protection (the Filing) in Canada under the Companies' Creditors Arrangement Act (CCAA) with the Ontario Superior Court of Justice in Toronto (the Court). Following the Filing, we no longer consolidate our former Canadian retail operation. Canadian financial results prior to the Filing are included in our financial statements and classified within discontinued operations. See Item 7, Management's Discussion and Analysis of Financial Condition and Results of Operations (MD&A) and Note
7
of the Financial Statements for more information.
Prior to December 16, 2015, we operated 1,672 pharmacies and 79 clinics in our stores. On December 16, 2015, we sold our pharmacy and clinic businesses (Pharmacy Transaction) to CVS Pharmacy, Inc. (CVS). CVS now operates the pharmacy and clinic businesses in our stores under a perpetual operating agreement, subject to termination in limited circumstances. See MD&A and Note 6 of the Financial Statements for more information.
Discontinued operations in this Annual Report on Form 10-K refers only to our discontinued Canadian operations.
Financial Highlights
For information on key financial highlights and segment financial information, see the items referenced in Item 6, Selected Financial Data, MD&A, and Note
30
of the Financial Statements.
Seasonality
A larger share of annual revenues and earnings traditionally occurs in the fourth quarter because it includes the peak holiday sales period of November and December.
Merchandise
We sell a wide assortment of general merchandise and food. The majority of our general merchandise stores offer an edited food assortment, including perishables, dry grocery, dairy, and frozen items. Nearly all of our stores larger than 170,000 square feet offer a full line of food items comparable to traditional supermarkets. Our small, flexible format stores, generally smaller than 50,000 square feet, offer curated general merchandise and food assortments. Our digital channels include a wide assortment of general merchandise, including many items found in our stores, along with a complementary assortment such as additional sizes and colors sold only online.
2
A significant portion of our sales is from national brand merchandise. Approximately one-third of
2016
sales related to our owned and exclusive brands, including but not limited to the following:
|
Owned Brands
|
|
|
|
Archer Farms®
|
Market Pantry®
|
Sutton & Dodge®
|
|
Art Class™
|
Merona®
|
Threshold™
|
|
Ava & Viv®
|
Pillowfort™
|
up & up®
|
|
Boots & Barkley®
|
Room Essentials®
|
Wine Cube®
|
|
Cat & Jack™
|
Simply Balanced™
|
Wondershop™
|
|
Embark®
|
Smith & Hawken®
|
Xhilaration®
|
|
Gilligan & O'Malley®
|
Sonia Kashuk®
|
|
|
Knox Rose™
|
Spritz™
|
|
|
Exclusive Brands
|
|
|
|
C9 by Champion®
|
Hand Made Modern®
|
Mossimo®
|
|
DENIZEN® from Levi's®
|
Just One You® made by carter's®
|
Nate Berkus for Target
|
|
Fieldcrest®
|
Kid Made Modern®
|
Oh Joy!® for Target
|
|
Genuine Kids® from OshKosh®
|
Liz Lange® for Target
|
|
We also sell merchandise through periodic exclusive design and creative partnerships and generate revenue from in-store amenities such as Target Café and Target Photo, and leased or licensed departments such as Target Optical, Starbucks, and other food service offerings. The majority of our stores also have a CVS pharmacy from which we will generate ongoing annual, inflation adjusted occupancy-related income (see MD&A and Note 6 of the Financial Statements for more information).
Distribution
The vast majority of merchandise is distributed to our stores through our network of 40 distribution centers. Common carriers ship general merchandise to and from our distribution centers. Vendors or third party distributors ship certain food items and other merchandise directly to our stores. Merchandise sold through our digital channels is distributed to our guests via common carriers from our distribution centers, from vendors or third party distributors, from our stores or through guest pick-up at our stores. Using our stores as fulfillment points allows improved product availability and delivery times and also reduces shipping costs.
Employees
At
January 28, 2017
, we employed approximately 323,000 full-time, part-time and seasonal employees, referred to as "team members." During the
2016
holiday sales period our employment levels peaked at approximately 373,000 team members. We offer a broad range of company-paid benefits to our team members. Eligibility for and the level of benefits vary depending on team members' full-time or part-time status, compensation level, date of hire, and/or length of service. Company-paid benefits include a 401(k) plan, medical and dental plans, disability insurance, paid vacation, tuition reimbursement, various team member assistance programs, life insurance, a pension plan (closed to new participants, with limited exceptions), and merchandise and other discounts. We believe our team member relations are good.
Working Capital
Our working capital needs are greater in the months leading up to the holiday sales period, which we typically finance with cash flow provided by operations and short-term borrowings. Additional details are provided in the Liquidity and Capital Resources section in MD&A.
Effective inventory management is key to our ongoing success, and we use various techniques including demand forecasting and planning and various forms of replenishment management. We achieve effective inventory management by staying in-stock in core product offerings, maintaining positive vendor relationships, and carefully planning inventory levels for seasonal and apparel items to minimize markdowns.
3
Competition
We compete with traditional and internet retailers, including off-price general merchandise retailers, apparel retailers, wholesale clubs, category specific retailers, drug stores, supermarkets, and other forms of retail commerce. Our ability to positively differentiate ourselves from other retailers and provide a compelling value proposition largely determines our competitive position within the retail industry.
Intellectual Property
Our brand image is a critical element of our business strategy. Our principal trademarks, including Target, SuperTarget and our "Bullseye Design," have been registered with the U.S. Patent and Trademark Office. We also seek to obtain and preserve intellectual property protection for our owned brands.
Geographic Information
Virtually all of our revenues are generated within the United States. The vast majority of our long-lived assets are located within the United States.
Available Information
Our Annual Report on Form 10-K, quarterly reports on Form 10-Q, current reports on Form 8-K, and amendments to those reports filed or furnished pursuant to Section 13(a) or 15(d) of the Exchange Act are available free of charge at investors.target.com as soon as reasonably practicable after we file such material with, or furnish it to, the U.S. Securities and Exchange Commission (SEC). Our Corporate Governance Guidelines, Business Conduct Guide, Corporate Social Responsibility Report, and the charters for the committees of our Board of Directors are also available free of charge in print upon request or at investors.target.com.
4
Our business is subject to many risks. Set forth below are the material risks we face. Risks are listed in the categories where they primarily apply, but other categories may also apply.
Competitive and Reputational Risks
Our continued success is dependent on positive perceptions of Target which, if eroded, could adversely affect our business and our relationships with our guests and team members.
We believe that one of the reasons our guests prefer to shop at Target, our team members choose Target as a place of employment and our vendors choose to do business with us is the reputation we have built over many years for serving our four primary constituencies: guests, team members, shareholders, and the communities in which we operate. To be successful in the future, we must continue to preserve Target's reputation. Reputational value is based in large part on perceptions, and broad access to social media makes it easy for anyone to provide public feedback that can influence perceptions of Target. It may be difficult to control negative publicity, regardless of whether it is accurate. While reputations may take decades to build, any negative incidents can quickly erode trust and confidence, particularly if they result in negative mainstream and social media publicity, governmental investigations, or litigation. Negative incidents could lead to tangible adverse effects on our business, including consumer boycotts, lost sales, loss of new store and technology development opportunities, or team member retention and recruiting difficulties. In addition, vendors and others with whom we choose to do business may affect our reputation. For example, CVS operates clinics and pharmacies within our stores, and our guests’ perceptions of and experiences with CVS may impact our reputation.
If we are unable to positively differentiate ourselves from other retailers, our results of operations could be adversely affected.
In the past, we have been able to compete successfully by differentiating our guests’ shopping experience through a careful combination of price, merchandise assortment, store environment, convenience, guest service, loyalty programs and marketing efforts. Our ability to create a personalized guest experience through the collection and use of accurate and relevant guest data is important to our ability to differentiate from other retailers. Guest perceptions regarding the cleanliness and safety of our stores, the functionality, reliability, and speed of our digital channels and fulfillment options, our in-stock levels, the effectiveness of our promotions, the attractiveness of our third party offerings, such as the clinics and pharmacies owned and operated by CVS, and other factors also affect our ability to compete. No single competitive factor is dominant, and actions by our competitors on any of these factors or the failure of our strategies could have an adverse effect on our sales, gross margins, and expenses.
We sell many products under our owned and exclusive brands. These brands are an important part of our business because they differentiate us from other retailers, generally carry higher margins than equivalent national brand products and represent a significant portion of our overall sales. If we are unable to successfully develop and support our owned and exclusive brands, if one or more of these brands experiences a loss of consumer acceptance or confidence, or if we are unable to successfully protect our intellectual property rights in these brands, our sales and gross margins could be adversely affected.
The continuing migration and evolution of retailing to digital channels has increased our challenges in differentiating ourselves from other retailers. In particular, consumers are able to quickly and conveniently comparison shop and determine real-time product availability using digital tools, which can lead to decisions based solely on price, the functionality of the digital tools or a combination of those and other factors. We must compete by offering a consistent and convenient shopping experience for our guests regardless of the ultimate sales channel. We must provide our guests and team members digital tools that have the right features and are reliable and easy to use. Failures to effectively execute in these efforts, actions by our competitors in response to these efforts, or failures of our vendors to manage their own channels, content and technology systems could hurt our ability to differentiate ourselves from other retailers and, as a result, have an adverse effect on sales, gross margins, and expenses.
If we are unable to successfully provide a relevant and reliable experience for our guests, regardless of where our guest demand is ultimately fulfilled, our sales, results of operations and reputation could be adversely affected.
Our business has evolved from an in-store experience to interaction with guests across multiple channels (in-store, online, mobile and social media, among others). Our guests are using computers, tablets, mobile phones and other
5
devices to shop in our stores and online and provide feedback and public commentary about all aspects of our business. We must anticipate and meet changing guest expectations and counteract new developments and technology investments by our competitors. Our evolving retailing efforts include implementing new technology, software and processes to be able to fulfill guest orders directly from our vendors and from any point within our system of stores and distribution centers. Providing flexible fulfillment options is complex and may not meet guest expectations for accurate order fulfillment, faster and guaranteed delivery times, and low-price or free shipping. If we are unable to attract and retain team members or contract with third parties having the specialized skills needed to support these efforts, implement improvements to our guest‑facing technology in a timely manner, collect accurate, relevant, and usable guest data to support our personalization efforts, allow real-time and accurate visibility to product availability when guests are ready to purchase, quickly and efficiently fulfill our guests orders using the fulfillment and payment methods they demand, or provide a convenient and consistent experience for our guests across all sales channels, our ability to compete and our results of operations could be adversely affected. In addition, if Target.com and our other guest‑facing technology systems do not appeal to our guests, reliably function as designed, integrate across all sales channels, or maintain the privacy of guest data we may experience a loss of guest confidence and lost sales, which could adversely affect our reputation and results of operations.
If we fail to anticipate and respond quickly to changing consumer preferences, our sales, gross margins and profitability could suffer.
A large part of our business is dependent on our ability to make trend‑right decisions and effectively manage our inventory in a broad range of merchandise categories, including apparel, accessories, home décor, electronics, toys, seasonal offerings, food and other merchandise. For example, our apparel and home décor assortment is continually evolving and in other areas of our product assortment, including food, we are supporting guest wellness goals and offering more items that appeal to local cultural and demographic tastes. Failure to obtain accurate and relevant data on guest preferences, predict changing consumer tastes, preferences, spending patterns and other lifestyle decisions, emphasize the correct categories, implement effective promotions, and personalize our offerings to our guests may result in lost sales, spoilage, and increased inventory markdowns, which would lead to a deterioration in our results of operations by hurting our sales, gross margins, and profitability.
Technology Investments and Infrastructure Risks
If our capital investments in technology, supply chain, new stores and remodeling existing stores do not achieve appropriate returns, our competitive position, financial condition and results of operations may be adversely affected.
Our business is becoming increasingly reliant on technology investments, and the returns on these investments can be less predictable than building new stores and remodeling existing stores. We are currently making, and will continue to make, significant technology investments to provide a consistent and improved guest experience across all sales channels and improve our supply chain and inventory management systems. These technology initiatives might not provide the anticipated benefits or desired return or may provide them on a delayed schedule or at a higher cost. Our business also depends, in part, on our ability to build new stores and remodel existing stores in a manner that achieves appropriate returns on our capital investment. We compete with other retailers and businesses for suitable locations for our stores. Many of our expected new store sites are smaller and non-standard footprints located in fully developed markets, which require changes to our supply chain practices and are generally more time-consuming, expensive and uncertain undertakings than expansion into undeveloped suburban and ex-urban markets. Targeting the wrong technology or store opportunities, failing to make the best investments, being unable to make new concepts scalable or making an investment commitment significantly above or below our needs could result in the loss of our competitive position and adversely impact our financial condition or results of operations.
A significant disruption in our computer systems and our inability to adequately maintain and update those systems could adversely affect our operations and our ability to maintain guest confidence.
We rely extensively on our computer systems to manage and account for inventory, process guest transactions, manage and maintain the privacy of guest data, communicate with our vendors and other third parties, service REDcard accounts, and summarize and analyze results. We also rely on continued and unimpeded access to the Internet to use our computer systems. Our systems are subject to damage or interruption from power outages, telecommunications failures, computer viruses, malicious attacks, security breaches, and catastrophic events. If our systems are damaged or fail to function properly or reliably, we may incur substantial repair or replacement costs, experience data loss or theft and impediments to our ability to manage inventories or process guest transactions, engage in additional
6
promotional activities to retain our guests, and encounter lost guest confidence, which could adversely affect our results of operations.
We continually make significant technology investments that are intended to help maintain and update our existing computer systems. Implementing significant system changes increases the risk of computer system disruption. The potential problems and interruptions associated with implementing technology initiatives could disrupt or reduce our operational efficiency, and could negatively impact guest experience and guest confidence.
Data Security and Privacy Risks
If our efforts to protect the security of information about our guests, team members and vendors are unsuccessful, we may face additional costly government enforcement actions and private litigation, and our sales and reputation could suffer.
We regularly receive and store information about our guests, team members, and vendors. We have programs in place to detect, contain and respond to data security incidents. However, because the techniques used to obtain unauthorized access, disable or degrade service, or sabotage systems change frequently and may be difficult to detect for long periods of time, we may be unable to anticipate these techniques or implement adequate preventive measures. In addition, hardware, software, or applications we develop or procure from third parties may contain defects in design or manufacture or other problems that could unexpectedly compromise information security. Unauthorized parties may also attempt to gain access to our systems or facilities, or those of third parties with whom we do business, through fraud, trickery, or other forms of deceiving our team members, contractors, vendors, and temporary staff.
Until the data breach we experienced in the fourth quarter of 2013, all incidents we encountered were insignificant. The data breach we experienced in 2013 was significant and went undetected for several weeks. Both we and our vendors had data security incidents subsequent to the 2013 data breach; however, to date these other incidents have not been material to our consolidated financial statements. Based on the prominence and notoriety of the 2013 data breach, even minor additional data security incidents could draw greater scrutiny. If we, our vendors, or other third parties with whom we do business experience additional significant data security breaches or fail to detect and appropriately respond to significant data security breaches, we could be exposed to additional government enforcement actions and private litigation. In addition, our guests could lose confidence in our ability to protect their information, which could cause them to discontinue using our REDcards or loyalty programs, or stop shopping with us altogether.
Supply Chain and Third Party Risks
Changes in our relationships with our vendors, changes in tax policy or trade relations, interruptions in our supply chain or increased commodity or supply chain costs could adversely affect our results of operations.
We are dependent on our vendors to supply merchandise to our distribution centers, stores and guests. As we continue to add capabilities, our fulfillment network becomes increasingly complex and operating it becomes more challenging. If our fulfillment network does not operate properly or if a vendor fails to deliver on its commitments, we could experience merchandise out-of-stocks, delivery delays or increased delivery costs, which could lead to lost sales and decreased guest confidence, and adversely affect our results of operations.
A large portion of our merchandise is sourced, directly or indirectly, from outside the United States, with China as our single largest source. The results of the recent United States elections may signal a change in trade policy between the United States and other countries. Because a large portion of our merchandise is sourced, directly or indirectly, from outside the United States, major changes in tax policy or trade relations, such as the disallowance of tax deductions for imported merchandise or the imposition of additional tariffs or duties on imported products, could adversely affect our business, results of operations, effective income tax rate, liquidity and net income.
Political or financial instability, currency fluctuations, changes in trade policy, trade restrictions, tariffs or duties, the outbreak of pandemics, labor unrest, transport capacity and costs, port security, weather conditions, natural disasters or other events that could slow or disrupt port activities and affect foreign trade are beyond our control and could materially disrupt our supply of merchandise, increase our costs, and/or adversely affect our results of operations. There have been periodic labor disputes impacting the United States ports that have caused us to make alternative arrangements to continue the flow of inventory, and if these types of disputes recur, worsen, or occur in other countries through which we source products, it may have a material impact on our costs or inventory supply. Changes in the costs of procuring commodities used in our merchandise or the costs related to our supply chain, including vendor costs, labor, fuel, tariffs, duties, currency exchange rates, and supply chain transparency initiatives, could have an
7
adverse effect on gross margins, expenses, and results of operations. Changes in our relationships with our vendors also have the potential to increase our expenses and adversely affect results of operations.
A disruption in relationships with third party service providers could adversely affect our operations.
We rely on third parties to support our business, including portions of our technology development and support, our digital platforms and fulfillment operations, credit and debit card transaction processing, extensions of credit for our 5% REDcard Rewards loyalty program, the clinics and pharmacies operated by CVS within our stores, the infrastructure supporting our guest contact centers, and aspects of our food offerings. If we are unable to contract with third parties having the specialized skills needed to support those strategies or integrate their products and services with our business, if we fail to properly manage those third parties, if they fail to meet our performance standards and expectations, including with respect to data security, then our reputation, sales, and results of operations could be adversely affected. In addition, we could face increased costs associated with finding replacement providers or hiring and retaining team members to provide these services in-house. An example of our reliance on third parties is our relationship with CVS. If our guests do not react favorably to CVS’s operations or if our relationship with CVS is ineffective, our ability to discontinue the relationship is limited and our results of operations may be adversely affected. In addition, if we wish to have clinics and pharmacies in any new stores, those clinics and pharmacies must be owned and operated by CVS, which limits our flexibility in designing and operating new stores and new store concepts.
Legal, Regulatory, Global and Other External Risks
Our earnings are highly susceptible to the state of macroeconomic conditions and consumer confidence in the United States.
Virtually all of our sales are in the United States, making our results highly dependent on United States consumer confidence and the health of the United States economy. In addition, a significant portion of our total sales is derived from stores located in five states: California, Texas, Florida, Minnesota and Illinois, resulting in further dependence on local economic conditions in these states. Deterioration in macroeconomic conditions or consumer confidence could negatively affect our business in many ways, including slowing sales growth, reducing overall sales, and reducing gross margins.
These same considerations impact the success of our credit card program. Although we no longer own a consumer credit card receivables portfolio, we share in the economic performance of the credit card program with TD, which owns the receivables generated by our proprietary credit cards. Deterioration in macroeconomic conditions could adversely affect the volume of new credit accounts, the amount of credit card program balances and the ability of credit card holders to pay their balances. These conditions could result in us receiving lower profit‑sharing payments.
Uncharacteristic or significant weather conditions, alone or together with natural disasters, could adversely affect our operations.
Uncharacteristic or significant weather conditions can affect consumer shopping patterns, particularly in apparel and seasonal items, which could lead to lost sales or greater than expected markdowns and adversely affect our short-term results of operations. In addition, our three largest states by total sales are California, Texas and Florida, areas where natural disasters are more prevalent. Natural disasters in those states or in other areas where our sales are concentrated could result in significant physical damage to or closure of one or more of our stores, distribution centers or key vendors, and cause delays in the distribution of merchandise from our vendors to our distribution centers, stores, and directly to guests, which could adversely affect our results of operations by increasing our costs and lowering our sales.
We rely on a large, global and changing workforce of team members, contractors and temporary staffing. If we do not effectively manage our workforce and the concentration of work in certain global locations, our labor costs and results of operations could be adversely affected.
With over 300,000 team members, our workforce costs represent our largest operating expense, and our business and regulatory compliance is dependent on our ability to attract, train, and retain the appropriate mix of qualified team members, contractors, and temporary staffing and effectively organize and manage those resources as our business and strategic priorities change. Many team members are in entry-level or part-time positions with historically high turnover rates. Our ability to meet our changing labor needs while controlling our costs is subject to external factors such as labor laws and regulations, unemployment levels, prevailing wage rates, collective bargaining efforts, health care and other be
8
nefit costs, changing demographics, and our reputation and relevance within the labor market. If we are unable to attract and retain adequate numbers and an appropriate mix of qualified team members, contractors and temporary staffing, our operations, guest service levels, support functions, and competitiveness could suffer. Those factors, together with increasing wage and benefit costs, could adversely affect our results of operations. We are periodically subject to labor organizing efforts. If we become subject to one or more collective bargaining agreements in the future, it could adversely affect our labor costs and how we operate our business.
We maintain a headquarters location in India and sourcing offices in China where there has generally been greater political, financial, environmental and health instability than the United States. An extended disruption of our operations in India or offices in China could adversely affect certain operations supporting stability and maintenance of our digital channels, information technology development, and sourcing operations.
Failure to address product safety and sourcing concerns could adversely affect our sales and results of operations.
If our merchandise offerings do not meet applicable safety standards or Target's or our guests’ expectations regarding safety, supply chain transparency and integrity of sources of supply, we could experience lost sales and increased costs and be exposed to legal and reputational risk. All of our vendors must comply with applicable product safety laws, and we are dependent on them to ensure that the products we buy comply with all safety standards. Events that give rise to actual, potential or perceived product safety concerns, including food or drug contamination, could expose us to government enforcement action or private litigation and result in costly product recalls and other liabilities. All of our vendors must also comply with our Standards of Vendor Engagement, which cover a variety of expectations across multiple areas of social compliance, including supply chain transparency and sources of supply. We have a social compliance audit process, but we are also dependent on our vendors to ensure that the products we buy comply with our standards. Negative guest perceptions regarding the safety of the products we sell and events that give rise to actual, potential or perceived social compliance concerns could hurt our reputation and result in lost sales. For example, we recently terminated a relationship with a vendor that supplied us with cotton sheets that were represented to be 100 percent Egyptian cotton after we discovered that the vendor substituted non-Egyptian cotton. If that event or if similar events in the future cause our guests to seek alternative sources for their needs, we could lose sales and it may be difficult and costly for us to regain the confidence of our guests.
Our failure to comply with federal, state, local, and international laws, or changes in these laws could increase our costs, reduce our margins, and lower our sales.
Our business is subject to a wide array of laws and regulations in the United States and other countries in which we operate. Significant workforce-related legislative changes could increase our expenses and adversely affect our operations. Examples of possible workforce-related legislative changes include changes to an employer's obligation to recognize collective bargaining units, the process by which collective bargaining agreements are negotiated or imposed, minimum wage requirements, advance scheduling notice requirements, and health care mandates. In addition, changes in the regulatory environment affecting privacy and information security, product safety, payment methods and related fees, responsible sourcing, supply chain transparency, or environmental protection, among others, could cause our expenses to increase without an ability to pass through any increased expenses through higher prices. In addition, if we fail to comply with other applicable laws and regulations, including wage and hour laws, the Foreign Corrupt Practices Act and local anti-bribery laws, we could be subject to legal risk, including government enforcement action and class action civil litigation, which could adversely affect our results of operations by increasing our costs, reducing our margins, and lowering our sales.
Financial Risks
Changes in our effective income tax rate could adversely affect our business, results of operations, liquidity, and net income.
A number of factors influence our effective income tax rate, including changes in tax law, tax treaties, interpretation of existing laws, and our ability to sustain our reporting positions on examination. Changes in any of those factors could change our effective tax rate, which could adversely affect our net income. In addition, our operations outside of the United States may cause greater volatility in our effective tax rate.
9
If we are unable to access the capital markets or obtain bank credit, our financial position, liquidity, and results of operations could suffer.
We are dependent on a stable, liquid, and well-functioning financial system to fund our operations and capital investments. In particular, we have historically relied on the public debt markets to fund portions of our capital investments and the commercial paper market and bank credit facilities to fund seasonal needs for working capital. Our continued access to these markets depends on multiple factors including the condition of debt capital markets, our operating performance, and maintaining strong credit ratings. If rating agencies lower our credit ratings, it could adversely impact our ability to access the debt markets, our cost of funds, and other terms for new debt issuances. Each of the credit rating agencies reviews its rating periodically, and there is no guarantee our current credit rating will remain the same. In addition, we use a variety of derivative products to manage our exposure to market risk, principally interest rate and equity price fluctuations. Disruptions or turmoil in the financial markets could reduce our ability to meet our capital requirements or fund our working capital needs, and lead to losses on derivative positions resulting from counterparty failures, which could adversely affect our financial position and results of operations.
Not applicable.
10
|
Stores at
January 28, 2017
|
Stores
|
|
Retail Sq. Ft.
(in thousands)
|
|
|
Stores
|
|
Retail Sq. Ft.
(in thousands)
|
|
|
|
Alabama
|
22
|
|
3,150
|
|
Montana
|
7
|
|
780
|
|
|
|
Alaska
|
3
|
|
504
|
|
Nebraska
|
14
|
|
2,006
|
|
|
|
Arizona
|
46
|
|
6,136
|
|
Nevada
|
17
|
|
2,230
|
|
|
|
Arkansas
|
9
|
|
1,165
|
|
New Hampshire
|
9
|
|
1,148
|
|
|
|
California
|
273
|
|
35,575
|
|
New Jersey
|
46
|
|
5,929
|
|
|
|
Colorado
|
41
|
|
6,215
|
|
New Mexico
|
10
|
|
1,185
|
|
|
|
Connecticut
|
20
|
|
2,672
|
|
New York
|
75
|
|
9,961
|
|
|
|
Delaware
|
3
|
|
440
|
|
North Carolina
|
49
|
|
6,496
|
|
|
|
District of Columbia
|
1
|
|
179
|
|
North Dakota
|
4
|
|
554
|
|
|
|
Florida
|
122
|
|
17,135
|
|
Ohio
|
61
|
|
7,659
|
|
|
|
Georgia
|
51
|
|
6,916
|
|
Oklahoma
|
15
|
|
2,168
|
|
|
|
Hawaii
|
6
|
|
971
|
|
Oregon
|
19
|
|
2,280
|
|
|
|
Idaho
|
6
|
|
664
|
|
Pennsylvania
|
69
|
|
8,741
|
|
|
|
Illinois
|
92
|
|
12,361
|
|
Rhode Island
|
4
|
|
517
|
|
|
|
Indiana
|
31
|
|
4,174
|
|
South Carolina
|
19
|
|
2,359
|
|
|
|
Iowa
|
20
|
|
2,835
|
|
South Dakota
|
5
|
|
580
|
|
|
|
Kansas
|
18
|
|
2,473
|
|
Tennessee
|
31
|
|
3,990
|
|
|
|
Kentucky
|
13
|
|
1,551
|
|
Texas
|
147
|
|
20,726
|
|
|
|
Louisiana
|
16
|
|
2,246
|
|
Utah
|
13
|
|
1,953
|
|
|
|
Maine
|
5
|
|
630
|
|
Vermont
|
—
|
|
—
|
|
|
|
Maryland
|
39
|
|
4,952
|
|
Virginia
|
58
|
|
7,689
|
|
|
|
Massachusetts
|
40
|
|
5,188
|
|
Washington
|
37
|
|
4,328
|
|
|
|
Michigan
|
55
|
|
6,603
|
|
West Virginia
|
6
|
|
755
|
|
|
|
Minnesota
|
75
|
|
10,634
|
|
Wisconsin
|
37
|
|
4,560
|
|
|
|
Mississippi
|
6
|
|
743
|
|
Wyoming
|
2
|
|
187
|
|
|
|
Missouri
|
35
|
|
4,609
|
|
|
|
|
|
|
|
|
|
|
|
|
Total
|
1,802
|
|
239,502
|
|
||
|
Stores and Distribution Centers at January 28, 2017
|
Stores
|
|
Distribution
Centers
(a)
|
|
|
Owned
|
1,535
|
|
33
|
|
|
Leased
|
107
|
|
7
|
|
|
Owned buildings on leased land
|
160
|
|
—
|
|
|
Total
|
1,802
|
|
40
|
|
(a)
The 40 distribution centers have a total of 51,831 thousand square feet.
We own our corporate headquarters buildings located in and around Minneapolis, Minnesota, and we lease and own additional office space elsewhere in the United States. We also lease office space in 12 countries for various support functions. Our properties are in good condition, well maintained, and suitable to carry on our business.
For additional information on our properties, see the Capital Expenditures section in MD&A and Notes
14
and
22
of the Financial Statements.
11
The following proceedings are being reported pursuant to Item 103 of Regulation S-K:
Federal Securities Law Class Actions
On May 17, 2016 and May 24, 2016, Target Corporation and certain present and former officers were named as defendants in two purported federal securities law class actions filed in the United States District Court for the District of Minnesota. The actions subsequently were consolidated under the caption
In re: Target Corporation Securities Litigation
, Case No. 0:16-cv-01315-JNE-BRT. The plaintiffs filed a Consolidated Amended Class Action Complaint (Consolidated Complaint) on November 14, 2016, alleging violations of Sections 10(b) and 20(a) of the Securities Exchange Act of 1934, as amended, and Rule 10b-5 relating to certain prior disclosures of Target about its expansion of retail operations into Canada (Canada Disclosure).Target, its former chief executive officer, its present chief operating officer, and the former president of Target Canada are named as defendants in the Consolidated Complaint. The plaintiff seeks to represent a class consisting of all purchasers of Target common stock between March 20, 2013 and August 4, 2014. The plaintiff seeks damages and other relief, including attorneys’ fees, based on allegations that the defendants misled investors about the performance and prospects of Target Canada and that such conduct affected the value of Target common stock. On February 10, 2017, Target and the other defendants moved to dismiss the Consolidated Complaint. That motion has not yet been heard or decided. Target intends to vigorously defend this consolidated action.
ERISA Class Actions
On July 12, 2016 and July 15, 2016, Target Corporation, the Plan Investment Committee and Target’s current chief operating officer were named as defendants in two purported Employee Retirement Income Security Act of 1974 (ERISA) class actions filed in the United States District Court for the District of Minnesota. The actions subsequently were consolidated under the caption
In re: Target Corporation ERISA Litigation
, Case No. 0:16-cv-02400-JNE-BRT. The plaintiffs filed an Amended Class Action Complaint (Amended Complaint) on December 14, 2016, alleging violations of Sections 404 and 405 of ERISA relating to the Canada Disclosure. Target, the Plan Investment Committee, and seven present or former officers are named as defendants in the Amended Complaint. The plaintiffs seek to represent a class consisting of all persons who were participants in or beneficiaries of the Target Corporation 401(k) Plan or the Target Corporation Ventures 401(k) Plan (collectively, the Plans) at any time between February 27, 2013 and May 19, 2014 and whose Plan accounts included investments in Target stock. The plaintiffs seek damages, an injunction and other unspecified equitable relief, and attorneys’ fees, expenses, and costs, based on allegations that the defendants breached their fiduciary duties by failing to take action to prevent Plan participants from continuing to purchase Target stock during the class period at prices that allegedly were artificially inflated. On February 24, 2017, Target and the other defendants moved to dismiss the Amended Complaint. That motion has not yet been heard or decided. Target intends to vigorously defend this consolidated action.
The following governmental enforcement proceedings relating to environmental matters are reported pursuant to instruction 5(C) of Item 103 of Regulation S-K because they involve potential monetary sanctions in excess of $100,000:
On February 27, 2015, the California Attorney General sent us a letter alleging, based on a series of compliance checks, that we have not achieved compliance with California’s environmental laws and the provisions of the injunction that was part of a settlement reached in 2011. Representatives of Target have had a series of meetings with representatives of the Attorney General’s Office and certain California District Attorneys’ Offices to discuss the allegations and attempt to resolve the matter. No formal legal action has been commenced, nor has any specific relief been sought, to date.
For a description of other legal proceedings, see Note
19
of the Financial Statements.
Not applicable.
12
Executive officers are elected by, and serve at the pleasure of, the Board of Directors. There are no family relationships between any of the officers named and any other executive officer or member of the Board of Directors, or any arrangement or understanding pursuant to which any person was selected as an officer.
|
Name
|
Title and Business Experience
|
Age
|
|
|
Casey L. Carl
|
Executive Vice President and Chief Strategy and Innovation Officer since December 2014. President, Omnichannel and Senior Vice President, Enterprise Strategy from July 2014 to December 2014. President, Multichannel, from November 2011 to July 2014.
|
41
|
|
|
Brian C. Cornell
|
Chairman of the Board and Chief Executive Officer since August 2014. Chief Executive Officer of PepsiCo Americas Foods, a division of PepsiCo, Inc., a multinational food and beverage corporation, from March 2012 to July 2014.
|
58
|
|
|
Rick H. Gomez
|
Executive Vice President and Chief Marketing Officer since January 2017. Senior Vice President, Brand and Category Marketing from April 2013 to January 2017. Vice President, Brand Marketing at MillerCoors, a multinational brewing company, from April 2011 to April 2013.
|
47
|
|
|
Don H. Liu
|
Executive Vice President, Chief Legal Officer and Corporate Secretary since August 2016. Executive Vice President, General Counsel and Corporate Secretary of Xerox Corporation from July 2014 to July 2016, and Senior Vice President, General Counsel and Corporate Secretary from March 2007 to August 2014.
|
55
|
|
|
Stephanie A. Lundquist
|
Executive Vice President and Chief Human Resources Officer since February 2016. Senior Vice President, Human Resources from January 2015 to February 2016. Senior Vice President, Stores and Distribution Human Resources from February 2014 to January 2015. From March 2011 to January 2014, Ms. Lundquist held several leadership positions with Target Canada.
|
41
|
|
|
Michael E. McNamara
|
Executive Vice President, Chief Information and Digital Officer since September 2016. Executive Vice President and Chief Information Officer from June 2015 to September 2016. Chief Information Officer of Tesco PLC, a multinational grocery and general merchandise retailer, from March 2011 to May 2015.
|
52
|
|
|
John J. Mulligan
|
Executive Vice President and Chief Operating Officer since September 2015. Executive Vice President and Chief Financial Officer from April 2012 to August 2015.
|
51
|
|
|
Janna A. Potts
|
Executive Vice President and Chief Stores Officer since January 2016. Senior Vice President, Stores and Supply Chain Human Resources from February 2015 to January 2016. Senior Vice President, Target Canada Stores and Distribution from March 2014 to January 2015. Senior Vice President, Store Operations from August 2009 to March 2014.
|
49
|
|
|
Jacqueline Hourigan Rice
|
Executive Vice President and Chief Risk and Compliance Officer since December 2014. Chief Compliance Officer of General Motors Company, a vehicle manufacturer, from March 2013 to November 2014. Executive Director, Global Ethics & Compliance of General Motors Company from January 2010 to February 2013.
|
45
|
|
|
Cathy R. Smith
|
Executive Vice President and Chief Financial Officer since September 2015. Executive Vice President and Chief Financial Officer of Express Scripts Holding Company, a pharmacy benefit manager, from February 2014 to December 2014. Executive Vice President of Strategy and Chief Financial Officer for Walmart International, a division of Wal-Mart Stores, Inc., a discount retailer, from March 2010 to January 2014.
|
53
|
|
|
Mark J. Tritton
|
Executive Vice President and Chief Merchandising Officer since June 2016. President of Nordstrom Product Group, of Nordstrom Inc., a fashion specialty retailer, from June 2009 to June 2016.
|
53
|
|
|
Laysha L. Ward
|
Executive Vice President and Chief External Engagement Officer since January 2017.
Chief Corporate Social Responsibility Officer from December 2014 to January 2017. President, Community Relations and Target Foundation from July 2008 to December 2014.
|
49
|
|
13
Our common stock is listed on the New York Stock Exchange under the symbol "TGT." We are authorized to issue up to 6,000,000,000 shares of common stock, par value $0.0833, and up to 5,000,000 shares of preferred stock, par value $0.01. At
March 2, 2017
, there were 15,067 shareholders of record. Dividends declared per share and the high and low closing common stock price for each fiscal quarter during
2016
and
2015
are disclosed in Note
31
of the Financial Statements.
On January 11, 2012, our Board of Directors authorized the repurchase of $5 billion of our common stock and on June 9, 2015 expanded the program by an additional $5 billion for a total authorization of $10 billion. On September 20, 2016, our Board of Directors authorized a new $5 billion share repurchase program. We began repurchasing shares under this new authorization during the fourth quarter of 2016 upon completion of the previous $10 billion program. There is no stated expiration for the share repurchase programs. Under these programs, we repurchased 50.9 million shares of common stock in fiscal 2016, at an average price of $72.35, for a total investment of $3.7 billion. The table below presents information with respect to Target common stock purchases made during the three months ended
January 28, 2017
, by Target or any "affiliated purchaser" of Target, as defined in Rule 10b-18(a)(3) under the Exchange Act.
|
Period
|
Total Number
of Shares
Purchased
|
|
Average
Price
Paid per
Share
|
|
Total Number of
Shares Purchased
as Part of Publicly Announced Programs
|
|
Dollar Value of
Shares that May
Yet Be Purchased
Under Publicly
Announced Programs
|
|
|||||
|
October 30, 2016 through November 26, 2016
|
|||||||||||||
|
Open market and privately negotiated purchases
|
802,412
|
|
$
|
67.23
|
|
802,412
|
|
$
|
5,210,467,654
|
|
|||
|
September 2016 ASR
(a)
|
1,286,423
|
|
67.67
|
|
1,286,423
|
|
5,246,730,198
|
|
|||||
|
November 27, 2016 through December 31, 2016
|
|||||||||||||
|
Open market and privately negotiated purchases
|
—
|
|
—
|
|
—
|
|
5,246,730,198
|
|
|||||
|
December 2016 ASR
|
4,618,451
|
|
76.77
|
|
4,618,451
|
|
4,892,156,933
|
|
|||||
|
January 1, 2017 through January 28, 2017
|
|||||||||||||
|
Open market and privately negotiated purchases
|
2,362,745
|
|
66.27
|
|
2,362,745
|
|
4,735,572,452
|
|
|||||
|
Total
|
9,070,031
|
|
$
|
71.90
|
|
9,070,031
|
|
$
|
4,735,572,452
|
|
|||
|
(a)
|
Represents the incremental shares received upon final settlement of the accelerated share repurchase agreement (ASR) initiated in third quarter 2016.
|
14
|
|
Fiscal Years Ended
|
|||||||||||||||||
|
|
January 28,
2012 |
|
February 2,
2013 |
|
February 1,
2014 |
|
January 31,
2015 |
|
January 30,
2016 |
|
January 28,
2017 |
|
||||||
|
Target
|
$
|
100.00
|
|
$
|
124.97
|
|
$
|
118.53
|
|
$
|
158.98
|
|
$
|
160.89
|
|
$
|
146.06
|
|
|
S&P 500 Index
|
100.00
|
|
117.61
|
|
141.49
|
|
161.61
|
|
160.54
|
|
194.04
|
|
||||||
|
Peer Group
|
100.00
|
|
127.43
|
|
154.12
|
|
191.03
|
|
208.03
|
|
231.50
|
|
||||||
The graph above compares the cumulative total shareholder return on our common stock for the last five fiscal years with the cumulative total return on the S&P 500 Index and a peer group consisting of 18 online, general merchandise, department store, food, and specialty retailers, which are large and meaningful competitors (Amazon.com, Inc., Best Buy Co., Inc., Costco Wholesale Corporation, CVS Health Corporation, Dollar General Corporation, The Gap, Inc., The Home Depot, Inc., Kohl's Corporation, The Kroger Co., Lowe's Companies, Inc., Macy's, Inc., Publix Super Markets, Inc., Rite Aid Corporation, Sears Holdings Corporation, Staples, Inc., The TJX Companies, Inc., Walgreens Boots Alliance, Inc., and Wal-Mart Stores, Inc.) (Peer Group). The peer group is consistent with the retail peer group used for our definitive Proxy Statement to be filed on or about May 1, 2017.
The peer group is weighted by the market capitalization of each component company. The graph assumes the investment of $100 in Target common stock, the S&P 500 Index and the Peer Group on January 28, 2012, and reinvestment of all dividends.
15
|
|
As of or for the Fiscal Year Ended
|
||||||||||||||
|
(millions, except per share data)
|
2016
|
|
2015
|
|
2014
|
|
2013
|
|
2012
(a)
|
|
|||||
|
Sales
(b)
|
$
|
69,495
|
|
$
|
73,785
|
|
$
|
72,618
|
|
$
|
71,279
|
|
$
|
73,301
|
|
|
Net Earnings
/
(Loss)
|
|||||||||||||||
|
Continuing operations
|
2,669
|
|
3,321
|
|
2,449
|
|
2,694
|
|
3,315
|
|
|||||
|
Discontinued operations
|
68
|
|
42
|
|
(4,085
|
)
|
(723
|
)
|
(316
|
)
|
|||||
|
Net earnings /
(loss)
|
2,737
|
|
3,363
|
|
(1,636
|
)
|
1,971
|
|
2,999
|
|
|||||
|
Basic Earnings
/
(Loss) Per Share
|
|
|
|
|
|
||||||||||
|
Continuing operations
|
4.62
|
|
5.29
|
|
3.86
|
|
4.24
|
|
5.05
|
|
|||||
|
Discontinued operations
|
0.12
|
|
0.07
|
|
(6.44
|
)
|
(1.14
|
)
|
(0.48
|
)
|
|||||
|
Basic earnings /
(loss) per share
|
4.74
|
|
5.35
|
|
(2.58
|
)
|
3.10
|
|
4.57
|
|
|||||
|
Diluted Earnings
/
(Loss) Per Share
|
|||||||||||||||
|
Continuing operations
|
4.58
|
|
5.25
|
|
3.83
|
|
4.20
|
|
5.00
|
|
|||||
|
Discontinued operations
|
0.12
|
|
0.07
|
|
(6.38
|
)
|
(1.13
|
)
|
(0.48
|
)
|
|||||
|
Diluted earnings /
(loss) per share
|
4.70
|
|
5.31
|
|
(2.56
|
)
|
3.07
|
|
4.52
|
|
|||||
|
Cash dividends declared per share
|
2.36
|
|
2.20
|
|
1.99
|
|
1.65
|
|
1.38
|
|
|||||
|
Total assets
|
37,431
|
|
40,262
|
|
41,172
|
|
44,325
|
|
47,878
|
|
|||||
|
Long-term debt, including current portion
|
12,749
|
|
12,760
|
|
12,725
|
|
12,494
|
|
16,260
|
|
|||||
Note: This information should be read in conjunction with MD&A and the Financial Statements.
|
(a)
|
Consisted of 53 weeks.
|
|
(b)
|
For 2012, includes credit card revenues.
|
Executive Summary
Fiscal
2016
included the following notable items:
|
•
|
GAAP earnings per share from continuing operations were
$4.58
.
|
|
•
|
Adjusted earnings per share were
$5.01
.
|
|
•
|
Comparable sales decreased
0.5 percent
, reflecting a
0.8 percent
decrease in traffic.
|
|
•
|
Comparable digital channel sales growth of 27 percent contributed 1.0 percentage points of comparable sales growth.
|
|
•
|
We returned $5.0 billion to shareholders through dividends and share repurchase.
|
Sales were
$69,495 million
for
2016
, a decrease of
$4,290 million
or
5.8 percent
from the prior year, primarily due to the Pharmacy Transaction. Earnings from continuing operations before interest expense and income taxes in
2016
decreased by
$561 million
or
10.1
percent from
2015
to
$4,969 million
, primarily due to the 2015 gain on the Pharmacy Transaction. Operating cash flow provided by continuing operations was
$5,329 million
,
$5,254 million
, and
$5,157 million
for
2016
,
2015
, and
2014
, respectively. In 2015, proceeds from the Pharmacy Transaction are included in investing cash flows provided by continuing operations. Refer to Note 6 of the Financial Statements for additional information about the transaction.
16
|
Earnings Per Share From
Continuing Operations
|
|
|
|
Percent Change
|
|||||||||
|
2016
|
|
2015
|
|
2014
|
|
2016/2015
|
|
2015/2014
|
|
||||
|
GAAP diluted earnings per share
|
$
|
4.58
|
|
$
|
5.25
|
|
$
|
3.83
|
|
(12.7
|
)%
|
37.2
|
%
|
|
Adjustments
|
0.42
|
|
(0.56
|
)
|
0.39
|
|
|
|
|
|
|||
|
Adjusted diluted earnings per share
|
$
|
5.01
|
|
$
|
4.69
|
|
$
|
4.22
|
|
6.7
|
%
|
11.3
|
%
|
We report after-tax return on invested capital (ROIC) from continuing operations because we believe ROIC provides a meaningful measure of our capital-allocation effectiveness over time. For the trailing twelve months ended
January 28, 2017
, ROIC was
15.0
percent, compared with
16.0
percent for the trailing twelve months ended
January 30, 2016
. Excluding the net gain on the Pharmacy Transaction, ROIC was 13.9 percent for the trailing twelve months ended January 30, 2016. A reconciliation of ROIC is provided on page 22.
Analysis of Results of Operations
Segment Results
|
|
|
|
Percent Change
|
||||||||||
|
(dollars in millions)
|
2016
|
|
2015
(a)
|
|
2014
(a)
|
|
2016/2015
|
|
2015/2014
|
|
|||
|
Sales
|
$
|
69,495
|
|
$
|
73,785
|
|
$
|
72,618
|
|
(5.8
|
)%
|
1.6
|
%
|
|
Cost of sales
|
48,872
|
|
51,997
|
|
51,278
|
|
(6.0
|
)
|
1.4
|
|
|||
|
Gross margin
|
20,623
|
|
21,788
|
|
21,340
|
|
(5.4
|
)
|
2.1
|
|
|||
|
SG&A expenses
(b)
|
13,360
|
|
14,448
|
|
14,503
|
|
(7.5
|
)
|
(0.4
|
)
|
|||
|
EBITDA
|
7,263
|
|
7,340
|
|
6,837
|
|
(1.1
|
)
|
7.4
|
|
|||
|
Depreciation and amortization
|
2,298
|
|
2,213
|
|
2,129
|
|
3.8
|
|
3.9
|
|
|||
|
EBIT
|
$
|
4,965
|
|
$
|
5,127
|
|
$
|
4,708
|
|
(3.2
|
)%
|
8.9
|
%
|
Note: See Note
30
of our Financial Statements for a reconciliation of our segment results to earnings before income taxes and more information about items recorded outside of segment SG&A.
|
(a)
|
Sales include $3,815 million and $4,148 million related to our former pharmacy and clinic businesses for 2015 and 2014, respectively, and cost of sales include $3,076 million and $3,222 million, respectively. The sale of these businesses had no notable impact on EBITDA or EBIT.
|
|
(b)
|
For 2016, 2015, and 2014, SG&A includes $663 million, $641 million, and $629 million, respectively, of net profit-sharing income from the arrangement with TD.
|
|
Rate Analysis
|
2016
|
|
2015
|
|
2014
|
|
|
Gross margin rate
|
29.7
|
%
|
29.5
|
%
|
29.4
|
%
|
|
SG&A expense rate
|
19.2
|
|
19.6
|
|
20.0
|
|
|
EBITDA margin rate
(a)
|
10.5
|
|
9.9
|
|
9.4
|
|
|
Depreciation and amortization expense rate
|
3.3
|
|
3.0
|
|
2.9
|
|
|
EBIT margin rate
(a)
|
7.1
|
|
6.9
|
|
6.5
|
|
Note: Rate analysis metrics are computed by dividing the applicable amount by sales.
|
(a)
|
Excluding sales of our former pharmacy and clinic businesses, EBITDA margin rates were 10.5 percent and 10.0 percent for 2015 and 2014, respectively. and EBIT margin rates were 7.3 percent and 6.9 percent, respectively.
|
17
Sales
Sales include all merchandise sales, net of expected returns, and gift card breakage. Refer to Note
2
of the Financial Statements for a definition of gift card breakage. Digital channel sales include all sales initiated through mobile applications and our conventional websites. Digital channel sales may be fulfilled through our distribution centers, our vendors, or our stores.
The decrease in 2016 sales reflects a decrease of approximately $3,815 million due to the Pharmacy Transaction and a comparable sales decrease of 0.5 percent, partially offset by the contribution from new stores. The increase in 2015 sales reflects an increase in comparable sales of
2.1
percent and the contribution from new stores, partially offset by a decrease of approximately $550 million due to the Pharmacy Transaction.
Inflation did not materially affect sales in any period presented.
|
Sales by Channel
|
2016
|
|
2015
(a)
|
|
2014
(a)
|
|
|
Stores
|
95.6
|
%
|
96.6
|
%
|
97.4
|
%
|
|
Digital
|
4.4
|
|
3.4
|
|
2.6
|
|
|
Total
|
100
|
%
|
100
|
%
|
100
|
%
|
|
(a)
|
Excluding sales of our former pharmacy and clinic businesses, stores and digital channels sales were 96.4 percent and 3.6 percent of total sales, respectively, for 2015 and 97.2 and 2.8 percent of total sales, respectively, for 2014.
|
Comparable sales is a measure that highlights the performance of our existing stores and digital channel sales by measuring the change in sales for a period over the comparable, prior-year period of equivalent length. Comparable sales include all sales, except sales from stores open less than 13 months, digital acquisitions we have owned less than 13 months, stores that have been closed, and digital acquisitions that we no longer operate. We removed pharmacy and clinic sales from the 2015 sales amounts when calculating 2016 comparable sales. Comparable sales measures vary across the retail industry. As a result, our comparable sales calculation is not necessarily comparable to similarly titled measures reported by other companies.
|
Comparable Sales
|
2016
|
|
2015
|
|
2014
|
|
|
Comparable sales change
|
(0.5
|
)%
|
2.1
|
%
|
1.3
|
%
|
|
Drivers of change in comparable sales:
|
|
|
|
|||
|
Number of transactions
|
(0.8
|
)
|
1.3
|
|
(0.2
|
)
|
|
Average transaction amount
|
0.3
|
|
0.8
|
|
1.5
|
|
|
Contribution to Comparable Sales Change
|
2016
|
|
2015
|
|
2014
|
|
|
Stores channel comparable sales change
|
(1.5
|
)%
|
1.3
|
%
|
0.7
|
%
|
|
Digital channel contribution to comparable sales change
|
1.0
|
|
0.8
|
|
0.7
|
|
|
Total comparable sales change
|
(0.5
|
)%
|
2.1
|
%
|
1.3
|
%
|
Note: Amounts may not foot due to rounding
.
18
|
Sales by Product Category
|
Percentage of Sales
|
|||||
|
|
2016
|
|
2015
|
|
2014
|
|
|
Household essentials
(a)
|
22
|
%
|
26
|
%
|
25
|
%
|
|
Food, beverage, and pet supplies
(b)
|
22
|
|
21
|
|
21
|
|
|
Apparel and accessories
(c)
|
20
|
|
19
|
|
19
|
|
|
Home furnishings and décor
(d)
|
19
|
|
17
|
|
17
|
|
|
Hardlines
(e)
|
17
|
|
17
|
|
18
|
|
|
Total
|
100
|
%
|
100
|
%
|
100
|
%
|
|
(a)
|
Includes pharmacy, beauty, personal care, baby care, cleaning, and paper products. Pharmacy represented 5 percent and 6 percent in 2015 and 2014, respectively.
|
|
(b)
|
Includes dry grocery, dairy, frozen food, beverages, candy, snacks, deli, bakery, meat, produce, and pet supplies.
|
|
(c)
|
Includes apparel for women, men, boys, girls, toddlers, infants and newborns, as well as intimate apparel, jewelry, accessories, and shoes.
|
|
(d)
|
Includes furniture, lighting, kitchenware, small appliances, home décor, bed and bath, home improvement, automotive, and seasonal merchandise such as patio furniture and holiday décor.
|
|
(e)
|
Includes electronics (including video game hardware and software), music, movies, books, computer software, sporting goods, and toys.
|
Further analysis of sales metrics is infeasible due to the collective interaction of a broad array of macroeconomic, competitive, and consumer behavioral factors, as well as sales mix and transfer of sales to new stores.
TD offers credit to qualified guests through Target-branded credit cards: the Target Credit Card and the Target MasterCard Credit Card (Target Credit Cards). Additionally, we offer a branded proprietary Target Debit Card. Collectively, we refer to these products as REDcards
®
. Guests receive a 5 percent discount on virtually all purchases and free shipping at Target.com when they use a REDcard. We monitor the percentage of sales that are paid for using REDcards (REDcard Penetration) because our internal analysis has indicated that a meaningful portion of incremental purchases on our REDcards are also incremental sales for Target.
|
REDcard Penetration
|
2016
|
|
2015
|
|
2014
|
|
|
Target Debit Card
|
12.8
|
%
|
12.1
|
%
|
11.2
|
%
|
|
Target Credit Cards
|
11.2
|
|
10.1
|
|
9.7
|
|
|
Total REDcard Penetration
|
24.0
|
%
|
22.3
|
%
|
20.9
|
%
|
Note: Excluding pharmacy and clinic sales, total REDcard penetration would have been 23.2 percent and 21.9 percent for 2015 and 2014, respectively. The sum of Target Credit Cards and Target Debit Card penetration may not equal Total REDcard Penetration due to rounding.
Gross Margin Rate
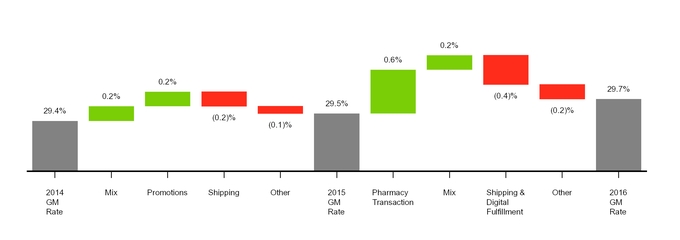
Our gross margin rate was
29.7
percent in
2016
,
29.5
percent in
2015
, and
29.4
percent in
2014
. The 2016 increase was primarily due to the Pharmacy Transaction and favorable category sales mix, partially offset by increased shipping and digital fulfillment costs. Cost of goods savings helped offset the impact of a competitive promotional environment.
19
The 2015 increase was primarily due to favorable category sales mix and lower promotional activity relative to the highly promotional period in 2014 following the 2013 data breach, partially offset by the impact of increased digital channel sales.
Selling, General and Administrative Expense Rate
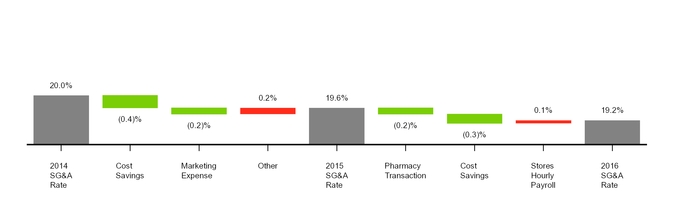
Our SG&A expense rate was
19.2
percent in
2016
,
19.6
percent in
2015
, and
20.0
percent in
2014
. The decrease in
2016
primarily resulted from the benefit of the Pharmacy Transaction and technology-related cost savings, partially offset by increased stores hourly payroll.
The decrease in 2015 primarily resulted from cost saving initiatives and reduced marketing expense, partially offset by investments in other initiatives, none of which were individually significant.
Store Data
|
Change in Number of Stores
|
2016
|
|
2015
|
|
|
Beginning store count
|
1,792
|
|
1,790
|
|
|
Opened
|
15
|
|
15
|
|
|
Closed
|
(5
|
)
|
(13
|
)
|
|
Ending store count
|
1,802
|
|
1,792
|
|
|
Number of Stores and
Retail Square Feet |
Number of Stores
|
Retail Square Feet
(a)
|
|||||||
|
January 28, 2017
|
|
January 30, 2016
|
|
January 28, 2017
|
|
January 30, 2016
|
|
||
|
170,000 or more sq. ft.
|
276
|
|
278
|
|
49,328
|
|
49,688
|
|
|
|
50,000 to 169,999 sq. ft.
|
1,504
|
|
1,505
|
|
189,620
|
|
189,677
|
|
|
|
49,999 or less sq. ft.
|
22
|
|
9
|
|
554
|
|
174
|
|
|
|
Total
|
1,802
|
|
1,792
|
|
239,502
|
|
239,539
|
|
|
|
(a)
|
In thousands, reflects total square feet less office, distribution center and vacant space.
|
Other Performance Factors
Other Selling, General and Administrative Expenses
We recorded $(4) million, $216 million, and $174 million of selling, general and administrative expenses outside of the segment during
2016
,
2015
, and
2014
, respectively, because they relate to discretely managed matters. Additional information about these discretely managed items is provided within Note 30 of the Financial Statements.
20
Net Interest Expense
Net interest expense from continuing operations was
$1,004 million
,
$607 million
, and
$882 million
for
2016
,
2015
, and
2014
, respectively. Net interest expense for 2016 and 2014 included a loss on early retirement of debt of $422 million and $285 million, respectively.
Provision for Income Taxes
Our 2016 effective income tax rate from continuing operations increased to
32.7
percent, from
32.5
percent in
2015
, driven primarily by the 2015 rate impact of the $112 million tax benefit from releasing the valuation allowance on a capital loss. This comparative rate impact was partially offset by $27 million of excess tax benefit in 2016 related to shared-based payments after the adoption of Accounting Standards Update (ASU) No. 2016-09,
Improvements to Employee Share-Based Payment Accounting,
and lower pretax earnings. Note
23
of the Financial Statements provides a tax rate reconciliation.
Our 2015 effective income tax rate from continuing operations decreased to
32.5
percent, from
33.0
percent in
2014
, driven primarily by the $112 million tax benefit from releasing the valuation allowance on a capital loss. This benefit was partially offset by a year-over-year decrease in the favorable resolution of various income tax matters and the rate impact of higher pretax earnings. The resolution of various income tax matters reduced tax expense by $8 million and $35 million in 2015 and 2014, respectively.
Discontinued Operations
See Note
7
of the Financial Statements for information about our Canada exit.
Reconciliation of Non-GAAP Financial Measures to GAAP Measures
To provide additional transparency, we have disclosed non-GAAP adjusted diluted earnings per share from continuing operations (Adjusted EPS). This metric excludes certain items presented below. We believe this information is useful in providing period-to-period comparisons of the results of our continuing operations. This measure is not in accordance with, or an alternative to, generally accepted accounting principles in the United States (GAAP). The most comparable GAAP measure is diluted earnings per share from continuing operations. Adjusted EPS should not be considered in isolation or as a substitution for analysis of our results as reported under GAAP. Other companies may calculate Adjusted EPS differently than we do, limiting the usefulness of the measure for comparisons with other companies.
|
2016
|
2015
|
2014
|
||||||||||||||||||||||||||||||||||
|
(millions, except per share data)
|
Pretax
|
|
Net of Tax
|
|
Per Share Amounts
|
|
Pretax
|
|
Net of Tax
|
|
Per Share Amounts
|
|
Pretax
|
|
Net of Tax
|
|
Per Share Amounts
|
|
||||||||||||||||||
|
GAAP diluted earnings per share from continuing operations
|
$
|
4.58
|
|
$
|
5.25
|
|
$
|
3.83
|
|
|||||||||||||||||||||||||||
|
Adjustments
|
||||||||||||||||||||||||||||||||||||
|
Loss on early retirement of debt
|
$
|
422
|
|
$
|
257
|
|
$
|
0.44
|
|
$
|
—
|
|
$
|
—
|
|
$
|
—
|
|
$
|
285
|
|
$
|
173
|
|
$
|
0.27
|
|
|||||||||
|
Gain on sale
(a)
|
—
|
|
—
|
|
—
|
|
(620
|
)
|
(487
|
)
|
(0.77
|
)
|
—
|
|
—
|
|
—
|
|
||||||||||||||||||
|
Restructuring costs
(b)
|
—
|
|
—
|
|
—
|
|
138
|
|
87
|
|
0.14
|
|
—
|
|
—
|
|
—
|
|
||||||||||||||||||
|
Data breach-related costs, net of insurance
(c)
|
—
|
|
—
|
|
—
|
|
39
|
|
28
|
|
0.04
|
|
145
|
|
94
|
|
0.15
|
|
||||||||||||||||||
|
Other
(d)
|
(4
|
)
|
(2
|
)
|
—
|
|
39
|
|
29
|
|
0.05
|
|
29
|
|
18
|
|
0.03
|
|
||||||||||||||||||
|
Resolution of income tax matters
|
—
|
|
(7
|
)
|
(0.01
|
)
|
—
|
|
(8
|
)
|
(0.01
|
)
|
—
|
|
(35
|
)
|
(0.06
|
)
|
||||||||||||||||||
|
Adjusted diluted earnings per share from continuing operations
|
$
|
5.01
|
|
$
|
4.69
|
|
$
|
4.22
|
|
|||||||||||||||||||||||||||
Note: Amounts may not foot due to rounding.
|
(a)
|
Refer to Note
6
of the Financial Statements.
|
|
(b)
|
Refer to Note
8
of the Financial Statements.
|
|
(c)
|
Refer to Note
19
of the Financial Statements.
|
|
(d)
|
For 2016, represents items related to the Pharmacy Transaction. For 2015, represents impairments related to our decision to wind down certain noncore operations, as described in Note
16
of the Financial Statements. The 2014 amounts include impairments of $16 million related to undeveloped land in the U.S. and $13 million of expense related to converting co-branded card program to MasterCard.
|
21
We have also disclosed after-tax return on invested capital for continuing operations (ROIC), which is a ratio based on GAAP information, with the exception of adjustments made to capitalize operating leases. Operating leases are capitalized as part of the ROIC calculation to control for differences in capital structure between us and our competitors. We believe this metric provides a meaningful measure of the effectiveness of our capital allocation over time. Other companies may calculate ROIC differently than we do, limiting the usefulness of the measure for comparisons with other companies.
|
After-Tax Return on Invested Capital
|
||||||||||||
|
Numerator
|
Trailing Twelve Months
|
|||||||||||
|
(dollars in millions)
|
January 28,
2017 |
|
January 30,
2016 |
|
||||||||
|
Earnings from continuing operations before interest expense and income taxes
|
$
|
4,969
|
|
$
|
5,530
|
|
||||||
|
+ Operating lease interest
(a)(b)
|
71
|
|
87
|
|
||||||||
|
Adjusted earnings from continuing operations before interest expense and income taxes
|
5,040
|
|
5,617
|
|
||||||||
|
- Income taxes
(c)
|
1,648
|
|
1,827
|
|
||||||||
|
Net operating profit after taxes
|
$
|
3,392
|
|
$
|
3,790
|
|
||||||
|
Denominator
(dollars in millions)
|
January 28,
2017 |
|
January 30,
2016 |
|
January 31,
2015 |
|
||||||
|
Current portion of long-term debt and other borrowings
|
$
|
1,718
|
|
$
|
815
|
|
$
|
91
|
|
|||
|
+ Noncurrent portion of long-term debt
|
11,031
|
|
11,945
|
|
12,634
|
|
||||||
|
+ Shareholders' equity
|
10,953
|
|
12,957
|
|
13,997
|
|
||||||
|
+ Capitalized operating lease obligations
(b)(d)
|
1,187
|
|
1,457
|
|
1,490
|
|
||||||
|
- Cash and cash equivalents
|
2,512
|
|
4,046
|
|
2,210
|
|
||||||
|
- Net assets of discontinued operations
|
62
|
|
226
|
|
1,479
|
|
||||||
|
Invested capital
|
$
|
22,315
|
|
$
|
22,902
|
|
$
|
24,523
|
|
|||
|
Average invested capital
(e)
|
$
|
22,608
|
|
$
|
23,713
|
|
||||||
|
After-tax return on invested capital
|
15.0
|
%
|
16.0
|
%
|
(f)
|
|||
|
(a)
|
Represents the add-back to operating income driven by the hypothetical interest expense we would incur if the property under our operating leases were owned or accounted for as capital leases, using eight times our trailing twelve months rent expense and an estimated interest rate of six percent.
|
|
(b)
|
See the following Reconciliation of Capitalized Operating Leases table for the adjustments to our GAAP total rent expense to obtain the hypothetical capitalization of operating leases and related operating lease interest.
|
|
(c)
|
Calculated using the effective tax rate for continuing operations, which was
32.7
percent and
32.5
percent for the trailing twelve months ended
January 28, 2017
and
January 30, 2016
. For the twelve months ended January 28, 2017 and January 30, 2016, includes tax effect of $1,624 million and $1,799 million, respectively, related to EBIT and $23 million and $28 million, respectively, related to operating lease interest.
|
|
(d)
|
Calculated as eight times our trailing twelve months rent expense.
|
|
(e)
|
Average based on the invested capital at the end of the current period and the invested capital at the end of the prior period.
|
|
(f)
|
Excluding the net gain on the Pharmacy Transaction, ROIC was 13.9 percent for the trailing twelve months ended January 30, 2016.
|
Capitalized operating lease obligations and operating lease interest are not in accordance with, or an alternative for, GAAP. The most comparable GAAP measure is total rent expense. Capitalized operating lease obligations and operating lease interest should not be considered in isolation or as a substitution for analysis of our results as reported under GAAP.
22
|
Reconciliation of Capitalized Operating Leases
|
Trailing Twelve Months
|
|||||||||||||
|
(dollars in millions)
|
January 28,
2017 |
|
January 30,
2016 |
|
January 31,
2015 |
|
||||||||
|
Total rent expense
|
$
|
148
|
|
$
|
182
|
|
$
|
186
|
|
|||||
|
Capitalized operating lease obligations (total rent expense x 8)
|
1,187
|
|
1,457
|
|
1,490
|
|
||||||||
|
Operating lease interest (capitalized operating lease obligations x 6%)
|
71
|
|
87
|
|
n/a
|
|
||||||||
Analysis of Financial Condition
Liquidity and Capital Resources
Our period-end cash and cash equivalents balance decreased to
$2,512 million
from
$4,046 million
in
2015
, primarily reflecting deployment during 2016 of proceeds from the Pharmacy Transaction and payment of related taxes. Due to the timing of the sale late in 2015, we did not fully deploy the net proceeds by the end of 2015. Short-term investments of $1,110 million and $3,008 million were included in cash and cash equivalents at the end of
2016
and
2015
, respectively. Our investment policy is designed to preserve principal and liquidity of our short-term investments. This policy allows investments in large money market funds or in highly rated direct short-term instruments that mature in 60 days or less. We also place dollar limits on our investments in individual funds or instruments.
Capital Allocation
We follow a disciplined and balanced approach to capital allocation based on the following priorities, ranked in order of importance: first, we fully invest in opportunities to profitably grow our business, create sustainable long-term value, and maintain our current operations and assets; second, we maintain a competitive quarterly dividend and seek to grow it annually; and finally, we return any excess cash to shareholders by repurchasing shares within the limits of our credit rating goals.
Cash Flows
Our
2016
operations were funded by internally and externally generated funds. Operating cash flow provided by continuing operations was
$5,329 million
in
2016
compared with
$5,254 million
in
2015
. These cash flows, combined with period year-end cash position, allowed us to invest in the business, fund early debt retirement and maturities, pay dividends, and repurchase shares under our share repurchase program. Proceeds from the Pharmacy Transaction are included in investing cash flows provided by continuing operations during 2015.
Inventory
Year-end inventory was
$8,309 million
, compared with
$8,601 million
in
2015
. The decrease was due to our alignment of inventory levels with the slowing sales trend while appropriately supporting instocks.
Share Repurchases
During 2016, 2015, and 2014 we returned
$3,686 million
,
$3,441 million
, and
$41 million
, respectively, to shareholders through share repurchase. See Part II, Item 5 of this Annual Report on Form 10-K and Note
25
to the Financial Statements for more information.
Dividends
We paid dividends totaling
$1,348 million
($2.32 per share) in
2016
and
$1,362 million
($2.16 per share) in
2015
, a per share increase of 7.4 percent. We declared dividends totaling $1,359 million ($2.36 per share) in
2016
, a per share increase of 7.3 percent over
2015
. We declared dividends totaling $1,378 million (
$2.20
per share) in
2015
, a per share increase of 10.6 percent over
2014
. We have paid dividends every quarter since our 1967 initial public offering, and it is our intent to continue to do so in the future.
23
Short-term and Long-term Financing
Our financing strategy is to ensure liquidity and access to capital markets, maintain a balanced spectrum of debt maturities, and manage our net exposure to floating interest rate volatility. Within these parameters, we seek to minimize our borrowing costs. Our ability to access the long-term debt and commercial paper markets has provided us with ample sources of liquidity. Our continued access to these markets depends on multiple factors, including the condition of debt capital markets, our operating performance, and maintaining strong credit ratings. As of
January 28, 2017
, our credit ratings were as follows:
|
Credit Ratings
|
Moody's
|
Standard and Poor's
|
Fitch
|
|
Long-term debt
|
A2
|
A
|
A-
|
|
Commercial paper
|
P-1
|
A-1
|
F2
|
If our credit ratings were lowered, our ability to access the debt markets, our cost of funds, and other terms for new debt issuances could be adversely impacted. Each of the credit rating agencies reviews its rating periodically and there is no guarantee our current credit ratings will remain the same as described above.
In
2016
, we funded our peak holiday sales period working capital needs through internally generated funds and the issuance of commercial paper. In 2015, we funded our peak holiday sales period working capital needs through internally generated funds.
|
Commercial Paper
|
|
|
|
||||||
|
(dollars in millions)
|
2016
|
|
2015
|
|
2014
|
|
|||
|
Maximum daily amount outstanding during the year
|
$
|
89
|
|
$
|
—
|
|
$
|
590
|
|
|
Average amount outstanding during the year
|
1
|
|
—
|
|
129
|
|
|||
|
Amount outstanding at year-end
|
—
|
|
—
|
|
—
|
|
|||
|
Weighted average interest rate
|
0.43
|
%
|
—
|
%
|
0.11
|
%
|
|||
We have additional liquidity through a committed $2.5 billion revolving credit facility obtained through a group of banks in October 2016 which expires in October 2021. This new unsecured revolving credit facility replaced a $2.25 billion unsecured revolving credit facility that was scheduled to expire in October 2018. No balances were outstanding under either credit facility at any time during
2016
,
2015
, or 2014.
Most of our long-term debt obligations contain covenants related to secured debt levels. In addition to a secured debt level covenant, our credit facility also contains a debt leverage covenant. We are, and expect to remain, in compliance with these covenants. Additionally, at
January 28, 2017
, no notes or debentures contained provisions requiring acceleration of payment upon a credit rating downgrade, except that certain outstanding notes allow the note holders to put the notes to us if within a matter of months of each other we experience both (i) a change in control and (ii) our long-term credit ratings are either reduced and the resulting rating is non-investment grade, or our long-term credit ratings are placed on watch for possible reduction and those ratings are subsequently reduced and the resulting rating is non-investment grade.
We believe our sources of liquidity will continue to be adequate to maintain operations, finance anticipated expansion and strategic initiatives, fund debt maturities, pay dividends, and execute purchases under our share repurchase program for the foreseeable future. We continue to anticipate ample access to commercial paper and long-term financing.
24
Capital Expenditures
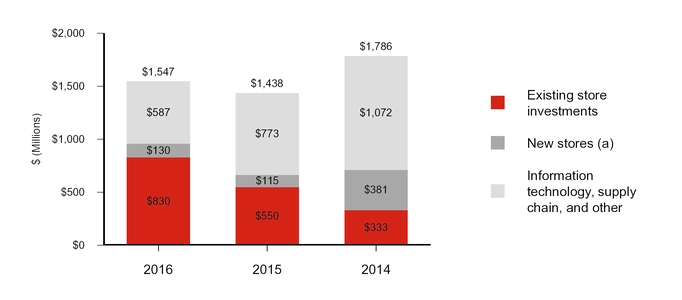
(a) In addition to these cash investments, we entered into leases related to new stores in 2016, 2015, and 2014 with total future minimum lease payments of $550 million, $338 million, and $85 million, respectively.
Capital expenditures increased in 2016 from the prior year because we increased our investments in existing stores, including remodels and guest experience enhancements. These increases were partially offset by continued efficiency gains in technology. Capital expenditures decreased in 2015 from the prior year as we opened fewer large-format stores and realized efficiency gains in technology, partially offset by increased guest experience and supply chain investments. As noted in the footnote to the chart presented above, we substantially increased our investments in leases in 2016 and 2015.
We expect capital expenditures in 2017 to increase to approximately $2.0 billion to $2.5 billion as we accelerate the rate of store remodels and flexible-format store openings, and continue to make supply chain investments. We also expect our rate of investment in store leases to continue to increase.
25
Commitments and Contingencies
|
Contractual Obligations as of
|
Payments Due by Period
|
||||||||||||||
|
January 28, 2017
|
Less than
|
|
1-3
|
|
3-5
|
|
After 5
|
|
|||||||
|
(millions)
|
Total
|
|
1 Year
|
|
Years
|
|
Years
|
|
Years
|
|
|||||
|
Recorded contractual obligations:
|
|
|
|
|
|
||||||||||
|
Long-term debt
(a)
|
$
|
11,814
|
|
$
|
1,683
|
|
$
|
1,203
|
|
$
|
2,150
|
|
$
|
6,778
|
|
|
Capital lease obligations
(b)
|
1,963
|
|
82
|
|
174
|
|
178
|
|
1,529
|
|
|||||
|
Deferred compensation
(c)
|
515
|
|
56
|
|
114
|
|
121
|
|
224
|
|
|||||
|
Real estate liabilities
(d)
|
52
|
|
52
|
|
—
|
|
—
|
|
—
|
|
|||||
|
Tax contingencies
(e)
|
—
|
|
—
|
|
—
|
|
—
|
|
—
|
|
|||||
|
Unrecorded contractual obligations:
|
|
|
|
|
|
||||||||||
|
Interest payments – long-term debt
|
6,308
|
|
510
|
|
819
|
|
710
|
|
4,269
|
|
|||||
|
Operating leases
(b)
|
3,876
|
|
198
|
|
398
|
|
364
|
|
2,916
|
|
|||||
|
Purchase obligations
(f)
|
1,762
|
|
609
|
|
814
|
|
107
|
|
232
|
|
|||||
|
Real estate obligations
(g)
|
216
|
|
185
|
|
31
|
|
—
|
|
—
|
|
|||||
|
Future contributions to retirement plans
(h)
|
—
|
|
—
|
|
—
|
|
—
|
|
—
|
|
|||||
|
Contractual obligations
|
$
|
26,506
|
|
$
|
3,375
|
|
$
|
3,553
|
|
$
|
3,630
|
|
$
|
15,948
|
|
|
(a)
|
Represents principal payments only. See Note
20
of the Financial Statements for further information.
|
|
(b)
|
These payments also include $348 million and $269 million of legally binding minimum lease payments for stores that are expected to open in
2017
or later for capital and operating leases, respectively. See Note
22
of the Financial Statements for further information.
|
|
(c)
|
The timing of deferred compensation payouts is estimated based on payments currently made to former employees and retirees, forecasted investment returns, and the projected timing of future retirements.
|
|
(d)
|
Real estate liabilities include costs incurred but not paid related to the construction or remodeling of real estate and facilities.
|
|
(e)
|
Estimated tax contingencies of $222 million, including interest and penalties and primarily related to continuing operations, are not included in the table above because we are not able to make reasonably reliable estimates of the period of cash settlement. See Note
23
of the Financial Statements for further information.
|
|
(f)
|
Purchase obligations include all legally binding contracts such as firm minimum commitments for inventory purchases, merchandise royalties, equipment purchases, marketing-related contracts, software acquisition/license commitments, and service contracts. We issue inventory purchase orders in the normal course of business, which represent authorizations to purchase that are cancelable by their terms. We do not consider purchase orders to be firm inventory commitments; therefore, they are excluded from the table above. If we choose to cancel a purchase order, we may be obligated to reimburse the vendor for unrecoverable outlays incurred prior to cancellation. We also issue trade letters of credit in the ordinary course of business, which are excluded from this table as these obligations are conditioned on terms of the letter of credit being met.
|
|
(g)
|
Real estate obligations include commitments for the purchase, construction, or remodeling of real estate and facilities.
|
|
(h)
|
We have not included obligations under our pension plans in the contractual obligations table above because no additional amounts are required to be funded as of
January 28, 2017
. Our historical practice regarding these plans has been to contribute amounts necessary to satisfy minimum pension funding requirements, plus periodic discretionary amounts determined to be appropriate.
|
Off Balance Sheet Arrangements:
Other than the unrecorded contractual obligations noted above, we do not have any arrangements or relationships with entities that are not consolidated into the financial statements.
Critical Accounting Estimates
Our consolidated financial statements are prepared in accordance with GAAP, which requires us to make estimates and apply judgments that affect the reported amounts. In the Notes to Consolidated Financial Statements, we describe the significant accounting policies used in preparing the consolidated financial statements. Our management has discussed the development, selection, and disclosure of our critical accounting estimates with the Audit & Finance Committee of our Board of Directors. The following items require significant estimation or judgment:
Inventory and cost of sales:
Our inventory is valued at the lower of cost or market. We reduce inventory for estimated losses related to shrink and markdowns. Our shrink estimate is based on historical losses verified by physical inventory counts. Historically, our actual physical inventory count results have shown our estimates to be reliable. Market adjustments for markdowns are recorded when the salability of the merchandise has diminished. We believe the risk of inventory obsolescence is largely mitigated because our inventory typically turns in less than three months. Inventory was
$8,309 million
and
$8,601 million
at
January 28, 2017
and
January 30, 2016
, respectively, and is further described in Note
12
of the Financial Statements.
26
Vendor income:
We receive various forms of consideration from our vendors (vendor income), principally earned as a result of volume rebates, markdown allowances, promotions, and advertising allowances. Substantially all vendor income is recorded as a reduction of cost of sales.
We establish a receivable for vendor income that is earned but not yet received. Based on the agreements in place, this receivable is computed by estimating when we have completed our performance and when the amount is earned. The majority of the year-end vendor income receivables are collected within the following fiscal quarter, and we do not believe there is a reasonable likelihood that the assumptions used in our estimate will change significantly. Historically, adjustments to our vendor income receivable have not been material. Vendor income receivable was $385 million and $384 million at January 28, 2017 and January 30, 2016, respectively. Vendor income is described further in Note
4
of the Financial Statements.
Long-lived assets:
Long-lived assets are reviewed for impairment whenever events or changes in circumstances indicate that the carrying amounts may not be recoverable. The evaluation is performed at the lowest level of identifiable cash flows independent of other assets. An impairment loss would be recognized when estimated undiscounted future cash flows from the operation and/or disposition of the assets are less than their carrying amount. Measurement of an impairment loss would be based on the excess of the carrying amount of the asset group over its fair value. Fair value is measured using discounted cash flows or independent opinions of value, as appropriate. We recorded impairments of
$43 million
,
$54 million
, and
$124 million
in
2016
,
2015
, and
2014
, respectively, which are described further in Note
14
of the Financial Statements.
Insurance/self-insurance:
We retain a substantial portion of the risk related to certain general liability, workers' compensation, property loss, and team member medical and dental claims. However, we maintain stop-loss coverage to limit the exposure related to certain risks. Liabilities associated with these losses include estimates of both claims filed and losses incurred but not yet reported. We use actuarial methods which consider a number of factors to estimate our ultimate cost of losses. General liability and workers' compensation liabilities are recorded at our estimate of their net present value; other liabilities referred to above are not discounted. Our workers' compensation and general liability accrual was $447 million and $498 million at
January 28, 2017
and
January 30, 2016
, respectively. We believe that the amounts accrued are appropriate; however, our liabilities could be significantly affected if future occurrences or loss developments differ from our assumptions. For example, a five percent increase or decrease in average claim costs would impact our self-insurance expense by $22 million in
2016
. Historically, adjustments to our estimates have not been material. Refer to Item 7A, Quantitative and Qualitative Disclosures About Market Risk, for further disclosure of the market risks associated with these exposures. We maintain insurance coverage to limit our exposure to certain events, including network security matters.
Income taxes:
We pay income taxes based on the tax statutes, regulations, and case law of the various jurisdictions in which we operate. Significant judgment is required in determining the timing and amounts of deductible and taxable items, and in evaluating the ultimate resolution of tax matters in dispute with tax authorities. The benefits of uncertain tax positions are recorded in our financial statements only after determining it is likely the uncertain tax positions would withstand challenge by taxing authorities. We periodically reassess these probabilities and record any changes in the financial statements as appropriate. Liabilities for uncertain tax positions, including interest and penalties, were $222 million and $215 million at
January 28, 2017
and
January 30, 2016
, respectively, and primarily relate to continuing operations. We believe the resolution of these matters will not have a material adverse impact on our consolidated financial statements. Income taxes are described further in Note
23
of the Financial Statements.
Pension accounting:
We maintain a funded qualified, defined benefit pension plan, as well as several smaller and unfunded nonqualified plans for certain current and retired team members. The costs for these plans are determined based on actuarial calculations using the assumptions described in the following paragraphs. Eligibility and the level of benefits varies depending on team members' full-time or part-time status, date of hire, age, and/or length of service. The benefit obligation and related expense for these plans are determined based on actuarial calculations using assumptions about the expected long-term rate of return, the discount rate, and compensation growth rates. The assumptions, with adjustments made for any significant plan or participant changes, are used to determine the period-end benefit obligation and establish expense for the next year.
Our
2016
expected long-term rate of return on plan assets of
6.8
percent is determined by the portfolio composition, historical long-term investment performance, and current market conditions. A one percentage point decrease in our expected long-term rate of return would increase annual expense by $37 million.
The discount rate used to determine benefit obligations is adjusted annually based on the interest rate for long-term high-quality corporate bonds, using yields for maturities that are in line with the duration of our pension liabilities. Our
27
benefit obligation and related expense will fluctuate with changes in interest rates. A 0.5 percentage point decrease to the weighted average discount rate would increase annual expense by $30 million.
Based on our experience, we use a graduated compensation growth schedule that assumes higher compensation growth for younger, shorter-service pension-eligible team members than it does for older, longer-service pension-eligible team members.
Pension benefits are further described in Note
28
of the Financial Statements.
Legal and other contingencies:
We believe the accruals recorded in our consolidated financial statements properly reflect loss exposures that are both probable and reasonably estimable. We do not believe any of the currently identified claims or litigation may materially affect our results of operations, cash flows, or financial condition. However, litigation is subject to inherent uncertainties, and unfavorable rulings could occur. If an unfavorable ruling were to occur, it may cause a material adverse impact on the results of operations, cash flows, or financial condition for the period in which the ruling occurs, or future periods. Refer to Note 19 of the Financial Statements for further information on contingencies.
New Accounting Pronouncements
Refer to Note 2 and Note 22 of the Financial Statements for a description of new accounting pronouncements related to revenues and leases, respectively. We do not expect any other recently issued accounting pronouncements will have a material effect on our financial statements.
Forward-Looking Statements
This report contains forward-looking statements, which are based on our current assumptions and expectations. These statements are typically accompanied by the words "expect," "may," "could," "believe," "would," "might," "anticipates," or words of similar import. The principal forward-looking statements in this report include: our financial performance, statements regarding the adequacy of and costs associated with our sources of liquidity, the expected impact of the Pharmacy Transaction on our financial performance, the continued execution of our share repurchase program, our expected capital expenditures and new lease commitments, the impact of changes in the expected effective income tax rate on net income, the expected compliance with debt covenants, the expected impact of new accounting pronouncements, our intentions regarding future dividends, contributions and payments related to our pension plan, the expected returns on pension plan assets, the expected timing and recognition of compensation expenses, the effects of macroeconomic conditions, the adequacy of our reserves for general liability, workers' compensation and property loss, the expected outcome of, and adequacy of our reserves for investigations, inquiries, claims and litigation, including those related to the 2013 data breach, expected changes to our contractual obligations and liabilities, the expected ability to recognize deferred tax assets and liabilities and the timing of such recognition, the process, timing and effects of discontinuing our Canadian operations, the resolution of tax matters, changes in our assumptions and expectations, and the expected benefits of restructuring activities.
All such forward-looking statements are intended to enjoy the protection of the safe harbor for forward-looking statements contained in the Private Securities Litigation Reform Act of 1995, as amended. Although we believe there is a reasonable basis for the forward-looking statements, our actual results could be materially different. The most important factors which could cause our actual results to differ from our forward-looking statements are set forth on our description of risk factors in Item 1A to this Form 10-K, which should be read in conjunction with the forward-looking statements in this report. Forward-looking statements speak only as of the date they are made, and we do not undertake any obligation to update any forward-looking statement.
28
At
January 28, 2017
, our exposure to market risk was primarily from interest rate changes on our debt obligations, some of which are at a LIBOR-plus floating-rate. Our interest rate exposure is primarily due to differences between our floating rate debt obligations compared to our floating rate short term investments. At
January 28, 2017
, our floating rate debt exceeded our floating rate short-term investments by approximately $140 million. Based on our balance sheet position at
January 28, 2017
, the annualized effect of a 0.1 percentage point increase in floating interest rates on our floating rate debt obligations, net of our floating rate short-term investments, would not be significant. In general, we expect our floating rate debt to exceed our floating rate short-term investments over time, but that may vary in different interest rate environments. See further description of our debt and derivative instruments in Notes
20
and
21
to the Financial Statements.
We record our general liability and workers' compensation liabilities at net present value; therefore, these liabilities fluctuate with changes in interest rates. Based on our balance sheet position at
January 28, 2017
, the annualized effect of a 0.5 percentage point decrease in interest rates would be to decrease earnings before income taxes by $7 million.
In addition, we are exposed to market return fluctuations on our qualified defined benefit pension plans. The value of our pension liabilities is inversely related to changes in interest rates. A 0.5 percentage point decrease to the weighted average discount rate would increase annual expense by $30 million. To protect against declines in interest rates, we hold high-quality, long-duration bonds and interest rate swaps in our pension plan trust. At year-end, we had hedged 55 percent of the interest rate exposure of our funded status.
As more fully described in Notes
15
and
27
to the Financial Statements, we are exposed to market returns on accumulated team member balances in our nonqualified, unfunded deferred compensation plans. We control the risk of offering the nonqualified plans by making investments in life insurance contracts and prepaid forward contracts on our own common stock that offset a substantial portion of our economic exposure to the returns on these plans. The annualized effect of a one percentage point change in market returns on our nonqualified defined contribution plans (inclusive of the effect of the investment vehicles used to manage our economic exposure) would not be significant.
There have been no other material changes in our primary risk exposures or management of market risks since the prior year.
29
Report of Management on the Consolidated Financial Statements
Management is responsible for the consistency, integrity, and presentation of the information in the Annual Report. The consolidated financial statements and other information presented in this Annual Report have been prepared in accordance with accounting principles generally accepted in the United States and include necessary judgments and estimates by management.
To fulfill our responsibility, we maintain comprehensive systems of internal control designed to provide reasonable assurance that assets are safeguarded and transactions are executed in accordance with established procedures. The concept of reasonable assurance is based upon recognition that the cost of the controls should not exceed the benefit derived. We believe our systems of internal control provide this reasonable assurance.
The Board of Directors exercised its oversight role with respect to the Corporation's systems of internal control primarily through its Audit Committee, which is comprised of independent directors. The Committee oversees the Corporation's systems of internal control, accounting practices, financial reporting and audits to assess whether their quality, integrity, and objectivity are sufficient to protect shareholders' investments.
In addition, our consolidated financial statements have been audited by Ernst & Young LLP, independent registered public accounting firm, whose report also appears on this page.

|
|

|
|
Brian C. Cornell
Chairman and Chief Executive Officer
March 8, 2017
|
|
Cathy R. Smith
Executive Vice President and
Chief Financial Officer
|
Report of Independent Registered Public Accounting Firm on Consolidated Financial Statements
The Board of Directors and Shareholders
Target Corporation
We have audited the accompanying consolidated statements of financial position of Target Corporation and subsidiaries (the Corporation) as of
January 28, 2017
and
January 30, 2016
, and the related consolidated statements of operations, comprehensive income, cash flows, and shareholders' investment for each of the three years in the period ended
January 28, 2017
. These financial statements are the responsibility of the Corporation's management. Our responsibility is to express an opinion on these financial statements based on our audits.
We conducted our audits in accordance with the standards of the Public Company Accounting Oversight Board (United States). Those standards require that we plan and perform the audit to obtain reasonable assurance about whether the financial statements are free of material misstatement. An audit includes examining, on a test basis, evidence supporting the amounts and disclosures in the financial statements. An audit also includes assessing the accounting principles used and significant estimates made by management, as well as evaluating the overall financial statement presentation. We believe that our audits provide a reasonable basis for our opinion.
In our opinion, the financial statements referred to above present fairly, in all material respects, the consolidated financial position of Target Corporation and subsidiaries at
January 28, 2017
and
January 30, 2016
, and the consolidated results of their operations and their cash flows for each of the three years in the period ended
January 28, 2017
, in conformity with U.S. generally accepted accounting principles.
We also have audited, in accordance with the standards of the Public Company Accounting Oversight Board (United States), the Corporation's internal control over financial reporting as of
January 28, 2017
, based on criteria established in
Internal Control—Integrated Framework
issued by the Committee of Sponsoring Organizations of the Treadway Commission (2013 Framework), and our report dated
March 8, 2017
, expressed an unqualified opinion thereon.
|
Minneapolis, Minnesota
March 8, 2017
|

|
30
Report of Management on Internal Control over Financial Reporting
Our management is responsible for establishing and maintaining adequate internal control over financial reporting, as such term is defined in Exchange Act Rules 13a-15(f). Under the supervision and with the participation of our management, including our chief executive officer and chief financial officer, we assessed the effectiveness of our internal control over financial reporting as of
January 28, 2017
, based on the framework in
Internal Control—Integrated Framework (2013)
, issued by the Committee of Sponsoring Organizations of the Treadway Commission (2013 framework). Based on our assessment, we conclude that the Corporation's internal control over financial reporting is effective based on those criteria.
Our internal control over financial reporting as of
January 28, 2017
, has been audited by Ernst & Young LLP, the independent registered public accounting firm who has also audited our consolidated financial statements, as stated in their report which appears on this page.
|
|
|

|
|
Brian C. Cornell
Chairman and Chief Executive Officer
March 8, 2017 |
|
Cathy R. Smith
Executive Vice President and Chief Financial Officer |
Report of Independent Registered Public Accounting Firm on Internal Control over Financial Reporting
The Board of Directors and Shareholders
Target Corporation
We have audited Target Corporation and subsidiaries' (the Corporation) internal control over financial reporting as of
January 28, 2017
, based on criteria established in
Internal Control—Integrated Framework
issued by the Committee of Sponsoring Organizations of the Treadway Commission (2013 Framework) (the COSO criteria). The Corporation's management is responsible for maintaining effective internal control over financial reporting, and for its assessment of the effectiveness of internal control over financial reporting included in the accompanying Report of Management on Internal Control over Financial Reporting. Our responsibility is to express an opinion on the Corporation's internal control over financial reporting based on our audit.
We conducted our audit in accordance with the standards of the Public Company Accounting Oversight Board (United States). Those standards require that we plan and perform the audit to obtain reasonable assurance about whether effective internal control over financial reporting was maintained in all material respects. Our audit included obtaining an understanding of internal control over financial reporting, assessing the risk that a material weakness exists, testing and evaluating the design and operating effectiveness of internal control based on the assessed risk, and performing such other procedures as we considered necessary in the circumstances. We believe that our audit provides a reasonable basis for our opinion.
A company's internal control over financial reporting is a process designed to provide reasonable assurance regarding the reliability of financial reporting and the preparation of financial statements for external purposes in accordance with generally accepted accounting principles. A company's internal control over financial reporting includes those policies and procedures that (1) pertain to the maintenance of records that, in reasonable detail, accurately and fairly reflect the transactions and dispositions of the assets of the company; (2) provide reasonable assurance that transactions are recorded as necessary to permit preparation of financial statements in accordance with generally accepted accounting principles, and that receipts and expenditures of the company are being made only in accordance with authorizations of management and directors of the company; and (3) provide reasonable assurance regarding prevention or timely detection of unauthorized acquisition, use or disposition of the company's assets that could have a material effect on the financial statements.
Because of its inherent limitations, internal control over financial reporting may not prevent or detect misstatements. Also, projections of any evaluation of effectiveness to future periods are subject to the risk that controls may become inadequate because of changes in conditions or that the degree of compliance with the policies or procedures may deteriorate.
In our opinion, the Corporation maintained, in all material respects, effective internal control over financial reporting as of
January 28, 2017
, based on the COSO criteria.
We also have audited, in accordance with the standards of the Public Company Accounting Oversight Board (United States), the consolidated statements of financial position of Target Corporation and subsidiaries as of
January 28, 2017
and
January 30, 2016
, and the related consolidated statements of operations, comprehensive income, cash flows and shareholders' investment for each of the three years in the period ended
January 28, 2017
, and our report dated
March 8, 2017
, expressed an unqualified opinion thereon.
|
Minneapolis, Minnesota March 8, 2017 |
|
31
|
(millions, except per share data)
|
2016
|
|
2015
|
|
2014
|
|
|||
|
Sales
|
$
|
69,495
|
|
$
|
73,785
|
|
$
|
72,618
|
|
|
Cost of sales
|
48,872
|
|
51,997
|
|
51,278
|
|
|||
|
Gross margin
|
20,623
|
|
21,788
|
|
21,340
|
|
|||
|
Selling, general and administrative expenses
|
13,356
|
|
14,665
|
|
14,676
|
|
|||
|
Depreciation and amortization
|
2,298
|
|
2,213
|
|
2,129
|
|
|||
|
Gain on sale
|
—
|
|
(620
|
)
|
—
|
|
|||
|
Earnings from continuing operations before interest expense and income taxes
|
4,969
|
|
5,530
|
|
4,535
|
|
|||
|
Net interest expense
|
1,004
|
|
607
|
|
882
|
|
|||
|
Earnings from continuing operations before income taxes
|
3,965
|
|
4,923
|
|
3,653
|
|
|||
|
Provision for income taxes
|
1,296
|
|
1,602
|
|
1,204
|
|
|||
|
Net earnings from continuing operations
|
2,669
|
|
3,321
|
|
2,449
|
|
|||
|
Discontinued operations, net of tax
|
68
|
|
42
|
|
(4,085
|
)
|
|||
|
Net earnings
/
(loss)
|
$
|
2,737
|
|
$
|
3,363
|
|
$
|
(1,636
|
)
|
|
Basic earnings
/
(loss) per share
|
|||||||||
|
Continuing operations
|
$
|
4.62
|
|
$
|
5.29
|
|
$
|
3.86
|
|
|
Discontinued operations
|
0.12
|
|
0.07
|
|
(6.44
|
)
|
|||
|
Net earnings
/
(loss) per share
|
$
|
4.74
|
|
$
|
5.35
|
|
$
|
(2.58
|
)
|
|
Diluted earnings
/
(loss) per share
|
|||||||||
|
Continuing operations
|
$
|
4.58
|
|
$
|
5.25
|
|
$
|
3.83
|
|
|
Discontinued operations
|
0.12
|
|
0.07
|
|
(6.38
|
)
|
|||
|
Net earnings
/
(loss) per share
|
$
|
4.70
|
|
$
|
5.31
|
|
$
|
(2.56
|
)
|
|
Weighted average common shares outstanding
|
|
|
|
||||||
|
Basic
|
577.6
|
|
627.7
|
|
634.7
|
|
|||
|
Dilutive effect of share-based awards
|
4.9
|
|
5.2
|
|
5.4
|
|
|||
|
Diluted
|
582.5
|
|
632.9
|
|
640.1
|
|
|||
|
Antidilutive shares
|
0.1
|
|
—
|
|
3.3
|
|
|||
|
Dividends declared per share
|
$
|
2.36
|
|
$
|
2.20
|
|
$
|
1.99
|
|
Note: Per share amounts may not foot due to rounding.
See accompanying Notes to Consolidated Financial Statements.
32
Consolidated Statements of Comprehensive Income
|
(millions)
|
2016
|
|
2015
|
|
2014
|
|
|||
|
Net income
/
(loss)
|
$
|
2,737
|
|
$
|
3,363
|
|
$
|
(1,636
|
)
|
|
Other comprehensive (loss)
/
income, net of tax
|
|
|
|
||||||
|
Pension and other benefit liabilities, net of tax benefit of $9, $18, and $90
|
(13
|
)
|
(27
|
)
|
(139
|
)
|
|||
|
Currency translation adjustment and cash flow hedges, net of provision for taxes of $2, $2, and $2
|
4
|
|
(3
|
)
|
431
|
|
|||
|
Other comprehensive (loss)
/
income
|
(9
|
)
|
(30
|
)
|
292
|
|
|||
|
Comprehensive income
/
(loss)
|
$
|
2,728
|
|
$
|
3,333
|
|
$
|
(1,344
|
)
|
See accompanying Notes to Consolidated Financial Statements.
|
(millions, except footnotes)
|
January 28,
2017 |
|
January 30,
2016 |
|
||
|
Assets
|
|
|
||||
|
Cash and cash equivalents, including short-term investments of $1,110 and $3,008
|
$
|
2,512
|
|
$
|
4,046
|
|
|
Inventory
|
8,309
|
|
8,601
|
|
||
|
Assets of discontinued operations
|
69
|
|
322
|
|
||
|
Other current assets
|
1,100
|
|
1,161
|
|
||
|
Total current assets
|
11,990
|
|
14,130
|
|
||
|
Property and equipment
|
|
|
||||
|
Land
|
6,106
|
|
6,125
|
|
||
|
Buildings and improvements
|
27,611
|
|
27,059
|
|
||
|
Fixtures and equipment
|
5,503
|
|
5,347
|
|
||
|
Computer hardware and software
|
2,651
|
|
2,617
|
|
||
|
Construction-in-progress
|
200
|
|
315
|
|
||
|
Accumulated depreciation
|
(17,413
|
)
|
(16,246
|
)
|
||
|
Property and equipment, net
|
24,658
|
|
25,217
|
|
||
|
Noncurrent assets of discontinued operations
|
12
|
|
75
|
|
||
|
Other noncurrent assets
|
771
|
|
840
|
|
||
|
Total assets
|
$
|
37,431
|
|
$
|
40,262
|
|
|
Liabilities and shareholders' investment
|
|
|
||||
|
Accounts payable
|
$
|
7,252
|
|
$
|
7,418
|
|
|
Accrued and other current liabilities
|
3,737
|
|
4,236
|
|
||
|
Current portion of long-term debt and other borrowings
|
1,718
|
|
815
|
|
||
|
Liabilities of discontinued operations
|
1
|
|
153
|
|
||
|
Total current liabilities
|
12,708
|
|
12,622
|
|
||
|
Long-term debt and other borrowings
|
11,031
|
|
11,945
|
|
||
|
Deferred income taxes
|
861
|
|
823
|
|
||
|
Noncurrent liabilities of discontinued operations
|
18
|
|
18
|
|
||
|
Other noncurrent liabilities
|
1,860
|
|
1,897
|
|
||
|
Total noncurrent liabilities
|
13,770
|
|
14,683
|
|
||
|
Shareholders' investment
|
|
|
||||
|
Common stock
|
46
|
|
50
|
|
||
|
Additional paid-in capital
|
5,661
|
|
5,348
|
|
||
|
Retained earnings
|
5,884
|
|
8,188
|
|
||
|
Accumulated other comprehensive loss
|
|
|
||||
|
Pension and other benefit liabilities
|
(601
|
)
|
(588
|
)
|
||
|
Currency translation adjustment and cash flow hedges
|
(37
|
)
|
(41
|
)
|
||
|
Total shareholders' investment
|
10,953
|
|
12,957
|
|
||
|
Total liabilities and shareholders' investment
|
$
|
37,431
|
|
$
|
40,262
|
|
Preferred Stock
Authorized 5,000,000 shares
,
$0.01 par value
;
no shares were issued or outstanding
at
January 28, 2017
or
January 30, 2016
.
See accompanying Notes to Consolidated Financial Statements.
33
|
(millions)
|
2016
|
|
2015
|
|
2014
|
|
|||
|
Operating activities
|
|
|
|
||||||
|
Net earnings
/
(loss)
|
$
|
2,737
|
|
$
|
3,363
|
|
$
|
(1,636
|
)
|
|
Earnings
/
(losses) from discontinued operations, net of tax
|
68
|
|
42
|
|
(4,085
|
)
|
|||
|
Net earnings from continuing operations
|
2,669
|
|
3,321
|
|
2,449
|
|
|||
|
Adjustments to reconcile net earnings to cash provided by operations:
|
|
|
|
||||||
|
Depreciation and amortization
|
2,298
|
|
2,213
|
|
2,129
|
|
|||
|
Share-based compensation expense
|
113
|
|
115
|
|
71
|
|
|||
|
Deferred income taxes
|
41
|
|
(322
|
)
|
7
|
|
|||
|
Gain on sale
|
—
|
|
(620
|
)
|
—
|
|
|||
|
Loss on debt extinguishment
|
422
|
|
—
|
|
285
|
|
|||
|
Noncash (gains)
/
losses and other, net
|
—
|
|
57
|
|
40
|
|
|||
|
Changes in operating accounts:
|
|
|
|
||||||
|
Inventory
|
293
|
|
(316
|
)
|
(512
|
)
|
|||
|
Other assets
|
36
|
|
227
|
|
(115
|
)
|
|||
|
Accounts payable and accrued liabilities
|
(543
|
)
|
579
|
|
803
|
|
|||
|
Cash provided by operating activities—continuing operations
|
5,329
|
|
5,254
|
|
5,157
|
|
|||
|
Cash provided by
/
(
required for) operating activities—discontinued operations
|
107
|
|
704
|
|
(692
|
)
|
|||
|
Cash provided by operations
|
5,436
|
|
5,958
|
|
4,465
|
|
|||
|
Investing activities
|
|
|
|
||||||
|
Expenditures for property and equipment
|
(1,547
|
)
|
(1,438
|
)
|
(1,786
|
)
|
|||
|
Proceeds from disposal of property and equipment
|
46
|
|
28
|
|
95
|
|
|||
|
Proceeds from sale of businesses
|
—
|
|
1,875
|
|
—
|
|
|||
|
Cash paid for acquisitions, net of cash assumed
|
—
|
|
—
|
|
(20
|
)
|
|||
|
Other investments
|
28
|
|
24
|
|
106
|
|
|||
|
Cash (required for)
/
provided by investing activities—continuing operations
|
(1,473
|
)
|
489
|
|
(1,605
|
)
|
|||
|
Cash provided by
/
(
required for) investing activities—discontinued operations
|
—
|
|
19
|
|
(321
|
)
|
|||
|
Cash
(
required for)
/
provided by investing activities
|
(1,473
|
)
|
508
|
|
(1,926
|
)
|
|||
|
Financing activities
|
|
|
|
||||||
|
Change in commercial paper, net
|
—
|
|
—
|
|
(80
|
)
|
|||
|
Additions to long-term debt
|
1,977
|
|
—
|
|
1,993
|
|
|||
|
Reductions of long-term debt
|
(2,641
|
)
|
(85
|
)
|
(2,079
|
)
|
|||
|
Dividends paid
|
(1,348
|
)
|
(1,362
|
)
|
(1,205
|
)
|
|||
|
Repurchase of stock
|
(3,706
|
)
|
(3,483
|
)
|
(26
|
)
|
|||
|
Stock option exercises
|
221
|
|
300
|
|
373
|
|
|||
|
Cash required for financing activities
|
(5,497
|
)
|
(4,630
|
)
|
(1,024
|
)
|
|||
|
Net (decrease)
/
increase in cash and cash equivalents
|
(1,534
|
)
|
1,836
|
|
1,515
|
|
|||
|
Cash and cash equivalents at beginning of period
(a)
|
4,046
|
|
2,210
|
|
695
|
|
|||
|
Cash and cash equivalents at end of period
|
$
|
2,512
|
|
$
|
4,046
|
|
$
|
2,210
|
|
|
Supplemental information
|
|
|
|
||||||
|
Interest paid, net of capitalized interest
|
$
|
999
|
|
$
|
604
|
|
$
|
871
|
|
|
Income taxes paid / (refunded)
|
1,514
|
|
(127
|
)
|
1,251
|
|
|||
|
Property and equipment acquired through capital lease obligations
|
238
|
|
126
|
|
88
|
|
|||
(a)
Includes cash of our discontinued operations of
$25 million
at February 1, 2014.
See accompanying Notes to Consolidated Financial Statements.
34
Consolidated Statements of Shareholders' Investment
|
(millions)
|
Common
Stock
Shares
|
|
Stock
Par
Value
|
|
Additional
Paid-in
Capital
|
|
Retained
Earnings
|
|
Accumulated Other
Comprehensive
(Loss)
/
Income
|
|
Total
|
|
|||||
|
February 1, 2014
|
632.9
|
|
$
|
53
|
|
$
|
4,470
|
|
$
|
12,599
|
|
$
|
(891
|
)
|
$
|
16,231
|
|
|
Net loss
|
—
|
|
—
|
|
—
|
|
(1,636
|
)
|
—
|
|
(1,636
|
)
|
|||||
|
Other comprehensive income
|
—
|
|
—
|
|
—
|
|
—
|
|
292
|
|
292
|
|
|||||
|
Dividends declared
|
—
|
|
—
|
|
—
|
|
(1,273
|
)
|
—
|
|
(1,273
|
)
|
|||||
|
Repurchase of stock
|
(0.8
|
)
|
—
|
|
—
|
|
(46
|
)
|
—
|
|
(46
|
)
|
|||||
|
Stock options and awards
|
8.1
|
|
—
|
|
429
|
|
—
|
|
—
|
|
429
|
|
|||||
|
January 31, 2015
|
640.2
|
|
$
|
53
|
|
$
|
4,899
|
|
$
|
9,644
|
|
$
|
(599
|
)
|
$
|
13,997
|
|
|
Net earnings
|
—
|
|
—
|
|
—
|
|
3,363
|
|
—
|
|
3,363
|
|
|||||
|
Other comprehensive loss
|
—
|
|
—
|
|
—
|
|
—
|
|
(30
|
)
|
(30
|
)
|
|||||
|
Dividends declared
|
—
|
|
—
|
|
—
|
|
(1,378
|
)
|
—
|
|
(1,378
|
)
|
|||||
|
Repurchase of stock
|
(44.7
|
)
|
(4
|
)
|
—
|
|
(3,441
|
)
|
—
|
|
(3,445
|
)
|
|||||
|
Stock options and awards
|
6.7
|
|
1
|
|
449
|
|
—
|
|
—
|
|
450
|
|
|||||
|
January 30, 2016
|
602.2
|
|
$
|
50
|
|
$
|
5,348
|
|
$
|
8,188
|
|
$
|
(629
|
)
|
$
|
12,957
|
|
|
Net earnings
|
—
|
|
—
|
|
—
|
|
2,737
|
|
—
|
|
2,737
|
|
|||||
|
Other comprehensive loss
|
—
|
|
—
|
|
—
|
|
—
|
|
(9
|
)
|
(9
|
)
|
|||||
|
Dividends declared
|
—
|
|
—
|
|
—
|
|
(1,359
|
)
|
—
|
|
(1,359
|
)
|
|||||
|
Repurchase of stock
|
(50.9
|
)
|
(4
|
)
|
—
|
|
(3,682
|
)
|
—
|
|
(3,686
|
)
|
|||||
|
Stock options and awards
|
4.9
|
|
—
|
|
313
|
|
—
|
|
—
|
|
313
|
|
|||||
|
January 28, 2017
|
556.2
|
|
$
|
46
|
|
$
|
5,661
|
|
$
|
5,884
|
|
$
|
(638
|
)
|
$
|
10,953
|
|
See accompanying Notes to Consolidated Financial Statements.
35
Notes to Consolidated Financial Statements
1
. Summary of Accounting Policies
Organization
We are a general merchandise retailer selling products to our guests through our stores and digital channels.
As described in Note
7
, in January 2015, we announced our exit from the Canadian market and filed for protection (the Filing) under the Companies' Creditors Arrangement Act (CCAA) with the Ontario Superior Court of Justice in Toronto (the Court). Our prefiling financial results in Canada and subsequent expenses directly attributable to the Canada exit are included in our financial statements and classified within discontinued operations. Discontinued operations refers only to our discontinued Canadian operations. Subsequent to the Filing, we operate as a single segment that includes all of our continuing operations, which are designed to enable guests to purchase products seamlessly in stores or through our digital channels.
Consolidation
The consolidated financial statements include the balances of Target and its subsidiaries after elimination of intercompany balances and transactions. All material subsidiaries are wholly owned. We consolidate variable interest entities where it has been determined that Target is the primary beneficiary of those entities' operations. As of January 15, 2015, we deconsolidated substantially all of our Canadian operations following the Filing. See Note
7
for more information.
Use of estimates
The preparation of our consolidated financial statements in conformity with U.S. generally accepted accounting principles (GAAP) requires management to make estimates and assumptions affecting reported amounts in the consolidated financial statements and accompanying notes. Actual results may differ significantly from those estimates.
Fiscal year
Our fiscal year ends on the Saturday nearest January 31. Unless otherwise stated, references to years in this report relate to fiscal years, rather than to calendar years. Fiscal
2016
ended
January 28, 2017
, and consisted of
52
weeks. Fiscal
2015
ended
January 30, 2016
, and consisted of
52
weeks. Fiscal
2014
ended
January 31, 2015
, and consisted of
52
weeks. Fiscal 2017 will end February 3, 2018, and will consist of
53
weeks.
Accounting policies
Our accounting policies are disclosed in the applicable Notes to the Consolidated Financial Statements.
2
. Revenues
Our retail stores generally record revenue at the point of sale. Digital channel sales include shipping revenue and are recorded upon delivery to the guest. Total revenues do not include sales tax because we are a pass-through conduit for collecting and remitting sales taxes. Generally, guests may return national brand merchandise within
90 days
of purchase and owned and exclusive brands within
one year
of purchase. Revenues are recognized net of expected returns, which we estimate using historical return patterns as a percentage of sales and our expectation of future returns. Commissions earned on sales generated by leased departments are included within sales and were
$42 million
,
$37 million
, and
$32 million
in
2016
,
2015
, and
2014
, respectively.
Revenue from gift card sales is recognized upon gift card redemption. Our gift cards do not expire. Based on historical redemption rates, a small and relatively stable percentage of gift cards will never be redeemed, referred to as "breakage." Estimated breakage revenue is recognized over time in proportion to actual gift card redemptions and was not material in any period presented.
Guests receive a
5
percent discount on virtually all purchases and receive free shipping at Target.com when they use their REDcard. The discount is included as a sales reduction in our Consolidated Statements of Operations and was
$899 million
,
$905 million
, and
$832 million
in
2016
,
2015
, and
2014
, respectively.
In May 2014, the FASB issued Accounting Standards Update (ASU) No. 2014-09,
Revenue from Contracts with Customers (Topic 606)
.
We plan to adopt the standard in the first quarter of 2018, which begins on February 4, 2018. We are still evaluating whether to use a full retrospective or a modified retrospective approach to adopt the standard. We do not expect the standard to materially affect our consolidated net earnings, financial position, or cash flows.
36
We are evaluating whether we act as principal or agent in certain vendor arrangements where the purchase and sale of inventory is virtually simultaneous, as further described in Note 12. We currently record revenue and related costs gross, with approximately
3 percent
of 2016 consolidated sales made under such arrangements. Any change to net presentation would not impact gross margin or earnings.
We are also evaluating the presentation of certain ancillary income streams, including the credit card profit sharing income described in Note 9.
3
. Cost of Sales and Selling, General and Administrative Expenses
The following table illustrates the primary items classified in each major expense category:
|
Cost of Sales
|
Selling, General and Administrative Expenses
|
|
Total cost of products sold including
• Freight expenses associated with moving
merchandise from our vendors to and between our
distribution centers and our retail stores
• Vendor income that is not reimbursement of
specific, incremental, and identifiable costs
Inventory shrink
Markdowns
Outbound shipping and handling expenses
associated with sales to our guests
Payment term cash discounts
Distribution center costs, including compensation
and benefits costs
Import costs
|
Compensation and benefit costs for stores and
headquarters Occupancy and operating costs of retail and headquarters facilities Advertising, offset by vendor income that is a reimbursement of specific, incremental, and identifiable costs Pre-opening costs of stores and other facilities U.S. credit cards servicing expenses and profit sharing Costs associated with accepting 3 rd party bank issued payment cards Litigation and defense costs and related insurance recovery Other administrative costs |
4
. Consideration Received from Vendors
We receive consideration for a variety of vendor-sponsored programs, such as volume rebates, markdown allowances, promotions, and advertising allowances and for our compliance programs, referred to as "vendor income." Under our compliance programs, vendors are charged for merchandise shipments that do not meet our requirements (violations), such as late or incomplete shipments. Substantially all consideration received is recorded as a reduction of cost of sales.
We establish a receivable for vendor income that is earned but not yet received. Based on provisions of the agreements in place, this receivable is computed by estimating the amount earned when we have completed our performance. We perform detailed analyses to determine the appropriate level of the receivable in the aggregate. The majority of year-end receivables associated with these activities are collected within the following fiscal quarter. We have not historically had significant write-offs for these receivables.
5
. Advertising Costs
Advertising costs, which primarily consist of newspaper circulars, internet advertisements, and media broadcast, are generally expensed at first showing or distribution of the advertisement.
|
Advertising Costs
(millions)
|
2016
|
|
2015
|
|
2014
|
|
|||
|
Gross advertising costs
|
$
|
1,503
|
|
$
|
1,472
|
|
$
|
1,647
|
|
|
Vendor income
|
(38
|
)
|
(38
|
)
|
(47
|
)
|
|||
|
Net advertising costs
|
$
|
1,465
|
|
$
|
1,434
|
|
$
|
1,600
|
|
37
6
. Pharmacy Transaction
In December 2015, we sold our pharmacy and clinic businesses to CVS (the Pharmacy Transaction) for cash consideration of
$1.9 billion
, recognizing a gain of
$620 million
, and deferred income of
$694 million
. CVS now operates the pharmacy and clinic businesses in our stores and paid us $
24 million
for occupancy during 2016.
|
Gain on Pharmacy Transaction
(millions)
|
2015
|
|
|
|
Cash consideration
|
$
|
1,868
|
|
|
Less:
|
|||
|
Deferred income
(a)
|
694
|
|
|
|
Inventory
|
447
|
|
|
|
Other assets
|
13
|
|
|
|
Pretax transaction costs and contingent liabilities
(b)
|
94
|
|
|
|
Pretax gain on Pharmacy Transaction
(c)
|
$
|
620
|
|
|
(a)
|
Represents the consideration received at the close of the sale related to CVS’s leasehold interest in the related space within our stores. Deferred income will be recorded as a reduction to SG&A expense evenly over the
23
-year weighted average remaining accounting useful life of our stores. As of
January 28, 2017
,
$660 million
remains in other current and other noncurrent liabilities.
|
|
(b)
|
Primarily relates to professional services, contract termination charges, severance, and impairment of certain assets not sold to CVS.
|
|
(c)
|
Recorded outside of segment results and excluded from Adjusted EPS.
|
7
. Canada Exit
On January 15, 2015, Target Canada Co. and certain other wholly owned subsidiaries of Target (collectively, Canada Subsidiaries), comprising substantially all of our former Canadian operations and our former Canadian Segment, filed for protection under the CCAA with the Ontario Superior Court of Justice in Toronto (the Court) and were deconsolidated. As a result, we recorded a pretax impairment loss on deconsolidation and other related charges, collectively totaling
$5.1 billion
. The Canada Subsidiaries are in the process of liquidation.
Subsequent to deconsolidation, we use the cost method to account for our equity investment in the Canada Subsidiaries, which has been reflected as
zero
in our Consolidated Statement of Financial Position at January 28, 2017 and January 30, 2016 based on the estimated fair value of the Canada Subsidiaries' net assets.
As of the deconsolidation date, the loans, associated interest, and accounts receivable Target Corporation held are considered related party transactions and have been recognized in Target Corporation's consolidated financial statements. In addition, we held an accrual for the estimated probable loss related to claims that may be asserted directly against us (rather than against the Canada Subsidiaries), primarily under our guarantees of certain leases of the Canada Subsidiaries.
As part of a March 2016 settlement between the Canada Subsidiaries and all of their former landlords, we agreed to subordinate a portion of our intercompany claims and make certain cash contributions to the Target Canada Co. estate in exchange for a full release from our obligations under guarantees of certain leases of the Canada Subsidiaries. The settlement was contingent upon the Canada Subsidiaries' creditors' and the Court's approval of a plan of compromise and arrangement to complete the controlled, orderly, and timely wind-down of the Canada Subsidiaries (Plan). During the second quarter of 2016, a Plan was approved. The net pretax financial impact of the settlement and Plan was materially consistent with amounts previously recorded in our financial statements. During 2016, we received
$182 million
from the Target Canada Co. estate and made cash contributions of
$27 million
.
38
|
Income
/
(Loss) on Discontinued Operations
(millions)
|
2016
|
|
2015
|
|
2014
|
|
|||
|
Sales
|
$
|
—
|
|
$
|
—
|
|
$
|
1,902
|
|
|
Cost of sales
|
—
|
|
—
|
|
1,541
|
|
|||
|
SG&A expenses
|
—
|
|
—
|
|
909
|
|
|||
|
Depreciation and amortization
|
—
|
|
—
|
|
248
|
|
|||
|
Interest expense
|
—
|
|
—
|
|
73
|
|
|||
|
Pretax loss from operations
|
—
|
|
—
|
|
(869
|
)
|
|||
|
Pretax exit costs
|
13
|
|
(129
|
)
|
(5,105
|
)
|
|||
|
Income taxes
|
55
|
|
171
|
|
1,889
|
|
|||
|
Income
/
(loss) from discontinued operations
|
$
|
68
|
|
$
|
42
|
|
$
|
(4,085
|
)
|
|
Pretax Exit Costs
(millions)
|
2016
|
|
2015
|
|
2014
|
|
|||
|
Investment impairment
|
$
|
(222
|
)
|
$
|
(6
|
)
|
$
|
(4,766
|
)
|
|
Contingent liabilities
|
229
|
|
(62
|
)
|
(240
|
)
|
|||
|
Other exit costs
|
6
|
|
(61
|
)
|
(99
|
)
|
|||
|
Total
|
$
|
13
|
|
$
|
(129
|
)
|
$
|
(5,105
|
)
|
During 2016, we recognized net tax benefits of
$55 million
in discontinued operations, which primarily related to tax benefits from our investment losses in Canada recognized upon court approval of the Plan. During 2015, we recognized net tax benefits of
$171 million
in discontinued operations, which primarily related to our pretax exit costs and change in the estimated tax benefit from our investment losses in Canada. During 2014, we recognized a tax benefit of
$1,889 million
in discontinued operations, which includes the tax benefit of our 2014 Canadian operating losses, the tax benefit related to a loss on our investment in Canada, and other tax benefits resulting from certain asset write-offs and liabilities paid or accrued to facilitate the liquidation. The majority of these tax benefits were received in the first quarter of 2015, and we used substantially all of the remainder in 2015 to reduce our estimated tax payments.
|
Assets and Liabilities of Discontinued Operations
(millions)
|
January 28,
2017 |
|
January 30,
2016 |
|
|||
|
Income tax benefit
|
$
|
35
|
|
$
|
77
|
|
|
|
Receivables from Canada Subsidiaries
(a)
|
46
|
|
320
|
|
|||
|
Total assets
|
$
|
81
|
|
$
|
397
|
|
|
|
Accrued liabilities
|
$
|
19
|
|
$
|
171
|
|
|
|
Total liabilities
|
$
|
19
|
|
$
|
171
|
|
|
|
(a)
|
Represents loans and accounts receivable from Canada Subsidiaries.
|
8
. Restructuring Initiatives
In 2015, we initiated a series of headquarters workforce reductions intended to increase organizational effectiveness and provide cost savings that can be reinvested in our growth initiatives. As a result, during 2015 we recorded
$138 million
of severance and other benefits-related charges within SG&A. The vast majority of these expenses required cash expenditures during 2015 and were not included in our segment results.
9
. Credit Card Profit Sharing
TD Bank Group underwrites, funds, and owns Target Credit Card and Target MasterCard receivables, controls risk management policies, and oversees regulatory compliance. We perform account servicing and primary marketing functions. We earn a substantial portion of the profits generated by the Target Credit Card and Target MasterCard portfolios. We earned
$663 million
,
$641 million
, and
$629 million
of net profit-sharing income during
2016
,
2015
, and
2014
, respectively, which reduced SG&A expense.
39
10
. Fair Value Measurements
Fair value measurements are reported in one of three levels based on the lowest level of significant input used: Level 1 (unadjusted quoted prices in active markets); Level 2 (observable market inputs, other than quoted prices included in Level 1); and Level 3 (unobservable inputs that cannot be corroborated by observable market data).
|
Fair Value Measurements - Recurring Basis
|
Fair Value at
|
|||||||
|
(millions)
|
Pricing Category
|
January 28,
2017 |
|
January 30,
2016 |
|
|||
|
Assets
|
|
|
|
|
||||
|
Cash and cash equivalents
|
|
|
|
|
||||
|
Short-term investments
|
Level 1
|
$
|
1,110
|
|
$
|
3,008
|
|
|
|
Other current assets
|
|
|
|
|
||||
|
Interest rate swaps
(a)
|
Level 2
|
1
|
|
12
|
|
|||
|
Prepaid forward contracts
|
Level 1
|
26
|
|
32
|
|
|||
|
Beneficial interest asset
|
Level 3
|
12
|
|
19
|
|
|||
|
Other noncurrent assets
|
|
|
|
|
||||
|
Interest rate swaps
(a)
|
Level 2
|
4
|
|
27
|
|
|||
|
Beneficial interest asset
|
Level 3
|
—
|
|
12
|
|
|||
|
Liabilities
|
|
|
|
|
||||
|
Other current liabilities
|
|
|
|
|
||||
|
Interest rate swaps
(a)
|
Level 2
|
—
|
|
8
|
|
|||
|
(a)
|
See Note
21
for additional information on interest rate swaps.
|
|
Valuation Technique
|
|
Short-term investments - Carrying value approximates fair value because maturities are less than three months.
|
|
Prepaid forward contracts - Initially valued at transaction price. Subsequently valued by reference to the market price of Target common stock.
|
|
Interest rate swaps - Valuation models are calibrated to initial trade price. Subsequent valuations are based on observable inputs to the valuation model (e.g., interest rates and credit spreads).
|
|
Significant Financial Instruments not Measured at Fair Value
(a)
(millions)
|
2016
|
2015
|
|||||||||||
|
Carrying
Amount
|
|
Fair
Value
|
|
Carrying
Amount
|
|
Fair
Value
|
|
||||||
|
Debt
(b)
|
$
|
11,715
|
|
$
|
12,545
|
|
$
|
11,859
|
|
$
|
13,385
|
|
|
|
(a)
|
The carrying amounts of certain other current assets, accounts payable, and certain accrued and other current liabilities approximate fair value due to their short-term nature.
|
|
(b)
|
The fair value of debt is generally measured using a discounted cash flow analysis based on current market interest rates for the same or similar types of financial instruments and would be classified as Level 2. These amounts exclude unamortized swap valuation adjustments and capital lease obligations.
|
11
. Cash Equivalents
Cash equivalents include highly liquid investments with an original maturity of three months or less from the time of purchase. These investments were
$1,110 million
and
$3,008 million
at
January 28, 2017
and
January 30, 2016
, respectively. Cash equivalents also include amounts due from third-party financial institutions for credit and debit card transactions. These receivables typically settle in less than
five days
and were
$346 million
and
$375 million
at
January 28, 2017
and
January 30, 2016
, respectively.
40
12
. Inventory
The vast majority of our inventory is accounted for under the retail inventory accounting method (RIM) using the last-in, first-out (LIFO) method. Inventory is stated at the lower of LIFO cost or market. The cost of our inventory includes the amount we pay to our suppliers to acquire inventory, freight costs incurred in connection with the delivery of product to our distribution centers and stores, and import costs, reduced by vendor income and cash discounts. The majority of our distribution center operating costs, including compensation and benefits, are expensed in the period incurred. Inventory is also reduced for estimated losses related to shrink and markdowns. The LIFO provision is calculated based on inventory levels, markup rates, and internally measured retail price indices.
Under RIM, inventory cost and the resulting gross margins are calculated by applying a cost-to-retail ratio to the inventory retail value. RIM is an averaging method that has been widely used in the retail industry due to its practicality. The use of RIM will result in inventory being valued at the lower of cost or market because permanent markdowns are taken as a reduction of the retail value of inventory.
We routinely enter into arrangements with vendors whereby we do not purchase or pay for merchandise until the merchandise is ultimately sold to a guest. Activity under this program is included in sales and cost of sales in the Consolidated Statements of Operations, but the merchandise received under the program is not included in inventory in our Consolidated Statements of Financial Position because of the virtually simultaneous purchase and sale of this inventory. Sales made under these arrangements totaled
$2,202 million
,
$2,261 million
, and
$2,040 million
in
2016
,
2015
, and
2014
, respectively.
13
. Other Current Assets
|
Other Current Assets
(millions)
|
January 28,
2017 |
|
January 30,
2016 |
|
||
|
Vendor income receivable
|
$
|
385
|
|
$
|
384
|
|
|
Income tax and other receivables
|
364
|
|
352
|
|
||
|
Prepaid expenses
|
207
|
|
214
|
|
||
|
Other
|
144
|
|
211
|
|
||
|
Total
|
$
|
1,100
|
|
$
|
1,161
|
|
14
. Property and Equipment
Property and equipment is depreciated using the straight-line method over estimated useful lives or lease terms if shorter. We amortize leasehold improvements purchased after the beginning of the initial lease term over the shorter of the assets' useful lives or a term that includes the original lease term, plus any renewals that are reasonably assured at the date the leasehold improvements are acquired. Depreciation and capital lease amortization expense for 2016, 2015, and 2014 was
$2,280 million
,
$2,191 million
, and
$2,108 million
, respectively. For income tax purposes, accelerated depreciation methods are generally used. Repair and maintenance costs are expensed as incurred. Facility pre-opening costs, including supplies and payroll, are expensed as incurred.
|
Estimated Useful Lives
|
Life (Years)
|
|
Buildings and improvements
|
8-39
|
|
Fixtures and equipment
|
2-15
|
|
Computer hardware and software
|
2-7
|
Long-lived assets are reviewed for impairment when events or changes in circumstances, such as a decision to relocate or close a store or make significant software changes, indicate that the asset's carrying value may not be recoverable. For asset groups classified as held for sale, the carrying value is compared to the fair value less cost to sell. We estimate fair value by obtaining market appraisals, valuations from third party brokers, or other valuation techniques.
41
|
Impairments
(a)
(millions)
|
2016
|
|
2015
|
|
2014
|
|
|||
|
Impairments included in segment SG&A
|
$
|
43
|
|
$
|
50
|
|
$
|
108
|
|
|
Unallocated impairments
(b)
|
—
|
|
4
|
|
16
|
|
|||
|
Total impairments
|
$
|
43
|
|
$
|
54
|
|
$
|
124
|
|
|
(a)
|
Substantially all of the impairments are recorded in SG&A expense on the Consolidated Statements of Operations.
|
|
(b)
|
For 2015, represents long-lived asset impairments from our decision to wind down certain noncore operations. For 2014, represents impairments of undeveloped land. These costs were not included in our segment results.
|
15
. Other Noncurrent Assets
|
Other Noncurrent Assets
(millions)
|
January 28,
2017 |
|
January 30,
2016 |
|
||
|
Company-owned life insurance investments
(a)
|
$
|
345
|
|
$
|
308
|
|
|
Goodwill and intangible assets
|
259
|
|
277
|
|
||
|
Pension asset
|
43
|
|
66
|
|
||
|
Other
|
124
|
|
189
|
|
||
|
Total
|
$
|
771
|
|
$
|
840
|
|
|
(a)
|
Company-owned life insurance policies on approximately
4,000
team members who have been designated highly compensated under the Internal Revenue Code and have given their consent to be insured. Amounts are presented net of loans that are secured by some of these policies.
|
16
. Goodwill and Intangible Assets
Goodwill totaled
$133 million
at
January 28, 2017
and
January 30, 2016
. During 2015, we announced our decision to wind down certain noncore operations. As a result, we recorded a
$35 million
pretax impairment loss, which included approximately
$23 million
of intangible assets and
$12 million
of goodwill. These costs were included in SG&A on our Consolidated Statements of Operations, but were not included in our segment results.
No
impairments were recorded in 2016 or
2014
as a result of the annual goodwill impairment tests performed.
|
Intangible Assets
|
Leasehold
Acquisition Costs
|
Other
(a)
|
Total
|
|||||||||||||||||
|
(millions)
|
January 28,
2017 |
|
January 30,
2016 |
|
January 28,
2017 |
|
January 30,
2016 |
|
January 28,
2017 |
|
January 30,
2016 |
|
||||||||
|
Gross asset
|
$
|
208
|
|
$
|
211
|
|
$
|
88
|
|
$
|
88
|
|
$
|
296
|
|
$
|
299
|
|
||
|
Accumulated amortization
|
(132
|
)
|
(127
|
)
|
(38
|
)
|
(27
|
)
|
(170
|
)
|
(154
|
)
|
||||||||
|
Net intangible assets
|
$
|
76
|
|
$
|
84
|
|
$
|
50
|
|
$
|
61
|
|
$
|
126
|
|
$
|
145
|
|
||
|
(a)
|
Other intangible assets relate primarily to trademarks.
|
We use the straight-line method to amortize leasehold acquisition costs primarily over
9
to
39 years
and other definite-lived intangibles over
3
to
15 years
. The weighted average life of leasehold acquisition costs and other intangible assets was
27 years
and
8 years
, respectively, at
January 28, 2017
. Amortization expense was
$18 million
,
$23 million
, and
$22 million
in
2016
,
2015
, and
2014
, respectively.
|
Estimated Amortization Expense
(millions)
|
2017
|
|
2018
|
|
2019
|
|
2020
|
|
2021
|
|
|||||
|
Amortization expense
|
$
|
16
|
|
$
|
12
|
|
$
|
11
|
|
$
|
11
|
|
$
|
11
|
|
17
. Accounts Payable
At
January 28, 2017
and
January 30, 2016
, we reclassified book overdrafts of
$459 million
and
$534 million
, respectively, to accounts payable and
$24 million
and
$25 million
, respectively, to accrued and other current liabilities.
42
18
. Accrued and Other Current Liabilities
|
Accrued and Other Current Liabilities
(millions)
|
January 28,
2017 |
|
January 30,
2016 |
|
||
|
Wages and benefits
|
$
|
812
|
|
$
|
884
|
|
|
Gift card liability, net of estimated breakage
|
693
|
|
644
|
|
||
|
Real estate, sales, and other taxes payable
|
571
|
|
574
|
|
||
|
Dividends payable
|
334
|
|
337
|
|
||
|
Straight-line rent accrual
(a)
|
271
|
|
262
|
|
||
|
Income tax payable
|
158
|
|
502
|
|
||
|
Workers' compensation and general liability
(b)
|
141
|
|
146
|
|
||
|
Interest payable
|
71
|
|
76
|
|
||
|
Other
|
686
|
|
811
|
|
||
|
Total
|
$
|
3,737
|
|
$
|
4,236
|
|
|
(a)
|
Straight-line rent accrual represents the amount of operating lease rent expense recorded that exceeds cash payments.
|
|
(b)
|
We retain a substantial portion of the risk related to general liability and workers' compensation claims. Liabilities associated with these losses include estimates of both claims filed and losses incurred but not yet reported. We estimate our ultimate cost based on analysis of historical data and actuarial estimates. General liability and workers' compensation liabilities are recorded at our estimate of their net present value.
|
19
. Commitments and Contingencies
Data Breach
In the fourth quarter of 2013, we experienced a data breach in which an intruder stole certain payment card and other guest information from our network (the Data Breach), which resulted in a number of claims against us. We have resolved the most significant claims relating to the Data Breach, and there were no material changes to our loss contingency assessment relating to the remaining claims during 2016. We do not expect any material changes to the assessment of our exposure from this event. At January 28, 2017, the remaining accrual for Data Breach-related liabilities was immaterial to our Consolidated Statements of Financial Position.
We incurred net Data Breach-related expenses of
$39 million
and
$145 million
during 2015 and 2014, respectively. Net expenses include expenditures for legal and other professional services and accruals for Data Breach-related costs and expected insurance recoveries. These net expenses were included in our Consolidated Statements of Operations as SG&A, but were not part of segment results. For 2016, Data Breach-related expenses were negligible.
Since the Data Breach, we have incurred
$292 million
of cumulative expenses, partially offset by insurance recoveries of
$90 million
, for net cumulative expenses of
$202 million
.
Other Contingencies
We are exposed to other claims and litigation arising in the ordinary course of business and use various methods to resolve these matters in a manner that we believe serves the best interest of our shareholders and other constituents. When a loss is probable, we record an accrual based on the reasonably estimable loss or range of loss. When no point of loss is more likely than another, we record the lowest amount in the estimated range of loss and, if material, disclose the estimated range of loss. We do not record liabilities for reasonably possible loss contingencies, but do disclose a range of reasonably possible losses if they are material and we are able to estimate such a range. If we cannot provide a range of reasonably possible losses, we explain the factors that prevent us from determining such a range. Historically, adjustments to our estimates have not been material. We believe the recorded reserves in our consolidated financial statements are adequate in light of the probable and estimable liabilities. We do not believe that any of these identified claims or litigation will be material to our results of operations, cash flows, or financial condition.
43
Commitments
Purchase obligations, which include all legally binding contracts such as firm commitments for inventory purchases, merchandise royalties, equipment purchases, marketing-related contracts, software acquisition/license commitments, and service contracts, were
$1,762 million
and
$1,950 million
at
January 28, 2017
and
January 30, 2016
, respectively. These purchase obligations are primarily due within
three years
and recorded as liabilities when inventory is received. We issue inventory purchase orders, which represent authorizations to purchase that are cancelable by their terms. We do not consider purchase orders to be firm inventory commitments. If we choose to cancel a purchase order, we may be obligated to reimburse the vendor for unrecoverable outlays incurred prior to cancellation. Real estate obligations, which include commitments for the purchase, construction or remodeling of real estate and facilities, were $
268 million
and $
279 million
at
January 28, 2017
and
January 30, 2016
, respectively. These real estate obligations are primarily due within
one year
, a portion of which are recorded as liabilities.
We issue letters of credit and surety bonds in the ordinary course of business. Trade letters of credit totaled
$1,330 million
and
$1,510 million
at
January 28, 2017
and
January 30, 2016
, respectively, a portion of which are reflected in accounts payable. Standby letters of credit and surety bonds, relating primarily to insurance and regulatory requirements, totaled
$463 million
and
$438 million
at
January 28, 2017
and
January 30, 2016
, respectively.
20
. Notes Payable and Long-Term Debt
At
January 28, 2017
, the carrying value and maturities of our debt portfolio were as follows:
|
Debt Maturities
|
January 28, 2017
|
||||
|
(dollars in millions)
|
Rate
(a)
|
|
Balance
|
|
|
|
Due 2017-2021
|
4.2
|
%
|
$
|
5,007
|
|
|
Due 2022-2026
|
3.2
|
|
2,048
|
|
|
|
Due 2027-2031
|
6.9
|
|
462
|
|
|
|
Due 2032-2036
|
6.4
|
|
496
|
|
|
|
Due 2037-2041
|
6.8
|
|
1,237
|
|
|
|
Due 2042-2046
|
3.8
|
|
2,465
|
|
|
|
Total notes and debentures
|
4.4
|
|
11,715
|
|
|
|
Swap valuation adjustments
|
|
|
9
|
|
|
|
Capital lease obligations
|
|
|
1,025
|
|
|
|
Less: Amounts due within one year
|
|
|
(1,718
|
)
|
|
|
Long-term debt
|
|
|
$
|
11,031
|
|
|
(a)
|
Reflects the weighted average stated interest rate as of year-end.
|
|
Required Principal Payments
(millions)
|
2017
|
|
2018
|
|
2019
|
|
2020
|
|
2021
|
|
|||||
|
Total required principal payments
|
$
|
1,683
|
|
$
|
201
|
|
$
|
1,002
|
|
$
|
1,094
|
|
$
|
1,056
|
|
In April 2016, we issued unsecured fixed rate debt of
$1 billion
at
2.5 percent
that matures in April 2026 and
$1 billion
at
3.625 percent
that matures in April 2046. During the first half of 2016, we used cash on hand and proceeds from these issuances to repurchase
$1,389 million
of debt before its maturity at a market value of
$1,800 million
, repay
$750 million
of debt maturities, and for general corporate purposes. We recognized a loss on early retirement of approximately
$422 million
, which was recorded in net interest expense in our Consolidated Statements of Operations
.
In June 2014, we issued
$1 billion
of unsecured fixed rate debt at
2.3
percent that matures in June 2019 and
$1 billion
of unsecured fixed rate debt at
3.5
percent that matures in July 2024. We used proceeds from these issuances to repurchase
$725 million
of debt before its maturity at a market value of
$1 billion
, and for general corporate purposes including the payment of
$1 billion
of debt maturities. We recognized a loss of
$285 million
on the early retirement, which was recorded in net interest expense in our Consolidated Statements of Operations.
We obtain short-term financing from time to time under our commercial paper program, a form of notes payable.
44
|
Commercial Paper
(dollars in millions)
|
2016
|
|
2015
|
|
2014
|
|
|||
|
Maximum daily amount outstanding during the year
|
$
|
89
|
|
$
|
—
|
|
$
|
590
|
|
|
Average amount outstanding during the year
|
1
|
|
—
|
|
129
|
|
|||
|
Amount outstanding at year-end
|
—
|
|
—
|
|
—
|
|
|||
|
Weighted average interest rate
|
0.43
|
%
|
—
|
%
|
0.11
|
%
|
|||
In October 2016, we obtained a committed
$2.5 billion
revolving credit facility that expires in October 2021. This new unsecured revolving credit facility replaced a
$2.25 billion
unsecured revolving credit facility that was scheduled to expire in October 2018.
No
balances were outstanding under either credit facility at any time during
2016
or
2015
.
Substantially all of our outstanding borrowings are senior, unsecured obligations. Most of our long-term debt obligations contain covenants related to secured debt levels. In addition to a secured debt level covenant, our credit facility also contains a debt leverage covenant. We are, and expect to remain, in compliance with these covenants, which have no practical effect on our ability to pay dividends.
21
. Derivative Financial Instruments
Our derivative instruments primarily consist of interest rate swaps, which are used to mitigate interest rate risk. As a result of our use of derivative instruments, we have counterparty credit exposure to large global financial institutions. We monitor this concentration of counterparty credit risk on an ongoing basis. See Note
10
for a description of the fair value measurement of our derivative instruments and their classification on the Consolidated Statements of Financial Position.
As of
January 28, 2017
and
January 30, 2016
, interest rate swaps with notional amounts totaling
$1,000 million
and
$1,250 million
, respectively, were designated as fair value hedges.
No
ineffectiveness was recognized in
2016
or
2015
.
|
Outstanding Interest Rate Swap Summary
(a)
|
January 28, 2017
|
||||||
|
|
Designated
|
|
De-Designated
|
|
|||
|
(dollars in millions)
|
Pay Floating
|
|
Pay Floating
|
|
|||
|
Weighted average rate:
|
|
|
|||||
|
Pay
|
3-month LIBOR
|
|
1-month LIBOR
|
|
|||
|
Receive
|
1.8
|
%
|
1.3
|
%
|
|||
|
Weighted average maturity
|
2.4 years
|
|
1.0 year
|
|
|||
|
Notional
|
$
|
1,000
|
|
$
|
250
|
|
|
|
(a)
|
There are
two
designated swaps and
one
de-designated swap at
January 28, 2017
|
|
Classification and Fair Value
(millions)
|
Assets
|
Liabilities
|
|||||||||||||
|
Classification
|
Jan 28,
2017 |
|
Jan 30,
2016 |
|
Classification
|
Jan 28,
2017 |
|
Jan 30,
2016 |
|
||||||
|
Designated:
|
Other noncurrent assets
|
$
|
4
|
|
$
|
27
|
|
N/A
|
$
|
—
|
|
$
|
—
|
|
|
|
De-designated:
|
Other current assets
|
1
|
|
12
|
|
Other current liabilities
|
—
|
|
8
|
|
|||||
|
Total
|
|
$
|
5
|
|
$
|
39
|
|
|
$
|
—
|
|
$
|
8
|
|
|
Periodic payments, valuation adjustments, and amortization of gains or losses on our derivative contracts had the following effect on our Consolidated Statements of Operations:
|
Derivative Contracts – Effect on Results of Operations
(millions)
|
||||||||||
|
Type of Contract
|
Classification of (Income)/Expense
|
2016
|
|
2015
|
|
2014
|
|
|||
|
Interest rate swaps
|
Net interest expense
|
$
|
(24
|
)
|
$
|
(36
|
)
|
$
|
(32
|
)
|
45
22
. Leases
We lease certain retail locations, warehouses, distribution centers, office space, land, and equipment. Assets held under capital leases are included in property and equipment. Operating lease rentals are expensed on a straight-line basis over the life of the lease beginning on the date we take possession of the property. At lease inception, we determine the lease term by assuming the exercise of those renewal options that are reasonably assured. The exercise of lease renewal options is at our sole discretion. The lease term is used to determine whether a lease is capital or operating and is used to calculate straight-line rent expense. Additionally, the depreciable life of leased assets and leasehold improvements is limited by the expected lease term.
Rent expense is included in SG&A expenses. Some of our lease agreements include rental payments based on a percentage of retail sales over contractual levels and others include rental payments adjusted periodically for inflation. Certain leases require us to pay real estate taxes, insurance, maintenance, and other operating expenses associated with the leased premises. These expenses are classified in SG&A, consistent with similar costs for owned locations. CVS leases the space in our stores in which they operate CVS branded pharmacies and clinics. Rent income received from tenants who rent properties is recorded as a reduction to SG&A expense.
In February 2016, the FASB issued ASU No. 2016-02,
Leases.
The new standard requires lessees to record assets and liabilities on the balance sheet for all leases with terms longer than 12 months. Leases will be classified as either finance or operating, with classification affecting the pattern of expense recognition in the income statement.
We must adopt the standard no later than the first quarter of 2019, which begins on February 3, 2019. A modified retrospective transition approach is required for leases existing at, or entered into after, the beginning of the earliest comparative period presented in the financial statements.
We plan to adopt the standard in the first quarter of 2018. We expect to elect the package of practical expedients, including the use of hindsight to determine the lease term. While lease classification will remain unchanged, hindsight may result in different lease terms for certain leases and affect the timing of related depreciation, interest, and rent expense. We do not expect to apply the recognition requirements to short-term leases and will recognize those lease payments in the Consolidated Statements of Operations on a straight-line basis over the lease term.
We believe the most significant impact relates to our accounting for retail-store and office-space real estate leases, which will be recorded as assets and liabilities on our balance sheet upon adoption. We do not believe the new standard will have a notable impact on our liquidity. The standard will have no impact on our debt-covenant compliance under our current agreements.
|
Rent Expense
(millions)
|
2016
|
|
2015
|
|
2014
|
|
|||
|
Rent expense
|
$
|
202
|
|
$
|
198
|
|
$
|
195
|
|
|
Rent income
(a)
|
(54
|
)
|
(16
|
)
|
(9
|
)
|
|||
|
Total rent expense
|
$
|
148
|
|
$
|
182
|
|
$
|
186
|
|
(a)
Includes rental income from CVS from both ongoing rent payments and amortization of the deferred income liability related to the Pharmacy Transaction. See Note
6
for further discussion.
Total capital lease interest expense was
$49 million
,
$42 million
, and
$38 million
in
2016
,
2015
, and
2014
, respectively, and is included within net interest expense on the Consolidated Statements of Operations.
Most leases include
one
or more options to renew, with renewal terms that can extend the lease term from
one
to
50 years
or more. Certain leases also include options to purchase the leased property. Assets recorded under capital leases as of
January 28, 2017
and
January 30, 2016
were
$888 million
and
$735 million
, respectively. These assets are recorded net of accumulated amortization of
$406 million
and
$321 million
as of
January 28, 2017
and
January 30, 2016
, respectively.
46
|
Future Minimum Lease Payments
(millions)
|
Operating Leases
(a)
|
|
Capital Leases
(b)
|
|
Rent Income
|
|
Total
|
|
||||
|
2017
|
$
|
198
|
|
$
|
82
|
|
$
|
(22
|
)
|
$
|
258
|
|
|
2018
|
204
|
|
86
|
|
(21
|
)
|
269
|
|
||||
|
2019
|
194
|
|
88
|
|
(20
|
)
|
262
|
|
||||
|
2020
|
184
|
|
89
|
|
(20
|
)
|
253
|
|
||||
|
2021
|
180
|
|
89
|
|
(19
|
)
|
250
|
|
||||
|
After 2021
|
2,916
|
|
1,529
|
|
(286
|
)
|
4,159
|
|
||||
|
Total future minimum lease payments
|
$
|
3,876
|
|
$
|
1,963
|
|
$
|
(388
|
)
|
$
|
5,451
|
|
|
Less: Interest
(c)
|
|
|
938
|
|
|
|
|
|
||||
|
Present value of future minimum capital lease payments
(d)
|
|
|
$
|
1,025
|
|
|
|
|
|
|||
Note: Minimum lease payments exclude payments to landlords for real estate taxes and common area maintenance. Minimum lease payments also exclude payments to landlords for fixed purchase options which we believe are reasonably assured of being exercised.
|
(a)
|
Total contractual lease payments include
$2,024 million
related to options to extend lease terms that are reasonably assured of being exercised and also includes
$269 million
of legally binding minimum lease payments for stores that are expected to open in 2017 or later.
|
|
(b)
|
Capital lease payments include
$608 million
related to options to extend lease terms that are reasonably assured of being exercised and also includes
$348 million
of legally binding minimum lease payments for stores that are expected to open in 2017 or later.
|
|
(c)
|
Calculated using the interest rate at inception for each lease.
|
|
(d)
|
Includes the current portion of
$31 million
.
|
23
. Income Taxes
Earnings from continuing operations before income taxes were
$3,965 million
,
$4,923 million
, and
$3,653 million
during
2016
,
2015
, and
2014
, respectively, including
$336 million
,
$373 million
, and
$261 million
earned by our foreign entities subject to tax outside of the U.S.
|
Tax Rate Reconciliation – Continuing Operations
|
2016
|
|
2015
|
|
2014
|
|
|
Federal statutory rate
|
35.0
|
%
|
35.0
|
%
|
35.0
|
%
|
|
State income taxes, net of the federal tax benefit
|
2.7
|
|
3.0
|
|
2.2
|
|
|
International
|
(2.6
|
)
|
(2.3
|
)
|
(2.3
|
)
|
|
Excess tax benefit related to share-based payments
(a)
|
(0.6
|
)
|
—
|
|
—
|
|
|
Change in valuation allowance
|
—
|
|
(2.3
|
)
|
—
|
|
|
Other
|
(1.8
|
)
|
(0.9
|
)
|
(1.9
|
)
|
|
Effective tax rate
|
32.7
|
%
|
32.5
|
%
|
33.0
|
%
|
(a)
Refer to Note 26.
|
Provision for Income Taxes
(millions)
|
2016
|
|
2015
|
|
2014
|
|
|||
|
Current:
|
|
|
|
||||||
|
Federal
|
$
|
1,108
|
|
$
|
1,652
|
|
$
|
1,074
|
|
|
State
|
141
|
|
265
|
|
116
|
|
|||
|
International
|
6
|
|
7
|
|
7
|
|
|||
|
Total current
|
1,255
|
|
1,924
|
|
1,197
|
|
|||
|
Deferred:
|
|
|
|
||||||
|
Federal
|
21
|
|
(272
|
)
|
(2
|
)
|
|||
|
State
|
21
|
|
(50
|
)
|
10
|
|
|||
|
International
|
(1
|
)
|
—
|
|
(1
|
)
|
|||
|
Total deferred
|
41
|
|
(322
|
)
|
7
|
|
|||
|
Total provision
|
$
|
1,296
|
|
$
|
1,602
|
|
$
|
1,204
|
|
47
|
Net Deferred Tax Asset/(Liability)
(millions)
|
January 28,
2017 |
|
January 30,
2016 |
|
||
|
Gross deferred tax assets:
|
|
|
||||
|
Accrued and deferred compensation
|
$
|
455
|
|
$
|
476
|
|
|
Accruals and reserves not currently deductible
|
328
|
|
323
|
|
||
|
Self-insured benefits
|
178
|
|
199
|
|
||
|
Prepaid store-in-store lease income
|
258
|
|
270
|
|
||
|
Other
|
62
|
|
90
|
|
||
|
Total gross deferred tax assets
|
1,281
|
|
1,358
|
|
||
|
Gross deferred tax liabilities:
|
|
|
||||
|
Property and equipment
|
(1,822
|
)
|
(1,790
|
)
|
||
|
Inventory
|
(182
|
)
|
(190
|
)
|
||
|
Other
|
(102
|
)
|
(168
|
)
|
||
|
Total gross deferred tax liabilities
|
(2,106
|
)
|
(2,148
|
)
|
||
|
Total net deferred tax liability
|
$
|
(825
|
)
|
$
|
(790
|
)
|
In 2014, we incurred a tax effected capital loss of
$112 million
within discontinued operations from our exit from Canada. At that time, we neither had nor anticipated sufficient capital gains to absorb this capital loss, and established a full valuation allowance within discontinued operations. In 2015, we released the entire
$112 million
valuation allowance due to a capital gain resulting from the Pharmacy Transaction. The benefit of the valuation allowance release was recorded in continuing operations in 2015.
Deferred tax assets and liabilities are recognized for the future tax consequences attributable to temporary differences between financial statement carrying amounts of existing assets and liabilities and their respective tax bases. Deferred tax assets and liabilities are measured using enacted income tax rates in effect for the year the temporary differences are expected to be recovered or settled. Tax rate changes affecting deferred tax assets and liabilities are recognized at the enactment date.
We have not recorded deferred taxes when earnings from foreign operations are considered to be indefinitely invested outside the U.S. These accumulated net earnings relate to certain ongoing operations and were
$993 million
at
January 28, 2017
and
$685 million
at
January 30, 2016
. It is not practicable to determine the income tax liability that would be payable if such earnings were repatriated.
We file a U.S. federal income tax return and income tax returns in various states and foreign jurisdictions. The U.S. Internal Revenue Service has completed exams on the U.S. federal income tax returns for years 2012 and prior. With few exceptions, we are no longer subject to state and local or non-U.S. income tax examinations by tax authorities for years before 2008.
|
Reconciliation of Liability for Unrecognized Tax Benefits
(millions)
|
2016
|
|
2015
|
|
2014
|
|
|||
|
Balance at beginning of period
|
$
|
153
|
|
$
|
155
|
|
$
|
183
|
|
|
Additions based on tax positions related to the current year
|
12
|
|
10
|
|
10
|
|
|||
|
Additions for tax positions of prior years
|
6
|
|
14
|
|
17
|
|
|||
|
Reductions for tax positions of prior years
|
(16
|
)
|
(26
|
)
|
(42
|
)
|
|||
|
Settlements
|
(2
|
)
|
—
|
|
(13
|
)
|
|||
|
Balance at end of period
|
$
|
153
|
|
$
|
153
|
|
$
|
155
|
|
48
If we were to prevail on all unrecognized tax benefits recorded,
$100 million
of the
$153 million
reserve would benefit the effective tax rate. In addition, the reversal of accrued penalties and interest would also benefit the effective tax rate. Interest and penalties associated with unrecognized tax benefits are recorded within income tax expense. During the years ended
January 28, 2017
,
January 30, 2016
, and
January 31, 2015
, we recorded an expense
/
(benefit) from accrued penalties and interest of
$1 million
,
$5 million
, and
$(12) million
, respectively. As of
January 28, 2017
,
January 30, 2016
, and
January 31, 2015
total accrued interest and penalties were
$45 million
,
$44 million
, and
$40 million
, respectively.
It is reasonably possible that the amount of the unrecognized tax benefits with respect to our other unrecognized tax positions will increase or decrease during the next
twelve months
; however, an estimate of the amount or range of the change cannot be made at this time.
24
. Other Noncurrent Liabilities
|
Other Noncurrent Liabilities
(millions)
|
January 28,
2017 |
|
January 30,
2016 |
|
||
|
Deferred income liability
(a)
|
$
|
630
|
|
$
|
660
|
|
|
Deferred compensation
|
473
|
|
454
|
|
||
|
Workers' compensation and general liability
(b)
|
306
|
|
353
|
|
||
|
Income tax
|
125
|
|
122
|
|
||
|
Pension benefits
|
46
|
|
54
|
|
||
|
Other
|
280
|
|
254
|
|
||
|
Total
|
$
|
1,860
|
|
$
|
1,897
|
|
|
(a)
|
Represents deferred income related to the Pharmacy Transaction. See Note
6
for more information.
|
|
(b)
|
See footnote
(b)
to the Accrued and Other Current Liabilities table in Note
18
for additional detail.
|
25
. Share Repurchase
|
Share Repurchases
(millions, except per share data)
|
2016
|
|
2015
|
|
2014
|
|
|||
|
Total number of shares purchased
|
50.9
|
|
44.7
|
|
0.8
|
|
|||
|
Average price paid per share
|
$
|
72.35
|
|
$
|
77.07
|
|
$
|
54.07
|
|
|
Total investment
|
$
|
3,686
|
|
$
|
3,441
|
|
$
|
41
|
|
26
. Share-Based Compensation
We maintain a long-term incentive plan (the Plan) for key team members and non-employee members of our Board of Directors. The Plan allows us to grant equity-based compensation awards, including stock options, stock appreciation rights, performance share units, restricted stock units, restricted stock awards, or a combination of awards (collectively, share-based awards). The number of unissued common shares reserved for future grants under the Plan was
31.0 million
and
31.5 million
at
January 28, 2017
and
January 30, 2016
, respectively.
Compensation expense associated with share-based awards is recognized on a straight-line basis over the shorter of the vesting period or the minimum required service period. Share-based compensation expense recognized in the Consolidated Statements of Operations was
$116 million
,
$118 million
, and
$73 million
in
2016
,
2015
, and
2014
, respectively. The related income tax benefit was
$43 million
,
$46 million
, and
$29 million
in
2016
,
2015
, and
2014
, respectively.
49
During the first quarter of 2016, we adopted Accounting Standards Update (ASU) No. 2016-09,
Improvements to Employee Share-Based Payment Accounting
(ASU 2016-09). As a result of adoption, we recognized
$27 million
of excess tax benefits related to share-based payments in our provision for income taxes for 2016. These items were historically recorded in additional paid-in capital. In addition, for each period presented, cash flows related to excess tax benefits are classified as an operating activity along with other income tax cash flows. Cash paid on employees' behalf related to shares withheld for tax purposes is classified as a financing activity. Retrospective application of the cash flow presentation resulted in increases to both net cash provided by operations and net cash required for financing activities of
$113 million
and
$26 million
for 2015 and 2014, respectively. Compensation expense each period continues to reflect estimated forfeitures.
Restricted Stock Units
We issue restricted stock units and performance-based restricted stock units generally with
three
-year cliff vesting from the grant date (collectively restricted stock units) to certain team members. The final number of shares issued under performance-based restricted stock units will be based on our total shareholder return relative to a retail peer group over a
three
-year performance period. We also regularly issue restricted stock units to our Board of Directors, which vest quarterly over a
one
-year period and are settled in shares of Target common stock upon departure from the Board. The fair value for restricted stock units is calculated based on the stock price on the date of grant, incorporating an analysis of the total shareholder return performance measure where applicable. The weighted average grant date fair value for restricted stock units was
$74.05
,
$73.76
, and
$70.50
in
2016
,
2015
, and
2014
, respectively.
|
Restricted Stock Unit Activity
|
Total Nonvested Units
|
||||
|
|
Restricted
Stock
(a)
|
|
Grant Date
Fair Value
(b)
|
|
|
|
January 30, 2016
|
4,226
|
|
$
|
69.49
|
|
|
Granted
|
639
|
|
74.05
|
|
|
|
Forfeited
|
(358
|
)
|
71.37
|
|
|
|
Vested
|
(1,168
|
)
|
64.37
|
|
|
|
January 28, 2017
|
3,339
|
|
$
|
71.62
|
|
|
(a)
|
Represents the number of shares of restricted stock units, in thousands. For performance-based restricted stock units, assumes attainment of maximum payout rates as set forth in the performance criteria. Applying actual or expected payout rates, the number of outstanding restricted stock units and performance-based restricted stock units at
January 28, 2017
was
2,765 thousand
.
|
|
(b)
|
Weighted average per unit.
|
The expense recognized each period is partially dependent upon our estimate of the number of shares that will ultimately be issued. At
January 28, 2017
, there was
$96 million
of total unrecognized compensation expense related to restricted stock units, which is expected to be recognized over a weighted average period of
1.8
years. The fair value of restricted stock units vested and converted to shares of Target common stock was
$75 million
,
$90 million
, and
$40 million
in
2016
,
2015
, and
2014
, respectively.
Performance Share Units
We issue performance share units to certain team members that represent shares potentially issuable in the future. Issuance is based upon our performance relative to a retail peer group over a
three
-year performance period on certain measures including domestic market share change, return on invested capital, and EPS growth. In 2015 we also issued strategic alignment performance share units to certain team members. Issuance is based on performance against
four
strategic metrics identified as vital to Target's success, including total sales growth, digital channel sales growth, EBIT growth, and return on invested capital, over a
two
-year performance period. The fair value of performance share units is calculated based on the stock price on the date of grant. The weighted average grant date fair value for performance share units was
$71.37
,
$74.19
, and
$73.12
in
2016
,
2015
, and
2014
, respectively.
50
|
Performance Share Unit Activity
|
Total Nonvested Units
|
||||
|
|
Performance
Share Units
(a)
|
|
Grant Date
Fair Value
(b)
|
|
|
|
January 30, 2016
|
4,023
|
|
$
|
70.70
|
|
|
Granted
|
712
|
|
71.37
|
|
|
|
Forfeited
|
(754
|
)
|
73.21
|
|
|
|
Vested
|
(8
|
)
|
63.54
|
|
|
|
January 28, 2017
|
3,973
|
|
$
|
70.55
|
|
|
(a)
|
Represents the number of performance share units, in thousands. Assumes attainment of maximum payout rates as set forth in the performance criteria. Applying actual or expected payout rates, the number of outstanding units at
January 28, 2017
was
1,799 thousand
.
|
|
(b)
|
Weighted average per unit.
|
The expense recognized each period is partially dependent upon our estimate of the number of shares that will ultimately be issued. Future compensation expense for unvested awards could reach a maximum of
$191 million
assuming payout of all unvested awards. The unrecognized expense is expected to be recognized over a weighted average period of
1.9
years. The fair value of performance share units vested and converted to shares of Target common stock was
$1 million
in
2016
,
$2 million
in
2015
, and
$11 million
in
2014
.
Stock Options
Through 2013, we granted nonqualified stock options to certain team members. Virtually all are vested and currently exercisable.
|
Stock Option Activity
|
Stock Options
|
||||||||||||||||
|
|
Total Outstanding
|
Exercisable
|
|||||||||||||||
|
|
Number of
Options
(a)
|
|
Exercise
Price
(b)
|
|
Intrinsic
Value
(c)
|
|
Number of
Options
(a)
|
|
Exercise
Price
(b)
|
|
Intrinsic
Value
(c)
|
|
|||||
|
January 30, 2016
|
10,500
|
|
$
|
53.47
|
|
$
|
199
|
|
9,405
|
|
$
|
52.57
|
|
$
|
187
|
|
|
|
Granted
|
—
|
|
—
|
|
|
|
|
|
|
|
|
|
|||||
|
Expired/forfeited
|
(133
|
)
|
60.24
|
|
|
|
|
|
|
|
|
|
|||||
|
Exercised/issued
|
(4,157
|
)
|
52.93
|
|
|
|
|
|
|
|
|
|
|||||
|
January 28, 2017
|
6,210
|
|
$
|
53.68
|
|
$
|
63
|
|
6,180
|
|
$
|
53.60
|
|
$
|
63
|
|
|
|
(a)
|
In thousands.
|
|
(b)
|
Weighted average per share.
|
|
(c)
|
Represents stock price appreciation subsequent to the grant date, in millions.
|
|
Stock Option Exercises
(millions)
|
2016
|
|
2015
|
|
2014
|
|
|||
|
Cash received for exercise price
|
$
|
219
|
|
$
|
303
|
|
$
|
374
|
|
|
Intrinsic value
|
103
|
|
159
|
|
143
|
|
|||
|
Income tax benefit
|
40
|
|
77
|
|
41
|
|
|||
The weighted average remaining life of outstanding options is
3.9
years. The total fair value of options vested was
$9 million
,
$23 million
, and
$37 million
in
2016
,
2015
, and
2014
, respectively.
27
. Defined Contribution Plans
Team members who meet eligibility requirements can participate in a defined contribution 401(k) plan by investing up to
80 percent
of their compensation, as limited by statute or regulation. Generally, we match
100 percent
of each team member's contribution up to
5 percent
of total compensation. Company match contributions are made to funds designated by the participant.
In addition, we maintain a nonqualified, unfunded deferred compensation plan for approximately
2,200
current and retired team members whose participation in our 401(k) plan is limited by statute or regulation. These team members choose from a menu of crediting rate alternatives that are the same as the investment choices in our 401(k) plan,
51
including Target common stock. We credit an additional
2 percent
per year to the accounts of all active participants, excluding executive officers, in part to recognize the risks inherent to their participation in this plan. We also maintain a frozen nonqualified, unfunded deferred compensation plan covering approximately
50
participants. Our total liability under these plans was
$514 million
and
$497 million
at
January 28, 2017
and
January 30, 2016
, respectively.
We mitigate some of our risk of offering the nonqualified plans through investing in company-owned life insurance that offsets a substantial portion of our economic exposure to the returns of these plans. These investments are general corporate assets and are marked to market with the related gains and losses recognized in the Consolidated Statements of Operations in the period they occur. See Note 15 for additional information.
|
Plan Expenses
|
|
|
|
||||||
|
(millions)
|
2016
|
|
2015
|
|
2014
|
|
|||
|
401(k) plan matching contributions expense
|
$
|
197
|
|
$
|
224
|
|
$
|
220
|
|
|
Nonqualified deferred compensation plans
|
|
|
|
||||||
|
Benefits expense
(a)
|
58
|
|
5
|
|
52
|
|
|||
|
Related investment (income) expense
(b)
|
(38
|
)
|
15
|
|
(45
|
)
|
|||
|
Nonqualified plan net expense
|
$
|
20
|
|
$
|
20
|
|
$
|
7
|
|
|
(a)
|
Includes market-performance credits on accumulated participant account balances and annual crediting for additional benefits earned during the year.
|
|
(b)
|
Includes investment returns and life-insurance proceeds received from company-owned life insurance policies and other investments used to economically hedge the cost of these plans.
|
28
. Pension and Postretirement Health Care Plans
Pension Plans
We have qualified defined benefit pension plans covering team members who meet age and service requirements, including date of hire in certain circumstances. Effective January 1, 2009, our U.S. qualified defined benefit pension plan was closed to new participants, with limited exceptions. We also have unfunded nonqualified pension plans for team members with qualified plan compensation restrictions. Eligibility for, and the level of, these benefits varies depending on each team members' date of hire, length of service and/or team member compensation.
|
Funded Status
|
Qualified Plans
|
Nonqualified Plans
|
|||||||||||
|
(millions)
|
2016
|
|
2015
|
|
2016
|
|
2015
|
|
|||||
|
Projected benefit obligations
|
$
|
3,760
|
|
$
|
3,558
|
|
$
|
32
|
|
$
|
39
|
|
|
|
Fair value of plan assets
|
3,785
|
|
3,607
|
|
—
|
|
—
|
|
|||||
|
Funded
/
(underfunded) status
|
$
|
25
|
|
$
|
49
|
|
$
|
(32
|
)
|
$
|
(39
|
)
|
|
Contributions and Estimated Future Benefit Payments
Our obligations to plan participants can be met over time through a combination of company contributions to these plans and earnings on plan assets. In 2016 we made no contributions to our qualified defined benefit pension plans. In 2015 we made a discretionary contribution of
$200 million
. We are not required to make any contributions in 2017. However, depending on investment performance and plan funded status, we may elect to make a contribution.
|
Estimated Future Benefit Payments
(millions)
|
Pension
Benefits
|
|
|
|
2017
|
$
|
163
|
|
|
2018
|
171
|
|
|
|
2019
|
179
|
|
|
|
2020
|
188
|
|
|
|
2021
|
197
|
|
|
|
2022-2026
|
1,112
|
|
|
52
Cost of Plans
|
Net Pension Benefits Expense
|
|||||||||
|
(millions)
|
2016
|
|
2015
|
|
2014
|
|
|||
|
Service cost benefits earned during the period
|
$
|
87
|
|
$
|
109
|
|
$
|
112
|
|
|
Interest cost on projected benefit obligation
|
134
|
|
154
|
|
149
|
|
|||
|
Expected return on assets
|
(256
|
)
|
(260
|
)
|
(233
|
)
|
|||
|
Amortization of losses
|
46
|
|
82
|
|
65
|
|
|||
|
Amortization of prior service cost
(a)
|
(11
|
)
|
(11
|
)
|
(11
|
)
|
|||
|
Settlement and special termination charges
|
2
|
|
4
|
|
—
|
|
|||
|
Total
|
$
|
2
|
|
$
|
78
|
|
$
|
82
|
|
|
(a)
|
Determined using the straight-line method over the average remaining service period of team members expected to receive benefits under the plan.
|
Assumptions
|
Benefit Obligation Weighted Average Assumptions
|
||||
|
|
2016
|
|
2015
|
|
|
Discount rate
|
4.40
|
%
|
4.70
|
%
|
|
Average assumed rate of compensation increase
|
3.00
|
|
3.00
|
|
|
Net Periodic Benefit Expense Weighted Average Assumptions
|
||||||
|
|
2016
|
|
2015
|
|
2014
|
|
|
Discount rate
|
4.70
|
%
|
3.87
|
%
|
4.77
|
%
|
|
Expected long-term rate of return on plan assets
|
6.80
|
|
7.50
|
|
7.50
|
|
|
Average assumed rate of compensation increase
|
3.00
|
|
3.00
|
|
3.00
|
|
The weighted average assumptions used to measure net periodic benefit expense each year are the rates as of the beginning of the year (i.e., the prior measurement date). Based on a stable asset allocation, our most recent compound annual rate of return on qualified plans' assets was
7.7 percent
,
6.4 percent
,
7.7 percent
, and
8.2 percent
for the
5
-year,
10
-year,
15
-year, and
20
-year time periods, respectively.
The market-related value of plan assets, which is used in calculating expected return on assets in net periodic benefit cost, is determined each year by adjusting the previous year's value by expected return, benefit payments, and cash contributions. The market-related value is adjusted for asset gains and losses in equal
20 percent
adjustments over a
five
-year period.
We review the expected long-term rate of return annually and revise it as appropriate. Additionally, we monitor the mix of investments in our portfolio to ensure alignment with our long-term strategy to manage pension cost and reduce volatility in our assets. Our expected annualized long-term rate of return assumptions as of
January 28, 2017
were
8.0 percent
for domestic and international equity securities,
5.0 percent
for long-duration debt securities,
8.0 percent
for balanced funds, and
9.5 percent
for other investments. These estimates are a judgmental matter in which we consider the composition of our asset portfolio, our historical long-term investment performance, and current market conditions.
53
Benefit Obligation
|
Change in Projected Benefit Obligation
|
Qualified Plans
|
Nonqualified Plans
|
|||||||||||
|
(millions)
|
2016
|
|
2015
|
|
2016
|
|
2015
|
|
|||||
|
Benefit obligation at beginning of period
|
$
|
3,558
|
|
$
|
3,844
|
|
$
|
39
|
|
$
|
43
|
|
|
|
Service cost
|
86
|
|
108
|
|
1
|
|
1
|
|
|||||
|
Interest cost
|
133
|
|
152
|
|
1
|
|
2
|
|
|||||
|
Actuarial loss
/
(gain)
|
156
|
|
(400
|
)
|
(2
|
)
|
(4
|
)
|
|||||
|
Participant contributions
|
7
|
|
6
|
|
—
|
|
—
|
|
|||||
|
Benefits paid
|
(180
|
)
|
(155
|
)
|
(7
|
)
|
(3
|
)
|
|||||
|
Plan amendments
|
—
|
|
3
|
|
—
|
|
—
|
|
|||||
|
Benefit obligation at end of period
(a)
|
$
|
3,760
|
|
$
|
3,558
|
|
$
|
32
|
|
$
|
39
|
|
|
|
(a)
|
Accumulated benefit obligation—the present value of benefits earned to date assuming no future salary growth—is materially consistent with the projected benefit obligation in each period presented.
|
Plan Assets
|
Change in Plan Assets
|
Qualified Plans
|
Nonqualified Plans
|
|||||||||||
|
(millions)
|
2016
|
|
2015
|
|
2016
|
|
2015
|
|
|||||
|
Fair value of plan assets at beginning of period
|
$
|
3,607
|
|
$
|
3,784
|
|
$
|
—
|
|
$
|
—
|
|
|
|
Actual return on plan assets
|
349
|
|
(231
|
)
|
—
|
|
—
|
|
|||||
|
Employer contributions
|
2
|
|
203
|
|
7
|
|
3
|
|
|||||
|
Participant contributions
|
7
|
|
6
|
|
—
|
|
—
|
|
|||||
|
Benefits paid
|
(180
|
)
|
(155
|
)
|
(7
|
)
|
(3
|
)
|
|||||
|
Fair value of plan assets at end of period
|
$
|
3,785
|
|
$
|
3,607
|
|
$
|
—
|
|
$
|
—
|
|
|
Our asset allocation policy is designed to reduce the long-term cost of funding our pension obligations. The plan invests with both passive and active investment managers depending on the investment. The plan also seeks to reduce the risk associated with adverse movements in interest rates by employing an interest rate hedging program, which may include the use of interest rate swaps, total return swaps, and other instruments.
54
|
Asset Category
|
Current Targeted
|
|
Actual Allocation
|
|||
|
|
Allocation
|
|
2016
|
|
2015
|
|
|
Domestic equity securities
(a)
|
14
|
%
|
14
|
%
|
16
|
%
|
|
International equity securities
|
9
|
|
9
|
|
10
|
|
|
Debt securities
|
45
|
|
43
|
|
44
|
|
|
Balanced funds
|
23
|
|
25
|
|
21
|
|
|
Other
(b)
|
9
|
|
9
|
|
9
|
|
|
Total
|
100
|
%
|
100
|
%
|
100
|
%
|
|
(a)
|
Equity securities include our common stock in amounts substantially less than
1 percent
of total plan assets as of
January 28, 2017
and
January 30, 2016
.
|
|
(b)
|
Other assets include private equity, mezzanine and high-yield debt, natural resources and timberland funds, multi-strategy hedge funds, derivative instruments, and real estate. The real estate allocation represents
4 percent
of total assets.
|
|
Fair Value Measurements
|
Fair Value at
|
|||||||
|
(millions)
|
Pricing Category
|
January 31, 2017
|
|
January 30, 2016
|
|
|||
|
Cash and cash equivalents
|
Level 1
|
$
|
5
|
|
$
|
43
|
|
|
|
Government securities
(a)
|
Level 2
|
477
|
|
470
|
|
|||
|
Fixed income
(b)
|
Level 2
|
1,080
|
|
979
|
|
|||
|
Other
(c)
|
Level 2
|
4
|
|
8
|
|
|||
|
1,566
|
|
1,500
|
|
|||||
|
Investments valued using NAV per share
(d)
|
||||||||
|
Cash and cash equivalents
|
168
|
|
455
|
|
||||
|
Common collective trusts
|
768
|
|
544
|
|
||||
|
Fixed Income
|
51
|
|
49
|
|
||||
|
Balanced funds
|
942
|
|
756
|
|
||||
|
Private equity funds
|
126
|
|
141
|
|
||||
|
Other
|
164
|
|
162
|
|
||||
|
Total plan assets
|
$
|
3,785
|
|
$
|
3,607
|
|
||
|
(a)
|
Investments in government securities and long-term government bonds.
|
|
(b)
|
Investments in corporate and municipal bonds.
|
|
(c)
|
Investments in derivative investments.
|
|
(d)
|
In accordance with Subtopic 820-10, certain investments that are measured at fair value using the net asset value per share (or its equivalent) practical expedient have not been classified in the fair value hierarchy. The fair value amounts presented in this table are intended to permit reconciliation of the fair value hierarchy to the amounts presented in the statement of financial position.
|
|
Position
|
|
Valuation Technique
|
|
Cash and cash equivalents
|
|
Carrying value approximates fair value.
|
|
Government securities
and fixed income
|
|
Valued using matrix pricing models and quoted prices of securities with similar characteristics.
|
|
Derivatives
|
|
Swap derivatives - Valued initially using models calibrated to initial trade price. Subsequent valuations are based on observable inputs to the valuation model (e.g., interest rates and credit spreads). Model inputs are changed only when corroborated by market data. A credit risk adjustment is made on each swap using observable market credit spreads.
Option derivatives - Valued at transaction price initially. Subsequent valuations are based on observable inputs to the valuation model (e.g., underlying investments).
|
55
Amounts Included in Shareholders' Equity
|
Amounts in Accumulated Other Comprehensive Income
|
||||||
|
(millions)
|
2016
|
|
2015
|
|
||
|
Net actuarial loss
|
$
|
1,035
|
|
$
|
1,022
|
|
|
Prior service credits
|
(46
|
)
|
(57
|
)
|
||
|
Amounts in accumulated other comprehensive income
(a)(b)
|
$
|
989
|
|
$
|
965
|
|
|
(a)
|
$601 million
and
$583 million
, net of tax, at the end of 2016 and 2015, respectively.
|
|
(b)
|
We expect 2017 net pension expense to include amortization expense of
$49 million
(
$30 million
, net of tax) to net actuarial loss and prior service credit balances included in accumulated other comprehensive income.
|
Postretirement Health Care
Effective April 1, 2016, we discontinued the postretirement health care benefits that were offered to team members upon early retirement and prior to Medicare eligibility. This decision resulted in a
$58 million
reduction in the projected postretirement health care benefit obligation and a
$43 million
curtailment gain recorded in SG&A during 2015. As of January 30, 2016, we extinguished the remaining benefit obligation related to this plan.
29
. Accumulated Other Comprehensive Income
|
(millions)
|
Cash Flow
Hedges
|
|
Currency
Translation
Adjustment
|
|
Pension and
Other
Benefit
|
|
Total
|
|
|||||||
|
January 30, 2016
|
$
|
(19
|
)
|
$
|
(22
|
)
|
$
|
(588
|
)
|
$
|
(629
|
)
|
|||
|
Other comprehensive income
/
(loss) before reclassifications
|
—
|
|
1
|
|
(32
|
)
|
(31
|
)
|
|||||||
|
Amounts reclassified from AOCI
|
3
|
|
(a)
|
—
|
|
19
|
|
(b)
|
22
|
|
|||||
|
January 28, 2017
|
$
|
(16
|
)
|
$
|
(21
|
)
|
$
|
(601
|
)
|
$
|
(638
|
)
|
|||
|
(a)
|
Represents gains and losses on cash flow hedges, net of
$2 million
of taxes, which are recorded in net interest expense on the Consolidated Statements of Operations.
|
|
(b)
|
Represents amortization of pension and other benefit liabilities, net of
$12 million
of taxes, which is recorded in SG&A expenses on the Consolidated Statements of Operations. See Note
28
for additional information.
|
56
30
. Segment Reporting
Our segment measure of profit is used by management to evaluate the return on our investment and to make operating decisions. Effective January 15, 2015, following the deconsolidation of our former Canadian retail operation, we have been operating as a single segment that includes all of our continuing operations, which are designed to enable guests to purchase products seamlessly in stores or through our digital channels.
|
Business Segment Results
|
2016
|
|
2015
|
|
2014
|
|
|||||
|
(millions)
|
|||||||||||
|
Sales
|
$
|
69,495
|
|
$
|
73,785
|
|
$
|
72,618
|
|
||
|
Cost of sales
|
48,872
|
|
51,997
|
|
51,278
|
|
|||||
|
Gross margin
|
20,623
|
|
21,788
|
|
21,340
|
|
|||||
|
Selling, general, and administrative expenses
(e)
|
13,360
|
|
14,448
|
|
14,503
|
|
|||||
|
Depreciation and amortization
|
2,298
|
|
2,213
|
|
2,129
|
|
|||||
|
Segment earnings before interest expense and income taxes
|
4,965
|
|
5,127
|
|
4,708
|
|
|||||
|
Gain on sale
(a)
|
—
|
|
620
|
|
—
|
|
|||||
|
Restructuring costs
(b)(e)
|
—
|
|
(138
|
)
|
—
|
|
|||||
|
Data breach-related costs, net of insurance
(c)(e)
|
—
|
|
(39
|
)
|
(145
|
)
|
|||||
|
Other
(d)(e)
|
4
|
|
(39
|
)
|
(29
|
)
|
|||||
|
Earnings from continuing operations before interest expense and income taxes
|
4,969
|
|
5,530
|
|
4,535
|
|
|||||
|
Net interest expense
|
1,004
|
|
607
|
|
882
|
|
|||||
|
Earnings from continuing operations before income taxes
|
$
|
3,965
|
|
$
|
4,923
|
|
$
|
3,653
|
|
||
Note: The sum of the segment amounts may not equal the total amounts due to rounding.
|
(a)
|
For 2015, represents the gain on the Pharmacy Transaction.
|
|
(b)
|
Refer to Note
8
for more information on restructuring costs.
|
|
(c)
|
Refer to Note
19
for more information on data breach-related costs.
|
|
(d)
|
For 2016, represents items related to the Pharmacy Transaction. For 2015, represents impairments related to our decision to wind down certain noncore operations. For 2014, includes impairments of
$16 million
related to undeveloped land in the U.S. and
$13 million
of expense related to converting co-branded card program to MasterCard.
|
|
(e)
|
The sum of segment SG&A expenses, restructuring costs, data breach-related costs, and other charges equal consolidated SG&A expenses.
|
|
Total Assets by Segment
(millions)
|
January 28,
2017 |
|
January 30,
2016 |
|
||
|
U.S.
|
$
|
37,350
|
|
$
|
39,845
|
|
|
Assets of discontinued operations
|
81
|
|
397
|
|
||
|
Unallocated assets
(a)
|
—
|
|
20
|
|
||
|
Total assets
|
$
|
37,431
|
|
$
|
40,262
|
|
|
(a)
|
Represents the insurance receivable related to the 2013 data breach.
|
57
31
. Quarterly Results (Unaudited)
Due to the seasonal nature of our business, fourth quarter operating results typically represent a substantially larger share of total year revenues and earnings because they include our peak sales period of November and December. We follow the same accounting policies for preparing quarterly and annual financial data. The table below summarizes quarterly results for
2016
and
2015
:
|
Quarterly Results
|
First Quarter
|
Second Quarter
|
Third Quarter
|
Fourth Quarter
|
Total Year
|
|||||||||||||||||||||||||||||
|
(millions, except per share data)
|
2016
|
|
2015
|
|
2016
|
|
2015
|
|
2016
|
|
2015
|
|
2016
|
|
2015
|
|
2016
|
|
2015
|
|
||||||||||||||
|
Sales
|
$
|
16,196
|
|
$
|
17,119
|
|
$
|
16,169
|
|
$
|
17,427
|
|
$
|
16,441
|
|
$
|
17,613
|
|
$
|
20,690
|
|
$
|
21,626
|
|
$
|
69,495
|
|
$
|
73,785
|
|
||||
|
Cost of sales
|
11,185
|
|
11,911
|
|
11,102
|
|
12,051
|
|
11,471
|
|
12,440
|
|
15,116
|
|
15,594
|
|
48,872
|
|
51,997
|
|
||||||||||||||
|
Gross margin
|
5,011
|
|
5,208
|
|
5,067
|
|
5,376
|
|
4,970
|
|
5,173
|
|
5,574
|
|
6,032
|
|
20,623
|
|
21,788
|
|
||||||||||||||
|
Selling, general, and administrative expenses
|
3,153
|
|
3,514
|
|
3,249
|
|
3,495
|
|
3,339
|
|
3,736
|
|
3,614
|
|
3,921
|
|
13,356
|
|
14,665
|
|
||||||||||||||
|
Depreciation and amortization
|
546
|
|
540
|
|
570
|
|
551
|
|
570
|
|
561
|
|
612
|
|
562
|
|
2,298
|
|
2,213
|
|
||||||||||||||
|
Gain on sale
|
—
|
|
—
|
|
—
|
|
—
|
|
—
|
|
—
|
|
—
|
|
(620
|
)
|
—
|
|
(620
|
)
|
||||||||||||||
|
Earnings before interest expense and income taxes
|
1,312
|
|
1,154
|
|
1,248
|
|
1,330
|
|
1,061
|
|
876
|
|
1,348
|
|
2,169
|
|
4,969
|
|
5,530
|
|
||||||||||||||
|
Net interest expense
|
415
|
|
155
|
|
307
|
|
148
|
|
142
|
|
151
|
|
140
|
|
152
|
|
1,004
|
|
607
|
|
||||||||||||||
|
Earnings from continuing operations before income taxes
|
897
|
|
999
|
|
941
|
|
1,182
|
|
919
|
|
725
|
|
1,208
|
|
2,017
|
|
3,965
|
|
4,923
|
|
||||||||||||||
|
Provision for income taxes
|
283
|
|
348
|
|
316
|
|
409
|
|
311
|
|
249
|
|
387
|
|
596
|
|
1,296
|
|
1,602
|
|
||||||||||||||
|
Net earnings from continuing operations
|
614
|
|
651
|
|
625
|
|
773
|
|
608
|
|
476
|
|
821
|
|
1,421
|
|
2,669
|
|
3,321
|
|
||||||||||||||
|
Discontinued operations, net of tax
|
18
|
|
(16
|
)
|
55
|
|
(20
|
)
|
—
|
|
73
|
|
(4
|
)
|
5
|
|
68
|
|
42
|
|
||||||||||||||
|
Net earnings
|
$
|
632
|
|
$
|
635
|
|
$
|
680
|
|
$
|
753
|
|
$
|
608
|
|
$
|
549
|
|
$
|
817
|
|
$
|
1,426
|
|
$
|
2,737
|
|
$
|
3,363
|
|
||||
|
Basic earnings/(loss) per share
|
||||||||||||||||||||||||||||||||||
|
Continuing operations
|
$
|
1.03
|
|
$
|
1.02
|
|
$
|
1.07
|
|
$
|
1.21
|
|
$
|
1.07
|
|
$
|
0.76
|
|
$
|
1.47
|
|
$
|
2.33
|
|
$
|
4.62
|
|
$
|
5.29
|
|
||||
|
Discontinued operations
|
0.03
|
|
(0.03
|
)
|
0.09
|
|
(0.03
|
)
|
—
|
|
0.12
|
|
(0.01
|
)
|
0.01
|
|
0.12
|
|
0.07
|
|
||||||||||||||
|
Net earnings per share
|
$
|
1.06
|
|
$
|
0.99
|
|
$
|
1.17
|
|
$
|
1.18
|
|
$
|
1.07
|
|
$
|
0.88
|
|
$
|
1.46
|
|
$
|
2.33
|
|
$
|
4.74
|
|
$
|
5.35
|
|
||||
|
Diluted earnings/(loss) per share
|
||||||||||||||||||||||||||||||||||
|
Continuing operations
|
$
|
1.02
|
|
$
|
1.01
|
|
$
|
1.07
|
|
$
|
1.21
|
|
$
|
1.06
|
|
$
|
0.76
|
|
$
|
1.46
|
|
$
|
2.31
|
|
$
|
4.58
|
|
$
|
5.25
|
|
||||
|
Discontinued operations
|
0.03
|
|
(0.03
|
)
|
0.09
|
|
(0.03
|
)
|
—
|
|
0.11
|
|
(0.01
|
)
|
0.01
|
|
0.12
|
|
0.07
|
|
||||||||||||||
|
Net earnings per share
|
$
|
1.05
|
|
$
|
0.98
|
|
$
|
1.16
|
|
$
|
1.18
|
|
$
|
1.06
|
|
$
|
0.87
|
|
$
|
1.45
|
|
$
|
2.32
|
|
$
|
4.70
|
|
$
|
5.31
|
|
||||
|
Dividends declared per share
|
$
|
0.56
|
|
$
|
0.52
|
|
$
|
0.60
|
|
$
|
0.56
|
|
$
|
0.60
|
|
$
|
0.56
|
|
$
|
0.60
|
|
$
|
0.56
|
|
$
|
2.36
|
|
$
|
2.20
|
|
||||
|
Closing common stock price:
|
|
|
|
|
|
|
|
|
|
|||||||||||||||||||||||||
|
High
|
83.98
|
|
83.57
|
|
80.12
|
|
85.01
|
|
75.81
|
|
80.87
|
|
78.61
|
|
78.23
|
|
83.98
|
|
85.01
|
|
||||||||||||||
|
Low
|
68.05
|
|
74.25
|
|
66.74
|
|
77.26
|
|
67.22
|
|
72.94
|
|
63.70
|
|
67.59
|
|
63.70
|
|
67.59
|
|
||||||||||||||
Note: Per share amounts are computed independently for each of the quarters presented. The sum of the quarters may not equal the total year amount due to the impact of changes in average quarterly shares outstanding and all other quarterly amounts may not equal the total year due to rounding.
|
U.S. Sales by Product Category
(a)
|
First Quarter
|
Second Quarter
|
Third Quarter
|
Fourth Quarter
|
Total Year
|
|||||||||||||||||||
|
|
2016
|
|
2015
|
|
2016
|
|
2015
|
|
2016
|
|
2015
|
|
2016
|
|
2015
|
|
2016
|
|
2015
|
|
||||
|
Household essentials
|
23
|
%
|
28
|
%
|
23
|
%
|
28
|
%
|
23
|
%
|
28
|
%
|
19
|
%
|
21
|
%
|
22
|
%
|
26
|
%
|
||||
|
Food, beverage, and pet supplies
|
24
|
|
22
|
|
22
|
|
20
|
|
23
|
|
22
|
|
20
|
|
19
|
|
22
|
|
21
|
|
||||
|
Apparel and accessories
|
21
|
|
20
|
|
22
|
|
21
|
|
21
|
|
19
|
|
18
|
|
18
|
|
20
|
|
19
|
|
||||
|
Home furnishings and décor
|
17
|
|
16
|
|
19
|
|
17
|
|
19
|
|
18
|
|
19
|
|
18
|
|
19
|
|
17
|
|
||||
|
Hardlines
|
15
|
|
14
|
|
14
|
|
14
|
|
14
|
|
13
|
|
24
|
|
24
|
|
17
|
|
17
|
|
||||
|
Total
|
100
|
%
|
100
|
%
|
100
|
%
|
100
|
%
|
100
|
%
|
100
|
%
|
100
|
%
|
100
|
%
|
100
|
%
|
100
|
%
|
||||
|
Supplemental information
|
||||||||||||||||||||||||
|
Pharmacy
(b)
|
—
|
%
|
6
|
%
|
—
|
%
|
6
|
%
|
—
|
%
|
6
|
%
|
—
|
%
|
3
|
%
|
—
|
%
|
5
|
%
|
||||
|
(a)
|
As a percentage of sales.
|
|
(b)
|
Included in household essentials.
|
58
Not applicable.
Changes in Internal Control Over Financial Reporting
There have been no changes in our internal control over financial reporting during the most recently completed fiscal quarter that have materially affected, or are reasonably likely to materially affect, our internal control over financial reporting.
Evaluation of Disclosure Controls and Procedures
As of the end of the period covered by this Annual Report, we conducted an evaluation, under supervision and with the participation of management, including the chief executive officer and chief financial officer, of the effectiveness of the design and operation of our disclosure controls and procedures pursuant to Rules 13a-15 and 15d-15 of the Securities Exchange Act of 1934, as amended (Exchange Act). Based upon that evaluation, our chief executive officer and chief financial officer concluded that our disclosure controls and procedures are effective. Disclosure controls and procedures are defined by Rules 13a-15(e) and 15d-15(e) of the Exchange Act as controls and other procedures that are designed to ensure that information required to be disclosed by us in reports filed with the SEC under the Exchange Act is recorded, processed, summarized and reported within the time periods specified in the SEC's rules and forms. Disclosure controls and procedures include, without limitation, controls and procedures designed to ensure that information required to be disclosed by us in reports filed under the Exchange Act is accumulated and communicated to our management, including our principal executive and principal financial officers, or persons performing similar functions, as appropriate, to allow timely decisions regarding required disclosure.
For the Report of Management on Internal Control and the Report of Independent Registered Public Accounting Firm on Internal Control over Financial Reporting, see Item 8, Financial Statements and Supplementary Data.
Not applicable.
Certain information required by Part III is incorporated by reference from Target's definitive Proxy Statement to be filed on or about
May 1, 2017
. Except for those portions specifically incorporated in this Form 10-K by reference to Target's Proxy Statement, no other portions of the Proxy Statement are deemed to be filed as part of this Form 10-K.
The following sections of Target's Proxy Statement to be filed on or about
May 1, 2017
, are incorporated herein by reference:
|
•
|
|
|
•
|
Stock Ownership Information--Section 16(a) Beneficial Ownership Reporting Compliance
|
|
•
|
General Information About Corporate Governance and the Board of Directors
|
|
◦
|
Business Ethics and Conduct
|
|
◦
|
Committees
|
|
•
|
Questions and Answers About Our Annual Meeting and Voting--Question 14
|
See also Item 4A, Executive Officers of Part I hereof.
59
The following sections of Target's Proxy Statement to be filed on or about
May 1, 2017
, are incorporated herein by reference:
|
•
|
Compensation Discussion and Analysis
|
|
•
|
Compensation Tables
|
|
•
|
Human Resources & Compensation Committee Report
|
The following sections of Target's Proxy Statement to be filed on or about
May 1, 2017
, are incorporated herein by reference:
|
•
|
Stock Ownership Information--
|
|
◦
|
Beneficial Ownership of Directors and Officers
|
|
◦
|
Beneficial Ownership of Target’s Largest Shareholders
|
|
•
|
Compensation Tables--Equity Compensation Plan Information
|
The following sections of Target's Proxy Statement to be filed on or about
May 1, 2017
, are incorporated herein by reference:
|
•
|
General Information About Corporate Governance and the Board of Directors--
|
|
◦
|
Policy on Transactions with Related Persons
|
|
◦
|
Director Independence
|
|
◦
|
Committees
|
The following section of Target's Proxy Statement to be filed on or about
May 1, 2017
, is incorporated herein by reference:
|
•
|
Item Two-- Ratification of Appointment of Ernst & Young LLP As Independent Registered Public Accounting Firm-Audit and Non-Audit Fees
|
60
The following information required under this item is filed as part of this report:
|
a)
|
Financial Statements
|
|
•
|
Consolidated Statements of Operations for the Years Ended
January 28, 2017
,
January 30, 2016
, and
January 31, 2015
|
|
•
|
Consolidated Statements of Comprehensive Income for the Years Ended
January 28, 2017
,
January 30, 2016
, and
January 31, 2015
|
|
•
|
Consolidated Statements of Financial Position at
January 28, 2017
and
January 30, 2016
|
|
•
|
Consolidated Statements of Cash Flows for the Years Ended
January 28, 2017
,
January 30, 2016
, and
January 31, 2015
|
|
•
|
Consolidated Statements of Shareholders' Investment for the Years Ended
January 28, 2017
,
January 30, 2016
, and
January 31, 2015
|
|
•
|
Notes to Consolidated Financial Statements
|
|
•
|
Report of Independent Registered Public Accounting Firm on Consolidated Financial Statements
|
|
Financial Statement Schedules
|
|
None.
|
|
Other schedules have not been included either because they are not applicable or because the information is included elsewhere in this Report.
|
61
|
b)
|
Exhibits
|
|
(2)A
|
†
|
Asset Purchase Agreement dated June 12, 2015 between Target Corporation and CVS Pharmacy, Inc. (
1
)
|
|
(3)A
|
|
Amended and Restated Articles of Incorporation (as amended through June 9, 2010)
(2)
|
|
B
|
|
Bylaws (as amended through November 11, 2015)
(3)
|
|
(4)A
|
|
Indenture, dated as of August 4, 2000 between Target Corporation and Bank One Trust Company, N.A.
(4)
|
|
B
|
|
First Supplemental Indenture dated as of May 1, 2007 to Indenture dated as of August 4, 2000 between Target Corporation and The Bank of New York Trust Company, N.A. (as successor in interest to Bank One Trust Company N.A.)
(5)
|
|
C
|
|
Target agrees to furnish to the Commission on request copies of other instruments with respect to long-term debt.
|
|
(10)A
|
*
|
Target Corporation Officer Short-Term Incentive Plan
(6)
|
|
B
|
*
|
Target Corporation Long-Term Incentive Plan (as amended and restated effective June 8, 2011)
(7)
|
|
C
|
*
|
Amended and Restated Target Corporation 2011 Long-Term Incentive Plan
(8)
|
|
D
|
*
|
Target Corporation SPP I (2016 Plan Statement) (as amended and restated effective April 3, 2016)
(9)
|
|
E
|
*
|
Target Corporation SPP II (2016 Plan Statement) (as amended and restated effective April 3, 2016)
(10)
|
|
F
|
*
|
Target Corporation SPP III (2014 Plan Statement) (as amended and restated effective January 1, 2014)
(11)
|
|
G
|
*
|
Amendment to Target Corporation SPP III (2014 Plan Statement) (effective April 3, 2016)
(12)
|
|
H
|
*
|
Target Corporation Officer Deferred Compensation Plan (as amended and restated effective June 8, 2011)
(13)
|
|
I
|
*
|
Target Corporation Officer EDCP (2017 Plan Statement) (as amended and restated effective May 1, 2017)
|
|
J
|
*
|
Target Corporation Deferred Compensation Plan Directors
(14)
|
|
K
|
*
|
Target Corporation DDCP (2013 Plan Statement) (as amended and restated effective December 1, 2013)
(15)
|
|
L
|
*
|
Target Corporation Officer Income Continuance Policy Statement (as amended and restated effective April 3, 2016)
(16)
|
|
M
|
*
|
Target Corporation Executive Excess Long Term Disability Plan (as restated effective January 1, 2010
(17)
|
|
N
|
*
|
Director Retirement Program
(18)
|
|
O
|
*
|
Target Corporation Deferred Compensation Trust Agreement (as amended and restated effective January 1, 2009)
(19)
|
|
P
|
*
|
Amendment to Target Corporation Deferred Compensation Trust Agreement (as amended and restated effective January 1, 2009)
(20)
|
|
Q
|
*
|
Form of Amended and Restated Executive Non-Qualified Stock Option Agreement
(21)
|
|
R
|
*
|
Form of Executive Restricted Stock Unit Agreement - Cliff Vesting
(22)
|
|
S
|
*
|
Form of Executive Restricted Stock Unit Agreement - Ratable Vesting
|
|
T
|
*
|
Form of Executive Performance-Based Restricted Stock Unit Agreement
(23)
|
|
U
|
*
|
Form of Executive Performance Share Unit Agreement
|
|
V
|
*
|
Form of Non-Employee Director Non-Qualified Stock Option Agreement
(24)
|
|
W
|
*
|
Form of Non-Employee Director Restricted Stock Unit Agreement
(25)
|
|
X
|
*
|
Form of Cash Retention Award
(26)
|
|
Y
|
|
Five-Year Credit Agreement dated as of October 5, 2016 among Target Corporation, Bank of America, N.A. as Administrative Agent and the Banks listed therein
(27)
|
|
Z
|
‡
|
Credit Card Program Agreement dated October 22, 2012 among Target Corporation, Target Enterprise, Inc. and TD Bank USA, N.A.
(28)
|
62
|
AA
|
‡
|
First Amendment dated February 24, 2015 to Credit Card Program Agreement among Target Corporation, Target Enterprise, Inc. and TD Bank USA, N.A.
(29)
|
|
BB
|
‡
|
Pharmacy Operating Agreement dated December 16, 2015 between Target Corporation and CVS Pharmacy, Inc.
(30)
|
|
CC
|
‡
|
First Amendment dated November 30, 2016 to Pharmacy Operating Agreement between Target Corporation and CVS Pharmacy, Inc.
|
|
DD
|
*
|
Restricted Stock Unit Agreement with John J. Mulligan, effective as of May 22, 2014
(31)
|
|
EE
|
*
|
Employment Offer Letter to Brian C. Cornell, dated July 26, 2014
(32)
|
|
FF
|
*
|
Make-Whole Performance-Based Restricted Stock Unit Agreement with Brian C. Cornell, effective as of August 21, 2014
(33)
|
|
GG
|
*
|
Aircraft Time Sharing Agreement as of March 13, 2015 among Target Corporation and Brian C. Cornell
(34)
|
|
HH
|
*
|
Advisory Role Letter to Timothy R. Baer dated July 11, 2016
(35)
|
|
II
|
*
|
Target Corporation Officer EDCP (2017 Plan Statement) (as amended and restated effective January 1, 2017)
(36)
|
|
(12)
|
|
Statements of Computations of Ratios of Earnings to Fixed Charges
|
|
(21)
|
|
List of Subsidiaries
|
|
(23)
|
|
Consent of Independent Registered Public Accounting Firm
|
|
(24)
|
|
Powers of Attorney
|
|
(31)A
|
|
Certification of the Chief Executive Officer Pursuant to Section 302 of the Sarbanes-Oxley Act of 2002
|
|
(31)B
|
|
Certification of the Chief Financial Officer Pursuant to Section 302 of the Sarbanes-Oxley Act of 2002
|
|
(32)A
|
|
Certification of the Chief Executive Officer Pursuant to Section 18 U.S.C. Section 1350 Pursuant to Section 906 of the Sarbanes-Oxley Act of 2002
|
|
(32)B
|
|
Certification of the Chief Financial Officer Pursuant to Section 18 U.S.C. Section 1350 Pursuant to Section 906 of the Sarbanes-Oxley Act of 2002
|
|
101.INS
|
|
XBRL Instance Document
|
|
101.SCH
|
|
XBRL Taxonomy Extension Schema
|
|
101.CAL
|
|
XBRL Taxonomy Extension Calculation Linkbase
|
|
101.DEF
|
|
XBRL Taxonomy Extension Definition Linkbase
|
|
101.LAB
|
|
XBRL Taxonomy Extension Label Linkbase
|
|
101.PRE
|
|
XBRL Taxonomy Extension Presentation Linkbase
|
Copies of exhibits will be furnished upon written request and payment of Registrant's reasonable expenses in furnishing the exhibits.
_____________________________________________________________________
|
†
|
Excludes the Seller Disclosure Schedule, Exhibits B through G and Schedules I and II referred to in the agreement which Target Corporation agrees to furnish supplementally to the Securities and Exchange Commission upon request. Exhibit A is separately filed as Exhibit (10)BB.
|
|
‡
|
Certain portions of this exhibit have been omitted pursuant to a request for confidential treatment and have been filed separately with the Securities and Exchange Commission.
|
|
*
|
Management contract or compensation plan or arrangement required to be filed as an exhibit to this Form 10-K.
|
|
(1)
|
Incorporated by reference to Exhibit (2)H to Target's Form 10-Q Report for the quarter ended August 1, 2015.
|
|
(2)
|
Incorporated by reference to Exhibit (3)A to Target's Form 8-K Report filed June 10, 2010.
|
|
(3)
|
Incorporated by reference to Exhibit (3)A to Target's Form 8-K Report filed November 12, 2015.
|
|
(4)
|
Incorporated by reference to Exhibit 4.1 to Target's Form 8-K Report filed August 10, 2000.
|
|
(5)
|
Incorporated by reference to Exhibit 4.1 to the Registrant's Form 8-K Report filed May 1, 2007.
|
|
(6)
|
Incorporated by reference to Appendix A to the Registrant's Proxy Statement filed April 30, 2012.
|
|
(7)
|
Incorporated by reference to Exhibit (10)B to Target's Form 10-Q Report for the quarter ended July 30, 2011.
|
|
(8)
|
Incorporated by reference to Exhibit (10)JJ to Target's Form 8-K Report filed June 12, 2015.
|
|
(9)
|
Incorporated by reference to Exhibit (10)C to Target's Form 10-Q Report for the quarter ended April 30, 2016.
|
|
(10)
|
Incorporated by reference to Exhibit (10)D to Target's Form 10-Q Report for the quarter ended April 30, 2016.
|
|
(11)
|
Incorporated by reference to Exhibit (10)E to Target's Form 10-K Report for the year ended February 1, 2014.
|
|
(12)
|
Incorporated by reference to Exhibit (10)NN to Target's Form 10-Q Report for the quarter ended April 30, 2016.
|
63
|
(13)
|
Incorporated by reference to Exhibit (10)F to Target's Form 10-Q Report for the quarter ended July 30, 2011.
|
|
(14)
|
Incorporated by reference to Exhibit (10)I to Target's Form 10-K Report for the year ended February 3, 2007.
|
|
(15)
|
Incorporated by reference to Exhibit (10)I to Target's Form 10-K Report for the year ended February 1, 2014.
|
|
(16)
|
Incorporated by reference to Exhibit (10)J to Target's Form 10-Q Report for the quarter ended April 30, 2016.
|
|
(17)
|
Incorporated by reference to Exhibit (10)A to Target's Form 10-Q Report for the quarter ended October 30, 2010.
|
|
(18)
|
Incorporated by reference to Exhibit (10)O to Target's Form 10-K Report for the year ended January 29, 2005.
|
|
(19)
|
Incorporated by reference to Exhibit (10)O to Target's Form 10-K Report for the year ended January 31, 2009.
|
|
(20)
|
Incorporated by reference to Exhibit (10)AA to Target's Form 10-Q Report for the quarter ended July 30, 2011.
|
|
(21)
|
Incorporated by reference to Exhibit (10)V to Target's Form 10-K Report for the year ended January 31, 2015.
|
|
(22)
|
Incorporated by reference to Exhibit (10)W to Target's Form 10-K Report for the year ended January 30, 2016.
|
|
(23)
|
Incorporated by reference to Exhibit (10)X to Target's Form 10-K Report for the year ended January 30, 2016
.
|
|
(24)
|
Incorporated by reference to Exhibit (10)EE to Target's Form 8-K Report filed January 11, 2012.
|
|
(25)
|
Incorporated by reference to Exhibit (10)AA to Target's Form 10-K Report for the year ended January 30, 2016.
|
|
(26)
|
Incorporated by reference to Exhibit (10)W to Target’s Form 10-K Report for year ended February 2, 2013.
|
|
(27)
|
Incorporated by reference to Exhibit (10)O to Target's Form 10-Q Report for the quarter ended October 29, 2016.
|
|
(28)
|
Incorporated by reference to Exhibit (10)X to Target's Form 10-Q/A Report for the quarter ended May 4, 2013.
|
|
(29)
|
Incorporated by reference to Exhibit (10)II to Target's Form 10-Q Report for the quarter ended May 2, 2015.
|
|
(30)
|
Incorporated by reference to Exhibit (10)KK to Target's Form 10-K Report for the year ended January 30, 2016.
|
|
(31)
|
Incorporated by reference to Exhibit (10)BB to Target's Form 10-Q Report for the quarter ended August 2, 2014.
|
|
(32)
|
Incorporated by reference to Exhibit (10)CC to Target's Form 10-Q Report for the quarter ended August 2, 2014.
|
|
(33)
|
Incorporated by reference to Exhibit (10)EE to Target's Form 10-Q Report for the quarter ended August 2, 2014.
|
|
(34)
|
Incorporated by reference to Exhibit (10)HH to Target's Form 10-K Report for the year ended January 31, 2015.
|
|
(35)
|
Incorporated by reference to Exhibit (10)OO to Target's Form 10-Q Report for the quarter ended July 30, 2016.
|
|
(36)
|
Incorporated by reference to Exhibit (10)G to Target's 10-Q Report for the quarter ended October 29, 2016.
|
64
SIGNATURES
Pursuant to the requirements of Section 13 or 15(d) of the Securities Exchange Act of 1934, Target has duly caused this report to be signed on its behalf by the undersigned, thereunto duly authorized.
|
|
TARGET CORPORATION
|
|
|
|
By:
|

|
|
Dated: March 8, 2017
|
|
Cathy R. Smith
Executive Vice President and Chief Financial Officer
|
___________________________________________________________________________________________________________________
Pursuant to the requirements of the Securities Exchange Act of 1934, the report has been signed below by the following persons on behalf of Target and in the capacities and on the dates indicated.
|
|
|
|
Dated: March 8, 2017
|
Brian C. Cornell
Chairman of the Board and Chief Executive Officer
|
|
|

|
|
Dated: March 8, 2017
|
Cathy R. Smith
Executive Vice President and Chief Financial Officer |
|
|

|
|
Dated: March 8, 2017
|
Robert M. Harrison
Senior Vice President, Chief Accounting Officer
and Controller
|
|
ROXANNE S. AUSTIN
DOUGLAS M. BAKER, JR.
CALVIN DARDEN
HENRIQUE DE CASTRO
ROBERT L. EDWARDS
MELANIE L. HEALEY
|
|
DONALD R. KNAUSS
MONICA C. LOZANO
MARY E. MINNICK
ANNE M. MULCAHY
DERICA W. RICE
KENNETH L. SALAZAR
|
|
Constituting a majority of the Board of Directors
|
65
Cathy R. Smith, by signing her name hereto, does hereby sign this document pursuant to powers of attorney duly executed by the Directors named, filed with the Securities and Exchange Commission on behalf of such Directors, all in the capacities and on the date stated.
|
|
By:
|

|
|
Dated: March 8, 2017
|
Cathy R. Smith
Attorney-in-fact |
|
66
Exhibit Index
|
Exhibit
|
Description
|
Manner of Filing
|
|
(2)A
|
Asset Purchase Agreement dated June 12, 2015 between Target Corporation and CVS Pharmacy, Inc.
|
Incorporated by Reference
|
|
(3)A
|
Amended and Restated Articles of Incorporation (as amended June 9, 2010)
|
Incorporated by Reference
|
|
(3)B
|
Bylaws (as amended through November 11, 2015)
|
Incorporated by Reference
|
|
(4)A
|
Indenture, dated as of August 4, 2000 between Target Corporation and Bank One Trust Company, N.A.
|
Incorporated by Reference
|
|
(4)B
|
First Supplemental Indenture dated as of May 1, 2007 to Indenture dated as of August 4, 2000 between Target Corporation and The Bank of New York Trust Company, N.A. (as successor in interest to Bank One Trust Company N.A.)
|
Incorporated by Reference
|
|
(4)C
|
Target agrees to furnish to the Commission on request copies of other instruments with respect to long-term debt.
|
Filed Electronically
|
|
(10)A
|
Target Corporation Officer Short-Term Incentive Plan
|
Incorporated by Reference
|
|
(10)B
|
Target Corporation Long-Term Incentive Plan (as amended and restated effective June 8, 2011)
|
Incorporated by Reference
|
|
(10)C
|
Amended and Restated Target Corporation 2011 Long-Term Incentive Plan
|
Incorporated by Reference
|
|
(10)D
|
Target Corporation SPP I (2016 Plan Statement) (as amended and restated effective April 3, 2016)
|
Incorporated by Reference
|
|
(10)E
|
Target Corporation SPP II (2016 Plan Statement) (as amended and restated effective April 3, 2016)
|
Incorporated by Reference
|
|
(10)F
|
Target Corporation SPP III (2014 Plan Statement) (as amended and restated effective January 1, 2014)
|
Incorporated by Reference
|
|
(10)G
|
Amendment to Target Corporation SPP III (2014 Plan Statement) (effective April 3, 2016)
|
Incorporated by Reference
|
|
(10)H
|
Target Corporation Officer Deferred Compensation Plan (as amended and restated effective June 8, 2011)
|
Incorporated by Reference
|
|
(10)I
|
Target Corporation Officer EDCP (2017 Plan Statement) (as amended and restated effective May 1, 2017)
|
Filed Electronically
|
|
(10)J
|
Target Corporation Deferred Compensation Plan Directors
|
Incorporated by Reference
|
|
(10)K
|
Target Corporation DDCP (2013 Plan Statement) (as amended and restated effective December 1, 2013)
|
Incorporated by Reference
|
|
(10)L
|
Target Corporation Officer Income Continuance Policy Statement (as amended and restated effective April 3, 2016)
|
Incorporated by Reference
|
|
(10)M
|
Target Corporation Executive Excess Long Term Disability Plan (as restated effective January 1, 2010)
|
Incorporated by Reference
|
|
(10)N
|
Director Retirement Program
|
Incorporated by Reference
|
|
(10)O
|
Target Corporation Deferred Compensation Trust Agreement (as amended and restated effective January 1, 2009)
|
Incorporated by Reference
|
|
(10)P
|
Amendment to Target Corporation Deferred Compensation Trust Agreement (as amended and restated effective January 1, 2009)
|
Incorporated by Reference
|
|
(10)Q
|
Form of Amended and Restated Executive Non-Qualified Stock Option Agreement
|
Incorporated by Reference
|
|
(10)R
|
Form of Executive Restricted Stock Unit Agreement - Cliff Vesting
|
Incorporated by Reference
|
|
(10)S
|
Form of Executive Restricted Stock Unit Agreement - Ratable Vesting
|
Filed Electronically
|
|
(10)T
|
Form of Executive Performance-Based Restricted Stock Unit Agreement
|
Incorporated by Reference
|
|
(10)U
|
Form of Executive Performance Share Unit Agreement
|
Filed Electronically
|
|
(10)V
|
Form of Non-Employee Director Non-Qualified Stock Option Agreement
|
Incorporated by Reference
|
|
(10)W
|
Form of Non-Employee Director Restricted Stock Unit Agreement
|
Incorporated by Reference
|
67
|
(10)X
|
Form of Cash Retention Award
|
Incorporated by Reference
|
|
(10)Y
|
Five-Year Credit Agreement dated as of October 5, 2016 among Target Corporation, Bank of America, N.A. as Administrative Agent and the Banks listed therein
|
Incorporated by Reference
|
|
(10)Z
|
Credit Card Program Agreement dated October 22, 2012 among Target Corporation, Target Enterprise, Inc. and TD Bank USA, N.A.
|
Incorporated by Reference
|
|
(10)AA
|
First Amendment dated February 24, 2015 to Credit Card Program Agreement among Target Corporation, Target Enterprise, Inc. and TD Bank USA, N.A.
|
Incorporated by Reference
|
|
(10)BB
|
Pharmacy Operating Agreement dated December 16, 2015 between Target Corporation and CVS Pharmacy, Inc.
|
Incorporated by Reference
|
|
(10)CC
|
First Amendment dated November 30, 2016 to Pharmacy Operating Agreement between Target Corporation and CVS Pharmacy, Inc.
|
Filed Electronically
|
|
(10)DD
|
Restricted Stock Unit Agreement with John J. Mulligan, effective as of May 22, 2014
|
Incorporated by Reference
|
|
(10)EE
|
Employment Offer Letter to Brian C. Cornell, dated July 26, 2014
|
Incorporated by Reference
|
|
(10)FF
|
Make-Whole Performance-Based Restricted Stock Unit Agreement with Brian C. Cornell, effective as of August 21, 2014
|
Incorporated by Reference
|
|
(10)GG
|
Aircraft Time Sharing Agreement as of March 13, 2015 among Target Corporation and Brian C. Cornell
|
Incorporated by Reference
|
|
(10)HH
|
Advisory Role Letter to Timothy R. Baer dated July 11, 2016
|
Incorporated by Reference
|
|
(10)II
|
Target Corporation Officer EDCP (2017 Plan Statement) (as amended and restated effective January 1, 2017)
|
Incorporated by Reference
|
|
(12)
|
Statements of Computations of Ratios of Earnings to Fixed Charges
|
Filed Electronically
|
|
(21)
|
List of Subsidiaries
|
Filed Electronically
|
|
(23)
|
Consent of Independent Registered Public Accounting Firm
|
Filed Electronically
|
|
(24)
|
Powers of Attorney
|
Filed Electronically
|
|
(31)A
|
Certification of the Chief Executive Officer Pursuant to Section 302 of the Sarbanes-Oxley Act of 2002
|
Filed Electronically
|
|
(31)B
|
Certification of the Chief Financial Officer Pursuant to Section 302 of the Sarbanes-Oxley Act of 2002
|
Filed Electronically
|
|
(32)A
|
Certification of the Chief Executive Officer Pursuant to Section 18 U.S.C. Section 1350 Pursuant to Section 906 of the Sarbanes-Oxley Act of 2002
|
Filed Electronically
|
|
(32)B
|
Certification of the Chief Financial Officer Pursuant to Section 18 U.S.C. Section 1350 Pursuant to Section 906 of the Sarbanes-Oxley Act of 2002
|
Filed Electronically
|
|
101.INS
|
XBRL Instance Document
|
Filed Electronically
|
|
101.SCH
|
XBRL Taxonomy Extension Schema
|
Filed Electronically
|
|
101.CAL
|
XBRL Taxonomy Extension Calculation Linkbase
|
Filed Electronically
|
|
101.DEF
|
XBRL Taxonomy Extension Definition Linkbase
|
Filed Electronically
|
|
101.LAB
|
XBRL Taxonomy Extension Label Linkbase
|
Filed Electronically
|
|
101.PRE
|
XBRL Taxonomy Extension Presentation Linkbase
|
Filed Electronically
|
68
TABLE OF CONTENTS
Part IItem 1. BusinessItem 1A. Risk FactorsItem 1B. Unresolved Staff CommentsItem 2. PropertiesItem 3. Legal ProceedingsItem 4. Mine Safety DisclosuresItem 4A. Executive OfficersPart IIItem 5. Market For The Registrant's Common Equity, Related Stockholder Matters and Issuer Purchases Of Equity SecuritiesItem 6. Selected Financial DataItem 7. Management's Discussion and Analysis Of Financial Condition and Results Of OperationsItem 7A. Quantitative and Qualitative Disclosures About Market RiskItem 8. Financial Statements and Supplementary DataItem 9. Changes in and Disagreements with Accountants on Accounting and Financial DisclosureItem 9A. Controls and ProceduresItem 9B. Other InformationPart IIIItem 10. Directors, Executive Officers and Corporate GovernanceItem One--election Of DirectorsItem 11. Executive CompensationItem 12. Security Ownership Of Certain Beneficial Owners and Management and Related Stockholder MattersItem 13. Certain Relationships and Related Transactions, and Director IndependenceItem 14. Principal Accountant Fees and ServicesPart IVItem 15. Exhibits, Financial Statement Schedules