TG THERAPEUTICS, INC.
10-Ks and 10-Qs
|
|
|
|
|
|
|
|
|
|
|
|
|
|
|
|
|
|
|
|
|
|
|
|
|
|
|
|
|
|
|
|
|
|
|
|
|
|
|
|
|
|
|
|
|
|
|
|
|
|
|
|
|
UNITED STATES
SECURITIES AND EXCHANGE COMMISSION
Washington, D.C. 20549
FORM 10-K
|
x
|
ANNUAL REPORT PURSUANT TO SECTION 13 OR 15(d) OF THE SECURITIES EXCHANGE ACT OF 1934
|
|
|
|
|
|
For the fiscal year ended December 31, 2013.
|
|
|
OR
|
|
|
|
|
¨
|
TRANSITION REPORT PURSUANT TO SECTION 13 OR 15(d) OF THE SECURITIES EXCHANGE ACT OF 1934
|
|
|
|
|
|
For the transition period from ________ to ________.
|
Commission File Number
1-32639
TG THERAPEUTICS, INC.
(Exact name of registrant as specified in its charter)
|
|
Delaware
|
36-3898269
|
|
|
|
(State or other jurisdiction of
|
(I.R.S. Employer
|
|
|
|
incorporation or organization)
|
Identification No.)
|
|
|
|
|
|
|
|
|
3 Columbus Circle
|
|
|
|
|
15
th
Floor
|
10019
|
|
|
|
New York, New York
|
(Zip Code)
|
|
|
|
(Address of principal executive offices)
|
|
|
Registrant’s telephone number, including area code:
(212) 554-4484
Securities registered pursuant to Section 12(b) of the Act:
|
Common Stock, Par Value $0.001 Per Share
|
NASDAQ Capital Market
|
|
(Title of Class)
|
(Name of Each Exchange on Which Registered)
|
Securities registered pursuant to Section 12(g) of the Act:
None
Indicate by check mark if the registrant is a well-known seasoned issuer, as defined in Rule 405 of the Securities Act.
Yes
£
No
x
Indicate by check mark if the registrant is not required to file reports pursuant to Section 13 or Section 15(d) of the Act.
Yes
£
No
x
Indicate by check mark whether the registrant: (1) has filed all reports required to be filed by Section 13 or 15(d) of the Securities Exchange Act of 1934 during the preceding 12 months (or for such shorter period that the registrant was required to file such reports), and (2) has been subject to such filing requirements for the past 90 days. Yes
x
No
£
Indicate by check mark whether the registrant has submitted electronically and posted on its corporate Web site, if any, every Interactive Data File required to be submitted and posted pursuant to Rule 405 of Regulation S-T during the preceding 12 months (or for such shorter period that the registrant was required to submit and post such files).
Yes
x
No
£
Indicate by check mark if disclosure of delinquent filers pursuant to Item 405 of Regulation S-K is not contained herein, and will not be contained, to the best of registrant’s knowledge, in definitive proxy or information statements incorporated by reference in Part III of this Form 10-K or any amendment to this Form 10-K.
£
Indicate by check mark whether the registrant is a large accelerated filed, an accelerated filer, a non-accelerated filer or a smaller reporting company.
See definitions of “large accelerated filer,” “accelerated filer,” and “smaller reporting company” in Rule 12b-2 of the Exchange Act).
(Check one):
|
Large accelerated filer
£
|
Accelerated filer
£
|
|
Non-accelerated filer
£
|
Smaller reporting company
x
|
Indicate by check mark whether the registrant is a shell company (as defined in Rule 12b-2 of the Exchange Act).
Yes
£
No
x
The aggregate market value of voting common stock held by non-affiliates of the registrant (assuming, for purposes of this calculation, without conceding, that all executive officers and directors are “affiliates”) was $74,983,321 as of June 30, 2013, based on the closing sale price of such stock as reported on
the NASDAQ Capital Market
.
There were 34,373,925 shares of the registrant’s common stock, $0.001 par value, outstanding as of March 1, 2014.
DOCUMENTS INCORPORATED BY REFERENCE
Portions of the registrant’s Proxy Statement for the 2014 Annual Meeting of Stockholders are incorporated by reference in Part III of this Annual Report on Form 10-K.
TG THERAPEUTICS, INC.
ANNUAL REPORT ON FORM 10-K
FOR THE FISCAL YEAR ENDED DECEMBER 31, 2013
TABLE OF CONTENTS
|
|
|
Page
|
|
|
|
|
|
SPECIAL CAUTIONARY NOTICE REGARDING FORWARD-LOOKING STATEMENTS
|
|
|
|
|
|
|
|
|
PART I
|
|
|
ITEM 1
|
Business
|
2
|
|
ITEM 1A
|
Risk Factors
|
17
|
|
ITEM 2
|
Properties
|
32
|
|
ITEM 3
|
Legal Proceedings
|
33
|
|
ITEM 4
|
Mine Safety Disclosures
|
33
|
|
|
|
|
|
|
PART II
|
|
|
|
|
|
|
ITEM 5
|
Market for Registrant’s Common Equity, Related Stockholder Matters and Issuer Purchases of Equity Securities
|
33
|
|
ITEM 7
|
Management’s Discussion and Analysis of Financial Condition and Results of Operations
|
34
|
|
ITEM 8
|
Financial Statements and Supplementary Data
|
41
|
|
ITEM 9
|
Changes in and Disagreements With Accountants on Accounting and Financial Disclosures
|
41
|
|
ITEM 9A
|
Controls and Procedures
|
41
|
|
ITEM 9B
|
Other Information
|
42
|
|
|
|
|
|
|
PART III
|
|
|
|
|
|
|
ITEM 10
|
Directors, Executive Officers and Corporate Governance
|
42
|
|
ITEM 11
|
Executive Compensation
|
42
|
|
ITEM 12
|
Security Ownership of Certain Beneficial Owners and Management and Related Stockholder Matters
|
42
|
|
ITEM 13
|
Certain Relationships and Related Transactions, and Director Independence
|
42
|
|
ITEM 14
|
Principal Accountant Fees and Services
|
42
|
|
|
|
|
|
|
PART IV
|
|
|
|
|
|
|
ITEM 15
|
Exhibits and Financial Statement Schedules
|
43
|
This Annual Report on Form 10-K contains trademarks and trade names of TG Therapeutics, Inc., including our name and logo. All other trademarks, service marks, or trade names referenced in this Annual Report on Form 10-K are the property of their respective owners.
SPECIAL CAUTIONARY NOTICE REGARDING FORWARD-LOOKING STATEMENTS
Certain matters discussed in this report, including matters discussed under the caption “Management’s Discussion and Analysis of Financial Condition and Results of Operations,” may constitute forward-looking statements for purposes of the Securities Act of 1933, as amended, or the Securities Act, and the Securities Exchange Act of 1934, as amended, or the Exchange Act, and involve known and unknown risks, uncertainties and other factors that may cause our actual results, performance or achievements to be materially different from the future results, performance or achievements expressed or implied by such forward-looking statements. The words "anticipate," "believe," "estimate," "may," "expect" and similar expressions are generally intended to identify forward-looking statements. Our actual results may differ materially from the results anticipated in these forward-looking statements due to a variety of factors, including, without limitation, those discussed under the captions “Risk Factors,” “Management’s Discussion and Analysis of Financial Condition and Results of Operations” and elsewhere in this report, as well as other factors which may be identified from time to time in our other filings with the Securities and Exchange Commission, or the SEC, or in the documents where such forward-looking statements appear. All written or oral forward-looking statements attributable to us are expressly qualified in their entirety by these cautionary statements. Such forward-looking statements include, but are not limited to, statements about our:
| · | expectations for increases or decreases in expenses; |
| · | expectations for the clinical and pre-clinical development, manufacturing, regulatory approval, and commercialization of our pharmaceutical product candidates or any other products we may acquire or in-license; |
| · | use of clinical research centers and other contractors; |
| · | expectations as to the timing of commencing or completing pre-clinical and clinical trials and the expected outcomes of those trials; |
| · | expectations for incurring capital expenditures to expand our research and development and manufacturing capabilities; |
| · | expectations for generating revenue or becoming profitable on a sustained basis; |
| · | expectations or ability to enter into marketing and other partnership agreements; |
| · | expectations or ability to enter into product acquisition and in-licensing transactions; |
| · | expectations or ability to build our own commercial infrastructure to manufacture, market and sell our drug candidates; |
| · | acceptance of our products by doctors, patients or payors; |
| · | ability to compete against other companies and research institutions; |
| · | ability to secure adequate protection for our intellectual property; |
| · | ability to attract and retain key personnel; |
| · | availability of reimbursement for our products; |
| · | estimates of the sufficiency of our existing cash and cash equivalents and investments to finance our operating requirements, including expectations regarding the value and liquidity of our investments; |
| · | stock price and its volatility; |
| · | expected losses; and |
| · | expectations for future capital requirements. |
The forward-looking statements contained in this report reflect our views and assumptions only as of the date this report is signed. Except as required by law, we assume no responsibility for updating any forward-looking statements.
We qualify all of our forward-looking statements by these cautionary statements. In addition, with respect to all of our forward-looking statements, we claim the protection of the safe harbor for forward-looking statements contained in the Private Securities Litigation Reform Act of 1995.
| 1 | ||
|
|
Unless the context requires otherwise, references in this report to “TG,” “Company,” “we,” “us” and “our” refer to TG Therapeutics, Inc. and our subsidiaries.
OVERVIEW
We are a biopharmaceutical company focused on the acquisition, development, and commercialization of innovative and medically important pharmaceutical products for the treatment of cancer and other underserved therapeutic needs.
We aim to acquire rights to these technologies by licensing or otherwise acquiring an ownership interest, funding their research and development and eventually either out-licensing or bringing the technologies to market.
Currently, the company is developing two therapies targeting hematological malignancies.
TG-1101 (ublituximab), is a novel, glycoengineered monoclonal antibody that targets a specific and unique epitope on the CD20 antigen found on B-lymphocytes. We are also developing TGR-1202, an orally available PI3K delta inhibitor.
We also actively evaluate complementary products, technologies and companies for in-licensing, partnership, acquisition and/or investment opportunities. To date, we have not received approval for the sale of any of our drug candidates in any market and, therefore, have not generated any product sales from our drug candidates.
CORPORATE INFORMATION
We were incorporated in Delaware in 1993.
Our executive offices are located at 3 Columbus Circle, New York, New York 10019.
Our telephone number is 212-554-4484, and our e-mail address is info@tgtxinc.com.
We file reports with the SEC on an annual basis using Form 10-K, quarterly reports on Form 10-Q and current reports on Form 8-K. You may read and copy any such reports and amendments thereto at the SEC’s Public Reference Room at 100 F Street, N.E., Washington, D.C. 20549 on official business days during the hours of 10:00 a.m. to 3:00 p.m.
Please call the SEC at 1-800-SEC-0330 for information on the Public Reference Room.
Additionally, the SEC maintains a website that contains annual, quarterly, and current reports, proxy statements, and other information that issuers (including us) file electronically with the SEC.
The SEC’s website address is
http://www.sec.gov
.
PRODUCTS UNDER DEVELOPMENT
TG-1101 (ublituximab)
Overview
TG-1101 (ublituximab) is a chimeric, glycoengineered monoclonal antibody that targets a unique epitope on the CD20 antigen found on the surface of B-lymphocytes developed to aid in the depletion of circulating B-cells.
We hold exclusive worldwide rights to develop and commercialize TG-1101 for all indications, except for the territories of France and Belgium which have been retained by LFB Biotechnologies, and South Korea and Southeast Asia which were licensed to Ildong Pharmaceutical Co. Ltd (“Ildong”) in November 2012.
Generally, anti-CD20 antibodies are believed to exert their B-cell depleting effects through three primary mechanisms: antibody dependent cell-mediated cytotoxicity (“ADCC”), complement dependent cytotoxicity (“CDC”), and direct or programmed cell death (“DCD” or “PCD”).
TG-1101 has been specifically glycoengineered to enhance ADCC activity, which should enhance its ability to deplete B-cells and may improve its anti-cancer effects when compared to Rituxan
®
, the leading anti-CD20 monoclonal antibody, which had worldwide sales in 2012 of approximately $7 billion.
Two single-agent, dose-escalation, Phase I studies were undertaken with TG-1101 to establish an optimal dose in patients with Non-Hodgkin’s Lymphoma (“NHL”) and Chronic Lymphocytic Leukemia (“CLL”). A two part first-in-human Phase I clinical trial was first completed in France in which
TG-1101
was evaluated in relapsed or refractory CLL patients at doses as high as 450mg per infusion. Preliminary results from Part 2 of this study were presented at the 53
rd
Annual American Society of Hematology Meeting in December 2011 and recently presented again at the 2013 European Hematology Annual Meeting.
Subsequently, a single-agent Phase I study was undertaken in the US enrolling patients with both NHL and CLL, dosing patients up to 1200mg per infusion.
In oncology settings, anti-CD20 therapy is generally used in combination with other anti-cancer agents where it demonstrates maximum activity as opposed to single agent usage.
As a result, subsequent clinical development for TG-1101 has focused on combination therapy with Phase I studies undertaken evaluating the following regimens:
| 2 | ||
|
|
| · | TG-1101 in combination with lenalidomide (trade name Revlimid ® ), an immunomodulatory agent, for patients with NHL and CLL; |
| · | TG-1101 in combination with ibrutinib (trade name IMBRUVICA™), a BTK inhibitor, for patients with CLL and Mantle Cell Lymphoma (MCL); and |
| · | TG-1101 in combination with TGR-1202, the Company’s development stage PI3Kδ inhibitor, for patients with CLL and NHL. |
Additional combinations studies with novel agents are planned.
Manufacturing of TG-1101 is currently performed by our partner, LFB Biotechnologies.
Pre-Clinical Data Overview
The mechanism of action of anti-CD20 antibodies, including rituximab and TG-1101 has been elucidated and detailed in numerous academic and clinical studies.
Upon conjugation of the antibody to the CD20 surface antigen, rituximab has been found to deplete B-lymphocytes through three primary mechanisms: ADCC, CDC, and DCD or PCD.
Antibody dependent cellular cytotoxicity, or ADCC, is a mechanism that is dependent on interactions between the Fc region of the antibody and the Fc
γ
R receptors on immune system effector cells, most notably the Fc
γ
RIIIA (CD16) receptor found on NK cells.
These interactions trigger cells to release pre-forming proteins and proteases resulting in B-cell death.
CDC occurs when binding of the antibody to the CD20 epitope leads to activation of the complement immune system, also known as the “innate” immune system, which can lead to destruction of the target cell.
In programmed cell death, or PCD, the binding of the antibody to the CD20 antigen leads to the activation of apoptotic signaling pathways, contributing to cell death.
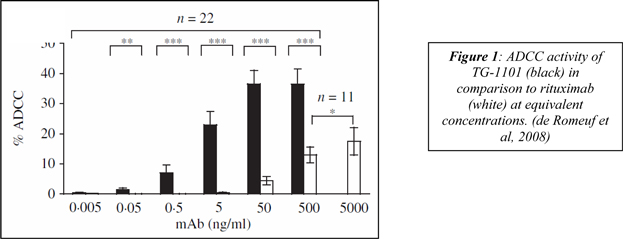
TG-1101 is a third generation, type I chimeric IgG1 monoclonal antibody with a glycoengineered Fc region designed specifically to induce higher ADCC activity in comparison to rituximab.
In vitro
testing has demonstrated superior ADCC induction of TG-1101 over rituximab (
see Figure 1
).
Tested on CLL patient B-cell samples at concentrations of 50 ng/mL, TG-1101 produces ADCC activity of 35%, while rituximab was found to exhibit ADCC levels of only 5% at the same concentration.
Extensive pre-clinical studies of TG-1101, including
in vivo
assays as a single agent and in combination with chemotherapeutic agents have been conducted, with recent presentations in abstract and poster form given at the 53
rd
and 54
th
Annual American Society of Hematology Meetings in December 2011 and 2012, respectively.
Clinical Data Overview and Recent Developments
Single Agent TG-1101 in Relapsed/Refractory CLL
A multicenter, open-label Phase I/Ib clinical trial of TG-1101 was completed which aimed to assess the safety, tolerability, and efficacy of TG-1101 in patients with relapsed or refractory CLL.
This two part, first-in-man, dose escalating trial was conducted in nine centers in France with preliminary results from Parts 1 and 2 presented at the 52
nd
and 53
rd
Annual American Society of Hematology (“ASH”) meetings, respectively.
| 3 | ||
|
|
The study regimen in Part 1 involved 21 patients in five dosing cohorts receiving infusions of TG-1101 at a dose ranging from 5mg to 450mg once weekly over the course of four weeks.
Part 2 of this study evaluated the safety and efficacy profile of TG-1101 when administered in an 8-dose regimen (150mg initial dose, followed by seven doses of 450mg).
Inclusion criteria were the same in Parts 1 and 2 of the study.
In Part 2, 12 patients were enrolled, having a median age of 69.5 years, and a median of 3 prior therapies (58% previously treated with rituximab). Patients were assessed for efficacy every eight weeks.
TG-1101 was well tolerated with adverse events generally consistent with those exhibited by other anti-CD20 antibodies.
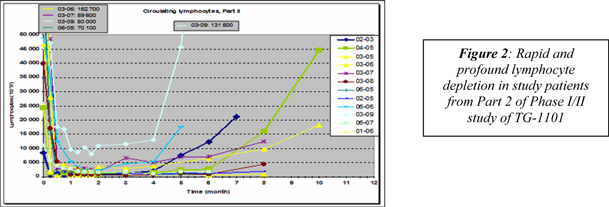
In Part 2 of the study, rapid, near total blood lymphocyte depletion was observed in all patients (
see Figure 2
).
Overall response assessment at month four according to NCI-WG guidelines following treatment, TG-1101 was found to produce a durable partial response (“PR”) in 5/11 (45%) evaluable patients (1 patient not evaluable for efficacy due to early withdrawal as a result of a secondary acute leukemia diagnosis).
Four Phase I/II trials with TG-1101 are currently ongoing, as follows:
Single Agent TG-1101 in Relapsed/Refractory NHL & CLL
Our first US based trial was launched in the 3
rd
quarter of 2012.
The trial is entitled "An Open Label Phase I/II Trial of the Efficacy and Safety of TG-1101 in Patients with B-cell Non-Hodgkin Lymphoma who have Relapsed or are Refractory After CD20 Directed Antibody Therapy." All enrolled patients were relapsed or refractory to Rituxan® or a Rituxan® containing regimen, and in most cases multiple other lines of therapy.
Dr. Owen O'Connor, Professor of Medicine and Director, Center for Lymphoid Malignancies at New York Presbyterian Columbia Medical Center is the Principal Investigator for the multi-center study.
We have completed the dose escalation portion of this study, with three patients enrolled into four dose cohorts each (450mg, 600mg, 900mg, and 1200mg), with preliminary safety and efficacy data for these patients presented at the American Society of Clinical Oncology (ASCO) Annual Meeting in June 2013 and at the European Hematology Association (“EHA”) Annual Meeting in June 2013. Cohort expansions were undertaken at the 900 and 1200 mg doses for NHL patients and at the 600 and 900 mg doses for CLL patients. A summary of the ASCO presentation for TG-1101 is provided below.
As of June 2013, 12 NHL patients had been enrolled (3 per cohort) including 7 Follicular Lymphoma (FL), 3 Marginal Zone Lymphoma (MZL) and 2 Mantle Cell Lymphoma (MCL).
No dose-limiting toxicities have been reported up through the 1200 mg dose.
Most adverse events reported to date have been Grade 1/2 infusion related reactions (IRR’s) appropriately managed by supportive care and occurring mostly with the first infusion.
All NHL patients have completed all scheduled doses.
Data on the CLL/SLL patient group has not been published to date, however as of June 2013, no DLT’s have been observed in the CLL/SLL patient groups up through 900 mg.
| 4 | ||
|
|
As of data presentation, 10 NHL patients were evaluable for efficacy of which, 5 patients achieved at least a PR (50% ORR) as per the revised Response Criteria for Malignant Lymphoma (J Clin Oncol. 2007), as follows:
| · | Complete Response (“CR”) : 3 patients – 1 rituximab-refractory MZL, 1 rituximab-refractory FL, and 1 rituximab-relapsed MZL |
| · | Partial Response (“PR”) : 2 patients – 1 rituximab-relapsed MZL, 1 rituximab-relapsed FL |
90% of patients had exhibited tumor size reductions on TG-1101 monotherapy.
Patients achieving SD or better continue on TG-1101 maintenance therapy.
As of February 2014, enrollment has completed for this study, with updated data from this study anticipated to be presented during 2014.
TG-1101 in Combination with Lenalidomide for Relapsed/Refractory NHL & CLL
In December of 2012, the Company initiated its second US based clinical trial entitled "TG-1101-102: A Phase I/II Study of Ublituximab in Combination with Lenalidomide (Revlimid
®
) in Patients with B-Cell Lymphoid Malignancies who have Relapsed or are Refractory After CD20 Directed Antibody Therapy".
The trial was designed as a Phase I dose escalation study with the potential to enroll one or more expansion cohorts once the optimal dose was determined. All enrolled patients were relapsed or refractory to a prior anti-CD20 antibody containing regimen. The patients enrolled into this study were heavily pre-treated, most of which were refractory to Rituxan or a Rituxan containing regimen.
This multicenter trial was being led by Dr. Marshall Schreeder of the Clearview Cancer Institute in Huntsville, AL.
In June 2013, preliminary data was presented from this study at the 18th annual congress of the EHA in Stockholm, Sweden.
As of the date of presentation, six patients had been enrolled in the study, and it was reported that the combination regimen has been well tolerated to date with no DLT’s observed.
Presently we have completed enrollment in this study, with the highest cohort dosing patients at 900mg of TG-1101 in combination with Revlimid
®
starting at 10mg and titrated based on tolerability in 5mg increments per cycle to a maximum dose of 20mg for patients with NHL and 15mg for patients with CLL.
TG-1101 in Combination with TGR-1202 for Relapsed/Refractory NHL & CLL
In November 2013, we initiated a multi-center, Phase I study to evaluate the safety and efficacy of the combination of TG-1101 and TGR-1202, the Company's novel, once per day, PI3Kδ inhibitor, for patients with relapsed and/or refractory CLL and NHL. This is the first clinical trial evaluating the combination of TG-1101 and TGR-1202.
In this study, dosing of TGR-1202 is commencing at 800mg once per day (QD) with dose escalation proceeding in a 3+3 design.
The trial, entitled "A Multi-center Phase I/Ib Study Evaluating the Efficacy and Safety of TG-1101 (Ublituximab), a novel Glycoengineered Anti-CD20 Monoclonal Antibody, in Combination with TGR-1202, a Novel PI3k Delta Inhibitor, in Patients with B-cell Malignancies," will enroll CLL and NHL patients whose disease is relapsed from or refractory to prior therapies, including prior anti-CD20 monoclonal antibodies, PI3Kδ inhibitors, and/or BTK inhibitors. The MD Anderson Cancer Center is the lead center for the trial. Susan O'Brien, MD, Professor in the Department of Leukemia, is the Study Chair for the CLL patient group, and Nathan Fowler, MD, Assistant Professor and Co-Director of Clinical Research in the Department of Lymphoma, is the Study Chair for the NHL patient group.
TG-1101 in Combination with Ibrutinib for Relapsed/Refractory MCL & CLL
In December 2013, we initiated a multi-center Phase 2 clinical trial to evaluate the safety and efficacy of the combination of TG-1101 and ibrutinib (IMBRUVICA™) for patients with CLL and mantle cell lymphoma (MCL). This is the first clinical trial evaluating the combination of TG-1101 and ibrutinib, an oral Bruton’s Tyrosine Kinase (BTK) inhibitor which was recently granted approval by the U.S. Food and Drug Administration (FDA).
The trial, entitled "A Multi-center Phase 2 Study with Safety Run-in Evaluating the Efficacy and Safety of Ublituximab in Combination with Ibrutinib in Patients with Select B-Cell Malignancies," will enroll patients with CLL and MCL who are eligible to receive ibrutinib. TG Therapeutics has partnered with the US Oncology Network, Columbia University and other select centers throughout the United States on the study. Jeff Sharman, MD, Medical Director for Hematology Research, US Oncology Network, is the Study Chair for the CLL patient group, while Owen A. O'Connor, MD, PhD, Professor and Director of the Center for Lymphoid Malignancies, Columbia University Medical Center is the Study Chair for the MCL patient group.
| 5 | ||
|
|
TG-1101 Orphan Drug Designation for Marginal Zone Lymphoma
In September 2013, TG-1101 received two Orphan Drug designations from the U.S. Food and Drug Administration (FDA); 1) For the treatment of Nodal Marginal Zone Lymphoma and 2) For the treatment of Extranodal Marginal Zone Lymphoma (Mucosa-Associated Lymphatic Tissue, MALT).
Both are rare subtypes of non-Hodgkin's lymphoma (NHL).
TGR-1202
Overview
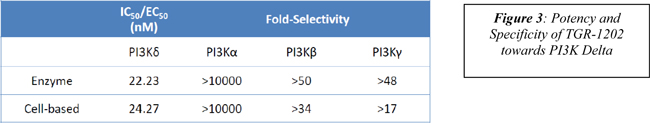
The phosphoinositide-3-kinases (“PI3Ks”) are a family of enzymes involved in various cellular functions, including cell proliferation and survival, cell differentiation, intracellular trafficking, and immunity. There are four isoforms of PI3K (alpha, beta, delta, and gamma), of which the delta isoform is strongly expressed in cells of hematopoietic origin, and often implicated in B-cell related lymphomas.
TGR-1202 is an orally available PI3K delta inhibitor with nanomolar potency to the delta isoform and several fold selectivity over the alpha, beta, and gamma isoforms.
TGR-1202 has demonstrated activity in several pre-clinical models and primary cells from patients with hematologic malignancies.
TGR-1202 is being developed jointly with Rhizen Pharmaceuticals, S A, a Switzerland based drug discovery and biotechnology company (“Rhizen”).
The Company and Rhizen are jointly developing the product on a worldwide basis, excluding India, initially focusing on indications in the area of hematologic malignancies and autoimmune disease.
Rhizen shall maintain rights to manufacture and supply the product, while we will be responsible for all clinical and regulatory development for TGR-1202 globally.
The Company’s Investigational New Drug (“IND”) application for TGR-1202 was accepted by the FDA in December 2012 and a first in-human Phase I clinical trial was initiated in January 2013.
Pre-Clinical Data Overview
In an enzyme based assay, TGR-1202 demonstrated potency and specificity towards PI3Kδ with >1000, 50 and 48-fold selectivity over the α, β, and γ PI3K isoforms.
Pre-clinical studies of TGR-1202 were presented in abstract and poster form at the 55
th
Annual ASH Meeting in New Orleans, LA in December 2013. Highlights from the meeting included the following:
| · | Potent synergy observed with the combination of TGR-1202 and brentuximab vedotin (ADCETRIS ® ) in Hodgkin’s Lymphoma cell lines. Poster 1835. |
| · | TGR-1202 demonstrates enhanced Myeloma cell apoptosis in combination with the proteasome inhibitor carfilzomib (KYPROLIS™) in in-vitro cell lines. Poster 3224. |
| · | The combination of TGR-1202 and proteasome inhibitor carfilzomib demonstrate marked synergy in the killing of various B- and T-Cell lymphoma cell lines. Poster 4421. |
Clinical Data Overview and Recent Developments
In January 2013, the Company initiated a Phase I, open label, multi-center, first-in-human clinical trial of TGR-1202 in patients with hematologic malignancies.
The study entitled TGR-1202-101, "A Phase I Dose Escalation Study Evaluating the Safety and Efficacy of TGR-1202 in Patients with Relapsed or Refractory Hematologic Malignancies," is being run in collaboration with the Sarah Cannon Research Institute in Nashville, TN. Enrollment is open to patients with relapsed or refractory NHL, CLL, and Peripheral T-Cell Lymphoma. As of February 2014, TGR-1202-101 is ongoing and enrolling patients in the dose escalation component of the Phase I study and select expansion cohorts.
| 6 | ||
|
|
As of December 1, 2013, 23 patients had been evaluated with single agent TGR-1202 (4 patients at 50 mg QD, and 3 patients each at 100 mg QD, 200 mg QD, 400 mg QD and 1200 mg QD, while 7 patients were evaluated at the 800 mg QD dose). No safety concerns have been recognized by the Study Chair and Medical Monitor for the trial for up through 1200 mg QD.
Preliminary data from this ongoing Phase I study was presented at the 2013 Annual Meeting of the American Society of Hematology, as summarized below:
Safety
:
Overall, TGR-1202 was considered to be well tolerated by treating investigators with the majority of adverse events classified as Grade 1 or 2 in severity. One DLT event of Grade 3 rash was observed at the 800 mg dose level, which necessitated enrollment of an additional 3 patients.
The Grade 3 rash resolved upon interruption of TGR-1202 and concomitant medications and did not recur upon re-challenging the patient at 800 mg QD.
No other DLTs have been reported through 1200 mg QD dosing and adverse events have been manageable, with Grade 3/4 adverse events consisting of the following observed events (regardless of attribution to TGR-1202):
neutropenia, anemia, low WBC, shortness of breath, pruritic rash, diffuse macular papular rash, and thrombocytopenia.
Notably, no liver function laboratory abnormalities, including increases in ALT/AST, have been observed.
Pharmacokinetics
:
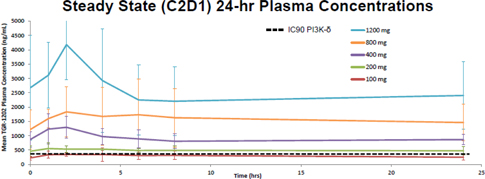
TGR-1202 was rapidly absorbed (mean Tmax ~2 hours), and displayed a Cycle 1, Day 1 half-life of ~15 hours, supporting a once-daily (QD) administration schedule.
Steady state pharmacokinetics were achieved by Day 15 of dosing, with an estimated steady state half-life of ~50 hours observed.
Kinetics were observed to be linear through 1200 mg QD dosing.
Efficacy
:
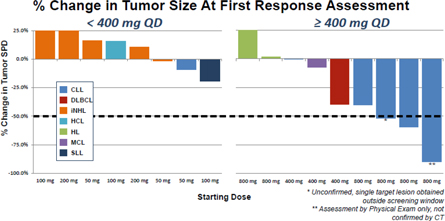
A significant dose-response relationship was observed with patients treated at higher doses (400 mg QD or greater) demonstrating marked reduction in tumor burden.
Of the 5 CLL patients treated at 800 mg QD, one patient was removed from study due to a Richter’s Transformation, however, of the remaining 4 patients, 3 achieved a nodal response (>50% reduction in lymphadenopathy), while the fourth achieved a significant nodal reduction (>40%) at first response assessment.
Overall, TGR-1202 was well tolerated and displayed promising signs of clinical activity at the higher dosing cohorts.
Dose escalation is ongoing, now dosing patients at 1800 mg QD with select expansion cohorts opened and enrolling additional patients.
| 7 | ||
|
|
Pre-clinical activity of TGR-1202 in CLL
In September 2013, a pre-clinical poster on TGR-1202 was presented at the 15th International Workshop on Chronic Lymphocytic Leukemia (iwCLL) which was held in Cologne, Germany.
The poster presentation, entitled "The PI3K-δ inhibitor TGR-1202 induces cytotoxicity and inhibits phosphorylation of AKT in 17p deleted and non-17p deleted CLL cells
in vitro
," highlighted the pre-clinical activity of TGR-1202, in CLL patient samples. The research was conducted by Daphne R. Friedman, MD, from the Duke University Medical Center, Durham, NC and presented by Mark C. Lanasa, MD, PhD.
Market Opportunity for TG-1101 & TGR-1202
Our lead products under development, TG-1101 and TGR-1202 are for the treatment of B-cell hematologic malignancies. Hematologic malignancies include cancers derived from the bone marrow and lymph tissue. The non-Hodgkin lymphomas (NHL) represent a heterogeneous subset of these malignancies. Underneath the single rubric of lymphoma exist some of the most aggressive growing cancers (Burkitt’s lymphoma, lymphoblastic lymphoma, diffuse large-B-cell lymphoma), as well as some of the most indolent (small lymphocytic lymphoma, follicular lymphoma, and marginal zone lymphoma).
In the United States, NHL represents 4-5% of all new cancer cases, and is the fifth leading cause of cancer death.
According to the National Cancer Institute, it is estimated in 2013 that there will be 69,740 cases in the United States, and 19,020 deaths from NHL, despite improvements in treatment. Chronic lymphocytic leukemia (CLL) affects mainly older adults and accounts for one third of all diagnosed cases of leukemia. In the US, an estimated 15,680 new cases of CLL will be reported in 2013 with deaths totaling 4,580 due to the disease according to National Cancer Institute (NCI) estimates.
Despite improvements in therapy, up to one third of patients with aggressive NHL continue to die from their disease, and indolent lymphomas remain incurable in the absence of allogeneic stem cell transplant.
The treatment paradigm for hematologic malignancies is well standardized in front line settings, with the anti-CD20 monoclonal antibody, rituximab, administered generally in combination with chemotherapeutic agents.
While front line therapies are generally efficacious, there are numerous downsides, including a high rate of toxicity associated with exposure to chemotherapeutic agents.
While initially responsive, most patients with hematologic malignancies will relapse and require second, third, and sometimes more lines of therapy.
As a result, there is a pressing need for new, innovative, targeted therapies for the treatment of this heterogeneous group of diseases.
Anti-CD20 antibodies have been approved and studied in a variety of diseases falling into several therapeutic areas including oncology, autoimmune disorders, and neurologic disease.
NHL and CLL are the most common B-cell proliferative diseases for which rituximab, the first anti-CD20 antibody approved by the FDA, is the current gold standard treatment.
While the addition of rituximab to chemotherapeutic treatment of NHL has dramatically improved patient outcomes, many patients will relapse or become refractory to rituximab containing regimens.
Rituximab resistance is becoming an increasing concern for clinicians as relapsing patients are exposed to multiple lines of rituximab containing regimens to treat recurrence of disease.
It is estimated that over half of patients initially responsive to their first exposure to rituximab do not respond upon retreatment (Davis et al, 2000).
We believe these factors contribute to an immediate and sustained need for an anti-CD20 monoclonal antibody that is differentiated and potentially therapeutically superior to the gold standard rituximab in order to extend and enhance CD20 therapy as it stands today.
Additionally, advanced novel agents are being developed which target specific signaling pathways and enzymes known to exhibit aberrant activity and overexpression in B-cell malignancies such as Bruton’s Tyrosine Kinase (BTK), and Phosphoinositide-3-Kinase delta (PI3K delta).
The PI3K/AKT/mTOR pathway has been the target of numerous pharmaceutical agents, both approved and in development, however only recently has the delta isoform of PI3k been identified as a potential target for the treatment of hematologic malignancies and other B-cell lymphoproliferative disorders.
Idelalisib (formerly GS-1101 or CAL-101) is a PI3K delta specific inhibitor that is under development by Gilead Pharmaceuticals, and has shown promising responses in patients with advanced hematologic malignancies.
IPI-145, a PI3K delta and gamma specific inhibitor under development by Infinity Pharmaceuticals has also shown preliminary activity in hematologic malignancies of both B- and T-cell origin.
Other agents in development targeting kinases downstream of the B-cell receptor, such as the BTK inhibitor, ibrutinib, have displayed high rates of response in patients with relapsed and refractory B-cell malignancies and have been recently approved for these indications. While these agents have demonstrated high levels of single agent activity in B-cell disorders, their clinical activity has been shown to be greatly enhanced when utilized in combination with anti-CD20 agents.
| 8 | ||
|
|
The current market for front-line therapy for hematologic malignancies is estimated to be over $7 billion annually, while subsequent lines of therapy currently consist of generically available chemotherapies which do not contribute significantly to the size of the overall hematologic malignancies market.
As novel targeted agents gain FDA approval for the treatment of relapsed and refractory disease, it is anticipated that the size of this market will expand greatly as branded drugs enter use in multiple lines of therapy.
Given the nature of the disease state for patients with hematologic malignancies, characterized by indolent disease progression and chronic relapses, the Company anticipates a great and growing need for novel agents that can be used alone or in combination with approved agents, and those currently under development to enhance the quality of life and extend the length of survival for patients suffering from hematologic malignancies.
AST-726
AST-726 is a nasally delivered form of hydroxocobalamin for the treatment of Vitamin B12 deficiency. The Company acquired global rights to AST-726 as part of the Ariston acquisition. AST-726 has demonstrated pharmacokinetic equivalence to a marketed intramuscular injection product for Vitamin B12 remediation. Given the expiring intellectual property of AST-726, as discussed below, the Company has decided to discontinue development of AST-726.
COSTS AND TIME TO COMPLETE PRODUCT DEVELOPMENT
The information below provides estimates regarding the costs associated with the completion of the current development phase and our current estimated range of the time that will be necessary to complete that development phase for our key pipeline products. We also direct your attention to the risk factors which could significantly affect our ability to meet these cost and time estimates found in this report in Item 1A under the heading “Risks Related to the Company’s Business and Industry.”
|
|
|
|
|
|
|
|
|
|
Estimated cost
|
|
|
Product
|
|
|
|
Development
|
|
Completion
|
|
|
to
|
|
|
candidate
|
|
Target indication
|
|
Status
|
|
of phase
|
|
|
complete phase
|
|
|
TG-1101 (ublituximab)
|
|
As a single agent and in combination for multiple forms of cancer (includes Phase 1b combination with TGR-1202)
|
|
Phase Ib/II
|
|
End of 2014
|
|
|
Approximately $6 million
|
|
|
TGR-1202
|
|
As a single agent in multiple forms of cancer
|
|
Phase I
|
|
Mid-2014
|
|
|
Approximately $1.5 million
|
|
Completion dates and costs in the above table are estimates due to the uncertainties associated with clinical trials and the related requirements of development. In the cases where the requirements for clinical trials and development programs have not been fully defined, or are dependent on the success of other trials, we cannot estimate trial completion or cost with any certainty.
The actual spending on each trial during the year is also dependent on funding.
We therefore direct your attention to Item 7 under the heading “Liquidity and Capital Resources.”
INTELLECTUAL PROPERTY AND PATENTS
General
Our goal is to obtain, maintain and enforce patent protection for our products, formulations, processes, methods and other proprietary technologies, preserve our trade secrets, and operate without infringing on the proprietary rights of other parties, both in the United States and in other countries. Our policy is to actively seek to obtain, where appropriate, the broadest intellectual property protection possible for our product candidates, proprietary information and proprietary technology through a combination of contractual arrangements and patents, both in the U.S. and elsewhere in the world.
We also depend upon the skills, knowledge and experience of our scientific and technical personnel, as well as that of our advisors, consultants and other contractors. This knowledge and experience we call “know-how.” To help protect our proprietary know-how which is not patentable, and for inventions for which patents may be difficult to enforce, we rely on trade secret protection and confidentiality agreements to protect our interests. To this end, we require all employees, consultants, advisors and other contractors to enter into confidentiality agreements which prohibit the disclosure of confidential information and, where applicable, require disclosure and assignment to us of the ideas, developments, discoveries and inventions important to our business.
| 9 | ||
|
|
Patents and other proprietary rights are crucial to the development of our business. We will be able to protect our proprietary technologies from unauthorized use by third parties only to the extent that our proprietary rights are covered by valid and enforceable patents, supported by regulatory exclusivity or are effectively maintained as trade secrets. We have a number of patents and patent applications related to our compounds and other technology, but we cannot guarantee the scope of protection of the issued patents, or that such patents will survive a validity or enforceability challenge, or that any of the pending patent applications will issue as patents.
Generally, patent applications in the U.S. are maintained in secrecy for a period of 18 months or more. Since publication of discoveries in the scientific or patent literature often lag behind actual discoveries, we are not certain that we were the first to make the inventions covered by each of our pending patent applications or that we were the first to file those patent applications. The patent positions of biotechnology and pharmaceutical companies are highly uncertain and involve complex legal and factual questions. Therefore, we cannot predict the breadth of claims allowed in biotechnology and pharmaceutical patents, or their enforceability. To date, there has been no consistent policy regarding the breadth of claims allowed in biotechnology patents. Third parties or competitors may challenge or circumvent our patents or patent applications, if issued. If our competitors prepare and file patent applications in the U.S. that claim technology also claimed by us, we may have to participate in interference proceedings declared by the U.S. Patent and Trademark Office to determine priority of invention, which could result in substantial cost, even if the eventual outcome is favorable to us. Because of the extensive time required for development, testing and regulatory review of a potential product, it is possible that before we commercialize any of our products, any related patent may expire or remain in existence for only a short period following commercialization, thus reducing any advantage of the patent.
However, the life of a patent covering a product that has been subject to regulatory approval may have the ability to be extended through the patent restoration program, although any such extension could still be minimal.
If a patent is issued to a third party containing one or more preclusive or conflicting claims, and those claims are ultimately determined to be valid and enforceable, we may be required to obtain a license under such patent or to develop or obtain alternative technology. In the event of litigation involving a third party claim, an adverse outcome in the litigation could subject us to significant liabilities to such third party, require us to seek a license for the disputed rights from such third party, and/or require us to cease use of the technology.
Further, our breach of an existing license or failure to obtain a license to technology required to commercialize our products may seriously harm our business. We also may need to commence litigation to enforce any patents issued to us or to determine the scope and validity of third-party proprietary rights. Litigation would involve substantial costs.
TG-1101
Pursuant to our license for TG-1101 (ublituximab) with LFB Biotechnologies, GTC Biotherapeutics, and LFB/GTC LLC, we have the exclusive commercial rights to a series of patents and patent applications in the U.S., and in multiple countries around the world.
These patents and patent applications include composition of matter patents relating to the structure and mechanism of action for TG-1101 as well as method of use patents which cover use of TG-1101 in combination with various agents and for various therapeutic indications.
In the United States, we have seven issued patents for TG-1101 which expire between 2021 and 2024, excluding any patent term extensions, as well as granted and pending foreign counterpart patent filings related to these issued patents.
These patents include claims related to the manufacture and use of TG-1101.
Additionally, we have over 10 issued patents outside the US, and over 45 patent applications pending worldwide including claims directed to the composition of matter and methods of treatment with TG-1101 in various settings.
TGR-1202
Pursuant to our Collaboration Agreement with Rhizen for TGR-1202, we have the exclusive commercial rights to a series of patent applications in the U.S. and abroad.
The patent applications include composition of matter patents relating to the structure and mechanism of action for TGR-1202 as well as method of use patents which cover use of TGR-1202 in combination with various agents and for various therapeutic indications.
All patent applications currently filed for TG-1202 are currently pending. Because the dates for any potential regulatory approval is currently unknown we cannot predict the expected expiration date, and it is possible that the life of these patents following regulatory approval could be minimal.
AST-726
The Company has certain patent rights and other intellectual property relating to AST-726 in the U.S. and multiple countries around the world, which expire at various times from 2014 to 2015.
| 10 | ||
|
|
The patent rights that we own or have licensed relating to our product candidates are limited in ways that may affect our ability to exclude third parties from competing against us if we obtain regulatory approval to market these product candidates.
See section “
Risks Related to the Company’s Intellectual Property.
”
Proof of direct infringement by a competitor for method of use patents can prove difficult because the competitors making and marketing a product typically do not engage in the patented use.
Additionally, proof that a competitor contributes to or induces infringement of a patented method of use by another can also prove difficult because an off-label use of a product could prohibit a finding of contributory infringement and inducement of infringement requires proof of intent by the competitor.
Moreover, physicians may prescribe such a competitive identical product for indications other than the one for which the product has been approved, or off-label indications, that are covered by the applicable patents. Although such off-label prescriptions may directly infringe or contribute to or induce infringement of method of use patents, such infringement is difficult to prevent or prosecute.
In addition, the limited patent protection described above may adversely affect the value of our product candidates and may inhibit our ability to obtain a corporate partner at terms acceptable to us, if at all.
Other Intellectual Property Rights
We depend upon trademarks, trade secrets, know-how and continuing technological advances to develop and maintain our competitive position. To maintain the confidentiality of trade secrets and proprietary information, we require our employees, scientific advisors, consultants and collaborators, upon commencement of a relationship with us, to execute confidentiality agreements and, in the case of parties other than our research and development collaborators, to agree to assign their inventions to us. These agreements are designed to protect our proprietary information and to grant us ownership of technologies that are developed in connection with their relationship with us. These agreements may not, however, provide protection for our trade secrets in the event of unauthorized disclosure of such information.
In addition to patent protection, we may utilize orphan drug regulations or other provisions of the Food, Drug and Cosmetic Act of 1938, as amended, or FDCA, to provide market exclusivity for certain of our drug candidates. Orphan drug regulations provide incentives to pharmaceutical and biotechnology companies to develop and manufacture drugs for the treatment of rare diseases, currently defined as diseases that exist in fewer than 200,000 individuals in the U.S., or, diseases that affect more than 200,000 individuals in the U.S. but that the sponsor does not realistically anticipate will generate a net profit. Under these provisions, a manufacturer of a designated orphan-drug can seek tax benefits, and the holder of the first FDA approval of a designated orphan product will be granted a seven-year period of marketing exclusivity for such FDA-approved orphan product.
Pursuant to these regulations, TG-1101 (ublituximab) has received Orphan-Drug designation from the FDA for the treatment of Marginal Zone Lymphoma (Nodal and Extranodal) in September 2013, for the treatment of CLL in August of 2010, and Orphan-Drug designation by the European Medicines Agency (“EMA”) for the treatment of CLL in November of 2009. We believe that TG-1101 may be eligible for additional orphan drug designations; however, we cannot assure you that TG-1101, or any other drug candidates we may acquire or in-license, will obtain such orphan drug designations. Additionally, upon FDA approval, we believe that TG-1101 would qualify as a New Chemical Entity, or NCE, which provides for five years of exclusivity following approval.
We cannot assure you that any other drug candidates we may acquire or in-license, will obtain such orphan drug designation or that we will be the first to receive FDA approval for such drugs so as to be eligible for market exclusivity protection.
LICENSING AGREEMENTS AND COLLABORATIONS
We have formed strategic alliances with a number of companies for the manufacture and commercialization of our products. Our current key strategic alliances are discussed below.
| 11 | ||
|
|
TG-1101
LFB Biotechnologies S.A.S, GTC Biotherapeutics, LFB/GTC LLC.
In January 2012, we entered into an exclusive license agreement with LFB Biotechnologies, GTC Biotherapeutics, and LFB/GTC LLC, all wholly-owned subsidiaries of LFB Group, relating to the development of TG-1101.
Under the license agreement, we have acquired the exclusive worldwide rights (exclusive of France/Belgium) for the development and commercialization of TG-1101 (ublituximab). To date, we have made no payments to LFB Group and LFB Group is eligible to receive payments of up to an aggregate of approximately $31.0 million upon our successful achievement of certain clinical development, regulatory and sales milestones, in addition to royalty payments on net sales of TG-1101 at a royalty rate that escalates from mid-single digits to high-single digits. The license will terminate on a country by country basis upon the expiration of the last licensed patent right or 15 years after the first commercial sale of a product in such country, unless the agreement is earlier terminated (i) by LFB if the Company challenges any of the licensed patent rights, (ii) by either party due to a breach of the agreement, or (iii) by either party in the event of the insolvency of the other party.
Ildong Pharmaceutical Co. Ltd.
In November 2012, we entered into an exclusive (within the territory) sublicense agreement with Ildong relating to the development and commercialization of TG-1101 in South Korea and Southeast Asia.
Under the terms of the sublicense agreement, Ildong has been granted a royalty bearing, exclusive right, including the right to grant sublicenses, to develop and commercialize TG-1101 in South Korea, Taiwan, Singapore, Indonesia, Malaysia, Thailand, Philippines, Vietnam, and Myanmar.
To date, we have received $2 million in the form of an upfront payment from Ildong, and are eligible to receive sales based milestone payments up to an aggregate of $5 million and royalty payments on net sales of TG-1101 at a royalty rate that escalates from mid-teens to high-teens upon approval in South Korea and/or Southeast Asia.
The license will terminate on a country by country basis upon the expiration of the last licensed patent right or 15 years after the first commercial sale of a product in such country, unless the agreement is earlier terminated (i) by Ildong if the Company challenges any of the licensed patent rights, (ii) by either party due to a breach of the agreement, or (iii) by either party in the event of the insolvency of the other party.
TGR-1202
On August 15, 2012, the Company and Rhizen entered into an exclusive global agreement to collaborate on the development and commercialization of Rhizen’s lead product candidate (the “Collaboration Agreement”), a novel P13K delta inhibitor, TGR-1202 (previously referred to as RP5264). The companies will jointly develop the product on a worldwide basis, excluding India, initially focusing on indications in the area of hematologic malignancies and autoimmune disease. Beyond TGR-1202, Rhizen would contribute backup molecules providing multiple opportunities for TG to develop differentiated therapies against hematologic cancers and autoimmune diseases.
The Company will make up-front licensing payments and milestones based on early clinical development, and will be responsible for the costs of clinical development of the product through Phase II, after which the Company and Rhizen will be jointly responsible for all development costs of the product. The Company and Rhizen will each maintain an exclusive option, exercisable at specific times during development, for the Company to license the rights to TGR-1202, in which case Rhizen would be eligible to receive upfront, development, and commercialization milestone payments in addition to milestone payments and royalties tied to net sales of the product, the aggregate of which could exceed $182.5 million. Rhizen shall maintain rights to manufacture and supply the product to the Company, and the Company will be responsible for all clinical and regulatory development for TGR-1202 globally.
In connection with the Collaboration Agreement, the Company incurred upfront milestone payments of $1,000,000 during the year ended December 31, 2012.
During the year ended December 31, 2013 the Company recognized a $2,000,000 milestone payment to Rhizen related to the development of TGR-1202.
Pursuant to the terms of the Collaboration Agreement, should either of the exclusive license options be exercised, Rhizen would be eligible to receive up to an aggregate of $182.5 million upon the successful achievement of certain clinical development, regulatory, and sales based milestones in addition to royalties on net sales of TGR-1202. The Collaboration Agreement will terminate upon the earlier to occur of (i) the Company’s exercise of its license option, (ii) Rhizen’s exercise of its license option or (iii) the later to occur of (A) the expiration of the last applicable patent of the joint patents of the parties, Rhizen’s patents or the Company’s patents, or (B) the expiry of any other exclusivity right with respect to the product in a country, including patent term extensions, marketing exclusivity or any other non-patent exclusivity. In addition, the agreement may be earlier terminated (i) by the Company with or without cause upon six months’ notice, (ii) by either party due to a breach of the agreement by the other party, (iii) by either party upon the insolvency of the other party, or (iv) by Rhizen if, even when conditions are met, the Company still fails to file a new drug application.
In case of a termination pursuant to (i), (ii) or (iv) in the preceding sentence, Rhizen has the right to obtain a license to the Company’s intellectual property relating to TGR-1202, for a royalty rate to be equal to the current fair market value of the license to be negotiated by the parties at the time of termination.
| 12 | ||
|
|
COMPETITION
Competition in the pharmaceutical and biotechnology industries is intense. Our competitors include pharmaceutical companies and biotechnology companies, as well as universities and public and private research institutions.
In addition, companies that are active in different but related fields represent substantial competition for us.
Many of our competitors have significantly greater capital resources, larger research and development staffs and facilities and greater experience in drug development, regulation, manufacturing and marketing than we do. These organizations also compete with us to recruit qualified personnel, attract partners for joint ventures or other collaborations, and license technologies that are competitive with ours.
To compete successfully in this industry we must identify novel and unique drugs or methods of treatment and then complete the development of those drugs as treatments in advance of our competitors.
The drugs that we are attempting to develop will have to compete with existing therapies. In addition, a large number of companies are pursuing the development of pharmaceuticals that target the same diseases and conditions that we are targeting. Other companies have products or drug candidates in various stages of pre-clinical or clinical development to treat diseases for which we are also seeking to discover and develop drug candidates. Some of these potential competing drugs are further advanced in development than our drug candidates and may be commercialized earlier.
If approved, we expect TG-1101 to compete directly with Roche Group’s Rituxan
®
(Rituximab) and Gazyva™ (Obinutuzumab), Spectrum Pharmaceutical’s Zevalin
®
(Y
90
-Ibritumomab Tiuxetan), Dr. Reddy’s Laboratories’ Reditux
®
, and Genmab and GlaxoSmithKline’s Arzerra
®
(Ofatumumab) among others, each of which is currently approved for the treatment of various diseases including NHL and CLL.
In addition, other pharmaceutical companies are developing anti-CD20 antibodies which, if approved, would potentially compete with TG-1101.
New developments, including the development of other pharmaceutical technologies and methods of treating disease, occur in the pharmaceutical and life sciences industries at a rapid pace.
With respect to TGR-1202, although no PI3K delta inhibitors have been approved by the FDA, there are several PI3K delta targeted compounds in development, including, but not limited to, Gilead’s Idelalisib (formerly known as GS-1101 and CAL-101), Infinity Pharmaceuticals IPI-145 and Amgen’s AMG-319, which if approved we would expect to compete directly with TGR-1202.
In addition, there are numerous other novel therapies targeting similar pathways to TGR-1202 in development, which would also compete with TGR-1202 in similar indications, such as the BTK inhibitor, ibrutinib (FDA approved for Mantle Cell Lymphoma and CLL marketed by Pharmacyclics and Janssen), or the blc-2 inhibitor ABT-199 (under clinical development by AbbVie and Roche).
Additional information can be found under Item 1A - Risk Factors – Other Risks Related to Our Business within this report.
SUPPLY AND MANUFACTURING
We have limited experience in manufacturing products for clinical or commercial purposes. We currently do not have any manufacturing capabilities.
We have established contract manufacturing relationships for the supply of TG-1101 as part of our license agreement with LFB Biotechnologies, among others. We have also established contract manufacturing relationships for the supply of TGR-1202 as part of our collaboration agreement with Rhizen. As with any supply program, obtaining pre-clinical and clinical materials of sufficient quality and quantity to meet the requirements of our development programs cannot be guaranteed and we cannot ensure that we will be successful in this endeavor. In addition, we anticipate the need for the current scale of production for each of our products to be significantly expanded as we enter later stages of development.
There can be no assurance given that such scale-up will be successful in providing pharmaceutical product that is of sufficient quantity, or of a quality that is consistent with our previously established specifications, or that meets the requirements set by regulatory agencies under which we may seek approval of our product candidates.
At the time of commercial sale, to the extent possible and commercially practicable, we would seek to engage a back-up supplier for each of our product candidates. Until such time, we expect that we will rely on a single contract manufacturer to produce each of our product candidates under current Good Manufacturing Practice, or cGMP, regulations. Our third-party manufacturers have a limited number of facilities in which our product candidates can be produced and will have limited experience in manufacturing our product candidates in quantities sufficient for commercialization. Our third-party manufacturers will have other clients and may have other priorities that could affect their ability to perform the work satisfactorily and/or on a timely basis. Both of these occurrences would be beyond our control.
We expect to similarly rely on contract manufacturing relationships for any products that we may in-license or acquire in the future. However, there can be no assurance that we will be able to successfully contract with such manufacturers on terms acceptable to us, or at all.
| 13 | ||
|
|
Contract manufacturers are subject to ongoing periodic and unannounced inspections by the FDA, the Drug Enforcement Administration and corresponding state agencies to ensure strict compliance with cGMP and other state and federal regulations. Our contractors outside of the United States face similar challenges from the numerous local and regional agencies and authorized bodies. We do not have control over third-party manufacturers’ compliance with these regulations and standards, other than through contractual obligations. If they are deemed out of compliance with cGMPs, product recalls could result, inventory could be destroyed, production could be stopped and supplies could be delayed or otherwise disrupted.
If we need to change manufacturers after commercialization, the FDA and corresponding foreign regulatory agencies must approve these new manufacturers in advance, which will involve testing and additional inspections to ensure compliance with FDA regulations and standards and may require significant lead times and delay. Furthermore, switching manufacturers may be difficult because the number of potential manufacturers is limited. It may be difficult or impossible for us to find a replacement manufacturer quickly or on terms acceptable to us, or at all.
GOVERNMENT AND INDUSTRY REGULATION
Numerous governmental authorities, principally the FDA and corresponding state and foreign regulatory agencies, impose substantial regulations upon the clinical development, manufacture and marketing of our drug candidates, as well as our ongoing research and development activities. None of our drug candidates have been approved for sale in any market in which we have marketing rights. Before marketing in the U.S., any drug that we develop must undergo rigorous pre-clinical testing and clinical trials and an extensive regulatory approval process implemented by the FDA under the FDCA. The FDA regulates, among other things, the pre-clinical and clinical testing, safety, efficacy, approval, manufacturing, record keeping, adverse event reporting, packaging, labeling, storage, advertising, promotion, export, sale and distribution of biopharmaceutical products.
The regulatory review and approval process is lengthy, expensive and uncertain. We are required to submit extensive pre-clinical and clinical data and supporting information to the FDA for each indication or use to establish a drug candidate’s safety and efficacy before we can secure FDA approval to market or sell a product in the U.S. The approval process takes many years, requires the expenditure of substantial resources and may involve ongoing requirements for post-marketing studies or surveillance. Before commencing clinical trials in humans, we must submit an IND to the FDA containing, among other things, pre-clinical data, chemistry, manufacturing and control information, and an investigative plan. Our submission of an IND may not result in FDA authorization to commence a clinical trial.
The FDA may permit expedited development, evaluation, and marketing of new therapies intended to treat persons with serious or life-threatening conditions for which there is an unmet medical need under its fast track drug development programs. A sponsor can apply for fast track designation at the time of submission of an IND, or at any time prior to receiving marketing approval of the new drug application, or NDA. To receive Fast Track designation, an applicant must demonstrate:
| · | that the drug is intended to treat a serious or life-threatening condition; |
| · | that the drug is intended to treat a serious aspect of the condition; and |
| · | that the drug has the potential to address unmet medical needs, and this potential is being evaluated in the planned drug development program. |
The FDA must respond to a request for fast track designation within 60 calendar days of receipt of the request. Over the course of drug development, a product in a fast track development program must continue to meet the criteria for fast track designation. Sponsors of products in fast track drug development programs must be in regular contact with the reviewing division of the FDA to ensure that the evidence necessary to support marketing approval will be developed and presented in a format conducive to an efficient review. Sponsors of products in fast track drug development programs ordinarily are eligible for priority review of a completed application in six months or less and also may be permitted to submit portions of a New Drug Application (“NDA”) to the FDA for review before the complete application is submitted.
| 14 | ||
|
|
Sponsors of drugs designated as fast track also may seek approval under the FDA’s accelerated approval regulations.
Under this authority, the FDA may grant marketing approval for a new drug product on the basis of adequate and well-controlled clinical trials establishing that the drug product has an effect on a surrogate endpoint that is reasonably likely, based on epidemiologic, therapeutic, pathophysiologic, or other evidence, to predict clinical benefit or on the basis of an effect on a clinical endpoint other than survival or irreversible morbidity. Approval will be subject to the requirement that the applicant study the drug further to verify and describe its clinical benefit where there is uncertainty as to the relation of the surrogate endpoint to clinical benefit or uncertainty as to the relation of the observed clinical benefit to ultimate outcome. Post-marketing studies are usually underway at the time an applicant files the NDA. When required to be conducted, such post-marketing studies must also be adequate and well-controlled. The applicant must carry out any such post-marketing studies with due diligence.
Many companies who have been granted the right to utilize an accelerated approval approach have failed to obtain approval. Moreover, negative or inconclusive results from the clinical trials we hope to conduct or adverse medical events could cause us to have to repeat or terminate the clinical trials. Accordingly, we may not be able to complete the clinical trials within an acceptable time frame, if at all, and, therefore, could not submit the NDA to the FDA or foreign regulatory authorities for marketing approval.
In addition, sponsors may also apply to the FDA for Breakthrough Therapy Designation. The Breakthrough Therapy Designation is intended to expedite the development and review of a potential new drug for serious or life-threatening diseases where “preliminary clinical evidence indicates that the drug may demonstrate substantial improvement over existing therapies on one or more clinically significant endpoints, such as substantial treatment effects observed early in clinical development.” The designation of a drug as a Breakthrough Therapy was enacted as part of the 2012 Food and Drug Administration Safety and Innovation Act.
Clinical testing must meet requirements for institutional review board oversight, informed consent and good clinical practices, and must be conducted pursuant to an IND, unless exempted.
For purposes of NDA approval, clinical trials are typically conducted in the following sequential phases:
| · | Phase 1 : The drug is administered to a small group of humans, either healthy volunteers or patients, to test for safety, dosage tolerance, absorption, metabolism, excretion, and clinical pharmacology. |
| · | Phase 2 : Studies are conducted on a larger number of patients to assess the efficacy of the product, to ascertain dose tolerance and the optimal dose range, and to gather additional data relating to safety and potential adverse events. |
| · | Phase 3 : Studies establish safety and efficacy in an expanded patient population. |
| · | Phase 4 : The FDA may require Phase 4 post-marketing studies to find out more about the drug’s long-term risks, benefits, and optimal use, or to test the drug in different populations. |
The length of time necessary to complete clinical trials varies significantly and may be difficult to predict. Clinical results are frequently susceptible to varying interpretations that may delay, limit or prevent regulatory approvals. Additional factors that can cause delay or termination of our clinical trials, or that may increase the costs of these trials, include:
| · | slow patient enrollment due to the nature of the clinical trial plan, the proximity of patients to clinical sites, the eligibility criteria for participation in the study or other factors; |
| · | inadequately trained or insufficient personnel at the study site to assist in overseeing and monitoring clinical trials or delays in approvals from a study site’s review board; |
| · | longer treatment time required to demonstrate efficacy or determine the appropriate product dose; |
| · | insufficient supply of the drug candidates; |
| · | adverse medical events or side effects in treated patients; and |
| · | ineffectiveness of the drug candidates. |
In addition, the FDA, equivalent foreign regulatory authority, or a data safety monitoring committee for a trial may place a clinical trial on hold or terminate it if it concludes that subjects are being exposed to an unacceptable health risk, or for futility. Any drug is likely to produce some toxicity or undesirable side effects in animals and in humans when administered at sufficiently high doses and/or for a sufficiently long period of time. Unacceptable toxicity or side effects may occur at any dose level at any time in the course of studies in animals designed to identify unacceptable effects of a drug candidate, known as toxicological studies, or clinical trials of drug candidates. The appearance of any unacceptable toxicity or side effect could cause us or regulatory authorities to interrupt, limit, delay or abort the development of any of our drug candidates and could ultimately prevent approval by the FDA or foreign regulatory authorities for any or all targeted indications.
| 15 | ||
|
|
Sponsors of drugs may apply for an SPA from the FDA. The SPA process is a procedure by which the FDA provides official evaluation and written guidance on the design and size of proposed protocols that are intended to form the basis for a new drug application. However, final marketing approval depends on the results of efficacy, the adverse event profile and an evaluation of the benefit/risk of treatment demonstrated in the Phase 3 trial. The SPA agreement may only be changed through a written agreement between the sponsor and the FDA, or if the FDA becomes aware of a substantial scientific issue essential to product safety or efficacy.
Before receiving FDA approval to market a product, we must demonstrate that the product is safe and effective for its intended use by submitting to the FDA an NDA containing the pre-clinical and clinical data that have been accumulated, together with chemistry and manufacturing and controls specifications and information, and proposed labeling, among other things. The FDA may refuse to accept an NDA for filing if certain content criteria are not met and, even after accepting an NDA, the FDA may often require additional information, including clinical data, before approval of marketing a product.
It is also becoming more common for the FDA to request a Risk Evaluation and Mitigation Strategy, or REMS, as part of a NDA. The REMS plan contains post-market obligations of the sponsor to train prescribing physicians, monitor off-label drug use, and conduct sufficient Phase 4 follow-up studies and registries to ensure the continued safe use of the drug.
As part of the approval process, the FDA must inspect and approve each manufacturing facility. Among the conditions of approval is the requirement that a manufacturer’s quality control and manufacturing procedures conform to cGMP. Manufacturers must expend significant time, money and effort to ensure continued compliance, and the FDA conducts periodic inspections to certify compliance. It may be difficult for our manufacturers or us to comply with the applicable cGMP, as interpreted by the FDA, and other FDA regulatory requirements. If we, or our contract manufacturers, fail to comply, then the FDA may not allow us to market products that have been affected by the failure.
If the FDA grants approval, the approval will be limited to those disease states, conditions and patient populations for which the product is safe and effective, as demonstrated through clinical studies. Further, a product may be marketed only in those dosage forms and for those indications approved in the NDA. Certain changes to an approved NDA, including, with certain exceptions, any significant changes to labeling, require approval of a supplemental application before the drug may be marketed as changed. Any products that we manufacture or distribute pursuant to FDA approvals are subject to continuing monitoring and regulation by the FDA, including compliance with cGMP and the reporting of adverse experiences with the drugs. The nature of marketing claims that the FDA will permit us to make in the labeling and advertising of our products will generally be limited to those specified in FDA approved labeling, and the advertising of our products will be subject to comprehensive monitoring and regulation by the FDA. Drugs whose review was accelerated may carry additional restrictions on marketing activities, including the requirement that all promotional materials are pre-submitted to the FDA.
Claims exceeding those contained in approved labeling will constitute a violation of the FDCA. Violations of the FDCA or regulatory requirements at any time during the product development process, approval process, or marketing and sale following approval may result in agency enforcement actions, including withdrawal of approval, recall, seizure of products, warning letters, injunctions, fines and/or civil or criminal penalties. Any agency enforcement action could have a material adverse effect on our business.
Should we wish to market our products outside the U.S., we must receive marketing authorization from the appropriate foreign regulatory authorities. The requirements governing the conduct of clinical trials, marketing authorization, pricing and reimbursement vary widely from country to country. At present, companies are typically required to apply for foreign marketing authorizations at a national level. However, within the European Union, registration procedures are available to companies wishing to market a product in more than one European Union member state. Typically, if the regulatory authority is satisfied that a company has presented adequate evidence of safety, quality and efficacy, then the regulatory authority will grant a marketing authorization. This foreign regulatory approval process, however, involves risks similar or identical to the risks associated with FDA approval discussed above, and therefore we cannot guarantee that we will be able to obtain the appropriate marketing authorization for any product in any particular country.
Failure to comply with applicable federal, state and foreign laws and regulations would likely have a material adverse effect on our business. In addition, federal, state and foreign laws and regulations regarding the manufacture and sale of new drugs are subject to future changes. We cannot predict the likelihood, nature, effect or extent of adverse governmental regulation that might arise from future legislative or administrative action, either in the U.S. or abroad.
| 16 | ||
|
|
EMPLOYEES
As of March 1, 2014, we had thirteen full and part-time employees. None of our employees are represented by a collective bargaining agreement, and we have never experienced a work stoppage. We consider our relations with our employees to be good.
You should carefully consider the following risks and uncertainties. If any of the following occurs, our business, financial condition or operating results could be materially harmed. An investment in our securities is speculative in nature, involves a high degree of risk, and should not be made by an investor who cannot bear the economic risk of its investment for an indefinite period of time and who cannot afford the loss of its entire investment.
You should carefully consider the following risk factors and the other information contained elsewhere in this Annual Report before making an investment in our securities.
Risks Related to the Company’s Business and Industry
Because we have in-licensed our product candidates from third parties, any dispute with or non-performance by our licensors will adversely affect our ability to develop and commercialize the applicable product candidates.
Our product candidates have been in-licensed from third parties.
Under the terms of our license agreements, the licensors generally will have the right to terminate such agreement in the event of a material breach by us.
The licensors will also have the right to terminate the agreement in the event we fail to use diligent and reasonable efforts to develop and commercialize the product candidate worldwide.
If there is any conflict, dispute, disagreement or issue of non-performance between us and our licensing partners regarding our rights or obligations under the license agreements, including any such conflict, dispute or disagreement arising from our failure to satisfy payment obligations under such agreement, our ability to develop and commercialize the affected product candidate and our ability to enter into collaboration or marketing agreements for the affected product candidate may be adversely affected.
Any loss of our rights under these license agreements would delay or completely terminate its product development efforts for the affected product candidate.
We do not have full internal development capabilities, and are thus reliant upon our partners and third parties to generate clinical, preclinical and quality data necessary to support the regulatory applications needed to conduct clinical trials and file for marketing approval.
In order to submit and maintain an IND, Biologics License Application (“BLA”), or NDA to the FDA, it is necessary to submit all information on the clinical, non-clinical, chemistry, manufacturing, controls and quality aspects of the product candidate.
We rely on our third party contractors and our licensing partners to provide a significant portion of this data.
If we are unable to obtain this data, or the data is not sufficient to meet the regulatory requirements, we may experience significant delays in our development programs. Additionally, an IND must be active in each division in which we intend to conduct clinical trials.
While we maintain an active IND for
TG-1101
and TGR-1202 enabling the conduct of studies in the FDA’s Division of Hematology and Oncology; there can be no assurance given that we will be successful in obtaining an active IND for
TG-1101
or TGR-1202 in any other division under whose supervision we may seek to develop our product candidates, or that the FDA will allow us to continue the development of our product candidates in those divisions where we maintain an active IND.
We are highly dependent on the success of our product candidates and cannot give any assurance that these or any future product candidates will be successfully commercialized.
We are a development-stage biopharmaceutical company, and do not currently have any commercial products that generate revenues or any other sources of revenue.
We may never be able to successfully develop marketable products.
Our pharmaceutical development methods are unproven and may not lead to commercially viable products for any of several reasons.
If we are unable to develop, or receive regulatory approval for or successfully commercialize any of our product candidates, we will not be able to generate product revenues.
| 17 | ||
|
|
Because the results of preclinical studies and early clinical trials are not necessarily predictive of future results, any product candidate we advance into clinical trials may not have favorable results in later clinical trials, if any, or receive regulatory approval.
Pharmaceutical development has inherent risk.
We will be required to demonstrate through adequate and well-controlled clinical trials that our product candidates are effective with a favorable benefit-risk profile for use in diverse populations for their target indications before we can seek regulatory approvals for their commercial sale.
Success in early clinical trials does not mean that later clinical trials will be successful because product candidates in later-stage clinical trials may fail to demonstrate sufficient safety or efficacy despite having progressed through initial clinical testing.
Companies frequently suffer significant setbacks in advanced clinical trials, even after earlier clinical trials have shown promising results.
In addition, there is typically an extremely high rate of attrition from the failure of pharmaceutical candidates proceeding through clinical trials.
We plan on conducting additional Phase I, II and III clinical trials for
TG-1101
. Early clinical results seen with
TG-1101
in a small number of patients may not be reproduced in expanded or larger clinical trials. Additionally, individually reported outcomes of patients treated in clinical trials may not be representative of the entire population of treated patients in such studies. If the results from expansion cohorts or later trials are different from those found in the earlier studies of
TG-1101
, we may need to terminate or revise our clinical development plan, which could extend the time for conducting our development program and could have a material adverse effect on our business.
TGR-1202 has only recently entered into a first-in-human Phase I clinical trial. As such, preliminary human data is only available from a limited number of patients from the ongoing Phase I clinical trial. There can be no assurances given that TGR-1202 will exhibit sufficient pharmacologic properties following review of the data from this first Phase I study to support further development of TGR-1202.
In addition, the pharmacologic and pharmacokinetic properties demonstrated by TGR-1202 in early cohorts and at lower doses may not be consistent with those demonstrated at higher doses of TGR-1202. Furthermore, such pharmacologic data arising from this first Phase I study may be inconclusive or not reproducible in later clinical trials.
In such situation, we may conduct additional clinical trials only to learn later that TGR-1202 lacks adequate pharmacologic properties.
Additionally, even if we believed that TGR-1202 possessed adequate pharmacologic properties, that still does not ensure that TGR-1202 will be a safe and effective pharmaceutical agent.
If TGR-1202 were ultimately determined to lack adequate pharmacologic properties or fail to be a safe and effective pharmaceutical agent, we would have to cease development, which could have a material adverse effect on our business.
In such event, despite the rights we retain to back-up compounds, our PI3k Delta program would be significantly delayed or terminated.
Any product candidates we may advance into clinical development are subject to extensive regulation, which can be costly and time consuming, cause unanticipated delays or prevent the receipt of the required approvals to commercialize our product candidates.
The clinical development, manufacturing, labeling, storage, record-keeping, advertising, promotion, import, export, marketing and distribution of our product candidates or any future product candidates are subject to extensive regulation by the FDA in the United States and by comparable health authorities worldwide or in foreign markets.
In the United States, we are not permitted to market our product candidates until we receive approval of a BLA or NDA from the FDA.
The process of obtaining BLA and NDA approval is expensive, often takes many years and can vary substantially based upon the type, complexity and novelty of the products involved.
Approval policies or regulations may change and the FDA has substantial discretion in the pharmaceutical approval process, including the ability to delay, limit or deny approval of a product candidate for many reasons.
In addition, the FDA may require post-approval clinical trials or studies which also may be costly.
The FDA approval for a limited indication or approval with required warning language, such as a boxed warning, could significantly impact our ability to successfully market our product candidates.
Finally, the FDA may require adoption of a Risk Evaluation and Mitigation Strategy (REMS) requiring prescriber training, post-market registries, or otherwise restricting the marketing and dissemination of these products.
Despite the time and expense invested in clinical development of product candidates, regulatory approval is never guaranteed.
Assuming successful clinical development, we intend to seek product approvals in countries outside the United States.
As a result, we would be subject to regulation by the EMA, as well as the other regulatory agencies in many of these countries, and other regulatory agencies around the world.
Approval procedures vary among countries and can involve additional product testing and additional administrative review periods.
The time required to obtain approval in other countries might differ from that required to obtain FDA approval.
Regulatory approval in one country does not ensure regulatory approval in another, but a failure or delay in obtaining regulatory approval in one country may negatively impact the regulatory process in others.
As in the United States, the regulatory approval process in Europe and in other countries is a lengthy and challenging process.
The FDA, and any other regulatory body around the world can delay, limit or deny approval of a product candidate for many reasons, including:
| · | the FDA or comparable foreign regulatory authorities may disagree with the design or implementation of our clinical trials; |
| · | we may be unable to demonstrate to the satisfaction of the FDA or comparable foreign regulatory authorities that a product candidate is safe and effective for any indication; |
| 18 | ||
|
|
| · | the FDA may not accept clinical data from trials which are conducted by individual investigators or in countries where the standard of care is potentially different from the United States; |
| · | the results of clinical trials may not meet the level of statistical significance required by the FDA or comparable foreign regulatory authorities for approval; |
| · | we may be unable to demonstrate that a product candidate's clinical and other benefits outweigh its safety risks; |
| · | the FDA or comparable foreign regulatory authorities may disagree with our interpretation of data from preclinical studies or clinical trials; |
| · | the data collected from clinical trials of our product candidates may not be sufficient to support the submission of a BLA, NDA or other submission or to obtain regulatory approval in the United States or elsewhere; |
| · | the FDA or comparable foreign regulatory authorities may fail to approve the manufacturing processes or facilities of third-party manufacturers with which we or our collaborators contract for clinical and commercial supplies; or |
| · | the approval policies or regulations of the FDA or comparable foreign regulatory authorities may significantly change in a manner rendering our clinical data insufficient for approval. |
In addition, recent events raising questions about the safety of certain marketed pharmaceuticals may result in increased cautiousness by the FDA and other regulatory authorities in reviewing new pharmaceuticals based on safety, efficacy or other regulatory considerations and may result in significant delays in obtaining regulatory approvals.
Regulatory approvals for our product candidates may not be obtained without lengthy delays, if at all. Any delay in obtaining, or inability to obtain, applicable regulatory approvals would prevent us from commercializing our product candidates.
Any product candidate we advance into clinical trials may cause unacceptable adverse events or have other properties that may delay or prevent their regulatory approval or commercialization or limit their commercial potential.
Unacceptable adverse events caused by any of our product candidates that we take into clinical trials could cause either us or regulatory authorities to interrupt, delay, modify or halt clinical trials and could result in the denial of regulatory approval by the FDA or other regulatory authorities for any or all targeted indications.
This, in turn, could prevent us from commercializing the affected product candidate and generating revenues from its sale.
We have not completed testing of any of our product candidates for the treatment of the indications for which we intend to seek product approval in humans, and we currently do not know the extent that adverse events, if any, will be observed in patients who receive any of its product candidates.
To date, clinical trials using
TG-1101
and our other product candidates have demonstrated a toxicity profile that was deemed acceptable by the investigators performing such studies.
Such interpretation may not be shared by future investigators or by the FDA and in the case of
TG-1101
and TGR-1202, even if deemed acceptable for oncology applications, it may not be acceptable for diseases outside the oncology setting, and likewise for any other product candidates we may develop.
Additionally, the severity, duration and incidence of adverse events may increase in larger study populations.
With respect to
TG-1101
, the toxicity when manufactured under different conditions is not known, and it is possible that additional and/or different adverse events may appear upon the human use of those formulations and those adverse events may arise with greater frequency, intensity and duration than in the current formulation.
Such risk also exists for new manufacturing processes and/or formulations, if any, of TGR-1202, the clinical impact of which is not known.
Further, with respect to TGR-1202, to date only a small number of patients have been dosed in the ongoing first-in-human dose-escalation Phase I study, the full adverse effect profile of TGR-1202 is not known. Limited data is available on the drug’s adverse event profile at lower doses, and as the dose escalation continues with higher doses of TGR-1202, greater frequency and/or severity of adverse events are likely to occur as a maximum tolerated dose is reached. If any of our product candidates cause unacceptable adverse events in clinical trials, we may not be able to obtain marketing approval and generate revenues from its sale, which could have a material adverse impact on our business and operations.
If any of our product candidates receives marketing approval and we, or others, later identify unacceptable adverse events caused by the product, a number of significant negative consequences could result, including:
| · | regulatory authorities may withdraw their approval of the affected product; |
| · | regulatory authorities may require a more significant clinical benefit for approval to offset the risk; |
| · | regulatory authorities may require the addition of labeling statements that could diminish the usage of the product or otherwise limit the commercial success of the affected product; |
| · | we may be required to change the way the product is administered, conduct additional clinical trials or change the labeling of the product; |
| · | we may choose to discontinue sale of the product; |
| · | we could be sued and held liable for harm caused to patients; |
| 19 | ||
|
|
| · | we may not be able to enter into collaboration agreements on acceptable terms and execute on our business model; and |
| · | our reputation may suffer. |
Any one or a combination of these events could prevent us from obtaining or maintaining regulatory approval and achieving or maintaining market acceptance of the affected product or could substantially increase the costs and expenses of commercializing the affected product, which in turn could delay or prevent us from generating any revenues from the sale of the affected product.
We may experience delays in the commencement of our clinical trials or in the receipt of data from preclinical and clinical trials conducted by third parties, which could result in increased costs and delay its ability to pursue regulatory approval.
Delays in the commencement of clinical trials and delays in the receipt of data from preclinical or clinical trials conducted by third parties could significantly impact our product development costs.
Before we can initiate clinical trials in the United States for our product candidates, we need to submit the results of preclinical testing, usually in animals, to the FDA as part of an IND, along with other information including information about product chemistry, manufacturing and controls and its proposed clinical trial protocol for its product candidates.
We plan to rely on preclinical and clinical trial data from third parties, if any, for the IND submissions for our product candidates.
If receipt of that data is delayed for any reason, including reasons outside of our control, it will delay our plans for IND filings, and clinical trial plans.
This, in turn, will delay our ability to make subsequent regulatory filings and ultimately, to commercialize our products if regulatory approval is obtained.
If those third parties do not make this data available to us, we will likely, on our own, have to develop all the necessary preclinical and clinical data which will lead to additional delays and increase the costs of our development of our product candidates.
Before we can test any product candidate in human clinical trials the product candidate enters the preclinical testing stage.
Preclinical tests include laboratory evaluations of product chemistry, toxicity and formulation, as well as in-vitro and animal studies to assess the potential safety and activity of the pharmaceutical product candidate.
The conduct of the preclinical tests must comply with federal regulations and requirements including good laboratory practices (GLP).
We must submit the results of the preclinical tests, together with manufacturing information, analytical data, any available clinical data or literature and a proposed clinical protocol, to the FDA as part of the IND.
The IND automatically becomes effective 30 days after receipt by the FDA, unless the FDA places the IND on a clinical hold within that 30-day time period.
In such a case, we must work with the FDA to resolve any outstanding concerns before the clinical trials can begin.
The FDA may also impose clinical holds on a product candidate at any time before or during clinical trials due to safety concerns or non-compliance.
Accordingly, we cannot be sure that submission of an IND will result in the FDA allowing clinical trials to begin, or that, once begun, issues will not arise that suspend or terminate such clinical trial.
The FDA may require that we conduct additional preclinical testing for any product candidate before it allows us to initiate the clinical testing under any IND, which may lead to additional delays and increase the costs of our preclinical development.
Even assuming an active IND for a product candidate, we do not know whether our planned clinical trials for any such product candidate will begin on time, or at all.
The commencement of clinical trials can be delayed for a variety of reasons, including delays in:
| · | obtaining regulatory clearance to commence a clinical trial; |
| · | identifying, recruiting and training suitable clinical investigators; |
| · | reaching agreement on acceptable terms with prospective contract research organizations (“CROs”) and trial sites, the terms of which can be subject to extensive negotiation, may be subject to modification from time to time and may vary significantly among different CROs and trial sites; |
| · | obtaining sufficient quantities of a product candidate for use in clinical trials; |
| · | obtaining institutional review board (“IRB”) or ethics committee approval to conduct a clinical trial at a prospective site; |
| · | identifying, recruiting and enrolling patients to participate in a clinical trial; |
| · | retaining patients who have initiated a clinical trial but may withdraw due to adverse events from the therapy, insufficient efficacy, fatigue with the clinical trial process or personal issues; and |
| · | unexpected safety findings. |
| 20 | ||
|
|
Any delays in the commencement of our clinical trials will delay our ability to pursue regulatory approval for our product candidates.
In addition, many of the factors that cause, or lead to, a delay in the commencement of clinical trials may also ultimately lead to the denial of regulatory approval of a product candidate.
Delays in the completion of clinical testing could result in increased costs and delay our ability to generate product revenues.
Once a clinical trial has begun, patient recruitment and enrollment may be slower than we anticipate.
Clinical trials may also be delayed as a result of ambiguous or negative interim results.
Further, a clinical trial may be suspended or terminated by us, an IRB, an ethics committee or a Data Safety and Monitoring Committee overseeing the clinical trial, any of our clinical trial sites with respect to that site or the FDA or other regulatory authorities due to a number of factors, including:
| · | failure to conduct the clinical trial in accordance with regulatory requirements or our clinical protocols; |
| · | inspection of the clinical trial operations or clinical trial site by the FDA or other regulatory authorities resulting in the imposition of a clinical hold; |
| · | unforeseen safety issues or any determination that the clinical trial presents unacceptable health risks; and |
| · | lack of adequate funding to continue the clinical trial. |
Changes in regulatory requirements and guidance also may occur and we may need to amend clinical trial protocols to reflect these changes.
Amendments may require us to resubmit our clinical trial protocols to IRBs for re-examination, which may impact the costs, timing and successful completion of a clinical trial.
If we experience delays in the completion of, or if we must terminate, any clinical trial of any product candidate that we advance into clinical trials, our ability to obtain regulatory approval for that product candidate will be delayed and the commercial prospects, if any, for the product candidate may be harmed.
In addition, many of these factors may also ultimately lead to the denial of regulatory approval of a product candidate.
Even if we ultimately commercialize any of our product candidates, other therapies for the same indications may have been introduced to the market during the period we have been delayed and such therapies may have established a competitive advantage over our product candidates.
We intend to rely on third parties to help conduct our planned clinical trials.
If these third parties do not meet their deadlines or otherwise conduct the trials as required, we may not be able to obtain regulatory approval for or commercialize our product candidates when expected or at all.
We intend to use CROs to assist in the conduct of our planned clinical trials and will rely upon medical institutions, clinical investigators and contract laboratories to conduct our trials in accordance with our clinical protocols.
Our future CROs, investigators and other third parties may play a significant role in the conduct of these trials and the subsequent collection and analysis of data from the clinical trials.
There is no guarantee that any CROs, investigators and other third parties will devote adequate time and resources to our clinical trials or perform as contractually required.
If any third parties upon whom we rely for administration and conduct of our clinical trials fail to meet expected deadlines, fail to adhere to its clinical protocols or otherwise perform in a substandard manner, our clinical trials may be extended, delayed or terminated, and we may not be able to commercialize our product candidates.
If any of our clinical trial sites terminate for any reason, we may experience the loss of follow-up information on patients enrolled in our ongoing clinical trials unless we are able to transfer the care of those patients to another qualified clinical trial site.
In addition, principal investigators for our clinical trials may serve as scientific advisors or consultants to us from time to time and receive cash or equity compensation in connection with such services.
If these relationships and any related compensation result in perceived or actual conflicts of interest, the integrity of the data generated at the applicable clinical trial site may be jeopardized.
As all of our product candidates are still under development; manufacturing and process improvements implemented in the production of those product candidates, may affect their ultimate activity or function.
Our product candidates are in the initial stages of development and are currently manufactured in small batches for use in pre-clinical and clinical studies.
Process improvements implemented to date have, and process improvements in the future may change the activity profile of the product candidates, which may affect the safety and efficacy of the products.
No assurance can be given that the material manufactured from any of the optimized processes will perform comparably to the product candidates as manufactured to date and used in currently available pre-clinical data and or in early clinical trials reported in this or any previous filing.
Additionally, future clinical trial results will be subject to the same level of uncertainty if, following such trials, additional process improvements are made.
| 21 | ||
|
|
If we fail to adequately understand and comply with the local laws and customs as we expand into new international markets, these operations may incur losses or otherwise adversely affect our business and results of operations.
We expect to operate a portion of our business in certain countries through subsidiaries or through supply and marketing arrangements.
In those countries, where we have limited experience in operating subsidiaries and in reviewing equity investees, we will be subject to additional risks related to complying with a wide variety of national and local laws, including restrictions on the import and export of certain intermediates, drugs, technologies and multiple and possibly overlapping tax structures.
In addition, we may face competition in certain countries from companies that may have more experience with operations in such countries or with international operations generally.
We may also face difficulties integrating new facilities in different countries into our existing operations, as well as integrating employees hired in different countries into our existing corporate culture.
If we do not effectively manage our operations in these subsidiaries and review equity investees effectively, or if we fail to manage our alliances, we may lose money in these countries and it may adversely affect our business and results of our operations.
If our competitors develop treatments for the target indications for which any of our product candidates may be approved, that are approved more quickly, marketed more effectively or demonstrated to be more effective than our product candidates, our commercial opportunity will be reduced or eliminated.
We operate in a highly competitive segment of the biotechnology and biopharmaceutical market.
We face competition from numerous sources, including commercial pharmaceutical and biotechnology enterprises, academic institutions, government agencies, and private and public research institutions.
Many of our competitors have significantly greater financial, product development, manufacturing and marketing resources.
Large pharmaceutical companies have extensive experience in clinical testing and obtaining regulatory approval for drugs.
Additionally, many universities and private and public research institutes are active in cancer research, some in direct competition with us.
We may also compete with these organizations to recruit scientists and clinical development personnel.
Smaller or early-stage companies may also prove to be significant competitors, particularly through collaborative arrangements with large and established companies.
The cancer indications for which we are developing our products have a number of established therapies with which we will compete.
Most major pharmaceutical companies and many biotechnology companies are aggressively pursuing new cancer development programs for the treatment of NHL, CLL, and other B-cell proliferative malignancies, including both therapies with traditional, as well as novel, mechanisms of action.
If approved, we expect TG-1101 to compete directly with Roche Group’s Rituxan
®
(Rituximab) and Gazyva (obinutuzumab or GA-101), Spectrum Pharmaceutical’s Zevalin
®
(Y
90
-Ibritumomab Tiuxetan), and Genmab and GlaxoSmithKline’s Arzerra
®
(Ofatumumab) among others, each of which is currently approved for the treatment of various diseases including NHL and CLL.
In addition, a number of pharmaceutical companies are developing anti-CD20 antibodies which, if approved, would potentially compete with TG-1101.
New developments, including the development of other pharmaceutical technologies and methods of treating disease, occur in the pharmaceutical and life sciences industries at a rapid pace.
With respect to TGR-1202, although no PI3K delta inhibitors have been approved by the FDA, there are several PI3K delta targeted compounds in development, including, but not limited to, Gilead’s idelalisib (formerly known as GS-1101 or CAL-101), Infinity Pharmaceuticals IPI-145 and Amgen’s AMG-319, which if approved we would expect to compete directly with TGR-1202.
In addition, there are numerous other novel therapies targeting similar pathways to TGR-1202 in development, which if approved would also compete with TGR-1202 in similar indications, such as the BTK inhibitor, ibrutinib (FDA approved for MCL and CLL and marketed by Pharmacyclics and Janssen), or the blc-2 inhibitor ABT-199 (under clinical development by AbbVie and Roche).
These developments may render our product candidates obsolete or noncompetitive.
Compared to us, many of our potential competitors have substantially greater:
| · | research and development resources, including personnel and technology; |
| · | regulatory experience; |
| · | pharmaceutical development, clinical trial and pharmaceutical commercialization experience; |
| · | experience and expertise in exploitation of intellectual property rights; and |
| · | capital resources. |
| 22 | ||
|
|
As a result of these factors, our competitors may obtain regulatory approval of their products more rapidly than us or may obtain patent protection or other intellectual property rights that limit our ability to develop or commercialize our product candidates.
Our competitors may also develop products for the treatment of
lymphoma or CLL that are more effective, better tolerated, more useful and less costly than ours and may also be more successful in manufacturing and marketing their products.
Our competitors may succeed in obtaining approvals from the FDA and foreign regulatory authorities for their product candidates sooner than we do for our products.
We will also face competition from these third parties in recruiting and retaining qualified personnel, establishing clinical trial sites and enrolling patients for clinical trials and in identifying and in-licensing new product candidates.
We rely completely on third parties to manufacture our preclinical and clinical pharmaceutical supplies and we intend to rely on third parties to produce commercial supplies of any approved product candidate, and our commercialization of any of our product candidates could be stopped, delayed or made less profitable if those third parties fail to obtain approval of the FDA, fail to provide us with sufficient quantities of pharmaceutical product or fail to do so at acceptable quality levels or prices.
The facilities used by our contract manufacturers to manufacture our product candidates must be approved by the FDA pursuant to inspections that will be conducted only after we submit a BLA or NDA to the FDA, if at all.
We do not control the manufacturing process of our product candidates and are completely dependent on our contract manufacturing partners for compliance with the FDA’s requirements for manufacture of finished pharmaceutical products (good manufacturing practices, GMP).
If our contract manufacturers cannot successfully manufacture material that conforms to our target product specifications, patent specifications, and/or the FDA’s strict regulatory requirements of safety, purity and potency, we will not be able to secure and/or maintain FDA approval for our product candidates.
In addition, we have no control over the ability of our contract manufacturers to maintain adequate quality control, quality assurance and qualified personnel.
If our contract manufacturers cannot meet FDA standards, we may need to find alternative manufacturing facilities, which would significantly impact our ability to develop, obtain regulatory approval for or market our product candidates. No assurance can be given that a long-term, scalable manufacturer can be identified or that they can make clinical and commercial supplies of our product candidates at an appropriate scale and cost to make it commercially feasible.
If they are unable to do so, it could have a material adverse impact on our business.
In addition, we do not have the capability to package finished products for distribution to hospitals and other customers.
Prior to commercial launch, we intend to enter into agreements with one or more alternate fill/finish pharmaceutical product suppliers so that we can ensure proper supply chain management once we are authorized to make commercial sales of our product candidates.
If we receive marketing approval from the FDA, we intend to sell pharmaceutical product finished and packaged by such suppliers. We have not entered into long-term agreements with our current contract manufacturers or with any fill/finish suppliers, and though we intend to do so prior to commercial launch of our product candidates in order to ensure that we maintain adequate supplies of finished product, we may be unable to enter into such an agreement or do so on commercially reasonable terms, which could have a material adverse impact upon our business.
In most cases, our manufacturing partners are single source suppliers.
It is expected that our manufacturing partners will be sole source suppliers from single site locations for the foreseeable future.
Given this, any disruption of supply from these partners could have a material, long-term impact on our ability to supply products for clinical trials or commercial sale. If our suppliers do not deliver sufficient quantities of our product candidates on a timely basis, or at all, and in accordance with applicable specifications, there could be a significant interruption of our supply, which would adversely affect clinical development and commercialization of our products.
In addition, if our current or future supply of any or our product candidates should fail to meet specifications during its stability program there could be a significant interruption of our supply of drug, which would adversely affect the clinical development and commercialization of the product.
We currently have no marketing and sales organization and no experience in marketing pharmaceutical products.
If we are unable to establish sales and marketing capabilities or fail to enter into agreements with third parties to market and sell any products we may develop, we may not be able to effectively market and sell our products and generate product revenue.
We do not currently have the infrastructure for the sales, marketing and distribution of our biotechnology products, and we must build this infrastructure or make arrangements with third parties to perform these functions in order to commercialize our products.
We plan to either develop internally or enter into collaborations or other commercial arrangements to develop further, promote and sell all or a portion of our product candidates.
| 23 | ||
|
|
The establishment and development of a sales force, either by us or jointly with a development partner, or the establishment of a contract sales force to market any products we may develop will be expensive and time-consuming and could delay any product launch, and we cannot be certain that we or our development partners would be able to successfully develop this capability.
If we or our development partners are unable to establish sales and marketing capability or any other non-technical capabilities necessary to commercialize any products we may develop, we will need to contract with third parties to market and sell such products.
We currently possess limited resources and may not be successful in establishing our own internal sales force or in establishing arrangements with third parties on acceptable terms, if at all.
If any product candidate that we successfully develop does not achieve broad market acceptance among physicians, patients, healthcare payors, and the medical community, the revenues that we generate from its sales will be limited.
Even if our product candidates receive regulatory approval, they may not gain market acceptance among physicians, patients, healthcare payors, and the medical community.
Coverage and reimbursement of our product candidates by third-party payors, including government payors, generally is also necessary for commercial success.
The degree of market acceptance of any of our approved products will depend on a number of factors, including:
|
|
·
|
the efficacy and safety as demonstrated in clinical trials;
|
|
|
·
|
the clinical indications for which the product is approved;
|
|
|
·
|
acceptance by physicians, major operators of cancer clinics and patients of the product as a safe and effective treatment;
|
|
|
·
|
the potential and perceived advantages of product candidates over alternative treatments;
|
|
|
·
|
the safety of product candidates seen in a broader patient group, including its use outside the approved indications;
|
|
|
·
|
the cost of treatment in relation to alternative treatments;
|
|
|
·
|
the availability of adequate reimbursement and pricing by third parties and government authorities;
|
|
|
·
|
relative convenience and ease of administration;
|
|
|
·
|
the prevalence and severity of adverse events; and
|
|
|
·
|
the effectiveness of our sales and marketing efforts.
|
If any product candidate is approved but does not achieve an adequate level of acceptance by physicians, hospitals, healthcare payors and patients, we may not generate sufficient revenue from these products and we may not become or remain profitable.
If product liability lawsuits are brought against us, we may incur substantial liabilities and may be required to limit commercialization of our product candidates.
We face an inherent risk of product liability exposure related to the testing of our product candidates in human clinical trials, and will face an even greater risk if we sell our product candidates commercially.
Although we are not aware of any historical or anticipated product liability claims against us, if we cannot successfully defend ourselves against product liability claims, we may incur substantial liabilities or be required to cease clinical trials of our drug candidates or limit commercialization of any approved products. An individual may bring a liability claim against us if one of our product candidates causes, or merely appears to have caused, an injury.
If we cannot successfully defend our self against product liability claims, we will incur substantial liabilities.
Regardless of merit or eventual outcome, liability claims may result in:
| · | decreased demand for our product candidates; |
| · | impairment to our business reputation; |
| · | withdrawal of clinical trial participants; |
| · | costs of related litigation; |
| · | distraction of management’s attention from our primary business; |
| · | substantial monetary awards to patients or other claimants; |
| · | the inability to commercialize our product candidates; and |
| · | loss of revenues. |
We believe that we have obtained sufficient product liability insurance coverage for our clinical trials. We intend to expand our insurance coverage to include the sale of commercial products if marketing approval is obtained for any of our product candidates.
However, we may be unable to obtain this product liability insurance on commercially reasonable terms and with insurance coverage that will be adequate to satisfy any liability that may arise.
On occasion, large judgments have been awarded in class action or individual lawsuits relating to marketed pharmaceuticals.
A successful product liability claim or series of claims brought against us could cause our stock price to decline and, if judgments exceed our insurance coverage, could decrease our cash and adversely affect our business.
| 24 | ||
|
|
Reimbursement may be limited or unavailable in certain market segments for our product candidates, which could make it difficult for us to sell our products profitably.
We intend to seek approval to market our future products in both the United States and in countries and territories outside the United States.
If we obtain approval in one or more foreign countries, we will be subject to rules and regulations in those countries relating to our product.
In some foreign countries, particularly in the European Union, the pricing of prescription pharmaceuticals and biologics is subject to governmental control.
In these countries, pricing negotiations with governmental authorities can take considerable time after the receipt of marketing approval for a product candidate.
In addition, market acceptance and sales of our product candidates will depend significantly on the availability of adequate coverage and reimbursement from third-party payors for any of our product candidates and may be affected by existing and future healthcare reform measures.
Government authorities and third-party payors, such as private health insurers and health maintenance organizations, decide which pharmaceuticals they will pay for and establish reimbursement levels.
Reimbursement by a third-party payor may depend upon a number of factors, including the third-party payor’s determination that use of a product is:
| · | a covered benefit under its health plan; |
| · | safe, effective and medically necessary; |
| · | appropriate for the specific patient; |
| · | cost-effective; and |
| · | neither experimental nor investigational. |
Obtaining coverage and reimbursement approval for a product from a government or other third-party payor is a time consuming and costly process that could require that we provide supporting scientific, clinical and cost-effectiveness data for the use of our products to the payor.
We may not be able to provide data sufficient to gain acceptance with respect to coverage and reimbursement.
If reimbursement of our future products is unavailable or limited in scope or amount, or if pricing is set at unsatisfactory levels, we may be unable to achieve or sustain profitability.
In both the United States and certain foreign countries, there have been a number of legislative and regulatory changes to the healthcare system that could impact our ability to sell our products profitably. In particular, the Medicare Modernization Act of 2003 revised the payment methodology for many products reimbursed by Medicare, resulting in lower rates of reimbursement for many types of drugs, and added a prescription drug benefit to the Medicare program that involves commercial plans negotiating drug prices for their members.
Since 2003, there have been a number of other legislative and regulatory changes to the coverage and reimbursement landscape for pharmaceuticals.
Most recently, the Patient Protection and Affordable Care Act, as amended by the Health Care and Education Reconciliation Act of 2010, collectively, the “Affordable Care Act,” was enacted.
The Affordable Care Act contains a number of provisions, including those governing enrollment in federal healthcare programs, the increased use of comparative effectiveness research on healthcare products, reimbursement and fraud and abuse changes, and a new regulatory pathway for the approval of biosimilar biological products, all of which will impact existing government healthcare programs and will result in the development of new programs.
An expansion in the government’s role in the U.S. healthcare industry may further lower rates of reimbursement for pharmaceutical and biotechnology products.
There have been, and likely will continue to be, legislative and regulatory proposals at the federal and state levels directed at broadening the availability of healthcare and containing or lowering the cost of healthcare products and services.
We cannot predict the initiatives that may be adopted in the future.
The continuing efforts of the government, insurance companies, managed care organizations and other payors of healthcare services to contain or reduce costs of healthcare may adversely affect:
| · | the demand for any products for which we may obtain regulatory approval; |
| · | our ability to set a price that we believe is fair for our products; |
| · | our ability to generate revenues and achieve or maintain profitability; |
| · | the level of taxes that we are required to pay; and |
| · | the availability of capital. |
In addition, governments may impose price controls, which may adversely affect our future profitability.
| 25 | ||
|
|
The Company will need to increase the size of its organization and the scope of our outside vendor relationships, and we may experience difficulties in managing this growth.
As of March 1, 2014, we had thirteen full and part time employees.
Over time, we will need to expand our managerial, operational, financial and other resources in order to manage and fund our operations and clinical trials, continue research and development activities, and commercialize our product candidates.
Our management and scientific personnel, systems and facilities currently in place may not be adequate to support our future growth.
Our need to effectively manage our operations, growth, and various projects requires that we:
| · | manage our clinical trials effectively; |
| · | manage our internal development efforts effectively while carrying out our contractual obligations to licensors, contractors and other third parties; |
| · | continue to improve our operational, financial and management controls and reporting systems and procedures; and |
| · | attract and retain sufficient numbers of talented employees. |
We may utilize the services of outside vendors or consultants to perform tasks including clinical trial management, statistics and analysis, regulatory affairs, formulation development and other pharmaceutical development functions.
Our growth strategy may also entail expanding our group of contractors or consultants to implement these tasks going forward.
Because we rely on a substantial number of consultants, effectively outsourcing many key functions of our business, we will need to be able to effectively manage these consultants to ensure that they successfully carry out their contractual obligations and meet expected deadlines.
However, if we are unable to effectively manage our outsourced activities or if the quality or accuracy of the services provided by consultants is compromised for any reason, our clinical trials may be extended, delayed or terminated, and we may not be able to obtain regulatory approval for our product candidates or otherwise advance its business.
There can be no assurance that we will be able to manage our existing consultants or find other competent outside contractors and consultants on economically reasonable terms, or at all.
If we are not able to effectively expand our organization by hiring new employees and expanding our groups of consultants and contractors, we may be unable to successfully implement the tasks necessary to further develop and commercialize our product candidates and, accordingly, may not achieve our research, development and commercialization goals.
If we fail to attract and keep key management and clinical development personnel, we may be unable to successfully develop or commercialize our product candidates.
We will need to expand and effectively manage our managerial, operational, financial and other resources in order to successfully pursue our clinical development and commercialization efforts for our product candidates and future product candidates.
We are highly dependent on the development, regulatory, commercial and financial expertise of the members of our senior management.
The loss of the services of any of our senior management could delay or prevent the further development and potential commercialization of our product candidates and, if we are not successful in finding suitable replacements, could harm our business.
We do not maintain “key man” insurance policies on the lives of these individuals.
We will need to hire additional personnel as we continue to expand our manufacturing, research and development activities.
Our success depends on our continued ability to attract, retain and motivate highly qualified management and scientific personnel and we may not be able to do so in the future due to the intense competition for qualified personnel among biotechnology, pharmaceutical and other businesses.
Our industry has experienced a high rate of turnover of management personnel in recent years.
If the Company is not able to attract and retain the necessary personnel to accomplish its business objectives, we may experience constraints that will impede significantly the achievement of our development objectives, our ability to raise additional capital, and our ability to implement our business strategy.
If we fail to comply with healthcare regulations, we could face substantial penalties and our business, operations and financial condition could be adversely affected.
In addition to FDA restrictions on the marketing of pharmaceutical and biotechnology products, several other types of state and federal laws have been applied to restrict certain marketing practices in the pharmaceutical and medical device industries in recent years, as well as consulting or other service agreements with physicians or other potential referral sources.
These laws include anti-kickback statutes and false claims statutes that prohibit, among other things, knowingly and willfully offering, paying, soliciting or receiving remuneration to induce, or, in return for, purchasing, leasing, ordering or arranging for the purchase, lease or order of any healthcare item or service reimbursable under Medicare, Medicaid or other federally-financed healthcare programs, and knowingly presenting, or causing to be presented, a false claim for payment to the federal government, or knowingly making, or causing to be made, a false statement to get a false claim paid.
The majority of states also have statutes or regulations similar to the federal anti-kickback law and false claims laws, which apply to items and services reimbursed under Medicaid and other state programs, or, in several states, apply regardless of the payor.
Although there are a number of statutory exemptions and regulatory safe harbors protecting certain common activities from prosecution, the exemptions and safe harbors are drawn narrowly, and any practices we adopt may not, in all cases, meet all of the criteria for safe harbor protection from anti-kickback liability.
Sanctions under these federal and state laws may include civil monetary penalties, exclusion of a manufacturer’s products from reimbursement under government programs, criminal fines and imprisonment.
Any challenge to its business practices under these laws could have a material adverse effect on our business, financial condition, and results of operations.
| 26 | ||
|
|
We use biological and hazardous materials, and any claims relating to improper handling, storage or disposal of these materials could be time consuming or costly.
We use hazardous materials, including chemicals and biological agents and compounds, which could be dangerous to human health and safety or the environment.
Our operations also produce hazardous waste products.
Federal, state and local laws and regulations govern the use, generation, manufacture, storage, handling and disposal of these materials and wastes.
Compliance with applicable environmental laws and regulations may be expensive, and current or future environmental laws and regulations may impair our pharmaceutical development efforts.
In addition, we cannot entirely eliminate the risk of accidental injury or contamination from these materials or wastes.
If one of our employees was accidentally injured from the use, storage, handling or disposal of these materials or wastes, the medical costs related to his or her treatment would be covered by our workers’ compensation insurance policy.
However, we do not carry specific biological or hazardous waste insurance coverage and our property and casualty and general liability insurance policies specifically exclude coverage for damages and fines arising from biological or hazardous waste exposure or contamination.
Accordingly, in the event of contamination or injury, we could be held liable for damages or penalized with fines in an amount exceeding our resources, and our clinical trials or regulatory approvals could be suspended, or operations otherwise affected.
All product candidate development timelines and projections in this report are based on the assumption of further financing.
The timelines and projections in this report are predicated upon the assumption that we will raise additional financing in the future to continue the development of our product candidates.
In the event we do not successfully raise subsequent financing, our product development activities will necessarily be curtailed commensurate with the magnitude of the shortfall.
If our product development activities are slowed or stopped, we would be unable to meet the timelines and projections outlined in this filing.
Failure to progress our product candidates as anticipated will have a negative effect on our business, future prospects, and ability to obtain further financing on acceptable terms (if at all), and the value of the enterprise.
Risks Relating to Acquisitions
Acquisitions, investments and strategic alliances that we may make in the future may use significant resources, result in disruptions to our business or distractions of our management, may not proceed as planned, and could expose us to unforeseen liabilities.
We may seek to expand our business through the acquisition of, investments in and strategic alliances with companies, technologies, products, and services.
Acquisitions, investments and strategic alliances involve a number of special problems and risks, including, but not limited to:
| · | difficulty integrating acquired technologies, products, services, operations and personnel with the existing businesses; |
| · | diversion of management’s attention in connection with both negotiating the acquisitions and integrating the businesses; |
| · | strain on managerial and operational resources as management tries to oversee larger operations; |
| · | difficulty implementing and maintaining effective internal control over financial reporting at businesses that we acquire, particularly if they are not located near our existing operations; |
| · | exposure to unforeseen liabilities of acquired companies; |
| · | potential costly and time-consuming litigation, including stockholder lawsuits; |
| · | potential issuance of securities to equity holders of the company being acquired with rights that are superior to the rights of holders of our common stock, par value $0.001 (“Common Stock”), or which may have a dilutive effect on our stockholders; |
| · | risk of loss of invested capital; |
| · | the need to incur additional debt or use cash; and |
| · | the requirement to record potentially significant additional future operating costs for the amortization of intangible assets. |
| 27 | ||
|
|
As a result of these or other problems and risks, businesses we acquire may not produce the revenues, earnings, or business synergies that we anticipated, and acquired products, services, or technologies might not perform as we expected.
As a result, we may incur higher costs and realize lower revenues than we had anticipated.
We may not be able to successfully address these problems and we cannot assure you that the acquisitions will be successfully identified and completed or that, if acquisitions are completed, the acquired businesses, products, services, or technologies will generate sufficient revenue to offset the associated costs or other negative effects on our business.
Any of these risks can be greater if an acquisition is large relative to our size. Failure to effectively manage our growth through acquisitions could adversely affect our growth prospects, business, results of operations, financial condition and cash flows.
Risks Relating to the Company’s Intellectual Property
Our success depends upon our ability to protect our intellectual property and proprietary technologies, and the intellectual property protection for our product candidates depends significantly on third parties.
Our commercial success depends on obtaining and maintaining patent protection and trade secret protection for our product candidates and their formulations and uses, as well as successfully defending these patents against third-party challenges. If any of our licensors or partners fails to appropriately prosecute and maintain patent protection for these product candidates, our ability to develop and commercialize these product candidates may be adversely affected and we may not be able to prevent competitors from making, using and selling competing products.
This failure to properly protect the intellectual property rights relating to these product candidates could have a material adverse effect on our financial condition and results of operations.
Currently, the composition of matter patent and several method of use patents for
TG-1101
and TGR-1202 in various indications and settings have been applied for but have not yet been issued. The patent application process is subject to numerous risks and uncertainties, and there can be no assurance that we or our partners will be successful in protecting our product candidates by obtaining and defending patents.
These risks and uncertainties include the following:
| · | the patent applications that we or our partners file may not result in any patents being issued; |
| · | patents that may be issued or in-licensed may be challenged, invalidated, modified, revoked or circumvented, or otherwise may not provide any competitive advantage; |
| · | as of March 16, 2013, the U.S. converted from a “first to invent” to a “first to file” system. If we do not win the filing race, we will not be entitled to inventive priority; |
| · | our competitors, many of which have substantially greater resources than we do, and many of which have made significant investments in competing technologies, may seek, or may already have obtained, patents that will limit, interfere with, or eliminate its ability to make, use, and sell our potential products either in the United States or in international markets; |
| · | there may be significant pressure on the U.S. government and other international governmental bodies to limit the scope of patent protection both inside and outside the United States for disease treatments that prove successful as a matter of public policy regarding worldwide health concerns; and |
| · | countries other than the United States may have less restrictive patent laws than those upheld by United States courts, allowing foreign competitors the ability to exploit these laws to create, develop, and market competing products. |
If patents are not issued that protect our product candidates, it could have a material adverse effect on our financial condition and results of operations.
In addition to patents, we and our partners also rely on trade secrets and proprietary know-how.
Although we have taken steps to protect our trade secrets and unpatented know-how, including entering into confidentiality agreements with third parties, and confidential information and inventions agreements with employees, consultants and advisors, third parties may still obtain this information or we may be unable to protect its rights.
If any of these events occurs, or we otherwise lose protection for our trade secrets or proprietary know-how, the value of this information may be greatly reduced.
Patent protection and other intellectual property protection are crucial to the success of our business and prospects, and there is a substantial risk that such protections will prove inadequate.
| 28 | ||
|
|
If we or our partners are sued for infringing intellectual property rights of third parties, it will be costly and time consuming, and an unfavorable outcome in that litigation would have a material adverse effect on our business.
Our commercial success also depends upon our ability and the ability of any of our future collaborators to develop, manufacture, market and sell our product candidates without infringing the proprietary rights of third parties.
Numerous United States and foreign issued patents and pending patent applications, which are owned by third parties, exist in the fields in which we are developing products, some of which may be directed at claims that overlap with the subject matter of our intellectual property.
For example, Roche has the Cabilly patents in the U.S. that block the commercialization of antibody products derived from a single cell line, like
TG-1101
.
Also, Roche, Biogen Idec, and Genentech hold patents for the use of anti-CD20 antibodies utilized in the treatment of CLL in the U.S.
While these patents have been challenged, to the best of our knowledge, those matters were settled in a way that permitted additional anti-CD20 antibodies to be marketed for CLL.
If those patents are still enforced at the time we are intending to launch
TG-1101
, then we will need to either prevail in a litigation to challenge those patents or negotiate a settlement agreement with the patent holders.
If we are unable to do so we may be forced to delay the launch of
TG-1101
or launch at the risk of litigation for patent infringement, which may have a material adverse effect on our business and results of operations.
In addition, because patent applications can take many years to issue, there may be currently pending applications, unknown to us, which may later result in issued patents that our product candidates or proprietary technologies may infringe.
Similarly, there may be issued patents relevant to our product candidates of which we are not aware.
There is a substantial amount of litigation involving patent and other intellectual property rights in the biotechnology and biopharmaceutical industries generally.
If a third party claims that we or any collaborators of ours infringe their intellectual property rights, we may have to:
| · | obtain licenses, which may not be available on commercially reasonable terms, if at all; |
| · | abandon an infringing product candidate or redesign its products or processes to avoid infringement; |
| · | pay substantial damages, including treble damages and attorneys’ fees, which we may have to pay if a court decides that the product or proprietary technology at issue infringes on or violates the third party’s rights; |
| · | pay substantial royalties, fees and/or grant cross licenses to our technology; and/or |
| · | defend litigation or administrative proceedings which may be costly whether we win or lose, and which could result in a substantial diversion of our financial and management resources. |
No assurance can be given that patents issued to third parties do not exist, have not been filed, or could not be filed or issued, which contain claims covering its products, technology or methods that may encompass all or a portion of our products and methods. Given the number of patents issued and patent applications filed in our technical areas or fields, we believe there is a risk that third parties may allege they have patent rights encompassing our products or methods.
Other product candidates that we may in-license or acquire could be subject to similar risks and uncertainties.
We may be involved in lawsuits to protect or enforce our patents or the patents of our licensors, which could be expensive, time consuming and unsuccessful.
Competitors may infringe our patents or the patents of our licensors.
To counter infringement or unauthorized use, we may be required to file infringement claims, which typically are very expensive, time-consuming and disruptive of day-to-day business operations.
In addition, in an infringement proceeding, a court may decide that a patent of ours or our licensors is not valid or is unenforceable, or may refuse to stop the other party from using the technology at issue on the grounds that our patents do not cover the technology in question.
An adverse result in any litigation or defense proceedings could put one or more of our patents at risk of being invalidated, held unenforceable, or interpreted narrowly.
The adverse result could also put related patent applications at risk of not issuing.
Interference proceedings provoked by third parties or brought by the U.S. Patent and Trademark Office
may be necessary to determine the priority of inventions with respect to our patents or patent applications or those of our collaborators or licensors.
An unfavorable outcome could require us to cease using the related technology or to attempt to license rights to it from the prevailing party.
Our business could be harmed if the prevailing party does not offer us a license on commercially reasonable terms.
Litigation or interference proceedings may fail and, even if successful, may result in substantial costs and distract its management and other employees.
We may not be able to prevent, alone or with our licensors, misappropriation of our trade secrets or confidential information, particularly in countries where the laws may not protect those rights as fully as in the United States.
Moreover, as of March 16, 2013, the U.S. will convert from a “first to invent” to a “first to file” system.
After that time, should there be any innovations that we invented first, but on which we filed the patent application second, we will have limited options available to reclaim invention priority.
| 29 | ||
|
|
Furthermore, because of the substantial amount of discovery required in connection with intellectual property litigation, there is a risk that some of our confidential information could be compromised by disclosure during this type of litigation.
In addition, there could be public announcements of the results of hearings, motions or other interim proceedings or developments.
If securities analysts or investors perceive these results to be negative, it could have a substantial adverse effect on the price of our common stock.
We may be subject to claims that our consultants or independent contractors have wrongfully used or disclosed alleged trade secrets of their other clients or former employers to it.
As is common in the biotechnology and pharmaceutical industry, we engage the services of consultants to assist us in the development of our product candidates.
Many of these consultants were previously employed at, may have previously been, or are currently providing consulting services to, other biotechnology or pharmaceutical companies, including our competitors or potential competitors.
Although no claims against us are currently pending, we may be subject to claims that these consultants or we have inadvertently or otherwise used or disclosed trade secrets or other proprietary information of their former employers or their former or current customers.
Litigation may be necessary to defend against these claims.
Even if we are successful in defending against these claims, litigation could result in substantial costs and be a distraction to management and day-to-day business operations.
Risks Relating to the Company’s Finances and Capital Requirements
We will need to raise additional capital to continue to operate our business.
As of December 31, 2013, we had net cash, cash equivalents, investment securities and interest receivable of approximately $45,432,000.
We believe that our cash on hand will sustain our operations for approximately 24 months.
As a result, we will need additional capital to continue our operations beyond that time.
We will need to seek additional sources of financing in the future, which might not be available on favorable terms, if at all, to continue our operations.
If we do not succeed in raising additional funds on acceptable terms, we might be unable to complete planned preclinical and clinical trials or obtain approval of any of our product candidates from the FDA or any foreign regulatory authorities.
In addition, we could be forced to discontinue product development, reduce or forego sales and marketing efforts and forego attractive business opportunities.
Any additional sources of financing will likely involve the issuance of our equity securities, which would have a dilutive effect on your holdings of our capital stock.
Currently, none of our product candidates have been approved by the FDA or any foreign regulatory authority for sale.
Therefore, for the foreseeable future, we will have to fund all of our operations and capital expenditures from cash on hand and amounts raised in future offerings.
We have a history of operating losses, expect to continue to incur losses, and are unable to predict the extent of future losses or when we will become profitable, if ever.
We have not yet demonstrated an ability to obtain regulatory approval for or commercialize a product candidate.
Our short operating history makes it difficult to evaluate our business prospects and consequently, any predictions about our future performance may not be as accurate as they could be if we had a history of successfully developing and commercializing pharmaceutical or biotechnology products.
Our prospect must be considered in light of the uncertainties, risks, expenses and difficulties frequently encountered by companies in the early stages of operations and the competitive environment in which we operate.
We have never been profitable, and, as of December 31, 2013, we had an accumulated deficit of $39,404,003.
We have generated operating losses in all periods since we were incorporated.
We expect to make substantial expenditures resulting in increasing operating costs in the future and our accumulated deficit will increase significantly as we expand development and clinical trial efforts for our product candidates.
Our losses have had, and are expected to continue to have, an adverse impact on our working capital, total assets and stockholders’ equity.
Because of the risks and uncertainties associated with product development, we are unable to predict the extent of any future losses or when we will become profitable, if ever.
Even if we achieve profitability, we may not be able to sustain or increase profitability on an ongoing basis.
| 30 | ||
|
|
We have not generated any revenue from our product candidates and may never become profitable.
Our ability to become profitable depends upon our ability to generate significant continuing revenues.
To obtain significant continuing revenues, we must succeed, either alone or with others, in developing, obtaining regulatory approval for and manufacturing and marketing our product candidates (or utilize early access programs to generate such revenue).
To date, our product candidates have not generated any revenues, and we do not know when, or if, we will generate any revenue.
Our ability to generate revenue depends on a number of factors, including, but not limited to:
| · | successful completion of preclinical studies of its product candidates; |
| · | successful commencement and completion of clinical trials of its product candidates and any future product candidates we advance into clinical trials; |
| · | achievement of regulatory approval for our product candidates and any future product candidates we advance into clinical trials (unless we successfully utilize early access programs which allow for revenue generation prior to approval); |
| · | manufacturing commercial quantities of our products at acceptable cost levels if regulatory approvals are obtained; |
| · | successful sales, distribution and marketing of our future products, if any; and |
| · | our entry into collaborative arrangements or co-promotion agreements to market and sell our products. |
If we are unable to generate significant continuing revenues, we will not become profitable and we may be unable to continue our operations without continued funding.
We will need substantial additional funding and may be unable to raise capital when needed, which would force us to delay, reduce or eliminate our development programs or commercialization efforts.
We expect to spend substantial amounts on development, including significant amounts on conducting clinical trials for our product candidates, manufacturing clinical supplies and expanding our pharmaceutical development programs.
We expect that our monthly cash used by operations will continue to increase for the next several years.
We anticipate that we will continue to incur operating losses for the foreseeable future.
We will require substantial additional funds to support our continued research and development activities, as well as the anticipated costs of preclinical studies and clinical trials, regulatory approvals, and eventual commercialization.
We anticipate that we will incur operating losses for the foreseeable future.
We have based these estimates, however, on assumptions that may prove to be wrong, and we could expend our available financial resources much faster than we currently expect.
Further, we will need to raise additional capital to fund our operations and continue to conduct clinical trials to support potential regulatory approval of marketing applications.
Future capital requirements will also depend on the extent to which we acquire or in-license additional product candidates. We currently have no commitments or agreements relating to any of these types of transactions.
The amount and timing of our future funding requirements will depend on many factors, including, but not limited to, the following:
| · | the progress of our clinical trials, including expenses to support the trials and milestone payments that may become payable under our license agreements; |
| · | the costs and timing of regulatory approvals; |
| · | the costs and timing of clinical and commercial manufacturing supply arrangements for each product candidate; |
| · | the costs of establishing sales or distribution capabilities; |
| · | the success of the commercialization of our products; |
| · | our ability to establish and maintain strategic collaborations, including licensing and other arrangements; |
| · | the costs involved in enforcing or defending patent claims or other intellectual property rights; and |
| · | the extent to which we in-license or invest in other indications or product candidates. |
Until we can generate a sufficient amount of product revenue and achieve profitability, we expect to finance future cash needs through public or private equity offerings, debt financings or corporate collaboration and licensing arrangements, as well as through interest income earned on cash balances.
If we were to be unable to raise additional capital, we would have to significantly delay, scale back or discontinue one or more of our pharmaceutical development programs.
We also may be required to relinquish, license or otherwise dispose of rights to product candidates or products that it would otherwise seek to develop or commercialize itself on terms that are less favorable than might otherwise be available.
Raising additional funds by issuing securities or through licensing or lending arrangements may cause dilution to our existing stockholders, restrict our operations or require us to relinquish proprietary rights.
We may raise additional funds through public or private equity offerings, debt financings or licensing arrangements.
To the extent that we raise additional capital by issuing equity securities, the share ownership of existing stockholders will be diluted.
Any future debt financing we enter into may involve covenants that restrict our operations, including limitations on our ability to incur liens or additional debt, pay dividends, redeem our stock, make certain investments and engage in certain merger, consolidation or asset sale transactions, among other restrictions.
| 31 | ||
|
|
In addition, if we raise additional funds through licensing arrangements, it may be necessary to relinquish potentially valuable rights to our product candidates, or grant licenses on terms that are not favorable to us.
If adequate funds are not available, our ability to achieve profitability or to respond to competitive pressures would be significantly limited and we may be required to delay, significantly curtail or eliminate the development of one or more of our product candidates.
We are controlled by current officers, directors and principal stockholders.
Our directors, executive officers, their affiliates, and our principal stockholders beneficially own approximately 58% percent of our outstanding voting stock, including shares underlying outstanding options and warrants.
Our directors, officers and principal stockholders, taken as a whole, have the ability to exert substantial influence over the election of our Board of Directors and the outcome of issues submitted to our stockholders.
Our stock price is, and we expect it to remain, volatile, which could limit investors’ ability to sell stock at a profit.
The trading price of our common stock is likely to be highly volatile and subject to wide fluctuations in price in response to various factors, many of which are beyond our control. These factors include:
| · | the global economic crisis, which affected stock prices of many companies, and particularly many small pharmaceutical companies like ours; |
| · | publicity regarding actual or potential clinical results relating to products under development by our competitors or us; |
| · | delay or failure in initiating, completing or analyzing nonclinical or clinical trials or the unsatisfactory design or results of these trials; |
| · | achievement or rejection of regulatory approvals by our competitors or us; |
| · | announcements of technological innovations or new commercial products by our competitors or us; |
| · | developments concerning proprietary rights, including patents; |
| · | developments concerning our collaborations; |
| · | regulatory developments in the United States and foreign countries; |
| · | economic or other crises and other external factors; |
| · | period-to-period fluctuations in our revenues and other results of operations; |
| · | changes in financial estimates by securities analysts; and |
| · | sales of our common stock. |
We will not be able to control many of these factors, and we believe that period-to-period comparisons of our financial results will not necessarily be indicative of our future performance.
In addition, the stock market in general, and the market for biotechnology companies in particular, has experienced extreme price and volume fluctuations that may have been unrelated or disproportionate to the operating performance of individual companies.
These broad market and industry factors may seriously harm the market price of our common stock, regardless of our operating performance.
We have not paid dividends in the past and do not expect to pay dividends in the future, and any return on investment may be limited to the value of your stock.
We have never paid dividends on our Common Stock and do not anticipate paying any dividends for the foreseeable future.
You should not rely on an investment in our stock if you require dividend income.
Further, you will only realize income on an investment in our stock in the event you sell or otherwise dispose of your shares at a price higher than the price you paid for your shares.
Such a gain would result only from an increase in the market price of our Common Stock, which is uncertain and unpredictable.
Our corporate and executive office is located in New York, New York. Our New York facility consists of office space at 3 Columbus Circle, 15
th
Floor, New York, New York 10019.
We are not currently under a lease agreement at 3 Columbus Circle.
We believe that our existing facilities are adequate to meet our current requirements.
We do not own any real property.
| 32 | ||
|
|
We, and our subsidiaries, are not a party to, and our property is not the subject of, any material pending legal proceedings.
This item is not applicable to the Company.
Market Information
Our common stock is listed on
the NASDAQ Capital Market and trades under the symbol “TGTX”.
Prior to May 30, 2013 our stock was listed on the Over the Counter Bulletin Board.
Prior to January 12, 2012 the Company was traded under the symbol “MHAN.”
The following table sets forth the high and low closing sale prices of our common stock for the periods indicated.
|
|
|
High
|
|
Low
|
|
||
|
Fiscal Year Ended December 31, 2013
|
|
|
|
|
|
|
|
|
Fourth Quarter
|
|
$
|
5.16
|
|
$
|
3.17
|
|
|
Third Quarter
|
|
$
|
6.87
|
|
$
|
5.04
|
|
|
Second Quarter
|
|
$
|
7.49
|
|
$
|
5.26
|
|
|
First Quarter
|
|
$
|
6.40
|
|
$
|
3.50
|
|
|
|
|
High
|
|
Low
|
|
||
|
Fiscal Year Ended December 31, 2012
|
|
|
|
|
|
|
|
|
Fourth Quarter
|
|
$
|
3.64
|
|
$
|
1.90
|
|
|
Third Quarter
|
|
$
|
6.25
|
|
$
|
2.24
|
|
|
Second Quarter
|
|
$
|
7.31
|
|
$
|
5.63
|
|
|
First Quarter
|
|
$
|
33.19
|
|
$
|
1.13
|
|
Holders
The number of record holders of our common stock as of March 1, 2014 was 407.
Dividends
We have never declared or paid any cash dividends on our common stock and do not anticipate paying any cash dividends in the foreseeable future. Any future determination to pay dividends will be at the discretion of our board of directors.
Securities Authorized for Issuance Under Equity Compensation Plans
The following table provides information as of December 31, 2013, regarding the securities authorized for issuance under our equity compensation plans, consisting of the 2003 Stock Option Plan, and the TG Therapeutics, Inc. Amended and Restated 2012 Incentive Plan.
| 33 | ||
|
|
|
Equity Compensation Plan Information
|
|
|||||||||
|
|
|
|
|
|
|
|
|
|
|
|
|
|
|
|
|
|
|
|
|
Number of
|
|
|
|
|
|
|
|
|
|
|
|
securities
|
|
|
|
|
|
|
|
|
|
|
|
remaining
|
|
|
|
|
|
|
|
|
|
|
|
available for
|
|
|
|
|
|
|
|
|
|
|
|
future issuance
|
|
|
|
|
|
Number of
|
|
|
|
|
under equity
|
|
||
|
|
|
securities to be
|
|
Weighted-average
|
|
compensation
|
|
|||
|
|
|
issued upon
|
|
exercise price of
|
|
plans (excluding
|
|
|||
|
|
|
exercise of
|
|
outstanding
|
|
securities reflected in
|
|
|||
|
Plan Category
|
|
outstanding options
|
|
options
|
|
column (a))
|
|
|||
|
|
|
(a)
|
|
(b)
|
|
(c)
|
|
|||
|
Equity compensation plans approved by
security holders |
|
|
46,591
|
|
$
|
46.37
|
|
|
1,107,793
|
|
|
Equity compensation plans not approved by
security holders |
|
|
—
|
|
|
—
|
|
|
—
|
|
|
Total
|
|
|
46,591
|
|
$
|
46.37
|
|
|
1,107,793
|
|
For information about all of our equity compensation plans, see Note 5 to our Consolidated Financial Statements included in this report.
Recent Sales of Unregistered Securities
On December 30, 2011, we
completed the first closing of the private placement of our securities, issuing 4,929,523 shares of Common Stock at a price per share of $2.25 for total gross proceeds, before placement commissions and expenses, of $11,091,425 (the “2011 Equity PIPE”). Investors also received warrants to purchase 1,232,381 shares of Common Stock. The warrants have an exercise price of $2.25 per share and are exercisable for five years. In 2012, we completed two additional closings of the 2011 Equity PIPE.
These closings were held on January 31, 2012, and February 24, 2012.
In these closings, we issued 695,428 shares of our Series A preferred stock (the “Company Preferred Stock”) at a price per share of $20.00 for total gross proceeds, before placement commissions and expenses, of $13,908,560. Each share of Company Preferred Stock was convertible into 8.89 shares of Common Stock; provided that such conversion rights were subject to sufficient available authorized shares of Common Stock. In connection with the reverse stock split effected by the Company on April 30, 2012, all shares of the Company’s preferred stock issued in the 2011 Equity PIPE were converted to Common Stock. Investors also received warrants to purchase 1,545,396 shares of Common Stock. The warrants have an exercise price of $2.25 per share and are exercisable for five years. The shares of Common Stock, Company Preferred Stock, and warrants sold in these closings were offered and sold to accredited investors, including members of management, without registration under the Securities Act, or state securities laws, in reliance on the exemptions provided by Section 4(2) of the Securities Act, and Regulation D promulgated thereunder and in reliance on similar exemptions under applicable state laws. Accordingly, the securities issued in the offering have not been registered under the Securities Act, and until so registered, these securities may not be offered or sold in the United States absent registration or availability of an applicable exemption from registration. The placement agent received cash commissions equal to 10% of the gross proceeds of the offering, five-year warrants to purchase shares of the Company’s stock equal to 10% of shares sold in the offering, and a non-accountable expense allowance equal to two percent of the gross proceeds of the offering for their expenses.
The following discussion and analysis contains forward-looking statements about our plans and expectations of what may happen in the future. Forward-looking statements are based on a number of assumptions and estimates that are inherently subject to significant risks and uncertainties, and our results could differ materially from the results anticipated by our forward-looking statements as a result of many known or unknown factors, including, but not limited to, those factors discussed in
“Item 1A. Risk Factors.” See also the “Special Cautionary Notice Regarding Forward-Looking Statements” set forth at the beginning of this report
.
You should read the following discussion and analysis in conjunction with “Item 8. Financial Statements and Supplementary Data,” and our consolidated financial statements beginning on page F-1 of this report.
Overview
We were incorporated in Delaware in 1993 under the name “Atlantic Pharmaceuticals, Inc.” and, in March 2000, we changed our name to “Atlantic Technology Ventures, Inc.”
In 2003, we completed a “reverse acquisition” of privately held “Manhattan Research Development, Inc”.
In connection with this transaction, we also changed our name to “Manhattan Pharmaceuticals, Inc.”
From an accounting perspective, the accounting acquirer is considered to be Manhattan Research Development, Inc. and accordingly, through December 29, 2011, the historical financial statements were those of Manhattan Research Development, Inc.
| 34 | ||
|
|
On March 8, 2010, we entered into an Agreement and Plan of Merger (the "Merger Agreement") by and among us, Ariston Pharmaceuticals, Inc., a Delaware corporation ("Ariston") and Ariston Merger Corp., a Delaware corporation and wholly-owned subsidiary of the Company (the "Merger Sub"). Pursuant to the terms and conditions set forth in the Merger Agreement, on March 8, 2010, the Merger Sub merged with and into Ariston (the "Merger"), with Ariston being the surviving corporation of the Merger. As a result of the Merger, Ariston became our wholly-owned subsidiary.
On December 29, 2011, we entered into and consummated an exchange transaction agreement (the “Exchange Transaction”) with Opus Point Partners, LLC (“Opus”) and TG Biologics, Inc. (formerly known as TG Therapeutics, Inc.) (“TG Bio”). The stockholders of TG Bio received the majority of our voting shares; therefore, the merger was accounted for as a reverse acquisition whereby TG Bio was the accounting acquirer (legal acquiree) and we were the accounting acquiree (legal acquirer) under the acquisition method of accounting.
TG Bio was incorporated in Delaware in November 2010, but did not commence operations until April 2011.
On April 30, 2012, we filed a Certificate of Amendment to our Certificate of Incorporation to change our name from Manhattan Pharmaceuticals, Inc. (“Manhattan”) to TG Therapeutics, Inc.
In conjunction with this change, the subsidiary formerly named TG Therapeutics, Inc. filed a Certificate of Amendment changing its name to TG Biologics, Inc.
We are a biopharmaceutical company focused on the acquisition, development and commercialization of innovative and medically important pharmaceutical products for the treatment of cancer and other underserved therapeutic needs.
We aim to acquire rights to these technologies by licensing or otherwise acquiring an ownership interest, funding their research and development and eventually either out-licensing or bringing the technologies to market.
Currently, we are developing therapies targeting hematological malignancies. TG-1101 (ublituximab), is a novel, third generation monoclonal antibody that targets a specific and unique epitope on the CD20 antigen found on mature B-lymphocytes. We are also developing TGR-1202, an orally available PI3K delta inhibitor.
Our license revenues currently consist of license fees arising from our agreement with Ildong. We recognize upfront license fee revenues ratably over the estimated period in which we will have certain significant ongoing responsibilities under the sublicense agreement, with unamortized amounts recorded as deferred revenue.
We have not earned any revenues from the commercial sale of any of our drug candidates.
Our research and development expenses (excluding non-cash compensation expense related to research and development) consist primarily of expenses related to in-licensing of new product candidates, fees paid to consultants and outside service providers for clinical and laboratory development, facilities-related and other expenses relating to the design, development, manufacture, testing, and enhancement of our drug candidates and technologies. We expense our research and development costs as they are incurred. Research and development expenses for the years ended December 31, 2013 and 2012 were $12,621,161, and $20,572,182, respectively, excluding non-cash compensation expenses related to research and development.
The following table sets forth the research and development expenses per project, exclusive of non-cash compensation expenses, for the periods presented.
|
|
|
2013
|
|
2012
|
|
||
|
TG-1101
|
|
$
|
8,281,028
|
|
$
|
19,140,621
|
|
|
TGR-1202
|
|
|
4,340,133
|
|
|
1,259,289
|
|
|
AST-726
|
|
|
—
|
|
|
72,272
|
|
|
Terminated programs
|
|
|
—
|
|
|
100,000
|
|
|
Total
|
|
$
|
12,621,161
|
|
$
|
20,572,182
|
|
Included in the above research and development expenses related to TG-1101 during the year ended December 31, 2012 are noncash expenses of $16,578,000 recorded in conjunction with stock issued to LFB Group for the license to TG-1101.
Our general and administrative expenses consist primarily of salaries and related expenses for executive, finance and other administrative personnel, recruitment expenses, professional fees and other corporate expenses, including investor relations, legal activities and facilities-related expenses.
| 35 | ||
|
|
Our results of operations include non-cash compensation expense as a result of the grants of stock options and restricted stock. Compensation expense for awards of options and restricted stock granted to employees and directors represents the fair value of the award recorded over the respective vesting periods of the individual awards. The expense is included in the respective categories of expense in the consolidated statements of operations. We expect to continue to incur significant non-cash compensation expenses.
For awards of options and restricted stock to consultants and other third-parties, compensation expense is determined at the “measurement date.” The expense is recognized over the vesting period of the award. Until the measurement date is reached, the total amount of compensation expense remains uncertain. We record compensation expense based on the fair value of the award at the reporting date. The awards to consultants and other third-parties are then revalued, or the total compensation is recalculated based on the then current fair value, at each subsequent reporting date. This results in a change to the amount previously recorded in respect of the equity award grant, and additional expense or a reversal of expense may be recorded in subsequent periods based on changes in the assumptions used to calculate fair value, such as changes in market price, until the measurement date is reached and the compensation expense is finalized. The Company did not grant any consultant options during the year ended December 31, 2013.
In addition, certain restricted stock issued to employees vest upon the achievement of certain milestones, therefore, the total expense is uncertain until the milestone is probable.
Our clinical trials will be lengthy and expensive. Even if these trials show that our drug candidates are effective in treating certain indications, there is no guarantee that we will be able to record commercial sales of any of our drug candidates in the near future. In addition, we expect losses to continue as we continue to fund in-licensing and development of new drug candidates. As we continue our development efforts, we may enter into additional third-party collaborative agreements and may incur additional expenses, such as licensing fees and milestone payments. In addition, we may need to establish the commercial infrastructure required to manufacture, market and sell our drug candidates following approval, if any, by the FDA, which would result in us incurring additional expenses. As a result, our quarterly results may fluctuate and a quarter-by-quarter comparison of our operating results may not be a meaningful indication of our future performance.
RESULTS OF OPERATIONS
Years Ended December 31, 2013 and 2012
|
|
|
Years Ended December 31,
|
|
||||
|
|
|
2013
|
|
2012
|
|
||
|
|
|
|
|
|
|
|
|
|
License revenue
|
|
$
|
152,381
|
|
$
|
19,048
|
|
|
|
|
|
|
|
|
|
|
|
Costs and expenses:
|
|
|
|
|
|
|
|
|
Research and development:
|
|
|
|
|
|
|
|
|
Noncash stock expense associated with in-licensing agreement
|
|
|
—
|
|
|
16,578,000
|
|
|
Noncash compensation
|
|
|
1,041,519
|
|
|
455,809
|
|
|
Other research and development
|
|
|
12,621,161
|
|
|
3,994,182
|
|
|
Total research and development
|
|
|
13,662,680
|
|
|
21,027,991
|
|
|
|
|
|
|
|
|
|
|
|
General and administrative:
|
|
|
|
|
|
|
|
|
Noncash compensation
|
|
|
4,161,629
|
|
|
2,966,373
|
|
|
Other general and administrative
|
|
|
2,496,461
|
|
|
1,815,083
|
|
|
Total general and administrative
|
|
|
6,658,090
|
|
|
4,781,456
|
|
|
|
|
|
|
|
|
|
|
|
Impairment of in-process research and development
|
|
|
2,797,600
|
|
|
1,104,700
|
|
|
|
|
|
|
|
|
|
|
|
Total costs and expenses
|
|
|
23,118,370
|
|
|
26,914,147
|
|
|
|
|
|
|
|
|
|
|
|
Operating loss
|
|
|
(22,965,989)
|
|
|
(26,895,099)
|
|
|
|
|
|
|
|
|
|
|
|
Other income, net
|
|
|
(2,487,779)
|
|
|
(1,042,147)
|
|
|
|
|
|
|
|
|
|
|
|
Loss before income taxes
|
|
|
(20,478,210)
|
|
|
(25,852,952)
|
|
|
|
|
|
|
|
|
|
|
|
Income taxes
|
|
|
—
|
|
|
330,000
|
|
|
Consolidated net loss
|
|
$
|
(20,478,210)
|
|
$
|
(26,182,952)
|
|
| 36 | ||
|
|
License Revenue.
License revenue was $152,381 for the year ended December 31, 2013, as compared to $19,048 for the year ended December 31, 2012. License revenue is related to the amortization of an upfront payment of $2.0 million associated with our license agreement with Ildong. The upfront payment from Ildong will be recognized as license revenue on a straight-line basis through December 2025, which represents the estimated period over which the Company will have certain ongoing responsibilities under the sublicense agreement.
Noncash Stock Expense Associated with In-licensing Agreement.
Noncash stock expense associated with an in-licensing agreement was $0 for the year ended December 31, 2013, as compared to $16,578,000 for the year ended December 31, 2012. The expense during the year ended December 31, 2012 related to a noncash stock expense recorded in conjunction with the stock issued to LFB Group for the license to TG-1101.
Noncash Compensation Expense (Research and Development).
Noncash compensation expense (research and development) related to equity incentive grants increased by $585,710 from $455,809 for the year ended December 31, 2012 to $1,041,519 during the year ended December 31, 2013.
The noncash compensation expense was related to the period’s expense for restricted stock grants to research and development personnel.
We expect noncash compensation expense (research and development) to remain at a comparable level in 2014.
Other Research and Development Expenses
. Other research and development expenses increased by $8,626,979 from $3,994,182 for the year ended December 31, 2012 to $12,621,161 for the year ended December 31, 2013.
The increase in other research and development expenses was due primarily to an increase of approximately $5,700,000 for research and development expenses and drug supply costs related to TG-1101, and an increase of approximately $3,000,000 for research and development expenses related to TGR-1202. Included in the research and development expenses related to TGR-1202 for the year ended December 31, 2013
is a $2,000,000 milestone payment due to Rhizen in connection with the Collaboration Agreement for TGR-1202. We expect our other research and development costs to increase in 2014 as we continue to recruit patients to our clinical programs for both compounds.
Noncash Compensation Expense (General and Administrative).
Noncash compensation expense (general and administrative) related to equity incentive grants increased by $1,195,256 from $2,966,373 for the year ended December 31, 2012 to $4,161,629 during the year ended December 31, 2013.
The noncash compensation expense was related to the period’s expense for restricted stock grants to general and administrative personnel.
We expect noncash compensation expense (general and administrative) to remain at a comparable level in 2014.
Other General and Administrative Expenses
. Other general and administrative expenses increased by $681,378 from $1,815,083 for the year ended December 31, 2012 to $2,496,461 for the year ended December 31, 2013. This expense was primarily related to increased business insurance levels, the NASDAQ entry fee, franchise taxes, and expenses related to additional general and administrative personnel. We expect our other general and administrative expenses to increase modestly during 2014.
Impairment of in-process research and development
. During the year ended December 31, 2013, we recorded an impairment charge of $2,797,600 as compared to $1,104,700 for the year ended December 31, 2012.
The impairments recognized in both 2012 and 2013 related to the in-process research and development intangible asset recorded in connection with the Exchange Transaction. Impairment testing of our indefinite lived intangible assets is performed annually or when a triggering event occurs that could indicate a potential impairment. As of December 31, 2013, as a result of expiring intellectual property, uncertain regulatory pathways, and market changes affecting the commercial potential for the Ariston in-process research and development asset (AST-726), the Company determined that the asset's carrying value was no longer recoverable.
Other Income, net
. Other income increased by $1,445,632 from $1,042,147 for the year ended December 31, 2012 to $2,487,779 for the year ended December 31, 2013. The increase in other income is primarily due to a further decrease in the fair value of our non-current notes payable of approximately $1,641,079.
Income Taxes
. During the year ended December 31, 2012, we recorded income tax expense of approximately $330,000 related to a foreign tax withholding on the $2,000,000 upfront payment received from Ildong in connection with our sublicensing agreement.
| 37 | ||
|
|
LIQUIDITY AND CAPITAL RESOURCES
Our primary sources of cash has been from the sale of equity securities, the upfront payment from our Sublicense Agreement with Ildong, and warrant exercises. We have not yet commercialized any of our drug candidates and cannot be sure if we will ever be able to do so. Even if we commercialize one or more of our drug candidates, we may not become profitable. Our ability to achieve profitability depends on a number of factors, including our ability to obtain regulatory approval for our drug candidates, successfully complete any post-approval regulatory obligations and successfully commercialize our drug candidates alone or in partnership. We may continue to incur substantial operating losses even if we begin to generate revenues from our drug candidates.
As of December 31, 2013, we had $45,431,532 in cash, cash equivalents, investment securities, and interest receivable. We currently anticipate that our cash and cash equivalents as of December 31, 2013 are sufficient to fund our anticipated operating cash requirements for approximately 24 months from December 31, 2013. The actual amount of cash that we will need to operate is subject to many factors, including, but not limited to, the timing, design and conduct of clinical trials for our drug candidates. We are dependent upon significant financing to provide the cash necessary to execute our current operations, including the commercialization of any of our drug candidates.
Cash used in operating activities for the year ended December 31, 2013 was $10,824,231 as compared to $5,187,964 for the year ended December 31, 2012. The increase in cash used in operating activities was due primarily to increased expenditures related to our clinical development plan for TG-1101 and TGR-1202 and a milestone payment of $2,000,000 associated with TGR-1202.
For the year ended December 31, 2013, net cash used in investing activities was $4,925,552 as compared to $1,399 for the year ended December 31, 2012. The increase in net cash used in investing activities was primarily due to our investment in held-to-maturity securities.
Cash provided by financing activities for the year ended December 31, 2013 was $39,779,254 as compared to $11,896,867 for the year ended December 31, 2012. The increase in net cash provided by financing activities in 2013 was primarily related to the 2013 Equity financing, as discussed below.
2013 Equity Financing
On July 18, 2013, we announced the pricing of an underwritten public offering of 5,700,000 shares of our Common Stock at a price of $6.15 per share for gross proceeds of approximately $35 million. We also granted to the underwriters a 30-day option to acquire an additional 855,000 shares to cover overallotments in connection with the offering, which they exercised. Total net proceeds from this offering, including the overallotment, were approximately $37.6 million, net of underwriting discounts and offering expenses of approximately $2.7 million. The shares were sold under a shelf registration statement on Form S-3 (File No. 333-189015) that was previously filed and declared effective by the SEC on June 17, 2013.
2011 Equity PIPE
On December 30, 2011, we
completed the first closing of the private placement of our securities, issuing 4,929,523 shares of Common Stock at a price per share of $2.25 for total gross proceeds, before placement commissions and expenses, of $11,091,425 (the “2011 Equity PIPE”). Investors also received warrants to purchase 1,232,381 shares of Common Stock. The warrants have an exercise price of $2.25 per share and are exercisable for five years. In 2012, we completed two additional closings of the 2011 Equity PIPE.
These closings were held on January 31, 2012, and February 24, 2012.
In these closings, the Company issued 695,428 shares of our Company Preferred Stock at a price per share of $20.00 for total gross proceeds, before placement commissions and expenses, of $13,908,560. Each share of Company Preferred Stock was convertible into 8.89 shares of Common Stock; provided that such conversion rights were subject to sufficient available authorized shares of Common Stock. In connection with the reverse stock split effected by the Company on April 30, 2012, all shares of preferred stock issued in the 2011 Equity PIPE were converted to Common Stock. Investors also received warrants to purchase 1,545,396 shares of Common Stock. The warrants have an exercise price of $2.25 per share and are exercisable for five years. The shares of Common Stock, Company Preferred Stock, and warrants sold in these closings were offered and sold to accredited investors, including members of management, without registration under the Securities Act, or state securities laws, in reliance on the exemptions provided by Section 4(2) of the Securities Act, and Regulation D promulgated thereunder and in reliance on similar exemptions under applicable state laws. Accordingly, the securities issued in the offering have not been registered under the Securities Act, and until so registered, these securities may not be offered or sold in the United States absent registration or availability of an applicable exemption from registration. The placement agent received cash commissions equal to 10% of the gross proceeds of the offering, five-year warrants to purchase shares of the Company’s stock equal to 10% of shares sold in the offering, and a non-accountable expense allowance equal to two percent of the gross proceeds of the offering for their expenses.
| 38 | ||
|
|
OFF-BALANCE SHEET ARRANGEMENTS
We have not entered into any transactions with unconsolidated entities whereby we have financial guarantees, subordinated retained interests, derivative instruments or other contingent arrangements that expose us to material continuing risks, contingent liabilities, or any other obligations under a variable interest in an unconsolidated entity that provides us with financing, liquidity, market risk or credit risk support.
CRITICAL ACCOUNTING POLICIES
The discussion and analysis of our financial condition and results of operations is based upon our consolidated financial statements, which have been prepared in accordance with U.S. generally accepted accounting principles. The preparation of these financial statements requires us to make estimates and judgments that affect the reported amount of assets and liabilities and related disclosure of contingent assets and liabilities at the date of our financial statements and the reported amounts of revenues and expenses during the applicable period. Actual results may differ from these estimates under different assumptions or conditions.
We define critical accounting policies as those that are reflective of significant judgments and uncertainties and which may potentially result in materially different results under different assumptions and conditions. In applying these critical accounting policies, our management uses its judgment to determine the appropriate assumptions to be used in making certain estimates. These estimates are subject to an inherent degree of uncertainty. Our critical accounting policies include the following:
Revenue Recognition
. We recognize license revenue in accordance with the revenue recognition guidance of the Financial Accounting Standards Board (“FASB”) Accounting Standards Codification, or Codification. We analyze each element of our licensing agreement to determine the appropriate revenue recognition. The terms of the license agreement may include payments to us of non-refundable up-front license fees, milestone payments if specified objectives are achieved, and/or royalties on product sales. We recognize revenue from upfront payments over the period of significant involvement under the related agreements unless the fee is in exchange for products delivered or services rendered that represent the culmination of a separate earnings process and no further performance obligation exists under the contract. We recognize milestone payments as revenue upon the achievement of specified milestones only if (1) the milestone payment is non-refundable, (2) substantive effort is involved in achieving the milestone, (3) the amount of the milestone is reasonable in relation to the effort expended or the risk associated with achievement of the milestone, and (4) the milestone is at risk for both parties. If any of these conditions are not met, we defer the milestone payment and recognize it as revenue over the estimated period of performance under the contract.
Stock Compensation
. We have granted stock options and restricted stock to employees, directors and consultants, as well as warrants to other third parties. For employee and director grants, the value of each option award is estimated on the date of grant using the Black-Scholes option-pricing model. The Black-Scholes model takes into account volatility in the price of our stock, the risk-free interest rate, the estimated life of the option, the closing market price of our stock and the exercise price. We base our estimates of our stock price volatility on the historical volatility of our common stock and our assessment of future volatility; however, these estimates are neither predictive nor indicative of the future performance of our stock. For purposes of the calculation, we assumed that no dividends would be paid during the life of the options and warrants. The estimates utilized in the Black-Scholes calculation involve inherent uncertainties and the application of management judgment. In addition, we are required to estimate the expected forfeiture rate and only recognize expense for those equity awards expected to vest. As a result, if other assumptions had been used, our recorded stock-based compensation expense could have been materially different from that reported.
In addition, because some of the options and warrants issued to employees, consultants and other third-parties vest upon the achievement of certain milestones, the total expense is uncertain.
Total compensation expense for options and restricted stock issued to consultants is determined at the “measurement date.” The expense is recognized over the vesting period for the options and restricted stock. Until the measurement date is reached, the total amount of compensation expense remains uncertain. We record stock-based compensation expense based on the fair value of the equity awards at the reporting date. These equity awards are then revalued, or the total compensation is recalculated based on the then current fair value, at each subsequent reporting date. This results in a change to the amount previously recorded in respect of the equity award grant, and additional expense or a reversal of expense may be recorded in subsequent periods based on changes in the assumptions used to calculate fair value, such as changes in market price, until the measurement date is reached and the compensation expense is finalized.
| 39 | ||
|
|
In-process Research and Development
. All acquired research and development projects are recorded at their fair value as of the date acquisition.
The fair values are assessed as of the balance sheet date to ascertain if there has been any impairment of the recorded value.
If there is an impairment the asset is written down to its current fair value by the recording of an expense.
Accruals for Clinical Research Organization and Clinical Site Costs.
We make estimates of costs incurred in relation to external clinical research organizations, or CROs, and clinical site costs. We analyze the progress of clinical trials, including levels of patient enrollment, invoices received and contracted costs when evaluating the adequacy of the amount expensed and the related prepaid asset and accrued liability. Significant judgments and estimates must be made and used in determining the accrued balance and expense in any accounting period.
We review and accrue CRO expenses and clinical trial study expenses based on work performed and rely upon estimates of those costs applicable to the stage of completion of a study. Accrued CRO costs are subject to revisions as such trials progress to completion. Revisions are charged to expense in the period in which the facts that give rise to the revision become known.
With respect to clinical site costs, the financial terms of these agreements are subject to negotiation and vary from contract to contract. Payments under these contracts may be uneven, and depend on factors such as the achievement of certain events, the successful recruitment of patients, the completion of portions of the clinical trial or similar conditions. The objective of our policy is to match the recording of expenses in our financial statements to the actual services received and efforts expended. As such, expense accruals related to clinical site costs are recognized based on our estimate of the degree of completion of the event or events specified in the specific clinical study or trial contract.
Accounting Related to Goodwill.
As of December 31, 2013 and 2012, there was $799,391 of goodwill on our consolidated balance sheets. Goodwill is reviewed for impairment annually, or when events arise that could indicate that an impairment exists. We test for goodwill impairment using a two-step process. The first step compares the fair value of the reporting unit with the unit's carrying value, including goodwill. When the carrying value of the reporting unit is greater than fair value, the unit’s goodwill may be impaired, and the second step must be completed to measure the amount of the goodwill impairment charge, if any. In the second step, the implied fair value of the reporting unit’s goodwill is compared with the carrying amount of the unit’s goodwill. If the carrying amount is greater than the implied fair value, the carrying value of the goodwill must be written down to its implied fair value.
We are required to perform impairment tests annually, at December 31, and whenever events or changes in circumstances suggest that the carrying value of an asset may not be recoverable. For all of our acquisitions, various analyses, assumptions and estimates were made at the time of each acquisition that were used to determine the valuation of goodwill and intangibles. In future years, the possibility exists that changes in forecasts and estimates from those used at the acquisition date could result in impairment indicators.
Accounting For Income Taxes
. In preparing our consolidated financial statements, we are required to estimate our income taxes in each of the jurisdictions in which we operate. This process involves management estimation of our actual current tax exposure and assessment of temporary differences resulting from differing treatment of items for tax and accounting purposes. These differences result in deferred tax assets and liabilities. We must then assess the likelihood that our deferred tax assets will be recovered from future taxable income and, to the extent we believe that recovery is not likely, we must establish a valuation allowance. To the extent we establish a valuation allowance or increase this allowance in a period, we must include an expense within the tax provision in the consolidated statement of operations. Significant management judgment is required in determining our provision for income taxes, our deferred tax assets and liabilities and any valuation allowance recorded against our net deferred tax assets. We have fully offset our deferred tax assets with a valuation allowance. Our lack of earnings history and the uncertainty surrounding our ability to generate taxable income prior to the reversal or expiration of such deferred tax assets were the primary factors considered by management in maintaining the valuation allowance.
RECENTLY ISSUED ACCOUNTING STANDARDS
In July 2013, the Financial Accounting Standards Board, or FASB, issued a new accounting standard which will require the presentation of certain unrecognized tax benefits as reductions to deferred tax assets rather than as liabilities in the consolidated balance sheets when a net operating loss carryforward, a similar tax loss, or a tax credit carryforward exists. The new standard requires adoption on a prospective basis in the first quarter of 2015; however, early adoption is permitted. The Company does not anticipate that this adoption will have a significant impact on its financial position, results of operations, or cash flows.
| 40 | ||
|
|
Other pronouncements issued by the FASB or other authoritative accounting standards group with future effective dates are either not applicable or not significant to the consolidated financial statements of the Company.
Our consolidated financial statements and the notes thereto, included in Part IV, Item 15(a), part 1, are incorporated by reference into this Item 8.
FINANCIAL DISCLOSURE.
Not applicable.
Evaluation of Disclosure Controls and Procedures.
As of December 31, 2013, we carried out an evaluation, under the supervision and with the participation of our Chief Executive Officer and our Chief Financial Officer, of the effectiveness of the design and operation of our disclosure controls and procedures (as defined in Rules 13a-15(e) and 15d-15(e) of the Securities Exchange Act of 1934, as amended (the “Exchange Act”)). Based upon that evaluation, our Chief Executive and Chief Financial Officers concluded that our disclosure controls and procedures were effective as of that date to ensure that information required to be disclosed in our reports filed or submitted under the Exchange Act is recorded , processed, summarized and reported within the time periods specified in the SEC’s rules and forms, and to ensure that information required to be disclosed by us in such reports is accumulated and communicated to the our management, including our Chief Executive Officer and Chief Financial Officer, as appropriate to allow timely decisions regarding required disclosure.
There were no changes in our internal controls over financial reporting (as defined in Exchange Act Rules 13a – 15(f) and 15d – 15(f)) during
the quarter ended December 31, 2013 that have materially affected, or is reasonably likely to materially affect, our internal controls over financial reporting.
Our disclosure controls or internal controls over financial reporting were designed to provide only reasonable assurance that such disclosure controls or internal control over financial reporting will prevent all errors or all instances of fraud, even as the same are improved to address any deficiencies. The design of any system of controls is based in part upon certain assumptions about the likelihood of future events, and there can be only reasonable, not absolute assurance that any design will succeed in achieving its stated goals under all potential future conditions. A control system, no matter how well designed and operated, can provide only reasonable, not absolute, assurance that the control system’s objectives will be met. Over time, controls may become inadequate because of changes in conditions or deterioration in the degree of compliance with policies or procedures. Further, the design of a control system must reflect the fact that there are resource constraints, and the benefits of controls must be considered relative to their costs.
Management's Report on Internal Control over Financial Reporting.
Our management is responsible for establishing and maintaining adequate internal control over financial reporting and for the assessment of the effectiveness of internal control over financial reporting.
As defined by the SEC, internal control over financial reporting is a process designed by, or under the supervision of our principal executive and principal financial officers and effected by our Board of Directors, management and other personnel, to provide reasonable assurance regarding the reliability of financial reporting and the preparation of the financial statements in accordance with U.S. generally accepted accounting principles.
Our internal control over financial reporting includes those policies and procedures that (1) pertain to the maintenance of records that, in reasonable detail, accurately and fairly reflect our transactions and dispositions of our assets; (2) provide reasonable assurance that transactions are recorded as necessary to permit preparation of the financial statements in accordance with U.S. generally accepted accounting principles, and that our receipts and expenditures are being made only in accordance with authorizations of our management and directors; and (3) provide reasonable assurance regarding prevention or timely detection of unauthorized acquisition, use or disposition of our assets that could have a material effect on the financial statements.
Because of its inherent limitations, internal control over financial reporting may not prevent or detect misstatements.
Also projections of any evaluation of effectiveness to future periods are subject to the risk that controls may become inadequate because of changes in conditions, or that the degree of compliance with the policies or procedures may deteriorate.
| 41 | ||
|
|
In connection with the preparation of our annual financial statements, management has undertaken an assessment of the effectiveness of our internal control over financial reporting as of December 31, 2013, based on criteria established in Internal Control – Integrated Framework (1992) issued by the Committee of Sponsoring Organizations of the Treadway Commission, or COSO Framework.
Management’s assessment included an evaluation of the design of our internal control over financial reporting and testing of the operational effectiveness of those controls.
Based on this evaluation, management has concluded that our internal control over financial reporting is effective as of December 31, 2013.
This annual report does not include an attestation report of our independent registered public accounting firm regarding internal control over financial reporting.
Management’s report was not subject to attestation by our independent registered public accounting firm pursuant to rules of the SEC that permit us to provide only management’s report on internal control in this report.
Limitations on the Effectiveness of Controls.
Our management, including our Chief Executive Officer and Chief Financial Officer, does not expect that our disclosure controls and procedures or our internal control over financial reporting will prevent all errors and all fraud. A control system, no matter how well conceived and operated, can provide only reasonable, not absolute, assurance that the objectives of the control system are met. Further, the design of a control system must reflect the fact that there are resource constraints, and the benefits of controls must be considered relative to their costs. Because of the inherent limitations in all control systems, no evaluation of controls can provide absolute assurance that all control issues and instances of fraud, if any, within our Company have been detected.
None.
The information required by this Item is incorporated herein by reference from our Proxy Statement for our 2014 Annual Meeting of Stockholders.
The information required by this Item is incorporated herein by reference from our Proxy Statement for our 2014 Annual Meeting of Stockholders.
The information required by this Item is incorporated herein by reference from our Proxy Statement for our 2014 Annual Meeting of Stockholders.
The information required by this Item is incorporated herein by reference from our Proxy Statement for our 2014 Annual Meeting of Stockholders.
The information required by this Item is incorporated herein by reference from our Proxy Statement for our 2014 Annual Meeting of Stockholders.
| 42 | ||
|
|
1. Consolidated Financial Statements
The following consolidated financial statements of TG Therapeutics, Inc. are filed as part of this report.
|
Contents
|
Page
|
|
|
|
|
Report of Independent Registered Public Accounting Firm
|
F-2
|
|
|
|
|
Consolidated Balance Sheets as of December 31, 2013 and 2012
|
F-3
|
|
|
|
|
Consolidated Statements of Operations for the years ended December 31, 2013 and 2012 and cumulative period ended December 31, 2013
|
F-4
|
|
|
|
|
Consolidated Statements of Equity for the years ended December 31, 2013, 2012 and 2011 and cumulative period ended December 31, 2013
|
F-5
|
|
|
|
|
Consolidated Statements of Cash Flows for the years ended December 31, 2013 and 2012 and cumulative period ended December 31, 2013
|
F-7
|
|
|
|
|
Notes to Consolidated Financial Statements
|
F-8
|
2. Consolidated Financial Statement Schedules
All schedules are omitted as the information required is inapplicable or the information is presented in the consolidated financial statements or the related notes.
3. Exhibits
|
Exhibit
|
|
|
Number
|
Exhibit Description
|
|
|
|
|
3.1
|
Amended and Restated Certificate of Incorporation, of TG Therapeutics, Inc. dated April 26, 2012 (incorporated by reference to Exhibit 3.2 to the Registrant’s Form 10-Q for the quarter ended June 30, 2012).
|
|
|
|
|
3.2
|
Restated Bylaws of TG Therapeutics, Inc. dated May 14, 2012 (incorporated by reference to Exhibit 3.2 to the Registrant’s Form 10-Q for the quarter ended March 31, 2012).
|
|
|
|
|
4.1
|
Specimen common stock certificate (incorporated by reference to Exhibit 4.1 to the Registrant’s Form 10-K for the year ended December 31, 2011).
|
|
|
|
|
4.2
|
Form of Warrant issued to Noteholders on September 11, 2008 (incorporated by reference to Exhibit 10.2 to the Registrant’s Current Report on Form 8-K filed on September 15, 2008).
|
|
|
|
|
4.3
|
Form of Warrant issued to Noteholders on November 19, 2008 (incorporated by reference to Exhibit 10.6 to the Registrant’s Current Report on Form 8-K filed on November 25, 2008).
|
|
|
|
|
4.4
|
Form of warrant to purchase common stock of TG Therapeutics, Inc. (incorporated by reference to Exhibit 4.1 to the Registrant’s Current Report on Form 8-K filed on November 13, 2012).
|
|
|
|
|
4.5
|
Form of Placement Agent Warrant (incorporated by reference to Exhibit 10.9 to the Registrant’s Current Report on Form 8-K filed on November 25, 2008).
|
|
|
|
|
4.6
|
Warrant, dated October 28, 2009 (incorporated by reference to Exhibit 10.3 to the Registrant’s Current Report on Form 8-K filed on November 3, 2009).
|
| 43 | ||
|
|
|
4.7
|
Form of Placement Agent Warrant (incorporated by reference to Exhibit 10.4 to the Registrant’s Current Report on Form 8-K filed on November 3, 2009).
|
|
|
|
|
10.1
|
2003 Stock Option Plan (incorporated by reference to Exhibit 4.1 to Registrant’s Registration Statement on Form S-8 filed February 17, 2004).
|
|
|
|
|
10.2
|
Form of Stock Option Agreement issued under the Registrant’s 2003 Stock Option Plan (incorporated by reference to Exhibit 10.15 to the Registrant's Form 10-KSB filed April 2, 2007).
|
|
|
|
|
10.3
|
Amended and Restated Convertible Promissory Note, dated March 1, 2011 (incorporated by reference to Exhibit 10.1 to the Registrant’s Current Report on Form 8-K filed on March 7, 2011).
|
|
|
|
|
10.4
|
Exchange Transaction Agreement dated December 29, 2011, by and among the Registrant, Opus Point Partners, LLC and TG Therapeutics, Inc. (incorporated by reference to Exhibit 10.1 to the Registrant’s Form 8-K filed on January 5, 2012).
|
|
|
|
|
10.5
|
Amendment No. 1 to Exchange Transaction Agreement, dated as of December 29, 2011, by and among Opus Point Partners, LLC, TG Biologics, Inc. and TG Therapeutics, Inc. (incorporated by reference to Exhibit 10.1 to the Registrant’s Form 8-K filed on August 8, 2012).
|
|
|
|
|
10.6
|
Employment Agreement, effective December 29, 2011, between the Registrant and Michael Weiss (incorporated by reference to Exhibit 10.30 to the Registrant’s Form 10-K for the fiscal year ended December 31, 2011). †
|
|
|
|
|
10.7
|
Restricted Stock Subscription Agreement, effective December 29, 2011, between the Registrant and Michael Weiss (incorporated by reference to Exhibit 10.31 to the Registrant’s Form 10-K for the fiscal year ended December 31, 2011). †
|
|
|
|
|
10.8
|
Employment Agreement, effective December 29, 2011, between the Registrant and Sean Power (incorporated by reference to Exhibit 10.32 to the Registrant’s Form 10-K for the fiscal year ended December 31, 2011). †
|
|
|
|
|
10.9
|
Restricted Stock Subscription Agreement, effective December 29, 2011 between the Registrant and Sean Power (incorporated by reference to Exhibit 10.33 to the Registrant’s Form 10-K for the fiscal year ended December 31, 2011).
†
|
|
|
|
|
10.10
|
Form of Warrant issued to stockholders on December 29, 2011, January 31, 2012 and February 24, 2012 (incorporated by reference to Exhibit 10.34 to the Registrant’s Form 10-K for the fiscal year ended December 31, 2011).
|
|
|
|
|
10.11
|
License Agreement, dated January 30, 2012, by and among the Registrant, GTC Biotherapeutics, Inc., LFB Biotechnologies S.A.S. and LFB/GTC LLC (incorporated by reference to Exhibit 10.35 to the Registrant’s Form 10-K for the fiscal year ended December 31, 2011). *
|
|
|
|
|
10.12
|
TG Therapeutics, Inc. Amended and Restated 2012 Incentive Plan, dated May 14, 2012 (incorporated by reference to Exhibit 10.1 to the Registrant’s Form 10-Q/A for the quarter ended March 31, 2012).
|
|
|
|
|
10.13
|
Securities Exchange Agreement, dated November 9, 2012, by and between the Company and LFB Biotechnologies S.A.S. (incorporated by reference to Exhibit 10.1 to the Registrant’s Current Report on Form 8-K filed on November 13, 2012).
|
|
|
|
|
10.14
|
Joint Venture Agreement between TG Therapeutics, Inc. and Rhizen Pharmaceuticals SA, dated August 15, 2012 (incorporated by reference to Exhibit 10.1 to the Registrant’s Form 10-Q for the quarter ended September 30, 2012). *
|
|
|
|
|
10.15
|
Sublicense Agreement between TG Therapeutics, Inc. and Ildong Pharmaceutical Co. Ltd., dated November 13, 2012 (incorporated by reference to Exhibit 10.37 to the Registrant’s Form 10-K for the fiscal year ended December 31, 2012). *
|
| 44 | ||
|
|
|
23.1
|
Consent of Independent Registered Public Accounting Firm
|
|
|
|
|
31.1
|
Certification of Principal Executive Officer
|
|
|
|
|
31.2
|
Certification of Principal Financial Officer
|
|
|
|
|
32.1
|
Certifications pursuant to Section 906 of the Sarbanes-Oxley Act of 2002.
|
†
Indicates management contract or compensatory plan or arrangement.
*
Confidential treatment has been requested with respect to omitted portions of this exhibit.
| 45 | ||
|
|
TG Therapeutics, Inc. |
|
Consolidated Financial Statements as of December 31, 2013
|
|
|
|
Contents
|
Page
|
|
|
|
|
Report of Independent Registered Public Accounting Firm
|
F-2
|
|
|
|
|
Consolidated Balance Sheets as of December 31, 2013 and 2012
|
F-3
|
|
|
|
|
Consolidated Statements of Operations for the years ended December 31, 2013 and 2012 and cumulative period ended December 31, 2013
|
F-4
|
|
|
|
|
Consolidated Statements of Equity for the years ended December 31, 2013, 2012 and 2011 and cumulative period ended December 31, 2013
|
F-5
|
|
|
|
|
Consolidated Statements of Cash Flows for the years ended December 31, 2013 and 2012 and cumulative period ended December 31, 2013
|
F-7
|
|
|
|
|
Notes to Consolidated Financial Statements
|
F-8
|
| F-1 | ||
|
|
Report of Independent Registered Public Accounting Firm
The Board of Directors and Stockholders
TG Therapeutics, Inc.
We have audited the accompanying consolidated balance sheets of TG Therapeutics, Inc. and Subsidiaries (a development stage company) (the “Company”) as of December 31, 2013 and 2012, and the related consolidated statements of operations, equity and cash flows for the years then ended and cumulative period ended December 31, 2013. TG Therapeutics, Inc.’s management is responsible for these consolidated financial statements. Our responsibility is to express an opinion on these consolidated financial statements based on our audits.
We conducted our audits in accordance with the standards of the Public Company Accounting Oversight Board (United States). Those standards require that we plan and perform the audit to obtain reasonable assurance about whether the financial statements are free of material misstatement. The Company is not required to have, nor were we engaged to perform, an audit of its internal control over financial reporting. Our audit included consideration of internal control over financial reporting as a basis for designing audit procedures that are appropriate in the circumstances, but not for the purpose of expressing an opinion on the effectiveness of the Company’s internal control over financial reporting.
Accordingly, we express no such opinion. An audit also includes examining, on a test basis, evidence supporting the amounts and disclosures in the financial statements, assessing the accounting principles used and significant estimates made by management, as well as evaluating the overall financial statement presentation. We believe that our audits provide a reasonable basis for our opinion.
In our opinion, the consolidated financial statements referred to above present fairly, in all material respects, the financial position of TG Therapeutics, Inc. and Subsidiaries as of December 31, 2013 and 2012, and their results of operations and cash flows for the years then ended and cumulative period ended December 31, 2013, in conformity with accounting principles generally accepted in the United States of America.
/s/ CohnReznick LLP
Roseland, New Jersey
March 7, 2014
| F-2 | ||
|
|
|
TG Therapeutics, Inc.
|
|
(a development stage company)
|
|
|
|
|
|
|
|
2013
|
|
2012
|
|
||
|
Assets
|
|
|
|
|
|
|
|
|
Current assets:
|
|
|
|
|
|
|
|
|
Cash and cash equivalents
|
|
$
|
40,485,466
|
|
$
|
16,455,995
|
|
|
Interest receivable
|
|
|
27,169
|
|
|
—
|
|
|
Prepaid research and development
|
|
|
1,742,824
|
|
|
1,990,759
|
|
|
Other current assets
|
|
|
47,804
|
|
|
29,128
|
|
|
Total current assets
|
|
|
42,303,263
|
|
|
18,475,882
|
|
|
Long-term investment securities
|
|
|
4,918,897
|
|
|
—
|
|
|
Equipment, net
|
|
|
5,718
|
|
|
1,164
|
|
|
In-process research and development
|
|
|
—
|
|
|
2,797,600
|
|
|
Goodwill
|
|
|
799,391
|
|
|
799,391
|
|
|
Other assets
|
|
|
85,121
|
|
|
—
|
|
|
Total assets
|
|
$
|
48,112,390
|
|
$
|
22,074,037
|
|
|
|
|
|
|
|
|
|
|
|
Liabilities and equity
|
|
|
|
|
|
|
|
|
Current liabilities:
|
|
|
|
|
|
|
|
|
Notes payable, current portion
|
|
$
|
677,778
|
|
$
|
677,778
|
|
|
Accounts payable and accrued expenses
|
|
|
4,764,502
|
|
|
1,117,397
|
|
|
Accrued compensation
|
|
|
532,500
|
|
|
145,000
|
|
|
Current portion of deferred revenue
|
|
|
152,381
|
|
|
152,381
|
|
|
Interest payable
|
|
|
190,017
|
|
|
123,511
|
|
|
Total current liabilities
|
|
|
6,317,178
|
|
|
2,216,067
|
|
|
Deferred revenue, net of current portion
|
|
|
1,676,191
|
|
|
1,828,571
|
|
|
Notes payable, less current portion, at fair value
|
|
|
64,529
|
|
|
2,479,098
|
|
|
Total liabilities
|
|
|
8,057,898
|
|
|
6,523,736
|
|
|
Commitments and contingencies
|
|
|
|
|
|
|
|
|
Equity:
|
|
|
|
|
|
|
|
|
Preferred stock, $0.001 par value per share (10,000,000 shares
authorized, 0 issued and outstanding as of December 31, 2013 and 2012) |
|
|
—
|
|
|
—
|
|
|
Common stock, $0.001 par value per share (500,000,000 shares
authorized, 34,336,235 and 25,820,738 shares issued, 34,294,926 and 25,807,212 shares outstanding at December 31, 2013 and 2012, respectively) |
|
|
34,336
|
|
|
25,821
|
|
|
Contingently issuable shares
|
|
|
6
|
|
|
6
|
|
|
Additional paid-in capital
|
|
|
79,658,490
|
|
|
34,534,805
|
|
|
Treasury stock, at cost, 41,309 and 13,526 shares at December 31,
2013 and 2012, respectively |
|
|
(234,337)
|
|
|
(84,538)
|
|
|
Deficit accumulated in the development stage
|
|
|
(39,404,003)
|
|
|
(18,925,793)
|
|
|
Total equity
|
|
|
40,054,492
|
|
|
15,550,301
|
|
|
Total liabilities and equity
|
|
$
|
48,112,390
|
|
$
|
22,074,037
|
|
The accompanying notes are an integral part of the consolidated financial statements.
| F-3 | ||
|
|
|
TG Therapeutics, Inc.
|
|
(a development stage company)
|
|
Consolidated Statements of Operations for the Years Ended December 31, 2013 and 2012 and Cumulative Period Ended December 31, 2013
|
|
|
|
|
|
2013
|
|
2012
|
|
Amounts accumulated
during the development stage |
|
|||
|
|
|
|
|
|
|
|
|
|
|
|
|
License revenue
|
|
$
|
152,381
|
|
$
|
19,048
|
|
$
|
171,429
|
|
|
|
|
|
|
|
|
|
|
|
|
|
|
Costs and expenses:
|
|
|
|
|
|
|
|
|
|
|
|
Research and development:
|
|
|
|
|
|
|
|
|
|
|
|
Noncash stock expense associated with in-licensing agreement
|
|
|
—
|
|
|
16,578,000
|
|
|
16,875,000
|
|
|
Noncash compensation
|
|
|
1,041,519
|
|
|
455,809
|
|
|
1,497,328
|
|
|
Other research and development
|
|
|
12,621,161
|
|
|
3,994,182
|
|
|
16,645,626
|
|
|
Total research and development
|
|
|
13,662,680
|
|
|
21,027,991
|
|
|
35,017,954
|
|
|
|
|
|
|
|
|
|
|
|
|
|
|
General and administrative:
|
|
|
|
|
|
|
|
|
|
|
|
Noncash compensation
|
|
|
4,161,629
|
|
|
2,966,373
|
|
|
7,214,496
|
|
|
Other general and administrative
|
|
|
2,496,461
|
|
|
1,815,083
|
|
|
4,779,741
|
|
|
Total general and administrative
|
|
|
6,658,090
|
|
|
4,781,456
|
|
|
11,994,237
|
|
|
|
|
|
|
|
|
|
|
|
|
|
|
Impairment of in-process research and development
|
|
|
2,797,600
|
|
|
1,104,700
|
|
|
3,902,300
|
|
|
|
|
|
|
|
|
|
|
|
|
|
|
Total costs and expenses
|
|
|
23,118,370
|
|
|
26,914,147
|
|
|
50,914,491
|
|
|
|
|
|
|
|
|
|
|
|
|
|
|
Operating loss
|
|
|
(22,965,989)
|
|
|
(26,895,099)
|
|
|
(50,743,062)
|
|
|
|
|
|
|
|
|
|
|
|
|
|
|
Other (income) expense:
|
|
|
|
|
|
|
|
|
|
|
|
Interest income
|
|
|
(30,822)
|
|
|
(15,787)
|
|
|
(46,609)
|
|
|
Other income
|
|
|
(108,894)
|
|
|
(272,232)
|
|
|
(381,126)
|
|
|
Interest expense
|
|
|
952,888
|
|
|
905,744
|
|
|
1,865,729
|
|
|
Change in fair value of notes payable
|
|
|
(3,300,951)
|
|
|
(1,659,872)
|
|
|
(4,960,823)
|
|
|
Total other income, net
|
|
|
(2,487,779)
|
|
|
(1,042,147)
|
|
|
(3,522,829)
|
|
|
|
|
|
|
|
|
|
|
|
|
|
|
Loss before income taxes
|
|
|
(20,478,210)
|
|
|
(25,852,952)
|
|
|
(47,220,233)
|
|
|
|
|
|
|
|
|
|
|
|
|
|
|
Income taxes
|
|
|
—
|
|
|
330,000
|
|
|
330,000
|
|
|
Consolidated net loss
|
|
|
(20,478,210)
|
|
|
(26,182,952)
|
|
|
(47,550,233)
|
|
|
|
|
|
|
|
|
|
|
|
|
|
|
Net loss attributable to non-controlling interest
|
|
|
—
|
|
|
(8,110,233)
|
|
|
(8,146,230)
|
|
|
|
|
|
|
|
|
|
|
|
|
|
|
Net loss attributable to TG Therapeutics, Inc. and
Subsidiaries |
|
$
|
(20,478,210)
|
|
$
|
(18,072,719)
|
|
$
|
(39,404,003)
|
|
|
|
|
|
|
|
|
|
|
|
|
|
|
Basic and diluted net loss per common share
|
|
$
|
(0.81)
|
|
$
|
(1.38)
|
|
|
|
|
|
|
|
|
|
|
|
|
|
|
|
|
|
Weighted average shares used in computing basic and diluted net loss
per common share |
|
|
25,413,964
|
|
|
13,113,758
|
|
|
|
|
The accompanying notes are an integral part of the consolidated financial statements.
| F-4 | ||
|
|
|
TG Therapeutics, Inc.
|
|
(a development stage company)
|
|
Consolidated Statements of Equity for the Years Ended December 31, 2013, 2012 and 2011 and Cumulative Period Ended December 31, 2013
|
|
|
|
|
|
Preferred stock
|
|
Common stock
|
|
Contingently
issuable |
|
Additional
paid-in |
|
Treasury Stock
|
|
Deficit
accumulated in the development |
|
Non- controlling
interest in |
|
|
|
|
|||||||||||||
|
|
|
Shares
|
|
|
Amount
|
|
Shares
|
|
|
Amount
|
|
shares
|
|
capital
|
|
Shares
|
|
Amount
|
|
stage
|
|
subsidiary
|
|
|
Total
|
|
|||||
|
Common stock issued
to founders in exchange for seed capital in April 2011 |
|
|
|
|
|
|
2,500,000
|
|
$
|
2,500
|
|
|
|
|
$
|
104,078
|
|
|
|
|
|
|
|
|
|
|
|
|
$
|
106,578
|
|
|
Stock issued at $2.25
per share in exchange for license option |
|
|
|
|
|
|
132,000
|
|
|
132
|
|
|
|
|
|
296,868
|
|
|
|
|
|
|
|
|
|
|
|
|
|
297,000
|
|
|
Issuance of restricted
stock to employees |
|
|
|
|
|
|
1,150,000
|
|
|
1,150
|
|
|
|
|
|
|
|
|
|
|
|
|
|
|
|
|
|
|
|
1,150
|
|
|
Effect of reverse
acquisition |
|
281,250
|
|
$
|
281
|
|
(2,500,124)
|
|
|
(2,501)
|
|
$
|
6
|
|
|
277,500
|
|
|
|
|
|
|
|
|
|
$
|
47,678
|
|
|
322,964
|
|
|
Conversion of note
payable to preferred stock |
|
2,763
|
|
|
3
|
|
|
|
|
|
|
|
|
|
|
55,268
|
|
|
|
|
|
|
|
|
|
|
|
|
|
55,271
|
|
|
Issuance of
replacement restricted preferred stock to employees |
|
129,375
|
|
|
129
|
|
(1,150,000)
|
|
|
(1,150)
|
|
|
|
|
|
1,021
|
|
|
|
|
|
|
|
|
|
|
|
|
|
—
|
|
|
Common stock issued
at $2.25 per share, net of expenses |
|
|
|
|
|
|
4,929,523
|
|
|
4,930
|
|
|
|
|
|
9,650,886
|
|
|
|
|
|
|
|
|
|
|
|
|
|
9,655,816
|
|
|
Compensation in
respect of restricted stock preferred stock granted to employees |
|
|
|
|
|
|
|
|
|
|
|
|
|
|
|
86,494
|
|
|
|
|
|
|
|
|
|
|
|
|
|
86,494
|
|
|
Net loss
|
|
|
|
|
|
|
|
|
|
|
|
|
|
|
|
|
|
|
|
|
|
|
$
|
(853,074)
|
|
|
(35,997)
|
|
|
(889,071)
|
|
|
Balance at December
31, 2011 |
|
413,388
|
|
|
413
|
|
5,061,399
|
|
|
5,061
|
|
|
6
|
|
|
10,472,115
|
|
|
|
|
|
|
|
(853,074)
|
|
|
11,681
|
|
|
9,636,202
|
|
|
|
|
|
|
|
|
|
|
|
|
|
|
|
|
|
|
|
|
|
|
|
|
|
|
|
|
|
|
|
|
|
|
|
Compensation in
respect of restricted preferred stock granted to employees |
|
|
|
|
|
|
|
|
|
|
|
|
|
|
|
188,509
|
|
|
|
|
|
|
|
|
|
|
|
|
|
188,509
|
|
|
Preferred stock issued
at $20.00 per share, net of expenses |
|
695,428
|
|
|
696
|
|
|
|
|
|
|
|
|
|
|
12,180,710
|
|
|
|
|
|
|
|
|
|
|
|
|
|
12,181,406
|
|
|
Shares issued in
subsidiary to non- controlling interest in connection with in-licensing agreement |
|
|
|
|
|
|
|
|
|
|
|
|
|
|
|
|
|
|
|
|
|
|
|
|
|
|
16,578,000
|
|
|
16,578,000
|
|
|
Conversion of
preferred stock to common stock in conjunction with reverse stock split |
|
(1,108,816)
|
|
|
(1,109)
|
|
9,857,596
|
|
|
9,858
|
|
|
|
|
|
(8,749)
|
|
|
|
|
|
|
|
|
|
|
|
|
|
—
|
|
|
Issuance of restricted
stock |
|
|
|
|
|
|
5,901,743
|
|
|
5,902
|
|
|
|
|
|
(5,902)
|
|
|
|
|
|
|
|
|
|
|
|
|
|
—
|
|
|
Compensation in
respect of restricted common stock granted to employees, directors and consultants |
|
|
|
|
|
|
|
|
|
|
|
|
|
|
|
3,233,674
|
|
|
|
|
|
|
|
|
|
|
|
|
|
3,233,674
|
|
|
Non-controlling
interest subsidiary shares exchanged for shares in TG Therapeutics, Inc. |
|
|
|
|
|
|
5,000,000
|
|
|
5,000
|
|
|
|
|
|
8,474,448
|
|
|
|
|
|
|
|
|
|
|
(8,479,448)
|
|
|
—
|
|
|
Surrender of common
stock for tax withholding |
|
|
|
|
|
|
|
|
|
|
|
|
|
|
|
|
|
13,526
|
|
$
|
(84,538)
|
|
|
|
|
|
|
|
|
(84,538)
|
|
|
Net loss
|
|
|
|
|
|
|
|
|
|
|
|
|
|
|
|
|
|
|
|
|
|
|
|
(18,072,719)
|
|
|
(8,110,233)
|
|
|
(26,182,952)
|
|
|
Balance at December
31, 2012 |
|
—
|
|
$
|
—
|
|
25,820,738
|
|
$
|
25,821
|
|
$
|
6
|
|
$
|
34,534,805
|
|
13,526
|
|
$
|
(84,538)
|
|
$
|
(18,925,793)
|
|
$
|
—
|
|
$
|
15,550,301
|
|
| F-5 | ||
|
|
|
TG Therapeutics, Inc.
|
|
(a development stage company)
|
|
Consolidated Statements of Equity for the Years Ended December 31, 2013, 2012 and 2011 and Cumulative Period Ended December 31, 2013
|
|
|
|
|
|
Preferred stock
|
|
Common stock
|
|
|
Contingently
|
|
Additional
paid-in capital |
|
Treasury Stock
|
|
Deficit
accumulated in the |
|
Non-
controlling |
|
|
|
|
||||||||||||
|
|
|
Shares
|
|
|
Amount
|
|
Shares
|
|
|
Amount
|
|
|
issuable shares
|
|
|
Shares
|
|
|
Amount
|
|
development
stage |
|
interest in
subsidiary |
|
Total
|
|
|||||
|
Balance at December31,
2012 |
|
—
|
|
$
|
—
|
|
25,820,738
|
|
$
|
25,821
|
|
$
|
6
|
|
$
|
34,534,805
|
|
13,526
|
|
$
|
(84,538)
|
|
$
|
(18,925,793)
|
|
$
|
—
|
|
$
|
15,550,301
|
|
|
Issuance of common
stock in connection with exercise of warrants |
|
|
|
|
|
|
1,013,009
|
|
|
1,013
|
|
|
|
|
|
2,279,760
|
|
|
|
|
|
|
|
|
|
|
|
|
|
2,280,773
|
|
|
Issuance of common
stock in connection with cashless exercise of warrants |
|
|
|
|
|
|
3,024
|
|
|
3
|
|
|
|
|
|
(4)
|
|
|
|
|
|
|
|
|
|
|
|
|
|
(1)
|
|
|
Issuance of restricted
stock |
|
|
|
|
|
|
944,464
|
|
|
944
|
|
|
|
|
|
(944)
|
|
|
|
|
|
|
|
|
|
|
|
|
|
—
|
|
|
Issuance of common
stock in public offering (net of offering costs of $2,664,970) |
|
|
|
|
|
|
6,555,000
|
|
|
6,555
|
|
|
|
|
|
37,641,725
|
|
|
|
|
|
|
|
|
|
|
|
|
|
37,648,280
|
|
|
Compensation in respect
of restricted stock and stock options granted to employees, directors and consultants |
|
|
|
|
|
|
|
|
|
|
|
|
|
|
|
5,203,148
|
|
|
|
|
|
|
|
|
|
|
|
|
|
5,203,148
|
|
|
Surrender of common
stock for tax withholding |
|
|
|
|
|
|
|
|
|
|
|
|
|
|
|
|
|
27,783
|
|
|
(149,799)
|
|
|
|
|
|
|
|
|
(149,799)
|
|
|
Net loss
|
|
|
|
|
|
|
|
|
|
|
|
|
|
|
|
|
|
|
|
|
|
|
|
(20,478,210)
|
|
|
|
|
|
(20,478,210)
|
|
|
Balance at December
31, 2013 |
|
—
|
|
$
|
—
|
|
34,336,235
|
|
$
|
34,336
|
|
$
|
6
|
|
$
|
79,658,490
|
|
41,309
|
|
$
|
(234,337)
|
|
$
|
(39,404,003)
|
|
$
|
—
|
|
$
|
40,054,492
|
|
The accompanying notes are an integral part of the consolidated financial statements.
| F-6 | ||
|
|
|
TG Therapeutics, Inc.
|
|
(a development stage company)
|
|
Consolidated Statements of Cash Flows for the Years Ended December 31, 2013 and 2012 and Cumulative Period Ended December 31, 2013
|
|
|
|
|
|
2013
|
|
2012
|
|
Amounts
accumulated during the development stage |
|
|||
|
CASH FLOWS FROM OPERATING ACTIVITIES
|
|
|
|
|
|
|
|
|
|
|
|
|
|
|
|
|
|
|
|
|
|
|
|
Consolidated net loss
|
|
$
|
(20,478,210)
|
|
$
|
(26,182,952)
|
|
$
|
(47,550,233)
|
|
|
Adjustments to reconcile consolidated net loss to net cash used in
operating activities: |
|
|
|
|
|
|
|
|
|
|
|
Stock compensation expense
|
|
|
5,203,148
|
|
|
3,422,182
|
|
|
8,711,824
|
|
|
Noncash stock expense associated with in-licensing
agreement |
|
|
—
|
|
|
16,578,000
|
|
|
16,875,000
|
|
|
Impairment of in-process research and development
|
|
|
2,797,600
|
|
|
1,104,700
|
|
|
3,902,300
|
|
|
Depreciation
|
|
|
1,127
|
|
|
235
|
|
|
1,362
|
|
|
Amortization of premiums on investment securities, net
|
|
|
975
|
|
|
—
|
|
|
975
|
|
|
Change in fair value and accrued interest of notes payable
|
|
|
(2,414,569)
|
|
|
(815,699)
|
|
|
(3,230,268)
|
|
|
Changes in assets and liabilities, net of effects of acquisition:
|
|
|
|
|
|
|
|
|
|
|
|
Decrease (increase) in other current assets
|
|
|
229,258
|
|
|
(1,932,710)
|
|
|
(1,699,859)
|
|
|
Increase in accrued interest receivable
|
|
|
(27,169)
|
|
|
—
|
|
|
(27,169)
|
|
|
Increase in other assets
|
|
|
(85,121)
|
|
|
—
|
|
|
(85,121)
|
|
|
Increase in accounts payable and accrued expenses
|
|
|
4,034,605
|
|
|
595,757
|
|
|
5,038,672
|
|
|
Increase in interest payable
|
|
|
66,506
|
|
|
61,571
|
|
|
135,174
|
|
|
(Decrease) increase in deferred revenue
|
|
|
(152,381)
|
|
|
1,980,952
|
|
|
1,828,571
|
|
|
Net cash used in operating activities
|
|
|
(10,824,231)
|
|
|
(5,187,964)
|
|
|
(16,098,772)
|
|
|
|
|
|
|
|
|
|
|
|
|
|
|
CASH FLOWS FROM INVESTING ACTIVITIES
|
|
|
|
|
|
|
|
|
|
|
|
|
|
|
|
|
|
|
|
|
|
|
|
Purchases of equipment
|
|
|
(5,681)
|
|
|
(1,399)
|
|
|
(7,080)
|
|
|
Investment in held-to-maturity long-term securities
|
|
|
(4,919,871)
|
|
|
—
|
|
|
(4,919,871)
|
|
|
Cash acquired in connection with acquisition
|
|
|
—
|
|
|
—
|
|
|
10,386
|
|
|
Net cash used in investing activities
|
|
|
(4,925,552)
|
|
|
(1,399)
|
|
|
(4,916,565)
|
|
|
|
|
|
|
|
|
|
|
|
|
|
|
CASH FLOWS FROM FINANCING ACTIVITIES
|
|
|
|
|
|
|
|
|
|
|
|
|
|
|
|
|
|
|
|
|
|
|
|
Proceeds from exercise of warrants
|
|
|
2,280,773
|
|
|
—
|
|
|
2,280,773
|
|
|
Payments of short-term loans
|
|
|
—
|
|
|
(200,001)
|
|
|
(200,001)
|
|
|
Proceeds from sale of common stock, net
|
|
|
37,648,280
|
|
|
—
|
|
|
47,472,962
|
|
|
Proceeds from sale of preferred stock, net
|
|
|
—
|
|
|
12,257,309
|
|
|
12,257,309
|
|
|
Offering costs paid
|
|
|
—
|
|
|
(75,903)
|
|
|
(75,903)
|
|
|
Purchase of treasury stock
|
|
|
(149,799)
|
|
|
(84,538)
|
|
|
(234,337)
|
|
|
Net cash provided by financing activities
|
|
|
39,779,254
|
|
|
11,896,867
|
|
|
61,500,803
|
|
|
|
|
|
|
|
|
|
|
|
|
|
|
NET INCREASE IN CASH AND CASH EQUIVALENTS
|
|
|
24,029,471
|
|
|
6,707,504
|
|
|
40,485,466
|
|
|
|
|
|
|
|
|
|
|
|
|
|
|
Cash and cash equivalents at beginning of period
|
|
|
16,455,995
|
|
|
9,748,491
|
|
|
—
|
|
|
|
|
|
|
|
|
|
|
|
|
|
|
CASH AND CASH EQUIVALENTS AT END OF PERIOD
|
|
$
|
40,485,466
|
|
$
|
16,455,995
|
|
$
|
40,485,466
|
|
|
|
|
|
|
|
|
|
|
|
|
|
|
NONCASH TRANSACTIONS
|
|
|
|
|
|
|
|
|
|
|
|
Conversion of notes payable to preferred stock
|
|
$
|
—
|
|
$
|
—
|
|
$
|
55,271
|
|
|
Accrued financing costs
|
|
$
|
—
|
|
$
|
—
|
|
$
|
61,138
|
|
The accompanying notes are an integral part of the consolidated financial statements.
| F-7 | ||
|
|
|
TG Therapeutics, Inc.
|
|
(a development stage company)
|
|
Notes to the Consolidated Financial Statements
|
|
|
Unless the context requires otherwise, references in this report to “TG,” “Company,” “we,” “us” and “our” refer to TG Therapeutics, Inc. and our subsidiaries.
DESCRIPTION OF BUSINESS
We are a biopharmaceutical company focused on the acquisition, development and commercialization of innovative and medically important pharmaceutical products for the treatment of cancer and other underserved therapeutic needs. We aim to acquire rights to these technologies by licensing or otherwise acquiring an ownership interest, funding their research and development and eventually either out-licensing or bringing the technologies to market. Currently, the Company is developing two therapies targeting hematological malignancies.
TG-1101 (ublituximab), is a novel,
glycoengineered
monoclonal antibody that targets a specific and unique epitope on the CD20 antigen found on mature B-lymphocytes
. We are also developing
TGR-1202, an orally available PI3K delta inhibitor. We also hold the development rights to AST-726, a nasally delivered product for the treatment of Vitamin B
12
deficiency.
Exchange Transaction with TG Therapeutics, Inc. and its majority shareholders
On December 29, 2011, the Company entered into and consummated an Exchange Transaction Agreement with Opus Point Partners, LLC (“Opus”) and TG Biologics, Inc. (formerly known as TG Therapeutics, Inc.) (“TG Bio”) (the “Agreement”). Under the Agreement, Opus exchanged (the “Exchange Transaction”) its shares of common stock in TG Bio (“TG Bio Common Stock”) for shares of Series A preferred stock in the Company (“Company Preferred Stock”). In accordance with the terms of the Agreement,
95
% of the holders of common stock of TG Bio (one (1) minority shareholder of TG Bio holding in aggregate
132,000
shares of common stock of TG Bio did not participate) surrendered their TG Bio common stock. The Agreement caused the Company to issue to TG Bio’s shareholders
281,250
shares of Company Preferred Stock.
Each share of Company Preferred Stock was convertible into
8.89
shares of the Common Stock provided that such conversion rights were subject to sufficient available authorized shares of Common Stock. In connection with the reverse stock split effected by the Company on April 30, 2012 (as discussed below), all shares of preferred stock issued in connection with the Agreement were converted to Common Stock.
The Company Preferred Stock issued in connection with the Agreement provided the former TG Bio shareholders with direct and/or indirect ownership of approximately
95
% of the Company’s outstanding Company Common Stock immediately following the consummation of the transaction.
Since the stockholders of TG Bio received the majority of the voting shares of the Company, the merger was accounted for as a reverse acquisition whereby TG Bio was the accounting acquirer (legal acquiree) and the Company was the accounting acquiree (legal acquirer) under the acquisition method of accounting. TG Bio was incorporated in Delaware in November 2010, but did not commence operations until April 2011.
The filings with the Securities and Exchange Commission (the “SEC”) include the historical financial results of TG Bio and will hereafter collectively be referred to as the Company.
On April 30, 2012, the Company filed a Certificate of Amendment to its Certificate of Incorporation to change its name from Manhattan Pharmaceuticals, Inc. (“Manhattan”) to TG Therapeutics, Inc. In conjunction with this change, the subsidiary formerly named TG Therapeutics, Inc. filed a Certificate of Amendment changing its name to TG Biologics, Inc.
LIQUIDITY AND CAPITAL RESOURCES
We have incurred operating losses since our inception, and expect to continue to incur operating losses for the foreseeable future and may never become profitable. As of December 31, 2013, we have an accumulated deficit of $
39,404,003
.
| F-8 | ||
|
|
|
TG Therapeutics, Inc.
|
|
(a development stage company)
|
|
Notes to the Consolidated Financial Statements
|
|
|
Our primary source of cash has been proceeds from the sale of equity securities,
the upfront payment from our Sublicense Agreement with Ildong Pharmaceutical Co. Ltd. (“Ildong”), and warrant exercises
. We have not yet commercialized any of our drug candidates and cannot be sure if we will ever be able to do so. Even if we commercialize one or more of our drug candidates, we may not become profitable. Our ability to achieve profitability depends on a number of factors, including our ability to obtain regulatory approval for our drug candidates, successfully complete any post-approval regulatory obligations and successfully commercialize our drug candidates alone or in partnership. We may continue to incur substantial operating losses even if we begin to generate revenues from our drug candidates.
As of December 31, 2013, we had $
45,431,532
in cash, cash equivalents, investment securities, and interest receivable. We currently anticipate that our cash and cash equivalents to be sufficient to fund our anticipated operating cash requirements for approximately
24
months from December 31, 2013. The actual amount of cash that we will need to operate is subject to many factors, including, but not limited to, the timing, design and conduct of clinical trials for our drug candidates. We are dependent upon significant future financing to provide the cash necessary to execute our current operations, including the commercialization of any of our drug candidates.
Our common stock is quoted on
the NASDAQ Capital Market
and trades under the symbol “TGTX.”
REVERSE STOCK SPLIT
On April 30, 2012, the Company effected a reverse split of its Common Stock at a
ratio of 56.25 for 1
, pursuant to a previously obtained stockholder authorization. All share amounts and per share prices in this Annual Report on Form 10-K have been retroactively adjusted to reflect the effect of our reverse stock split, on a fifty-six and one quarter (56.25) for one (1) basis, unless otherwise indicated. The exercise price for all stock options and warrants and the conversion price for convertible securities in the accompanying consolidated financial statements have been adjusted to reflect the reverse stock split by multiplying the original exercise or conversion price by fifty-six and one quarter (56.25).
RECENTLY ISSUED ACCOUNTING STANDARDS
In July 2013, the Financial Accounting Standards Board, or FASB, issued a new accounting standard which will require the presentation of certain unrecognized tax benefits as reductions to deferred tax assets rather than as liabilities in the consolidated balance sheets when a net operating loss carryforward, a similar tax loss, or a tax credit carryforward exists. The new standard requires adoption on a prospective basis in the first quarter of 2015; however, early adoption is permitted. The Company does not anticipate that this adoption will have a significant impact on its financial position, results of operations, or cash flows.
Other pronouncements issued by the FASB or other authoritative accounting standards group with future effective dates are either not applicable or not significant to the consolidated financial statements of the Company.
BASIS OF PRESENTATION
The Company has generated limited revenue from its operations and, accordingly, the financial statements have been prepared in accordance with the provisions of accounting and reporting for Development Stage Enterprises.
USE OF ESTIMATES
The preparation of financial statements in conformity with U.S. generally accepted accounting principles (“GAAP”) requires management to make estimates and judgments that affect the reported amounts of assets and liabilities and the disclosure of contingent assets and liabilities at the date of the financial statements and the reported amounts of revenues and expenses during the applicable reporting period. Actual results could differ from those estimates. Such differences could be material to the financial statements.
CASH AND CASH EQUIVALENTS
We treat liquid investments with original maturities of
less than three months
when purchased as cash and cash equivalents.
| F-9 | ||
|
|
|
TG Therapeutics, Inc.
|
|
(a development stage company)
|
|
Notes to the Consolidated Financial Statements
|
|
|
INVESTMENT SECURITIES
Investment securities at December 31, 2013 consist of long-term government securities. We classify our long-term debt securities as held-to-maturity. Held-to-maturity securities are those securities in which we have the ability and intent to hold the security until maturity. Held-to-maturity securities are recorded at amortized cost, adjusted for the amortization or accretion of premiums or discounts. Premiums and discounts are amortized or accreted over the life of the related held-to-maturity security as an adjustment to yield using the effective interest method.
A decline in the market value of any investment security below cost, that is deemed to be other than temporary, results in a reduction in the carrying amount to fair value. The impairment is charged to operations and a new cost basis for the security is established. Other-than-temporary impairment charges are included in interest and other income, net. Unrealized gains, if determined to be temporary, are included in accumulated other comprehensive income in stockholders’ equity. Dividend and interest income are recognized when earned.
REVENUE RECOGNITION
We recognize license revenue in accordance with the revenue recognition guidance of the FASB Accounting Standards Codification, or Codification. We analyze each element of our licensing agreement to determine the appropriate revenue recognition. The terms of the license agreement may include payments to us of non-refundable up-front license fees, milestone payments if specified objectives are achieved, and/or royalties on product sales. We recognize revenue from upfront payments over the period of significant involvement under the related agreements unless the fee is in exchange for products delivered or services rendered that represent the culmination of a separate earnings process and no further performance obligation exists under the contract. We recognize milestone payments as revenue upon the achievement of specified milestones only if (1) the milestone payment is non-refundable, (2) substantive effort is involved in achieving the milestone, (3) the amount of the milestone is reasonable in relation to the effort expended or the risk associated with achievement of the milestone, and (4) the milestone is at risk for both parties. If any of these conditions are not met, we defer the milestone payment and recognize it as revenue over the estimated period of performance under the contract.
RESEARCH AND DEVELOPMENT COSTS
Generally, research and development costs are expensed as incurred. Nonrefundable advance payments for goods or services that will be used or rendered for future research and development activities are deferred and amortized over the period that the goods are delivered or the related services are performed, subject to an assessment of recoverability. We make estimates of costs incurred in relation to external clinical research organizations, or CROs, and clinical site costs. We analyze the progress of clinical trials, including levels of patient enrollment, invoices received and contracted costs when evaluating the adequacy of the amount expensed and the related prepaid asset and accrued liability. Significant judgments and estimates must be made and used in determining the accrued balance and expense in any accounting period. We review and accrue CRO expenses and clinical trial study expenses based on work performed and rely upon estimates of those costs applicable to the stage of completion of a study. Accrued CRO costs are subject to revisions as such trials progress to completion. Revisions are charged to expense in the period in which the facts that give rise to the revision become known. With respect to clinical site costs, the financial terms of these agreements are subject to negotiation and vary from contract to contract. Payments under these contracts may be uneven, and depend on factors such as the achievement of certain events, the successful recruitment of patients, the completion of portions of the clinical trial or similar conditions. The objective of our policy is to match the recording of expenses in our financial statements to the actual services received and efforts expended. As such, expense accruals related to clinical site costs are recognized based on our estimate of the degree of completion of the event or events specified in the specific clinical study or trial contract.
| F-10 | ||
|
|
|
TG Therapeutics, Inc.
|
|
(a development stage company)
|
|
Notes to the Consolidated Financial Statements
|
|
|
IN-PROCESS RESEARCH AND DEVELOPMENT
All acquired research and development projects are recorded at their fair value as of the date acquisition. The fair values are assessed as of the balance sheet date to ascertain if there has been any impairment of the recorded value. If there is an impairment, the asset is written down to its current fair value by the recording of an expense. Impairment is tested on an annual basis
or sooner, if there is an indication of impairment,
and consists of a comparison of the fair value of the in-process research and development with its carrying amount.
INCOME TAXES
Income taxes are accounted for under the asset and liability method. Deferred tax assets and liabilities are recognized for the future tax consequences attributable to temporary differences between the financial statement carrying amounts of existing assets and liabilities and their respective tax bases, operating losses and tax credit carryforwards. Deferred tax assets and liabilities are measured using enacted tax rates expected to apply to taxable income in the years in which those temporary differences are expected to be recovered or settled. The effect on deferred tax assets and liabilities of a change in tax rates is recognized in operations in the period that includes the enactment date. If the likelihood of realizing the deferred tax assets or liability is less than “more likely than not,” a valuation allowance is then created.
We, and our subsidiaries, file income tax returns in the U.S. Federal jurisdiction and in various states. We have tax net operating loss carryforwards that are subject to examination for a number of years beyond the year in which they were generated for tax purposes. Since a portion of these net operating loss carryforwards may be utilized in the future, many of these net operating loss carryforwards will remain subject to examination.
We recognize interest and penalties related to uncertain income tax positions in income tax expense.
STOCK - BASED COMPENSATION
We recognize all share-based payments to employees and to non-employee directors as compensation for service as compensation expense in the consolidated financial statements based on the fair values of such payments. Stock-based compensation expense recognized each period is based on the value of the portion of share-based payment awards that is ultimately expected to vest during the period. Forfeitures are estimated at the time of grant and revised, if necessary, in subsequent periods if actual forfeitures differ from those estimates.
For share-based payments to consultants and other third-parties, compensation expense is determined at the “measurement date.” The expense is recognized over the vesting period of the award. Until the measurement date is reached, the total amount of compensation expense remains uncertain. We record compensation expense based on the fair value of the award at the reporting date. The awards to consultants and other third-parties are then revalued, or the total compensation is recalculated based on the then current fair value, at each subsequent reporting date.
BASIC AND DILUTED NET (LOSS) INCOME PER COMMON SHARE
Basic net income (loss) per common share is calculated by dividing net income (loss) applicable to common shares by the weighted-average number of common shares outstanding for the period. Diluted net loss per common share is the same as basic net income (loss) per common share, since potentially dilutive securities from stock options, stock warrants and convertible preferred stock would have an antidilutive effect either because the Company incurred a net loss during the period presented or because such potentially dilutive securities were out of the money and the Company realized net income during the period presented. The amounts of potentially dilutive securities excluded from the calculation were
10,618,584
and
10,746,837
at December 31, 2013 and 2012, respectively. During the years ended December 31, 2013 and 2012 the Company incurred a net loss, therefore, all of the dilutive securities are excluded from the computation of diluted earnings per share.
LONG-LIVED ASSETS AND GOODWILL
Long-lived assets are reviewed for an impairment loss when circumstances indicate that the carrying value of long-lived tangible and intangible assets with finite lives may not be recoverable. Management’s policy in determining whether an impairment indicator exists, a triggering event, comprises measurable operating performance criteria as well as qualitative measures. If an analysis is necessitated by the occurrence of a triggering event, we make certain assumptions in determining the impairment amount. If the carrying amount of an asset exceeds its estimated future cash flows, an impairment charge is recognized.
| F-11 | ||
|
|
|
TG Therapeutics, Inc.
|
|
(a development stage company)
|
|
Notes to the Consolidated Financial Statements
|
|
|
Goodwill is reviewed for impairment annually, or when events arise that could indicate that an impairment exists. We test for goodwill impairment using a two-step process. The first step compares the fair value of the reporting unit with the unit's carrying value, including goodwill. When the carrying value of the reporting unit is greater than fair value, the unit’s goodwill may be impaired, and the second step must be completed to measure the amount of the goodwill impairment charge, if any. In the second step, the implied fair value of the reporting unit’s goodwill is compared with the carrying amount of the unit’s goodwill. If the carrying amount is greater than the implied fair value, the carrying value of the goodwill must be written down to its implied fair value. We will continue to perform impairment tests annually, at December 31, and whenever events or changes in circumstances suggest that the carrying value of an asset may not be recoverable.
|
|
|
December 31, 2013
|
|
December 31, 2012
|
|
||
|
|
|
|
|
|
|
|
|
|
Money market funds
|
|
$
|
554,069
|
|
$
|
500,007
|
|
|
Checking and bank deposits
|
|
|
39,931,397
|
|
|
15,955,988
|
|
|
Total
|
|
$
|
40,485,466
|
|
$
|
16,455,995
|
|
We record our investments as either held-to-maturity or available-for-sale. Held-to-maturity investments are recorded at amortized cost.
We were not invested in investment securities at December 31, 2012. The following tables summarize our investment securities at December 31, 2013:
|
|
|
December 31, 2013
|
|
||||||||||
|
|
|
Amortized cost,
as adjusted |
|
Gross
unrealized holding gains |
|
Gross
unrealized holding losses |
|
Estimated
fair value |
|
||||
|
Long-term investments:
|
|
|
|
|
|
|
|
|
|
|
|
|
|
|
Obligations of domestic governmental agencies
(maturing between January 2015 and April 2015) (held-to-maturity) |
|
$
|
4,918,897
|
|
$
|
—
|
|
$
|
650
|
|
$
|
4,918,247
|
|
|
Total long-term investment securities
|
|
$
|
4,918,897
|
|
$
|
—
|
|
$
|
650
|
|
$
|
4,918,247
|
|
NOTE 4
– FAIR VALUE MEASUREMENTS
We measure certain financial assets and liabilities at fair value on a recurring basis in the financial statements. The fair value hierarchy ranks the quality and reliability of inputs, or assumptions, used in the determination of fair value and requires financial assets and liabilities carried at fair value to be classified and disclosed in one of the following three categories:
|
|
⋅
|
Level 1 – quoted prices in active markets for identical assets and liabilities;
|
|
|
⋅
|
Level 2 – inputs other than Level 1 quoted prices that are directly or indirectly observable; and
|
|
|
⋅
|
Level 3 – unobservable inputs that are not corroborated by market data.
|
As of December 31, 2013 and 2012, the fair values of cash and cash equivalents, and notes and interest payable, current portion approximate their carrying value.
| F-12 | ||
|
|
|
TG Therapeutics, Inc.
|
|
(a development stage company)
|
|
Notes to the Consolidated Financial Statements
|
|
|
Upon the merger between Manhattan and Ariston Pharmaceuticals, Inc. (“Ariston”) in March 2010, Ariston issued $
15,452,793
of five-year
5
% notes payable (the “5% Notes”) in satisfaction of several note payable issuances. The 5% Notes and accrued and unpaid interest thereon are convertible at the option of the holder into Common Stock at the conversion price of $
1,125
per share. Ariston agreed to make quarterly payments on the 5% Notes equal to
50
% of the net product cash flow received from the exploitation or commercialization of Ariston’s product candidates, AST-726 and AST-915. The Company has no obligations under the 5% Notes aside from a) 50% of the net product cash flows from Ariston’s product candidates, if any, payable to noteholders; and b) the conversion feature, discussed above.
In connection with the Exchange Transaction in December 2011, the Company performed a valuation of the assets and liabilities of Manhattan immediately prior to the transaction.
The cumulative liability including accrued and unpaid interest of these notes was approximately $
16,876,000
immediately prior to the Exchange Transaction, and $
18,614,000
and $
17,727,000
at December 31, 2013 and 2012, respectively.
As these notes payable are tied directly to net product cash flows derived from the preexisting products of the Company, this note and accrued interest was recorded at fair value of $
3,287,700
as of the date of the Exchange Transaction. No payments have been made on these notes as of December 31, 2013.
We elected the fair value option for valuing the
5
% Notes upon the completion of the reverse merger with TG Bio, as discussed above. The Company elected the fair value option in order to reflect in our financial statements the assumptions that market participants use in evaluating these financial instruments.
For the year ended December 31, 2012, the valuation method used to estimate the 5% Notes’ fair value was a discounted cash flow model, where the expected cash flows of AST-726 and AST-915 were discounted to the present using a yield that incorporated compensation for the probability of success in clinical development and marketing, among other factors. The discount rate used in this discounted cash flow model approximated
20
% at December 31, 2012. As of December 31, 2013, as a result of expiring intellectual property rights and other factors as discussed below in Nonrecurring Fair Value Measurements, it was determined that net product cash flows from AST-726 were unlikely. As the Company has no other obligations under the 5% Notes aside from the net product cash flows and the conversion feature, the conversion feature was used to estimate the 5% Notes’ fair value as of December 31, 2013. The assumptions, assessments and projections of future revenues are subject to uncertainties, are difficult to predict and require significant judgment. The use of different assumptions, applying different judgment to inherently subjective matters and changes in future market conditions could result in significantly different estimates of fair value and the differences could be material to our consolidated financial statements.
The Company’s financial liabilities measured at fair value on a recurring basis as of December 31, 2013 and 2012 were as follows:
|
|
|
|
Financial liabilities at fair value
as of December 31, 2013 |
|
||||||||||
|
|
|
|
Level 1
|
|
Level 2
|
|
Level 3
|
|
Total
|
|
||||
|
|
|
|
|
|
|
|
|
|
|
|
|
|
|
|
|
5% Notes
|
|
|
$
|
—
|
|
$
|
—
|
|
$
|
64,529
|
|
$
|
64,529
|
|
|
Totals
|
|
|
$
|
—
|
|
$
|
—
|
|
$
|
64,529
|
|
$
|
64,529
|
|
|
|
|
Financial liabilities at fair value
as of December 31, 2012 |
|||||||||||
|
|
|
Level 1
|
|
Level 2
|
|
Level 3
|
|
Total
|
|
||||
|
|
|
|
|
|
|
|
|
|
|
|
|
|
|
|
5% Notes
|
|
$
|
—
|
|
$
|
—
|
|
$
|
2,479,098
|
|
$
|
2,479,098
|
|
|
Totals
|
|
$
|
—
|
|
$
|
—
|
|
$
|
2,479,098
|
|
$
|
2,479,098
|
|
The Level 3 amounts above represent the fair value of the
5
% Notes and related accrued interest.
| F-13 | ||
|
|
|
TG Therapeutics, Inc.
|
|
(a development stage company)
|
|
Notes to the Consolidated Financial Statements
|
|
|
The following table summarizes the changes in Level 3 instruments for the years ended December 31, 2012 and 2013:
|
Balance at January 1, 2012
|
|
$
|
3,294,797
|
|
|
Interest accrued on face value of 5% Notes
|
|
|
844,173
|
|
|
Change in fair value of Level 3 liabilities
|
|
|
(1,659,872)
|
|
|
Balance at December 31, 2012
|
|
|
2,479,098
|
|
|
Interest accrued on face value of 5% Notes
|
|
|
886,382
|
|
|
Change in fair value of Level 3 liabilities
|
|
|
(3,300,951)
|
|
|
Balance at December 31, 2013
|
|
$
|
64,529
|
|
The change in the fair value of the Level 3 liabilities is reported in other (income) expense in the accompanying consolidated statements of operations.
Nonrecurring Fair Value Measurements
The Company’s assets measured at fair value on a nonrecurring basis as of December 31, 2013 and 2012 were as follows:
|
|
|
Fair value measurements
as of December 31, 2013 |
|
|
Total impairment charge for the year ended
|
|
|||||||
|
|
|
Level 1
|
|
Level 2
|
|
Level 3
|
|
|
December 31, 2013
|
|
|||
|
Assets:
|
|
|
|
|
|
|
|
|
|
|
|
|
|
|
In-process research and development
|
|
$
|
—
|
|
$
|
—
|
|
$
|
—
|
|
$
|
(2,797,600)
|
|
|
Total
|
|
$
|
—
|
|
$
|
—
|
|
$
|
—
|
|
$
|
(2,797,600)
|
|
|
|
|
Fair value measurements
as of December 31, 2012 |
|
|
Total impairment charge for the year ended
|
|
|||||||
|
|
|
Level 1
|
|
Level 2
|
|
Level 3
|
|
|
December 31, 2012
|
|
|||
|
Assets:
|
|
|
|
|
|
|
|
|
|
|
|
|
|
|
In-process research and development
|
|
$
|
—
|
|
$
|
—
|
|
$
|
2,797,600
|
|
$
|
(1,104,700)
|
|
|
Total
|
|
$
|
—
|
|
$
|
—
|
|
$
|
2,797,600
|
|
$
|
(1,104,700)
|
|
As of December 31, 2013, as a result of expiring intellectual property rights, uncertain regulatory pathways, and market changes affecting the commercial potential for the Ariston in-process research and development asset (AST-726), the Company determined that the asset's carrying value was no longer recoverable. Accordingly, during the year ended December 31, 2013, we recorded a non-cash impairment charge of $
2,797,600
, which was recorded as impairment of in-process research and development in our consolidated statements of operations. The fair value of this asset was determined to be zero primarily as a result of the expiring intellectual property rights surrounding the asset. This fair value measurement technique is based on significant inputs not observable in the market and thus represents a Level 3 measurement within the fair value hierarchy.
As of December 31, 2012, as a result of market changes affecting the commercial potential for the Ariston in-process research and development assets (AST-726 and AST-915), the Company determined that the asset's carrying value was no longer fully recoverable. Accordingly, during the year ended December 31, 2012, we recorded a non-cash impairment charge of $
1,104,700
, which was recorded as impairment of in-process research and development in our consolidated statements of operations. The fair value of this asset was determined using a discounted cash flow model, where the expected cash flows of the Ariston assets are discounted to the present using a yield that incorporates compensation for the probability of success in clinical development and marketing, among other factors. This fair value measurement technique is based on significant inputs not observable in the market and thus represents a Level 3 measurement within the fair value hierarchy. Also contributing to the impairment charge recorded during the period ended December 31, 2012 was the Company’s decision during 2012 to discontinue future development activities for AST-915, following the analysis from a Phase I dose escalation trial, in which AST-915 failed to meet its primary efficacy endpoint.
| F-14 | ||
|
|
|
TG Therapeutics, Inc.
|
(a development stage company)
Notes to the Consolidated Financial Statements
Preferred Stock
Our amended and restated certificate of incorporation authorizes the issuance of up to
10,000,000
shares of preferred stock, $
0.001
par value, with rights senior to those of our common stock,
issuable in one or more series. Upon issuance, the Company can determine the rights, preferences, privileges and restrictions thereof. These rights, preferences and privileges could include dividend rights, conversion rights, voting rights, terms of redemption, liquidation preferences, sinking fund terms and the number of shares constituting any series or the designation of such series, any or all of which may be greater than the rights of common stock.
Common Stock
Our amended and restated certificate of incorporation authorizes the issuance of up to
500,000,000
shares of $
0.001
par value common stock.
On December 30, 2011, we
completed the first closing of the private placement of our securities, issuing
4,929,523
shares of Common Stock at a price per share of $
2.25
for total gross proceeds, before placement commissions and expenses, of $
11,091,425
(the “2011 Equity PIPE”). Investors also received warrants to purchase
1,232,381
shares of Common Stock. The warrants have an exercise price of $
2.25
per share and are exercisable for five years.
In 2012, we completed two additional closings of the 2011 Equity PIPE. These closings were held on January 31, 2012, and February 24, 2012. In these closings, the Company issued
695,428
shares of our Company Preferred Stock at a price per share of $
20.00
for total gross proceeds, before placement commissions and expenses, of $
13,908,560
. Each share of Company Preferred Stock was convertible into
8.89
shares of Common Stock; provided that such conversion rights were subject to sufficient available authorized shares of Common Stock. In connection with the reverse stock split effected by the Company on April 30, 2012, all shares of Preferred Stock issued in the 2011 Equity PIPE were converted to Common Stock. Investors also received warrants to purchase
1,545,396
shares of Common Stock. The warrants have an exercise price of $
2.25
per share and are exercisable for five years. The shares of Company Preferred Stock and warrants sold in these closings were offered and sold to accredited investors, including members of management, without registration under the Securities Act, or state securities laws, in reliance on the exemptions provided by Section 4(2) of the Securities Act, and Regulation D promulgated thereunder and in reliance on similar exemptions under applicable state laws. Accordingly, the securities issued in the offering have not been registered under the Securities Act, and until so registered, these securities may not be offered or sold in the United States absent registration or availability of an applicable exemption from registration.
On July 18, 2013, we announced the pricing of an underwritten public offering of
5,700,000
shares of our Common Stock at a price of $
6.15
per share for gross proceeds of approximately $
35
million. We also granted to the underwriters a 30-day option to acquire an additional
855,000
shares to cover overallotments in connection with the offering. Total net proceeds from this offering, including the overallotment, were approximately $
37.6
million, net of underwriting discounts and offering expenses of approximately $
2.7
million. The shares were sold under a shelf registration statement on Form S-3 (File No. 333-189015) that was previously filed and declared effective by the SEC on June 17, 2013.
We currently have one shelf registration statement on Form S-3 filed and declared effective by the SEC (File No. 333-189015). Subsequent to the July 2013 offering, this shelf registration statement provides for the offering of up to approximately $
135
million of common stock. We may offer the securities under our shelf registration statement from time to time in response to market conditions or other circumstances if we believe such a plan of financing is in the best interests of our stockholders. We believe that this shelf registration statement provides us with the flexibility to raise additional capital to finance our operations as needed.
| F-15 | ||
|
|
|
TG Therapeutics, Inc.
|
|
(a development stage company)
|
|
Notes to the Consolidated Financial Statements
|
|
|
Treasury Stock
As of December 31, 2013,
41,309
shares of common stock are being held by the Company in Treasury, at a cost of approximately $
234,000
, representing the fair market value on the date the shares were surrendered
to the Company to satisfy employee tax obligations
.
Equity Incentive Plans
We have in effect the following stock option and incentive plans.
a
. The Company has shareholder-approved incentive stock option plans for employees under which it has granted non-qualified and incentive stock options, which provided for the granting of options to purchase up to
5,333
shares of the Company’s common stock. The options have a maximum term of
10
years and vest over a period determined by the Company’s Board of Directors. At December 31, 2013, options to purchase
591
shares were outstanding,
10
shares of common stock were issued and there were no shares reserved for future grants under the Plan.
b
. In May 2012, the Company established the TG Therapeutics, Inc. Amended and Restated 2012 Incentive Plan (“2012 Incentive Plan”). Under the 2012 Incentive Plan, the compensation committee of the Company’s board of directors is authorized to grant stock-based awards to directors, consultants, employees and officers. The 2012 Incentive Plan authorizes grants to purchase up to
6,000,000
shares of authorized but unissued common stock. As of December 31, 2013, options to purchase
46,000
shares were outstanding and up to an additional
1,107,793
shares may be issued under the 2012 Incentive Plan.
Stock Options
The following table summarizes stock option activity for the years ended December 31, 2013 and 2012:
|
|
|
Number
of shares |
|
Weighted-
average exercise price |
|
Weighted-
average Contractual Term |
|
Aggregate Intrinsic
Value |
|
||
|
|
|
|
|
|
|
|
(in years)
|
|
|
|
|
|
Outstanding at January 1, 2012
|
|
3,379
|
|
$
|
1,315.62
|
|
|
|
|
|
|
|
Granted
|
|
46,000
|
|
|
4.40
|
|
|
|
|
|
|
|
Exercised
|
|
—
|
|
|
—
|
|
|
|
|
|
|
|
Forfeited
|
|
(2,475)
|
|
|
720.45
|
|
|
|
|
|
|
|
Expired
|
|
—
|
|
|
—
|
|
|
|
|
|
|
|
Outstanding at December 31, 2012
|
|
46,904
|
|
|
61.08
|
|
9.44
|
|
$
|
—
|
|
|
Granted
|
|
—
|
|
|
—
|
|
|
|
|
|
|
|
Exercised
|
|
—
|
|
|
—
|
|
|
|
|
|
|
|
Forfeited
|
|
(313)
|
|
|
2,249.85
|
|
|
|
|
|
|
|
Expired
|
|
—
|
|
|
—
|
|
|
|
|
|
|
|
Outstanding at December 31, 2013
|
|
46,591
|
|
$
|
46.37
|
|
8.50
|
|
$
|
—
|
|
|
|
|
|
|
|
|
|
|
|
|
|
|
|
Vested and expected to vest at December 31, 2013
|
|
9,591
|
|
$
|
208.30
|
|
8.16
|
|
$
|
—
|
|
|
Exercisable at December 31, 2013
|
|
9,591
|
|
$
|
208.30
|
|
8.16
|
|
$
|
—
|
|
| F-16 | ||
|
|
|
TG Therapeutics, Inc.
|
|
(a development stage company)
|
|
Notes to the Consolidated Financial Statements
|
|
|
As of December 31, 2013, there is no unrecognized compensation cost related to unvested time-based option awards. This amount does not include, as of December 31, 2013,
37,000
non-employee options outstanding which are milestone-based and vest upon certain corporate milestones. Stock-based compensation will be measured and recorded if and when a milestone occurs.
Restricted Stock- Preferred
Certain employees had been awarded restricted preferred stock. The restricted stock vesting consisted of milestone and time-based vesting. The following table summarizes restricted share activity for the years ended December 31, 2013 and 2012:
|
|
|
Number of Shares
Restricted Series A Preferred Stock (1) |
|
Weighted
Average Grant Date Fair Value |
|
|
|
Outstanding at January 1, 2012
|
|
129,375
|
|
$
|
20.00
|
|
|
Granted
|
|
—
|
|
|
—
|
|
|
Vested
|
|
—
|
|
|
—
|
|
|
Forfeited
|
|
—
|
|
|
—
|
|
|
Conversion to restricted common stock
|
|
(129,375)
|
|
|
20.00
|
|
|
Outstanding at December 31, 2012
|
|
—
|
|
|
—
|
|
|
Granted
|
|
—
|
|
|
—
|
|
|
Vested
|
|
—
|
|
|
—
|
|
|
Forfeited
|
|
—
|
|
|
—
|
|
|
Outstanding at December 31, 2013
|
|
—
|
|
$
|
—
|
|
(
1)
The restricted preferred stock listed in the table above was granted in connection with the Exchange Transaction to certain executives. Each share of preferred stock was convertible into
8.89
shares of the Company’s Common Stock. In conjunction with the reverse split effected on April 30, 2012 (as discussed in Note 1), all outstanding restricted Preferred Stock automatically converted to
1,150,000
shares of restricted Common Stock as of that date.
Restricted Stock- Common
Certain employees, directors and consultants have been awarded restricted Company Common Stock. The restricted stock vesting consists of milestone and time-based vesting. The following table summarizes restricted share activity for the years ended December 31, 2013 and 2012:
|
|
|
Number of Shares
|
|
Weighted
Average Grant Date Fair Value |
|
|
|
Outstanding at January 1, 2012
|
|
—
|
|
$
|
—
|
|
|
Converted preferred stock
|
|
1,150,000
|
|
|
2.25
|
|
|
Granted
|
|
5,901,743
|
|
|
4.77
|
|
|
Vested
|
|
(437,500)
|
|
|
2.25
|
|
|
Forfeited
|
|
—
|
|
|
—
|
|
|
Outstanding at December 31, 2012
|
|
6,614,243
|
|
|
4.49
|
|
|
Granted
|
|
944,464
|
|
|
4.13
|
|
|
Vested
|
|
(523,750)
|
|
|
2.48
|
|
|
Forfeited
|
|
—
|
|
|
—
|
|
|
Outstanding at December 31, 2013
|
|
7,034,957
|
|
$
|
4.60
|
|
Total expense associated with restricted stock grants was $
5,146,743
and $
3,422,182
during the years ended December 31, 2013 and 2012, respectively. As of December 31, 2013, there was approximately $
7,977,072
of total unrecognized compensation cost related to unvested time based restricted stock, which is expected to be recognized over a weighted-average period of
1.9
years. This amount does not include, as of December 31, 2013,
1,800,960
shares of restricted stock outstanding which are milestone-based and vest upon certain corporate milestones; and
2,556,375
shares of restricted stock outstanding issued to non-employees (see Note 10 – Related Party Transactions for additional information). Milestone based non-cash compensation expense will be measured and recorded if and when a milestone occurs.
| F-17 | ||
|
|
|
TG Therapeutics, Inc.
|
|
(a development stage company)
|
|
Notes to the Consolidated Financial Statements
|
|
|
Warrants
The following table summarizes warrant activity for the years ended December 31, 2013 and 2012:
|
|
|
Warrants
|
|
Weighted-
average exercise price |
|
Aggregate
Intrinsic Value |
|
||
|
Outstanding at January 1, 2012
|
|
1,625,911
|
|
|
5.27
|
|
$
|
—
|
|
|
Issued
|
|
5,156,599
|
|
|
1.21
|
|
|
|
|
|
Exercised
|
|
—
|
|
|
—
|
|
|
|
|
|
Expired
|
|
(1,503)
|
|
|
2,739.75
|
|
|
|
|
|
Outstanding at December 31, 2012
|
|
6,781,007
|
|
|
1.58
|
|
$
|
14,563,539
|
|
|
Issued
|
|
—
|
|
|
—
|
|
|
|
|
|
Exercised
|
|
(1,018,068)
|
|
|
2.25
|
|
|
|
|
|
Expired
|
|
(43,992)
|
|
|
16.26
|
|
|
|
|
|
Outstanding at December 31, 2013
|
|
5,718,947
|
|
$
|
1.34
|
|
$
|
14,809,030
|
|
As discussed above, as part of the 2011 Equity PIPE, we issued warrants to purchase up to
2,777,962
shares of our common stock at an exercise price of $
2.25
per warrant share,
757,096
of which have been exercised as of December 31, 2013. In addition, we issued to the placement agent in the transaction warrants to purchase up to
1,111,111
shares of our common stock at an exercise price of $
2.48
per warrant share,
6,533
of which have been exercised as of December 31, 2013.
In connection with the Securities Exchange Agreement between the Company and LFB Group as discussed in Note 8 – License Agreements, we issued LFB Group a warrant to purchase an aggregate of
2,500,000
shares of Company Common Stock at a purchase price of $
0.001
per share.
Stock-Based Compensation
The fair value of stock options granted is estimated at the date of grant using the Black-Scholes pricing model. The expected term of options granted is derived from historical data and the expected vesting period. Expected volatility is based on the historical volatility of our common stock. The risk-free interest rate is based on the U.S. Treasury yield for a period consistent with the expected term of the option in effect at the time of the grant. We have assumed no expected dividend yield, as dividends have never been paid to stock or option holders and will not be paid for the foreseeable future. The Company did not grant any stock options during the year-ended December 31, 2013.
The following table summarizes stock-based compensation expense information about stock options and restricted stock for the years ended December 31, 2013 and 2012:
|
|
|
2013
|
|
2012
|
|
||
|
Stock-based compensation expense associated with restricted stock
|
|
$
|
5,146,743
|
|
$
|
3,422,182
|
|
|
Stock-based compensation expense associated with option grants
|
|
|
56,405
|
|
|
—
|
|
|
|
|
$
|
5,203,148
|
|
$
|
3,422,182
|
|
| F-18 | ||
|
|
|
TG Therapeutics, Inc.
|
|
(a development stage company)
|
|
Notes to the Consolidated Financial Statements
|
|
|
Non-controlling Interest
On November 9, 2012, LFB Group exercised their right to exchange their TG Bio common stock for Company Common Stock. The Company and LFB Group entered into a Securities Exchange Agreement pursuant to which, LFB Group agreed to exchange its
7,500,000
shares of the common stock of TG Bio, for
5,000,000
shares of Company Common Stock, and a warrant to purchase an aggregate of
2,500,000
shares of Company Common Stock at a purchase price of $
0.001
per share. Refer to
Note 8 – License Agreements for further information.
Accordingly, in connection with the aforementioned Securities Exchange Agreement, TG Bio became a wholly owned subsidiary of the Company. Prior to the execution of the Securities Exchange Agreement LFB Group owned approximately
42.9
% of TG Bio. The non-controlling interest in subsidiary balance was approximately $
8,479,000
immediately prior to LFB Group exercising their option, which was transferred to equity in connection with the transaction.
The following is a summary of notes payable:
|
|
|
December 31, 2013
|
|
December 31, 2012
|
|
||||||||||||||
|
|
|
Current
portion, net |
|
Non-current
portion, net |
|
Total
|
|
Current
portion, net |
|
Non-current
portion, net |
|
Total
|
|
||||||
|
Convertible 5% Notes Payable
|
|
$
|
-
|
|
$
|
64,529
|
|
$
|
64,529
|
|
$
|
-
|
|
$
|
2,479,098
|
|
$
|
2,479,098
|
|
|
ICON Convertible Note
|
|
|
677,778
|
|
|
-
|
|
|
677,778
|
|
|
677,778
|
|
|
-
|
|
|
677,778
|
|
|
Totals
|
|
$
|
677,778
|
|
$
|
64,529
|
|
$
|
742,307
|
|
$
|
677,778
|
|
$
|
2,479,098
|
|
$
|
3,156,876
|
|
We assumed the preceding notes payable as the result of the Exchange Transaction between the Company and TG Therapeutics, Inc. Accordingly, a valuation using the guidance in the accounting literature for business combinations (ASC 805) was performed and these notes have been presented at their fair value on the date of the transaction.
Convertible 5% Notes Payable
On March 8, 2010, Manhattan entered into an Agreement and Plan of Merger (the "Merger Agreement") by and among the Company, Ariston and Ariston Merger Corp., a Delaware corporation and wholly-owned subsidiary of the Company (the "Merger Sub"). Pursuant to the terms and conditions set forth in the Merger Agreement, on March 8, 2010, the Merger Sub merged with and into Ariston (the "Merger"), with Ariston being the surviving corporation of the Merger. As a result of the Merger, Ariston became a wholly-owned subsidiary of Manhattan.
The 5% Notes and accrued and unpaid interest thereon are convertible at the option of the holder into Common Stock at the conversion price of $
1,125
per share. Ariston agreed to make quarterly payments on the
5
% Notes equal to
50
% of the net product cash flow received from the exploitation or commercialization of Ariston’s product candidates, AST-726 and AST-915.
The Company has no obligations under the
5
% Notes aside from a) 50% of the net product cash flows from Ariston’s product candidates, if any, payable to noteholders; and b) the conversion feature, discussed above.
Interest accrues monthly, is added to principal on an annual basis, every March 8, and is payable at maturity, which is
March 8, 2015
.
In connection with the Exchange Transaction in December 2011, the Company performed a valuation of the assets and liabilities of Manhattan immediately prior to the transaction.
The cumulative liability including accrued and unpaid interest of these notes was approximately $
16,876,000
immediately prior to the Exchange Transaction, and $
18,614,000
and $
17,727,000
at December 31, 2013 and 2012, respectively.
As these notes payable are tied directly to net product cash flows derived from the preexisting products of the Company, this note and accrued interest was recorded at fair value of $
3,287,700
as of the date of the Exchange Transaction. No payments have been made on these notes as of December 31, 2013. See Note 4 for further details.
| F-19 | ||
|
|
|
TG Therapeutics, Inc.
|
|
(a development stage company)
|
|
Notes to the Consolidated Financial Statements
|
|
|
ICON Convertible Note Payable
In connection with the merger with Ariston as discussed above, Ariston satisfied an account payable of $
1,275,188
to ICON Clinical Research Limited (“ICON”) through the payment of $
275,188
in cash and the issuance of a three-year
5
% note payable (the “ICON Note”). The principal was to be repaid in
36 monthly
installments of $
27,778
commencing in April 2010. Interest was payable monthly in arrears. On March 1, 2011 Ariston entered into an amended and restated convertible promissory note (the “Amended ICON Note”) with ICON. The principal terms of the Amended ICON Note are that monthly payments of principal and interest will be waived for the thirteen month period ended December 31, 2011 (the “Waiver Period”) in exchange for a single payment of $
100,000
on March 31, 2011, an increase in the interest on the Amended ICON Note from
5
% to
8
% per annum during the Waiver Period and a balloon payment on January 31, 2012. The Amended ICON Note is convertible at the option of the holder into the Company’s common stock at the conversion price of $
562.50
per share. During the year ended December 31, 2013, the Company recorded $
66,506
of interest expense on the Amended ICON Note. As of December 31, 2013 and 2012, the principal amount of the Amended ICON Note was $
677,778
, of which the entire balance has been classified as current and is reflected as notes payable, current portion, net in the accompanying consolidated balance sheets. Interest payable on the Amended ICON Note was $
190,017
and $
123,511
as of December 31, 2013 and 2012, respectively, and is reflected as interest payable in the accompanying consolidated balance sheets. As of December 31, 2013, this note was in default as the Company did not make the balloon payment due on January 31, 2012, or any subsequent payments. In January 2014, the Company entered into a settlement and release agreement with ICON related to this note, whereby the Company paid $
772,369
in full settlement of the principal and interest due on this note.
We account for income taxes under the asset and liability method. Deferred tax assets and liabilities are determined based on differences between the financial reporting and tax basis of assets and liabilities and are measured using the enacted tax rates and laws that will be in effect when the differences are expected to reverse. A valuation allowance is established when necessary to reduce deferred tax assets to the amount expected to be realized. In determining the need for a valuation allowance, management reviews both positive and negative evidence, including current and historical results of operations, future income projections and the overall prospects of our business. Based upon management's assessment of all available evidence, we believe that it is more-likely-than-not that the deferred tax assets will not be realizable, and therefore, a valuation allowance has been established. The valuation allowance for deferred tax assets was approximately $
46,283,000
and $
36,271,000
as of December 31, 2013 and 2012, respectively.
As of December 31, 2013, we have U.S. net operating loss carryforwards (“NOLs”) of approximately $
84,182,000
. For income tax purposes, these NOLs will expire in various amounts through
2033
. The Tax Reform Act of 1986 contains provisions which limit the ability to utilize net operating loss carryforwards in the case of certain events including significant changes in ownership interests. The Exchange Transaction with TG Bio may have resulted in a “change in ownership” as defined by IRC Section 382 of the Internal Revenue Code of 1986, as amended. Accordingly, a substantial portion of the Company’s NOLs above may be subject to annual limitations in reducing any future year’s taxable income.
The tax effects of temporary differences that give rise to significant portions of the deferred tax assets and deferred tax liabilities at December 31, 2013 and 2012 are presented below.
|
|
|
2013
|
|
2012
|
|
||
|
Deferred tax assets (liabilities):
|
|
|
|
|
|
|
|
|
Net operating loss carryforwards
|
|
$
|
32,399,879
|
|
$
|
32,190,080
|
|
|
Research and development credit
|
|
|
2,266,167
|
|
|
1,882,238
|
|
|
Noncash compensation
|
|
|
10,971,912
|
|
|
3,051,920
|
|
|
Acquired in-process research and development
|
|
|
—
|
|
|
(1,202,556)
|
|
|
Foreign tax credit
|
|
|
—
|
|
|
330,000
|
|
|
Other
|
|
|
644,899
|
|
|
19,241
|
|
|
Deferred tax asset, excluding valuation allowance
|
|
|
46,282,857
|
|
|
36,270,923
|
|
|
|
|
|
|
|
|
|
|
|
Less valuation allowance
|
|
|
(46,282,857)
|
|
|
(36,270,923)
|
|
|
Net deferred tax assets
|
|
$
|
—
|
|
$
|
—
|
|
| F-20 | ||
|
|
|
TG Therapeutics, Inc.
|
|
(a development stage company)
|
|
Notes to the Consolidated Financial Statements
|
|
|
There was no current or deferred income tax expense for the year ended December 31, 2013. The Company recorded $
330,000
in income tax expense for the year ended December 31, 2012, as a result of South Korean taxes withheld associated with the Ildong sublicense agreement (see Note 8). Income tax expense differed from amounts computed by applying the US Federal income tax rate of
34
% to pretax loss as follows:
|
|
|
For the year ended December 31,
|
|
||||
|
|
|
2013
|
|
2012
|
|
||
|
|
|
|
|
|
|
|
|
|
Loss before income taxes, as reported in the consolidated statements
of operations |
|
$
|
(20,478,210)
|
|
$
|
(25,852,952)
|
|
|
|
|
|
|
|
|
|
|
|
Computed “expected” tax benefit
|
|
$
|
(6,962,592)
|
|
$
|
(8,790,003)
|
|
|
|
|
|
|
|
|
|
|
|
Increase (decrease) in income taxes resulting from:
|
|
|
|
|
|
|
|
|
Expected benefit from state and local taxes
|
|
|
(917,810)
|
|
|
(1,758,001)
|
|
|
Research and development credits
|
|
|
(250,000)
|
|
|
(75,000)
|
|
|
Other
|
|
|
43,026
|
|
|
230,643
|
|
|
Permanent difference related to contingent note payable
|
|
|
(1,924,558)
|
|
|
—
|
|
|
Foreign tax withholding
|
|
|
—
|
|
|
330,000
|
|
|
Change in the balance of the valuation allowance for deferred tax
assets |
|
|
10,011,934
|
|
|
10,392,361
|
|
|
|
|
$
|
—
|
|
$
|
330,000
|
|
We file income tax returns in the U.S Federal and various state and local jurisdictions. With certain exceptions, the Company is no longer subject to U.S. Federal and state income tax examinations by tax authorities for years prior to 2010. However, NOLs and tax credits generated from those prior years could still be adjusted upon audit.
The Company recognizes interest and penalties to uncertain tax position in income tax expense in the statement of operations. There was no accrual for interest and penalties related to uncertain tax positions for 2013. We do not believe that there will be a material change in our unrecognized tax positions over the next twelve months. All of the unrecognized tax benefits, if recognized, would be offset by the valuation allowance.
TG-1101
On January 30, 2012, TG Bio
entered into an exclusive license agreement with LFB Biotechnologies, GTC Biotherapeutics and LFB/GTC LLC, all wholly-owned subsidiaries of LFB Group, relating to the development of TG-1101 (the “License Agreement”)
.
Under the License Agreement, we acquired the exclusive worldwide rights (exclusive of France/Belgium) for the development and commercialization of TG-1101 (ublituximab). To date, we have made no payments to LFB Group, who is eligible to receive payments of up to an aggregate of approximately $
31.0
million upon our successful achievement of certain clinical development, regulatory and sales milestones, in addition to royalty payments on net sales of TG-1101.
The license will terminate on a country by country basis upon the expiration of the last licensed patent right or 15 years after the first commercial sale of a product in such country, unless the agreement is earlier terminated.
In connection with the License Agreement, our subsidiary TG Bio issued
7,368,000
shares of its common stock to LFB Group, and the Company agreed to contribute $
15
million, less applicable fees and expenses associated with the financing, to TG Bio to fund the development of TG-1101 under the License Agreement in exchange for
7,500,000
shares of TG Bio common stock. The Company recognized $
16,578,000
of noncash research and development expense during the year ended December 31, 2012 in connection with the issuance of these shares. In addition, in connection with this share issuance, the Company and TG Bio provided LFB Group the option to, in its sole discretion, elect to convert its shares of TG Bio common stock into
7,500,000
shares of the Company’s Common Stock. Furthermore, should LFB Group choose to exercise the option for Company Common Stock, the Board of Directors of the Company shall appoint an individual designated by LFB Group to serve as a director of the Company until the next annual meeting of the stockholders and until his or her successor has been duly elected. Thereafter
the Board of Directors of the Company shall nominate a designee named by LFB Group for election at each annual meeting of the stockholders until such time as LFB Group owns less than 10% of the outstanding Company Common Stock.
| F-21 | ||
|
|
|
TG Therapeutics, Inc.
|
|
(a development stage company)
|
|
Notes to the Consolidated Financial Statements
|
|
|
On November 9, 2012, LFB Group exercised their right to exchange their TG Bio common stock for Company Common Stock. The Company and LFB Group entered into a Securities Exchange Agreement pursuant to which, LFB Group agreed to exchange its
7,500,000
shares of the common stock of TG Bio, for
5,000,000
shares of Company Common Stock, and a warrant to purchase an aggregate of
2,500,000
shares of Company Common Stock at a purchase price of $
0.001
per share. In addition, upon the occurrence of certain financing conditions, the Securities Exchange Agreement requires LFB Group to purchase at least $
750,000
in additional shares of Company Common Stock at a purchase price per share equal to the then current Market Price (as defined therein). In addition on November 9, 2012, in connection with the Securities Exchange Agreement, the Board of Directors (the “Board”) of the Company appointed Dr. Yann Echelard to the Board as LFB Group’s nominee. Effective November 9, 2012, in connection with the aforementioned Securities Exchange Agreement, TG Bio became a wholly owned subsidiary of the Company.
TG-1101 – Ildong Sublicense
In November 2012, we entered into an exclusive (within the territory) sublicense agreement with Ildong relating to the development and commercialization of TG-1101 in South Korea and Southeast Asia. Under the terms of the sublicense agreement, Ildong has been granted a royalty bearing, exclusive right, including the right to grant sublicenses, to develop and commercialize TG-1101 in South Korea, Taiwan, Singapore, Indonesia, Malaysia, Thailand, Philippines, Vietnam, and Myanmar.
An upfront payment of $
2,000,000
, which was received in December 2012,
net of $
330,000
of income tax withheld
, is being recognized as license revenue on a straight-line basis over the life of the agreement, which is through the expiration of the last licensed patent right or 15 years after the first commercial sale of a product in such country, unless the agreement is earlier terminated, and represents the estimated period over which the Company will have certain ongoing responsibilities under the sublicense agreement. The Company recorded license revenue of approximately $
152,000
and $
19,000
for the years ended December 31, 2013 and 2012, respectively, and, at December 31, 2013 and 2012, has deferred revenue of approximately $
1,829,000
and $
1,981,000
, respectively, associated with this $
2,000,000
payment (approximately $152,000 of which has been classified as a current liability at December 31, 2013).
The Company may receive up to an additional $
5.0
million in payments upon the achievement of pre-specified milestones. In addition, upon commercialization, Ildong will make royalty payments to the Company on net sales of TG-1101 in the sublicense territory.
TGR-1202
On August 15, 2012, the Company and Rhizen Pharmaceuticals S A (“Rhizen”) entered into an exclusive global agreement to collaborate on the development and commercialization of Rhizen’s lead product candidate (the “Collaboration Agreement”), a novel P13K delta inhibitor, (“TGR-1202”) (previously referred to as RP5264). The companies will jointly develop the product on a worldwide basis, excluding India, initially focusing on indications in the area of hematologic malignancies and autoimmune disease. Beyond TGR-1202, Rhizen would contribute backup molecules providing multiple opportunities for TG to develop differentiated therapies against hematologic cancers and autoimmune diseases.
The Company will make up-front licensing payments and milestones based on early clinical development, and will be responsible for the costs of clinical development of the product through Phase II, after which the Company and Rhizen will be jointly responsible for all development costs of the product. The Company and Rhizen will each maintain an exclusive option, exercisable at specific times during development, for the Company to license the rights to TGR-1202, in which case Rhizen would be eligible to receive upfront, development, and commercialization milestone payments in addition to milestone payments and royalties tied to net sales of the product, the aggregate of which could exceed $
182.5
million. Rhizen shall maintain rights to manufacture and supply the product to the Company, and the Company will be responsible for all clinical and regulatory development for TGR-1202 globally.
| F-22 | ||
|
|
|
TG Therapeutics, Inc.
|
|
(a development stage company)
|
|
Notes to the Consolidated Financial Statements
|
|
|
In connection with the Collaboration Agreement, the Company incurred upfront milestone payments of $
1,000,000
during the year ended December 31, 2012. During the year ended December 31, 2013, the Company recognized a $
2,000,000
milestone payment to Rhizen related to the
development of TGR-1202. All milestone payments related to this agreement have been included in other research and development expenses in the accompanying consolidated financial statements.
Pursuant to the terms of the Collaboration Agreement, should either of the exclusive license options be exercised, Rhizen would be eligible to receive up to an aggregate of $
182.5
million upon the successful achievement of certain clinical development, regulatory, and sales based milestones in addition to royalties on net sales of TGR-1202.
On April 19, 2011, H Pharmaceuticals K/S (the “Hedrin JV”), of which the Company was a
15
% limited partner at the time, filed a demand for arbitration against Thornton & Ross, LTD. (“T&R”) with respect to alleged breaches by T&R of an Exclusive License Agreement (the “Hedrin License”) dated June 28, 2007, which was originally entered into between the Company and T&R, and which the Company assigned in 2008 to the Hedrin JV, with T&R’s consent. The Hedrin JV is seeking damages from T&R in the amount of approximately $
7,000,000
. The Company was not a party to the initial arbitration demand.
On May 20, 2011, T&R filed an answer to the arbitration demand in which T&R asserted counterclaims against the Hedrin JV for alleged breaches by the Hedrin JV of the Hedrin License and for declaratory relief that the Hedrin License was properly terminated by T&R. In addition, T&R impleaded an individual (who is not associated with the Company), Nordic Biotech Venture Fund II K/S (an investment fund) and the Company, demanding arbitration against them based on alleged breaches of the Hedrin License and other related claims. In December 2011, the Company was removed by the arbitrator as a party to the arbitration. T&R is seeking damages of approximately $
20,000,000
.
The Hedrin JV and T&R held a mediation session in order to avoid the arbitration process. The mediation process did not produce a result. During 2011, Nordic made an additional capital contribution to the Hedrin JV in order to fund the arbitration. As a result of that capital contribution, as of December 31, 2011, the Company owned a
13
% interest in the Hedrin JV, and no further information has been available since that date. The arbitration process is ongoing.
On December 30, 2011, OPN Capital Markets (“OPNCM”) and its affiliated broker-dealer, National Securities Corporation (“NSC” and collectively with OPNCM, “National”), both affiliates of National Holdings Corporation (“National Holdings”), entered into a Placement Agency Agreement (the “PAA”) with the Company in connection with the initial closing of the 2011 Equity PIPE. Pursuant to the PAA, National acted as the Company’s placement agent for 2011 Equity PIPE.
Until April 2012, Michael S. Weiss was a director and Non-Executive Chairman of the Board of Directors of National Holdings. He is also a stockholder of National Holdings and, when combined with his ownership indirectly through Opus and its affiliates, beneficially owns approximately
5
% of National Holdings, the parent company of NSC. Mr. Weiss disclaims such beneficial ownership other than to the extent of his pecuniary interest. In addition, at the time, Opus and NSC were parties to a 50/50 joint venture that shared profits from OPNCM, the investment banking division of NSC that was responsible for managing the Offering. This joint venture was dissolved in April 2012.
As placement agent, National received cash commissions equal to
10
% of the gross proceeds of the 2011 Equity PIPE, five-year warrants to purchase shares of Company Preferred Stock equal to
10
% of shares sold in the 2011 Equity PIPE, and a non-accountable expense allowance equal to two percent of the gross proceeds of the 2011 Equity PIPE for National’s expenses (not including up to $
80,000
of National’s legal expenses and any blue sky fees, both of which the Company also reimbursed). In connection with the dissolution of the joint venture in January 2013, National waived all rights to and surrendered to Opus the warrants discussed above. In addition to acting as placement agent, National provided advisory services in connection with the Exchange Transaction and received an advisory fee of $
150,000
for such services.
| F-23 | ||
|
|
|
TG Therapeutics, Inc.
|
|
(a development stage company)
|
|
Notes to the Consolidated Financial Statements
|
|
|
Under the terms of the Company’s License Agreement with LFB Group, the Company utilizes LFB Group for certain development and manufacturing services.
The Company incurred approximately $
6,267,000
and $
1,447,000
in such expenses during the years ended December 31, 2013 and 2012, respectively, which have been included in other research and development expenses in the accompanying consolidated statements of operations. As of December 31, 2013 and 2012, respectively, the Company has approximately $
1,745,000
and $
56,000
recorded in accounts payable related to the aforementioned agreements with LFB Group. In conjunction with the development and manufacturing services discussed above, certain agreements between the Company and LFB Group require payments in advance of services performed or goods delivered.
Accordingly, as of December 31, 2013 and 2012, respectively, the Company recorded $
1,629,340
and $
1,719,828
in prepaid research and development for such advance payments.
In connection with the Collaboration Agreement with Rhizen in August 2012, the Company issued Opus
2,000,000
shares of Company common stock subject to certain vesting provisions based on the progress of the joint venture and future success of the products governed by the Collaboration Agreement. The issuance of the Company Common Stock was exempt from registration under the Securities Act of 1933 pursuant to Regulation D and Rule 506 promulgated thereunder. Accordingly, the securities have not been registered under the Securities Act, and until so registered, these securities may not be offered or sold in the United States absent registration or availability of an applicable exemption from registration. The Company recognized approximately $
437,000
and $
134,000
of noncash compensation (research and development) expense during the year ended December 31, 2013 and 2012, respectively, in connection with the issuance of these shares.
| F-24 | ||
|
|
SIGNATURES
Pursuant to the requirements of Section 13 or 15(d) of the Securities Exchange Act of 1934, the registrant has duly caused this report to be signed on its behalf by the undersigned, thereunto duly authorized.
Date:
March 7, 2014
|
|
TG THERAPEUTICS, INC. |
|
|
|
|
|
|
|
By:
|
/s/ Michael S. Weiss
|
|
|
|
Michael S. Weiss
|
|
|
|
Executive Chairman, Interim Chief Executive Officer and President
|
POWER OF ATTORNEY
KNOW ALL MEN BY THESE PRESENTS, that each person whose signature appears below constitutes and appoints each of Michael S. Weiss and Sean A. Power, his true and lawful attorney-in-fact and agent, with full power of substitution and resubstitution, for him and his name, place and stead, in any and all capacities, to sign any or all amendments to this annual report on Form 10-K, and to file the same, with all exhibits thereto and other documents in connection therewith, with the SEC, granting unto said attorney-in-fact and agent, full power and authority to do and perform each and every act and thing requisite and necessary to be done in and about the premises, as fully to all intents and purposes as he might or could do in person, hereby ratifying and confirming all that said attorney-in-fact and agent or any of his substitutes, may lawfully do or cause to be done by virtue hereof.
Pursuant to the requirements of the Securities Exchange Act of 1934, as amended, this Form 10-K has been signed by the following persons on behalf of the Registrant on March 7, 2014, and in the capacities indicated:
|
Signatures
|
|
Title
|
|
|
|
|
|
/s/ Michael S. Weiss
|
|
Executive Chairman, Interim Chief Executive Officer and President
|
|
Michael S. Weiss
|
|
(principal executive officer)
|
|
|
|
|
|
/s/ Sean A. Power
|
|
Chief Financial Officer
|
|
Sean A. Power
|
|
(principal financial and accounting officer)
|
|
|
|
|
|
/s/ Laurence N. Charney
|
|
Director
|
|
Laurence N. Charney
|
|
|
|
|
|
|
|
/s/ Yann Echelard
|
|
Director
|
|
Yann Echelard
|
|
|
|
|
|
|
|
/s/ Neil Herskowitz
|
|
Director
|
|
Neil Herskowitz
|
|
|
|
|
|
|
|
/s/ William J. Kennedy
|
|
Director
|
|
William J. Kennedy
|
|
|
|
|
|
|
|
/s/ Mark Schoenebaum, M.D.
|
|
Director
|
|
Mark Schoenebaum, M.D.
|
|
|
| 46 | ||
|
|
EXHIBIT INDEX
|
Exhibit
|
|
|
|
Number
|
|
Exhibit Description
|
|
|
|
|
|
23.1
|
|
Consent of Independent Registered Public Accounting Firm
|
|
|
|
|
|
31.1
|
|
Certification of Principal Executive Officer
|
|
|
|
|
|
31.2
|
|
Certification of Principal Financial Officer
|
|
|
|
|
|
32.1
|
|
Certification of Chief Executive Officer pursuant to Section 906 of the Sarbanes-Oxley Act of 2002
|
|
|
|
|
|
32.2
|
|
Certification of Chief Financial Officer pursuant to Section 906 of the Sarbanes-Oxley Act of 2002
|
TABLE OF CONTENTS
Part IItem 1. BusinessItem 1A. Risk FactorsItem 2. PropertiesItem 3. Legal ProceedingsItem 4. Mine Safety DisclosuresPart IIItem 5. Market For Registrant S Common Equity, Related Stockholder Matters and Issuer Purchases Of Equity SecuritiesItem 7. Management S Discussion and Analysis Of Financial Condition and Results Of OperationsItem 8. Financial Statements and Supplementary DataItem 9. Changes in and Disagreements with Accountants on Accounting andItem 9A. Controls and ProceduresItem 9B. Other InformationPart IIIItem 10. Directors, Executive Officers and Corporate GovernanceItem 11. Executive CompensationItem 12. Security Ownership Of Certain Beneficial Owners and Management and Related Stockholder MattersItem 13. Certain Relationships and Related Transactions, and Director IndependenceItem 14. Principal Accountant Fees and ServicesPart IVItem 15. Exhibits and Financial Statement SchedulesNote 1 - Organization and Summary Of Significant Accounting PoliciesNote 2 Cash and Cash EquivalentsNote 2 Cash and Cash EquivaleNote 3 Investment SecuritiesNote 4 Fair Value MeasurementsNote 5 Stockholders EquityNote 8 License Agreements For Further InformationNote 6 Notes PayableNote 7 Income TaxesNote 8 License AgreementsNote 9 Joint VentureNote 10 Related Party Transactions