TENET HEALTHCARE CORP
10-Ks and 10-Qs
|
|
|
|
|
|
|
|
|
|
|
|
|
|
|
|
|
|
|
|
|
|
|
|
|
|
|
|
|
|
|
|
|
|
|
|
|
|
|
|
|
|
|
|
|
|
|
|
|
|
|
|
|
|
|
|
|
|
|
|
|
UNITED STATES
SECURITIES AND EXCHANGE COMMISSION
Washington, DC 20549
Form 10-K
x
Annual report pursuant to Section 13 or 15(d) of the Securities Exchange Act of 1934 for the fiscal year ended December 31, 2017
OR
¨
Transition report pursuant to Section 13 or 15(d) of the Securities Exchange Act of 1934 for the transition period from to
Commission File Number 1-7293
________________________________________
_
TENET HEALTHCARE CORPORATION
(
Exact name of Registrant as specified in its charter)
|
Nevada
|
|
95-2557091
|
|
(State of Incorporation)
|
|
(IRS Employer Identification No.)
|
1445 Ross Avenue, Suite 1400
Dallas, TX 75202
(Address of principal executive offices, including zip code)
(469) 893-2200
(Registrant’s telephone number, including area code)
________________________________________________________
Securities registered pursuant to Section 12(b) of the Act:
|
Title of each class
|
|
Name of each exchange on which registered
|
|
Common stock, $0.05 par value
|
|
New York Stock Exchange
|
|
6.875% Senior Notes due 2031
|
|
New York Stock Exchange
|
Securities registered pursuant to Section 12(g) of the Act:
None
________________________________________________________
Indicate by check mark if the Registrant is a well-known seasoned issuer, as defined in Rule 405 of the Securities Act. Yes
x
No
¨
Indicate by check mark if the Registrant is not required to file reports pursuant to Section 13 or Section 15(d) of the Exchange Act. Yes
¨
No
x
Indicate by check mark whether the Registrant (1) has filed all reports required to be filed by Section 13 or 15(d) of the Exchange Act during the preceding 12 months, and (2) has been subject to such filing requirements for the past 90 days. Yes
x
No
¨
Indicate by check mark whether the Registrant has submitted electronically and posted on its corporate website every Interactive Data File required to be submitted and posted pursuant to Rule 405 of Regulation S-T during the preceding 12 months. Yes
x
No
¨
Indicate by check mark if disclosure of delinquent filers pursuant to Item 405 of Regulation S-K is not contained herein, and will not be contained, to the best of the Registrant’s knowledge, in definitive proxy or information statements incorporated by reference in Part III of this Form 10-K or any amendment to this Form 10-K.
x
Indicate by check mark whether the Registrant is a large accelerated filer, an accelerated filer, a non-accelerated filer, a smaller reporting company or an emerging growth company (each as defined in Exchange Act Rule 12b-2).
|
Large accelerated filer
x
Accelerated filer
¨
|
Non-accelerated filer
¨
|
|||
|
Smaller reporting company
¨
|
Emerging growth company
¨
|
|||
If an emerging growth company, indicate by check mark if the Registrant has elected not to use the extended transition period for complying with any new or revised financial accounting standards pursuant to Section 13(a) of the Exchange Act. ☐
Indicate by check mark whether the Registrant is a shell company (as defined in Exchange Act Rule 12b-2). Yes
☐
No ☒
As of June 30, 2017, the aggregate market value of the shares of common stock held by non-affiliates of the Registrant (treating directors, executive officers who were SEC reporting persons, and holders of 10% or more of the common stock outstanding as of that date, for this purpose, as affiliates) was approximately $1.3 billion based on the closing price of the Registrant’s shares on the New York Stock Exchange on that day. As of January 31, 2018, there were 101,107,955 shares of common stock outstanding.
DOCUMENTS INCORPORATED BY REFERENCE
Portions of the Registrant’s definitive proxy statement for the 2018 annual meeting of shareholders are incorporated by reference into Part III of this Form 10-K.
|
|
|
|
|
|
TABLE OF CONTENTS
|
Page
|
|
|
|
|
|
|
|
|
|
|
||
|
|
||
|
|
||
|
|
||
|
|
|
|
|
|
||
|
|
|
|
|
|
||
|
|
||
i
OVERVIEW
Tenet Healthcare Corporation (together with our subsidiaries, referred to herein as “Tenet,” “we” or “us”) is a diversified healthcare services company. We operate regionally focused, integrated healthcare delivery networks, primarily in large urban and suburban markets in the United States. At
December 31, 2017
, we operated 76 hospitals (two of which we have since divested), 20 surgical hospitals and over 470 outpatient centers in the United States, as well as nine facilities in the United Kingdom, through our subsidiaries, partnerships and joint ventures, including USPI Holding Company, Inc. (“USPI joint venture”). In addition, our Conifer Holdings, Inc. (“Conifer”) subsidiary provides healthcare business process services in the areas of hospital and physician revenue cycle management and value-based care solutions to healthcare systems, as well as individual hospitals, physician practices, self-insured organizations, health plans and other entities. For financial reporting purposes, our business lines are classified into three separate reportable operating segments – Hospital Operations and other, Ambulatory Care and Conifer. Additional information about our business segments is provided below and in Note 20 to the accompanying Consolidated Financial Statements; financial and statistical data for the segments can be found in Item 7, Management’s Discussion and Analysis of Financial Condition and Results of Operations, of Part II of this report.
The healthcare industry, in general, and the acute care hospital business, in particular, have been experiencing significant regulatory uncertainty based, in large part, on legislative and administrative efforts to significantly modify or repeal and potentially replace the Patient Protection and Affordable Care Act, as amended by the Health Care and Education Reconciliation Act of 2010 (“Affordable Care Act” or “ACA”). Although it is difficult to predict the full impact of this regulatory uncertainty on our future revenues and operations, we believe that our strategies discussed in detail in Item 7, Management’s Discussion and Analysis of Financial Condition and Results of Operations, of Part II of this report will help us to address the following trends shaping the demand for healthcare services: (1) consumers, employers and insurers are actively seeking lower-cost solutions and better value as they focus more on healthcare spending; (2) patient volumes are shifting from inpatient to outpatient settings due to technological advancements and demand for care that is more convenient, affordable and accessible; (3) the industry is migrating to value-based payment models with government and private payers shifting risk to providers; and (4) consolidation continues across the entire healthcare sector. Our ability to execute on our strategies and manage these trends is subject to a number of risks and uncertainties that may cause actual results to be materially different from expectations. For information about risks and uncertainties that could affect our results of operations, see the Forward-Looking Statements and Risk Factors sections in Part I of this report.
Over the past several years, and with the aforementioned trends in mind, we have taken a number of steps to better position Tenet to compete more effectively in the ever-evolving healthcare environment. We have (1) set competitive prices for our services, (2) directed capital and other investments in our facilities and technology toward high-acuity inpatient service lines, (3) increased our efforts to recruit and retain quality physicians, nurses and other healthcare personnel, (4) significantly increased our outpatient footprint through our USPI joint venture, (5) negotiated competitive contracts with managed care and other private payers, and (6) increased the participation of our hospitals in accountable care organizations. We have also entered into joint ventures with other healthcare providers in several of our markets to maximize effectiveness, reduce costs and build clinically integrated networks that provide quality services across the care continuum.
We have recently completed a number of hospital projects in Florida, Michigan and Texas, including our 106-bed teaching hospital in El Paso, which opened in January 2017. In addition, we opened 11 new outpatient centers in the year ended December 31, 2017, and we acquired eight outpatient businesses. We are also continuing our strategy of selling assets in non-core markets. We have announced definitive agreements to sell, transfer or otherwise divest our interests in eight hospitals we owned or operated at December 31, 2017, and we have since completed the sale of two of the eight hospitals. We intend to continue to further refine our portfolio of hospitals and other healthcare facilities when we believe such refinements will help us improve profitability, allocate capital more effectively in areas where we have a stronger presence, deploy proceeds on higher-return investments across our business, enhance cash generation and lower our ratio of debt-to-Adjusted EBITDA. In late 2017, we announced additional actions to support our goals of improving financial performance and enhancing shareholder value, including a significant cost-reduction program, an ongoing board refreshment process intended to provide the mix of skills and experience necessary for Tenet’s directors to maximize the future value of the Company, and the exploration of a potential sale of Conifer.
1
OPERATIONS
HOSPITAL OPERATIONS AND OTHER SEGMENT
Hospitals, Ancillary Outpatient Facilities and Related Businesses—
At
December 31, 2017
, our subsidiaries operated 76 hospitals, including two children’s hospitals, two specialty hospitals and one critical access hospital, serving primarily urban and suburban communities in 12 states. (Following the sale of our Philadelphia-area hospitals and related operations effective January 11, 2018, our subsidiaries operated 74 hospitals in 11 states.) Our subsidiaries had sole ownership of 61 of the hospitals we owned at
December 31, 2017
, 13 were owned or leased by entities that are, in turn, jointly owned by a Tenet subsidiary and a healthcare system partner or group of physicians, and two were owned by third parties and leased by our wholly owned subsidiaries. Our Hospital Operations and other segment also included 167 outpatient centers at December 31, 2017, the majority of which are freestanding urgent care centers, provider-based diagnostic imaging centers, satellite emergency departments and provider-based ambulatory surgery centers. In addition, at December 31, 2017, our subsidiaries owned or leased and operated: a number of medical office buildings, all of which were located on, or nearby, our hospital campuses; over 675 physician practices; accountable care organizations and clinically integrated networks; and other ancillary healthcare businesses.
Our Hospital Operations and other segment generated approximately
82%
,
83%
and
87%
of our consolidated net operating revenues, net of intercompany eliminations, for the years ended
December 31, 2017
, 2016 and 2015, respectively. Factors that affect patient volumes and, thereby, the results of operations at our hospitals and related healthcare facilities include, but are not limited to: (1) changes in federal and state healthcare regulations; (2) the business environment, economic conditions and demographics of local communities in which we operate; (3) the number of uninsured and underinsured individuals in local communities treated at our hospitals; (4) seasonal cycles of illness; (5) climate and weather conditions; (6) physician recruitment, retention and attrition; (7) advances in technology and treatments that reduce length of stay; (8) local healthcare competitors; (9) managed care contract negotiations or terminations; (10) the number of patients with high-deductible health insurance plans; (11) hospital performance data on quality measures and patient satisfaction, as well as standard charges for services; (12) any unfavorable publicity about us, or our joint venture partners, that impacts our relationships with physicians and patients; and (13) the timing of elective procedures.
Each of our general hospitals offers acute care services, operating and recovery rooms, radiology services, respiratory therapy services, clinical laboratories and pharmacies; in addition, most have intensive care, critical care and/or coronary care units, physical therapy, and orthopedic, oncology and outpatient services. Many of our hospitals provide tertiary care services, such as cardiothoracic surgery, neonatal intensive care and neurosurgery, and some also offer quaternary care in areas such as heart, liver, kidney and bone marrow transplants. Our children’s hospital provides tertiary and quaternary pediatric services, including organ and bone marrow transplants, as well as burn services. Moreover, a number of our hospitals offer advanced treatment options for patients, including limb-salvaging vascular procedures, acute level 1 trauma services, comprehensive intravascular stroke care, minimally invasive cardiac valve replacement, cutting edge imaging technology, and telemedicine access for selected medical specialties.
Each of our hospitals (other than our critical access hospital) is accredited by The Joint Commission. With such accreditation, our hospitals are deemed to meet the Medicare Conditions of Participation and are eligible to participate in government-sponsored provider programs, such as the Medicare and Medicaid programs. Although our critical access hospital has not sought to be accredited, it also participates in the Medicare and Medicaid programs by otherwise meeting the Medicare Conditions of Participation.
2
The table below lists, by state, the hospitals wholly owned, operated as part of a joint venture, or leased and operated by our wholly owned subsidiaries at December 31, 2017:
|
Hospital
|
Location
|
Licensed
Beds
|
Status
|
||||
|
Alabama
|
|||||||
|
Brookwood Baptist Medical Center
(1)
|
Birmingham
|
607
|
|
JV/Owned
|
|||
|
Citizens Baptist Medical Center
(1)(2)
|
Talladega
|
122
|
|
JV/Leased
|
|||
|
Princeton Baptist Medical Center
(1)(2)
|
Birmingham
|
505
|
|
JV/Leased
|
|||
|
Shelby Baptist Medical Center
(1)(2)
|
Alabaster
|
252
|
|
JV/Leased
|
|||
|
Walker Baptist Medical Center
(1)(2)
|
Jasper
|
267
|
|
JV/Leased
|
|||
|
|
|
|
|||||
|
Arizona
|
|||||||
|
Abrazo Arizona Heart Hospital
(3)
|
Phoenix
|
59
|
|
Owned
|
|||
|
Abrazo Arrowhead Campus
|
Glendale
|
217
|
|
Owned
|
|||
|
Abrazo Central Campus
|
Phoenix
|
221
|
|
Owned
|
|||
|
Abrazo Scottsdale Campus
|
Phoenix
|
136
|
|
Owned
|
|||
|
Abrazo West Campus
|
Goodyear
|
188
|
|
Owned
|
|||
|
Holy Cross Hospital
(4)(5)
|
Nogales
|
25
|
|
JV/Owned
|
|||
|
St. Joseph’s Hospital
(
4)
|
Tucson
|
486
|
|
JV/Owned
|
|||
|
St. Mary’s Hospital
(4)
|
Tucson
|
400
|
|
JV/Owned
|
|||
|
California
|
|
|
|
|
|||
|
Desert Regional Medical Center
(6)
|
Palm Springs
|
385
|
|
Leased
|
|||
|
Doctors Hospital of Manteca
|
Manteca
|
73
|
|
Owned
|
|||
|
Doctors Medical Center
|
Modesto
|
461
|
|
Owned
|
|||
|
Emanuel Medical Center
|
Turlock
|
209
|
|
Owned
|
|||
|
Fountain Valley Regional Hospital and Medical Center
|
Fountain Valley
|
400
|
|
Owned
|
|||
|
Hi-Desert Medical Center
(7)
|
Joshua Tree
|
179
|
|
Leased
|
|||
|
John F. Kennedy Memorial Hospital
|
Indio
|
145
|
|
Owned
|
|||
|
Lakewood Regional Medical Center
|
Lakewood
|
172
|
|
Owned
|
|||
|
Los Alamitos Medical Center
|
Los Alamitos
|
163
|
|
Owned
|
|||
|
Placentia Linda Hospital
|
Placentia
|
114
|
|
Owned
|
|||
|
San Ramon Regional Medical Center
(8)
|
San Ramon
|
123
|
|
JV/Owned
|
|||
|
Sierra Vista Regional Medical Center
|
San Luis Obispo
|
164
|
|
Owned
|
|||
|
Twin Cities Community Hospital
|
Templeton
|
122
|
|
Owned
|
|||
|
Florida
|
|
|
|
|
|||
|
Coral Gables Hospital
|
Coral Gables
|
245
|
|
Owned
|
|||
|
Delray Medical Center
|
Delray Beach
|
536
|
|
Owned
|
|||
|
Florida Medical Center – a campus of North Shore
|
Lauderdale Lakes
|
459
|
|
Owned
|
|||
|
Good Samaritan Medical Center
|
West Palm Beach
|
333
|
|
Owned
|
|||
|
Hialeah Hospital
|
Hialeah
|
378
|
|
Owned
|
|||
|
North Shore Medical Center
|
Miami
|
337
|
|
Owned
|
|||
|
Palm Beach Gardens Medical Center
|
Palm Beach Gardens
|
199
|
|
Owned
|
|||
|
Palmetto General Hospital
|
Hialeah
|
368
|
|
Owned
|
|||
|
St. Mary’s Medical Center
|
West Palm Beach
|
460
|
|
Owned
|
|||
|
West Boca Medical Center
|
Boca Raton
|
195
|
|
Owned
|
|||
|
Illinois
|
|
|
|
|
|||
|
Louis A. Weiss Memorial Hospital
|
Chicago
|
236
|
|
Owned
|
|||
|
MacNeal Hospital
(9)
|
Berwyn
|
368
|
|
Owned
|
|||
|
Westlake Hospital
|
Melrose Park
|
230
|
|
Owned
|
|||
|
West Suburban Medical Center
|
Oak Park
|
234
|
|
Owned
|
|||
|
Massachusetts
|
|
|
|
|
|||
|
MetroWest Medical Center – Framingham Union Campus
|
Framingham
|
147
|
|
Owned
|
|||
|
MetroWest Medical Center – Leonard Morse Campus
|
Natick
|
160
|
|
Owned
|
|||
|
Saint Vincent Hospital
|
Worcester
|
283
|
|
Owned
|
|||
3
|
Hospital
|
Location
|
Licensed
Beds
|
Status
|
||||
|
Michigan
|
|
|
|
|
|||
|
Children’s Hospital of Michigan
|
Detroit
|
228
|
|
Owned
|
|||
|
Detroit Receiving Hospital
|
Detroit
|
273
|
|
Owned
|
|||
|
Harper University Hospital
|
Detroit
|
470
|
|
Owned
|
|||
|
Huron Valley-Sinai Hospital
|
Commerce Township
|
158
|
|
Owned
|
|||
|
Hutzel Women’s Hospital
|
Detroit
|
114
|
|
Owned
|
|||
|
Rehabilitation Institute of Michigan
(3)
|
Detroit
|
69
|
|
Owned
|
|||
|
Sinai-Grace Hospital
|
Detroit
|
404
|
|
Owned
|
|||
|
Missouri
|
|
|
|
|
|||
|
Des Peres Hospital
(9)
|
St. Louis
|
143
|
|
Owned
|
|||
|
Pennsylvania
|
|
|
|
|
|||
|
Hahnemann University Hospital
(10)
|
Philadelphia
|
496
|
|
Owned
|
|||
|
St. Christopher’s Hospital for Children
(10)
|
Philadelphia
|
188
|
|
Owned
|
|||
|
South Carolina
|
|
|
|
|
|||
|
Coastal Carolina Hospital
|
Hardeeville
|
41
|
|
Owned
|
|||
|
East Cooper Medical Center
|
Mount Pleasant
|
140
|
|
Owned
|
|||
|
Hilton Head Hospital
|
Hilton Head
|
93
|
|
Owned
|
|||
|
Piedmont Medical Center
|
Rock Hill
|
288
|
|
Owned
|
|||
|
Tennessee
|
|
|
|
|
|||
|
Saint Francis Hospital
|
Memphis
|
479
|
|
Owned
|
|||
|
Saint Francis Hospital – Bartlett
|
Bartlett
|
196
|
|
Owned
|
|||
|
Texas
|
|
|
|
|
|||
|
Baptist Medical Center
|
San Antonio
|
623
|
|
Owned
|
|||
|
Baylor Scott & White Medical Center – Centennial
(11)(12)(13)
|
Frisco
|
—
|
|
JV/Owned
|
|||
|
Baylor Scott & White Medical Center – Lake Pointe
(12)(13)(14)
|
Rowlett
|
—
|
|
JV/Owned
|
|||
|
Baylor Scott & White Medical Center – Sunnyvale
(13)(15)
|
Sunnyvale
|
—
|
|
JV/Leased
|
|||
|
Baylor Scott & White Medical Center – White Rock
(13)(16)
|
Dallas
|
—
|
|
JV/Owned
|
|||
|
The Hospitals of Providence East Campus
|
El Paso
|
182
|
|
Owned
|
|||
|
The Hospitals of Providence Memorial Campus
|
El Paso
|
480
|
|
Owned
|
|||
|
The Hospitals of Providence Sierra Campus
|
El Paso
|
297
|
|
Owned
|
|||
|
The Hospitals of Providence Transmountain Campus
|
El Paso
|
106
|
|
Owned
|
|||
|
Mission Trail Baptist Hospital
|
San Antonio
|
110
|
|
Owned
|
|||
|
Nacogdoches Medical Center
|
Nacogdoches
|
161
|
|
Owned
|
|||
|
North Central Baptist Hospital
|
San Antonio
|
429
|
|
Owned
|
|||
|
Northeast Baptist Hospital
|
San Antonio
|
371
|
|
Owned
|
|||
|
Resolute Health Hospital
|
New Braunfels
|
128
|
|
Owned
|
|||
|
St. Luke’s Baptist Hospital
|
San Antonio
|
282
|
|
Owned
|
|||
|
Valley Baptist Medical Center
|
Harlingen
|
586
|
|
Owned
|
|||
|
Valley Baptist Medical Center – Brownsville
|
Brownsville
|
243
|
|
Owned
|
|||
|
Total Licensed Beds
|
|
19,141
|
|
|
|||
|
(1)
|
Operated by a limited liability company formed as part of a joint venture with Baptist Health System, Inc. (“BHS”), a not-for-profit healthcare system in Alabama; a Tenet subsidiary owned a 60% interest in the entity at December 31, 2017, and BHS owned a 40% interest.
|
|
(2)
|
In order to receive certain tax benefits for these hospitals, which were operated as nonprofit hospitals prior to our joint venture with BHS, we have entered into arrangements with the City of Talladega, the City of Birmingham, the City of Alabaster and the City of Jasper such that a Medical Clinic Board owns each of these hospitals, and the hospitals are leased to our joint venture entity. These capital leases expire between November 2025 and September 2036, but contain two optional renewal terms of 10 years each.
|
|
(3)
|
Specialty hospital.
|
|
(4)
|
Owned by a limited liability company formed as part of a joint venture with Dignity Health and Ascension Arizona, each of which is a not-for-profit healthcare system; a Tenet subsidiary owned a 60% interest in the entity at December 31, 2017, Dignity Health owned a 22.5% interest and Ascension Arizona owned a 17.5% interest.
|
|
(5)
|
Designated by the Centers for Medicare and Medicaid Services (“CMS”) as a critical access hospital.
|
|
(6)
|
Lease expires in May 2027.
|
4
|
(7)
|
Lease expires in July 2045.
|
|
(8)
|
Owned by a limited liability company formed as part of a joint venture with John Muir Health (“JMH”), a not-for-profit healthcare system in the San Francisco Bay area; a Tenet subsidiary owned a 51% interest in the entity at December 31, 2017, and JMH owned a 49% interest.
|
|
(9)
|
We have entered into a definitive agreement to sell this hospital; the sale is expected to occur in early to mid-2018, subject to regulatory approvals and customary closing conditions.
|
|
(10)
|
We sold our Philadelphia-area hospitals and related operations effective January 11, 2018.
|
|
(11)
|
At December 31, 2017, managed by a Tenet subsidiary and owned by a limited partnership that is owned by a limited liability partnership (the “JV LLP”) formed as part of a joint venture with Baylor Scott & White Health (“BSWH”), a not-for-profit healthcare system; a Tenet subsidiary owned a 25% interest and BSWH owned a 75% interest in the JV LLP at December 31, 2017.
|
|
(12)
|
In the three months ended December 31, 2017, we entered into definitive agreements to restructure our joint venture arrangements with BSWH. Pursuant to this restructuring, BSWH will, among other things, acquire all of the JV LLP’s ownership interests in the entity or entities that own this hospital and also take over operations of the hospital. The transactions are currently expected to be completed in early 2018, subject to regulatory approvals and customary closing conditions.
|
|
(13)
|
Although we managed the operations of this hospital as of December 31, 2017, we have not included its licensed beds in the table because the statistical information associated with the hospital is not presented on a consolidated basis with our other facilities.
|
|
(14)
|
At December 31, 2017, managed by a Tenet subsidiary and owned by a limited liability company in which the JV LLP (in which we owned a 25% interest at December 31, 2017, as set forth in footnote (11) above) indirectly owned a 94.67% interest at December 31, 2017, with physicians owning the remaining 5.33%. As a result, our ownership interest in this facility was approximately 23.67% at December 31, 2017.
|
|
(15)
|
At December 31, 2017, managed by a Tenet subsidiary and operated by a limited liability company in which the JV LLP (in which we owned a 25% interest at December 31, 2017, as set forth in footnote (11) above) indirectly owned a 62.05% interest at December 31, 2017, with physicians owning the remaining 37.95%. As a result, our ownership interest in this facility was approximately 15.5% at December 31, 2017. Pursuant to the restructuring agreement described in footnote (12) above, this hospital will become part of Texas Health Ventures Group, an existing joint venture between BSWH and our USPI joint venture. The current lease term for this hospital expires in November 2029, but may be renewed through at least November 2049, subject to certain conditions contained in the lease.
|
|
(16)
|
At December 31, 2017, managed by a Tenet subsidiary and owned by the JV LLP (in which we owned a 25% interest at December 31, 2017, as set forth in footnote (11) above). In the three months ended December 31, 2017, we and BSWH reached a definitive agreement to sell this hospital to an unaffiliated third party. The transaction is currently expected to be completed in early 2018, subject to regulatory approvals and customary closing conditions.
|
Information regarding the utilization of licensed beds and other operating statistics at December 31, 2017, 2016 and 2015 can be found in Item 7, Management’s Discussion and Analysis of Financial Condition and Results of Operations, of Part II of this report.
At December 31, 2017, our Hospital Operations and other segment also included 59 diagnostic imaging centers, 12 satellite emergency departments, 11 ambulatory surgery centers and one urgent care center operated as departments of our hospitals and under the same license, as well as 84 separately licensed, freestanding outpatient centers – typically at locations complementary to our hospitals – consisting of six diagnostic imaging centers, eight emergency facilities (also known as microhospitals), three ambulatory surgery centers and 67 urgent care centers, nearly all of which are managed by our USPI joint venture and operated under our national MedPost brand. Over half of the outpatient centers in our Hospital Operations and other segment at December 31, 2017 were in California, Florida and Texas, the same states where we had the largest concentrations of licensed hospital beds. Strong concentrations of hospital beds and outpatient centers within market areas may help us contract more successfully with managed care payers, reduce management, marketing and other expenses, and more efficiently utilize resources. However, these concentrations increase the risk that, should any adverse economic, regulatory, environmental or other condition occur in these areas, our overall business, financial condition, results of operations or cash flows could be materially adversely affected.
Accountable Care Organizations and Clinically Integrated Networks—
We own, control or operate nine accountable care organizations (“ACOs”) and 10 clinically integrated networks (“CINs”) – in Alabama, Arizona, California, Florida, Illinois, Michigan, Missouri and Texas – and participate in six additional ACOs and CINs with other healthcare providers for select markets in Arizona, California, Massachusetts and Texas. An ACO is a group of providers and suppliers that work together to redesign delivery processes in an effort to achieve high-quality and efficient provision of services under contract with CMS. ACOs that achieve quality performance standards established by the U.S. Department of Health and Human Services (“HHS”) are eligible to share in a portion of the amounts saved by the Medicare program. A CIN coordinates the healthcare needs of the communities served by its network of providers with the purpose of improving the quality and efficiency of healthcare services through collaborative programs, including contracts with managed care payers, that create a high degree of interdependence and cooperation among the network providers. Because they promote accountability and coordination of care, ACOs and CINs are intended to produce savings as a result of improved quality and operational efficiencies. Both ACOs and CINs operate using a range of payment and care coordination models.
Health Plans—
We previously announced our intention to sell or otherwise dispose of our health plan businesses because they are not a core part of our long-term strategy. To that end, we sold, divested the membership of, or discontinued four health plans in 2017, and we intend to divest or explore the possibility of winding down operations for our remaining Southern California Medicare Advantage plan and our Chicago-based preferred provider network, which currently have less than 50,000 members, by the end of 2018. Health plans we have not sold outright continue to be subject to numerous federal
5
and state statutes and regulations related to their business operations, and each such health plan continues to be licensed by one or more agencies in the states in which they conduct business. In addition, insurance regulations in the states in which we currently operate have required us to maintain cash reserves in connection with certain health plans throughout the wind-down process.
AMBULATORY CARE SEGMENT
Our Ambulatory Care segment is comprised of the operations of our USPI joint venture and our nine European Surgical Partners Limited (“Aspen”) facilities in the United Kingdom. The operations of our Ambulatory Care segment generated approximately
10%
of our consolidated net operating revenues for the year ended December 31, 2017. At December 31, 2017, we had an 80% ownership interest in the USPI joint venture, while Welsh, Carson, Anderson & Stowe (“Welsh Carson”), a private equity firm that specializes in healthcare investments, owned approximately 15% through two subsidiaries, and Baylor University Medical Center (“Baylor”) owned approximately 5%. In accordance with the terms of our amended and restated put/call agreement, the 15% ownership interest held by our Welsh Carson joint venture partners will be subject to put options in equal shares in each of 2018 and 2019. In the event our Welsh Carson joint venture partners do not exercise these put options, we will have the option, but not the obligation, to buy 7.5% of our USPI joint venture from them in 2018 and another 7.5% in 2019. In connection with such puts or calls, we will have the ability to choose whether to settle the purchase price in cash or shares of our common stock.
Operations of Our USPI Joint Venture—
Our USPI joint venture acquires and develops its facilities primarily through the formation of joint ventures with physicians and healthcare systems. Subsidiaries of the USPI joint venture hold ownership interests in the facilities directly or indirectly and operate the facilities on a day-to-day basis through management services contracts. We believe that this acquisition and development strategy and operating model will enable our USPI joint venture to continue to grow because of various industry trends we have seen emerge in recent years, namely that: (1) consumers are increasingly selecting services and providers based on cost and convenience, as well as quality; (2) more procedures are shifting from inpatient to outpatient settings; (3) payer reimbursements have become more closely tied to performance on quality and service metrics; and (4) healthcare providers are entering into joint ventures to maximize effectiveness, reduce costs and build clinically integrated networks.
The surgical facilities in our USPI joint venture primarily specialize in non-emergency cases. We believe surgery centers and surgical hospitals offer many advantages to patients and physicians, including greater affordability, predictability and convenience. Medical emergencies at acute care hospitals often demand the unplanned use of operating rooms and result in the postponement or delay of scheduled surgeries, disrupting physicians’ practices and inconveniencing patients. Outpatient facilities generally provide physicians with greater scheduling flexibility, more consistent nurse staffing and faster turnaround time between cases. In addition, many physicians choose to perform surgery in outpatient facilities because their patients prefer the comfort of a less institutional atmosphere and the convenience of simplified admissions and discharge procedures.
New surgical techniques and technology, as well as advances in anesthesia, have significantly expanded the types of surgical procedures that are being performed in surgery centers and have helped drive the growth in outpatient surgery. Improved anesthesia has shortened recovery time by minimizing post-operative side effects, such as nausea and drowsiness, thereby avoiding the need for overnight hospitalization in many cases. Furthermore, some states permit surgery centers to keep a patient for up to 23 hours, which allows for more complex surgeries, previously performed only in an inpatient setting, to be performed in a surgery center.
In addition to these technological and other clinical advancements, a changing payer environment has contributed to the growth of outpatient surgery relative to all surgery performed. Government programs, private insurance companies, managed care organizations and self-insured employers have implemented cost-containment measures to limit increases in healthcare expenditures, including procedure reimbursement. Furthermore, as self-funded employers are looking to curb annual increases in their employee health benefit costs, they continue to shift additional financial responsibility to patients through higher co-pays, deductibles and premium contributions. These cost-containment measures have contributed to the shift in the delivery of healthcare services away from traditional inpatient hospitals to more cost-effective alternate sites, including surgical facilities. We believe that surgeries performed at surgical facilities are generally less expensive than hospital-based outpatient surgeries because of lower facility development costs, more efficient staffing and space utilization, and a specialized operating environment focused on quality of care and cost containment.
We operate our USPI joint venture’s facilities, structure our joint ventures, and adopt staffing, scheduling, and clinical systems and protocols with the goal of increasing physician productivity. We believe that this focus on physician satisfaction, combined with providing high-quality healthcare in a friendly and convenient environment for patients, will continue to increase the number of procedures performed at our facilities each year. Our joint ventures also enable healthcare systems to
6
offer patients, physicians and payers the cost advantages, convenience and other benefits of ambulatory care in a freestanding facility and, in certain markets, establish networks needed to manage the full continuum of care for a defined population. Further, these relationships allow the healthcare systems to focus their attention and resources on their core business without the challenge of acquiring, developing and operating these facilities.
At December 31, 2017, our USPI joint venture had interests in 247 ambulatory surgery centers, 34 urgent care centers operated under the CareSpot brand, 23 imaging centers and 20 surgical hospitals in 28 states. Of these 324 facilities, 193 are jointly owned with healthcare systems. As further described in Note 1 to our Consolidated Financial Statements, we do not consolidate the financial results of 106 of the facilities in which our USPI joint venture has an ownership interest, meaning that while we record a share of their net profit within our operating income as equity in earnings of unconsolidated affiliates, we do not include their revenues and expenses in the consolidated revenue and expense line items of our consolidated financial statements. Additional financial and other information about our Ambulatory Care operating segment can be found in Item 7, Management’s Discussion and Analysis of Financial Condition and Results of Operations, of Part II of this report.
Aspen’s Business—
Aspen Healthcare’s four acute care hospitals, one cancer center and four outpatient facilities offer patients in the United Kingdom a complete range of private healthcare and clinical services, including inpatient care, outpatient and minimally invasive treatment and surgery, and diagnostic imaging. As with our USPI joint venture, a number of Aspen’s facilities are owned jointly with physicians. Our nine Aspen facilities met the criteria to be classified as held for sale in the three months ended September 30, 2017, as further described in Note 4 to our Consolidated Financial Statements.
CONIFER SEGMENT
The operations of our Conifer segment generated approximately
8%
of our consolidated net operating revenues for the year ended December 31, 2017. Nearly all of the services comprising the operations of our Conifer segment are provided by Conifer Health Solutions, LLC or one of its direct or indirect wholly owned subsidiaries. As further described in Note 15 to our Consolidated Financial Statements, at December 31, 2017, we owned 76.2% of Conifer Health Solutions, LLC, and Catholic Health Initiatives (“CHI”) had a 23.8% ownership position. In December 2017, we announced that we are initiating a process to explore a potential sale of Conifer. There can be no assurance that this process will result in a transaction, and we may ultimately decide to retain all or part of Conifer’s business.
Services—
Conifer provides healthcare business process services in the areas of hospital and physician revenue cycle management and value-based care solutions to healthcare systems, as well as individual hospitals, physician practices, self-insured organizations, health plans and other entities.
Conifer’s revenue cycle management solutions consist of: (1) patient services, including: centralized insurance and benefit verification; financial clearance, pre-certification, registration and check-in services; and financial counseling services, including reviews of eligibility for government healthcare programs, for both insured and uninsured patients; (2) clinical revenue integrity solutions, including: clinical admission reviews; coding; clinical documentation; coding compliance audits; charge description management; and health information services; and (3) accounts receivable management solutions, including: third-party billing and collections; denials management; and patient collections. All of these solutions include ongoing measurement and monitoring of key revenue cycle metrics, as well as productivity and quality improvement programs. These revenue cycle management solutions assist hospitals, physician practices and other healthcare organizations in improving cash flow, revenue, and physician and patient satisfaction.
In addition, Conifer offers customized communications and engagement solutions to optimize the relationship between providers and patients. Conifer’s trained customer service representatives provide direct, 24-hour, multilingual support for (1) physician referrals, calls regarding maternity services and other patient inquiries, (2) community education and outreach, and (3) scheduling and appointment reminders. Additionally, Conifer coordinates and implements marketing outreach programs to keep patients informed of screenings, seminars and other events and services.
Conifer also offers value-based care solutions, including clinical integration, financial risk management and population health management, all of which assist hospitals, physicians, ACOs, health plans, self-insured employers and government agencies in improving the cost and quality of healthcare delivery, as well as patient outcomes. Conifer helps clients build clinically integrated networks that provide predictive analytics and quality measures across the care continuum. In addition, Conifer assists clients in improving both the cost and quality of care by aligning and managing financial incentives among healthcare stakeholders through risk modeling and management of various payment models. Furthermore, Conifer offers clients tools and analytics to improve quality of care and provide care management services for patients with chronic diseases by identifying high-risk patients, coordinating with patients and clinicians in managing care, and monitoring clinical outcomes.
7
Clients—
At December 31, 2017, Conifer provided one or more of the business process services described above to more than 800 Tenet and non-Tenet hospital and other clients nationwide. In 2012, we entered into agreements documenting the terms and conditions of various services Conifer provides to Tenet hospitals, as well as certain administrative services our Hospital Operations and other segment provides to Conifer. The pricing terms for the services provided by each party to the other under these contracts were based on estimated third-party pricing terms in effect at the time the agreements were signed. The contracts between Tenet and Conifer are scheduled to expire in December 2018, and it is possible that the pricing under the renegotiated agreements may be different from the current agreements. In addition, under its agreement with CHI, which expires in 2032, Conifer is providing patient access, revenue integrity and patient financial services to 84 CHI hospitals.
For the year ended December 31, 2017, approximately 39% of Conifer’s net operating revenues were attributable to its relationship with Tenet and approximately 35% were attributable to its relationship with CHI. The loss of CHI’s business would have a material adverse impact on our Conifer segment, although not on Tenet as a whole. Additional financial and other information about our Conifer operating segment can be found in Item 7, Management’s Discussion and Analysis of Financial Condition and Results of Operations, of Part II of this report.
We intend to continue to market and expand Conifer’s revenue cycle management, patient communications and engagement services, and value-based care solutions businesses. We believe that our success in growing Conifer and increasing its profitability depends in part on our success in executing the following strategies: (1) attracting hospitals and other healthcare providers that currently handle their revenue cycle management processes internally as new clients; (2) generating new client relationships through opportunities from USPI and Tenet’s acute care hospital acquisition and divestiture activities; (3) expanding revenue cycle management and value-based care service offerings through organic development and small acquisitions; (4) leveraging data from tens of millions of patient interactions for continued enhancement of the value-based care environment to drive competitive differentiation; and (5) developing services for our Ambulatory Care segment, leveraging our USPI joint venture’s capabilities. However, there can be no assurance that Conifer will be successful in generating new client relationships, particularly with respect to hospitals we or Conifer’s other clients sell, as the respective buyers may not continue to use Conifer’s services or, if they do, they may not do so under the same contractual terms.
REAL PROPERTY
The locations of our hospitals and the number of licensed beds at each hospital at December 31, 2017 are set forth in the table beginning on page 3. We lease the majority of our outpatient facilities in both our Hospital Operations and other segment and our Ambulatory Care segment. These leases typically have initial terms ranging from five to 20 years, and most of the leases contain options to extend the lease periods. Our subsidiaries also operate a number of medical office buildings, all of which are located on, or nearby, our hospital campuses. We own many of these medical office buildings; the remainder are owned by third parties and leased by our subsidiaries. See Note 21 to the accompanying Consolidated Financial Statements for a discussion of the recently issued accounting standard related to accounting for leases.
Our corporate headquarters are located in Dallas, Texas. In addition, we maintain administrative offices in markets where we operate hospitals and other businesses, including our USPI joint venture and Conifer. We typically lease our office space under operating lease agreements. We believe that all of our properties are suitable for their respective uses and are, in general, adequate for our present needs.
INTELLECTUAL PROPERTY
We rely on a combination of trademark, copyright and trade secret laws, as well as contractual terms and conditions, to protect our rights in our intellectual property assets. However, third parties may develop intellectual property that is similar or superior to ours. We also license third-party software, other technology and certain trademarks through agreements that impose certain restrictions on our ability to use the licensed items. We control access to and use of our software and other technology through a combination of internal and external controls. Although we do not believe the intellectual property we utilize infringes any intellectual property right held by a third party, we could be prevented from utilizing such property and could be subject to significant damage awards if our use is found to do so.
PHYSICIANS AND EMPLOYEES
Physicians—
Our operations depend in significant part on the number, quality, specialties, and admitting and scheduling practices of the licensed physicians who have been admitted to the medical staffs of our hospitals and who affiliate with us and use our facilities as an extension of their practices. Under state laws and other licensing standards, medical staffs are generally self-governing organizations subject to ultimate oversight by the facility’s local governing board. Members of the
8
medical staffs of our hospitals also often serve on the medical staffs of facilities we do not operate, and they are free to terminate their association with our hospitals or admit their patients to competing facilities at any time. At December 31, 2017, we owned over 675 physician practices, and we employed (where permitted by state law) or otherwise affiliated with nearly 2,000 physicians; however, we have no contractual relationship with the overwhelming majority of the physicians who practice at our hospitals and outpatient centers. It is essential to our ongoing business that we attract an appropriate number of quality physicians in the specialties required to support our services and that we maintain good relations with those physicians. In some of our markets, physician recruitment and retention are affected by a shortage of physicians in certain specialties and the difficulties that physicians can experience in obtaining affordable malpractice insurance or finding insurers willing to provide such insurance. Moreover, our ability to recruit and employ physicians is closely regulated.
Employees in Our Healthcare Facilities—
In addition to physicians, the operations of our facilities are dependent on the efforts, abilities and experience of our facilities management and medical support employees, including nurses, therapists, pharmacists and lab technicians. We compete with other healthcare providers in recruiting and retaining qualified personnel responsible for the day-to-day operations of our facilities. In some markets, there is a limited availability of experienced medical support personnel, which drives up the local wages and benefits required to recruit and retain employees. In particular, like others in the healthcare industry, we continue to experience a shortage of critical-care nurses in certain disciplines and geographic areas. Moreover, we hire many newly licensed nurses in addition to experienced nurses, which requires us to invest in their training.
California is the only state in which we operate that requires minimum nurse-to-patient staffing ratios to be maintained at all times in acute care hospitals. If other states in which we operate adopt mandatory nurse-staffing ratios or if California changes its minimum nurse-staffing ratios to require nurses to cover even fewer patients, it could have a significant effect on our labor costs and have an adverse impact on our net operating revenues if we are required to limit patient volumes in order to meet the required ratios.
Union Activity and Labor Relations—
At December 31, 2017, approximately 24% of the employees in our Hospital Operations and other segment were represented by labor unions. There were no unionized employees in our Ambulatory Care segment, and less than 1% of Conifer’s employees belong to a union. Unionized employees – primarily registered nurses and service, technical and maintenance workers – are located at 35 of our hospitals, the majority of which are in California, Florida and Michigan. We currently have six expired contracts covering approximately 14% of our unionized employees and are or will be negotiating renewals under extension agreements. We are also negotiating (or will soon negotiate) six first contracts at four hospitals where employees recently selected union representation; these contracts cover nearly 7% of our unionized employees. At this time, we are unable to predict the outcome of the negotiations, but increases in salaries, wages and benefits could result from these agreements. Furthermore, there is a possibility that strikes could occur during the negotiation process, which could increase our labor costs and have an adverse effect on our volumes and net operating revenues. Organizing activities by labor unions could increase our level of union representation in future periods.
Headcount—
In October 2017, we began implementing an enterprise-wide cost-reduction initiative – comprised primarily of headcount reductions and the renegotiation of contracts with suppliers and vendors. At December 31, 2016, we employed over 130,000 people, including 98,500 in our Hospital Operations and other segment. As of December 31, 2017, we employed approximately 126,000 people (of which approximately 22% were part-time employees) in our three business segments, as follows:
|
Hospital Operations and other
(1)
|
93,230
|
|
|
Ambulatory Care
|
18,310
|
|
|
Conifer
|
14,280
|
|
|
Total
|
125,820
|
|
|
(1)
|
Includes approximately 900 employees supporting the consolidated operations of our businesses.
|
COMPETITION
HEALTHCARE SERVICES
Generally, other hospitals and outpatient centers in the local communities we serve provide services similar to those we offer, and, in some cases, competing facilities are more established or newer than ours. Furthermore, competing facilities (1) may offer a broader array of services to patients and physicians than ours, (2) may have larger or more specialized medical staffs to admit and refer patients, (3) may have a better reputation in the community, (4) may be more centrally located with better parking or closer proximity to public transportation or (5) may be able to negotiate more favorable reimbursement rates
9
that they may use to strengthen their competitive position. In the future, we expect to encounter increased competition from system-affiliated hospitals and healthcare companies, as well as health insurers and private equity companies seeking to acquire providers, in specific geographic markets.
We also face competition from specialty hospitals (some of which are physician-owned) and unaffiliated freestanding outpatient centers for market share in high-margin services and for quality physicians and personnel. In recent years, the number of freestanding specialty hospitals, surgery centers, emergency departments, urgent care centers and diagnostic imaging centers in the geographic areas in which we operate has increased significantly. Furthermore, some of the hospitals that compete with our hospitals are owned by government agencies or not-for-profit organizations. These tax-exempt competitors may have certain financial advantages not available to our facilities, such as endowments, charitable contributions, tax-exempt financing, and exemptions from sales, property and income taxes. In addition, in certain markets in which we operate, large teaching hospitals provide highly specialized facilities, equipment and services that may not be available at our hospitals.
Another major factor in the competitive position of a hospital or outpatient facility is the ability to negotiate contracts with managed care plans. Health maintenance organizations (“HMOs”), preferred provider organizations (“PPOs”), third-party administrators, and other third-party payers use managed care contracts to encourage patients to use certain hospitals in exchange for discounts from the hospitals’ established charges. Our future success depends, in part, on our ability to retain and renew our managed care contracts and enter into new managed care contracts on competitive terms. Other healthcare providers may affect our ability to enter into acceptable managed care contractual arrangements or negotiate increases in our reimbursement. For example, some of our competitors may negotiate exclusivity provisions with managed care plans or otherwise restrict the ability of managed care companies to contract with us. Furthermore, the trend toward consolidation among non-government payers tends to increase their bargaining power over fee structures.
In addition, the competitive position of hospitals and outpatient facilities is dependent in significant part on the number, quality, specialties, and admitting and scheduling practices of the licensed physicians who have been admitted to the medical staffs of the hospitals and who affiliate with and use outpatient facilities as an extension of their practices. Members of the medical staffs of our hospitals also often serve on the medical staffs of facilities we do not operate, and they are free to terminate their association with our hospitals or admit their patients to competing facilities at any time.
State laws that require findings of need for construction and expansion of healthcare facilities or services (as described in “Healthcare Regulation and Licensing – Certificate of Need Requirements” below) may also have the effect of restricting competition. In addition, in those states that do not have certificate of need requirements or that do not require review of healthcare capital expenditure amounts below a relatively high threshold, competition in the form of new services, facilities and capital spending is more prevalent.
Our strategies are designed to help our hospitals and outpatient facilities remain competitive. We believe targeted capital spending on critical growth opportunities, emphasis on higher-demand clinical service lines (including outpatient lines) and improved quality metrics at our hospitals will improve our patient volumes. Furthermore, we have significantly expanded our outpatient business, and we have increased our focus on operating our outpatient centers with improved accessibility and more convenient service for patients, increased predictability and efficiency for physicians, and (for most services) lower costs for payers than would be incurred with a hospital visit. We have also sought to include all of our hospitals and other healthcare businesses in the related geographic area or nationally when negotiating new managed care contracts, which may result in additional volumes at facilities that were not previously a part of such managed care networks.
We have made significant investments in equipment, technology, education and operational strategies designed to improve clinical quality at all of our facilities. We believe physicians refer patients to a hospital on the basis of the quality and scope of services it renders to patients and physicians, the quality of other physicians on the medical staff, the location of the hospital, and the quality of the hospital’s facilities, equipment and employees. In addition, we continually collaborate with physicians to implement the most current evidence-based medicine techniques to improve the way we provide care, while using labor management tools and supply chain initiatives to reduce variable costs. We believe the use of these practices will promote the most effective and efficient utilization of resources and result in shorter lengths of stay, as well as reductions in readmissions for hospitalized patients. In general, we believe that quality of care improvements may have the effects of: (1) reducing costs; (2) increasing payments from Medicare and certain managed care payers for our services as governmental and private payers move to pay-for-performance models, and the commercial market moves to more narrow networks and other methods designed to encourage covered individuals to use certain facilities over others; and (3) increasing physician and patient satisfaction, which may improve our volumes.
Moreover, in most of our markets, we have formed clinically integrated networks, which are collaborations with independent physicians and hospitals to develop ongoing clinical initiatives designed to control costs and improve the quality
10
of care delivered to patients. Arrangements like these provide a foundation for negotiating with plans under an ACO structure or other risk-sharing model. However, we do face competition from other healthcare systems that are implementing similar physician alignment strategies, such as employing physicians, acquiring physician practice groups, and participating in ACOs or other clinical integration models.
REVENUE CYCLE MANAGEMENT SOLUTIONS
Our Conifer subsidiary faces competition from existing participants and new entrants to the revenue cycle management market, some of which may have significantly greater capital resources than Conifer. In addition, the internal revenue cycle management staff of hospitals and other healthcare providers, who have historically performed many of the functions addressed by our services, in effect compete with us. Moreover, providers who have previously made investments in internally developed solutions may choose to continue to rely on their own resources. We also currently compete with several categories of external participants in the revenue cycle market, including:
|
•
|
software vendors and other technology-supported revenue cycle management business process outsourcing companies;
|
|
•
|
traditional consultants, either specialized healthcare consulting firms or healthcare divisions of large accounting firms; and
|
|
•
|
large, non-healthcare focused business process and information technology outsourcing firms.
|
We believe that competition for the revenue cycle management and other services Conifer provides is based primarily on: (1) knowledge and understanding of the complex public and private healthcare payment and reimbursement systems; (2) a track record of delivering revenue improvements and efficiency gains for hospitals and other healthcare providers; (3) the ability to deliver solutions that are fully integrated along each step of the revenue cycle; (4) cost-effectiveness, including the breakdown between up-front costs and pay-for-performance incentive compensation; (5) reliability, simplicity and flexibility of the technology platform; (6) understanding of the healthcare industry’s regulatory environment; and (7) financial resources to maintain current technology and other infrastructure.
To be successful, Conifer must respond more quickly and effectively than its competitors to new or changing opportunities, technologies, standards, regulations and client requirements. Existing or new competitors may introduce technologies or services that render Conifer’s technologies or services obsolete or less marketable. Even if Conifer’s technologies and services are more effective than the offerings of its competitors, current or potential clients might prefer competitive technologies or services to Conifer’s technologies and services. Furthermore, increased competition has resulted and may continue to result in pricing pressures, which could negatively impact Conifer’s margins, growth rate or market share.
HEALTHCARE REGULATION AND LICENSING
HEALTHCARE REFORM
The Affordable Care Act extended health coverage to millions of uninsured legal U.S. residents through a combination of private sector health insurance reforms and public program expansion. To fund the expansion of insurance coverage, the ACA includes measures designed to promote quality and cost efficiency in healthcare delivery and to generate budgetary savings in the Medicare and Medicaid programs. In addition, the ACA contains provisions intended to strengthen fraud and abuse enforcement.
As further discussed in Item 7, Management’s Discussion and Analysis of Financial Condition and Results of Operations, of Part II of this report, the initial expansion of health insurance coverage under the ACA resulted in an increase in the number of patients using our facilities with either private or public program coverage and a decrease in uninsured and charity care admissions. Although a substantial portion of both our patient volumes and, as result, our revenues has historically been derived from government healthcare programs, reductions to our reimbursement under the Medicare and Medicaid programs as a result of the ACA have been partially offset by increased revenues from providing care to previously uninsured individuals.
The President issued an executive order on January 20, 2017 declaring that it is the official policy of his administration to seek the prompt repeal of the ACA and directing the heads of all executive departments and agencies to minimize the economic and regulatory burdens of the ACA to the maximum extent permitted by law while the ACA remains in effect. The White House also sent a memorandum to federal agencies directing them to freeze any new or pending regulations. In
11
October 2017, the administration announced that reimbursements to insurance companies for ACA cost-sharing reduction (“CSR”) plans offered through the health insurance marketplace would be discontinued. CSR payments compensate insurers for subsidizing out-of-pocket costs for low-income enrollees. Without the CSR payments, some insurers may seek approval to increase premiums for plans offered on ACA exchanges or withdraw from offering plans on some or all of the exchanges. We cannot predict what actions insurers might take as a result of the order, the impact of those actions on our operations, or the outcome of legislative efforts or litigation seeking to restore the payments. In addition, in December 2017, Congress passed and the President signed a tax reform bill into law that, among other things, eliminates the ACA’s individual mandate penalty for not buying health insurance starting in 2019. The Congressional Budget Office estimates that this change will result in four million people losing health insurance coverage in 2019 and 13 million people losing coverage by 2027.
We cannot predict if or when further modification of the ACA will occur or what action, if any, Congress might take with respect to eventually repealing and possibly replacing the law. We are also unable to predict the impact of legislative, administrative and regulatory changes, and market reactions to those changes, on our future revenues and operations. However, if the ultimate impact is that significantly fewer individuals have private or public health coverage, we likely will experience decreased volumes, reduced revenues and an increase in uncompensated care, which would adversely affect our results of operations and cash flows. This negative effect will be exacerbated if the ACA’s reductions in Medicare reimbursement and reductions in Medicare disproportionate share hospital (“DSH”) payments that have already taken effect are not reversed if the law is repealed or if further reductions (including Medicaid DSH reductions scheduled to take effect under the Bipartisan Budget Act of 2018 (“2018 BBA”) in federal fiscal years (“FFYs”) 2020 through 2025) are made.
ANTI-KICKBACK AND SELF-REFERRAL REGULATIONS
Anti-Kickback Statute—
Medicare and Medicaid anti-kickback and anti-fraud and abuse amendments codified under Section 1128B(b) of the Social Security Act (the “Anti-kickback Statute”) prohibit certain business practices and relationships that might affect the provision and cost of healthcare services payable under the Medicare and Medicaid programs and other government programs, including the payment or receipt of remuneration for the referral of patients whose care will be paid for by such programs. Specifically, the law prohibits any person or entity from offering, paying, soliciting or receiving anything of value, directly or indirectly, for the referral of patients covered by Medicare, Medicaid and other federal healthcare programs or the leasing, purchasing, ordering or arranging for or recommending the lease, purchase or order of any item, good, facility or service covered by these programs. In addition to addressing other matters, as discussed below, the Health Insurance Portability and Accountability Act of 1996 (“HIPAA”) also amended Title XI (42 U.S.C. Section 1301 et seq.) to broaden the scope of fraud and abuse laws to include all health plans, whether or not payments under such health plans are made pursuant to a federal program. Moreover, the Affordable Care Act amended the Anti-kickback Statute to provide that intent to violate the Anti-kickback Statute is not required; rather, intent to violate the law generally is all that is required.
Sanctions for violating the Anti-kickback Statute include criminal and civil penalties, as well as fines and mandatory exclusion from government programs, such as Medicare and Medicaid. In addition, submission of a claim for services or items generated in violation of the Anti-kickback Statute constitutes a false or fraudulent claim and may be subject to additional penalties under the federal False Claims Act (“FCA”). Furthermore, it is a violation of the federal Civil Monetary Penalties Law to offer or transfer anything of value to Medicare or Medicaid beneficiaries that is likely to influence their decision to obtain covered goods or services from one provider or service over another. Many states have statutes similar to the federal Anti-kickback Statute, except that the state statutes usually apply to referrals for services reimbursed by all third-party payers, not just federal programs.
The federal government has also issued regulations that describe some of the conduct and business relationships that are permissible under the Anti-kickback Statute. These regulations are often referred to as the “Safe Harbor” regulations. Currently, there are safe harbors for various activities, including the following: investment interests; space rental; equipment rental; practitioner recruitment; personal services and management contracts; sales of practices; referral services; warranties; discounts; employees; group purchasing organizations; waivers of beneficiary coinsurance and deductible amounts; managed care arrangements; obstetrical malpractice insurance subsidies; investments in group practices; ambulatory surgery centers; referral agreements for specialty services; cost-sharing waivers for pharmacies and emergency ambulance services; and local transportation. The fact that certain conduct or a given business arrangement does not meet a Safe Harbor does not necessarily render the conduct or business arrangement illegal under the Anti-kickback Statute. Rather, such conduct and business arrangements may be subject to increased scrutiny by government enforcement authorities and should be reviewed on a case-by-case basis.
Stark Law—
The Stark law generally restricts referrals by physicians of Medicare or Medicaid patients to entities with which the physician or an immediate family member has a financial relationship, unless one of several exceptions applies. The referral prohibition applies to a number of statutorily defined “designated health services,” such as clinical laboratory, physical
12
therapy, radiology, and inpatient and outpatient hospital services; the prohibition does not apply to health services provided by an ambulatory surgery center if those services are included in the surgery center’s composite Medicare payment rate. However, if the ambulatory surgery center is separately billing Medicare for designated health services that are not covered under the ambulatory surgery center’s composite Medicare payment rate, or if either the ambulatory surgery center or an affiliated physician is performing (and billing Medicare) for procedures that involve designated health services that Medicare has not designated as an ambulatory surgery center service, the Stark law’s self-referral prohibition would apply and such services could implicate the Stark law. Exceptions to the Stark law’s referral prohibition cover a broad range of common financial relationships. These statutory and the subsequent regulatory exceptions are available to protect certain permitted employment relationships, relocation arrangements, leases, group practice arrangements, medical directorships, and other common relationships between physicians and providers of designated health services, such as hospitals. A violation of the Stark law may result in a denial of payment, required refunds to patients and the Medicare program, civil monetary penalties of up to $15,000 for each violation, civil monetary penalties of up to $100,000 for “sham” arrangements, civil monetary penalties of up to $10,000 for each day that an entity fails to report required information, and exclusion from participation in the Medicare and Medicaid programs and other federal programs. In addition, the submission of a claim for services or items generated in violation of the Stark law may constitute a false or fraudulent claim, and thus be subject to additional penalties under the FCA. Many states have adopted self-referral statutes similar to the Stark law, some of which extend beyond the related state Medicaid program to prohibit the payment or receipt of remuneration for the referral of patients and physician self-referrals regardless of the source of the payment for the care. Our participation in and development of joint ventures and other financial relationships with physicians could be adversely affected by the Stark law and similar state enactments.
The Affordable Care Act also made changes to the “whole hospital” exception in the Stark law, effectively preventing new physician-owned hospitals after March 23, 2010 and limiting the capacity and amount of physician ownership in existing physician-owned hospitals. As revised, the Stark law prohibits physicians from referring Medicare patients to a hospital in which they have an ownership or investment interest unless the hospital had physician ownership and a Medicare provider agreement as of March 23, 2010 (or, for those hospitals under development at the time of the ACA’s enactment, as of December 31, 2010). A physician-owned hospital that meets these requirements is still subject to restrictions that limit the hospital’s aggregate physician ownership percentage and, with certain narrow exceptions for hospitals with a high percentage of Medicaid patients, prohibit expansion of the number of operating rooms, procedure rooms or beds. Physician-owned hospitals are also currently subject to reporting requirements and extensive disclosure requirements on the hospital’s website and in any public advertisements.
Implications of Fraud and Abuse Laws—
At December 31, 2017, two hospitals in our Hospital Operations and other segment, and the majority of the facilities that operate as surgical hospitals in our Ambulatory Care segment, are owned by joint ventures that include some physician owners and are subject to the limitations and requirements in the Affordable Care Act on physician-owned hospitals. Furthermore, the majority of ambulatory surgery centers in our Ambulatory Care segment, which are owned by joint ventures with physicians or healthcare systems, are subject to the Anti-kickback Statute and, in certain circumstances, may be subject to the Stark law. In addition, we have contracts with physicians and non-physician referral services providing for a variety of financial arrangements, including employment contracts, leases and professional service agreements, such as medical director agreements. We have also provided financial incentives to recruit physicians to relocate to communities served by our hospitals, including income and collection guarantees and reimbursement of relocation costs, and will continue to provide recruitment packages in the future. Furthermore, new payment structures, such as ACOs and other arrangements involving combinations of hospitals, physicians and other providers who share payment savings, could potentially be seen as implicating anti-kickback and self-referral provisions.
Our operations could be adversely affected by the failure of our arrangements to comply with the Anti-kickback Statute, the Stark law, billing requirements, current state laws, or other legislation or regulations in these areas adopted in the future. We are unable to predict whether other legislation or regulations at the federal or state level in any of these areas will be adopted, what form such legislation or regulations may take or how they may impact our operations. For example, we cannot predict whether physicians may ultimately be restricted from holding ownership interests in hospitals or whether the exception relating to services provided by ambulatory surgery centers could be eliminated. We are continuing to enter into new financial arrangements with physicians and other providers in a manner we believe complies with applicable anti-kickback and anti-fraud and abuse laws. However, governmental officials responsible for enforcing these laws may nevertheless assert that we are in violation of these provisions. In addition, these statutes or regulations may be interpreted and enforced by the courts in a manner that is not consistent with our interpretation. An adverse determination could subject us to liabilities under the Social Security Act, including criminal penalties, civil monetary penalties and exclusion from participation in Medicare, Medicaid or other federal healthcare programs, any of which could have a material adverse effect on our business, financial condition or results of operations. In addition, any determination by a federal or state agency or court that our USPI joint venture or its subsidiaries has violated any of these laws could give certain of our healthcare system partners a right to terminate their relationships with us; and any similar determination with respect to Conifer or any of its subsidiaries could give
13
Conifer’s clients the right to terminate their services agreements with us. Moreover, any violations by and resulting penalties or exclusions imposed upon our USPI joint venture’s healthcare system partners or Conifer’s clients could adversely affect their financial condition and, in turn, have a material adverse effect on our business and results of operations.
Retention of Independent Compliance Monitor—
As previously disclosed, in September 2016, the Company and certain of its subsidiaries, including Tenet HealthSystem Medical, Inc. (“THSMI”), Atlanta Medical Center, Inc. (“AMCI”) and North Fulton Medical Center, Inc. (“NFMCI”), executed agreements with the Department of Justice (“DOJ”) and others to resolve a civil qui tam action and criminal investigation. In accordance with the terms of the resolution agreements, THSMI entered into a Non-Prosecution Agreement (“NPA”) with the Criminal Division, Fraud Section, of the DOJ and the U.S. Attorney’s Office for the Northern District of Georgia (together, the “Offices”). The NPA requires, among other things, (1) THSMI and the Company to fully cooperate with the Offices in any matters relating to the conduct described in the NPA and other conduct under investigation by the Offices at any time during the term of the NPA, and (2) the Company to retain an independent compliance monitor to assess, oversee and monitor its compliance with the obligations under the NPA. On February 1, 2017, the Company retained two independent co-monitors (the “Monitor”), who are partners in a national law firm.
The NPA is scheduled to expire on February 1, 2020 (three years from the date on which the Monitor was retained). However, in the event the Offices determine, in their sole discretion, that the Company, or any of its subsidiaries or affiliates, has knowingly violated any provision of the NPA, the NPA could be extended by the Offices, in their sole discretion, for up to one year, without prejudice to the Offices’ other rights under the NPA. Conversely, in the event the Offices find, in their sole discretion, that there exists a change in circumstances sufficient to eliminate the need for a monitor, or that the other provisions of the NPA have been satisfied, the oversight of the Monitor or the NPA itself may be terminated early.
The Monitor’s primary responsibility is to assess, oversee and monitor the Company’s compliance with its obligations under the NPA to specifically address and reduce the risk of any recurrence of violations of the Anti-kickback Statute and Stark law by any entity the Company owns, in whole or in part. In doing so, the Monitor reviews and monitors the effectiveness of the Company’s compliance with the Anti-kickback Statute and the Stark law, as well as respective implementing regulations, advisories and advisory opinions promulgated thereunder, and makes such recommendations as the Monitor believes are necessary to comply with the NPA. With respect to all entities in which the Company or one of its affiliates owns a direct or indirect equity interest of 50% or less and does not manage or control the day-to-day operations, the Monitor’s access to such entities is co-extensive with the Company’s access or control and for the purpose of reviewing the conduct. During its term, the Monitor will review and provide recommendations for improving compliance with the Anti-kickback Statute and Stark law, as well as the design, implementation and enforcement of the Company’s compliance and ethics programs for the purpose of preventing future criminal and ethical violations by the Company and its subsidiaries, including, but not limited to, violations related to the conduct giving rise to the NPA and the Criminal Information filed in connection with the NPA. If we are alleged or found to have violated the terms of the NPA described above or federal healthcare laws, rules or regulations in the future, our business, financial condition, results of operations or cash flows could be materially adversely affected. For additional information regarding the duties and authorities of the Monitor, reference is made to our Current Report on Form 8-K filed with the Securities and Exchange Commission (“SEC”) on October 3, 2016.
HEALTH INSURANCE PORTABILITY AND ACCOUNTABILITY ACT
Title II, Subtitle F of the Health Insurance Portability and Accountability Act mandates the adoption of specific standards for electronic transactions and code sets that are used to transmit certain types of health information. HIPAA’s objective is to encourage efficiency and reduce the cost of operations within the healthcare industry. To protect the information transmitted using the mandated standards and the patient information used in the daily operations of a covered entity, HIPAA also sets forth federal rules protecting the privacy and security of protected health information (“PHI”). The privacy and security regulations address the use and disclosure of individually identifiable health information and the rights of patients to understand and control how their information is used and disclosed. The law provides both criminal and civil fines and penalties for covered entities that fail to comply with HIPAA.
To receive reimbursement from CMS for electronic claims, healthcare providers and health plans must use HIPAA’s electronic data transmission (transaction and code set) standards when transmitting certain healthcare information electronically. Effective October 1, 2015, CMS changed the formats used for certain electronic transactions and began requiring the use of updated standard code sets for certain diagnoses and procedures known as ICD-10 code sets. Although use of the ICD-10 code sets required significant modifications to our payment systems and processes, the costs of compliance with these regulations has not had and is not expected to have a material adverse effect on our business, financial condition, results of operations or revenues. Furthermore, our electronic data transmissions are compliant with current HHS standards for additional electronic transactions and with HHS’ operating rules to promote uniformity in the implementation of each standardized electronic transaction.
14
Under HIPAA, covered entities must establish administrative, physical and technical safeguards to protect the confidentiality, integrity and availability of electronic PHI maintained or transmitted by them or by others on their behalf. The covered entities we operate are in material compliance with the privacy, security and National Provider Identifier requirements of HIPAA. In addition, most of Conifer’s clients are covered entities, and Conifer is a business associate to many of those clients under HIPAA as a result of its contractual obligations to perform certain functions on behalf of and provide certain services to those clients. As a business associate, Conifer’s use and disclosure of PHI is restricted by HIPAA and the business associate agreements Conifer is required to enter into with its covered entity clients.
In 2009, HIPAA was amended by the Health Information Technology for Economic and Clinical Health (“HITECH”) Act to impose certain of the HIPAA privacy and security requirements directly upon business associates of covered entities and significantly increase the monetary penalties for violations of HIPAA. Regulations that took effect in late 2009 also require business associates such as Conifer to notify covered entities, who in turn must notify affected individuals and government authorities, of data security breaches involving unsecured PHI. Since the passage of the HITECH Act, enforcement of HIPAA violations has increased. A knowing breach of the HIPAA privacy and security requirements made applicable to business associates by the HITECH Act could expose Conifer to criminal liability (as well as contractual liability to the associated covered entity), and a breach of safeguards and processes that is not due to reasonable cause or involves willful neglect could expose Conifer to significant civil penalties and the possibility of civil litigation under HIPAA and applicable state law.
We have developed a comprehensive set of policies and procedures in our efforts to comply with HIPAA, and similar state privacy laws, under the guidance of our ethics and compliance department. Our compliance officers and information security officers are responsible for implementing and monitoring compliance with our HIPAA privacy and security policies and procedures throughout our company. We have also created an internal web-based HIPAA training program, which is mandatory for all U.S.-based employees. Based on existing regulations and our experience with HIPAA to this point, we continue to believe that the ongoing costs of complying with HIPAA will not have a material adverse effect on our business, financial condition, results of operations or cash flows.
GOVERNMENT ENFORCEMENT EFFORTS AND QUI TAM LAWSUITS
Both federal and state government agencies continue heightened and coordinated civil and criminal enforcement efforts against the healthcare industry. The Office of Inspector General (“OIG”) was established as an independent and objective oversight unit of HHS to carry out the mission of preventing fraud and abuse and promoting economy, efficiency and effectiveness of HHS programs and operations. In furtherance of this mission, the OIG, among other things, conducts audits, evaluations and investigations relating to HHS programs and operations and, when appropriate, imposes civil monetary penalties, assessments and administrative sanctions. Although we have extensive policies and procedures in place to facilitate compliance with the laws, rules and regulations affecting the healthcare industry, these policies and procedures may not be effective.
Healthcare providers are also subject to qui tam or “whistleblower” lawsuits under the federal False Claims Act, which allows private individuals to bring actions on behalf of the government, alleging that a hospital or healthcare provider has defrauded a government program, such as Medicare or Medicaid. If the government intervenes in the action and prevails, the defendant may be required to pay three times the damages sustained by the government, plus mandatory civil penalties for each false claim submitted to the government. As part of the resolution of a qui tam case, the qui tam plaintiff may share in a portion of any settlement or judgment. If the government does not intervene in the action, the qui tam plaintiff may continue to pursue the action independently. There are many potential bases for liability under the FCA. Liability often arises when an entity knowingly submits a false claim for reimbursement to the federal government. The FCA defines the term “knowingly” broadly. Though simple negligence will not give rise to liability under the FCA, submitting a claim with reckless disregard to its truth or falsity constitutes a “knowing” submission under the FCA and, therefore, will qualify for liability. The Fraud Enforcement and Recovery Act of 2009 expanded the scope of the FCA by, among other things, creating liability for knowingly and improperly avoiding repayment of an overpayment received from the government and broadening protections for whistleblowers. It is a violation of the FCA to knowingly fail to report and return an overpayment within 60 days of identifying the overpayment or by the date a corresponding cost report is due, whichever is later. Qui tam actions can also be filed under certain state false claims laws if the fraud involves Medicaid funds or funding from state and local agencies. We have paid significant amounts to resolve qui tam matters brought against us in the past, and we are unable to predict the impact of future qui tam actions on our business, financial condition, results of operations or cash flows.
15
HEALTHCARE FACILITY LICENSING REQUIREMENTS
The operation of healthcare facilities is subject to federal, state and local regulations relating to personnel, operating policies and procedures, fire prevention, rate-setting, the adequacy of medical care, and compliance with building codes and environmental protection laws. Various licenses and permits also are required in order to dispense narcotics, operate pharmacies, handle radioactive materials and operate certain equipment. Our facilities are subject to periodic inspection by governmental and other authorities to assure continued compliance with the various standards necessary for licensing and accreditation. We believe that all of our healthcare facilities hold all required governmental approvals, licenses and permits material to the operation of their business.
UTILIZATION REVIEW COMPLIANCE AND HOSPITAL GOVERNANCE
In addition to certain statutory coverage limits and exclusions, federal regulations, specifically the Medicare Conditions of Participation, generally require healthcare providers, including hospitals that furnish or order healthcare services that may be paid for under the Medicare program or state healthcare programs, to ensure that claims for reimbursement are for services or items that are (1) provided economically and only when, and to the extent, they are medically reasonable and necessary, (2) of a quality that meets professionally recognized standards of healthcare, and (3) supported by appropriate evidence of medical necessity and quality. The Social Security Act established the Utilization and Quality Control Peer Review Organization program, now known as the Quality Improvement Organization (“QIO”) program, to promote the effectiveness, efficiency, economy and quality of services delivered to Medicare beneficiaries and to ensure that those services are reasonable and necessary. CMS administers the program through a network of QIOs that work with consumers, physicians, hospitals and other caregivers to refine care delivery systems to ensure patients receive the appropriate care at the appropriate time, particularly among underserved populations. The QIO program also safeguards the integrity of the Medicare trust fund by reviewing Medicare patient admissions, treatments and discharges, and ensuring payment is made only for medically necessary services, and investigates beneficiary complaints about quality of care. The QIOs have the authority to deny payment for services provided and recommend to HHS that a provider that is in substantial noncompliance with certain standards be excluded from participating in the Medicare program.
There has been increased scrutiny from outside auditors, government enforcement agencies and others, as well as an increased risk of government investigations and qui tam lawsuits, related to hospitals’ Medicare observation rates and inpatient admission decisions. The term “Medicare observation rate” is defined as total unique observation claims divided by the sum of total unique observation claims and total inpatient short-stay acute care hospital claims. A low rate may raise suspicions that a hospital is inappropriately admitting patients that could be cared for in an observation setting. In addition, CMS has established a concept referred to as the “two-midnight rule” to guide practitioners admitting patients and contractors on when it is appropriate to admit individuals as hospital inpatients. Under the two-midnight rule, full implementation and enforcement of which began on January 1, 2016, CMS has indicated that a Medicare patient should generally be admitted on an inpatient basis only when there is a reasonable expectation that the patient’s care will cross two midnights; if not, the patient generally should be treated as an outpatient, unless an exception applies. In our affiliated hospitals, we conduct reviews of Medicare inpatient stays of less than two midnights to determine whether a patient qualifies for inpatient admission. Enforcement of the two-midnight rule has not had, and is not expected to have, a material impact on inpatient admission rates at our hospitals.
Medical and surgical services and practices are extensively supervised by committees of staff doctors at each of our healthcare facilities, are overseen by each facility’s local governing board, the members of which primarily are community members and physicians, and are reviewed by our clinical quality personnel. The local hospital governing board also helps maintain standards for quality care, develop short-term and long-range plans, and establish, review and enforce practices and procedures, as well as approves the credentials, disciplining and, if necessary, the termination of privileges of medical staff members.
CERTIFICATE OF NEED REQUIREMENTS
Some states require state approval for construction, acquisition and closure of healthcare facilities, including findings of need for additional or expanded healthcare facilities or services. Certificates or determinations of need, which are issued by governmental agencies with jurisdiction over healthcare facilities, are at times required for capital expenditures exceeding a prescribed amount, changes in bed capacity or services, and certain other matters. Our subsidiaries operate hospitals in eight states that require a form of state approval under certificate of need programs applicable to those hospitals. Approximately 52% of our licensed hospital beds are located in these states (namely, Alabama, Florida, Illinois, Massachusetts, Michigan, Missouri, South Carolina and Tennessee). The certificate of need programs in most of these states, along with several others, also apply to ambulatory surgery centers.
16
Failure to obtain necessary state approval can result in the inability to expand facilities, add services, acquire a facility or change ownership. Further, violation of such laws may result in the imposition of civil sanctions or the revocation of a facility’s license. We are unable to predict whether we will be required or able to obtain any additional certificates of need in any jurisdiction where they are required, or if any jurisdiction will eliminate or alter its certificate of need requirements in a manner that will increase competition and, thereby, affect our competitive position. In those states that do not have certificate of need requirements or that do not require review of healthcare capital expenditure amounts below a relatively high threshold, competition in the form of new services, facilities and capital spending is more prevalent.
ENVIRONMENTAL MATTERS
Our healthcare operations are subject to a number of federal, state and local environmental laws, rules and regulations that govern, among other things, our disposal of solid waste, as well as our use, storage, transportation and disposal of hazardous and toxic materials (including radiological materials). Our operations also generate medical waste that must be disposed of in compliance with statutes and regulations that vary from state to state. In addition, although we are not engaged in manufacturing or other activities that produce meaningful levels of greenhouse gas emissions, our operating expenses could be adversely affected if legal and regulatory developments related to climate change or other initiatives result in increased energy or other costs. We could also be affected by climate change and other environmental issues to the extent such issues adversely affect the general economy or result in severe weather affecting the communities in which our facilities are located. At this time, based on current climate conditions and our assessment of existing and pending environmental rules and regulations, as well as treaties and international accords relating to climate change, we do not believe that the costs of complying with environmental laws, including regulations relating to climate change issues, will have a material adverse effect on our future capital expenditures, results of operations or cash flows. There were no material capital expenditures for environmental matters in the year ended December 31, 2017.
ANTITRUST LAWS
The federal government and most states have enacted antitrust laws that prohibit specific types of anti-competitive conduct, including price fixing, wage fixing, concerted refusals to deal, price discrimination and tying arrangements, as well as monopolization and acquisitions of competitors that have, or may have, a substantial adverse effect on competition. Violations of federal or state antitrust laws can result in various sanctions, including criminal and civil penalties.
Antitrust enforcement in the healthcare industry is currently a priority of the U.S. Federal Trade Commission (“FTC”). In recent years, the FTC has filed multiple administrative complaints challenging hospital transactions in several states. The FTC has focused its enforcement efforts on preventing hospital mergers that may, in the government’s view, leave insufficient local options for patient services. In addition to hospital merger enforcement, the FTC has given increased attention to the effect of combinations involving other healthcare providers, including physician practices. The FTC has also entered into numerous consent decrees in the past several years settling allegations of price-fixing among providers.
REGULATIONS AFFECTING CONIFER’S OPERATIONS
As described below, Conifer and certain of its subsidiaries are subject to statutes and regulations regarding their consumer finance, debt collection and credit reporting activities.
DEBT COLLECTION ACTIVITIES
The federal Fair Debt Collection Practices Act (“FDCPA”) regulates persons who regularly collect or attempt to collect, directly or indirectly, consumer debts owed or asserted to be owed to another person. Certain of the accounts receivable handled by Conifer’s debt collection agency subsidiary, Syndicated Office Systems, LLC (“SOS”), are subject to the FDCPA, which establishes specific guidelines and procedures that debt collectors must follow in communicating with consumer debtors, including the time, place and manner of such communications. The FDCPA also places restrictions on communications with individuals other than consumer debtors in connection with the collection of any consumer debt. In addition, the FDCPA contains various notice and disclosure requirements and imposes certain limitations on lawsuits to collect debts against consumers. Debt collection activities are also regulated at the state level. Most states have laws regulating debt collection activities in ways that are similar to, and in some cases more stringent than, the FDCPA.
Many states also regulate the collection practices of creditors who collect their own debt. These state regulations are often the same or similar to state regulations applicable to third-party collectors. Certain of the accounts receivable Conifer manages for its clients are subject to these state regulations.
17
In certain situations, the activities of SOS are also subject to the Fair Credit Reporting Act (“FCRA”). The FCRA regulates the collection, dissemination and use of consumer information, including consumer credit information. State credit reporting laws, to the extent they are not preempted by the FCRA, may also apply to SOS.
In accordance with the federal Fair and Accurate Credit Transaction Act (“FACTA”), Conifer has adopted (1) written guidance and procedures for detecting, preventing and responding appropriately to mitigate identity theft, and (2) coworker policies and procedures (including training) that address the importance of protecting non-public personal information and aid Conifer in detecting and responding to suspicious activity, including suspicious activity that may suggest a possible identity theft red flag, as appropriate.
Conifer and its subsidiaries are also subject to regulation by the Federal Trade Commission and the U.S. Consumer Financial Protection Bureau (“CFPB”). Both the FTC and the CFPB have the authority to investigate consumer complaints relating to a variety of consumer protection laws, including the FDCPA, FCRA and FACTA, and to initiate enforcement actions, including actions to seek restitution and monetary penalties from, or to require changes in business practices of, regulated entities. State officials typically have authority to enforce corresponding state laws. In addition, affected consumers may bring suits, including class action suits, to seek monetary remedies (including statutory damages) for violations of the federal and state provisions discussed above.
PAYMENT ACTIVITY RISKS
Conifer accepts payments from patients of the facilities for which it provides services using a variety of methods, including credit card, debit card, direct debit from a patient’s bank account, and physical bank check. For certain payment methods, including credit and debit cards, Conifer pays interchange and other fees, which may increase over time, thereby raising operating costs. Conifer relies on third parties to provide payment processing services, including the processing of credit cards, debit cards and electronic checks, and it could disrupt Conifer’s business if these companies become unwilling or unable to provide these services. Conifer is also subject to payment card association operating rules, including data security rules, certification requirements and rules governing electronic funds transfers, which could change or be reinterpreted to make it difficult or impossible for Conifer to comply. If Conifer fails to comply with these rules or requirements, or if its data security systems are breached or compromised, Conifer may be liable for card issuing banks’ costs, be subject to fines and higher transaction fees, and lose its ability to accept credit and debit card payments from patients, process electronic funds transfers, or facilitate other types of online payments.
COMPLIANCE AND ETHICS
General—
Our ethics and compliance department maintains our values-based ethics and compliance program, which is designed to (1) help staff in our corporate, USPI joint venture and Conifer offices, hospitals, outpatient centers, health plan offices and physician practices meet or exceed applicable standards established by federal and state statutes and regulations, as well as industry practice, and (2) monitor and raise awareness of ethical issues among employees and others, and stress the importance of understanding and complying with our
Standards of Conduct
. The ethics and compliance department operates with independence – it has its own operating budget; it has the authority to hire outside counsel, access any company document and interview any of our personnel; and our chief compliance officer reports directly to the quality, compliance and ethics committee of our board of directors.
Program Charter—
Our Q
uality, Compliance and Ethics Program Charter
is the governing document for our ethics and compliance program. Our adherence to the charter is intended to:
|
•
|
support and maintain our present and future responsibilities with regard to participation in federal healthcare programs; and
|
|
•
|
further our goals of operating an organization that (1) fosters and maintains the highest ethical standards among all employees, officers and directors, physicians practicing at our facilities and contractors that furnish healthcare items or services, (2) values compliance with all state and federal statutes and regulations as a foundation of its corporate philosophy, and (3) aligns its behaviors and decisions with Tenet’s core values of quality, integrity, service, innovation and transparency.
|
The primary focus of our quality, compliance and ethics program is compliance with the requirements of Medicare, Medicaid and other federally funded healthcare programs. Pursuant to the terms of the charter, our ethics and compliance department is responsible for, among other things, the following activities: (1) ensuring, in collaboration with in-house counsel, facilitation of the Monitor’s activities and compliance with the provisions of the NPA and related company policies; (2) assessing, critiquing,
18
and (as appropriate) drafting and distributing company policies and procedures; (3) developing, providing, and tracking ethics and compliance training and other training programs, including job-specific training to those who work in clinical quality, coding, billing, cost reporting and referral source arrangements, in collaboration with the respective department responsible for oversight of each of these areas; (4) creating and disseminating the Company’s
Standards of Conduct
and obtaining certifications of adherence to the
Standards of Conduct
as a condition of employment; (5) maintaining and promoting the Company’s Ethics Action Line, a 24-hour, toll-free hotline that allows for confidential reporting of issues on an anonymous basis and emphasizes the Company’s no-retaliation policy; and (6) responding to and ensuring resolution of all compliance-related issues that arise from the Ethics Action Line and compliance reports received from facilities and compliance officers (utilizing any compliance reporting software that the Company may employ for this purpose) or any other source that results in a report to the ethics and compliance department.
Standards of Conduct—
All of our employees, including our chief executive officer, chief financial officer and principal accounting officer, are required to abide by our
Standards of Conduct
to advance our mission that our business be conducted in a legal and ethical manner. The members of our board of directors and all of our contractors having functional roles similar to our employees are also required to abide by our
Standards of Conduct
. The standards reflect our basic values and form the foundation of a comprehensive process that includes compliance with all corporate policies, procedures and practices. Our standards cover such areas as quality patient care, compliance with all applicable statutes and regulations, appropriate use of our assets, protection of patient information and avoidance of conflicts of interest.
As part of the program, we provide training sessions at least annually to every employee, as well as our board of directors and certain physicians and contractors. All employees are required to report incidents that they believe in good faith may be in violation of the
Standards of Conduct
or our policies, and are encouraged to contact our Ethics Action Line when they have questions about the standards or any ethics concerns. All reports to the Ethics Action Line are kept confidential to the extent allowed by law, and employees have the option to remain anonymous. Incidents of alleged financial improprieties reported to the Ethics Action Line or the ethics and compliance department are communicated to the audit committee of our board of directors. Reported cases that involve a possible violation of the law or regulatory policies and procedures are referred to the ethics and compliance department for investigation. Retaliation against employees in connection with reporting ethical concerns is considered a serious violation of our
Standards of Conduct
, and, if it occurs, it will result in discipline, up to and including termination of employment.
Non-Prosecution Agreement—
As previously disclosed, in September 2016, our THSMI subsidiary entered into a Non-Prosecution Agreement with the DOJ’s Criminal Division, Fraud Section, and the U.S. Attorney’s Office for the Northern District of Georgia. The NPA requires, among other things, that we and THSMI (1) fully cooperate with the Offices in any matters relating to the conduct described in the NPA and other conduct under investigation by the Offices at any time during the term of the NPA, (2) retain an independent compliance monitor to assess, oversee and monitor our compliance with the obligations under the NPA, (3) promptly report any evidence or allegations of actual or potential violations of the Anti-kickback Statute, (4) maintain our compliance and ethics program throughout our operations, including those of our subsidiaries, affiliates, agents and joint ventures (to the extent that we manage or control or THSMI manages or controls such joint ventures), and (5) notify the DOJ and undertake certain other obligations specified in the NPA relative to, among other things, any sale, merger or transfer of all or substantially all of our and THSMI’s respective business operations or the business operations of our or its subsidiaries or affiliates, including an obligation to include in any contract for sale, merger, transfer or other change in corporate form a provision binding the purchaser to retain the commitment of us or THSMI, or any successor-in-interest thereto, to comply with the NPA obligations except as may otherwise be agreed by the parties to the NPA in connection with a particular transaction. The powers, duties and responsibilities of the independent compliance monitor are broadly defined.
The NPA is scheduled to expire on February 1, 2020 (three years from the date on which the Monitor was retained), but it may be extended or terminated early as described herein and in the NPA. If, during the term of the NPA, THSMI commits any felony under federal law, or if the Company commits any felony related to the Anti-kickback Statute, or if THSMI or the Company fails to cooperate or otherwise fails to fulfill the obligations set forth in the NPA, then THSMI, the Company and our affiliates could be subject to prosecution, exclusion from participation in federal health care programs, and other substantial costs and penalties. The Offices retain sole discretion over determining whether there has been a breach of the NPA and whether to pursue prosecution. The NPA provides that, in the event the DOJ determines that the Company or THSMI has breached the NPA, the DOJ will provide written notice prior to instituting any prosecution of the Company or THSMI resulting from such breach. Following receipt of such notice, the Company and THSMI have the opportunity to respond to the DOJ to explain the nature and circumstances of the breach, as well as the actions taken to address and remediate the situation, which the DOJ shall consider in determining whether to pursue prosecution of the Company, THSMI or its affiliates. Any liability or consequences associated with a failure to comply with the NPA could have a material adverse effect on our business, financial condition, results of operations or cash flows.
19
In the fourth quarter of 2017, in accordance with the process described in the NPA, the DOJ notified the Company and THSMI of its view that the Company had breached the terms of the NPA by failing to promptly report “evidence or allegations of actual or potential violations of the Anti-Kickback Statute” to the DOJ as required by the NPA. In particular, the Company did not promptly report that Crain’s
Detroit Business
had published an article in August 2017 alleging that Detroit Medical Center’s (“DMC’s”) termination of the employment of 14 nurse practitioners and physician’s assistants was due, in part, to the Company’s concerns that their prior employment did not comply with the Anti-kickback Statute, the Stark law and the False Claims Act. Additionally, the Company did not promptly report its receipt in the fourth quarter of 2017 of a document request from the U.S. Attorney’s Office for the Eastern District of Michigan and the Civil Division of the DOJ requesting that the Company produce documents related to a civil investigation of DMC for potential violations of the Stark law, the Anti-kickback Statute and the False Claims Act related to the allegations contained in the Crain’s article. In accordance with the process described in the NPA, representatives of the Company, the Company’s external counsel and the DOJ have engaged in discussions regarding the nature and circumstances of the breach, as well as the actions the Company and THSMI have taken in remediation. As part of this remediation, the Company’s external counsel has undertaken, in close consultation with the Company’s independent compliance monitor, a retrospective review of the Company’s compliance with its reporting obligations. In the first quarter of 2018, the DOJ informed the Company, through its external counsel, that: (i) the DOJ will wait until the retrospective review is complete before making a decision on the appropriate remedy for the breach; (ii) the DOJ does not intend to prosecute the Company or THSMI for the underlying conduct that gave rise to the NPA for purposes of enforcing the breach provision of the NPA; and (iii) the DOJ will instead consider other remedies short of prosecution to the extent that the DOJ decides that such remedies are necessary and appropriate to enforce the breach provision. The Company believes that the retrospective review and discussions with the DOJ will continue into the second quarter of 2018 and does not expect that the remedy with respect to such breach will have a material effect on the Company.
Availability of Documents—
The full text of our
Quality, Compliance and Ethics Program Charter,
our
Standards of Conduct
, and a number of our ethics and compliance policies and procedures are published on our website, at www.tenethealth.com, under the “Our Commitment To Compliance” caption in the “About Us” section. A copy of our
Standards of Conduct
is also available upon written request to our corporate secretary. Information about how to contact our corporate secretary is set forth under “Company Information” below. Amendments to the
Standards of Conduct
and any grant of a waiver from a provision of the
Standards of Conduct
requiring disclosure under applicable SEC rules will be disclosed at the same location as the
Standards of Conduct
on our website. A copy of the NPA is attached as an exhibit to our Current Report on Form 8-K filed with the SEC on October 3, 2016.
INSURANCE
Property Insurance—
We have property, business interruption and related insurance coverage to mitigate the financial impact of catastrophic events or perils that is subject to deductible provisions based on the terms of the policies. These policies are on an occurrence basis. For the policy period April 1, 2016 through March 31, 2017, we have coverage totaling $600 million per occurrence, after deductibles and exclusions, with annual aggregate sub-limits of $100 million each for floods and earthquakes and a per-occurrence sub-limit of $200 million for windstorms with no annual aggregate. With respect to fires and other perils, excluding floods, earthquakes and windstorms, the total $600 million limit of coverage per occurrence applies. Deductibles are 5% of insured values up to a maximum of $25 million for floods, California earthquakes and wind-related claims, and 2% of insured values for New Madrid fault earthquakes, with a maximum per claim deductible of $25 million. Other covered losses, including fires and other perils, have a minimum deductible of $1 million.
For the policy period April 1, 2017 through March 31, 2018, we have coverage totaling $850 million per occurrence, after deductibles and exclusions, with annual aggregate sub-limits of $100 million for floods, $200 million for earthquakes and a per-occurrence sub-limit of $200 million for named windstorms with no annual aggregate. With respect to fires and other perils, excluding floods, earthquakes and named windstorms, the total $850 million limit of coverage per occurrence applies. Deductibles are 5% of insured values up to a maximum of $25 million for California earthquakes, floods and wind-related claims, and 2% of insured values for New Madrid fault earthquakes, with a maximum per claim deductible of $25 million. Floods and certain other covered losses, including fires and other perils, have a minimum deductible of $1 million.
Professional and General Liability Insurance—
As is typical in the healthcare industry, we are subject to claims and lawsuits in the ordinary course of business. The healthcare industry has seen significant increases in the cost of professional liability insurance due to increased litigation. In response, we maintain captive insurance companies to self-insure a substantial portion of our professional and general liability risk. We also own two captive insurance companies that write professional liability insurance for a small number of physicians, including employed physicians, who are on the medical staffs of certain of our hospitals.
20
Claims in excess of our self-insurance retentions are insured with commercial insurance companies. If the aggregate limit of any of our professional and general liability policies is exhausted, in whole or in part, it could deplete or reduce the limits available to pay any other material claims applicable to that policy period. Any losses not covered by or in excess of the amounts maintained under insurance policies will be funded from our working capital.
In addition to the reserves recorded by our captive insurance subsidiaries, we maintain reserves, including reserves for incurred but not reported claims, for our self-insured professional liability retentions and claims in excess of the policies’ aggregate limits, based on modeled estimates of losses and related expenses. Also, we provide standby letters of credit to certain of our insurers, which can be drawn upon under certain circumstances, to collateralize the deductible and self-insured retentions under a selected number of our professional and general liability insurance programs.
COMPANY INFORMATION
Tenet Healthcare Corporation was incorporated in the State of Nevada in 1975. We file annual, quarterly and current reports, proxy statements and other documents with the SEC under the Securities Exchange Act of 1934, as amended (the “Exchange Act”). Our reports, proxy statements and other documents filed electronically with the SEC are available at the website maintained by the SEC at www.sec.gov.
Our website, www.tenethealth.com, also offers, free of charge, access to our annual, quarterly and current reports (and amendments to such reports), and other filings made with, or furnished to, the SEC as soon as reasonably practicable after such documents are submitted to the SEC. The information found on our website is not part of this or any other report we file with or furnish to the SEC.
Inquiries directed to our corporate secretary may be sent to Corporate Secretary, Tenet Healthcare Corporation, P.O. Box 139003, Dallas, Texas 75313-9003 or by e-mail at CorporateSecretary@tenethealth.com.
EXECUTIVE OFFICERS
Information about our executive officers, as of February 26, 2018, is as follows:
|
Name
|
Position
|
Age
|
|
Ronald A. Rittenmeyer
|
Executive Chairman and Chief Executive Officer
|
70
|
|
Daniel J. Cancelmi
|
Chief Financial Officer
|
55
|
|
Keith B. Pitts
|
Vice Chairman
|
60
|
|
J. Eric Evans
|
President of Hospital Operations
|
40
|
|
Audrey T. Andrews
|
Senior Vice President and General Counsel
|
51
|
Mr. Rittenmeyer was named Tenet’s executive chairman in August 2017 and chief executive officer in October 2017. He has served on Tenet’s board of directors since 2010, most recently as lead director. He previously served as chairman of the board and chief executive officer of Millennium Health, a health solutions company. He served as the chairman, president and chief executive officer of Expert Global Solutions, Inc., a provider of business process outsourcing services, from 2011 to 2014. From 2005 to 2008, Mr. Rittenmeyer held a number of senior management positions with Electronic Data Systems Corporation, including chairman and chief executive officer from 2007 to 2008, president from 2006 to 2008, chief operating officer from 2005 to 2007 and executive vice president, global service delivery from 2005 to 2006. Prior to that, he was a managing director of the Cypress Group, a private equity firm, serving from 2004 to 2005. He served as chairman, chief executive officer and president of Safety-Kleen Corp. from 2001 to 2004. Among his other leadership roles, Mr. Rittenmeyer served as chief executive officer and president of AmeriServe Food Distribution Inc. from 2000 to 2001, chairman, chief executive officer and president of RailTex, Inc. from 1998 to 2000, president and chief operating officer of Ryder TRS, Inc. from 1997 to 1998, president and chief operating officer of Merisel, Inc. from 1995 to 1996 and chief operating officer of Burlington Northern Railroad Co. from 1994 to 1995. Mr. Rittenmeyer holds a bachelor’s degree in commerce and economics from Wilkes University and an M.B.A. from Rockhurst University. He currently serves on the board of directors of three other public companies: American International Group, Inc., Avaya Holdings Corp. and IQVIA Holdings Inc.
Mr. Cancelmi was appointed Tenet’s chief financial officer in September 2012. He previously served as senior vice president from April 2009, principal accounting officer from April 2007 and controller from September 2004. Mr. Cancelmi was a vice president and assistant controller at Tenet from September 1999 until his promotion to controller. He joined the Company as chief financial officer of Hahnemann University Hospital. Prior to that, he held various positions at PricewaterhouseCoopers, including in the firm’s National Accounting and SEC office in New York City. Mr. Cancelmi is a
21
certified public accountant who holds a bachelor’s degree in accounting from Duquesne University in Pittsburgh. He is also a member of the American Institute of Certified Public Accountants and the Florida and Pennsylvania Institutes of Certified Public Accountants.
Mr. Pitts was appointed vice chairman following Tenet’s acquisition of Vanguard Health Systems, Inc. (“Vanguard”) in October 2013. He was Vanguard’s vice chairman from May 2001 until the acquisition and an executive vice president from August 1999 until May 2001. Mr. Pitts also served as a director of Vanguard from August 1999 until September 2004. Before joining Vanguard, Mr. Pitts was the chairman and chief executive officer of Mariner Post-Acute Network and its predecessor, Paragon Health Network, a nursing home management company, from November 1997 until June 1999. He served as the executive vice president and chief financial officer for OrNda HealthCorp, prior to its acquisition by Tenet, from August 1992 to January 1997, and, before that, as a consultant to many healthcare organizations, including as a partner in Ernst & Young’s healthcare consulting practice. Mr. Pitts is a certified public accountant who holds a bachelor’s degree in business administration from the University of Florida. He is a member of the American Institute of Certified Public Accountants and the Florida Institute of Certified Public Accountants.
Mr. Evans was appointed Tenet’s president of hospital operations in March 2016. He previously served as chief executive officer of our former Texas region from April 2015 and as market chief executive officer of The Hospitals of Providence (formerly known as the Sierra Providence Health Network) in El Paso from September 2012. Mr. Evans was the chief executive officer of our former Dallas-area Lake Pointe Health Network from September 2010, where he previously held the positions of chief operating officer and director of business development after he joined Tenet in August 2004 as part of our MBA Leadership Development Program. Earlier in his career, Mr. Evans was an industrial engineer and a material flow coordinator at Saturn Corporation, a former subsidiary of General Motors Co. He holds a bachelor’s degree in industrial management from Purdue University and an M.B.A. from Harvard Business School. He is also a fellow in the American College of Healthcare Executives. Beginning in 2014, Mr. Evans served a three-year term as a member of the board of directors of the El Paso Branch of the Federal Reserve Bank of Dallas, for which he acted as chair in 2016.
Ms. Andrews was appointed senior vice president and general counsel in January 2013. From July 2008 until that appointment, she served as senior vice president and chief compliance officer and, prior to that, served as vice president and chief compliance officer from November 2006. She joined Tenet in 1998 as hospital operations counsel. Ms. Andrews holds a J.D. and a bachelor’s degree in government, both from the University of Texas at Austin. She is a member of the American and Texas Bar Associations and the American Health Lawyers Association.
FORWARD-LOOKING STATEMENTS
This report includes “forward-looking statements” within the meaning of Section 27A of the Securities Act of 1933 and Section 21E of the Exchange Act, each as amended. All statements, other than statements of historical or present facts, that address activities, events, outcomes, business strategies and other matters that we plan, expect, intend, assume, believe, budget, predict, forecast, project, estimate or anticipate (and other similar expressions) will, should or may occur in the future are forward-looking statements. These forward-looking statements represent management’s current expectations, based on currently available information, as to the outcome and timing of future events. They involve known and unknown risks, uncertainties and other factors, many of which we are unable to predict or control, that may cause our actual results, performance or achievements, or healthcare industry results, to be materially different from those expressed or implied by forward-looking statements. Such factors include, but are not limited to, the following:
|
•
|
The impact on our business of recent and future modifications of the Affordable Care Act and the enactment of, or changes in, other statutes and regulations affecting the healthcare industry generally;
|
|
•
|
Cuts to Medicare and Medicaid payment rates or changes in reimbursement practices or to Medicaid supplemental payment programs;
|
|
•
|
Adverse regulatory developments and government investigations;
|
|
•
|
Adverse developments with respect to our ability to comply with the terms of the Non-Prosecution Agreement, including any breach of the agreement;
|
|
•
|
Our ability to enter into managed care provider arrangements on acceptable terms, including our ability to mitigate the impact of national managed care contracts that expire and are not replaced; and changes in service mix, revenue mix and surgical volumes, including potential declines in the population covered under managed care agreements;
|
22
|
•
|
Our ability to achieve operating and financial targets, as well as identify and execute on measures designed to save or control costs or streamline operations, including our ability to realize savings under our recently announced cost-reduction initiatives;
|
|
•
|
Our success in divesting assets in non-core markets and completing other transactions, including the process we have initiated for the potential sale of Conifer;
|
|
•
|
Potential disruptions to our business or diverted management attention as a result of our cost-reduction efforts or our planned divestitures, including the potential sale of Conifer;
|
|
•
|
The impact of our significant indebtedness; the availability and terms of capital to fund the operation and expansion of our business; and our ability to comply with our debt covenants and, over time, reduce leverage;
|
|
•
|
Adverse litigation;
|
|
•
|
Competition;
|
|
•
|
Our ability to continue to manage, expand and realize earnings contributions from our USPI and Conifer business segments;
|
|
•
|
The effect that adverse economic conditions, consumer behavior and other factors have on our volumes and our ability to collect outstanding receivables on a timely basis, among other things;
|
|
•
|
Increases in wages, and our ability to hire and retain qualified personnel, especially healthcare professionals;
|
|
•
|
The timing and impact of additional changes in federal tax laws, regulations and policies, and the outcome of pending and any future tax audits, disputes and litigation associated with our tax positions; and
|
|
•
|
Other factors and risks referenced in this report and our other public filings.
|
When considering forward-looking statements, a reader should keep in mind the risk factors and other cautionary statements in this report. Should one or more of the risks and uncertainties described in this report occur, or should underlying assumptions prove incorrect, our actual results and plans could differ materially from those expressed in any forward-looking statement. We specifically disclaim any obligation to update any information contained in a forward-looking statement or any forward-looking statement in its entirety and, therefore, disclaim any resulting liability for potentially related damages.
All forward-looking statements attributable to us are expressly qualified in their entirety by this cautionary statement.
Our business is subject to a number of risks and uncertainties, many of which are beyond our control, that may cause our actual operating results or financial performance to be materially different from our expectations. If one or more of the events discussed in this report were to occur, actual outcomes could differ materially from those expressed in or implied by any forward-looking statements we make in this report or our other filings with the SEC, and our business, financial condition, results of operations or liquidity could be materially adversely affected; furthermore, the trading price of our common stock could decline and our shareholders could lose all or part of their investment.
We cannot predict the impact that modifications of the Affordable Care Act may have on our business, financial condition, results of operations or cash flows.
The expansion of health insurance coverage under the Affordable Care Act resulted in an increase in the number of patients using our facilities with either private or public program coverage and a decrease in uninsured and charity care admissions. Although a substantial portion of both our patient volumes and, as result, our revenues has historically been derived from government healthcare programs, reductions to our reimbursement under the Medicare and Medicaid programs as a result of the ACA have been partially offset by increased revenues from providing care to previously uninsured individuals.
The President issued an executive order on January 20, 2017 declaring that it is the official policy of his administration to seek the prompt repeal of the ACA and directing the heads of all executive departments and agencies to minimize the
23
economic and regulatory burdens of the ACA to the maximum extent permitted by law while the ACA remains in effect. The White House also sent a memorandum to federal agencies directing them to freeze any new or pending regulations. In October 2017, the administration announced that reimbursements to insurance companies for ACA cost-sharing reduction plans offered through the health insurance marketplace would be discontinued. In addition, in December 2017, Congress passed and the President signed a tax reform bill into law that, among other things, eliminates the ACA’s individual mandate penalty for not buying health insurance starting in 2019. The Congressional Budget Office estimates that this change will result in four million people losing health insurance coverage in 2019 and 13 million people losing coverage by 2027. We cannot predict if or when further modification of the ACA will occur or what action, if any, Congress might take with respect to eventually repealing and possibly replacing the law. We are also unable to predict the impact of legislative, administrative and regulatory changes, and market reactions to those changes, on our future revenues and operations. However, if the ultimate impact is that significantly fewer individuals have private or public health coverage, we likely will experience decreased volumes, reduced revenues and an increase in uncompensated care, which would adversely affect our results of operations and cash flows. This negative effect will be exacerbated if the ACA’s reductions in Medicare reimbursement and reductions in Medicare DSH payments that have already taken effect are not reversed if the law is repealed or if further reductions (including Medicaid DSH reductions scheduled to take effect under the 2018 BBA in FFYs 2020 through 2025) are made.
Further changes in the Medicare and Medicaid programs or other government healthcare programs, including reductions in scale and scope, could have an adverse effect on our business.
For the year ended December 31, 2017, approximately
20%
and
8%
of our net patient revenues before provision for doubtful accounts from our Hospital Operations and other segment were related to the Medicare program and various state Medicaid programs, respectively, in each case excluding Medicare and Medicaid managed care programs. The Medicare and Medicaid programs are subject to: statutory and regulatory changes, administrative rulings, interpretations and determinations concerning patient eligibility requirements, funding levels and the method of calculating payments or reimbursements, among other things; requirements for utilization review; and federal and state funding restrictions, all of which could materially increase or decrease payments from these government programs in the future, as well as affect the cost of providing services to our patients and the timing of payments to our facilities, which could in turn adversely affect our overall business, financial condition, results of operations or cash flows. Any material adverse effects resulting from future reductions in payments from government programs could be exacerbated if we are not able to identify and execute on measures designed to save or control costs or streamline operations, including our recently announced cost-reduction initiatives.
Several states in which we operate face budgetary challenges that have resulted, and likely will continue to result, in reduced Medicaid funding levels to hospitals and other providers. Because most states must operate with balanced budgets, and the Medicaid program is generally a significant portion of a state’s budget, states can be expected to adopt or consider adopting future legislation designed to reduce or not increase their Medicaid expenditures. In addition, some states delay issuing Medicaid payments to providers to manage state expenditures. As an alternative means of funding provider payments, many of the states in which we operate have adopted provider fee programs or have received federal government waivers allowing them to test new approaches and demonstration projects to improve care. Continuing pressure on state budgets and other factors could result in future reductions to Medicaid payments, payment delays, changes to Medicaid supplemental payment programs or additional taxes on hospitals.
In general, we are unable to predict the effect of future government healthcare funding policy changes on our operations. If the rates paid by governmental payers are reduced, if the scope of services covered by governmental payers is limited, or if we or one or more of our subsidiaries’ hospitals are excluded from participation in the Medicare or Medicaid program or any other government healthcare program, there could be a material adverse effect on our business, financial condition, results of operations or cash flows.
Our business and financial results could be harmed if we are alleged to have violated existing regulations or if we fail to comply with new or changed regulations.
Our hospitals, outpatient centers and related healthcare businesses are subject to extensive federal, state and local regulation relating to, among other things, licensure, contractual arrangements, conduct of operations, privacy of patient information, ownership of facilities, physician relationships, addition of facilities and services, and reimbursement rates for services. The laws, rules and regulations governing the healthcare industry are extremely complex and, in certain areas, the industry has little or no regulatory or judicial interpretation for guidance. Moreover, under the ACA, the government and its contractors may suspend Medicare and Medicaid payments to providers of services “pending an investigation of a credible allegation of fraud.” The potential consequences for violating such laws, rules or regulations include reimbursement of government program payments, the assessment of civil monetary penalties, including treble damages, fines, which could be significant, exclusion from participation in federal healthcare programs, or criminal sanctions against current or former
24
employees, any of which could have a material adverse effect on our business, financial condition or cash flows. Even a public announcement that we are being investigated for possible violations of law could have a material adverse effect on the value of our common stock and our business reputation could suffer.
Furthermore, healthcare, as one of the largest industries in the United States, continues to attract much legislative interest and public attention. We are unable to predict the future course of federal, state and local healthcare regulation or legislation, including Medicare and Medicaid statutes and regulations. Further changes in the regulatory framework negatively affecting healthcare providers could have a material adverse effect on our business, financial condition, results of operations or cash flows.
We are also required to comply with various federal and state labor laws, rules and regulations governing a variety of workplace wage and hour issues. From time to time, we have been and expect to continue to be subject to regulatory proceedings and private litigation concerning our application of such laws, rules and regulations.
If we breach or otherwise fail to comply with our Non-Prosecution Agreement, we could be subject to criminal prosecution, substantial penalties and exclusion from participation in federal healthcare programs, any of which could adversely impact our business, financial condition, results of operations or cash flows.
In September 2016, one of our subsidiaries, Tenet HealthSystem Medical, Inc., entered into a Non-Prosecution Agreement with the DOJ’s Criminal Division, Fraud Section, and the U.S. Attorney’s Office for the Northern District of Georgia. The NPA requires, among other things, that we and THSMI (1) fully cooperate with the Offices in any matters relating to the conduct described in the NPA and other conduct under investigation by the Offices at any time during the term of the NPA, (2) retain an independent compliance monitor to assess, oversee and monitor our compliance with the obligations under the NPA, (3) promptly report any evidence or allegations of actual or potential violations of the Anti-kickback Statute, (4) maintain our compliance and ethics program throughout our operations, including those of our subsidiaries, affiliates, agents and joint ventures (to the extent that we manage or control or THSMI manages or controls such joint ventures), and (5) notify the DOJ and undertake certain other obligations specified in the NPA relative to, among other things, any sale, merger or transfer of all or substantially all of our and THSMI’s respective business operations or the business operations of our or its subsidiaries or affiliates, including an obligation to include in any contract for sale, merger, transfer or other change in corporate form a provision binding the purchaser to retain the commitment of us or THSMI, or any successor-in-interest thereto, to comply with the NPA obligations except as may otherwise be agreed by the parties to the NPA in connection with a particular transaction. The powers, duties and responsibilities of the independent compliance monitor are broadly defined.
The NPA is scheduled to expire on February 1, 2020 (three years from the date on which the Monitor was retained), but it may be extended or terminated early as described herein and in the NPA. If, during the term of the NPA, THSMI commits any felony under federal law, or if the Company commits any felony related to the Anti-kickback Statute, or if THSMI or the Company fails to cooperate or otherwise fails to fulfill the obligations set forth in the NPA, then THSMI, the Company and our affiliates could be subject to prosecution, exclusion from participation in federal health care programs, and other substantial costs and penalties. The Offices retain sole discretion over determining whether there has been a breach of the NPA and whether to pursue prosecution. The NPA provides that, in the event the DOJ determines that the Company or THSMI has breached the NPA, the DOJ will provide written notice prior to instituting any prosecution of the Company or THSMI resulting from such breach. Following receipt of such notice, the Company and THSMI have the opportunity to respond to the DOJ to explain the nature and circumstances of the breach, as well as the actions taken to address and remediate the situation, which the DOJ shall consider in determining whether to pursue prosecution of the Company, THSMI or its affiliates. Any liability or consequences associated with a failure to comply with the NPA could have a material adverse effect on our business, financial condition, results of operations or cash flows.
The industry trend toward value-based purchasing and alternative payment models may negatively impact our revenues.
Value-based purchasing and alternative payment model initiatives of both governmental and private payers tying financial incentives to quality and efficiency of care will increasingly affect the results of operations of our hospitals and other healthcare facilities, and may negatively impact our revenues if we are unable to meet expected quality standards. Medicare now requires providers to report certain quality measures in order to receive full reimbursement increases for inpatient and outpatient procedures that were previously awarded automatically. In addition, hospitals that meet or exceed certain quality performance standards will receive increased reimbursement payments, and hospitals that have “excess readmissions” for specified conditions will receive reduced reimbursement. Furthermore, Medicare no longer pays hospitals additional amounts for the treatment of certain hospital-acquired conditions (“HACs”), unless the conditions were present at admission. Hospitals that rank in the worst 25% of all hospitals nationally for HACs in the previous year receive reduced Medicare reimbursements.
25
Moreover, the ACA prohibits the use of federal funds under the Medicaid program to reimburse providers for treating certain provider‑preventable conditions.
The ACA also created the CMS Innovation Center to test innovative payment and service delivery models that have the potential to reduce Medicare, Medicaid or Children’s Health Insurance Program expenditures while preserving or enhancing the quality of care for beneficiaries. Participation in some of these models is voluntary; however, participation in certain bundled payment arrangements is mandatory for providers located in randomly selected geographic locations. Generally, the mandatory bundled payment models hold hospitals financially accountable for the quality and costs for an entire episode of care for a specific diagnosis or procedure from the date of the hospital admission or inpatient procedure through 90 days post-discharge, including services not provided by the hospital, such as physician, inpatient rehabilitation, skilled nursing and home health services. Under the mandatory models, hospitals are eligible to receive incentive payments or will be subject to payment reductions within certain corridors based on their performance against quality and spending criteria. In 2015, CMS finalized a five-year bundled payment model, called the Comprehensive Care for Joint Replacement (“CJR”) model, which includes hip and knee replacements, as well as other major leg procedures. Twenty of our hospitals currently participate in the CJR model. We cannot predict what effect significant modification or repeal of the ACA as described above will have on the established payment models or the Secretary of HHS’ authority to develop new payment models, nor can we predict what impact, if any, these demonstration programs will have on our inpatient volumes, net revenues or cash flows.
There is also a trend among private payers toward value-based purchasing and alternative payment models for healthcare services. Many large commercial payers expect hospitals to report quality data, and several of these payers will not reimburse hospitals for certain preventable adverse events. We expect value-based purchasing programs, including programs that condition reimbursement on patient outcome measures, to become more common and to involve a higher percentage of reimbursement amounts.
We are unable at this time to predict how the industry trend toward value-based purchasing and alternative payment models will affect our results of operations, but it could negatively impact our revenues, particularly if we are unable to meet the quality and cost standards established by both governmental and private payers.
If we are unable to enter into and maintain managed care contractual arrangements on acceptable terms, if we experience material reductions in the contracted rates we receive from managed care payers or if we have difficulty collecting from managed care payers, our results of operations could be adversely affected.
We currently have thousands of managed care contracts with various HMOs and PPOs. The amount of our managed care net patient revenues, including Medicare and Medicaid managed care programs, from our Hospital Operations and other segment during the year ended December 31, 2017 was approximately
$10.463 billion
, which represented approximately
62%
of our total net patient revenues before provision for doubtful accounts. Approximately
64%
of our managed care net patient revenues for the year ended December 31, 2017 was derived from our top ten managed care payers. In the year ended December 31, 2017, our commercial managed care net inpatient revenue per admission from our acute care hospitals was approximately
82%
higher than our aggregate yield on a per admission basis from government payers, including managed Medicare and Medicaid insurance plans. In addition, at December 31, 2017, approximately
62%
of our net accounts receivable for our Hospital Operations and other segment were due from managed care payers.
Our ability to negotiate favorable contracts with HMOs, insurers offering preferred provider arrangements and other managed care plans significantly affects the revenues and operating results of our hospitals. Furthermore, we may experience a short- or long-term adverse effect on our net operating revenues if we cannot replace or otherwise mitigate the impact of expired contracts with national payers. In addition, private payers are increasingly attempting to control healthcare costs through direct contracting with hospitals to provide services on a discounted basis, increased utilization reviews and greater enrollment in managed care programs, such as HMOs and PPOs. The trend toward consolidation among private managed care payers tends to increase their bargaining power over prices and fee structures. Our future success will depend, in part, on our ability to renew existing managed care contracts and enter into new managed care contracts on competitive terms. Other healthcare companies, including some with greater financial resources, greater geographic coverage or a wider range of services, may compete with us for these opportunities. For example, some of our competitors may negotiate exclusivity provisions with managed care plans or otherwise restrict the ability of managed care companies to contract with us. Any material reductions in the contracted rates we receive for our services or any significant difficulties in collecting receivables from managed care payers could have a material adverse effect on our financial condition, results of operations or cash flows. Any material adverse effects resulting from future reductions in payments from private payers could be exacerbated if we are not able to identify and execute on measures designed to save or control costs or streamline operations, including our recently announced cost-reduction initiatives, as described below.
26
Our failure to effectively execute our cost-reduction initiatives may adversely affect our business, financial condition and results of operations.
Our future financial performance and level of profitability is dependent, in part, on various cost-reduction initiatives. We may encounter challenges in executing these cost-reduction initiatives and not achieve the intended cost savings. In addition, we may face wrongful termination, discrimination or other legal claims from employees affected by any workforce reductions, and we may incur substantial costs defending against such claims, regardless of their merits. Moreover, such claims may significantly increase our severance costs. Workforce reductions in connection with our cost-reduction initiatives may result in the loss of numerous long-term employees, the loss of institutional knowledge and expertise, the reallocation of certain job responsibilities and the disruption of business continuity, all of which could negatively affect operational efficiencies and increase our operating expenses in the short term. Our failure to effectively execute our cost-reduction initiatives may lead to significant volatility, and a decline, in the price of our common stock. We cannot guarantee that our cost-reduction initiatives will be successful, and we may need to take additional steps in the future to achieve our profitability goals.
We cannot provide any assurances that we will be successful in divesting assets in non-core markets or that we will complete the process we have initiated for the potential sale of Conifer.
We are continuing our strategy of selling assets in non-core markets. We have announced definitive agreements to sell, transfer or otherwise divest our interests in eight hospitals we owned or operated at December 31, 2017, and we have since completed the sale of two of the eight hospitals. We cannot provide any assurances that recent, planned or future divestitures will achieve their business goals or the cost and service synergies we expect. We also cannot predict the outcome of the process we have initiated for the potential sale of Conifer. With respect to all proposed divestitures of assets or businesses, we may fail to obtain applicable regulatory approvals for such divestitures, including any approval that may be required under our NPA. Moreover, we may encounter difficulties in finding acquirers or alternative exit strategies on terms that are favorable to us, which could delay the receipt of anticipated proceeds necessary for us to complete our planned strategic objectives. In addition, our divestiture activities have required, and may in the future require, us to retain significant pre-closing liabilities, recognize impairment charges (as discussed below) or agree to contractual restrictions that limit our ability to reenter the applicable market, which may be material. Furthermore, our divestiture activities, including the potential sale of Conifer, may present financial and operational risks, including (1) the diversion of management attention from existing core businesses, (2) adverse effects (including a deterioration in the related asset or business) from the announcement of the planned or potential divesture, and (3) the challenges associated with separating personnel and financial and other systems.
Trends affecting our actual or anticipated results may require us to record charges that may negatively impact our results of operations.
As a result of factors that have negatively affected our industry generally and our business specifically, we have been required to record various charges in our results of operations. During the year ended December 31, 2017, we recorded impairment charges of (1) $232 million in connection with the sale of our Philadelphia-area hospitals, physician practices and related assets, (2) $73 million in connection with the planned divestiture of three of our hospitals in the Chicago-area, as well as other operations affiliated with the hospitals, and (3) $59 million in connection with the planned divestiture of our nine Aspen facilities in the United Kingdom. Our impairment tests presume stable, improving or, in some cases, declining operating results in our hospitals, which are based on programs and initiatives being implemented that are designed to achieve the hospitals’ most recent projections. If these projections are not met, or negative trends occur that impact our future outlook, future impairments of long-lived assets and goodwill may occur, and we may incur additional restructuring charges, which could be material. Future restructuring of our operating structure that changes our goodwill reporting units could also result in future impairments of our goodwill. Any such charges could negatively impact our results of operations.
Our level of indebtedness could, among other things, adversely affect our ability to raise additional capital to fund our operations, limit our ability to react to changes in the economy or our industry, and prevent us from meeting our obligations under the agreements relating to our indebtedness.
At December 31, 2017, we had approximately
$14.791 billion
of total long-term debt, as well as approximately
$102 million
in standby letters of credit outstanding in the aggregate, under our senior secured revolving credit facility (as amended, “Credit Agreement”) and our letter of credit facility agreement (as amended, “LC Facility”). Our Credit Agreement is collateralized by patient accounts receivable of substantially all of our domestic wholly owned acute care and specialty hospitals, and our LC Facility is guaranteed and secured by a first priority pledge of the capital stock and other ownership interests of certain of our hospital subsidiaries on an equal ranking basis with our existing senior secured notes. From time to
27
time, we expect to engage in additional capital market, bank credit and other financing activities, depending on our needs and financing alternatives available at that time.
The interest expense associated with our indebtedness offsets a substantial portion of our operating income. During 2017, our interest expense was
$1.028 billion
and represented approximately
92%
of our
$1.113 billion
of operating income. As a result, relatively small percentage changes in our operating income can result in a relatively large percentage change in our net income and earnings per share, both positively and negatively. In addition:
|
•
|
Our substantial indebtedness may limit our ability to adjust to changing market conditions and place us at a competitive disadvantage compared to our competitors that have less debt.
|
|
•
|
We may be more vulnerable in the event of a deterioration in our business, in the healthcare industry or in the economy generally, or if federal or state governments substantially limit or reduce reimbursement under the Medicare or Medicaid programs.
|
|
•
|
Our debt service obligations reduce the amount of funds available for our operations, capital expenditures and corporate development activities, and may make it more difficult for us to satisfy our financial obligations.
|
|
•
|
Our substantial indebtedness could limit our ability to obtain additional financing to fund future capital expenditures, working capital, acquisitions or other needs.
|
|
•
|
Our significant indebtedness may result in the market value of our stock being more volatile, potentially resulting in larger investment gains or losses for our shareholders, than the market value of the common stock of other companies that have a relatively smaller amount of indebtedness.
|
|
•
|
Most of our outstanding debt is either subject to early prepayment penalties, such as “make-whole premiums,” or is not currently callable. As a result, it may be costly to pursue debt repayment as a deleveraging strategy.
|
Furthermore, as described below, our Credit Agreement, LC Facility and the indentures governing our outstanding notes contain, and any future debt obligations may contain, covenants that, among other things, restrict our ability to pay dividends, incur additional debt and sell assets.
We may not be able to generate sufficient cash to service all of our indebtedness, and we may be forced to take other actions to satisfy our obligations under our indebtedness, which may not be successful.
Our ability to make scheduled payments on or to refinance our indebtedness depends on our financial and operating performance, which is subject to prevailing economic and competitive conditions and to financial, business and other factors that may be beyond our control. We cannot assure you that we will maintain a level of cash flows from operating activities sufficient to permit us to pay the principal, premium, if any, and interest on our indebtedness.
In addition, our ability to meet our debt service obligations is dependent upon the operating results of our subsidiaries and their ability to pay dividends or make other payments or advances to us. We hold most of our assets at, and conduct substantially all of our operations through, direct and indirect subsidiaries. Moreover, we are dependent on dividends or other intercompany transfers of funds from our subsidiaries to meet our debt service and other obligations, including payment on our outstanding debt. The ability of our subsidiaries to pay dividends or make other payments or advances to us will depend on their operating results and will be subject to applicable laws and restrictions contained in agreements governing the debt of such subsidiaries. Our less than wholly owned subsidiaries may also be subject to restrictions on their ability to distribute cash to us in their financing or other agreements and, as a result, we may not be able to access their cash flows to service their respective debt obligations.
If our cash flows and capital resources are insufficient to fund our debt service obligations, we may be forced to reduce or delay capital expenditures, including those required for operating our existing hospitals, for integrating our historical acquisitions or for future corporate development activities. We also may be forced to sell assets or operations, seek additional capital, or restructure or refinance our indebtedness. We cannot assure you that we would be able to take any of these actions, that these actions would be successful and permit us to meet our scheduled debt service obligations, or that these actions would be permitted under the terms of our existing or future debt agreements, including our Credit Agreement, LC Facility and the indentures governing our outstanding notes.
28
Restrictive covenants in the agreements governing our indebtedness may adversely affect us.
Our Credit Agreement, LC Facility and the indentures governing our outstanding notes contain various covenants that, among other things, limit our ability and the ability of our subsidiaries to:
|
•
|
incur, assume or guarantee additional indebtedness;
|
|
•
|
incur liens;
|
|
•
|
make certain investments;
|
|
•
|
provide subsidiary guarantees;
|
|
•
|
consummate asset sales;
|
|
•
|
redeem debt that is subordinated in right of payment to outstanding indebtedness;
|
|
•
|
enter into sale and lease-back transactions;
|
|
•
|
enter into transactions with affiliates; and
|
|
•
|
consolidate, merge or sell all or substantially all of our assets.
|
These restrictions are subject to a number of important exceptions and qualifications.
In addition, so long as any obligation or commitment is outstanding under our Credit Agreement and LC Facility, the terms of such facilities require us to maintain a financial ratio relating to our ability to satisfy certain fixed expenses, including interest payments. Our ability to meet these restrictive covenants and financial ratio may be affected by events beyond our control, and we cannot assure you that we will meet those tests. These restrictions could limit our ability to obtain future financing, make acquisitions or needed capital expenditures, withstand economic downturns in our business or the economy in general, conduct operations or otherwise take advantage of business opportunities that may arise. In addition, a breach of any of these covenants could cause an event of default, which, if not cured or waived, could require us to repay the indebtedness immediately. Under these conditions, we are not certain whether we would have, or be able to obtain, sufficient funds to make accelerated payments.
Despite current indebtedness levels, we may be able to incur substantially more debt or otherwise increase our leverage. This could further exacerbate the risks described above.
We have the ability to incur additional indebtedness in the future, subject to the restrictions contained in our Credit Agreement, LC Facility and the indentures governing our outstanding notes. We may decide to incur additional secured or unsecured debt in the future to finance our operations and any judgments or settlements or for other business purposes. Similarly, if we continue to sell assets, including the potential sale of Conifer, and do not use the proceeds to repay debt, this could further increase our leverage ratios.
Our Credit Agreement provides for revolving loans in an aggregate principal amount of up to $1 billion, with a $300 million subfacility for standby letters of credit. Based on our eligible receivables, approximately
$998 million
was available for borrowing under the Credit Agreement at December 31, 2017. Our LC Facility provides for the issuance of standby and documentary letters of credit in an aggregate principal amount of up to $180 million (subject to increase to up to $200 million). At December 31, 2017, we had no cash borrowings outstanding under the Credit Agreement, and we had approximately
$102 million
of standby letters of credit outstanding in the aggregate under the Credit Facility and the LC Facility. If new indebtedness is added or leverage increases, the related risks that we now face could intensify.
We could be subject to substantial uninsured liabilities or increased insurance costs as a result of significant legal actions.
We are subject to medical malpractice lawsuits, antitrust and other class action lawsuits and other legal actions in the ordinary course of business. Some of these actions may involve large demands, as well as substantial defense costs. Even in states that have imposed caps on damages, litigants are seeking recoveries under new theories of liability that might not be subject to such caps. Our professional and general liability insurance does not cover all claims against us, and it may not
29
continue to be available at a reasonable cost for us to maintain at adequate levels, as the healthcare industry has seen significant increases in the cost of such insurance due to increased litigation. We cannot predict the outcome of current or future legal actions against us or the effect that judgments or settlements in such matters may have on us or on our insurance costs. Additionally, all professional and general liability insurance we purchase is subject to policy limitations. If the aggregate limit of any of our professional and general liability policies is exhausted, in whole or in part, it could deplete or reduce the limits available to pay any other material claims applicable to that policy period. Any losses not covered by or in excess of the amounts maintained under insurance policies will be funded from our working capital. Furthermore, one or more of our insurance carriers could become insolvent and unable to fulfill its or their obligations to defend, pay or reimburse us when those obligations become due. In that case or if payments of claims exceed our estimates or are not covered by our insurance, it could have a material adverse effect on our business, financial condition, results of operations or cash flows.
Our hospitals, outpatient centers and other healthcare businesses operate in competitive environments, and competition in our markets can adversely affect patient volumes.
The healthcare business is highly competitive, and competition among hospitals and other healthcare providers for patients has intensified in recent years. Generally, other hospitals and outpatient centers in the local communities we serve provide services similar to those we offer, and, in some cases, competing facilities (1) are more established or newer than ours, (2) may offer a broader array of services to patients and physicians than ours, and (3) may have larger or more specialized medical staffs to admit and refer patients, among other things. Furthermore, healthcare consumers are now able to access hospital performance data on quality measures and patient satisfaction, as well as standard charges for services, to compare competing providers; if any of our hospitals achieve poor results (or results that are lower than our competitors) on quality measures or patient satisfaction surveys, or if our standard charges are higher than our competitors, we may attract fewer patients. Additional quality measures and future trends toward clinical transparency may have an unanticipated impact on our competitive position and patient volumes.
In the future, we expect to encounter increased competition from system-affiliated hospitals and healthcare companies, as well as health insurers and private equity companies seeking to acquire providers, in specific geographic markets. We also face competition from specialty hospitals (some of which are physician-owned) and unaffiliated freestanding outpatient centers for market share in high margin services and for quality physicians and personnel. In recent years, the number of freestanding specialty hospitals, surgery centers, emergency departments, urgent care centers and diagnostic imaging centers in the geographic areas in which we operate has increased significantly. Furthermore, some of the hospitals that compete with our hospitals are owned by government agencies or not-for-profit organizations supported by endowments and charitable contributions and can finance capital expenditures and operations on a tax-exempt basis. If our competitors are better able to attract patients, recruit physicians, expand services or obtain favorable managed care contracts at their facilities than we are, we may experience an overall decline in patient volumes.
Our USPI joint venture and our hospital-based joint ventures depend on existing relationships with key healthcare system partners. If we are not able to maintain historical relationships with these healthcare systems, or enter into new relationships, we may be unable to implement our business strategies successfully.
Our USPI joint venture and our hospital-based joint ventures depend in part on the efforts, reputations and success of healthcare system partners and the strength of our relationships with those healthcare systems. Our joint ventures could be adversely affected by any damage to those healthcare systems’ reputations or to our relationships with them. In addition, damage to our business reputation could negatively impact the willingness of healthcare systems to enter into relationships with us or our USPI joint venture. Moreover, in many cases, our joint venture agreements are structured to comply with current revenue rulings published by the Internal Revenue Service (“IRS”), as well as case law, relevant to joint ventures between for-profit and not-for-profit healthcare entities. Material changes in these authorities could adversely affect our relationships with healthcare system partners. If we are unable to maintain existing arrangements on favorable terms or enter into relationships with additional healthcare system partners, we may be unable to implement our business strategies for our joint ventures successfully.
The put/call arrangements associated with our USPI joint venture, if settled in cash, will require us to utilize our cash flow or incur additional indebtedness to satisfy the payment obligations in respect of such arrangements.
As previously disclosed, as part of the formation of our USPI joint venture in 2015, we entered into a put/call agreement (the “Put/Call Agreement”) with respect to the equity interests in the joint venture held by our joint venture partners. In January 2016, Welsh Carson, on behalf of our joint venture partners, delivered a put notice for the minimum number of shares they were required to put to us in 2016 according to the Put/Call Agreement. In April 2016, we paid approximately $127 million to purchase those shares, which increased our ownership interest in the USPI joint venture to
30
approximately 56.3%. On May 1, 2017, we amended and restated the Put/Call Agreement to provide for, among other things, the acceleration of our acquisition of certain shares of our USPI joint venture. Under the terms of the amendment, we agreed to pay Welsh Carson, on or before July 3, 2017, approximately $711 million to buy 23.7% of our USPI joint venture, which amount is subject to adjustment for actual 2017 financial results in accordance with the terms of the Put/Call Agreement. On July 3, 2017, we paid approximately $716 million for the purchase of these shares, which increased our ownership interest in the USPI joint venture to 80.0%, as well as the final adjustment to the 2016 purchase price.
The amended and restated Put/Call Agreement also provides that the remaining 15% ownership interest in our USPI joint venture held by our Welsh Carson joint venture partners is subject to put options in equal shares in each of 2018 and 2019. In January 2018, Welsh Carson, on behalf of our joint venture partners, delivered a put notice for the number of shares that represent a 7.5% ownership interest in our USPI joint venture in accordance with the amended and restated Put/Call Agreement. The parties are in discussions regarding the calculation of the estimated purchase price relating to the exercise of the 2018 put option, which price is based on an agreed-upon estimate of 2018 financial results and is subject to a true-up following the finalization of actual 2018 financial results.
We expect that the estimated payment
in 2018 will be
between $285 million and $295 million
, prior to any true-up payments related to actual financial results in 2017 or 2018.
In the event our Welsh Carson joint venture partners do not exercise their 2019 put option, we will have the option, but not the obligation, to buy the remaining 7.5% of our USPI joint venture from them in 2019. In connection with the aforementioned put and call options, we have the ability to choose whether to settle the purchase price in cash or shares of our common stock.
We have also entered into a separate put/call agreement (the “Baylor Put/Call Agreement”) with Baylor that contains put and call options with respect to the 5% ownership interest in the USPI joint venture held by Baylor. Each year starting in 2021, Baylor may put up to 33.3% of their total shares in the USPI joint venture held as of January 1, 2017. In each year that Baylor does not put the full 33.3% of the USPI joint venture’s shares allowable, we may call the difference between the number of shares Baylor put and the maximum number of shares they could have put that year. In addition, the Baylor Put/Call Agreement contains a call option pursuant to which we have the ability to acquire all of Baylor’s ownership interest by 2024. We have the ability to choose whether to settle the purchase price for the Baylor put/call in cash or shares of our common stock.
The put and call arrangements described above, to the extent settled in cash, may require us to dedicate a substantial portion of our cash flow to satisfy our payment obligations in respect of such arrangements, which may reduce the amount of funds available for our operations, capital expenditures and corporate development activities. Similarly, we may be required to incur additional indebtedness to satisfy our payment obligations in respect of such arrangements, which could have important consequences to our business and operations, as described more fully above.
Our existing joint ventures may limit our flexibility with respect to such jointly owned investments and could, thereby, have a material adverse effect on our business, results of operations and financial condition, as well as our ability to sell the underlying assets or ownership interests in the joint ventures.
We have invested in a number of joint ventures with other entities when circumstances warranted the use of these structures, and we may form additional joint ventures in the future. These joint ventures may not be profitable or may not achieve the profitability that justifies the investments made. Furthermore, the nature of a joint venture requires us to consult with and share certain decision-making powers with unaffiliated third parties, some of which may be not-for-profit healthcare systems. If our joint venture partners do not fulfill their obligations, the affected joint venture may not be able to operate according to its business or strategic plans. In that case, our results could be adversely affected or we may be required to increase our level of financial commitment to the joint venture. Moreover, differences in economic or business interests or goals among joint venture participants could result in delayed decisions, failures to agree on major issues and even litigation. If these differences cause the joint ventures to deviate from their business or strategic plans, or if our joint venture partners take actions contrary to our policies, objectives or the best interests of the joint venture, our results could be adversely affected. In addition, our relationships with not-for-profit healthcare systems and the joint venture agreements that govern these relationships are intended to be structured to comply with current IRS revenue rulings, as well as case law relevant to joint ventures between for-profit and not-for-profit healthcare entities. Material changes in these authorities could adversely affect our relationships with not-for-profit healthcare systems and related joint venture arrangements.
Our participation in joint ventures is also subject to the risks that:
|
•
|
We could experience an impasse on certain decisions because we do not have sole decision-making authority, which could require us to expend additional resources on resolving such impasses or potential disputes.
|
|
•
|
We may not be able to maintain good relationships with our joint venture partners (including healthcare systems), which could limit our future growth potential and could have an adverse effect our business strategies.
|
31
|
•
|
Our joint venture partners could have investment or operational goals that are not consistent with our corporate-wide objectives, including the timing, terms and strategies for investments or future growth opportunities.
|
|
•
|
Our joint venture partners might become bankrupt, fail to fund their share of required capital contributions or fail to fulfill their other obligations as joint venture partners, which may require us to infuse our own capital into any such venture on behalf of the related joint venture partner or partners despite other competing uses for such capital.
|
|
•
|
Many of our existing joint ventures require that one of our wholly owned affiliates provide a working capital line of credit to the joint venture, which could require us to allocate substantial financial resources to the joint venture potentially impacting our ability to fund our other short-term obligations.
|
|
•
|
Some of our existing joint ventures require mandatory capital expenditures for the benefit of the applicable joint venture, which could limit our ability to expend funds on other corporate opportunities.
|
|
•
|
Our joint venture partners may have exit rights that would require us to purchase their interests upon the occurrence of certain events or the passage of certain time periods, which could impact our financial condition by requiring us to incur additional indebtedness in order to complete such transactions or, alternatively, in some cases we may have the option to issue shares of our common stock to our joint venture partners to satisfy such obligations, which would dilute the ownership of our existing stockholders.
|
|
•
|
Our joint venture partners may have competing interests in our markets that could create conflict of interest issues.
|
|
•
|
Any sale or other disposition of our interest in a joint venture or underlying assets of the joint venture may require consents from our joint venture partners, which we may not be able to obtain.
|
|
•
|
Certain corporate-wide or strategic transactions may also trigger other contractual rights held by a joint venture partner (including termination or liquidation rights) depending on how the transaction is structured, which could impact our ability to complete such transactions.
|
|
•
|
Our joint venture arrangements that involve financial and ownership relationships with physicians and others who either refer or influence the referral of patients to our hospitals or other healthcare facilities are subject to greater regulatory scrutiny and may not quality for safe harbor protection from the Anti-kickback Statute.
|
Conifer operates in a highly competitive industry, and its current or future competitors may be able to compete more effectively than Conifer does, which could have a material adverse effect on Conifer’s margins, growth rate and market share.
We are continuing to market and expand Conifer’s revenue cycle management, patient communications and engagement services, and value-based care solutions businesses. However, there can be no assurance that Conifer will be successful in generating new client relationships, including with respect to hospitals we or Conifer’s other clients sell, as the respective buyers may not continue to use Conifer’s services or, if they do, they may not do so under the same contractual terms. The market for Conifer’s solutions is highly competitive, and we expect competition may intensify in the future. Conifer faces competition from existing participants and new entrants to the revenue cycle management market, as well as from the staffs of hospitals and other healthcare providers who handle these processes internally. In addition, electronic medical record software vendors may expand into services offerings that compete with Conifer. To be successful, Conifer must respond more quickly and effectively than its competitors to new or changing opportunities, technologies, standards, regulations and client requirements. Moreover, existing or new competitors may introduce technologies or services that render Conifer’s technologies or services obsolete or less marketable. Even if Conifer’s technologies and services are more effective than the offerings of its competitors, current or potential clients might prefer competitive technologies or services to Conifer’s technologies and services. Furthermore, increased competition has resulted and may continue to result in pricing pressures, which could negatively impact Conifer’s margins, growth rate or market share.
32
The failure to comply with consumer protection laws could subject Conifer and its subsidiaries to fines and other liabilities, as well as harm Conifer’s business and reputation.
Conifer and its subsidiaries are subject to numerous federal, state and local consumer protection laws governing such topics as privacy, finance, debt collection and credit reporting. Regulations governing debt collection are subject to changing interpretations that may be inconsistent among different jurisdictions. In addition, a regulatory determination made by, or a settlement or consent decree entered into with, one regulatory agency, such as the Consumer Financial Protection Bureau, may not be binding upon, or preclude, investigations or regulatory actions by state or local agencies. Conifer’s failure to comply with consumer financial, debt collection and credit reporting requirements could result in, among other things, the issuance of cease and desist orders (which can include orders for restitution or rescission of contracts, as well as other kinds of affirmative relief), the imposition of fines or refunds, and other civil and criminal penalties, some of which could be significant in the case of knowing or reckless violations. In addition, Conifer’s failure to comply with the statutes and regulations applicable to it could result in reduced demand for its services, invalidate all or portions of some of Conifer’s services agreements with its clients, give clients the right to terminate Conifer’s services agreements with them or give rise to contractual liabilities, among other things, any of which could have an adverse effect on Conifer’s business. Furthermore, if Conifer or its subsidiaries become subject to fines or other penalties, it could harm Conifer’s reputation, thereby making it more difficult for Conifer to retain existing clients or attract new clients.
Economic factors, consumer behavior and other dynamics have affected, and may continue to impact, our business, financial condition and results of operations.
We believe broad economic factors (including high unemployment rates in some of the markets our facilities serve), instability in consumer spending, uncertainty regarding the future of the Affordable Care Act, and the continued shift of additional financial responsibility to insured patients through higher co-pays, deductibles and premium contributions, among other dynamics, have affected our service mix, revenue mix and volumes, as well as our ability to collect outstanding receivables. The United States economy remains unpredictable. If industry trends (including reductions in commercial managed care enrollment and patient decisions to postpone or cancel elective and non-emergency healthcare procedures) worsen or if general economic conditions deteriorate, we may not be able to sustain future profitability, and our liquidity and ability to repay our outstanding debt may be harmed.
It is essential to our ongoing business that we attract an appropriate number of quality physicians in the specialties required to support our services and that we maintain good relations with those physicians.
The success of our business depends in significant part on the number, quality, specialties, and admitting and scheduling practices of the licensed physicians who have been admitted to the medical staffs of our hospitals and who affiliate with us and use our facilities as an extension of their practices. Physicians are often not employees of the hospitals or surgery centers at which they practice. Members of the medical staffs of our hospitals also often serve on the medical staffs of facilities we do not operate, and they are free to terminate their association with our hospitals or admit their patients to competing facilities at any time. In addition, although physicians who own interests in our facilities are generally subject to agreements restricting them from owning an interest in competitive facilities, we may not learn of, or be unsuccessful in preventing, our physician partners from acquiring interests in competitive facilities.
We expect to encounter increased competition from health insurers and private equity companies seeking to acquire providers in the markets where we operate physician practices and, where permitted by law, employ physicians. In some of our markets, physician recruitment and retention are affected by a shortage of physicians in certain specialties and the difficulties that physicians can experience in obtaining affordable malpractice insurance or finding insurers willing to provide such insurance. Furthermore, our ability to recruit and employ physicians is closely regulated. For example, the types, amount and duration of compensation and assistance we can provide to recruited physicians are limited by the Stark law, the Anti-kickback Statute, state anti-kickback statutes and related regulations. All arrangements with physicians must also be fair market value and commercially reasonable. If we are unable to attract and retain sufficient numbers of quality physicians by providing adequate support personnel, technologically advanced equipment, and facilities that meet the needs of those physicians and their patients, physicians may be discouraged from referring patients to our facilities, admissions and outpatient visits may decrease and our operating performance may decline.
Our labor costs could be adversely affected by competition for staffing, the shortage of experienced nurses and labor union activity.
The operations of our facilities are dependent on the efforts, abilities and experience of our management and medical support personnel, including nurses, therapists, pharmacists and lab technicians, as well as our employed physicians. We
33
compete with other healthcare providers in recruiting and retaining employees, and, like others in the healthcare industry, we continue to experience a shortage of critical-care nurses in certain disciplines and geographic areas. As a result, from time to time, we may be required to enhance wages and benefits to recruit and retain experienced employees, make greater investments in education and training for newly licensed medical support personnel, or hire more expensive temporary or contract employees. Furthermore, state-mandated nurse-staffing ratios in California affect not only our labor costs, but, if we are unable to hire the necessary number of experienced nurses to meet the required ratios, they may also cause us to limit volumes, which would have a corresponding adverse effect on our net operating revenues. In general, our failure to recruit and retain qualified management, experienced nurses and other medical support personnel, or to control labor costs, could have a material adverse effect on our business, financial condition, results of operations or cash flows.
Increased labor union activity is another factor that could adversely affect our labor costs. At December 31, 2017, approximately 24% of the employees in our Hospital Operations and other segment were represented by labor unions. There were no unionized employees in our Ambulatory Care segment, and less than 1% of Conifer’s employees belong to a union. Unionized employees - primarily registered nurses and service, technical and maintenance workers - are located at 35 of our hospitals, the majority of which are in California, Florida and Michigan. We currently have six expired contracts covering approximately 14% of our unionized employees and are or will be negotiating renewals under extension agreements. We are also negotiating (or will soon negotiate) six first contracts at four hospitals where employees recently selected union representation; these contracts cover approximately 5% of our unionized employees. At this time, we are unable to predict the outcome of the negotiations, but increases in salaries, wages and benefits could result from these agreements. Furthermore, there is a possibility that strikes could occur during the negotiation process, which could increase our labor costs and have an adverse effect on our volumes and net operating revenues. Organizing activities by labor unions could increase our level of union representation in future periods; to the extent a greater portion of our employee base unionizes, it is possible our labor costs could increase materially.
Conifer’s future success also depends in part on our ability to attract, hire, integrate and retain key personnel. Competition for the caliber and number of employees we require at Conifer is intense. We may face difficulty identifying and hiring qualified personnel at compensation levels consistent with our existing compensation and salary structure. In addition, we invest significant time and expense in training Conifer’s employees, which increases their value to competitors who may seek to recruit them. If we fail to retain our Conifer employees, we could incur significant expenses in hiring, integrating and training their replacements, and the quality of Conifer’s services and its ability to serve its clients could diminish, resulting in a material adverse effect on that segment of our business.
The utilization of our tax losses could be substantially limited if we experience an ownership change as defined in the Internal Revenue Code.
At December 31, 2017, we had federal net operating loss (“NOL”) carryforwards of approximately
$1.6 billion
pre-tax available to offset future taxable income. These NOL carryforwards will expire in the years 2025 to 2034. Section 382 of the Internal Revenue Code imposes an annual limitation on the amount of a company’s taxable income that may be offset by the NOL carryforwards if it experiences an “ownership change” as defined in Section 382 of the Code. An ownership change occurs when a company’s “five-percent shareholders” (as defined in Section 382 of the Code) collectively increase their ownership in the company by more than 50 percentage points (by value) over a rolling three-year period. (This is different from a change in beneficial ownership under applicable securities laws.) These ownership changes include purchases of common stock under share repurchase programs, a company’s offering of its stock, the purchase or sale of company stock by five-percent shareholders, or the issuance or exercise of rights to acquire company stock. While we expect to be able to realize our total NOL carryforwards prior to their expiration, if an ownership change occurs, our ability to use the NOL carryforwards to offset future taxable income will be subject to an annual limitation and will depend on the amount of taxable income we generate in future periods. There is no assurance that we will be able to fully utilize the NOL carryforwards. Furthermore, we could be required to record a valuation allowance related to the amount of the NOL carryforwards that may not be realized, which could adversely impact our results of operations.
On August 31, 2017,
we entered into a rights agreement as a measure intended to deter the above-referenced ownership changes in order to preserve
the Company’s
NOL carryforwards
. The rights agreement is scheduled to expire following the conclusion of the Company’s 2018 annual meeting of stockholders. Following the 2018 annual meeting, the board intends to further evaluate the ongoing need for a rights agreement based on status of risk to the Company’s NOLs. The rights agreement may not prevent an ownership change, however. In addition, while the rights agreement is in effect, it could discourage or prevent a merger, tender offer, proxy contest or accumulations of substantial blocks of shares for which some shareholders might receive a premium above market value. It could also adversely affect the liquidity of the market for the Company’s common stock.
34
Our business could be negatively affected by security threats, catastrophic events and other disruptions affecting our information technology and related systems.
Information technology is a critical component of the day-to-day operation of our business. We rely on our information technology to process, transmit and store sensitive and confidential data, including protected health information, personally identifiable information, and our proprietary and confidential business performance data. We utilize electronic health records and other information technology in connection with all of our operations, including our billing and supply chain and labor management operations. Our systems, in turn, interface with and rely on third-party systems. Although we monitor and routinely test our security systems and processes and have a diversified data network that provides redundancies as well as other measures designed to protect the security and availability of the data we process, transmit and store, our information technology and infrastructure have been, and will likely continue to be, subject to computer viruses, attacks by hackers, or breaches due to employee error or malfeasance. While we are not aware of having experienced a material breach of our systems, the preventive actions we take to reduce the risk of such incidents and protect our information technology may not be sufficient in the future. As cybersecurity threats continue to evolve, we may not be able to anticipate certain attack methods in order to implement effective protective measures, and we may be required to expend significant additional resources to continue to modify and strengthen our security measures, investigate and remediate any vulnerabilities in our information systems and infrastructure, or invest in new technology designed to mitigate security risks. Third parties to whom we outsource certain of our functions, or with whom our systems interface and who may, in some instances, store our sensitive and confidential data, are also subject to the risks outlined above and may not have or use controls effective to protect such information. A breach or attack affecting any of these third parties could harm our business. Further, successful cyber-attacks at other healthcare services companies, whether or not we are impacted, could lead to a general loss of consumer confidence in our industry that could negatively affect us, including harming the market perception of the effectiveness of our security measures or of the healthcare industry in general, which could result in reduced use of our services. Though we have insurance against some cyber-risks and attacks, it may not be sufficient to offset the impact of a material loss event.
Our networks and technology systems are also subject to disruption due to events such as a major earthquake, fire, hurricane, telecommunications failure, terrorist attack or other catastrophic event.
Any breach or system interruption of our information systems or of third parties with access to our sensitive and confidential data could result in the unauthorized disclosure, misuse or loss of such data, could negatively impact our ability to conduct normal business operations (including the collection of revenues), and could result in potential liability under privacy, security, consumer protection or other applicable laws, regulatory penalties, negative publicity and damage to our reputation, any of which could have a material adverse effect on our business, financial position, results of operations or cash flows.
Our business and financial results could be harmed by a national or localized outbreak of a highly contagious or epidemic disease.
If an outbreak of an infectious disease, such as the Zika virus or the Ebola virus, were to occur nationally or in one of the regions our hospitals serve, our business and financial results could be adversely affected. The treatment of a highly contagious disease at one of our facilities may result in a temporary shutdown or diversion of patients. In addition, unaffected individuals may decide to defer elective procedures or otherwise avoid medical treatment, resulting in reduced patient volumes and operating revenues. Furthermore, we cannot predict the costs associated with the potential treatment of an infectious disease outbreak by our hospitals or preparation for such treatment.
When we acquire new assets or businesses, we become subject to various risks and uncertainties that could adversely affect our results of operations and financial condition.
We have completed a number of acquisitions in recent years, and we may pursue similar transactions in the future. With respect to planned or future transactions, we cannot provide any assurances that we will be able to identify suitable candidates, consummate transactions on terms that are favorable to us, or achieve synergies or other benefits in a timely manner or at all. Furthermore, companies or operations acquired may not be profitable or may not achieve the profitability that justifies the investments made. In addition, we may face significant challenges in integrating personnel and financial and other systems. Future acquisitions could result in potentially dilutive issuances of equity securities, the incurrence of additional debt and contingent liabilities, and increased operating expenses, any of which could adversely affect our results of operations and financial condition.
None.
35
The disclosure required under this Item is included in Item 1, Business, of Part I of this report.
Because we provide healthcare services in a highly regulated industry, we have been and expect to continue to be party to various lawsuits, claims and regulatory investigations from time to time. For information regarding material pending legal proceedings in which we are involved, see Note 14 to our Consolidated Financial Statements, which is incorporated by reference.
Not applicable.
36
|
ITEM 5.
|
MARKET FOR REGISTRANT’S COMMON EQUITY, RELATED STOCKHOLDER MATTERS AND ISSUER PURCHASES OF EQUITY SECURITIES
|
Common Stock.
Our common stock is listed on the New York Stock Exchange (“NYSE”) under the symbol “THC.” The following table sets forth, for the periods indicated, the high and low sales prices per share of our common stock on the NYSE:
|
|
High
|
Low
|
|||||
|
Year Ended December 31, 2017
|
|
|
|
|
|||
|
First Quarter
|
$
|
22.72
|
|
$
|
14.73
|
|
|
|
Second Quarter
|
20.00
|
|
14.66
|
|
|||
|
Third Quarter
|
21.19
|
|
12.54
|
|
|||
|
Fourth Quarter
|
16.92
|
|
12.25
|
|
|||
|
Year Ended December 31, 2016
|
|
|
|
|
|||
|
First Quarter
|
$
|
30.07
|
|
$
|
21.39
|
|
|
|
Second Quarter
|
34.08
|
|
25.71
|
|
|||
|
Third Quarter
|
31.84
|
|
20.93
|
|
|||
|
Fourth Quarter
|
24.13
|
|
14.06
|
|
|||
On February 16, 2018, the last reported sales price of our common stock on the NYSE composite tape was $19.50 per share. As of that date, there were 4,019 holders of record of our common stock. Our transfer agent and registrar is Computershare. Shareholders with questions regarding their stock certificates, including inquiries related to exchanging or replacing certificates or changing an address, should contact the transfer agent at (866) 229-8416.
Cash Dividends on Common Stock
. We have not paid cash dividends on our common stock since the first quarter of fiscal 1994. We currently intend to retain future earnings, if any, for the operation and development of our business and, accordingly, do not currently intend to pay any cash dividends on our common stock. Our board of directors will evaluate our future earnings, results of operations, financial condition and capital requirements in determining whether to pay any cash dividends in the future. Our senior secured revolving credit agreement and our letter of credit facility agreement contain provisions that limit the payment of cash dividends on our common stock if we do not meet certain financial ratios.
Equity Compensation.
Refer to Item 12, Security Ownership of Certain Beneficial Owners and Management and Related Stockholder Matters, of Part III of this report for information regarding securities authorized for issuance under our equity compensation plans.
Stock Performance Graph.
The following graph shows the cumulative, five-year total return for our common stock compared to the following indices:
|
•
|
Standard & Poor’s 500 Stock Index (a broad equity market index in which we are not included);
|
|
•
|
Standard & Poor’s Health Care Composite Index (a published industry index in which we are not included); and
|
|
•
|
A group made up of us and our hospital company peers (namely, Community Health Systems, Inc. (CYH), HCA Healthcare, Inc. (HCA), LifePoint Health, Inc. (LPNT), Tenet Healthcare Corporation (THC) and Universal Health Services, Inc. (UHS)), which we refer to as our “Peer Group”.
|
Performance data assumes that $100.00 was invested on December 31, 2012 in our common stock and each of the indices. The data assumes the reinvestment of all cash dividends and the cash value of other distributions. Moreover, in accordance with SEC regulations, the returns of each company in our Peer Group have been weighted according to the respective company’s stock market capitalization at the beginning of each period for which a return is indicated. The stock price performance shown in the graph is not necessarily indicative of future stock price performance. The performance graph shall not be deemed “filed” for purposes of Section 18 of the Exchange Act or incorporated by reference into any of our filings under the Securities Act or the Exchange Act, except as shall be expressly set forth by specific reference in such filing.
37
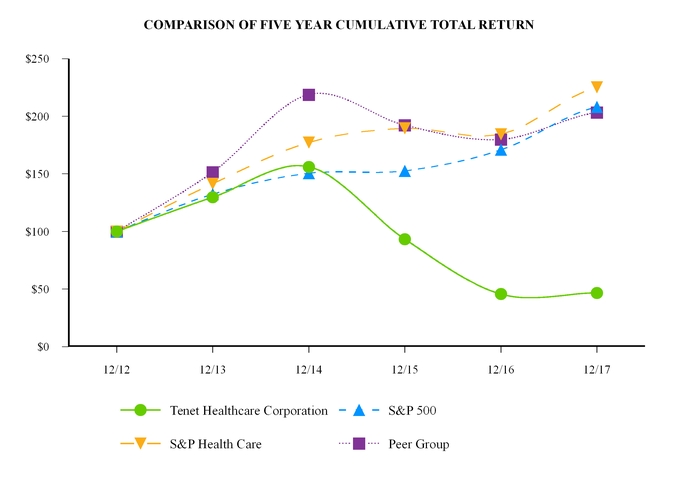
|
|
12/12
|
12/13
|
12/14
|
12/15
|
12/16
|
12/17
|
|||||||||||||||||
|
Tenet Healthcare Corporation
|
$
|
100.00
|
|
$
|
129.72
|
|
$
|
156.05
|
|
$
|
93.32
|
|
$
|
45.70
|
|
$
|
46.69
|
|
|||||
|
S&P 500
|
$
|
100.00
|
|
$
|
132.39
|
|
$
|
150.51
|
|
$
|
152.59
|
|
$
|
170.84
|
|
$
|
208.14
|
|
|||||
|
S&P Health Care
|
$
|
100.00
|
|
$
|
141.46
|
|
$
|
177.30
|
|
$
|
189.52
|
|
$
|
184.42
|
|
$
|
225.13
|
|
|||||
|
Peer Group
|
$
|
100.00
|
|
$
|
151.48
|
|
$
|
218.78
|
|
$
|
192.16
|
|
$
|
179.82
|
|
$
|
203.29
|
|
|||||
38
OPERATING RESULTS
The following tables present selected consolidated financial data for Tenet Healthcare Corporation and its wholly owned and majority-owned subsidiaries for the years ended December 31, 2013 through 2017. Effective June 16, 2015, we completed the transaction that combined our freestanding ambulatory surgery and imaging center assets with the surgical facility assets of United Surgical Partners International, Inc. (“USPI”) into our new USPI joint venture. The table below includes USPI results in the 2015 column for the post-acquisition period only. We acquired Vanguard Health Systems, Inc. (“Vanguard”) on October 1, 2013. The 2013 columns in the tables below include results of operations for Vanguard and its consolidated subsidiaries for the
three
months ended December 31, 2013 only. The tables should be read in conjunction with Item 7, Management’s Discussion and Analysis of Financial Condition and Results of Operations, and our Consolidated Financial Statements and notes thereto included in this report.
|
|
Years Ended December 31,
|
||||||||||||||||||
|
|
2017
|
2016
|
2015
|
2014
|
2013
|
||||||||||||||
|
|
(In Millions, Except Per-Share Amounts)
|
||||||||||||||||||
|
Net operating revenues:
|
|
|
|
|
|
|
|
|
|
|
|||||||||
|
Net operating revenues before provision for doubtful accounts
|
$
|
20,613
|
|
$
|
21,070
|
|
$
|
20,111
|
|
$
|
17,908
|
|
$
|
12,059
|
|
||||
|
Less: Provision for doubtful accounts
|
1,434
|
|
1,449
|
|
1,477
|
|
1,305
|
|
972
|
|
|||||||||
|
Net operating revenues
|
19,179
|
|
19,621
|
|
18,634
|
|
16,603
|
|
11,087
|
|
|||||||||
|
Equity in earnings of unconsolidated affiliates
|
144
|
|
131
|
|
99
|
|
12
|
|
15
|
|
|||||||||
|
Operating expenses:
|
|
|
|
|
|
|
|
|
|
||||||||||
|
Salaries, wages and benefits
|
9,274
|
|
9,328
|
|
8,990
|
|
8,013
|
|
5,354
|
|
|||||||||
|
Supplies
|
3,085
|
|
3,124
|
|
2,963
|
|
2,630
|
|
1,784
|
|
|||||||||
|
Other operating expenses, net
|
4,570
|
|
4,891
|
|
4,555
|
|
4,114
|
|
2,701
|
|
|||||||||
|
Electronic health record incentives
|
(9
|
)
|
(32
|
)
|
(72
|
)
|
(104
|
)
|
(96
|
)
|
|||||||||
|
Depreciation and amortization
|
870
|
|
850
|
|
797
|
|
849
|
|
545
|
|
|||||||||
|
Impairment and restructuring charges, and acquisition-related costs
|
541
|
|
202
|
|
318
|
|
153
|
|
103
|
|
|||||||||
|
Litigation and investigation costs, net of insurance recoveries
|
23
|
|
293
|
|
291
|
|
25
|
|
31
|
|
|||||||||
|
Gains on sales, consolidation and deconsolidation of facilities
|
(144
|
)
|
(151
|
)
|
(186
|
)
|
—
|
|
—
|
|
|||||||||
|
Operating income
|
1,113
|
|
1,247
|
|
1,077
|
|
935
|
|
680
|
|
|||||||||
|
Interest expense
|
(1,028
|
)
|
(979
|
)
|
(912
|
)
|
(754
|
)
|
(474
|
)
|
|||||||||
|
Other non-operating expense, net
|
(22
|
)
|
(20
|
)
|
(20
|
)
|
(10
|
)
|
(16
|
)
|
|||||||||
|
Loss from early extinguishment of debt
|
(164
|
)
|
—
|
|
(1
|
)
|
(24
|
)
|
(348
|
)
|
|||||||||
|
Income (loss) from continuing operations, before income taxes
|
(101
|
)
|
248
|
|
144
|
|
147
|
|
(158
|
)
|
|||||||||
|
Income tax benefit (expense)
|
(219
|
)
|
(67
|
)
|
(68
|
)
|
(49
|
)
|
65
|
|
|||||||||
|
Income (loss) from continuing operations, before discontinued operations
|
(320
|
)
|
181
|
|
76
|
|
98
|
|
(93
|
)
|
|||||||||
|
Less: Net income attributable to noncontrolling interests from continuing operations
|
384
|
|
368
|
|
218
|
|
64
|
|
30
|
|
|||||||||
|
Net income (loss) attributable to Tenet Healthcare Corporation common shareholders from continuing operations
|
$
|
(704
|
)
|
$
|
(187
|
)
|
$
|
(142
|
)
|
$
|
34
|
|
$
|
(123
|
)
|
||||
|
Basic earnings (loss) per share attributable to Tenet Healthcare Corporation common shareholders from continuing operations
|
$
|
(7.00
|
)
|
$
|
(1.88
|
)
|
$
|
(1.43
|
)
|
$
|
0.35
|
|
$
|
(1.21
|
)
|
||||
|
Diluted earnings (loss) per share attributable to Tenet Healthcare Corporation common shareholders from continuing operations
|
$
|
(7.00
|
)
|
$
|
(1.88
|
)
|
$
|
(1.43
|
)
|
$
|
0.34
|
|
$
|
(1.21
|
)
|
||||
The operating results data presented above is not necessarily indicative of our future results of operations. Reasons for this include, but are not limited to: overall revenue and cost trends, particularly the timing and magnitude of price changes; fluctuations in contractual allowances and cost report settlements and valuation allowances; managed care contract negotiations, settlements or terminations and payer consolidations; changes in Medicare and Medicaid regulations; Medicaid and other supplemental funding levels set by the states in which we operate; the timing of approval by the Centers for Medicare
39
and Medicaid Services (“CMS”) of Medicaid provider fee revenue programs; trends in patient accounts receivable collectability and associated provisions for doubtful accounts; fluctuations in interest rates; levels of malpractice insurance expense and settlement trends; impairment of long-lived assets and goodwill; restructuring charges; losses, costs and insurance recoveries related to natural disasters and other weather-related occurrences; litigation and investigation costs; acquisitions and dispositions of facilities and other assets; gains (losses) on sales, consolidation and deconsolidation of facilities; income tax rates and deferred tax asset valuation allowance activity; changes in estimates of accruals for annual incentive compensation; the timing and amounts of stock option and restricted stock unit grants to employees and directors; gains or losses from early extinguishment of debt; and changes in occupancy levels and patient volumes. Factors that affect patient volumes and, thereby, the results of operations at our hospitals and related healthcare facilities include, but are not limited to: changes in federal and state healthcare regulations; the business environment, economic conditions and demographics of local communities in which we operate; the number of uninsured and underinsured individuals in local communities treated at our hospitals; seasonal cycles of illness; climate and weather conditions; physician recruitment, retention and attrition; advances in technology and treatments that reduce length of stay; local healthcare competitors; managed care contract negotiations or terminations; the number of patients with high-deductible health insurance plans; hospital performance data on quality measures and patient satisfaction, as well as standard charges for services; any unfavorable publicity about us, or our joint venture partners, that impacts our relationships with physicians and patients; and the timing of elective procedures.
|
|
December 31,
|
||||||||||||||||||
|
|
2017
|
2016
|
2015
|
2014
|
2013
|
||||||||||||||
|
|
(In Millions)
|
||||||||||||||||||
|
Working capital (current assets minus current liabilities)
|
$
|
1,241
|
|
$
|
1,223
|
|
$
|
863
|
|
$
|
393
|
|
$
|
599
|
|
||||
|
Total assets
|
23,385
|
|
24,701
|
|
23,682
|
|
17,951
|
|
16,450
|
|
|||||||||
|
Long-term debt, net of current portion
|
14,791
|
|
15,064
|
|
14,383
|
|
11,505
|
|
10,696
|
|
|||||||||
|
Redeemable noncontrolling interests in equity of consolidated subsidiaries
|
1,866
|
|
2,393
|
|
2,266
|
|
401
|
|
340
|
|
|||||||||
|
Noncontrolling interests
|
686
|
|
665
|
|
267
|
|
134
|
|
123
|
|
|||||||||
|
Total equity
|
539
|
|
1,082
|
|
958
|
|
785
|
|
878
|
|
|||||||||
CASH FLOW DATA
|
|
Years Ended December 31,
|
||||||||||||||||||
|
|
2017
|
2016
|
2015
|
2014
|
2013
|
||||||||||||||
|
|
(In Millions)
|
||||||||||||||||||
|
Net cash provided by operating activities
|
$
|
1,200
|
|
$
|
558
|
|
$
|
1,026
|
|
$
|
687
|
|
$
|
589
|
|
||||
|
Net cash provided by (used in) investing activities
|
21
|
|
(430
|
)
|
(1,317
|
)
|
(1,322
|
)
|
(2,164
|
)
|
|||||||||
|
Net cash provided by (used in) financing activities
|
(1,326
|
)
|
232
|
|
454
|
|
715
|
|
1,324
|
|
|||||||||
40
INTRODUCTION TO MANAGEMENT’S DISCUSSION AND ANALYSIS
The purpose of this section, Management’s Discussion and Analysis of Financial Condition and Results of Operations (“MD&A”), is to provide a narrative explanation of our financial statements that enables investors to better understand our business, to enhance our overall financial disclosures, to provide the context within which our financial information may be analyzed, and to provide information about the quality of, and potential variability of, our financial condition, results of operations and cash flows. Our Hospital Operations and other segment
is comprised of our acute care hospitals, ancillary outpatient facilities, urgent care centers, microhospitals and physician practices. As described in Note 4
to the accompanying Consolidated Financial Statements
, certain of our facilities are classified as held for sale
at
December 31, 2017
. Our Ambulatory Care segment is comprised of the operations of our USPI Holding Company, Inc. (“USPI joint venture”), in which we own a majority interest, and European Surgical Partners Limited (“Aspen”) facilities, which are classified as held for sale at
December 31, 2017
. At
December 31, 2017
, our USPI joint venture had interests in
247
ambulatory surgery centers,
34
urgent care centers,
23
imaging centers and
20
surgical hospitals in
28
states, and Aspen operated
nine
private hospitals and clinics in the United Kingdom. Our Conifer segment
provides healthcare business process services in the areas of hospital and physician revenue cycle management and value-based care solutions to healthcare systems, as well as individual hospitals, physician practices, self-insured organizations, health plans and other entities
, through our Conifer Holdings, Inc. (“Conifer”) subsidiary. MD&A, which should be read in conjunction with the accompanying Consolidated Financial Statements, includes the following sections:
|
•
|
Management Overview
|
|
•
|
Sources of Revenue for Our Hospital Operations and Other Segment
|
|
•
|
Results of Operations
|
|
•
|
Liquidity and Capital Resources
|
|
•
|
Off-Balance Sheet Arrangements
|
|
•
|
Recently Issued Accounting Standards
|
|
•
|
Critical Accounting Estimates
|
Unless otherwise indicated, all financial and statistical information included in MD&A relates to our continuing operations, with dollar amounts expressed in millions (except per share, per admission, per adjusted admission, per patient day, per adjusted patient day, per visit and per case amounts). Due to the adoption of Financial Accounting Standards Board (“FASB”) Accounting Standards Update (“ASU”) 2017-07, “Compensation-Retirement Benefits (Topic 715) Improving the Presentation of Net Periodic Pension Cost and Net Periodic Postretirement Benefit Cost” discussed in Note 1 to the accompanying Consolidated Financial Statements, we have restated our salaries, wages and benefits expense for the 2016 and 2015 periods presented herein. Continuing operations information includes the results of (i) our same
72
hospitals operated throughout the years ended
December 31, 2017
and
2016
, (ii)
five Georgia hospitals, which we divested effective April 1, 2016
, (iii) The Hospitals of Providence (“THOP”) Transmountain Campus, a teaching hospital we opened in January 2017 in El Paso, and (iv)
three Houston-area hospitals, which we divested effective August 1, 2017
. Continuing operations information excludes the results of our hospitals and other businesses that have been classified as discontinued operations for accounting purposes. In addition, although we operated four North Texas hospitals throughout the years ended December 31, 2017 and 2016 as part of a joint venture, as described herein, we do not consolidate the results of operations of these hospitals because we divested a controlling interest in them effective January 1, 2016.
MANAGEMENT OVERVIEW
RECENT DEVELOPMENTS
Welsh Carson Put Notice—
In January 2018, subsidiaries of Welsh, Carson, Anderson & Stowe delivered a put notice for the number of shares that represent a 7.5% ownership interest in our USPI joint venture in accordance with our amended and restated Put/Call Agreement
, as described and defined in Note 15 to the accompanying Consolidated Financial Statements. The parties are in discussions regarding the calculation of the estimated purchase price relating to the exercise of the 2018 put option, which price is based on an agreed-upon estimate of 2018 financial results and is subject to true-up following the finalization of actual 2018 financial results.
We expect that the estimated payment
in 2018 will be
between $285 million and $295 million
, prior to any true-up payments related to actual financial results in 2017 or 2018.
Sale of Two Acute Care Hospitals and Related Operations in Philadelphia—
Effective January 11, 2018, we completed the sale of our hospitals, physician practices and related assets in Philadelphia, Pennsylvania and the surrounding area. As a
41
result of this transaction, we recorded impairment charges of
$232 million
during the year ended
December 31, 2017
, and we received net pre-tax cash proceeds of
$152.5 million
, as well as a secured promissory note for
$17.5 million
, in the three months ending March 31, 2018. For additional details, see Note 4 to the accompanying Consolidated Financial Statements.
Definitive Agreement To Sell Des Peres Hospital and Related Operations in St. Louis—
On January 5, 2018, we announced the signing of a definitive agreement for the sale of our hospital, physician practices and other hospital-affiliated operations in St. Louis, Missouri. This sale, which is subject to customary closing conditions, including regulatory approvals, is expected to be completed in the first half of 2018. For additional details, see Note 4 to the accompanying Consolidated Financial Statements.
Agreement To Restructure Joint Venture Arrangements for Three North Texas Hospitals—
On January 4, 2018, we, along with Baylor Scott & White Health (“BSWH”), announced that we have entered into definitive agreements to restructure our joint venture arrangements for three North Texas hospitals: Baylor Scott & White Medical Center – Centennial (“Centennial”), Baylor Scott & White Medical Center – Lake Pointe (“Lake Pointe”), and Baylor Scott & White Medical Center – Sunnyvale (“Sunnyvale”). Under the definitive agreements, BSWH will, among other things, acquire our minority interests in Centennial and Lake Pointe and take over the operation of both hospitals. Sunnyvale, which is a joint venture between physicians, BSWH and Tenet, will become part of Texas Health Ventures Group, an existing joint venture between BSWH and our USPI joint venture, which will manage the operations of Sunnyvale. The transactions are currently expected to be completed in early 2018, subject to regulatory approvals and customary closing conditions.
Definitive Agreement To Sell Baylor Scott & White Medical Center – White Rock—
On December 26, 2017, we, along with BSWH, announced that we have entered into a definitive agreement to sell Baylor Scott & White Medical Center – White Rock (“White Rock”) to an unaffiliated third party. White Rock is part of a joint venture partnership with BSWH, in which we are the minority owner. The transaction is currently expected to be completed in early 2018, subject to regulatory approvals and customary closing conditions.
TRENDS AND STRATEGIES
The healthcare industry, in general, and the acute care hospital business, in particular, have been experiencing significant regulatory uncertainty based, in large part, on legislative and administrative efforts to significantly modify or repeal and potentially replace the Patient Protection and Affordable Care Act, as amended by the Health Care and Education Reconciliation Act of 2010 (“Affordable Care Act” or “ACA”). Although it is difficult to predict the full impact of this regulatory uncertainty on our future revenues and operations, we believe that our strategies will help us to address the following trends shaping the demand for healthcare services: (1) consumers, employers and insurers are actively seeking lower-cost solutions and better value as they focus more on healthcare spending; (2) patient volumes are shifting from inpatient to outpatient settings due to technological advancements and demand for care that is more convenient, affordable and accessible; (3) the industry is migrating to value-based payment models with government and private payers shifting risk to providers; and (4) consolidation continues across the entire healthcare sector.
Driving Growth in Our Hospital Systems—
We are committed to better positioning our hospital systems and competing more effectively in the ever-evolving healthcare environment. We are focused on improving operational effectiveness, increasing capital efficiency and margins, enhancing patient satisfaction, growing our higher-acuity inpatient service lines, expanding patient access points, and exiting businesses and markets that we believe are no longer strategic to our long-term growth. We recently announced enterprise-wide cost reduction initiatives, comprised primarily of workforce reductions and the renegotiation of contracts with suppliers and vendors, which are intended to lower annual operating expenses by $250 million. We anticipate achieving the full annualized run-rate savings by the end of 2018. Most of the savings are expected to be achieved through actions within our Hospital Operations and other segment, including eliminating a regional management layer and streamlining corporate overhead and centralized support functions. In conjunction with these initiatives, we incurred restructuring charges related to employee severance payments of approximately $42 million in the three months ended December 31, 2017, and we expect to incur additional such restructuring charges in 2018.
Expansion of Our Ambulatory Care Segment—
We remain focused on opportunities to expand our Ambulatory Care segment through organic growth, building new outpatient centers, corporate development activities and strategic partnerships. We believe our USPI joint venture’s surgery centers and surgical hospitals offer many advantages to patients and physicians, including greater affordability, predictability, flexibility and convenience. Moreover, due in part to advancements in medical technology, and due to the lower cost structure and greater efficiencies that are attainable at a specialized outpatient site, we believe the volume and complexity of surgical cases performed in an outpatient setting will continue to steadily increase. In addition, we have continued to grow our imaging and urgent care businesses through our USPI joint venture to reflect our broader strategies to (1) offer more services to patients, (2) broaden the capabilities we offer to healthcare systems and
42
physicians, and (3) expand into faster-growing, less capital intensive, higher-margin businesses. Historically, our outpatient services have generated significantly higher margins for us than inpatient services.
Exploration of a Potential Sale of Conifer While Continuing To Drive Conifer’s Growth—
In late 2017, we announced additional actions to support our goals of improving financial performance and enhancing shareholder value, including the exploration of a potential sale of Conifer. During this time, we remain focused on driving growth at Conifer by continuing to market and expand its revenue cycle management and value-based care solutions businesses. Conifer serves more than 800 Tenet and non-Tenet hospital and other clients nationwide. In addition to providing revenue cycle management services to both healthcare systems and physicians, Conifer provides support to both providers and self-insured employers seeking assistance with clinical integration, financial risk management and population health management.
Improving Profitability—
We are focused on improving profitability by growing patient volumes and effective cost management. We believe our patient volumes have been constrained by increased competition, utilization pressure by managed care organizations, new delivery models that are designed to lower the utilization of acute care hospital services, the effects of higher patient co-pays and deductibles, changing consumer behavior, and adverse economic conditions and demographic trends in certain of our markets. However, we also believe that targeted capital spending on growth opportunities for our hospitals, emphasis on higher-demand clinical service lines (including outpatient services), focus on expanding our ambulatory care business and contracting strategies that create shared value with payers should help us grow our patient volumes.
Reducing Our Leverage—
As of December 31, 2017, all of our outstanding long-term debt has a fixed rate of interest, and the maturity dates of our notes are staggered from 2019 through 2031. Although we believe that our capital structure minimizes the near-term impact of increased interest rates, and the staggered maturities of our debt allow us to refinance our debt over time, it is nonetheless our long-term objective to lower our ratio of debt-to-Adjusted EBITDA, primarily through more efficient capital allocation and Adjusted EBITDA growth, which should lower our refinancing risk and increase the potential for us to continue to use lower rate secured debt to refinance portions of our higher rate unsecured debt.
Our ability to execute on our strategies and manage the aforementioned trends is subject to a number of risks and uncertainties that may cause actual results to be materially different from expectations. For information about risks and uncertainties that could affect our results of operations, see the Forward-Looking Statements and Risk Factors sections in Part I of this report.
RECENT RESULTS OF OPERATIONS
We believe our results of operations for our most recent fiscal quarter best reflect recent trends we are experiencing with respect to volumes, revenues and expenses; therefore, we have provided below information about these metrics for the
three
months ended
December 31, 2017
and
2016
on a continuing operations basis, which includes the results of (i) our same
72
hospitals operated throughout the three months ended
December 31, 2017
and
2016
, (ii) our
THOP Transmountain Campus teaching hospital, which we opened in January 2017 in El Paso
, and (iii)
three Houston-area hospitals, which we divested effective August 1, 2017
. Although we operated Centennial, Lake Pointe, Sunnyvale and White Rock throughout the three months ended December 31, 2017 and 2016, we do not consolidate the results of operations of these hospitals because we divested a controlling interest in them effective January 1, 2016. The following tables also show information about facilities in our Ambulatory Care segment that we control and, therefore, consolidate.
43
|
Continuing Operations
|
||||||||||
|
|
Three Months Ended December 31,
|
|||||||||
|
Selected Operating Statistics
|
2017
|
2016
|
Increase
(Decrease)
|
|||||||
|
Hospital Operations and other – acute care hospitals and related outpatient facilities
|
|
|
|
|||||||
|
Number of hospitals (at end of period)
|
72
|
|
75
|
|
(3
|
)
|
(1)
|
|||
|
Total admissions
|
186,185
|
|
192,104
|
|
(3.1
|
)%
|
||||
|
Adjusted patient admissions
(2)
|
332,642
|
|
338,929
|
|
(1.9
|
)%
|
||||
|
Paying admissions (excludes charity and uninsured)
|
176,158
|
|
181,617
|
|
(3.0
|
)%
|
||||
|
Charity and uninsured admissions
|
10,027
|
|
10,487
|
|
(4.4
|
)%
|
||||
|
Emergency department visits
|
711,268
|
|
701,100
|
|
1.5
|
%
|
||||
|
Total surgeries
|
118,896
|
|
126,749
|
|
(6.2
|
)%
|
||||
|
Patient days — total
|
857,728
|
|
888,185
|
|
(3.4
|
)%
|
||||
|
Adjusted patient days
(2)
|
1,505,130
|
|
1,543,490
|
|
(2.5
|
)%
|
||||
|
Average length of stay (days)
|
4.61
|
|
4.62
|
|
(0.2
|
)%
|
||||
|
Average licensed beds
|
19,320
|
|
20,326
|
|
(4.9
|
)%
|
||||
|
Utilization of licensed beds
(3)
|
48.3
|
%
|
47.5
|
%
|
0.8
|
%
|
(1)
|
|||
|
Total visits
|
1,901,864
|
|
1,950,549
|
|
(2.5
|
)%
|
||||
|
Paying visits (excludes charity and uninsured)
|
1,777,790
|
|
1,834,844
|
|
(3.1
|
)%
|
||||
|
Charity and uninsured visits
|
124,074
|
|
115,705
|
|
7.2
|
%
|
||||
|
Ambulatory Care
|
||||||||||
|
Total consolidated facilities (at end of period)
|
227
|
|
215
|
|
12
|
|
(1)
|
|||
|
Total cases
|
488,046
|
|
445,107
|
|
9.6
|
%
|
||||
|
(1)
|
The change is the difference between the 2017 and 2016 amounts shown.
|
|
|
(2)
|
Adjusted patient admissions/days represents actual patient admissions/days adjusted to include outpatient services provided by facilities in our Hospital Operations and other segment by multiplying actual patient admissions/days by the sum of gross inpatient revenues and outpatient revenues and dividing the results by gross inpatient revenues.
|
|
|
(3)
|
Utilization of licensed beds represents patient days divided by number of days in the period divided by average licensed beds.
|
|
Total admissions
decreased
by
5,919
, or
3.1%
, in the three months ended
December 31, 2017
compared to the three months ended
December 31, 2016
, and total surgeries
decreased
by
7,853
, or
6.2%
, in the three months ended
December 31, 2017
compared to the
2016
period. Our emergency department visits
increased
1.5%
in the three months ended
December 31, 2017
compared to the same period in the prior year. Our volumes from continuing operations in the three months ended
December 31, 2017
compared to the three months ended
December 31, 2016
were negatively affected by the sale of our Houston-area facilities effective August 1, 2017. Our Ambulatory Care total cases
increased
9.6%
in the three months ended
December 31, 2017
compared to the
2016
period primarily due to the impact associated with stepping up our USPI joint venture’s ownership interests in previously held equity investments, which we began consolidating after we acquired controlling interests, and facilities added during 2017 through acquisitions and de novo development.
|
Continuing Operations
|
||||||||||||
|
|
Three Months Ended December 31,
|
|||||||||||
|
Revenues
|
2017
|
2016
|
Increase
(Decrease)
|
|||||||||
|
Net operating revenues before provision for doubtful accounts
|
|
|
||||||||||
|
Hospital Operations and other prior to inter-segment eliminations
|
$
|
4,508
|
|
$
|
4,488
|
|
0.4
|
%
|
||||
|
Ambulatory Care
|
556
|
|
487
|
|
14.2
|
%
|
||||||
|
Conifer
|
394
|
|
402
|
|
(2.0
|
)%
|
||||||
|
Inter-segment eliminations
|
(155
|
)
|
(163
|
)
|
(4.9
|
)%
|
||||||
|
Total
|
$
|
5,303
|
|
$
|
5,214
|
|
1.7
|
%
|
||||
|
Selected Hospital Operations and other – acute care hospitals and related outpatient facilities revenue data
|
|
|
|
|
|
|
||||||
|
Net inpatient revenues
|
$
|
2,721
|
|
$
|
2,606
|
|
4.4
|
%
|
||||
|
Net outpatient revenues
|
1,450
|
|
1,457
|
|
(0.5
|
)%
|
||||||
|
Net patient revenues
|
$
|
4,171
|
|
$
|
4,063
|
|
2.7
|
%
|
||||
|
Self-pay net inpatient revenues
|
$
|
99
|
|
$
|
127
|
|
(22.0
|
)%
|
||||
|
Self-pay net outpatient revenues
|
146
|
|
160
|
|
(8.8
|
)%
|
||||||
|
Total self-pay revenues
|
$
|
245
|
|
$
|
287
|
|
(14.6
|
)%
|
||||
44
Net operating revenues before provision for doubtful accounts
increased
by
$89 million
, or
1.7%
, in the three months ended
December 31, 2017
compared to the same period in
2016
. The increase is primarily due to
$267 million
of net revenues from the California provider fee program recognized in the 2017 period due to CMS’ approval of the 2017 program in December 2017 compared to
$65 million
recognized in the 2016 period, which increase was partially offset by the impact of the sale of our Houston-area facilities effective August 1, 2017. For our Hospital Operations and other segment, the impact of lower volumes on net operating revenues was partially mitigated by improved managed care pricing.
|
|
Continuing Operations
|
|||||||||||
|
|
Three Months Ended December 31,
|
|||||||||||
|
Provision for Doubtful Accounts
|
2017
|
2016
|
Increase (Decrease)
|
|||||||||
|
Provision for doubtful accounts
|
|
|
||||||||||
|
Hospital Operations and other
|
$
|
314
|
|
$
|
345
|
|
(9.0
|
)%
|
||||
|
Ambulatory Care
|
11
|
|
9
|
|
22.2
|
%
|
||||||
|
Total
|
$
|
325
|
|
$
|
354
|
|
(8.2
|
)%
|
||||
|
Provision for doubtful accounts as a percentage of net operating revenues before provision for doubtful accounts
|
||||||||||||
|
Hospital Operations and other
|
7.0
|
%
|
7.7
|
%
|
(0.7
|
)%
|
(1)
|
|||||
|
Ambulatory Care
|
2.0
|
%
|
1.8
|
%
|
0.2
|
%
|
(1)
|
|||||
|
Total
|
6.1
|
%
|
6.8
|
%
|
(0.7
|
)%
|
(1)
|
|||||
|
(1)
|
The change is the difference between the 2017 and 2016 amounts shown.
|
|
Provision for doubtful accounts as a percentage of net operating revenues before provision for doubtful accounts was
6.1%
and
6.8%
for the three months ended
December 31, 2017
and
2016
, respectively. This improvement was primarily driven by the decrease in uninsured revenues, the impact of our divestiture activity and the timing of the recognition of net revenues from the California provider fee program in the 2017 period discussed above. Our accounts receivable days outstanding (“AR Days”) from continuing operations (which calculation includes the accounts receivable of our St. Louis, Philadelphia-area, Chicago-area and Aspen facilities that have been classified as assets held for sale in the accompanying Consolidated Balance Sheet at
December 31, 2017
, excludes our divested Houston-area facilities and health plan revenues, and excludes our California provider fee revenues) were 55.2 days at
December 31, 2017
and 56.5 days at
December 31, 2016
, compared to our target of less than 55 days.
45
|
Continuing Operations
|
|||||||||||
|
|
Three Months Ended December 31,
|
||||||||||
|
Selected Operating Expenses
|
2017
|
2016
|
Increase
(Decrease)
|
||||||||
|
Hospital Operations and other
|
|
|
|
|
|
|
|||||
|
Salaries, wages and benefits
|
$
|
1,887
|
|
$
|
1,917
|
|
(1.6
|
)%
|
|||
|
Supplies
|
685
|
|
674
|
|
1.6
|
%
|
|||||
|
Other operating expenses
|
930
|
|
1,034
|
|
(10.1
|
)%
|
|||||
|
Total
|
$
|
3,502
|
|
$
|
3,625
|
|
(3.4
|
)%
|
|||
|
Ambulatory Care
|
|
|
|
|
|
|
|||||
|
Salaries, wages and benefits
|
$
|
165
|
|
$
|
157
|
|
5.1
|
%
|
|||
|
Supplies
|
113
|
|
99
|
|
14.1
|
%
|
|||||
|
Other operating expenses
|
93
|
|
83
|
|
12.0
|
%
|
|||||
|
Total
|
$
|
371
|
|
$
|
339
|
|
9.4
|
%
|
|||
|
Conifer
|
|
|
|
|
|
|
|||||
|
Salaries, wages and benefits
|
$
|
232
|
|
$
|
242
|
|
(4.1
|
)%
|
|||
|
Supplies
|
2
|
|
—
|
|
100.0
|
%
|
|||||
|
Other operating expenses
|
81
|
|
88
|
|
(8.0
|
)%
|
|||||
|
Total
|
$
|
315
|
|
$
|
330
|
|
(4.5
|
)%
|
|||
|
Total
|
|
|
|
|
|
|
|||||
|
Salaries, wages and benefits
|
$
|
2,284
|
|
$
|
2,316
|
|
(1.4
|
)%
|
|||
|
Supplies
|
800
|
|
773
|
|
3.5
|
%
|
|||||
|
Other operating expenses
|
1,104
|
|
1,205
|
|
(8.4
|
)%
|
|||||
|
Total
|
$
|
4,188
|
|
$
|
4,294
|
|
(2.5
|
)%
|
|||
|
Rent/lease expense
(1)
|
|
|
|
|
|
|
|||||
|
Hospital Operations and other
|
$
|
59
|
|
$
|
62
|
|
(4.8
|
)%
|
|||
|
Ambulatory Care
|
20
|
|
19
|
|
5.3
|
%
|
|||||
|
Conifer
|
5
|
|
4
|
|
25.0
|
%
|
|||||
|
Total
|
$
|
84
|
|
$
|
85
|
|
(1.2
|
)%
|
|||
|
(1)
|
Included in other operating expenses.
|
|
|
Continuing Operations
|
|||||||||||
|
|
Three Months Ended December 31,
|
||||||||||
|
Selected Operating Expenses per Adjusted Patient Admission
|
2017
|
2016
|
Increase
(Decrease)
|
||||||||
|
Hospital Operations and other
|
|
|
|
||||||||
|
Salaries, wages and benefits per adjusted patient admission
(1)
|
$
|
5,662
|
|
$
|
5,635
|
|
0.5
|
%
|
|||
|
Supplies per adjusted patient admission
(1)
|
2,058
|
|
1,983
|
|
3.8
|
%
|
|||||
|
Other operating expenses per adjusted patient admission
(1)
|
2,772
|
|
2,646
|
|
4.8
|
%
|
|||||
|
Total per adjusted patient admission
|
$
|
10,492
|
|
$
|
10,264
|
|
2.2
|
%
|
|||
|
(1)
|
Calculation excludes the expenses from our health plan businesses. Adjusted patient admissions represents actual patient admissions adjusted to include outpatient services provided by facilities in our Hospital Operations and other segment by multiplying actual patient admissions by the sum of gross inpatient revenues and outpatient revenues and dividing the results by gross inpatient revenues.
|
|
Salaries, wages and benefits per adjusted patient admission
increased
0.5%
in the three months ended
December 31, 2017
compared to the same period in
2016
. This change is primarily due to the effect of lower volumes on operating leverage due to certain fixed staffing costs and annual merit increases for certain of our employees in the three months ended
December 31, 2017
compared to the three months ended
December 31, 2016
.
Supplies expense per adjusted patient admission
increased
3.8%
in the three months ended
December 31, 2017
compared to the same period in
2016
. The change in supplies expense was primarily attributable to growth in our higher acuity supply-intensive surgical services, partially offset by the impact of the group-purchasing strategies and supplies-management services we utilize to reduce costs.
Other operating expenses per adjusted patient admission
increased
by
4.8%
in the three months ended
December 31, 2017
compared to the three months ended
December 31, 2016
. This increase is due to higher medical fees, the effect of lower volumes on operating leverage due to the sale of our Houston-area facilities in 2017, and increased malpractice expense for our Hospital Operations and other segment, which was
$29 million
higher in the
2017
period compared to the
2016
46
period. The
2017
period included
a favorable
adjustment of approximately
$4 million
from the
17
basis point
increase
in the interest rate used to estimate the discounted present value of projected future malpractice liabilities compared to
a favorable
adjustment of approximately
$19 million
from the
83
basis point
increase
in the interest rate in the
2016
period.
LIQUIDITY AND CAPITAL RESOURCES OVERVIEW
Cash and cash equivalents were
$611 million
at
December 31, 2017
compared to
$429 million
at September 30,
2017
.
Significant cash flow items in the three months ended
December 31, 2017
included:
|
•
|
Interest payments of
$322 million
;
|
|
•
|
Capital expenditures of
$215 million
;
|
|
•
|
Approximately $165 million of additional net cash proceeds related to the California provider fee program;
|
|
•
|
$80 million
of distributions paid to noncontrolling interests;
|
|
•
|
Payments for restructuring charges, acquisition-related costs, and litigation costs and settlements of
$37 million
; and
|
|
•
|
Purchases of businesses or joint venture interests of
$9 million
.
|
Net cash provided by operating activities was
$1.200 billion
in the year ended
December 31, 2017
compared to
$558 million
in the year ended
December 31, 2016
. Key factors contributing to the change between the
2017
and
2016
periods include the following:
|
•
|
A
decrease
of
$566 million
in payments on reserves for restructuring charges, acquisition-related costs, and litigation costs and settlements; and
|
|
•
|
The timing of other working capital items.
|
SOURCES OF REVENUE FOR OUR HOSPITAL OPERATIONS AND OTHER SEGMENT
We earn revenues for patient services from a variety of sources, primarily managed care payers and the federal Medicare program, as well as state Medicaid programs, indemnity-based health insurance companies and self-pay patients (that is, patients who do not have health insurance and are not covered by some other form of third-party arrangement).
The following table shows the sources of net patient revenues before provision for doubtful accounts for our acute care hospitals and related outpatient facilities, expressed as percentages of net patient revenues before provision for doubtful accounts from all sources:
|
|
Years Ended December 31,
|
||||||||
|
Net Patient Revenues from:
|
2017
|
2016
|
2015
|
||||||
|
Medicare
|
20.0
|
%
|
20.5
|
%
|
20.4
|
%
|
|||
|
Medicaid
|
8.1
|
%
|
8.2
|
%
|
8.7
|
%
|
|||
|
Managed care
(1)
|
61.7
|
%
|
61.5
|
%
|
60.6
|
%
|
|||
|
Indemnity, self-pay and other
|
10.2
|
%
|
9.8
|
%
|
10.3
|
%
|
|||
|
(1)
|
Includes Medicare and Medicaid managed care programs.
|
|
47
Our payer mix on an admissions basis for our acute care hospitals and related outpatient facilities, expressed as a percentage of total admissions from all sources, is shown below:
|
|
Years Ended December 31,
|
||||||||
|
Admissions from:
|
2017
|
2016
|
2015
|
||||||
|
Medicare
|
26.0
|
%
|
26.1
|
%
|
26.7
|
%
|
|||
|
Medicaid
|
6.5
|
%
|
7.0
|
%
|
8.0
|
%
|
|||
|
Managed care
(1)
|
59.6
|
%
|
59.2
|
%
|
57.5
|
%
|
|||
|
Indemnity, self-pay and other
|
7.9
|
%
|
7.7
|
%
|
7.8
|
%
|
|||
|
(1)
|
Includes Medicare and Medicaid managed care programs.
|
|
GOVERNMENT PROGRAMS
The Centers for Medicare and Medicaid Services, an agency of the U.S. Department of Health and Human Services (“HHS”), is the single largest payer of healthcare services in the United States. Approximately
57
million individuals rely on healthcare benefits through Medicare, and approximately
74
million individuals are enrolled in Medicaid and the Children’s Health Insurance Program (“CHIP”). These three programs are authorized by federal law and directed by CMS. Medicare is a federally funded health insurance program primarily for individuals 65 years of age and older, certain younger people with disabilities, and people with end-stage renal disease, and is provided without regard to income or assets. Medicaid is administered by the states and is jointly funded by the federal government and state governments. Medicaid is the nation’s main public health insurance program for people with low incomes and is the largest source of health coverage in the United States. The CHIP, which is also administered by the states and jointly funded, provides health coverage to children in families with incomes too high to qualify for Medicaid, but too low to afford private coverage. Unlike Medicaid, the CHIP is limited in duration and requires the enactment of reauthorizing legislation. On January 22 and February 9, 2018, separate pieces of legislation were enacted extending CHIP funding for a total of ten years from federal fiscal year (“FFY”) 2018 (which began on October 1, 2017) through FFY 2027.
The Affordable Care Act
The expansion of Medicaid in the 32 states (including five in which we currently operate acute care hospitals) and the District of Columbia that have taken action to do so is financed through:
|
•
|
negative adjustments to the annual market basket updates for the Medicare hospital inpatient and outpatient prospective payment systems, which began in 2010, as well as additional negative “productivity adjustments” to the annual market basket updates, which began in 2011; and
|
|
•
|
reductions to Medicare and Medicaid disproportionate share hospital (“DSH”) payments, which began for Medicare payments in FFY 2014 and began for Medicaid payments in FFY 2018.
|
We cannot predict if or when further modification of the ACA will occur or what action, if any, Congress might take with respect to eventually repealing and possibly replacing the law. We are also unable to predict the impact of legislative, administrative and regulatory changes, and market reactions to those changes, on our future revenues and operations. However, if the ultimate impact is that significantly fewer individuals have private or public health coverage, we likely will experience decreased volumes, reduced revenues and an increase in uncompensated care, which would adversely affect our results of operations and cash flows. This negative effect will be exacerbated if the ACA’s reductions in Medicare reimbursement and reductions in Medicare DSH payments that have already taken effect are not reversed if the law is repealed or if further reductions (including Medicaid DSH reductions scheduled to take effect under the Balanced Budget Act of 2018 in FFYs 2020 through 2025, as described below) are made.
Medicare
Medicare offers its beneficiaries different ways to obtain their medical benefits. One option, the Original Medicare Plan (which includes “Part A” and “Part B”), is a fee-for-service payment system. The other option, called Medicare Advantage (sometimes called “Part C” or “MA Plans”), includes health maintenance organizations (“HMOs”), preferred provider organizations (“PPOs”), private fee-for-service Medicare special needs plans and Medicare medical savings account plans. The major components of our net patient revenues from continuing operations of our Hospital Operations and other segment for services provided to patients enrolled in the Original Medicare Plan for the years ended
December 31, 2017
,
2016
and
2015
are set forth in the following table:
48
|
|
Years Ended December 31,
|
|||||||||||
|
Revenue Descriptions
|
2017
|
2016
|
2015
|
|||||||||
|
Medicare severity-adjusted diagnosis-related group — operating
|
$
|
1,659
|
|
$
|
1,705
|
|
$
|
1,744
|
|
|||
|
Medicare severity-adjusted diagnosis-related group — capital
|
162
|
|
157
|
|
161
|
|
||||||
|
Outliers
|
89
|
|
77
|
|
61
|
|
||||||
|
Outpatient
|
908
|
|
927
|
|
953
|
|
||||||
|
Disproportionate share
|
265
|
|
293
|
|
337
|
|
||||||
|
Direct Graduate and Indirect Medical Education
(1)
|
260
|
|
249
|
|
256
|
|
||||||
|
Other
(2)
|
7
|
|
63
|
|
5
|
|
||||||
|
Adjustments for prior-year cost reports and related valuation allowances
|
39
|
|
55
|
|
62
|
|
||||||
|
Total Medicare net patient revenues
|
$
|
3,389
|
|
$
|
3,526
|
|
$
|
3,579
|
|
|||
|
(1)
|
Includes Indirect Medical Education revenues earned by our children’s hospitals under the Children’s Hospitals Graduate Medical Education Payment Program administered by the Health Resources and Services Administration of HHS.
|
|
|
(2)
|
The other revenue category includes inpatient psychiatric units, inpatient rehabilitation units, one long-term acute care hospital, other revenue adjustments, and adjustments related to the estimates for current-year cost reports and related valuation allowances.
|
|
A general description of the types of payments we receive for services provided to patients enrolled in the Original Medicare Plan is provided below. Recent regulatory and legislative updates to the terms of these payment systems and their estimated effect on our revenues can be found under “Regulatory and Legislative Changes” below.
Acute Care Hospital Inpatient Prospective Payment System
Medicare Severity-Adjusted Diagnosis-Related Group Payments
—Sections 1886(d) and 1886(g) of the Social Security Act (the “Act”) set forth a system of payments for the operating and capital costs of inpatient acute care hospital admissions based on a prospective payment system (“PPS”). Under the inpatient prospective payment systems (“IPPS”), Medicare payments for hospital inpatient operating services are made at predetermined rates for each hospital discharge. Discharges are classified according to a system of Medicare severity-adjusted diagnosis-related groups (“MS-DRGs”), which categorize patients with similar clinical characteristics that are expected to require similar amounts of hospital resources. CMS assigns to each MS-DRG a relative weight that represents the average resources required to treat cases in that particular MS-DRG, relative to the average resources used to treat cases in all MS-DRGs.
The base payment amount for the operating component of the MS-DRG payment is comprised of an average standardized amount that is divided into a labor-related share and a nonlabor-related share. Both the labor-related share of operating base payments and the base payment amount for capital costs are adjusted for geographic variations in labor and capital costs, respectively. Using diagnosis and procedure information submitted by the hospital, CMS assigns to each discharge an MS-DRG, and the base payments are multiplied by the relative weight of the MS-DRG assigned. The MS-DRG operating and capital base rates, relative weights and geographic adjustment factors are updated annually, with consideration given to: the increased cost of goods and services purchased by hospitals; the relative costs associated with each MS-DRG; and changes in labor data by geographic area. Although these payments are adjusted for area labor and capital cost differentials, the adjustments do not take into consideration an individual hospital’s operating and capital costs.
Outlier Payments
—Outlier payments are additional payments made to hospitals on individual claims for treating Medicare patients whose medical conditions are costlier to treat than those of the average patient in the same MS-DRG. To qualify for a cost outlier payment, a hospital’s billed charges, adjusted to cost, must exceed the payment rate for the MS-DRG by a fixed threshold established annually by CMS. A Medicare administrative contractor (“MAC”) calculates the cost of a claim by multiplying the billed charges by a cost-to-charge ratio that is typically based on the hospital’s most recently filed cost report. Generally, if the computed cost exceeds the sum of the MS-DRG payment plus the fixed threshold, the hospital receives 80% of the difference as an outlier payment.
Under the Act, CMS must project aggregate annual outlier payments to all PPS hospitals to be not less than 5% or more than 6% of total MS-DRG payments (“Outlier Percentage”). The Outlier Percentage is determined by dividing total outlier payments by the sum of MS-DRG and outlier payments. CMS annually adjusts the fixed threshold to bring projected outlier payments within the mandated limit. A change to the fixed threshold affects total outlier payments by changing: (1) the number of cases that qualify for outlier payments; and (2) the dollar amount hospitals receive for those cases that qualify for outlier payments.
Disproportionate Share Hospital Payments
—In addition to making payments for services provided directly to beneficiaries, Medicare makes additional payments to hospitals that treat a disproportionately high share of low-income
49
patients. Prior to October 1, 2013, DSH payments were determined annually based on certain statistical information defined by CMS and calculated as a percentage add-on to the MS-DRG payments. The ACA revised the Medicare DSH adjustment effective for discharges occurring on or after October 1, 2014. Under the revised methodology, hospitals receive 25% of the amount they previously would have received under the pre-ACA formula. This amount is referred to as the “Empirically Justified Amount.”
Hospitals qualifying for the Empirically Justified Amount of DSH payments are also eligible to receive an additional payment for uncompensated care (the “UC DSH Amount”). The UC DSH Amount is a hospital’s share of a pool of funds that the CMS Office of the Actuary estimates would equal 75% of Medicare DSH that otherwise would have been paid under the pre-ACA formula, adjusted for changes in the percentage of individuals that are uninsured. Generally, the factors used to calculate and distribute UC DSH Amounts are set forth in the ACA and are not subject to administrative or judicial review. Although the statute requires that each hospital’s cost of uncompensated care as a percentage of the total uncompensated care cost of all DSH hospitals be used to allocate the pool, CMS previously determined that the available cost data from cost reports was unreliable and for FFYs 2014 through 2017 used low-income days (i.e., Medicaid days) to distribute UC DSH Amounts. Beginning in FFY 2018, CMS commenced a three-year transition to using uncompensated care cost data to distribute the UC DSH Amounts. During 2017, 59 of our acute care hospitals in continuing operations qualified for Medicare DSH payments.
One of the variables used in the pre-ACA DSH formula is the number of Medicare inpatient days attributable to patients receiving Supplemental Security Income (“SSI”) who are also eligible for Medicare Part A benefits divided by total Medicare inpatient days (the “SSI Ratio”). In an earlier rulemaking, CMS established a policy of including not only days attributable to Original Medicare Plan patients, but also Medicare Advantage patients in the SSI ratio. The statutes and regulations that govern Medicare DSH payments have been the subject of various administrative appeals and lawsuits, and our hospitals have been participating in such appeals, including challenges to the inclusion of the Medicare Advantage days used in the DSH calculation as set forth in the Changes to the Hospital Inpatient Prospective Payment Systems and Fiscal Year 2005 Rates (“FFY 2005 Final Rule”). We are not able to predict what action the Secretary might take with respect to the DSH calculation for prior periods in this regard or the outcome of the pending litigation; however, a favorable outcome of our DSH appeals could have a material impact on our future revenues and cash flows.
Direct Graduate and Indirect Medical Education Payments
—The Medicare program provides additional reimbursement to approved teaching hospitals for additional expenses incurred by such institutions. This additional reimbursement, which is subject to certain limits, including intern and resident full-time equivalent (“FTE”) limits, is made in the form of Direct Graduate Medical Education (“DGME”) and Indirect Medical Education (“IME”) payments. During 2017, 25 of our hospitals in continuing operations were affiliated with academic institutions and were eligible to receive such payments.
IPPS Quality Adjustments
—The ACA authorizes the following adjustments to Medicare IPPS payments:
|
•
|
Value Based Purchasing (“VBP”) – Under the VPB program, IPPS operating payments to hospitals are reduced by 2% to fund value-based incentive payments to eligible hospitals based on their overall performance on a set of quality measures;
|
|
•
|
Hospital Readmission Reduction Program (“HRRP”) – Under the HRRP program, IPPS operating payments to hospitals with excess readmissions are reduced up to a maximum of 3% of base MS-DRG payments; and
|
|
•
|
Hospital-Acquired Conditions (“HAC”) Reduction Program (“HACRP”) – Under the HACRP, overall inpatient payments are reduced by 1% for hospitals in the worst performing quartile of risk-adjusted quality measures for reasonable preventable HACs.
|
These adjustments are generally based on a hospital’s performance from prior periods and are updated annually by CMS.
Hospital Outpatient Prospective Payment System
Under the outpatient prospective payment system, hospital outpatient services, except for certain services that are reimbursed on a separate fee schedule, are classified into groups called ambulatory payment classifications (“APCs”). Services in each APC are similar clinically and in terms of the resources they require, and a payment rate is established for each APC. Depending on the services provided, hospitals may be paid for more than one APC for an encounter. CMS annually updates the APCs and the rates paid for each APC.
50
Inpatient Psychiatric Facility Prospective Payment System
The inpatient psychiatric facility (“IPF”) prospective payment system (“IPF-PPS”) applies to psychiatric hospitals and psychiatric units located within acute care hospitals that have been designated as exempt from the hospital inpatient prospective payment system. The IPF-PPS is based on prospectively determined per-diem rates and includes an outlier policy that authorizes additional payments for extraordinarily costly cases. During 2017, 25 of our general hospitals operated IPF units.
Inpatient Rehabilitation Prospective Payment System
Rehabilitation hospitals and rehabilitation units in acute care hospitals meeting certain criteria established by CMS are eligible to be paid as an inpatient rehabilitation facility (“IRF”) under the IRF prospective payment system (“IRF-PPS”). Payments under the IRF-PPS are made on a per-discharge basis. The IRF-PPS uses federal prospective payment rates across distinct case-mix groups established by a patient classification system. During 2017, we operated one freestanding IRF, and 18 of our general hospitals operated IRF units.
Physician Services Payment System
Medicare pays for physician and other professional services based on a list of services and their payment rates called the Medicare Physician Fee Schedule (“MPFS”). In determining payment rates for each service on the fee schedule, CMS considers the amount of work required to provide a service, expenses related to maintaining a practice, and liability insurance costs. The values given to these three types of resources are adjusted by variations in the input prices in different markets, and then a total is multiplied by a standard dollar amount, called the fee schedule’s conversion factor, to arrive at the payment amount. Medicare’s payment rates may be adjusted based on provider characteristics, additional geographic designations and other factors. Beginning in CY 2017, the payments for physician services are based on the provisions prescribed by The Medicare Access and CHIP Reauthorization Act of 2015 (“MACRA”), as described below.
Cost Reports
The final determination of certain Medicare payments to our hospitals, such as DSH, DGME, IME and bad debt expense, are retrospectively determined based on our hospitals’ cost reports. The final determination of these payments often takes many years to resolve because of audits by the program representatives, providers’ rights of appeal, and the application of numerous technical reimbursement provisions.
For filed cost reports, we adjust the accrual for estimated cost report settlements based on those cost reports and subsequent activity, and record a valuation allowance against those cost reports based on historical settlement trends. The accrual for estimated cost report settlements for periods for which a cost report is yet to be filed is recorded based on estimates of what we expect to report on the filed cost reports and a corresponding valuation allowance is recorded as previously described. Cost reports must generally be filed within five months after the end of the annual cost report reporting period. After the cost report is filed, the accrual and corresponding valuation allowance may need to be adjusted.
Medicare Claims Reviews
HHS estimates that the overall FFY 2017 Medicare fee-for-service (“FFS”) improper payment rate for the program is approximately 10%. The FFY 2017 error rate for Hospital IPPS payments is approximately 4%. CMS has identified the FFS program as a program at risk for significant erroneous payments. One of CMS’ stated key goals is to pay claims properly the first time. This means paying the right amount, to legitimate providers, for covered, reasonable and necessary services provided to eligible beneficiaries. According to CMS, paying correctly the first time saves resources required to recover improper payments and ensures the proper expenditure of Medicare Trust Fund dollars. CMS has established several initiatives to prevent or identify improper payments before a claim is paid, and to identify and recover improper payments after paying a claim. The overall goal is to reduce improper payments by identifying and addressing coverage and coding billing errors for all provider types. Under the authority of the Act, CMS employs a variety of contractors (e.g., Medicare Administrative Contractors and Recovery Audit Contractors) to process and review claims according to Medicare rules and regulations.
Claims selected for prepayment review are not subject to the normal Medicare FFS payment timeframe. Furthermore, prepayment and post-payment claims denials are subject to administrative and judicial review, and we intend to pursue the reversal of adverse determinations where appropriate. We have established robust protocols to respond to claims reviews and payment denials. In addition to overpayments that are not reversed on appeal, we will incur additional costs to respond to requests for records and pursue the reversal of payment denials. The degree to which our Medicare FFS claims are subjected to
51
prepayment reviews, the extent to which payments are denied, and our success in overturning denials could have a material adverse effect on our cash flows and results of operations.
Medicaid
Medicaid programs and the corresponding reimbursement methodologies are administered by the states and vary from state to state and from year to year. Estimated revenues under various state Medicaid programs, including state-funded managed care Medicaid programs, constituted approximately
18.8%
,
18.6%
and
19.1%
of total net patient revenues before provision for doubtful accounts of our acute care hospitals and related outpatient facilities for the years ended
December 31, 2017
,
2016
and
2015
, respectively. We also receive DSH and other supplemental revenues under various state Medicaid programs. For the years ended
December 31, 2017
,
2016
and
2015
, our total Medicaid revenues attributable to DSH and other supplemental revenues were approximately
$864 million
,
$906 million
and
$888 million
, respectively. The
$864 million
of total Medicaid revenues attributable to DSH and other supplemental revenues for the year ended
December 31, 2017
was comprised of
$267 million
related to the California Provider Fee program described below,
$220 million
related to the Michigan Provider Fee program,
$136 million
related to Medicaid DSH programs in multiple states,
$96 million
related to the Texas 1115 waiver program described below, and
$145 million
from a number of other state and local programs.
Several states in which we operate face budgetary challenges that have resulted, and likely will continue to result, in reduced Medicaid funding levels to hospitals and other providers. Because most states must operate with balanced budgets, and the Medicaid program is generally a significant portion of a state’s budget, states can be expected to adopt or consider adopting future legislation designed to reduce or not increase their Medicaid expenditures. In addition, some states delay issuing Medicaid payments to providers to manage state expenditures. As an alternative means of funding provider payments, many of the states in which we operate have adopted provider fee programs or received waivers under Section 1115 of the Social Security Act. Under a Medicaid waiver, the federal government waives certain Medicaid requirements, thereby giving states flexibility in the operation of their Medicaid program to allow states to test new approaches and demonstration projects to improve care. Generally the Section 1115 waivers are for a period of five years with an option to extend the waiver for three additional years. Continuing pressure on state budgets and other factors could result in future reductions to Medicaid payments, payment delays or additional taxes on hospitals.
The California Department of Health Care Services implemented its first Hospital Quality Assurance Fee (“HQAF”) program in 2010. The HQAF program provides funding for supplemental payments to California hospitals that serve Medi-Cal and uninsured patients. CMS approved the fifth and most recent phase of the program (“HQAF V”) covering the period January 2017 through June 2019 in the three months ended December 31, 2017. Our hospitals recognized HQAF revenues, net of provider fees and other expenses, of approximately
$267 million
, $232 million and $188 million in calendar years 2017, 2016 and 2015, respectively. In November 2016, California voters approved a state constitutional amendment measure that extends indefinitely the statute that imposes fees on hospitals to obtain federal matching funds. Because HQAF funding levels are based in part on Medi-Cal utilization, changes in coverage of individuals under the Medi-Cal program could affect the net revenues and cash flows of our hospitals under HQAF V and subsequent phases of the HQAF program. Also, because funding of the HQAF program is dependent on federal funding, we cannot provide assurances that such funding will continue in future periods.
Certain of our Texas hospitals participate in the Texas 1115 waiver program. The previous waiver term expired on December 31, 2017, and the current waiver term, which was approved during the three months ended December 31, 2017 and expires on September 30, 2022, is funded by intergovernmental transfer payments from local government entities, and includes two funding pools – Uncompensated Care and Delivery System Reform Payment. In 2017, we recognized
$96 million
of revenues from the Texas 1115 waiver program. Separately, during the same period, we incurred $76 million of expenses related to funding indigent care services by certain of our Texas hospitals. We cannot provide any assurances as to future extensions of the Texas 1115 waiver program, or the ultimate amount of revenues that our hospitals may receive from this program in 2018 or future periods.
Because we cannot predict what actions the federal government or the states may take under existing legislation and future legislation to address budget gaps, deficits, Medicaid expansion, provider fee programs or Medicaid Section 1115 waivers, we are unable to assess the effect that any such legislation might have on our business, but the impact on our future financial position, results of operations or cash flows could be material.
Medicaid-related patient revenues from continuing operations recognized by our Hospital Operations and other segment from Medicaid-related programs in the states in which our facilities are (or were, as the case may be) located, as well
52
as from Medicaid programs in neighboring states, for the years ended
December 31, 2017
,
2016
and
2015
are set forth in the table below:
|
|
Years Ended December 31,
|
|||||||||||||||||||||||
|
|
2017
|
2016
|
2015
|
|||||||||||||||||||||
|
Hospital Location
|
Medicaid
|
Managed
Medicaid
|
Medicaid
|
Managed
Medicaid
|
Medicaid
|
Managed
Medicaid
|
||||||||||||||||||
|
Alabama
|
$
|
101
|
|
$
|
—
|
|
$
|
79
|
|
$
|
—
|
|
$
|
33
|
|
$
|
—
|
|
||||||
|
Arizona
|
(11
|
)
|
197
|
|
(3
|
)
|
214
|
|
(20
|
)
|
205
|
|
||||||||||||
|
California
|
437
|
|
431
|
|
401
|
|
423
|
|
343
|
|
404
|
|
||||||||||||
|
Florida
|
64
|
|
170
|
|
94
|
|
169
|
|
96
|
|
165
|
|
||||||||||||
|
Georgia
|
(1
|
)
|
(2
|
)
|
11
|
|
8
|
|
71
|
|
40
|
|
||||||||||||
|
Illinois
|
73
|
|
75
|
|
37
|
|
74
|
|
89
|
|
54
|
|
||||||||||||
|
Massachusetts
|
36
|
|
52
|
|
39
|
|
56
|
|
38
|
|
55
|
|
||||||||||||
|
Michigan
|
366
|
|
361
|
|
351
|
|
323
|
|
367
|
|
314
|
|
||||||||||||
|
Missouri
|
2
|
|
1
|
|
2
|
|
—
|
|
50
|
|
14
|
|
||||||||||||
|
North Carolina
|
(1
|
)
|
—
|
|
(2
|
)
|
—
|
|
29
|
|
6
|
|
||||||||||||
|
Pennsylvania
|
76
|
|
239
|
|
80
|
|
231
|
|
67
|
|
240
|
|
||||||||||||
|
South Carolina
|
13
|
|
37
|
|
18
|
|
38
|
|
17
|
|
37
|
|
||||||||||||
|
Tennessee
|
4
|
|
33
|
|
5
|
|
34
|
|
6
|
|
34
|
|
||||||||||||
|
Texas
|
166
|
|
215
|
|
229
|
|
248
|
|
263
|
|
249
|
|
||||||||||||
|
|
$
|
1,325
|
|
$
|
1,809
|
|
$
|
1,341
|
|
$
|
1,818
|
|
$
|
1,449
|
|
$
|
1,817
|
|
||||||
Regulatory and Legislative Changes
The Medicare and Medicaid programs are subject to statutory and regulatory changes, administrative and judicial rulings, interpretations and determinations, requirements for utilization review, and federal and state funding restrictions, all of which could materially increase or decrease payments from these government programs in the future, as well as affect the cost of providing services to our patients and the timing of payments to our facilities. We are unable to predict the effect of future government healthcare funding policy changes on our operations. If the rates paid or services covered by governmental payers are reduced, or if we or one or more of our subsidiaries’ hospitals are excluded from participation in the Medicare or Medicaid program or any other government healthcare program, there could be a material adverse effect on our business, financial condition, results of operations or cash flows. Recent regulatory and legislative updates to the Medicare and Medicaid payment systems are provided below.
Final Payment and Policy Changes to the Medicare Inpatient Prospective Payment Systems
Under Medicare law, CMS is required to annually update certain rules governing the inpatient prospective payment systems (“IPPS”). The updates generally become effective October 1, the beginning of the federal fiscal year. On August 2, 2017, CMS issued Changes to the Hospital Inpatient Prospective Payment Systems for Acute Care Hospitals and Fiscal Year 2018 Rates, and, on September 29, 2017, CMS issued a correction notice to the rule issued on August 2, 2017. The August 2, 2017 final rule and the September 29, 2017 correction notice are collectively referred to hereinafter as the “Final IPPS Rule.” The Final IPPS Rule includes the following payment and policy changes:
|
•
|
A market basket increase of 2.7% for MS-DRG operating payments for hospitals reporting specified quality measure data and that are meaningful users of electronic health record (“EHR”) technology (hospitals that do not report specified quality measure data and/or are not meaningful users of EHR technology will receive a reduced market basket increase); CMS also made certain adjustments to the 2.7% market basket increase that resulted in a net operating payment update of 1.21% (before budget neutrality adjustments), including:
|
|
•
|
Market basket index and multifactor productivity reductions required by the ACA of 0.75% and 0.6%, respectively;
|
|
•
|
A 0.4588% increase required under the 21st Century Cures Act; and
|
|
•
|
A reduction of 0.6% to reverse the one-time increase of 0.6% made in FFY 2017 to address the effects of the 0.2% reduction in effect for FFYs 2014 through 2016 related to the two-midnight rule.
|
53
|
•
|
Updates to the three factors used to determine the amount and distribution of Medicare UC-DSH Amounts, including a transition from using low-income days to estimated uncompensated care costs for the distribution of UC-DSH Amounts;
|
|
•
|
A 1.60% net increase in the capital federal MS-DRG rate; and
|
|
•
|
An increase in the cost outlier threshold from $23,573 to $26,537.
|
According to CMS, the combined impact of the payment and policy changes in the Final IPPS Rule for operating costs will yield an average 1.4% increase in Medicare operating MS-DRG FFS payments for hospitals in large urban areas (populations over one million) in FFY 2018. We estimate that all of the payment and policy changes affecting operating MS-DRG payments, notably those affecting Medicare UC-DSH Amounts, will result in an estimated 0.2% increase in our annual Medicare FFS IPPS payments, which yields an estimated increase of approximately $5 million. The payment increase resulting from the 1.21% net market basket increase is offset by a reduction to our UC-DSH Amounts primarily due to the aforementioned transition to using uncompensated care costs for the distribution of UC-DSH Amounts. Because of the uncertainty associated with various factors that may influence our future IPPS payments by individual hospital, including legislative action, admission volumes, length of stay and case mix, we cannot provide any assurances regarding our estimate of the impact of the final payment and policy changes.
Final Payment and Policy Changes to the Medicare Outpatient Prospective Payment and Ambulatory Surgical Center Payment Systems
On November 1, 2017, CMS released final policy changes, quality provisions and payment rates for the Medicare Hospital Outpatient Prospective Payment System (“OPPS”) and Ambulatory Surgical Center (“ASC”) Payment System for calendar year 2018, and, on December 27, 2017, CMS issued a correction notice to the rule issued on November 1, 2017. The November 1, 2017 final rule and the December 27, 2017 correction notice are collectively referred to hereinafter as the “Final OPPS/ASC Rule.” The Final OPPS/ASC Rule includes the following payment and policy changes:
|
•
|
An increase of approximately 4.85% in the OPPS conversion factor (i.e., the base rate that is adjusted for geographic wage differences and multiplied by the Ambulatory Payment Classification (“APC”) relative weight to determine individual APC payments) comprised of: (i) an increase of 1.35% based on a market basket increase of 2.7% reduced by market basket index and multifactor productivity reductions required by the ACA of 0.75% and 0.6%, respectively; (ii) wage index budget neutrality, pass-through and outlier spending adjustments; and (iii) an increase of 3.19% resulting from a budget-neutral redistribution of approximately $1.6 billion related to payments for separately payable drugs purchased under the 340B program from average sale price (“ASP”) plus 6% to ASP minus 22.5%; the 340B program allows certain hospitals (i.e., only nonprofit organizations with specific federal designations and/or funding) to purchase separately payable drugs at discounted rates from drug manufacturers;
|
|
•
|
The removal of total knee arthroplasty (“TKA”) from the CMS list of procedures that can be performed only on an inpatient basis (the “Inpatient Only List”), which permits TKAs to be performed in a hospital outpatient department; CMS did not add TKA to the ASC list of covered surgical procedures; and
|
|
•
|
A 1.2% update to the ASC payment rates.
|
CMS projects that the combined impact of the payment and policy changes in the Final OPPS/ASC Rule will yield an average 1.4% increase in Medicare FFS OPPS payments for all hospitals, an average 1.3% increase in Medicare FFS OPPS payments for hospitals in large urban areas (populations over one million), and an average 4.5% increase in Medicare FFS OPPS payments for proprietary hospitals. Based on CMS’ estimates, the projected annual impact of the payment and policy changes in the Final OPPS/ASC Rule on our hospitals is an increase to Medicare FFS hospital outpatient revenues of approximately $31 million, which represents an increase of approximately 4.5%. Because of the uncertainty associated with various factors that may influence our future OPPS payments, including legislative or legal actions, volumes and case mix, we cannot provide any assurances regarding our estimate of the impact of the final payment and policy changes.
The Medicare Access and CHIP Reauthorization Act of 2015
The MACRA replaces the Medicare Sustainable Growth Rate methodology with a new system for establishing the annual updates to payment rates for physician services in Medicare that, beginning in 2019, rewards the delivery of high-quality patient care through one of two avenues:
54
|
•
|
The Merit-Based Incentive Payment System (“MIPS”) – MIPS participating providers will be eligible for a payment adjustment of plus or minus 4% in the first payment adjustment year (2019 based on 2017 performance) with the payment adjustment increasing each year until it reaches plus or minus 9% in 2022 and beyond; or
|
|
•
|
The Advanced Alternative Payment Model (“APM”) – Providers that choose to participate in an Advanced APM (defined as certain CMS Innovation Center models and Shared Savings Program tracks that require participants to use certified EHR technology, base payments for services on quality measures comparable to those in MIPS, and require participants to bear more than nominal financial risk for losses) will be exempt from MIPS and from 2019-2024 will be eligible for a 5% upward adjustment to their Medicare payments.
|
The new system helps to link fee-for-service payments to quality and value with payment incentives and penalties.
Additionally, the MACRA reduced the restoration of the 3.2% coding and document adjustment to hospital inpatient rates that was expected to be effective in FFY 2018 to 3.0%; as modified by the 21st Century Cures Act, the adjustment will be applied at the rate of 0.4588% over six years beginning in FFY 2018.
Less than 1% of the net operating revenue generated by our Hospital Operations and other segment during the year ended
December 31, 2017
was related to the MPFS. We are unable to estimate the potential impact of the MACRA; however, the maximum incentive and penalty adjustments could result in an increase or decrease in our annual net revenues of approximately $15 million. Additionally, we cannot predict the effect of the MACRA on our future operations, revenues and cash flows.
Payment and Policy Changes to the Medicare Physician Fee Schedule
On November 15, 2017, CMS issued a final rule updating the MPFS for calendar year 2018 (“MPFS Final Rule”). This final rule updates payment policies, payment rates, and other provisions for services furnished under the MPFS on or after January 1, 2018. In addition to policies affecting the calculation of payment rates, the final rule identifies potentially misvalued codes, adds procedures to the telehealth list, and finalizes a number of new policies. As a result of the final rule, the MPFS conversion factor for 2018 will increase by 0.31%. CMS estimates that the impact of the payment and policy changes in the final rule will result in no change in aggregate payments across all specialties.
The American Recovery and Reinvestment Act of 2009
The American Recovery and Reinvestment Act of 2009 (“ARRA”) was enacted to stimulate the U.S. economy. One provision of ARRA provides financial incentives to hospitals and physicians to become “meaningful users” of electronic health records (“EHR”). Hospitals that fail to demonstrate meaningful use of EHR are subject to payment penalties; EHR payment adjustments to physicians sunset effective January 1, 2019. During the year ended
December 31, 2017
, we recognized approximately
$9 million
of EHR incentives related to the Medicare and Medicaid EHR incentive programs as a result of certain of our hospitals, employed physicians and Ambulatory Care segment facilities demonstrating meaningful use of certified EHR technology and meeting the criteria for revenue recognition. Medicare and Medicaid incentive payment amounts to which a provider is entitled are subject to post-payment audits.
In addition to the expenditures we incur to qualify for these incentive payments, our operating expenses have increased and we anticipate will increase in the future as a result of these information system investments. Eligible hospitals must continue to demonstrate meaningful use of EHR technology every year to avoid payment reductions in subsequent years. These reductions, which are based on the market basket update, will continue until a hospital achieves compliance. Should all of our hospitals fail to become meaningful users or fail to continue to demonstrate meaningful use of EHR technology and fail to submit quality data, the penalties would result in reductions to our annual Medicare traditional inpatient net revenues of up to approximately $36 million in 2018 and subsequent years.
The complexity of the changes required to our hospitals’ systems and the time required to complete the changes could result in some or all of our facilities not being fully compliant and subject to the payment penalties permitted under ARRA. Because of the uncertainties regarding the implementation of HIT, including CMS’ future EHR implementation regulations, our ability to achieve compliance and the associated costs, we cannot provide any assurances regarding the aforementioned estimates of incentives or penalties in future periods.
55
CMS Innovation Models
The CMS Innovation Center develops new payment and service delivery models in accordance with the requirements of Section 1115A of the Social Security Act. Additionally, Congress has defined – both through the Affordable Care Act and previous legislation – a number of specific demonstrations to be conducted by CMS. The CMS Innovation Center has a growing portfolio testing various payment and service delivery models that aim to achieve better care for patients, better health for communities and lower costs through improvement for our health care system. Participation in some of these models is voluntary; however, participation in certain bundled payment arrangements is mandatory for providers located in randomly selected geographic locations. Generally, the mandatory bundled payment models hold hospitals financially accountable for the quality and costs for an entire episode of care for a specific diagnosis or procedure from the date of the hospital admission or inpatient procedure through 90 days post-discharge, including services not provided by the hospital, such as physician, inpatient rehabilitation, skilled nursing and home health services. Under the mandatory models, hospitals are eligible to receive incentive payments or will be subject to payment reductions within certain corridors based on their performance against quality and spending criteria.
In 2015, CMS finalized a five-year bundled payment model, called the Comprehensive Care for Joint Replacement (“CJR”) model, which includes hip and knee replacements, as well as other major leg procedures. Twenty of our hospitals currently participate in the CJR model. We cannot predict what effect significant modification or repeal of the ACA as described herein will have on the established payment models or the Secretary of HHS’ authority to develop new payment models, nor can we predict what impact, if any, these demonstration programs will have on our inpatient volumes, net revenues or cash flows.
Medicaid Managed Care Final Rule – Pass Through Payments
In a final rule issued in 2016, CMS stated that managed care regulations prohibit states from making payments to providers for services available under a contract between the state and the managed care plan, and the agency interprets those regulations to also prohibit states from making supplemental payments to providers (referred to as “pass-through” payments) through a managed care plan. In that rule, CMS: (1) stated its belief that pass-through payments are not actuarially sound because they do not tie provider payments to the provision of services and limited the managed care plans’ ability to effectively manage care delivery, and (2) that it would allow states, managed care plans and providers 10 years to phase out pass-through payments. On January 17, 2017, CMS issued a Final Medicaid Managed Care rule that clarified and established additional policies regarding Medicaid managed care pass-through payments that will affect how Medicaid managed care supplemental payments are distributed to providers. Specifically,
|
•
|
States may not create new pass-through payment programs;
|
|
•
|
Pass-through payments that will be permitted through the phase down period will be limited to the rates that states had submitted to CMS as of July 5, 2016; and
|
|
•
|
Although the change in CMS’ policy results in a reduction of the pass-through payments over a 10-year period, states may instead implement new “Permissible Directed Payments” in Medicaid managed care programs, which could include uniform dollar or percentage increases in rates, minimum or maximum fee schedules.
|
In the January 17, 2017 final rule, CMS estimates that at least 16 states have implemented pass-through payments for hospitals, although the individual states are not identified. Some states in which we operate hospitals have established supplemental payment programs that include payments that may possibly meet CMS’ definition of pass-through payments, and would, therefore, be subject to the provisions of the Medicaid Managed Care final rule. Although CMS’ policy requires the gradual phase-out of pass-through payments, the agency concluded that, because states have other mechanisms to build in amounts currently provided through pass-through payments in approvable ways, the fiscal impact in aggregate spending would not be significant. However, transitioning from pass-through payments to other payment structures could result in a redistribution of payments among providers. We are unable to predict what actions the states affected by the rule will take with respect to CMS’ policy, including the development of permissible alternative managed care payment structures to offset the phase-out of pass-through payments over the transition period, or what impact those actions might have on our operations, revenues or cash flows.
Bipartisan Budget Act of 2018
On February 9, 2018, the President signed the Bipartisan Budget Act of 2018 (“2018 BBA”), a two-year spending agreement and six-week continuing resolution, into law. The 2018 BBA includes the following measures:
56
|
•
|
Four additional years of CHIP funding through FFY 2027, as described above;
|
|
•
|
Modifications to the MIPS under the MACRA;
|
|
•
|
A reduction to the MPFS conversion factor for CY 2019 from 0.5% to 0.25%; and
|
|
•
|
Modifications to the ACA Medicaid DSH payment reductions as follows:
|
|
•
|
elimination of the FFY 2018 and 2019 Medicaid DSH payment reductions;
|
|
•
|
retention of the $4 billion payment reduction in FFY 2020; and
|
|
•
|
an increase to the payment reductions in FFYs 2021 through 2025 to $8 billion.
|
The ACA reduced federal funding for Medicaid DSH payments under the assumption that hospital uncompensated care costs would decline as insurance coverage increased. Although the reductions were delayed several times, federal DSH payment reductions were slated to begin with a $2 billion reduction in FFY 2018, with additional reductions occurring each year through FFY 2025. The amount of federal DSH funds available to each state, referred to as allotments, will vary based on historical state DSH allotments and the methodology that CMS uses to distribute DSH allotment reductions among states. In FFY 2017, a total of $12 billion in federal funds was allotted for DSH payments.
PRIVATE INSURANCE
Managed Care
We currently have thousands of managed care contracts with various HMOs and PPOs. HMOs generally maintain a full-service healthcare delivery network comprised of physician, hospital, pharmacy and ancillary service providers that HMO members must access through an assigned “primary care” physician. The member’s care is then managed by his or her primary care physician and other network providers in accordance with the HMO’s quality assurance and utilization review guidelines so that appropriate healthcare can be efficiently delivered in the most cost-effective manner. HMOs typically provide reduced benefits or reimbursement (or none at all) to their members who use non-contracted healthcare providers for non-emergency care.
PPOs generally offer limited benefits to members who use non-contracted healthcare providers. PPO members who use contracted healthcare providers receive a preferred benefit, typically in the form of lower co-pays, co-insurance or deductibles. As employers and employees have demanded more choice, managed care plans have developed hybrid products that combine elements of both HMO and PPO plans, including high-deductible healthcare plans that may have limited benefits, but cost the employee less in premiums.
The amount of our managed care net patient revenues, including Medicare and Medicaid managed care programs, from our Hospital Operations and other segment during the years ended
December 31, 2017
,
2016
and
2015
was
$10.463 billion
,
$10.651 billion
and
$10.582 billion
, respectively. Approximately
64%
of our managed care net patient revenues for the year ended
December 31, 2017
was derived from our top ten managed care payers. National payers generated approximately
45%
of our total net managed care revenues. The remainder comes from regional or local payers. At
December 31, 2017
and
2016
approximately
62%
and
63%
, respectively, of our net accounts receivable for our Hospital Operations and other segment were due from managed care payers.
Revenues under managed care plans are based primarily on payment terms involving predetermined rates per diagnosis, per-diem rates, discounted fee-for-service rates and other similar contractual arrangements. These revenues are also subject to review and possible audit by the payers, which can take several years before they are completely resolved. The payers are billed for patient services on an individual patient basis. An individual patient’s bill is subject to adjustment on a patient-by-patient basis in the ordinary course of business by the payers following their review and adjudication of each particular bill. We estimate the discounts for contractual allowances at the individual hospital level utilizing billing data on an individual patient basis. At the end of each month, on an individual hospital basis, we estimate our expected reimbursement for patients of managed care plans based on the applicable contract terms. We believe it is reasonably likely for there to be an approximately 3% increase or decrease in the estimated contractual allowances related to managed care plans. Based on reserves at
December 31, 2017
, a 3% increase or decrease in the estimated contractual allowance would impact the estimated reserves by approximately
$17 million
. Some of the factors that can contribute to changes in the contractual allowance
57
estimates include: (1) changes in reimbursement levels for procedures, supplies and drugs when threshold levels are triggered; (2) changes in reimbursement levels when stop-loss or outlier limits are reached; (3) changes in the admission status of a patient due to physician orders subsequent to initial diagnosis or testing; (4) final coding of in-house and discharged-not-final-billed patients that change reimbursement levels; (5) secondary benefits determined after primary insurance payments; and (6) reclassification of patients among insurance plans with different coverage and payment levels. Contractual allowance estimates are periodically reviewed for accuracy by taking into consideration known contract terms, as well as payment history. Although we do not separately accumulate and disclose the aggregate amount of adjustments to the estimated reimbursement for every patient bill, we believe our estimation and review process enables us to identify instances on a timely basis where such estimates need to be revised. We do not believe there were any adjustments to estimates of patient bills that were material to our operating income. In addition, on a corporate-wide basis, we do not record any general provision for adjustments to estimated contractual allowances for managed care plans.
We expect managed care governmental admissions to continue to increase as a percentage of total managed care admissions over the near term. However, the managed Medicare and Medicaid insurance plans typically generate lower yields than commercial managed care plans, which have been experiencing an improved pricing trend. Although we have benefited from solid year-over-year aggregate managed care pricing improvements for several years, we have seen these improvements moderate in recent years, and we believe the moderation could continue in future years. In the year ended
December 31, 2017
, our commercial managed care net inpatient revenue per admission from our acute care hospitals was approximately
82%
higher than our aggregate yield on a per admission basis from government payers, including managed Medicare and Medicaid insurance plans.
Indemnity
An indemnity-based agreement generally requires the insurer to reimburse an insured patient for healthcare expenses after those expenses have been incurred by the patient, subject to policy conditions and exclusions. Unlike an HMO member, a patient with indemnity insurance is free to control his or her utilization of healthcare and selection of healthcare providers.
SELF-PAY PATIENTS
Self-pay patients are patients who do not qualify for government programs payments, such as Medicare and Medicaid, do not have some form of private insurance and, therefore, are responsible for their own medical bills. A significant number of our self-pay patients are admitted through our hospitals’ emergency departments and often require high-acuity treatment that is more costly to provide and, therefore, results in higher billings, which are the least collectible of all accounts.
Self-pay accounts pose significant collectability problems. At
December 31, 2017
and
2016
, approximately
6%
and
5%
, respectively, of our net accounts receivable for our Hospital Operations and other segment were due from self-pay patients. Further, a significant portion of our provision for doubtful accounts relates to self-pay patients, as well as co-pays and deductibles owed to us by patients with insurance. We provide revenue cycle management services through Conifer, which is subject to various statutes and regulations regarding consumer protection in areas including finance, debt collection and credit reporting activities. For additional information, see Item 1, Business — Regulations Affecting Conifer’s Operations, of Part I of this report.
Conifer has performed systematic analyses to focus our attention on the drivers of provision for doubtful accounts for each hospital. While emergency department use is the primary contributor to our provision for doubtful accounts in the aggregate, this is not the case at all hospitals. As a result, we have increased our focus on targeted initiatives that concentrate on non-emergency department patients as well. These initiatives are intended to promote process efficiencies in collecting self-pay accounts, as well as co-pay and deductible amounts owed to us by patients with insurance, that we deem highly collectible. We leverage a statistical-based collections model that aligns our operational capacity to maximize our collections performance. We are dedicated to modifying and refining our processes as needed, enhancing our technology and improving staff training throughout the revenue cycle process in an effort to increase collections and reduce accounts receivable.
Over the longer term, several other initiatives we have previously announced should also help address this challenge. For example, our
Compact with Uninsured Patients
(“Compact”) is designed to offer managed care-style discounts to certain uninsured patients, which enables us to offer lower rates to those patients who historically had been charged standard gross charges. A significant portion of those charges had previously been written down in our provision for doubtful accounts. Under the Compact, the discount offered to uninsured patients is recognized as a contractual allowance, which reduces net operating revenues at the time the self-pay accounts are recorded. The uninsured patient accounts, net of contractual allowances recorded, are further reduced to their net realizable value through provision for doubtful accounts based on historical collection trends for self-pay accounts and other factors that affect the estimation process.
58
We also provide charity care to patients who are financially unable to pay for the healthcare services they receive. Most patients who qualify for charity care are charged a per-diem amount for services received, subject to a cap. Except for the per-diem amounts, our policy is not to pursue collection of amounts determined to qualify as charity care; therefore, we do not report these amounts in net operating revenues. Most states include an estimate of the cost of charity care in the determination of a hospital’s eligibility for Medicaid DSH payments. These payments are intended to mitigate our cost of uncompensated care, as well as reduced Medicaid funding levels. Generally, our method of measuring the estimated costs uses adjusted self-pay/charity patient days multiplied by selected operating expenses (which include salaries, wages and benefits, supplies and other operating expenses and which exclude the costs of our health plan businesses) per adjusted patient day. The adjusted self-pay/charity patient days represents actual self-pay/charity patient days adjusted to include self-pay/charity outpatient services by multiplying actual self-pay/charity patient days by the sum of gross self-pay/charity inpatient revenues and gross self-pay/charity outpatient revenues and dividing the results by gross self-pay/charity inpatient revenues. The following table shows our estimated costs (based on selected operating expenses) of caring for self-pay patients and charity care patients, as well as revenues attributable to DSH and other supplemental revenues we recognized, in the years ended
December 31, 2017
,
2016
and
2015
.
|
|
Years Ended December 31,
|
|||||||||||
|
|
2017
|
2016
|
2015
|
|||||||||
|
Estimated costs for:
|
|
|
|
|
|
|
||||||
|
Self-pay patients
|
$
|
648
|
|
$
|
609
|
|
$
|
598
|
|
|||
|
Charity care patients
|
121
|
|
138
|
|
184
|
|
||||||
|
Total
|
$
|
769
|
|
$
|
747
|
|
$
|
782
|
|
|||
|
Medicaid DSH and other supplemental revenues
|
$
|
864
|
|
$
|
906
|
|
$
|
888
|
|
|||
The expansion of health insurance coverage has resulted in an increase in the number of patients using our facilities who have either health insurance exchange or government healthcare insurance program coverage. However, we continue to have to provide uninsured discounts and charity care due to the failure of states to expand Medicaid coverage and for persons living in the country who are not permitted to enroll in a health insurance exchange or government healthcare insurance program.
59
RESULTS OF OPERATIONS FOR THE YEAR ENDED DECEMBER 31,
2017
COMPARED TO THE YEAR ENDED DECEMBER 31,
2016
The following two tables summarize our consolidated net operating revenues, operating expenses and operating income from continuing operations, both in dollar amounts and as percentages of net operating revenues, for the years ended
December 31, 2017
and
2016
:
|
|
Years Ended December 31,
|
||||||||||
|
|
2017
|
2016
|
Increase
(Decrease)
|
||||||||
|
Net operating revenues:
|
|
|
|
|
|
|
|||||
|
General hospitals
|
$
|
16,242
|
|
$
|
16,488
|
|
$
|
(246
|
)
|
||
|
Other operations
|
4,371
|
|
4,582
|
|
(211
|
)
|
|||||
|
Net operating revenues before provision for doubtful accounts
|
20,613
|
|
21,070
|
|
(457
|
)
|
|||||
|
Less provision for doubtful accounts
|
1,434
|
|
1,449
|
|
(15
|
)
|
|||||
|
Net operating revenues
|
19,179
|
|
19,621
|
|
(442
|
)
|
|||||
|
Equity in earnings of unconsolidated affiliates
|
144
|
|
131
|
|
13
|
|
|||||
|
Operating expenses:
|
|
|
|
|
|
|
|||||
|
Salaries, wages and benefits
|
9,274
|
|
9,328
|
|
(54
|
)
|
|||||
|
Supplies
|
3,085
|
|
3,124
|
|
(39
|
)
|
|||||
|
Other operating expenses, net
|
4,570
|
|
4,891
|
|
(321
|
)
|
|||||
|
Electronic health record incentives
|
(9
|
)
|
(32
|
)
|
23
|
|
|||||
|
Depreciation and amortization
|
870
|
|
850
|
|
20
|
|
|||||
|
Impairment and restructuring charges, and acquisition-related costs
|
541
|
|
202
|
|
339
|
|
|||||
|
Litigation and investigation costs
|
23
|
|
293
|
|
(270
|
)
|
|||||
|
Gains on sales, consolidation and deconsolidation of facilities
|
(144
|
)
|
(151
|
)
|
7
|
|
|||||
|
Operating income
|
$
|
1,113
|
|
$
|
1,247
|
|
$
|
(134
|
)
|
||
|
|
Years Ended December 31,
|
|||||||
|
|
2017
|
2016
|
Increase
(Decrease)
|
|||||
|
Net operating revenues
|
100.0
|
%
|
100.0
|
%
|
—
|
%
|
||
|
Equity in earnings of unconsolidated affiliates
|
0.8
|
%
|
0.7
|
%
|
0.1
|
%
|
||
|
Operating expenses:
|
|
|
|
|
||||
|
Salaries, wages and benefits
|
48.4
|
%
|
47.5
|
%
|
0.9
|
%
|
||
|
Supplies
|
16.1
|
%
|
15.9
|
%
|
0.2
|
%
|
||
|
Other operating expenses, net
|
23.8
|
%
|
25.0
|
%
|
(1.2
|
)%
|
||
|
Electronic health record incentives
|
—
|
%
|
(0.2
|
)%
|
0.2
|
%
|
||
|
Depreciation and amortization
|
4.5
|
%
|
4.3
|
%
|
0.2
|
%
|
||
|
Impairment and restructuring charges, and acquisition-related costs
|
2.8
|
%
|
1.1
|
%
|
1.7
|
%
|
||
|
Litigation and investigation costs
|
0.1
|
%
|
1.5
|
%
|
(1.4
|
)%
|
||
|
Gains on sales, consolidation and deconsolidation of facilities
|
(0.7
|
)%
|
(0.8
|
)%
|
0.1
|
%
|
||
|
Operating income
|
5.8
|
%
|
6.4
|
%
|
(0.6
|
)%
|
||
Net operating revenues of our general hospitals include inpatient and outpatient revenues for services provided by facilities in our Hospital Operations and other segment, as well as nonpatient revenues (e.g., rental income, management fee revenue, and income from services such as cafeterias, gift shops and parking) and other miscellaneous revenue. Net operating revenues of other operations for the periods presented primarily consist of revenues from (1) physician practices, (2) our Ambulatory Care segment, (3) services provided by Conifer to third parties and (4) our health plans, most of which were sold in 2017. Revenues from our general hospitals represented approximately
79%
and
78%
of our total net operating revenues before provision for doubtful accounts for the years ended
December 31, 2017
and
2016
, respectively.
Net operating revenues from our other operations were
$4.371 billion
and
$4.582 billion
in the years ended
December 31, 2017
and
2016
, respectively. The
decrease
in net operating revenues from other operations during
2017
primarily related to the cessation of operations of our health plan businesses in 2017, partially offset by increased revenues from the revenue cycle services provided by Conifer, as well as revenues from our USPI joint venture. Equity in earnings of unconsolidated affiliates were
$144 million
and
$131 million
for the years ended
December 31, 2017
and
2016
, respectively. The increase in equity in earnings of unconsolidated affiliates in the
2017
period compared to the
2016
period primarily related to our USPI joint venture.
60
The following table shows selected operating expenses of our three reportable business segments. Information for our Hospital Operations and other segment is presented on a same-hospital basis, which includes the results of our same
72
hospitals operated throughout the years ended
December 31, 2017
and
2016
. Our same-hospital information excludes the results of
five Georgia hospitals, which we divested effective April 1, 2016
, our
THOP Transmountain Campus teaching hospital, which we opened in January 2017 in El Paso
, and
three Houston-area hospitals, which we divested effective August 1, 2017
. In addition, although we operated Centennial, Lake Pointe, Sunnyvale and White Rock throughout the years ended December 31, 2017 and 2016, we do not consolidate the results of operations of these hospitals because we divested a controlling interest in them effective January 1, 2016.
|
|
Years Ended December 31,
|
||||||||||
|
Selected Operating Expenses
|
2017
|
2016
|
Increase
(Decrease)
|
||||||||
|
Hospital Operations and other — Same-Hospital
|
|
|
|
|
|
|
|||||
|
Salaries, wages and benefits
|
$
|
7,490
|
|
$
|
7,423
|
|
0.9
|
%
|
|||
|
Supplies
|
2,628
|
|
2,659
|
|
(1.2
|
)%
|
|||||
|
Other operating expenses
|
3,682
|
|
3,936
|
|
(6.5
|
)%
|
|||||
|
Total
|
$
|
13,800
|
|
$
|
14,018
|
|
(1.6
|
)%
|
|||
|
Ambulatory Care
|
|
|
|
|
|
|
|||||
|
Salaries, wages and benefits
|
$
|
623
|
|
$
|
594
|
|
4.9
|
%
|
|||
|
Supplies
|
398
|
|
365
|
|
9.0
|
%
|
|||||
|
Other operating expenses
|
360
|
|
346
|
|
4.0
|
%
|
|||||
|
Total
|
$
|
1,381
|
|
$
|
1,305
|
|
5.8
|
%
|
|||
|
Conifer
|
|
|
|
|
|
|
|||||
|
Salaries, wages and benefits
|
$
|
962
|
|
$
|
959
|
|
0.3
|
%
|
|||
|
Supplies
|
5
|
|
—
|
|
100.0
|
%
|
|||||
|
Other operating expenses
|
347
|
|
335
|
|
3.6
|
%
|
|||||
|
Total
|
$
|
1,314
|
|
$
|
1,294
|
|
1.5
|
%
|
|||
|
Total
|
|
|
|
|
|
|
|||||
|
Salaries, wages and benefits
|
$
|
9,075
|
|
$
|
8,976
|
|
1.1
|
%
|
|||
|
Supplies
|
3,031
|
|
3,024
|
|
0.2
|
%
|
|||||
|
Other operating expenses
|
4,389
|
|
4,617
|
|
(4.9
|
)%
|
|||||
|
Total
|
$
|
16,495
|
|
$
|
16,617
|
|
(0.7
|
)%
|
|||
|
Rent/lease expense
(1)
|
|
|
|
|
|
|
|||||
|
Hospital Operations and other
|
$
|
226
|
|
$
|
223
|
|
1.3
|
%
|
|||
|
Ambulatory Care
|
77
|
|
74
|
|
4.1
|
%
|
|||||
|
Conifer
|
19
|
|
18
|
|
5.6
|
%
|
|||||
|
Total
|
$
|
322
|
|
$
|
315
|
|
2.2
|
%
|
|||
|
(1)
|
Included in other operating expenses.
|
|
RESULTS OF OPERATIONS BY SEGMENT
Our operations are reported under three segments:
|
•
|
Hospital Operations and other, which
is comprised of our acute care hospitals, ancillary outpatient facilities, urgent care centers, microhospitals and physician practices. As described in Note 4
to the accompanying Consolidated Financial Statements
, certain of our facilities are classified as held for sale
at
December 31, 2017
.
|
|
•
|
Ambulatory Care, which is comprised of our USPI joint venture’s ambulatory surgery centers, urgent care centers, imaging centers and surgical hospitals, as well as Aspen’s hospitals and clinics, which are classified as held for sale at
December 31, 2017
as described in Note 4 to the accompanying Consolidated Financial Statements.
|
|
•
|
Conifer, which
provides healthcare business process services in the areas of hospital and physician revenue cycle management and value-based care solutions to healthcare systems, as well as individual hospitals, physician practices, self-insured organizations, health plans and other entities
.
|
61
Hospital Operations and
Other Segment
The following tables show operating statistics of our continuing operations hospitals and related outpatient facilities on a same-hospital basis, unless otherwise indicated, which includes the results of our same
72
hospitals operated throughout the years ended
December 31, 2017
and
2016
. Our same-hospital information excludes the results of
five Georgia hospitals, which we divested effective April 1, 2016
, our
THOP Transmountain Campus teaching hospital, which we opened in January 2017 in El Paso
, and
three Houston-area hospitals, which we divested effective August 1, 2017
. In addition, although we operated Centennial, Lake Pointe, Sunnyvale and White Rock throughout the years ended December 31, 2017 and 2016, we do not consolidate the results of operations of these hospitals because we divested a controlling interest in them effective January 1, 2016.
|
|
Same-Hospital
Continuing Operations
|
|||||||||
|
Years Ended December 31,
|
||||||||||
|
Admissions, Patient Days and Surgeries
|
2017
|
2016
|
Increase
(Decrease)
|
|||||||
|
Number of hospitals (at end of period)
|
72
|
|
72
|
|
—
|
|
(1)
|
|||
|
Total admissions
|
738,528
|
|
753,673
|
|
(2.0
|
)%
|
||||
|
Adjusted patient admissions
(2)
|
1,294,913
|
|
1,310,962
|
|
(1.2
|
)%
|
||||
|
Paying admissions (excludes charity and uninsured)
|
699,613
|
|
715,198
|
|
(2.2
|
)%
|
||||
|
Charity and uninsured admissions
|
38,915
|
|
38,475
|
|
1.1
|
%
|
||||
|
Admissions through emergency department
|
480,180
|
|
476,068
|
|
0.9
|
%
|
||||
|
Paying admissions as a percentage of total admissions
|
94.7
|
%
|
94.9
|
%
|
(0.2
|
)%
|
(1)
|
|||
|
Charity and uninsured admissions as a percentage of total admissions
|
5.3
|
%
|
5.1
|
%
|
0.2
|
%
|
(1)
|
|||
|
Emergency department admissions as a percentage of total admissions
|
65.0
|
%
|
63.2
|
%
|
1.8
|
%
|
(1)
|
|||
|
Surgeries — inpatient
|
199,871
|
|
207,609
|
|
(3.7
|
)%
|
||||
|
Surgeries — outpatient
|
271,228
|
|
286,761
|
|
(5.4
|
)%
|
||||
|
Total surgeries
|
471,099
|
|
494,370
|
|
(4.7
|
)%
|
||||
|
Patient days — total
|
3,423,934
|
|
3,515,087
|
|
(2.6
|
)%
|
||||
|
Adjusted patient days
(2)
|
5,964,002
|
|
6,080,456
|
|
(1.9
|
)%
|
||||
|
Average length of stay (days)
|
4.64
|
|
4.66
|
|
(0.4
|
)%
|
||||
|
Licensed beds (at end of period)
|
19,035
|
|
19,306
|
|
(1.4
|
)%
|
||||
|
Average licensed beds
|
19,277
|
|
19,315
|
|
(0.2
|
)%
|
||||
|
Utilization of licensed beds
(3)
|
48.7
|
%
|
49.9
|
%
|
(1.2
|
)%
|
(1)
|
|||
|
(1)
|
The change is the difference between 2017 and 2016 amounts shown.
|
|
|
(2)
|
Adjusted patient admissions/days represents actual patient admissions/days adjusted to include outpatient services provided by facilities in our Hospital Operations and other segment by multiplying actual patient admissions/days by the sum of gross inpatient revenues and outpatient revenues and dividing the results by gross inpatient revenues.
|
|
|
(3)
|
Utilization of licensed beds represents patient days divided by number of days in the period divided by average licensed beds.
|
|
|
|
Same-Hospital
Continuing Operations
|
|||||||||
|
|
Years Ended December 31,
|
|||||||||
|
Outpatient Visits
|
2017
|
2016
|
Increase
(Decrease)
|
|||||||
|
Total visits
|
7,495,754
|
|
7,697,302
|
|
(2.6
|
)%
|
||||
|
Paying visits (excludes charity and uninsured)
|
7,028,688
|
|
7,200,453
|
|
(2.4
|
)%
|
||||
|
Charity and uninsured visits
|
467,066
|
|
496,849
|
|
(6.0
|
)%
|
||||
|
Emergency department visits
|
2,664,448
|
|
2,689,519
|
|
(0.9
|
)%
|
||||
|
Surgery visits
|
271,228
|
|
286,761
|
|
(5.4
|
)%
|
||||
|
Paying visits as a percentage of total visits
|
93.8
|
%
|
93.5
|
%
|
0.3
|
%
|
(1)
|
|||
|
Charity and uninsured visits as a percentage of total visits
|
6.2
|
%
|
6.5
|
%
|
(0.3
|
)%
|
(1)
|
|||
|
(1)
|
The change is the difference between the 2017 and 2016 amounts shown.
|
|
62
|
|
Same-Hospital
Continuing Operations
|
||||||||||
|
|
Years Ended December 31,
|
||||||||||
|
Revenues
|
2017
|
2016
|
Increase
(Decrease)
|
||||||||
|
Total segment net operating revenues
|
$
|
15,191
|
|
$
|
15,472
|
|
(1.8
|
)%
|
|||
|
Selected acute care hospitals and related outpatient facilities revenue data
|
|||||||||||
|
Net inpatient revenues
|
$
|
10,037
|
|
$
|
10,089
|
|
(0.5
|
)%
|
|||
|
Net outpatient revenues
|
5,626
|
|
5,452
|
|
3.2
|
%
|
|||||
|
Net patient revenues
|
$
|
15,663
|
|
$
|
15,541
|
|
0.8
|
%
|
|||
|
Self-pay net inpatient revenues
|
$
|
395
|
|
$
|
370
|
|
6.8
|
%
|
|||
|
Self-pay net outpatient revenues
|
564
|
|
511
|
|
10.4
|
%
|
|||||
|
Total self-pay revenues
|
$
|
959
|
|
$
|
881
|
|
8.9
|
%
|
|||
|
|
Same-Hospital
Continuing Operations
|
||||||||||
|
|
Years Ended December 31,
|
||||||||||
|
Revenues on a Per Admission, Per Patient Day and Per Visit Basis
|
2017
|
2016
|
Increase
(Decrease)
|
||||||||
|
Net inpatient revenue per admission
|
$
|
13,591
|
|
$
|
13,386
|
|
1.5
|
%
|
|||
|
Net inpatient revenue per patient day
|
$
|
2,931
|
|
$
|
2,870
|
|
2.1
|
%
|
|||
|
Net outpatient revenue per visit
|
$
|
751
|
|
$
|
708
|
|
6.1
|
%
|
|||
|
Net patient revenue per adjusted patient admission
(1)
|
$
|
12,096
|
|
$
|
11,855
|
|
2.0
|
%
|
|||
|
Net patient revenue per adjusted patient day
(1)
|
$
|
2,626
|
|
$
|
2,556
|
|
2.7
|
%
|
|||
|
(1)
|
Adjusted patient admissions/days represents actual patient admissions/days adjusted to include outpatient services provided by facilities in our Hospital Operations and other segment by multiplying actual patient admissions/days by the sum of gross inpatient revenues and outpatient revenues and dividing the results by gross inpatient revenues.
|
|
|
|
Same-Hospital
Continuing Operations
|
|||||||||||
|
|
Years Ended December 31,
|
|||||||||||
|
Total Segment Provision for Doubtful Accounts
|
2017
|
2016
|
Increase
(Decrease)
|
|||||||||
|
Provision for doubtful accounts
|
$
|
1,300
|
|
$
|
1,220
|
|
6.6
|
%
|
||||
|
Provision for doubtful accounts as a percentage of net operating revenues before provision for doubtful accounts
|
7.9
|
%
|
7.3
|
%
|
0.6
|
%
|
(1)
|
|||||
|
(1)
|
The change is the difference between the 2017 and 2016 amounts shown.
|
|
|
|
Same-Hospital
Continuing Operations
|
|||||||||
|
|
Years Ended December 31,
|
|||||||||
|
Total Segment Selected Operating Expenses
|
2017
|
2016
|
Increase
(Decrease)
|
|||||||
|
Salaries, wages and benefits as a percentage of net operating revenues
|
49.3
|
%
|
48.0
|
%
|
1.3
|
%
|
(1)
|
|||
|
Supplies as a percentage of net operating revenues
|
17.3
|
%
|
17.2
|
%
|
0.1
|
%
|
(1)
|
|||
|
Other operating expenses as a percentage of net operating revenues
|
24.2
|
%
|
25.4
|
%
|
(1.2
|
)%
|
(1)
|
|||
|
(1)
|
The change is the difference between the 2017 and 2016 amounts shown.
|
|
Revenues
Same-hospital net operating revenues
decreased
$281 million
, or
1.8%
, during the year ended
December 31, 2017
compared to the year ended
December 31, 2016
. The
decrease
in same-hospital net operating revenues in the
2017
period is primarily due to lower inpatient and outpatient volumes, as well as a decrease in our other operations revenues, partially offset by improved terms of our managed care contracts and incremental net revenues from the California provider fee program of
$35 million
. Same-hospital net inpatient revenues
decreased
$52 million
, or
0.5%
, while same-hospital admissions
decreased
2.0%
in the
2017
period compared to the
2016
period. Same-hospital net inpatient revenue per admission
increased
1.5%
, primarily due to the improved terms of our managed care contracts and volume growth in higher acuity service lines in the year ended
December 31, 2017
compared to the prior year. Same-hospital net outpatient revenues
increased
$174 million
, or
3.2%
, and same-hospital outpatient visits
decreased
2.6%
in the year ended
December 31, 2017
compared to the year ended
63
December 31, 2016
. Growth in outpatient revenues was primarily driven by improved terms of our managed care contracts, partially offset by
decreased
outpatient volume levels. Same-hospital net outpatient revenue per visit
increased
6.1%
primarily due to the improved terms of our managed care contracts.
Provision for Doubtful Accounts
Same-hospital provision for doubtful accounts as a percentage of net operating revenues before provision for doubtful accounts was
7.9%
and
7.3%
for the years ended
December 31, 2017
and
2016
, respectively. The increase in the
2017
period compared to the
2016
period was driven by increases in uninsured revenues and volumes, as well as higher patient co-pays and deductibles. The following table shows the net accounts receivable and allowance for doubtful accounts by payer at
December 31, 2017
and
2016
:
|
|
December 31, 2017
|
December 31, 2016
|
|||||||||||||||||||||
|
|
Accounts Receivable Before Allowance for Doubtful Accounts
|
Allowance for Doubtful Accounts
|
Net
|
Accounts Receivable Before Allowance for Doubtful Accounts
|
Allowance for Doubtful Accounts
|
Net
|
|||||||||||||||||
|
Medicare
|
$
|
257
|
|
$
|
—
|
|
$
|
257
|
|
$
|
294
|
|
$
|
—
|
|
$
|
294
|
|
|||||
|
Medicaid
|
95
|
|
—
|
|
95
|
|
125
|
|
—
|
|
125
|
|
|||||||||||
|
Net cost report settlements receivable (payable) and valuation allowances
|
4
|
|
—
|
|
4
|
|
(14
|
)
|
—
|
|
(14
|
)
|
|||||||||||
|
Managed care
|
1,709
|
|
204
|
|
1,505
|
|
1,911
|
|
190
|
|
1,721
|
|
|||||||||||
|
Self-pay uninsured
|
407
|
|
351
|
|
56
|
|
479
|
|
412
|
|
67
|
|
|||||||||||
|
Self-pay balance after insurance
|
240
|
|
149
|
|
91
|
|
226
|
|
147
|
|
79
|
|
|||||||||||
|
Estimated future recoveries
|
132
|
|
—
|
|
132
|
|
141
|
|
—
|
|
141
|
|
|||||||||||
|
Other payers
|
453
|
|
151
|
|
302
|
|
537
|
|
239
|
|
298
|
|
|||||||||||
|
Total Hospital Operations and other
|
3,297
|
|
855
|
|
2,442
|
|
3,699
|
|
988
|
|
2,711
|
|
|||||||||||
|
Ambulatory Care
|
215
|
|
43
|
|
172
|
|
227
|
|
43
|
|
184
|
|
|||||||||||
|
Total discontinued operations
|
2
|
|
—
|
|
2
|
|
2
|
|
—
|
|
2
|
|
|||||||||||
|
|
$
|
3,514
|
|
$
|
898
|
|
$
|
2,616
|
|
$
|
3,928
|
|
$
|
1,031
|
|
$
|
2,897
|
|
|||||
A significant portion of our provision for doubtful accounts relates to self-pay patients, as well as co-pays and deductibles owed to us by patients with insurance. Collection of accounts receivable has been a key area of focus, particularly over the past several years. At
December 31, 2017
, our Hospital Operations and other segment collection rate on self-pay accounts was approximately
24.7%
. Our self-pay collection rate includes payments made by patients, including co-pays and deductibles paid by patients with insurance. Based on our accounts receivable from self-pay patients and co-pays and deductibles owed to us by patients with insurance at
December 31, 2017
, a 10% decrease or increase in our self-pay collection rate, or approximately 3%, which we believe could be a reasonably likely change, would result in an unfavorable or favorable adjustment to provision for doubtful accounts of approximately
$9 million
.
Payment pressure from managed care payers also affects our provision for doubtful accounts. We typically experience ongoing managed care payment delays and disputes; however, we continue to work with these payers to obtain adequate and timely reimbursement for our services. Our estimated Hospital Operations and other segment collection rate from managed care payers was approximately
97.4%
at
December 31, 2017
.
We manage our provision for doubtful accounts using hospital-specific goals and benchmarks such as (1) total cash collections, (2) point-of-service cash collections, (3) AR Days and (4) accounts receivable by aging category. The following tables present the approximate aging by payer of our net accounts receivable from the continuing operations of our Hospital Operations and other segment of
$2.438 billion
and
$2.725 billion
at
December 31, 2017
and
2016
, respectively, excluding cost report settlements receivable (payable) and valuation allowances of
$4 million
and
$(14) million
at
December 31, 2017
and
2016
, respectively:
64
|
|
December 31, 2017
|
|||||||||||||
|
Medicare
|
Medicaid
|
Managed
Care
|
Indemnity,
Self-Pay
and Other
|
Total
|
||||||||||
|
0-60 days
|
89
|
%
|
66
|
%
|
65
|
%
|
28
|
%
|
60
|
%
|
||||
|
61-120 days
|
6
|
%
|
16
|
%
|
14
|
%
|
17
|
%
|
13
|
%
|
||||
|
121-180 days
|
2
|
%
|
10
|
%
|
7
|
%
|
9
|
%
|
7
|
%
|
||||
|
Over 180 days
|
3
|
%
|
8
|
%
|
14
|
%
|
46
|
%
|
20
|
%
|
||||
|
Total
|
100
|
%
|
100
|
%
|
100
|
%
|
100
|
%
|
100
|
%
|
||||
|
|
December 31, 2016
|
|||||||||||||
|
Medicare
|
Medicaid
|
Managed
Care
|
Indemnity,
Self-Pay
and Other
|
Total
|
||||||||||
|
0-60 days
|
92
|
%
|
75
|
%
|
61
|
%
|
24
|
%
|
60
|
%
|
||||
|
61-120 days
|
5
|
%
|
15
|
%
|
15
|
%
|
14
|
%
|
13
|
%
|
||||
|
121-180 days
|
2
|
%
|
4
|
%
|
8
|
%
|
10
|
%
|
6
|
%
|
||||
|
Over 180 days
|
1
|
%
|
6
|
%
|
16
|
%
|
52
|
%
|
21
|
%
|
||||
|
Total
|
100
|
%
|
100
|
%
|
100
|
%
|
100
|
%
|
100
|
%
|
||||
Conifer continues to implement revenue cycle initiatives to improve cash flow. These initiatives are focused on standardizing and improving both patient access processes, including pre-registration, registration, verification of eligibility and benefits, liability identification and collection at point-of-service, and financial counseling and accounts receivable processes, including billing and follow up. These initiatives are intended to reduce denials, improve service levels to patients and increase the quality of accounts that end up in accounts receivable. Although we continue to focus on improving our methodology for evaluating the collectability of our accounts receivable, we may incur future charges if there are unfavorable changes in the trends affecting the net realizable value of our accounts receivable.
At
December 31, 2017
, we had a cumulative total of patient account assignments to Conifer of approximately
$2.279 billion
related to our continuing operations. These accounts have already been written off and are not included in our receivables or in the allowance for doubtful accounts; however, an estimate of future recoveries from all the accounts assigned to Conifer is determined based on our historical experience and recorded in accounts receivable.
Patient advocates from Conifer’s Medicaid Eligibility Program (“MEP”) screen patients in the hospital to determine whether those patients meet eligibility requirements for financial assistance programs. They also expedite the process of applying for these government programs. Receivables from patients who are potentially eligible for Medicaid are classified as Medicaid pending, under the MEP, with appropriate contractual allowances recorded. Based on recent trends, approximately
95%
of all accounts in the MEP are ultimately approved for benefits under a government program, such as Medicaid. The following table shows the approximate amount of accounts receivable in the MEP still awaiting determination of eligibility under a government program at
December 31, 2017
and
2016
by aging category for the hospitals currently in the program:
|
|
2017
|
2016
|
|||||
|
0-60 days
|
$
|
81
|
|
$
|
84
|
|
|
|
61-120 days
|
12
|
|
13
|
|
|||
|
121-180 days
|
3
|
|
4
|
|
|||
|
Over 180 days
|
4
|
|
4
|
|
|||
|
Total
|
$
|
100
|
|
$
|
105
|
|
|
Salaries, Wages and Benefits
Same-hospital salaries, wages and benefits as a percentage of net operating revenues
increased
by
130
basis points to
49.3%
in the year ended
December 31, 2017
compared to the same period in
2016
. While same-hospital net operating revenues
decreased
1.8%
in the year ended
December 31, 2017
compared to the year ended
December 31, 2016
, same-hospital salaries, wages and benefits
increased
by
0.9%
in the
2017
period compared to the
2016
period. The increase in same-hospital salaries, wages and benefits as a percentage of net operating revenues was primarily due to annual merit increases for certain of our employees, increased employee health benefits costs and the effect of lower volumes on operating leverage due to certain fixed staffing costs. Salaries, wages and benefits expense for the years ended
December 31, 2017
and
2016
included stock-based compensation expense of
$46 million
and
$58 million
, respectively.
65
At
December 31, 2017
, approximately
24%
of the employees in our Hospital Operations and other segment were represented by labor unions. There were no unionized employees in our Ambulatory Care segment, and less than 1% of Conifer’s employees belong to a union. Unionized employees – primarily registered nurses and service, technical and maintenance workers – are located at
35
of our hospitals, the majority of which are in California, Florida and Michigan. We currently have
six
expired contracts covering approximately
14%
of our unionized employees and are or will be negotiating renewals under extension agreements. We are also negotiating (or will soon negotiate)
six
first contracts at four hospitals where employees recently selected union representation; these contracts cover nearly
7%
of our unionized employees. At this time, we are unable to predict the outcome of the negotiations, but increases in salaries, wages and benefits could result from these agreements. Furthermore, there is a possibility that strikes could occur during the negotiation process, which could increase our labor costs and have an adverse effect on our patient admissions and net operating revenues. Organizing activities by labor unions could increase our level of union representation in future periods.
Supplies
Same-hospital supplies expense as a percentage of net operating revenues
increased
by
10
basis points to
17.3%
in the year ended
December 31, 2017
compared to the same period in
2016
. Supplies expense was impacted by growth in our higher acuity supply-intensive surgical services, partially offset by the benefits of the group-purchasing strategies and supplies-management services we utilize to reduce costs.
We strive to control supplies expense through product standardization, contract compliance, improved utilization, bulk purchases and operational improvements. The items of current cost reduction focus continue to be cardiac stents and pacemakers, orthopedics and implants, and high-cost pharmaceuticals.
Other Operating Expenses, Net
Same-hospital other operating expenses as a percentage of net operating revenues
decreased
by
120
basis points to
24.2%
in the year ended
December 31, 2017
compared to
25.4%
in the same period in
2016
. Same-hospital other operating expenses
decreased
by
$254 million
, or
6.5%
, and net operating revenues
decreased
by
$281 million
, or
1.8%
, for the year ended December 31, 2017 compared to the year ended December 31, 2016. The changes in other operating expenses included:
|
•
|
decreased
expenses associated with our health plan businesses of
$362 million
due to the sale and wind-down of those businesses in 2017, which decreases were offset by decreased health plan revenues; and
|
|
•
|
increased
gains on sales of fixed assets of
$24 million
primarily due to the sale of our home health and hospice assets, partially offset by
|
|
•
|
increased
costs associated with funding indigent care services by hospitals we operated throughout both periods of
$12 million
, which costs were substantially offset by additional net patient revenues;
|
|
•
|
increased
medical fees of
$54 million
; and
|
|
•
|
increased
malpractice expense of
$28 million
.
|
Same-hospital malpractice expense in the 2017 period included a favorable adjustment of approximately
$3 million
from the
eight
basis point increase in the interest rate used to estimate the discounted present value of projected future malpractice liabilities compared to a favorable adjustment of approximately $4 million from the 16 basis point increase in the interest rate in the
2016
period.
Ambulatory
Care
Segment
Our Ambulatory Care segment is comprised of our USPI joint venture’s ambulatory surgery centers, urgent care centers, imaging centers and surgical hospitals, as well as Aspen’s hospitals and clinics. Our USPI joint venture operates its surgical facilities in partnership with local physicians and, in many of these facilities, a healthcare system partner. We hold an ownership interest in each facility, with each being operated through a separate legal entity. The joint venture operates facilities on a day-to-day basis through management services contracts. Our sources of earnings from each facility consist of:
|
•
|
management services revenues, computed as a percentage of each facility’s net revenues (often net of bad debt expense); and
|
66
|
•
|
our share of each facility’s net income (loss), which is computed by multiplying the facility’s net income (loss) times the percentage of each facility’s equity interests owned by our USPI joint venture.
|
Our role as an owner and day-to-day manager provides us with significant influence over the operations of each facility. In many of the facilities our Ambulatory Care segment operates (
106
of
333
facilities at
December 31, 2017
), this influence does not represent control of the facility, so we account for our investments in these facilities under the equity method as unconsolidated affiliates. We control
227
of the facilities our Ambulatory Care segment operates, and we account for these investments as consolidated subsidiaries. Our net earnings from a facility are the same under either method, but the classification of those earnings differs. For consolidated subsidiaries, our financial statements reflect 100% of the revenues and expenses of the subsidiaries, after the elimination of intercompany amounts. The net profit attributable to owners other than us is classified within “net income attributable to noncontrolling interests.”
For unconsolidated affiliates, our consolidated statements of operations reflect our earnings in two line items:
|
•
|
equity in earnings of unconsolidated affiliates
—our share of the net income of each facility, which is based on the facility’s net income and the percentage of the facility’s outstanding equity interests owned by our USPI joint venture; and
|
|
•
|
management and administrative services revenues, which is included in our net operating revenues
—income we earn in exchange for managing the day-to-day operations of each facility, usually quantified as a percentage of each facility’s net revenues less bad debt expense.
|
Our Ambulatory Care operating income is driven by the performance of all facilities our USPI joint venture operates and by the joint venture’s ownership interests in those facilities, but our individual revenue and expense line items contain only consolidated businesses, which represent
68%
of those facilities. This translates to trends in consolidated operating income that often do not correspond with changes in consolidated revenues and expenses.
Year Ended
December 31, 2017
Compared to the Year Ended
December 31, 2016
The following table summarizes certain consolidated statements of operations items for the periods indicated:
|
|
Years Ended December 31,
|
|||||||
|
Ambulatory Care Results of Operations
|
2017
|
2016
|
||||||
|
Net operating revenues
|
$
|
1,940
|
|
$
|
1,797
|
|
||
|
Equity in earnings of unconsolidated affiliates
|
$
|
140
|
|
$
|
122
|
|
||
|
Salaries, wages and benefits
|
$
|
623
|
|
$
|
594
|
|
||
|
Supplies
|
$
|
398
|
|
$
|
365
|
|
||
|
Other operating expenses, net
|
$
|
360
|
|
$
|
346
|
|
||
Our Ambulatory Care net operating revenues
increased
by
$143 million
, or
8.0%
, for the year ended
December 31, 2017
compared to the year ended
December 31, 2016
. The growth in
2017
revenues was primarily driven by increases from acquisitions of $110 million.
Salaries, wages and benefits expense
increased
by
$29 million
, or
4.9%
, for the year ended
December 31, 2017
compared to the year ended
December 31, 2016
. The
2017
increase was primarily driven by salaries, wages and benefits expense from acquisitions of $26 million.
Supplies expense
increased
by
$33 million
, or
9.0%
, for the year ended
December 31, 2017
compared to the year ended
December 31, 2016
. The
2017
increase was primarily due to supplies expense from acquisitions of $27 million.
Other operating expenses
increased
by
$14 million
, or
4.0%
, for the year ended
December 31, 2017
compared to the year ended
December 31, 2016
. The
2017
increase in other operating expenses was driven by other operating expenses from acquisitions of $18 million, partially offset by decreases in same-facility other operating expenses of $4 million.
Facility Growth
The following table summarizes the changes in our same-facility revenue year-over-year on a pro forma systemwide basis, which includes both consolidated and unconsolidated (equity method) facilities. While we do not record the revenues of unconsolidated facilities, we believe this information is important in understanding the financial performance of our
67
Ambulatory Care segment because these revenues are the basis for calculating our management services revenues and, together with the expenses of our unconsolidated facilities, are the basis for our equity in earnings of unconsolidated affiliates.
|
Ambulatory Care Facility Growth
|
Year Ended December 31, 2017
|
|
|
Net revenues
|
4.6%
|
|
|
Cases
|
0.6%
|
|
|
Net revenue per case
|
3.9%
|
|
Joint Ventures with Healthcare System Partners
Our USPI joint venture’s business model is to jointly own its facilities with local physicians and not-for-profit healthcare systems. Accordingly, as of
December 31, 2017
, the majority of facilities in our Ambulatory Care segment are operated in this model.
|
Ambulatory Care Facilities
|
Year Ended December 31, 2017
|
||
|
Facilities:
|
|
|
|
|
With a healthcare system partner
|
193
|
|
|
|
Without a healthcare system partner
|
140
|
|
|
|
Total facilities operated
|
333
|
|
|
|
Change from December 31, 2016
|
|
|
|
|
Acquisitions
|
9
|
|
|
|
De novo
|
3
|
|
|
|
Dispositions/Mergers
|
(2
|
)
|
|
|
Total increase in number of facilities operated
|
10
|
|
|
During the year ended
December 31, 2017
, we acquired controlling interests in a single-specialty gastroenterology surgery center in each of Texas and Arizona, a single-specialty ophthalmology surgery center in each of Florida and Kansas, a single-specialty orthopedics surgery center in Colorado, a multi-specialty surgery center in California and an imaging center in California. We paid cash totaling approximately $36 million for these acquisitions. All seven facilities are jointly owned with local physicians, and a healthcare system partner has an ownership interest in each of the Arizona, Colorado and Florida surgery centers. During the year ended
December 31, 2017
, we acquired non-controlling interests in a surgical hospital in Texas and a multi-specialty surgery center in California. We paid cash totaling approximately $49 million for these ownership interests. Both facilities are jointly owned with local physicians and a healthcare system partner.
Conifer
Segment
Conifer generated net operating revenues of approximately
$1.597 billion
and
$1.571 billion
during the years ended
December 31, 2017
and
2016
, respectively, a portion of which was eliminated in consolidation as described in Note 20 to the Consolidated Financial Statements. The increase in revenues from third parties of
$59 million
, or
6.4%
, for the year ended
December 31, 2017
, which are not eliminated in consolidation, is primarily due to new clients.
Salaries, wages and benefits expense for Conifer
increased
$3 million
, or
0.3%
, in the year ended
December 31, 2017
compared to the year ended
December 31, 2016
due to an increase in staffing as a result of the growth in Conifer’s business primarily attributable to new clients.
Other operating expenses for Conifer
increased
$12 million
, or
3.6%
, in the year ended
December 31, 2017
compared to the year ended
December 31, 2016
due to the growth in Conifer’s business primarily attributable to new clients.
Conifer’s master service agreement with Tenet is scheduled to expire in December 2018, and it is possible that the pricing under the renegotiated agreement may be different from the current agreement. Any changes in the price or other terms of the contract could have a material impact on our Conifer segment’s results of operations. Conifer’s contract with Tenet represented approximately
39%
of the net operating revenues Conifer recognized in the year ended
December 31, 2017
.
68
Consolidated
Impairment and Restructuring Charges, and Acquisition-Related Costs
During the year ended
December 31, 2017
,
we recorded impairment and restructuring charges and acquisition-related costs of
$541 million
, consisting of
$402 million
of impairment charges,
$117 million
of restructuring charges and
$22 million
of acquisition-related costs. Impairment charges consisted of
$364 million
of charges to write-down assets held for sale to their estimated fair value, less estimated costs to sell, for our Aspen, Philadelphia-area and certain of our Chicago-area facilities,
$31 million
for the impairment of
two
equity method investments and
$7 million
to write-down intangible assets.
Of the total impairment charges recognized for the year ended
December 31, 2017
,
$337 million
related to our Hospital Operations and other segment,
$63 million
related to our Ambulatory Care segment, and
$2 million
related to our Conifer segment.
Restructuring charges consisted of
$82 million
of employee severance costs,
$15 million
of contract and lease termination fees, and
$20 million
of other restructuring costs.
Acquisition-related costs consisted of
$6 million
of transaction costs and
$16 million
of
acquisition integration charges.
During the year ended
December 31, 2016
,
we recorded impairment and restructuring charges and acquisition-related costs of
$202 million
.
This amount included impairment charges of approximately
$54 million
for the write-down of buildings, equipment and other long-lived assets, primarily capitalized software costs classified as other intangible assets, to their estimated fair values at
four
hospitals.
The aggregate carrying value of assets held and used of the hospitals for which impairment charges were recorded was
$163 million
at
December 31, 2016
after recording the impairment charges. We also recorded
$19 million
of impairment charges related to investments and
$14 million
related to other intangible assets, primarily contract-related intangibles and capitalized software costs not associated with the hospitals described above. Of the total impairment charges recognized for the year ended
December 31, 2016
,
$76 million
related to our Hospital Operations and other segment,
$8 million
related to our Ambulatory Care segment, and
$3 million
related to our Conifer segment. We also recorded
$35 million
of employee severance costs,
$14 million
of restructuring costs,
$14 million
of contract and lease termination fees, and
$52 million
in acquisition-related costs, which include
$20 million
of transaction costs and
$32 million
of acquisition integration costs.
Our impairment tests presume stable, improving or, in some cases, declining operating results in our hospitals, which are based on programs and initiatives being implemented that are designed to achieve the hospital’s most recent projections. If these projections are not met, or if in the future negative trends occur that impact our future outlook, future impairments of long-lived assets and goodwill may occur, and we may incur additional restructuring charges, which could be material.
Litigation and Investigation Costs
Litigation and investigation costs for the years ended
December 31, 2017
and
2016
were
$23 million
and
$293 million
, respectively. For the year ended
December 31, 2016
,
$278 million
was attributable to accruals for the previously disclosed civil qui tam litigation and parallel criminal investigation of the Company and certain of its subsidiaries (together, the “Clinica de la Mama matters”).
Gains on Sales, Consolidation and Deconsolidation of Facilities
During the year ended
December 31, 2017
, we recorded gains on sales, consolidation and deconsolidation of facilities of approximately
$144 million
, primarily comprised of an
$111 million
gain from the sale of our hospitals, physician practices and related assets in Houston, Texas and the surrounding area,
$13 million
from the sale of the membership of one of our health plans in Arizona,
$10 million
from the sale of our health plan membership in Texas,
$3 million
from the sale of our health plan in Michigan, and
$9 million
of gains related to the consolidation of certain businesses of our USPI joint venture due to ownership changes.
During the year ended
December 31, 2016
, we recorded gains on sales, consolidation and deconsolidation of facilities of approximately
$151 million
, primarily comprised of a $113 million gain from the sale of our Atlanta-area facilities and $33 million of gains related to the consolidation of certain businesses of our USPI joint venture due to ownership changes.
Interest Expense
Interest expense for the year ended
December 31, 2017
was
$1.028 billion
compared to
$979 million
for the year ended
December 31, 2016
. These increases are attributable to additional senior notes issued since December 2016, partially offset by the impact of the redemption of other senior notes since the 2016 period.
69
Income Tax Expense
During the year ended
December 31, 2017
, we recorded income tax expense of
$219 million
in continuing operations on a pre-tax loss of
$101 million
, compared to income tax expense of
$67 million
on pre-tax income of
$248 million
during the year ended
December 31, 2016
. The reconciliation between the amount of recorded income tax expense (benefit) and the amount calculated at the statutory federal tax rate is shown below.
|
|
Years Ended December 31,
|
||||||
|
|
2017
|
2016
|
|||||
|
Tax expense (benefit) at statutory federal rate of 35%
|
$
|
(35
|
)
|
$
|
87
|
|
|
|
State income taxes, net of federal income tax benefit
|
4
|
|
16
|
|
|||
|
Expired state net operating losses, net of federal income tax benefit
|
28
|
|
35
|
|
|||
|
Tax attributable to noncontrolling interests
|
(113
|
)
|
(106
|
)
|
|||
|
Nondeductible goodwill
|
109
|
|
29
|
|
|||
|
Nontaxable gains
|
—
|
|
(11
|
)
|
|||
|
Nondeductible litigation costs
|
—
|
|
37
|
|
|||
|
Nondeductible acquisition costs
|
1
|
|
1
|
|
|||
|
Nondeductible health insurance provider fee
|
—
|
|
2
|
|
|||
|
Impact of decrease in federal tax rate on deferred taxes
|
246
|
|
—
|
|
|||
|
Reversal of permanent reinvestment assumption for foreign subsidiary
|
(30
|
)
|
—
|
|
|||
|
Stock based compensation tax deficiencies
|
15
|
|
—
|
|
|||
|
Changes in valuation allowance (including impact of decrease in federal tax rate)
|
—
|
|
(25
|
)
|
|||
|
Change in tax contingency reserves, including interest
|
(6
|
)
|
(9
|
)
|
|||
|
Prior-year provision to return adjustments and other changes in deferred taxes
|
4
|
|
12
|
|
|||
|
Other items
|
(4
|
)
|
(1
|
)
|
|||
|
|
$
|
219
|
|
$
|
67
|
|
|
On December 22, 2017, the President signed into law the Tax Cuts and Jobs Act (the “Tax Act”). The Tax Act amends the Internal Revenue Code to reduce tax rates and modify policies, credits and deductions for individuals and businesses. For businesses, the Tax Act makes broad and complex changes to the U.S. tax code, including but not limited to, (1) reducing the corporate federal tax rate from a maximum of 35% to a flat 21% rate, effective January 1, 2018, (2) repealing the corporate alternative minimum tax (“AMT”) and changing how existing AMT credits may be realized, (3) creating a new limitation on the deductibility of interest expense, (4) allowing full expensing of certain capital expenditures, and (5) denying deductions for performance-based compensation paid to certain key executives. International provisions in the Tax Act are not expected to have a material impact on the Company’s taxes.
As a result of the reduction in the corporate income tax rate from 35% to 21% under the Tax Act, we revalued our net deferred tax assets at December 31, 2017, resulting in a reduction in the value of our net deferred tax assets of approximately
$252 million
. The reduction was recorded as additional income tax expense in the accompanying Consolidated Statement of Operations for the year ended December 31, 2017. In the table above, approximately
$6 million
of the total
$252 million
increase in income tax expense is included in the net change in valuation allowance. Our revaluation of our deferred tax asset is subject to further revision based on our actual 2017 federal and state income tax filings. As a result, the actual impact on the net deferred tax assets may vary from the estimated amount due to changes in our estimates of 2017 taxable income.
Net Income Attributable to Noncontrolling Interests
Net income attributable to noncontrolling interests was
$384 million
for the year ended
December 31, 2017
compared to
$368 million
for the year ended
December 31, 2016
. Net income attributable to noncontrolling interests in the
2017
period was comprised of
$29 million
related to our Hospital Operations and other segment,
$304 million
related to our Ambulatory Care segment and
$51 million
related to our Conifer segment. Of the portion related to our Ambulatory Care segment,
$60 million
was related to the minority interests in our USPI joint venture, including $22 million related to the reduction of our USPI joint venture’s deferred tax liabilities as a result of the reduction in the corporate income tax rate from 35% to 21%.
ADDITIONAL SUPPLEMENTAL NON-GAAP DISCLOSURES
The financial information provided throughout this report, including our Consolidated Financial Statements and the notes thereto, has been prepared in conformity with accounting principles generally accepted in the United States of America (“GAAP”). However, we use certain non-GAAP financial measures defined below in communications with investors, analysts, rating agencies, banks and others to assist such parties in understanding the impact of various items on our financial statements,
70
some of which are recurring or involve cash payments. We use this information in our analysis of the performance of our business, excluding items we do not consider relevant to the performance of our continuing operations. In addition, from time to time we use these measures to define certain performance targets under our compensation programs.
“Adjusted EBITDA” is a non-GAAP measure defined by the Company as net income available (loss attributable) to Tenet Healthcare Corporation common shareholders before (1) the cumulative effect of changes in accounting principle, (2) net loss (income) attributable to noncontrolling interests, (3) income (loss) from discontinued operations, (4) income tax benefit (expense), (5) other non-operating expense, net, (6) gain (loss) from early extinguishment of debt, (7) interest expense, (8) litigation and investigation (costs) benefit, net of insurance recoveries, (9) net gains (losses) on sales, consolidation and deconsolidation of facilities, (10) impairment and restructuring charges and acquisition-related costs, (11) depreciation and amortization, and (12) income (loss) from divested operations and closed businesses (i.e., our health plan businesses). Litigation and investigation costs do not include ordinary course of business malpractice and other litigation and related expense.
The Company believes the foregoing non-GAAP measure is useful to investors and analysts because it presents additional information on the Company’s financial performance. Investors, analysts, Company management and the Company’s Board of Directors utilize this non-GAAP measure, in addition to GAAP measures, to track the Company’s financial and operating performance and compare the Company’s performance to peer companies, which utilize similar non-GAAP measures in their presentations. The Human Resources Committee of the Company’s Board of Directors also uses certain non-GAAP measures to evaluate management’s performance for the purpose of determining incentive compensation. The Company believes that Adjusted EBITDA is a useful measure, in part, because certain investors and analysts use both historical and projected Adjusted EBITDA, in addition to GAAP and other non-GAAP measures, as factors in determining the estimated fair value of shares of the Company’s common stock. Company management also regularly reviews the Adjusted EBITDA performance for each operating segment. The Company does not use Adjusted EBITDA to measure liquidity, but instead to measure operating performance. The non-GAAP Adjusted EBITDA measure the Company utilizes may not be comparable to similarly titled measures reported by other companies. Because this measure excludes many items that are included in our financial statements, it does not provide a complete measure of our operating performance. Accordingly, investors are encouraged to use GAAP measures when evaluating the Company’s financial performance.
The following table shows the reconciliation of Adjusted EBITDA to net income available (loss attributable) to Tenet Healthcare Corporation common shareholders (the most comparable GAAP term) for the years ended
December 31, 2017
and
2016
:
71
|
|
Years Ended December 31,
|
|||||||
|
|
2017
|
2016
|
||||||
|
Net loss attributable to Tenet Healthcare Corporation common shareholders
|
$
|
(704
|
)
|
$
|
(192
|
)
|
||
|
Less: Net income attributable to noncontrolling interests
|
(384
|
)
|
(368
|
)
|
||||
|
Income (loss) from discontinued operations, net of tax
|
—
|
|
(5
|
)
|
||||
|
Income (loss) from continuing operations
|
(320
|
)
|
181
|
|
||||
|
Income tax expense
|
(219
|
)
|
(67
|
)
|
||||
|
Loss from early extinguishment of debt
|
(164
|
)
|
—
|
|
||||
|
Other non-operating expense, net
|
(22
|
)
|
(20
|
)
|
||||
|
Interest expense
|
(1,028
|
)
|
(979
|
)
|
||||
|
Operating income
|
1,113
|
|
1,247
|
|
||||
|
Litigation and investigation costs
|
(23
|
)
|
(293
|
)
|
||||
|
Gains on sales, consolidation and deconsolidation of facilities
|
144
|
|
151
|
|
||||
|
Impairment and restructuring charges, and acquisition-related costs
|
(541
|
)
|
(202
|
)
|
||||
|
Depreciation and amortization
|
(870
|
)
|
(850
|
)
|
||||
|
Loss from divested and closed businesses (i.e., the Company
’
s health plan businesses)
|
(41
|
)
|
(37
|
)
|
||||
|
Adjusted EBITDA
|
$
|
2,444
|
|
$
|
2,478
|
|
||
|
Net operating revenues
|
$
|
19,179
|
|
$
|
19,621
|
|
||
|
Less: Net operating revenues from health plans
|
110
|
|
482
|
|
||||
|
Adjusted net operating revenues
|
$
|
19,069
|
|
$
|
19,139
|
|
||
|
Net loss attributable to Tenet Healthcare Corporation common shareholders as a % of operating revenues
|
(3.7
|
)%
|
(1.0
|
)%
|
||||
|
Adjusted EBITDA as % of adjusted net operating revenues (Adjusted EBITDA margin)
|
12.8
|
%
|
12.9
|
%
|
||||
72
RESULTS OF OPERATIONS FOR THE YEAR ENDED DECEMBER 31, 2016 COMPARED TO THE YEAR ENDED DECEMBER 31, 2015
The following two tables summarize our net operating revenues, operating expenses and operating income from continuing operations, both in dollar amounts and as percentages of net operating revenues, for the years ended December 31, 2016 and 2015:
|
|
Years Ended December 31,
|
||||||||||
|
|
2016
|
2015
|
Increase
(Decrease)
|
||||||||
|
Net operating revenues:
|
|
|
|
|
|
|
|||||
|
General hospitals
|
$
|
16,488
|
|
$
|
16,741
|
|
$
|
(253
|
)
|
||
|
Other operations
|
4,582
|
|
3,370
|
|
1,212
|
|
|||||
|
Net operating revenues before provision for doubtful accounts
|
21,070
|
|
20,111
|
|
959
|
|
|||||
|
Less provision for doubtful accounts
|
1,449
|
|
1,477
|
|
(28
|
)
|
|||||
|
Net operating revenues
|
19,621
|
|
18,634
|
|
987
|
|
|||||
|
Equity in earnings of unconsolidated affiliates
|
131
|
|
99
|
|
32
|
|
|||||
|
Operating expenses:
|
|
|
|
|
|
|
|||||
|
Salaries, wages and benefits
|
9,328
|
|
8,990
|
|
338
|
|
|||||
|
Supplies
|
3,124
|
|
2,963
|
|
161
|
|
|||||
|
Other operating expenses, net
|
4,891
|
|
4,555
|
|
336
|
|
|||||
|
Electronic health record incentives
|
(32
|
)
|
(72
|
)
|
40
|
|
|||||
|
Depreciation and amortization
|
850
|
|
797
|
|
53
|
|
|||||
|
Impairment and restructuring charges, and acquisition-related costs
|
202
|
|
318
|
|
(116
|
)
|
|||||
|
Litigation and investigation costs
|
293
|
|
291
|
|
2
|
|
|||||
|
Gains on sales, consolidation and deconsolidation of facilities
|
(151
|
)
|
(186
|
)
|
35
|
|
|||||
|
Operating income
|
$
|
1,247
|
|
$
|
1,077
|
|
$
|
170
|
|
||
|
|
Years Ended December 31,
|
|||||||
|
|
2016
|
2015
|
Increase
(Decrease)
|
|||||
|
Net operating revenues
|
100.0
|
%
|
100.0
|
%
|
—
|
%
|
||
|
Equity in earnings of unconsolidated affiliates
|
0.7
|
%
|
0.5
|
%
|
0.2
|
%
|
||
|
Operating expenses:
|
|
|
|
|
|
|
||
|
Salaries, wages and benefits
|
47.5
|
%
|
48.2
|
%
|
(0.7
|
)%
|
||
|
Supplies
|
15.9
|
%
|
15.9
|
%
|
—
|
%
|
||
|
Other operating expenses, net
|
25.0
|
%
|
24.4
|
%
|
0.6
|
%
|
||
|
Electronic health record incentives
|
(0.2
|
)%
|
(0.4
|
)%
|
0.2
|
%
|
||
|
Depreciation and amortization
|
4.3
|
%
|
4.3
|
%
|
—
|
%
|
||
|
Impairment and restructuring charges, and acquisition-related costs
|
1.1
|
%
|
1.7
|
%
|
(0.6
|
)%
|
||
|
Litigation and investigation costs
|
1.5
|
%
|
1.5
|
%
|
—
|
%
|
||
|
Gains on sales, consolidation and deconsolidation of facilities
|
(0.8
|
)%
|
(1.0
|
)%
|
0.2
|
%
|
||
|
Operating income
|
6.4
|
%
|
5.9
|
%
|
0.5
|
%
|
||
Net operating revenues of our general hospitals include inpatient and outpatient revenues for services provided by facilities in our Hospital Operations and other segment, as well as nonpatient revenues (e.g., rental income, management fee revenue, and income from services such as cafeterias, gift shops and parking) and other miscellaneous revenue. Net operating revenues of other operations primarily consist of revenues from (1) physician practices, (2) a long-term acute care hospital, (3) our Ambulatory Care segment, (4) services provided by Conifer to third parties and (5) our health plans. Revenues from our general hospitals represented approximately
78%
and
83%
of our total net operating revenues before provision for doubtful accounts for the years ended
December 31, 2016
and
2015
, respectively.
Net operating revenues from our other operations were
$4.582 billion
and
$3.370 billion
in the years ended
December 31, 2016
and
2015
, respectively. The increase in net operating revenues from other operations during
2016
primarily relates to revenue cycle services provided by Conifer, as well as revenues from our USPI joint venture and Aspen operations, our health plans and physician practices. Equity in earnings of unconsolidated affiliates were
$131 million
and
$99 million
for the years ended
December 31, 2016
and
2015
, respectively. The increase in equity in earnings of unconsolidated affiliates in the
2016
period compared to the
2015
period primarily related to our USPI joint venture.
73
The following table shows selected operating expenses of our three reportable business segments. Information for our Hospital Operations and other segment is presented on a same-hospital basis, which includes the results of our same 67 hospitals and six health plans operated throughout the years ended
December 31, 2016
and
2015
. The results of the following facilities are excluded from our same-hospital information: (i) Hi-Desert Medical Center, which we began operating on July 15, 2015, (ii) our Carondelet Heath Network joint venture, in which we acquired a majority interest on August 31, 2015, (iii) Saint Louis University Hospital ("SLUH"), which we divested on August 31, 2015, (iv) our joint venture with Baptist Health System, Inc., which we formed on October 2, 2015, (v) DMC Surgery Hospital, which we closed in October 2015, (vi) our two North Carolina hospitals, which we divested effective January 1, 2016, (vii) our four North Texas hospitals in which we divested a controlling interest effective January 1, 2016, but continue to operate, and (viii) our five Georgia hospitals, which we divested effective April 1, 2016.
|
|
Years Ended December 31,
|
||||||||||
|
Selected Operating Expenses
|
2016
|
2015
|
Increase
(Decrease)
|
||||||||
|
Hospital Operations and other — Same-Hospital
|
|
|
|
|
|
|
|||||
|
Salaries, wages and benefits
|
$
|
7,093
|
|
$
|
6,944
|
|
2.1
|
%
|
|||
|
Supplies
|
2,484
|
|
2,408
|
|
3.2
|
%
|
|||||
|
Other operating expenses
|
3,829
|
|
3,466
|
|
10.5
|
%
|
|||||
|
Total
|
$
|
13,406
|
|
$
|
12,818
|
|
4.6
|
%
|
|||
|
Ambulatory Care
|
|
|
|
|
|
|
|||||
|
Salaries, wages and benefits
|
$
|
594
|
|
$
|
301
|
|
97.3
|
%
|
|||
|
Supplies
|
365
|
|
188
|
|
94.1
|
%
|
|||||
|
Other operating expenses
|
346
|
|
196
|
|
76.5
|
%
|
|||||
|
Total
|
$
|
1,305
|
|
$
|
685
|
|
90.5
|
%
|
|||
|
Conifer
|
|
|
|
|
|
|
|||||
|
Salaries, wages and benefits
|
$
|
959
|
|
$
|
852
|
|
12.6
|
%
|
|||
|
Other operating expenses
|
335
|
|
296
|
|
13.2
|
%
|
|||||
|
Total
|
$
|
1,294
|
|
$
|
1,148
|
|
12.7
|
%
|
|||
|
Rent/lease expense
(1)
|
|
|
|
|
|
|
|||||
|
Hospital Operations and other
|
$
|
201
|
|
$
|
191
|
|
5.2
|
%
|
|||
|
Ambulatory Care
|
74
|
|
41
|
|
80.5
|
%
|
|||||
|
Conifer
|
18
|
|
16
|
|
12.5
|
%
|
|||||
|
Total
|
$
|
293
|
|
$
|
248
|
|
18.1
|
%
|
|||
|
(1)
|
Included in other operating expenses.
|
|
RESULTS OF OPERATIONS BY SEGMENT
Our operations are reported under three segments:
|
•
|
Hospital Operations and other, which is comprised of our acute care hospitals, ancillary outpatient facilities, urgent care centers, microhospitals, physician practices and health plans (certain of which are classified as held for sale as described in Note 4 to our Consolidated Financial Statements);
|
|
•
|
Ambulatory Care, which is comprised of our USPI joint venture’s ambulatory surgery centers, urgent care centers, imaging centers and surgical hospitals, as well as Aspen’s hospitals and clinics; and
|
|
•
|
Conifer, which provides healthcare business process services in the areas of hospital and physician revenue cycle management and value-based care solutions to healthcare systems and other entities.
|
Hospital
Operations and Other Segment
The following tables show operating statistics of our continuing operations hospitals on a same-hospital basis, which includes the results of our same 67 hospitals and six health plans operated throughout the years ended
December 31, 2016
and
2015
. The results of the following facilities are excluded from our same-hospital information: (i) Hi‑Desert Medical Center, which we began operating on July 15, 2015, (ii) our Carondelet Heath Network joint venture, in which we acquired a majority interest on August 31, 2015, (iii) SLUH, which we divested on August 31, 2015, (iv) our joint venture with Baptist Health System, Inc., which we formed on October 2, 2015, (v) DMC Surgery Hospital, which we closed in October 2015, (vi) our two North Carolina hospitals, which we divested effective January 1, 2016, (vii) our four North Texas hospitals in which we
74
divested a controlling interest effective January 1, 2016, but continue to operate, and (viii) our five Georgia hospitals, which we divested effective April 1, 2016.
|
|
Same-Hospital
Continuing Operations
|
|||||||||
|
|
Years Ended December 31,
|
|||||||||
|
Admissions, Patient Days and Surgeries
|
2016
|
2015
|
Increase
(Decrease)
|
|||||||
|
Number of hospitals (at end of period)
|
67
|
|
67
|
|
—
|
%
|
(1)
|
|||
|
Total admissions
|
715,502
|
|
717,218
|
|
(0.2
|
)%
|
||||
|
Adjusted patient admissions
(2)
|
1,239,324
|
|
1,228,039
|
|
0.9
|
%
|
||||
|
Paying admissions (excludes charity and uninsured)
|
677,361
|
|
680,837
|
|
(0.5
|
)%
|
||||
|
Charity and uninsured admissions
|
38,141
|
|
36,381
|
|
4.8
|
%
|
||||
|
Admissions through emergency department
|
451,785
|
|
452,593
|
|
(0.2
|
)%
|
||||
|
Paying admissions as a percentage of total admissions
|
94.7
|
%
|
94.9
|
%
|
(0.2
|
)%
|
(1)
|
|||
|
Charity and uninsured admissions as a percentage of total admissions
|
5.3
|
%
|
5.1
|
%
|
0.2
|
%
|
(1)
|
|||
|
Emergency department admissions as a percentage of total admissions
|
63.1
|
%
|
63.1
|
%
|
—
|
%
|
(1)
|
|||
|
Surgeries — inpatient
|
195,641
|
|
196,352
|
|
(0.4
|
)%
|
||||
|
Surgeries — outpatient
|
256,301
|
|
254,932
|
|
0.5
|
%
|
||||
|
Total surgeries
|
451,942
|
|
451,284
|
|
0.1
|
%
|
||||
|
Patient days — total
|
3,269,558
|
|
3,286,026
|
|
(0.5
|
)%
|
||||
|
Adjusted patient days
(2)
|
5,612,240
|
|
5,567,041
|
|
0.8
|
%
|
||||
|
Average length of stay (days)
|
4.57
|
|
4.58
|
|
(0.2
|
)%
|
||||
|
Licensed beds (at end of period)
|
18,118
|
|
18,130
|
|
(0.1
|
)%
|
||||
|
Average licensed beds
|
18,127
|
|
18,217
|
|
(0.5
|
)%
|
||||
|
Utilization of licensed beds
(3)
|
49.4
|
%
|
49.4
|
%
|
—
|
%
|
(1)
|
|||
|
(1)
|
The change is the difference between the 2016 and 2015 amounts shown.
|
|
|
(2)
|
Adjusted patient admissions/days represents actual patient admissions/days adjusted to include outpatient services provided by facilities in our Hospital Operations and other segment by multiplying actual patient admissions/days by the sum of gross inpatient revenues and outpatient revenues and dividing the results by gross inpatient revenues.
|
|
|
(3)
|
Utilization of licensed beds represents patient days divided by number of days in the period divided by average licensed beds.
|
|
|
|
Same-Hospital
Continuing Operations
|
|||||||||
|
|
Years Ended December 31,
|
|||||||||
|
Outpatient Visits
|
2016
|
2015
|
Increase
(Decrease)
|
|||||||
|
Total visits
|
7,273,671
|
|
7,176,650
|
|
1.4
|
%
|
||||
|
Paying visits (excludes charity and uninsured)
|
6,784,173
|
|
6,670,711
|
|
1.7
|
%
|
||||
|
Charity and uninsured visits
|
489,498
|
|
505,939
|
|
(3.2
|
)%
|
||||
|
Emergency department visits
|
2,560,308
|
|
2,520,481
|
|
1.6
|
%
|
||||
|
Surgery visits
|
256,301
|
|
254,932
|
|
0.5
|
%
|
||||
|
Paying visits as a percentage of total visits
|
93.3
|
%
|
93.0
|
%
|
0.3
|
%
|
(1)
|
|||
|
Charity and uninsured visits as a percentage of total visits
|
6.7
|
%
|
7.0
|
%
|
(0.3
|
)%
|
(1)
|
|||
|
(1)
|
The change is the difference between the 2016 and 2015 amounts shown.
|
|
|
|
Same-Hospital
Continuing Operations
|
||||||||||
|
|
Years Ended December 31,
|
||||||||||
|
Revenues
|
2016
|
2015
|
Increase
(Decrease)
|
||||||||
|
Net operating revenues
|
$
|
14,877
|
|
$
|
14,148
|
|
5.2
|
%
|
|||
|
Revenues from charity and the uninsured
|
$
|
950
|
|
$
|
879
|
|
8.1
|
%
|
|||
|
Net inpatient revenues
(1)
|
$
|
9,776
|
|
$
|
9,334
|
|
4.7
|
%
|
|||
|
Net outpatient revenues
(1)
|
$
|
5,347
|
|
$
|
5,103
|
|
4.8
|
%
|
|||
|
(1)
|
Net inpatient revenues and net outpatient revenues are components of net operating revenues. Net inpatient revenues include self-pay revenues of $396 million and $340 million for the years ended December 31, 2016 and 2015, respectively. Net outpatient revenues include self-pay revenues of $554 million and $539 million for the years ended December 31, 2016 and 2015, respectively.
|
|
75
|
|
Same-Hospital
Continuing Operations
|
||||||||||
|
|
Years Ended December 31,
|
||||||||||
|
Revenues on a Per Admission, Per Patient Day and Per Visit Basis
|
2016
|
2015
|
Increase
(Decrease)
|
||||||||
|
Net inpatient revenue per admission
|
$
|
13,663
|
|
$
|
13,014
|
|
5.0
|
%
|
|||
|
Net inpatient revenue per patient day
|
$
|
2,990
|
|
$
|
2,841
|
|
5.2
|
%
|
|||
|
Net outpatient revenue per visit
|
$
|
735
|
|
$
|
711
|
|
3.4
|
%
|
|||
|
Net patient revenue per adjusted patient admission
(1)
|
$
|
12,203
|
|
$
|
11,756
|
|
3.8
|
%
|
|||
|
Net patient revenue per adjusted patient day
(1)
|
$
|
2,695
|
|
$
|
2,593
|
|
3.9
|
%
|
|||
|
(1)
|
Adjusted patient admissions/days represents actual patient admissions/days adjusted to include outpatient services provided by facilities in our Hospital Operations and other segment by multiplying actual patient admissions/days by the sum of gross inpatient revenues and outpatient revenues and dividing the results by gross inpatient revenues.
|
|
|
|
Same-Hospital
Continuing Operations
|
|||||||||||
|
|
Years Ended December 31,
|
|||||||||||
|
Provision for Doubtful Accounts
|
2016
|
2015
|
Increase
(Decrease)
|
|||||||||
|
Provision for doubtful accounts
|
$
|
1,306
|
|
$
|
1,203
|
|
8.6
|
%
|
||||
|
Provision for doubtful accounts as a percentage of net operating revenues before provision for doubtful accounts
|
8.1
|
%
|
7.8
|
%
|
0.3
|
%
|
(1)
|
|||||
|
(1)
|
The change is the difference between the 2016 and 2015 amounts shown.
|
|
|
|
Same-Hospital
Continuing Operations
|
|||||||||
|
|
Years Ended December 31,
|
|||||||||
|
Selected Operating Expenses
|
2016
|
2015
|
Increase
(Decrease)
|
|||||||
|
Hospital Operations and other
|
|
|
|
|
|
|
||||
|
Salaries, wages and benefits as a percentage of net operating revenues
|
47.7
|
%
|
49.1
|
%
|
(1.4
|
)%
|
(1)
|
|||
|
Supplies as a percentage of net operating revenues
|
16.7
|
%
|
17.0
|
%
|
(0.3
|
)%
|
(1)
|
|||
|
Other operating expenses as a percentage of net operating revenues
|
25.7
|
%
|
24.5
|
%
|
1.2
|
%
|
(1)
|
|||
|
(1)
|
The change is the difference between the 2016 and 2015 amounts shown.
|
|
Revenues
Same-hospital net operating revenues increased
$729 million
, or
5.2%
, during the year ended
December 31, 2016
compared to the year ended
December 31, 2015
. The increase in same-hospital net operating revenues in the
2016
period is primarily due to volume growth in higher acuity inpatient services, higher outpatient volumes, improved terms of our managed care contracts, incremental net revenues from the California provider fee program of
$44 million
and an increase in our other operations revenues. Same-hospital net inpatient revenues increased
$442 million
, or
4.7%
, while same-hospital admissions decreased
0.2%
in the
2016
period compared to the
2015
period. Same-hospital net inpatient revenue per admission increased
5.0%
, primarily due to the improved terms of our managed care contracts and volume growth in higher acuity service lines, in the year ended
December 31, 2016
. Same-hospital net outpatient revenues increased
$244 million
, or
4.8%
, and same-hospital outpatient visits increased
1.4%
in the year ended
December 31, 2016
compared to the year ended
December 31, 2015
. Growth in outpatient revenues and volumes was primarily driven by improved terms of our managed care contracts and increased outpatient volume levels associated with our outpatient development program. Same-hospital net outpatient revenue per visit increased
3.4%
primarily due to the improved terms of our managed care contracts.
Provision for Doubtful Accounts
Same-hospital provision for doubtful accounts as a percentage of net operating revenues before provision for doubtful accounts was
8.1%
and
7.8%
for the years ended
December 31, 2016
and
2015
, respectively. The increase in the
2016
period compared to the
2015
period was driven by increases in uninsured revenues and volumes, and higher patient co–pays and deductibles. The following table shows the net accounts receivable and allowance for doubtful accounts by payer at
December 31, 2016
and
2015
:
76
|
|
December 31, 2016
|
December 31, 2015
|
||||||||||||||||||||||
|
|
Accounts Receivable Before Allowance for Doubtful Accounts
|
Allowance for Doubtful Accounts
|
Net
|
Accounts Receivable Before Allowance for Doubtful Accounts
|
Allowance for Doubtful Accounts
|
Net
|
||||||||||||||||||
|
Medicare
|
$
|
294
|
|
$
|
—
|
|
$
|
294
|
|
$
|
360
|
|
$
|
—
|
|
$
|
360
|
|
||||||
|
Medicaid
|
125
|
|
—
|
|
125
|
|
70
|
|
—
|
|
70
|
|
||||||||||||
|
Net cost report settlements payable and valuation allowances
|
(14
|
)
|
—
|
|
(14
|
)
|
(42
|
)
|
—
|
|
(42
|
)
|
||||||||||||
|
Managed care
|
1,911
|
|
190
|
|
1,721
|
|
1,715
|
|
126
|
|
1,589
|
|
||||||||||||
|
Self-pay uninsured
|
479
|
|
412
|
|
67
|
|
509
|
|
436
|
|
73
|
|
||||||||||||
|
Self-pay balance after insurance
|
226
|
|
147
|
|
79
|
|
208
|
|
142
|
|
66
|
|
||||||||||||
|
Estimated future recoveries
|
141
|
|
—
|
|
141
|
|
144
|
|
—
|
|
144
|
|
||||||||||||
|
Other payers
|
537
|
|
239
|
|
298
|
|
442
|
|
166
|
|
276
|
|
||||||||||||
|
Total Hospital Operations and other
|
3,699
|
|
988
|
|
2,711
|
|
3,406
|
|
870
|
|
2,536
|
|
||||||||||||
|
Ambulatory Care
|
227
|
|
43
|
|
184
|
|
182
|
|
17
|
|
165
|
|
||||||||||||
|
Total discontinued operations
|
2
|
|
—
|
|
2
|
|
3
|
|
—
|
|
3
|
|
||||||||||||
|
|
$
|
3,928
|
|
$
|
1,031
|
|
$
|
2,897
|
|
$
|
3,591
|
|
$
|
887
|
|
$
|
2,704
|
|
||||||
A significant portion of our provision for doubtful accounts relates to self-pay patients, as well as co-pays and deductibles owed to us by patients with insurance. Collection of accounts receivable has been a key area of focus, particularly over the past several years. At
December 31, 2016
, our Hospital Operations and other segment collection rate on self-pay accounts was approximately
26.1%
. Our self-pay collection rate includes payments made by patients, including co-pays and deductibles paid by patients with insurance. Based on our accounts receivable from self-pay patients and co-pays and deductibles owed to us by patients with insurance at
December 31, 2016
, a 10% decrease or increase in our self-pay collection rate, or approximately 3%, which we believe could be a reasonably likely change, would result in an unfavorable or favorable adjustment to provision for doubtful accounts of approximately
$9 million
. Our estimated Hospital Operations and other segment collection rate from managed care payers was approximately
97.8%
at
December 31, 2016
.
The following tables present the approximate aging by payer of our net accounts receivable from the continuing operations of our Hospital Operations and other segment of
$2.725 billion
and
$2.578 billion
at
December 31, 2016
and
2015
, respectively, excluding cost report settlements payable and valuation allowances of
$14 million
and
$42 million
at
December 31, 2016
and
2015
, respectively:
|
|
December 31, 2016
|
||||||||||||||
|
|
Medicare
|
Medicaid
|
Managed
Care
|
Indemnity,
Self-Pay
and Other
|
Total
|
||||||||||
|
0-60 days
|
92
|
%
|
75
|
%
|
61
|
%
|
24
|
%
|
60
|
%
|
|||||
|
61-120 days
|
5
|
%
|
15
|
%
|
15
|
%
|
14
|
%
|
13
|
%
|
|||||
|
121-180 days
|
2
|
%
|
4
|
%
|
8
|
%
|
10
|
%
|
6
|
%
|
|||||
|
Over 180 days
|
1
|
%
|
6
|
%
|
16
|
%
|
52
|
%
|
21
|
%
|
|||||
|
Total
|
100
|
%
|
100
|
%
|
100
|
%
|
100
|
%
|
100
|
%
|
|||||
|
|
December 31, 2015
|
||||||||||||||
|
|
Medicare
|
Medicaid
|
Managed
Care
|
Indemnity,
Self-Pay
and Other
|
Total
|
||||||||||
|
0-60 days
|
90
|
%
|
65
|
%
|
64
|
%
|
27
|
%
|
62
|
%
|
|||||
|
61-120 days
|
6
|
%
|
16
|
%
|
16
|
%
|
19
|
%
|
15
|
%
|
|||||
|
121-180 days
|
2
|
%
|
6
|
%
|
7
|
%
|
11
|
%
|
7
|
%
|
|||||
|
Over 180 days
|
2
|
%
|
13
|
%
|
13
|
%
|
43
|
%
|
16
|
%
|
|||||
|
Total
|
100
|
%
|
100
|
%
|
100
|
%
|
100
|
%
|
100
|
%
|
|||||
As of
December 31, 2016
, we had a cumulative total of patient account assignments to Conifer of approximately
$2.886 billion
related to our continuing operations. These accounts have already been written off and are not included in our receivables or in the allowance for doubtful accounts; however, an estimate of future recoveries from all the accounts assigned to Conifer is determined based on our historical experience and recorded in accounts receivable.
77
The following table shows the approximate amount of accounts receivable in the MEP still awaiting determination of eligibility under a government program at
December 31, 2016
and
2015
by aging category for the hospitals in the program:
|
|
2016
|
2015
|
|||||
|
0-60 days
|
$
|
84
|
|
$
|
86
|
|
|
|
61-120 days
|
13
|
|
14
|
|
|||
|
121-180 days
|
4
|
|
7
|
|
|||
|
Over 180 days
|
4
|
|
18
|
|
|||
|
Total
|
$
|
105
|
|
$
|
125
|
|
|
Salaries, Wages and Benefits
Same-hospital salaries, wages and benefits as a percentage of net operating revenues decreased by
140
basis points to
47.7%
in the year ended
December 31, 2016
compared to the same period in
2015
. While same-hospital net operating revenues increased
5.2%
in the year ended
December 31, 2016
compared to the year ended
December 31, 2015
, same-hospital salaries, wages and benefits increased by only
2.1%
in the year ended
December 31, 2016
compared to the
2015
period. The increase in same-hospital salaries, wages and benefits was primarily due to annual merit increases for certain of our employees and increased employee health benefits costs, partially offset by lower annual incentive compensation expense. Salaries, wages and benefits expense for the years ended
December 31, 2016
and
2015
included stock-based compensation expense of
$58 million
and
$77 million
, respectively.
Supplies
Same-hospital supplies expense as a percentage of net operating revenues decreased by
30
basis points to
16.7%
in the year ended
December 31, 2016
compared to the same period in
2015
.
Other Operating Expenses, Net
Same-hospital other operating expenses as a percentage of net operating revenues increased by
120
basis points to
25.7%
in the year ended
December 31, 2016
compared
24.5%
to the same period in
2015
. The increase in other operating expenses was primarily due to:
|
•
|
increased costs associated with funding indigent care services by hospitals we operated throughout both periods of
$16 million
, which costs were substantially offset by additional net patient revenues;
|
|
•
|
increased costs of
$126 million
associated with our health plans due to an increase in covered lives, which costs were partially offset by increased health plan revenues; and
|
|
•
|
increased costs of contracted services of
$160 million
.
|
Same-hospital malpractice expense in the
2016
period included a favorable adjustment of approximately
$4 million
from the
16
basis point increase in the interest rate used to estimate the discounted present value of projected future malpractice liabilities compared to a favorable adjustment of approximately
$3 million
from the
12
basis point increase in the interest rate in the
2015
period.
Ambulatory
Care
Segment
On June 16, 2015, we completed the transaction that combined our freestanding ambulatory surgery and imaging center assets with the surgical facility assets of USPI into our new USPI joint venture, and we acquired Aspen, which operates nine private surgical hospitals and clinics in the United Kingdom, thereby forming our Ambulatory Care separate reportable business segment. The results of our USPI joint venture and Aspen are included in the financial and statistical information provided only for the period from acquisition to
December 31, 2016
.
78
Year Ended
December 31, 2016
Compared to the Year Ended
December 31, 2015
The following table summarizes certain consolidated statements of operations items for the periods indicated:
|
|
Years Ended December 31,
|
|||||||
|
Ambulatory Care Results of Operations
|
2016
|
2015
|
||||||
|
Net operating revenues
|
$
|
1,797
|
|
$
|
959
|
|
||
|
Equity in earnings of unconsolidated affiliates
|
$
|
122
|
|
$
|
83
|
|
||
|
Salaries, wages and benefits
|
$
|
594
|
|
$
|
301
|
|
||
|
Supplies
|
$
|
365
|
|
$
|
188
|
|
||
|
Other operating expenses, net
|
$
|
346
|
|
$
|
196
|
|
||
Our Ambulatory Care net operating revenues increased by
$838 million
, or
87.4%
, for the year ended
December 31, 2016
compared to the year ended
December 31, 2015
. The growth in revenues was primarily due to our majority ownership interest in our USPI joint venture for the entire year ended
December 31, 2016
compared to only the period from June 15, 2015 to
December 31, 2015
.
Salaries, wages and benefits expense increased by
$293 million
, or
97.3%
, for the year ended
December 31, 2016
compared to the year ended
December 31, 2015
. The increase was primarily due to our majority ownership interest in our USPI joint venture for the entire year ended
December 31, 2016
compared to only the period from June 15, 2015 to
December 31, 2015
.
Supplies expense increased by
$177 million
, or
94.1%
, for the year ended
December 31, 2016
compared to the year ended
December 31, 2015
. The increase was primarily due to our majority ownership interest in our USPI joint venture for the entire year ended
December 31, 2016
compared to only the period from June 15, 2015 to
December 31, 2015
.
Other operating expenses increased by
$150 million
, or
76.5%
, for the year ended
December 31, 2016
compared to the year ended
December 31, 2015
. The increase was primarily due to our majority ownership interest in our USPI joint venture for the entire year ended
December 31, 2016
compared to only the period from June 15, 2015 to
December 31, 2015
.
Facility Growth
The following table summarizes the changes in our same-facility revenue year-over-year on a pro forma systemwide basis, which includes both consolidated and unconsolidated (equity method) facilities. While we do not record the revenues of unconsolidated facilities, we believe this information is important in understanding the financial performance of our Ambulatory Care segment because these revenues are the basis for calculating our management services revenues and, together with the expenses of our unconsolidated facilities, are the basis for our equity in earnings of unconsolidated affiliates.
|
Ambulatory Care Facility Growth
|
Year Ended December 31, 2016
|
||
|
Net revenues
|
9.6
|
%
|
|
|
Cases
|
5.2
|
%
|
|
|
Net revenue per case
|
4.2
|
%
|
|
Joint Ventures with Healthcare System Partners
Our USPI joint venture’s business model is to jointly own its facilities with local physicians and not-for-profit healthcare systems. Accordingly, as of
December 31, 2016
, the majority of facilities in our Ambulatory Care segment are operated in this model.
79
|
Ambulatory Care Facilities with Healthcare System Partners
|
Year Ended December 31, 2016
|
||
|
Facilities:
|
|
|
|
|
With a healthcare system partner
|
177
|
|
|
|
Without a healthcare system partner
|
146
|
|
|
|
Total facilities operated
|
323
|
|
|
|
Change from December 31, 2015
|
|
|
|
|
Acquisitions
|
5
|
|
|
|
De novo
|
4
|
|
|
|
Dispositions/Mergers
|
(17
|
)
|
|
|
Total increase in number of facilities operated
|
(8
|
)
|
|
Conifer
Segment
Conifer generated net operating revenues of
$1.571 billion
and
$1.413 billion
during the years ended
December 31, 2016
and
2015
, respectively, a portion of which was eliminated in consolidation as described in Note 20 to our Consolidated Financial Statements. The increase in the revenue from third parties, which is not eliminated in consolidation, is primarily due to new clients.
Salaries, wages and benefits expense for Conifer increased
$107 million
, or
12.6%
, in the year ended
December 31, 2016
compared to the year ended
December 31, 2015
due to an increase in employee headcount as a result of the growth in Conifer’s business primarily attributable to new clients. Conifer typically incurs start-up and other transition costs during the initial term of new client contracts.
Other operating expenses for Conifer increased
$39 million
, or
13.2%
, in the year ended
December 31, 2016
compared to the year ended
December 31, 2015
due to the growth in Conifer’s business primarily attributable to to new clients. Conifer typically incurs start-up and other transition costs during the initial term of new client contracts.
Consolidated
Impairment and Restructuring Charges, and Acquisition-Related Costs
During the year ended
December 31, 2016
,
we recorded impairment and restructuring charges and acquisition-related costs of
$202 million
.
This amount included impairment charges of approximately
$54 million
for the write-down of buildings, equipment and other long-lived assets, primarily capitalized software costs classified as other intangible assets, to their estimated fair values at
four
hospitals.
Material adverse trends in our most recent estimates of future undiscounted cash flows of the hospitals indicated the carrying value of the hospitals’ long-lived assets was not recoverable from the estimated future cash flows. We believe the most significant factors contributing to the adverse financial trends include reductions in volumes of insured patients, shifts in payer mix from commercial to governmental payers combined with reductions in reimbursement rates from governmental payers, and high levels of uninsured patients. As a result, we updated the estimate of the fair value of the hospitals’ long-lived assets and compared the fair value estimate to the carrying value of the hospitals’ long-lived assets. Because the fair value estimates were lower than the carrying value of the long-lived assets, an impairment charge was recorded for the difference in the amounts.
The aggregate carrying value of assets held and used of the hospitals for which impairment charges were recorded was
$163 million
at
December 31, 2016
after recording the impairment charges. We also recorded
$19 million
of impairment charges related to investments and
$14 million
related to other intangible assets, primarily contract-related intangibles and capitalized software costs not associated with the hospitals described above. Of the total impairment charges recognized for the year ended
December 31, 2016
,
$76 million
related to our Hospital Operations and other segment,
$8 million
related to our Ambulatory Care segment, and
$3 million
related to our Conifer segment. We also recorded
$35 million
of employee severance costs,
$14 million
of restructuring costs,
$14 million
of contract and lease termination fees, and
$52 million
in acquisition-related costs, which include
$20 million
of transaction costs and
$32 million
of acquisition integration costs.
During the year ended
December 31, 2015
, we recorded impairment and restructuring charges and acquisition-related costs of
$318 million
, including
$168 million
of impairment charges. We recorded an impairment charge of approximately
$147 million
to write-down assets held for sale to their estimated fair value, less estimated costs to sell, as a result of entering into a definitive agreement for the sale of SLUH during the three months ended June 30, 2015, as further described in Note 4 to the accompanying Consolidated Financial Statements. We also recorded impairment charges of approximately
$19 million
for the write-down of buildings, equipment and other long-lived assets, primarily capitalized software cost classified as other intangible assets, to their estimated fair values at two hospitals. The aggregate carrying value of assets held and used of the
80
hospitals for which impairment charges were recorded was
$45 million
at
December 31, 2015
after recording the impairment charge. We also recorded
$2 million
of impairment charges related to investments. In addition, we recorded
$25 million
of employee severance costs,
$6 million
of restructuring costs,
$19 million
of contract and lease termination fees, and
$100 million
in acquisition-related costs, which include
$55 million
of transaction costs and
$45 million
of acquisition integration costs.
Litigation and Investigation Costs
Litigation and investigation costs for the years ended
December 31, 2016
and
2015
were
$293 million
and
$291 million
, respectively. Of these amounts,
$278 million
and
$219 million
for the years ended
December 31, 2016
and
2015
, respectively, were attributable to accruals for the Clinica de la Mama matters.
Gains on Sales, Consolidation and Deconsolidation of Facilities
During the year ended
December 31, 2016
, we recorded gains on sales, consolidation and deconsolidation of facilities of approximately
$151 million
, primarily comprised of a
$113 million
gain from the sale of our Atlanta-area facilities and
$33 million
of gains related to the consolidation of certain businesses of our USPI joint venture due to ownership changes.
During the year ended
December 31, 2015
, we recorded gains on sales, consolidation and deconsolidation of facilities of approximately
$186 million
, comprised of a
$151 million
gain on deconsolidation due to our joint venture with BSWH, a
$3 million
gain from the sale of our North Carolina facilities, and
$32 million
of gains related to the consolidation and deconsolidation of certain businesses of our USPI joint venture due to ownership changes.
Interest Expense
Interest expense for the year ended
December 31, 2016
was
$979 million
compared to
$912 million
for the year ended December 31, 2015, primarily due to increased borrowings related to our 2015 acquisitions.
Income Tax Expense
During the year ended
December 31, 2016
, we recorded income tax expense of
$67 million
in continuing operations on pre-tax income of
$248 million
, compared to income tax expense of
$68 million
on pre-tax income of
$144 million
during the year ended
December 31, 2015
. The reconciliation between the amount of recorded income tax expense (benefit) and the amount calculated at the statutory federal tax rate is shown below.
|
|
Years Ended December 31,
|
||||||
|
|
2016
|
2015
|
|||||
|
Tax expense at statutory federal rate of 35%
|
$
|
87
|
|
$
|
50
|
|
|
|
State income taxes, net of federal income tax benefit
|
16
|
|
18
|
|
|||
|
Expired state net operating losses, net of federal income tax benefit
|
35
|
|
11
|
|
|||
|
Tax attributable to noncontrolling interests
|
(106
|
)
|
(59
|
)
|
|||
|
Nondeductible goodwill
|
29
|
|
22
|
|
|||
|
Nontaxable gains
|
(11
|
)
|
(11
|
)
|
|||
|
Nondeductible litigation costs
|
37
|
|
44
|
|
|||
|
Nondeductible acquisition costs
|
1
|
|
4
|
|
|||
|
Nondeductible health insurance provider fee
|
2
|
|
2
|
|
|||
|
Changes in valuation allowance
|
(25
|
)
|
4
|
|
|||
|
Change in tax contingency reserves, including interest
|
(9
|
)
|
7
|
|
|||
|
Amendment of prior-year tax returns
|
—
|
|
(17
|
)
|
|||
|
Prior-year provision to return adjustments and other changes in deferred taxes
|
12
|
|
(12
|
)
|
|||
|
Other items
|
(1
|
)
|
5
|
|
|||
|
|
$
|
67
|
|
$
|
68
|
|
|
81
Net Income Attributable to Noncontrolling Interests
Net income attributable to noncontrolling interests was
$368 million
for the year ended
December 31, 2016
compared to
$218 million
for the year ended
December 31, 2015
. Net income attributable to noncontrolling interests for the year ended
December 31, 2016
was comprised of
$31 million
related to our Hospital Operations and other segment,
$285 million
related to our Ambulatory Care segment and
$52 million
related to our Conifer segment. Of the portion related to our Ambulatory Care segment,
$65 million
was related to the minority interest in our USPI joint venture.
LIQUIDITY AND CAPITAL RESOURCES
CASH REQUIREMENTS
Our obligations to make future cash payments under contracts, such as debt and lease agreements, and under contingent commitments, such as standby letters of credit and minimum revenue guarantees, are summarized in the table below, all as of
December 31, 2017
:
|
|
Total
|
Years Ended December 31,
|
Later Years
|
||||||||||||||||||||||||
|
|
2018
|
2019
|
2020
|
2021
|
2022
|
||||||||||||||||||||||
|
|
(In Millions)
|
||||||||||||||||||||||||||
|
Long-term debt
(1)
|
$
|
19,263
|
|
$
|
911
|
|
$
|
1,385
|
|
$
|
3,441
|
|
$
|
2,612
|
|
$
|
4,015
|
|
$
|
6,899
|
|
||||||
|
Capital lease obligations
(1)
|
1,067
|
|
178
|
|
120
|
|
93
|
|
64
|
|
52
|
|
560
|
|
|||||||||||||
|
Long-term non-cancelable operating leases
|
1,217
|
|
211
|
|
180
|
|
150
|
|
129
|
|
104
|
|
443
|
|
|||||||||||||
|
Standby letters of credit
|
102
|
|
102
|
|
—
|
|
—
|
|
—
|
|
—
|
|
—
|
|
|||||||||||||
|
Guarantees
(2)
|
234
|
|
107
|
|
54
|
|
18
|
|
7
|
|
6
|
|
42
|
|
|||||||||||||
|
Asset retirement obligations
|
175
|
|
—
|
|
—
|
|
—
|
|
—
|
|
—
|
|
175
|
|
|||||||||||||
|
Academic affiliation agreements
(3)
|
104
|
|
62
|
|
21
|
|
12
|
|
9
|
|
—
|
|
—
|
|
|||||||||||||
|
Tax liabilities
|
19
|
|
—
|
|
—
|
|
—
|
|
—
|
|
—
|
|
19
|
|
|||||||||||||
|
Defined benefit plan obligations
|
652
|
|
69
|
|
22
|
|
23
|
|
23
|
|
23
|
|
492
|
|
|||||||||||||
|
Information technology contract services
|
980
|
|
214
|
|
215
|
|
218
|
|
221
|
|
112
|
|
—
|
|
|||||||||||||
|
Purchase orders
|
218
|
|
218
|
|
—
|
|
—
|
|
—
|
|
—
|
|
—
|
|
|||||||||||||
|
Total
(
4)
|
$
|
24,031
|
|
$
|
2,072
|
|
$
|
1,997
|
|
$
|
3,955
|
|
$
|
3,065
|
|
$
|
4,312
|
|
$
|
8,630
|
|
||||||
|
(1)
|
Includes interest through maturity date/lease termination.
|
|
(2)
|
Includes minimum revenue guarantees, primarily related to physicians under relocation agreements and physician groups that provide services at our hospitals, and operating lease guarantees.
|
|
(3)
|
These agreements contain various rights and termination provisions.
|
|
(4)
|
Professional liability and workers’ compensation reserves, and our obligations under the Put/Call Agreement and the Baylor Put/Call Agreement, as defined and described in Note 15 to our Consolidated Financial Statements, have been excluded from the table. At
December 31, 2017
, the current and long-term professional and general liability reserves included in our Consolidated Balance Sheet were approximately
$200 million
and
$654 million
, respectively, and the current and long-term workers’ compensation reserves included in our Consolidated Balance Sheet were approximately
$47 million
and
$181 million
, respectively. Redeemable noncontrolling interests in our USPI joint venture that are subject to the Put/Call Agreement and the Baylor Put/Call Agreement totaled approximately $631 million at
December 31, 2017
.
In January 2018, subsidiaries of Welsh, Carson, Anderson & Stowe delivered a put notice for the number of shares that represent a 7.5% ownership interest in our USPI joint venture in accordance with our amended and restated Put/Call Agreement
.
We expect that the estimated payment
to repurchase these shares will be
between $285 million and $295 million
, prior to any true-up payments related to actual financial results in 2017 or 2018.
|
Standby letters of credit are required principally by our insurers and various states to collateralize our workers’ compensation programs pursuant to statutory requirements and as security to collateralize the deductible and self-insured retentions under certain of our professional and general liability insurance programs. The amount of collateral required is primarily dependent upon the level of claims activity and our creditworthiness. The insurers require the collateral in case we are unable to meet our obligations to claimants within the deductible or self-insured retention layers.
We consummated the following transactions affecting our long-term commitments in the year ended
December 31, 2017
:
|
•
|
On June 14, 2017, we sold
$830 million
aggregate principal amount of our
4.625%
senior secured first lien notes, which will mature on July 15, 2024
(the “2024 Secured First Lien Notes”)
. We will pay interest on the 2024 Secured First Lien Notes semi-annually in arrears on January 15 and July 15 of each year, which payments commenced on January 15, 2018. The proceeds from the sale of the 2024 Secured First Lien Notes were used, after payment of fees and expenses, together with cash on hand, to deposit with the trustee an amount sufficient to fund the redemption of all
$900 million
in aggregate principal amount of our floating rate senior secured notes
|
82
due 2020
(the “2020 Floating Rate Notes”)
on July 14, 2017, thereby fully discharging the 2020 Floating Rate Notes as of June 14, 2017. In connection with the redemption, we recorded a loss from early extinguishment of debt of approximately
$26 million
in the three months ended June 30, 2017, primarily related to the difference between the redemption price and the par value of the notes, as well as the write-off of associated unamortized note discounts and issuance costs.
|
•
|
Also on June 14, 2017,
THC Escrow Corporation III (“
Escrow Corp.
”), a Delaware corporation established for the purpose of issuing the securities referred to in this paragraph,
issued
$1.040 billion
in aggregate principal amount of
4.625%
senior secured first lien notes due 2024
(the “Escrow Secured First Lien Notes”)
,
$1.410 billion
in aggregate principal amount of
5.125%
senior secured second lien notes due 2025
(the “Escrow Secured Second Lien Notes”)
and
$500 million
in aggregate principal amount of
7.000%
senior unsecured notes due 2025
(the “Escrow Unsecured Notes”)
.
|
|
•
|
On July 14, 2017, we (i) assumed Escrow Corp.’s obligations with respect to the Escrow Secured Second Lien Notes and (ii) effected a mandatory exchange of all outstanding Escrow Secured First Lien Notes for a like principal amount of our newly issued 2024 Secured First Lien Notes. The proceeds from the sale of the Escrow Secured Second Lien Notes and Escrow Secured First Lien Notes were released from escrow on July 14, 2017 and were used, after payment of fees and expenses, to finance our redemption on July 14, 2017 of
$1.041 billion
aggregate principal amount of our outstanding
6.250%
senior secured notes due 2018 and
$1.100 billion
aggregate principal amount of our outstanding
5.000%
senior unsecured notes due 2019.
|
|
•
|
On August 1, 2017, we assumed Escrow Corp.’s obligations with respect to the Escrow Unsecured Notes. The proceeds from the sale of the Escrow Unsecured Notes were released from escrow on August 1, 2017 and were used, after payment of fees and expenses, to finance our redemption on August 1, 2017 of
$500 million
aggregate principal amount of our
8.000%
senior unsecured notes due 2020.
|
|
•
|
On September 11, 2017, we redeemed the remaining
$250 million
aggregate principal amount of our
8.000%
senior unsecured notes due 2020 using cash on hand.
|
As part of our long-term objective to manage our capital structure, we may from time to time seek to retire, purchase, redeem or refinance some of our outstanding debt or equity securities subject to prevailing market conditions, our liquidity requirements, contractual restrictions and other factors. These actions are part of our strategy to manage our leverage and capital structure over time, which is dependent on our total amount of debt, our cash and our operating results. We continue to seek further initiatives to increase the efficiency of our balance sheet by generating incremental cash, including by means of the sale of underutilized or inefficient assets.
At
December 31, 2017
, using the last 12 months of Adjusted EBITDA, our ratio of total long-term debt, net of cash and cash equivalent balances, to Adjusted EBITDA was
5.86
x. We anticipate this ratio will fluctuate from quarter to quarter based on earnings performance and other factors, including the use of our revolving credit facility as a source of liquidity and acquisitions that involve the assumption of long-term debt. We intend to manage this ratio by following our business plan, managing our cost structure, possible asset divestitures and through other changes in our capital structure, including, if appropriate, the issuance of equity or convertible securities. Our ability to achieve our leverage and capital structure objectives is subject to numerous risks and uncertainties, many of which are described in the Forward-Looking Statements and Risk Factors sections of Part I of this report.
Our capital expenditures primarily relate to the expansion and renovation of existing facilities (including amounts to comply with applicable laws and regulations), equipment and information systems additions and replacements, introduction of new medical technologies, design and construction of new buildings, and various other capital improvements, as well as commitments to make capital expenditures in connection with acquisitions of businesses. Capital expenditures were
$707 million
,
$875 million
and
$842 million
in the years ended
December 31, 2017
,
2016
and
2015
, respectively. We anticipate that our capital expenditures for continuing operations for the year ending
December 31,
2018
will total approximately $625 million to $675 million, including
$117 million
that was accrued as a liability at
December 31, 2017
.
Interest payments, net of capitalized interest, were
$939 million
,
$932 million
and
$859 million
in the years ended
December 31, 2017
,
2016
and
2015
, respectively. For the year ending December 31,
2018
, we expect annual interest expense to be approximately $1.000 billion to $1.010 billion compared to
$1.028 billion
for the year ended
December 31, 2017
.
Income tax payments, net of tax refunds, were approximately
$56 million
in the year ended
December 31, 2017
compared to approximately
$33 million
in the year ended
December 31, 2016
. At
December 31, 2017
,
our carryforwards
83
available to offset future taxable income consisted of (1) federal net operating loss (“NOL”) carryforwards of approximately
$1.6 billion
pre-tax expiring in 2025 to 2034, (2) general business credit carryforwards of approximately
$29 million
expiring in 2023 through 2037, and (3) state NOL carryforwards of
approximately
$3.0 billion
expiring in 2018 through 2037 for which the associated deferred tax benefit, net of valuation allowance and federal tax impact, is
$12 million
. Our ability to utilize NOL carryforwards to reduce future taxable income may be limited under Section 382 of the Internal Revenue Code if certain ownership changes in our company occur during a rolling
three
-year period. These ownership changes include purchases of common stock under share repurchase programs (see Note 2
to the accompanying Consolidated Financial Statements for additional information
), the offering of stock by us, the purchase or sale of our stock by
5%
shareholders, as defined in the Treasury regulations, or the issuance or exercise of rights to acquire our stock. If such ownership changes by
5%
shareholders result in aggregate increases that exceed 50 percentage points during the
three
-year period, then Section 382 imposes an annual limitation on the amount of our taxable income that may be offset by the NOL carryforwards or tax credit carryforwards at the time of ownership change.
On August 31, 2017,
we entered into a rights agreement as a measure intended to deter the above-referenced ownership changes in order to preserve
our
NOL carryforwards
(see Note 2 to the accompanying Consolidated Financial Statements for additional information).
Periodic examinations of our tax returns by the Internal Revenue Service (“IRS”) or other taxing authorities could result in the payment of additional taxes. The IRS
has completed audits of our tax returns for all tax years ended on or before December 31, 2007, and of Vanguard’s tax returns for fiscal years ended on or before October 1, 2013. All disputed issues with respect to these audits have been resolved and all related tax assessments (including interest) have been paid. Our tax returns for years ended after December 31, 2007 and USPI’s tax returns for years ended after December 31, 2013 remain subject to audit by the IRS.
SOURCES AND USES OF CASH
Our liquidity for the year ended
December 31, 2017
was primarily derived from net cash provided by operating activities, cash on hand, issuance of long-term debt and borrowings under our revolving credit facility. We had approximately $611 million of cash and cash equivalents on hand at
December 31, 2017
to fund our operations and capital expenditures, and our borrowing availability under our credit facility was $998 million based on our borrowing base calculation as of
December 31, 2017
.
Our primary source of operating cash is the collection of accounts receivable. As such, our operating cash flow is impacted by levels of cash collections and levels of bad debt due to shifts in payer mix and other factors.
Net cash provided by operating activities was
$1.200 billion
in the year ended
December 31, 2017
compared to
$558 million
in the year ended
December 31, 2016
. Key factors contributing to the change between the
2017
and
2016
periods include the following:
|
•
|
A
decrease
of
$566 million
in payments on reserves for restructuring charges, acquisition-related costs, and litigation costs and settlements; and
|
|
•
|
The timing of other working capital items.
|
Net cash
provided by
investing activities was
$21 million
for the year ended
December 31, 2017
compared to
$430 million
net cash
used in
investing activities for the year ended
December 31, 2016
. The primary reason for the year-over-year change was due to proceeds from sales of facilities and other assets of
$827 million
in the
2017
period when we completed the sale of our hospitals, physician practices and related assets in Houston, Texas and the surrounding area compared to
$573 million
in the
2016
period when we completed the sale of our Georgia facilities. Cash used for acquisitions of businesses and joint venture interests was
$50 million
in the
2017
period compared to
$117 million
in the
2016
period, primarily related to freestanding outpatient facilities in both periods. Capital expenditures were
$707 million
and
$875 million
in the years ended
December 31, 2017
and
2016
, respectively.
Net cash
used in
financing activities was
$1.326 billion
for the year ended
December 31, 2017
compared to net cash
provided by
financing activities of
$232 million
for the year ended
December 31, 2016
. The
2017
amount included
$729 million
related to purchases of noncontrolling interests, primarily our purchase of an additional 23.7% of our USPI joint venture, which increased our ownership interest in the USPI joint venture to 80.0%, compared to
$186 million
in the
2016
period when we paid $127 million to increase our ownership interest in the USPI joint venture from 50.1% to approximately 56.3%. The
2017
amount also included our redemption of
$250 million
aggregate principal amount of our
8.000%
senior unsecured notes due 2020 using cash on hand, and our purchase of the land and improvements associated with our Palm Beach Gardens Medical Center, which we previously leased under a capital lease, by retiring the lease obligation for approximately
84
$44 million. The
2016
amount included proceeds from the sale of
$750 million
aggregate amount of our
7.500%
senior secured notes due 2022.
We record our investments that are available-for-sale at fair market value. As shown in Note 18 to the accompanying Consolidated Financial Statements, the majority of our investments are valued based on quoted market prices or other observable inputs. We have no investments that we expect will be negatively affected by the current economic conditions such that they will materially impact our financial condition, results of operations or cash flows.
DEBT INSTRUMENTS, GUARANTEES AND RELATED COVENANTS
Credit Agreement.
We have a senior secured revolving credit facility (as amended, the “Credit Agreement”) that provides, subject to borrowing availability, for revolving loans in an aggregate principal amount of up to
$1 billion
,
with a
$300 million
subfacility for standby letters of credit. Obligations under the Credit Agreement, which has a scheduled maturity date of December 4, 2020, are guaranteed by substantially all of our domestic wholly owned hospital subsidiaries and are secured by a first-priority lien on the accounts receivable owned by us and the subsidiary guarantors.
At
December 31, 2017
, we were in compliance with all covenants and conditions in our Credit Agreement. At
December 31, 2017
,
we had no cash borrowings outstanding under the Credit Agreement and we had approximately
$2 million
of standby letters of credit outstanding. Based on our eligible receivables, approximately
$998 million
was available for borrowing under the Credit Agreement at
December 31, 2017
.
Letter of Credit Facility.
We have a letter of credit facility (as amended, the “LC Facility”) that provides for the issuance of standby and documentary letters of credit, from time to time, in an aggregate principal amount of up to
$180 million
(subject to increase to up to
$200 million
).
Obligations under the LC Facility are guaranteed and secured by a first-priority pledge of the capital stock and other ownership interests of certain of our wholly owned domestic hospital subsidiaries on an equal ranking basis with our senior secured first lien notes.
On September 15, 2016, we entered into an amendment to the existing letter of credit facility agreement in order to, among other things, (i) extend the scheduled maturity date of the LC Facility to March 7, 2021, (ii) reduce the margin payable with respect to unreimbursed drawings under letters of credit and undrawn letters of credit issued under the LC Facility, and (iii) reduce the commitment fee payable with respect to the undrawn portion of the commitments under the LC Facility. At
December 31, 2017
, we were in compliance with all covenants and conditions in our LC Facility. At
December 31, 2017
,
we had approximately
$100 million
of standby letters of credit outstanding under the LC Facility.
Senior Secured and Senior Unsecured Note Refinancing Transactions.
On June 14, 2017, we sold
$830 million
aggregate principal amount of our
4.625%
senior secured first lien notes, which will mature on July 15, 2024
. We will pay interest on the 2024 Secured First Lien Notes semi-annually in arrears on January 15 and July 15 of each year, which payments commenced on January 15, 2018. The proceeds from the sale of the 2024 Secured First Lien Notes were used, after payment of fees and expenses, together with cash on hand, to deposit with the trustee an amount sufficient to fund the redemption of all
$900 million
in aggregate principal amount of our floating rate senior secured notes due 2020
on July 14, 2017, thereby fully discharging the 2020 Floating Rate Notes as of June 14, 2017. In connection with the redemption, we recorded a loss from early extinguishment of debt of approximately
$26 million
in the three months ended June 30, 2017, primarily related to the difference between the redemption price and the par value of the notes, as well as the write-off of associated unamortized note discounts and issuance costs.
Also on June 14, 2017,
Escrow Corp.
issued
$1.040 billion
in aggregate principal amount of
4.625%
senior secured first lien notes due 2024
,
$1.410 billion
in aggregate principal amount of
5.125%
senior secured second lien notes due 2025
and
$500 million
in aggregate principal amount of
7.000%
senior unsecured notes due 2025
.
On July 14, 2017, we (i) assumed Escrow Corp.’s obligations with respect to the Escrow Secured Second Lien Notes and (ii) effected a mandatory exchange of all outstanding Escrow Secured First Lien Notes for a like principal amount of our newly issued 2024 Secured First Lien Notes. The proceeds from the sale of the Escrow Secured Second Lien Notes and Escrow Secured First Lien Notes were released from escrow on July 14, 2017 and were used, after payment of fees and expenses, to finance our redemption on July 14, 2017 of
$1.041 billion
aggregate principal amount of our outstanding
6.250%
senior secured notes due 2018 and
$1.100 billion
aggregate principal amount of our outstanding
5.000%
senior unsecured notes due 2019.
On August 1, 2017, we assumed Escrow Corp.’s obligations with respect to the Escrow Unsecured Notes. The proceeds from the sale of the Escrow Unsecured Notes were released from escrow on August 1, 2017 and were used, after payment of fees and expenses, to finance our redemption on August 1, 2017 of
$500 million
aggregate principal amount of our
8.000%
senior unsecured notes due 2020.
85
On September 11, 2017, we redeemed the remaining
$250 million
aggregate principal amount of our
8.000%
senior unsecured notes due 2020 using cash on hand.
As a result of the redemption activities in the three months ended September 30, 2017 discussed above, we recorded a loss from early extinguishment of debt of approximately
$138 million
in the period, primarily related to the difference between the redemption price and the par value of the notes, as well as the write-off of associated unamortized note discounts and issuance costs.
In December 2016, we sold $750 million aggregate amount of
7.500%
senior secured notes, which will mature on January 1, 2022. We will pay interest on the 7.500% senior secured second lien notes semi-annually in arrears on January 1 and July 1 of each year, which payments commenced on July 1, 2017. The net proceeds of the notes were used, after payment of fees and expenses, to repay indebtedness outstanding under our senior secured revolving credit facility and for general corporate purposes.
For additional information regarding our long-term debt and capital lease obligations, see Note 6 to the accompanying Consolidated Financial Statements.
LIQUIDITY
From time to time, we expect to engage in additional capital markets, bank credit and other financing activities depending on our needs and financing alternatives available at that time. We believe our existing debt agreements provide flexibility for future secured or unsecured borrowings.
Our cash on hand fluctuates day-to-day throughout the year based on the timing and levels of routine cash receipts and disbursements, including our book overdrafts, and required cash disbursements, such as interest and income tax payments. These fluctuations result in material intra-quarter net uses of cash that have caused, and in the future could cause, us to use our Credit Agreement as a source of liquidity. We believe that existing cash and cash equivalents on hand, availability under our Credit Agreement, anticipated future cash provided by operating activities, and our investments in marketable securities of our captive insurance companies classified as noncurrent investments on our balance sheet should be adequate to meet our current cash needs. These sources of liquidity, in combination with any potential future debt incurrence, should also be adequate to finance planned capital expenditures, payments on the current portion of our long-term debt, payments to joint venture partners, including those related to put and call arrangements, and other presently known operating needs.
Long-term liquidity for debt service and other purposes will be dependent on the amount of cash provided by operating activities and, subject to favorable market and other conditions, the successful completion of future borrowings and potential refinancings. However, our cash requirements could be materially affected by the use of cash in acquisitions of businesses, repurchases of securities, the exercise of put rights or other exit options by our joint venture partners, and contractual commitments to fund capital expenditures in, or intercompany borrowings to, businesses we own. In addition, liquidity could be adversely affected by a deterioration in our results of operations, including our ability to generate cash from operations, as well as by the various risks and uncertainties discussed in this section and other sections of this report, including any costs associated with legal proceedings and government investigations.
We do not rely on commercial paper or other short-term financing arrangements nor do we enter into repurchase agreements or other short-term financing arrangements not otherwise reported in our period-end balance sheets. In addition, we do not have significant exposure to floating interest rates given that all of our current long-term indebtedness has fixed rates of interest.
OFF-BALANCE SHEET ARRANGEMENTS
Our consolidated operating results for the years ended December 31, 2016 and 2015 include
$2 million
and
$94 million
, respectively, of net operating revenues and
$(7) million
and
$15 million
, respectively, of operating income (loss) generated from hospitals operated by us under operating lease arrangements (there were no hospitals in the year ended
December 31, 2017
, one hospital in the year ended December 31,
2016
, which was sold effective March 31, 2016, and two hospitals in the year ended December 31,
2015
). In accordance with GAAP, the applicable buildings and the future lease obligations under these arrangements are not recorded on our consolidated balance sheet.
86
We have no other off-balance sheet arrangements that may have a current or future material effect on our financial condition, revenues or expenses, results of operations, liquidity, capital expenditures or capital resources, except for
$203 million
of standby letters of credit outstanding and guarantees at
December 31, 2017
.
RECENTLY ISSUED ACCOUNTING STANDARDS
See Note 21 to the accompanying Consolidated Financial Statements for a discussion of recently issued accounting standards.
CRITICAL ACCOUNTING ESTIMATES
In preparing our Consolidated Financial Statements in conformity with GAAP, we must use estimates and assumptions that affect the amounts reported in our Consolidated Financial Statements and accompanying notes. We regularly evaluate the accounting policies and estimates we use. In general, we base the estimates on historical experience and on assumptions that we believe to be reasonable, given the particular circumstances in which we operate. Actual results may vary from those estimates.
We consider our critical accounting estimates to be those that (1) involve significant judgments and uncertainties, (2) require estimates that are more difficult for management to determine, and (3) may produce materially different outcomes under different conditions or when using different assumptions.
Our critical accounting estimates cover the following areas:
|
•
|
Recognition of net operating revenues, including contractual allowances and provision for doubtful accounts;
|
|
•
|
Accruals for general and professional liability risks;
|
|
•
|
Accruals for defined benefit plans;
|
|
•
|
Impairment of long-lived assets;
|
|
•
|
Impairment of goodwill; and
|
|
•
|
Accounting for income taxes.
|
REVENUE RECOGNITION
We recognize net operating revenues before provision for doubtful accounts in the period in which our services are performed. Net operating revenues before provision for doubtful accounts primarily consist of net patient service revenues that are recorded based on established billing rates (i.e., gross charges), less estimated discounts for contractual and other allowances, principally for patients covered by Medicare, Medicaid, and managed care and other health plans, as well as certain uninsured patients under the Compact.
Revenues under the traditional fee-for-service Medicare and Medicaid programs are based primarily on prospective payment systems. Retrospectively determined cost-based revenues under these programs, which were more prevalent in earlier periods, and certain other payments, such as DSH, DGME, IME and bad debt expense, which are based on our hospitals’ cost reports, are estimated using historical trends and current factors. Cost report settlements under these programs are subject to audit by Medicare and Medicaid auditors and administrative and judicial review, and it can take several years until final settlement of such matters is determined and completely resolved. Because the laws, regulations, instructions and rule interpretations governing Medicare and Medicaid reimbursement are complex and change frequently, the estimates recorded by us could change by material amounts.
We have a system and estimation process for recording Medicare net patient revenue and estimated cost report settlements. This results in us recording accruals to reflect the expected final settlements on our cost reports. For filed cost reports, we record the accrual based on those cost reports and subsequent activity, and record a valuation allowance against those cost reports based on historical settlement trends. The accrual for periods for which a cost report is yet to be filed is recorded based on estimates of what we expect to report on the filed cost reports, and a corresponding valuation allowance is recorded as previously described. Cost reports must generally be filed within five months after the end of the annual cost report reporting period. After the cost report is filed, the accrual and corresponding valuation allowance may need to be adjusted.
87
Revenues under managed care plans are based primarily on payment terms involving predetermined rates per diagnosis, per-diem rates, discounted fee-for-service rates and other similar contractual arrangements. These revenues are also subject to review and possible audit by the payers, which can take several years before they are completely resolved. The payers are billed for patient services on an individual patient basis. An individual patient’s bill is subject to adjustment on a patient-by-patient basis in the ordinary course of business by the payers following their review and adjudication of each particular bill. We estimate the discounts for contractual allowances at the individual hospital level utilizing billing data on an individual patient basis. At the end of each month, on an individual hospital basis, we estimate our expected reimbursement for patients of managed care plans based on the applicable contract terms. We believe it is reasonably likely for there to be an approximately 3% increase or decrease in the estimated contractual allowances related to managed care plans. Based on reserves as of
December 31, 2017
, a 3% increase or decrease in the estimated contractual allowance would impact the estimated reserves by approximately
$17 million
. Some of the factors that can contribute to changes in the contractual allowance estimates include: (1) changes in reimbursement levels for procedures, supplies and drugs when threshold levels are triggered; (2) changes in reimbursement levels when stop-loss or outlier limits are reached; (3) changes in the admission status of a patient due to physician orders subsequent to initial diagnosis or testing; (4) final coding of in-house and discharged-not-final-billed patients that change reimbursement levels; (5) secondary benefits determined after primary insurance payments; and (6) reclassification of patients among insurance plans with different coverage levels. Contractual allowance estimates are periodically reviewed for accuracy by taking into consideration known contract terms, as well as payment history. Although we do not separately accumulate and disclose the aggregate amount of adjustments to the estimated reimbursement for every patient bill, we believe our estimation and review process enables us to identify instances on a timely basis where such estimates need to be revised. We do not believe there were any adjustments to estimates of patient bills that were material to our revenues. In addition, on a corporate-wide basis, we do not record any general provision for adjustments to estimated contractual allowances for managed care plans.
Revenues related to self-pay patients may qualify for a discount under the Compact, whereby the gross charges based on established billing rates would be reduced by an estimated discount for contractual allowance.
We believe that adequate provision has been made for any adjustments that may result from final determination of amounts earned under all the above arrangements. We know of no material claims, disputes or unsettled matters with any payers that would affect our revenues for which we have not adequately provided for in our Consolidated Financial Statements.
Although outcomes vary, our policy is to attempt to collect amounts due from patients, including co-pays and deductibles due from patients with insurance, at the time of service while complying with all federal and state statutes and regulations, including, but not limited to, the Emergency Medical Treatment and Active Labor Act (“EMTALA”). Generally, as required by EMTALA, patients may not be denied emergency treatment due to inability to pay. Therefore, services, including the legally required medical screening examination and stabilization of the patient, are performed without delaying to obtain insurance information. In non-emergency circumstances or for elective procedures and services, it is our policy to verify insurance prior to a patient being treated; however, there are various exceptions that can occur. Such exceptions can include, for example, instances where (1) we are unable to obtain verification because the patient’s insurance company was unable to be reached or contacted, (2) a determination is made that a patient may be eligible for benefits under various government programs, such as Medicaid or Victims of Crime, and it takes several days or weeks before qualification for such benefits is confirmed or denied, and (3) under physician orders we provide services to patients that require immediate treatment.
We provide for accounts receivable that could become uncollectible by establishing an allowance to reduce the carrying value of such receivables to their estimated net realizable value. Generally, we estimate this allowance based on the aging of our accounts receivable by hospital, our historical collection experience by hospital and for each type of payer over a look-back period, and other relevant factors. Based on our accounts receivable from self-pay patients and co-pays and deductibles owed to us by patients with insurance at
December 31, 2017
, a 10% decrease or increase in our self-pay collection rate, or approximately 3%, which we believe could be a reasonable likely change, would result in an unfavorable or favorable adjustment to provision for doubtful accounts of approximately
$9 million
. There are various factors that can impact collection trends, such as changes in the economy, which in turn have an impact on unemployment rates and the number of uninsured and underinsured patients, the volume of patients through our emergency departments, the increased burden of co-pays and deductibles to be made by patients with insurance, and business practices related to collection efforts. These factors continuously change and can have an impact on collection trends and our estimation process.
Our practice is to reduce the net carrying value of self-pay accounts receivable, including accounts related to the co-pays and deductibles due from patients with insurance, to their estimated net realizable value at the time of billing. Generally, uncollected balances are assigned to Conifer between 90 to 180 days, once patient responsibility has been identified. When accounts are assigned to Conifer by the hospital, the accounts are completely written off the hospital’s books through the provision for doubtful accounts, and an estimated future recovery amount is calculated and recorded as a receivable on the
88
hospital’s books at the same time. The estimated future recovery amount is adjusted based on the aging of the accounts and changes to actual recovery rates. The estimated future recovery amount for self-pay accounts is written down whereby it is fully reserved if the amount is not paid within two years after the account is assigned to Conifer.
Managed care accounts are collected through the regional business offices of Conifer, whereby the account balances remain in the related hospital’s patient accounting system and on the hospital’s books, and are adjusted based on an analysis of the net realizable value as they age. Generally, managed care accounts collected by Conifer are gradually written down whereby they are fully reserved if the accounts are not paid within two years.
Changes in the collectability of aged managed care accounts receivable are ongoing and impact our provision for doubtful accounts. We continue to experience payment pressure from managed care companies concerning amounts of past billings. We aggressively pursue collection of these accounts receivable using all means at our disposal, including arbitration and litigation, but we may not be successful.
ACCRUALS FOR GENERAL AND PROFESSIONAL LIABILITY RISKS
We accrue for estimated professional and general liability claims, to the extent not covered by insurance, when they are probable and can be reasonably estimated. We maintain reserves, which are based on modeled estimates for the portion of our professional liability risks, including incurred but not reported claims, to the extent we do not have insurance coverage. Our liability consists of estimates established based upon discounted calculations using several factors, including the number of expected claims, estimates of losses for these claims based on recent and historical settlement amounts, estimates of incurred but not reported claims based on historical experience, the timing of historical payments, and risk free discount rates used to determine the present value of projected payments. We consider the number of expected claims, average cost per claim and discount rate to be the most significant assumptions in estimating accruals for general and professional liabilities. Our liabilities are adjusted for new claims information in the period such information becomes known. Malpractice expense is recorded within other operating expenses in the accompanying Consolidated Statements of Operations.
Our estimated reserves for professional and general liability claims will change significantly if future trends differ from projected trends. We believe it is reasonably likely for there to be a 500 basis point increase or decrease in our frequency or severity trend. Based on our reserves and other information at
December 31, 2017
, a 500 basis point increase in our frequency trend would increase the estimated reserves by
$64 million
, and a 500 basis point decrease in our frequency trend would decrease the estimated reserves by
$46 million
. A 500 basis point increase in our severity trend would increase the estimated reserves by
$134 million
, and a 500 basis point decrease in our severity trend would decrease the estimated reserves by
$101 million
. Because our estimated reserves for future claim payments are discounted to present value, a change in our discount rate assumption could also have a significant impact on our estimated reserves. Our discount rate was
2.33%
,
2.25%
and
2.09%
at
December 31, 2017
,
2016
and
2015
, respectively. A 100 basis point increase or decrease in the discount rate would change the estimated reserves by
$22 million
. In addition, because of the complexity of the claims, the extended period of time to settle the claims and the wide range of potential outcomes, our ultimate liability for professional and general liability claims could change materially from our current estimates.
The table below shows the case reserves and incurred but not reported and loss development reserves as of
December 31, 2017
,
2016
and
2015
:
|
|
December 31,
|
||||||||||
|
|
2017
|
2016
|
2015
|
||||||||
|
Case reserves
|
$
|
194
|
|
$
|
189
|
|
$
|
219
|
|
||
|
Incurred but not reported and loss development reserves
|
720
|
|
675
|
|
584
|
|
|||||
|
Total undiscounted reserves
|
$
|
914
|
|
$
|
864
|
|
$
|
803
|
|
||
Several actuarial methods, including the incurred, paid loss development and Bornhuetter-Ferguson methods, are applied to our historical loss data to produce estimates of ultimate expected losses and the resulting incurred but not reported and loss development reserves. These methods use our specific historical claims data related to paid losses and loss adjustment expenses, historical and current case reserves, reported and closed claim counts, and a variety of hospital census information. These analyses are considered in our determination of our estimate of the professional liability claims, including the incurred but not reported and loss development reserve estimates. The determination of our estimates involves subjective judgment and could result in material changes to our estimates in future periods if our actual experience is materially different than our assumptions.
89
Malpractice claims generally take up to five years to settle from the time of the initial reporting of the occurrence to the settlement payment. Accordingly, the percentage of undiscounted reserves at both
December 31, 2017
and
2016
representing unsettled claims is approximately
98%
.
The following table, which includes both our continuing and discontinued operations, presents the amount of our accruals for professional and general liability claims and the corresponding activity therein:
|
|
Years Ended December 31,
|
||||||||||
|
|
2017
|
2016
|
2015
|
||||||||
|
Accrual for professional and general liability claims, beginning of the year
|
$
|
794
|
|
$
|
755
|
|
$
|
681
|
|
||
|
Assumed from acquisition
|
—
|
|
—
|
|
29
|
|
|||||
|
Expense (income) related to:
(1)
|
|
|
|
|
|
|
|||||
|
Current year
|
243
|
|
228
|
|
151
|
|
|||||
|
Prior years
|
61
|
|
43
|
|
95
|
|
|||||
|
Expense (income) from discounting
|
(5
|
)
|
(4
|
)
|
(3
|
)
|
|||||
|
Total incurred loss and loss expense
|
299
|
|
267
|
|
243
|
|
|||||
|
Paid claims and expenses related to:
|
|
|
|
|
|
|
|||||
|
Current year
|
(2
|
)
|
—
|
|
(3
|
)
|
|||||
|
Prior years
|
(237
|
)
|
(228
|
)
|
(195
|
)
|
|||||
|
Total paid claims and expenses
|
(239
|
)
|
(228
|
)
|
(198
|
)
|
|||||
|
Accrual for professional and general liability claims, end of year
|
$
|
854
|
|
$
|
794
|
|
$
|
755
|
|
||
|
(1)
|
Total malpractice expense for continuing operations, including premiums for insured coverage, was
$303 million
,
$281 million
and
$283 million
in the years ended
December 31, 2017
,
2016
and
2015
, respectively.
|
ACCRUALS FOR DEFINED BENEFIT PLANS
Our defined benefit plan obligations and related costs are calculated using actuarial concepts. The discount rate is a critical assumption in determining the elements of expense and liability measurement. We evaluate this critical assumption annually. Other assumptions include employee demographic factors such as retirement patterns, mortality, turnover and rate of compensation increase. During the years ended
December 31, 2017
and
2016
, the Society of Actuaries issued new mortality improvement scales (MP-2017 and MP-2016, respectively), which we incorporated into the estimates of our defined benefit plan obligations at
December 31, 2017
and
2016
.
The discount rate enables us to state expected future cash payments for benefits as a present value on the measurement date. The guideline for setting these rates is a high-quality long-term corporate bond rate. A lower discount rate increases the present value of benefit obligations and impacts pension expense. Our discount rates for
2017
ranged from
3.75%
to
4.00%
and our discount rate for
2016
ranged from
4.25%
to
4.42%
. The assumed discount rate for pension plans reflects the market rates for high-quality corporate bonds currently available. A 100 basis point decrease in the assumed discount rate would increase total net periodic pension expense for
2018
by approximately
$3 million
and would increase the projected benefit obligation at
December 31, 2017
by approximately
$180 million
. A 100 basis point increase in the assumed discount rate would decrease net periodic pension expense for
2018
by approximately
$1 million
and decrease the projected benefit obligation at
December 31, 2017
by approximately
$149 million
.
IMPAIRMENT OF LONG-LIVED ASSETS
We evaluate our long-lived assets for possible impairment annually or whenever events or changes in circumstances indicate that the carrying amount of the asset, or related group of assets, may not be recoverable from estimated future undiscounted cash flows. If the estimated future undiscounted cash flows are less than the carrying value of the assets, we calculate the amount of an impairment charge if the carrying value of the long-lived assets exceeds the fair value of the assets. The fair value of the assets is estimated based on appraisals, established market values of comparable assets or internal estimates of future net cash flows expected to result from the use and ultimate disposition of the asset. The estimates of these future cash flows are based on assumptions and projections we believe to be reasonable and supportable. They require our subjective judgments and take into account assumptions about revenue and expense growth rates. These assumptions may vary by type of facility and presume stable, improving or, in some cases, declining results at our hospitals, depending on their circumstances. If the presumed level of performance does not occur as expected, impairment may result.
We report long-lived assets to be disposed of at the lower of their carrying amounts or fair values less costs to sell. In such circumstances, our estimates of fair value are based on appraisals, established market prices for comparable assets or internal estimates of future net cash flows
90
Fair value estimates can change by material amounts in subsequent periods. Many factors and assumptions can impact the estimates, including the following risks:
|
•
|
future financial results of our hospitals, which can be impacted by volumes of insured patients and declines in commercial managed care patients, terms of managed care payer arrangements, our ability to collect accounts due from uninsured and managed care payers, loss of volumes as a result of competition, and our ability to manage costs such as labor costs, which can be adversely impacted by union activity and the shortage of experienced nurses;
|
|
•
|
changes in payments from governmental healthcare programs and in government regulations such as reductions to Medicare and Medicaid payment rates resulting from government legislation or rule-making or from budgetary challenges of states in which we operate;
|
|
•
|
how the hospitals are operated in the future; and
|
|
•
|
the nature of the ultimate disposition of the assets.
|
During the year ended
December 31, 2017
, we recorded
$402 million
of impairment charges, consisting of approximately
$364 million
of charges to write-down assets held for sale to their estimated fair value, less estimated costs to sell, for our Aspen, Philadelphia-area and certain of our Chicago-area facilities,
$31 million
for the impairment of
two
equity method investments and
$7 million
to write-down intangible assets.
Of the total impairment charges recognized for the year ended
December 31, 2017
,
$337 million
related to our Hospital Operations and other segment,
$63 million
related to our Ambulatory Care segment, and
$2 million
related to our Conifer segment.
We also had three hospitals whose estimated future undiscounted cash flows did not exceed the carrying value of long-lived assets. However, in each case, the fair value of those assets, based on independent appraisals, established market values of comparable assets or internal estimates exceeded the carrying value, so no impairment was recorded. Future adverse trends that result in necessary changes in the assumptions underlying these estimates of future undiscounted cash flows could result in the hospitals’ estimated cash flows being less than the carrying value of the assets, which would require a fair value assessment of the long-lived assets and, if the fair value amount is less than the carrying value of the assets, impairment charges would occur and could be material.
During the year ended
December 31, 2016
, we recorded
$87 million
of impairment charges.
This amount included impairment charges of approximately
$54 million
for the write-down of buildings, equipment and other long-lived assets, primarily capitalized software costs classified as other intangible assets, to their estimated fair values at
four
hospitals.
Material adverse trends in our most recent estimates of future undiscounted cash flows of the hospitals indicated the carrying value of the hospitals’ long-lived assets was not recoverable from the estimated future cash flows. We believe the most significant factors contributing to the adverse financial trends include reductions in volumes of insured patients, shifts in payer mix from commercial to governmental payers combined with reductions in reimbursement rates from governmental payers, and high levels of uninsured patients. As a result, we updated the estimate of the fair value of the hospitals’ long-lived assets and compared the fair value estimate to the carrying value of the hospitals’ long-lived assets. Because the fair value estimates were lower than the carrying value of the long-lived assets, an impairment charge was recorded for the difference in the amounts.
The aggregate carrying value of assets held and used of the hospitals for which impairment charges were recorded was
$163 million
at
December 31, 2016
after recording the impairment charges. We also recorded
$19 million
of impairment charges related to investments and
$14 million
related to other intangible assets, primarily contract-related intangibles and capitalized software costs not associated with the hospitals described above. Of the total impairment charges recognized for the year ended
December 31, 2016
,
$76 million
related to our Hospital Operations and other segment,
$8 million
related to our Ambulatory Care segment, and
$3 million
related to our Conifer segment.
IMPAIRMENT OF GOODWILL
Goodwill represents the excess of costs over the fair value of assets of businesses acquired. Goodwill and other intangible assets acquired in purchase business combinations and determined to have indefinite useful lives are not amortized, but instead are subject to impairment tests performed at least annually. For goodwill, we perform the test at the reporting unit level, as defined by applicable accounting standards, when events occur that require an evaluation to be performed or at least annually. If we determine the carrying value of goodwill is impaired, or if the carrying value of a business that is to be sold or otherwise disposed of exceeds its fair value, then we reduce the carrying value, including any allocated goodwill, to fair value. Estimates of fair value are based on appraisals, established market prices for comparable assets or internal estimates of future net cash flows and presume stable, improving or, in some cases, declining results at our hospitals, depending on their circumstances. If the presumed level of performance does not occur as expected, impairment may result.
91
At
December 31, 2017
, our continuing operations consisted of three reportable segments, Hospital Operations and other, Ambulatory Care and Conifer.
Our segments are reporting units used to perform our goodwill impairment analysis. We completed our annual impairment tests for goodwill as of October
1
, 2017. During the year ended December 31, 2017, we changed our annual quantitative goodwill impairment testing date from December 31 to October 1 of each year. The change in the goodwill impairment test date better aligns the impairment testing procedures with the timing of our long-term planning process, which is a significant input to the testing. Also, during January 2017, our Florida, Northeast and Southern regions and our Detroit market were combined to form our then Eastern region. Subsequent to this change, our Hospital Operations and other segment was comprised of our then Eastern, Texas and Western regions, which were our reporting units used to perform our goodwill impairment analysis. During October 2017, we further reorganized our business such that our regional management layer was eliminated. Due to this reorganization, our previous region reporting units for our Hospital Operations and other segment were combined into one reporting unit. The change in testing date and the change in reporting units did not delay, accelerate or avoid a goodwill impairment charge.
The allocated goodwill balance related to our Hospital Operations and other segment totals approximately
$2.976 billion
. In our latest impairment analysis for the year ended
December 31, 2017
, the estimated fair value of our Hospital Operations and other segment exceeded the carrying value of long-lived assets, including goodwill, by more than 50%, and the estimated fair value of the Texas Region, our reporting unit with the largest goodwill balance prior to our latest reorganization, exceeded the carrying value of long-lived assets, including goodwill, by approximately 17%.
The allocated goodwill balance related to our Ambulatory Care segment, consisting largely of assets acquired in 2015 and 2016, totals approximately
$3.437 billion
. For the Ambulatory Care segment, we performed a qualitative analysis under ASU 2011-08, “Intangibles-Goodwill and Other (Topic 350): Testing Goodwill for Impairment” (“ASU 2011-08”) and concluded that it was more likely than not that the fair value of the reporting unit exceeded its carrying value. Factors considered in the analysis included the length of time since the acquisition date fair value analyses were performed, as well as recent and estimated future operating trends.
The allocated goodwill balance related to our Conifer segment totals approximately
$605 million
. For the Conifer segment, we performed a qualitative analysis under ASU 2011-08 and concluded that it was more likely than not that the fair value of the reporting unit exceeded its carrying value. Factors considered in the analysis included recent and estimated future operating trends.
ACCOUNTING FOR INCOME TAXES
We account for income taxes using the asset and liability method. This approach requires the recognition of deferred tax assets and liabilities for the expected future tax consequences of temporary differences between the carrying amounts and the tax bases of assets and liabilities. Income tax receivables and liabilities and deferred tax assets and liabilities are recognized based on the amounts that more likely than not will be sustained upon ultimate settlement with taxing authorities.
Developing our provision for income taxes and analysis of uncertain tax positions requires significant judgment and knowledge of federal and state income tax laws, regulations and strategies, including the determination of deferred tax assets and liabilities and, if necessary, any valuation allowances that may be required for deferred tax assets.
We assess the realization of our deferred tax assets to determine whether an income tax valuation allowance is required. Based on all available evidence, both positive and negative, and the weight of that evidence to the extent such evidence can be objectively verified, we determine whether it is more likely than not that all or a portion of the deferred tax assets will be realized. The main factors that we consider include:
|
•
|
Cumulative profits/losses in recent years, adjusted for certain nonrecurring items;
|
|
•
|
Income/losses expected in future years;
|
|
•
|
Unsettled circumstances that, if unfavorably resolved, would adversely affect future operations and profit levels;
|
|
•
|
The availability, or lack thereof, of taxable income in prior carryback periods that would limit realization of tax benefits; and
|
|
•
|
The carryforward period associated with the deferred tax assets and liabilities.
|
92
During the year ended
December 31, 2017
, we had
no
net change in the valuation allowance,
but there was a decrease of
$28 million
due to the expiration or worthlessness of unutilized state net operating loss carryovers, an increase of
$6 million
due to the decrease in the federal tax rate, and an increase of
$22 million
due to changes in expected realizability of deferred tax assets. The remaining balance in the valuation allowance at
December 31, 2017
was
$72 million
. During the year ended
December 31, 2016
, the valuation allowance decreased by
$24 million
primarily due to the expiration or worthlessness of unutilized state net operating loss carryovers. The balance in the valuation allowance as of
December 31, 2016
was
$72 million
.
We consider many factors when evaluating our uncertain tax positions, and such judgments are subject to periodic review. Tax benefits associated with uncertain tax positions are recognized in the period in which one of the following conditions is satisfied: (1) the more likely than not recognition threshold is satisfied; (2) the position is ultimately settled through negotiation or litigation; or (3) the statute of limitations for the taxing authority to examine and challenge the position has expired. Tax benefits associated with an uncertain tax position are derecognized in the period in which the more likely than not recognition threshold is no longer satisfied.
While we believe we have adequately provided for our income tax receivables or liabilities and our deferred tax assets or liabilities, adverse determinations by taxing authorities or changes in tax laws and regulations could have a material adverse effect on our consolidated financial position, results of operations or cash flows.
The table below presents information about certain of our market-sensitive financial instruments at
December 31, 2017
. The fair values were determined based on quoted market prices for the same or similar instruments. The average effective interest rates presented are based on the rate in effect at the reporting date. The effects of unamortized premiums and discounts are excluded from the table.
|
|
Maturity Date, Years Ending December 31,
|
|||||||||||||||||||||||
|
|
2018
|
2019
|
2020
|
2021
|
2022
|
Thereafter
|
Total
|
Fair Value
|
||||||||||||||||
|
|
(Dollars in Millions)
|
|||||||||||||||||||||||
|
Fixed rate long-term debt
|
$
|
146
|
|
$
|
591
|
|
$
|
2,667
|
|
$
|
1,940
|
|
$
|
3,577
|
|
$
|
6,247
|
|
$
|
15,168
|
|
$
|
15,193
|
|
|
Average effective interest rates
|
5.2
|
%
|
5.8
|
%
|
6.2
|
%
|
4.7
|
%
|
8.5
|
%
|
6.2
|
%
|
6.5
|
%
|
|
|
||||||||
At
December 31, 2017
, we had long-term, market-sensitive investments held by our captive insurance subsidiaries. Our market risk associated with our investments in debt securities classified as non-current assets is substantially mitigated by the long-term nature and type of the investments in the portfolio.
We have no affiliation with partnerships, trusts or other entities (sometimes referred to as “special-purpose” or “variable-interest” entities) whose purpose is to facilitate off-balance sheet financial transactions or similar arrangements by us. As a result, we have no exposure to the financing, liquidity, market or credit risks associated with such entities.
We do not hold or issue derivative instruments for trading purposes and are not a party to any instruments with leverage or prepayment features.
93
MANAGEMENT REPORT ON INTERNAL CONTROL OVER FINANCIAL REPORTING
To Our Shareholders:
Management is responsible for establishing and maintaining adequate internal control over financial reporting, as such term is defined in Rule 13a-15(f) under the Securities Exchange Act of 1934, as amended. Management assessed the effectiveness of Tenet’s internal control over financial reporting as of
December 31, 2017
. This assessment was performed under the supervision of and with the participation of management, including the chief executive officer and chief financial officer.
In making this assessment, management used criteria based on the framework in
Internal Control — Integrated Framework (2013)
issued by the Committee of Sponsoring Organizations of the Treadway Commission (“COSO”). Based on the assessment using the COSO framework, management concluded that Tenet’s internal control over financial reporting was effective as of
December 31, 2017
.
Tenet’s internal control over financial reporting as of
December 31, 2017
has been audited by Deloitte & Touche LLP, an independent registered public accounting firm, as stated in their report, which is included herein. Deloitte & Touche LLP has also audited Tenet’s Consolidated Financial Statements as of and for the year ended
December 31, 2017
, and that firm’s audit report on such Consolidated Financial Statements is also included herein.
Internal control over financial reporting cannot provide absolute assurance of achieving financial reporting objectives because of its inherent limitations. Internal control over financial reporting is a process that involves human diligence and compliance and is subject to lapses in judgment and breakdowns resulting from human failures. Internal control over financial reporting also can be circumvented by collusion or improper management override. Because of such limitations, there is a risk that material misstatements may not be prevented or detected on a timely basis by internal control over financial reporting. However, these inherent limitations are known features of the financial reporting process. Therefore, it is possible to design into the process safeguards to reduce, though not eliminate, this risk.
|
/s/ RONALD A. RITTENMEYER
|
/s/ DANIEL J. CANCELMI
|
|
Ronald A. Rittenmeyer
|
Daniel J. Cancelmi
|
|
Executive Chairman and Chief Executive Officer
|
Chief Financial Officer
|
|
February 26, 2018
|
February 26, 2018
|
94
REPORT OF INDEPENDENT REGISTERED PUBLIC ACCOUNTING FIRM
To the Board of Directors and Stockholders of
Tenet Healthcare Corporation
Dallas, Texas
Opinion on Internal Control over Financial Reporting
We have audited the internal control over financial reporting of Tenet Healthcare Corporation and subsidiaries (the “Company”) as of
December 31, 2017
, based on criteria established in
Internal Control - Integrated Framework (2013)
issued by the Committee of Sponsoring Organizations of the Treadway Commission (COSO). In our opinion, the Company maintained, in all material respects, effective internal control over financial reporting as of
December 31, 2017
, based on criteria established in
Internal Control - Integrated Framework (2013)
issued by COSO.
We have also audited, in accordance with the standards of the Public Company Accounting Oversight Board (United States) (PCAOB), the consolidated financial statements and financial statement schedule as of and for the year ended
December 31, 2017
, of the Company and our report dated
February 26, 2018
, expressed an unqualified opinion on those financial statements.
Basis for Opinion
The Company’s management is responsible for maintaining effective internal control over financial reporting and for its assessment of the effectiveness of internal control over financial reporting, included in the accompanying Management’s Report on Internal Control over Financial Reporting. Our responsibility is to express an opinion on the Company’s internal control over financial reporting based on our audit. We are a public accounting firm registered with the PCAOB and are required to be independent with respect to the Company in accordance with the U.S. federal securities laws and the applicable rules and regulations of the Securities and Exchange Commission and the PCAOB.
We conducted our audit in accordance with the standards of the PCAOB. Those standards require that we plan and perform the audit to obtain reasonable assurance about whether effective internal control over financial reporting was maintained in all material respects. Our audit included obtaining an understanding of internal control over financial reporting, assessing the risk that a material weakness exists, testing and evaluating the design and operating effectiveness of internal control based on the assessed risk, and performing such other procedures as we considered necessary in the circumstances. We believe that our audit provides a reasonable basis for our opinion.
Definition and Limitations of Internal Control over Financial Reporting
A company’s internal control over financial reporting is a process designed to provide reasonable assurance regarding the reliability of financial reporting and the preparation of financial statements for external purposes in accordance with generally accepted accounting principles. A company’s internal control over financial reporting includes those policies and procedures that (1) pertain to the maintenance of records that, in reasonable detail, accurately and fairly reflect the transactions and dispositions of the assets of the company; (2) provide reasonable assurance that transactions are recorded as necessary to permit preparation of financial statements in accordance with generally accepted accounting principles, and that receipts and expenditures of the company are being made only in accordance with authorizations of management and directors of the company; and (3) provide reasonable assurance regarding prevention or timely detection of unauthorized acquisition, use, or disposition of the company’s assets that could have a material effect on the financial statements.
Because of its inherent limitations, internal control over financial reporting may not prevent or detect misstatements. Also, projections of any evaluation of effectiveness to future periods are subject to the risk that controls may become inadequate because of changes in conditions, or that the degree of compliance with the policies or procedures may deteriorate.
/s/ Deloitte & Touche LLP
Dallas, Texas
February 26, 2018
95
REPORT OF INDEPENDENT REGISTERED PUBLIC ACCOUNTING FIRM
To the Board of Directors and Stockholders of
Tenet Healthcare Corporation
Dallas, Texas
We have audited the accompanying consolidated balance sheets of Tenet Healthcare Corporation and subsidiaries (the “Company”) as of
December 31, 2017
and
2016
, and the related consolidated statements of operations, comprehensive income (loss), changes in equity, and cash flows for each of the three years in the period ended
December 31, 2017
, and the related notes and the consolidated financial statement schedule listed in the Index at Item 15 (collectively referred to as the “financial statements”). In our opinion, the financial statements present fairly, in all material respects, the financial position of the Company as of
December 31, 2017
and
2016
, and the results of its operations and its cash flows for each of the three years in the period ended
December 31, 2017
, in conformity with accounting principles generally accepted in the United States of America.
We have also audited, in accordance with the standards of the Public Company Accounting Oversight Board (United States) (PCAOB), the Company’s internal control over financial reporting as of
December 31, 2017
, based on criteria established in
Internal Control - Integrated Framework (2013)
issued by the Committee of Sponsoring Organizations of the Treadway Commission and our report dated
February 26, 2018
, expressed an unqualified opinion on the Company’s internal control over financial reporting.
Basis for Opinion
These financial statements are the responsibility of the Company’s management. Our responsibility is to express an opinion on the Company’s financial statements based on our audits. We are a public accounting firm registered with the PCAOB and are required to be independent with respect to the Company in accordance with the U.S. federal securities laws and the applicable rules and regulations of the Securities and Exchange Commission and the PCAOB.
We conducted our audits in accordance with the standards of the PCAOB. Those standards require that we plan and perform the audit to obtain reasonable assurance about whether the financial statements are free of material misstatement, whether due to error or fraud. Our audits included performing procedures to assess the risks of material misstatement of the financial statements, whether due to error or fraud, and performing procedures that respond to those risks. Such procedures included examining, on a test basis, evidence regarding the amounts and disclosures in the financial statements. Our audits also included evaluating the accounting principles used and significant estimates made by management, as well as evaluating the overall presentation of the financial statements. We believe that our audits provide a reasonable basis for our opinion.
/s/ Deloitte & Touche LLP
Dallas, Texas
February 26, 2018
We have served as the Company’s auditor since 2007.
96
CONSOLIDATED BALANCE SHEETS
Dollars in Millions
|
|
December 31,
|
December 31,
|
|||||
|
2017
|
2016
|
||||||
|
ASSETS
|
|
|
|
|
|||
|
Current assets:
|
|
|
|
|
|||
|
Cash and cash equivalents
|
$
|
611
|
|
$
|
716
|
|
|
|
Accounts receivable, less allowance for doubtful accounts ($898 at December 31, 2017 and $1,031 at December 31, 2016)
|
2,616
|
|
2,897
|
|
|||
|
Inventories of supplies, at cost
|
289
|
|
326
|
|
|||
|
Income tax receivable
|
5
|
|
4
|
|
|||
|
Assets held for sale
|
1,017
|
|
29
|
|
|||
|
Other current assets
|
1,035
|
|
1,285
|
|
|||
|
Total current assets
|
5,573
|
|
5,257
|
|
|||
|
Investments and other assets
|
1,543
|
|
1,250
|
|
|||
|
Deferred income taxes
|
455
|
|
871
|
|
|||
|
Property and equipment, at cost, less accumulated depreciation and amortization ($4,739 at December 31, 2017 and $4,974 at December 31, 2016)
|
7,030
|
|
8,053
|
|
|||
|
Goodwill
|
7,018
|
|
7,425
|
|
|||
|
Other intangible assets, at cost, less accumulated amortization ($883 at December 31, 2017 and $772 at December 31, 2016)
|
1,766
|
|
1,845
|
|
|||
|
Total assets
|
$
|
23,385
|
|
$
|
24,701
|
|
|
|
LIABILITIES AND EQUITY
|
|
|
|
|
|||
|
Current liabilities:
|
|
|
|
|
|||
|
Current portion of long-term debt
|
$
|
146
|
|
$
|
191
|
|
|
|
Accounts payable
|
1,175
|
|
1,329
|
|
|||
|
Accrued compensation and benefits
|
848
|
|
872
|
|
|||
|
Professional and general liability reserves
|
200
|
|
181
|
|
|||
|
Accrued interest payable
|
256
|
|
210
|
|
|||
|
Liabilities held for sale
|
480
|
|
9
|
|
|||
|
Other current liabilities
|
1,227
|
|
1,242
|
|
|||
|
Total current liabilities
|
4,332
|
|
4,034
|
|
|||
|
Long-term debt, net of current portion
|
14,791
|
|
15,064
|
|
|||
|
Professional and general liability reserves
|
654
|
|
613
|
|
|||
|
Defined benefit plan obligations
|
536
|
|
626
|
|
|||
|
Deferred income taxes
|
36
|
|
279
|
|
|||
|
Other long-term liabilities
|
631
|
|
610
|
|
|||
|
Total liabilities
|
20,980
|
|
21,226
|
|
|||
|
Commitments and contingencies
|
|
|
|
|
|||
|
Redeemable noncontrolling interests in equity of consolidated subsidiaries
|
1,866
|
|
2,393
|
|
|||
|
Equity:
|
|
|
|
|
|||
|
Shareholders’ equity:
|
|
|
|
|
|||
|
Common stock, $0.05 par value; authorized 262,500,000 shares; 149,384,952 shares issued at December 31, 2017 and 148,106,249 shares issued at December 31, 2016
|
7
|
|
7
|
|
|||
|
Additional paid-in capital
|
4,859
|
|
4,827
|
|
|||
|
Accumulated other comprehensive loss
|
(204
|
)
|
(258
|
)
|
|||
|
Accumulated deficit
|
(2,390
|
)
|
(1,742
|
)
|
|||
|
Common stock in treasury, at cost, 48,413,169 shares at December 31, 2017 and 48,420,650 shares at December 31, 2016
|
(2,419
|
)
|
(2,417
|
)
|
|||
|
Total shareholders’ equity (deficit)
|
(147
|
)
|
417
|
|
|||
|
Noncontrolling interests
|
686
|
|
665
|
|
|||
|
Total equity
|
539
|
|
1,082
|
|
|||
|
Total liabilities and equity
|
$
|
23,385
|
|
$
|
24,701
|
|
|
See accompanying Notes to Consolidated Financial Statements.
97
Dollars in Millions, Except Per-Share Amounts
|
|
Years Ended December 31,
|
||||||||||
|
|
2017
|
2016
|
2015
|
||||||||
|
Net operating revenues:
|
|
|
|
|
|
|
|||||
|
Net operating revenues before provision for doubtful accounts
|
$
|
20,613
|
|
$
|
21,070
|
|
$
|
20,111
|
|
||
|
Less: Provision for doubtful accounts
|
1,434
|
|
1,449
|
|
1,477
|
|
|||||
|
Net operating revenues
|
19,179
|
|
19,621
|
|
18,634
|
|
|||||
|
Equity in earnings of unconsolidated affiliates
|
144
|
|
131
|
|
99
|
|
|||||
|
Operating expenses:
|
|
|
|
|
|
|
|||||
|
Salaries, wages and benefits
|
9,274
|
|
9,328
|
|
8,990
|
|
|||||
|
Supplies
|
3,085
|
|
3,124
|
|
2,963
|
|
|||||
|
Other operating expenses, net
|
4,570
|
|
4,891
|
|
4,555
|
|
|||||
|
Electronic health record incentives
|
(9
|
)
|
(32
|
)
|
(72
|
)
|
|||||
|
Depreciation and amortization
|
870
|
|
850
|
|
797
|
|
|||||
|
Impairment and restructuring charges, and acquisition-related costs
|
541
|
|
202
|
|
318
|
|
|||||
|
Litigation and investigation costs
|
23
|
|
293
|
|
291
|
|
|||||
|
Gains on sales, consolidation and deconsolidation of facilities
|
(144
|
)
|
(151
|
)
|
(186
|
)
|
|||||
|
Operating income
|
1,113
|
|
1,247
|
|
1,077
|
|
|||||
|
Interest expense
|
(1,028
|
)
|
(979
|
)
|
(912
|
)
|
|||||
|
Other non-operating expense, net
|
(22
|
)
|
(20
|
)
|
(20
|
)
|
|||||
|
Loss from early extinguishment of debt
|
(164
|
)
|
—
|
|
(1
|
)
|
|||||
|
Income (loss) from continuing operations, before income taxes
|
(101
|
)
|
248
|
|
144
|
|
|||||
|
Income tax expense
|
(219
|
)
|
(67
|
)
|
(68
|
)
|
|||||
|
Income (loss) from continuing operations, before discontinued operations
|
(320
|
)
|
181
|
|
76
|
|
|||||
|
Discontinued operations:
|
|
|
|
|
|
|
|||||
|
Loss from operations
|
—
|
|
(6
|
)
|
(5
|
)
|
|||||
|
Litigation and investigation benefit
|
—
|
|
—
|
|
8
|
|
|||||
|
Income tax benefit (expense)
|
—
|
|
1
|
|
(1
|
)
|
|||||
|
Income (loss) from discontinued operations
|
—
|
|
(5
|
)
|
2
|
|
|||||
|
Net income (loss)
|
(320
|
)
|
176
|
|
78
|
|
|||||
|
Less: Net income attributable to noncontrolling interests
|
384
|
|
368
|
|
218
|
|
|||||
|
Net loss attributable to Tenet Healthcare Corporation common shareholders
|
$
|
(704
|
)
|
$
|
(192
|
)
|
$
|
(140
|
)
|
||
|
Amounts available (attributable) to Tenet Healthcare Corporation common shareholders
|
|
|
|
|
|
|
|||||
|
Loss from continuing operations, net of tax
|
$
|
(704
|
)
|
$
|
(187
|
)
|
$
|
(142
|
)
|
||
|
Income (loss) from discontinued operations, net of tax
|
—
|
|
(5
|
)
|
2
|
|
|||||
|
Net loss attributable to Tenet Healthcare Corporation common shareholders
|
$
|
(704
|
)
|
$
|
(192
|
)
|
$
|
(140
|
)
|
||
|
Earnings (loss) per share available (attributable) to Tenet Healthcare Corporation common shareholders:
|
|
|
|
|
|
|
|||||
|
Basic
|
|
|
|
|
|
|
|||||
|
Continuing operations
|
$
|
(7.00
|
)
|
$
|
(1.88
|
)
|
$
|
(1.43
|
)
|
||
|
Discontinued operations
|
—
|
|
(0.05
|
)
|
0.02
|
|
|||||
|
|
$
|
(7.00
|
)
|
$
|
(1.93
|
)
|
$
|
(1.41
|
)
|
||
|
Diluted
|
|
|
|
|
|
|
|||||
|
Continuing operations
|
$
|
(7.00
|
)
|
$
|
(1.88
|
)
|
$
|
(1.43
|
)
|
||
|
Discontinued operations
|
—
|
|
(0.05
|
)
|
0.02
|
|
|||||
|
|
$
|
(7.00
|
)
|
$
|
(1.93
|
)
|
$
|
(1.41
|
)
|
||
|
Weighted average shares and dilutive securities outstanding (in thousands):
|
|
|
|
|
|
|
|||||
|
Basic
|
100,592
|
|
99,321
|
|
99,167
|
|
|||||
|
Diluted
|
100,592
|
|
99,321
|
|
99,167
|
|
|||||
See accompanying Notes to Consolidated Financial Statements.
98
CONSOLIDATED STATEMENTS OF OTHER COMPREHENSIVE INCOME (LOSS)
Dollars in Millions
|
|
Years Ended December 31,
|
||||||||||
|
|
2017
|
2016
|
2015
|
||||||||
|
Net income (loss)
|
$
|
(320
|
)
|
$
|
176
|
|
$
|
78
|
|
||
|
Other comprehensive income (loss):
|
|
|
|
|
|
|
|||||
|
Adjustments for defined benefit plans
|
42
|
|
(73
|
)
|
3
|
|
|||||
|
Amortization of net actuarial loss included in other non-operating expense, net
|
14
|
|
12
|
|
12
|
|
|||||
|
Unrealized gains (losses) on securities held as available-for-sale
|
6
|
|
2
|
|
(2
|
)
|
|||||
|
Foreign currency translation adjustments
|
15
|
|
(53
|
)
|
5
|
|
|||||
|
Other comprehensive income (loss) before income taxes
|
77
|
|
(112
|
)
|
18
|
|
|||||
|
Income tax benefit (expense) related to items of other comprehensive income (loss)
|
(23
|
)
|
18
|
|
—
|
|
|||||
|
Total other comprehensive income (loss), net of tax
|
54
|
|
(94
|
)
|
18
|
|
|||||
|
Comprehensive net income (loss)
|
(266
|
)
|
82
|
|
96
|
|
|||||
|
Less: Comprehensive income attributable to noncontrolling interests
|
384
|
|
368
|
|
218
|
|
|||||
|
Comprehensive loss attributable to Tenet Healthcare Corporation common shareholders
|
$
|
(650
|
)
|
$
|
(286
|
)
|
$
|
(122
|
)
|
||
See accompanying Notes to Consolidated Financial Statements.
99
CONSOLIDATED STATEMENTS OF CHANGES IN EQUITY
Dollars in Millions,
Share Amounts in Thousands
|
|
Tenet Healthcare Corporation Shareholders’ Equity
|
|
|
||||||||||||||||||||||||||||
|
|
Common Stock
|
Additional
Paid-in
Capital
|
Accumulated
Other
Comprehensive
Loss
|
Accumulated
Deficit
|
Treasury
Stock
|
Noncontrolling
Interests
|
Total Equity
|
||||||||||||||||||||||||
|
|
Shares
Outstanding
|
Issued Par
Amount
|
|||||||||||||||||||||||||||||
|
Balances at December 31, 2014
|
98,382
|
|
$
|
7
|
|
$
|
4,614
|
|
$
|
(182
|
)
|
$
|
(1,410
|
)
|
$
|
(2,378
|
)
|
$
|
134
|
|
$
|
785
|
|
||||||||
|
Net income (loss)
|
—
|
|
—
|
|
—
|
|
—
|
|
(140
|
)
|
—
|
|
52
|
|
(88
|
)
|
|||||||||||||||
|
Distributions paid to noncontrolling interests
|
—
|
|
—
|
|
—
|
|
—
|
|
—
|
|
—
|
|
(50
|
)
|
(50
|
)
|
|||||||||||||||
|
Contributions from noncontrolling interests
|
—
|
|
—
|
|
—
|
|
—
|
|
—
|
|
—
|
|
3
|
|
3
|
|
|||||||||||||||
|
Other comprehensive income
|
—
|
|
—
|
|
—
|
|
18
|
|
—
|
|
—
|
|
—
|
|
18
|
|
|||||||||||||||
|
Purchases (sales) of businesses and noncontrolling interests
|
—
|
|
—
|
|
124
|
|
—
|
|
—
|
|
—
|
|
128
|
|
252
|
|
|||||||||||||||
|
Repurchases of common stock
|
(1,243
|
)
|
—
|
|
—
|
|
—
|
|
—
|
|
(40
|
)
|
—
|
|
(40
|
)
|
|||||||||||||||
|
Stock-based compensation expense and issuance of common stock
|
1,356
|
|
—
|
|
77
|
|
—
|
|
—
|
|
1
|
|
—
|
|
78
|
|
|||||||||||||||
|
Balances at December 31, 2015
|
98,495
|
|
7
|
|
4,815
|
|
(164
|
)
|
(1,550
|
)
|
(2,417
|
)
|
267
|
|
958
|
|
|||||||||||||||
|
Net income (loss)
|
—
|
|
—
|
|
—
|
|
—
|
|
(192
|
)
|
—
|
|
138
|
|
(54
|
)
|
|||||||||||||||
|
Distributions paid to noncontrolling interests
|
—
|
|
—
|
|
—
|
|
—
|
|
—
|
|
—
|
|
(111
|
)
|
(111
|
)
|
|||||||||||||||
|
Other comprehensive loss
|
—
|
|
—
|
|
—
|
|
(94
|
)
|
—
|
|
—
|
|
—
|
|
(94
|
)
|
|||||||||||||||
|
Purchases (sales) of businesses and noncontrolling interests
|
—
|
|
—
|
|
(40
|
)
|
—
|
|
—
|
|
—
|
|
146
|
|
106
|
|
|||||||||||||||
|
Purchase accounting adjustments
|
—
|
|
—
|
|
—
|
|
—
|
|
—
|
|
—
|
|
225
|
|
225
|
|
|||||||||||||||
|
Stock-based compensation expense, tax benefit and issuance of common stock
|
1,191
|
|
—
|
|
52
|
|
—
|
|
—
|
|
—
|
|
—
|
|
52
|
|
|||||||||||||||
|
Balances at December 31, 2016
|
99,686
|
|
7
|
|
4,827
|
|
(258
|
)
|
(1,742
|
)
|
(2,417
|
)
|
665
|
|
1,082
|
|
|||||||||||||||
|
Net income (loss)
|
—
|
|
—
|
|
—
|
|
—
|
|
(704
|
)
|
—
|
|
145
|
|
(559
|
)
|
|||||||||||||||
|
Distributions paid to noncontrolling interests
|
—
|
|
—
|
|
—
|
|
—
|
|
—
|
|
—
|
|
(123
|
)
|
(123
|
)
|
|||||||||||||||
|
Other comprehensive income
|
—
|
|
—
|
|
—
|
|
54
|
|
—
|
|
—
|
|
—
|
|
54
|
|
|||||||||||||||
|
Accretion of redeemable noncontrolling interests
|
—
|
|
—
|
|
(33
|
)
|
—
|
|
—
|
|
—
|
|
—
|
|
(33
|
)
|
|||||||||||||||
|
Purchases (sales) of businesses and noncontrolling interests
|
—
|
|
—
|
|
4
|
|
—
|
|
—
|
|
—
|
|
(1
|
)
|
3
|
|
|||||||||||||||
|
Cumulative effect of accounting change
|
—
|
|
—
|
|
—
|
|
—
|
|
56
|
|
—
|
|
—
|
|
56
|
|
|||||||||||||||
|
Stock-based compensation expense, tax benefit and issuance of common stock
|
1,286
|
|
—
|
|
61
|
|
—
|
|
—
|
|
(2
|
)
|
—
|
|
59
|
|
|||||||||||||||
|
Balances at December 31, 2017
|
$
|
100,972
|
|
$
|
7
|
|
$
|
4,859
|
|
$
|
(204
|
)
|
$
|
(2,390
|
)
|
$
|
(2,419
|
)
|
$
|
686
|
|
$
|
539
|
|
|||||||
See accompanying Notes to Consolidated Financial Statements.
100
Dollars in Millions
|
|
Years Ended December 31,
|
||||||||||
|
|
2017
|
2016
|
2015
|
||||||||
|
Net income (loss)
|
$
|
(320
|
)
|
$
|
176
|
|
$
|
78
|
|
||
|
Adjustments to reconcile net income (loss) to net cash provided by operating activities:
|
|
|
|
|
|
|
|||||
|
Depreciation and amortization
|
870
|
|
850
|
|
797
|
|
|||||
|
Provision for doubtful accounts
|
1,434
|
|
1,449
|
|
1,477
|
|
|||||
|
Deferred income tax expense
|
200
|
|
41
|
|
42
|
|
|||||
|
Stock-based compensation expense
|
59
|
|
68
|
|
69
|
|
|||||
|
Impairment and restructuring charges, and acquisition-related costs
|
541
|
|
202
|
|
318
|
|
|||||
|
Litigation and investigation costs
|
23
|
|
293
|
|
291
|
|
|||||
|
Gains on sales, consolidation and deconsolidation of facilities
|
(144
|
)
|
(151
|
)
|
(186
|
)
|
|||||
|
Loss from early extinguishment of debt
|
164
|
|
—
|
|
1
|
|
|||||
|
Equity in earnings of unconsolidated affiliates, net of distributions received
|
(18
|
)
|
(13
|
)
|
(99
|
)
|
|||||
|
Amortization of debt discount and debt issuance costs
|
44
|
|
41
|
|
41
|
|
|||||
|
Pre-tax (income) loss from discontinued operations
|
—
|
|
6
|
|
(3
|
)
|
|||||
|
Other items, net
|
(18
|
)
|
(1
|
)
|
59
|
|
|||||
|
Changes in cash from operating assets and liabilities:
|
|
|
|
|
|
|
|||||
|
Accounts receivable
|
(1,448
|
)
|
(1,604
|
)
|
(1,632
|
)
|
|||||
|
Inventories and other current assets
|
(35
|
)
|
(83
|
)
|
(130
|
)
|
|||||
|
Income taxes
|
(38
|
)
|
(8
|
)
|
18
|
|
|||||
|
Accounts payable, accrued expenses and other current liabilities
|
(10
|
)
|
(51
|
)
|
68
|
|
|||||
|
Other long-term liabilities
|
26
|
|
40
|
|
38
|
|
|||||
|
Payments for restructuring charges, acquisition-related costs, and litigation costs and settlements
|
(125
|
)
|
(691
|
)
|
(200
|
)
|
|||||
|
Net cash used in operating activities from discontinued operations, excluding income taxes
|
(5
|
)
|
(6
|
)
|
(21
|
)
|
|||||
|
Net cash provided by operating activities
|
1,200
|
|
558
|
|
1,026
|
|
|||||
|
Cash flows from investing activities:
|
|
|
|
|
|
|
|||||
|
Purchases of property and equipment — continuing operations
|
(707
|
)
|
(875
|
)
|
(842
|
)
|
|||||
|
Purchases of businesses or joint venture interests, net of cash acquired
|
(50
|
)
|
(117
|
)
|
(940
|
)
|
|||||
|
Proceeds from sales of facilities and other assets
|
827
|
|
573
|
|
549
|
|
|||||
|
Proceeds from sales of marketable securities, long-term investments and other assets
|
36
|
|
62
|
|
60
|
|
|||||
|
Purchases of equity investments
|
(68
|
)
|
(39
|
)
|
(134
|
)
|
|||||
|
Other long-term assets
|
(10
|
)
|
(31
|
)
|
(4
|
)
|
|||||
|
Other items, net
|
(7
|
)
|
(3
|
)
|
(6
|
)
|
|||||
|
Net cash provided by (used in) investing activities
|
21
|
|
(430
|
)
|
(1,317
|
)
|
|||||
|
Cash flows from financing activities:
|
|
|
|
|
|
|
|||||
|
Repayments of borrowings under credit facility
|
(970
|
)
|
(1,895
|
)
|
(2,815
|
)
|
|||||
|
Proceeds from borrowings under credit facility
|
970
|
|
1,895
|
|
2,595
|
|
|||||
|
Repayments of other borrowings
|
(4,139
|
)
|
(154
|
)
|
(2,049
|
)
|
|||||
|
Proceeds from other borrowings
|
3,795
|
|
760
|
|
3,158
|
|
|||||
|
Repurchases of common stock
|
—
|
|
—
|
|
(40
|
)
|
|||||
|
Debt issuance costs
|
(62
|
)
|
(12
|
)
|
(80
|
)
|
|||||
|
Distributions paid to noncontrolling interests
|
(258
|
)
|
(218
|
)
|
(110
|
)
|
|||||
|
Proceeds from sale of noncontrolling interests
|
31
|
|
22
|
|
11
|
|
|||||
|
Purchases of noncontrolling interests
|
(729
|
)
|
(186
|
)
|
(268
|
)
|
|||||
|
Proceeds from exercise of stock options and employee stock purchase plan
|
7
|
|
4
|
|
15
|
|
|||||
|
Other items, net
|
29
|
|
16
|
|
37
|
|
|||||
|
Net cash provided by (used in) financing activities
|
(1,326
|
)
|
232
|
|
454
|
|
|||||
|
Net increase (decrease) in cash and cash equivalents
|
(105
|
)
|
360
|
|
163
|
|
|||||
|
Cash and cash equivalents at beginning of period
|
716
|
|
356
|
|
193
|
|
|||||
|
Cash and cash equivalents at end of period
|
$
|
611
|
|
$
|
716
|
|
$
|
356
|
|
||
|
Supplemental disclosures:
|
|
|
|
|
|
|
|||||
|
Interest paid, net of capitalized interest
|
$
|
(939
|
)
|
$
|
(932
|
)
|
$
|
(859
|
)
|
||
|
Income tax payments, net
|
$
|
(56
|
)
|
$
|
(33
|
)
|
$
|
(7
|
)
|
||
See accompanying Notes to Consolidated Financial Statements.
101
NOTES TO CONSOLIDATED FINANCIAL STATEMENTS
Description of Business
Tenet Healthcare Corporation (together with our subsidiaries, referred to herein as “Tenet,” “we” or “us”) is a diversified healthcare services company. At
December 31, 2017
, we operated
76
hospitals (
two
of which we have since divested),
20
surgical hospitals, and over
470
outpatient centers in the United States, as well as
nine
facilities in the United Kingdom through our subsidiaries, partnerships and joint ventures, including USPI Holding Company, Inc. (“USPI joint venture”). We hold noncontrolling interests in
121
of these facilities, which are recorded using the equity method of accounting. Our Conifer Holdings, Inc. (“Conifer”) subsidiary provides healthcare business process services in the areas of hospital and physician revenue cycle management and value-based care solutions to healthcare systems, as well as individual hospitals, physician practices, self-insured organizations, health plans and other entities.
Effective June 16, 2015, we completed the transaction that combined our freestanding ambulatory surgery and imaging center assets with the surgical facility assets of United Surgical Partners International, Inc. (“USPI”) into our new USPI joint venture. We contributed our interests in
49
ambulatory surgery centers and
20
imaging centers, which had previously been included in our Hospital Operations and other segment, to the joint venture. We also refinanced approximately
$1.5 billion
of existing USPI debt and paid approximately
$424 million
to align the respective valuations of the assets contributed to the joint venture. In April 2016, we paid approximately
$127 million
to purchase additional shares, which increased our ownership interest in the USPI joint venture from
50.1%
to approximately
56.3%
. In July 2017, we paid approximately
$716 million
for the purchase of additional shares and the final adjustment to the 2016 purchase price, which increased our ownership interest in the USPI joint venture to
80.0%
. In addition, we completed the acquisition of European Surgical Partners Ltd. (“Aspen”) for approximately
$226 million
on June 16, 2015. Aspen has
nine
private hospitals and clinics in the United Kingdom, which are classified as held for sale in the accompanying Consolidated Balance Sheet at
December 31, 2017
as further discussed in Note 4.
Basis of Presentation
Our Consolidated Financial Statements include the accounts of Tenet and its wholly owned and majority-owned subsidiaries. We eliminate intercompany accounts and transactions in consolidation, and we include the results of operations of businesses that are newly acquired in purchase transactions from their dates of acquisition. We account for significant investments in other affiliated companies using the equity method. Unless otherwise indicated, all financial and statistical data included in these notes to our Consolidated Financial Statements relate to our continuing operations, with dollar amounts expressed in millions (except per-share amounts).
Effective January 1, 2017, we adopted Financial Accounting Standards Board (“FASB”) Accounting Standards Update (“ASU”) 2016-09, “Compensation-Stock Compensation (Topic 718) Improvements to Employee Share-Based Payment Accounting” (“ASU 2016-09”), which affects all entities that issue share-based payment awards to their employees. The guidance in ASU 2016-09 simplifies several aspects of the accounting for share-based payment transactions, including the income tax consequences, classification of awards as either equity or liabilities, and classification on the statement of cash flows. Upon adoption of ASU 2016-09, we recorded previously unrecognized excess tax benefits of approximately
$56 million
as a deferred tax asset and a cumulative effect adjustment to retained earnings as of January 1, 2017. Prospectively, all excess tax benefits and deficiencies will be recognized as income tax benefit or expense in our consolidated statement of operations when awards vest.
Also effective January 1, 2017, we early adopted ASU 2017-07, “Compensation-Retirement Benefits (Topic 715) Improving the Presentation of Net Periodic Pension Cost and Net Periodic Postretirement Benefit Cost” (“ASU 2017-07”), which the FASB issued in March 2017. The amendments in ASU 2017-07 apply to all employers that offer to their employees defined benefit pension plans, other postretirement benefit plans, or other types of benefits accounted for under Topic 715 of the FASB Accounting Standards Codification. The guidance in ASU 2017-07 requires that an employer report the service cost component in the same line item or items as other compensation costs arising from services rendered by the pertinent employees during the period. The other components of net benefit cost are required to be presented in the statement of operations separately from the service cost component and outside a subtotal of income from operations. The line item or items used in the statement of operations to present the other components of net benefit cost must be disclosed. The amendments in ASU 2017-07 must be applied retrospectively for the presentation of the service cost component and the other components of net periodic pension cost and net periodic postretirement benefit cost in the statement of operations. As a result of the adoption of ASU 2017-07, we reclassified approximately
$28 million
and
$21 million
of net benefit cost from salaries, wages and
102
benefits expense to other non-operating expense, net, in the accompanying Consolidated Statements of Operations for the years ended
December 31, 2016
and
2015
, respectively, and approximately
$31 million
of other components of net benefit cost are included in other non-operating expense, net, in the accompanying Consolidated Statement of Operations for the year ended
December 31, 2017
.
Certain prior-year amounts have also been reclassified to conform to current-year presentation, primarily due to the adoption of ASU 2017-07 as described above.
Use of Estimates
The preparation of financial statements, in conformity with accounting principles generally accepted in the United States of America (“GAAP”), requires us to make estimates and assumptions that affect the amounts reported in our Consolidated Financial Statements and these accompanying notes. We regularly evaluate the accounting policies and estimates we use. In general, we base the estimates on historical experience and on assumptions that we believe to be reasonable given the particular circumstances in which we operate. Although we believe all adjustments considered necessary for a fair presentation have been included, actual results may vary from those estimates. Financial and statistical information we report to other regulatory agencies may be prepared on a basis other than GAAP or using different assumptions or reporting periods and, therefore, may vary from amounts presented herein. Although we make every effort to ensure that the information we report to those agencies is accurate, complete and consistent with applicable reporting guidelines, we cannot be responsible for the accuracy of the information they make available to the public.
Translation of Foreign Currencies
The accounts of Aspen were measured in its local currency (the pound sterling) and then translated into U.S. dollars. All assets and liabilities were translated using the current rate of exchange at the balance sheet date. Results of operations were translated using the average rates prevailing throughout the period of operations. Translation gains or losses resulting from changes in exchange rates are accumulated in shareholders’ equity.
Net Operating Revenues Before Provision for Doubtful Accounts
We recognize net operating revenues before provision for doubtful accounts in the period in which our services are performed. Net operating revenues before provision for doubtful accounts primarily consist of net patient service revenues that are recorded based on established billing rates (i.e., gross charges), less estimated discounts for contractual and other allowances, principally for patients covered by Medicare, Medicaid, managed care and other health plans, as well as certain uninsured patients under our
Compact with Uninsured Patients
(“Compact”) and other uninsured discount and charity programs.
Gross charges are retail charges. They are not the same as actual pricing, and they generally do not reflect what a hospital is ultimately paid and, therefore, are not displayed in our consolidated statements of operations. Hospitals are typically paid amounts that are negotiated with insurance companies or are set by the government. Gross charges are used to calculate Medicare outlier payments and to determine certain elements of payment under managed care contracts (such as stop-loss payments). Because Medicare requires that a hospital’s gross charges be the same for all patients (regardless of payer category), gross charges are what hospitals charge all patients prior to the application of discounts and allowances.
Revenues under the traditional fee-for-service Medicare and Medicaid programs are based primarily on prospective payment systems. Retrospectively determined cost-based revenues under these programs, which were more prevalent in earlier periods, and certain other payments, such as Indirect Medical Education, Direct Graduate Medical Education, disproportionate share hospital and bad debt expense reimbursement, which are based on our hospitals’ cost reports, are estimated using historical trends and current factors. Cost report settlements under these programs are subject to audit by Medicare and Medicaid auditors and administrative and judicial review, and it can take several years until final settlement of such matters is determined and completely resolved. Because the laws, regulations, instructions and rule interpretations governing Medicare and Medicaid reimbursement are complex and change frequently, the estimates recorded by us could change by material amounts.
We have a system and estimation process for recording Medicare net patient revenue and estimated cost report settlements. This results in us recording accruals to reflect the expected final settlements on our cost reports. For filed cost reports, we record the accrual based on those cost reports and subsequent activity, and record a valuation allowance against those cost reports based on historical settlement trends. The accrual for periods for which a cost report is yet to be filed is recorded based on estimates of what we expect to report on the filed cost reports, and a corresponding valuation allowance is
103
recorded as previously described. Cost reports generally must be filed within
five
months after the end of the annual cost reporting period. After the cost report is filed, the accrual and corresponding valuation allowance may need to be adjusted. Adjustments for prior-year cost reports and related valuation allowances, principally related to Medicare and Medicaid, increased revenues in the years ended
December 31, 2017
,
2016
and
2015
by
$35 million
,
$54 million
, and
$64 million
, respectively. Estimated cost report settlements and valuation allowances are included in accounts receivable in the accompanying Consolidated Balance Sheets (see Note 3). We believe that we have made adequate provision for any adjustments that may result from final determination of amounts earned under all the above arrangements with Medicare and Medicaid.
Revenues under managed care plans are based primarily on payment terms involving predetermined rates per diagnosis, per-diem rates, discounted fee-for-service rates and/or other similar contractual arrangements. These revenues are also subject to review and possible audit by the payers, which can take several years before they are completely resolved. The payers are billed for patient services on an individual patient basis. An individual patient’s bill is subject to adjustment on a patient-by-patient basis in the ordinary course of business by the payers following their review and adjudication of each particular bill. We estimate the discounts for contractual allowances at the individual hospital level utilizing billing data on an individual patient basis. At the end of each month, on an individual hospital basis, we estimate our expected reimbursement for patients of managed care plans based on the applicable contract terms. Contractual allowance estimates are periodically reviewed for accuracy by taking into consideration known contract terms as well as payment history. Although we do not separately accumulate and disclose the aggregate amount of adjustments to the estimated reimbursement for every patient bill, we believe our estimation and review process enables us to identify instances on a timely basis where such estimates need to be revised. We do not believe there were any adjustments to estimates of patient bills that were material to our revenues. In addition, on a corporate-wide basis, we do not record any general provision for adjustments to estimated contractual allowances for managed care plans. Managed care accounts, net of contractual allowances recorded, are further reduced to their net realizable value through provision for doubtful accounts based on historical collection trends for these payers and other factors that affect the estimation process.
We know of no claims, disputes or unsettled matters with any payer that would materially affect our revenues for which we have not adequately provided for in the accompanying Consolidated Financial Statements.
Under our Compact or other uninsured discount programs, the discount offered to certain uninsured patients is recognized as a contractual allowance, which reduces net operating revenues at the time the self-pay accounts are recorded. The uninsured patient accounts, net of contractual allowances recorded, are further reduced to their net realizable value through provision for doubtful accounts based on historical collection trends for self-pay accounts and other factors that affect the estimation process.
We also provide charity care to patients who are financially unable to pay for the healthcare services they receive. Most patients who qualify for charity care are charged a per-diem amount for services received, subject to a cap. Except for the per-diem amounts, our policy is not to pursue collection of amounts determined to qualify as charity care; therefore, we do not report these amounts in net operating revenues or in provision for doubtful accounts. Patient advocates from Conifer’s Medical Eligibility Program screen patients in the hospital to determine whether those patients meet eligibility requirements for financial assistance programs. They also expedite the process of applying for these government programs.
The following table shows the sources of net operating revenues before provision for doubtful accounts from continuing operations:
104
|
|
Years Ended December 31,
|
||||||||||
|
|
2017
|
2016
|
2015
|
||||||||
|
Hospital Operations and other:
|
|
|
|
|
|
|
|||||
|
Net patient revenues from acute care hospitals, related outpatient facilities and physician practices
|
|||||||||||
|
Medicare
|
$
|
3,389
|
|
$
|
3,526
|
|
$
|
3,579
|
|
||
|
Medicaid
|
1,325
|
|
1,341
|
|
1,449
|
|
|||||
|
Managed care
|
10,463
|
|
10,651
|
|
10,582
|
|
|||||
|
Indemnity, self-pay and other
|
1,740
|
|
1,694
|
|
1,814
|
|
|||||
|
Net patient revenues
(1)
|
16,917
|
|
17,212
|
|
17,424
|
|
|||||
|
Health plans
|
110
|
|
482
|
|
423
|
|
|||||
|
Revenue from other sources
|
629
|
|
623
|
|
541
|
|
|||||
|
Hospital Operations and other total prior to inter-segment eliminations
|
17,656
|
|
18,317
|
|
18,388
|
|
|||||
|
Ambulatory Care
|
1,978
|
|
1,833
|
|
976
|
|
|||||
|
Conifer
|
1,597
|
|
1,571
|
|
1,413
|
|
|||||
|
Inter-segment eliminations
|
(618
|
)
|
(651
|
)
|
(666
|
)
|
|||||
|
Net operating revenues before provision for doubtful accounts
|
$
|
20,613
|
|
$
|
21,070
|
|
$
|
20,111
|
|
||
|
(1)
|
Net patient revenues include revenues from physician practices of
$729 million
,
$745 million
and
$745 million
for the years ended December 31, 2017, 2016 and 2015, respectively.
|
Provision for Doubtful Accounts
Although outcomes vary, our policy is to attempt to collect amounts due from patients, including co-pays and deductibles due from patients with insurance, at the time of service while complying with all federal and state statutes and regulations, including, but not limited to, the Emergency Medical Treatment and Active Labor Act (“EMTALA”). Generally, as required by EMTALA, patients may not be denied emergency treatment due to inability to pay. Therefore, services, including the legally required medical screening examination and stabilization of the patient, are performed without delaying to obtain insurance information. In non-emergency circumstances or for elective procedures and services, it is our policy to verify insurance prior to a patient being treated; however, there are various exceptions that can occur. Such exceptions can include, for example, instances where (1) we are unable to obtain verification because the patient’s insurance company was unable to be reached or contacted, (2) a determination is made that a patient may be eligible for benefits under various government programs, such as Medicaid or Victims of Crime, and it takes several days or weeks before qualification for such benefits is confirmed or denied, and (3) under physician orders we provide services to patients that require immediate treatment.
We provide for accounts receivable that could become uncollectible by establishing an allowance to reduce the carrying value of such receivables to their estimated net realizable value. Generally, we estimate this allowance based on the aging of our accounts receivable by hospital, our historical collection experience by hospital and for each type of payer over a look-back period, and other relevant factors. A significant portion of our provision for doubtful accounts relates to self-pay patients, as well as co-pays and deductibles owed to us by patients with insurance. Payment pressure from managed care payers also affects our provision for doubtful accounts. We typically experience ongoing managed care payment delays and disputes; however, we continue to work with these payers to obtain adequate and timely reimbursement for our services. There are various factors that can impact collection trends, such as changes in the economy, which in turn have an impact on unemployment rates and the number of uninsured and underinsured patients, the volume of patients through our emergency departments, the increased burden of co-pays and deductibles to be made by patients with insurance, and business practices related to collection efforts. These factors continuously change and can have an impact on collection trends and our estimation process.
Electronic Health Record Incentives
Under certain provisions of the American Recovery and Reinvestment Act of 2009 (“ARRA”), federal incentive payments are available to hospitals, physicians and certain other professionals when they adopt, implement or upgrade (“AIU”) certified electronic health record (“EHR”) technology or become “meaningful users,” as defined under ARRA, of EHR technology in ways that demonstrate improved quality, safety and effectiveness of care. We recognize Medicaid EHR incentive payments in our consolidated statements of operations for the first payment year when: (1) CMS approves a state’s EHR incentive plan; and (2) our hospital or employed physician acquires certified EHR technology (i.e., when AIU criteria are met). Medicaid EHR incentive payments for subsequent payment years are recognized in the period during which the specified meaningful use criteria are met. We recognize Medicare EHR incentive payments when: (1) the specified meaningful use criteria are met; and (2) contingencies in estimating the amount of the incentive payments to be received are resolved. During
105
the years ended
December 31, 2017
,
2016
and
2015
, certain of our hospitals and physicians satisfied the CMS AIU and/or meaningful use criteria. As a result, we recognized approximately
$9 million
,
$32 million
and
$72 million
of Medicare and Medicaid EHR incentive payments as a reduction to expense in our Consolidated Statement of Operations for the years ended
December 31, 2017
,
2016
and
2015
, respectively.
Cash and Cash Equivalents
We treat highly liquid investments with original maturities of three months or less as cash equivalents. Cash and cash equivalents were approximately
$611 million
and
$716 million
at
December 31, 2017
and
2016
, respectively. As of
December 31, 2017
and
2016
, our book overdrafts were approximately
$311 million
and
$279 million
, respectively, which were classified as accounts payable.
At
December 31, 2017
and
2016
, approximately
$179 million
and
$232 million
, respectively, of total cash and cash equivalents in the accompanying Condensed Consolidated Balance Sheets were intended for the operations of our captive insurance subsidiaries, and approximately
$30 million
and
$85 million
, respectively, of total cash and cash equivalents in the accompanying Consolidated Balance Sheets were intended for the operations of our health plan-related businesses.
Also at
December 31, 2017
and
2016
, we had
$117 million
and
$179 million
, respectively, of property and equipment purchases accrued for items received but not yet paid. Of these amounts,
$79 million
and
$141 million
, respectively, were included in accounts payable.
During the years ended
December 31, 2017
and
2016
, we entered into non-cancellable capital leases of approximately
$162 million
and
$160 million
, respectively, primarily for equipment.
Investments in Debt and Equity Securities
We classify investments in debt and equity securities as either available-for-sale, held-to-maturity or as part of a trading portfolio. At
December 31, 2017
and
2016
, we had no significant investments in securities classified as either held-to-maturity or trading. We carry securities classified as available-for-sale at fair value. We report their unrealized gains and losses, net of taxes, as accumulated other comprehensive income (loss) unless we determine that a loss is other-than-temporary, at which point we would record a loss in our consolidated statements of operations. We include realized gains or losses in our consolidated statements of operations based on the specific identification method.
Investments in Unconsolidated Affiliates
We control
227
of the facilities within our Ambulatory Care segment and, therefore, consolidate their results. We account for many of the facilities our Ambulatory Care segment operates (
106
of
333
at
December 31, 2017
),
four
of the hospitals our Hospital Operations and other segment operates, and additional companies in which our Hospital Operations and other segment holds ownership interests under the equity method as investments in unconsolidated affiliates and report only our share of net income as equity in earnings of unconsolidated affiliates in the accompanying Consolidated Statements of Operations. Summarized financial information for these equity method investees, primarily from our Ambulatory Care segment and the four hospitals mentioned above, is included in the following table. For investments acquired during the reported periods, amounts reflect
100%
of the investee’s results beginning on the date of our acquisition of the investment.
|
|
December 31, 2017
|
December 31, 2016
|
December 31, 2015
|
||||||||
|
Current assets
|
$
|
805
|
|
$
|
943
|
|
$
|
866
|
|
||
|
Noncurrent assets
|
$
|
1,223
|
|
$
|
991
|
|
$
|
854
|
|
||
|
Current liabilities
|
$
|
(354
|
)
|
$
|
(320
|
)
|
$
|
(301
|
)
|
||
|
Noncurrent liabilities
|
$
|
(389
|
)
|
$
|
(345
|
)
|
$
|
(377
|
)
|
||
|
Noncontrolling interests
|
$
|
(490
|
)
|
$
|
(494
|
)
|
$
|
(309
|
)
|
||
|
|
Years Ended December 31,
|
||||||||||
|
|
2017
|
2016
|
2015
|
||||||||
|
Net operating revenues
|
$
|
2,907
|
|
$
|
2,823
|
|
$
|
1,335
|
|
||
|
Net income
|
$
|
558
|
|
$
|
573
|
|
$
|
436
|
|
||
|
Net income attributable to the investees
|
$
|
363
|
|
$
|
343
|
|
$
|
356
|
|
||
106
Our equity method investment that contributes the most to our equity in earnings of unconsolidated affiliates is Texas Health Ventures Group, LLC (“THVG”), which is operated by our USPI joint venture. THVG represented
$69 million
of the total
$144 million
equity in earnings of unconsolidated affiliates we recognized for the year ended
December 31, 2017
and
$61 million
of the total
$131 million
equity in earnings of unconsolidated affiliates we recognized for the year ended
December 31, 2016
.
Property and Equipment
Additions and improvements to property and equipment exceeding established minimum amounts with a useful life greater than one year are capitalized at cost. Expenditures for maintenance and repairs are charged to expense as incurred. We use the straight-line method of depreciation for buildings, building improvements and equipment. The estimated useful life for buildings and improvements is primarily
15
to
40
years, and for equipment
three
to
15
years. Newly constructed hospitals are usually depreciated over
50
years. We record capital leases at the beginning of the lease term as assets and liabilities. The value recorded is the lower of either the present value of the minimum lease payments or the fair value of the asset. Such assets, including improvements, are generally amortized over the shorter of either the lease term or their estimated useful life. Interest costs related to construction projects are capitalized. In the years ended
December 31, 2017
,
2016
and
2015
, capitalized interest was
$15 million
,
$22 million
and
$12 million
, respectively.
We evaluate our long-lived assets for possible impairment annually or whenever events or changes in circumstances indicate that the carrying amount of the asset, or related group of assets, may not be recoverable from estimated future undiscounted cash flows. If the estimated future undiscounted cash flows are less than the carrying value of the assets, we calculate the amount of an impairment if the carrying value of the long-lived assets exceeds the fair value of the assets. The fair value of the assets is estimated based on appraisals, established market values of comparable assets or internal estimates of future net cash flows expected to result from the use and ultimate disposition of the asset. The estimates of these future cash flows are based on assumptions and projections we believe to be reasonable and supportable. They require our subjective judgments and take into account assumptions about revenue and expense growth rates. These assumptions may vary by type of facility and presume stable, improving or, in some cases, declining results at our hospitals, depending on their circumstances.
We report long-lived assets to be disposed of at the lower of their carrying amounts or fair values less costs to sell. In such circumstances, our estimates of fair value are based on appraisals, established market prices for comparable assets or internal estimates of future net cash flows.
Goodwill and Other Intangible Assets
Goodwill represents the excess of costs over the fair value of assets of businesses acquired. Goodwill and other intangible assets acquired in purchase business combinations and determined to have indefinite useful lives are not amortized, but instead are subject to impairment tests performed at least annually. For goodwill, we perform the test at the reporting unit level when events occur that require an evaluation to be performed or at least annually. If we determine the carrying value of goodwill is impaired, or if the carrying value of a business that is to be sold or otherwise disposed of exceeds its fair value, we reduce the carrying value, including any allocated goodwill, to fair value. Estimates of fair value are based on appraisals, established market prices for comparable assets or internal estimates of future net cash flows and presume stable, improving or, in some cases, declining results at our hospitals, depending on their circumstances.
Other intangible assets primarily consist of capitalized software costs, which are amortized on a straight-line basis over the estimated useful life of the software, which ranges from
three
to
15
years, costs of acquired management and other contract service rights, most of which have indefinite lives, and miscellaneous intangible assets.
Accruals for General and Professional Liability Risks
We accrue for estimated professional and general liability claims, when they are probable and can be reasonably estimated. The accrual, which includes an estimate for incurred but not reported claims, is updated each quarter based on a model of projected payments using case-specific facts and circumstances and our historical loss reporting, development and settlement patterns and is discounted to its net present value using a risk-free discount rate
2.33%
at
December 31, 2017
and
2.25%
at
December 31, 2016
. To the extent that subsequent claims information varies from our estimates, the liability is adjusted in the period such information becomes available. Malpractice expense is presented within other operating expenses in the accompanying Consolidated Statements of Operations.
107
Income Taxes
We account for income taxes using the asset and liability method. This approach requires the recognition of deferred tax assets and liabilities for the expected future tax consequences of temporary differences between the carrying amounts and the tax bases of assets and liabilities. Income tax receivables and liabilities and deferred tax assets and liabilities are recognized based on the amounts that more likely than not will be sustained upon ultimate settlement with taxing authorities.
Developing our provision for income taxes and analysis of uncertain tax positions requires significant judgment and knowledge of federal and state income tax laws, regulations and strategies, including the determination of deferred tax assets and liabilities and, if necessary, any valuation allowances that may be required for deferred tax assets.
We assess the realization of our deferred tax assets to determine whether an income tax valuation allowance is required. Based on all available evidence, both positive and negative, and the weight of that evidence to the extent such evidence can be objectively verified, we determine whether it is more likely than not that all or a portion of the deferred tax assets will be realized. The main factors that we consider include:
|
•
|
Cumulative profits/losses in recent years, adjusted for certain nonrecurring items;
|
|
•
|
Income/losses expected in future years;
|
|
•
|
Unsettled circumstances that, if unfavorably resolved, would adversely affect future operations and profit levels;
|
|
•
|
The availability, or lack thereof, of taxable income in prior carryback periods that would limit realization of tax benefits; and
|
|
•
|
The carryforward period associated with the deferred tax assets and liabilities.
|
We consider many factors when evaluating our uncertain tax positions, and such judgments are subject to periodic review. Tax benefits associated with uncertain tax positions are recognized in the period in which one of the following conditions is satisfied: (1) the more likely than not recognition threshold is satisfied; (2) the position is ultimately settled through negotiation or litigation; or (3) the statute of limitations for the taxing authority to examine and challenge the position has expired. Tax benefits associated with an uncertain tax position are derecognized in the period in which the more likely than not recognition threshold is no longer satisfied.
Segment Reporting
We primarily operate acute care hospitals and related healthcare facilities. Our general hospitals generated
79%
,
78%
and
83%
of our net operating revenues before provision for doubtful accounts in the years ended
December 31, 2017
,
2016
and
2015
, respectively. Each of our markets related to our general hospitals report directly to our president of hospital operations. Major decisions, including capital resource allocations, are made at the consolidated level, not at the market or hospital level.
Our Hospital Operations and other segment
is comprised of our acute care hospitals, ancillary outpatient facilities, urgent care centers, microhospitals and physician practices. As described in Note 4
, certain of our facilities are classified as held for sale
in the accompanying Consolidated Balance Sheet at
December 31, 2017
. In the three months ended June 30, 2015, we began reporting Ambulatory Care as a separate reportable business segment. Previously, our business consisted of our Hospital Operations and other segment and our Conifer segment, which provides healthcare business process services in the areas of hospital and physician revenue cycle management and value-based care solutions to healthcare systems, as well as individual hospitals, physician practices, self-insured organizations and health plans.
Effective June 16, 2015, we completed the joint venture transaction that combined our freestanding ambulatory surgery and imaging center assets with USPI’s surgical facility assets. We contributed our interests in
49
ambulatory surgery centers and
20
imaging centers, which had previously been included in our Hospital Operations and other segment, to the joint venture. We also completed the acquisition of Aspen effective June 16, 2015, which includes
nine
private hospitals and clinics in the United Kingdom. Our Ambulatory Care segment is comprised of the operations of our USPI joint venture and Aspen facilities. The factors for determining the reportable segments include the manner in which management evaluates operating performance combined with the nature of the individual business activities.
108
Costs Associated With Exit or Disposal Activities
We recognize costs associated with exit (including restructuring) or disposal activities when they are incurred and can be measured at fair value, rather than at the date of a commitment to an exit or disposal plan.
Rights Agreement
On August 31, 2017, our board of directors (the “board”) declared a dividend of
one
preferred share purchase right per each outstanding share of our common stock issuable to our shareholders of record as of the close of business on September 10, 2017 (the “Record Date”).
One
right will also be issued together with each share of our common stock issued after the Record Date. In connection with the distribution of the Rights, we entered into a rights agreement (the “Rights Agreement”) intended to protect all shareholder interests as the board executes leadership and governance changes, and to diminish the risk that our ability to use our net operating loss carryforwards to reduce future federal income tax obligations may become substantially limited due to an “ownership change,” as defined in Section 382 of the Internal Revenue Code. Currently, the rights are attached to our common share certificates, and no separate certificates evidencing the rights have been issued. The rights will separate and begin trading separately from our common shares on the earlier to occur of (i)
10
business days after a public announcement that a person has become an “Acquiring Person” by acquiring beneficial ownership of
4.9%
or more of our outstanding common stock (or, in the case of a person that had beneficial ownership of
4.9%
or more of our outstanding common stock as of the close of business on the Record Date, by obtaining beneficial ownership of additional shares of common stock), or, in the event an exchange is effected in accordance with the Rights Agreement and the board determines that a later date is advisable, then such later date and (ii)
10
business days (or such later date as may be specified by the board prior to such time as any person becomes an Acquiring Person) after the commencement of a tender or exchange offer by or on behalf of a person that, if completed, would result in such person becoming an Acquiring Person. In the event that a person becomes an Acquiring Person, each holder of a right, other than rights that are or, under certain circumstances, were beneficially owned by the Acquiring Person (which will thereupon become null and void), will thereafter have the right to receive upon exercise of a right and payment of
$70.00
(the “Purchase Price”), one one-thousandth of a share of Series R Preferred Stock, subject to adjustment. The rights will expire on the close of business on the date on which our 2018 annual meeting of stockholders is concluded (or, if later, the date on which the votes of our stockholders with respect to such meeting are certified). Shareholders who beneficially owned
4.9%
or more of our outstanding common stock as of the close of business on September 10, 2017 will not trigger the Rights Agreement so long as they do not acquire beneficial ownership of additional shares of our common stock at a time when they still beneficially own
4.9%
or more of our outstanding common stock. Our board of directors may, in its sole discretion, also exempt any person from triggering the Rights Agreement, such as in the case where beneficial ownership of more than
4.9%
of our common stock does not limit the use of our net operating losses.
Noncontrolling Interests
Our noncontrolling interests balances at
December 31, 2017
and
2016
in our Consolidated Statements of Shareholders’ Equity were comprised of
$64 million
and
$89 million
, respectively, from our Hospital Operations and other segment, and
$622 million
and
$576 million
, respectively, from our Ambulatory Care segment. Our net income attributable to noncontrolling interests for the years ended
December 31, 2017
,
2016
and
2015
were comprised of
$11 million
,
$11 million
and
$24 million
, respectively, from our Hospital Operations and other segment, and
$134 million
,
$127 million
and
$28 million
, respectively, from our Ambulatory Care segment.
Share Repurchase Program
In November 2015, we announced that our board of directors had authorized the repurchase of up to
$500 million
of our common stock through a share repurchase program that expired in December 2016. Pursuant to the share repurchase program, we paid approximately
$40 million
to repurchase a total of
1,242,806
shares during the period from the commencement of the program through
December 31, 2015
. There were
no
purchases under the program during the year ended
December 31, 2016
.
109
|
Period
|
Total Number of
Shares
Purchased
|
Average Price
Paid Per
Share
|
Total Number of
Shares Purchased as
Part of Publicly
Announced Program
|
Maximum Dollar Value
of Shares Not Purchased Under
the Program
|
||||||||||
|
|
(In Thousands)
|
|
(In Thousands)
|
(In Millions)
|
||||||||||
|
November 1, 2015 through November 30, 2015
|
978
|
|
$
|
32.71
|
|
978
|
|
$
|
468
|
|
||||
|
December 1, 2015 through December 31, 2015
|
265
|
|
30.25
|
|
265
|
|
460
|
|
||||||
|
November 1, 2015 through December 31, 2015
|
1,243
|
|
$
|
32.18
|
|
1,243
|
|
$
|
460
|
|
||||
The principal components of accounts receivable are shown in the table below:
|
|
December 31, 2017
|
December 31, 2016
|
|||||
|
Continuing operations:
|
|
|
|
|
|||
|
Patient accounts receivable
|
$
|
3,376
|
|
$
|
3,799
|
|
|
|
Allowance for doubtful accounts
|
(898
|
)
|
(1,031
|
)
|
|||
|
Estimated future recoveries
|
132
|
|
141
|
|
|||
|
Net cost reports and settlements payable and valuation allowances
|
4
|
|
(14
|
)
|
|||
|
|
2,614
|
|
2,895
|
|
|||
|
Discontinued operations
|
2
|
|
2
|
|
|||
|
Accounts receivable, net
|
$
|
2,616
|
|
$
|
2,897
|
|
|
At
December 31, 2017
and
2016
, our allowance for doubtful accounts was
26.6%
and
27.1%
, respectively, of our patient accounts receivable. Our allowance was impacted by higher patient co-pays and deductibles, as well as increases in our uninsured revenues during the year ended
December 31, 2017
compared to the same period in
2016
. Additionally, the composition of our accounts receivable has been impacted by our divestiture activity.
Accounts that are pursued for collection through Conifer’s regional business offices are maintained on our hospitals’ books and reflected in patient accounts receivable with an allowance for doubtful accounts established to reduce the carrying value of such receivables to their estimated net realizable value. Generally, we estimate this allowance based on the aging of our accounts receivable by hospital, our historical collection experience by hospital and for each type of payer, and other relevant factors.
Accounts assigned to Conifer are written off and excluded from patient accounts receivable and allowance for doubtful accounts; however, an estimate of future recoveries from all accounts at Conifer is determined based on historical experience and recorded on our hospitals’ books as a component of accounts receivable in the accompanying Consolidated Balance Sheets.
We also provide charity care to patients who are financially unable to pay for the healthcare services they receive. Most patients who qualify for charity care are charged a per-diem amount for services received, subject to a cap. Except for the per-diem amounts, our policy is not to pursue collection of amounts determined to qualify as charity care; therefore, we do not report these amounts in net operating revenues. Most states include an estimate of the cost of charity care in the determination of a hospital’s eligibility for Medicaid disproportionate share hospital (“DSH”) payments. These payments are intended to mitigate our cost of uncompensated care, as well as reduced Medicaid funding levels. Generally, our method of measuring the estimated costs uses adjusted self-pay/charity patient days multiplied by selected operating expenses (which include salaries, wages and benefits, supplies and other operating expenses and which exclude the costs of our health plan businesses) per adjusted patient day. The adjusted self-pay/charity patient days represents actual self-pay/charity patient days adjusted to include self-pay/charity outpatient services by multiplying actual self-pay/charity patient days by the sum of gross self-pay/charity inpatient revenues and gross self-pay/charity outpatient revenues and dividing the results by gross self-pay/charity inpatient revenues. The table below shows our estimated costs of caring for our self-pay patients and charity care patients and revenues attributable to Medicaid DSH and other supplement revenues we recognize for the years ended
December 31, 2017
,
2016
and
2015
.
110
|
|
Years Ended December 31,
|
||||||||||
|
|
2017
|
2016
|
2015
|
||||||||
|
Estimated costs for:
|
|
|
|
|
|
|
|||||
|
Self-pay patients
|
$
|
648
|
|
$
|
609
|
|
$
|
598
|
|
||
|
Charity care patients
|
121
|
|
138
|
|
184
|
|
|||||
|
Total
|
$
|
769
|
|
$
|
747
|
|
$
|
782
|
|
||
|
Medicaid DSH and other supplemental revenues
|
$
|
864
|
|
$
|
906
|
|
$
|
888
|
|
||
We had approximately
$312 million
and
$266 million
of receivables recorded in other current assets and investments and other assets, respectively, and approximately
$159 million
and
$49 million
of payables recorded in other current liabilities and other long-term liabilities, respectively, in the accompanying Consolidated Balance Sheet at
December 31, 2017
related to California’s provider fee program. We had approximately
$537 million
of receivables recorded in other current assets and approximately
$139 million
of payables recorded in other current liabilities in the accompanying Consolidated Balance Sheet at
December 31, 2016
related to California’s provider fee program.
In the three months ended
December 31, 2017
, our hospital, physician practices and other hospital-affiliated operations in St. Louis, Missouri met the criteria to be classified as held for sale in accordance with the guidance in the FASB’s Accounting Standards Codification (“ASC”) 360, “Property, Plant and Equipment.” We classified
$42 million
of our St. Louis-area assets as “assets held for sale” in current assets and the related liabilities of
$3 million
as “liabilities held for sale” in current liabilities in the accompanying Consolidated Balance Sheet at
December 31, 2017
. These assets and liabilities, which are in our Hospital Operations and other segment, were recorded at the lower of their carrying amount or their fair value less estimated costs to sell. There was no impairment recorded for a write-down of assets held for sale to their estimated fair value, less estimated costs to sell, as a result of the planned divestiture of these assets.
Also in the three months ended
December 31, 2017
, three of our hospitals in the Chicago-area, as well as other operations affiliated with the hospitals, met the criteria to be classified as held for sale. As a result, we classified these assets totaling
$126 million
as “assets held for sale” in current assets and the related liabilities of
$52 million
as “liabilities held for sale” in current liabilities in the accompanying Consolidated Balance Sheet at
December 31, 2017
. These assets and liabilities, which are in our Hospital Operations and other segment, were recorded at the lower of their carrying amount or their fair value less estimated costs to sell. We recorded impairment charges of
$73 million
for the write-down of assets held for sale to their estimated fair value, less estimated costs to sell, as a result of the planned divestiture of these assets.
Additionally, certain assets and the related liabilities of our health plan in California, as well as the real estate related to our Abrazo Maryvale hospital we have closed in Arizona, were classified as held for sale in the three months ended
December 31, 2017
. We classified
$18 million
of assets as “assets held for sale” in current assets and the related liabilities of
$9 million
as “liabilities held for sale” in current liabilities in the accompanying Consolidated Balance Sheet at
December 31, 2017
related to these entities. These assets and liabilities, which are in our Hospital Operations and other segment, were recorded at the lower of their carrying amount or their fair value less estimated costs to sell. There was no impairment recorded for a write-down of assets held for sale to their estimated fair value, less estimated costs to sell, as a result of the planned divestiture of these assets.
In the three months ended September 30, 2017, we entered into a definitive agreement for the sale of our hospitals, physician practices and related assets in Philadelphia, Pennsylvania and the surrounding area. We classified
$223 million
of our Philadelphia-area assets as “assets held for sale” in current assets and the related liabilities of
$52 million
as “liabilities held for sale” in current liabilities in the accompanying Consolidated Balance Sheet at
December 31, 2017
. These assets and liabilities, which are in our Hospital Operations and other segment, were recorded at the lower of their carrying amount or their fair value less estimated costs to sell. We recorded impairment charges of
$232 million
for the write-down of assets held for sale to their estimated fair value, less estimated costs to sell, as a result of this transaction, which closed effective January 11, 2018, resulting in net pre-tax proceeds of
$152.5 million
in cash and a secured promissory note for
$17.5 million
.
Also in the three months ended September 30, 2017, MacNeal Hospital, which is located in a suburb of Chicago, as well as other operations affiliated with the hospital, met the criteria to be classified as held for sale. As a result, we classified these assets totaling
$202 million
as “assets held for sale” in current assets and the related liabilities of
$36 million
as “liabilities held for sale” in current liabilities in the accompanying Consolidated Balance Sheet at
December 31, 2017
. These assets and liabilities, which are in our Hospital Operations and other segment, were recorded at the lower of their carrying amount or their fair value less estimated costs to sell. There was no impairment recorded for a write-down of assets held for sale to their estimated fair value, less estimated costs to sell, as a result of the planned divestiture of these assets.
111
Additionally, our
nine
Aspen facilities in the United Kingdom met the criteria to be classified as held for sale in the three months ended September 30, 2017. We classified
$406 million
of our United Kingdom assets as “assets held for sale” in current assets and the related liabilities of
$328 million
as “liabilities held for sale” in current liabilities in the accompanying Consolidated Balance Sheet at
December 31, 2017
. These assets and liabilities, which are in our Ambulatory Care segment, were recorded at the lower of their carrying amount or their fair value less estimated costs to sell. We recorded impairment charges of
$59 million
for the write-down of assets held for sale to their estimated fair value, less estimated costs to sell.
Assets and liabilities classified as held for sale at
December 31, 2017
were comprised of the following:
|
Accounts receivable
|
$
|
211
|
|
|
|
Other current assets
|
123
|
|
||
|
Investments and other long-term assets
|
18
|
|
||
|
Property and equipment
|
557
|
|
||
|
Other intangible assets
|
10
|
|
||
|
Goodwill
|
98
|
|
||
|
Current liabilities
|
(169
|
)
|
||
|
Long-term liabilities
|
(311
|
)
|
||
|
Net assets held for sale
|
$
|
537
|
|
|
In the three months ended June 30, 2017, we entered into a definitive agreement for the sale of our hospitals, physician practices and related assets in Houston, Texas and the surrounding area, and we classified these assets and liabilities as held for sale. Effective August 1, 2017, we completed the sale for net proceeds of approximately
$750 million
and recognized a gain on sale of approximately
$111 million
.
The following table provides information on significant components of our business that have been disposed of or have been classified as held for sale in the year ended December 31, 2017:
|
|
Years Ended December 31,
|
||||||||||
|
|
2017
|
2016
|
2015
|
||||||||
|
Significant disposals:
|
|
|
|
|
|
|
|||||
|
Houston
|
|||||||||||
|
Income from continuing operations, before income taxes
|
$
|
133
|
|
$
|
67
|
|
$
|
85
|
|
||
|
Pre-tax income attributable to Tenet Healthcare Corporation common shareholders
|
$
|
132
|
|
$
|
64
|
|
$
|
82
|
|
||
|
Significant classifications as held for sale:
|
|||||||||||
|
Income (loss) from continuing operations, before income taxes
|
|||||||||||
|
Chicago-area
|
$
|
(82
|
)
|
$
|
(1
|
)
|
$
|
9
|
|
||
|
Philadelphia
|
(255
|
)
|
(75
|
)
|
(7
|
)
|
|||||
|
MacNeal
|
27
|
|
29
|
|
36
|
|
|||||
|
Aspen
|
(68
|
)
|
(16
|
)
|
(4
|
)
|
|||||
|
Total
|
$
|
(378
|
)
|
$
|
(63
|
)
|
$
|
34
|
|
||
In the three months ended September 30, 2016, certain of our health plan assets and liabilities met the criteria to be classified as held for sale. We classified
$27 million
of our health plan assets as “assets held for sale” in current assets and
$13 million
of our health plan liabilities as “liabilities held for sale” in current liabilities in the accompanying Consolidated Balance Sheet at
December 31, 2016
. During the year ended
December 31, 2017
, we completed the sales of certain of our health plan businesses (or the membership thereof) in Michigan, Arizona and Texas at transaction prices of approximately
$20 million
,
$13 million
and
$12 million
, respectively, and recognized gains on the sales of approximately
$3 million
,
$13 million
and
$10 million
, respectively.
Our hospitals, physician practices and related assets in Georgia met the criteria to be classified as assets held for sale in the three months ended June 30, 2015. We completed the sale of our Georgia assets on March 31, 2016 at a transaction price of approximately
$575 million
and recognized a gain on sale of approximately
$113 million
. Because we did not sell the related accounts receivable with respect to the pre-closing period, net receivables of approximately
$12 million
are included in accounts receivable, less allowance for doubtful accounts in the accompanying Consolidated Balance Sheet at
December 31, 2017
.
112
In the three months ended June 30, 2015, we entered into a definitive agreement for the sale of the assets of our Saint Louis University Hospital (“SLUH”) to Saint Louis University. As a result of this anticipated transaction, we recorded an impairment charge of
$147 million
for the write-down of assets held for sale to their estimated fair value, less estimated costs to sell, in the three months ended June 30, 2015. We completed the sale of SLUH on August 31, 2015 at a transaction price of approximately
$32 million
, excluding working capital and subject to customary purchase price adjustments. Because we did not sell SLUH’s accounts receivable related to the pre-closing period, net receivables of approximately
$3 million
are included in accounts receivable, less allowance for doubtful accounts, in the accompanying Consolidated Balance Sheet at
December 31, 2017
.
Our hospitals, physician practices and related assets in North Carolina also met the criteria to be classified as assets held for sale in the three months ended June 30, 2015. We completed the sale of our North Carolina assets on December 31, 2015 at a transaction price of approximately
$191 million
and recognized a gain on sale of approximately
$3 million
. Because we did not sell the related accounts receivable related to the pre-closing period, net receivables of approximately
$2 million
are included in accounts receivable, less allowance for doubtful accounts in the accompanying Consolidated Balance Sheet at
December 31, 2017
.
During the three months ended March 31, 2015, we entered into definitive agreements to form
two
joint ventures with affiliates of Baylor Scott & White Holdings (“BSW Holdings”), the parent company of Baylor Scott & White Health, involving the ownership and operation of the hospitals formerly known as Centennial Medical Center, Doctors Hospital at White Rock Lake, Lake Pointe Medical Center and Texas Regional Medical Center at Sunnyvale (collectively, “our North Texas hospitals”) – which we continue to operate – and Baylor Medical Center at Garland – which is operated by an affiliate of BSW Holdings, which, through its affiliates, holds a majority ownership interest in the joint ventures. The transactions closed on December 31, 2015 at a net transaction price of approximately
$288 million
, and we recorded a gain on deconsolidation of these facilities of approximately
$151 million
. We also recorded an equity investment in the new joint ventures of approximately
$164 million
, which included
$11 million
of cash contributed at closing.
We recognized impairment charges on long-lived assets in
2017
,
2016
and
2015
because the fair values of those assets or groups of assets indicated that the carrying amount was not recoverable. The fair value estimates were derived from appraisals, established market values of comparable assets, or internal estimates of future net cash flows. These fair value estimates can change by material amounts in subsequent periods. Many factors and assumptions can impact the estimates, including the future financial results of the hospitals, how the hospitals are operated in the future, changes in healthcare industry trends and regulations, and the nature of the ultimate disposition of the assets. In certain cases, these fair value estimates assume the highest and best use of hospital assets in the future to a market place participant is other than as a hospital. In these cases, the estimates are based on the fair value of the real property and equipment if utilized other than as a hospital. The impairment recognized does not include the costs of closing the hospitals or other future operating costs, which could be substantial. Accordingly, the ultimate net cash realized from the hospitals, should we choose to sell them, could be significantly less than their impaired value.
Our impairment tests presume stable, improving or, in some cases, declining operating results in our facilities, which are based on programs and initiatives being implemented that are designed to achieve the facility’s most recent projections. If these projections are not met, or if in the future negative trends occur that impact our future outlook, impairments of long-lived assets and goodwill may occur, and we may incur additional restructuring charges, which could be material.
At
December 31, 2017
, our continuing operations consisted of
three
reportable segments, Hospital Operations and other, Ambulatory Care and Conifer.
Our segments are reporting units used to perform our goodwill impairment analysis. We completed our annual impairment tests for goodwill as of October
1
, 2017. During the year ended December 31, 2017, we changed our annual quantitative goodwill impairment testing date from December 31 to October 1 of each year. The change in the goodwill impairment test date better aligns the impairment testing procedures with the timing of our long-term planning process, which is a significant input to the testing. Also, during January 2017, our Florida, Northeast and Southern regions and our Detroit market were combined to form our then Eastern region. Subsequent to this change, our Hospital Operations and other segment was comprised of our then Eastern, Texas and Western regions, which were our reporting units used to perform our goodwill impairment analysis. During October 2017, we further reorganized our business such that our regional management layer was eliminated. Due to this reorganization, our previous region reporting units for our Hospital Operations and other segment were combined into one reporting unit. The change in testing date and the change in reporting units did not delay, accelerate or avoid a goodwill impairment charge.
113
We periodically incur costs to implement restructuring efforts for specific operations, which are recorded in our statement of operations as they are incurred. Our restructuring plans focus on various aspects of operations, including aligning our operations in the most strategic and cost-effective structure. Certain restructuring and acquisition-related costs are based on estimates. Changes in estimates are recognized as they occur.
Year Ended
December 31, 2017
During the year ended
December 31, 2017
,
we recorded impairment and restructuring charges and acquisition-related costs of
$541 million
, consisting of
$402 million
of impairment charges,
$117 million
of restructuring charges and
$22 million
of acquisition-related costs. Impairment charges consisted of
$364 million
of charges to write-down assets held for sale to their estimated fair value, less estimated costs to sell, for our Aspen, Philadelphia-area and certain of our Chicago-area facilities,
$31 million
for the impairment of
two
equity method investments and
$7 million
to write-down intangible assets.
Of the total impairment charges recognized for the year ended
December 31, 2017
,
$337 million
related to our Hospital Operations and other segment,
$63 million
related to our Ambulatory Care segment, and
$2 million
related to our Conifer segment.
Restructuring charges consisted of
$82 million
of employee severance costs,
$15 million
of contract and lease termination fees, and
$20 million
of other restructuring costs.
Acquisition-related costs consisted of
$6 million
of transaction costs and
$16 million
of
acquisition integration charges.
Year Ended
December 31, 2016
During the year ended
December 31, 2016
,
we recorded impairment and restructuring charges and acquisition-related costs of
$202 million
.
This amount included impairment charges of approximately
$54 million
for the write-down of buildings, equipment and other long-lived assets, primarily capitalized software costs classified as other intangible assets, to their estimated fair values at
four
hospitals.
Material adverse trends in our most recent estimates of future undiscounted cash flows of the hospitals indicated the carrying value of the hospitals’ long-lived assets was not recoverable from the estimated future cash flows. We believe the most significant factors contributing to the adverse financial trends include reductions in volumes of insured patients, shifts in payer mix from commercial to governmental payers combined with reductions in reimbursement rates from governmental payers, and high levels of uninsured patients. As a result, we updated the estimate of the fair value of the hospitals’ long-lived assets and compared the fair value estimate to the carrying value of the hospitals’ long-lived assets. Because the fair value estimates were lower than the carrying value of the long-lived assets, an impairment charge was recorded for the difference in the amounts.
The aggregate carrying value of assets held and used of the hospitals for which impairment charges were recorded was
$163 million
at
December 31, 2016
after recording the impairment charges. We also recorded
$19 million
of impairment charges related to investments and
$14 million
related to other intangible assets, primarily contract-related intangibles and capitalized software costs not associated with the hospitals described above. Of the total impairment charges recognized for the year ended
December 31, 2016
,
$76 million
related to our Hospital Operations and other segment,
$8 million
related to our Ambulatory Care segment, and
$3 million
related to our Conifer segment. We also recorded
$35 million
of employee severance costs,
$14 million
of restructuring costs,
$14 million
of contract and lease termination fees, and
$52 million
in acquisition-related costs, which include
$20 million
of transaction costs and
$32 million
of acquisition integration costs.
Year Ended
December 31, 2015
During the year ended
December 31, 2015
, we recorded impairment and restructuring charges and acquisition-related costs of
$318 million
, including
$168 million
of impairment charges. We recorded an impairment charge of approximately
$147 million
to write-down assets held for sale to their estimated fair value, less estimated costs to sell, as a result of entering into a definitive agreement for the sale of SLUH during the three months ended June 30, 2015, as further described in Note 4. We also recorded impairment charges of approximately
$19 million
for the write-down of buildings, equipment and other long-lived assets, primarily capitalized software costs classified as other intangible assets, to their estimated fair values at
two
hospitals. The aggregate carrying value of assets held and used of the hospital for which an impairment charge was recorded was
$45 million
as of
December 31, 2015
after recording the impairment charge. We also recorded
$2 million
related to investments. In addition, we recorded
$25 million
of employee severance costs,
$6 million
of restructuring costs,
$19 million
of contract and lease termination fees, and
$100 million
in acquisition-related costs, which include
$55 million
of transaction costs and
$45 million
of acquisition integration charges.
114
The table below shows our long-term debt as of
December 31, 2017
and
2016
:
|
|
December 31, 2017
|
December 31, 2016
|
|||||
|
Senior unsecured notes:
|
|
|
|
|
|||
|
5.000% due 2019
|
$
|
—
|
|
$
|
1,100
|
|
|
|
5.500% due 2019
|
500
|
|
500
|
|
|||
|
6.750% due 2020
|
300
|
|
300
|
|
|||
|
8.000% due 2020
|
—
|
|
750
|
|
|||
|
8.125% due 2022
|
2,800
|
|
2,800
|
|
|||
|
6.750% due 2023
|
1,900
|
|
1,900
|
|
|||
|
7.000% due 2025
|
500
|
|
—
|
|
|||
|
6.875% due 2031
|
430
|
|
430
|
|
|||
|
Senior secured first lien notes:
|
|
|
|
|
|||
|
6.250% due 2018
|
—
|
|
1,041
|
|
|||
|
4.750% due 2020
|
500
|
|
500
|
|
|||
|
6.000% due 2020
|
1,800
|
|
1,800
|
|
|||
|
Floating % due 2020
|
—
|
|
900
|
|
|||
|
4.500% due 2021
|
850
|
|
850
|
|
|||
|
4.375% due 2021
|
1,050
|
|
1,050
|
|
|||
|
4.625% due 2024
|
1,870
|
|
—
|
|
|||
|
Senior secured second lien notes:
|
|||||||
|
7.500% due 2022
|
750
|
|
750
|
|
|||
|
5.125% due 2025
|
1,410
|
|
—
|
|
|||
|
Capital leases
|
431
|
|
735
|
|
|||
|
Mortgage notes
|
77
|
|
84
|
|
|||
|
Unamortized issue costs, note discounts and premiums
|
(231
|
)
|
(235
|
)
|
|||
|
Total long-term debt
|
14,937
|
|
15,255
|
|
|||
|
Less current portion
|
146
|
|
191
|
|
|||
|
Long-term debt, net of current portion
|
$
|
14,791
|
|
$
|
15,064
|
|
|
Credit Agreement
We have a senior secured revolving credit facility (as amended, the “Credit Agreement”) that provides, subject to borrowing availability, for revolving loans in an aggregate principal amount of up to
$1 billion
,
with a
$300 million
subfacility for standby letters of credit. Obligations under the Credit Agreement, which has a scheduled maturity date of December 4, 2020, are guaranteed by substantially all of our domestic wholly owned hospital subsidiaries and are secured by a first-priority lien on the accounts receivable owned by us and the subsidiary guarantors.
Outstanding revolving loans accrue interest at a base rate plus a margin ranging from
0.25%
to
0.75%
per annum or the London Interbank Offered Rate (“LIBOR”) plus a margin ranging from
1.25%
to
1.75%
per annum, in each case based on available credit. An unused commitment fee payable on the undrawn portion of the revolving loans ranges from
0.25%
to
0.375%
per annum based on available credit. Our borrowing availability is based on a specified percentage of eligible accounts receivable, including self-pay accounts
. At
December 31, 2017
,
we had no cash borrowings outstanding under the Credit Agreement and we had approximately
$2 million
of standby letters of credit outstanding. Based on our eligible receivables, approximately
$998 million
was available for borrowing under the Credit Agreement at
December 31, 2017
.
Letter of Credit Facility
We have a letter of credit facility (as amended, the “LC Facility”) that provides for the issuance of standby and documentary letters of credit, from time to time, in an aggregate principal amount of up to
$180 million
(subject to increase to up to
$200 million
).
Obligations under the LC Facility are guaranteed and secured by a first-priority pledge of the capital stock and other ownership interests of certain of our wholly owned domestic hospital subsidiaries on an equal ranking basis with our senior secured first lien notes.
On September 15, 2016, we entered into an amendment to the existing letter of credit facility agreement in order to, among other things, (i) extend the scheduled maturity date of the LC Facility to March 7, 2021, (ii) reduce the margin payable with respect to unreimbursed drawings under letters of credit and undrawn letters of credit issued under the LC Facility, and (iii) reduce the commitment fee payable with respect to the undrawn portion of the commitments under the LC Facility.
115
Drawings under any letter of credit issued under the LC Facility that we have not reimbursed within
three
business days after notice thereof accrue interest at a base rate plus a margin equal to
0.50%
per annum. An unused commitment fee is payable at an initial rate of
0.25%
per annum with a step up to
0.375%
per annum should our secured debt-to-EBITDA ratio equal or exceed
3.00
to 1.00 at the end of any fiscal quarter. A fee on the aggregate outstanding amount of issued but undrawn letters of credit accrues at a rate of
1.50%
per annum. An issuance fee equal to
0.125%
per annum of the aggregate face amount of each outstanding letter of credit is payable to the account of the issuer of the related letter of credit.
At
December 31, 2017
,
we had approximately
$100 million
of standby letters of credit outstanding under the LC Facility.
Senior Secured Notes and Senior Unsecured Notes
On June 14, 2017, we sold
$830 million
aggregate principal amount of our
4.625%
senior secured first lien notes, which will mature on July 15, 2024
(the “2024 Secured First Lien Notes”)
. We will pay interest on the 2024 Secured First Lien Notes semi-annually in arrears on January 15 and July 15 of each year, which payments commenced on January 15, 2018. The proceeds from the sale of the 2024 Secured First Lien Notes were used, after payment of fees and expenses, together with cash on hand, to deposit with the trustee an amount sufficient to fund the redemption of all
$900 million
in aggregate principal amount of our floating rate senior secured notes due 2020
(the “2020 Floating Rate Notes”)
on July 14, 2017, thereby fully discharging the 2020 Floating Rate Notes as of June 14, 2017. In connection with the redemption, we recorded a loss from early extinguishment of debt of approximately
$26 million
in the three months ended June 30, 2017, primarily related to the difference between the redemption price and the par value of the notes, as well as the write-off of associated unamortized note discounts and issuance costs.
Also on June 14, 2017,
THC Escrow Corporation III (“
Escrow Corp.
”), a Delaware corporation established for the purpose of issuing the securities referred to in this paragraph,
issued
$1.040 billion
in aggregate principal amount of
4.625%
senior secured first lien notes due 2024
(the “Escrow Secured First Lien Notes”)
,
$1.410 billion
in aggregate principal amount of
5.125%
senior secured second lien notes due 2025
(the “Escrow Secured Second Lien Notes”)
and
$500 million
in aggregate principal amount of
7.000%
senior unsecured notes due 2025
(the “Escrow Unsecured Notes”)
.
On July 14, 2017, we (i) assumed Escrow Corp.’s obligations with respect to the Escrow Secured Second Lien Notes and (ii) effected a mandatory exchange of all outstanding Escrow Secured First Lien Notes for a like principal amount of our newly issued 2024 Secured First Lien Notes. The proceeds from the sale of the Escrow Secured Second Lien Notes and Escrow Secured First Lien Notes were released from escrow on July 14, 2017 and were used, after payment of fees and expenses, to finance our redemption on July 14, 2017 of
$1.041 billion
aggregate principal amount of our outstanding
6.250%
senior secured notes due 2018 and
$1.100 billion
aggregate principal amount of our outstanding
5.000%
senior unsecured notes due 2019.
On August 1, 2017, we assumed Escrow Corp.’s obligations with respect to the Escrow Unsecured Notes. The proceeds from the sale of the Escrow Unsecured Notes were released from escrow on August 1, 2017 and were used, after payment of fees and expenses, to finance our redemption on August 1, 2017 of
$500 million
aggregate principal amount of our
8.000%
senior unsecured notes due 2020.
On September 11, 2017, we redeemed the remaining
$250 million
aggregate principal amount of our
8.000%
senior unsecured notes due 2020 using cash on hand.
As a result of the redemption activities in the three months ended September 30, 2017 discussed above, we recorded a loss from early extinguishment of debt of approximately
$138 million
in the period, primarily related to the difference between the redemption price and the par value of the notes, as well as the write-off of associated unamortized note discounts and issuance costs.
In December 2016, we sold
$750 million
aggregate amount of our
7.500%
senior secured second lien notes (the “Second Lien Notes”), which will mature on January 1, 2022. We will pay interest on the Second Lien Notes semi-annually in arrears on January 1 and July 1 of each year, which payments commenced on July 1, 2017. The net proceeds of the Second Lien Notes were used, after payment of fees and expenses, to repay indebtedness outstanding under our Credit Agreement and for general corporate purposes.
All of our senior secured notes are guaranteed by certain of our wholly owned domestic hospital company subsidiaries and secured by a pledge of the capital stock and other ownership interests of those subsidiaries on either a first lien or second lien basis, as indicated in the table above. All of our senior secured notes and the related subsidiary guarantees are our and the subsidiary guarantors’ senior secured obligations. All of our senior secured notes rank equally in right of payment with all of our other senior secured indebtedness. Our senior secured notes rank senior to any subordinated indebtedness that we or such
116
subsidiary guarantors may incur; they are effectively senior to our and such subsidiary guarantors’ existing and future unsecured indebtedness and other liabilities to the extent of the value of the collateral securing the notes and the subsidiary guarantees; they are effectively subordinated to our and such subsidiary guarantors’ obligations under our Credit Agreement to the extent of the value of the collateral securing borrowings thereunder; and they are structurally subordinated to all obligations of our non-guarantor subsidiaries.
The indentures setting forth the terms of our senior secured notes contain provisions governing our ability to redeem the notes and the terms by which we may do so. At our option, we may redeem our senior secured notes, in whole or in part, at any time at a redemption price equal to
100%
of the principal amount of the notes redeemed plus the make-whole premium set forth in the related indenture, together with accrued and unpaid interest thereon, if any, to the redemption date. Certain series of the senior secured notes may also be redeemed, in whole or in part, at certain redemption prices set forth in the applicable indentures, together with accrued and unpaid interest. In addition, we may be required to purchase for cash all or any part of each series of our senior secured notes upon the occurrence of a change of control (as defined in the applicable indentures) for a cash purchase price of
101%
of the aggregate principal amount of the notes, plus accrued and unpaid interest.
All of our senior unsecured notes are general unsecured senior debt obligations that rank equally in right of payment with all of our other unsecured senior indebtedness, but are effectively subordinated to our senior secured notes described above, the obligations of our subsidiaries and any obligations under our Credit Agreement to the extent of the value of the collateral. We may redeem any series of our senior unsecured notes, in whole or in part, at any time at a redemption price equal to
100%
of the principal amount of the notes redeemed, plus a make-whole premium specified in the applicable indenture, if any, together with accrued and unpaid interest to the redemption date.
Covenants
Credit Agreement.
Our Credit Agreement contains customary covenants for an asset-backed facility, including a minimum fixed charge coverage ratio to be met if the designated excess availability under the revolving credit facility falls below
$100 million
, as well as limits on debt, asset sales and prepayments of senior debt. The Credit Agreement also includes a provision, which we believe is customary in receivables-backed credit facilities, that gives our lenders the right to require that proceeds of collections of substantially all of our consolidated accounts receivable be applied directly to repay outstanding loans and other amounts that are due and payable under the Credit Agreement at any time that unused borrowing availability under the revolving credit facility is less than
$100 million
for
three
consecutive business days or if an event of default has occurred and is continuing thereunder. In that event, we would seek to re-borrow under the Credit Agreement to satisfy our operating cash requirements. Our ability to borrow under the Credit Agreement is subject to conditions that we believe are customary in revolving credit facilities, including that no events of default then exist.
Senior Secured Notes.
The indentures governing our senior secured notes contain covenants that, among other things, restrict our ability and the ability of our subsidiaries to incur liens, consummate asset sales, enter into sale and lease-back transactions or consolidate, merge or sell all or substantially all of our or their assets, other than in certain transactions between one or more of our wholly owned subsidiaries. These restrictions, however, are subject to a number of exceptions and qualifications. In particular, there are no restrictions on our ability or the ability of our subsidiaries to incur additional indebtedness, make restricted payments, pay dividends or make distributions in respect of capital stock, purchase or redeem capital stock, enter into transactions with affiliates or make advances to, or invest in, other entities (including unaffiliated entities). In addition, the indentures governing our senior secured notes contain a covenant that neither we nor any of our subsidiaries will incur secured debt, unless at the time of and after giving effect to the incurrence of such debt, the aggregate amount of all such secured debt (including the aggregate principal amount of senior secured notes outstanding at such time) does not exceed the amount that would cause the secured debt ratio (as defined in the indentures) to exceed
4.0
to 1.0; provided that the aggregate amount of all such debt secured by a lien on par to the lien securing the senior secured notes may not exceed the amount that would cause the secured debt ratio to exceed
3.0
to 1.0.
Senior Unsecured Notes.
The indentures governing our senior unsecured notes contain covenants and conditions that have, among other requirements, limitations on (1) liens on “principal properties” and (2) sale and lease-back transactions with respect to principal properties. A principal property is defined in the senior unsecured notes indentures as a hospital that has an asset value on our books in excess of
5%
of our consolidated net tangible assets, as defined in such indentures. The above limitations do not apply, however, to (1) debt that is not secured by principal properties or (2) debt that is secured by principal properties if the aggregate of such secured debt does not exceed
15%
of our consolidated net tangible assets, as further described in the indentures. The senior unsecured notes indentures also prohibit the consolidation, merger or sale of all or substantially all assets unless no event of default would result after giving effect to such transaction.
117
Future Maturities
Future long-term debt maturities and minimum operating lease payments as of
December 31, 2017
are as follows:
|
|
|
Years Ending December 31,
|
Later Years
|
||||||||||||||||||||||||
|
|
Total
|
2018
|
2019
|
2020
|
2021
|
2022
|
|||||||||||||||||||||
|
Long-term debt, including capital lease obligations
|
$
|
15,168
|
|
$
|
146
|
|
$
|
591
|
|
$
|
2,667
|
|
$
|
1,940
|
|
$
|
3,577
|
|
$
|
6,247
|
|
||||||
|
Long-term non-cancelable operating leases
|
$
|
1,217
|
|
$
|
211
|
|
$
|
180
|
|
$
|
150
|
|
$
|
129
|
|
$
|
104
|
|
$
|
443
|
|
||||||
Rental expense under operating leases, including short-term leases, was
$340 million
,
$335 million
and
$292 million
in the years ended
December 31, 2017
,
2016
and
2015
, respectively. Included in rental expense for each of these periods was sublease income of
$14 million
,
$13 million
and
$12 million
, respectively, which were recorded as a reduction to rental expense.
Consistent with our policy on physician relocation and recruitment, we provide income guarantee agreements to certain physicians who agree to relocate to fill a community need in the service area of one of our hospitals and commit to remain in practice in the area for a specified period of time. Under such agreements, we are required to make payments to the physicians in excess of the amounts they earn in their practices up to the amount of the income guarantee. The income guarantee periods are typically
12
months. If a physician does not fulfill his or her commitment period to the community, which is typically
three
years subsequent to the guarantee period, we seek recovery of the income guarantee payments from the physician on a prorated basis. We also provide revenue collection guarantees to hospital-based physician groups providing certain services at our hospitals with terms generally ranging from
one
to
three
years.
At
December 31, 2017
, the maximum potential amount of future payments under our income guarantees to certain physicians who agree to relocate and revenue collection guarantees to hospital-based physician groups providing certain services at our hospitals was
$163 million
. We had a total liability of
$138 million
recorded for these guarantees included in other current liabilities at
December 31, 2017
.
At
December 31, 2017
, we also had issued guarantees of the indebtedness and other obligations of our investees to third parties, the maximum potential amount of future payments under which was approximately
$23 million
. Of the total,
$18 million
relates to the obligations of consolidated subsidiaries, which obligations are recorded in the accompanying Consolidated Balance Sheet at
December 31, 2017
.
Share-Based Compensation Plans
We currently grant stock-based awards to our directors and key employees pursuant to our 2008 Stock Incentive Plan, as amended. At December 31, 2017, assuming outstanding performance-based restricted stock units for which performance has not yet been determined will achieve Target performance, approximately
5.7 million
shares of common stock were available under our 2008 Stock Incentive Plan for future stock option grants and other incentive awards, including restricted stock units (
4.7 million
shares remain available if we assume Maximum performance for outstanding performance restricted stock units for which performance has not yet been determined). Options have an exercise price equal to the fair market value of the shares on the date of grant and generally expire
10
years from the date of grant. A restricted stock unit is a contractual right to receive
one
share of our common stock or the equivalent value in cash in the future. Options and time-based restricted stock units typically vest one-third on each of the first
three
anniversary dates of the grant. In addition, we grant performance-based options and/or restricted stock units that vest subject to the achievement of specified performance goals within a specified timeframe.
Our Consolidated Statement of Operations for the years ended
December 31, 2017
,
2016
and
2015
includes
$59 million
,
$60 million
and
$77 million
, respectively, of pre-tax compensation costs related to our stock-based compensation arrangements (
$37 million
,
$38 million
and
$48 million
, respectively, after-tax). The table below shows certain stock option and restricted stock unit grants and other awards that comprise the stock-based compensation expense recorded in the year ended
December 31, 2017
. Compensation cost is measured by the fair value of the awards on their grant dates and is recognized over the requisite service period of the awards, whether or not the awards had any intrinsic value during the period.
118
|
Grant Date
|
Awards
|
Exercise Price
Per Share
|
Fair Value
Per Share at
Grant Date
|
Stock-Based
Compensation Expense for Year Ended December 31, 2017
|
||||||||
|
|
(In Thousands)
|
|
|
(In Millions)
|
||||||||
|
Stock Options:
|
||||||||||||
|
September 29, 2017
|
409
|
|
16.43
|
5.63
|
|
1
|
|
|||||
|
March 1, 2017
|
928
|
|
18.99
|
8.52
|
|
3
|
|
|||||
|
Restricted Stock Units:
|
|
|
|
|
|
|
|
|||||
|
May 5, 2017
|
145
|
|
17.83
|
|
2
|
|
||||||
|
March 1, 2017
|
430
|
|
|
18.99
|
|
4
|
|
|||||
|
June 30, 2016
|
130
|
|
27.64
|
|
1
|
|
||||||
|
March 10, 2016
|
541
|
|
|
25.50
|
|
6
|
|
|||||
|
February 25, 2015
|
1,375
|
|
|
45.63
|
|
20
|
|
|||||
|
August 25, 2014
|
510
|
|
|
59.90
|
|
5
|
|
|||||
|
June 13, 2013
|
282
|
|
|
47.13
|
|
2
|
|
|||||
|
Other grants
|
|
|
|
|
|
15
|
|
|||||
|
|
|
|
|
|
|
$
|
59
|
|
||||
Prior to our shareholders approving the 2008 Stock Incentive Plan, we granted stock-based awards to our directors and employees pursuant to other plans. Stock options remain outstanding under those other plans, but
no
additional stock-based awards will be granted under them.
Pursuant to the terms of our stock-based compensation plans, awards granted under the plans vest and may be exercised as determined by the human resources committee of our board of directors. In the event of a change in control, the human resources committee of our Board of Directors may, at its sole discretion without obtaining shareholder approval, accelerate the vesting or performance periods of the awards.
Stock Options
The following table summarizes stock option activity during the years ended
December 31, 2017
,
2016
and
2015
:
|
|
Options
|
Weighted Average
Exercise Price
Per Share
|
Aggregate
Intrinsic Value
|
Weighted Average
Remaining Life
|
|||||||||
|
|
|
|
(In Millions)
|
|
|||||||||
|
Outstanding at December 31, 2014
|
1,984,149
|
|
$
|
24.42
|
|
|
|
|
|||||
|
Granted
|
—
|
|
—
|
|
|
|
|
||||||
|
Exercised
|
(340,869
|
)
|
29.85
|
|
|
|
|
||||||
|
Forfeited/Expired
|
(36,438
|
)
|
42.08
|
|
|
|
|
||||||
|
Outstanding at December 31, 2015
|
1,606,842
|
|
$
|
22.87
|
|
|
|
|
|||||
|
Granted
|
—
|
|
—
|
|
|
|
|
||||||
|
Exercised
|
(111,715
|
)
|
17.88
|
|
|
|
|
||||||
|
Forfeited/Expired
|
(59,206
|
)
|
18.68
|
|
|
|
|
||||||
|
Outstanding at December 31, 2016
|
1,435,921
|
|
$
|
22.87
|
|
|
|
|
|||||
|
Granted
|
1,396,307
|
|
18.24
|
|
|
|
|
||||||
|
Exercised
|
(20,400
|
)
|
4.56
|
|
|
|
|
||||||
|
Forfeited/Expired
|
(247,006
|
)
|
24.37
|
|
|
|
|
||||||
|
Outstanding at December 31, 2017
|
2,564,822
|
|
$
|
20.35
|
|
$
|
2
|
|
4.8 years
|
||||
|
Vested and expected to vest at December 31, 2017
|
1,233,497
|
|
$
|
22.67
|
|
$
|
2
|
|
1.5 years
|
||||
|
Exercisable at December 31, 2017
|
1,233,497
|
|
$
|
22.67
|
|
$
|
2
|
|
1.5 years
|
||||
There were
20,400
stock options exercised during the year ended
December 31, 2017
with an aggregated intrinsic value less than
$1 million
, and
111,715
stock options exercised during the same period in 2016 with an aggregate intrinsic value of approximately
$1 million
. There were
1,396,307
performance-based stock options granted in the year ended
December 31, 2017
, with
no
stock options granted in the year ended
December 31, 2016
. On
March 1, 2017
, we granted
987,781
stock options to certain of our senior officers. These stock options will vest on the
third
anniversary of the grant date, subject to achieving a closing stock price of at least
$23.74
(a
25%
premium above the grant date closing stock price of
$18.99
) for
twenty
consecutive trading days within
three
years of the grant date, and will expire on the
tenth
anniversary of the grant date. On
September 29, 2017
, we granted our executive chairman
408,526
performance-based stock options. The options vest
119
on the
first
anniversary of the grant date and become exercisable only if the average closing stock price calculated over any period of
thirty
sequential trading days during a
four
year performance period equals or exceeds
$20.53
(a
25%
premium above the grant date closing stock price of
$16.43
). The options expire on the
fifth
anniversary of the grant date.
The weighted average estimated fair value of stock options we granted during the year ended
December 31, 2017
was
$7.64
per share. The fair values were calculated based on the grant dates, using a Monte Carlo simulation with the following assumptions:
|
September 29,
|
March 1,
|
|||
|
2017
|
2017
|
|||
|
Expected volatility
|
46%
|
49%
|
||
|
Expected dividend yield
|
0%
|
0%
|
||
|
Expected life
|
3.01 years
|
6.2 years
|
||
|
Expected forfeiture rate
|
0%
|
0%
|
||
|
Risk-free interest rate
|
1.92%
|
2.15%
|
||
The following table summarizes information about our outstanding stock options at
December 31, 2017
:
|
|
Options Outstanding
|
Options Exercisable
|
||||||||||||||
|
Range of Exercise Prices
|
Number of
Options
|
Weighted Average
Remaining
Contractual Life
|
Weighted Average
Exercise Price
|
Number of
Options
|
Weighted Average
Exercise Price
|
|||||||||||
|
$0.00 to $4.569
|
150,486
|
|
1.2 years
|
$
|
4.56
|
|
150,486
|
|
$
|
4.56
|
|
|||||
|
$4.57 to $19.759
|
1,337,059
|
|
7.8 years
|
18.21
|
|
5,734
|
|
18.76
|
|
|||||||
|
$19.76 to $32.569
|
822,890
|
|
1.8 years
|
20.87
|
|
822,890
|
|
20.87
|
|
|||||||
|
$32.57 to $42.529
|
254,387
|
|
0.2 years
|
39.31
|
|
254,387
|
|
39.31
|
|
|||||||
|
|
2,564,822
|
|
4.8 years
|
$
|
20.35
|
|
1,233,497
|
|
$
|
22.67
|
|
|||||
As of
December 31, 2017
, approximately
46.2%
of all our outstanding options were held by current employees and approximately
53.8%
were held by former employees. Approximately
21.8%
of our outstanding options were in-the-money, that is, they had exercise price less than the
$15.16
market price of our common stock on
December 31, 2017
, and approximately
78.2%
were out-of-the-money, that is, they had an exercise price of more than
$15.16
as shown in the table below:
|
|
In-the-Money Options
|
Out-of-the-Money Options
|
All Options
|
|||||||||||||||
|
|
Outstanding
|
% of Total
|
Outstanding
|
% of Total
|
Outstanding
|
% of Total
|
||||||||||||
|
Current employees
|
508,193
|
|
90.9
|
%
|
676,734
|
|
33.7
|
%
|
1,184,927
|
|
46.2
|
%
|
||||||
|
Former employees
|
50,819
|
|
9.1
|
%
|
1,329,076
|
|
66.3
|
%
|
1,379,895
|
|
53.8
|
%
|
||||||
|
Totals
|
559,012
|
|
100.0
|
%
|
2,005,810
|
|
100.0
|
%
|
2,564,822
|
|
100.0
|
%
|
||||||
|
% of all outstanding options
|
21.8
|
%
|
|
|
78.2
|
%
|
|
|
100.0
|
%
|
|
|
||||||
120
Restricted Stock Units
The following table summarizes restricted stock unit activity during the years ended
December 31, 2017
,
2016
and
2015
:
|
|
Restricted Stock Units
|
Weighted Average Grant Date Fair Value Per Unit
|
|||||
|
Unvested at December 31, 2014
|
3,299,720
|
|
$
|
40.99
|
|
||
|
Granted
|
1,718,057
|
|
45.51
|
|
|||
|
Vested
|
(1,210,159
|
)
|
38.40
|
|
|||
|
Forfeited
|
(180,386
|
)
|
42.46
|
|
|||
|
Unvested at December 31, 2015
|
3,627,232
|
|
$
|
44.69
|
|
||
|
Granted
|
1,626,329
|
|
30.05
|
|
|||
|
Vested
|
(1,644,616
|
)
|
42.95
|
|
|||
|
Forfeited
|
(434,412
|
)
|
38.59
|
|
|||
|
Unvested at December 31, 2016
|
3,174,533
|
|
$
|
38.75
|
|
||
|
Granted
|
714,018
|
|
18.25
|
|
|||
|
Vested
|
(1,397,953
|
)
|
35.50
|
|
|||
|
Forfeited
|
(236,610
|
)
|
32.13
|
|
|||
|
Unvested at December 31, 2017
|
2,253,988
|
|
$
|
35.20
|
|
||
In the year ended
December 31, 2017
, we granted
714,018
restricted stock units of which
518,229
will vest and be settled ratably over a
three
-year period from the grant date. In addition, in May 2017, we made an annual grant of
145,179
restricted stock units to our non-employee directors for the 2017-2018 board service year, which units vested immediately and will settle in shares of our common stock on the third anniversary of the date of the grant. The Board of Directors appointed
three
new members,
one
in October 2017 and
two
in November 2017. We made initial grants totaling
13,772
restricted stock units to these directors, as well as prorated annual grants totaling
23,935
restricted stock units. Both the initial grants and the annual grants vested immediately, however the initial grants will not settle until the directors’ separation from the Board, while the annual grants settle on the third anniversary of the grant date. In addition, we granted
12,903
performance-based restricted stock units to certain of our senior officers; the vesting of these restricted stock units is contingent on our achievement of specified
three
-year performance goals for the years 2017 to 2019. Provided the goals are achieved, the performance-based restricted stock units will vest and settle on the third anniversary of the grant date. The actual number of performance-based restricted stock units that could vest will range from
0%
to
200%
of the
12,903
units granted, depending on our level of achievement with respect to the performance goals.
In the year ended
December 31, 2016
, we granted
737,493
restricted stock units subject to time-vesting, of which
504,511
will vest and be settled ratably over a
three
-year period from the grant date,
57,139
will vest and be settled on the third anniversary of the grant date and
175,843
will vest and be settled on the fifth anniversary of the grant date. In addition, in May 2016, we made an annual grant of
90,105
restricted stock units to our non-employee directors for the 2016-2017 board service year, which units vested immediately and will settle in shares of our common stock on the third anniversary of the date of the grant. The Board of Directors appointed
four
new members,
two
in January 2016 and
two
in November 2016. We made initial grant totaling
13,190
restricted stock units to these directors, as well as a prorated annual grants totaling
19,648
restricted stock units. Both the initial grants and the annual grants vested immediately, however the initial grants will not settle until the directors’ separation from the Board, while the annual grants settle on the third anniversary of the grant date. In addition, we granted
474,443
performance-based restricted stock units to certain of our senior officers; the vesting of these restricted stock units is contingent on our achievement of specified
three
-year performance goals for the years 2016 to 2018. Provided the goals are achieved, the performance-based restricted stock units will vest and settle on the third anniversary of the grant date. The actual number of performance-based restricted stock units that could vest will range from
0%
to
200%
of the
474,443
units granted, depending on our level of achievement with respect to the performance goals. Moreover, in the year ended December 31, 2016, we granted
291,540
restricted stock units as a result of our level of achievement with respect to prior-year target performance goals.
As of
December 31, 2017
, there were
$23 million
of total unrecognized compensation costs related to restricted stock units. These costs are expected to be recognized over a weighted average period of
1.9
years.
Employee Stock Purchase Plan
We have an employee stock purchase plan under which we are currently authorized to issue up to
5,062,500
shares of common stock to our eligible employees. As of
December 31, 2017
, there were approximately
3,457,222
shares available for
121
issuance under our employee stock purchase plan. Under the terms of the plan, eligible employees may elect to have between
1%
and
10%
of their base earnings withheld each quarter to purchase shares of our common stock. Shares are purchased at a price equal to
95%
of the closing price on the last day of the quarter. The plan requires a
one
-year holding period for all shares issued. The holding period does not apply upon termination of employment. Under the plan, no individual may purchase, in any year, shares with a fair market value in excess of
$25,000
. The plan is currently not considered to be compensatory.
We sold the following numbers of shares under our employee stock purchase plan in the years ended
December 31, 2017
,
2016
and
2015
:
|
|
Years Ended December 31,
|
|||||||||||
|
|
2017
|
2016
|
2015
|
|||||||||
|
Number of shares
|
395,957
|
|
217,184
|
|
145,290
|
|
||||||
|
Weighted average price
|
$
|
17.28
|
|
$
|
17.21
|
|
$
|
43.96
|
|
|||
Employee Retirement Plans
Substantially all of our employees, upon qualification, are eligible to participate in
one
of our defined contribution 401(k) plans. Under the plans, employees may contribute a portion of their eligible compensation, and we match such contributions annually up to a maximum percentage for participants actively employed, as defined by the plan documents. Employer matching contributions will vary by plan. Plan expenses, primarily related to our contributions to the plans, were approximately
$128 million
,
$116 million
and
$105 million
for the years ended
December 31, 2017
,
2016
and
2015
, respectively. Such amounts are reflected in salaries, wages and benefits in the accompanying Consolidated Statements of Operations.
We maintain
three
frozen non-qualified defined benefit pension plans (“SERPs”) that provide supplemental retirement benefits to certain of our current and former executives. One of these SERPs was frozen during the year ended December 31, 2014. These plans are not funded, and plan obligations for these plans are paid from our working capital. Pension benefits are generally based on years of service and compensation. Upon completing the acquisition of Vanguard on October 1, 2013, we assumed a frozen qualified defined benefit plan (“DMC Pension Plan”) covering substantially all of the employees of our Detroit market that were hired prior to June 1, 2003. The benefits paid under the DMC Pension Plan are primarily based on years of service and final average earnings. During the years ended
December 31, 2017
and
2016
, the Society of Actuaries issued new mortality improvement scales (MP-2017 and MP‑2016, respectively), which we incorporated into the estimates of our defined benefit plan obligations at
December 31, 2017
and
2016
. These changes to our mortality assumptions decreased our projected benefit obligations as of
December 31, 2017
and
2016
by approximately
$10 million
and
$20 million
, respectively. The following tables summarize the balance sheet impact, as well as the benefit obligations, funded status and rate assumptions associated with the SERPs and the DMC Pension Plan based on actuarial valuations prepared as of
December 31, 2017
and
2016
:
122
|
|
December 31,
|
|||||||
|
|
2017
|
2016
|
||||||
|
Reconciliation of funded status of plans and the amounts included in the Consolidated Balance Sheets:
|
|
|
|
|
||||
|
Projected benefit obligations
(1)
|
|
|
|
|
||||
|
Beginning obligations
|
$
|
(1,475
|
)
|
$
|
(1,455
|
)
|
||
|
Service cost
|
(2
|
)
|
(2
|
)
|
||||
|
Interest cost
|
(62
|
)
|
(69
|
)
|
||||
|
Actuarial gain(loss)
|
(31
|
)
|
(58
|
)
|
||||
|
Benefits paid
|
120
|
|
109
|
|
||||
|
Special termination benefit costs
|
(5
|
)
|
—
|
|
||||
|
Ending obligations
|
(1,455
|
)
|
(1,475
|
)
|
||||
|
Fair value of plans assets
|
|
|
|
|
||||
|
Beginning plan assets
|
786
|
|
815
|
|
||||
|
Gain on plan assets
|
122
|
|
36
|
|
||||
|
Employer contribution
|
43
|
|
25
|
|
||||
|
Benefits paid
|
(101
|
)
|
(90
|
)
|
||||
|
Ending plan assets
|
850
|
|
786
|
|
||||
|
Funded status of plans
|
$
|
(605
|
)
|
$
|
(689
|
)
|
||
|
Amounts recognized in the Consolidated Balance Sheets consist of:
|
|
|
|
|
||||
|
Other current liability
|
$
|
(69
|
)
|
$
|
(63
|
)
|
||
|
Other long-term liability
|
$
|
(536
|
)
|
$
|
(626
|
)
|
||
|
Accumulated other comprehensive loss
|
$
|
266
|
|
$
|
322
|
|
||
|
SERP Assumptions:
|
|
|
|
|
||||
|
Discount rate
|
3.75
|
%
|
4.25
|
%
|
||||
|
Compensation increase rate
|
3.00
|
%
|
3.00
|
%
|
||||
|
Measurement date
|
December 31, 2017
|
|
December 31, 2016
|
|
||||
|
DMC Pension Plan Assumptions:
|
|
|
|
|
||||
|
Discount rate
|
4.00
|
%
|
4.42
|
%
|
||||
|
Compensation increase rate
|
Frozen
|
|
Frozen
|
|
||||
|
Measurement date
|
December 31, 2017
|
|
December 31, 2016
|
|
||||
|
(1)
|
The accumulated benefit obligation at
December 31, 2017
and
2016
was approximately
$1.448 billion
and
$1.461 billion
, respectively.
|
The components of net periodic benefit costs and related assumptions are as follows:
|
|
Years Ended December 31,
|
|||||||||||
|
|
2017
|
2016
|
2015
|
|||||||||
|
Service costs
|
$
|
2
|
|
$
|
2
|
|
$
|
3
|
|
|||
|
Interest costs
|
62
|
|
69
|
|
64
|
|
||||||
|
Expected return on plan assets
|
(50
|
)
|
(51
|
)
|
(57
|
)
|
||||||
|
Amortization of net actuarial loss
|
14
|
|
12
|
|
12
|
|
||||||
|
Net periodic benefit cost
|
$
|
28
|
|
$
|
32
|
|
$
|
22
|
|
|||
|
SERP Assumptions:
|
|
|
|
|
|
|
||||||
|
Discount rate
|
4.25
|
%
|
4.75
|
%
|
4.25
|
%
|
||||||
|
Long-term rate of return on assets
|
n/a
|
|
n/a
|
|
n/a
|
|
||||||
|
Compensation increase rate
|
3.00
|
%
|
3.00
|
%
|
3.00
|
%
|
||||||
|
Measurement date
|
January 1, 2017
|
|
January 1, 2016
|
|
January 1, 2015
|
|
||||||
|
Census date
|
January 1, 2017
|
|
January 1, 2016
|
|
January 1, 2015
|
|
||||||
|
DMC Pension Plan Assumptions:
|
|
|
|
|
|
|
||||||
|
Discount rate
|
4.42
|
%
|
4.67
|
%
|
4.16
|
%
|
||||||
|
Long-term rate of return on assets
|
6.50
|
%
|
6.50
|
%
|
6.50
|
%
|
||||||
|
Compensation increase rate
|
Frozen
|
|
Frozen
|
|
Frozen
|
|
||||||
|
Measurement date
|
January 1, 2017
|
|
January 1, 2016
|
|
January 1, 2015
|
|
||||||
|
Census date
|
January 1, 2017
|
|
January 1, 2016
|
|
January 1, 2015
|
|
||||||
Net periodic benefit costs for the current year are based on assumptions determined at the valuation date of the prior year for the SERPs and the DMC Pension Plan. As a result of the adoption of ASU 2017-07 discussed in Note 1 and Note 21,
123
we recognized service costs in salaries, wages and benefits expense, and recognized other components of net periodic benefit cost in other non-operating expense, net, in the accompanying Consolidated Statements of Operations.
We recorded gain/(loss) adjustments of
$56 million
,
$(61) million
and
$15 million
in other comprehensive income (loss) in the years ended
December 31, 2017
,
2016
and
2015
, respectively, to recognize changes in the funded status of our SERPs and the DMC Pension Plan. Changes in the funded status are recorded as a direct increase or decrease to shareholders’ equity through accumulated other comprehensive loss. Net actuarial gains/(losses) of
$42 million
,
$(73) million
and
$3 million
during the years ended
December 31, 2017
,
2016
and
2015
, respectively, and the amortization of net actuarial loss of
$14 million
,
$12 million
and
$12 million
for the years ended
December 31, 2017
,
2016
and
2015
, respectively, were recognized in other comprehensive income (loss). Cumulative net actuarial losses of
$266 million
,
$322 million
and
$261 million
as of
December 31, 2017
,
2016
and
2015
, respectively, and unrecognized prior service costs of less than
$1 million
as of each of the years ended
December 31, 2017
,
2016
and
2015
, have not yet been recognized as components of net periodic benefit costs.
To develop the expected long-term rate of return on plan assets assumption, the DMC Pension Plan considers the current level of expected returns on risk-free investments (primarily government bonds), the historical level of risk premium associated with the other asset classes in which the portfolio is invested and the expectations for future returns on each asset class. The expected return for each asset class is then weighted based on the target asset allocation to develop the expected long-term rate of return on assets assumption for the portfolio. The weighted-average asset allocations by asset category as of
December 31, 2017
, were as follows:
|
Asset Category
|
Target
|
Actual
|
||||
|
Cash and cash equivalents
|
1
|
%
|
6
|
%
|
||
|
United States government obligations
|
1
|
%
|
1
|
%
|
||
|
Equity securities
|
62
|
%
|
57
|
%
|
||
|
Debt Securities
|
36
|
%
|
36
|
%
|
||
The DMC Pension Plan assets are invested in separately managed portfolios using investment management firms. The objective for all asset categories is to maximize total return without assuming undue risk exposure. The DMC Pension Plan maintains a well-diversified asset allocation that best meets these objectives. The DMC Pension Plan assets are largely comprised of equity securities, which include companies with various market capitalization sizes in addition to international and convertible securities. Cash and cash equivalents are comprised of money market funds. Debt securities include domestic and foreign government obligations, corporate bonds, and mortgage-backed securities. Under the investment policy of the DMC Pension Plan, investments in derivative securities are not permitted for the sole purpose of speculating on the direction of market interest rates. Included in this prohibition are leveraging, shorting, swaps, futures, options, forwards, and similar strategies.
In each investment account, the DMC Pension Plan investment managers are responsible to monitor and react to economic indicators, such as gross domestic product, consumer price index and U.S. monetary policy that may affect the performance of their account. The performance of all managers and the aggregate asset allocation are formally reviewed on a quarterly basis, with a rebalancing of the asset allocation occurring at least once a year. The current asset allocation objective is to maintain a certain percentage with each class allowing for a
10%
deviation from the target.
The following tables summarize the DMC Pension Plan assets measured at fair value on a recurring basis as of
December 31, 2017
and
2016
, aggregated by the level in the fair value hierarchy within which those measurements are determined. Fair value methodologies for Level 1, Level 2 and Level 3 are consistent with the inputs described in Note 18.
|
|
December 31, 2017
|
Level 1
|
Level 2
|
Level 3
|
||||||||||||
|
Cash and cash equivalents
|
$
|
49
|
|
$
|
49
|
|
$
|
—
|
|
$
|
—
|
|
||||
|
United States government obligations
|
5
|
|
5
|
|
—
|
|
—
|
|
||||||||
|
Fixed income funds
|
308
|
|
308
|
|
—
|
|
—
|
|
||||||||
|
Equity securities
|
488
|
|
488
|
|
—
|
|
—
|
|
||||||||
|
|
$
|
850
|
|
$
|
850
|
|
$
|
—
|
|
$
|
—
|
|
||||
|
|
December 31, 2016
|
Level 1
|
Level 2
|
Level 3
|
||||||||||||
|
Cash and cash equivalents
|
$
|
60
|
|
$
|
60
|
|
$
|
—
|
|
$
|
—
|
|
||||
|
United States government obligations
|
5
|
|
5
|
|
—
|
|
—
|
|
||||||||
|
Fixed income funds
|
335
|
|
335
|
|
—
|
|
—
|
|
||||||||
|
Equity securities
|
386
|
|
386
|
|
—
|
|
—
|
|
||||||||
|
|
$
|
786
|
|
$
|
786
|
|
$
|
—
|
|
$
|
—
|
|
||||
124
The following table presents the estimated future benefit payments to be made from the SERPs and the DMC Pension Plan, a portion of which will be funded from plan assets, for the next five years and in the aggregate for the five years thereafter:
|
|
|
Years Ending December 31,
|
Five Years
|
|||||||||||||||||||||||||
|
|
Total
|
2018
|
2019
|
2020
|
2021
|
2022
|
Thereafter
|
|||||||||||||||||||||
|
Estimated benefit payments
|
$
|
936
|
|
$
|
88
|
|
$
|
91
|
|
$
|
93
|
|
$
|
94
|
|
$
|
94
|
|
$
|
476
|
|
|||||||
The SERP and DMC Pension Plan obligations of
$605 million
at
December 31, 2017
are classified in the accompanying Consolidated Balance Sheet as an other current liability (
$69 million
) and defined benefit plan obligations (
$536 million
) based on an estimate of the expected payment patterns. We expect to make total contributions to the plans of approximately
$69 million
for the year ending December 31,
2018
.
The principal components of property and equipment are shown in the table below:
|
|
December 31,
|
||||||
|
|
2017
|
2016
|
|||||
|
Land
|
$
|
602
|
|
$
|
667
|
|
|
|
Buildings and improvements
|
6,837
|
|
7,277
|
|
|||
|
Construction in progress
|
109
|
|
339
|
|
|||
|
Equipment
|
4,221
|
|
4,744
|
|
|||
|
|
11,769
|
|
13,027
|
|
|||
|
Accumulated depreciation and amortization
|
(4,739
|
)
|
(4,974
|
)
|
|||
|
Net property and equipment
|
$
|
7,030
|
|
$
|
8,053
|
|
|
Property and equipment is stated at cost, less accumulated depreciation and amortization and impairment write-downs related to assets held and used.
The following table provides information on changes in the carrying amount of goodwill, which is included in the accompanying Consolidated Balance Sheets as of
2017
and
2016
:
|
|
2017
|
|
2016
|
||||
|
Hospital Operations and other
|
|
|
|
|
|||
|
As of January 1:
|
|
|
|
|
|||
|
Goodwill
|
$
|
5,803
|
|
$
|
5,552
|
|
|
|
Accumulated impairment losses
|
(2,430
|
)
|
(2,430
|
)
|
|||
|
Total
|
3,373
|
|
3,122
|
|
|||
|
Goodwill acquired during the year and purchase price allocation adjustments
|
5
|
|
251
|
|
|||
|
Goodwill allocated to assets held for sale
|
(402
|
)
|
—
|
|
|||
|
Total
|
$
|
2,976
|
|
$
|
3,373
|
|
|
|
As of December 31:
|
|
|
|
|
|||
|
Goodwill
|
$
|
5,406
|
|
$
|
5,803
|
|
|
|
Accumulated impairment losses
|
(2,430
|
)
|
(2,430
|
)
|
|||
|
Total
|
$
|
2,976
|
|
$
|
3,373
|
|
|
125
|
2017
|
2016
|
||||||
|
Ambulatory Care
|
|||||||
|
As of January 1:
|
|
|
|
|
|||
|
Goodwill
|
$
|
3,447
|
|
$
|
3,243
|
|
|
|
Accumulated impairment losses
|
—
|
|
—
|
|
|||
|
Total
|
3,447
|
|
3,243
|
|
|||
|
Goodwill acquired during the year and purchase price allocation adjustments
|
86
|
|
236
|
|
|||
|
Goodwill allocated to assets held for sale
|
(103
|
)
|
—
|
|
|||
|
Impact of foreign currency translation
|
7
|
|
(32
|
)
|
|||
|
Total
|
$
|
3,437
|
|
$
|
3,447
|
|
|
|
As of December 31:
|
|
|
|
|
|||
|
Goodwill
|
$
|
3,437
|
|
$
|
3,447
|
|
|
|
Accumulated impairment losses
|
—
|
|
—
|
|
|||
|
Total
|
$
|
3,437
|
|
$
|
3,447
|
|
|
|
|
2017
|
2016
|
|||||
|
Conifer
|
|
|
|
|
|||
|
As of January 1:
|
|
|
|
|
|||
|
Goodwill
|
$
|
605
|
|
$
|
605
|
|
|
|
Accumulated impairment losses
|
—
|
|
—
|
|
|||
|
Total
|
605
|
|
605
|
|
|||
|
Goodwill acquired during the year and purchase price allocation adjustments
|
—
|
|
—
|
|
|||
|
Total
|
$
|
605
|
|
$
|
605
|
|
|
|
As of December 31:
|
|
|
|
|
|||
|
Goodwill
|
$
|
605
|
|
$
|
605
|
|
|
|
Accumulated impairment losses
|
—
|
|
—
|
|
|||
|
Total
|
$
|
605
|
|
$
|
605
|
|
|
The following table provides information regarding other intangible assets, which are included in the accompanying Consolidated Balance Sheets as of
2017
and
2016
:
|
|
Gross
Carrying
Amount
|
Accumulated
Amortization
|
Net Book
Value
|
||||||||
|
At December 31, 2017:
|
|
|
|
|
|
|
|||||
|
Capitalized software costs
|
$
|
1,582
|
|
$
|
(754
|
)
|
$
|
828
|
|
||
|
Trade names
|
102
|
|
—
|
|
102
|
|
|||||
|
Contracts
|
859
|
|
(60
|
)
|
799
|
|
|||||
|
Other
|
106
|
|
(69
|
)
|
37
|
|
|||||
|
Total
|
$
|
2,649
|
|
$
|
(883
|
)
|
$
|
1,766
|
|
||
|
At December 31, 2016:
|
|
|
|
|
|
|
|||||
|
Capitalized software costs
|
$
|
1,562
|
|
$
|
(676
|
)
|
$
|
886
|
|
||
|
Trade Names
|
106
|
|
—
|
|
106
|
|
|||||
|
Contracts
|
845
|
|
(43
|
)
|
802
|
|
|||||
|
Other
|
104
|
|
(53
|
)
|
51
|
|
|||||
|
Total
|
$
|
2,617
|
|
$
|
(772
|
)
|
$
|
1,845
|
|
||
Estimated future amortization of intangibles with finite useful lives as of
December 31, 2017
is as follows:
|
|
Total
|
Years Ending December 31,
|
Later Years
|
||||||||||||||||||||||||
|
|
2018
|
2019
|
2020
|
2021
|
2022
|
||||||||||||||||||||||
|
Amortization of intangible assets
|
$
|
1,101
|
|
$
|
154
|
|
$
|
137
|
|
$
|
111
|
|
$
|
96
|
|
$
|
85
|
|
$
|
518
|
|
||||||
We recognized amortization expense of
$172 million
,
$152 million
and
$144 million
in the accompanying Consolidated Statements of Operations for the years ended
December 31, 2017
,
2016
and
2015
, respectively.
126
The principal components of investments and other assets in the accompanying Consolidated Balance Sheets are as follows:
|
|
December 31,
|
||||||
|
|
2017
|
2016
|
|||||
|
Marketable debt securities
|
$
|
56
|
|
$
|
49
|
|
|
|
Equity investments in unconsolidated healthcare entities
|
958
|
|
935
|
|
|||
|
Total investments
|
1,014
|
|
984
|
|
|||
|
Cash surrender value of life insurance policies
|
32
|
|
28
|
|
|||
|
Long-term deposits
|
37
|
|
34
|
|
|||
|
California provider fee program receivables
|
266
|
|
—
|
|
|||
|
Land held for expansion, other long-term receivables and other assets
|
194
|
|
204
|
|
|||
|
Investments and other assets
|
$
|
1,543
|
|
$
|
1,250
|
|
|
Our policy is to classify investments that may be needed for cash requirements as “available-for-sale.” In doing so, the carrying values of the shares and debt instruments are adjusted at the end of each accounting period to their market values through a credit or charge to other comprehensive income (loss), net of taxes.
Our accumulated other comprehensive loss is comprised of the following:
|
|
December 31,
|
||||||
|
|
2017
|
2016
|
|||||
|
Adjustments for defined benefit plans
|
$
|
(170
|
)
|
$
|
(205
|
)
|
|
|
Foreign currency translation adjustments
|
(38
|
)
|
(53
|
)
|
|||
|
Unrealized gains on investments
|
$
|
4
|
|
$
|
—
|
|
|
|
Accumulated other comprehensive loss
|
$
|
(204
|
)
|
$
|
(258
|
)
|
|
The tax expense allocated to the adjustments for our defined benefit plans, foreign currency translation adjustments and unrealized gains on investments were approximately
$15 million
,
$5 million
and
$3 million
, respectively, for the year ended
December 31, 2017
, and
$18 million
of tax benefit was allocated to the adjustments for our defined benefit plans for the year ended
December 31, 2016
.
Property Insurance
We have property, business interruption and related insurance coverage to mitigate the financial impact of catastrophic events or perils that is subject to deductible provisions based on the terms of the policies. These policies are on an occurrence basis. For the policy period April 1, 2017 through March 31, 2018, we have coverage totaling
$850 million
per occurrence, after deductibles and exclusions, with annual aggregate sub-limits of
$100 million
for floods,
$200 million
for earthquakes and a per-occurrence sub-limit of
$200 million
for named windstorms with no annual aggregate. With respect to fires and other perils, excluding floods, earthquakes and named windstorms, the total
$850 million
limit of coverage per occurrence applies. Deductibles are
5%
of insured values up to a maximum of
$25 million
for California earthquakes, floods and wind-related claims, and
2%
of insured values for New Madrid fault earthquakes, with a maximum per claim deductible of
$25 million
. Floods and certain other covered losses, including fires and other perils, have a minimum deductible of
$1 million
.
Professional and General Liability Reserves
At
December 31, 2017
and
2016
, the aggregate current and long-term professional and general liability reserves in the accompanying Consolidated Balance Sheets were approximately
$854 million
and
$794 million
, respectively. These reserves include the reserves recorded by our captive insurance subsidiaries and our self-insured retention reserves recorded based on modeled estimates for the portion of our professional and general liability risks, including incurred but not reported claims, for which we do not have insurance coverage. We estimated the reserves for losses and related expenses using expected loss-reporting patterns discounted to their present value under a risk-free rate approach using a Federal Reserve
seven
-year maturity rate of
2.33%
,
2.25%
and
2.09%
at
December 31, 2017
,
2016
and
2015
, respectively.
127
If the aggregate limit of any of our professional and general liability policies is exhausted, in whole or in part, it could deplete or reduce the limits available to pay any other material claims applicable to that policy period.
Included in other operating expenses, net, in the accompanying Consolidated Statements of Operations is malpractice expense of
$303 million
,
$281 million
and
$283 million
for the years ended
December 31, 2017
,
2016
and
2015
, respectively.
We operate in a highly regulated and litigious industry. Healthcare companies are subject to numerous investigations by various governmental agencies. Further, private parties have the right to bring qui tam or “whistleblower” lawsuits against companies that allegedly submit false claims for payments to, or improperly retain overpayments from, the government and, in some states, private payers. We and our subsidiaries have received inquiries in recent years from government agencies, and we may receive similar inquiries in future periods. We are also subject to class action lawsuits, employment-related claims and other legal actions in the ordinary course of business. Some of these actions may involve large demands, as well as substantial defense costs. We cannot predict the outcome of current or future legal actions against us or the effect that judgments or settlements in such matters may have on us.
We are also subject to a non-prosecution agreement, as described in Item 1, Business – Compliance and Ethics, of Part I of this report. If we fail to comply with this agreement, we could be subject to criminal prosecution, substantial penalties and exclusion from participation in federal healthcare programs, any of which could adversely impact our business, financial condition, results of operations or cash flows.
We record accruals for estimated losses relating to claims and lawsuits when available information indicates that a loss is probable and we can reasonably estimate the amount of the loss or a range of loss. Significant judgment is required in both the determination of the probability of a loss and the determination as to whether a loss is reasonably estimable. These determinations are updated at least quarterly and are adjusted to reflect the effects of negotiations, settlements, rulings, advice of legal counsel and technical experts, and other information and events pertaining to a particular matter. If a loss on a material matter is reasonably possible and estimable, we disclose an estimate of the loss or a range of loss. In cases where we have not disclosed an estimate, we have concluded that the loss is either not reasonably possible or the loss, or a range of loss, is not reasonably estimable, based on available information.
Securities Litigation
On December 20, 2017, the U.S. District Court for the Northern District of Texas granted the Company’s motion to dismiss the matter captioned
In re Tenet Healthcare Corporation Securities Litigation
and denied the plaintiffs’ request to amend the lawsuit. Because the plaintiffs did not appeal the court’s decision, the dismissal is final. The
four
court-appointed lead plaintiffs filed a consolidated amended class action complaint in April 2017 asserting violations of the federal securities laws against the Company and several current and former executive officers. The plaintiffs were seeking class certification on behalf of all persons who acquired the Company’s common stock between February 28, 2012 and August 1, 2016. The complaint alleged that false or misleading statements or omissions concerning the Company’s financial performance and compliance policies, specifically with respect to the previously disclosed civil qui tam litigation and parallel criminal investigation of the Company and certain of its subsidiaries (together, the “Clinica de la Mama matters”), caused the price of the Company’s common stock to be artificially inflated. In addition, the plaintiffs claimed that the defendants violated GAAP by failing to disclose an estimate of the possible loss or a range of loss related to the Clinica de la Mama matters.
Shareholder Derivative Litigation
In January 2017, the Dallas County District Court consolidated
two
previously disclosed shareholder derivative lawsuits filed by purported shareholders of the Company’s common stock on behalf of the Company against current and former officers and directors into a single matter captioned
In re Tenet Healthcare Corporation Shareholder Derivative Litigation
. The plaintiffs filed a consolidated shareholder derivative petition in February 2017. A separate shareholder derivative lawsuit, captioned
Horwitz, derivatively on behalf of Tenet Healthcare Corporation
, was filed in January 2017 in the U.S. District Court for the Northern District of Texas; however, on January 19, 2018, the plaintiff in the
Horwitz
matter voluntarily dismissed his case. The consolidated shareholder derivative petition generally tracks the allegations in the securities class action complaint described above and claims that the plaintiffs did not make a demand on the Board of Directors to bring the lawsuit because such a demand would have been futile. The pending shareholder derivative matter was stayed in the second quarter of 2017 pending the final resolution of the motion to dismiss in the consolidated securities litigation. The Company intends to vigorously defend against the allegations in the remaining purported shareholder derivative lawsuit.
128
Antitrust Class Action Lawsuit Filed by Registered Nurses in San Antonio
In
Maderazo, et al. v. VHS San Antonio Partners, L.P. d/b/a Baptist Health Systems, et al.
, filed in June 2006 in the U.S. District Court for the Western District of Texas, a purported class of registered nurses employed by
three
unaffiliated San Antonio-area hospital systems allege those hospital systems, including our Baptist Health System, and other unidentified San Antonio regional hospitals violated Section §1 of the federal Sherman Act by conspiring to depress nurses’ compensation and exchanging compensation-related information among themselves in a manner that reduced competition and suppressed the wages paid to such nurses. The suit seeks unspecified damages (subject to trebling under federal law), interest, costs and attorneys’ fees. The case was stayed from 2008 through mid-2015. At this time, we are awaiting the court’s ruling on class certification and will continue to vigorously defend ourselves against the plaintiffs’ allegations. It remains impossible at this time to predict the outcome of these proceedings with any certainty; however, we believe that the ultimate resolution of this matter will not have a material effect on our business, financial condition or results of operations.
Ordinary Course Matters
We are also subject to other claims and lawsuits arising in the ordinary course of business, including potential claims related to, among other things, the care and treatment provided at our hospitals and outpatient facilities, the application of various federal and state labor laws, tax audits and other matters. Although the results of these claims and lawsuits cannot be predicted with certainty, we believe that the ultimate resolution of these ordinary course claims and lawsuits will not have a material effect on our business or financial condition.
New claims or inquiries may be initiated against us from time to time. These matters could (1) require us to pay substantial damages or amounts in judgments or settlements, which, individually or in the aggregate, could exceed amounts, if any, that may be recovered under our insurance policies where coverage applies and is available, (2) cause us to incur substantial expenses, (3) require significant time and attention from our management, and (4) cause us to close or sell hospitals or otherwise modify the way we conduct business.
The following table presents reconciliations of the beginning and ending liability balances in connection with legal settlements and related costs recorded during the years ended
December 31, 2017
,
2016
and
2015
:
|
|
Balances at
Beginning
of Period
|
Litigation and
Investigation
Costs
|
Cash
Payments
|
Other
|
Balances at
End of
Period
|
||||||||||||||
|
Year Ended December 31, 2017
|
|
|
|
|
|
|
|
|
|
|
|||||||||
|
Continuing operations
|
$
|
12
|
|
$
|
23
|
|
$
|
(23
|
)
|
$
|
—
|
|
$
|
12
|
|
||||
|
Discontinued operations
|
—
|
|
—
|
|
—
|
|
—
|
|
—
|
|
|||||||||
|
|
$
|
12
|
|
$
|
23
|
|
$
|
(23
|
)
|
$
|
—
|
|
$
|
12
|
|
||||
|
Year Ended December 31, 2016
|
|
|
|
|
|
|
|
|
|
|
|||||||||
|
Continuing operations
|
$
|
299
|
|
$
|
293
|
|
$
|
(582
|
)
|
$
|
2
|
|
$
|
12
|
|
||||
|
Discontinued operations
|
—
|
|
—
|
|
—
|
|
—
|
|
—
|
|
|||||||||
|
|
$
|
299
|
|
$
|
293
|
|
$
|
(582
|
)
|
$
|
2
|
|
$
|
12
|
|
||||
|
Year Ended December 31, 2015
|
|
|
|
|
|
|
|
|
|
|
|||||||||
|
Continuing operations
|
$
|
73
|
|
$
|
291
|
|
$
|
(72
|
)
|
$
|
7
|
|
$
|
299
|
|
||||
|
Discontinued operations
|
10
|
|
(8
|
)
|
(2
|
)
|
—
|
|
—
|
|
|||||||||
|
|
$
|
83
|
|
$
|
283
|
|
$
|
(74
|
)
|
$
|
7
|
|
$
|
299
|
|
||||
For the years ended
December 31, 2017
,
2016
and
2015
, we recorded net costs of
$23 million
,
$293 million
and
$283 million
, respectively, in connection with significant legal proceedings and governmental reviews. Of these amounts,
$278 million
and
$219 million
for the years ended December 31, 2016 and 2015, respectively, were attributable to accruals for the Clinica de la Mama matters.
In June 2015, we formed a new joint venture by combining our freestanding ambulatory surgery and imaging center assets with the surgical facility assets of USPI. As a result of this transaction, we recorded approximately
$1.477 billion
of redeemable noncontrolling interests. In connection with the formation of the USPI joint venture, we entered into a stockholders agreement pursuant to which we and our joint venture partners agreed to certain rights and obligations with respect to the governance of the joint venture.
129
As part of the USPI transaction, we entered into a put/call agreement (the “Put/Call Agreement”) with respect to the equity interests in the joint venture held by our joint venture partners. In January 2016, Welsh, Carson, Anderson & Stowe (“Welsh Carson”), on behalf of our joint venture partners, delivered a put notice for the minimum number of shares they were required to put to us in 2016 according to the Put/Call Agreement. In April 2016, we paid approximately
$127 million
to purchase those shares, which increased our ownership interest in the USPI joint venture to approximately
56.3%
. On May 1, 2017, we amended and restated the Put/Call Agreement to provide for, among other things, the acceleration of our acquisition of certain shares of our USPI joint venture. Under the terms of the amendment, we agreed to pay Welsh Carson, on or before July 3, 2017, approximately
$711 million
to buy
23.7%
of our USPI joint venture, which amount is subject to adjustment for actual 2017 financial results in accordance with the terms of the Put/Call Agreement. On July 3, 2017, we paid approximately
$716 million
for the purchase of these shares, which increased our ownership interest in the USPI joint venture to
80.0%
, as well as the final adjustment to the 2016 purchase price.
The amended and restated Put/Call Agreement also provides that the remaining
15%
ownership interest in our USPI joint venture held by our Welsh Carson joint venture partners is subject to put options in equal shares in each of 2018 and 2019. In January 2018, Welsh Carson, on behalf of our joint venture partners, delivered a put notice for the number of shares that represent a
7.5%
ownership interest in our USPI joint venture in accordance with the amended and restated Put/Call Agreement. The parties are in discussions regarding the calculation of the estimated purchase price relating to the exercise of the 2018 put option, which price is based on an agreed-upon estimate of 2018 financial results and is subject to a true-up following the finalization of actual 2018 financial results. We expect that the estimated payment to repurchase these shares will be between
$285 million
and
$295 million
, prior to any true-up payments related to actual financial results in 2017 or 2018. In the event our Welsh Carson joint venture partners do not exercise their 2019 put option, we will have the option, but not the obligation, to buy the remaining
7.5%
of our USPI joint venture from them in 2019. In connection with the aforementioned put and call options, we have the ability to choose whether to settle the purchase price in cash or shares of our common stock.
In addition, we entered into a separate put call agreement (the “Baylor Put/Call Agreement”) with Baylor University Medical Center (“Baylor”) that contains put and call options with respect to the
5%
ownership interest in the USPI joint venture held by Baylor. Each year starting in 2021, Baylor may put up to one-third of their total shares in the USPI joint venture held as of January 1, 2017. In each year that Baylor does not put the full
33.3%
of the USPI joint venture’s shares allowable, we may call the difference between the number of shares Baylor put and the maximum number of shares they could have put that year. In addition, the Baylor Put/Call Agreement contains a call option pursuant to which we have the ability to acquire all of Baylor’s ownership interest by 2024. We have the ability to choose whether to settle the purchase price for the Baylor put/call in cash or shares of our common stock.
Based on the nature of these put/call structures, the minority shareholders’ interests in the USPI joint venture is classified as redeemable noncontrolling interests in the accompanying Consolidated Balance Sheets at
December 31, 2017
and
2016
.
The following table shows the changes in redeemable noncontrolling interests in equity of consolidated subsidiaries during the years ended
2017
and
2016
:
|
|
December 31,
|
||||||
|
|
2017
|
2016
|
|||||
|
Balances at beginning of period
|
$
|
2,393
|
|
$
|
2,266
|
|
|
|
Net income
|
239
|
|
230
|
|
|||
|
Distributions paid to noncontrolling interests
|
(128
|
)
|
(105
|
)
|
|||
|
Purchase accounting adjustments
|
—
|
|
(47
|
)
|
|||
|
Accretion of redeemable noncontrolling interests
|
33
|
|
—
|
|
|||
|
Purchases and sales of businesses and noncontrolling interests, net
|
(671
|
)
|
49
|
|
|||
|
Balances at end of period
|
$
|
1,866
|
|
$
|
2,393
|
|
|
Our redeemable noncontrolling interests balances at
December 31, 2017
and
2016
in the table above were comprised of
$519 million
and
$520 million
, respectively, from our Hospital Operations and other segment,
$1.137 billion
and
$1.715 billion
, respectively, from our Ambulatory Care segment, and
$210 million
and
$158 million
, respectively, from our Conifer segment. Our net income attributable to redeemable noncontrolling interests for the years ended
December 31, 2017
and
2016
respectively, on our Consolidated Statements of Operations were comprised of
$18 million
and
$20 million
, respectively, from our Hospital Operations and other segment,
$170 million
and
$158 million
, respectively, from our Ambulatory Care segment, and
$51 million
and
$52 million
, respectively, from our Conifer segment.
130
The provision for income taxes for continuing operations for the years ended
December 31, 2017
,
2016
and
2015
consists of the following:
|
|
Years Ended December 31,
|
||||||||||
|
|
2017
|
2016
|
2015
|
||||||||
|
Current tax expense (benefit):
|
|
|
|
|
|
|
|||||
|
Federal
|
$
|
(4
|
)
|
$
|
12
|
|
$
|
(2
|
)
|
||
|
State
|
23
|
|
14
|
|
28
|
|
|||||
|
|
19
|
|
26
|
|
26
|
|
|||||
|
Deferred tax expense (benefit):
|
|
|
|
|
|
|
|||||
|
Federal
|
202
|
|
34
|
|
24
|
|
|||||
|
State
|
(2
|
)
|
7
|
|
18
|
|
|||||
|
|
200
|
|
41
|
|
42
|
|
|||||
|
|
$
|
219
|
|
$
|
67
|
|
$
|
68
|
|
||
A reconciliation between the amount of reported income tax expense (benefit) and the amount computed by multiplying income (loss) from continuing operations before income taxes by the statutory federal income tax rate is shown below. State income tax expense for the year ended
December 31, 2017
includes
$28 million
of expense related to the write off of expired or worthless unutilized state net operating loss carryforwards and other deferred tax assets for which a full valuation allowance had been provided in prior years. A corresponding tax benefit of
$28 million
is included for the year ended
December 31, 2017
to reflect the reduction in the valuation allowance. Foreign pre-tax loss for the years ended
December 31, 2017
and
2016
was
$70 million
and
$16 million
, respectively.
|
|
Years Ended December 31,
|
||||||||||
|
|
2017
|
2016
|
2015
|
||||||||
|
Tax expense (benefit) at statutory federal rate of 35%
|
$
|
(35
|
)
|
$
|
87
|
|
$
|
50
|
|
||
|
State income taxes, net of federal income tax benefit
|
4
|
|
16
|
|
18
|
|
|||||
|
Expired state net operating losses, net of federal income tax benefit
|
28
|
|
35
|
|
11
|
|
|||||
|
Tax attributable to noncontrolling interests
|
(113
|
)
|
(106
|
)
|
(59
|
)
|
|||||
|
Nondeductible goodwill
|
109
|
|
29
|
|
22
|
|
|||||
|
Nontaxable gains
|
—
|
|
(11
|
)
|
(11
|
)
|
|||||
|
Nondeductible litigation costs
|
—
|
|
37
|
|
44
|
|
|||||
|
Nondeductible acquisition costs
|
1
|
|
1
|
|
4
|
|
|||||
|
Nondeductible health insurance provider fee
|
—
|
|
2
|
|
2
|
|
|||||
|
Impact of decrease in federal tax rate on deferred taxes
|
246
|
|
—
|
|
—
|
|
|||||
|
Reversal of permanent reinvestment assumption for foreign subsidiary
|
(30
|
)
|
—
|
|
—
|
|
|||||
|
Stock based compensation tax deficiencies
|
15
|
|
—
|
|
—
|
|
|||||
|
Changes in valuation allowance (including impact of decrease in federal tax rate)
|
—
|
|
(25
|
)
|
4
|
|
|||||
|
Change in tax contingency reserves, including interest
|
(6
|
)
|
(9
|
)
|
7
|
|
|||||
|
Amendment of prior-year tax returns
|
—
|
|
—
|
|
(17
|
)
|
|||||
|
Prior-year provision to return adjustments and other changes in deferred taxes
|
4
|
|
12
|
|
(12
|
)
|
|||||
|
Other items
|
(4
|
)
|
(1
|
)
|
5
|
|
|||||
|
|
$
|
219
|
|
$
|
67
|
|
$
|
68
|
|
||
On December 22, 2017, the President signed into law the Tax Cuts and Jobs Act (the “Tax Act”). The Tax Act amends the Internal Revenue Code to reduce tax rates and modify policies, credits and deductions for individuals and businesses. For businesses, the Tax Act makes broad and complex changes to the U.S. tax code, including but not limited to, (1) reducing the corporate federal tax rate from a maximum of 35% to a flat 21% rate, effective January 1, 2018, (2) repealing the corporate alternative minimum tax (“AMT”) and changing how existing AMT credits may be realized, (3) creating a new limitation on the deductibility of interest expense, (4) allowing full expensing of certain capital expenditures, and (5) denying deductions for performance based compensation paid to certain key executives. International provisions in the Tax Act are not expected to have a material impact on the Company’s taxes.
As a result of the reduction in the corporate income tax rate from 35% to 21% under the Tax Act, we revalued our net deferred tax assets at December 31, 2017, resulting in a reduction in the value of our net deferred tax assets by approximately
$252 million
. The reduction was recorded as additional income tax expense in the accompanying Consolidated Statement of
131
Operations for the year ended December 31, 2017. Approximately
$6 million
of the total
$252 million
increase in income tax expense is included in the net change in valuation allowance, with the remaining
$246 million
shown in the table above.
The SEC staff issued Staff Accounting Bulletin No. 118 (“SAB 118”), which provides guidance on accounting for the tax effects of the Tax Act. SAB 118 provides a measurement period that should not extend beyond one year from the Tax Act enactment date for companies to complete the accounting under ASC 740. In accordance with SAB 118, a company must reflect the income tax effects of those aspects of the Tax Act for which the accounting under ASC 740 is complete. To the extent that a company’s accounting for certain income tax effects of the Tax Act is incomplete but it is able to determine a reasonable estimate, it must record a provisional estimate in the financial statements. If a company cannot determine a provisional estimate to be included in the financial statements, it should continue to apply ASC 740 on the basis of the provisions of the tax laws that were in effect immediately before the enactment of the Tax Act.
While we are able to make a reasonable estimate of the impact of the reduction in the corporate tax rate, the revaluation of our net deferred tax assets is subject to further revision based on our actual 2017 federal and state income tax filings. In addition, our valuation allowance analysis is affected by various aspects of the Tax Act, including the new limitation on the deductibility of interest expense. As a result, the actual impact on the net deferred tax assets may vary from the provisional estimate due to changes in our estimates of 2017 taxable income and due to revisions in our estimates of the impact of the limitation on the deductibility of interest expense.
Deferred income taxes reflect the tax effects of temporary differences between the carrying amount of assets and liabilities for financial reporting purposes and the amount used for income tax purposes. The following table discloses those significant components of our deferred tax assets and liabilities, including any valuation allowance:
|
|
December 31, 2017
|
December 31, 2016
|
|||||||||||||
|
|
Assets
|
Liabilities
|
Assets
|
Liabilities
|
|||||||||||
|
Depreciation and fixed-asset differences
|
$
|
—
|
|
$
|
411
|
|
$
|
—
|
|
$
|
683
|
|
|||
|
Reserves related to discontinued operations and restructuring charges
|
15
|
|
—
|
|
13
|
|
—
|
|
|||||||
|
Receivables (doubtful accounts and adjustments)
|
134
|
|
—
|
|
231
|
|
—
|
|
|||||||
|
Deferred gain on debt exchanges
|
—
|
|
6
|
|
—
|
|
21
|
|
|||||||
|
Accruals for retained insurance risks
|
225
|
|
—
|
|
351
|
|
—
|
|
|||||||
|
Intangible assets
|
—
|
|
330
|
|
—
|
|
548
|
|
|||||||
|
Other long-term liabilities
|
97
|
|
—
|
|
141
|
|
—
|
|
|||||||
|
Benefit plans
|
268
|
|
—
|
|
457
|
|
—
|
|
|||||||
|
Other accrued liabilities
|
42
|
|
—
|
|
60
|
|
—
|
|
|||||||
|
Investments and other assets
|
—
|
|
79
|
|
—
|
|
130
|
|
|||||||
|
Net operating loss carryforwards
|
399
|
|
—
|
|
653
|
|
—
|
|
|||||||
|
Stock-based compensation
|
27
|
|
—
|
|
45
|
|
—
|
|
|||||||
|
Other items
|
142
|
|
32
|
|
118
|
|
23
|
|
|||||||
|
|
1,349
|
|
858
|
|
2,069
|
|
1,405
|
|
|||||||
|
Valuation allowance
|
(72
|
)
|
—
|
|
(72
|
)
|
—
|
|
|||||||
|
|
$
|
1,277
|
|
$
|
858
|
|
$
|
1,997
|
|
$
|
1,405
|
|
|||
Below is a reconciliation of the deferred tax assets and liabilities and the corresponding amounts reported in the accompanying Consolidated Balance Sheets.
|
|
December 31,
|
||||||
|
|
2017
|
2016
|
|||||
|
Deferred income tax assets
|
$
|
455
|
|
$
|
871
|
|
|
|
Deferred tax liabilities
|
(36
|
)
|
(279
|
)
|
|||
|
Net deferred tax asset
|
$
|
419
|
|
$
|
592
|
|
|
During the year ended
December 31, 2017
, we had
no
net change in the valuation allowance,
but there was a decrease of
$28 million
due to the expiration or worthlessness of unutilized state net operating loss carryovers, an increase of
$6 million
due to the decrease in the federal tax rate, and an increase of
$22 million
due to changes in expected realizability of deferred tax assets. The remaining balance in the valuation allowance at
December 31, 2017
was
$72 million
. During the year ended
December 31, 2016
, the valuation allowance decreased by
$24 million
primarily due to the expiration or worthlessness of unutilized state net operating loss carryovers. The balance in the valuation allowance as of
December 31, 2016
was
$72 million
. During the year ended December 31, 2015, the valuation allowance increased by
$9 million
,
$5 million
due to the acquisition of USPI and
$4 million
due to changes in expected realizability of deferred tax assets.
132
We account for uncertain tax positions in accordance with ASC 740-10-25, which prescribes a comprehensive model for the financial statement recognition, measurement, presentation and disclosure of uncertain tax positions taken or expected to be taken in income tax returns. The table below summarizes the total changes in unrecognized tax benefits during the year ended
December 31, 2017
. The additions and reductions for tax positions include the impact of items for which the ultimate deductibility is highly certain, but for which there is uncertainty about the timing of such deductions. Such amounts include unrecognized tax benefits that have impacted deferred tax assets and liabilities at
December 31, 2017
,
2016
and
2015
.
|
|
Continuing
Operations
|
Discontinued
Operations
|
Total
|
||||||||||
|
Balance At December 31, 2014
|
$
|
38
|
|
$
|
—
|
|
$
|
38
|
|
||||
|
Additions for prior-year tax positions
|
1
|
|
—
|
|
1
|
|
|||||||
|
Additions for current-year tax positions
|
5
|
|
—
|
|
5
|
|
|||||||
|
Reductions due to a lapse of statute of limitations
|
(4
|
)
|
—
|
|
(4
|
)
|
|||||||
|
Balance At December 31, 2015
|
$
|
40
|
|
$
|
—
|
|
$
|
—
|
|
$
|
40
|
|
|
|
Additions for prior-year tax positions
|
2
|
|
—
|
|
2
|
|
|||||||
|
Additions for current-year tax positions
|
—
|
|
—
|
|
—
|
|
|||||||
|
Reductions due to a lapse of statute of limitations
|
(7
|
)
|
—
|
|
(7
|
)
|
|||||||
|
Balance At December 31, 2016
|
$
|
35
|
|
$
|
—
|
|
$
|
35
|
|
||||
|
Additions for prior-year tax positions
|
31
|
|
—
|
|
31
|
|
|||||||
|
Reductions for tax positions of prior years
|
(15
|
)
|
—
|
|
(15
|
)
|
|||||||
|
Additions for current-year tax positions
|
—
|
|
—
|
|
—
|
|
|||||||
|
Reductions due to a lapse of statute of limitations
|
(5
|
)
|
—
|
|
(5
|
)
|
|||||||
|
Balance At December 31, 2017
|
$
|
46
|
|
$
|
—
|
|
$
|
46
|
|
||||
The total amount of unrecognized tax benefits as of
December 31, 2017
was
$46 million
, of which
$44 million
, if recognized, would affect our effective tax rate and income tax expense (benefit) from continuing operations. Income tax expense in the year ended
December 31, 2017
includes a benefit of
$5 million
in continuing operations attributable to a decrease in our estimated liabilities for uncertain tax positions, net of related deferred tax effects. The total amount of unrecognized tax benefits as of
December 31, 2016
was
$35 million
, of which
$32 million
, if recognized, would affect our effective tax rate and income tax expense (benefit) from continuing operations. Income tax expense in the year ended
December 31, 2016
includes a benefit of
$9 million
in continuing operations attributable to a decrease in our estimated liabilities for uncertain tax positions, net of related deferred tax effects. The total amount of unrecognized tax benefits as of
December 31, 2015
was
$40 million
, of which
$37 million
, if recognized, would affect our effective tax rate and income tax expense (benefit) from continuing operations. Income tax expense in the year ended
December 31, 2015
includes expense of
$2 million
in continuing operations attributable to an increase in our estimated liabilities for uncertain tax positions, net of related deferred tax effects.
Our practice is to recognize interest and/or penalties related to income tax matters in income tax expense in our consolidated statements of operations. Approximately
$1 million
of interest and penalties related to accrued liabilities for uncertain tax positions related to continuing operations are included in the accompanying Consolidated Statement of Operations for the year ended
December 31, 2017
. Total accrued interest and penalties on unrecognized tax benefits as of
December 31, 2017
were
$3 million
, all of which related to continuing operations.
The Internal Revenue Service (“IRS”)
has completed audits of our tax returns for all tax years ended on or before December 31, 2007, and of Vanguard’s tax returns for fiscal years ended on or before October 1, 2013. All disputed issues with respect to these audits have been resolved and all related tax assessments (including interest) have been paid. Our tax returns for years ended after December 31, 2007 and USPI’s tax returns for years ended after December 31, 2013 remain subject to audit by the IRS.
As of
December 31, 2017
, approximately
$1 million
of unrecognized federal and state tax benefits, as well as reserves for interest and penalties, may decrease in the next 12 months as a result of the settlement of audits, the filing of amended tax returns or the expiration of statutes of limitations.
At
December 31, 2017
,
our carryforwards available to offset future taxable income consisted of (1) federal net operating loss (“NOL”) carryforwards of approximately
$1.6 billion
pre-tax expiring in 2025 to 2034, (2) general business credit carryforwards of approximately
$29 million
expiring in 2023 through 2037, and (3) state NOL carryforwards of
approximately
$3.0 billion
expiring in 2018 through 2037 for which the associated deferred tax benefit, net of valuation allowance and federal tax impact, is
$12 million
. Our ability to utilize NOL carryforwards to reduce future taxable income may be limited under Section 382 of the Internal Revenue Code if certain ownership changes in our company occur during a rolling
133
three
-year period. These ownership changes include purchases of common stock under share repurchase programs (see Note 2
), the offering of stock by us, the purchase or sale of our stock by
5%
shareholders, as defined in the Treasury regulations, or the issuance or exercise of rights to acquire our stock. If such ownership changes by
5%
shareholders result in aggregate increases that exceed 50 percentage points during the
three
-year period, then Section 382 imposes an annual limitation on the amount of our taxable income that may be offset by the NOL carryforwards or tax credit carryforwards at the time of ownership change.
On August 31, 2017,
we entered into a rights agreement as a measure intended to deter the above-referenced ownership changes in order to preserve
our
NOL carryforwards
(see Note 2).
The following table is a reconciliation of the numerators and denominators of our basic and diluted earnings (loss) per common share calculations for our continuing operations for the years ended
December 31, 2017
,
2016
and
2015
. Net loss attributable is expressed in millions and weighted average shares are expressed in thousands.
|
|
Net Loss Attributable
to Common
Shareholders
(Numerator)
|
Weighted
Average Shares
(Denominator)
|
Per-Share
Amount
|
||||||||
|
Year Ended December 31, 2017
|
|
|
|
|
|
|
|||||
|
Net loss attributable to Tenet Healthcare Corporation common shareholders for basic loss per share
|
$
|
(704
|
)
|
100,592
|
|
$
|
(7.00
|
)
|
|||
|
Effect of dilutive stock options, restricted stock units and deferred compensation units
|
—
|
|
—
|
|
—
|
|
|||||
|
Net loss attributable to Tenet Healthcare Corporation common shareholders for diluted loss per share
|
$
|
(704
|
)
|
$
|
100,592
|
|
$
|
(7.00
|
)
|
||
|
Year Ended December 31, 2016
|
|
|
|
|
|
|
|||||
|
Net loss attributable to Tenet Healthcare Corporation common shareholders for basic loss per share
|
$
|
(187
|
)
|
99,321
|
|
$
|
(1.88
|
)
|
|||
|
Effect of dilutive stock options, restricted stock units and deferred compensation units
|
—
|
|
—
|
|
—
|
|
|||||
|
Net loss attributable to Tenet Healthcare Corporation common shareholders for diluted loss per share
|
$
|
(187
|
)
|
$
|
99,321
|
|
$
|
(1.88
|
)
|
||
|
Year Ended December 31, 2015
|
|
|
|
|
|
|
|||||
|
Net loss attributable to Tenet Healthcare Corporation common shareholders for basic earnings per share
|
$
|
(142
|
)
|
99,167
|
|
$
|
(1.43
|
)
|
|||
|
Effect of dilutive stock options, restricted stock units and deferred compensation units
|
—
|
|
—
|
|
—
|
|
|||||
|
Net loss attributable to Tenet Healthcare Corporation common shareholders for diluted earnings per share
|
$
|
(142
|
)
|
$
|
99,167
|
|
$
|
(1.43
|
)
|
||
All potentially dilutive securities were excluded from the calculation of diluted earnings (loss) per share for the years ended
December 31, 2017
,
2016
and
2015
because we did not report income from continuing operations available to common shareholders in those periods. In circumstances where we do not have income from continuing operations available to common shareholders, the effect of stock options and other potentially dilutive securities is anti-dilutive, that is, a loss from continuing operations attributable to common shareholders has the effect of making the diluted loss per share less than the basic loss per share. Had we generated income from continuing operations available to common shareholders in the years ended
December 31, 2017
,
2016
and
2015
, the effect (in thousands) of employee stock options, restricted stock units and deferred compensation units on the diluted shares calculation would have been an increase in shares of
788
,
1,421
and
2,380
for the years ended
December 31, 2017
,
2016
and
2015
, respectively.
Our financial assets and liabilities recorded at fair value on a recurring basis primarily relate to investments in available-for-sale securities held by our captive insurance subsidiaries. The following tables present information about our assets and liabilities that are measured at fair value on a recurring basis as of
December 31, 2017
and
2016
. The following tables also indicate the fair value hierarchy of the valuation techniques we utilized to determine such fair value hierarchy of the valuation techniques we utilized to determine such fair values. In general, fair values determined by Level 1 inputs utilize quoted prices (unadjusted) in active markets for identical assets or liabilities. We consider a security that trades at least weekly to have an active market. Fair values determined by Level 2 inputs utilize data points that are observable, such as quoted prices
134
for similar assets, interest rates and yield curves. Fair values determined by Level 3 inputs are unobservable data points for the asset or liability, and include situations where there is little, if any, market activity for the asset or liability.
|
Investments
|
December 31, 2017
|
Quoted Prices
in Active
Markets for
Identical Assets
(Level 1)
|
Significant Other
Observable Inputs
(Level 2)
|
Significant
Unobservable
Inputs
(Level 3)
|
||||||||||||
|
Marketable debt securities — noncurrent
|
$
|
56
|
|
$
|
42
|
|
$
|
14
|
|
$
|
—
|
|
||||
|
|
$
|
56
|
|
$
|
42
|
|
$
|
14
|
|
$
|
—
|
|
||||
|
Investments
|
December 31, 2016
|
Quoted Prices
in Active
Markets for
Identical Assets
(Level 1)
|
Significant Other
Observable Inputs
(Level 2)
|
Significant
Unobservable
Inputs
(Level 3)
|
||||||||||||
|
Marketable debt securities — noncurrent
|
$
|
49
|
|
$
|
23
|
|
$
|
26
|
|
$
|
—
|
|
||||
|
|
$
|
49
|
|
$
|
23
|
|
$
|
26
|
|
$
|
—
|
|
||||
Our non-financial assets and liabilities not permitted or required to be measured at fair value on a recurring basis typically relate to long-lived assets held and used, long-lived assets held for sale and goodwill. We are required to provide additional disclosures about fair value measurements as part of our financial statements for each major category of assets and liabilities measured at fair value on a non-recurring basis. The following table presents this information and indicates the fair value hierarchy of the valuation techniques we utilized to determine such fair values. In general, fair values determined by Level 1 inputs utilize quoted prices (unadjusted) in active markets for identical assets or liabilities, which generally are not applicable to non-financial assets and liabilities. Fair values determined by Level 2 inputs utilize data points that are observable, such as definitive sales agreements, appraisals or established market values of comparable assets. Fair values determined by Level 3 inputs are unobservable data points for the asset or liability and include situations where there is little, if any, market activity for the asset or liability, such as internal estimates of future cash flows.
|
|
December 31, 2017
|
Quoted Prices
in Active
Markets for
Identical Assets
(Level 1)
|
Significant Other
Observable Inputs
(Level 2)
|
Significant
Unobservable
Inputs
(Level 3)
|
||||||||||||
|
Long-lived assets held for sale
|
$
|
456
|
|
$
|
—
|
|
$
|
456
|
|
$
|
—
|
|
||||
|
Long-lived assets held and used
|
$
|
—
|
|
$
|
—
|
|
$
|
—
|
|
$
|
—
|
|
||||
|
Other than temporarily impaired equity method investments
|
$
|
113
|
|
$
|
—
|
|
$
|
113
|
|
$
|
—
|
|
||||
|
|
December 31, 2016
|
Quoted Prices
in Active
Markets for
Identical Assets
(Level 1)
|
Significant Other
Observable Inputs
(Level 2)
|
Significant
Unobservable
Inputs
(Level 3)
|
||||||||||||
|
Long-lived assets held and used
|
163
|
|
$
|
—
|
|
$
|
163
|
|
$
|
—
|
|
|||||
|
Other than temporarily impaired equity method investments
|
$
|
27
|
|
$
|
—
|
|
$
|
27
|
|
$
|
—
|
|
||||
As described in Note 5, in the year ended
December 31, 2017
, we recorded impairment charges in continuing operations of
$364 million
to write-down assets held for sale to their estimated fair value, less estimated costs to sell, for our Aspen, Philadelphia-area and certain of our Chicago-area facilities, as well as
$31 million
of impairment charges related to investments and
$7 million
related to other intangible assets, primarily contract-related intangibles and capitalized software costs not associated with the hospitals described above. In the year ended
December 31, 2016
, we recorded
$54 million
for the write-down of buildings, equipment and other long-lived assets of
four
hospitals to their estimated fair values,
$19 million
of impairment charges related to investments and
$14 million
related to other intangible assets, primarily contract-related intangibles and capitalized software costs not associated with the hospitals described above.
The fair value of our long-term debt (except for borrowings under the Credit Agreement) is based on quoted market prices (Level 1). The inputs used to establish the fair value of the borrowings outstanding under the Credit Agreement are considered to be Level 2 inputs, which include inputs other than quoted prices included in Level 1 that are observable, either directly or indirectly. At
December 31, 2017
and
2016
, the estimated fair value of our long-term debt was approximately
100.2%
and
93.9%
, respectively, of the carrying value of the debt.
135
During the year ended
December 31, 2017
, we acquired
eight
outpatient businesses (all of which are owned by our USPI joint venture) and various physician practices. The fair value of the consideration conveyed in the acquisitions (the “purchase price”) was
$50 million
.
During the year ended
December 31, 2016
, we completed a transaction that allowed us to consolidate
five
microhospitals that were previously recorded as equity method investments. We also acquired majority interests in
28
ambulatory surgery centers (all of which are owned by our USPI joint venture) and various physician practices. The fair value of the consideration conveyed in the acquisitions (the “purchase price”) was
$117 million
.
During the year ended
December 31, 2015
, we completed the transaction that combined our freestanding ambulatory surgery and imaging center assets with USPI’s surgical facility assets into a new joint venture. We also completed the acquisition of Aspen, a network of
nine
private hospitals and clinics in the United Kingdom. In addition, we began operating Hi-Desert Medical Center, which is a
59
-bed acute care hospital in Joshua Tree, California, and its related healthcare facilities, including a
120
-bed skilled nursing facility, an ambulatory surgery center and an imaging center, under a long-term lease agreement. Furthermore, we formed a new joint venture with Dignity Health and Ascension Health to own and operate Carondelet Health Network, which is comprised of
three
hospitals with over
900
licensed beds, related physician practices, ambulatory surgery, imaging and urgent care centers, and other affiliated businesses, in Tucson and Nogales, Arizona. We also formed a new joint venture with Baptist Health Systems, Inc. to own and operate a healthcare network serving Birmingham and central Alabama. We have a
60%
ownership in the joint venture and manage the network’s operations. The network has more than
1,700
licensed beds,
nine
outpatient centers,
68
physician clinics delivering primary and specialty care, and more than
7,000
employees and approximately
1,500
affiliated physicians. Additionally, we acquired majority interests in
nine
ambulatory surgery centers and purchased
35
urgent care centers (all of which are owned by our USPI joint venture), and various physician practice entities. The fair value of the consideration conveyed in the acquisitions (the “purchase price”) was
$940 million
.
We are required to allocate the purchase prices of acquired businesses to assets acquired or liabilities assumed and, if applicable, noncontrolling interests based on their fair values. The excess of the purchase price allocated over those fair values is recorded as goodwill. The purchase price allocations for certain acquisitions completed in
2017
is preliminary. We are in process of finalizing the purchase price allocations, including valuations of the acquired property and equipment, other intangible assets and noncontrolling interests for some of our
2017
acquisitions; therefore, those purchase price allocations are subject to adjustment once the valuations are completed. During the year ended
December 31, 2016
, we made adjustments to the purchase price allocations for businesses acquired in
2015
that increased goodwill by approximately
$59 million
and increased depreciation and amortization expense by approximately
$7 million
for our Hospital Operations and other segment. During the year ended
December 31, 2016
, we made adjustments to the purchase price allocations for businesses acquired in
2015
that decreased goodwill by approximately
$36 million
for our Ambulatory Care segment.
Preliminary or final purchase price allocations for all the acquisitions made during the years ended
December 31, 2017
,
2016
and
2015
are as follows:
|
|
2017
|
2016
|
2015
|
||||||||
|
Current assets
|
$
|
7
|
|
$
|
51
|
|
$
|
457
|
|
||
|
Property and equipment
|
9
|
|
38
|
|
1,059
|
|
|||||
|
Other intangible assets
|
8
|
|
7
|
|
361
|
|
|||||
|
Goodwill
|
91
|
|
464
|
|
3,374
|
|
|||||
|
Other long-term assets
|
(3
|
)
|
(56
|
)
|
557
|
|
|||||
|
Current liabilities
|
(8
|
)
|
(30
|
)
|
(443
|
)
|
|||||
|
Deferred taxes — long term
|
—
|
|
—
|
|
(128
|
)
|
|||||
|
Other long-term liabilities
|
(2
|
)
|
(15
|
)
|
(2,146
|
)
|
|||||
|
Redeemable noncontrolling interests in equity of consolidated subsidiaries
|
(29
|
)
|
(190
|
)
|
(1,974
|
)
|
|||||
|
Noncontrolling interests
|
(18
|
)
|
(119
|
)
|
(147
|
)
|
|||||
|
Cash paid, net of cash acquired
|
(50
|
)
|
(117
|
)
|
(940
|
)
|
|||||
|
Gains on consolidations
|
$
|
5
|
|
$
|
33
|
|
$
|
30
|
|
||
The goodwill generated from these transactions, the majority of which will be deductible for income tax purposes, can be attributed to the benefits that we expect to realize from operating efficiencies and growth strategies. Of the total
$91 million
of goodwill recorded for acquisitions completed during the year ended
December 31, 2017
,
$5 million
was recorded in our Hospital Operations and other segment, and
$86 million
was recorded in our Ambulatory Care segment. Approximately
136
$6 million
,
$20 million
and
$45 million
in transaction costs related to prospective and closed acquisitions were expensed during the years ended
December 31, 2017
,
2016
and
2015
, respectively, and are included in impairment and restructuring charges, and acquisition-related costs in the accompanying Consolidated Statements of Operations.
During the years ended
December 31, 2017
,
2016
and
2015
we recognized gains totaling
$5 million
,
$33 million
and
$30 million
associated with stepping up our ownership interests in previously held equity investments, which we began consolidating after we acquired controlling interests.
Pro Forma Information – Unaudited
Effective June 16, 2015, we combined our freestanding ambulatory surgery and imaging center assets with the surgical facility assets of United Surgical Partners International, Inc. (“USPI”) into the USPI joint venture. We refinanced approximately
$1.5 billion
of existing USPI debt, which was allocated to the joint venture through an intercompany loan, and paid approximately
$424 million
to align the respective valuations of the assets contributed to the joint venture. We also completed the Aspen acquisition for approximately
$226 million
.
The following table provides
2017
and
2016
actual results compared to
2015
pro forma information for Tenet as if the USPI joint venture and Aspen acquisition had occurred at the beginning of the year ended
December 31, 2015
. The net income of USPI for the December 31, 2015 was adjusted by
$30 million
to remove a nonrecurring loss on extinguishment of debt.
|
|
Years Ended December 31,
|
||||||||||
|
|
2017
|
2016
|
2015
|
||||||||
|
Net operating revenues
|
$
|
19,179
|
|
$
|
19,621
|
|
$
|
19,018
|
|
||
|
Equity in earnings of unconsolidated affiliates
|
$
|
144
|
|
$
|
131
|
|
$
|
143
|
|
||
|
Net loss attributable to common shareholders
|
$
|
(704
|
)
|
$
|
(192
|
)
|
$
|
(171
|
)
|
||
|
Loss per share attributable to common shareholders
|
$
|
(7.00
|
)
|
$
|
(1.93
|
)
|
$
|
(1.73
|
)
|
||
Our business consists of our Hospital Operations and other segment, our Ambulatory Care segment and our Conifer segment. The factors for determining the reportable segments include the manner in which management evaluates operating performance combined with the nature of the individual business activities.
Our Hospital Operations and other segment
is comprised of our acute care hospitals, ancillary outpatient facilities, urgent care centers, microhospitals and physician practices. As described in Note 4
, certain of our facilities are classified as held for sale
in the accompanying Consolidated Balance Sheet at
December 31, 2017
. We also own various related healthcare businesses. At
December 31, 2017
, our subsidiaries operated
76
hospitals, primarily serving urban and suburban communities in
12
states (certain of which are classified as held for sale, as described in Note 4), as well as hospital-based outpatient centers, freestanding emergency departments and freestanding urgent care centers.
Our Ambulatory Care segment is comprised of the operations of our USPI joint venture and our
nine
Aspen facilities in the United Kingdom, which are classified as held for sale
in the accompanying Consolidated Balance Sheet at
December 31, 2017
. At
December 31, 2017
, our USPI joint venture had interests in
247
ambulatory surgery centers,
34
urgent care centers,
23
imaging centers and
20
surgical hospitals in
28
states.
Our Conifer segment
provides healthcare business process services in the areas of hospital and physician revenue cycle management and value-based care solutions to healthcare systems, as well as individual hospitals, physician practices, self-insured organizations, health plans and other entities
. At
December 31, 2017
, Conifer provided services to more than
800
Tenet and non-Tenet hospitals and other clients nationwide. In 2012, we entered into agreements documenting the terms and conditions of various services Conifer provides to Tenet hospitals, as well as certain administrative services our Hospital Operations and other segment provides to Conifer. The pricing terms for the services provided by each party to the other under these contracts were based on estimated third-party pricing terms in effect at the time the agreements were signed.
137
The following table includes amounts for each of our reportable segments and the reconciling items necessary to agree to amounts reported in the accompanying Consolidated Balance Sheets and Consolidated Statements of Operations:
|
|
December 31,
2017 |
December 31,
2016 |
December 31,
2015 |
||||||||
|
Assets:
|
|
|
|
|
|||||||
|
Hospital Operations and other
|
$
|
16,466
|
|
$
|
17,871
|
|
$
|
17,353
|
|
||
|
Ambulatory Care
|
5,822
|
|
5,722
|
|
5,159
|
|
|||||
|
Conifer
|
1,097
|
|
1,108
|
|
1,170
|
|
|||||
|
Total
|
$
|
23,385
|
|
$
|
24,701
|
|
$
|
23,682
|
|
||
|
|
Years Ended December 31,
|
||||||||||
|
|
2017
|
2016
|
2015
|
||||||||
|
Capital expenditures:
|
|
|
|
|
|
|
|||||
|
Hospital Operations and other
|
$
|
625
|
|
$
|
799
|
|
$
|
786
|
|
||
|
Ambulatory Care
|
60
|
|
51
|
|
28
|
|
|||||
|
Conifer
|
22
|
|
25
|
|
28
|
|
|||||
|
Total
|
$
|
707
|
|
$
|
875
|
|
$
|
842
|
|
||
|
Net operating revenues:
|
|
|
|
|
|
|
|||||
|
Hospital Operations and other
|
$
|
16,260
|
|
$
|
16,904
|
|
$
|
16,928
|
|
||
|
Ambulatory Care
|
1,940
|
|
1,797
|
|
959
|
|
|||||
|
Conifer
|
|
|
|
|
|
|
|||||
|
Tenet
|
618
|
|
651
|
|
666
|
|
|||||
|
Other clients
|
979
|
|
920
|
|
747
|
|
|||||
|
Total Conifer revenues
|
1,597
|
|
1,571
|
|
1,413
|
|
|||||
|
Intercompany eliminations
|
(618
|
)
|
(651
|
)
|
(666
|
)
|
|||||
|
Total
|
$
|
19,179
|
|
$
|
19,621
|
|
$
|
18,634
|
|
||
|
Equity in earnings of unconsolidated affiliates:
|
|
|
|
|
|
|
|||||
|
Hospital Operations and other
|
$
|
4
|
|
$
|
9
|
|
$
|
16
|
|
||
|
Ambulatory Care
|
140
|
|
122
|
|
83
|
|
|||||
|
Total
|
$
|
144
|
|
$
|
131
|
|
$
|
99
|
|
||
|
Adjusted EBITDA:
|
|
|
|
|
|
|
|||||
|
Hospital Operations and other
|
$
|
1,462
|
|
$
|
1,586
|
|
$
|
1,657
|
|
||
|
Ambulatory Care
|
699
|
|
615
|
|
358
|
|
|||||
|
Conifer
|
283
|
|
277
|
|
265
|
|
|||||
|
Total
|
$
|
2,444
|
|
$
|
2,478
|
|
$
|
2,280
|
|
||
|
Depreciation and amortization:
|
|
|
|
|
|
|
|||||
|
Hospital Operations and other
|
$
|
736
|
|
$
|
709
|
|
$
|
702
|
|
||
|
Ambulatory Care
|
84
|
|
91
|
|
46
|
|
|||||
|
Conifer
|
50
|
|
50
|
|
49
|
|
|||||
|
Total
|
$
|
870
|
|
$
|
850
|
|
$
|
797
|
|
||
|
Adjusted EBITDA
|
$
|
2,444
|
|
$
|
2,478
|
|
$
|
2,280
|
|
||
|
Loss from divested and closed businesses
(i.e., the Company’s health plan businesses) |
(41
|
)
|
(37
|
)
|
17
|
|
|||||
|
Depreciation and amortization
|
(870
|
)
|
(850
|
)
|
(797
|
)
|
|||||
|
Impairment and restructuring charges, and acquisition-related costs
|
(541
|
)
|
(202
|
)
|
(318
|
)
|
|||||
|
Litigation and investigation costs
|
(23
|
)
|
(293
|
)
|
(291
|
)
|
|||||
|
Interest expense
|
(1,028
|
)
|
(979
|
)
|
(912
|
)
|
|||||
|
Loss from early extinguishment of debt
|
(164
|
)
|
—
|
|
(1
|
)
|
|||||
|
Other non-operating expense, net
|
(22
|
)
|
(20
|
)
|
(20
|
)
|
|||||
|
Gains on sales, consolidation and deconsolidation of facilities
|
144
|
|
151
|
|
186
|
|
|||||
|
Income (loss) from continuing operations, before income taxes
|
$
|
(101
|
)
|
$
|
248
|
|
$
|
144
|
|
||
138
Recently Issued Accounting Standards
In May 2014, the FASB issued ASU 2014-09, “Revenue from Contracts with Customers (Topic 606)” (“ASU 2014-09”). In August 2015, the FASB amended the guidance to defer the effective date of this standard by one year. ASU 2014-09 affects any entity that either enters into contracts with customers to transfer goods or services or enters into contracts for the transfer of nonfinancial assets unless those contracts are within the scope of other standards. The core principle of the guidance in ASU 2014-09 is that an entity should recognize revenue to depict the transfer of promised goods or services to customers in an amount that reflects the consideration to which the entity expects to be entitled in exchange for those goods or services. We have completed our evaluation of the requirements of the new standard to insure that we have processes, systems and internal controls in place to collect the necessary information to implement the standard, which became effective for us on January 1, 2018, and we are drafting the new disclosures required post implementation. We used a modified retrospective method of application to adopt ASU 2014‑09 on January 1, 2018. For our Hospital Operations and other and Ambulatory Care segments, we used a portfolio approach to apply the new model to classes of payers with similar characteristics and analyzed cash collection trends over an appropriate collection look-back period depending on the payer. Adoption of ASU 2014‑09 will result in changes to our presentation for and disclosure of revenue related to uninsured or underinsured patients. Prior to the adoption of ASU 2014-09, a significant portion of our provision for doubtful accounts related to self-pay patients, as well as co-pays and deductibles owed to us by patients with insurance in our Hospital Operations and other segment. Under ASU 2014-09, the estimated uncollectible amounts due from these patients are generally considered a direct reduction to net operating revenues and, correspondingly, result in a material reduction in the amounts presented separately as provision for doubtful accounts. We also completed our assessment of the impact of the new standard on various reimbursement programs that represent variable consideration and concluded that accounting for these programs under the new standard is substantially consistent with our historical accounting practices. These include supplemental state Medicaid programs, disproportionate share payments and settlements with third party payers. The payment mechanisms for these types of programs vary by state. For our Conifer segment, the adoption of ASU 2014-09 will result in changes to our presentation and disclosure of customer contract assets and liabilities and the assessment of variable consideration under customer contracts. While the adoption of ASU 2014-09 will have a material effect on the presentation of net operating revenues in our Consolidated Statements of Operations and will impact certain disclosures, it will not materially impact our financial position, results of operations or cash flows. There was no cumulative effect of a change in accounting principle recorded related to the adoption of ASU 2014-09 on January 1, 2018.
In January 2016, the FASB issued ASU 2016-01, “Financial Instruments-Overall (Subtopic 825-10) Recognition and Measurement of Financial Assets and Financial Liabilities” (“ASU 2016-01”), which affects all entities that hold financial assets or owe financial liabilities. The guidance in ASU 2016-01 supersedes the guidance to classify equity securities with readily determinable fair values into different categories (that is, trading or available-for-sale) and require equity securities (including other ownership interests, such as partnerships, unincorporated joint ventures, and limited liability companies) to be measured at fair value with changes in the fair value recognized through net income. An entity’s equity investments that are accounted for under the equity method of accounting or result in consolidation of an investee are not included within the scope of this guidance. The amendments allow equity investments that do not have readily determinable fair values to be remeasured at fair value either upon the occurrence of an observable price change or upon identification of an impairment. The amendments also require enhanced disclosures about those investments. Upon adoption of ASU 2016-01 on January 1, 2018, we recorded a cumulative effect adjustment to increase retained earnings by approximately
$7 million
.
In February 2016, the FASB issued ASU 2016-02, “Leases (Topic 842)” (“ASU 2016-02”), which affects any entity that enters into a lease (as that term is defined in ASU 2016-02), with some specified scope exceptions. The main difference between the guidance in ASU 2016-02 and current GAAP is the recognition of lease assets and lease liabilities by lessees for those leases classified as operating leases under current GAAP. Recognition of these assets and liabilities will have a material impact to our consolidated balance sheets upon adoption. Under ASU 2016-02, lessees and lessors are required to recognize and measure leases at the beginning of the earliest period presented using a modified retrospective approach, which includes a number of optional practical expedients. We are currently evaluating the potential impact of this guidance, which will be effective for us beginning in 2019, including performing an assessment of the quantity of and contractual provisions in various leasing arrangements to guide our implementation plan related to processes, systems and internal controls and the conclusion on the use of the optional practical expedients.
In March 2016, the FASB issued ASU 2016-09, which simplifies several aspects of the accounting for share-based payment transactions, including the income tax consequences, classification of awards as either equity or liabilities, and classification on the statement of cash flows. As further discussed in Note 1, we adopted ASU 2016-09 effective
139
January 1, 2017 and, upon adoption, we recorded previously unrecognized excess tax benefits of approximately
$56 million
as a deferred tax asset and a cumulative effect adjustment to retained earnings as of January 1, 2017.
In August 2016, the FASB issued ASU 2016-15, “Statement of Cash Flows (Topic 230) Classification of Certain Cash Receipts and Cash Payments” (“ASU 2016-15”), which applies to all entities that are required to present a statement of cash flows under Topic 230. ASU 2016-15 addresses the presentation and classification of cash flows related to (i) debt prepayment or debt extinguishment costs, (ii) settlement of zero-coupon debt instruments or other debt instruments with coupon interest rates that are insignificant in relation to the effective interest rate of the borrowing, (iii) contingent consideration payments made after a business combination, (iv) proceeds from the settlement of insurance claims, (v) proceeds from the settlement of corporate-owned life insurance policies (including bank-owned life insurance policies), (vi) distributions received from equity method investees, (vii) beneficial interests in securitization transactions, and (viii) separately identifiable cash flows and application of the predominance principle. The amendments in ASU 2016-05 should be applied using a retrospective transition method to each period presented, unless it is impracticable. We do not expect the adoption of this guidance, which will be effective for us beginning in 2018, to have a material effect on our statement of cash flows.
In November 2016, the FASB issued ASU 2016-18, “Statement of Cash Flows (Topic 230) Restricted Cash” (“ASU 2016-18”), which applies to all entities that have restricted cash or restricted cash equivalents and are required to present a statement of cash flows under Topic 230. ASU 2016-18 requires that a statement of cash flows explain the change during the period in the total of cash, cash equivalents, and amounts generally described as restricted cash or restricted cash equivalents. Therefore, amounts generally described as restricted cash and restricted cash equivalents should be included with cash and cash equivalents when reconciling the beginning-of-period and end-of-period total amounts shown on the statement of cash flows. The amendments in ASU 2016-18 do not provide a definition of restricted cash or restricted cash equivalents. The amendments in ASU 2016-18 should be applied using a retrospective transition method to each period presented. We do not expect the adoption of this guidance, which will be effective for us beginning in 2018, to have a material effect on our statement of cash flows.
In January 2017, the FASB issued ASU 2017-04, “Intangibles-Goodwill and Other (Topic 350)” (“ASU 2017‑04”), which affects public business and other entities that have goodwill reported in their financial statements and have not elected the private company alternative for the subsequent measurement of goodwill. The amendments in ASU 2017-04 modify the concept of impairment from the condition that exists when the carrying amount of goodwill exceeds its implied fair value to the condition that exists when the carrying amount of a reporting unit exceeds its fair value. An entity no longer will determine goodwill impairment by calculating the implied fair value of goodwill by assigning the fair value of a reporting unit to all of its assets and liabilities as if that reporting unit had been acquired in a business combination. Because these amendments eliminate Step 2 from the goodwill impairment test, they should reduce the cost and complexity of evaluating goodwill for impairment. We early adopted ASU 2017-04 for our annual goodwill impairment tests for the year ended December 31, 2017, and such adoption did not affect our financial position, results of operations or cash flows.
In March 2017, the FASB issued ASU 2017-07, which requires that an employer report the service cost component in the same line item or items as other compensation costs arising from services rendered by the pertinent employees during the period. The other components of net benefit cost are required to be presented in the statement of operations separately from the service cost component and outside a subtotal of income from operations. As further discussed in Note 1, we early adopted ASU 2017-07 effective January 1, 2017 and such adoption did not have a material effect on our financial position, results of operations or cash flows
In February 2018, the FASB issued ASU 2018-02, “Income Statement-Reporting Comprehensive Income (Topic 220)” (“ASU 2018-02”), which allows a reclassification from accumulated other comprehensive income to retained earnings for stranded tax effects resulting from the Tax Act and requires certain disclosures about stranded tax effects. The amendments in ASU 2018-02 are effective for us beginning in 2019, with early adoption permitted, and may be applied either in the period of adoption or retrospectively to each period in which the effect of the change in the U.S. federal corporate tax rate in the Tax Act is recognized. We are currently evaluating the potential impact of this guidance, as well as the timing and method of our adoption.
140
SUPPLEMENTAL FINANCIAL INFORMATION
SELECTED QUARTERLY FINANCIAL DATA
(UNAUDITED)
|
|
Year Ended December 31, 2017
|
||||||||||||||
|
|
First
|
Second
|
Third
|
Fourth
|
|||||||||||
|
Net operating revenues
|
$
|
4,813
|
|
$
|
4,802
|
|
$
|
4,586
|
|
$
|
4,978
|
|
|||
|
Net income (loss)
|
$
|
36
|
|
$
|
32
|
|
$
|
(289
|
)
|
$
|
(99
|
)
|
|||
|
Net loss attributable to Tenet Healthcare Corporation common shareholders
|
$
|
(53
|
)
|
$
|
(55
|
)
|
$
|
(367
|
)
|
$
|
(229
|
)
|
|||
|
Loss per share attributable to Tenet Healthcare Corporation common shareholders:
|
|
|
|
|
|
|
|
|
|||||||
|
Basic
|
$
|
(0.53
|
)
|
$
|
(0.55
|
)
|
$
|
(3.64
|
)
|
$
|
(2.27
|
)
|
|||
|
Diluted
|
$
|
(0.53
|
)
|
$
|
(0.55
|
)
|
$
|
(3.64
|
)
|
$
|
(2.27
|
)
|
|||
|
|
Year Ended December 31, 2016
|
||||||||||||||
|
|
First
|
Second
|
Third
|
Fourth
|
|||||||||||
|
Net operating revenues
|
$
|
5,044
|
|
$
|
4,868
|
|
$
|
4,849
|
|
$
|
4,860
|
|
|||
|
Net income
|
$
|
34
|
|
$
|
39
|
|
$
|
80
|
|
$
|
23
|
|
|||
|
Net loss attributable to Tenet Healthcare Corporation common shareholders
|
$
|
(59
|
)
|
$
|
(46
|
)
|
$
|
(8
|
)
|
$
|
(79
|
)
|
|||
|
Loss per share attributable to Tenet Healthcare Corporation common shareholders:
|
|
|
|
|
|
|
|
|
|||||||
|
Basic
|
$
|
(0.60
|
)
|
$
|
(0.46
|
)
|
$
|
(0.08
|
)
|
$
|
(0.79
|
)
|
|||
|
Diluted
|
$
|
(0.60
|
)
|
$
|
(0.46
|
)
|
$
|
(0.08
|
)
|
$
|
(0.79
|
)
|
|||
Quarterly operating results are not necessarily indicative of the results that may be expected for the full year. Reasons for this include, but are not limited to: overall revenue and cost trends, particularly the timing and magnitude of price changes; fluctuations in contractual allowances and cost report settlements and valuation allowances; managed care contract negotiations, settlements or terminations and payer consolidations; changes in Medicare and Medicaid regulations; Medicaid and other supplemental funding levels set by the states in which we operate; the timing of approval by the Centers for Medicare and Medicaid Services of Medicaid provider fee revenue programs; trends in patient accounts receivable collectability and associated provisions for doubtful accounts; fluctuations in interest rates; levels of malpractice insurance expense and settlement trends; impairment of long-lived assets and goodwill; restructuring charges; losses, costs and insurance recoveries related to natural disasters and other weather-related occurrences; litigation and investigation costs; acquisitions and dispositions of facilities and other assets; gains (losses) on sales, consolidation and deconsolidation of facilities; income tax rates and deferred tax asset valuation allowance activity; changes in estimates of accruals for annual incentive compensation; the timing and amounts of stock option and restricted stock unit grants to employees and directors; gains or losses from early extinguishment of debt; and changes in occupancy levels and patient volumes. Factors that affect patient volumes and, thereby, the results of operations at our hospitals and related healthcare facilities include, but are not limited to: changes in federal and state healthcare regulations; the business environment, economic conditions and demographics of local communities in which we operate; the number of uninsured and underinsured individuals in local communities treated at our hospitals; seasonal cycles of illness; climate and weather conditions; physician recruitment, retention and attrition; advances in technology and treatments that reduce length of stay; local healthcare competitors; managed care contract negotiations or terminations; the number of patients with high-deductible health insurance plans; hospital performance data on quality measures and patient satisfaction, as well as standard charges for services; any unfavorable publicity about us, or our joint venture partners, that impacts our relationships with physicians and patients; and the timing of elective procedures. These considerations apply to year-to-year comparisons as well.
None.
We carried out an evaluation of the effectiveness of the design and operation of our disclosure controls and procedures as defined by Rules 13a-15(e) and 15d-15(e) under the Securities Exchange Act of 1934, as amended (the “Exchange Act”), as of the end of the period covered by this report. The evaluation was performed under the supervision and with the participation
141
of management, including our chief executive officer and chief financial officer. Based upon that evaluation, our chief executive officer and chief financial officer concluded that our disclosure controls and procedures are effective to ensure that material information is recorded, processed, summarized and reported by management on a timely basis in order to comply with our disclosure obligations under the Exchange Act and the SEC rules thereunder.
Management’s report on internal control over financial reporting is set forth on page 94 and is incorporated herein by reference. The independent registered public accounting firm that audited the financial statements included in this report has issued an attestation report on our internal control over financial reporting as set forth on page 95 herein.
There were no changes in our internal control over financial reporting during the quarter ended
December 31, 2017
that have materially affected, or are reasonably likely to materially affect, our internal control over financial reporting.
None.
142
Certain information required by this Item is hereby incorporated by reference to our definitive proxy statement in accordance with General Instruction G(3) to Form 10-K. Information concerning our executive officers appears under Item 1, Business – Executive Officers, of Part I of this report, and information concerning our Standards of Conduct, by which all of our employees, including our chief executive officer, chief financial officer and principal accounting officer, are required to abide appears under Item 1, Business – Compliance and Ethics, of Part I of this report.
Information required by this Item is hereby incorporated by reference to our definitive proxy statement in accordance with General Instruction G(3) to Form 10-K.
|
ITEM 12.
|
SECURITY OWNERSHIP OF CERTAIN BENEFICIAL OWNERS AND MANAGEMENT AND RELATED STOCKHOLDER MATTERS
|
Information required by this Item is hereby incorporated by reference to our definitive proxy statement in accordance with General Instruction G(3) to Form 10-K.
Information required by this Item is hereby incorporated by reference to our definitive proxy statement in accordance with General Instruction G(3) to Form 10-K.
Information required by this Item is hereby incorporated by reference to our definitive proxy statement in accordance with General Instruction G(3) to Form 10-K.
143
FINANCIAL STATEMENTS
The Consolidated Financial Statements and notes thereto can be found on pages 97 through 140.
FINANCIAL STATEMENT SCHEDULES
Schedule II—Valuation and Qualifying Accounts (included on page 153).
All other schedules and financial statements of the Registrant are omitted because they are not applicable or not required or because the required information is included in the Consolidated Financial Statements or notes thereto.
FINANCIAL STATEMENTS REQUIRED BY RULE 3-09 OF REGULATION S-X
The consolidated financial statements of Texas Health Ventures Group, L.L.C. and subsidiaries (“THVG”), which are included due to the significance of the equity in earnings of unconsolidated affiliates we recognized from our investment in THVG for the years ended
December 31, 2017
and
2016
, can be found on pages F-1 through F-18.
All other schedules and financial statements of THVG are omitted because they are not applicable or not required or because the required information is included in the Consolidated Financial Statements or notes thereto.
144
EXHIBITS
Unless otherwise indicated, the following exhibits are filed with this report:
|
(2
|
)
|
Plan of Acquisition, Reorganization, Arrangement, Liquidation or Succession
|
||
|
(a)
|
||||
|
(3
|
)
|
Articles of Incorporation and Bylaws
|
||
|
(a)
|
|
|||
|
(b)
|
|
|||
|
(c)
|
|
|||
|
(d)
|
|
|||
|
(4
|
)
|
Instruments Defining the Rights of Security Holders, Including Indentures
|
||
|
(a)
|
||||
|
(b)
|
|
|||
|
(c)
|
||||
|
(d)
|
|
|||
|
(e)
|
|
|||
|
(f)
|
||||
|
(g)
|
|
|||
145
|
(h)
|
|||
|
(i)
|
|
||
|
(j)
|
|
||
|
(k)
|
|
||
|
(l)
|
|
||
|
(m)
|
|
||
|
(n)
|
|
||
|
(o)
|
|
||
|
(p)
|
|
||
|
(q)
|
|
||
|
(r)
|
|
||
|
(s)
|
|||
|
(t)
|
|||
146
|
(u)
|
||||
|
(10
|
)
|
Material Contracts
|
||
|
(a)
|
|
|||
|
(b)
|
|
|||
|
(c)
|
|
|||
|
(d)
|
|
|||
|
(e)
|
|
|||
|
(f)
|
|
|||
|
(g)
|
|
|||
|
(h)
|
|
|||
|
(i)
|
|
|||
|
(j)
|
|
|||
147
|
(k)
|
|
||
|
(l)
|
|
||
|
(m)
|
|
||
|
(n)
|
|
||
|
(o)
|
|
||
|
(p)
|
|
||
|
(q)
|
|
||
|
(r)
|
|
||
|
(s)
|
|
||
|
(t)
|
|
||
|
(u)
|
|
||
|
(v)
|
|
||
|
(w)
|
|
||
|
(x)
|
|
||
148
|
(y)
|
|
||
|
(z)
|
|
||
|
(aa)
|
|
||
|
(bb)
|
|
||
|
(cc)
|
|
||
|
(dd)
|
|
||
|
(ee)
|
|
||
|
(ff)
|
|
||
|
(gg)
|
|
||
|
(hh)
|
|
||
|
(ii)
|
|||
|
(jj)
|
|
||
|
(kk)
|
|
||
|
(ll)
|
|
||
|
(mm)
|
|
||
149
|
(nn)
|
|
|||
|
(21
|
)
|
|||
|
(23
|
)
|
Consents
|
||
|
(a)
|
||||
|
(b)
|
|
|||
|
(31
|
)
|
Rule 13a-14(a)/15d-14(a) Certifications
|
||
|
(a)
|
||||
|
(b)
|
||||
|
(32
|
)
|
|||
|
(101 INS)
|
|
XBRL Instance Document
|
||
|
(101 SCH)
|
|
XBRL Taxonomy Extension Schema Document
|
||
|
(101 CAL)
|
|
XBRL Taxonomy Extension Calculation Linkbase Document
|
||
|
(101 DEF)
|
|
XBRL Taxonomy Extension Definition Linkbase Document
|
||
|
(101 LAB)
|
|
XBRL Taxonomy Extension Label Linkbase Document
|
||
|
(101 PRE)
|
|
XBRL Taxonomy Extension Presentation Linkbase Document
|
||
|
* Management contract or compensatory plan or arrangement.
|
||||
Not applicable.
150
SIGNATURES
Pursuant to the requirements of Section 13 or 15(d) of the Securities Exchange Act of 1934, the Registrant has duly caused this report to be signed on its behalf by the undersigned, thereunto duly authorized.
|
|
|
TENET HEALTHCARE CORPORATION
(Registrant)
|
|
Date: February 26, 2018
|
By:
|
/s/ R. SCOTT RAMSEY
|
|
|
|
R. Scott Ramsey
Vice President and Controller
(Principal Accounting Officer)
|
Pursuant to the requirements of the Securities Exchange Act of 1934, this report has been signed below by the following persons on behalf of the Registrant and in the capacities and on the dates indicated.
|
Date: February 26, 2018
|
By:
|
/s/ RONALD A. RITTENMEYER
|
|
|
|
Ronald A. Rittenmeyer
Executive Chairman and Chief Executive Officer
(Principal Executive Officer)
|
|
Date: February 26, 2018
|
By:
|
/s/ DANIEL J. CANCELMI
|
|
|
|
Daniel J. Cancelmi
Chief Financial Officer
(Principal Financial Officer)
|
|
Date: February 26, 2018
|
By:
|
/s/ R. SCOTT RAMSEY
|
|
|
|
R. Scott Ramsey
Vice President and Controller
(Principal Accounting Officer)
|
|
Date: February 26, 2018
|
By:
|
/s/ JAMES L. BIERMAN
|
|
|
|
James L. Bierman
Director
|
|
Date: February 26, 2018
|
By:
|
/s/ JOHN P. BYRNES
|
|
|
|
John P. Byrnes
Director
|
|
Date: February 26, 2018
|
By:
|
/s/ RICHARD FISHER
|
|
|
|
Richard Fisher
Director
|
|
Date: February 26, 2018
|
By:
|
/s/ BRENDA J. GAINES
|
|
|
|
Brenda J. Gaines
Director
|
|
Date: February 26, 2018
|
By:
|
/s/ KAREN M. GARRISON
|
|
|
|
Karen M. Garrison
Director
|
|
Date: February 26, 2018
|
By:
|
/s/ EDWARD A. KANGAS
|
|
|
|
Edward A. Kangas
Director
|
|
Date: February 26, 2018
|
By:
|
/s/ J. ROBERT KERREY
|
|
|
|
J. Robert Kerrey
Director
|
|
Date: February 26, 2018
|
By:
|
/s/ RICHARD MARK
|
|
|
|
Richard Mark
Director
|
151
|
Date: February 26, 2018
|
By:
|
/s/ RICHARD R. PETTINGILL
|
|
|
|
Richard R. Pettingill
Director |
|
Date: February 26, 2018
|
By:
|
/s/ TAMMY ROMO
|
|
|
|
Tammy Romo
Director
|
|
Date: February 26, 2018
|
By:
|
/s/ PETER M. WILVER
|
|
|
|
Peter M. Wilver
Director
|
152
SCHEDULE II—VALUATION AND QUALIFYING ACCOUNTS
(In Millions)
|
|
|
Additions Charged To:
|
|
|
|||||||||||||||
|
|
Balance at
Beginning
of Period
|
Costs and
Expenses
(1)(2)
|
Deductions
(3)
|
Other
Items
(4)
|
Balance at
End of
Period
|
||||||||||||||
|
Allowance for doubtful accounts:
|
|
|
|
|
|
|
|
|
|
|
|||||||||
|
Year ended December 31, 2017
|
$
|
1,031
|
|
$
|
1,434
|
|
$
|
(1,445
|
)
|
$
|
(122
|
)
|
$
|
898
|
|
||||
|
Year ended December 31, 2016
|
$
|
887
|
|
$
|
1,451
|
|
$
|
(1,307
|
)
|
$
|
—
|
|
$
|
1,031
|
|
||||
|
Year ended December 31, 2015
|
$
|
852
|
|
$
|
1,480
|
|
$
|
(1,388
|
)
|
$
|
(57
|
)
|
$
|
887
|
|
||||
|
Valuation allowance for deferred tax assets:
|
|
|
|
|
|
|
|
|
|
|
|||||||||
|
Year ended December 31, 2017
|
$
|
72
|
|
$
|
—
|
|
$
|
—
|
|
$
|
—
|
|
$
|
72
|
|
||||
|
Year ended December 31, 2016
|
$
|
96
|
|
$
|
(24
|
)
|
$
|
—
|
|
$
|
—
|
|
$
|
72
|
|
||||
|
Year ended December 31, 2015
|
$
|
87
|
|
$
|
4
|
|
$
|
—
|
|
$
|
5
|
|
$
|
96
|
|
||||
|
(1)
|
Includes amounts recorded in discontinued operations.
|
|
(2)
|
Before considering recoveries on accounts or notes previously written off.
|
|
(3)
|
Accounts written off.
|
|
(4)
|
Acquisition and divestiture activity.
|
153
TEXAS HEALTH VENTURES GROUP, L.L.C. AND SUBSIDIARIES
CONSOLIDATED FINANCIAL STATEMENTS
YEARS ENDED JUNE 30, 2017 AND 2016
CONTENTS
F-1
Report of Independent Auditors
To the Board of Managers of
Texas Health Ventures Group, L.L.C.:
We have audited the accompanying consolidated financial statements of Texas Health Ventures Group, L.L.C. and its subsidiaries, which comprise the consolidated balance sheets as of June 30, 2017 and 2016, and the related consolidated statements of income, changes in equity and of cash flows for the years then ended.
Management’s Responsibility for the Consolidated Financial Statements
Management is responsible for the preparation and fair presentation of the consolidated financial statements in accordance with accounting principles generally accepted in the United States of America; this includes the design, implementation, and maintenance of internal control relevant to the preparation and fair presentation of consolidated financial statements that are free from material misstatement, whether due to fraud or error.
Auditors
’
Responsibility
Our responsibility is to express an opinion on the consolidated financial statements based on our audits. We conducted our audits in accordance with auditing standards generally accepted in the United States of America. Those standards require that we plan and perform the audit to obtain reasonable assurance about whether the consolidated financial statements are free from material misstatement.
An audit involves performing procedures to obtain audit evidence about the amounts and disclosures in the consolidated financial statements. The procedures selected depend on our judgment, including the assessment of the risks of material misstatement of the consolidated financial statements, whether due to fraud or error. In making those risk assessments, we consider internal control relevant to the Company’s preparation and fair presentation of the consolidated financial statements in order to design audit procedures that are appropriate in the circumstances, but not for the purpose of expressing an opinion on the effectiveness of the Company’s internal control. Accordingly, we express no such opinion. An audit also includes evaluating the appropriateness of accounting policies used and the reasonableness of significant accounting estimates made by management, as well as evaluating the overall presentation of the consolidated financial statements. We believe that the audit evidence we have obtained is sufficient and appropriate to provide a basis for our audit opinion.
Opinion
In our opinion, the consolidated financial statements referred to above present fairly, in all material respects, the financial position of Texas Health Ventures Group, L.L.C. and its subsidiaries as of June 30, 2017 and 2016, and the results of their operations and their cash flows for the years then ended in accordance with accounting principles generally accepted in the United States of America.
/s/ PricewaterhouseCoopers LLP
Dallas, Texas
November 3, 2017
F-2
TEXAS HEALTH VENTURES GROUP, L.L.C. AND SUBSIDIARIES
CONSOLIDATED BALANCE SHEETS – JUNE 30, 2017 AND 2016
(in thousands)
|
|
2017
|
2016
|
|||||
|
ASSETS
|
|
|
|||||
|
CURRENT ASSETS:
|
|
|
|||||
|
Cash
|
$
|
19,957
|
|
$
|
14,602
|
|
|
|
Funds due from United Surgical Partners, Inc.
|
82,280
|
|
70,776
|
|
|||
|
Patient receivables, net of allowance for doubtful accounts of $16,102 and $14,952 at June 30, 2017 and 2016, respectively
|
83,405
|
|
80,612
|
|
|||
|
Supplies
|
20,568
|
|
18,833
|
|
|||
|
Prepaid and other current assets
|
5,277
|
|
5,784
|
|
|||
|
Total current assets
|
211,487
|
|
190,607
|
|
|||
|
|
|
||||||
|
PROPERTY AND EQUIPMENT, net (Note 2)
|
154,768
|
|
160,708
|
|
|||
|
|
|
||||||
|
OTHER LONG-TERM ASSETS:
|
|
|
|||||
|
Restricted cash
|
9,960
|
|
—
|
|
|||
|
Investments in unconsolidated affiliates (Note 3)
|
7,143
|
|
3,968
|
|
|||
|
Goodwill and intangible assets, net (Note 5)
|
259,332
|
|
240,649
|
|
|||
|
Other
|
217
|
|
178
|
|
|||
|
Total assets
|
$
|
642,907
|
|
$
|
596,110
|
|
|
|
|
|
||||||
|
LIABILITIES AND EQUITY
|
|
|
|||||
|
|
|
||||||
|
CURRENT LIABILITIES:
|
|
|
|||||
|
Accounts payable
|
$
|
46,092
|
|
$
|
39,314
|
|
|
|
Accrued expenses and other
|
32,892
|
|
32,252
|
|
|||
|
Current portion of long-term obligations (Note 6)
|
18,301
|
|
12,494
|
|
|||
|
Total current liabilities
|
97,285
|
|
84,060
|
|
|||
|
|
|
|
|||||
|
LONG-TERM OBLIGATIONS, NET OF CURRENT PORTION (Note 6)
|
134,604
|
|
138,924
|
|
|||
|
|
|
|
|||||
|
OTHER LIABILITIES
|
13,505
|
|
13,678
|
|
|||
|
Total liabilities
|
245,394
|
|
236,662
|
|
|||
|
|
|
|
|||||
|
COMMITMENTS AND CONTINGENCIES (Notes 6, 7, 8 and 9)
|
|
|
|
|
|||
|
|
|
|
|||||
|
NONCONTROLLING INTERESTS - REDEEMABLE
|
109,147
|
|
89,927
|
|
|||
|
|
|
|
|||||
|
EQUITY:
|
|
|
|
|
|||
|
Members’ equity
|
263,758
|
|
246,433
|
|
|||
|
Noncontrolling interests – nonredeemable
|
24,608
|
|
23,088
|
|
|||
|
Total equity
|
288,366
|
|
269,521
|
|
|||
|
Total liabilities and equity
|
$
|
642,907
|
|
$
|
596,110
|
|
|
See accompanying notes to consolidated financial statements.
F-3
TEXAS HEALTH VENTURES GROUP, L.L.C. AND SUBSIDIARIES
CONSOLIDATED STATEMENTS OF INCOME
FOR THE YEARS ENDED JUNE 30, 2017 AND 2016
(in thousands)
|
|
2017
|
2016
|
|||||
|
REVENUES:
|
|
|
|||||
|
Net patient service revenue
|
$
|
960,827
|
|
$
|
881,897
|
|
|
|
Other income
|
3,038
|
|
7,886
|
|
|||
|
Total revenues
|
963,865
|
|
889,783
|
|
|||
|
|
|
||||||
|
EQUITY IN EARNINGS OF UNCONSOLIDATED AFFILIATES (Note 3)
|
3,965
|
|
3,861
|
|
|||
|
|
|
||||||
|
OPERATING EXPENSES:
|
|
|
|||||
|
Salaries, benefits, and other employee costs
|
212,373
|
|
198,257
|
|
|||
|
Medical services and supplies
|
236,711
|
|
220,279
|
|
|||
|
Management and royalty fees (Note 8)
|
36,579
|
|
34,174
|
|
|||
|
Professional fees
|
5,113
|
|
5,803
|
|
|||
|
Purchased services
|
39,310
|
|
36,209
|
|
|||
|
Other operating expenses
|
99,511
|
|
93,867
|
|
|||
|
Provision for doubtful accounts
|
22,503
|
|
21,739
|
|
|||
|
Impairment loss
|
—
|
|
5,667
|
|
|||
|
Depreciation and amortization
|
27,735
|
|
29,091
|
|
|||
|
Total operating expenses
|
679,835
|
|
645,086
|
|
|||
|
Operating income
|
287,995
|
|
248,558
|
|
|||
|
|
|
|
|||||
|
NONOPERATING INCOME (EXPENSES):
|
|
|
|||||
|
Interest expense
|
(13,711
|
)
|
(14,028
|
)
|
|||
|
Interest income (Note 8)
|
492
|
|
364
|
|
|||
|
Other expense, net
|
(1,825
|
)
|
(350
|
)
|
|||
|
Net income before income taxes
|
272,951
|
|
234,544
|
|
|||
|
|
|
||||||
|
INCOME TAXES
|
(5,136
|
)
|
(3,858
|
)
|
|||
|
Net income
|
267,815
|
|
230,686
|
|
|||
|
|
|
||||||
|
NET INCOME ATTRIBUTABLE TO NONCONTROLLING INTERESTS – Redeemable
|
(134,905
|
)
|
(117,018
|
)
|
|||
|
|
|
|
|||||
|
NET INCOME ATTRIBUTABLE TO NONCONTROLLING INTERESTS – Nonredeemable
|
(6,822
|
)
|
(4,958
|
)
|
|||
|
Net income attributable to THVG
|
$
|
126,088
|
|
$
|
108,710
|
|
|
See accompanying notes to consolidated financial statements.
F-4
TEXAS HEALTH VENTURES GROUP, L.L.C. AND SUBSIDIARIES
CONSOLIDATED STATEMENTS OF CHANGES IN EQUITY
FOR THE YEARS ENDED JUNE 30, 2017 AND 2016
(in thousands)
|
|
|
Members’ Equity
|
|||||||||||||||||
|
|
Equity
|
USP
|
BUMC
|
Members’
Equity
|
Noncontrolling
Interests -
Nonredeemable
|
||||||||||||||
|
Balance at June 30, 2015
|
$
|
253,720
|
|
$
|
115,909
|
|
$
|
116,374
|
|
$
|
232,283
|
|
$
|
21,437
|
|
||||
|
Net income
|
113,668
|
|
54,246
|
|
54,464
|
|
108,710
|
|
4,958
|
|
|||||||||
|
Distributions to members
|
(105,054
|
)
|
(50,121
|
)
|
(50,321
|
)
|
(100,442
|
)
|
(4,612
|
)
|
|||||||||
|
Contributions from members
|
8,912
|
|
4,447
|
|
4,465
|
|
8,912
|
|
—
|
|
|||||||||
|
Purchase of noncontrolling interests
|
(811
|
)
|
(400
|
)
|
(401
|
)
|
(801
|
)
|
(10
|
)
|
|||||||||
|
Sale of noncontrolling interests
|
(914
|
)
|
(1,113
|
)
|
(1,116
|
)
|
(2,229
|
)
|
1,315
|
|
|||||||||
|
Balance at June 30, 2016
|
269,521
|
|
122,968
|
|
123,465
|
|
246,433
|
|
23,088
|
|
|||||||||
|
Net income
|
132,910
|
|
62,918
|
|
63,170
|
|
126,088
|
|
6,822
|
|
|||||||||
|
Distributions to members
|
(128,882
|
)
|
(60,778
|
)
|
(61,022
|
)
|
(121,800
|
)
|
(7,082
|
)
|
|||||||||
|
Contributions from members
|
13,571
|
|
6,772
|
|
6,799
|
|
13,571
|
|
-
|
|
|||||||||
|
Purchase of noncontrolling interests
|
(1,160
|
)
|
(718
|
)
|
(720
|
)
|
(1,438
|
)
|
278
|
|
|||||||||
|
Sale of noncontrolling interests
|
2,406
|
|
451
|
|
453
|
|
904
|
|
1,502
|
|
|||||||||
|
Balance at June 30, 2017
|
$
|
288,366
|
|
$
|
131,613
|
|
$
|
132,145
|
|
$
|
263,758
|
|
$
|
24,608
|
|
||||
See accompanying notes to consolidated financial statements.
F-5
TEXAS HEALTH VENTURES GROUP, L.L.C. AND SUBSIDIARIES
CONSOLIDATED STATEMENTS OF CASH FLOWS
FOR THE YEARS ENDED JUNE 30, 2017 AND 2016
(in thousands)
|
|
2017
|
2016
|
|||||
|
CASH FLOWS FROM OPERATING ACTIVITIES:
|
|
|
|||||
|
Net income
|
$
|
267,815
|
|
$
|
230,686
|
|
|
|
Adjustments to reconcile net income to net cash provided by operating activities:
|
|
|
|||||
|
Provision for doubtful accounts
|
22,503
|
|
21,739
|
|
|||
|
Depreciation and amortization
|
27,735
|
|
29,091
|
|
|||
|
Amortization of debt issue costs
|
5
|
|
7
|
|
|||
|
Equity in earnings of unconsolidated affiliates, net of distributions received
|
645
|
|
(232
|
)
|
|||
|
Loss on fixed asset impairment
|
—
|
|
5,667
|
|
|||
|
Loss (gain) on sale of assets
|
405
|
|
(67
|
)
|
|||
|
Changes in operating assets and liabilities, net of effects from purchases of new businesses:
|
|
|
|||||
|
Increase in patient receivables
|
(24,773
|
)
|
(36,666
|
)
|
|||
|
Increase in supplies, prepaids, and other assets
|
(962
|
)
|
(4,937
|
)
|
|||
|
Increase in accounts payable, accrued expenses, and other liabilities
|
8,693
|
|
13,348
|
|
|||
|
Net cash provided by operating activities
|
302,066
|
|
258,636
|
|
|||
|
|
|
||||||
|
CASH FLOWS FROM INVESTING ACTIVITIES:
|
|
|
|||||
|
Purchases of new businesses and equity interests, net of cash received of $0 and $135 for 2017 and 2016, respectively
|
(3,853
|
)
|
(9,171
|
)
|
|||
|
Purchases of property and equipment
|
(16,905
|
)
|
(17,207
|
)
|
|||
|
Sale of property and equipment
|
1,233
|
|
160
|
|
|||
|
Change in deposits and notes receivables
|
(5
|
)
|
9
|
|
|||
|
Change in funds due from United Surgical Partners, Inc.
|
(10,416
|
)
|
(12,794
|
)
|
|||
|
Net cash used in investing activities
|
(29,946
|
)
|
(39,003
|
)
|
|||
|
CASH FLOWS FROM FINANCING ACTIVITIES:
|
|
|
|||||
|
Proceeds from debt obligations
|
$
|
278
|
|
$
|
4,624
|
|
|
|
Payments on debt obligations
|
(13,786
|
)
|
(14,186
|
)
|
|||
|
Distributions to noncontrolling interest owners
|
(144,455
|
)
|
(114,380
|
)
|
|||
|
Purchases of noncontrolling interests
|
(5,447
|
)
|
(3,861
|
)
|
|||
|
Sales of noncontrolling interests
|
18,445
|
|
2,272
|
|
|||
|
Contribution from members
|
—
|
|
8,912
|
|
|||
|
Distributions to members
|
(121,800
|
)
|
(100,442
|
)
|
|||
|
Net cash used in financing activities
|
(266,765
|
)
|
(217,061
|
)
|
|||
|
|
|
||||||
|
INCREASE IN CASH
|
5,355
|
|
2,572
|
|
|||
|
CASH, beginning of period
|
14,602
|
|
12,030
|
|
|||
|
CASH, end of period
|
$
|
19,957
|
|
$
|
14,602
|
|
|
|
|
|
||||||
|
SUPPLEMENTAL INFORMATION:
|
|
|
|||||
|
Cash paid for interest
|
$
|
13,767
|
|
$
|
14,035
|
|
|
|
Cash paid for income taxes
|
$
|
4,525
|
|
$
|
3,779
|
|
|
|
|
|
||||||
|
Noncash transactions:
|
|
|
|||||
|
Assets acquired under capital leases
|
$
|
4,791
|
|
$
|
3,232
|
|
|
|
Increase in accounts payable due to property and equipment received but not paid
|
$
|
44
|
|
$
|
427
|
|
|
|
Centennial acquisition
|
$
|
13,571
|
|
$
|
—
|
|
|
|
Restricted cash borrowed
|
$
|
9,960
|
|
$
|
—
|
|
|
|
Restricted cash used for purchases of equipment
|
$
|
—
|
|
$
|
280
|
|
|
|
Restricted cash used for payments on debt obligations
|
$
|
—
|
|
$
|
2,089
|
|
|
See accompanying notes to consolidated financial statements.
F-6
TEXAS HEALTH VENTURES GROUP, L.L.C. AND SUBSIDIARIES
NOTES TO CONSOLIDATED FINANCIAL STATEMENTS
1. SUMMARY OF SIGNIFICANT ACCOUNTING POLICIES
Description of Business
Texas Health Ventures Group, L.L.C. and subsidiaries (THVG or the Company), a Texas limited liability company, was formed on January 21, 1997, for the primary purpose of developing, acquiring, and operating ambulatory surgery centers and related entities. THVG is a joint venture between Baylor University Medical Center, an affiliate of Baylor Scott & White Holdings (BSW Holdings), who owns 50.1% of THVG and USP North Texas, Inc. (USP), a Texas corporation and subsidiary of United Surgical Partners International, Inc. (USPI), who owns 49.9% of THVG. USPI is a subsidiary of Tenet Healthcare Corporation. BSW Holdings and its affiliates are referred collectively herein as “BSWH”. THVG’s fiscal year ends June 30. Fiscal years of THVG’s subsidiaries end December 31; however, the financial information of these subsidiaries included in these consolidated financial statements is as of, and for the twelve months ended, June 30, 2017 and 2016.
THVG owns equity interests in and operates ambulatory surgery centers, surgical hospitals, and related businesses in the Dallas/Fort Worth, Texas, metropolitan area. At June 30, 2017, THVG operated thirty facilities (the Facilities) under management contracts, twenty-nine of which are consolidated for financial reporting purposes and one of which is accounted for under the equity method. In addition, THVG holds an equity method investment in one partnership that owns the real estate used by one of the Facilities.
THVG has been funded by capital contributions from its members and by cash distributions from the Facilities. The board of managers, which is controlled by BSWH, initiates requests for capital contributions. The Facilities’ operating agreements provide that cash flows available for distribution will be distributed, at least quarterly, to THVG and other owners of the Facilities.
THVG’s operating agreement provides that the board of managers determine, on at least a quarterly basis, if THVG should make a cash distribution based on a comparison of THVG’s excess cash on hand versus current and anticipated needs, including, without limitation, needs for operating expenses, debt service, acquisitions, and a reasonable contingency reserve. The terms of THVG’s operating agreement provide that any distributions, whether driven by operating cash flows or by other sources, such as the distribution of noncash assets or distributions in the event THVG liquidates, are to be shared according to each member’s overall ownership level in THVG.
Basis of Accounting
THVG maintains its books and records on the accrual basis of accounting, and the consolidated financial statements are prepared in accordance with accounting principles generally accepted in the United States.
Principles of Consolidation
The consolidated financial statements include the financial statements of THVG and its wholly owned subsidiaries and other entities THVG controls. All intercompany balances and transactions have been eliminated in consolidation.
Use of Estimates
The preparation of financial statements in conformity with accounting principles generally accepted in the United States requires management of THVG to make estimates and assumptions that affect the amounts reported in the consolidated financial statements and accompanying notes. Actual results could differ from those estimates.
Cash Equivalents
THVG considers all highly liquid instruments with original maturities when purchased of three months or less to be cash equivalents. There were no cash equivalents at June 30, 2017 or 2016. Under the Company’s cash management system, checks issued but not presented to the bank may result in book cash overdraft balances for accounting purposes. The company reclassifies book overdrafts to accounts payable, which are reflected as an operating activity in its consolidated statements of cash flows. Book overdrafts included in accounts payable were approximately $12,730,000 and $13,300,000 as of June 30, 2017 and 2016, respectively.
F-7
TEXAS HEALTH VENTURES GROUP, L.L.C. AND SUBSIDIARIES
NOTES TO CONSOLIDATED FINANCIAL STATEMENTS- continued
Patient Receivables
Patient receivables are stated at estimated net realizable value. Significant concentrations of patient receivables at June 30, 2017 and 2016 include:
|
|
2017
|
2016
|
|||
|
Commercial and managed care providers
|
56
|
%
|
64
|
%
|
|
|
Government-related programs
|
35
|
%
|
24
|
%
|
|
|
Self-pay patients
|
9
|
%
|
12
|
%
|
|
|
|
100
|
%
|
100
|
%
|
|
Receivables from government-related programs (i.e. Medicare and Medicaid) represent the only concentrated groups of credit risk for THVG and management does not believe that there is any credit risk associated with these receivables. Commercial and managed care receivables consist of receivables from various payors involved in diverse activities and subject to differing economic conditions, and do not represent any concentrated credit risk to THVG. THVG maintains allowances for uncollectible accounts for estimated losses resulting from the payors’ inability to make payments on accounts. THVG assesses the reasonableness of the allowance account based on historic write-offs, the aging of accounts and other current conditions. Furthermore, management continually monitors and adjusts the allowances associated with its receivables. Accounts are written off when collection efforts have been exhausted.
Supplies
Supplies, consisting primarily of pharmaceuticals and medical supplies inventories, are stated at cost, which approximates market value, and are expensed as used.
Property and Equipment
Property and equipment are initially recorded at cost or, when acquired as part of a business combination, at fair value at the date of acquisition. Depreciation is calculated on the straight line method over the estimated useful lives of the assets. Upon retirement or disposal of assets, the asset and accumulated depreciation accounts are adjusted accordingly, and any gain or loss is reflected in earnings or losses of the respective period. Maintenance costs and repairs are expensed as incurred; significant renewals and betterments are capitalized.
Assets held under capital leases are classified as property and equipment and amortized using the straight line method over the shorter of the useful lives or the lease terms, and the related obligations are recorded as debt. Amortization of property and equipment held under capital leases and leasehold improvements is included in depreciation and amortization expense in the consolidated statements of income.
THVG records operating lease expense on a straight-line basis unless another systematic and rational allocation is more representative of the time pattern in which the leased property is physically employed. THVG amortizes leasehold improvements, including amounts funded by landlord incentives or allowances, for which the related deferred rent is amortized as a reduction of lease expense, over the shorter of their economic lives or the lease term.
Investments in Unconsolidated Affiliates
Investments in unconsolidated affiliates in which THVG exerts significant influence, but has less than a controlling ownership, are accounted for under the equity method. THVG exerts significant influence in the operations of its unconsolidated affiliates through representation on the governing bodies of the investees and additionally, with respect to the Facilities, through contracts to manage the operations of the investees.
Equity in earnings of unconsolidated affiliates consists of THVG’s share of the profits and losses generated from its noncontrolling equity investments. Because these operations are central to THVG’s business strategy, equity in earnings of unconsolidated affiliates is classified as a component of operating income in the accompanying consolidated statements of income. THVG has contracts to manage these facilities, which results in THVG having an active role in the operations of these facilities.
F-8
TEXAS HEALTH VENTURES GROUP, L.L.C. AND SUBSIDIARIES
NOTES TO CONSOLIDATED FINANCIAL STATEMENTS- continued
Goodwill
Goodwill is not amortized but is instead tested for impairment annually, using the market and income approach, or more frequently if changing circumstances warrant. Goodwill is reported at the THVG entity level. To determine the fair value of the reporting unit, THVG generally uses a present value technique (discounted cash flow) corroborated by market multiples and/or data from third-party valuation specialists. The factor most sensitive to change with respect to THVG’s discounted cash flow analyses is the estimated future cash flows of the reporting unit which is, in turn, sensitive to THVG’s estimates of future revenue growth and margins for these businesses. If actual revenue growth and/or margins are lower than THVG’s expectations, the impairment test results could differ. THVG bases its fair value estimates on assumptions THVG believes to be reasonable and consistent with market participant assumptions, but that are unpredictable and inherently uncertain.
The provisions of the accounting standard for goodwill require that THVG performs a two-step impairment test on goodwill. In the first step, THVG compares the fair value of each reporting unit to its carrying value. If the fair value of the reporting unit exceeds the carrying value of the net assets assigned to that unit, goodwill is not impaired and THVG is not required to perform further testing. If the carrying value of the net assets assigned to the reporting unit exceeds the fair value of the reporting unit, then THVG must perform the second step of the impairment test in order to determine the implied fair value of the reporting unit’s goodwill. If the carrying value of a reporting unit’s goodwill exceeds its implied fair value, then THVG records an impairment loss equal to the difference. An analysis of the goodwill balance was performed in March of 2017 and 2016 and no such impairments were identified.
Impairment of Long-Lived Assets
Long-lived assets are reviewed for impairment whenever events or changes in circumstances indicate that the carrying amount of an asset, or related groups of assets, may not be fully recoverable from estimated future cash flows. In the event of impairment, measurement of the amount of impairment may be based on appraisal, fair values of similar assets, or estimates of future undiscounted cash flows resulting from use and ultimate disposition of the asset. No such impairment was identified in 2017. In June of 2016, THVG determined that Lewisville Surgicare Partners, Ltd. (Lewisville), Baylor Surgicare at Ennis, L.L.C. (Ennis), and Arlington Surgicare Partners, Ltd. (Arlington) would be closing due to current and expected negative cash flows. This represents a significant adverse change in the manner in which the facilities’ assets are being used, thus triggering the need to test the facilities’ long-lived assets for impairment. These assets consist of office and medical equipment, furniture, and building leases. Management determined that the fair value of the office and medical equipment and furniture, using Level 2 inputs, is greater than the total carrying value, and as such no impairment was recorded for those asset classes. Based on the inability to locate a sublessee to occupy the properties, which are specialized to perform outpatient surgery, and Level 3 inputs, THVG concluded that the three facility building leases, which are classified as capital leases, were impaired and recorded impairment charges, equal to the remaining un-depreciated carrying value of the facility building leases. THVG recorded an impairment charge in June 2016 for approximately $5,667,000.
Fair Value of Financial Instruments
The fair value of a financial instrument is the amount at which the instrument could be exchanged in an orderly transaction between market participants to sell the asset or transfer the liability. The Company uses fair value measurements based on quoted prices in active markets for identical assets or liabilities (Level 1), significant other observable inputs (Level 2) or unobservable inputs (Level 3), depending on the nature of the item being valued.
The Company does not have financial assets or liabilities measured at fair value on a recurring basis at June 30, 2017 and 2016. The carrying amounts of cash, restricted cash, funds due from United Surgical Partners, Inc., accounts receivable, and accounts payable approximate fair value because of the short maturity of these instruments.
The fair value of the Company’s long-term debt is determined by Level 2 inputs which are an estimation of the discounted future cash flows of the debt at rates currently quoted or offered to a comparable company for similar debt instruments of comparable maturities by its lenders. At June 30, 2017, the aggregate carrying amount and estimated fair value of long-term debt were approximately $36,490,000 and $33,076,000, respectively. At June 30, 2016, the aggregate carrying amount and estimated fair value of long-term debt were approximately $32,545,000 and $29,336,000, respectively.
F-9
TEXAS HEALTH VENTURES GROUP, L.L.C. AND SUBSIDIARIES
NOTES TO CONSOLIDATED FINANCIAL STATEMENTS- continued
Revenue Recognition
THVG has agreements with third-party payors that provide for payments to THVG at amounts different from its established rates. Payment arrangements include prospectively-determined rates per discharge, reimbursed costs, discounted charges, and per diem payments. Net patient service revenue is reported at the estimated net realizable amount from patients, third-party payors, and others for services rendered, including estimated contractual adjustments under reimbursement agreements with third party payors. Contractual adjustments are accrued on an estimated basis in the period the related services are rendered and adjusted in future periods as final settlements are determined. These contractual adjustments are related to the Medicare and Medicaid programs, as well as managed care contracts.
Net patient service revenue from the Medicare and Medicaid programs accounted for approximately 15% of total net patient service revenue in 2017 and 2016.
Net patient service revenue from commercial and managed care contracts accounted for approximately 80% of net patient service revenue in 2017 and 2016.
Net patient service revenue from private payors accounted for approximately 5% of total net patient service revenue in 2017 and 2016. For facilities licensed as hospitals, federal regulations require the submission of annual cost reports covering medical costs and expenses associated with services provided to program beneficiaries. Medicare and Medicaid cost report settlements are estimated in the period services are provided to beneficiaries.
Laws and regulations governing the Medicare and Medicaid programs are extremely complex and subject to interpretation. As a result, there is a reasonable possibility that recorded estimates with respect to the six THVG facilities licensed as hospitals may change as interpretations are clarified. These initial estimates are revised as needed until final cost reports are settled.
Income Taxes
No amounts for federal income taxes have been reflected in the accompanying consolidated financial statements because the federal tax effects of THVG’s activities accrue to the individual members.
The Texas franchise tax applies to all THVG entities and is reflected in the accompanying consolidated statements of income. The tax is calculated on a margin base and is therefore reflected in THVG’s consolidated statements of income for the years ended June 30, 2017 and 2016 as income tax.
THVG follows the provisions of ASC 740 (Income Taxes) which prescribes a single model to address uncertainty in tax positions and clarifies the accounting for income taxes by prescribing the minimum recognition threshold a tax position is required to meet before being recognized in the financial statements.
As of June 30, 2017 and 2016, THVG had no gross unrecognized tax benefits. THVG files a partnership income tax return in the U.S. federal jurisdiction and a franchise tax return in the state of Texas. THVG is no longer subject to U.S. federal income tax examination for years prior to 2013 and no longer subject to state and local income tax examination for years prior to 2012.
THVG has identified Texas as a “major” state taxing jurisdiction. THVG does not expect or anticipate a significant change over the next twelve months in the unrecognized tax benefits.
Commitments and Contingencies
Liabilities for loss contingencies arising from claims, assessments, litigation, fines and penalties, and other sources are recorded when it is probable that a liability has been incurred and the amount can be reasonably estimated.
Recently Issued Accounting Pronouncements
In July 2015, FASB issued ASU 2015-11,
“Simplifying the Measurement of Inventory.”
This ASU requires an entity to measure inventory at the lower of cost and net realizable value. Net realizable value is the estimated selling prices in the ordinary course of business, less reasonably predictable costs of completion, disposal, and transportation. Subsequent measurement is unchanged for inventory measured using last-in, first-out (LIFO) or the retail inventory method. The amendments do not apply to inventory that is measured using LIFO or the retail inventory method. The amendments apply to all other inventory, which includes inventory that is measured using first-in, first-out (FIFO) or average cost. THVG has not evaluated all of the provisions, which are effective
F-10
TEXAS HEALTH VENTURES GROUP, L.L.C. AND SUBSIDIARIES
NOTES TO CONSOLIDATED FINANCIAL STATEMENTS- continued
for fiscal years beginning after December 15, 2016, and interim periods within those years, for public business entities and December 15, 2016, and interim periods thereafter, for all other entities.
In September 2015, FASB issued ASU 2015-16,”
Simplifying the Accounting for Measurement-Period Adjustments.”
This ASU requires that an acquirer recognize adjustments to estimated amounts that are identified during the measurement period and any related income effects in the reporting period in which the adjustment amounts are determined. The ASU also requires an entity to present separately on the face of the income statement, or disclose in the notes, the portion of the amount recorded in current-period earnings by line item that would have been recorded in previous reporting periods if the adjustment to the estimated amounts had been recognized as of the acquisition date. THVG has not evaluated all of the provisions, which are effective for fiscal years beginning after December 15, 2015, and interim periods within those years, for public business entities and December 15, 2016, and interim periods thereafter, for all other entities.
In April 2016, FASB issued ASU 2016-10,
“Identifying Performance Obligations and Licensing.”
This ASU adds further guidance on identifying performance obligations and also improves the operability and understandability of the licensing implementation guidance. THVG has not evaluated all of the provisions, which are effective for fiscal years beginning after December 15, 2017, and interim periods within those years, for public business entities and not-for-profit entities that have issued publicly traded debt, and December 15, 2018 for all other entities.
In May 2016, FASB issued ASU 2016-12,
“Revenue from Contracts with Customers: Narrow-Scope Improvements and Practical Expedients.”
This ASU adds further clarification to the new revenue recognition standards issued in ASU 2014-09. THVG has not evaluated all of the provisions, which are effective for fiscal years beginning after December 15, 2017, and interim periods within those years, for public business entities and not-for-profit entities that have issued publicly traded debt, and December 15, 2018 for all other entities.
In August 2016, FASB issued ASU 2016-15,
“Classification of Certain Cash Receipts and Cash Payments.”
This ASU provides cash flow statement classification guidance. THVG has not evaluated all of the provisions, which are effective for fiscal years beginning after December 15, 2017, and interim periods within those years, for public business entities and December 15, 2018 , and interim periods thereafter, for all other entities.
In October 2016, FASB issued ASU 2016-16, “Intra-Entity Transfers of Assets Other Than Inventory.” This ASU requires an entity to recognize the income tax consequences of an intra-entity transfer of an asset other than inventory when the transfer occurs. The provisions of ASU 2016-16 are effective for fiscal years beginning after December 15, 2017, and interim periods within those years for public business entities, and December 15, 2018, and interim periods thereafter for all other entities. The Company is currently evaluating the impact of this ASU.
In November 2016, FASB issued ASU 2016-18, “Restricted Cash: a Consensus of the FASB Emerging Issues Task Force.” This ASU requires a statement of cash flows to explain the change during the period in the total of cash, cash equivalents, and amounts generally described as restricted cash or restricted cash equivalents. The provisions of ASU 2016-18 are effective for fiscal years beginning after December 15, 2017, and interim periods within those year for public business entities, and December 15, 2018, and interim periods thereafter for all other entities. The Company is currently evaluating the impact of this ASU.
In January 2017, FASB issued ASU 2017-01, “Clarifying the Definition of a Business.” By clarifying the definition of a business, the amendments of this ASU affect all companies and other reporting organizations that must determine whether they have acquired or sold a business. The provisions of ASU 2017-01 are effective for fiscal years beginning after December 15, 2017, and interim periods within those years for public business entities, and December 15, 2018, and interim periods within those years for all other entities. The Company is currently evaluating the impact of this ASU.
In January 2017, FASB issued ASU 2017-04, “Simplifying the Test for Goodwill Impairment.” This ASU eliminates Step 2 from the goodwill impairment test. Step 2 measures a goodwill impairment loss by comparing the implied fair value of a reporting unit’s goodwill with the carrying amount of that goodwill. The provisions of ASU 2017-04 are effective for fiscal years beginning after December 15, 2019, and interim periods within those years for public business entities, and December 15, 2021, and interim periods within those years for all other entities. The Company is currently evaluating the impact of this ASU.
F-11
TEXAS HEALTH VENTURES GROUP, L.L.C. AND SUBSIDIARIES
NOTES TO CONSOLIDATED FINANCIAL STATEMENTS- continued
2.PROPERTY AND EQUIPMENT
At June 30, 2017 and 2016, property and equipment and related accumulated depreciation and amortization consisted of the following (in thousands):
|
|
Estimated
Useful Lives
|
2017
|
2016
|
|||||||
|
Land
|
—
|
|
$
|
607
|
|
$
|
607
|
|
||
|
Buildings and leasehold improvements
|
5-25 years
|
|
193,489
|
|
186,242
|
|
||||
|
Equipment
|
3-15 years
|
|
161,244
|
|
162,472
|
|
||||
|
Furniture and fixtures
|
5-15 years
|
|
8,495
|
|
8,640
|
|
||||
|
Construction in progress
|
|
|
1,368
|
|
2,809
|
|
||||
|
|
|
|
365,203
|
|
360,770
|
|
||||
|
Less accumulated depreciation
|
|
|
(210,435
|
)
|
(200,062
|
)
|
||||
|
Net property and equipment
|
|
|
$
|
154,768
|
|
$
|
160,708
|
|
||
At June 30, 2017 and 2016, assets recorded under capital lease arrangements included in property and equipment consisted of the following (in thousands):
|
|
2017
|
2016
|
|||||
|
Buildings
|
$
|
112,401
|
|
$
|
119,032
|
|
|
|
Equipment and furniture
|
218
|
|
—
|
|
|||
|
112,619
|
|
119,032
|
|
||||
|
Less accumulated depreciation
|
(52,629
|
)
|
(50,917
|
)
|
|||
|
Net property and equipment under capital leases
|
$
|
59,990
|
|
$
|
68,115
|
|
|
3. INVESTMENTS IN SUBSIDIARIES AND UNCONSOLIDATED AFFILIATES
THVG’s investments in consolidated subsidiaries and unconsolidated affiliates consisted of the following:
|
Legal Name
|
Facility
|
City
|
Percentage Owned
|
|||
|
June 30,
2017
|
June 30,
2016
|
|||||
|
Consolidated subsidiaries
(1)
:
|
|
|
|
|
||
|
DeSoto Surgicare, Ltd.
|
North Texas Surgery Center
|
Desoto
|
52.1
|
%
|
52.1
|
%
|
|
Metroplex Surgicare Partners, Ltd.
|
Baylor Surgicare at Bedford
|
Bedford
|
65.8
|
|
65.8
|
|
|
Baylor Surgicare at North Dallas, LLC
|
Baylor Surgicare at North Dallas
|
Dallas
|
56.6
|
|
56.6
|
|
|
Fort Worth Surgicare Partners, Ltd.
|
Baylor Surgical Hospital of Fort Worth
|
Fort Worth
|
50.1
|
|
50.9
|
|
|
Denton Surgicare Partners, Ltd.
|
Baylor Surgicare at Denton
|
Denton
|
50.5
|
|
51.0
|
|
|
Garland Surgicare Partners, Ltd.
|
Baylor Surgicare at Garland
|
Garland
|
50.1
|
|
50.1
|
|
|
University Surgical Partners of Dallas, L.L.P.
(2)
|
N/A
|
Dallas
|
66.5
|
|
66.2
|
|
|
Dallas Surgical Partners, L.L.C.
|
Baylor Surgicare
|
Dallas
|
58.9
|
|
58.6
|
|
|
MSH Partners, L.L.C.
|
Baylor Medical Center at Uptown
|
Dallas
|
33.5
|
|
33.4
|
|
|
North Central Surgical Center, L.L.P.
|
North Central Surgery Center
|
Dallas
|
33.4
|
|
33.8
|
|
|
Grapevine Surgicare Partners, Ltd.
|
Baylor Surgicare at Grapevine
|
Grapevine
|
55.2
|
|
56.8
|
|
|
Frisco Medical Center, L.L.P.
|
Baylor Scott & White Medical Center - Frisco
|
Frisco
|
50.4
|
|
50.3
|
|
|
Physicians Center of Fort Worth, L.L.P.
|
Baylor Surgicare at Fort Worth I & II
|
Fort Worth
|
54.1
|
|
53.9
|
|
|
Bellaire Outpatient Surgery Center, L.L.P.
|
Baylor Surgicare at Oakmont
|
Fort Worth
|
52.0
|
|
50.1
|
|
F-12
TEXAS HEALTH VENTURES GROUP, L.L.C. AND SUBSIDIARIES
NOTES TO CONSOLIDATED FINANCIAL STATEMENTS- continued
|
Legal Name
|
Facility
|
City
|
Percentage Owned
|
|||
|
June 30,
2017
|
June 30,
2016
|
|||||
|
Park Cities Surgery Center, L.L.C.
|
Park Cities Surgery Center
|
Dallas
|
50.1
|
|
50.1
|
|
|
Trophy Club Medical Center, L.P.
|
Baylor Medical Center at Trophy Club
|
Fort Worth
|
50.3
|
|
50.1
|
|
|
Rockwall/Heath Surgery Center, L.L.P.
|
Baylor Surgicare at Heath
|
Heath
|
61.9
|
|
59.2
|
|
|
North Garland Surgery Center, L.L.P.
|
Baylor Surgicare at North Garland
|
Garland
|
52.1
|
|
52.1
|
|
|
Rockwall Ambulatory Surgery Center, L.L.P.
|
Rockwall Surgery Center
|
Rockwall
|
53.3
|
|
53.3
|
|
|
Baylor Surgicare at Plano, L.L.C.
|
Baylor Surgicare at Plano
|
Plano
|
50.1
|
|
50.1
|
|
|
Arlington Orthopedic and Spine Hospitals, LLC
|
Baylor Orthopedic and Spine Hospital at Arlington
|
Arlington
|
50.1
|
|
50.1
|
|
|
Baylor Surgicare at Granbury, LLC
|
Baylor Surgicare at Granbury
|
Granbury
|
51.2
|
|
50.6
|
|
|
Metrocrest Surgery Center, L.L.C.
|
Baylor Surgicare at Carrollton
|
Carrollton
|
53.5
|
|
51.0
|
|
|
Baylor Surgicare at Mansfield, L.L.C.
|
Baylor Surgicare at Mansfield
|
Mansfield
|
50.1
|
|
50.3
|
|
|
Tuscan Surgery Center, L.L.C.
|
Tuscan Surgery Center at Las Colinas
|
Las Colinas
|
57.3
|
|
51.0
|
|
|
Lone Star Endoscopy Center, L.L.C.
|
Lone Star Endoscopy
|
Keller
|
51.0
|
|
51.0
|
|
|
Baylor Surgicare at Plano Parkway, L.L.C.
|
Baylor Surgicare at Plano Parkway
|
Plano
|
51.0
|
|
51.0
|
|
|
Texas Endoscopy Centers, LLC
|
Texas Endoscopy
|
Plano/Allen
|
51.0
|
|
51.0
|
|
|
Heritage Park Surgical Hospital, LLC
|
Baylor Scott & White Surgical Hospital - Sherman
|
Sherman
|
52.5
|
|
52.3
|
|
|
Centennial ASC, LLC
|
Frisco Centennial Surgery Center
|
Frisco
|
50.4
|
|
—
|
|
|
Baylor Surgicare at Baylor Plano, LLC
|
Baylor Plano Campus
|
Plano
|
50.1
|
|
—
|
|
|
Unconsolidated affiliates:
|
|
|
|
|
||
|
Denton Surgicare Real Estate, Ltd.
(3)
|
|
n/a
|
49.0
|
|
49.0
|
|
|
Irving-Coppell Surgical Hospital, L.L.P.
|
Irving-Coppell Surgical Hospital
|
Irving
|
19.6
|
|
18.3
|
|
|
MCSH Real Estate Investors, Ltd.
(3)
|
|
n/a
|
2.0
|
|
2.0
|
|
|
1.
|
List excludes holding companies, which are wholly-owned by the Company and hold the Company’s investments in the Facilities.
|
|
2.
|
Partnership that has investment in North Central Surgical Center, Baylor Surgicare, and Baylor Medical Center at Uptown.
|
|
3.
|
These entities are not surgical facilities and do not have ownership in any surgical facilities.
|
USP previously had a controlling interest in Centennial ASC, LLC (Centennial). On February 1, 2017, USP’s ownership interest in Centennial, fair valued at $13,571,000, was assigned to THVG, and BSWH paid USP $6,200,000 for its share, resulting in THVG owning 50.42% in the ASC. Additionally, BSWH paid approximately $400,000 for its share of the management contract rights. From the acquisition date to fiscal year end June 30, 2017, Centennial accounted for approximately $4,400,000 of total revenues and approximately $1,000,000 of net income, included in the consolidated statements of income.
On September 17, 2015, THVG acquired 60.0% of Surgery Center of Garland, LLC, which owned and operated Precision Surgery Center (PSC), for approximately $8,900,000. THVG then merged the PSC operations with the existing Baylor Surgicare at Valley View (Valley View), resulting in THVG owning 56.6% in the ambulatory surgical center (ASC). Valley View’s legal name then changed to Baylor Surgicare at North Dallas, LLC (North Dallas). From the acquisition date to fiscal year end June 30, 2016, North Dallas accounted for approximately $10,500,000 of total revenues and approximately $2,800,000 of net income, included in the consolidated statements of income.
F-13
TEXAS HEALTH VENTURES GROUP, L.L.C. AND SUBSIDIARIES
NOTES TO CONSOLIDATED FINANCIAL STATEMENTS- continued
The following table summarizes the recorded values of the assets acquired and liabilities assumed at the date of acquisition (in thousands):
|
Centennial
|
PSC
|
||||||
|
Cash and cash equivalents
|
$
|
—
|
|
$
|
135
|
|
|
|
Current assets
|
3,690
|
|
631
|
|
|||
|
Long-term assets
|
1,079
|
|
140
|
|
|||
|
Goodwill
|
19,290
|
|
12,005
|
|
|||
|
Total assets acquired
|
24,059
|
|
12,911
|
|
|||
|
|
|
||||||
|
Current liabilities
|
585
|
|
136
|
|
|||
|
Long-term liabilities
|
—
|
|
—
|
|
|||
|
Total liabilities assumed
|
585
|
|
136
|
|
|||
|
Noncontrolling interests
|
9,903
|
|
3,862
|
|
|||
|
Net assets acquired
|
$
|
13,571
|
|
$
|
8,913
|
|
|
The acquisitions were accounted for in accordance with ASC 805 and the acquisition method was applied. Noncontrolling interests (NCI) are valued at fair value at acquisition with a discount to reflect lack of control and marketability by the NCI holders. These fair value measurements are determined by Level 2 inputs. The resulting goodwill is attributed to expected synergies from combining operations. The results of these acquisitions are included in THVG’s consolidated financial statements from the date of acquisition. Total acquisition costs included in professional fees on THVG’s consolidated statements of income were approximately $599,000 and $212,000 for 2017 and 2016, respectively.
The following table presents the unaudited pro forma results as if THVG had acquired PSC and Centennial on July 1, 2015 (in thousands). The pro forma results are not necessarily indicative of the results of operations that would have occurred if the acquisitions had been completed on the dates indicated, nor is indicative of the future operating results of THVG.
|
|
Year Ended
June 30, 2017
|
Year Ended
June 30, 2016
|
|||||
|
Total revenues
|
$
|
969,591
|
|
$
|
900,248
|
|
|
|
Net income attributable to THVG
|
$
|
127,261
|
|
$
|
111,116
|
|
|
4. NONCONTROLLING INTERESTS
The Company controls and therefore consolidates the results of 29 of its 30 facilities at June 30, 2017. Similar to its investments in unconsolidated affiliates, the Company regularly engages in the purchase and sale of equity interests with respect to its consolidated subsidiaries that do not result in a change of control. These transactions are accounted for as equity transactions, as they are undertaken among the Company, its consolidated subsidiaries, and noncontrolling interests, and their cash flow effect is classified within financing activities.
During the fiscal year ended June 30, 2017, the Company purchased and sold equity interests in various consolidated subsidiaries in the amounts of approximately $5,447,000 and $18,445,000, respectively. During the fiscal year ended June 30, 2016, the Company purchased and sold equity interests in various consolidated subsidiaries in the amounts of approximately $3,004,000 and $1,415,000, respectively. The basis difference between the Company’s carrying amount and the proceeds received or paid in each transaction is recorded as an adjustment to the Company’s equity. The impact of these transactions is summarized as follows (in thousands):
F-14
TEXAS HEALTH VENTURES GROUP, L.L.C. AND SUBSIDIARIES
NOTES TO CONSOLIDATED FINANCIAL STATEMENTS- continued
|
|
Year Ended
June 30, 2017
|
Year Ended
June 30, 2016
|
|||||
|
Net income attributable to the Company
|
$
|
126,088
|
|
$
|
108,710
|
|
|
|
Net transfers to the noncontrolling interests:
|
|
|
|||||
|
Decrease in the Company’s equity for losses incurred related to purchases of subsidiaries’ equity interests
|
(1,438
|
)
|
(801
|
)
|
|||
|
(Decrease)/Increase in the Company’s equity for (losses)/gains related to sales of subsidiaries’ equity interests
|
904
|
|
(2,229
|
)
|
|||
|
Net transfers to noncontrolling interests
|
(534
|
)
|
(3,030
|
)
|
|||
|
Change in equity from net income attributable to the Company and net transfers to noncontrolling interests
|
$
|
125,554
|
|
$
|
105,680
|
|
|
As further described in Note 1, upon the occurrence of various fundamental regulatory changes, the Company could be obligated, under the terms of its investees’ partnership and operating agreements, to purchase some or all of the noncontrolling interests related to the Company’s consolidated subsidiaries. As a result, these noncontrolling interests are not included as part of the Company’s equity and are carried as noncontrolling interests-redeemable on the Company’s consolidated balance sheets. The activity in noncontrolling interests-redeemable for the years ended June 30, 2017 and 2016 is summarized below (in thousands):
|
Balance, June 30, 2015
|
$
|
79,590
|
|
|
Net income attributable to noncontrolling interests
|
117,018
|
|
|
|
Distributions to noncontrolling interests
|
(109,768
|
)
|
|
|
Purchases of noncontrolling interests
|
(3,961
|
)
|
|
|
Sales of noncontrolling interests
|
3,186
|
|
|
|
Noncontrolling interests attributable to business acquisition
|
3,862
|
|
|
|
Balance, June 30, 2016
|
89,927
|
|
|
|
Net income attributable to noncontrolling interests
|
134,905
|
|
|
|
Distributions to noncontrolling interests
|
(137,373
|
)
|
|
|
Purchases of noncontrolling interests
|
(3,631
|
)
|
|
|
Sales of noncontrolling interests
|
15,415
|
|
|
|
Noncontrolling interests attributable to business acquisition
|
9,904
|
|
|
|
Balance, June 30, 2017
|
$
|
109,147
|
|
5. GOODWILL
The following is a summary of changes in the carrying amount of goodwill for the years ended June 30, 2017 and 2016 (in thousands):
|
Balance, June 30, 2015
|
$
|
228,612
|
|
|
Additions:
|
|||
|
Acquisition of Precision Surgery Center
|
12,005
|
|
|
|
Adjustments:
|
|
|
|
|
Acquisition of Sherman
|
(314
|
)
|
|
|
Balance, June 30, 2016
|
240,303
|
|
|
|
Additions:
|
|
|
|
|
Acquisition of Centennial ASC
|
19,290
|
|
|
|
Adjustments:
|
|
|
|
|
Acquisition of Precision Surgery Center
|
(532
|
)
|
|
|
Balance, June 30, 2017
|
$
|
259,061
|
|
Goodwill additions resulting from business combinations are recorded and assigned to the parent and noncontrolling interests.
F-15
TEXAS HEALTH VENTURES GROUP, L.L.C. AND SUBSIDIARIES
NOTES TO CONSOLIDATED FINANCIAL STATEMENTS- continued
6. LONG-TERM OBLIGATIONS
At June 30, 2017 and 2016, long-term obligations consisted of the following (in thousands):
|
|
2017
|
2016
|
|||||
|
Capital lease obligations (Note 7)
|
$
|
116,415
|
|
$
|
118,873
|
|
|
|
Notes payable to financial institutions
|
36,490
|
|
32,545
|
|
|||
|
Total long-term obligations
|
152,905
|
|
151,418
|
|
|||
|
Less current portion
|
(18,301
|
)
|
(12,494
|
)
|
|||
|
Long-term obligations, less current portion
|
$
|
134,604
|
|
$
|
138,924
|
|
|
The aggregate maturities of notes payable for each of the five years subsequent to June 30, 2017 and thereafter are as follows (in thousands):
|
2018
|
$
|
9,720
|
|
|
2019
|
9,264
|
|
|
|
2020
|
8,225
|
|
|
|
2021
|
4,348
|
|
|
|
2022
|
3,587
|
|
|
|
Thereafter
|
1,346
|
|
|
|
Total long-term obligations
|
$
|
36,490
|
|
The Facilities have notes payable to financial institutions which mature at various dates through 2023 and accrue interest at fixed and variable rates ranging from 2% to 8%. Each note is collateralized by certain assets of the respective Facility.
Capital lease obligations are collateralized by underlying real estate or equipment and have interest rates ranging from 8% to 14%.
7. LEASES
The Facilities lease various office equipment, medical equipment, and office space under a number of operating lease agreements, which expire at various times through the year 2032. Such leases do not involve contingent rentals, nor do they contain significant renewal or escalation clauses. Office leases generally require the Facilities to pay all executory costs (such as property taxes, maintenance, and insurance).
Minimum future payments under noncancelable leases with remaining terms in excess of one year as of June 30, 2017 are as follows (in thousands):
|
|
Capital
Leases
|
Operating
Leases
|
|||||
|
Year ending June 30:
|
|
|
|
|
|||
|
2018
|
$
|
20,502
|
|
$
|
23,771
|
|
|
|
2019
|
17,946
|
|
22,500
|
|
|||
|
2020
|
17,468
|
|
20,562
|
|
|||
|
2021
|
17,613
|
|
17,610
|
|
|||
|
2022
|
17,027
|
|
16,647
|
|
|||
|
Thereafter
|
107,179
|
|
89,931
|
|
|||
|
Total minimum lease payments
|
197,735
|
|
191,021
|
|
|||
|
Amount representing interest
|
(81,320
|
)
|
|
|
|||
|
Total principal payments
|
$
|
116,415
|
|
|
|
||
Total rent expense under operating leases was approximately $32,865,000 and $31,112,000 for the years ended June 30, 2017 and 2016, respectively, and is included in other operating expenses in the accompanying consolidated statements of income.
F-16
TEXAS HEALTH VENTURES GROUP, L.L.C. AND SUBSIDIARIES
NOTES TO CONSOLIDATED FINANCIAL STATEMENTS- continued
8. RELATED-PARTY TRANSACTIONS
THVG operates the Facilities under management and royalty contracts, and THVG in turn is managed by BSWH and USP, resulting in THVG incurring management and royalty fee expense payable to BSWH and USP in amounts equal to the management and royalty fee income THVG receives from the Facilities. THVG’s management and royalty fee income from the facilities it consolidates for financial reporting purposes eliminates in consolidation with the facilities’ expense and therefore is not included in THVG’s consolidated revenues. THVG’s management and royalty fee income from facilities which are not consolidated was $600,000 for both years ended June 30, 2017 and 2016, and is included in other income in the accompanying consolidated statements of income.
The management and royalty fee expense to BSWH and USP was approximately $36,579,000 and $34,174,000 for the years ended June 30, 2017 and 2016, respectively, and is reflected in operating expenses in THVG’s consolidated statements of income. Of the total, 64.3% and 1.7% represent management fees payable to USP and BSWH, respectively, and 34% represents royalty fees payable to BSWH.
Under the management and royalty agreements, the Facilities pay THVG an amount ranging from 5.0% to 7.0% of their net patient service revenue less provision for doubtful accounts annually, subject, in some cases, to an annual cap.
In addition, a subsidiary of USPI frequently pays bills on behalf of THVG and has custody of substantially all of THVG’s excess cash, paying THVG and the Facilities interest income on the net balance at prevailing market rates. Amounts held by USPI on behalf of THVG and the facilities totaled approximately $93,848,000 and $80,530,000 at June 30, 2017 and 2016, respectively, net against accrued expenses that USPI paid on behalf of THVG of approximately $11,568,000 and $9,754,000 at June 30, 2017 and 2016, respectively. These net amounts are shown in Funds due from United Surgical Partners, Inc on the accompanying consolidated balance sheets. The interest income amounted to approximately $233,000 and $150,000 for the years ended June 30, 2017 and 2016, respectively.
9. COMMITMENTS AND CONTINGENCIES
Financial Guarantees
THVG guarantees portions of the indebtedness of its investees to third-parties, which could potentially require THVG to make maximum aggregate payments totaling approximately $4,555,000. Of the total, approximately $3,091,000 relates to the obligations of three consolidated subsidiaries whose obligations are included in THVG’s consolidated balance sheets and related disclosures, and approximately $1,464,000 relates to obligations of two consolidated subsidiaries under operating leases whose obligations are not included in THVG’s consolidated balance sheets.
These arrangements (a) consist of guarantees of real estate and equipment financing, (b) are collateralized by all, or a portion of, the investees’ assets, (c) require payments by THVG in the event of a default by the investee primarily obligated under the financing, (d) expire as the underlying debt matures at various dates through 2021, or earlier if certain performance targets are met, and (e) provide no recourse for THVG to recover any amounts from third-parties. The fair value of the guarantee liability was not material to the consolidated financial statements and, therefore, no amounts were recorded at June 30, 2017 related to these guarantees. When THVG incurs guarantee obligations that are disproportionately greater than the guarantees provided by the investee’s other owners, THVG charges the investee a fair market value fee based on the value of the contingent liability THVG is assuming.
Litigation and Professional Liability Claims
In their normal course of business, the Facilities are subject to claims and lawsuits relating to patient treatment. THVG believes that its liability for damages resulting from such claims and lawsuits is adequately covered by insurance or is adequately provided for in its consolidated financial statements. USPI, on behalf of THVG and each of the Facilities, maintains professional liability insurance that provides coverage on a claims-made basis of $1,000,000 per incident and $15,000,000 in annual aggregate amount with retroactive provisions upon policy renewal. Certain of THVG’s insurance policies have deductibles and contingent premium arrangements. THVG believes that the expense recorded through June 30, 2017, which was estimated based on historical claims, adequately provides for its exposure under these arrangements. Additionally, from time to time, THVG may be named as a party to other legal claims and proceedings in the ordinary course of business. THVG is not aware of any such claims or proceedings that have more than a remote chance of having a material adverse impact on THVG.
F-17
TEXAS HEALTH VENTURES GROUP, L.L.C. AND SUBSIDIARIES
NOTES TO CONSOLIDATED FINANCIAL STATEMENTS- continued
10. SUBSEQUENT EVENTS
THVG regularly engages in exploratory discussions or enters into letters of intent with various entities regarding possible joint ventures, development, or other transactions. These possible joint ventures, developments of new facilities, or other transactions are in various stages of negotiation.
THVG has performed an evaluation of subsequent events through November 3, 2017, which is the date the consolidated financial statements were available to be issued.
In August of 2017, THVG purchased a controlling interest of 54.25% in Texas Spine and Joint Hospital, LLC. (Tyler Hospital) located in Tyler, Texas. Tyler Hospital specializes in the treatment of spine and joints. The total purchase price paid for the acquisition was approximately $81,620,000. The purchase price allocation for this acquisition has not been finalized.
F-18
TABLE OF CONTENTS
Part IItem 1. BusinessItem 1A. Risk FactorsItem 1B. Unresolved Staff CommentsItem 2. PropertiesItem 3. Legal ProceedingsItem 4. Mine Safety DisclosuresPart IIItem 5. Market For Registrant S Common Equity, Related Stockholder Matters and Issuer Purchases Of Equity SecuritiesItem 6. Selected Financial DataItem 7. Management S Discussion and Analysis Of Financial Condition and Results Of OperationsItem 7A. Quantitative and Qualitative Disclosures About Market RiskItem 8. Financial Statements and Supplementary DataNote 1. Significant Accounting PoliciesNote 2. EquityNote 3. Accounts Receivable and Allowance For Doubtful AccountsNote 4. Assets and Liabilities Held For SaleNote 5. Impairment and Restructuring Charges, and Acquisition-related CostsNote 6. Long-term Debt and Lease ObligationsNote 7. GuaranteesNote 8. Employee Benefit PlansNote 9. Property and EquipmentNote 10. Goodwill and Other Intangible AssetsNote 11. Investments and Other AssetsNote 12. Accumulated Other Comprehensive LossNote 13. Property and Professional and General Liability InsuranceNote 14. Claims and LawsuitsNote 15. Redeemable Noncontrolling Interest in Equity Of Consolidated SubsidiariesNote 16. Income TaxesNote 17. Earnings (loss) Per Common ShareNote 18. Fair Value MeasurementsNote 19. AcquisitionsNote 20. Segment InformationNote 21. Recent Accounting StandardsItem 9. Changes in and Disagreements with Accountants on Accounting and Financial DisclosureItem 9A. Controls and ProceduresItem 9B. Other InformationPart IIIItem 10. Directors, Executive Officers and Corporate GovernanceItem 11. Executive CompensationItem 12. Security Ownership Of Certain Beneficial Owners and Management and Related Stockholder MattersItem 13. Certain Relationships and Related Transactions, and Director IndependenceItem 14. Principal Accounting Fees and ServicesPart IVItem 15. Exhibits and Financial Statement SchedulesItem 16. Form 10-k Summary