FIRST FINANCIAL CORP /IN/
10-Ks and 10-Qs
|
|
|
|
|
|
|
|
|
|
|
|
|
|
|
|
|
|
|
|
|
|
|
|
|
|
|
|
|
|
|
|
|
|
|
|
|
|
|
|
|
|
|
|
|
|
|
|
|
|
|
|
|
UNITED STATES
SECURITIES AND EXCHANGE COMMISSION
Washington, D.C. 20549
FORM 10-K
|
x
|
ANNUAL REPORT PURSUANT TO SECTION 13 OR 15(d) OF THE SECURITIES EXCHANGE ACT OF 1934
|
For the fiscal year ended
December 31, 2019
OR
|
¨
|
TRANSITION REPORT PURSUANT TO SECTION 13 OR 15(d) OF THE SECURITIES EXCHANGE ACT OF 1934
|
For the transition period from _________ to ___________
Commission file number 0-16759
FIRST FINANCIAL CORPORATION
(Exact name of registrant as specified in its charter)
|
INDIANA
|
35-1546989
|
|
(State of Incorporation)
|
(I.R.S. Employer Identification Number)
|
|
One First Financial Plaza
Terre Haute, Indiana
|
47807
|
|
(Address of Registrant’s Principal Executive Offices)
|
(Zip Code)
|
(812) 238-6000
(Registrant’s Telephone Number, Including Area Code)
Securities registered pursuant to Section 12(b) of the Act:
|
Title of each class
|
Name of Exchange on Which Registered
|
|
Common Stock, no par value
|
The NASDAQ Stock Market LLC
(NASDAQ Global Select Market)
|
Securities registered pursuant to Section 12(g) of the Act:
None
Indicate by check mark if the registrant is a well-known-seasoned issuer, as defined in Rule 405 of the Securities Act. Yes
¨
No
x
Indicate by check mark if the registrant is not required to file reports pursuant to Section 13 or Section 15(d) of the Act. Yes
¨
No
x
Indicate by check mark whether the registrant (1) has filed all reports required to be filed by Section 13 or 15(d) of the Securities Exchange Act of 1934 during the preceding 12 months (or for such shorter period that the registrant was required to file such reports), and (2) has been subject to such filing requirements for the past 90 days. Yes
x
No
¨
Indicate by check mark whether the registrant has submitted electronically and posted on its corporate Web site, if any, every Interactive Data File required to be submitted and posted pursuant to Rule 405 of Regulation S-T (§ 232.405 of this chapter) during the preceding 12 months (or for such shorter period that the registrant was required to submit and post such files). Yes
x
No
¨
Indicate by check mark if disclosure of delinquent filers pursuant to Item 405 of Regulation S-K is not contained herein, and will not be contained, to the best of registrant’s knowledge, in definitive proxy or information statements incorporated by reference in Part III of this Form 10-K or any amendment to this Form 10-K.
x
Indicate by check mark whether the registrant is a large accelerated filer, an accelerated filer, a non-accelerated filer, or a smaller reporting company. See definition of “accelerated filer”, “large accelerated filer”, and “smaller reporting company” in Rule 12b-2 of the Exchange Act of 1934.
Large accelerated filer
¨
Accelerated filer
x
Non-accelerated filer
¨
Smaller reporting company
¨
Emerging growth company
¨
If an emerging growth company, indicate by check mark if the registrant has elected not to use the extended transition period for complying with any new or revised financial accounting standards provided pursuant to Section 7(a)(2)(B) of the Securities Act.
¨
Indicate by check mark whether the registrant is a shell company (as defined in Rule 12b-2 of the Act). Yes
¨
No
x
As of June 30,
2019
the aggregate market value of the stock held by non-affiliates of the registrant based on the average bid and ask prices of such stock was
$457,533,380
. (For purposes of this calculation, the Corporation excluded the stock owned by certain beneficial owners and management and the Corporation’s Employee Stock Ownership Plan.)
Shares of Common Stock outstanding as of March 1,
2020
—
13,753,790
shares.
DOCUMENTS INCORPORATED BY REFERENCE
Portions of the Definitive Proxy Statement for the First Financial Corporation Annual Meeting of Shareholders to be held April 15,
2020
are incorporated by reference into Part III.
FIRST FINANCIAL CORPORATION
2019
ANNUAL REPORT ON FORM 10-K
TABLE OF CONTENTS
|
|
PAGE
|
|
PART I
|
|
|
Item 1. Business
|
|
|
Item 1A. Risk Factors
|
|
|
Item 1B. Unresolved Staff Comments
|
|
|
Item 2. Properties
|
|
|
Item 3. Legal Proceedings
|
|
|
Item 4. Mine Safety Disclosures
|
|
|
PART II
|
|
|
Item 5. Market for Registrant’s Common Equity, Related Stockholder Matters and Issuer Purchases of Equity Securities
|
|
|
Item 6. Selected Financial Data
|
|
|
Item 7. Management’s Discussion and Analysis of Financial Condition and Results of Operations
|
|
|
Item 7A. Quantitative and Qualitative Disclosures about Market Risk
|
|
|
Item 8. Financial Statements and Supplementary Data
|
|
|
Item 9. Changes in and Disagreements with Accountants on Accounting and Financial Disclosures
|
|
|
Item 9A. Controls and Procedures
|
|
|
Item 9B. Other Information
|
|
|
PART III
|
|
|
Item 10. Directors, Executive Officers and Corporate Governance
|
|
|
Item 11. Executive Compensation
|
|
|
Item 12. Security Ownership of Certain Beneficial Owners and Management and Related Shareholder Matters
|
|
|
Item 13. Certain Relationships and Related Transactions and Director Independence
|
|
|
Item 14. Principal Accountant Fees and Services
|
|
|
PART IV
|
|
|
Item 15. Exhibits and Financial Statement Schedules
|
|
|
Signatures
|
|
|
Exhibit 21
|
|
|
Exhibit 31.1
|
|
|
Exhibit 31.2
|
|
|
Exhibit 32.1
|
|
|
Exhibit 32.2
|
|
2
FIRST FINANCIAL CORPORATION
2019
ANNUAL REPORT ON FORM 10-K
PART I
|
ITEM 1.
|
BUSINESS
|
FORWARD-LOOKING STATEMENTS
A cautionary note about forward-looking statements: In its oral and written communication, First Financial Corporation from time to time includes forward-looking statements, within the meaning of the Private Securities Litigation Reform Act of 1995. Such forward-looking statements can include statements about estimated cost savings, plans and objectives for future operations and expectations about performance, as well as economic and market conditions and trends. They often can be identified by the use of words such as "expect," "may," "could," "intend," "project," "estimate," "believe" or "anticipate" or words of similar import. By their nature, forward-looking statements are based on assumptions and are subject to risks, uncertainties and other factors. Actual results may differ materially from those contained in the forward-looking statement. First Financial Corporation may include forward-looking statements in filings with the Securities and Exchange Commission, in other written materials such as this Annual Report and in oral statements made by senior management to analysts, investors, representatives of the media and others. It is intended that these forward-looking statements speak only as of the date they are made, and First Financial Corporation undertakes no obligation to update any forward-looking statement to reflect events or circumstances after the date on which the forward-looking statement is made or to reflect the occurrence of unanticipated events.
The discussion in Item 1A (Risk Factors) and Item 7 (Management's Discussion and Analysis of Results of Operations and Financial Condition) of this Annual Report on Form 10-K, lists some of the factors which could cause actual results to vary materially from those in any forward-looking statements. Other uncertainties which could affect First Financial Corporation's future performance include the effects of competition, technological changes and regulatory developments; changes in fiscal, monetary and tax policies; market, economic, operational, liquidity, credit and interest rate risks associated with First Financial Corporation's business; inflation; competition in the financial services industry; changes in general economic conditions, either nationally or regionally, resulting in, among other things, credit quality deterioration; and changes in securities markets. Investors should consider these risks, uncertainties and other factors in addition to those mentioned by First Financial Corporation in its other filings from time to time when considering any forward-looking statement.
GENERAL
First Financial Corporation (the “Corporation”) is a financial holding company. The Corporation was originally organized as an Indiana corporation in 1984 to operate as a bank holding company.
The Corporation, which is headquartered in Terre Haute, Indiana, offers a wide variety of financial services including commercial, mortgage and consumer lending, lease financing, trust account services, depositor services and insurance services through its four subsidiaries. At the close of business in
2019
the Corporation and its subsidiaries had
957
full-time equivalent employees.
The risk characteristics of each loan portfolio segment are as follows:
Commercial
Commercial loans are predominately loans to expand a business or finance asset purchases. The underlying risk in the Commercial loan segment is primarily a function of the reliability and sustainability of the cash flows of the borrower and secondarily on the underlying collateral securing the transaction. From time to time, the cash flows of borrowers may be less than historical or as planned. In addition, the underlying collateral securing these loans may fluctuate in value. Most commercial loans are secured by the assets financed or other business assets and most commercial loans are further supported by a personal guarantee. However, in some instances, short term loans are made on an unsecured basis. Agriculture production loans are typically secured by growing crops and generally secured by other assets such as farm equipment. Production loans are subject to weather and market pricing risks. The Corporation has established underwriting standards and guidelines for all commercial loan types.
The Corporation strives to maintain a geographically diverse commercial real estate portfolio. Commercial real estate loans are primarily underwritten based upon the cash flows of the underlying real estate or from the cash flows of the business conducted at the real estate. Generally, these types of loans will be fully guaranteed by the principal owners of the real estate and loan amounts must be supported by adequate collateral value. Commercial real estate loans may be adversely affected by factors in the local market, the regional economy, or industry specific factors. In addition, Commercial Construction loans are a specific type of commercial real estate loan which inherently carry more risk than loans for completed projects. Since these types of loans are
3
underwritten utilizing estimated costs, feasibility studies, and estimated absorption rates, the underlying value of the project may change based upon the inaccuracy of these projections. Commercial construction loans are closely monitored, subject to industry standards, and disbursements are controlled during the construction process.
Residential
Retail real estate mortgages that are secured by 1-4 family residences are generally owner occupied and include residential real estate and residential real estate construction loans. The Corporation typically establishes a maximum loan-to-value ratio and generally requires private mortgage insurance if the ratio is exceeded. The Corporation sells substantially all of its long-term fixed mortgages to secondary market purchasers. Mortgages sold to secondary market purchasers are underwritten to specific guidelines. The Corporation originates some mortgages that are maintained in the bank’s loan portfolio. Portfolio loans are generally adjustable rate mortgages and are underwritten to conform to Qualified Mortgage standards. Several factors are considered in underwriting all Mortgages including the value of the underlying real estate, debt-to-income ratio and credit history of the borrower. Repayment is primarily dependent upon the personal income of the borrower and can be impacted by changes in borrower’s circumstances such as changes in employment status and changes in real estate property values. Risk is mitigated by the sale of substantially all long-term fixed rate mortgages, the underwriting of portfolio loans to Qualified Mortgage standards and the fact that mortgages are generally smaller individual amounts spread over a large number of borrowers.
Consumer
The consumer portfolio primarily consists of home equity loans and lines (typically secured by a subordinate lien on a 1-4 family residence), secured loans (typically secured by automobiles, boats, recreational vehicles, or motorcycles), cash/CD secured, and unsecured loans. Pricing, loan terms, and loan to value guidelines vary by product line. The underlying value of collateral dependent loans may vary based on a number of economic conditions, including fluctuations in home prices and unemployment levels. Underwriting of consumer loans is based on the individual credit profile and analysis of the debt repayment capacity for each borrower. Payments for consumer loans is typically set-up on equal monthly installments, however, future repayment may be impacted by a change in economic conditions or a change in the personal income levels of individual customers. Overall risks within the consumer portfolio are mitigated by the mix of various loan products, lending in various markets and the overall make-up of the portfolio (small loan sizes and a large number of individual borrowers).
COMPANY PROFILE
First Financial Bank, N.A. (the “Bank”) is the largest bank in Vigo County, Ind. It operates ten full-service banking branches within the county; three in Clay County, Ind.; one in Daviess County, Ind.; one in Greene County, Ind.; three in Knox County, Ind.; four in Parke County, Ind.; one in Putnam County, Ind., four in Sullivan County, Ind.; one in Vanderburgh, County, Ind.; four in Vermillion County, Ind.; four in Champaign County, Illinois; one in Clark County, Ill.; three in Coles County, Ill.; two in Crawford County, Ill.; two in Franklin County, Ill.; one in Jasper County, Ill.; two in Jefferson County, Ill.; one in Lawrence County, Ill.; two in Livingston County, Ill.; two in Marion County, Ill.; three in McLean County, Ill.; two in Richland County, Ill.; six in Vermilion County, Ill.; one in Wayne County, Ill; two in Calloway County, Kentucky; three in Christian County, Ky; two in Fulton County, Ky; two in Marshall County, Ky; one in Todd County, Ky; one in Trigg County, Ky; three in Cheatham County, Tennessee; one in Houston County, Tn; and three in Montgomery County, Tn. There are three loan production offices, one in Marion County, Indiana; one in Rutherford County, Tennessee; and one in Williamson County, Tn. In addition to its branches, it has a main office in downtown Terre Haute and a 50,000-square-foot commercial building on South Third Street in Terre Haute, which serves as the Corporation's operations center and provides additional office space. The Morris Plan Company of Terre Haute, Inc. (“Morris Plan”) has one office and is located in Vigo County. First Chanticleer Corporation has one building located in Terre Haute, Indiana. FFB Risk Management Co., Inc. located in Las Vegas, Nevada is a captive insurance subsidiary which insures various liability and property damage policies for First Financial Corporation subsidiaries.
COMPETITION
First Financial Bank and Morris Plan face competition from other financial institutions. These competitors consist of commercial banks, a mutual savings bank and other financial institutions, including consumer finance companies, insurance companies, brokerage firms and credit unions.
The Corporation's business activities are centered in west-central Indiana, east-central Illinois, western Kentucky, and middle and western Tennessee. The Corporation has no foreign activities other than periodically investing available funds in time deposits held in foreign branches of domestic banks.
4
REGULATION AND SUPERVISION
The Corporation and its subsidiaries operate in highly regulated environments and are subject to supervision and regulation by several governmental regulatory agencies, including the Board of Governors of the Federal Reserve System (the “Federal Reserve”), the Office of the Comptroller of the Currency (the “OCC”), the Federal Deposit Insurance Corporation (the “FDIC”), and the Indiana Department of Financial Institutions (the “DFI”). The laws and regulations established by these agencies are generally intended to protect depositors, not shareholders. Changes in applicable laws, regulations, governmental policies, income tax laws and accounting principles may have a material effect on the Corporation’s business and prospects. The following summary is qualified by reference to the statutory and regulatory provisions discussed.
The Dodd-Frank Act
The Dodd-Frank Wall Street Reform and Consumer Protection Act (the “Dodd-Frank Act” or “Dodd-Frank”), which was enacted in July 2010, significantly restructured the financial regulatory regime in the United States. Although the Dodd-Frank Act’s provisions that have received the most public attention generally have been those applying to or more likely to affect larger institutions such as bank holding companies with total consolidated assets of $50 billion or more, it contains numerous other provisions that affect all bank holding companies and banks, including the Corporation, the Bank, and Morris Plan, some of which are described in more detail below.
Because full implementation of the Dodd-Frank Act will occur over several years, it is difficult to anticipate the overall financial impact on the Corporation, its customers or the financial industry generally. However, the impact is expected to be substantial and may have an adverse impact on the Corporation’s financial performance and growth opportunities.
The Volcker Rule
The Dodd-Frank Act requires the federal financial regulatory agencies to adopt rules that prohibit banks and their affiliates from engaging in proprietary trading and investing in and sponsoring certain unregistered investment companies (defined as hedge funds and private equity funds). The statutory provision is commonly called the “Volcker Rule”. Although the Corporation is continuing to evaluate the impact of the Volcker Rule and the final rules adopted thereunder, the Corporation does not currently anticipate that the Volcker Rule will have a material effect on the operations of the Bank, Morris Plan, or their respective subsidiaries, as the Corporation does not engage in the businesses prohibited by the Volcker Rule. The Corporation may incur costs to adopt additional policies and systems to ensure compliance with the Volcker Rule, but any such costs are not expected to be material.
Consumer Financial Protection Bureau
The Consumer Financial Protection Bureau (the “CFPB”), created by the Dodd-Frank Act, is responsible for administering federal consumer financial protection laws. The CFPB, which began operations on July 21, 2011, is an independent bureau within the Federal Reserve and has broad rule-making, supervisory and examination authority to set and enforce rules in the consumer protection area over financial institutions that have assets of $10 billion or more. The CFPB also has data collecting powers for fair lending purposes for both small business and mortgage loans, as well as authority to prevent unfair, deceptive and abusive practices. Abusive acts or practices are defined as those that:
|
(1)
|
materially interfere with a consumer’s ability to understand a term or condition of a consumer financial product or service, or
|
|
(2)
|
take unreasonable advantage of a consumer’s:
|
|
•
|
lack of financial savvy,
|
|
•
|
inability to protect himself in the selection or use of consumer financial products or services,
|
or
|
•
|
reasonable reliance on a covered entity to act in the consumer’s interests.
|
The CFPB has the authority to investigate possible violations of federal consumer financial law, hold hearings and commence civil litigation. The CFPB can issue cease-and-desist orders against banks and other entities that violate consumer financial laws. The CFPB may also institute a civil action against an entity in violation of federal consumer financial law in order to impose a civil penalty or an injunction.
5
BASEL III
In July 2013, the federal banking agencies published the Basel III Capital Rules establishing a new comprehensive capital framework for U.S. banking organizations. The rules implement the Basel Committee’s December 2010 framework known as “Basel III” for strengthening international capital standards as well as certain provisions of the Dodd-Frank Act.
The Basel III Capital Rules became effective on January 1, 2015 (subject to a phase-in period) and, among other things, introduced a new capital measure known as “Common Equity Tier 1” (“CET1”), which generally consists of common equity Tier 1 capital instruments and related surplus, retained earnings, and common equity Tier 1 minority interests, minus certain adjustments and deductions.
The Basel III Capital Rules provide for a number of deductions from and adjustments to CET1. These include, for example, the requirement that mortgage servicing rights, deferred tax assets arising from temporary differences that could not be realized through net operating loss carrybacks and significant investments in non-consolidated financial entities be deducted from CET1 to the extent that any one such category exceeds 10% of CET1 or all such categories in the aggregate exceed 15% of CET1. Under the former capital standards, the effects of accumulated other comprehensive income items included in capital were excluded for the purposes of determining regulatory capital ratios. Under the Basel III Capital Rules, the effects of certain accumulated other comprehensive items are not excluded; however, non-advanced approaches banking organizations, including the Corporation, may make a one-time permanent election to continue to exclude these items. The Corporation, the Bank and Morris Plan all made this election in order to avoid significant variations in the level of capital depending upon the impact of interest rate fluctuations on the fair value of the Corporation’s available-for-sale securities portfolio. The Basel III Capital Rules also preclude certain hybrid securities, such as trust preferred securities, as Tier 1 capital of bank holding companies, subject to phase-out. The Corporation has no trust preferred securities. Implementation of the deductions and other adjustments to CET1 began on January 1, 2015 and will be phased-in over a four-year period (beginning at 40% on January 1, 2015 and an additional 20% per year thereafter).
The Basel III Capital Rules prescribe a standardized approach for risk weightings that expand the risk-weighting categories from the current four Basel I-derived categories (0%, 20%, 50% and 100%) to a much larger and more risk-sensitive number of categories, depending on the nature of the assets, generally ranging from 0% for U.S. government and agency securities, to 600% for certain equity exposures, and resulting in higher risk weights for a variety of asset categories. Specifics changes from former capital rules impacting the Corporation’s determination of risk-weighted assets include, among other things:
|
•
|
Applying a 150% risk weight instead of a 100% risk weight for certain high volatility commercial real estate acquisition, development and construction loans;
|
|
•
|
Assigning a 150% risk weight to exposures (other than residential mortgage exposures) that are 90 days past due;
|
|
•
|
Providing for a 20% credit conversion factor for the unused portion of a commitment with an original maturity of one year or less that is not unconditionally cancellable (currently set at 0%); and
|
|
•
|
Providing for a risk weight, generally not less than 20% with certain exceptions, for securities lending transactions based on the risk weight category of the underlying collateral securing the transaction.
|
Fully phased in on January 1, 2019, the Basel III Capital Rules require the Corporation and its banking subsidiaries to maintain:
|
•
|
a minimum ratio of CET1 to risk-weighted assets of at least 4.5%, plus a 2.5% “capital conservation buffer” (which is added to the 4.5% CET1 ratio as that buffer is phased in, effectively resulting in a minimum ratio of CET1 to risk-weighted assets of at least 7% upon full implementation);
|
|
•
|
a minimum ratio of Tier 1 capital to risk-weighted assets of at least 6.0%, plus the capital conservation buffer (which is added to the 6.0% Tier 1 capital ratio as that buffer is phased in, effectively resulting in a minimum Tier 1 capital ratio of 8.5% upon full implementation);
|
|
•
|
a minimum ratio of Total capital (that is, Tier 1 plus Tier 2) to risk-weighted assets of at least 8.0%, plus the capital conservation buffer (which is added to the 8.0% total capital ratio as that buffer is phased in, effectively resulting in a minimum total capital ratio of 10.5% upon full implementation), and
|
|
•
|
a minimum leverage ratio of 4%, calculated as the ratio of Tier 1 capital to average assets.
|
The capital conservation buffer is designed to absorb losses during periods of economic stress. Banking institutions with a ratio of CET1 to risk-weighted assets above the minimum but below the conservation buffer (or below the combined capital conservation
6
buffer and countercyclical capital buffer, when the latter is applied) will face constraints on dividends, equity repurchases and compensation based on the amount of the shortfall. The implementation of the capital conservation buffer began on January 1, 2016 at the 0.625% level and phased in over a four-year period (increasing by that amount on each subsequent January 1, until it reached 2.5% on January 1, 2019).
Under the Basel III Capital Rules, the minimum capital ratios as of January 1, 2019 are as follows:
|
•
|
7.00% CET1 to risk-weighted assets;
|
|
•
|
8.50% Tier 1 capital to risk-weighted assets; and
|
|
•
|
10.50% Total capital to risk-weighted assets.
|
Certain regulatory capital ratios for the Corporation as of
December 31, 2019
, are shown below:
|
•
|
15.51% CET1 to risk-weighted assets;
|
|
•
|
15.51% Tier 1 capital to risk-weighted assets;
|
|
•
|
16.16% Total capital to risk-weighted assets; and
|
|
•
|
12.04% leverage ratio.
|
Certain regulatory capital ratios for the Bank as of
December 31, 2019
, are shown below:
|
•
|
15.40% CET1 to risk-weighted assets;
|
|
•
|
15.40% Tier 1 capital to risk-weighted assets;
|
|
•
|
15.91% Total capital to risk-weighted assets; and
|
|
•
|
11.93% leverage ratio.
|
Certain regulatory capital ratios for Morris Plan as of
December 31, 2019
, are shown below:
|
•
|
28.12% CET1 to risk-weighted assets;
|
|
•
|
28.12% Tier 1 capital to risk-weighted assets;
|
|
•
|
29.41% Total capital to risk-weighted assets; and
|
|
•
|
27.37% leverage ratio.
|
The Corporation
The Bank Holding Company Act
. Because the Corporation owns all of the outstanding capital stock of the Bank, it is registered as a bank holding company under the Federal Bank Holding Company Act of 1956 (“Act”) and is subject to periodic examination by the Federal Reserve and required to file periodic reports of its operations and any additional information that the Federal Reserve may require.
In general, the Act limits the business of bank holding companies to banking, managing or controlling banks and other activities that the Federal Reserve has determined to be so closely related to banking as to be a proper incident thereto. In addition, bank holding companies that qualify and elect to be financial holding companies such as the Corporation, may engage in any activity, or acquire and retain the shares of a company engaged in any activity, that is either (i) financial in nature or incidental to such financial activity (as determined by the Federal Reserve in consultation with the Secretary of the Treasury) or (ii) complementary to a financial activity and does not pose a substantial risk to the safety and soundness of depository institutions or the financial system generally (as solely determined by the Federal Reserve), without prior approval of the Federal Reserve.
Investments, Control, and Activities
. With some limited exceptions, the Bank Holding Company Act requires every bank holding company to obtain the prior approval of the Federal Reserve before acquiring another bank holding company or acquiring more than five percent of the voting shares of a bank (unless it already owns or controls the majority of such shares).
Bank holding companies are prohibited, with certain limited exceptions, from engaging in activities other than those of banking or of managing or controlling banks. They are also prohibited from acquiring or retaining direct or indirect ownership or control of voting shares or assets of any company which is not a bank or bank holding company, other than subsidiary companies furnishing services to or performing services for their subsidiaries, and other subsidiaries engaged in activities which the Federal Reserve determines to be so closely related to banking or managing or controlling banks as to be incidental to these operations. The Bank Holding Company Act does not place territorial restrictions on the activities of such nonbanking-related activities.
7
Bank holding companies which meet certain management, capital, and Community Reinvestment Act of 1977 (“CRA”) standards may elect to become a financial holding company, which would allow them to engage in a substantially broader range of nonbanking activities than is permitted for a bank holding company, including insurance underwriting and making merchant banking investments in commercial and financial companies.
The Corporation is a financial holding company (“FHC”) within the meaning of the Gramm-Leach-Bliley Financial Modernization Act of 1999 (“GLB Act”). The GLB Act restricts the business of FHC’s to financial and related activities, and provides the following:
|
·
|
it allows bank holding companies that qualify as “financial holding companies” to engage in a broad range of financial and related activities;
|
|||
|
·
|
it allows insurers and other financial services companies to acquire banks;
|
|||
|
·
|
it removes various restrictions that applied to bank holding company ownership of securities firms and mutual fund advisory companies; and
|
|||
|
·
|
it establishes the overall regulatory structure applicable to bank holding companies that also engage in insurance and securities operations.
|
|||
As a qualified FHC, the Corporation is eligible to engage in, or acquire companies engaged in, the broader range of activities that are permitted by the GLB Act. These activities include those that are determined to be “financial in nature,” including insurance underwriting, securities underwriting and dealing, and making merchant banking investments in commercial and financial companies. If any of the Corporation’s banking subsidiaries ceases to be “well capitalized” or “well managed” under applicable regulatory standards, the Federal Reserve Board may, among other things, place limitations on the Corporation’s ability to conduct these broader financial activities or, if the deficiencies persist, require the divestiture of the banking subsidiary. In addition, if any of the Corporation’s banking subsidiaries receives a rating of less than satisfactory under the CRA, the Corporation would be prohibited from engaging in any additional activities other than those permissible for bank holding companies that are not financial holding companies. The Corporation’s banking subsidiaries currently meet these capital, management and CRA requirements.
Dividends
. The Federal Reserve's policy is that a bank holding company experiencing earnings weakness should not pay cash dividends exceeding its net income or which could only be funded in ways that weaken the bank holding company's financial health, such as by borrowing. Additionally, the Federal Reserve possesses enforcement powers over bank holding companies and their non-bank subsidiaries to prevent or remedy actions that represent unsafe or unsound practices or violations of applicable statutes and regulations. Among these powers is the ability to proscribe the payment of dividends by banks and bank holding companies.
Source of Strength
. In accordance with Federal Reserve policy, the Corporation is expected to act as a source of financial strength to the Bank and Morris Plan and to commit resources to support the Bank and Morris Plan in circumstances in which the Corporation might not otherwise do so.
Sarbanes-Oxley Act of 2002
. The Sarbanes-Oxley Act of 2002 (the “Sarbanes-Oxley Act”) represents a comprehensive revision of laws affecting corporate governance, accounting obligations and corporate reporting. Among other requirements, the Sarbanes-Oxley Act established: (i) requirements for audit committees of public companies, including independence and expertise standards; (ii) additional responsibilities regarding financial statements for the chief executive officers and chief financial officers of reporting companies; (iii) standards for auditors and regulation of audits; (iv) increased disclosure and reporting obligations for reporting companies regarding various matters relating to corporate governance, and (v) new and increased civil and criminal penalties for violation of the securities laws.
The Bank and Morris Plan
General Regulatory Supervision
. The Bank is a national bank organized under the laws of the United States of America and is subject to the supervision of the OCC, whose examiners conduct periodic examinations of the Bank. The Bank must undergo regular on-site examinations by the OCC and must submit quarterly and annual reports to the OCC concerning its activities and financial condition.
Morris Plan is an Indiana-chartered institution and is subject to the supervision of the FDIC and the DFI, whose examiners conduct periodic examinations of Morris Plan. Morris Plan must undergo regular on-site examinations by the FDIC and the DFI and must submit quarterly and annual reports to the FDIC and the DFI concerning its activities and financial condition.
The deposits of the Bank and Morris Plan are insured by the FDIC and are subject to the FDIC's rules and regulations respecting the insurance of deposits. See “Deposit Insurance”.
8
Lending Limits
. The total loans and extensions of credit to a borrower outstanding at one time and not fully secured may not exceed 15 percent of the bank's capital and unimpaired surplus. In addition, the total amount of outstanding loans and extensions of credit to any borrower outstanding at one time and fully secured by readily marketable collateral may not exceed 10 percent of the unimpaired capital and unimpaired surplus of the bank (this limitation is separate from and in addition to the above limitation). If a loan is secured by United States obligations, such as treasury bills, it is not subject to this legal lending limit.
Deposit Insurance
. The Dodd-Frank Act has permanently increased the maximum amount of deposit insurance for financial institutions per insured depositor to $250,000.
The deposits of the Bank and Morris Plan are insured up to the applicable limits under the Deposit Insurance Fund (“DIF”). The FDIC maintains the DIF by assessing depository institutions an insurance premium. Pursuant to the Dodd-Frank Act, the FDIC is required to set a DIF reserve ratio of 1.35% of estimated insured deposits and is required to achieve this ratio by September 30, 2020.
In connection with the Dodd-Frank Act’s requirement that insurance assessments be based on assets, the FDIC bases assessments on an institution’s average consolidated assets (less average tangible equity) as opposed to its deposit level. This may shift the burden of deposit premiums toward larger depository institutions which rely on funding sources other than U.S. deposits.
Under the FDIC’s risk-based assessment system, insured institutions are required to pay deposit insurance premiums based on the risk that each institution poses to the DIF. An institution’s risk to the DIF is measured by its regulatory capital levels, supervisory evaluations, and certain other factors. An institution’s assessment rate depends upon the risk category to which it is assigned. As noted above, pursuant to the Dodd-Frank Act, the FDIC will calculate an institution’s assessment level based on its total average consolidated assets during the assessment period less average tangible equity (i.e., Tier 1 capital) as opposed to an institution’s deposit level which was the previous basis for calculating insurance assessments. Pursuant to the Dodd-Frank Act, institutions will be placed into one of four risk categories for purposes of determining the institution’s actual assessment rate. The FDIC will determine the risk category based on the institution’s capital position (well capitalized, adequately capitalized, or undercapitalized) and supervisory condition (based on exam reports and related information provided by the institution’s primary federal regulator). The Bank paid a total FDIC assessment of $683 thousand and Morris Plan paid a total FDIC assessment of $10 thousand in 2019.
In addition to the FDIC insurance premiums, the Bank and the Morris Plan are required to make quarterly payments on bonds issued by the Financing Corporation (“FICO”), an agency of the Federal government established to recapitalize a predecessor deposit insurance fund. These assessments will continue until the FICO bonds are repaid.
Transactions with Affiliates and Insiders
. Pursuant to Sections 23A and 23B of the Federal Reserve Act and Regulation W, the Bank and Morris Plan are subject to limitations on the amount of loans or extensions of credit to, or investments in, or certain other transactions with, affiliates (including the Corporation) and insiders and on the amount of advances to third parties collateralized by the securities or obligations of affiliates. Furthermore, within the foregoing limitations as to amount, each covered transaction must meet specified collateral requirements. Compliance is also required with certain provisions designed to avoid the taking of low quality assets. The Bank and Morris Plan are also prohibited from engaging in certain transactions with certain affiliates and insiders unless the transactions are on terms substantially the same, or at least as favorable to such institution or its subsidiaries, as those prevailing at the time for comparable transactions with nonaffiliated companies.
Extensions of credit by the Bank or Morris Plan to their executive officers, directors, certain principal shareholders, and their related interests must:
|
•
|
be made on substantially the same terms, including interest rates and collateral, as those prevailing at the time for comparable transactions with third parties; and
|
|
•
|
not involve more than the normal risk of repayment or present other unfavorable features.
|
The Dodd-Frank Act also included specific changes to the law related to the definition of a “covered transaction” in Sections 23A and 23B and limitations on asset purchases from insiders. With respect to the definition of a “covered transaction,” the Dodd-Frank Act now defines that term to include the acceptance of debt obligations issued by an affiliate as collateral for an institution’s loan or extension of credit to another person or company. In addition, a “derivative transaction” with an affiliate is now deemed to be a “covered transaction” to the extent that such a transaction causes an institution or its subsidiary to have a credit exposure to the affiliate. A separate provision of the Dodd-Frank Act states that an insured depository institution may not “purchase an asset from, or sell an asset to” a bank insider (or their related interests) unless (1) the transaction is conducted on market terms between the parties and (2) if the proposed transaction represents more than 10 percent of the capital stock and surplus of the insured institution, it has been approved in advance by a majority of the institution’s non-interested directors.
9
Dividends
. Applicable law provides that a financial institution, such as the Bank or Morris Plan, may pay dividends from its undivided profits in an amount declared by its Board of Directors, subject to prior regulatory approval if the proposed dividend, when added to all prior dividends declared during the current calendar year, would be greater than the current year's net income and retained earnings for the previous two calendar years.
Federal law generally prohibits the Bank or Morris Plan from paying a dividend to the Corporation if it would thereafter be undercapitalized. The FDIC may prevent a financial institution from paying dividends if it is in default of payment of any assessment due to the FDIC. In addition, payment of dividends by a bank may be prevented by the applicable federal regulatory authority if such payment is determined, by reason of the financial condition of such bank, to be an unsafe and unsound banking practice.
Community Reinvestment Act
. The CRA requires that the federal banking regulators evaluate the records of a financial institution in meeting the credit needs of its local community, including low and moderate income neighborhoods. These factors are also considered in evaluating mergers, acquisitions, and applications to open a branch or facility. Failure to adequately meet these criteria could result in the imposition of additional requirements and limitations on the Bank or on Morris Plan.
Interest Rate and Market Risk
. The federal bank regulators also have issued a joint policy statement to provide guidance on sound practices for managing interest rate risk. The statement sets forth the factors the federal regulatory examiners will use to determine the adequacy of a bank's capital for interest rate risk. These qualitative factors include the adequacy and effectiveness of the bank's internal interest rate risk management process and the level of interest rate exposure. Other qualitative factors that will be considered include the size of the bank, the nature and complexity of its activities, the adequacy of its capital and earnings in relation to the bank's overall risk profile, and its earning exposure to interest rate movements. The interagency supervisory policy statement describes the responsibilities of a bank's board of directors in implementing a risk management process and the requirements of the bank's senior management in ensuring the effective management of interest rate risk. Further, the statement specifies the elements that a risk management process must contain.
The federal banking regulators have also issued regulations revising the risk-based capital standards to include a supervisory framework for measuring market risk. The effect of these regulations is that any bank holding company or bank which has significant exposure to market risk must measure such risk using its own internal model, subject to the requirements contained in the regulations, and must maintain adequate capital to support that exposure. These regulations apply to any bank holding company or bank whose trading activity equals 10% or more of its total assets, or whose trading activity equals $1 billion or more. Examiners may require a bank holding company or bank that does not meet the applicability criteria to comply with the capital requirements if necessary for safety and soundness purposes. These regulations contain supplemental rules to determine qualifying and excess capital, calculate risk-weighted assets, calculate market risk-equivalent assets and calculate risk-based capital ratios adjusted for market risk.
Prompt Corrective Action
. The Federal Deposit Insurance Act, as amended (“FDIA”), requires among other things, the federal banking agencies to take “prompt corrective action” in respect of depository institutions that do not meet minimum capital requirements. The FDIA includes the following five capital tiers: “well capitalized,” “adequately capitalized,” “undercapitalized,” “significantly undercapitalized” and “critically undercapitalized.” A depository institution’s capital tier will depend upon how its capital levels compare with various relevant capital measures and certain other factors, as established by regulation. The relevant capital measures are the total risk-based capital ratio, the Tier 1 risk-based capital ratio, the common equity Tier 1 risk-based capital ratio and the leverage ratio.
A bank will be (i) “well capitalized” if the institution has a total risk-based capital ratio of 10.0% or greater, a Tier 1 risk-based capital ratio of 8.0% or greater, a common equity tier 1 risk-based capital ratio of 6.5% or greater and a leverage ratio of 5.0% or greater, and is not subject to any order or written directive by any such regulatory authority to meet and maintain a specific capital level for any capital measure; (ii) “adequately capitalized” if the institution has a total risk-based capital ratio of 8.0% or greater, a Tier 1 risk-based capital ratio of 6.0% or greater, a common equity Tier 1 risk-based capital ratio of 4.5% or greater and a leverage ratio of 4.0% or greater and is not “well capitalized”; (iii) “undercapitalized” if the institution has a total risk-based capital ratio that is less than 8.0%, a Tier 1 risk-based capital ratio of less than 6.0%, a common equity Tier 1 risk-based capital ratio of 4.5%, or a leverage ratio of less than 4.0%; (iv) “significantly undercapitalized” if the institution has a total risk-based capital ratio of less than 6.0%, a Tier 1 risk-based capital ratio of less than 4.5%, a common equity Tier 1 risk-based capital ratio of less than 3.0%, or a leverage ratio of less than 3.0%; and (v) “critically undercapitalized” if the institution’s tangible equity is equal to or less than 2.0% of average quarterly tangible assets. An institution may be downgraded to, or deemed to be in, a capital category that is lower than indicated by its capital ratios if it is determined to be in an unsafe or unsound condition or if it receives an unsatisfactory examination rating with respect to certain matters. A bank’s capital category is determined solely for the purpose of applying prompt corrective action regulations, and the capital category may not constitute an accurate representation of the bank’s overall financial condition or prospects for other purposes.
10
The FDIA generally prohibits a depository institution from making any capital distributions (including payment of a dividend) or paying any management fee to its parent holding company if the depository institution would thereafter be “undercapitalized.” “Undercapitalized” institutions are subject to growth limitations and are required to submit a capital restoration plan. The agencies may not accept such a plan without determining, among other things, that the plan is based on realistic assumptions and is likely to succeed in restoring the depository institution’s capital. In addition, for a capital restoration plan to be acceptable, the depository institution’s parent holding company must guarantee that the institution will comply with such capital restoration plan. The bank holding company must also provide appropriate assurances of performance. The aggregate liability of the parent holding company is limited to the lesser of (i) an amount equal to 5.0% of the depository institution’s total assets at the time it became undercapitalized and (ii) the amount which is necessary (or would have been necessary) to bring the institution into compliance with all capital standards applicable with respect to such institution as of the time it fails to comply with the plan. If a depository institution fails to submit an acceptable plan, it is treated as if it is “significantly undercapitalized.”
“Significantly undercapitalized” depository institutions may be subject to a number of requirements and restrictions, including orders to sell sufficient voting stock to become “adequately capitalized,” requirements to reduce total assets, and cessation of receipt of deposits from correspondent banks. “Critically undercapitalized” institutions are subject to the appointment of a receiver or conservator.
The appropriate federal banking agency may, under certain circumstances, reclassify a well-capitalized insured depository institution as adequately capitalized. The FDIA provides that an institution may be reclassified if the appropriate federal banking agency determines (after notice and opportunity for hearing) that the institution is in an unsafe or unsound condition or deems the institution to be engaging in an unsafe or unsound practice.
The appropriate agency is also permitted to require an adequately capitalized or undercapitalized institution to comply with the supervisory provisions as if the institution were in the next lower category (but not treat a significantly undercapitalized institution as critically undercapitalized) based on supervisory information other than the capital levels of the institution.
The Corporation believes that, as of
December 31, 2019
, the Bank and Morris Plan were each “well capitalized” based on the aforementioned ratios.
Incentive Compensation
. The Dodd-Frank Act requires the federal bank regulatory agencies and the SEC to establish joint regulations or guidelines prohibiting incentive-based payment arrangements at specified regulated entities, such as the Corporation and the Bank, having at least $1 billion in total assets that encourage inappropriate risks by providing an executive officer, employee, director or principal shareholder with excessive compensation, fees, or benefits or that could lead to material financial loss to the entity. In addition, these regulators must establish regulations or guidelines requiring enhanced disclosure to regulators of incentive-based compensation arrangements. The agencies proposed such regulations in April 2011, but the regulations have not been finalized. If the regulations are adopted in the form initially proposed, they will impose limitations on the manner in which the Corporation may structure compensation for its executives.
The Federal Reserve Board, OCC and FDIC have issued a comprehensive final guidance on incentive compensation policies intended to ensure that the incentive compensation policies of banking organizations do not undermine the safety and soundness of such organizations by encouraging excessive risk-taking. The guidance, which covers all employees that have the ability to materially affect the risk profile of an organization, either individually or as part of a group, is based upon the key principles that a banking organization’s incentive compensation arrangements should (i) provide incentives that do not encourage risk-taking beyond the organization’s ability to effectively identify and manage risks, (ii) be compatible with effective internal controls and risk management, and (iii) be supported by strong corporate governance, including active and effective oversight by the organization’s board of directors. These three principles are incorporated into the proposed joint compensation regulations under the Dodd-Frank Act, discussed above.
The Federal Reserve Board will review, as part of the regular, risk-focused examination process, the incentive compensation arrangements of banking organizations, such as the Corporation, that are not “large, complex banking organizations.” These reviews will be tailored to each organization based on the scope and complexity of the organization’s activities and the prevalence of incentive compensation arrangements. The findings of the supervisory initiatives will be included in reports of examination. Deficiencies will be incorporated into the organization’s supervisory ratings, which can affect the organization’s ability to make acquisitions and take other actions. Enforcement actions may be taken against a banking organization if its incentive compensation arrangements, or related risk-management control or governance processes, pose a risk to the organization’s safety and soundness and the organization is not taking prompt and effective measures to correct the deficiencies.
Ability-to-Repay Requirement and Qualified Mortgage Rule
. The Dodd-Frank Act contains additional provisions that affect
11
consumer mortgage lending. First, it significantly expands underwriting requirements applicable to loans secured by 1-4 family residential real property and augments federal law combating predatory lending practices. In addition to numerous new disclosure requirements, the Dodd-Frank Act imposes new standards for mortgage loan originations on all lenders, including banks and savings associations, in an effort to encourage lenders to verify a borrower’s ability to repay, while also establishing a presumption of compliance for certain “qualified mortgages.” Most significantly, the new standards limit the total points and fees that the Bank and/or a broker may charge on conforming and jumbo loans to 3% of the total loan amount.
The CFPB has issued a final rule that implements the Dodd-Frank Act’s ability-to-repay requirements, and clarifies the presumption of compliance for “qualified mortgages.” Further, the final rule also clarifies that qualified mortgages do not include “no-doc” loans and loans with negative amortization, interest-only payments, balloon payments, terms in excess of 30 years, or points and fees paid by the borrower that exceed 3% of the loan amount, subject to certain exceptions. In addition, for qualified mortgages, the monthly payment must be calculated on the highest payment that will occur in the first five years of the loan, and the borrower’s total debt-to-income ratio generally may not be more than 43%. The final rule also provides that certain mortgages that satisfy the general product feature requirements for qualified mortgages and that also satisfy the underwriting requirements of Fannie Mae and Freddie Mac (while they operate under federal conservatorship or receivership) or the U.S. Department of Housing and Urban Development, Department of Veterans Affairs, or Department of Agriculture or Rural Housing Service are also considered to be qualified mortgages. This second category of qualified mortgages will phase out as the aforementioned federal agencies issue their own rules regarding qualified mortgages, the conservatorship of Fannie Mae and Freddie Mac ends, and, in any event, after seven years.
As set forth in the Dodd-Frank Act, subprime (or higher-priced) mortgage loans are subject to the ability-to-repay requirement, and the final rule provides for a rebuttable presumption of lender compliance for those loans. The final rule also applies the ability-to-repay requirement to prime loans, while also providing a conclusive presumption of compliance (i.e., a safe harbor) for prime loans that are also qualified mortgages. Additionally, the final rule generally prohibits prepayment penalties (subject to certain exceptions) and sets forth a 3-year record retention period with respect to documenting and demonstrating the ability-to-repay requirement and other provisions.
USA Patriot Act
. The Uniting and Strengthening America by Providing Appropriate Tools Required to Intercept and Obstruct Terrorism Act of 2001 (the “USA Patriot Act”) is intended to strengthen the ability of U.S. Law Enforcement to combat terrorism on a variety of fronts. The potential impact of the USA Patriot Act on financial institutions is significant and wide-ranging. The USA Patriot Act contains sweeping anti-money laundering and financial transparency laws and requires financial institutions to implement additional policies and procedures with respect to, or additional measures designed to address, any or all of the following matters, among others: money laundering and currency crimes, customer identification verification, cooperation among financial institutions, suspicious activities and currency transaction reporting.
S.A.F.E. Act Requirements
. Regulations issued under the Secure and Fair Enforcement for Mortgage Licensing Act of 2008 (
the “S.A.F.E. Act” ) require residential mortgage loan originators who are employees of institutions regulated by the foregoing agencies, including national banks, to meet the registration requirements of the S.A.F.E. Act. The S.A.F.E. Act requires residential mortgage loan originators who are employees of regulated financial institutions to be registered with the Nationwide Mortgage Licensing System and Registry, a database created by the Conference of State Bank Supervisors and the American Association of Residential Mortgage Regulators to support the licensing of mortgage loan originators by the states. Employees of regulated financial institutions are generally prohibited from originating residential mortgage loans unless they are registered.
Other Regulations
Federal law extensively regulates other various aspects of the banking business such as reserve requirements. Current federal law also requires banks, among other things to make deposited funds available within specified time periods. In addition, with certain exceptions, a bank and a subsidiary may not extend credit, lease or sell property or furnish any services or fix or vary the consideration for the foregoing on the condition that (i) the customer must obtain or provide some additional credit, property or services from, or to, any of them, or (ii) the customer may not obtain some other credit, property or service from a competitor, except to the extent reasonable conditions are imposed to assure the soundness of credit extended.
12
Interest and other charges collected or contracted by the Bank or Morris Plan are subject to state usury laws and federal laws concerning interest rates. The loan operations are also subject to federal and state laws applicable to credit transactions, such as the:
|
•
|
Truth-In-Lending Act and state consumer protection laws governing disclosures of credit terms and prohibiting certain practices with regard to consumer borrowers;
|
|
•
|
Home Mortgage Disclosure Act of 1975, requiring financial institutions to provide information to enable the public and public officials to determine whether a financial institution is fulfilling its obligation to help meet the housing needs of the community it serves;
|
|
•
|
Equal Credit Opportunity Act and other fair lending laws, prohibiting discrimination on the basis of race, creed or other prohibited factors in extending credit;
|
|
•
|
Fair Credit Reporting Act of 1978 and Fair and Accurate Credit Transactions Act of 2003, governing the use and provision of information to credit reporting agencies;
|
|
•
|
Fair Debt Collection Practices Act, governing the manner in which consumer debts may be collected by collection agencies; and rules and regulations of the various federal agencies charged with the responsibility of implementing such federal laws.
|
The deposit operations also are subject to the:
|
•
|
Customer Information Security Guidelines. The federal bank regulatory agencies have adopted final guidelines (the “Guidelines”) for safeguarding confidential customer information. The Guidelines require each financial institution, under the supervision and ongoing oversight of its Board of Directors, to create a comprehensive written information security program designed to ensure the security and confidentiality of customer information, protect against any anticipated threats or hazards to the security or integrity of such information; protect against unauthorized access to or use of such information that could result in substantial harm or inconvenience to any customer; and implement response programs for security breaches.
|
|
•
|
Electronic Funds Transfer Act and Regulation E. The Electronic Funds Transfer Act, which is implemented by Regulation E, governs automatic deposits to and withdrawals from deposit accounts and customers' rights and liabilities arising from the use of automated teller machines and other electronic banking service.
|
|
•
|
Gramm-Leach-Bliley Act, Fair and Accurate Credit Transactions Act. The Gramm-Leach-Bliley Act, the Fair and Accurate Credit Transactions Act, and the implementing regulations govern consumer financial privacy, provide disclosure requirements and restrict the sharing of certain consumer financial information with other parties.
|
The federal banking agencies have established guidelines which prescribe standards for depository institutions relating to internal controls, information systems, internal audit systems, loan documentation, credit underwriting, interest rate exposure, asset growth, asset quality, earnings, compensation fees and benefits, and management compensation. The agencies may require an institution which fails to meet the standards set forth in the guidelines to submit a compliance plan. Failure to submit an acceptable plan or adhere to an accepted plan may be grounds for further enforcement action.
As noted above, the new Bureau of Consumer Financial Protection has authority for amending existing consumer compliance regulations and implementing new such regulations. In addition, the Bureau has the power to examine the compliance of financial institutions with an excess of $10 billion in assets with these consumer protection rules. The Bank’s and Morris Plan’s compliance with consumer protection rules will be examined by the OCC and the FDIC, respectively, since neither the Bank nor Morris Plan meet this $10 billion asset level threshold.
Enforcement Powers
. Federal regulatory agencies may assess civil and criminal penalties against depository institutions and certain “institution-affiliated parties”, including management, employees, and agents of a financial institution, as well as independent contractors and consultants such as attorneys and accountants and others who participate in the conduct of the financial institution's affairs.
In addition, regulators may commence enforcement actions against institutions and institution-affiliated parties. Possible enforcement actions include the termination of deposit insurance. Furthermore, regulators may issue cease-and-desist orders to, among other things, require affirmative action to correct any harm resulting from a violation or practice, including restitution, reimbursement, indemnifications or guarantees against loss. A financial institution may also be ordered to restrict its growth, dispose of certain assets, rescind agreements or contracts, or take other actions as determined by the regulator to be appropriate.
Effect of Governmental Monetary Policies
. The Corporation's earnings are affected by domestic economic conditions and the monetary and fiscal policies of the United States government and its agencies. The Federal Reserve Bank's monetary policies have had, and are likely to continue to have, an important impact on the operating results of commercial banks through its power
13
to implement national monetary policy in order, among other things, to curb inflation or combat a recession. The monetary policies of the Federal Reserve have major effects upon the levels of bank loans, investments and deposits through its open market operations in United States government securities and through its regulation of the discount rate on borrowings of member banks and the reserve requirements against member bank deposits. It is not possible to predict the nature or impact of future changes in monetary and fiscal policies.
Available Information
The Corporation files annual reports on Form 10-K, quarterly reports on Form 10-Q, proxy statements and other information with the Securities and Exchange Commission. Such reports, proxy statements and other information can be read and copied at the public reference facilities maintained by the Securities and Exchange Commission at the Public Reference Room, 100 F Street, NE, Washington, D.C. 20549. Information regarding the operation of the Public Reference Room may be obtained by calling the Securities and Exchange Commission at 1-800-SEC-0330. The Securities and Exchange Commission maintains a web site (http://www.sec.gov) that contains reports, proxy statements, and other information. The Corporation’s filings are also accessible at no cost on the Corporation's website at www.first-online.com.
|
ITEM 1A.
|
RISK FACTORS
|
An investment in the Corporation involves risk, some of which, including market, liquidity, credit, operational, legal, compliance, reputational, and strategic risks, could be substantial and is inherent in our business. This risk also includes the possibility that the value of the investment could decrease considerably, you could lose all or part of your investment, and dividends or other distributions concerning the investment could be reduced or eliminated. Discussed below are the most significant risks and uncertainties that management believes could adversely affect our financial results and condition, as well as the value of, and return on, an investment in the Corporation. Before making an investment decision, you should carefully consider the risks and uncertainties described below together with all of the other information included or incorporated by reference in this report.
Risks Related to Economic and Market Conditions
Economic conditions have affected and could adversely affect our revenue and profits.
The Corporation’s financial performance generally, and in particular the ability of borrowers to pay interest on and repay principal of outstanding loans and the value of collateral securing those loans, as well as demand for loans and other products and services that the Corporation offers, is highly dependent upon the business environment in the markets where the Corporation operates and in the U.S. as a whole. An economic downturn or sustained, high unemployment levels, decreased investor or business confidence, trade wars and the imposition of tariffs on goods purchased or sold by our customers, the effect of a pandemic, epidemic, or outbreak of an infectious disease on our customers, stock market volatility, and other factors beyond our control may have a negative effect on the ability of our borrowers to make timely repayments of their loans (thereby, increasing the risk of loan defaults and losses), the value of collateral securing those loans, demand for loans and other products and services we offer, and our deposit levels and composition. As a result, our operating results could be negatively impacted.
Geographic concentration of the Corporation’s markets makes our business highly susceptible to local economic conditions and a downturn in local economic conditions may adversely affect our business.
Unlike larger banking organizations that are more geographically diversified, the Corporation’s operations are currently concentrated in west central Indiana, east central Illinois, western Kentucky, and middle and western Tennessee, and most of our customers are located in these markets. The economic conditions in these local markets may be different from, and in some instances be worse than, the economic conditions in the U.S. as a whole. As a result of this geographic concentration, the Corporation’s financial results depend largely upon economic conditions in these market areas. Deterioration in economic conditions in the Corporation’s markets could result in one or more of the following, which may adversely affect our business:
|
•
|
an increase in loan delinquencies;
|
|
•
|
an increase in problem assets and foreclosures;
|
|
•
|
an increase in our allowance for loan losses;
|
|
•
|
a decrease in the demand for our products and services;
|
|
•
|
a decrease in the value of collateral for loans, especially real estate, in turn reducing customers’ borrowing power, the value of assets associated with problem loans and collateral coverage;
|
|
•
|
a decrease in net worth and liquidity of loan guarantors, which may impair their ability to honor guarantees made to us; and
|
|
•
|
a decrease in deposits balances.
|
14
Changes in interest rates could adversely affect the Corporation’s results of operations and financial condition.
The Corporation’s earnings and cash flows are largely dependent upon the Corporation’s net interest income. Net interest income is the difference between interest income earned on interest earning assets, such as loans and securities, and interest expense paid on interest bearing liabilities, such as deposits and borrowed funds. Interest rates are highly sensitive to many factors that are beyond the Corporation’s control, including general economic conditions, domestic and international events, changes in U.S. and other financial markets, and policies of various governmental and regulatory agencies. Changes in monetary policy, including changes in interest rates, could influence not only the interest that is received on loans and securities and the interest that is paid on deposits and borrowings, but such changes could also affect the Corporation’s ability to originate loans and obtain deposits and the fair value of the Corporation’s financial assets and liabilities.
For several years prior to December 2015, the Federal Open Market Committee (“FOMC”) of the Federal Reserve kept the target federal funds rate between 0% to 0.25% to help the overall U.S. economy. Beginning in late 2015 and continuing through 2018, the FOMC steadily increased the target federal funds rate up to between 2.25% to 2.5%. In 2019, the FOMC decreased rates on three separate occasions for a total decrease of 75 basis points, resulting in a target federal funds rate between 1.5% to 1.75%. The FOMC decreased the target federal funds rate in response to economic uncertainty, and indicated possible further decreases, which will likely be influenced by global economic and financial developments and inflationary pressures.
If the interest rates paid on deposits and other interest-bearing liabilities increase at a faster rate than the interest rates received on loans and other interest-earning assets, our net interest income, and, therefore, our earnings, could be adversely affected. Such an interest rate environment may also result in us incurring a higher cost to retain our deposits. While the higher payment amounts we would receive on adjustable-rate or variable-rate loans in a rising interest rate environment may increase our interest income, some borrowers may be unable to afford the higher payment amounts, and this could result in a higher rate of default. Rising interest rates also may reduce the demand for loans and the value of fixed-rate investment securities. Accordingly, changes in interest rates could adversely affect our results of operations and financial condition.
Changes to the London Inter-Bank Offered Rate (“LIBOR”) may adversely impact the value of, and the return on, our financial instruments that are indexed to LIBOR.
The Corporation and its subsidiaries have financial instruments which have a rate indexed to LIBOR. On July 27, 2017, the United Kingdom Financial Conduct Authority, which regulates LIBOR, announced that it intends to stop persuading or compelling banks to submit rates for the calculation of LIBOR to the administrator of LIBOR after 2021. The announcement indicates that the continuation of LIBOR on the current basis cannot and will not be guaranteed after 2021. It is uncertain at this time whether and to what extent banks will continue to provide LIBOR submissions to the administrator of LIBOR or whether any additional reforms to LIBOR may be enacted in the United Kingdom or elsewhere.
As a result of this announcement, regulators, industry groups, and committees have, among other things, published recommended fallback language for financial instruments indexed to LIBOR, identified and recommended alternatives to LIBOR, and proposed implementations of the recommended alternatives in floating-rate financial instruments. For example, in June 2017, the Alternative Reference Rate Committee, a committee of private-market derivative participants and their regulators convened by the Federal Reserve to identity alternative reference interest rates, announced a Secured Overnight Funding Rate, a broad Treasuries overnight repurchase agreement (repo) financing rate, as its preferred alternative to U.S. dollar LIBOR. It is currently unknown whether any of these recommendations and proposals will be broadly accepted, whether they will continue to evolve, and what effect of their implementation may have on the markets for floating-rate financial instruments. Uncertainty as to the nature of alternative reference rates and as to potential changes or other reforms to LIBOR may adversely affect LIBOR and the value of financial instruments indexed to LIBOR in our portfolio and may impact the availability and cost of hedging instruments and borrowings.
Transition from LIBOR could create considerable costs and additional risk for us. Since proposed alternative reference rates are calculated differently, payments under contracts indexed to new rates will differ from those indexed to LIBOR. The transition will change our market risk profiles, requiring changes to risk and pricing models, valuation tools, product design, and hedging strategies. Further, our failure to adequately manage this transition process with our customers could impact our reputation and may subject us to disputes or litigation with our customers over the appropriateness or comparability to LIBOR of the substitute indices. Although we are currently unable to assess what the ultimate impact of the transition from LIBOR will be, any market-wide transition away from LIBOR could have an adverse effect on our business, financial condition and results of operations.
15
Risks Related to Our Business
When we loan money, commit to loan money, or enter into a letter of credit or other contract with a counterparty, we incur credit risk, or the risk of loss if our borrowers do not repay their loans or our counterparties fail to perform according to the terms of their contracts.
As lending is one of our primary business activities, the credit quality of our portfolio can have a significant impact on our earnings. We estimate and establish reserves for credit risks and probable incurred credit losses that are inherent in our loan portfolio. This process, which is critical to our financial results and condition, requires difficult, subjective, and complex judgments, including reviews of economic conditions and how these economic conditions might impair the ability of our borrowers to repay their loans. There is the chance that we will fail to identify the proper factors or that we will fail to accurately estimate the impacts of factors that we identify. In addition, large loans, letters of credit, and contracts with individual counterparties in our portfolio magnify the credit risk that we face, as the impact of large borrowers and counterparties not repaying their loans or performing according to the terms of their contracts has a disproportionately significant impact on our credit losses and reserves.
The information that we use in managing our credit risk may be inaccurate or incomplete, which may result in an increased risk of default and otherwise have an adverse effect on our business, results of operations, and financial condition.
In deciding whether to extend credit or enter into other transactions with clients and counterparties, we may rely on information furnished by or on behalf of clients and counterparties, including financial statements and other financial information. We also may rely on representations of clients and counterparties as to the accuracy and completeness of that information and, with respect to financial statements, on reports of independent auditors. Default risk may arise from events or circumstances that are difficult to detect, such as fraud. Moreover, such circumstances, including fraud, may become more likely to occur or be detected in periods of general economic uncertainty. We may also fail to receive full information with respect to the risks of a counterparty. In addition, in cases where we have extended credit against collateral, we may find that we are under-secured, for example, as a result of sudden declines in market values that reduce the value of collateral or due to fraud with respect to such collateral. If these events or circumstances were to occur, it could result in a potential loss of revenue and have an adverse effect on our business, results of operations, and financial condition.
If the Corporation’s actual loan losses exceed our allowance for loan losses, our net income will decrease.
The Corporation maintains an allowance for loan losses, which is a reserve established through a provision for loan losses charged to expense, that represents management’s best estimate of probable incurred losses that are inherent within the existing portfolio of loans. The level of the allowance reflects management’s continuing evaluation of industry concentrations; specific credit risks; loan loss experience; current loan portfolio quality; present economic, political, and regulatory conditions; and unidentified losses inherent in the current loan portfolio. The determination of the appropriate level of the allowance for loan losses inherently involves a high degree of subjectivity and requires the Corporation to make significant estimates of current credit risks and future trends, all of which may undergo material changes. Changes in economic conditions affecting borrowers, new information regarding existing loans, identification of additional problem loans, and other factors, both within and outside of the Corporation’s control, may require an increase in the allowance for loan losses. In addition, bank regulatory agencies periodically review the Corporation’s allowance for loan losses and may require an increase in the provision for loan losses or the recognition of further loan charge-offs, based on judgments different than those of management. If charge-offs in future periods exceed the allowance for loan losses, the Corporation will need additional provisions to increase the allowance for loan losses. Any increases in the allowance for loan losses will result in a decrease in net income and, possibly, capital, and may have a material adverse effect on the Corporation’s financial condition and results of operations.
The implementation of CECL, including the design and maintenance of related internal controls over financial reporting, will require a significant amount of time and resources which may have a material impact on our results of operations, and we anticipate will require us to increase our allowance for credit losses.
The Financial Accounting Standards Board has adopted a new accounting standard that is effective for our fiscal year beginning on January 1, 2020. This standard, referred to as Current Expected Credit Loss, or (“CECL”), requires us to determine periodic estimates of lifetime expected credit losses on financial assets, and recognize the expected credit losses as allowances for credit losses. This changes the current method of providing allowances for credit losses that are probable, which we anticipate will require us to increase our allowance for credit losses and may introduce increased volatility in the level of our allowance for credit losses. A material increase in the level of our allowance for credit losses could adversely affect our capital levels, financial condition, and results of operations. Our CECL implementation initiative has increased the amount of data and assumptions we need to collect and review to determine the appropriate level of the allowance for credit losses. A significant amount of time and resources has been spent and will continue to be spent in order to implement CECL effectively, including the design and
16
implementation of related adequate internal controls, which may adversely affect our results of operations. If we are unable to maintain effective internal control over financial reporting relating to CECL, our ability to report our financial condition and results of operations accurately and on a timely basis could also be adversely affected.
The Corporation operates in a highly competitive industry and market, and our business will suffer if we are unable to compete effectively.
The Corporation faces substantial competition in all areas of its operations from a variety of different competitors, many of which are larger and may have more financial resources. Our competitors include banks, savings and loan associations, credit unions, finance companies, brokerage firms, insurance companies, factoring companies, financial technology companies, and other financial intermediaries. The financial services industry could become even more competitive as a result of legislative, regulatory, and technological changes and continued consolidation. Banks, securities firms, and insurance companies can merge under the umbrella of a financial holding company, which can offer virtually any type of financial service, including banking, securities underwriting, insurance (both agency and underwriting), and merchant banking. Also, technology has lowered barriers to entry and made it possible for non-banks to offer products and services traditionally provided by banks, such as automatic transfer and automatic payment systems. Many of the Corporation’s competitors have fewer regulatory constraints and may have lower cost structures. Additionally, due to their size, many competitors may be able to achieve economies of scale and, as a result, may offer a broader range of products and services as well as better pricing for those products and services than the Corporation can.
The Corporation’s ability to compete successfully depends on a number of factors, including, among other things:
|
•
|
the ability to develop, maintain and build upon long-term customer relationships based on top quality service, and safe, sound assets;
|
|
•
|
the ability to expand the Corporation's market position;
|
|
•
|
the scope, relevance and pricing of products and services offered to meet customer needs and demands;
|
|
•
|
the rate at which the Corporation introduces new products and services relative to its competitors;
|
|
•
|
customer satisfaction with the Corporation's level of service; and
|
|
•
|
industry and general economic trends.
|
Failure to perform in any of these areas could significantly weaken the Corporation's competitive position, which could adversely affect the Corporation's growth and profitability, which, in turn, could have a material adverse effect on the Corporation's financial condition and results of operations.
The Corporation has significant exposure to risks associated with commercial and commercial real estate loans.
As of December 31, 2019, approximately 60% of the Corporation’s loan portfolio consisted of commercial and commercial real estate loans. These loans are generally viewed as having more inherent risk of default than residential mortgage or consumer loans. The repayment of these loans often depends on the successful operation of a business. These loans are more likely to be adversely affected by weak conditions in the economy. Also, the commercial loan balance per borrower is typically larger than that of residential mortgage loans and consumer loans, indicating higher potential losses on an individual loan basis. The deterioration of one or a few of these loans could cause a significant increase in nonperforming loans and a reduction in interest income. An increase in nonperforming loans could result in an increase in the provision for loan losses and an increase in loan charge-offs, both of which could have a material adverse effect on the Corporation’s business, financial condition, and results of operations.
The Corporation’s accounting estimates and risk management processes rely on analytical and forecasting models, which, if inadequate, may result in a material adverse effect on our business, financial condition, or results of operation.
The processes the Corporation uses to estimate its loan losses and to measure the fair value of financial instruments, as well as the processes used to estimate the effects of changing interest rates and other market measures on the Corporation’s financial condition and results of operations, depend upon the use of analytical and forecasting models. These models reflect assumptions that may not be accurate, particularly in times of market stress or other unforeseen circumstances. Even if these assumptions are adequate, the models may prove to be inadequate or inaccurate because of other flaws in their design or their implementation. If the models the Corporation uses for interest rate risk and asset-liability management are inadequate, the Corporation may incur increased or unexpected losses upon changes in market interest rates or other market measures. If the models the Corporation uses for determining its probable loan losses are inadequate, the allowance for loan losses may not be sufficient to support future charge-offs. If the models the Corporation uses to measure the fair value of our financial instruments are inadequate, the fair value of our financial instruments may fluctuate unexpectedly or may not accurately reflect what the Corporation could realize
17
upon sale or settlement of our financial instruments. Any failure in the Corporation’s analytical or forecasting models could have a material adverse effect on the Corporation’s business, financial condition, and results of operations.
We are a community bank and our ability to maintain our reputation is critical to the success of our business.
The Corporation’s banking subsidiaries are community banks and their reputation is one of the most valuable components of our business. A key component of our business strategy is to rely on our reputation for customer service and knowledge of local markets to expand our presence by capturing new business opportunities from existing and prospective customers in our current market and contiguous areas. As such, we strive to conduct our business in a manner that enhances our reputation. This is done, in part, by recruiting, hiring, and retaining employees who share our core values of being an integral part of the communities we serve, delivering superior service to our customers, and caring about our customers and associates. If our reputation is negatively affected by the actions of our employees, by our inability to conduct our operations in a manner that is appealing to current or prospective customers, or otherwise, our business and, therefore, our operating results, may be materially adversely affected.
We are dependent on key personnel and the loss of one or more of those key personnel may materially and adversely affect our business.
Our success depends, in large part, on our ability to attract and retain key personnel. Key personnel that have regular direct contact with customers and clients often build strong relationships that are important to our business. In addition, we rely on key personnel to manage and operate our business, including major revenue producing functions, such as loan and deposit generation. Competition for qualified personnel in the financial services industry can be intense and we may not be able to hire or retain the key personnel that we depend upon for success. Frequently, we compete in the market for talent with entities that are not subject to comprehensive regulation. The unexpected loss of services of one or more of our key personnel could have a material adverse impact on our business because of their skills, knowledge of the markets in which we operate, years of industry experience, and the difficulty of promptly finding qualified replacement personnel. Also, the loss of key personnel could jeopardize our relationships with customers and clients and could lead to the loss of accounts. Losses of accounts managed by key personnel could have a material adverse impact on our business.
Our operational systems and networks are subject to an increasing risk of continually evolving cybersecurity or other technological risks, which could result in a loss of customer business, financial liability, regulatory penalties, damage to our reputation, or the disclosure of confidential information.
Information technology systems are critical to our business. We use various technology systems to manage our customer relationships, general ledger, securities, deposits, and loans. Additionally, as part of our business, we collect, process, and retain personal, proprietary, and confidential information regarding our customers.
The financial services industry has experienced an increase in both the number and severity of reported cyber-attacks aimed at gaining unauthorized access to bank systems as a way to misappropriate assets and sensitive information, corrupt and destroy data, or cause operational or business services disruptions. Any security breach could result in the misappropriation, loss, or unauthorized disclosure of sensitive customer information, severely damage our reputation, expose us to the risk of litigation and liability, disrupt our operations, and have a material adverse effect on our business.
We also rely on the integrity and security of a variety of third party processors and payment, clearing, and settlement systems, as well as the various participants involved in these systems, many of which have no direct relationship with us. Failure by these participants or their systems to protect our customers’ transaction data may put us at risk for possible losses due to fraud or operational disruption.
Our customers are also the target of cyber-attacks and identity theft. Large scale identity theft could result in customers’ accounts being compromised and fraudulent activities being performed in their name, which could negatively affect our reputation or result in litigation and, consequently, negatively affect our results of operation.
The occurrence of cybersecurity incidents across a range of industries has resulted in increased legislative and regulatory scrutiny over cybersecurity and calls for additional data privacy laws and regulations. These laws and regulations could result in increased operating expenses or increase our exposure to the risk of litigation.
The occurrence of a cybersecurity incident involving us, third party service providers, or our customers, regardless of its origin, could damage our reputation and result in a loss of customers and business and subject us to additional regulatory scrutiny, and could expose us to litigation and possible financial liability. Furthermore, we may be required to expend significant additional resources to modify our protective measures or to investigate and remediate vulnerabilities or other exposures arising from
18
operational and security risks. Any of these events could have a material adverse effect on our financial condition and results of operations.
We rely on external vendors, which could expose the Corporation to additional operational risks.
The Corporation relies on external vendors to provide products and services necessary to maintain day-to-day operations of the Corporation. Accordingly, the Corporation’s operations are exposed to risk that these vendors will not perform in accordance with the contracted arrangements under service level agreements. The failure of an external vendor to perform in accordance with the contracted arrangements under service level agreements, because of changes in the vendor’s organizational structure, financial condition, support for existing products and services, strategic focus, or for any other reason, could be disruptive to the Corporation’s operations, which could have a material adverse impact on the Corporation’s business and, in turn, the Corporation’s financial condition and results of operations.
New lines of business or new products and services may subject the Corporation to additional risks.
From time to time, the Corporation may implement new lines of business or offer new products and services within existing lines of business. There are substantial risks and uncertainties associated with these efforts, particularly in instances where the markets are not fully developed. In developing and marketing new lines of business and/or new products and services, the Corporation may invest significant time and resources. Initial timetables for the introduction and development of new lines of business and/or new products or services may not be achieved and price and profitability targets may not prove feasible. External factors, such as compliance with regulations, competitive alternatives, and shifting market preferences, may also impact the successful implementation of a new line of business or a new product or service. Furthermore, any new line of business and/or new product or service could have a significant impact on the effectiveness of the Corporation’s system of internal controls. Failure to successfully manage these risks in the development and implementation of new lines of business or new products or services could have a material adverse effect on the Corporation’s business, financial condition, and results of operations.
The financial services industry is characterized by rapid technological change, and if we fail to keep pace, our business may suffer.
The financial services industry is continually undergoing rapid technological change with frequent introductions of new technology-driven products and services. The effective use of technology increases efficiency and enables financial institutions to better serve customers and to reduce costs. The Corporation’s future success depends, in part, upon its ability to address customer needs by using technology to provide products and services that will satisfy customer demands, as well as to create additional efficiencies in the Corporation’s operations. The Corporation may not be able to effectively implement new technology-driven products and services or be successful in marketing these products and services to its customers. Further, many of our competitors have substantially greater resources to invest in technological improvements. Failure to successfully keep pace with technological change affecting the financial services industry could negatively affect the Corporation’s growth, revenue, and profit.
A lack of liquidity could affect our operations and jeopardize our financial condition.
The Corporation requires liquidity to meet our deposit and other obligations as they come due. The Corporation’s access to funding sources in amounts adequate to finance its activities or on terms that are acceptable to it could be impaired by factors that affect it specifically or the financial services industry or the general economy. Factors that could reduce its access to liquidity sources include a downturn in the markets in which our loans are concentrated or adverse regulatory actions against the Corporation. The Corporation’s access to deposits may also be affected by the liquidity needs of depositors. The Corporation may not be able to replace maturing deposits and advances as necessary in the future, especially if a large number of depositors sought to withdraw their deposits, regardless of the reason. A failure to maintain adequate liquidity could have a material adverse effect on the Corporation’s business, financial condition, and result of operations.
The Corporation’s controls and procedures may fail or be circumvented, and the Corporation’s methods of reducing risk exposure may not be effective.
The Corporation’s internal operations are subject to isks, including, but not limited to, data processing system failures and errors, customer or employee fraud, and catastrophic failures resulting from terrorist acts or natural disasters. We regularly review and update our internal controls, disclosure controls and procedures, and corporate governance policies and procedures. Any system of controls and any system to reduce risk exposure, however well designed and operated, is based in part on assumptions and can provide only reasonable, not absolute, assurances that the objectives of the system are met. Additionally, instruments, systems, and strategies used to hedge or otherwise manage exposure to various types of market compliance, credit, liquidity, operational,
19
and business risks and enterprise-wide risk could be less effective than anticipated. As a result, the Corporation may not be able to effectively mitigate its risk exposures in particular market environments or against particular types of risk.
The Corporation may be adversely affected by the soundness of other financial institutions.
Financial institutions are interrelated as a result of trading, clearing, counterparty, or other relationships. The Corporation has exposure to many different industries and counterparties, and routinely executes transactions with counterparties in the financial services industry, including commercial banks, brokers and dealers, investment banks, and other institutional clients. Many of these transactions expose the Corporation to credit risk in the event of a default by a counterparty or client. In addition, the Corporation’s credit risk may be exacerbated when the collateral held by the Corporation cannot be realized upon or is liquidated at prices not sufficient to recover the full amount of the credit or derivative exposure due to the Corporation. These losses could have a material adverse effect on the Corporation’s business, financial condition, and results of operations.
The Corporation may foreclose on collateral property and would be subject to the increased costs associated with ownership of real property, resulting in reduced revenues and earnings.
The Corporation forecloses on collateral property from time to time to protect its interests and thereafter owns and operates foreclosed property, in which case it is exposed to the risks inherent in the ownership of real estate. The amount that the Corporation, as a mortgagee, may realize after a default is dependent upon factors outside of its control, including, but not limited to: (i) general or local economic conditions; (ii) neighborhood values; (iii) interest rates; (iv) real estate tax rates; (v) operating expenses of the mortgaged properties; (vi) environmental remediation liabilities; (vii) ability to obtain and maintain adequate occupancy of the properties; (viii) zoning laws; (ix) governmental rules, regulations, and fiscal policies; and (x) natural disasters. Certain expenditures associated with the ownership of real estate, principally real estate taxes, insurance, and maintenance costs, may adversely affect the income from the real estate. Therefore, the cost of operating real property may exceed the income earned from the real property, and the Corporation may have to advance funds in order to protect its interests, or it may be required to dispose of the real property at a loss. These expenditures and costs could adversely affect the Corporation’s ability to generate revenues, resulting in reduced levels of profitability.
The Corporation’s earnings may be adversely impacted due to environmental liabilities associated with lending activities.
A significant portion of the Corporation’s loan portfolio is secured by real property. During the ordinary course of business, the Corporation may foreclose on and take title to properties securing loans which have defaulted. In doing so, there is a risk that hazardous or toxic substances could be found on these properties. If hazardous or toxic substances are found, the Corporation may be liable for remediation costs, as well as for personal injury and property damage. Environmental laws may require the Corporation to incur substantial expenses and may materially reduce the affected property’s value or limit the Corporation’s ability to use or sell the affected property. In addition, future laws or more stringent interpretations or enforcement policies with respect to existing laws may increase the Corporation’s exposure to environmental liability. Environmental reviews of real property before initiating foreclosure actions may not be sufficient to detect all potential environmental hazards. The remediation costs and any other financial liabilities associated with an environmental hazard could have a material adverse effect on the Corporation’s business, financial condition, and results of operations.
The Corporation may become subject to claims and litigation pertaining to intellectual property.
Banking and other financial services companies, such as the Corporation, rely on technology companies to provide information technology products and services necessary to support the Corporation’s day-to-day operations. Technology companies frequently enter into litigation based on allegations of patent infringement or other violations of intellectual property rights. In addition, patent holding companies seek to monetize patents they have purchased or otherwise obtained. Competitors of the Corporation’s vendors, or other individuals or companies, may claim to hold intellectual property sold or licensed to the Corporation by its vendors. Intellectual property claims may increase in the future as the financial services sector becomes more reliant on information technology vendors. The plaintiffs in these actions frequently seek injunctions and substantial damages.
Regardless of the scope or validity of alleged patents or other intellectual property rights, or the merits of any claims by potential or actual litigants, the Corporation may have to engage in protracted litigation, which may be expensive, time-consuming, disruptive to the Corporation’s operations, and distracting to management. If the Corporation is found to infringe upon one or more patents or other intellectual property rights, it may be required to pay substantial damages or royalties to a third-party. The Corporation may also consider entering into licensing agreements for disputed intellectual property, however, these license agreements may also significantly increase the Corporation’s operating expenses. If legal matters related to intellectual property claims were resolved against the Corporation or settled, the Corporation could be required to make payments in amounts that could have a material adverse effect on its business, financial condition, and results of operations.
20
Changes in consumer use of banks and changes in consumer spending and savings habits could adversely affect the Corporation’s financial results.
Technology and other changes now allow many customers to complete financial transactions without using banks. For example, consumers can pay bills and transfer funds directly without going through a bank. This process of eliminating banks as intermediaries could result in the loss of fee income, as well as the loss of customer deposits and income generated from those deposits. In addition, changes in consumer spending and savings habits could adversely affect the Corporation’s operations, and the Corporation may be unable to timely develop competitive new products and services in response to these changes.
Potential acquisitions may disrupt the Corporation’s business and dilute shareholder value.
The Corporation generally seeks merger or acquisition partners that are culturally similar and have experienced management and possess either significant market presence or have potential for improved profitability through financial management, economies of scale, or expanded services. Acquiring other banks, businesses, or branches involves various risks commonly associated with acquisitions, including, among other things:
|
•
|
the time and costs associated with identifying and evaluating potential new markets, hiring experienced local management, and opening new offices, and the time lags between these activities and the generation of sufficient assets and deposits to support the costs of the expansion;
|
|
•
|
the time and costs associated with identifying potential acquisition and merger targets;
|
|
•
|
the accuracy of the estimates and judgments used to evaluate credit, operations, management, and market risks with respect to a target company;
|
|
•
|
the diversion of our management’s attention to the negotiation of a transaction, and the integration of the operations and personnel of the combined businesses;
|
|
•
|
our ability to finance an acquisition and possible dilution to our existing shareholders;
|
|
•
|
closing delays and expenses related to the resolution of lawsuits filed by shareholders of targets;
|
|
•
|
entry into new markets where we lack experience;
|
|
•
|
introduction of new products and services into our business;
|
|
•
|
potential exposure to unknown or contingent liabilities of the target company;
|
|
•
|
exposure to potential asset quality issues of the target company;
|
|
•
|
the risk of loss of key employees and customers; and
|
|
•
|
incurrence and possible impairment of goodwill associated with an acquisition and possible adverse short-term effects on our results of operations.
|
Acquisitions typically involve the payment of a premium over book and market values and, therefore, some dilution of the Corporation’s tangible book value and net income per common share may occur in connection with any future transaction. Furthermore, failure to realize the expected revenue increases, cost savings, increases in geographic or product presence, and/or other projected benefits from an acquisition could have a material adverse effect on the Corporation’s business, financial condition, and results of operations.
Difficulties in combining the operations of acquired entities with our operations may prevent us from achieving the expected benefits from acquisitions.
We may not be able to fully achieve the strategic objectives and operating efficiencies expected in an acquisition, including our acquisition of HopFed Bancorp, Inc. and its banking subsidiary, Heritage Bank USA, Inc., in July 2019. Inherent uncertainties exist in integrating the operations of an acquired entity. We may lose customers and/or key personnel and incur disruption of ongoing business as a result of an acquisition. We may experience greater than expected costs or difficulties relating to the integration of operations and may not realize expected cost savings within the expected time frame, if at all. If integration is unsuccessful or does not occur in the manner anticipated by management it could have a material adverse effect on our business, financial condition, and results of operations.
Future growth or operating results may require the Corporation to raise additional capital, but that capital may not be available or it may be dilutive.
The Corporation is required by federal and state regulatory authorities to maintain adequate levels of capital to support its operations. To the extent the Corporation’s future operating results erode capital or the Corporation elects to expand through loan growth or acquisition it may be required to raise capital. The Corporation’s ability to raise capital will depend on conditions in the capital markets, which are outside of its control, and on the Corporation’s financial performance. Accordingly, the Corporation
21
may not be able to raise capital when needed or on favorable terms. If the Corporation cannot raise additional capital when needed, it will be subject to increased regulatory supervision and the imposition of restrictions on its growth and business. These restrictions could negatively impact the Corporation’s ability to operate or further expand its operations through acquisitions or the establishment of additional branches and may result in increases in operating expenses and reductions in revenues that could have a material adverse effect on its financial condition and results of operations.
The value of the Corporation’s goodwill and other intangible assets may decline in the future.
As of December 31, 2019, the Corporation had $89 million of goodwill and other intangible assets. A significant decline in the Corporation’s expected future cash flows, a significant adverse change in the business climate, slower growth rates, or a significant and sustained decline in the price of the Corporation’s common stock may necessitate taking charges in the future related to the impairment of the Corporation’s goodwill and other intangible assets. If the Corporation were to conclude that a future write-down of goodwill and other intangible assets is necessary, the Corporation would record the appropriate charge, which could have a material adverse effect on the Corporation’s business, financial condition, and results of operations.
The Corporation relies on dividends from its subsidiaries for most of its revenue.
The Corporation is a separate and distinct legal entity from its subsidiaries. It receives substantially all of its revenue from dividends from its subsidiaries. These dividends are the principal source of funds to pay dividends on the Corporation’s common stock and interest and principal on the Corporation’s debt. Various federal and state laws and regulations limit the amount of dividends that the Bank and the Morris Plan may pay to the Corporation. Also, the Corporation’s right to participate in a distribution of assets upon a subsidiary’s liquidation or reorganization is subject to the prior claims of the subsidiary’s creditors. In the event the Bank and/or the Morris Plan are unable to pay dividends to the Corporation, the Corporation may not be able to service debt, pay obligations, or pay dividends on the Corporation’s common stock. The inability to receive dividends from the Bank and/or the Morris Plan could have a material adverse effect on the Corporation’s business, financial condition, and results of operations.
Risks Related to the Legal and Regulatory Environment
We operate in a highly regulated environment and the regulatory framework to which we are subject may adversely affect our results of operations.
The Corporation, the Bank, and the Morris Plan operate in a highly regulated environment and we are subject to extensive regulation, supervision, and examination by the Federal Reserve, the OCC, and the FDIC and DFI, respectively. Banking regulations are primarily intended to protect depositors’ funds, federal deposit insurance funds, and the banking system as a whole, not our shareholders. Further, as a bank holding company, we are required to act as a source of financial and managerial strength to the Bank and the Morris Plan and to commit resources to support our subsidiary banks if needed. This regulatory framework affects our lending practices, capital structure, investment practices, and growth, among other things.
If, as a result of an examination, a banking regulatory were to determine that our financial condition, capital resources, asset quality, earnings prospects, management, liquidity, or other aspects of any of our operations had become unsatisfactory, or that we were in violation of any law or regulation, they may take a number of different remedial actions as they deem appropriate. These actions include the power to enjoin “unsafe or unsound” practices, to require affirmative action to correct any conditions resulting from any violation or practice, to issue an administrative order that can be judicially enforced, to direct an increase in our capital, to restrict our growth, to assess civil money penalties, to fine or remove officers and directors, and, if it is concluded that these conditions cannot be corrected or there is an imminent risk of loss to depositors, to terminate our deposit insurance and place us into receivership or conservatorship. Any regulatory action against us or failure to comply with applicable laws and regulations could have an adverse effect on our reputation, business, financial condition, and results of operations.
Legislative and regulatory actions taken now or in the future may increase our costs and impact our business, regulatory structure, financial condition, and/or results of operations.
Since the 2007-2008 financial crisis, federal and state banking laws and regulations, as well as interpretations and implementations of these laws and regulations, have undergone substantial review and change. In particular, the Dodd-Frank Act drastically revised the laws and regulations under which we operate. Financial institutions generally have also been subjected to increased scrutiny from regulatory authorities. These changes and increased scrutiny may result in increased costs of doing business, decreased revenues and net income, may reduce our ability to effectively compete to attract and retain customers, or make it less attractive for us to continue providing certain products and services. Any future changes in federal and state law and regulations, as well as the interpretations and implementations of federal and state laws and regulations, could affect us in substantial and unpredictable ways, including those listed above, impact the regulatory structure under which we operate, significantly increase our costs,
22
impede the efficiency of our internal business processes, require us to increase our regulatory capital and modify our business strategy, limit our ability to pursue business opportunities in an efficient manner, or other ways that could have a material adverse effect on our business, financial condition, or results of operations. These changes also may require us to invest significant management attention and resources to make any necessary changes to operations to comply and could have an adverse effect on our business, financial condition, and results of operations.
The Basel III capital rules may require us to retain higher capital levels, impacting our ability to pay dividends, repurchase our stock, or pay discretionary bonuses.
The Federal Reserve, the FDIC, and the OCC adopted final rules for the Basel III capital framework which became effective on January 1, 2015. These rules substantially amended the regulatory risk-based capital rules formerly applicable to the Corporation and its banking subsidiaries. The rules have been phased in over time beginning in 2015 and became fully phased-in in 2019. The rules provide for minimum capital ratios of (i) common equity Tier 1 risk-weighted capital ratio of 4.5%, (ii) Tier 1 risk-based capital ratio of 6%, and (iii) total risk-based capital ratio of 8%. As fully phased in, the rules also require a capital conservation buffer of 2.5% on top of the foregoing minimum capital ratios, resulting in an effective requirement for minimum capital ratios of (a) common equity Tier 1 risk-weighted capital ratio of 7%, (b) Tier 1 risk-based capital ratio of 8.5%, and (c) total risk-based capital ratio of 10.5%. Failure to satisfy any of these three capital requirements will result in limits on paying dividends, engaging in share repurchases, and paying discretionary bonuses. These limitations establish a maximum percentage of eligible retained income that could be utilized for these actions.
We face a risk of noncompliance and enforcement action with the Bank Secrecy Act and other anti-money laundering statutes and regulations.
The Bank Secrecy Act, the USA Patriot Act, and other laws and regulations require financial institutions, among other duties, to institute and maintain an effective anti-money laundering program and file suspicious activity and currency transaction reports as appropriate. The Federal Financial Crimes Enforcement Network is authorized to impose significant civil money penalties for violations of those requirements and has engaged in coordinated enforcement efforts with the other federal agencies, including federal banking regulators. We are also subject to increased scrutiny of compliance with the rules enforced by the U.S. Department of the Treasury’s Office of Foreign Assets Control. If our policies, procedures and systems are deemed deficient, we could be subject to liability, including fines and regulatory actions, which may include restrictions on our ability to pay dividends and the necessity to obtain regulatory approvals to proceed with certain aspects of our business plan, including any acquisitions we desire to make. We could also incur increased costs and expenses to improve our anti-money laundering procedures and systems to comply with any regulatory requirements or actions. Failure to maintain and implement adequate programs to combat money laundering and terrorist financing could also have serious reputational consequences for us. Any of these results could have a material adverse effect on our business, financial condition, results of operations, and future prospects.
Higher FDIC deposit insurance premiums and assessments could adversely affect our financial condition.
FDIC insurance premiums we pay may change and be significantly higher in the future. Market developments may significantly deplete the insurance fund of the FDIC and further reduce the ratio of reserves to insured deposits, thereby making it requisite upon the FDIC to charge higher premiums prospectively.
Risks Related to the Corporation’s Common Stock
The Corporation may not be able to pay dividends in the future in accordance with past practice.
The Corporation has historically paid a semi-annual dividend to common shareholders. The payment of dividends is subject to legal and regulatory restrictions. Any payment of dividends in the future will depend, in large part, on the Corporation’s earnings, capital requirements, financial condition and other factors considered relevant by the Corporation’s Board of Directors.
The price of the Corporation’s common stock may be volatile, which may result in losses for investors.
General market price declines or market volatility in the future could adversely affect the price of the Corporation’s common stock and may make it more difficult for shareholders to resell their common stock when they want and at prices they find attractive. The Corporation’s common stock price can fluctuate significantly in response to a variety of factors, including:
|
•
|
announcements and news reports relating to the Corporation’s business and trends, concerns, and other issues in the financial services industry generally;
|
|
•
|
fluctuations in the Corporation’s results of operations;
|
23
|
•
|
sales or purchases of substantial amounts of the Corporation’s securities in the marketplace;
|
|
•
|
a shortfall or excess in revenues or earnings compared to securities analysts’ expectations;
|
|
•
|
changes in analysts’ recommendations or projections;
|
|
•
|
actual or expected economic conditions that are perceived to affect the Corporation, such as changes in real estate values or interest rates;
|
|
•
|
perceptions in the marketplace regarding the Corporation and/or our competitors;
|
|
•
|
new technology used, or services offered, by competitors;
|
|
•
|
changes in applicable government regulation; and
|
|
•
|
the Corporation’s announcement of new acquisitions or other projects.
|
As such, the market price of the Corporation’s common stock may not accurately reflect the underlying value of the stock, and investors should consider this before relying on the market prices of the Corporation’s common stock when making an investment decision.
Future capital needs could result in dilution of shareholder investment.
Our board of directors may determine from time to time there is a need to or, if our or the Bank’s or the Morris Plan’s regulatory capital ratios fall below the required minimums, we could be forced to raise additional capital through the issuance of additional shares of stock or other securities, including debt securities and senior or subordinated notes. We are currently authorized to issue up to 40 million shares of common stock, of which 13.7 million shares were outstanding as of December 31, 2019, and up to 10 million shares of preferred stock, of which no shares are outstanding. Subject to certain limitations, our board of directors generally has authority, without action or vote of our shareholders, to issue all or part of the remaining authorized but unissued shares and to establish the rights, preferences, and privileges of any class or series of preferred stock. These equity and/or debt issuances could dilute the ownership interest of our shareholders and may dilute the per share book value of our common stock. New investors also may have rights, preferences, and privileges senior to our shareholders which may adversely impact our shareholders.
Anti-takeover laws and charter provisions may adversely affect the value of our common stock.
Provisions of state and federal law and our articles of incorporation may make it more difficult for someone to acquire control of the Corporation. Under federal law, subject to certain exemptions, a person, entity, or group must notify the federal banking agencies before acquiring 10% or more of the outstanding voting stock of a bank holding company, including the Corporation’s common stock. There also are Indiana statutory provisions and provisions in our articles of incorporation that may be used to delay or block a takeover attempt. As a result, these statutory provisions and provisions in our articles of incorporation could result in the Corporation being less attractive to a potential acquiror.
An investment in the Corporation’s common stock is not an insured deposit.
The Corporation’s common stock is not a bank deposit and, therefore, is not insured against loss by the FDIC, any other deposit insurance fund or by any other public or private entity. Investment in the Corporation’s common stock is inherently risky for the reasons described in this “Risk Factors” section and elsewhere in this report and is subject to the same market forces that affect the price of common stock in any company. As a result, if you acquire the Corporation’s common stock, you could lose some or all of your investment.
|
ITEM 1B.
|
UNRESOLVED STAFF COMMENTS
|
None.
|
ITEM 2.
|
PROPERTIES
|
The Corporation is located in a four-story office building in downtown Terre Haute, Indiana that was first occupied in June 1988. It is leased to the Bank. The Bank also owns two other facilities in downtown Terre Haute. One is available for lease and the other is a 50,000-square-foot building housing operations and administrative staff and equipment. In addition, the Bank holds in fee six other branch buildings. One of the branch buildings is a single-story 36,000-square-foot building which is located in a Terre Haute suburban area. Three other branch bank buildings are leased by the Bank. The expiration dates on the leases are May 31, 2023, February 14, 2021, and May 31, 2020.
Facilities of the Corporation’s banking centers in Clay County include two offices in Brazil, Indiana and an office in Clay City, Indiana. All three buildings are held in fee.
24
Facilities of the Corporation’s banking center in Daviess County include an office in Washington, Indiana. This building is held in fee.
Facilities of the Corporation’s banking center in Greene County include an office in Worthington, Indiana. This building is held in fee.
Facilities of the Corporation’s banking centers in Knox County include two offices in Vincennes, Indiana. Both buildings are held in fee.
Facilities of the Corporation’s banking centers in Parke County include two offices in Rockville, Indiana and offices in Marshall and Montezuma, Indiana. All four buildings are held in fee.
Facilities of the Corporation’s banking center in Putnam County include an office in Greencastle, Indiana. This building is held in fee.
Facilities of the Corporation’s banking centers in Sullivan County include offices in Sullivan, Dugger, Farmersburg and Hymera, Indiana. All four buildings are held in fee.
Facilities of the Corporation’s banking center in Vanderburgh County include an office in Evansville, Indiana. This building is held in fee.
Facilities of the Corporation’s banking centers in Vermillion County include two offices in Clinton, Indiana and offices in Cayuga and Newport, Indiana. All four buildings are held in fee.
Facilities of the Corporation’s banking center in Champaign County include two offices in Champaign, Illinois, an office in Mahomet, Illinois, and an office in Urbana, Illinois. One of the banking centers in Champaign is held in fee while the land is leased. The land lease expires September 6, 2036. One of the banking centers in Champaign is leased and the lease expires on December 31, 2022. The banking center in Mahomet is leased and the lease expires on June 4, 2024. The banking center in Urbana is held in fee.
Facilities of the Corporation’s banking center in Clark County include an office in Marshall, Illinois. This building is held in fee.
Facilities of the Corporation’s banking centers in Coles County include two offices in Charleston, Illinois and an office in Mattoon, Illinois. These buildings are held in fee.
Facilities of the Corporation’s banking centers in Crawford County include its main office and a drive-up facility in Robinson, Illinois. Both buildings are held in fee.
Facilities of the Corporation’s banking centers in Franklin County include an office in Benton, Illinois and an office in West Frankfort, Illinois. Both buildings are held in fee.
Facilities of the Corporation’s banking center in Jasper County include an office in Newton, Illinois. This building is held in fee.
Facilities of the Corporation’s banking centers in Jefferson County include an office and a drive-up facility in Mt. Vernon, Illinois. Both buildings are held in fee.
Facilities of the Corporation’s banking center in Lawrence County include an office in Lawrenceville, Illinois. This building is held in fee.
Facilities of the Corporation’s banking centers in Livingston include two offices in Pontiac, Illinois. Both buildings are held in fee.
Facilities of the Corporation’s banking centers in Marion County include an office and a drive-up facility in Salem, Illinois. Both buildings are held in fee.
Facilities of the Corporation’s banking center in McLean County include two offices in Bloomington, Illinois, and an office in Gridley, Illinois. A banking center in Bloomington is leased and the lease expires on June 30, 2021. The other buildings are held in fee.
25
Facilities of the Corporation’s banking centers in Richland County include two offices in Olney, Illinois. One building is held in fee and the other building is leased. The expiration date on the lease is February 28, 2020.
Facilities of the Corporation’s banking center in Vermilion County include four offices in Danville, Illinois, an office in Westville, Illinois, and an office in Ridge Farm, Illinois. One of the buildings in Danville is leased and the lease expires on December 31, 2023 and the other five buildings are held in fee.
Facilities of the Corporation’s banking center in Wayne County include an office in Fairfield, Illinois. This building is held in fee.
Facilities of the Corporation's banking center in Calloway County include two offices in Murray, Kentucky. The buildings are held in fee.
Facilities of the Corporation's banking center in Christian County include three offices in Hopkinsville, Kentucky. The buildings are held in fee.
Facilities of the Corporation's banking center in Fulton County include two offices in Fulton, Kentucky. The buildings are held in fee.
Facilities of the Corporation's banking center in Marshall County include an office in Benton, Kentucky, and an office in Calvert City, Kentucky. The buildings are held in fee.
Facilities of the Corporation's banking center in Todd County include an office in Elkton, Kentucky. The building is held in fee.
Facilities of the Corporation's banking center in Trigg County include an office in Cadiz, Kentucky. The building is held in fee.
Facilities of the Corporation's banking center in Cheatham County include an office in Ashland City, Tennessee, an office in Kingston Springs, Tennessee, and an office in Pleasant View, Tennessee. The buildings are held in fee.
Facilities of the Corporation's banking center in Houston County include an office in Erin, Tennessee. The building is held in fee.
Facilities of the Corporation's banking center in Montgomery County include three offices in Clarksville, Tennessee. The buildings are held in fee.
Facilities of the Corporation's loan production offices, include an office in Indianapolis, Indiana, an office in Murfreesboro, Tennessee, and an office in Brentwood, Tennessee. The loan production offices are leased by the Bank. The expiration dates on the leases are February 29, 2020, May 18, 2020, and April 15, 2021.
The facility of the Corporation’s subsidiary, The Morris Plan Company, includes an office facility in Terre Haute, Indiana. The building is leased by The Morris Plan Company. The expiration date on the lease is October 31, 2020.
The facility of the Corporation’s subsidiary, First Chanticleer Corporation, includes an office building in Terre Haute, Indiana. The building is held in fee by First Chanticleer Corporation.
Facilities of the Corporation’s subsidiary, FFB Risk Management Co., Inc., include an office facility in Las Vegas, Nevada. This office facility is leased.
|
ITEM 3.
|
LEGAL PROCEEDINGS
|
(a) There are no material pending legal proceedings to which the Corporation or its subsidiaries is a party or of which any of their property is the subject, other than ordinary routine litigation incidental to its business.
(b) Not applicable.
26
|
ITEM 4.
|
MINE SAFETY DISCLOSURES
|
Not applicable.
PART II
|
ITEM 5.
|
MARKET FOR REGISTRANT’S COMMON EQUITY, RELATED STOCKHOLDER MATTERS AND ISSUER PURCHASES OF EQUITY SECURITIES.
|
MARKET AND DIVIDEND INFORMATION
(a) As of March 1,
2020
shareholders owned
13,753,790
shares of the Corporation's common stock. The stock is traded on the NASDAQ Global Select Market under the symbol “THFF”. On March 1,
2020
, approximately 6,357 shareholders of record held our common stock.
Historically, the Corporation has paid cash dividends semi-annually and currently expects that comparable cash dividends will continue to be paid in the future. The following table gives quarterly high and low trade prices and dividends per share during each quarter for
2019
and
2018
.
|
|
2019
|
2018
|
||||||||||||||||||||||
|
|
|
|
Cash
|
|
|
Cash
|
||||||||||||||||||
|
|
Trade Price
|
Dividends
|
Trade Price
|
Dividends
|
||||||||||||||||||||
|
Quarter ended
|
High
|
Low
|
Declared
|
High
|
Low
|
Declared
|
||||||||||||||||||
|
March 31
|
$
|
44.60
|
|
$
|
38.24
|
|
|
|
$
|
47.70
|
|
$
|
41.60
|
|
|
|
||||||||
|
June 30
|
$
|
42.72
|
|
$
|
37.83
|
|
$
|
0.52
|
|
$
|
46.25
|
|
$
|
41.35
|
|
$
|
0.51
|
|
||||||
|
September 30
|
$
|
44.52
|
|
$
|
38.70
|
|
|
|
$
|
52.45
|
|
$
|
45.35
|
|
|
|
||||||||
|
December 31
|
$
|
46.40
|
|
$
|
41.73
|
|
$
|
0.52
|
|
$
|
52.26
|
|
$
|
38.60
|
|
$
|
0.51
|
|
||||||
27
The graph below represents the five-year total return of the Corporation’s stock. The five year total return for our stock during this time was 50.07%. During this same period, the return on The Russell 2000 Index was 48.49% and the SNL Index of Banks $1 - $5 Billion had a return of 82.85%.
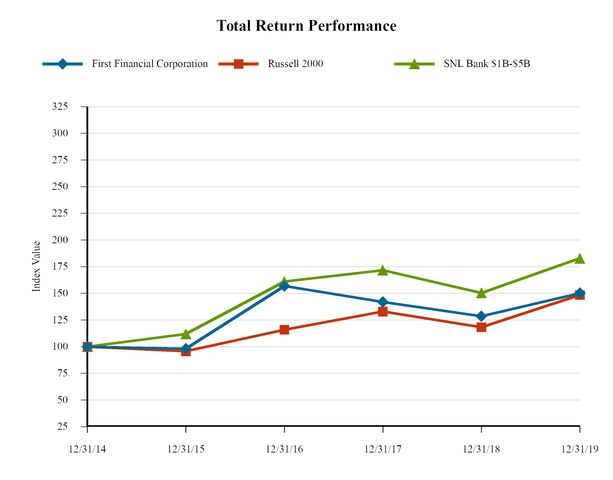
|
|
|
Period Ending
|
|
|||||||||||||||
|
Index
|
12/31/2014
|
|
12/31/2015
|
|
12/31/2016
|
|
12/31/2017
|
|
12/31/2018
|
|
12/31/2019
|
|
||||||
|
First Financial Corporation
|
100.00
|
|
98.13
|
|
156.88
|
|
141.90
|
|
128.51
|
|
150.07
|
|
||||||
|
Russell 2000
|
100.00
|
|
95.59
|
|
115.95
|
|
132.94
|
|
118.30
|
|
148.49
|
|
||||||
|
SNL Bank $1B-$5B
|
100.00
|
|
111.94
|
|
161.04
|
|
171.69
|
|
150.42
|
|
182.85
|
|
||||||
(b) Not applicable.
(c) The Corporation periodically acquires shares of its common stock directly from shareholders in individually negotiated transactions. On August 25, 2014 First Financial Corporation issued a press release announcing that it's Board of Directors has authorized a stock repurchase program pursuant to which up to 5% of the Corporation's outstanding shares of common stock, or 667,700 shares may be repurchased. There were 257,989 purchases of common stock by the Corporation during the year ended December 31, 2015. On February 3, 2016 First Financial Corporation issued a press release announcing that its Board of Directors has authorized a stock repurchase program pursuant to which up to 5% of the Corporation's outstanding shares of common stock, or 637,500 shares may be repurchased. There were
7,866
and
8,639
purchases of common stock by the Corporation during the years ended
December 31, 2019
and
December 31, 2018
. The Corporation contributed
28,470
shares of treasury stock to the ESOP in November of
2019
. There were no shares of common stock purchased by the Corporation during the fourth quarter of the fiscal year covered by this report.
28
|
ITEM 6.
|
SELECTED FINANCIAL DATA
|
FIVE YEAR COMPARISON OF SELECTED FINANCIAL DATA
|
(Dollar amounts in thousands, except per share amounts)
|
2019
|
2018
|
2017
|
2016
|
2015
|
|||||||||||||||
|
BALANCE SHEET DATA
|
|
|
|
|
|
|
|
|
|
|
||||||||||
|
Total assets
|
$
|
4,023,250
|
|
$
|
3,008,718
|
|
$
|
3,000,668
|
|
$
|
2,988,527
|
|
$
|
2,979,585
|
|
|||||
|
Securities
|
926,717
|
|
784,916
|
|
814,931
|
|
853,725
|
|
891,082
|
|
||||||||||
|
Loans
|
2,656,390
|
|
1,953,988
|
|
1,906,761
|
|
1,839,180
|
|
1,763,808
|
|
||||||||||
|
Deposits
|
3,275,357
|
|
2,436,727
|
|
2,458,653
|
|
2,428,526
|
|
2,442,369
|
|
||||||||||
|
Borrowings
|
111,092
|
|
69,656
|
|
57,686
|
|
81,121
|
|
46,508
|
|
||||||||||
|
Shareholders’ equity
|
557,608
|
|
442,701
|
|
413,569
|
|
414,395
|
|
410,316
|
|
||||||||||
|
INCOME STATEMENT DATA
|
|
|
|
|
|
|
|
|
|
|
||||||||||
|
Interest income
|
149,121
|
|
126,224
|
|
114,195
|
|
109,380
|
|
108,676
|
|
||||||||||
|
Interest expense
|
17,469
|
|
9,645
|
|
6,338
|
|
4,407
|
|
4,169
|
|
||||||||||
|
Net interest income
|
131,652
|
|
116,579
|
|
107,857
|
|
104,973
|
|
104,507
|
|
||||||||||
|
Provision for loan losses
|
4,700
|
|
5,768
|
|
5,295
|
|
3,300
|
|
4,700
|
|
||||||||||
|
Other income
|
38,452
|
|
38,206
|
|
35,938
|
|
46,931
|
|
39,179
|
|
||||||||||
|
Other expenses
|
104,405
|
|
91,289
|
|
88,747
|
|
90,308
|
|
98,398
|
|
||||||||||
|
Net income
|
48,872
|
|
46,583
|
|
29,131
|
|
38,413
|
|
30,196
|
|
||||||||||
|
PER SHARE DATA:
|
|
|
|
|
|
|
|
|
|
|
||||||||||
|
Net Income
|
3.80
|
|
3.80
|
|
2.38
|
|
3.12
|
|
2.35
|
|
||||||||||
|
Cash dividends
|
1.03
|
|
1.02
|
|
2.51
|
|
1.00
|
|
0.98
|
|
||||||||||
|
PERFORMANCE RATIOS:
|
|
|
|
|
|
|
|
|
|
|
||||||||||
|
Return on average assets
|
1.42
|
%
|
1.57
|
%
|
0.98
|
%
|
1.30
|
%
|
1.01
|
%
|
||||||||||
|
Return on average shareholders’ equity
|
9.83
|
|
10.98
|
|
6.69
|
|
9.26
|
|
7.46
|
|
||||||||||
|
Average total capital to average assets
|
15.05
|
|
14.93
|
|
15.24
|
|
14.67
|
|
14.26
|
|
||||||||||
|
Average shareholders’ equity to average assets
|
14.46
|
|
14.25
|
|
14.58
|
|
14.01
|
|
13.60
|
|
||||||||||
|
Dividend payout
|
27.69
|
|
26.85
|
|
105.32
|
|
31.81
|
|
41.51
|
|
||||||||||
|
ITEM 7.
|
MANAGEMENT’S DISCUSSION AND ANALYSIS OF FINANCIAL CONDITION AND RESULTS OF OPERATION
|
CRITICAL ACCOUNTING POLICIES AND ESTIMATES
The Management's Discussion and Analysis of Financial Condition and Results of Operations, as well as disclosures found elsewhere in this report are based upon First Financial Corporation's consolidated financial statements, which have been prepared in accordance with accounting principles generally accepted in the United States of America. The preparation of these financial statements requires the Corporation to make estimates and judgments that affect the reported amounts of assets, liabilities, revenues, and expenses. Material estimates that are particularly susceptible to significant change in the near term relate to the determination of the allowance for loan losses, securities valuation and goodwill. Actual results could differ from those estimates.
Allowance for loan losses.
The allowance for loan losses represents management's estimate of probable incurred losses in the existing loan portfolio. The allowance for loan losses is increased by the provision for loan losses charged to expense and reduced by loans charged off, net of recoveries. The allowance for loan losses is determined based on management's assessment of several factors: reviews and evaluations of specific loans, changes in the nature and volume of the loan portfolio, current economic conditions and nonperforming loans. Loans are considered impaired if, based on current information and events, it is probable that the Corporation will be unable to collect the scheduled payments of principal or interest according to the contractual terms of the loan agreement. When a loan is deemed impaired, impairment is measured by using the fair value of underlying collateral, for loans deemed to be collateral dependent, the present value of the future cash flows discounted at the effective interest rate stipulated in the loan agreement, or the estimated market value of the loan. In measuring the fair value of the collateral, management uses assumptions (e.g., discount rate) and methodologies (e.g., comparison to the recent selling price of similar assets) consistent with those that would be utilized by unrelated third parties.
Changes in the financial condition of individual borrowers, economic conditions, historical loss experience, or the condition of the various markets in which collateral may be sold may affect the required level of the allowance for loan losses and the associated provision for loan losses. Should cash flow assumptions or market conditions change, a different amount may be recorded for the allowance for loan losses and the associated provision for loan losses.
29
Securities valuation and potential impairment.
Securities available-for-sale are carried at fair value, with unrealized holding gains and losses reported separately in accumulated other comprehensive income (loss), net of tax. The Corporation obtains market values from a third party on a monthly basis in order to adjust the securities to fair value. Equity securities that do not have readily determinable fair values are carried at cost. Additionally, all securities are required to be evaluated for other than temporary impairment (OTTI). In determining whether a fair value decline is other than temporary, management considers the reason for the decline, the extent of the decline, the duration of the decline and whether the Corporation intends to sell a security or is more likely than not to be required to sell a security before recovery of its amortized cost. If an entity intends to sell or it is more likely than not it will be required to sell the security before recovery of its amortized cost basis, the OTTI shall be recognized in earnings equal to the entire difference between the investment's amortized cost basis and its fair value at the balance sheet date. If an entity does not intend to sell the security and it is not more likely than not that the entity will be required to sell the security before recovery of its amortized cost basis less any current-period loss, the OTTI shall be separated into the amount representing the credit loss and the amount related to all other factors. The amount of the total OTTI related to the credit loss is determined based on the present value of cash flows expected to be collected and is recognized in earnings.
Changes in credit ratings, financial condition of underlying debtors, default experience and market liquidity affect the conclusions on whether securities are other-than-temporarily impaired. Additional losses may be recorded through earnings for other than temporary impairment, should there be an adverse change in the expected cash flows for these investments.
Goodwill
. The carrying value of goodwill requires management to use estimates and assumptions about the fair value of the reporting unit compared to its book value. An impairment analysis is prepared on an annual basis. Fair values of the reporting units are determined by an analysis which considers cash flows streams, profitability and estimated market values of the reporting unit. The majority of the Corporation's goodwill is recorded at First Financial Bank, N. A.
Management believes the accounting estimates related to the allowance for loan losses, valuation of investment securities and the valuation of goodwill are "critical accounting estimates" because: (1) the estimates are highly susceptible to change from period to period because they require management to make assumptions concerning, among other factors, the changes in the types and volumes of the portfolios, valuation assumptions, and economic conditions, and (2) the impact of recognizing an impairment or loan loss could have a material effect on the Corporation's assets reported on the balance sheet as well as net income.
RESULTS OF OPERATIONS - SUMMARY FOR
2019
COMPARISON OF
2019
TO
2018
Net income for
2019
was $
48.9 million
, or
$3.80
per share versus $
46.6 million
, or
$3.80
per share for
2018
. The increase in 2019 net income results from the acquisition of HopFed, Inc. 2018 net income includes the recovery of a security previously written down for other-than temporary impairment, which contributed $2.4 million pre-tax to interest income and $4.5 million pre-tax to other income. Return on average assets at
December 31, 2019
decreased 9.55% to
1.42%
compared to
1.57%
at
December 31, 2018
.
The primary components of income and expense affecting net income are discussed in the following analysis.
NET INTEREST INCOME
The principal source of the Corporation's earnings is net interest income, which represents the difference between interest earned on loans and investments and the interest cost associated with deposits and other sources of funding. Net interest income increased in
2019
to $
131.7 million
compared to $
116.6 million
in
2018
. Total average interest earning assets increased to
$3.20 billion
in
2019
from
$2.79 billion
in
2018
. The tax-equivalent yield on these assets increased to
4.79%
in
2019
from
4.67%
in
2018
. Total average interest-bearing liabilities increased to
$2.59 billion
in
2019
from
$2.07 billion
in
2018
. The average cost of these interest-bearing liabilities increased to
0.67%
in
2019
from
0.47%
in
2018
.
The net interest margin decreased from
4.32%
in
2018
to
4.25%
in
2019
. Earning asset yields increased 12 basis points while the rate on interest-bearing liabilities increased by 20 basis points.
30
CONSOLIDATED BALANCE SHEET - AVERAGE BALANCES AND INTEREST RATES
|
|
December 31,
|
||||||||||||||||||||||||||||||||
|
|
2019
|
2018
|
2017
|
||||||||||||||||||||||||||||||
|
(Dollar amounts in thousands)
|
Average
Balance |
Interest
|
Yield/
Rate |
Average
Balance |
Interest
|
Yield/
Rate |
Average
Balance |
Interest
|
Yield/
Rate |
||||||||||||||||||||||||
|
ASSETS
|
|
|
|
|
|
|
|
|
|
|
|
|
|
|
|
|
|
|
|||||||||||||||
|
Interest-earning assets:
|
|
|
|
|
|
|
|
|
|
|
|
|
|
|
|
|
|
|
|||||||||||||||
|
Loans (1) (2)
|
$
|
2,270,313
|
|
125,906
|
|
5.55
|
%
|
$
|
1,922,588
|
|
101,666
|
|
5.29
|
%
|
$
|
1,855,092
|
|
92,750
|
|
5.00
|
%
|
||||||||||||
|
Taxable investment securities
|
621,756
|
|
15,191
|
|
2.44
|
%
|
576,544
|
|
16,942
|
|
2.94
|
%
|
632,672
|
|
14,325
|
|
2.26
|
%
|
|||||||||||||||
|
Tax-exempt investments (2)
|
302,757
|
|
11,999
|
|
3.96
|
%
|
285,931
|
|
11,500
|
|
4.02
|
%
|
279,301
|
|
13,337
|
|
4.78
|
%
|
|||||||||||||||
|
Federal funds sold
|
3,029
|
|
143
|
|
4.72
|
%
|
3,693
|
|
116
|
|
3.14
|
%
|
12,663
|
|
101
|
|
0.80
|
%
|
|||||||||||||||
|
Total interest-earning assets
|
3,197,855
|
|
153,239
|
|
4.79
|
%
|
2,788,756
|
|
130,224
|
|
4.67
|
%
|
2,779,728
|
|
120,513
|
|
4.34
|
%
|
|||||||||||||||
|
Non-interest earning assets:
|
|
|
|
|
|
|
|
|
|
|
|
|
|
|
|
|
|
|
|||||||||||||||
|
Cash and due from banks
|
86,592
|
|
|
|
|
|
58,599
|
|
|
|
|
|
61,650
|
|
|
|
|
|
|||||||||||||||
|
Premises and equipment, net
|
54,336
|
|
|
|
|
|
47,550
|
|
|
|
|
|
48,368
|
|
|
|
|
|
|||||||||||||||
|
Other assets
|
121,411
|
|
|
|
|
|
101,711
|
|
|
|
|
|
114,329
|
|
|
|
|
|
|||||||||||||||
|
Less allowance for loan losses
|
(20,401
|
)
|
|
|
|
|
(20,099
|
)
|
|
|
|
|
(19,528
|
)
|
|
|
|
|
|||||||||||||||
|
TOTALS
|
$
|
3,439,793
|
|
|
|
|
|
$
|
2,976,517
|
|
|
|
|
|
$
|
2,984,547
|
|
|
|
|
|
||||||||||||
|
LIABILITIES AND SHAREHOLDERS' EQUITY
|
|
|
|
|
|
|
|
|
|
|
|
|
|
|
|
|
|
|
|||||||||||||||
|
Interest-bearing liabilities:
|
|
|
|
|
|
|
|
|
|
|
|
|
|
|
|
|
|
|
|||||||||||||||
|
Transaction accounts
|
$
|
2,057,713
|
|
9,847
|
|
0.48
|
%
|
$
|
1,706,846
|
|
6,482
|
|
0.38
|
%
|
$
|
1,647,622
|
|
3,795
|
|
0.23
|
%
|
||||||||||||
|
Time deposits
|
447,172
|
|
5,864
|
|
1.31
|
%
|
317,739
|
|
2,550
|
|
0.80
|
%
|
356,281
|
|
2,216
|
|
0.62
|
%
|
|||||||||||||||
|
Short-term borrowings
|
60,924
|
|
1,105
|
|
1.81
|
%
|
41,480
|
|
501
|
|
1.21
|
%
|
39,802
|
|
245
|
|
0.62
|
%
|
|||||||||||||||
|
Other borrowings
|
24,780
|
|
653
|
|
2.64
|
%
|
5,566
|
|
112
|
|
2.01
|
%
|
7,205
|
|
82
|
|
1.14
|
%
|
|||||||||||||||
|
Total interest-bearing liabilities:
|
2,590,589
|
|
17,469
|
|
0.67
|
%
|
2,071,631
|
|
9,645
|
|
0.47
|
%
|
2,050,910
|
|
6,338
|
|
0.31
|
%
|
|||||||||||||||
|
Non interest-bearing liabilities:
|
|
|
|
|
|
|
|
|
|
|
|
|
|
|
|
|
|
|
|||||||||||||||
|
Demand deposits
|
292,445
|
|
|
|
|
|
425,639
|
|
|
|
|
|
438,234
|
|
|
|
|
|
|||||||||||||||
|
Other
|
59,430
|
|
|
|
|
|
54,973
|
|
|
|
|
|
60,137
|
|
|
|
|
|
|||||||||||||||
|
|
2,942,464
|
|
|
|
|
|
2,552,243
|
|
|
|
|
|
2,549,281
|
|
|
|
|
|
|||||||||||||||
|
Shareholders' equity
|
497,329
|
|
|
|
|
|
424,274
|
|
|
|
|
|
435,266
|
|
|
|
|
|
|||||||||||||||
|
TOTALS
|
$
|
3,439,793
|
|
|
|
|
|
$
|
2,976,517
|
|
|
|
|
|
$
|
2,984,547
|
|
|
|
|
|
||||||||||||
|
Net interest earnings
|
|
|
$
|
135,770
|
|
|
|
|
|
$
|
120,579
|
|
|
|
|
|
$
|
114,175
|
|
|
|
||||||||||||
|
Net yield on interest- earning assets
|
|
|
|
|
4.25
|
%
|
|
|
|
|
4.32
|
%
|
|
|
|
|
4.11
|
%
|
|||||||||||||||
(1)For purposes of these computations, non-accruing loans are included in the daily average loan amounts outstanding.
(2)Interest income includes the effect of tax equivalent adjustments using a federal tax rate of
21%
for 2019 and 2018 and a rate of 35% for 2017.
31
The following table sets forth the components of net interest income due to changes in volume and rate. The table information compares
2019
to
2018
and
2018
to
2017
.
|
|
2019 Compared to 2018 Increase
(Decrease) Due to
|
2018 Compared to 2017 Increase
(Decrease) Due to
|
||||||||||||||||||||||||||||||
|
(Dollar amounts in thousands)
|
Volume
|
Rate
|
Volume/
Rate
|
Total
|
Volume
|
Rate
|
Volume/
Rate
|
Total
|
||||||||||||||||||||||||
|
Interest earned on interest-earning assets:
|
|
|
|
|
|
|
|
|
|
|
|
|
|
|
|
|
||||||||||||||||
|
Loans (1) (2)
|
$
|
18,388
|
|
$
|
4,956
|
|
$
|
896
|
|
$
|
24,240
|
|
$
|
3,375
|
|
$
|
5,346
|
|
$
|
195
|
|
$
|
8,916
|
|
||||||||
|
Taxable investment securities
|
1,329
|
|
(2,856
|
)
|
(224
|
)
|
(1,751
|
)
|
(1,271
|
)
|
4,266
|
|
(378
|
)
|
2,617
|
|
||||||||||||||||
|
Tax-exempt investment securities (2)
|
677
|
|
(168
|
)
|
(10
|
)
|
499
|
|
317
|
|
(2,104
|
)
|
(50
|
)
|
(1,837
|
)
|
||||||||||||||||
|
Federal funds sold
|
(21
|
)
|
58
|
|
(10
|
)
|
27
|
|
(72
|
)
|
297
|
|
(210
|
)
|
15
|
|
||||||||||||||||
|
Total interest income
|
$
|
20,373
|
|
$
|
1,990
|
|
$
|
652
|
|
$
|
23,015
|
|
$
|
2,349
|
|
$
|
7,805
|
|
$
|
(443
|
)
|
$
|
9,711
|
|
||||||||
|
Interest paid on interest-bearing liabilities:
|
|
|
|
|
|
|
|
|
|
|
|
|
|
|
|
|
||||||||||||||||
|
Transaction accounts
|
1,331
|
|
1,686
|
|
347
|
|
3,364
|
|
136
|
|
2,463
|
|
89
|
|
2,688
|
|
||||||||||||||||
|
Time deposits
|
1,039
|
|
1,617
|
|
659
|
|
3,315
|
|
(240
|
)
|
643
|
|
(70
|
)
|
333
|
|
||||||||||||||||
|
Short-term borrowings
|
235
|
|
251
|
|
118
|
|
604
|
|
10
|
|
236
|
|
10
|
|
256
|
|
||||||||||||||||
|
Other borrowings
|
386
|
|
35
|
|
120
|
|
541
|
|
(19
|
)
|
63
|
|
(14
|
)
|
30
|
|
||||||||||||||||
|
Total interest expense
|
2,991
|
|
3,589
|
|
1,244
|
|
7,824
|
|
(113
|
)
|
3,405
|
|
15
|
|
3,307
|
|
||||||||||||||||
|
Net interest income
|
$
|
17,382
|
|
$
|
(1,599
|
)
|
$
|
(592
|
)
|
$
|
15,191
|
|
$
|
2,462
|
|
$
|
4,400
|
|
$
|
(458
|
)
|
$
|
6,404
|
|
||||||||
(1)For purposes of these computations, non-accruing loans are included in the daily average loan amounts outstanding.
(2)Interest income includes the effect of tax equivalent adjustments using a federal tax rate of
21%
for 2019 and 2018 and a rate of 35% for 2017.
PROVISION FOR LOAN LOSSES
The provision for loan losses charged to expense is based upon credit loss experience and the results of a detailed analysis estimating an appropriate and adequate allowance for loan losses. The analysis includes the evaluation of impaired loans as prescribed under
Accounting Standards Codification
(ASC-310), pooled loans as prescribed under ASC 450-10, and economic and other risk factors as outlined in various Joint Interagency Statements issued by the bank regulatory agencies. For the year ended
December 31, 2019
, the provision for loan losses was $
4.7 million
, an decrease of $1.1 million, or 18.5%, compared to
2018
.
Impaired loans decreased to
$7.1 million
at
December 31, 2019
from
$10.5 million
at
December 31, 2018
. The allowance allocation for these impaired loans decreased to
$48 thousand
from
$737 thousand
during this period, contributing to the decrease in provision in
2019
compared to
2018
. Net charge-offs for
2019
were
$5.2 million
as compared to
$5.2 million
for
2018
and
$4.2 million
for
2017
. Non-accrual loans, excluding TDR's, decreased to
$9.5 million
at
December 31, 2019
from
$11.0 million
at
December 31, 2018
. Loans past due 90 days and still on accrual increased to
$1.6 million
compared to
$0.9 million
at
December 31, 2018
.
NON-INTEREST INCOME
Non-interest income of $
38.5 million
increased $246 thousand from the $
38.2 million
earned in
2018
. Non-interest income increased due to the acquisition of HopFed, Inc. and a gain in BOLI income, which was offset by the recovery of a security previously written down for other-than temporary impairment of $4.5 million in 2018.
NON-INTEREST EXPENSES
Non-interest expenses increased to $
104.4 million
in
2019
from $
91.3 million
in
2018
. The increase was largely due to the acquisition of HopFed, Inc.
INCOME TAXES
The Corporation's federal income tax provision was $
12.1 million
in
2019
compared to
$11.1 million
in
2018
. The overall effective tax rate in
2019
of
20.0%
increased as compared to a
2018
effective rate of
19.3%
.
32
COMPARISON OF
2018
TO
2017
Net income for
2018
was $
46.6 million
or
$3.80
per share compared to $
29.1 million
in
2017
or
$2.38
per share. The increase in 2018 net income includes the recovery of a security previously written down for other-than temporary impairment, which contributed $2.4 million pre-tax to interest income and $4.5 million pre-tax to other income. The 2017 results were negatively impacted by the revaluation of the Corporation's deferred tax assets as a result of the passage of the Tax Cuts and Jobs Act resulting in a noncash tax expense of $6.3 million.
Net interest income increased $8.7 million in
2018
compared to
2017
. The provision for loan losses increased $473 thousand from $
5.3 million
in
2017
to $
5.8 million
in
2018
. Non-interest expenses increased $2.5 million and non-interest income increased $2.3 million. The increase in non-interest income resulted primarily from the recovery of a security previously written down for other-than-temporary impairment.
The provision for income taxes decreased $9.5 million from
2017
to
2018
and the effective tax rate decreased to 19.3% in
2018
from 41.5% in
2017
. The tax decrease is primarily due to the deferred tax adjustment related to the Tax Cuts and Jobs Act of 2017.
COMPARISON AND DISCUSSION OF
2019
BALANCE SHEET TO
2018
The Corporation's total assets increased 33.7% or $1.0 billion at
December 31, 2019
, from a year earlier. Available-for-sale securities increased $141.8 million at
December 31, 2019
, from the previous year. Loans, net increased by $702.9 million to $2.64 billion. Deposits increased $838.6 million while borrowings increased by $41.4 million. Total shareholders' equity increased $114.9 million to $557.6 million at
December 31, 2019
. In 2019 dividends paid by the Corporation totaled $1.03 per share. There were also
28,470
shares from the treasury with a value of $
1.25 million
that were contributed to the ESOP plan in
2019
compared to
23,250
shares with a value of $
1.09 million
in
2018
.
Following is an analysis of the components of the Corporation's balance sheet.
SECURITIES
The Corporation's investment strategy seeks to maximize income from the investment portfolio while using it as a risk management tool and ensuring safety of principal and capital. During
2019
the portfolio's balance increased by 18.1%. The average life of the portfolio decreased from 4.7 years in
2018
to 4.2 years in
2019
. The portfolio structure will continue to provide cash flows to be reinvested during
2020
.
|
|
1 year and less
|
1 to 5 years
|
5 to 10 years
|
Over 10 Years
|
2019
|
|||||||||||||||||||||||||||
|
(Dollar amounts in thousands)
|
Balance
|
Rate
|
Balance
|
Rate
|
Balance
|
Rate
|
Balance
|
Rate
|
Total
|
|||||||||||||||||||||||
|
U.S. government sponsored entity mortgage-backed securities and agencies and U.S. Treasury (1)
|
$
|
7,095
|
|
2.11
|
%
|
$
|
47,977
|
|
1.37
|
%
|
$
|
60,946
|
|
5.20
|
%
|
$
|
260,606
|
|
3.08
|
%
|
$
|
376,624
|
|
|||||||||
|
Collateralized mortgage obligations (1)
|
—
|
|
—
|
%
|
3,707
|
|
4.88
|
%
|
7,379
|
|
2.05
|
%
|
270,225
|
|
2.55
|
%
|
281,311
|
|
||||||||||||||
|
States and political subdivisions
|
6,949
|
|
3.01
|
%
|
37,595
|
|
3.13
|
%
|
53,476
|
|
3.26
|
%
|
167,143
|
|
3.06
|
%
|
265,163
|
|
||||||||||||||
|
Collateralized debt obligations
|
—
|
|
—
|
%
|
—
|
|
—
|
%
|
—
|
|
—
|
%
|
3,619
|
|
—
|
%
|
3,619
|
|
||||||||||||||
|
TOTAL
|
$
|
14,044
|
|
2.55
|
%
|
$
|
89,279
|
|
2.26
|
%
|
$
|
121,801
|
|
4.16
|
%
|
$
|
701,593
|
|
2.86
|
%
|
$
|
926,717
|
|
|||||||||
(1) Distribution of maturities is based on the estimated life of the asset.
|
|
1 year and less
|
1 to 5 years
|
5 to 10 years
|
Over 10 Years
|
2018
|
|||||||||||||||||||||||||||
|
(Dollar amounts in thousands)
|
Balance
|
Rate
|
Balance
|
Rate
|
Balance
|
Rate
|
Balance
|
Rate
|
Total
|
|||||||||||||||||||||||
|
U.S. government sponsored entity mortgage-backed securities and agencies (1)
|
$
|
56
|
|
4.61
|
%
|
$
|
4,186
|
|
5.33
|
%
|
$
|
52,699
|
|
5.83
|
%
|
$
|
147,166
|
|
3.95
|
%
|
$
|
204,107
|
|
|||||||||
|
Collateralized mortgage obligations (1)
|
3
|
|
7.59
|
%
|
278
|
|
4.30
|
%
|
9,326
|
|
2.88
|
%
|
334,009
|
|
2.62
|
%
|
343,616
|
|
||||||||||||||
|
States and political subdivisions
|
6,509
|
|
3.24
|
%
|
33,582
|
|
3.28
|
%
|
70,314
|
|
3.41
|
%
|
123,530
|
|
3.14
|
%
|
233,935
|
|
||||||||||||||
|
Collateralized debt obligations
|
—
|
|
—
|
%
|
—
|
|
—
|
%
|
—
|
|
—
|
%
|
3,258
|
|
—
|
%
|
3,258
|
|
||||||||||||||
|
TOTAL
|
6,568
|
|
3.25
|
%
|
38,046
|
|
3.51
|
%
|
132,339
|
|
4.34
|
%
|
607,963
|
|
3.03
|
%
|
784,916
|
|
||||||||||||||
(1) Distribution of maturities is based on the estimated life of the asset.
33
LOAN PORTFOLIO
Loans outstanding by major category as of December 31 for each of the last five years and the maturities at year end
2019
are set forth in the following analyses.
|
(Dollar amounts in thousands)
|
2019
|
2018
|
2017
|
2016
|
2015
|
|||||||||||||||
|
Loan Category
|
|
|
|
|
|
|
|
|
|
|
||||||||||
|
Commercial
|
$
|
1,584,447
|
|
$
|
1,166,352
|
|
$
|
1,139,490
|
|
$
|
1,106,182
|
|
$
|
1,043,980
|
|
|||||
|
Residential
|
682,077
|
|
443,670
|
|
436,143
|
|
423,911
|
|
444,447
|
|
||||||||||
|
Consumer
|
386,006
|
|
341,041
|
|
327,976
|
|
305,881
|
|
272,896
|
|
||||||||||
|
TOTAL
|
$
|
2,652,530
|
|
$
|
1,951,063
|
|
$
|
1,903,609
|
|
$
|
1,835,974
|
|
$
|
1,761,323
|
|
|||||
|
Within
|
After One
But Within
|
After Five
|
||||||||||||||
|
(Dollar amounts in thousands)
|
One Year
|
Five Years
|
Years
|
Total
|
||||||||||||
|
MATURITY DISTRIBUTION
|
|
|
|
|
|
|
|
|
||||||||
|
Commercial, financial and agricultural
|
$
|
555,437
|
|
$
|
740,019
|
|
$
|
288,991
|
|
$
|
1,584,447
|
|
||||
|
TOTAL
|
|
|
|
|
|
|
|
|
||||||||
|
Residential
|
|
|
|
|
|
|
682,077
|
|
||||||||
|
Consumer
|
|
|
|
|
|
|
386,006
|
|
||||||||
|
TOTAL
|
|
|
|
|
|
|
$
|
2,652,530
|
|
|||||||
|
Loans maturing after one year with:
|
|
|
|
|
|
|
|
|
||||||||
|
Fixed interest rates
|
|
|
$
|
305,783
|
|
$
|
279,419
|
|
|
|
||||||
|
Variable interest rates
|
|
|
434,236
|
|
9,572
|
|
|
|
||||||||
|
TOTAL
|
|
|
$
|
740,019
|
|
$
|
288,991
|
|
|
|
||||||
34
ALLOWANCE FOR LOAN LOSSES
The activity in the Corporation's allowance for loan losses is shown in the following analysis:
|
(Dollar amounts in thousands)
|
2019
|
2018
|
2017
|
2016
|
2015
|
|||||||||||||||
|
Amount of loans outstanding at December 31,
|
$
|
2,652,530
|
|
$
|
1,951,063
|
|
$
|
1,903,609
|
|
$
|
1,835,974
|
|
$
|
1,761,323
|
|
|||||
|
Average amount of loans by year
|
$
|
2,270,313
|
|
$
|
1,922,588
|
|
$
|
1,855,092
|
|
$
|
1,792,609
|
|
$
|
1,761,888
|
|
|||||
|
Allowance for loan losses at beginning of year
|
$
|
20,436
|
|
$
|
19,909
|
|
$
|
18,773
|
|
$
|
19,946
|
|
$
|
18,839
|
|
|||||
|
Loans charged off:
|
|
|
|
|
|
|
|
|
|
|
||||||||||
|
Commercial
|
2,616
|
|
1,122
|
|
1,572
|
|
2,659
|
|
2,852
|
|
||||||||||
|
Residential
|
1,050
|
|
841
|
|
761
|
|
1,011
|
|
866
|
|
||||||||||
|
Consumer
|
7,007
|
|
6,868
|
|
6,429
|
|
5,279
|
|
4,810
|
|
||||||||||
|
Total loans charged off
|
10,673
|
|
8,831
|
|
8,762
|
|
8,949
|
|
8,528
|
|
||||||||||
|
Recoveries of loans previously charged off:
|
|
|
|
|
|
|
|
|
|
|
||||||||||
|
Commercial
|
1,092
|
|
606
|
|
1,377
|
|
1,663
|
|
2,429
|
|
||||||||||
|
Residential
|
1,360
|
|
639
|
|
842
|
|
676
|
|
452
|
|
||||||||||
|
Consumer
|
3,028
|
|
2,345
|
|
2,384
|
|
2,137
|
|
2,054
|
|
||||||||||
|
Total recoveries
|
5,480
|
|
3,590
|
|
4,603
|
|
4,476
|
|
4,935
|
|
||||||||||
|
Net loans charged off
|
5,193
|
|
5,241
|
|
4,159
|
|
4,473
|
|
3,593
|
|
||||||||||
|
Provision charged to expense *
|
4,700
|
|
5,768
|
|
5,295
|
|
3,300
|
|
4,700
|
|
||||||||||
|
Balance at end of year
|
$
|
19,943
|
|
$
|
20,436
|
|
$
|
19,909
|
|
$
|
18,773
|
|
$
|
19,946
|
|
|||||
|
Ratio of net charge-offs during period to average loans outstanding
|
0.23
|
%
|
0.27
|
%
|
0.22
|
%
|
0.25
|
%
|
0.20
|
%
|
||||||||||
The allowance is maintained at an amount management believes sufficient to absorb probable incurred losses in the loan portfolio. Monitoring loan quality and maintaining an adequate allowance is an ongoing process overseen by senior management and the loan review function. On at least a quarterly basis, a formal analysis of the adequacy of the allowance is prepared and reviewed by management and the Board of Directors. This analysis serves as a point in time assessment of the level of the allowance and serves as a basis for provisions for loan losses. The loan quality monitoring process includes assigning loan grades and the use of a watch list to identify loans of concern.
Included in the
$2.7 billion
of loans outstanding at
December 31, 2019
are loans acquired on December 30, 2011 in the Freestar acquisition. The acquired portfolio includes purchased credit impaired loans with a carrying value of
$1.1 million
and a contractual balance due of
$1.2 million
. Also included are loans acquired on July 27, 2019 in the HopFed acquisition. The acquired portfolio includes purchased credit impaired loans with a carrying value of $5.9 million and a contractual balance due of $11.8 million.
The analysis of the allowance for loan losses includes the allocation of specific amounts of the allowance to individual impaired loans, generally based on an analysis of the collateral securing those loans. Portions of the allowance are also allocated to loan portfolios, based upon a variety of factors including historical loss experience, trends in the type and volume of the loan portfolios, trends in delinquent and non-performing loans, and economic trends affecting our market. These components are added together and compared to the balance of our allowance at the evaluation date. The allowance for loan losses as a percentage of total loans decreased to
0.75%
at year end
2019
compared to
1.05%
at year end
2018
. The decrease is primarily due to acquired loans being recorded at fair value. The Corporation’s unallocated allowance position of
$1.4 million
at
December 31, 2019
decreased from
$1.8 million
at
December 31, 2018
and decreased from
$1.5 million
December 31, 2017
. The calculation of historical losses used in the allowance computation averages the net charge off activity and qualitative factors that supplement historical losses and consider internal and external factors that influence management's expectations of loss in the portfolio and the unallocated portion of the allowance reflects management's uncertainty about whether the more modest levels of net charge offs in the recent years, particularly in the commercial segment of the portfolio, are sustainable and representative of the risk in the loan portfolio. Non-performing loans of
$15.3 million
at
December 31, 2019
decreased from
$16.6 million
at
December 31, 2018
due in large part to the resolution of certain commercial credits in
2019
. Management believes the allowance for loan losses balance at year end
2019
, including the unallocated portion, is reasonable based on their analysis of specific loans and the credit trends reflected within the loan portfolio. The table below presents the allocation of the allowance to the loan portfolios at year-end.
35
|
|
Years Ended December 31,
|
|||||||||||||||||||
|
(Dollar amounts in thousands)
|
2019
|
2018
|
2017
|
2016
|
2015
|
|||||||||||||||
|
Commercial
|
$
|
8,945
|
|
$
|
9,848
|
|
$
|
10,281
|
|
$
|
9,731
|
|
$
|
11,482
|
|
|||||
|
Residential
|
1,302
|
|
1,313
|
|
1,455
|
|
1,553
|
|
1,834
|
|
||||||||||
|
Consumer
|
8,304
|
|
7,481
|
|
6,709
|
|
5,767
|
|
4,945
|
|
||||||||||
|
Unallocated
|
1,392
|
|
1,794
|
|
1,464
|
|
1,722
|
|
1,685
|
|
||||||||||
|
TOTAL ALLOWANCE FOR LOAN LOSSES
|
$
|
19,943
|
|
$
|
20,436
|
|
$
|
19,909
|
|
$
|
18,773
|
|
$
|
19,946
|
|
|||||
NONPERFORMING LOANS
Management monitors the components and status of nonperforming loans as a part of the evaluation procedures used in determining the adequacy of the allowance for loan losses. It is the Corporation's policy to discontinue the accrual of interest on loans where, in management's opinion, serious doubt exists as to collectability. The amounts shown below represent non-accrual loans, loans which have been restructured to provide for a reduction or deferral of interest or principal because of deterioration in the financial condition of the borrower and those loans which are past due more than 90 days where the Corporation continues to accrue interest. Restructured loans declined in
2019
and
2018
due to the reduced number and balance of loans added combined with the continued receipt of payments in accordance with the restructuring terms as well as in 2015 there was one large commercial credit paid off. Additional information regarding restructured loans is available in the footnotes to the financial statements.
|
(Dollar amounts in thousands)
|
2019
|
2018
|
2017
|
2016
|
2015
|
|||||||||||||||
|
Non-accrual loans
|
$
|
9,535
|
|
$
|
10,974
|
|
$
|
13,245
|
|
$
|
13,492
|
|
$
|
14,634
|
|
|||||
|
Accruing restructured loans
|
3,318
|
|
3,702
|
|
3,280
|
|
3,729
|
|
4,851
|
|
||||||||||
|
Non-accrual restructured loans
|
876
|
|
1,104
|
|
3,754
|
|
4,836
|
|
5,009
|
|
||||||||||
|
Accruing loans past due over 90 days
|
1,610
|
|
798
|
|
1,403
|
|
610
|
|
964
|
|
||||||||||
|
|
$
|
15,339
|
|
$
|
16,578
|
|
$
|
21,682
|
|
$
|
22,667
|
|
$
|
25,458
|
|
|||||
The ratio of the allowance for loan losses as a percentage of nonperforming loans was
130%
at
December 31, 2019
, compared to
123%
in
2018
. In the footnotes to the financial statements the amount reported for nonperforming loans is the recorded investment which includes accrued interest receivable. The following loan categories comprise significant components of the nonperforming loans at
December 31, 2019
and
2018
:
|
(Dollar amounts in thousands)
|
2019
|
2018
|
||||||||||||
|
Non-accrual loans:
|
|
|
|
|
|
|
|
|
||||||
|
Commercial loans
|
$
|
5,630
|
|
59
|
%
|
$
|
6,851
|
|
62
|
%
|
||||
|
Residential loans
|
3,315
|
|
35
|
%
|
3,618
|
|
33
|
%
|
||||||
|
Consumer loans
|
590
|
|
6
|
%
|
505
|
|
5
|
%
|
||||||
|
|
$
|
9,535
|
|
100
|
%
|
$
|
10,974
|
|
100
|
%
|
||||
|
Past due 90 days or more:
|
|
|
|
|
|
|
|
|
||||||
|
Commercial loans
|
$
|
5
|
|
—
|
%
|
$
|
—
|
|
—
|
%
|
||||
|
Residential loans
|
1,383
|
|
86
|
%
|
630
|
|
79
|
%
|
||||||
|
Consumer loans
|
222
|
|
14
|
%
|
168
|
|
21
|
%
|
||||||
|
|
$
|
1,610
|
|
100
|
%
|
$
|
798
|
|
100
|
%
|
||||
Management considers the present allowance to be appropriate and adequate to cover probable incurred losses inherent in the loan portfolio based on the current economic environment. However, future economic changes cannot be predicted. Deteriorating economic conditions could result in an increase in the risk characteristics of the loan portfolio and an increase in the potential for loan losses.
36
DEPOSITS
The information below presents the average amount of deposits and rates paid on those deposits for
2019
,
2018
and
2017
.
|
|
2019
|
2018
|
2017
|
||||||||||||||||||
|
(Dollar amounts in thousands)
|
Amount
|
Rate
|
Amount
|
Rate
|
Amount
|
Rate
|
|||||||||||||||
|
Non-interest-bearing demand deposits
|
$
|
292,445
|
|
|
|
$
|
425,639
|
|
|
|
$
|
438,234
|
|
|
|
||||||
|
Interest-bearing demand deposits
|
979,195
|
|
0.60
|
%
|
805,689
|
|
0.50
|
%
|
719,728
|
|
0.30
|
%
|
|||||||||
|
Savings deposits
|
1,078,518
|
|
0.37
|
%
|
901,157
|
|
0.27
|
%
|
927,894
|
|
0.19
|
%
|
|||||||||
|
Time deposits: $100,000 or more
|
139,416
|
|
1.82
|
%
|
92,657
|
|
1.06
|
%
|
100,432
|
|
0.69
|
%
|
|||||||||
|
Other time deposits
|
307,756
|
|
1.08
|
%
|
225,082
|
|
0.70
|
%
|
255,849
|
|
0.59
|
%
|
|||||||||
|
TOTAL
|
$
|
2,797,330
|
|
|
|
$
|
2,450,224
|
|
|
|
$
|
2,442,137
|
|
|
|
||||||
The maturities of certificates of deposit of more than $100 thousand outstanding at
December 31, 2019
, are summarized as follows:
|
(Dollar amounts in thousands)
|
|
||
|
3 months or less
|
$
|
45,337
|
|
|
Over 3 through 6 months
|
45,558
|
|
|
|
Over 6 through 12 months
|
62,665
|
|
|
|
Over 12 months
|
136,460
|
|
|
|
TOTAL
|
$
|
290,020
|
|
OTHER BORROWINGS
Advances from the Federal Home Loan Bank increased to $
20.8 million
in
2019
compared to
zero
in
2018
. Other borrowings included trust preferred securities acquired in the assumption of liabilities of HopFed, Inc. totaling $10.2 million. The Asset/Liability Committee reviews these funding sources and considers the related strategies on a monthly basis. See Interest Rate Sensitivity and Liquidity below for more information.
CAPITAL RESOURCES
Bank regulatory agencies have established capital adequacy standards which are used extensively in their monitoring and control of the industry. These standards relate capital to level of risk by assigning different weightings to assets and certain off-balance-sheet activity. As shown in the footnote to the consolidated financial statements ("Regulatory Matters"), the Corporation's subsidiary banking institutions capital exceeds the requirements to be considered well capitalized at
December 31, 2019
.
First Financial Corporation's objective continues to be to maintain adequate capital to merit the confidence of its customers and shareholders. To warrant this confidence, the Corporation's management maintains a capital position which they believe is sufficient to absorb unforeseen financial shocks without unnecessarily restricting dividends to its shareholders. The Corporation's dividend payout ratio for
2019
and
2018
was
27.7%
and
26.9%
, respectively. The Corporation expects to continue its policy of paying regular cash dividends, subject to future earnings and regulatory restrictions and capital requirements.
INTEREST RATE SENSITIVITY AND LIQUIDITY
First Financial Corporation has established risk measures, limits and policy guidelines for managing interest rate risk and liquidity. Responsibility for management of these functions resides with the Asset/Liability Committee. The primary goal of the Asset/Liability Committee is to maximize net interest income within the interest rate risk limits approved by the Board of Directors.
Interest Rate Risk:
Management considers interest rate risk to be the Corporation's most significant market risk. Interest rate risk is the exposure to changes in net interest income as a result of changes in interest rates. Consistency in the Corporation's net interest income is largely dependent on the effective management of this risk. The Asset/Liability position is measured using sophisticated risk management tools, including earnings simulation and market value of equity sensitivity analysis. These tools allow management to quantify and monitor both short-and long-term exposure to interest rate risk. Simulation modeling measures the effects of changes in interest rates, changes in the shape of the yield curve and the effects of embedded options on net interest income. This
37
measure projects earnings in the various environments over the next three years. It is important to note that measures of interest rate risk have limitations and are dependent on various assumptions. These assumptions are inherently uncertain and, as a result, the model cannot precisely predict the impact of interest rate fluctuations on net interest income. Actual results will differ from simulated results due to timing, frequency and amount of interest rate changes as well as overall market conditions. The Committee has performed a thorough analysis of these assumptions and believes them to be valid and theoretically sound. These assumptions are continuously monitored for behavioral changes.
The Corporation from time to time utilizes derivatives to manage interest rate risk. Management continuously evaluates the merits of such interest rate risk products but does not anticipate the use of such products to become a major part of the Corporation's risk management strategy.
The table below shows the Corporation's estimated sensitivity profile as of
December 31, 2019
. The change in interest rates assumes a parallel shift in interest rates of 100 and 200 basis points. Given a 100 basis point increase in rates, net interest income would increase
2.21%
over the next 12 months and increase
5.42%
over the following 12 months. Given a 100 basis point decrease in rates, net interest income would decrease
3.46%
over the next 12 months and decrease
7.11%
over the following 12 months. These estimates assume all rate changes occur overnight and management takes no action as a result of this change.
|
Basis Point
|
Percentage Change in Net Interest Income
|
||||||||
|
Interest Rate Change
|
12 months
|
24 months
|
36 months
|
||||||
|
Down 200
|
-3.88
|
%
|
-8.85
|
%
|
-12.81
|
%
|
|||
|
Down 100
|
-3.46
|
%
|
-7.11
|
%
|
-10.07
|
%
|
|||
|
Up 100
|
2.21
|
%
|
5.42
|
%
|
8.70
|
%
|
|||
|
Up 200
|
1.73
|
%
|
7.70
|
%
|
14.20
|
%
|
|||
Typical rate shock analysis does not reflect management's ability to react and thereby reduce the effects of rate changes, and represents a worst-case scenario.
Liquidity Risk
Liquidity is measured by the bank's ability to raise funds to meet the obligations of its customers, including deposit withdrawals and credit needs. This is accomplished primarily by maintaining sufficient liquid assets in the form of investment securities and core deposits. The Corporation has $
14.0 million
of investments that mature throughout the coming 12 months. The Corporation also anticipates $
119.3 million
of principal payments from mortgage-backed securities. Given the current rate environment, the Corporation anticipates $
31.3 million
in securities to be called within the next 12 months.
The Corporation also has additional sources of liquidity available through secured and unsecured borrowing capacity. These include upstream correspondents, the Federal Home Loan Bank and the Federal Reserve Bank.
CONTRACTUAL OBLIGATIONS, COMMITMENTS, CONTINGENT LIABILITIES AND OFF-BALANCE SHEET ARRANGEMENTS
The Corporation has various financial obligations, including contractual obligations and commitments that may require future cash payments.
Contractual Obligations:
The following table presents, as of
December 31, 2019
, significant fixed and determinable contractual obligations to third parties by payment date. Further discussion of the nature of each obligation is included in the referenced note to the consolidated financial statements.
|
|
Payments Due in
|
||||||||||||||||||||||
|
|
Note
|
One year
|
One year to
|
Three to
|
Over Five
|
|
|||||||||||||||||
|
(Dollar amounts in thousands)
|
Reference
|
or less
|
Three Years
|
Five Years
|
Years
|
Total
|
|||||||||||||||||
|
Deposits without a stated maturity
|
|
|
$
|
2,660,947
|
|
$
|
—
|
|
$
|
—
|
|
$
|
—
|
|
$
|
2,660,947
|
|
||||||
|
Consumer certificates of deposit
|
|
|
350,284
|
|
194,909
|
|
69,046
|
|
171
|
|
614,410
|
|
|||||||||||
|
Short-term borrowings
|
11
|
|
80,119
|
|
—
|
|
—
|
|
—
|
|
80,119
|
|
|||||||||||
|
Other borrowings
|
12
|
|
30,973
|
|
—
|
|
—
|
|
—
|
|
30,973
|
|
|||||||||||
The Corporation has obligations under its pension, supplemental executive retirement plan and post-retirement medical benefits plan as described in Note 16 to the consolidated financial statements.
38
The Corporation has lease obligations on certain branch properties and equipment as described in Note 8 to the consolidated financial statements.
Commitments:
The following table details the amount and expected maturities of significant commitments as of
December 31, 2019
. Further discussion of these commitments is included in Note 15 to the consolidated financial statements.
|
|
Total Amount
|
One year
|
Over One
|
|||||||||
|
(Dollar amounts in thousands)
|
Committed
|
or less
|
Year
|
|||||||||
|
Commitments to extend credit:
|
|
|
|
|
|
|
||||||
|
Unused loan commitments
|
$
|
558,693
|
|
$
|
364,679
|
|
$
|
194,014
|
|
|||
|
Commercial letters of credit
|
3,851
|
|
3,851
|
|
—
|
|
||||||
Commitments to extend credit, including loan commitments, standby and commercial letters of credit do not necessarily represent future cash requirements, in that these commitments often expire without being drawn upon.
|
ITEM 7A.
|
QUANTITATIVE AND QUALITATIVE DISCLOSURES ABOUT MARKET RISK
|
The information contained in “Management’s Discussion and Analysis of Financial Condition and Results of Operations” in the preceding pages of this Form 10-K is incorporated herein by reference in response to this item.
39
|
ITEM 8.
|
FINANCIAL STATEMENTS AND SUPPLEMENTARY DATA
|
MANAGEMENT'S REPORT ON INTERNAL CONTROL OVER FINANCIAL REPORTING
The management of First Financial Corporation (the "Corporation") has prepared and is responsible for the preparation and accuracy of the consolidated financial statements and related financial information included in the Annual Report.
The management of the Corporation is responsible for establishing and maintaining adequate internal control over financial reporting as defined in Rules 13a-15(f) and 15d-15(f) under the Securities Exchange Act of 1934. The Corporation's internal control over financial reporting is designed to provide reasonable assurance regarding the reliability of financial reporting and the preparation of financial statements for external purposes in accordance with generally accepted accounting principles. The Corporation's internal control over financial reporting includes those policies and procedures that: (i) pertain to the maintenance of records that, in reasonable detail, accurately and fairly reflect the transactions and dispositions of the assets of the Corporation; (ii) provide reasonable assurance that transactions are recorded as necessary to permit preparation of financial statements in accordance with generally accepted accounting principles, and that receipts and expenditures of the Corporation are being made only in accordance with authorizations of management and directors of the Corporation; and (iii) provide reasonable assurance regarding prevention or timely detection of unauthorized acquisition, use or disposition of the Corporation's assets that could have a material effect on the financial statements.
Because of its inherent limitations, internal control over financial reporting may not prevent or detect misstatements. Also, projections of any evaluation of effectiveness to future periods are subject to the risk that controls may become inadequate because of changes in conditions, or that the degree of compliance with the policies or procedures may deteriorate.
Management assessed the Corporation's system of internal control over financial reporting as of
December 31, 2019
, in relation to criteria for effective internal control over financial reporting as described in "Internal Control—Integrated Framework," issued by the Committee of Sponsoring Organizations of the Treadway Commission (COSO) in 2013. Based on this assessment, management concluded that, as of
December 31, 2019
, its system of internal control over financial reporting is effective and meets the criteria of the "Internal Control—Integrated Framework."
Crowe LLP, independent registered public accounting firm, has audited the Corporation's internal control over financial reporting as of
December 31, 2019
and has issued a report dated March 6, 2020.
40
REPORT OF INDEPENDENT REGISTERED PUBLIC ACCOUNTING FIRM
Shareholders and the Board of Directors of First Financial Corporation
Terre Haute, Indiana
Opinions on the Financial Statements and Internal Control over Financial Reporting
We have audited the accompanying consolidated balance sheets of First Financial Corporation (the "Corporation") as of December 31, 2019 and 2018, the related consolidated statements of income and comprehensive income, changes in shareholders’ equity, and cash flows for each of the years in the three-year period ended December 31, 2019, and the related notes (collectively referred to as the "financial statements"). We also have audited the Corporation’s internal control over financial reporting as of December 31, 2019, based on criteria established in Internal Control - Integrated Framework: (2013) issued by the Committee of Sponsoring Organizations of the Treadway Commission (COSO).
In our opinion, the financial statements referred to above present fairly, in all material respects, the financial position of the Corporation as of December 31, 2019 and 2018, and the results of its operations and its cash flows for each of the years in the three-year period ended December 31, 2019 in conformity with accounting principles generally accepted in the United States of America. Also in our opinion, the Corporation maintained, in all material respects, effective internal control over financial reporting as of December 31, 2019, based on criteria established in Internal Control - Integrated Framework: (2013) issued by COSO.
Basis for Opinions
The Corporation’s management is responsible for these financial statements, for maintaining effective internal control over financial reporting, and for its assessment of the effectiveness of internal control over financial reporting, included in the accompanying Management’s Report on Internal Control over Financial Reporting. Our responsibility is to express an opinion on the Corporation’s financial statements and an opinion on the Corporation’s internal control over financial reporting based on our audits. We are a public accounting firm registered with the Public Company Accounting Oversight Board (United States) ("PCAOB") and are required to be independent with respect to the Corporation in accordance with the U.S. federal securities laws and the applicable rules and regulations of the Securities and Exchange Commission and the PCAOB.
We conducted our audits in accordance with the standards of the PCAOB. Those standards require that we plan and perform the audits to obtain reasonable assurance about whether the financial statements are free of material misstatement, whether due to error or fraud, and whether effective internal control over financial reporting was maintained in all material respects.
Our audits of the financial statements included performing procedures to assess the risks of material misstatement of the financial statements, whether due to error or fraud, and performing procedures that respond to those risks. Such procedures included examining, on a test basis, evidence regarding the amounts and disclosures in the financial statements. Our audits also included evaluating the accounting principles used and significant estimates made by management, as well as evaluating the overall presentation of the financial statements. Our audit of internal control over financial reporting included obtaining an understanding of internal control over financial reporting, assessing the risk that a material weakness exists, and testing and evaluating the design and operating effectiveness of internal control based on the assessed risk. Our audits also included performing such other procedures as we considered necessary in the circumstances. We believe that our audits provide a reasonable basis for our opinions.
Definition and Limitations of Internal Control Over Financial Reporting
A company’s internal control over financial reporting is a process designed to provide reasonable assurance regarding the reliability of financial reporting and the preparation of financial statements for external purposes in accordance with generally accepted accounting principles. A company’s internal control over financial reporting includes those policies and procedures that (1) pertain to the maintenance of records that, in reasonable detail, accurately and fairly reflect the transactions and dispositions of the assets of the company; (2) provide reasonable assurance that transactions are recorded as necessary to permit preparation of financial statements in accordance with generally accepted accounting principles, and that receipts and expenditures of the company are being made only in accordance with authorizations of management and directors of the company; and (3) provide reasonable assurance regarding prevention or timely detection of unauthorized acquisition, use, or disposition of the company’s assets that could have a material effect on the financial statements.
41
Because of its inherent limitations, internal control over financial reporting may not prevent or detect misstatements. Also, projections of any evaluation of effectiveness to future periods are subject to the risk that controls may become inadequate because of changes in conditions, or that the degree of compliance with the policies or procedures may deteriorate.
/s/ Crowe LLP
Crowe LLP
We have served as the Corporation's auditor since 1999.
Indianapolis, Indiana
March 6, 2020
42
CONSOLIDATED
BALANCE SHEETS
|
|
December 31,
|
|||||||
|
(Dollar amounts in thousands, except per share data)
|
2019
|
2018
|
||||||
|
ASSETS
|
|
|
|
|
||||
|
Cash and due from banks
|
$
|
127,426
|
|
$
|
74,388
|
|
||
|
Federal funds sold
|
7,500
|
|
—
|
|
||||
|
Securities available-for-sale
|
926,717
|
|
784,916
|
|
||||
|
Loans, net of allowance of $19,943 in 2019 and $20,436 in 2018
|
2,636,447
|
|
1,933,552
|
|
||||
|
Restricted stock
|
15,394
|
|
10,390
|
|
||||
|
Accrued interest receivable
|
18,523
|
|
13,970
|
|
||||
|
Premises and equipment, net
|
62,576
|
|
46,554
|
|
||||
|
Bank-owned life insurance
|
94,251
|
|
86,186
|
|
||||
|
Goodwill
|
78,592
|
|
34,355
|
|
||||
|
Other intangible assets
|
10,643
|
|
1,197
|
|
||||
|
Other real estate owned
|
3,625
|
|
603
|
|
||||
|
Other assets
|
41,556
|
|
22,607
|
|
||||
|
TOTAL ASSETS
|
$
|
4,023,250
|
|
$
|
3,008,718
|
|
||
|
LIABILITIES AND SHAREHOLDERS’ EQUITY
|
|
|
|
|
||||
|
Deposits:
|
|
|
|
|
||||
|
Non-interest-bearing
|
$
|
547,189
|
|
$
|
431,923
|
|
||
|
Interest-bearing:
|
|
|
|
|
||||
|
Certificates of deposit that meet or exceed the FDIC insurance limit
|
126,738
|
|
42,284
|
|
||||
|
Other interest-bearing deposits
|
2,601,430
|
|
1,962,520
|
|
||||
|
|
3,275,357
|
|
2,436,727
|
|
||||
|
Short-term borrowings
|
80,119
|
|
69,656
|
|
||||
|
Other borrowings
|
30,973
|
|
—
|
|
||||
|
Other liabilities
|
79,193
|
|
59,634
|
|
||||
|
TOTAL LIABILITIES
|
3,465,642
|
|
2,566,017
|
|
||||
|
Shareholders’ equity
|
|
|
|
|
||||
|
Common stock, $.125 stated value per share;
|
|
|
|
|
||||
|
Authorized shares-40,000,000
|
|
|
|
|
||||
|
Issued shares-16,055,466 in 2019 and 14,612,540 in 2018
|
|
|
|
|
||||
|
Outstanding shares-13,741,825 in 2019 and 12,278,295 in 2018
|
2,005
|
|
1,824
|
|
||||
|
Additional paid-in capital
|
139,694
|
|
76,774
|
|
||||
|
Retained earnings
|
492,055
|
|
456,716
|
|
||||
|
Accumulated other comprehensive income (loss)
|
(7,501
|
)
|
(23,454
|
)
|
||||
|
Less: Treasury shares at cost-2,313,641 in 2019 and 2,334,245 in 2018
|
(68,645
|
)
|
(69,159
|
)
|
||||
|
TOTAL SHAREHOLDERS’ EQUITY
|
557,608
|
|
442,701
|
|
||||
|
TOTAL LIABILITIES AND SHAREHOLDERS’ EQUITY
|
$
|
4,023,250
|
|
$
|
3,008,718
|
|
||
See accompanying notes.
43
CONSOLIDATED STATEMENTS OF INCOME AND COMPREHENSIVE INCOME
|
|
Years Ended December 31,
|
|||||||||||
|
(Dollar amounts in thousands, except per share data)
|
2019
|
2018
|
2017
|
|||||||||
|
INTEREST AND DIVIDEND INCOME:
|
|
|
|
|
|
|
||||||
|
Loans, including related fees
|
$
|
124,788
|
|
$
|
100,541
|
|
$
|
91,100
|
|
|||
|
Securities:
|
|
|
|
|
|
|
||||||
|
Taxable
|
15,191
|
|
16,942
|
|
14,325
|
|
||||||
|
Tax-exempt
|
7,674
|
|
7,455
|
|
7,391
|
|
||||||
|
Other
|
1,468
|
|
1,286
|
|
1,379
|
|
||||||
|
TOTAL INTEREST AND DIVIDEND INCOME
|
149,121
|
|
126,224
|
|
114,195
|
|
||||||
|
INTEREST EXPENSE:
|
|
|
|
|
|
|
||||||
|
Deposits
|
15,711
|
|
9,032
|
|
6,011
|
|
||||||
|
Short-term borrowings
|
1,105
|
|
501
|
|
245
|
|
||||||
|
Other borrowings
|
653
|
|
112
|
|
82
|
|
||||||
|
TOTAL INTEREST EXPENSE
|
17,469
|
|
9,645
|
|
6,338
|
|
||||||
|
NET INTEREST INCOME
|
131,652
|
|
116,579
|
|
107,857
|
|
||||||
|
Provision for loan losses
|
4,700
|
|
5,768
|
|
5,295
|
|
||||||
|
NET INTEREST INCOME AFTER PROVISION FOR LOAN LOSSES
|
126,952
|
|
110,811
|
|
102,562
|
|
||||||
|
NON-INTEREST INCOME:
|
|
|
|
|
|
|
||||||
|
Trust and financial services
|
5,036
|
|
5,286
|
|
5,001
|
|
||||||
|
Service charges and fees on deposit accounts
|
11,795
|
|
11,733
|
|
11,895
|
|
||||||
|
Other service charges and fees
|
14,012
|
|
13,012
|
|
12,499
|
|
||||||
|
Securities gain (loss), net
|
44
|
|
2
|
|
59
|
|
||||||
|
Insurance commissions
|
133
|
|
144
|
|
74
|
|
||||||
|
Gain on sale of mortgage loans
|
2,573
|
|
1,829
|
|
1,688
|
|
||||||
|
Other
|
4,859
|
|
6,200
|
|
4,722
|
|
||||||
|
TOTAL NON-INTEREST INCOME
|
38,452
|
|
38,206
|
|
35,938
|
|
||||||
|
NON-INTEREST EXPENSES:
|
|
|
|
|
|
|
||||||
|
Salaries and employee benefits
|
54,827
|
|
50,658
|
|
50,116
|
|
||||||
|
Occupancy expense
|
7,600
|
|
7,030
|
|
6,897
|
|
||||||
|
Equipment expense
|
8,244
|
|
6,827
|
|
7,186
|
|
||||||
|
Federal Deposit Insurance
|
693
|
|
929
|
|
915
|
|
||||||
|
Other
|
33,041
|
|
25,845
|
|
23,633
|
|
||||||
|
TOTAL NON-INTEREST EXPENSE
|
104,405
|
|
91,289
|
|
88,747
|
|
||||||
|
INCOME BEFORE INCOME TAXES
|
60,999
|
|
57,728
|
|
49,753
|
|
||||||
|
Provision for income taxes
|
12,127
|
|
11,145
|
|
20,622
|
|
||||||
|
NET INCOME
|
48,872
|
|
46,583
|
|
29,131
|
|
||||||
|
OTHER COMPREHENSIVE INCOME
|
|
|
|
|
|
|
||||||
|
Change in unrealized gains/(losses) on securities, net of reclassifications and taxes
|
20,998
|
|
(8,861
|
)
|
3,335
|
|
||||||
|
Change in funded status of post-retirement benefits, net of taxes
|
(5,045
|
)
|
2,477
|
|
(3,875
|
)
|
||||||
|
COMPREHENSIVE INCOME
|
$
|
64,825
|
|
$
|
40,199
|
|
$
|
28,591
|
|
|||
|
EARNINGS PER SHARE:
|
|
|
|
|
|
|
||||||
|
BASIC AND DILUTED
|
$
|
3.80
|
|
$
|
3.80
|
|
$
|
2.38
|
|
|||
|
Weighted average number of shares outstanding (in thousands)
|
12,865
|
|
12,256
|
|
12,225
|
|
||||||
See accompanying notes.
44
CONSOLIDATED STATEMENTS OF CHANGES IN SHAREHOLDERS' EQUITY
|
Common
|
Additional
|
Retained
|
Accumulated
Other
Comprehensive
|
Treasury
|
||||||||||||||||||||
|
(Dollar amounts in thousands, except per share data)
|
Stock
|
Capital
|
Earnings
|
Income/(Loss)
|
Stock
|
Total
|
||||||||||||||||||
|
Balance, January 1, 2017
|
$
|
1,820
|
|
$
|
74,525
|
|
$
|
421,826
|
|
$
|
(14,164
|
)
|
$
|
(69,612
|
)
|
$
|
414,395
|
|
||||||
|
Net income
|
—
|
|
—
|
|
29,131
|
|
—
|
|
—
|
|
29,131
|
|
||||||||||||
|
Other comprehensive income (loss)
|
—
|
|
—
|
|
—
|
|
(540
|
)
|
—
|
|
(540
|
)
|
||||||||||||
|
Omnibus Equity Incentive Plan, net
|
2
|
|
704
|
|
—
|
|
—
|
|
—
|
|
706
|
|
||||||||||||
|
Treasury stock purchases (9,524 shares)
|
—
|
|
—
|
|
—
|
|
—
|
|
(503
|
)
|
(503
|
)
|
||||||||||||
|
Contribution of 22,714 shares to ESOP
|
—
|
|
395
|
|
—
|
|
—
|
|
667
|
|
1,062
|
|
||||||||||||
|
Cash Dividends, $2.51 per share
|
—
|
|
—
|
|
(30,682
|
)
|
—
|
|
—
|
|
(30,682
|
)
|
||||||||||||
|
Balance, December 31, 2017
|
1,822
|
|
75,624
|
|
420,275
|
|
(14,704
|
)
|
(69,448
|
)
|
413,569
|
|
||||||||||||
|
Net income
|
—
|
|
—
|
|
46,583
|
|
—
|
|
—
|
|
46,583
|
|
||||||||||||
|
Other comprehensive income (loss)
|
—
|
|
—
|
|
—
|
|
(6,384
|
)
|
—
|
|
(6,384
|
)
|
||||||||||||
|
Omnibus Equity Incentive Plan, net
|
2
|
|
743
|
|
—
|
|
—
|
|
—
|
|
745
|
|
||||||||||||
|
Treasury stock purchases (8,639 shares)
|
—
|
|
—
|
|
—
|
|
—
|
|
(391
|
)
|
(391
|
)
|
||||||||||||
|
Contribution of 23,250 shares to ESOP
|
—
|
|
407
|
|
—
|
|
—
|
|
680
|
|
1,087
|
|
||||||||||||
|
ASU 2018-02 adjustment
|
—
|
|
—
|
|
2,366
|
|
(2,366
|
)
|
—
|
|
—
|
|
||||||||||||
|
Cash Dividends, $1.02 per share
|
—
|
|
—
|
|
(12,508
|
)
|
—
|
|
—
|
|
(12,508
|
)
|
||||||||||||
|
Balance, December 31, 2018
|
1,824
|
|
76,774
|
|
456,716
|
|
(23,454
|
)
|
(69,159
|
)
|
442,701
|
|
||||||||||||
|
Net income
|
—
|
|
—
|
|
48,872
|
|
—
|
|
—
|
|
48,872
|
|
||||||||||||
|
Other comprehensive income (loss)
|
—
|
|
—
|
|
—
|
|
15,953
|
|
—
|
|
15,953
|
|
||||||||||||
|
Omnibus Equity Incentive Plan, net
|
3
|
|
798
|
|
—
|
|
—
|
|
—
|
|
801
|
|
||||||||||||
|
Treasury stock purchases (7,866 shares)
|
—
|
|
—
|
|
—
|
|
—
|
|
(315
|
)
|
(315
|
)
|
||||||||||||
|
Contribution of 28,470 shares to ESOP
|
—
|
|
422
|
|
—
|
|
—
|
|
829
|
|
1,251
|
|
||||||||||||
|
Acquisition of HopFed, Inc. (1,423,143 shares)
|
178
|
|
61,700
|
|
—
|
|
—
|
|
—
|
|
61,878
|
|
||||||||||||
|
Cash Dividends, $1.04 per share
|
—
|
|
—
|
|
(13,533
|
)
|
—
|
|
—
|
|
(13,533
|
)
|
||||||||||||
|
Balance, December 31, 2019
|
$
|
2,005
|
|
$
|
139,694
|
|
$
|
492,055
|
|
$
|
(7,501
|
)
|
$
|
(68,645
|
)
|
$
|
557,608
|
|
||||||
See accompanying notes.
45
CONSOLIDATED STATEMENTS OF CASH FLOWS
|
|
Years Ended December 31,
|
|||||||||||
|
(Dollar amounts in thousands, except per share data)
|
2019
|
2018
|
2017
|
|||||||||
|
CASH FLOWS FROM OPERATING ACTIVITIES:
|
|
|
|
|
|
|
||||||
|
Net Income
|
$
|
48,872
|
|
$
|
46,583
|
|
$
|
29,131
|
|
|||
|
Adjustments to reconcile net income to net cash provided by operating activities:
|
|
|
|
|
|
|
||||||
|
Net (accretion) amortization on securities
|
4,848
|
|
3,622
|
|
3,786
|
|
||||||
|
Provision for loan losses
|
4,700
|
|
5,768
|
|
5,295
|
|
||||||
|
Securities (gains) losses
|
(44
|
)
|
(2
|
)
|
(59
|
)
|
||||||
|
Depreciation and amortization
|
4,826
|
|
4,164
|
|
4,426
|
|
||||||
|
Provision for deferred income taxes
|
(2,841
|
)
|
(2,428
|
)
|
(4,241
|
)
|
||||||
|
Net change in accrued interest receivable
|
(903
|
)
|
(1,057
|
)
|
(602
|
)
|
||||||
|
Contribution of shares to ESOP
|
1,251
|
|
1,087
|
|
1,062
|
|
||||||
|
Stock compensation expense
|
801
|
|
745
|
|
706
|
|
||||||
|
Gain on sale of mortgage loans
|
(2,573
|
)
|
(1,829
|
)
|
(1,688
|
)
|
||||||
|
Loss (gain) on sales of other real estate
|
44
|
|
86
|
|
108
|
|
||||||
|
Origination of loans held for sale
|
(79,454
|
)
|
(57,418
|
)
|
(62,712
|
)
|
||||||
|
Proceeds from loans held for sale
|
79,454
|
|
62,098
|
|
66,265
|
|
||||||
|
Other, net
|
(9,080
|
)
|
(3,971
|
)
|
8,658
|
|
||||||
|
NET CASH FROM OPERATING ACTIVITIES
|
49,901
|
|
57,448
|
|
50,135
|
|
||||||
|
CASH FLOWS FROM INVESTING ACTIVITIES:
|
|
|
|
|
|
|
||||||
|
Sales of securities available-for-sale
|
3,259
|
|
—
|
|
9,743
|
|
||||||
|
Calls, maturities and principal reductions on securities available-for-sale
|
181,763
|
|
143,157
|
|
141,819
|
|
||||||
|
Purchases of securities available-for-sale
|
(129,466
|
)
|
(124,333
|
)
|
(111,138
|
)
|
||||||
|
Loans made to customers, net of payments
|
(47,169
|
)
|
(52,905
|
)
|
(72,463
|
)
|
||||||
|
Net change in federal funds sold
|
(7,500
|
)
|
—
|
|
6,952
|
|
||||||
|
Redemption of restricted stock
|
3,588
|
|
—
|
|
—
|
|
||||||
|
Purchase of restricted stock
|
(4,164
|
)
|
(11
|
)
|
(20
|
)
|
||||||
|
Cash received (disbursed) from acquisitions
|
(32,830
|
)
|
—
|
|
—
|
|
||||||
|
Sale of other real estate
|
756
|
|
1,781
|
|
1,419
|
|
||||||
|
Additions to premises and equipment
|
(1,103
|
)
|
(2,013
|
)
|
(2,979
|
)
|
||||||
|
NET CASH FROM INVESTING ACTIVITIES
|
(32,866
|
)
|
(34,324
|
)
|
(26,667
|
)
|
||||||
|
CASH FLOWS FROM FINANCING ACTIVITIES:
|
|
|
|
|
|
|
||||||
|
Net change in deposits
|
104,113
|
|
(21,926
|
)
|
30,121
|
|
||||||
|
Net change in short-term borrowings
|
(55,147
|
)
|
11,970
|
|
(23,303
|
)
|
||||||
|
Dividends paid
|
(12,648
|
)
|
(12,496
|
)
|
(30,556
|
)
|
||||||
|
Purchases of treasury stock
|
(315
|
)
|
(391
|
)
|
(503
|
)
|
||||||
|
Proceeds from other borrowings
|
217,000
|
|
115,600
|
|
170,000
|
|
||||||
|
Repayments on other borrowings
|
(217,000
|
)
|
(115,600
|
)
|
(170,132
|
)
|
||||||
|
NET CASH FROM FINANCING ACTIVITIES
|
36,003
|
|
(22,843
|
)
|
(24,373
|
)
|
||||||
|
Continued
|
||||||||||||
46
|
NET CHANGE IN CASH AND CASH EQUIVALENTS
|
53,038
|
|
281
|
|
(905
|
)
|
||||||
|
CASH AND DUE FROM BANKS, BEGINNING OF YEAR
|
74,388
|
|
74,107
|
|
75,012
|
|
||||||
|
CASH AND DUE FROM BANKS, END OF YEAR
|
$
|
127,426
|
|
$
|
74,388
|
|
$
|
74,107
|
|
|||
|
SUPPLEMENTAL DISCLOSURES OF CASH FLOW AND NONCASH INFORMATION:
|
|
|
|
|
|
|
||||||
|
Cash paid for the year for:
|
|
|
|
|
|
|
||||||
|
Interest
|
$
|
16,339
|
|
$
|
9,408
|
|
$
|
6,337
|
|
|||
|
Income Taxes
|
$
|
9,595
|
|
$
|
7,185
|
|
$
|
11,158
|
|
|||
See accompanying notes.
47
NOTES TO CONSOLIDATED FINANCIAL STATEMENTS
|
1.
|
BUSINESS AND SIGNIFICANT ACCOUNTING POLICIES:
|
BUSINESS
Organization:
The consolidated financial statements of First Financial Corporation and its subsidiaries (the Corporation) include the parent company and its wholly-owned subsidiaries, First Financial Bank, N.A. headquartered in Vigo County, Indiana, The Morris Plan Company of Terre Haute (Morris Plan), First Chanticleer Corporation, a property rental entity headquartered in Terre Haute, Indiana, and FFB Risk Management Co., Inc., a captive insurance subsidiary headquartered in Las Vegas, Nevada. Inter-company transactions and balances have been eliminated.
First Financial Bank also has
two
investment subsidiaries, Portfolio Management Specialists A (Specialists A) and Portfolio Management Specialists B (Specialists B), which were established to hold and manage certain assets as part of a strategy to better manage various income streams and provide opportunities for capital creation as needed. Specialists A and Specialists B subsequently entered into a limited partnership agreement, Global Portfolio Limited Partners. Portfolio Management Specialists B also owns First Financial Real Estate, LLC. At
December 31, 2019
,
$784.4 million
of securities and loans were owned by these subsidiaries. Specialists A, Specialists B, Global Portfolio Limited Partners and First Financial Real Estate LLC are included in the consolidated financial statements.
The Corporation, which is headquartered in Terre Haute, Indiana, offers a wide variety of financial services including commercial, mortgage and consumer lending, lease financing, trust account services and depositor services through its four subsidiaries. The Corporation's primary source of revenue is derived from loans to customers and investment activities.
The Corporation operates 82 branches in west-central Indiana, east-central Illinois, western Kentucky, and middle and western Tennessee. First Financial Bank is the largest bank in Vigo County. It operates ten full-service banking branches within the county;
one
in Daviess County, Indiana.; three in Clay County, Indiana;
one
in Greene County, Indiana; two in Knox County, Indiana; four in Parke County, Indiana;
one
in Putnam County, Indiana;
four
in Sullivan County, Indiana;
one
in Vanderburgh County, Indiana,;
four
in Vermillion County, Indiana; four in Champaign County, Illinois;
one
in Clark County, Illinois;
three
in Coles County, Illinois;
two
in Crawford County, Illinois;
two
in Franklin County, Illinois;
one
in Jasper County, Illinois;
two
in Jefferson County, Illinois;
one
in Lawrence County, Illinois;
two
in Livingston County, Illinois;
two
in Marion County, Illinois;
three
in McLean County, Illinois;
two
in Richland County, Illinois; six in Vermilion County, Illinois;
one
in Wayne County, Illinois;
two in Calloway County, Kentucky; three in Christian County, Kentucky; two in Fulton County, Kentucky; two in Marshall County, Kentucky; one in Todd County, Kentucky; one in Trigg County, Kentucky; three in Cheatham County, Tennessee; one in Houston County, Tennessee; and three in Montgomery County, Tennessee. There are three loan production offices, one in Marion County, Indiana; one in Rutherford County, Tennessee; and one in Williamson County, Tennessee.
The bank also has a main office in downtown Terre Haute and an operations center/office building in southern Terre Haute.
Regulatory Agencies:
First Financial Corporation is a multi-bank holding company and as such is regulated by various banking agencies. The holding company is regulated by the Seventh District of the Federal Reserve System. The national bank subsidiary is regulated by the Office of the Comptroller of the Currency. The state bank subsidiary is jointly regulated by the state banking organization and the Federal Deposit Insurance Corporation. FFB Risk Management Company is regulated by the State of Nevada Division of Insurance.
SIGNIFICANT ACCOUNTING POLICIES
Use of Estimates:
To prepare financial statements in conformity with U.S. generally accepted accounting principles, management makes estimates and assumptions based on available information. These estimates and assumptions affect the amounts reported in the financial statements and disclosures provided, and actual results could differ.
Cash Flows
: Cash and cash equivalents include cash and demand deposits with other financial institutions. Cash flows are reported for customer loan and deposit transactions and short-term borrowings. Non-cash transactions include loans transferred to other real estate of
$0.5 million
,
$0.6 million
and
$0.9 million
for the years ended
December 31, 2019
,
2018
and
2017
respectively. Additionally, there was a non-cash transaction for lease liabilities arising from obtaining right-of-use assets of $6.7 million for the year ended December 31, 2019.
Securities
: The Corporation classifies all securities as "available for sale." Securities are classified as available for sale when they might be sold before maturity. Securities available for sale are carried at fair value with unrealized holdings gains and losses, net of taxes, reported in other comprehensive income within shareholders' equity.
48
Interest income includes amortization of purchase premium or discount. Premiums and discounts are amortized on the level yield method without anticipating prepayments. Mortgage-backed securities are amortized over the expected life. Realized gains and losses on sales are based on the amortized cost of the security sold. Management evaluates securities for other-than temporary impairment (OTTI) at least on a quarterly basis, and more frequently when economic or market conditions warrant such an evaluation.
Loans:
Loans that management has the intent and ability to hold for the foreseeable future until maturity or pay-off are reported at the principal balance outstanding, net of unearned interest, purchase premiums and discounts, deferred loan fees and costs, and allowance for loan losses. Loans held for sale are reported at the lower of cost or fair value, on an aggregate basis. Interest income is accrued on the unpaid principal balance and includes amortization of net deferred loan fees and costs over the loan term without anticipating prepayments. The recorded investment in loans includes accrued interest receivable and net deferred loan fees and costs. Interest income is not reported when full loan repayment is in doubt, typically when the loan is impaired or payments are significantly past due. Past-due status is based on the contractual terms of the loan.
All interest accrued but not received for loans placed on non-accrual is reversed against interest income. Interest received on such loans is accounted for on the cash-basis or cost-recovery method, until qualifying for return to accrual. Loans are returned to accrual status when all the principal and interest amounts contractually due are brought current and future payments are reasonably assured. In all cases, loans are placed on non-accrual or charged-off if collection of principal or interest is considered doubtful. The above policies are consistent for all segments of loans.
Certain Purchased Loans:
The Corporation purchases individual loans and groups of loans, some of which have shown evidence of credit deterioration since origination. These purchased loans are recorded at the amount paid, such that there is no carryover of the seller's allowance for loan losses. After acquisition, losses are recognized by an increase in the allowance for loan losses. Such purchased loans are accounted for individually. The Corporation estimates the amount and timing of expected cash flows for each
purchased loan, and the expected cash flows in excess of amount paid are recorded as interest income over the remaining life of the loan (accretable yield). The excess of the loan's contractual principal and interest over expected cash flows is not recorded (nonaccretable difference).
Over the life of the loan, expected cash flows continue to be estimated. If the present value of expected cash flows is less than the carrying amount, a provision for loan loss is recorded. If the present value of expected cash flows is greater than the carrying amount, it is recognized as part of future interest income.
Concentration of Credit Risk:
Most of the Corporation's business activity is with customers located within west central Indiana and east central Illinois. Therefore, the Corporation's exposure to credit risk is significantly affected by changes in the economy of this area. A major economic downturn in this area would have a negative effect on the Corporation's loan portfolio.
The risk characteristics of each loan portfolio segment are as follows:
Commercial
Commercial loans are predominately loans to expand a business or finance asset purchases. The underlying risk in the Commercial loan segment is primarily a function of the reliability and sustainability of the cash flows of the borrower and secondarily on the underlying collateral securing the transaction. From time to time, the cash flows of borrowers may be less than historical or as planned. In addition, the underlying collateral securing these loans may fluctuate in value. Most commercial loans are secured by the assets financed or other business assets and most commercial loans are further supported by a personal guarantee. However, in some instances, short term loans are made on an unsecured basis. Agriculture production loans are typically secured by growing crops and generally secured by other assets such as farm equipment. Production loans are subject to weather and market pricing risks. The Corporation has established underwriting standards and guidelines for all commercial loan types.
The Corporation strives to maintain a geographically diverse commercial real estate portfolio. Commercial real estate loans are primarily underwritten based upon the cash flows of the underlying real estate or from the cash flows of the business conducted at the real estate. Generally, these types of loans will be fully guaranteed by the principal owners of the real estate and loan amounts must be supported by adequate collateral value. Commercial real estate loans may be adversely affected by factors in the local market, the regional economy, or industry specific factors. In addition, Commercial Construction loans are a specific type of commercial real estate loan which inherently carry more risk than loans for completed projects. Since these types of loans are underwritten utilizing estimated costs, feasibility studies, and estimated absorption rates, the underlying value of the project may change based upon the inaccuracy of these projections. Commercial construction loans are closely monitored, subject to industry standards, and disbursements are controlled during the construction process.
49
Residential
Retail real estate mortgages that are secured by 1-4 family residences are generally owner occupied and include residential real estate and residential real estate construction loans. The Corporation typically establishes a maximum loan-to-value ratio and generally requires private mortgage insurance if the ratio is exceeded. The Corporation sells substantially all of its long-term fixed mortgages to secondary market purchasers. Mortgages sold to secondary market purchasers are underwritten to specific guidelines. The Corporation originates some mortgages that are maintained in the bank’s loan portfolio. Portfolio loans are generally adjustable rate mortgages and are underwritten to conform to Qualified Mortgage standards. Several factors are considered in underwriting all Mortgages including the value of the underlying real estate, debt-to-income ratio and credit history of the borrower. Repayment is primarily dependent upon the personal income of the borrower and can be impacted by changes in borrower’s circumstances such as changes in employment status and changes in real estate property values. Risk is mitigated by the sale of substantially all long-term fixed rate mortgages, the underwriting of portfolio loans to Qualified Mortgage standards and the fact that mortgages are generally smaller individual amounts spread over a large number of borrowers.
Consumer
The consumer portfolio primarily consists of home equity loans and lines (typically secured by a subordinate lien on a 1-4 family residence), secured loans (typically secured by automobiles, boats, recreational vehicles, or motorcycles), cash/CD secured, and unsecured loans. Pricing, loan terms, and loan to value guidelines vary by product line. The underlying value of collateral dependent loans may vary based on a number of economic conditions, including fluctuations in home prices and unemployment levels. Underwriting of consumer loans is based on the individual credit profile and analysis of the debt repayment capacity for each borrower. Payments for consumer loans is typically set-up on equal monthly installments, however, future repayment may be impacted by a change in economic conditions or a change in the personal income levels of individual customers. Overall risks within the consumer portfolio are mitigated by the mix of various loan products, lending in various markets and the overall make-up of the portfolio (small loan sizes and a large number of individual borrowers).
Allowance for Loan Losses:
The allowance for loan losses is a valuation allowance for probable incurred credit losses. Loan losses are charged against the allowance when management believes the uncollectibility of a loan balance is confirmed. Subsequent recoveries, if any, are credited to the allowance. Management estimates the allowance balance required using past loan loss experience, the nature and volume of the portfolio, information about specific borrower situations and estimated collateral values, economic conditions and other factors. Allocations of the allowance may be made for specific loans, but the entire allowance is available for any loan that, in management's judgment, should be charged off. The allowance consists of specific and general components. The specific component relates to loans that are individually classified as impaired. The general component covers non-classified loans as well as non-impaired classified loans and is based on historical loss experience adjusted for current factors.
A loan is impaired when full payment under the loan terms is not expected. Loans for which the terms have been modified, and for which the borrower is experiencing financial difficulties, are considered troubled debt restructurings and classified as impaired. Impairment is evaluated in total for smaller-balance loans of similar nature such as residential mortgages and consumer loans, and on an individual basis for other loans. If a loan is impaired, a portion of the allowance is allocated so that the loan is reported, net, at the present value of estimated future cash flows, using the loan's existing rate, or at the fair value of collateral if repayment is expected solely from the collateral. Large groups of smaller balance homogeneous loans, such as consumer and residential real estate loans, are collectively evaluated for impairment and, accordingly, they are not separately identified for impairment disclosures.
The general component covers non-classified loans as well as non-impaired classified loans and is based on historical loss experience adjusted for current factors. The historical loss experience is based on the actual loss history experienced over the most recent four years. This actual loss experience is supplemented with other current factors based on the risks present for each portfolio segment. These current factors include consideration of the following: levels of and trends in delinquent, classified, and impaired loans; levels of and trends in charge-offs and recoveries; national and local economic trends and conditions; changes in lending policies and procedures; trends in volume and terms of loans; experience, ability, and depth of lending management and other relevant staff; credit concentrations; value of underlying collateral for collateral dependent loans; and other external factors such as competition and legal and regulatory requirements. The following portfolio segments have been identified: commercial loans, residential loans and consumer loans. A characteristic of the commercial loan segment is that the loans are for business purchases. A characteristic of the residential loan segment is that the loans are secured by residential properties. A characteristic of the consumer loan segment is that the loans are for automobiles and other consumer purchases. Commercial loans are generally well secured, which mitigates the risk of loss and has contributed to the low historical loss rate. However, concentrations in commercial real estate, along with the potential impact of rising interest rates to commercial real estate, raises the risk of loss on commercial loans. For these reasons, commercial loans have the highest adjustment to the historical loss rate. Continued weakness in local
50
economic conditions along with declining auto values resulted in consumer loans having the next highest level of adjustment to the historical loss rate. The residential loan portfolio segment had the lowest level of adjustment to the historical loss rate.
Troubled debt restructurings are separately identified for impairment disclosures and are measured at the present value of estimated future cash flows using the loan's effective rate at inception. If a troubled debt restructuring is considered to be a collateral dependent loan, the loan is reported, net, at the fair value of the collateral. For troubled debt restructurings that subsequently default, the Corporation determines the amount of reserve in accordance with the accounting policy for the allowance for loan losses.
Foreclosed Assets:
Assets acquired through or instead of loan foreclosures are initially recorded at fair value less estimated selling costs when acquired, establishing a new cost basis. Physical possession of residential real estate property collateralizing a consumer mortgage loan occurs when legal title is obtained upon completion of foreclosure or when the borrower conveys all interest in the property to satisfy the loan through completion of a deed in lieu of foreclosure or similar legal agreement. These assets are subsequently accounted for at lower of cost or fair value less estimated costs to sell. If fair value declines, a valuation allowance is recorded through expense. Costs after acquisition are expensed.
Premises and Equipment:
Land is carried at cost. Premises and equipment are stated at cost less accumulated depreciation. Depreciation is computed over the useful lives of the assets, which range from
3
to
5
years for furniture and equipment and
33
to
39
years for buildings and leasehold improvements.
Restricted Stock:
Restricted stock includes Federal Home Loan Bank (FHLB) of Indianapolis and Federal Reserve stock. This restricted stock is carried at cost and periodically evaluated for impairment. Because this stock is viewed as a long-term investment, impairment is based on ultimate recovery of par value. Both cash and stock dividends are reported as income.
Servicing Rights:
Servicing rights are recognized separately when they are acquired through sales of loans. When mortgage loans are sold, servicing rights are initially recorded at fair value with the income statement effect recorded in gains on sales of loans. Fair value is based on market prices for comparable mortgage servicing contracts, when available, or alternatively, is based on third-party valuations that incorporate assumptions that market participants would use in estimating future net servicing income, such as the cost to service, the discount rate, ancillary income, prepayment speeds and default rates and losses. All classes of servicing assets are subsequently measured using the amortization method, which requires servicing rights to be amortized into non-interest income in proportion to, and over the period of, the estimated future net servicing income of the underlying loans.
Servicing assets are evaluated for impairment based upon the fair value of the rights as compared to carrying amount. Impairment is determined by stratifying rights into groupings based on predominant risk characteristics, such as interest rate, loan type and investor type. Impairment is recognized through a valuation allowance for an individual grouping, to the extent that fair value is less than the carrying amount. If the Corporation later determines that all or a portion of the impairment no longer exists for a particular grouping, a reduction of the allowance may be recorded as an increase to income. Changes in valuation allowances are reported with Other Service Charges and Fees on the income statement. The fair values of servicing rights are subject to significant fluctuations as a result of changes in estimated and actual prepayment speeds and default rates and losses.
Servicing fee income, which is included in Other Service Charges and Fees on the income statement, is for fees earned for servicing loans.
The fees are based on a contractual percentage of the outstanding principal or a fixed amount per loan and are recorded as income when earned. The amortization of mortgage servicing rights is netted against loan servicing fee income. Servicing fees totaled
$1.3 million
,
$1.3 million
and
$1.3 million
for the years ended
December 31, 2019
,
2018
and
2017
. Late fees and ancillary fees related to loan servicing are not material.
Stock based compensation:
Compensation cost is recognized for restricted stock awards and units issued to employees based on the fair value of these awards at the date of grant. Market price of the Corporation’s common stock at the date of grant is used for restricted stock awards. Compensation expense is recognized over the requisite service period.
Transfers of Financial Assets:
Transfers of financial assets are accounted for as sales, when control over the assets has been
relinquished. Control over transferred assets is deemed to be surrendered when the assets have been isolated from the Corporation, the transferee obtains the right (free of conditions that constrain it from taking advantage of that right) to pledge or exchange the transferred assets, and the Corporation does not maintain effective control over the transferred assets through an agreement to repurchase them before their maturity.
51
Bank-Owned Life Insurance:
The Corporation has purchased life insurance policies on certain key executives. Bank-owned life insurance is recorded at its cash surrender value, or the amount that can be realized. Income on the investments in life insurance is included in other interest income.
Goodwill and Other Intangible Assets:
Goodwill resulting from business combinations prior to January 1, 2009 represents the excess of the purchase price over the fair value of the net assets of businesses acquired. Goodwill resulting from business combinations after January 1, 2009 represents the future economic benefits arising from other assets acquired that are not individually identified and separately recognized. Goodwill and intangible assets acquired in a purchase business combination and determined to have an indefinite useful life are not amortized, but tested for impairment at least annually. The Corporation has selected December 31 as the date to perform the annual impairment test. Intangible assets with definite useful lives are amortized over their estimated useful lives to their estimated residual values. Goodwill is the only intangible asset with an indefinite life on our balance sheet.
Other intangible assets consist of core deposit assets arising from the whole bank and branch acquisitions. They are initially measured at fair value and then are amortized on an accelerated basis over their estimated useful lives, which are
10
and
12
years, respectively.
Long-Term Assets:
Premises and equipment and other long-term assets are reviewed for impairment when events indicate their carrying amount may not be recoverable from future undiscounted cash flows. If impaired, the assets are recorded at fair value.
Benefit Plans:
Pension expense is the net of service and interest cost, return on plan assets and amortization of gains and losses not immediately recognized. The amount contributed is determined by a formula as decided by the Board of Directors. Deferred compensation and supplemental retirement plan expense allocates the benefits over years of service.
Employee Stock Ownership Plan:
Shares of treasury stock are issued to the ESOP and compensation expense is recognized based upon the total market price of shares when contributed.
Deferred Compensation Plan:
Prior to 2011, a deferred compensation plan covered all directors. Under the plan, the Corporation pays each director, or their beneficiary, the amount of fees deferred plus interest over
10
years, beginning when the director achieves age
65
. A liability is accrued for the obligation under these plans. The expense incurred for the deferred compensation for each of the last three years was
$109 thousand
,
$98 thousand
and
$95 thousand
, resulting in a deferred compensation liability of
$1.7 million
at
December 31, 2019
and
$1.9 million
at
December 31, 2018
. There are no deferred compensation plans now in effect for directors.
Incentive Plans:
A long-term incentive plan established in 2000 provides for the payment of incentive rewards as a
15
-year annuity to all directors and certain key officers. That plan was in place through December 31, 2009, and compensation expense is recognized over the service period. Payments under the plan generally did not begin until the earlier of January 1, 2015, or the January 1 immediately following the year in which the participant reaches age
65
. There was no compensation expense related to this plan for
2019
,
2018
and
2017
. There is a liability of
$7.6 million
and
$8.5 million
as of year-end
2019
and
2018
. In 2011 the Corporation adopted the 2011 Short-term Incentive Plan and the 2011 Omnibus Equity Incentive Plan designed to reward key officers based on certain performance measures. The short-term portion of the plan is paid out within 75 days of year end and the long-term plan vests over a
three
year period and is paid out within 75 days of the end of each vesting period. The compensation expense related to the plans in
2019
,
2018
and
2017
was
$1.9 million
,
$1.7 million
and
$1.6 million
, respectively, and resulted in a liability of
$1.0 million
at
December 31, 2019
and
$899 thousand
at
December 31, 2018
.
The Omnibus Equity Incentive Plan is a long term incentive plan that was designed to align the interests of participants with the interest of shareholders. Under the plan, awards may be made based on certain performance measures. The grants are made in restricted stock units that are subject to a vesting schedule.
Income Taxes:
Income tax expense is the total of the current year income tax due or refundable and the change in deferred tax assets and liabilities. Deferred tax assets and liabilities are the expected future tax amounts for the temporary differences between carrying amounts and tax bases of assets and liabilities, computed using enacted tax rates. A valuation allowance, if needed, reduces deferred tax assets to the amount expected to be realized.
A tax position is recognized as a benefit only if it is "more likely than not" that the tax position would be sustained in a tax examination, with a tax examination being presumed to occur.
The amount recognized is the largest amount of tax benefit that is greater than 50% likely of being realized on examination.
For tax positions not meeting the "more likely than not" test, no tax benefit is recorded.
52
The Corporation recognizes interest and/or penalties related to income tax matters in income tax expense.
Loan Commitments and Related Financial Instruments:
Financial instruments include credit instruments, such as commitments to make loans and standby letters of credit, issued to meet customer financing needs. The face amount for these items represents the exposure to loss, before considering customer collateral or ability to repay. Such financial instruments are recorded when they are funded.
Earnings Per Share:
Earnings per common share is net income divided by the weighted average number of common shares outstanding during the period. The Corporation does not have any potentially dilutive securities as the restricted stock awards are included in outstanding shares.. Earnings and dividends per share are restated for stock splits and dividends through the date of issue of the financial statements.
Comprehensive Income:
Comprehensive income consists of net income and other comprehensive income. Other comprehensive income includes unrealized gains and losses on securities available for sale and changes in the funded status of the retirement plans, net of taxes, which are also recognized as separate components of equity.
Loss Contingencies:
Loss contingencies, including claims and legal actions arising in the ordinary course of business, are recorded as liabilities when the likelihood of loss is probable and an amount of range of loss can be reasonably estimated. Management does not believe there are currently such matters that will have a material effect on the financial statements.
Dividend Restriction:
Banking regulations require maintaining certain capital levels and may limit the dividends paid by the bank to the holding company or by the holding company to shareholders.
Fair Value of Financial Instruments:
Fair values of financial instruments are estimated using relevant market information and other assumptions, as more fully disclosed in a separate note. Fair value estimates involve uncertainties and matters of significant judgment regarding interest rates, credit risk, prepayments and other factors, especially in the absence of broad markets for particular items. Changes in assumptions or market conditions could significantly affect the estimates.
Operating Segment:
While the Corporation's chief decision-makers monitor the revenue streams of the various products and services, the operating results of significant segments are similar and operations are managed and financial performance is evaluated on a corporate-wide basis. Accordingly, all of the Corporation's financial service operations are considered by management to be aggregated in one reportable operating segment, which is banking.
Accounting Pronouncements Adopted:
In February 2016, the Financial Accounting Standards Board ("FASB") issued Accounting Standards Update ("ASU") No. 2016-02, Leases. The FASB issued this ASU to increase transparency and comparability among organizations by recognizing lease assets and lease liabilities on the balance sheet by lessees for those leases classified as operating leases under current U.S. GAAP and disclosing key information about leasing arrangements. The new standard was adopted by the Corporation on January 1, 2019. ASU 2016-02 provides for a modified retrospective transition approach requiring lessees to recognize and measure leases on the balance sheet at the beginning of either the earliest period presented or as of the beginning of the period of adoption. The Corporation elected to apply ASU 2016-02 as of the beginning of the period of adoption (January 1, 2019) and did not restate comparative periods. Adoption of ASU 2016-02 resulted in the recognition of lease liabilities totaling $7 million and the recognition of right-of- use assets totaling $7 million as of the date of adoption. Lease liabilities and right-of-use assets are reflected in other liabilities and other assets, respectively. The initial balance sheet gross up upon adoption was primarily related to operating leases of certain real estate properties. The Corporation has no finance leases or material subleases or leasing arrangements for which it is the lessor of property or equipment. The Corporation has elected to apply the package of practical expedients allowed by the new standard under which the Corporation need not reassess whether any expired or existing contracts are leases or contain leases, the Corporation need not reassess the lease classification for any expired or existing lease, and the Corporation need not reassess initial direct costs for any existing leases. Adoption of ASU 2016-02 did not materially change the Corporation’s recognition of lease expense. See Note 19 - Leases for additional disclosures related to leases.
In July 2018, the FASB issued ASU No. 2018-11, Leases - Targeted Improvements, to provide entities with relief from the costs
of implementing certain aspects of the new leasing standard, ASU No. 2016-02. Specifically, under the amendments in ASU
2018-11: (1) entities may elect not to recast the comparative periods presented when transitioning to the new leasing standard,
and (2) lessors may elect not to separate lease and non-lease components when certain conditions are met. The amendments
have the same effective date as ASU 2016-02 (January 1, 2019 for the Corporation). The Corporation elected both
transition options on January 1, 2019. ASU 2018-11 did not have a material impact on the Corporation’s financial statements.
53
Recently Issued Not Yet Effective Accounting Pronouncements
:
In June 2016 ASU 2016-13, Financial Instruments - Credit Losses (Topic 326): Measurement of Credit Losses on Financial Instruments (ASU 2016-13), was issued and requires entities to use a current expected credit loss ("CECL") model which is a new impairment model based on expected losses rather than incurred losses. Under this model an entity would recognize an impairment allowance equal to its current estimate of all contractual cash flows that the entity does not expect to collect from financial assets measured at amortized cost. The entity's estimate would consider relevant information about past events, current conditions, and reasonable and supportable forecasts, which will result in recognition of lifetime expected credit losses upon loan origination. ASU 2016-13 is effective for interim and annual reporting periods beginning after December 15, 2019, with early adoption permitted for annual reporting periods beginning after December 15, 2018.
The Corporation formed a cross-functional internal management committee and engaged a third party vendor to assist with the transition to the guidance set forth in this update. The new allowance model implemented by the Corporation estimates credit losses over the expected life of the portfolio and includes a qualitative framework to account for the drivers of losses that are not captured by the quantitative model. The results continue to be utilized to refine our models and estimation techniques. Documentation of new methodologies and internal controls that will be implemented as part of CECL as well as model validation is also being finalized. While the committee continues to analyze and modify calculations, the Corporation currently expects the adoption of ASU 2016-13 will result in an increase in allowance for loan losses amount at January 1, 2020 in the range of $15 million to $25 million. The allowance for credit losses also increased due to the requirement to record an allowance on acquired loan portfolios, previously recorded at fair value. Once finalized, the cumulative effect adjustment, as a result of the adoption of this guidance, will be recorded, net of tax, as an adjustment to retained earnings effective January 1, 2020. This estimate is subject to change as key assumptions are refined and model validations are finalized.
In January 2017, the FASB issued ASU No. 2017-04, “Simplifying the Test for Goodwill Impairment.” The guidance removes Step 2 of the goodwill impairment test, which requires a hypothetical purchase price allocation. Goodwill impairment will now be the amount by which a reporting unit’s carrying value exceeds its fair value, not to exceed the carrying amount of goodwill. All other goodwill impairment guidance will remain largely unchanged. ASU No. 2017-04 is effective for interim and annual reporting periods beginning after December 15, 2019, applied prospectively. Early adoption is permitted for any impairment tests performed after January 1, 2017. The Corporation is assessing ASU 2017-04 but does not expect a significant impact on its accounting and disclosures.
In August 2018, the FASB issued ASU No. 2018-13, Disclosure Framework - Changes to the Disclosure Requirements for Fair
Value Measurement. This ASU eliminates, adds and modifies certain disclosure requirements for fair value measurements.
Among the changes, entities will no longer be required to disclose the amount of and reasons for transfers between Level 1 and
Level 2 of the fair value hierarchy, but will be required to disclose the range and weighted average used to develop significant
unobservable inputs for Level 3 fair value measurements. ASU No. 2018-13 is effective for interim and annual reporting
periods beginning after December 15, 2019; early adoption is permitted. Entities are also allowed to elect early adoption the
eliminated or modified disclosure requirements and delay adoption of the new disclosure requirements until their effective date.
As ASU No. 2018-13 only revises disclosure requirements, it will not have a material impact on the Corporation’s financial
statements.
In August 2018, the FASB issued ASU No. 2018-14, Disclosure Framework - Changes to the Disclosure Requirements for
Defined Benefit Plans. This ASU makes minor changes to the disclosure requirements for employers that sponsor defined
benefit pension and/or other postretirement benefit plans. ASU 2018-14 is effective for fiscal years ending after December 15,
2020; early adoption is permitted. As ASU 2018-14 only revises disclosure requirements, it will not have a material impact on
the Corporation’s financial statements.
In September 2018, the FASB issued ASU No. 2018-15, Customer’s Accounting for Implementation Costs Incurred in a Cloud
Computing Arrangement That Is a Service Contract. This ASU requires an entity in a cloud computing arrangement (i.e.,
hosting arrangement) that is a service contract to follow the internal-use software guidance in ASC 350-40 to determine which
implementation costs to capitalize as assets or expense as incurred. Capitalized implementation costs should be presented in the
same line item on the balance sheet as amounts prepaid for the hosted service, if any (generally as an “other asset”). The
capitalized costs will be amortized over the term of the hosting arrangement, with the amortization expense being presented in
the same income statement line item as the fees paid for the hosted service. ASU 2018-15 is effective for interim and annual
reporting periods beginning after December 15, 2019; early adoption is permitted. ASU 2018-15 will not have a material
impact on the Corporation’s financial statements.
54
|
2.
|
FAIR VALUES OF FINANCIAL INSTRUMENTS:
|
Accounting guidance establishes a fair value hierarchy which requires an entity to maximize the use of observable inputs and minimize the use of unobservable inputs when measuring fair value. The standard describes three levels of inputs that may be used to measure fair value:
Level 1: Quoted prices (unadjusted) of identical assets or liabilities in active markets that the entity has the ability to access as of the measurement date.
Level 2: Significant other observable inputs other than Level 1 prices such as such as quoted prices for similar assets or liabilities; quoted prices in markets that are not active; or other inputs that are observable or can be corroborated by observable market data.
Level 3: Significant unobservable inputs that reflect a reporting entity's own assumptions about the assumptions that market participants would use in pricing an asset or liability.
The fair value of securities available-for-sale is determined by obtaining quoted prices on nationally recognized securities exchanges (Level 1 inputs) or matrix pricing, which is a mathematical technique widely used in the industry to value debt securities without relying exclusively on quoted prices for the specific securities but rather by relying on the securities' relationship to other benchmark quoted securities (Level 2 inputs).
For those securities that cannot be priced using quoted market prices or observable inputs, a Level 3 valuation is determined. These securities are primarily trust preferred securities, which are priced using Level 3 due to current market illiquidity, and state and municipal securities. The fair value of the trust preferred securities is obtained from a third party provider without adjustment. Management obtains values from other pricing sources to validate the Standard & Poors pricing that they currently utilizes. The fair value of state and municipal obligations are derived by comparing the securities to current market rates plus an appropriate credit spread to determine an estimated value. Illiquidity spreads are then considered. Credit reviews are performed on each of the issuers. The significant unobservable inputs used in the fair value measurement of the Corporation’s state and municipal obligations are credit spreads related to specific issuers. Significantly higher credit spread assumptions would result in significantly lower fair value measurement. Conversely, significantly lower credit spreads would result in a significantly higher fair value measurement.
The fair value of derivatives is based on valuation models using observable market data as of the measurement date (Level 2 inputs).
|
December 31, 2019
Fair Value Measurement Using
|
||||||||||||||||
|
(Dollar amounts in thousands)
|
Level 1
|
Level 2
|
Level 3
|
Carrying Value
|
||||||||||||
|
U.S. Government entity mortgage-backed securities
|
$
|
—
|
|
$
|
103,633
|
|
$
|
—
|
|
$
|
103,633
|
|
||||
|
Mortgage-backed securities, residential
|
—
|
|
243,382
|
|
—
|
|
243,382
|
|
||||||||
|
Mortgage-backed securities, commercial
|
—
|
|
22,104
|
|
—
|
|
22,104
|
|
||||||||
|
Collateralized mortgage obligations
|
—
|
|
281,311
|
|
—
|
|
281,311
|
|
||||||||
|
State and municipal obligations
|
—
|
|
261,869
|
|
2,565
|
|
264,434
|
|
||||||||
|
Municipal taxable
|
—
|
|
730
|
|
—
|
|
730
|
|
||||||||
|
U.S. Treasury
|
—
|
|
7,504
|
|
—
|
|
7,504
|
|
||||||||
|
Collateralized debt obligations
|
—
|
|
—
|
|
3,619
|
|
3,619
|
|
||||||||
|
TOTAL
|
$
|
—
|
|
$
|
920,533
|
|
$
|
6,184
|
|
$
|
926,717
|
|
||||
|
Derivative Assets
|
|
|
$
|
828
|
|
|
|
|
|
|||||||
|
Derivative Liabilities
|
|
|
(828
|
)
|
|
|
|
|
||||||||
55
|
December 31, 2018
Fair Value Measurement Using
|
||||||||||||||||
|
(Dollar amounts in thousands)
|
Level 1
|
Level 2
|
Level 3
|
Carrying Value
|
||||||||||||
|
U.S. Government entity mortgage-backed securities
|
$
|
—
|
|
$
|
25,364
|
|
$
|
—
|
|
$
|
25,364
|
|
||||
|
Mortgage-backed securities, residential
|
—
|
|
178,743
|
|
—
|
|
178,743
|
|
||||||||
|
Collateralized mortgage obligations
|
—
|
|
343,616
|
|
—
|
|
343,616
|
|
||||||||
|
State and municipal obligations
|
—
|
|
230,800
|
|
3,135
|
|
233,935
|
|
||||||||
|
Collateralized debt obligations
|
—
|
|
—
|
|
3,258
|
|
3,258
|
|
||||||||
|
TOTAL
|
$
|
—
|
|
$
|
778,523
|
|
$
|
6,393
|
|
$
|
784,916
|
|
||||
|
Derivative Assets
|
|
|
$
|
218
|
|
|
|
|
|
|||||||
|
Derivative Liabilities
|
|
|
(218
|
)
|
|
|
|
|
||||||||
There were no transfers between Level 1 and Level 2 during
2019
and
2018
.
The table below presents a reconciliation and income statement classification of gains and losses for all assets measured at fair value on a recurring basis using significant unobservable inputs (Level 3) for the twelve months ended
December 31, 2019
and
2018
.
|
Fair Value Measurements Using Significant Unobservable Inputs (Level 3)
December 31, 2019
|
||||||||||||
|
State and municipal obligations
|
Collateralized debt obligations
|
Total
|
||||||||||
|
Beginning balance, January 1
|
$
|
3,135
|
|
$
|
3,258
|
|
$
|
6,393
|
|
|||
|
Total realized/unrealized gains or losses
|
|
|
|
|
|
|
||||||
|
Included in earnings
|
—
|
|
—
|
|
—
|
|
||||||
|
Included in other comprehensive income
|
—
|
|
498
|
|
498
|
|
||||||
|
Purchases
|
—
|
|
—
|
|
—
|
|
||||||
|
Settlements
|
(570
|
)
|
(137
|
)
|
(707
|
)
|
||||||
|
Ending balance, December 31
|
$
|
2,565
|
|
$
|
3,619
|
|
$
|
6,184
|
|
|||
|
Fair Value Measurements Using Significant Unobservable Inputs (Level 3)
December 31, 2018
|
||||||||||||
|
State and
municipal
obligations
|
Collateralized
debt obligations
|
Total
|
||||||||||
|
Beginning balance, January 1
|
$
|
3,680
|
|
$
|
14,605
|
|
$
|
18,285
|
|
|||
|
Total realized/unrealized gains or losses
|
|
|
|
|
|
|
||||||
|
Included in earnings
|
—
|
|
—
|
|
—
|
|
||||||
|
Included in other comprehensive income
|
—
|
|
(2,840
|
)
|
(2,840
|
)
|
||||||
|
Transfers
|
—
|
|
—
|
|
—
|
|
||||||
|
Settlements
|
(545
|
)
|
(8,507
|
)
|
(9,052
|
)
|
||||||
|
Ending balance, December 31
|
$
|
3,135
|
|
$
|
3,258
|
|
$
|
6,393
|
|
|||
There were no unrealized gains and losses recorded in earnings for the years ended December 31,
2019
,
2018
or
2017
.
Impaired loans disclosed in footnote 7, which are measured for impairment using the fair value of collateral, are valued at Level 3. They are carried at a fair value of
$100 thousand
, after a valuation allowance of
$48 thousand
at
December 31, 2019
and at a fair value of
$1.6 million
, net of a valuation allowance of
$0.7 million
at
December 31, 2018
. The impact to the provision for loan losses for the twelve months ended
December 31, 2019
and
December 31, 2018
was a
$689 thousand
decrease and a
$112 thousand
increase, respectively. Other real estate owned is valued at Level 3. Other real estate owned at
December 31, 2019
with a value of
$3.6 million
was reduced
$64 thousand
for fair value adjustment. At
December 31, 2019
other real estate owned was comprised of
$3.5 million
from commercial loans and
$142 thousand
from residential loans. Other real estate owned at
December 31, 2018
56
with a value of
$603 thousand
was reduced
$598 thousand
for fair value adjustment. At
December 31, 2018
other real estate owned was comprised of
$171 thousand
from commercial loans and
$432 thousand
from residential loans.
Fair value is measured based on the value of the collateral securing those loans, and is determined using several methods. Generally the fair value of real estate is determined based on appraisals by qualified licensed appraisers. Appraisals for real estate generally use three methods to derive value: cost, sales or market comparison and income approach. The cost method bases value on the cost to replace current property. The market comparison evaluates the sales price of similar properties in the same market area. The income approach considers net operating income generated by the property and the investor’s required return. The final fair value is based on a reconciliation of these three approaches. If an appraisal is not available, the fair value may be determined by using a cash flow analysis, a broker’s opinion of value, the net present value of future cash flows, or an observable market price from an active market. Fair value of other real estate is based upon the current appraised values of the properties as determined by qualified licensed appraisers and the Company’s judgment of other relevant market conditions. Appraisals are obtained annually and reductions in value are recorded as a valuation through a charge to expense. The primary unobservable input used by management in estimating fair value are additional discounts to the appraised value to consider market conditions and the age of the appraisal, which are based on management’s past experience in resolving these types of properties. These discounts range from
0%
to
50%
. Values for non-real estate collateral, such as business equipment, are based on appraisals performed by qualified licensed appraisers or the customers financial statements. Values for non real estate collateral use much higher discounts than real estate collateral. Other real estate and impaired loans carried at fair value are primarily comprised of smaller balance properties.
The following tables present quantitative information about recurring and non-recurring Level 3 fair value measurements at
December 31, 2019
and
2018
.
|
2019
|
Fair Value
|
Valuation Technique(s)
|
Unobservable Input(s)
|
Range
|
|||||||
|
State and municipal obligations
|
$
|
2,565
|
|
Discounted cash flow
|
Discount rate
|
2.87%-4.44%
|
|
||||
|
|
|
|
|
Probability of default
|
—
|
%
|
|||||
|
Other real estate
|
$
|
3,625
|
|
Sales comparison/income approach
|
Discount rate for age of appraisal and market conditions
|
5.00%-20.00%
|
|
||||
|
Impaired Loans
|
$
|
100
|
|
Sales comparison/income approach
|
Discount rate for age of appraisal and market conditions
|
0.00%-50.00%
|
|
||||
|
2018
|
Fair Value
|
Valuation Technique(s)
|
Unobservable Input(s)
|
Range
|
|||||||
|
State and municipal obligations
|
$
|
3,135
|
|
Discounted cash flow
|
Discount rate
|
2.64%-4.80%
|
|
||||
|
|
|
|
|
Probability of default
|
—
|
%
|
|||||
|
Other real estate
|
$
|
603
|
|
Sales comparison/income approach
|
Discount rate for age of appraisal and market conditions
|
5.00%-20.00%
|
|
||||
|
Impaired Loans
|
$
|
1,639
|
|
Sales comparison/income approach
|
Discount rate for age of appraisal and market conditions
|
0.00%-50.00%
|
|
||||
57
The following tables present impaired collateral dependent loans measured at fair value on a non-recurring basis by class of loans as of
December 31, 2019
and
2018
.
|
|
December 31, 2019
|
|||||||||||
|
(Dollar amounts in thousands)
|
Carrying Value
|
Allowance
for Loan
Losses
Allocated
|
Fair Value
|
|||||||||
|
Commercial
|
|
|
|
|
|
|
||||||
|
Commercial & Industrial
|
$
|
148
|
|
$
|
48
|
|
$
|
100
|
|
|||
|
Farmland
|
—
|
|
—
|
|
—
|
|
||||||
|
Non Farm, Non Residential
|
—
|
|
—
|
|
—
|
|
||||||
|
Agriculture
|
—
|
|
—
|
|
—
|
|
||||||
|
All Other Commercial
|
—
|
|
—
|
|
—
|
|
||||||
|
Residential
|
|
|
|
|
|
|
||||||
|
First Liens
|
—
|
|
—
|
|
—
|
|
||||||
|
Home Equity
|
—
|
|
—
|
|
—
|
|
||||||
|
Junior Liens
|
—
|
|
—
|
|
—
|
|
||||||
|
Multifamily
|
—
|
|
—
|
|
—
|
|
||||||
|
All Other Residential
|
—
|
|
—
|
|
—
|
|
||||||
|
Consumer
|
|
|
|
|
|
|
||||||
|
Motor Vehicle
|
—
|
|
—
|
|
—
|
|
||||||
|
All Other Consumer
|
—
|
|
—
|
|
—
|
|
||||||
|
TOTAL
|
$
|
148
|
|
$
|
48
|
|
$
|
100
|
|
|||
|
|
December 31, 2018
|
|||||||||||
|
(Dollar amounts in thousands)
|
Carrying Value
|
Allowance
for Loan
Losses
Allocated
|
Fair Value
|
|||||||||
|
Commercial
|
|
|
|
|
|
|
||||||
|
Commercial & Industrial
|
$
|
1,819
|
|
$
|
593
|
|
$
|
1,226
|
|
|||
|
Farmland
|
211
|
|
44
|
|
167
|
|
||||||
|
Non Farm, Non Residential
|
—
|
|
—
|
|
—
|
|
||||||
|
Agriculture
|
346
|
|
100
|
|
246
|
|
||||||
|
All Other Commercial
|
—
|
|
—
|
|
—
|
|
||||||
|
Residential
|
|
|
|
|
|
|
||||||
|
First Liens
|
—
|
|
—
|
|
—
|
|
||||||
|
Home Equity
|
—
|
|
—
|
|
—
|
|
||||||
|
Junior Liens
|
—
|
|
—
|
|
—
|
|
||||||
|
Multifamily
|
—
|
|
—
|
|
—
|
|
||||||
|
All Other Residential
|
—
|
|
—
|
|
—
|
|
||||||
|
Consumer
|
|
|
|
|
|
|
||||||
|
Motor Vehicle
|
—
|
|
—
|
|
—
|
|
||||||
|
All Other Consumer
|
—
|
|
—
|
|
—
|
|
||||||
|
TOTAL
|
$
|
2,376
|
|
$
|
737
|
|
$
|
1,639
|
|
|||
The carrying amounts and estimated fair values of financial instruments are shown below. Carrying amount is the estimated fair value for cash and due from banks, federal funds sold, accrued interest receivable and payable, demand deposits, short-term and certain other borrowings, and variable-rate loans or deposits that reprice frequently and fully. Security fair values are determined as previously described. It is not practicable to determine the fair value of restricted stock due to restrictions placed on their transferability. For fixed-rate loans or deposits, variable rate loans or deposits with infrequent repricing or repricing limits, and for longer-term borrowings, fair value is based on discounted cash flows using current market rates applied to the estimated life
58
and credit risk. Loan fair value estimates represent an exit price for 2019 and 2018. Fair values for impaired loans are estimated using discounted cash flow analysis or underlying collateral values. Fair value of debt is based on current rates for similar financing. The fair value of off-balance sheet items is not considered material.
The carrying amount and estimated fair value of assets and liabilities are presented in the table below and were determined based on the above assumptions:
|
|
December 31, 2019
|
|||||||||||||||||||
|
|
Carrying
|
Fair Value
|
||||||||||||||||||
|
(Dollar amounts in thousands)
|
Value
|
Level 1
|
Level 2
|
Level 3
|
Total
|
|||||||||||||||
|
Cash and due from banks
|
$
|
127,426
|
|
$
|
26,275
|
|
$
|
101,151
|
|
$
|
—
|
|
$
|
127,426
|
|
|||||
|
Securities available-for-sale
|
926,717
|
|
—
|
|
920,533
|
|
6,184
|
|
926,717
|
|
||||||||||
|
Restricted stock
|
15,394
|
|
n/a
|
|
n/a
|
|
n/a
|
|
n/a
|
|
||||||||||
|
Loans, net
|
2,636,447
|
|
—
|
|
—
|
|
2,648,692
|
|
2,648,692
|
|
||||||||||
|
Accrued interest receivable
|
18,523
|
|
—
|
|
3,583
|
|
14,940
|
|
18,523
|
|
||||||||||
|
Deposits
|
(3,275,357
|
)
|
—
|
|
(3,278,099
|
)
|
—
|
|
(3,278,099
|
)
|
||||||||||
|
Short-term borrowings
|
(80,119
|
)
|
—
|
|
(80,119
|
)
|
—
|
|
(80,119
|
)
|
||||||||||
|
Accrued interest payable
|
(1,739
|
)
|
—
|
|
(1,739
|
)
|
—
|
|
(1,739
|
)
|
||||||||||
|
|
December 31, 2018
|
|||||||||||||||||||
|
|
Carrying
|
Fair Value
|
||||||||||||||||||
|
(Dollar amounts in thousands)
|
Value
|
Level 1
|
Level 2
|
Level 3
|
Total
|
|||||||||||||||
|
Cash and due from banks
|
$
|
74,388
|
|
$
|
23,418
|
|
$
|
50,970
|
|
$
|
—
|
|
$
|
74,388
|
|
|||||
|
Securities available-for-sale
|
784,916
|
|
—
|
|
778,523
|
|
6,393
|
|
784,916
|
|
||||||||||
|
Restricted stock
|
10,390
|
|
n/a
|
|
n/a
|
|
n/a
|
|
n/a
|
|
||||||||||
|
Loans, net
|
1,933,552
|
|
—
|
|
—
|
|
1,889,795
|
|
1,889,795
|
|
||||||||||
|
Accrued interest receivable
|
13,970
|
|
—
|
|
3,005
|
|
10,965
|
|
13,970
|
|
||||||||||
|
Deposits
|
(2,436,727
|
)
|
—
|
|
(2,426,128
|
)
|
—
|
|
(2,426,128
|
)
|
||||||||||
|
Short-term borrowings
|
(69,656
|
)
|
—
|
|
(69,656
|
)
|
—
|
|
(69,656
|
)
|
||||||||||
|
Accrued interest payable
|
(609
|
)
|
—
|
|
(609
|
)
|
—
|
|
(609
|
)
|
||||||||||
|
3.
|
RESTRICTIONS ON CASH AND DUE FROM BANKS:
|
Certain affiliate banks are required to maintain average reserve balances with the Federal Reserve Bank. The amount of those reserve balances was approximately
$16.9 million
and
$12.8 million
at
December 31, 2019
and
2018
, respectively.
59
4.
SECURITIES:
The fair value of securities available-for-sale and related gross unrealized gains and losses recognized in accumulated other comprehensive income were as follows:
|
|
December 31, 2019
|
|||||||||||||||
|
|
Amortized
|
Unrealized
|
|
|||||||||||||
|
(Dollar amounts in thousands)
|
Cost
|
Gains
|
Losses
|
Fair Value
|
||||||||||||
|
U.S. Government entity mortgage-backed securities
|
$
|
102,490
|
|
$
|
1,293
|
|
$
|
(150
|
)
|
$
|
103,633
|
|
||||
|
Mortgage-backed securities, residential
|
240,753
|
|
2,979
|
|
(350
|
)
|
243,382
|
|
||||||||
|
Mortgage-backed securities, commercial
|
22,036
|
|
73
|
|
(5
|
)
|
22,104
|
|
||||||||
|
Collateralized mortgage obligations
|
280,797
|
|
1,735
|
|
(1,221
|
)
|
281,311
|
|
||||||||
|
State and municipal obligations
|
253,277
|
|
11,265
|
|
(108
|
)
|
264,434
|
|
||||||||
|
Municipal taxable
|
728
|
|
2
|
|
—
|
|
730
|
|
||||||||
|
U.S. Treasury
|
7,494
|
|
10
|
|
—
|
|
7,504
|
|
||||||||
|
Collateralized debt obligations
|
—
|
|
3,619
|
|
—
|
|
3,619
|
|
||||||||
|
TOTAL
|
$
|
907,575
|
|
$
|
20,976
|
|
$
|
(1,834
|
)
|
$
|
926,717
|
|
||||
|
|
December 31, 2018
|
|||||||||||||||
|
|
Amortized
|
Unrealized
|
|
|||||||||||||
|
(Dollar amounts in thousands)
|
Cost
|
Gains
|
Losses
|
Fair Value
|
||||||||||||
|
U.S. Government entity mortgage-backed securities
|
$
|
25,617
|
|
$
|
218
|
|
$
|
(471
|
)
|
$
|
25,364
|
|
||||
|
Mortgage-backed securities, residential
|
182,050
|
|
723
|
|
(4,030
|
)
|
178,743
|
|
||||||||
|
Collateralized mortgage obligations
|
352,823
|
|
217
|
|
(9,424
|
)
|
343,616
|
|
||||||||
|
State and municipal obligations
|
232,457
|
|
2,767
|
|
(1,289
|
)
|
233,935
|
|
||||||||
|
Collateralized debt obligations
|
137
|
|
3,121
|
|
—
|
|
3,258
|
|
||||||||
|
TOTAL
|
$
|
793,084
|
|
$
|
7,046
|
|
$
|
(15,214
|
)
|
$
|
784,916
|
|
||||
As of
December 31, 2019
, the Corporation does not have any securities from any issuer, other than the U.S. Government, with an aggregate book or fair value that exceeds ten percent of shareholders' equity.
Securities with a carrying value of approximately
$596.2 million
and
$393.3 million
at
December 31, 2019
and
2018
, respectively, were pledged as collateral for short-term borrowings and for other purposes.
Below is a summary of the gross gains and losses realized by the Corporation on investment sales and calls during the years ended
December 31, 2019
,
2018
and
2017
, respectively.
|
(Dollar amounts in thousands)
|
2019
|
2018
|
2017
|
|||||||||
|
Proceeds
|
$
|
11,210
|
|
$
|
2,418
|
|
$
|
15,348
|
|
|||
|
Gross gains
|
55
|
|
5
|
|
185
|
|
||||||
|
Gross losses
|
(11
|
)
|
(3
|
)
|
(126
|
)
|
||||||
Gains of
$55 thousand
and losses of
$11 thousand
in
2019
and gains of
$5 thousand
and losses of
$3 thousand
in
2018
and gains of
$185 thousand
and losses of
$126 thousand
in
2017
resulted from redemption premiums on called and sold securities.
60
Contractual maturities of debt securities at year-end
2019
were as follows. Securities not due at a single maturity or with no maturity date, primarily mortgage-backed and collateralized mortgage obligations, are shown separately.
|
|
Available-for-Sale
|
|||||||
|
|
Amortized
|
Fair
|
||||||
|
(Dollar amounts in thousands)
|
Cost
|
Value
|
||||||
|
Due in one year or less
|
$
|
13,911
|
|
$
|
13,949
|
|
||
|
Due after one but within five years
|
60,624
|
|
61,502
|
|
||||
|
Due after five but within ten years
|
61,255
|
|
63,193
|
|
||||
|
Due after ten years
|
228,199
|
|
241,276
|
|
||||
|
|
363,989
|
|
379,920
|
|
||||
|
Mortgage-backed securities and collateralized mortgage obligations
|
543,586
|
|
546,797
|
|
||||
|
TOTAL
|
$
|
907,575
|
|
$
|
926,717
|
|
||
The following tables show the securities' gross unrealized losses and fair value, aggregated by investment category and length of time that individual securities have been in continuous unrealized loss position, at
December 31, 2019
and
2018
.
|
|
December 31, 2019
|
|||||||||||||||||||||||
|
|
Less Than 12 Months
|
More Than 12 Months
|
Total
|
|||||||||||||||||||||
|
|
|
Unrealized
|
|
Unrealized
|
|
Unrealized
|
||||||||||||||||||
|
(Dollar amounts in thousands)
|
Fair Value
|
Losses
|
Fair Value
|
Losses
|
Fair Value
|
Losses
|
||||||||||||||||||
|
U.S. Government entity mortgage-backed securities
|
$
|
29,183
|
|
$
|
(150
|
)
|
—
|
|
—
|
|
$
|
29,183
|
|
$
|
(150
|
)
|
||||||||
|
Mortgage-backed securities, residential
|
55,665
|
|
(243
|
)
|
18,724
|
|
(107
|
)
|
74,389
|
|
(350
|
)
|
||||||||||||
|
Mortgage-backed securities, commercial
|
4,391
|
|
(5
|
)
|
—
|
|
—
|
|
4,391
|
|
(5
|
)
|
||||||||||||
|
Collateralized mortgage obligations
|
33,398
|
|
(314
|
)
|
61,781
|
|
(907
|
)
|
95,179
|
|
(1,221
|
)
|
||||||||||||
|
State and municipal obligations
|
8,996
|
|
(61
|
)
|
461
|
|
(47
|
)
|
9,457
|
|
(108
|
)
|
||||||||||||
|
Total temporarily impaired securities
|
$
|
131,633
|
|
$
|
(773
|
)
|
$
|
80,966
|
|
$
|
(1,061
|
)
|
$
|
212,599
|
|
$
|
(1,834
|
)
|
||||||
|
|
December 31, 2018
|
|||||||||||||||||||||||
|
|
Less Than 12 Months
|
More Than 12 Months
|
Total
|
|||||||||||||||||||||
|
|
|
Unrealized
|
|
Unrealized
|
|
Unrealized
|
||||||||||||||||||
|
(Dollar amounts in thousands)
|
Fair Value
|
Losses
|
Fair Value
|
Losses
|
Fair Value
|
Losses
|
||||||||||||||||||
|
U.S. Government entity mortgage-backed securities
|
$
|
3,052
|
|
$
|
(4
|
)
|
$
|
11,356
|
|
$
|
(467
|
)
|
$
|
14,408
|
|
$
|
(471
|
)
|
||||||
|
Mortgage-backed securities, residential
|
39,997
|
|
(553
|
)
|
111,423
|
|
(3,477
|
)
|
151,420
|
|
(4,030
|
)
|
||||||||||||
|
Collateralized mortgage obligations
|
52,838
|
|
(455
|
)
|
241,373
|
|
(8,969
|
)
|
294,211
|
|
(9,424
|
)
|
||||||||||||
|
State and municipal obligations
|
34,229
|
|
(276
|
)
|
41,742
|
|
(1,013
|
)
|
75,971
|
|
(1,289
|
)
|
||||||||||||
|
Total temporarily impaired securities
|
$
|
130,116
|
|
$
|
(1,288
|
)
|
$
|
405,894
|
|
$
|
(13,926
|
)
|
$
|
536,010
|
|
$
|
(15,214
|
)
|
||||||
The Corporation held
97
investment securities with an amortized cost greater than fair value as of
December 31, 2019
. The unrealized losses on collateralized mortgage obligations, all mortgage-backed securities and state and municipal obligations represent negative adjustments to fair value relative to the rate of interest paid on the securities and not losses related to the creditworthiness of the issuer. Gross unrealized losses on investment securities were
$1.8 million
as of
December 31, 2019
and
$15.2 million
as of
December 31, 2018
. Management does not intend to sell and it is not more likely than not that management would be required to sell the securities prior to their anticipated recovery. Management believes the value will recover as the securities approach maturity or market rates change.
Management evaluates securities for other-than-temporary impairment ("OTTI") at least on a quarterly basis, and more frequently when economic or market conditions warrant such an evaluation. The investment securities portfolio is evaluated for OTTI by segregating the portfolio into two general segments and applying the appropriate OTTI model.
61
Investment securities are generally evaluated for OTTI under FASB ASC 320,
Investments—Debt and Equity Securities.
However, certain purchased beneficial interests, including non-agency mortgage-backed securities, asset-backed securities, and collateralized debt obligations, that had credit ratings at the time of purchase of below AA are evaluated using the model outlined in FASB ASC 325-40,
Beneficial Interests in Securitized Financial Assets.
In determining OTTI under the FASB ASC-320 model, management considers many factors, including: (1)the length of time and the extent to which the fair value has been less than cost, (2)the financial condition and near-term prospects of the issuer, (3) whether the fair value decline was affected by macroeconomic conditions, and (4) whether the entity has the intent to sell the security or more likely than not will be required to sell the security before its anticipated recovery. The assessment of whether an other-than-temporary decline exists involves a high degree of subjectivity and judgment and is based on the information available to management at a point in time.
The second segment of the portfolio uses the OTTI guidance provided by FASB ASC-325 that is specific to purchase beneficial interests that, on the purchase date, were rated below AA. Under the FASB ASC-325 model, the Corporation compares the present value of the remaining cash flows as estimated at the preceding evaluation date to the current expected remaining cash flows. An OTTI is deemed to have occurred if there has been an adverse change in the remaining expected future cash flows.
When OTTI occurs under either model, the amount of the OTTI recognized in earnings depends on whether an entity intends to sell the security or it is more likely than not it will be required to sell the security before recovery of its amortized cost basis, less any current-period credit loss. If an entity intends to sell or it is more likely than not it will be required to sell the security before recovery of its amortized cost basis, less any current-period credit loss, the OTTI shall be recognized in earnings equal to the entire difference between the investment's amortized cost basis and its fair value at the balance sheet date. If an entity does not intend to sell the security and it is not more likely than not that the entity will be required to sell the security before recovery of its amortized cost basis less any current-period loss, the OTTI shall be separated into the amount representing the credit loss and the amount related to all other factors. The amount of the total OTTI related to the credit loss is determined based on the present value of cash flows expected to be collected and is recognized in earnings. The amount of the total OTTI related to other factors is recognized in other comprehensive income, net of applicable taxes. The previous amortized cost basis less the OTTI recognized in earnings becomes the new amortized cost basis of the investment.
In prior years, a significant portion of the total unrealized losses relates to collateralized debt obligations that were separately evaluated under FASB ASC 325-40,
Beneficial Interests in Securitized Financial Assets.
Based upon qualitative considerations, such as a downgrade in credit rating or further defaults of underlying issuers during the year, and an analysis of expected cash flows, we determined that three CDOs included in collateralized debt obligations were other-than-temporarily impaired. One of the CDO's was called in first quarter 2017. A second was called in second quarter 2018. The remaining CDO has a contractual balance of
$3.7 million
at
December 31, 2019
which has been reduced to
$3.6 million
by
$750 thousand
of interest payments received,
$3.0 million
of cumulative OTTI charges recorded through earnings to date and increased by
$3.6 million
recorded in other comprehensive income. These securities are collateralized by trust preferred securities issued primarily by bank holding companies, but certain pools do include a limited number of insurance companies. The Corporation uses the OTTI evaluation model to compare the present value of expected cash flows to the previous estimate to determine if there are adverse changes in cash flows during the year. The OTTI model considers the structure and term of the CDO and the financial condition of the underlying issuers. Specifically, the model details interest rates, principal balances of note classes and underlying issuers, the timing and amount of interest and principal payments of the underlying issuers, and the allocation of the payments to the note classes. Cash flows are projected using a forward rate LIBOR curve, as these CDOs are variable-rate instruments. An average rate is then computed using this same forward rate curve to determine an appropriate discount rate (
3 month LIBOR
plus margin ranging from 160 to 180 basis points). The current estimate of expected cash flows is based on the most recent trustee reports and any other relevant market information, including announcements of interest payment deferrals or defaults of underlying trust preferred securities. Assumptions used in the model include expected future default rates and prepayments. We assume no recoveries on defaults and treat all interest payment deferrals as defaults. In addition we use the model to “stress” each CDO, or make assumptions more severe than expected activity, to determine the degree to which assumptions could deteriorate before the CDO could no longer fully support repayment of the Corporation’s note class. In the current year management determined there was no OTTI. There was no OTTI recorded in 2019 or 2018.
Collateralized debt obligations include one additional investment in a CDO consisting of pooled trust preferred securities in which the issuers are primarily banks. This CDO was paid in full in 2015. In the first quarter of 2017 a CDO with no remaining book value was called with the bank receiving
$3.1 million
, which is included in other non-interest income on the consolidated statements of income and comprehensive income. In the second quarter of 2018 one of the obligations was called, resulting in the elimination of the OTTI associated with that obligation. A recovery of previously recorded OTTI of $4.2 million was received and recognized in non-interest income for the period. In addition the Corporation received $2.4 million of interest income associated with the call.
62
The table below presents a rollforward of the credit losses recognized in earnings for the years presented:
|
(Dollar amounts in thousands)
|
2019
|
2018
|
2017
|
|||||||||
|
Beginning balance, January 1,
|
$
|
2,974
|
|
$
|
7,132
|
|
$
|
13,974
|
|
|||
|
Reductions for securities called during the period
|
—
|
|
(4,158
|
)
|
(6,842
|
)
|
||||||
|
Ending balance, December 31,
|
$
|
2,974
|
|
$
|
2,974
|
|
$
|
7,132
|
|
|||
5. LOANS:
Loans are summarized as follows:
|
|
December 31,
|
|||||||
|
(Dollar amounts in thousands)
|
2019
|
2018
|
||||||
|
Commercial
|
$
|
1,584,447
|
|
$
|
1,166,352
|
|
||
|
Residential
|
682,077
|
|
443,670
|
|
||||
|
Consumer
|
386,006
|
|
341,041
|
|
||||
|
Total gross loans
|
2,652,530
|
|
1,951,063
|
|
||||
|
Deferred costs, net
|
3,860
|
|
2,925
|
|
||||
|
Allowance for loan losses
|
(19,943
|
)
|
(20,436
|
)
|
||||
|
TOTAL
|
$
|
2,636,447
|
|
$
|
1,933,552
|
|
||
The Corporation periodically sells residential mortgage loans it originates based on the overall loan demand of the Corporation and the outstanding balances in the residential mortgage portfolio. At
December 31, 2019
and
2018
, loans held for sale were
$5.8 million
and
$3.2 million
, respectively, and are included in the totals above.
In the normal course of business, the Corporation’s subsidiary banks make loans to directors and executive officers and to their associates. In
2019
, the aggregate dollar amount of these loans to directors and executive officers who held office amounted to
$53.0 million
at the beginning of the year. During
2019
, advances of
$78.2 million
, repayments of
$58.1 million
, and additions for new directors of
$16.4 million
were made with respect to related party loans for an aggregate dollar amount outstanding of
$89.5 million
at
December 31, 2019
.
Loans serviced for others, which are not reported as assets, total
$477.0 million
and
$473.8 million
at year-end
2019
and
2018
. Custodial escrow balances maintained in connection with serviced loans were
$3.1 million
and
$3.0 million
at year-end
2019
and
2018
.
Activity for capitalized mortgage servicing rights (included in other assets) was as follows:
|
|
December 31,
|
|||||||||||
|
(Dollar amounts in thousands)
|
2019
|
2018
|
2017
|
|||||||||
|
Servicing rights:
|
|
|
|
|
|
|
||||||
|
Beginning of year
|
$
|
1,431
|
|
$
|
1,434
|
|
$
|
1,549
|
|
|||
|
Additions
|
579
|
|
513
|
|
477
|
|
||||||
|
Amortized to expense
|
(575
|
)
|
(516
|
)
|
(592
|
)
|
||||||
|
End of year
|
$
|
1,435
|
|
$
|
1,431
|
|
$
|
1,434
|
|
|||
Third party valuations are conducted periodically for mortgage servicing rights. Based on these valuations, fair values were approximately
$2.7 million
and
$2.3 million
at year end
2019
and
2018
. There was no valuation allowance in
2019
or
2018
.
Fair value for
2019
was determined using a discount rate of
12.5%
, prepayment speeds ranging from
118%
to
263%
, depending on the stratification of the specific right. Fair value at year end
2018
was determined using a discount rate of
13%
, prepayment speeds ranging from
88%
to
189%
, depending on the stratification of the specific right. Mortgage servicing rights are amortized over
8
years, the expected life of the sold loans.
63
|
6.
|
ACQUISITIONS, DIVESTITURES AND FDIC INDEMNIFICATION ASSET:
|
On July 27, 2019, the Corporation completed its acquisition of HopFed Bancorp, Inc. and its banking subsidiary, Heritage Bank. Therefore, the results of HopFed have been included in the results of operations beginning on July 27, 2019. Pursuant to the terms of the merger agreement, each issued and outstanding share of HopFed common stock, $0.01 par value per share, was converted into the right to receive, at the stockholder's election, either (or a combination of) 0.444 shares of Corporation common stock, without par value, or $21.00 in cash, subject to proration provisions specified in the merger agreement that provide for an aggregate split of 50% of shares of HopFed Common Stock being exchanged for Corporation Common Stock and 50% for cash, with cash to be paid in lieu of fractional shares. Each outstanding share of Corporation common stock remained outstanding and was unaffected by the merger. Acquisition-related costs of $3.3 million are included in the Corporation's income statement for the year ended December 31, 2019.
Goodwill of $44.2 million arising from the acquisition consisted largely of synergies and the cost savings resulting from the combining of the operations of the companies. The goodwill is not deductible for income tax purposes as the transaction was accounted for as a tax-free exchange. The following table summarizes the consideration paid and the amounts of the assets acquired and liabilities assumed recognized at the acquisition date.
|
(Dollar amounts in thousands)
|
As Initially Reported
|
Measurement Period Adjustments
|
As Adjusted
|
||||||||
|
Consideration
|
|||||||||||
|
Cash consideration
|
$
|
67,348
|
|
$
|
—
|
|
$
|
67,348
|
|
||
|
Stock consideration
|
61,878
|
|
—
|
|
61,878
|
|
|||||
|
|
|||||||||||
|
Fair value of total consideration transferred
|
$
|
129,226
|
|
$
|
—
|
|
$
|
129,226
|
|
||
|
Assets acquired
|
|||||||||||
|
Cash
|
$
|
34,518
|
|
$
|
34,518
|
|
|||||
|
Investment securities available-for-sale
|
174,851
|
|
174,851
|
|
|||||||
|
Bank owned life insurance
|
10,693
|
|
10,693
|
|
|||||||
|
Federal Home Loan Bank stock
|
4,428
|
|
4,428
|
|
|||||||
|
Loans
|
657,179
|
|
1,719
|
|
658,898
|
|
|||||
|
Premises and equipment
|
25,316
|
|
(6,494
|
)
|
18,822
|
|
|||||
|
Core deposit intangibles
|
10,369
|
|
10,369
|
|
|||||||
|
Other real estate owned
|
3,364
|
|
3,364
|
|
|||||||
|
Other assets
|
6,596
|
|
1,600
|
|
8,196
|
|
|||||
|
Total assets acquired
|
927,314
|
|
(3,175
|
)
|
924,139
|
|
|||||
|
Liabilities assumed
|
|||||||||||
|
Deposits
|
735,526
|
|
735,526
|
|
|||||||
|
FHLB advances
|
20,775
|
|
20,775
|
|
|||||||
|
Other borrowings
|
75,783
|
|
75,783
|
|
|||||||
|
Other liabilities
|
7,066
|
|
7,066
|
|
|||||||
|
Total liabilities assumed
|
839,150
|
|
—
|
|
839,150
|
|
|||||
|
Net identifiable assets
|
88,164
|
|
(3,175
|
)
|
84,989
|
|
|||||
|
Goodwill
|
$
|
41,062
|
|
$
|
3,175
|
|
$
|
44,237
|
|
||
The fair value of net assets acquired includes fair value adjustments to certain receivables that were not considered impaired as of the acquisition date. The fair value adjustments were determined using discounted contractual cash flows. However, the Corporation believes that all contractual cash flows related to these financial instruments will be collected. As such, these receivables
64
were not considered impaired at the acquisition date and were not subject to guidance relating to purchase credit impaired loans, which have shown evidence of credit deterioration since origination.
The following table presents supplemental pro forma information as if the acquisition had occurred at the beginning of 2018. The unaudited pro forma information includes adjustments for interest income on loans and securities acquired, interest expense on deposits acquired, and the related income tax effects. The pro forma financial information is not necessarily indicative of the results of operations that would have occurred had the transactions been effected on the assumed dates.
|
Year ended December 31,
|
|||||||
|
(Dollar amounts in thousands, except per share data)
|
2019
|
2018
|
|||||
|
Net interest income
|
$
|
147,581
|
|
$
|
145,136
|
|
|
|
Net income
|
$
|
51,088
|
|
$
|
52,252
|
|
|
|
Basic and diluted earnings per share
|
$
|
3.97
|
|
$
|
4.26
|
|
|
The Bank was party to a loss sharing agreement with the Federal Deposit Insurance Corporation (“FDIC”) as a result of a 2009 acquisition. Under the loss-sharing agreement (“LSA”), the Bank shared in the losses on assets covered under the agreement (referred to as covered assets). On losses up to
$29 million
, the FDIC agreed to reimburse the Bank for
80%
of the losses. On losses exceeding
$29 million
, the FDIC agreed to reimburse the Bank for
95%
of the losses. The loss-sharing agreement was subject to following servicing procedures as specified in the agreement with the FDIC. Loans acquired that were subject to the loss-sharing agreement with the FDIC were referred to as covered loans for disclosure purposes. Since the acquisition date the Bank has been reimbursed
$24.3 million
for losses and carrying expenses. The balance of the loans that were covered by the loss share agreement excluding AS 310-30 loans at December 31,
2018
totaled
$3.2 million
. The agreement expired on July 2, 2019.
FASB ASC 310-30,
Loans and Debt Securities Acquired with Deteriorated Credit Quality,
applies to a loan with evidence of deterioration of credit quality since origination, acquired by completion of a transfer for which it is probable, at acquisition, that the investor will be unable to collect all contractually required payments receivable. FASB ASC 310-30 prohibits carrying over or creating an allowance for loan losses upon initial recognition.
|
(Dollar amounts in thousands)
|
As Initially Reported
|
Measurement Period Adjustments
|
As Adjusted
|
||||||||
|
Contractually required payments receivable of loans purchased during the year:
|
|||||||||||
|
Commercial
|
$
|
16,530
|
|
$
|
(3,523
|
)
|
$
|
13,007
|
|
||
|
Consumer
|
391
|
|
(296
|
)
|
95
|
|
|||||
|
$
|
16,921
|
|
$
|
(3,819
|
)
|
$
|
13,102
|
|
|||
|
Fair value of acquired loans at acquisition
|
$
|
8,870
|
|
$
|
(1,857
|
)
|
$
|
7,013
|
|
||
The carrying amount of loans accounted for in accordance with FASB ASC 310-30 at
December 31, 2019
and
2018
, are shown in the following tables:
|
|
2019
|
|||||||||||
|
(Dollar amounts in thousands)
|
Commercial
|
Consumer
|
Total
|
|||||||||
|
Beginning balance
|
$
|
1,530
|
|
$
|
—
|
|
$
|
1,530
|
|
|||
|
Loans added, as initially reported
|
8,610
|
|
260
|
|
8,870
|
|
||||||
|
Measurement period adjustments
|
(1,597
|
)
|
(260
|
)
|
$
|
(1,857
|
)
|
|||||
|
Loans added
|
|
|
—
|
|
—
|
|
||||||
|
Disposals
|
(1,274
|
)
|
—
|
|
(1,274
|
)
|
||||||
|
ASC 310-30 Loans
|
$
|
7,269
|
|
$
|
—
|
|
$
|
7,269
|
|
|||
65
|
|
2018
|
|||||||||||
|
(Dollar amounts in thousands)
|
Commercial
|
Consumer
|
Total
|
|||||||||
|
Beginning balance
|
$
|
1,896
|
|
$
|
—
|
|
$
|
1,896
|
|
|||
|
Loans added
|
—
|
|
—
|
|
—
|
|
||||||
|
Disposals
|
(366
|
)
|
—
|
|
(366
|
)
|
||||||
|
ASC 310-30 Loans
|
$
|
1,530
|
|
$
|
—
|
|
$
|
1,530
|
|
|||
7. ALLOWANCE FOR LOAN LOSSES:
The following table presents the activity of the allowance for loan losses by portfolio segment for the years ended
December 31, 2019
,
2018
and
2017
.
|
Allowance for Loan Losses:
|
|
December 31, 2019
|
|
|||||||||||||||||
|
(Dollar amounts in thousands)
|
Commercial
|
Residential
|
Consumer
|
Unallocated
|
Total
|
|||||||||||||||
|
Beginning balance
|
$
|
9,848
|
|
$
|
1,313
|
|
$
|
7,481
|
|
$
|
1,794
|
|
$
|
20,436
|
|
|||||
|
Provision for loan losses
|
621
|
|
(321
|
)
|
4,802
|
|
(402
|
)
|
4,700
|
|
||||||||||
|
Loans charged -off
|
(2,616
|
)
|
(1,050
|
)
|
(7,007
|
)
|
—
|
|
(10,673
|
)
|
||||||||||
|
Recoveries
|
1,092
|
|
1,360
|
|
3,028
|
|
—
|
|
5,480
|
|
||||||||||
|
Ending Balance
|
$
|
8,945
|
|
$
|
1,302
|
|
$
|
8,304
|
|
$
|
1,392
|
|
$
|
19,943
|
|
|||||
|
Allowance for Loan Losses:
|
|
December 31, 2018
|
|
|||||||||||||||||
|
(Dollar amounts in thousands)
|
Commercial
|
Residential
|
Consumer
|
Unallocated
|
Total
|
|||||||||||||||
|
Beginning balance
|
$
|
10,281
|
|
$
|
1,455
|
|
$
|
6,709
|
|
$
|
1,464
|
|
$
|
19,909
|
|
|||||
|
Provision for loan losses
|
83
|
|
60
|
|
5,295
|
|
330
|
|
5,768
|
|
||||||||||
|
Loans charged -off
|
(1,122
|
)
|
(841
|
)
|
(6,868
|
)
|
—
|
|
(8,831
|
)
|
||||||||||
|
Recoveries
|
606
|
|
639
|
|
2,345
|
|
—
|
|
3,590
|
|
||||||||||
|
Ending Balance
|
$
|
9,848
|
|
$
|
1,313
|
|
$
|
7,481
|
|
$
|
1,794
|
|
$
|
20,436
|
|
|||||
|
Allowance for Loan Losses:
|
|
December 31, 2017
|
|
|||||||||||||||||
|
(Dollar amounts in thousands)
|
Commercial
|
Residential
|
Consumer
|
Unallocated
|
Total
|
|||||||||||||||
|
Beginning balance
|
$
|
9,731
|
|
$
|
1,553
|
|
$
|
5,767
|
|
$
|
1,722
|
|
$
|
18,773
|
|
|||||
|
Provision for loan losses
|
745
|
|
(179
|
)
|
4,987
|
|
(258
|
)
|
5,295
|
|
||||||||||
|
Loans charged -off
|
(1,572
|
)
|
(761
|
)
|
(6,429
|
)
|
—
|
|
(8,762
|
)
|
||||||||||
|
Recoveries
|
1,377
|
|
842
|
|
2,384
|
|
—
|
|
4,603
|
|
||||||||||
|
Ending Balance
|
$
|
10,281
|
|
$
|
1,455
|
|
$
|
6,709
|
|
$
|
1,464
|
|
$
|
19,909
|
|
|||||
66
The following tables present the allocation of the allowance for loan losses and the recorded investment in loans by portfolio segment and based on impairment method at
December 31, 2019
and
2018
:
|
Allowance for Loan Losses:
|
|
December 31, 2019
|
|
|
||||||||||||||||
|
(Dollar amounts in thousands)
|
Commercial
|
Residential
|
Consumer
|
Unallocated
|
Total
|
|||||||||||||||
|
Individually evaluated for impairment
|
$
|
48
|
|
$
|
—
|
|
$
|
—
|
|
$
|
—
|
|
$
|
48
|
|
|||||
|
Collectively evaluated for impairment
|
8,897
|
|
1,302
|
|
8,304
|
|
1,392
|
|
19,895
|
|
||||||||||
|
Acquired with deteriorated credit quality
|
—
|
|
—
|
|
—
|
|
—
|
|
—
|
|
||||||||||
|
BALANCE AT END OF YEAR
|
$
|
8,945
|
|
$
|
1,302
|
|
$
|
8,304
|
|
$
|
1,392
|
|
$
|
19,943
|
|
|||||
|
Loans
|
|
|
|
|
|
|
|
|
|
|
||||||||||
|
(Dollar amounts in thousands)
|
Commercial
|
Residential
|
Consumer
|
|
Total
|
|||||||||||||||
|
Individually evaluated for impairment
|
$
|
3,161
|
|
$
|
3,952
|
|
$
|
—
|
|
|
|
$
|
7,113
|
|
||||||
|
Collectively evaluated for impairment
|
1,584,169
|
|
680,069
|
|
387,655
|
|
|
|
2,651,893
|
|
||||||||||
|
Acquired with deteriorated credit quality
|
7,436
|
|
—
|
|
—
|
|
|
|
7,436
|
|
||||||||||
|
BALANCE AT END OF YEAR
|
$
|
1,594,766
|
|
$
|
684,021
|
|
$
|
387,655
|
|
|
|
$
|
2,666,442
|
|
||||||
|
Allowance for Loan Losses:
|
|
December 31, 2018
|
|
|
||||||||||||||||
|
(Dollar amounts in thousands)
|
Commercial
|
Residential
|
Consumer
|
Unallocated
|
Total
|
|||||||||||||||
|
Individually evaluated for impairment
|
$
|
737
|
|
$
|
—
|
|
$
|
—
|
|
$
|
—
|
|
$
|
737
|
|
|||||
|
Collectively evaluated for impairment
|
9,111
|
|
1,313
|
|
7,481
|
|
1,794
|
|
19,699
|
|
||||||||||
|
Acquired with deteriorated credit quality
|
—
|
|
—
|
|
—
|
|
—
|
|
—
|
|
||||||||||
|
BALANCE AT END OF YEAR
|
$
|
9,848
|
|
$
|
1,313
|
|
$
|
7,481
|
|
$
|
1,794
|
|
$
|
20,436
|
|
|||||
|
Loans
|
|
|
|
|
|
|
|
|
|
|
||||||||||
|
(Dollar amounts in thousands)
|
Commercial
|
|
Residential
|
|
Consumer
|
|
|
|
Total
|
|
||||||||||
|
Individually evaluated for impairment
|
$
|
6,101
|
|
$
|
4,415
|
|
$
|
—
|
|
|
|
$
|
10,516
|
|
||||||
|
Collectively evaluated for impairment
|
1,166,227
|
|
440,497
|
|
342,473
|
|
|
|
1,949,197
|
|
||||||||||
|
Acquired with deteriorated credit quality
|
1,495
|
|
—
|
|
—
|
|
|
|
1,495
|
|
||||||||||
|
BALANCE AT END OF YEAR
|
$
|
1,173,823
|
|
$
|
444,912
|
|
$
|
342,473
|
|
|
|
$
|
1,961,208
|
|
||||||
67
The following tables present loans individually evaluated for impairment by class of loan.
|
December 31, 2019
|
|
|
Allowance
|
|
|
Cash Basis
|
||||||||||||||||||
|
|
Unpaid
|
|
for Loan
|
Average
|
Interest
|
Interest
|
||||||||||||||||||
|
|
Principal
|
Recorded
|
Losses
|
Recorded
|
Income
|
Income
|
||||||||||||||||||
|
|
Balance
|
Investment
|
Allocated
|
Investment
|
Recognized
|
Recognized
|
||||||||||||||||||
|
With no related allowance recorded:
|
|
|
|
|
|
|
|
|
|
|
|
|
||||||||||||
|
Commercial
|
|
|
|
|
|
|
|
|
|
|
|
|
||||||||||||
|
Commercial & Industrial
|
$
|
1,519
|
|
$
|
989
|
|
$
|
—
|
|
$
|
848
|
|
$
|
—
|
|
$
|
—
|
|
||||||
|
Farmland
|
1,997
|
|
1,997
|
|
—
|
|
1,999
|
|
—
|
|
—
|
|
||||||||||||
|
Non Farm, Non Residential
|
—
|
|
—
|
|
—
|
|
—
|
|
—
|
|
—
|
|
||||||||||||
|
Agriculture
|
—
|
|
—
|
|
—
|
|
—
|
|
—
|
|
—
|
|
||||||||||||
|
All Other Commercial
|
27
|
|
27
|
|
—
|
|
461
|
|
—
|
|
—
|
|
||||||||||||
|
Residential
|
|
|
|
|
|
|
|
|
|
|
|
|
||||||||||||
|
First Liens
|
3,952
|
|
3,952
|
|
—
|
|
4,055
|
|
—
|
|
—
|
|
||||||||||||
|
Home Equity
|
—
|
|
—
|
|
—
|
|
—
|
|
—
|
|
—
|
|
||||||||||||
|
Junior Liens
|
—
|
|
—
|
|
—
|
|
—
|
|
—
|
|
—
|
|
||||||||||||
|
Multifamily
|
—
|
|
—
|
|
—
|
|
—
|
|
—
|
|
—
|
|
||||||||||||
|
All Other Residential
|
—
|
|
—
|
|
—
|
|
—
|
|
—
|
|
—
|
|
||||||||||||
|
Consumer
|
|
|
|
|
|
|
|
|
|
|
|
|
||||||||||||
|
Motor Vehicle
|
—
|
|
—
|
|
—
|
|
—
|
|
—
|
|
—
|
|
||||||||||||
|
All Other Consumer
|
—
|
|
—
|
|
—
|
|
—
|
|
—
|
|
—
|
|
||||||||||||
|
With an allowance recorded:
|
|
|
|
|
|
|
|
|
|
|
|
|
||||||||||||
|
Commercial
|
|
|
|
|
|
|
|
|
|
|
|
|
||||||||||||
|
Commercial & Industrial
|
148
|
|
148
|
|
48
|
|
1,108
|
|
—
|
|
—
|
|
||||||||||||
|
Farmland
|
—
|
|
—
|
|
—
|
|
84
|
|
—
|
|
—
|
|
||||||||||||
|
Non Farm, Non Residential
|
—
|
|
—
|
|
—
|
|
—
|
|
|
|
—
|
|
||||||||||||
|
Agriculture
|
—
|
|
—
|
|
—
|
|
138
|
|
—
|
|
—
|
|
||||||||||||
|
All Other Commercial
|
—
|
|
—
|
|
—
|
|
—
|
|
—
|
|
—
|
|
||||||||||||
|
Residential
|
|
|
|
|
|
|
|
|
|
|
|
|
||||||||||||
|
First Liens
|
—
|
|
—
|
|
—
|
|
—
|
|
—
|
|
—
|
|
||||||||||||
|
Home Equity
|
—
|
|
—
|
|
—
|
|
—
|
|
—
|
|
—
|
|
||||||||||||
|
Junior Liens
|
—
|
|
—
|
|
—
|
|
—
|
|
—
|
|
—
|
|
||||||||||||
|
Multifamily
|
—
|
|
—
|
|
—
|
|
—
|
|
—
|
|
—
|
|
||||||||||||
|
All Other Residential
|
—
|
|
—
|
|
—
|
|
—
|
|
—
|
|
—
|
|
||||||||||||
|
Consumer
|
|
|
|
|
|
|
|
|
|
|
|
|
||||||||||||
|
Motor Vehicle
|
—
|
|
—
|
|
—
|
|
—
|
|
—
|
|
—
|
|
||||||||||||
|
All Other Consumer
|
—
|
|
—
|
|
—
|
|
—
|
|
—
|
|
—
|
|
||||||||||||
|
TOTAL
|
$
|
7,643
|
|
$
|
7,113
|
|
$
|
48
|
|
$
|
8,693
|
|
$
|
—
|
|
$
|
—
|
|
||||||
68
|
December 31, 2018
|
|
|
Allowance
|
|
|
Cash Basis
|
||||||||||||||||||
|
|
Unpaid
|
|
for Loan
|
Average
|
Interest
|
Interest
|
||||||||||||||||||
|
|
Principal
|
Recorded
|
Losses
|
Recorded
|
Income
|
Income
|
||||||||||||||||||
|
|
Balance
|
Investment
|
Allocated
|
Investment
|
Recognized
|
Recognized
|
||||||||||||||||||
|
With no related allowance recorded:
|
|
|
|
|
|
|
|
|
|
|
|
|
||||||||||||
|
Commercial
|
|
|
|
|
|
|
|
|
|
|
|
|
||||||||||||
|
Commercial & Industrial
|
$
|
589
|
|
$
|
589
|
|
$
|
—
|
|
$
|
698
|
|
$
|
—
|
|
$
|
—
|
|
||||||
|
Farmland
|
2,022
|
|
2,022
|
|
—
|
|
1,579
|
|
—
|
|
—
|
|
||||||||||||
|
Non Farm, Non Residential
|
—
|
|
—
|
|
—
|
|
1,443
|
|
—
|
|
—
|
|
||||||||||||
|
Agriculture
|
—
|
|
—
|
|
—
|
|
49
|
|
—
|
|
—
|
|
||||||||||||
|
All Other Commercial
|
1,114
|
|
1,114
|
|
—
|
|
1,172
|
|
—
|
|
—
|
|
||||||||||||
|
Residential
|
|
|
|
|
|
|
|
|
|
|
|
|
||||||||||||
|
First Liens
|
4,415
|
|
4,415
|
|
—
|
|
3,371
|
|
—
|
|
—
|
|
||||||||||||
|
Home Equity
|
—
|
|
—
|
|
—
|
|
—
|
|
—
|
|
—
|
|
||||||||||||
|
Junior Liens
|
—
|
|
—
|
|
—
|
|
23
|
|
—
|
|
—
|
|
||||||||||||
|
Multifamily
|
—
|
|
—
|
|
—
|
|
—
|
|
—
|
|
—
|
|
||||||||||||
|
All Other Residential
|
—
|
|
—
|
|
—
|
|
—
|
|
—
|
|
—
|
|
||||||||||||
|
Consumer
|
|
|
|
|
|
|
|
|
|
|
|
|
||||||||||||
|
Motor Vehicle
|
—
|
|
—
|
|
—
|
|
—
|
|
—
|
|
—
|
|
||||||||||||
|
All Other Consumer
|
—
|
|
—
|
|
—
|
|
—
|
|
—
|
|
—
|
|
||||||||||||
|
With an allowance recorded:
|
|
|
|
|
|
|
|
|
|
|
|
|
||||||||||||
|
Commercial
|
|
|
|
|
|
|
|
|
|
|
|
|
||||||||||||
|
Commercial & Industrial
|
1,819
|
|
1,819
|
|
593
|
|
688
|
|
—
|
|
—
|
|
||||||||||||
|
Farmland
|
211
|
|
211
|
|
44
|
|
1,691
|
|
—
|
|
—
|
|
||||||||||||
|
Non Farm, Non Residential
|
—
|
|
—
|
|
—
|
|
—
|
|
|
|
—
|
|
||||||||||||
|
Agriculture
|
346
|
|
346
|
|
100
|
|
316
|
|
—
|
|
—
|
|
||||||||||||
|
All Other Commercial
|
—
|
|
—
|
|
—
|
|
—
|
|
—
|
|
—
|
|
||||||||||||
|
Residential
|
|
|
|
|
|
|
|
|
|
|
|
|
||||||||||||
|
First Liens
|
—
|
|
—
|
|
—
|
|
88
|
|
—
|
|
—
|
|
||||||||||||
|
Home Equity
|
—
|
|
—
|
|
—
|
|
—
|
|
—
|
|
—
|
|
||||||||||||
|
Junior Liens
|
—
|
|
—
|
|
—
|
|
—
|
|
—
|
|
—
|
|
||||||||||||
|
Multifamily
|
—
|
|
—
|
|
—
|
|
—
|
|
—
|
|
—
|
|
||||||||||||
|
All Other Residential
|
—
|
|
—
|
|
—
|
|
—
|
|
—
|
|
—
|
|
||||||||||||
|
Consumer
|
|
|
|
|
|
|
|
|
|
|
|
|
||||||||||||
|
Motor Vehicle
|
—
|
|
—
|
|
—
|
|
—
|
|
—
|
|
—
|
|
||||||||||||
|
All Other Consumer
|
—
|
|
—
|
|
—
|
|
—
|
|
—
|
|
—
|
|
||||||||||||
|
TOTAL
|
$
|
10,516
|
|
$
|
10,516
|
|
$
|
737
|
|
$
|
11,118
|
|
$
|
—
|
|
$
|
—
|
|
||||||
69
|
December 31, 2017
|
|
|
Cash Basis
|
|||||||||
|
|
Average
|
Interest
|
Interest
|
|||||||||
|
|
Recorded
|
Income
|
Income
|
|||||||||
|
|
Investment
|
Recognized
|
Recognized
|
|||||||||
|
With no related allowance recorded:
|
|
|
|
|
|
|
||||||
|
Commercial
|
|
|
|
|
|
|
||||||
|
Commercial & Industrial
|
$
|
971
|
|
$
|
—
|
|
$
|
—
|
|
|||
|
Farmland
|
1,265
|
|
—
|
|
—
|
|
||||||
|
Non Farm, Non Residential
|
2,781
|
|
—
|
|
—
|
|
||||||
|
Agriculture
|
239
|
|
—
|
|
—
|
|
||||||
|
All Other Commercial
|
1,308
|
|
—
|
|
—
|
|
||||||
|
Residential
|
|
|
|
|
|
|
||||||
|
First Liens
|
23
|
|
—
|
|
—
|
|
||||||
|
Home Equity
|
—
|
|
—
|
|
—
|
|
||||||
|
Junior Liens
|
—
|
|
—
|
|
—
|
|
||||||
|
Multifamily
|
—
|
|
—
|
|
—
|
|
||||||
|
All Other Residential
|
—
|
|
—
|
|
—
|
|
||||||
|
Consumer
|
|
|
|
|
|
|
||||||
|
Motor Vehicle
|
—
|
|
—
|
|
—
|
|
||||||
|
All Other Consumer
|
—
|
|
—
|
|
—
|
|
||||||
|
With an allowance recorded:
|
|
|
|
|
|
|
||||||
|
Commercial
|
|
|
|
|
|
|
||||||
|
Commercial & Industrial
|
514
|
|
—
|
|
—
|
|
||||||
|
Farmland
|
669
|
|
—
|
|
—
|
|
||||||
|
Non Farm, Non Residential
|
131
|
|
|
|
—
|
|
||||||
|
Agriculture
|
279
|
|
—
|
|
—
|
|
||||||
|
All Other Commercial
|
—
|
|
—
|
|
—
|
|
||||||
|
Residential
|
|
|
|
|
|
|
||||||
|
First Liens
|
483
|
|
—
|
|
—
|
|
||||||
|
Home Equity
|
—
|
|
—
|
|
—
|
|
||||||
|
Junior Liens
|
—
|
|
—
|
|
—
|
|
||||||
|
Multifamily
|
—
|
|
—
|
|
—
|
|
||||||
|
All Other Residential
|
—
|
|
—
|
|
—
|
|
||||||
|
Consumer
|
|
|
|
|
|
|
||||||
|
Motor Vehicle
|
—
|
|
—
|
|
—
|
|
||||||
|
All Other Consumer
|
—
|
|
—
|
|
—
|
|
||||||
|
TOTAL
|
$
|
8,663
|
|
$
|
—
|
|
$
|
—
|
|
|||
70
The following tables present the recorded investment in nonperforming loans by class of loans.
|
December 31, 2019
|
||||||||||||||||
|
|
Loans Past
|
Troubled Debt
|
||||||||||||||
|
Due Over
90 Day Still
|
Restructured
|
|||||||||||||||
|
(Dollar amounts in thousands)
|
Accruing
|
Accrual
|
Non-accrual
|
Non-accrual
|
||||||||||||
|
Commercial
|
|
|
|
|
|
|
|
|
||||||||
|
Commercial & Industrial
|
$
|
—
|
|
$
|
—
|
|
$
|
11
|
|
$
|
2,191
|
|
||||
|
Farmland
|
5
|
|
—
|
|
—
|
|
2,410
|
|
||||||||
|
Non Farm, Non Residential
|
—
|
|
—
|
|
—
|
|
441
|
|
||||||||
|
Agriculture
|
—
|
|
—
|
|
—
|
|
485
|
|
||||||||
|
All Other Commercial
|
—
|
|
—
|
|
—
|
|
114
|
|
||||||||
|
Residential
|
|
|
|
|
|
|
||||||||||
|
First Liens
|
625
|
|
3,007
|
|
396
|
|
2,876
|
|
||||||||
|
Home Equity
|
12
|
|
—
|
|
—
|
|
61
|
|
||||||||
|
Junior Liens
|
51
|
|
94
|
|
9
|
|
175
|
|
||||||||
|
Multifamily
|
—
|
|
—
|
|
—
|
|
—
|
|
||||||||
|
All Other Residential
|
738
|
|
—
|
|
—
|
|
203
|
|
||||||||
|
Consumer
|
|
|
|
|
|
|
||||||||||
|
Motor Vehicle
|
227
|
|
—
|
|
15
|
|
138
|
|
||||||||
|
All Other Consumer
|
4
|
|
239
|
|
444
|
|
452
|
|
||||||||
|
TOTAL
|
$
|
1,662
|
|
$
|
3,340
|
|
$
|
875
|
|
$
|
9,546
|
|
||||
|
December 31, 2018
|
||||||||||||||||
|
|
Loans Past
|
Troubled Debt
|
|
|||||||||||||
|
Due Over
90 Day Still
|
Restructured
|
|||||||||||||||
|
(Dollar amounts in thousands)
|
Accruing
|
Accrual
|
Non-accrual
|
Non-accrual
|
||||||||||||
|
Commercial
|
|
|
|
|
|
|
|
|
||||||||
|
Commercial & Industrial
|
$
|
—
|
|
$
|
1
|
|
$
|
144
|
|
$
|
2,902
|
|
||||
|
Farmland
|
—
|
|
—
|
|
—
|
|
2,391
|
|
||||||||
|
Non Farm, Non Residential
|
—
|
|
—
|
|
—
|
|
81
|
|
||||||||
|
Agriculture
|
—
|
|
—
|
|
—
|
|
355
|
|
||||||||
|
All Other Commercial
|
—
|
|
—
|
|
—
|
|
1,122
|
|
||||||||
|
Residential
|
|
|
|
|
|
|
||||||||||
|
First Liens
|
581
|
|
3,327
|
|
531
|
|
3,393
|
|
||||||||
|
Home Equity
|
41
|
|
—
|
|
—
|
|
75
|
|
||||||||
|
Junior Liens
|
53
|
|
55
|
|
—
|
|
86
|
|
||||||||
|
Multifamily
|
—
|
|
—
|
|
—
|
|
—
|
|
||||||||
|
All Other Residential
|
—
|
|
—
|
|
—
|
|
64
|
|
||||||||
|
Consumer
|
|
|
|
|
|
|
||||||||||
|
Motor Vehicle
|
177
|
|
1
|
|
—
|
|
125
|
|
||||||||
|
All Other Consumer
|
—
|
|
268
|
|
349
|
|
380
|
|
||||||||
|
TOTAL
|
$
|
852
|
|
$
|
3,652
|
|
$
|
1,024
|
|
$
|
10,974
|
|
||||
71
During the years ending
December 31, 2019
,
2018
, and
2017
the terms of certain loans were modified as troubled debt restructurings (TDRs). The following tables present the activity for TDR's.
|
2019
|
||||||||||||||||
|
(Dollar amounts in thousands)
|
Commercial
|
Residential
|
Consumer
|
Total
|
||||||||||||
|
January 1,
|
$
|
145
|
|
$
|
4,043
|
|
$
|
618
|
|
$
|
4,806
|
|
||||
|
Added
|
—
|
|
195
|
|
375
|
|
570
|
|
||||||||
|
Charged Off
|
—
|
|
(24
|
)
|
(81
|
)
|
(105
|
)
|
||||||||
|
Payments
|
(134
|
)
|
(729
|
)
|
(214
|
)
|
(1,077
|
)
|
||||||||
|
December 31,
|
$
|
11
|
|
$
|
3,485
|
|
$
|
698
|
|
$
|
4,194
|
|
||||
|
2018
|
||||||||||||||||
|
(Dollar amounts in thousands)
|
Commercial
|
Residential
|
Consumer
|
Total
|
||||||||||||
|
January 1,
|
$
|
2,709
|
|
$
|
3,611
|
|
$
|
714
|
|
$
|
7,034
|
|
||||
|
Added
|
—
|
|
984
|
|
295
|
|
1,279
|
|
||||||||
|
Charged Off
|
—
|
|
(16
|
)
|
(137
|
)
|
(153
|
)
|
||||||||
|
Payments
|
(2,564
|
)
|
(536
|
)
|
(254
|
)
|
(3,354
|
)
|
||||||||
|
December 31,
|
$
|
145
|
|
$
|
4,043
|
|
$
|
618
|
|
$
|
4,806
|
|
||||
|
2017
|
||||||||||||||||
|
(Dollar amounts in thousands)
|
Commercial
|
Residential
|
Consumer
|
Total
|
||||||||||||
|
January 1,
|
$
|
3,386
|
|
$
|
4,447
|
|
$
|
732
|
|
$
|
8,565
|
|
||||
|
Added
|
—
|
|
227
|
|
386
|
|
613
|
|
||||||||
|
Charged Off
|
—
|
|
(289
|
)
|
(141
|
)
|
(430
|
)
|
||||||||
|
Payments
|
(677
|
)
|
(774
|
)
|
(263
|
)
|
(1,714
|
)
|
||||||||
|
December 31,
|
$
|
2,709
|
|
$
|
3,611
|
|
$
|
714
|
|
$
|
7,034
|
|
||||
Modification of the terms of such loans typically include one or a combination of the following: a reduction of the stated interest rate of the loan; an extension of the maturity date at a stated rate of interest lower than the current market rate for new debt with similar risk; or a permanent reduction of the recorded investment in the loan. No modification in
2019
,
2018
or
2017
resulted in the permanent reduction of the recorded investment in the loan. Modifications involving a reduction of the stated interest rate of the loan were for periods ranging from
twelve months
to
five years
. Modifications involving an extension of the maturity date were for periods ranging from
twelve months
to
ten years
.
During the years ended
December 31, 2019
,
2018
and
2017
the Corporation modified
45
,
53
, and
43
loans respectively as troubled debt restructurings. All of the loans modified were smaller balance residential and consumer loans. There were no loans that were charged off within 12 months of the modification for
2019
,
2018
, or
2017
.
The Corporation had no allocation of specific reserves to customers whose loan terms have been modified in troubled debt restructurings at
December 31, 2019
,
2018
, and
2017
. The Corporation has not committed to lend additional amounts as of
December 31, 2019
and
2018
to customers with outstanding loans that are classified as troubled debt restructurings.
72
The following tables present the aging of the recorded investment in loans by past due category and class of loans.
|
|
|
|
Greater
|
|
|
|
||||||||||||||||||
|
December 31, 2019
|
30-59 Days
|
60-89 Days
|
than 90 days
|
Total
|
|
|
||||||||||||||||||
|
(Dollar amounts in thousands)
|
Past Due
|
Past Due
|
Past Due
|
Past Due
|
Current
|
Total
|
||||||||||||||||||
|
Commercial
|
|
|
|
|
|
|
|
|
|
|
|
|
||||||||||||
|
Commercial & Industrial
|
$
|
2,885
|
|
$
|
766
|
|
$
|
1,379
|
|
$
|
5,030
|
|
$
|
594,925
|
|
$
|
599,955
|
|
||||||
|
Farmland
|
132
|
|
—
|
|
2,089
|
|
2,221
|
|
137,730
|
|
139,951
|
|
||||||||||||
|
Non Farm, Non Residential
|
3,749
|
|
104
|
|
—
|
|
3,853
|
|
398,854
|
|
402,707
|
|
||||||||||||
|
Agriculture
|
277
|
|
128
|
|
—
|
|
405
|
|
162,794
|
|
163,199
|
|
||||||||||||
|
All Other Commercial
|
—
|
|
—
|
|
109
|
|
109
|
|
288,845
|
|
288,954
|
|
||||||||||||
|
Residential
|
|
|
|
|
|
|
|
|
|
|
|
|
||||||||||||
|
First Liens
|
6,452
|
|
1,292
|
|
1,458
|
|
9,202
|
|
375,924
|
|
385,126
|
|
||||||||||||
|
Home Equity
|
124
|
|
63
|
|
34
|
|
221
|
|
70,813
|
|
71,034
|
|
||||||||||||
|
Junior Liens
|
384
|
|
43
|
|
137
|
|
564
|
|
54,533
|
|
55,097
|
|
||||||||||||
|
Multifamily
|
—
|
|
—
|
|
—
|
|
—
|
|
148,282
|
|
148,282
|
|
||||||||||||
|
All Other Residential
|
1,082
|
|
—
|
|
890
|
|
1,972
|
|
22,510
|
|
24,482
|
|
||||||||||||
|
Consumer
|
|
|
|
|
|
|
|
|
|
|
|
|
||||||||||||
|
Motor Vehicle
|
6,488
|
|
983
|
|
270
|
|
7,741
|
|
347,950
|
|
355,691
|
|
||||||||||||
|
All Other Consumer
|
228
|
|
42
|
|
2
|
|
272
|
|
31,692
|
|
31,964
|
|
||||||||||||
|
TOTAL
|
$
|
21,801
|
|
$
|
3,421
|
|
$
|
6,368
|
|
$
|
31,590
|
|
$
|
2,634,852
|
|
$
|
2,666,442
|
|
||||||
|
|
|
|
Greater
|
|
|
|
||||||||||||||||||
|
December 31, 2018
|
30-59 Days
|
60-89 Days
|
than 90 days
|
Total
|
|
|
||||||||||||||||||
|
(Dollar amounts in thousands)
|
Past Due
|
Past Due
|
Past Due
|
Past Due
|
Current
|
Total
|
||||||||||||||||||
|
Commercial
|
|
|
|
|
|
|
|
|
|
|
|
|
||||||||||||
|
Commercial & Industrial
|
$
|
1,017
|
|
$
|
420
|
|
$
|
345
|
|
$
|
1,782
|
|
$
|
518,239
|
|
$
|
520,021
|
|
||||||
|
Farmland
|
515
|
|
8
|
|
2,136
|
|
2,659
|
|
104,981
|
|
107,640
|
|
||||||||||||
|
Non Farm, Non Residential
|
—
|
|
—
|
|
57
|
|
57
|
|
188,706
|
|
188,763
|
|
||||||||||||
|
Agriculture
|
41
|
|
—
|
|
347
|
|
388
|
|
148,345
|
|
148,733
|
|
||||||||||||
|
All Other Commercial
|
30
|
|
3
|
|
—
|
|
33
|
|
208,633
|
|
208,666
|
|
||||||||||||
|
Residential
|
|
|
|
|
|
|
|
|
|
|
|
|
||||||||||||
|
First Liens
|
3,365
|
|
429
|
|
1,473
|
|
5,267
|
|
231,684
|
|
236,951
|
|
||||||||||||
|
Home Equity
|
155
|
|
8
|
|
110
|
|
273
|
|
39,378
|
|
39,651
|
|
||||||||||||
|
Junior Liens
|
132
|
|
225
|
|
63
|
|
420
|
|
49,111
|
|
49,531
|
|
||||||||||||
|
Multifamily
|
—
|
|
—
|
|
—
|
|
—
|
|
109,609
|
|
109,609
|
|
||||||||||||
|
All Other Residential
|
—
|
|
9
|
|
15
|
|
24
|
|
9,146
|
|
9,170
|
|
||||||||||||
|
Consumer
|
|
|
|
|
|
|
|
|
|
|
|
|
||||||||||||
|
Motor Vehicle
|
4,766
|
|
609
|
|
177
|
|
5,552
|
|
309,238
|
|
314,790
|
|
||||||||||||
|
All Other Consumer
|
208
|
|
7
|
|
12
|
|
227
|
|
27,456
|
|
27,683
|
|
||||||||||||
|
TOTAL
|
$
|
10,229
|
|
$
|
1,718
|
|
$
|
4,735
|
|
$
|
16,682
|
|
$
|
1,944,526
|
|
$
|
1,961,208
|
|
||||||
Credit Quality Indicators:
The Corporation categorizes loans into risk categories based on relevant information about the ability of borrowers to service their debt such as: current financial information, historical payment experience, credit documentation, public information, and current economic trends, among other factors. The Corporation analyzes loans individually by classifying the loans as to credit risk. This analysis includes non-homogeneous loans, such as commercial loans, with an outstanding balance greater than
$100 thousand
. Any consumer loans outstanding to a borrower who had commercial loans analyzed will be similarly risk rated. This analysis is performed on a quarterly basis. The Corporation uses the following definitions for risk ratings:
73
Special Mention:
Loans classified as special mention have a potential weakness that deserves management’s close attention. If left uncorrected, these potential weaknesses may result in deterioration of the repayment prospects for the loan or of the institution’s credit position at some future date.
Substandard:
Loans classified as substandard are inadequately protected by the current net worth and debt service capacity of the borrower or of any pledged collateral. These loans have a well-defined weakness or weaknesses which have clearly jeopardized repayment of principal and interest as originally intended. They are characterized by the distinct possibility that the institution will sustain some future loss if the deficiencies are not corrected.
Doubtful:
Loans classified as doubtful have all the weaknesses inherent in those graded substandard, with the added characteristic that the severity of the weaknesses makes collection or liquidation in full highly questionable or improbable based upon currently existing facts, conditions, and values.
Furthermore, non-homogeneous loans which were not individually analyzed, but are 90+ days past due or on non-accrual are classified as substandard. Loans included in homogeneous pools, such as residential or consumer, may be classified as substandard due to 90+ days delinquency, non-accrual status, bankruptcy, or loan restructuring.
Loans not meeting the criteria above that are analyzed individually as part of the above described process are considered to be pass rated loans. Loans listed as not rated are either less than
$100 thousand
or are included in groups of homogeneous loans. As of
December 31, 2019
and
2018
, and based on the most recent analysis performed, the risk category of loans by class of loans is as follows:
|
December 31, 2019
|
|
Special
|
|
|
|
|
||||||||||||||||||
|
(Dollar amounts in thousands)
|
Pass
|
Mention
|
Substandard
|
Doubtful
|
Not Rated
|
Total
|
||||||||||||||||||
|
Commercial
|
|
|
|
|
|
|
|
|
|
|
|
|
||||||||||||
|
Commercial & Industrial
|
$
|
549,341
|
|
$
|
19,253
|
|
$
|
26,349
|
|
$
|
5
|
|
$
|
2,761
|
|
$
|
597,709
|
|
||||||
|
Farmland
|
119,858
|
|
8,673
|
|
8,644
|
|
—
|
|
100
|
|
137,275
|
|
||||||||||||
|
Non Farm, Non Residential
|
381,404
|
|
4,424
|
|
12,269
|
|
—
|
|
3,678
|
|
401,775
|
|
||||||||||||
|
Agriculture
|
127,144
|
|
4,507
|
|
27,490
|
|
—
|
|
985
|
|
160,126
|
|
||||||||||||
|
All Other Commercial
|
283,266
|
|
3,141
|
|
1,120
|
|
—
|
|
35
|
|
287,562
|
|
||||||||||||
|
Residential
|
|
|
|
|
|
|
|
|
|
|
|
|
||||||||||||
|
First Liens
|
174,338
|
|
926
|
|
4,382
|
|
—
|
|
204,266
|
|
383,912
|
|
||||||||||||
|
Home Equity
|
18,417
|
|
—
|
|
134
|
|
11
|
|
52,280
|
|
70,842
|
|
||||||||||||
|
Junior Liens
|
2,839
|
|
64
|
|
178
|
|
76
|
|
51,817
|
|
54,974
|
|
||||||||||||
|
Multifamily
|
146,497
|
|
112
|
|
1,315
|
|
—
|
|
19
|
|
147,943
|
|
||||||||||||
|
All Other Residential
|
12,624
|
|
—
|
|
205
|
|
—
|
|
11,577
|
|
24,406
|
|
||||||||||||
|
Consumer
|
|
|
|
|
|
|
|
|
|
|
|
|
||||||||||||
|
Motor Vehicle
|
2,880
|
|
—
|
|
538
|
|
—
|
|
350,780
|
|
354,198
|
|
||||||||||||
|
All Other Consumer
|
3,155
|
|
—
|
|
38
|
|
—
|
|
28,615
|
|
31,808
|
|
||||||||||||
|
TOTAL
|
$
|
1,821,763
|
|
$
|
41,100
|
|
$
|
82,662
|
|
$
|
92
|
|
$
|
706,913
|
|
$
|
2,652,530
|
|
||||||
74
|
December 31, 2018
|
|
Special
|
|
|
|
|
||||||||||||||||||
|
(Dollar amounts in thousands)
|
Pass
|
Mention
|
Substandard
|
Doubtful
|
Not Rated
|
Total
|
||||||||||||||||||
|
Commercial
|
|
|
|
|
|
|
|
|
|
|
|
|
||||||||||||
|
Commercial & Industrial
|
$
|
472,008
|
|
$
|
20,600
|
|
$
|
18,374
|
|
$
|
—
|
|
$
|
7,428
|
|
$
|
518,410
|
|
||||||
|
Farmland
|
90,367
|
|
7,587
|
|
7,783
|
|
—
|
|
19
|
|
105,756
|
|
||||||||||||
|
Non Farm, Non Residential
|
170,757
|
|
5,442
|
|
10,439
|
|
—
|
|
1,695
|
|
188,333
|
|
||||||||||||
|
Agriculture
|
118,952
|
|
10,010
|
|
16,637
|
|
—
|
|
457
|
|
146,056
|
|
||||||||||||
|
All Other Commercial
|
198,302
|
|
43
|
|
6,777
|
|
—
|
|
2,675
|
|
207,797
|
|
||||||||||||
|
Residential
|
|
|
|
|
|
|
|
|
|
|
|
|
||||||||||||
|
First Liens
|
43,915
|
|
1,043
|
|
3,504
|
|
—
|
|
187,685
|
|
236,147
|
|
||||||||||||
|
Home Equity
|
963
|
|
—
|
|
148
|
|
—
|
|
38,471
|
|
39,582
|
|
||||||||||||
|
Junior Liens
|
1,983
|
|
74
|
|
224
|
|
76
|
|
47,060
|
|
49,417
|
|
||||||||||||
|
Multifamily
|
109,361
|
|
—
|
|
—
|
|
—
|
|
17
|
|
109,378
|
|
||||||||||||
|
All Other Residential
|
—
|
|
—
|
|
15
|
|
—
|
|
9,131
|
|
9,146
|
|
||||||||||||
|
Consumer
|
|
|
|
|
|
|
|
|
|
|
|
|
||||||||||||
|
Motor Vehicle
|
—
|
|
—
|
|
627
|
|
—
|
|
312,863
|
|
313,490
|
|
||||||||||||
|
All Other Consumer
|
—
|
|
—
|
|
34
|
|
—
|
|
27,517
|
|
27,551
|
|
||||||||||||
|
TOTAL
|
$
|
1,206,608
|
|
$
|
44,799
|
|
$
|
64,562
|
|
$
|
76
|
|
$
|
635,018
|
|
$
|
1,951,063
|
|
||||||
|
8.
|
PREMISES AND EQUIPMENT:
|
Premises and equipment are summarized as follows:
|
|
December 31,
|
|||||||
|
(Dollar amounts in thousands)
|
2019
|
2018
|
||||||
|
Land
|
$
|
17,574
|
|
$
|
11,975
|
|
||
|
Building and leasehold improvements
|
66,592
|
|
56,061
|
|
||||
|
Furniture and equipment
|
39,715
|
|
44,772
|
|
||||
|
|
123,881
|
|
112,808
|
|
||||
|
Less accumulated depreciation
|
(61,305
|
)
|
(66,254
|
)
|
||||
|
TOTAL
|
$
|
62,576
|
|
$
|
46,554
|
|
||
Aggregate depreciation expense was
$3.90 million
,
$3.73 million
and
$3.95 million
for
2019
,
2018
and
2017
, respectively.
The Company leases certain branch properties and equipment under operating leases. Rent expense was
$1.1 million
,
$1.0 million
, and
$1.0 million
for
2019
,
2018
, and
2017
. Rent commitments, before considering renewal options that generally are present, were as follows:
|
2020
|
$
|
820
|
|
|
2021
|
563
|
|
|
|
2022
|
504
|
|
|
|
2023
|
402
|
|
|
|
2024
|
134
|
|
|
|
Thereafter
|
870
|
|
|
|
|
$
|
3,293
|
|
See Note 19 for additional discussion on leases.
75
|
9.
|
GOODWILL AND INTANGIBLE ASSETS:
|
The Corporation completed its annual impairment testing of goodwill during the fourth quarter of
2019
and
2018
. Management does not believe any amount of goodwill is impaired.
Intangible assets subject to amortization at
December 31, 2019
and
2018
are as follows:
|
|
2019
|
2018
|
||||||||||||||
|
|
Gross
|
Accumulated
|
Gross
|
Accumulated
|
||||||||||||
|
(Dollar amounts in thousands)
|
Amount
|
Amortization
|
Amount
|
Amortization
|
||||||||||||
|
Core deposit intangible
|
$
|
21,205
|
|
$
|
10,562
|
|
$
|
10,836
|
|
$
|
9,639
|
|
||||
|
|
$
|
21,205
|
|
$
|
10,562
|
|
$
|
10,836
|
|
$
|
9,639
|
|
||||
Aggregate amortization expense was
$923 thousand
,
$433 thousand
and
$479 thousand
for
2019
,
2018
and
2017
, respectively.
Estimated amortization expense for the next five years is as follows:
|
|
In thousands
|
|
|
|
2020
|
$
|
1,671
|
|
|
2021
|
1,615
|
|
|
|
2022
|
1,390
|
|
|
|
2023
|
1,127
|
|
|
|
2024
|
848
|
|
|
|
10.
|
DEPOSITS:
|
Scheduled maturities of time deposits for the next five years are as follows:
|
(dollar amounts in thousands)
|
|||
|
2020
|
$
|
350,284
|
|
|
2021
|
132,702
|
|
|
|
2022
|
62,207
|
|
|
|
2023
|
44,618
|
|
|
|
2024
|
24,428
|
|
|
|
11.
|
SHORT-TERM BORROWINGS:
|
A summary of the carrying value of the Corporation's short-term borrowings at
December 31, 2019
and
2018
is presented below:
|
(Dollar amounts in thousands)
|
2019
|
2018
|
||||||
|
Federal funds purchased
|
$
|
900
|
|
$
|
43,250
|
|
||
|
Repurchase-agreements
|
79,219
|
|
26,406
|
|
||||
|
|
$
|
80,119
|
|
$
|
69,656
|
|
||
|
(Dollar amounts in thousands)
|
2019
|
2018
|
||||||
|
Average amount outstanding
|
$
|
60,915
|
|
$
|
41,557
|
|
||
|
Maximum amount outstanding at a month end
|
91,750
|
|
69,656
|
|
||||
|
Average interest rate during year
|
1.84
|
%
|
1.24
|
%
|
||||
|
Interest rate at year-end
|
0.31
|
%
|
1.86
|
%
|
||||
Federal funds purchased are generally due in one day and bear interest at market rates. The Corporation enters into sales of securities under agreements to repurchase. The amounts received under these agreements represent short-term borrowings and are reflected as a liability in the consolidated balance sheets. The securities underlying these agreements are included in investment securities
76
in the consolidated balance sheets. The Corporation has no control over the market value of the securities, which fluctuates due to market conditions. However, the Corporation is obligated to promptly transfer additional securities if the market value of the securities falls below the repurchase agreement price. The Corporation manages this risk by maintaining an unpledged securities portfolio that it believes is sufficient to cover a decline in the market value of the securities sold under agreements to repurchase.
Securities are pledged to cover these liabilities, which are not covered by federal deposit insurance. The Corporation maintains possession of and control over these securities.
Collateral pledged to repurchase agreements by remaining maturity are as follows:
|
December 31, 2019
|
||||||||||||||||||||
|
Repurchase Agreements and Repurchase to Maturity Transactions
|
Remaining Contractual Maturity of the Agreements
|
|||||||||||||||||||
|
(Dollar amounts in thousands)
|
Overnight and continuous
|
Up to 30 days
|
30 - 90 days
|
Greater than 90 days
|
Total
|
|||||||||||||||
|
Mortgage Backed Securities - Residential and Collateralized Mortgage Obligations
|
$
|
69,709
|
|
$
|
1,927
|
|
$
|
6,552
|
|
$
|
1,031
|
|
$
|
79,219
|
|
|||||
|
December 31, 2018
|
||||||||||||||||||||
|
Repurchase Agreements and Repurchase to Maturity Transactions
|
Remaining Contractual Maturity of the Agreements
|
|||||||||||||||||||
|
(Dollar amounts in thousands)
|
Overnight and continuous
|
Up to 30 days
|
30 - 90 days
|
Greater than 90 days
|
Total
|
|||||||||||||||
|
Mortgage Backed Securities - Residential and Collateralized Mortgage Obligations
|
$
|
10,870
|
|
$
|
6,307
|
|
$
|
8,683
|
|
$
|
546
|
|
$
|
26,406
|
|
|||||
|
12.
|
OTHER BORROWINGS:
|
Other borrowings at December 31, 2019 and 2018 are summarized as follows:
|
(Dollar amounts in thousands)
|
2019
|
2018
|
||||||
|
FHLB advances
|
$
|
20,796
|
|
$
|
—
|
|
||
|
Junior subordinated debentures
|
10,177
|
|
—
|
|
||||
|
TOTAL
|
$
|
30,973
|
|
$
|
—
|
|
||
The aggregate minimum annual retirements of other borrowings are as follows:
|
2020
|
$
|
15
|
|
|
2021
|
—
|
|
|
|
2022
|
—
|
|
|
|
2023
|
6
|
|
|
|
2024
|
—
|
|
|
|
Thereafter
|
10
|
|
|
|
|
$
|
31
|
|
At
December 31, 2019
and
2018
, other borrowings are summarized as follows: The Corporation's subsidiary banks are members of the Federal Home Loan Bank (FHLB) and accordingly are permitted to obtain advances. There are $20.8 million of advances from the FHLB at
December 31, 2019
, and no advances at
December 31, 2018
, which accrue interest, payable monthly, at annual rates, primarily fixed, varying from
2.3%
to
2.8%
in
2019
and
1.6%
to
2.4%
during the year in
2018
. FHLB advances are, generally, due in full at maturity. They are secured by eligible securities totaling
$129.3 million
at
December 31, 2019
, and
$99.4 million
at
December 31, 2018
, and a blanket pledge on real estate loan collateral. Based on this collateral and the Corporation's holdings of FHLB stock, the Corporation is eligible to borrow up to
$212.3 million
at year end
2019
. Certain
77
advances may be prepaid, without penalty, prior to maturity. The FHLB can adjust the interest rate from fixed to variable on certain advances, but those advances may then be prepaid, without penalty.
|
13.
|
REVENUE FROM CONTRACTS WITH CUSTOMERS:
|
All of the Corporation's revenue from contracts with customers in the scope of ASC 606 is recognized within Non-Interest Income. The following table presents the Corporation's sources of Non-Interest Income for the years ended
December 31, 2019
and
2018
. Items outside the scope of ASC 606 are noted as such.
|
Years Ended December 31,
|
||||||||
|
(Dollar amounts in thousands)
|
2019
|
2018
|
||||||
|
Non-interest income
|
||||||||
|
Service charges on deposits and debit card fee income
|
$
|
21,293
|
|
$
|
20,761
|
|
||
|
Asset management fees
|
5,036
|
|
5,286
|
|
||||
|
Interchange income
|
358
|
|
296
|
|
||||
|
Net gains on sales of loans
(a)
|
2,573
|
|
1,829
|
|
||||
|
Loan servicing fees
(a)
|
1,618
|
|
1,609
|
|
||||
|
Net gains on sales of securities
(a)
|
44
|
|
2
|
|
||||
|
Other service charges and fees
(a)
|
2,099
|
|
1,923
|
|
||||
|
Other
(b)
|
5,431
|
|
6,500
|
|
||||
|
Total non-interest income
|
$
|
38,452
|
|
$
|
38,206
|
|
||
(a)
Not within the scope of ASC 606.
(b)
The Other category includes gains/(losses) on the sale of OREO for the years ended
December 31, 2019
and
December 31, 2018
, totaling
$(29) thousand
and
$(30) thousand
, respectively, which is within the scope of ASC 606; the remaining balance is outside the scope of ASC 606.
Service charges on deposits
: The Corporation earns fees from its deposit customers for transaction-based, account maintenance, and overdraft services. Transaction-based fees, which include services such as ATM use fees, stop payment charges, statement rendering, and ACH fees, are recognized at the time the transaction is executed as that is the point in time the Corporation fulfills the customer's request. Account maintenance fees, which relate primarily to monthly maintenance, are earned over the course of a month, representing the period over which the Corporation satisfies the performance obligation. Overdraft fees are recognized at the point in time that the overdraft occurs. Service charges on deposits are withdrawn from the customer's account balance.
Asset management fees
: The Corporation earns asset management fees from its contracts with trust customers to manage assets for investment, and/or to transact on their accounts. These fees are primarily earned over time as the Corporation provides the contracted monthly or quarterly services and are generally assessed based on a tiered scale of the market value of assets under management at month-end. Fees that are transaction based, including trade execution services, are recognized at the point in time that the transaction is executed, i.e. the trade date. Other related services provided and the fees the Corporation earns, which are based on a fixed fee schedule, are recognized when the services are rendered.
Interchange income
: The Corporation earns interchange fees from debit and credit cardholder transactions conducted through the payment network. Interchange fees from cardholder transactions represent a percentage of the underlying transaction value and are recognized daily, concurrently with the transaction processing services provided to the cardholder.
Gains/Losses on sales of OREO
: The Corporation records a gain or loss from the sale of OREO when control of the property transfers to the buyer, which generally occurs at the time of an executed deed. When the Corporation finances the sale of OREO to the buyer, the Corporation assesses whether the buyer is committed to perform their obligations under the contract and whether collectability of the transaction price is probable. Once these criteria are met, the OREO asset is derecognized and the gain or loss on sale is recorded upon the transfer of control of the property to the buyer. In determining the gain or loss on the sale, the Corporation adjusts the transaction price and related gain (loss) on sale if a significant financing component is present.
78
|
14.
|
INCOME TAXES:
|
Income tax expense is summarized as follows:
|
(Dollar amounts in thousands)
|
2019
|
2018
|
2017
|
|||||||||
|
Federal:
|
|
|
|
|
|
|
||||||
|
Currently payable
|
$
|
7,118
|
|
$
|
7,018
|
|
$
|
8,303
|
|
|||
|
Deferred
|
2,435
|
|
1,793
|
|
3,756
|
|
||||||
|
Expense due to enactment of federal tax reform
|
—
|
|
—
|
|
6,282
|
|
||||||
|
|
9,553
|
|
8,811
|
|
18,341
|
|
||||||
|
State:
|
|
|
|
|
|
|
||||||
|
Currently payable
|
2,168
|
|
1,699
|
|
1,818
|
|
||||||
|
Deferred
|
406
|
|
635
|
|
463
|
|
||||||
|
|
2,574
|
|
2,334
|
|
2,281
|
|
||||||
|
TOTAL
|
$
|
12,127
|
|
$
|
11,145
|
|
$
|
20,622
|
|
|||
The reconciliation of income tax expense with the amount computed by applying the statutory federal income tax rate of
21%
for 2019 and 2018 (35% for 2017) to income before income taxes is summarized as follows:
|
(Dollar amounts in thousands)
|
2019
|
2018
|
2017
|
|||||||||
|
Federal income taxes computed at the statutory rate
|
$
|
12,810
|
|
$
|
12,122
|
|
$
|
17,414
|
|
|||
|
Add (deduct) tax effect of:
|
|
|
|
|
|
|
||||||
|
Tax exempt income
|
(2,551
|
)
|
(2,495
|
)
|
(4,102
|
)
|
||||||
|
Non-deductible insurance brokerage goodwill
|
—
|
|
—
|
|
—
|
|
||||||
|
ESOP dividend deduction
|
(115
|
)
|
(103
|
)
|
(102
|
)
|
||||||
|
State tax, net of federal benefit
|
2,034
|
|
1,846
|
|
1,483
|
|
||||||
|
Affordable housing credits
|
(148
|
)
|
(148
|
)
|
(148
|
)
|
||||||
|
Expense due to enactment of federal tax reform
|
—
|
|
—
|
|
6,282
|
|
||||||
|
Other, net
|
97
|
|
(77
|
)
|
(205
|
)
|
||||||
|
TOTAL
|
$
|
12,127
|
|
$
|
11,145
|
|
$
|
20,622
|
|
|||
On December 22, 2017, the Tax Cuts and Jobs Act was signed into law. The primary change for the Corporation was to lower the corporate income tax rate from 35% to 21%, effective January 1, 2018. The Corporation's deferred tax assets and liabilities were re-measured based on the income tax rates at which they are expected to reverse in the future, which is generally 21%. The amount recorded related to the re-measurement of the Corporation's deferred tax balance was $6.3 million, an increase to income tax expense for the year ended December 31, 2017.
79
The tax effects of temporary differences that give rise to significant portions of the deferred tax assets and liabilities at
December 31, 2019
and
2018
, are as follows:
|
(Dollar amounts in thousands)
|
2019
|
2018
|
||||||
|
Deferred tax assets:
|
|
|
|
|
||||
|
Other than temporary impairment
|
$
|
754
|
|
$
|
761
|
|
||
|
Net unrealized losses on retirement plans
|
7,465
|
|
5,783
|
|
||||
|
Net unrealized losses on securities available for sale
|
—
|
|
2,063
|
|
||||
|
Loan loss provisions
|
5,288
|
|
5,463
|
|
||||
|
Deferred compensation
|
2,615
|
|
2,883
|
|
||||
|
Compensated absences
|
611
|
|
576
|
|
||||
|
Post-retirement benefits
|
1,309
|
|
1,338
|
|
||||
|
Lease liability
|
1,503
|
|
—
|
|
||||
|
Purchase accounting
|
1,600
|
|
—
|
|
||||
|
Deferred loss on acquisition
|
482
|
|
577
|
|
||||
|
Other
|
2,161
|
|
2,140
|
|
||||
|
GROSS DEFERRED ASSETS
|
23,788
|
|
21,584
|
|
||||
|
Deferred tax liabilities:
|
|
|
||||||
|
Net unrealized gains on securities available-for-sale
|
(4,248
|
)
|
—
|
|
||||
|
Depreciation
|
(2,376
|
)
|
(2,004
|
)
|
||||
|
Mortgage servicing rights
|
(332
|
)
|
(319
|
)
|
||||
|
Pensions
|
(475
|
)
|
(335
|
)
|
||||
|
Right-of-use asset
|
(1,501
|
)
|
—
|
|
||||
|
Intangibles
|
(3,285
|
)
|
(2,852
|
)
|
||||
|
Other
|
(2,827
|
)
|
(2,614
|
)
|
||||
|
GROSS DEFERRED LIABILITIES
|
(15,044
|
)
|
(8,124
|
)
|
||||
|
NET DEFERRED TAX ASSETS
|
$
|
8,744
|
|
$
|
13,460
|
|
||
Unrecognized Tax Benefits — A reconciliation of the beginning and ending amount of unrecognized tax benefits is as follows:
|
(Dollar amounts in thousands)
|
2019
|
2018
|
2017
|
|||||||||
|
Balance at January 1
|
$
|
922
|
|
$
|
825
|
|
$
|
698
|
|
|||
|
Additions based on tax positions related to the current year
|
298
|
|
174
|
|
257
|
|
||||||
|
Additions based on tax positions related to prior years
|
—
|
|
—
|
|
—
|
|
||||||
|
Reductions due to the statute of limitations
|
(395
|
)
|
(77
|
)
|
(130
|
)
|
||||||
|
Balance at December 31
|
$
|
825
|
|
$
|
922
|
|
$
|
825
|
|
|||
Of this total,
$825
thousand represents the amount of unrecognized tax benefits that, if recognized, would favorably affect the effective income tax rate in future periods. The Corporation does not expect the total amount of unrecognized tax benefits to significantly increase or decrease in the next 12 months.
The total amount of interest and penalties recorded in the income statement for the years ended
December 31, 2019
,
2018
and
2017
was an expense decrease of
$9
thousand, an increase of
$23
thousand, and an increase of
$4
thousand, respectively. The amount accrued for interest and penalties at
December 31, 2019
,
2018
and
2017
was
$53
thousand,
$52
thousand and
$40
thousand, respectively.
The Corporation and its subsidiaries are subject to U.S. federal income tax as well as income tax of the states of Indiana and Illinois. The Corporation is no longer subject to examination by taxing authorities for years before 2016.
|
15.
|
FINANCIAL INSTRUMENTS WITH OFF-BALANCE-SHEET RISK:
|
The Corporation is a party to financial instruments with off-balance-sheet risk in the normal course of business to meet the financing needs of its customers. These financial instruments include conditional commitments and commercial letters of credit. The financial instruments involve to varying degrees, elements of credit and interest rate risk in excess of amounts recognized in the financial
80
statements. The Corporation's maximum exposure to credit loss in the event of nonperformance by the other party to the financial instrument for commitments to make loans is limited generally by the contractual amount of those instruments. The Corporation follows the same credit policy to make such commitments as is followed for those loans recorded in the consolidated financial statements.
Commitment and contingent liabilities are summarized as follows at December 31:
|
(Dollar amounts in thousands)
|
2019
|
2018
|
||||||
|
Home Equity
|
$
|
87,327
|
|
$
|
57,341
|
|
||
|
Commercial Operating Lines
|
358,561
|
|
285,524
|
|
||||
|
Other Commitments
|
105,872
|
|
81,593
|
|
||||
|
TOTAL
|
$
|
551,760
|
|
$
|
424,458
|
|
||
|
Commercial letters of credit
|
$
|
3,851
|
|
$
|
4,673
|
|
||
The majority of commercial operating lines and home equity lines are variable rate, while the majority of other commitments to fund loans are fixed rate. Fixed rate commitments had a range of interest rates from
4.25%
to
7.25%
in
2019
. In
2018
this range of rates was from
4.50%
to
7.75%
. Since many commitments to make loans expire without being used, these amounts do not necessarily represent future cash commitments. Collateral obtained upon exercise of the commitment is determined using management's credit evaluation of the borrower, and may include accounts receivable, inventory, property, land and other items. The approximate duration of these commitments is generally one year or less.
Derivatives:
The Corporation enters into derivative instruments for the benefit of its customers. At the inception of a derivative contract, the Corporation designates the derivative as an instrument with no hedging designation ("standalone derivative"). Changes in the fair value of derivatives are reported currently in earnings as non-interest income. Net cash settlements on derivatives that do not qualify for hedge accounting are reported in non-interest income.
First Financial Bank offers clients the ability on certain transactions to enter into interest rate swaps. Typically, these are pay fixed, receive floating swaps used in conjunction with commercial loans. These derivative contracts do not qualify for hedge accounting. The Bank hedges the exposure to these contracts by entering into offsetting contracts with substantially matching terms. The notional amount of these interest rate swaps was
$26.2
million and
$19.0 million
at
December 31, 2019
and
2018
. The fair value of these contracts combined was zero, as gains offset losses. The gross gain and loss associated with these interest rate swaps was
$0.8 million
and
$0.1 million
at
December 31, 2019
and
2018
.
|
16.
|
RETIREMENT PLANS:
|
Employees of the Corporation are covered by a retirement program that consists of a defined benefit plan and an employee stock ownership plan (ESOP). Plan assets consist primarily of the Corporation's stock and obligations of U.S. Government agencies. Benefits under the defined benefit plan are actuarially determined based on an employee's service and compensation, as defined, and funded as necessary. This plan was frozen for the majority of employees as of December 31, 2012.Those employees will be eligible to participate in a 401K plan that the Corporation can contribute a discretionary match of the pay contributed by the employee. In addition the ESOP plan will continue in place for all employees.
Assets in the ESOP are considered in calculating the funding to the defined benefit plan required to provide such benefits. Any shortfall of benefits under the ESOP are to be provided by the defined benefit plan. The ESOP may provide benefits beyond those determined under the defined benefit plan. Contributions to the ESOP are determined by the Corporation's Board of Directors. The Corporation made contributions to the defined benefit plan of
$1.77 million
,
$2.26 million
and
$2.55 million
in
2019
,
2018
and
2017
. The Corporation contributed
$1.25 million
,
$1.09 million
and
$1.06 million
to the ESOP in
2019
,
2018
and
2017
. There were contributions of
$926 thousand
,
$735 thousand
and
$676 thousand
to the ESOP for employees no longer participating in the defined benefit plan in
2019
,
2018
and
2017
respectively.
The Corporation uses a measurement date of December 31.
81
Net periodic benefit cost and other amounts recognized in other comprehensive income included the following components:
|
(Dollar amounts in thousands)
|
2019
|
2018
|
2017
|
|||||||||
|
Service cost - benefits earned
|
$
|
1,218
|
|
$
|
1,388
|
|
$
|
1,432
|
|
|||
|
Interest cost on projected benefit obligation
|
3,465
|
|
3,194
|
|
3,621
|
|
||||||
|
Expected return on plan assets
|
(3,585
|
)
|
(3,962
|
)
|
(3,940
|
)
|
||||||
|
Net amortization and deferral
|
1,558
|
|
1,448
|
|
1,205
|
|
||||||
|
Net periodic pension cost
|
2,656
|
|
2,068
|
|
2,318
|
|
||||||
|
Net loss (gain) during the period
|
6,362
|
|
(1,192
|
)
|
5,366
|
|
||||||
|
Amortization of prior service cost
|
(1
|
)
|
(1
|
)
|
(1
|
)
|
||||||
|
Amortization of unrecognized gain (loss)
|
(1,558
|
)
|
(1,447
|
)
|
(1,204
|
)
|
||||||
|
Total recognized in other comprehensive (income) loss
|
4,803
|
|
(2,640
|
)
|
4,161
|
|
||||||
|
Total recognized net periodic pension cost and other comprehensive income
|
$
|
7,459
|
|
$
|
(572
|
)
|
$
|
6,479
|
|
|||
The estimated net loss and prior service costs (credits) for the defined benefit pension plan that will be amortized from accumulated other comprehensive income into net periodic benefit cost over the next fiscal year are
$2.0 million
and
$1 thousand
.
The information below sets forth the change in projected benefit obligation, reconciliation of plan assets, and the funded status of the Corporation's retirement program. Actuarial present value of benefits is based on service to date and present pay levels.
|
(Dollar amounts in thousands)
|
2019
|
2018
|
||||||
|
Change in benefit obligation:
|
|
|
|
|
||||
|
Benefit obligation at January 1
|
$
|
87,796
|
|
$
|
98,096
|
|
||
|
Service cost
|
1,218
|
|
1,388
|
|
||||
|
Interest cost
|
3,465
|
|
3,194
|
|
||||
|
Actuarial (gain) loss
|
14,233
|
|
(10,618
|
)
|
||||
|
Benefits paid
|
(3,921
|
)
|
(4,264
|
)
|
||||
|
Benefit obligation at December 31
|
102,791
|
|
87,796
|
|
||||
|
Reconciliation of fair value of plan assets:
|
|
|
|
|
||||
|
Fair value of plan assets at January 1
|
64,335
|
|
71,449
|
|
||||
|
Actual return on plan assets
|
11,456
|
|
(5,464
|
)
|
||||
|
Employer contributions
|
2,092
|
|
2,614
|
|
||||
|
Benefits paid
|
(3,921
|
)
|
(4,264
|
)
|
||||
|
Fair value of plan assets at December 31
|
73,962
|
|
64,335
|
|
||||
|
Funded status at December 31 (plan assets less benefit obligation)
|
$
|
(28,829
|
)
|
$
|
(23,461
|
)
|
||
Amounts recognized in accumulated other comprehensive income at
December 31, 2019
and
2018
consist of:
|
(Dollar amounts in thousands)
|
2019
|
2018
|
||||||
|
Net loss (gain)
|
$
|
27,786
|
|
$
|
22,982
|
|
||
|
Prior service cost (credit)
|
2
|
|
2
|
|
||||
|
|
$
|
27,788
|
|
$
|
22,984
|
|
||
The accumulated benefit obligation for the defined benefit pension plan was
$98.4
million and
$83.9
million at year-end
2019
and
2018
.
|
Principal assumptions used to determine pension benefit obligation at year end:
|
2019
|
2018
|
||||
|
Discount rate
|
3.22
|
%
|
4.22
|
%
|
||
|
Rate of increase in compensation levels
|
3.00
|
|
3.00
|
|
||
82
|
Principal assumptions used to determine net periodic pension cost:
|
2019
|
2018
|
||||
|
Discount rate
|
4.22
|
%
|
3.60
|
%
|
||
|
Rate of increase in compensation levels
|
3.00
|
|
3.00
|
|
||
|
Expected long-term rate of return on plan assets
|
6.00
|
|
6.00
|
|
||
The expected long-term rate of return was estimated using market benchmarks for equities and bonds applied to the plan's target asset allocation. Management estimated the rate by which plan assets would perform based on historical experience as adjusted for changes in asset allocations and expectations for future return on equities as compared to past periods.
Plan Assets
— The Corporation's pension plan weighted-average asset allocation for the years
2019
and
2018
by asset category are as follows:
|
Pension Plan
Target Allocation
|
ESOP
Target Allocation
|
Pension
Percentage of Plan
Assets at December 31,
|
ESOP
Percentage of Plan
Assets at December 31,
|
|||||||||||||
|
ASSET CATEGORY
|
2019
|
2019
|
2019
|
2018
|
2019
|
2018
|
||||||||||
|
Equity securities
|
25-75%
|
95-99%
|
63
|
%
|
65
|
%
|
98
|
%
|
99
|
%
|
||||||
|
Debt securities
|
0-50%
|
0-0%
|
33
|
%
|
31
|
%
|
—
|
%
|
—
|
%
|
||||||
|
Other
|
0-20%
|
0-5%
|
4
|
%
|
4
|
%
|
2
|
%
|
1
|
%
|
||||||
|
TOTAL
|
|
|
100
|
%
|
100
|
%
|
100
|
%
|
100
|
%
|
||||||
Fair Value of Plan Assets
— Fair value is the exchange price that would be received for an asset in the principal or most advantageous market for the asset in an orderly transaction between market participants on the measurement date. It also establishes a fair value hierarchy which requires an entity to maximize the use of observable inputs and minimize the use of unobservable inputs when measuring fair value.
The Corporation used the following methods and significant assumptions to estimate the fair value of each type of financial instrument:
Equity, Debt, Investment Funds and Other Securities
— The fair values for investment securities are determined by quoted market prices, if available (Level 1). For securities where quoted prices are not available, fair values are calculated based on market prices of similar securities (Level 2). For securities where quoted prices or market prices of similar securities are not available, fair values are calculated using discounted cash flows or other market indicators (Level 3).
The fair value of the plan assets at
December 31, 2019
and
2018
, by asset category, is as follows:
|
Fair Value Measurements at
December 31, 2019 Using:
|
||||||||||||||||
|
Quoted Prices
in Active
Markets for
Identical Assets
|
Significant
Other
Observable
Inputs
|
Significant
Observable
Inputs
|
||||||||||||||
|
(Dollar amounts in thousands)
|
Total
|
(Level 1)
|
(Level 2)
|
(Level 3)
|
||||||||||||
|
Plan assets
|
|
|
|
|
|
|
|
|
||||||||
|
Equity securities
|
$
|
51,334
|
|
$
|
51,334
|
|
$
|
—
|
|
$
|
—
|
|
||||
|
Debt securities
|
13,104
|
|
—
|
|
13,104
|
|
—
|
|
||||||||
|
Investment Funds
|
9,524
|
|
9,524
|
|
—
|
|
—
|
|
||||||||
|
Total plan assets
|
$
|
73,962
|
|
$
|
60,858
|
|
$
|
13,104
|
|
$
|
—
|
|
||||
83
|
Fair Value Measurements at
December 31, 2018 Using:
|
||||||||||||||||
|
Quoted Prices
in Active
Markets for
Identical Assets
|
Significant
Other
Observable
Inputs
|
Significant
Observable
Inputs
|
||||||||||||||
|
(Dollar amounts in thousands)
|
Total
|
(Level 1)
|
(Level 2)
|
(Level 3)
|
||||||||||||
|
Plan assets
|
|
|
|
|
|
|
|
|
||||||||
|
Equity securities
|
$
|
43,931
|
|
$
|
43,931
|
|
$
|
—
|
|
$
|
—
|
|
||||
|
Debt securities
|
10,652
|
|
—
|
|
10,652
|
|
—
|
|
||||||||
|
Investment Funds
|
9,752
|
|
9,752
|
|
—
|
|
—
|
|
||||||||
|
Total plan assets
|
$
|
64,335
|
|
$
|
53,683
|
|
$
|
10,652
|
|
$
|
—
|
|
||||
The investment objective for the retirement program is to maximize total return without exposure to undue risk. Asset allocation favors equities. This target includes the Corporation's ESOP, which is fully invested in corporate stock. Other investment allocations include fixed income securities and cash.
The plan is prohibited from investing in the following: private placement equity and debt transactions; letter stock and uncovered options; short-sale margin transactions and other specialized investment activity; and fixed income or interest rate futures. All other investments not prohibited by the plan are permitted.
Equity securities in the defined benefit plan include First Financial Corporation common stock in the amount of
$19.8 million
(
27 percent
of total plan assets) and
$18.0 million
(
28 percent
of total plan assets) at
December 31, 2019
and
2018
, respectively. In addition the ESOP for non plan participants holds an estimated
$5.1 million
and $
3.8 million
of First Financial Corporation stock at
December 31, 2019
and
December 31, 2018
respectively. Other equity securities are predominantly stocks in large cap U.S. companies.
Contributions —
The Corporation expects to contribute
$3.7 million
to its pension plan and
$736 thousand
to its ESOP in
2020
.
Estimated Future Payments
— The following benefit payments, which reflect expected future service, are expected:
|
PENSION BENEFITS
|
|||
|
(Dollar amounts in thousands)
|
|||
|
2020
|
$
|
4,709
|
|
|
2021
|
4,987
|
|
|
|
2022
|
5,213
|
|
|
|
2023
|
5,409
|
|
|
|
2024
|
5,567
|
|
|
|
2025-2029
|
29,531
|
|
|
Supplemental Executive Retirement Plan
— The Corporation has established a Supplemental Executive Retirement Plan (SERP) for certain executive officers. The provisions of the SERP allow the Plan's participants who are also participants in the Corporation's defined benefit pension plan to receive supplemental retirement benefits to help recompense for benefits lost due to the imposition of IRS limitations on benefits under the Corporation's tax qualified defined benefit pension plan. Expenses related to the plan were
$339 thousand
in
2019
and
$411 thousand
in
2018
and
$321 thousand
in
2017
.The plan is unfunded and has a measurement date of December 31. The amounts recognized in other comprehensive income in the current year are as follows:
|
(Dollar amounts in thousands)
|
2019
|
2018
|
2017
|
|||||||||
|
Net loss (gain) during the period
|
$
|
1,357
|
|
$
|
260
|
|
$
|
527
|
|
|||
|
Amortization of prior service cost
|
—
|
|
—
|
|
—
|
|
||||||
|
Amortization of unrecognized gain (loss)
|
(75
|
)
|
(51
|
)
|
—
|
|
||||||
|
Total recognized in other comprehensive (income) loss
|
$
|
1,282
|
|
$
|
209
|
|
$
|
527
|
|
|||
84
The Corporation has
$6.7 million
and
$5.0 million
recognized in the balance sheet as a liability at
December 31, 2019
and
2018
. Amounts in accumulated other comprehensive income consist of
$2.4 million
net loss at
December 31, 2019
and
$1.1 million
net loss at
December 31, 2018
. The estimated loss for the SERP that will be amortized from accumulated other comprehensive income into net periodic benefit cost over the next fiscal year is
$247 thousand
.
Estimated Future Payments
— The following benefit payments, which reflect expected future service, are expected:
|
(Dollar amounts on thousands)
|
|||
|
2020
|
$
|
—
|
|
|
2021
|
203
|
|
|
|
2022
|
399
|
|
|
|
2023
|
390
|
|
|
|
2024
|
380
|
|
|
|
2025-2029
|
3,104
|
|
|
Post-retirement medical benefits
— The Corporation also provides medical benefits to certain employees subsequent to their retirement. The Corporation uses a measurement date of December 31. Accrued post-retirement benefits as of
December 31, 2019
and
2018
are as follows:
|
|
December 31,
|
|||||||
|
(Dollar amounts in thousands)
|
2019
|
2018
|
||||||
|
Change in benefit obligation:
|
|
|
|
|
||||
|
Benefit obligation at January 1
|
$
|
3,420
|
|
$
|
4,361
|
|
||
|
Service cost
|
34
|
|
42
|
|
||||
|
Interest cost
|
145
|
|
131
|
|
||||
|
Plan participants' contributions
|
65
|
|
83
|
|
||||
|
Actuarial (gain) loss
|
626
|
|
(872
|
)
|
||||
|
Benefits paid
|
(315
|
)
|
(325
|
)
|
||||
|
Benefit obligation at December 31
|
$
|
3,975
|
|
$
|
3,420
|
|
||
|
Funded status at December 31
|
$
|
3,975
|
|
$
|
3,420
|
|
||
Amounts recognized in accumulated other comprehensive income consist of a net loss of
$27 thousand
at
December 31, 2019
and
$615 thousand
net gain at
December 31, 2018
. The post-retirement benefits paid in
2019
and
2018
of
$315 thousand
and
$325 thousand
, respectively, were fully funded by company and participant contributions.
There is no estimated transition obligation for the post-retirement benefit plan that will be amortized from accumulated other comprehensive income into net periodic benefit cost over the next fiscal year.
Weighted average assumptions at December 31:
|
|
December 31,
|
|||||
|
|
2019
|
2018
|
||||
|
Discount rate
|
3.22
|
%
|
4.22
|
%
|
||
|
Initial weighted health care cost trend rate
|
5.00
|
%
|
5.00
|
%
|
||
|
Ultimate health care cost trend rate
|
5.00
|
|
5.00
|
|
||
|
Year that the rate is assumed to stabilize and remain unchanged
|
2020
|
|
2019
|
|
||
85
Post-retirement health benefit expense included the following components:
|
|
Years Ended December 31,
|
|||||||||||
|
(Dollar amounts in thousands)
|
2019
|
2018
|
2017
|
|||||||||
|
Service cost
|
$
|
34
|
|
$
|
42
|
|
$
|
53
|
|
|||
|
Interest cost
|
146
|
|
131
|
|
172
|
|
||||||
|
Amortization of net actuarial loss (gain)
|
(16
|
)
|
—
|
|
—
|
|
||||||
|
Net periodic benefit cost
|
164
|
|
173
|
|
225
|
|
||||||
|
Net loss (gain) during the period
|
626
|
|
(872
|
)
|
83
|
|
||||||
|
Amortization of prior service cost
|
16
|
|
—
|
|
—
|
|
||||||
|
Total recognized in other comprehensive income (loss)
|
642
|
|
(872
|
)
|
83
|
|
||||||
|
Total recognized net periodic benefit cost and other comprehensive income
|
$
|
806
|
|
$
|
(699
|
)
|
$
|
308
|
|
|||
Assumed health care cost trend rates have a significant effect on the amounts reported for the health care plans. A one-percentage-point change in the assumed health care cost trend rates would have the following effects:
|
|
1% Point
|
1% Point
|
||||||
|
(Dollar amounts in thousands)
|
Increase
|
Decrease
|
||||||
|
Effect on total of service and interest cost components
|
$
|
1
|
|
$
|
1
|
|
||
|
Effect on post-retirement benefit obligation
|
17
|
|
16
|
|
||||
Contributions
— The Corporation expects to contribute
$251 thousand
to its other post-retirement benefit plan in 2019.
Estimated Future Payments
— The following benefit payments, which reflect expected future service, are expected:
|
(Dollar amounts in thousands)
|
|||
|
2020
|
$
|
251
|
|
|
2021
|
245
|
|
|
|
2022
|
246
|
|
|
|
2023
|
248
|
|
|
|
2024
|
251
|
|
|
|
2025-2029
|
1,187
|
|
|
|
17.
|
STOCK BASED COMPENSATION:
|
On February 5, 2011, the Corporation's Board of Directors adopted and approved the First Financial Corporation 2011 Omnibus Equity Incentive Plan (the "2011 Stock Incentive Plan") effective upon the approval of the Plan by the Company's shareholders, which occurred on April 20, 2011 at the Corporation’s annual meeting of shareholders. The 2011 Stock Incentive Plan provides for the grant of non qualified stock options, incentive stock options, stock appreciation rights, restricted stock, restricted stock units and incentive awards. An aggregate of
700,000
shares of common stock are reserved for issuance under the 2011 Stock Incentive Plan. Shares issuable under the 2011 Stock Incentive Plan may be authorized and unissued shares of common stock or treasury shares.
During the first quarter of
2019
and
2018
, the Compensation Committee of the Board of Directors of the Company granted restricted stock awards to certain executive officers pursuant to the Corporation's annual performance-based stock incentive bonus plan. Compensation expense is recognized over the vesting period of the awards based on the fair value of the stock at the grant date. The value of the awards was determined by dividing the award amount by the median price of a share of Company common stock on the grant dates. The restricted stock awards vest as follows —
33%
on the first anniversary,
33%
on the second anniversary and the remaining
34%
on the third anniversary of the earned date. The Corporation has the right to retain shares to satisfy any withholding tax obligation. A total of
186,072
shares of restricted common stock of the Company were granted under the 2011 Stock Incentive Plan. A total of
513,928
remain to be granted under this plan.
86
Restricted Stock
Restricted stock awards require certain service-based or performance requirements and have a vesting period of
3
years. Compensation expense is recognized over the vesting period of the award based on the fair value of the stock at the date of issue. Compensation related to the plan was
$799 thousand
,
$745 thousand
, and
$706 thousand
in
2019
,
2018
and
2017
, respectively.
|
2019
|
2018
|
|||||||||||
|
Number
|
Weighted Average
Grant Date
|
Number
|
Weighted Average
Grant Date
|
|||||||||
|
(shares in thousands)
|
Outstanding
|
Fair Value
|
Outstanding
|
Fair Value
|
||||||||
|
Nonvested balance at January 1,
|
16,999
|
|
45.92
|
|
18,019
|
|
41.14
|
|
||||
|
Granted during the year
|
19,783
|
|
42.52
|
|
17,220
|
|
45.55
|
|
||||
|
Vested during the year
|
(17,851
|
)
|
44.79
|
|
(18,240
|
)
|
40.85
|
|
||||
|
Forfeited during the year
|
—
|
|
—
|
|
—
|
|
—
|
|
||||
|
Nonvested balance at December 31,
|
18,931
|
|
43.44
|
|
16,999
|
|
45.92
|
|
||||
As of
December 31, 2019
and
2018
, there was
$822 thousand
and
$674 thousand
, respectively of total unrecognized compensation cost related to non-vested shares granted under the Plan. The cost is expected to be recognized over a weighted-average period of
1.5
years. The total fair value of the shares vested during the years ended
December 31, 2019
and
2018
was
$816 thousand
and
$732 thousand
, respectively.
18. OTHER COMPREHENSIVE INCOME (LOSS):
The following table summarizes the changes, net of tax within each classification of accumulated other comprehensive income for the years ended
December 31, 2019
and
2018
.
|
|
Unrealized
|
|
|
|||||||||
|
|
gains and
|
2019
|
||||||||||
|
Losses on
available- for-sale |
Retirement
|
|||||||||||
|
(Dollar amounts in thousands)
|
Securities
|
plans
|
Total
|
|||||||||
|
Beginning balance, January 1
|
$
|
(6,105
|
)
|
$
|
(17,349
|
)
|
$
|
(23,454
|
)
|
|||
|
Change in other comprehensive income before reclassification
|
21,031
|
|
(6,213
|
)
|
14,818
|
|
||||||
|
Amounts reclassified from accumulated other comprehensive income
|
(33
|
)
|
1,168
|
|
1,135
|
|
||||||
|
Net current period other comprehensive income (loss)
|
20,998
|
|
(5,045
|
)
|
15,953
|
|
||||||
|
ASU 2018-02 adjustment
|
$
|
—
|
|
$
|
—
|
|
$
|
—
|
|
|||
|
Ending balance, December 31
|
$
|
14,893
|
|
$
|
(22,394
|
)
|
$
|
(7,501
|
)
|
|||
|
|
Unrealized
|
|
|
|||||||||
|
|
gains and
|
2018
|
||||||||||
|
Losses on
available- for-sale |
Retirement
|
|||||||||||
|
(Dollar amounts in thousands)
|
Securities
|
plans
|
Total
|
|||||||||
|
Beginning balance, January 1
|
$
|
2,258
|
|
$
|
(16,962
|
)
|
$
|
(14,704
|
)
|
|||
|
Change in other comprehensive income before reclassification
|
(8,859
|
)
|
1,392
|
|
(7,467
|
)
|
||||||
|
Amounts reclassified from accumulated other comprehensive income
|
(2
|
)
|
1,085
|
|
1,083
|
|
||||||
|
Net current period other comprehensive income (loss)
|
(8,861
|
)
|
2,477
|
|
(6,384
|
)
|
||||||
|
ASU 2018-02 adjustment
|
$
|
498
|
|
$
|
(2,864
|
)
|
$
|
(2,366
|
)
|
|||
|
Ending balance, December 31
|
$
|
(6,105
|
)
|
$
|
(17,349
|
)
|
$
|
(23,454
|
)
|
|||
87
|
Balance
at |
Current
Period |
Balance
at |
||||||||||
|
(Dollar amounts in thousands)
|
1/1/2019
|
Change
|
12/31/2019
|
|||||||||
|
Unrealized gains (losses) on securities available-for-sale
|
|
|
|
|||||||||
|
without other than temporary impairment
|
$
|
(8,446
|
)
|
$
|
20,624
|
|
$
|
12,178
|
|
|||
|
Unrealized gains (losses) on securities available-for-sale
|
|
|
|
|
|
|
||||||
|
with other than temporary impairment
|
2,341
|
|
374
|
|
2,715
|
|
||||||
|
Total unrealized gain (loss) on securities available-for-sale
|
$
|
(6,105
|
)
|
$
|
20,998
|
|
$
|
14,893
|
|
|||
|
Unrealized loss on retirement plans
|
(17,349
|
)
|
(5,045
|
)
|
(22,394
|
)
|
||||||
|
TOTAL
|
$
|
(23,454
|
)
|
$
|
15,953
|
|
$
|
(7,501
|
)
|
|||
|
Balance
at
|
Current
Period
|
Balance
at
|
||||||||||
|
(Dollar amounts in thousands)
|
1/1/2018
|
Change
|
12/31/2018
|
|||||||||
|
Unrealized gains (losses) on securities available-for-sale
|
|
|
|
|
|
|
||||||
|
without other than temporary impairment
|
$
|
(1,371
|
)
|
$
|
(7,075
|
)
|
$
|
(8,446
|
)
|
|||
|
Unrealized gains (losses) on securities available-for-sale
|
|
|
|
|
|
|
||||||
|
with other than temporary impairment
|
3,629
|
|
(1,288
|
)
|
2,341
|
|
||||||
|
Total unrealized gain (loss) on securities available-for-sale
|
$
|
2,258
|
|
$
|
(8,363
|
)
|
$
|
(6,105
|
)
|
|||
|
Unrealized loss on retirement plans
|
(16,962
|
)
|
(387
|
)
|
(17,349
|
)
|
||||||
|
TOTAL
|
$
|
(14,704
|
)
|
$
|
(8,750
|
)
|
$
|
(23,454
|
)
|
|||
|
|
Balance at December 31, 2019
|
|
||||
|
Details about accumulated
|
Amount reclassified from
|
Affected line item in
|
||||
|
other comprehensive
|
accumulated other
|
the statement where
|
||||
|
income components
|
comprehensive income
|
net income is presented
|
||||
|
|
(in thousands)
|
|
||||
|
Unrealized gains and losses
|
$
|
44
|
|
Net securities gains (losses)
|
||
|
on available-for-sale
|
(11
|
)
|
Income tax expense
|
|||
|
securities
|
$
|
33
|
|
Net of tax
|
||
|
Amortization of
|
$
|
(1,558
|
)
|
(a)
|
||
|
retirement plan items
|
390
|
|
Income tax expense
|
|||
|
|
$
|
(1,168
|
)
|
Net of tax
|
||
|
Total reclassifications for the period
|
$
|
(1,135
|
)
|
Net of tax
|
||
(a) Included in the computation of net periodic benefit cost which is included in salaries and benefits. (see Footnote 16 for additional details).
88
|
|
Balance at December 31, 2018
|
|
||||
|
Details about accumulated
|
Amount reclassified from
|
Affected line item in
|
||||
|
other comprehensive
|
accumulated other
|
the statement where
|
||||
|
income components
|
comprehensive income
|
net income is presented
|
||||
|
|
(in thousands)
|
|
||||
|
Unrealized gains and losses
|
$
|
2
|
|
Net securities gains (losses)
|
||
|
on available-for-sale
|
—
|
|
Income tax expense
|
|||
|
securities
|
$
|
2
|
|
Net of tax
|
||
|
Amortization of
|
$
|
(1,447
|
)
|
(a)
|
||
|
retirement plan items
|
362
|
|
Income tax expense
|
|||
|
|
$
|
(1,085
|
)
|
Net of tax
|
||
|
Total reclassifications for the period
|
$
|
(1,083
|
)
|
Net of tax
|
||
(a) Included in the computation of net periodic benefit cost which is included in salaries and benefits. (see Footnote 16 for additional details).
|
|
Balance at December 31, 2017
|
|
||||
|
Details about accumulated
|
Amount reclassified from
|
Affected line item in
|
||||
|
other comprehensive
|
accumulated other
|
the statement where
|
||||
|
income components
|
comprehensive income
|
net income is presented
|
||||
|
|
(in thousands)
|
|
||||
|
Unrealized gains and losses
|
$
|
59
|
|
Net securities gains (losses)
|
||
|
on available-for-sale
|
(23
|
)
|
Income tax expense
|
|||
|
securities
|
$
|
36
|
|
Net of tax
|
||
|
Amortization of
|
$
|
(1,204
|
)
|
(a)
|
||
|
retirement plan items
|
470
|
|
Income tax expense
|
|||
|
|
$
|
(734
|
)
|
Net of tax
|
||
|
Total reclassifications for the period
|
$
|
(698
|
)
|
Net of tax
|
||
(a) Included in the computation of net periodic benefit cost which is included in salaries and benefits. (see Footnote 16 for additional details).
|
19.
|
LEASES:
|
The Corporation leases certain branches under operating leases. At December 31, 2019, the Corporation had lease liabilities totaling $6,014,000 and right-of-use assets totaling $6,003,000 related to these leases. Lease liabilities and right-of-use assets are reflected in other liabilities and other assets, respectively. For the year ended December 31, 2019, the weighted average remaining lease term for operating leases was 11.6 years and the weighted average discount rate used in the measurement of operating lease liabilities was 2.92%.
The calculated amount of the lease liabilities and right-of-use assets are impacted by the length of the lease term and the discount rate used to present value the minimum lease payments. The Corporation's lease agreements often include one or more options to renew at the Corporation's discretion. If at lease inception, the Corporation considers the exercising of a renewal option to be reasonably certain, the Corporation will include the extended term in the calculation of the lease liability and right-of-use asset. Regarding the discount rate, the new standard requires the use of the rate implicit in the lease whenever this rate is readily determinable. As this rate is rarely determinable, the Corporation utilizes its incremental borrowing rate at lease inception, on a collateralized basis, over a similar term. For operating leases existing prior to January 1, 2019, the rate for the remaining lease term as of January 1, 2019 was used.
89
The following table represents lease costs and other lease information. As the Corporation elected, not to separate lease and non-lease components and instead to account for them as a single lease component, the variable lease cost primarily represents variable payments such as common area maintenance and utilities.
Lease costs were as follows:
|
(Dollar amounts in thousands)
|
Year Ended December 31, 2019
|
|||||
|
Operating lease cost
|
$
|
910
|
|
|||
|
Short-term lease cost
|
75
|
|
||||
|
Variable lease cost
|
65
|
|
||||
|
Total lease cost
|
$
|
1,050
|
|
|||
|
Other information:
|
||||||
|
Cash paid for amounts included in the measurement of operating lease liabilities
|
893
|
|
||||
|
Right-of-use assets obtained in exchange for new operating lease liabilities
|
6,643
|
|
||||
Future minimum payments for operating leases with initial or remaining terms of one year or more as of December 31, 2019 were as follows:
|
(Dollar amounts in thousands)
|
December 31, 2019
|
|
||||
|
Twelve Months Ended December 31,
|
||||||
|
2020
|
$
|
809
|
|
|||
|
2021
|
762
|
|
||||
|
2022
|
763
|
|
||||
|
2023
|
714
|
|
||||
|
2024
|
641
|
|
||||
|
Thereafter
|
3,422
|
|
||||
|
Total future minimum lease payments
|
7,111
|
|
||||
|
Amounts representing interest
|
(1,097
|
)
|
||||
|
Present value of net future minimum lease payments
|
$
|
6,014
|
|
|||
|
20.
|
REGULATORY MATTERS:
|
The Corporation and its bank affiliates are subject to various regulatory capital requirements administered by the federal banking agencies. Failure to meet minimum capital requirements can initiate certain mandatory—and possibly additional discretionary—actions by regulators that, if undertaken, could have a direct material effect on the Corporation's financial statements.
Further, the Corporation's primary source of funds to pay dividends to shareholders is dividends from its subsidiary banks and compliance with these capital requirements can affect the ability of the Corporation and its banking affiliates to pay dividends. At
December 31, 2019
, approximately
$26.7 million
of undistributed earnings of the subsidiary banks, included in consolidated retained earnings, were available for distribution to the Corporation without regulatory approval. Under capital adequacy guidelines and the regulatory framework for prompt corrective action, the Corporation and Banks must meet specific capital guidelines that involve quantitative measures of the Corporation's assets, liabilities, and certain off-balance-sheet items as calculated under regulatory accounting practices. The Corporation's and Banks' capital amounts and classification are also subject to qualitative judgments by the regulators about components, risk weightings and other factors.
Quantitative measures established by regulation to ensure capital adequacy require the Corporation and Banks to maintain minimum amounts and ratios of Total, Common equity tier I capital and Tier I Capital to risk-weighted assets, and of Tier I Capital to average assets.
The final rules implementing Basel Committee on Banking Supervision's capital guidelines for U.S. banks (Basel lll rules) became effective for the Corporation on January 1, 2015 with full compliance with all of the requirements being phased in over a multi-year schedule, and fully phased in by January 1, 2019. Under the Basel lll rules, the Corporation must hold a capital conservation
90
buffer above the adequately capitalized risk-based capital ratios. The capital conservation buffer is being phased in from 0.0% for 2015 to 2.50% by 2019. The capital conservation buffer for 2018 and 2017 is 1.875% and 1.25%, respectively. The net unrealized gain or loss on available for sale securities is not included in computing regulatory capital.
Management believes, as of
December 31, 2019
and
2018
, that the Corporation meets all capital adequacy requirements to which it is subject.
As of
December 31, 2019
, the most recent notification from the respective regulatory agencies categorized the subsidiary banks as well capitalized under the regulatory framework for prompt corrective action. To be categorized as well capitalized, the banks must maintain minimum total risk-based, Common equity tier I capital, Tier I risk-based and Tier I leverage ratios as set forth in the table. There are no conditions or events since that notification that management believes have changed the banks' category.
The following table presents the actual and required capital amounts and related ratios for the Corporation and First Financial Bank, N.A., at year-end
2019
and
2018
.
|
|
|
|
|
|
To Be Well Capitalized
|
|||||||||||||||
|
|
|
|
For Capital
|
Under Prompt Corrective
|
||||||||||||||||
|
|
Actual
|
Adequacy Purposes
|
Action Provisions
|
|||||||||||||||||
|
(Dollar amounts in thousands)
|
Amount
|
Ratio
|
Amount
|
Ratio
|
Amount
|
Ratio
|
||||||||||||||
|
Total risk-based capital
|
|
|
|
|
|
|
|
|
|
|
|
|
||||||||
|
Corporation – 2019
|
$
|
495,817
|
|
16.16
|
%
|
$
|
322,091
|
|
10.500
|
%
|
N/A
|
|
N/A
|
|
||||||
|
Corporation – 2018
|
$
|
451,036
|
|
19.36
|
%
|
$
|
230,091
|
|
9.875
|
%
|
N/A
|
|
N/A
|
|
||||||
|
First Financial Bank – 2019
|
472,995
|
|
15.91
|
%
|
312,111
|
|
10.500
|
%
|
297,249
|
|
10.00
|
%
|
||||||||
|
First Financial Bank – 2018
|
421,553
|
|
18.71
|
%
|
222,453
|
|
9.875
|
%
|
225,268
|
|
10.00
|
%
|
||||||||
|
Common equity tier I capital
|
||||||||||||||||||||
|
Corporation – 2019
|
$
|
475,874
|
|
15.51
|
%
|
$
|
214,728
|
|
7.000
|
%
|
N/A
|
|
N/A
|
|
||||||
|
Corporation – 2018
|
$
|
430,600
|
|
18.48
|
%
|
$
|
148,540
|
|
6.375
|
%
|
N/A
|
|
N/A
|
|
||||||
|
First Financial Bank – 2019
|
457,649
|
|
15.40
|
%
|
208,074
|
|
7.000
|
%
|
193,212
|
|
6.50
|
%
|
||||||||
|
First Financial Bank – 2018
|
405,181
|
|
17.99
|
%
|
143,609
|
|
6.375
|
%
|
146,424
|
|
6.50
|
%
|
||||||||
|
Tier I risk-based capital
|
|
|
|
|
|
|
|
|
|
|
|
|
||||||||
|
Corporation – 2019
|
$
|
475,874
|
|
15.51
|
%
|
$
|
260,741
|
|
8.500
|
%
|
N/A
|
|
N/A
|
|
||||||
|
Corporation – 2018
|
$
|
430,600
|
|
18.48
|
%
|
$
|
183,490
|
|
7.875
|
%
|
N/A
|
|
N/A
|
|
||||||
|
First Financial Bank – 2019
|
457,649
|
|
15.40
|
%
|
252,661
|
|
8.500
|
%
|
237,799
|
|
8.00
|
%
|
||||||||
|
First Financial Bank – 2018
|
405,181
|
|
17.99
|
%
|
177,399
|
|
7.875
|
%
|
180,215
|
|
8.00
|
%
|
||||||||
|
Tier I leverage capital
|
|
|
|
|
|
|
|
|
|
|
|
|
||||||||
|
Corporation – 2019
|
$
|
475,874
|
|
12.04
|
%
|
$
|
158,081
|
|
4.00
|
%
|
N/A
|
|
N/A
|
|
||||||
|
Corporation – 2018
|
$
|
430,600
|
|
14.59
|
%
|
$
|
118,072
|
|
4.00
|
%
|
N/A
|
|
N/A
|
|
||||||
|
First Financial Bank – 2019
|
457,649
|
|
11.93
|
%
|
153,453
|
|
4.00
|
%
|
191,816
|
|
5.00
|
%
|
||||||||
|
First Financial Bank – 2018
|
405,181
|
|
14.19
|
%
|
114,213
|
|
4.00
|
%
|
142,767
|
|
5.00
|
%
|
||||||||
91
|
21.
|
PARENT COMPANY CONDENSED FINANCIAL STATEMENTS:
|
The parent company’s condensed balance sheets as of
December 31, 2019
and
2018
, and the related condensed statements of income and comprehensive income and cash flows for each of the three years in the period ended
December 31, 2019
, are as follows:
|
CONDENSED BALANCE SHEETS
|
||||||||
|
|
December 31,
|
|||||||
|
(Dollar amounts in thousands)
|
2019
|
2018
|
||||||
|
ASSETS
|
|
|
|
|
||||
|
Cash deposits in affiliated banks
|
$
|
4,394
|
|
$
|
3,342
|
|
||
|
Investments in subsidiaries
|
566,384
|
|
442,547
|
|
||||
|
Land and headquarters building, net
|
4,807
|
|
5,000
|
|
||||
|
Other
|
23
|
|
900
|
|
||||
|
Total Assets
|
$
|
575,608
|
|
$
|
451,789
|
|
||
|
LIABILITIES AND SHAREHOLDERS' EQUITY
|
|
|
|
|
||||
|
Liabilities
|
|
|
|
|
||||
|
Borrowings
|
$
|
10,177
|
|
$
|
—
|
|
||
|
Dividends payable
|
7,142
|
|
6,258
|
|
||||
|
Other liabilities
|
681
|
|
2,830
|
|
||||
|
TOTAL LIABILITIES
|
18,000
|
|
9,088
|
|
||||
|
Shareholders' Equity
|
557,608
|
|
442,701
|
|
||||
|
TOTAL LIABILITIES AND SHAREHOLDERS' EQUITY
|
$
|
575,608
|
|
$
|
451,789
|
|
||
|
CONDENSED STATEMENTS OF INCOME AND COMPREHENSIVE INCOME
|
|
|
||||||||||
|
|
Years Ended December 31,
|
|||||||||||
|
(Dollar amounts in thousands)
|
2019
|
2018
|
2017
|
|||||||||
|
Dividends from subsidiaries
|
$
|
81,281
|
|
$
|
13,651
|
|
$
|
30,814
|
|
|||
|
Other income
|
720
|
|
720
|
|
720
|
|
||||||
|
Other operating expenses
|
(4,327
|
)
|
(2,814
|
)
|
(2,647
|
)
|
||||||
|
Income before income taxes and equity in undistributed earnings of subsidiaries
|
77,532
|
|
11,557
|
|
28,887
|
|
||||||
|
Income tax benefit
|
908
|
|
934
|
|
889
|
|
||||||
|
Income before equity in undistributed earnings of subsidiaries
|
78,440
|
|
12,491
|
|
29,776
|
|
||||||
|
Equity in undistributed earnings of subsidiaries
|
(29,568
|
)
|
34,092
|
|
(645
|
)
|
||||||
|
Net income
|
$
|
48,872
|
|
$
|
46,583
|
|
$
|
29,131
|
|
|||
|
Comprehensive income
|
$
|
64,825
|
|
$
|
40,199
|
|
$
|
28,591
|
|
|||
92
|
CONDENSED STATEMENTS OF CASH FLOWS
|
|
|
|
|||||||||
|
|
Years Ended December 31,
|
|||||||||||
|
(Dollar amounts in thousands)
|
2019
|
2018
|
2017
|
|||||||||
|
CASH FLOWS FROM OPERATING ACTIVITIES:
|
|
|
|
|
|
|
||||||
|
Net Income
|
$
|
48,872
|
|
$
|
46,583
|
|
$
|
29,131
|
|
|||
|
Adjustments to reconcile net income to net cash provided by operating activities:
|
|
|
|
|
|
|
||||||
|
Depreciation and amortization
|
193
|
|
193
|
|
195
|
|
||||||
|
Equity in undistributed earnings
|
(29,568
|
)
|
(34,092
|
)
|
645
|
|
||||||
|
Contribution of shares to ESOP
|
1,251
|
|
1,087
|
|
1,062
|
|
||||||
|
Restricted stock compensation
|
801
|
|
745
|
|
706
|
|
||||||
|
Increase (decrease) in other liabilities
|
(2,150
|
)
|
(585
|
)
|
(247
|
)
|
||||||
|
(Increase) decrease in other assets
|
1,187
|
|
(900
|
)
|
—
|
|
||||||
|
NET CASH FROM OPERATING ACTIVITIES
|
20,586
|
|
13,031
|
|
31,492
|
|
||||||
|
CASH FLOWS FROM INVESTING ACTIVITIES:
|
|
|
|
|
|
|
||||||
|
Cash received (disbursed) from acquisitions
|
(6,571
|
)
|
—
|
|
—
|
|
||||||
|
NET CASH FROM INVESTING ACTIVITIES
|
(6,571
|
)
|
—
|
|
—
|
|
||||||
|
CASH FLOWS FROM FINANCING ACTIVITIES:
|
|
|
|
|
|
|
||||||
|
Purchase of treasury stock
|
(315
|
)
|
(391
|
)
|
(503
|
)
|
||||||
|
Dividends paid
|
(12,648
|
)
|
(12,496
|
)
|
(30,556
|
)
|
||||||
|
NET CASH FROM FINANCING ACTIVITES
|
(12,963
|
)
|
(12,887
|
)
|
(31,059
|
)
|
||||||
|
NET (DECREASE) INCREASE IN CASH
|
1,052
|
|
144
|
|
433
|
|
||||||
|
CASH, BEGINNING OF YEAR
|
3,342
|
|
3,198
|
|
2,765
|
|
||||||
|
CASH, END OF YEAR
|
$
|
4,394
|
|
$
|
3,342
|
|
$
|
3,198
|
|
|||
|
Supplemental disclosures of cash flow information:
|
|
|
|
|
|
|
||||||
|
Cash paid during the year for:
|
|
|
|
|
|
|
||||||
|
Interest
|
$
|
—
|
|
$
|
—
|
|
$
|
—
|
|
|||
|
Income taxes
|
$
|
9,595
|
|
$
|
7,185
|
|
$
|
11,158
|
|
|||
|
22.
|
SELECTED QUARTERLY DATA (UNAUDITED):
|
|
|
2019
|
|||||||||||||||||||||||
|
(Dollar amounts in thousands)
|
Interest
Income |
Interest
Expense |
Net Interest
Income |
Provision
For Loan Losses |
Net Income
|
Net Income
Per Share |
||||||||||||||||||
|
March 31
|
$
|
32,616
|
|
$
|
3,190
|
|
$
|
29,426
|
|
$
|
1,470
|
|
$
|
9,682
|
|
$
|
0.79
|
|
||||||
|
June 30
|
$
|
33,259
|
|
$
|
3,507
|
|
$
|
29,752
|
|
$
|
230
|
|
$
|
12,569
|
|
$
|
1.02
|
|
||||||
|
September 30
|
$
|
39,595
|
|
$
|
5,596
|
|
$
|
33,999
|
|
$
|
1,500
|
|
$
|
12,257
|
|
$
|
0.93
|
|
||||||
|
December 31
|
$
|
43,651
|
|
$
|
5,176
|
|
$
|
38,475
|
|
$
|
1,500
|
|
$
|
14,364
|
|
$
|
1.06
|
|
||||||
|
|
2018
|
|||||||||||||||||||||||
|
(Dollar amounts in thousands)
|
Interest
Income |
Interest
Expense |
Net
Interest Income |
Provision
For Loan Losses |
Net Income (a)
|
Net Income
Per Share |
||||||||||||||||||
|
March 31
|
$
|
29,377
|
|
$
|
1,904
|
|
$
|
27,473
|
|
$
|
1,473
|
|
$
|
8,953
|
|
$
|
0.73
|
|
||||||
|
June 30
|
$
|
32,903
|
|
$
|
2,219
|
|
$
|
30,684
|
|
$
|
1,355
|
|
$
|
15,261
|
|
$
|
1.25
|
|
||||||
|
September 30
|
$
|
31,375
|
|
$
|
2,548
|
|
$
|
28,827
|
|
$
|
1,470
|
|
$
|
11,313
|
|
$
|
0.92
|
|
||||||
|
December 31
|
$
|
32,569
|
|
$
|
2,974
|
|
$
|
29,595
|
|
$
|
1,470
|
|
$
|
11,056
|
|
$
|
0.90
|
|
||||||
93
|
ITEM 9.
|
CHANGES IN AND DISAGREEMENTS WITH ACCOUNTANTS ON ACCOUNTING AND FINANCIAL DISCLOSURE
|
None
|
ITEM 9A.
|
CONTROLS AND PROCEDURES
|
Evaluation of Disclosure Controls and Procedures
As of the end of the period covered by this report, we carried out an evaluation (the “Evaluation”), under the supervision and with the participation of our Chief Executive Officer (“CEO”), who serves as our principal executive officer, and Chief Financial Officer (“CFO”), who serves as our principal financial officer, of the effectiveness of our disclosure controls and procedures (“Disclosure Controls”). Based on the Evaluation, our CEO and CFO concluded that our Disclosure Controls are effective and designed to ensure that the information required to be included in our periodic SEC reports is recorded, processed, summarized and reported within the time periods specified in the SEC’s rules and forms.
Changes in Internal Controls Over Financial Reporting
There was no change in the Corporation’s internal control over financial reporting that occurred during the Corporation’s fourth fiscal quarter of
2019
that has materially affected, or is reasonably likely to materially affect, the Corporation’s internal control over financial reporting.
Management’s Report on Internal Control Over Financial Reporting and Attestation Report of the Registered Public Accounting Firm
“Management’s Report on Internal Control over Financial Reporting” and “Report of Independent Registered Public Accounting Firm” are included in Item 8 hereof and incorporated by reference.
|
ITEM 9B.
|
OTHER INFORMATION
|
Not applicable.
PART III
ITEM 10. DIRECTORS, EXECUTIVE OFFICERS AND CORPORATE GOVERNANCE
In accordance with the provisions of General Instruction G to Form 10-K, the information required for disclosure under Item 10 is not set forth herein because the Corporation intends to file with the Securities and Exchange Commission a definitive Proxy Statement pursuant to Regulation 14A not later than 120 days following the end of its
2019
fiscal year, which Proxy Statement will contain such information. The information required by Item 10 is incorporated herein by reference to such Proxy Statement.
ITEM 11. EXECUTIVE COMPENSATION
In accordance with the provisions of General Instruction G to Form 10-K, the information required for disclosure under Item 11 is not set forth herein because the Corporation intends to file with the Securities and Exchange Commission a definitive Proxy Statement pursuant to Regulation 14A not later than 120 days following the end of its
2019
fiscal year, which Proxy Statement will contain such information. The information required by Item 11 is incorporated herein by reference to such Proxy Statement.
94
|
ITEM 12.
|
SECURITY OWNERSHIP OF CERTAIN BENEFICIAL OWNERS AND MANAGEMENT AND RELATED SHAREHOLDER MATTERS
|
In accordance with the provisions of General Instruction G to Form 10-K, certain information required for disclosure under Item 12 (relating to Item 403 of Regulation S-K) is not set forth herein because the Corporation intends to file with the Securities and Exchange Commission a definitive Proxy Statement pursuant to Regulation 14A not later than 120 days following the end of its
2019
fiscal year, which Proxy Statement will contain such information. Such information required by Item 12 is incorporated herein by reference to such Proxy Statement.
Following is the information required by Item 12 relating to Item 201 (d) of Regulation S-K.
Equity Compensation Plan Information
The following table provides certain information as of
December 31, 2019
with respect to the Corporation’s equity compensation plans under which equity securities of the Company are authorized for issuance.
|
Plan Category
|
Number of Securities to be
issued upon exercise of
outstanding options, warrants
and rights
|
Weighted average exercise price
of outstanding options, warrants
and rights
|
Number of securities
remaining (1)
|
||||||
|
Equity compensation plans approved by security holders (2)
|
—
|
|
—
|
|
513,928
|
|
|||
|
Equity compensation plans not approved by security holders (3)
|
—
|
|
—
|
|
—
|
|
|||
|
Total
|
—
|
|
—
|
|
513,928
|
|
|||
(1)
Available for future issuance under equity compensation plans (excluding securities reflected in the first column).
(2)
Includes the First Financial Corporation 2011 Omnibus Equity Incentive Plan.
(3)
The Corporation has no equity compensation plan that has not been authorized by its stockholders.
|
ITEM 13.
|
CERTAIN RELATIONSHIPS AND RELATED TRANSACTIONS AND DIRECTOR INDEPENDENCE
|
In accordance with the provisions of General Instruction G to Form 10-K, the information required for disclosure under Item 13 is not set forth herein because the Corporation intends to file with the Securities and Exchange Commission a definitive Proxy Statement pursuant to Regulation 14A not later than 120 days following the end of its
2019
fiscal year, which Proxy Statement will contain such information. The information required by Item 13 is incorporated herein by reference to such Proxy Statement.
95
|
ITEM 14.
|
PRINCIPAL ACCOUNTANT FEES AND SERVICES
|
In accordance with the provisions of General Instruction G to Form 10-K, the information required for disclosure under Item 14 is not set forth herein because the Corporation intends to file with the Securities and Exchange Commission a definitive Proxy Statement pursuant to Regulation 14A not later than 120 days following the end of its
2019
fiscal year, which Proxy Statement will contain such information. The information required by Item 14 is incorporated herein by reference to such Proxy Statement.
PART IV
ITEM 15. EXHIBITS, FINANCIAL STATEMENT SCHEDULES
(a) (1) The following consolidated financial statements of the Registrant and its subsidiaries are filed as part of this document under “Item 8. Financial Statements and Supplementary Data.”
Consolidated Balance Sheets—
December 31, 2019
and
2018
Consolidated Statements of Income and Comprehensive Income—Years ended
December 31, 2019
,
2018
, and
2017
Consolidated Statements of Changes in Shareholders’ Equity—Years ended
December 31, 2019
,
2018
, and
2017
Consolidated Statements of Cash Flows—Years ended
December 31, 2019
,
2018
, and
2017
Notes to Consolidated Financial Statements
(a) (2) Schedules to the Consolidated Financial Statements required by Article 9 of Regulation S-X are not required, inapplicable, or the required information has been disclosed elsewhere.
(a) (3) Listing of Exhibits:
|
Exhibit Number
|
Description
|
|
Amended and Restated Articles of Incorporation of First Financial Corporation, incorporated by reference to Exhibit 3(i) of the Corporation’s Form 10-Q filed for the quarter ended September 30, 2002.
|
|
|
Code of By-Laws of First Financial Corporation, incorporated by reference to Exhibit 3(ii) of the Corporation’s Form 8-K filed August 24, 2012.
|
|
|
Employment Agreement for Norman L. Lowery, effective July 1, 2019, incorporated by reference to Exhibit 10.01 of the Corporation’s Form 8-K filed April 3, 2019.
|
|
|
2001 Long-Term Incentive Plan of First Financial Corporation, incorporated by reference to Exhibit 10.3 of the Corporation’s Form 10-Q filed for the quarter ended September 30, 2002.
|
|
|
2005 Long-Term Incentive Plan of First Financial Corporation, incorporated by reference to Exhibit 10.7 of the Corporation’s Form 8-K filed September 4, 2007.
|
|
|
2005 Executives Deferred Compensation Plan, incorporated by reference to Exhibit 10.5 of the Corporation’s Form 8-K filed September 4, 2007.
|
|
|
2005 Executives Supplemental Retirement Plan, incorporated by reference to Exhibit 10.6 of the Corporation’s Form 8-K filed September 4, 2007.
|
|
|
First Financial Corporation 2010 Long-Term Incentive Compensation Plan, incorporated by reference to Exhibit 10.9 to the Corporation’s Form 10-K filed March 15, 2011.
|
|
|
First Financial Corporation 2011 Short Term Incentive Compensation Plan, incorporated by reference to Exhibit 10.10 to the Corporation’s Form 10-K filed March 15, 2011.
|
|
|
First Financial Corporation 2011 Omnibus Equity Incentive Plan, incorporated by reference to exhibit 10.11 to the Corporation’s Form 10-Q for the quarter ended March 31, 2011 filed May 9, 2011.
|
|
|
Form of Restricted Stock Award Agreement, incorporated by reference to exhibit 10.12 to the Corporations 10-Q for the quarter ended March 31, 2012 filed May 10, 2012.
|
|
|
continued
|
|
96
|
Exhibit Number
|
Description
|
|
Employment Agreement for Norman D. Lowery, dated January 28, 2019, incorporated by reference to Exhibit 10.1 of the Corporation’s Form 8-K filed February 1, 2019.
|
|
|
Employment Agreement for Rodger A. McHargue, dated January 28, 2019, incorporated by reference to Exhibit 10.2 of the Corporation’s Form 8-K filed February 1, 2019.
|
|
|
Employment Agreement for Steven H. Holliday, dated January 28, 2019, incorporated by reference to Exhibit 10.3 of the Corporation’s Form 8-K filed February 1, 2019.
|
|
|
Employment Agreement for Karen L. Stinson-Milienu, dated January 28, 2019, incorporated by reference to Exhibit 10.4 of the Corporation’s Form 8-K filed February 1, 2019.
|
|
|
Subsidiaries
|
|
|
Certification pursuant to Rule 13a-14(a) for Annual Report of Form 10-K by Principal Executive Officer
|
|
|
Certification pursuant to Rule 13a-14(a) for Annual Report of Form 10-K by Principal Financial Officer
|
|
|
Certification pursuant to 18 U.S.C. Section 1350 of Principal Executive Officer
|
|
|
Certification pursuant to 18 U.S.C. Section 1350 of Principal Financial Officer
|
|
|
101.
|
The following material from First Financial Corporation’s Form 10-K Report for the annual period ended December 31, 2019, formatted in XBRL pursuant to Rule 405 of Regulation S-T: (i) the Consolidated Balance Sheets, (ii) the Consolidated Statements of Income and Comprehensive Income, (iii) the Consolidated Statements of Cash Flows, (iv) the Consolidated Statements of Changes in Shareholders’ Equity, and (v) the Notes to Consolidated Financial Statements**
|
* Indicates management contract or compensatory plan or arrangement required to be filed as an exhibit to this report.
**Furnished, not filed, for purposes of Sections 11 and 12 of the Securities Act of 1933 and Section 18 of the Securities Exchange Act of 1934.
(b)
Exhibits-Filed Exhibits to (a) (3) listed above are attached to this report.
(c)
Financial Statements Schedules-No schedules are required to be submitted. See response to ITEM 15(a) (2).
97
SIGNATURES
Pursuant to the requirements of Section 13 or 15(d) of the Securities Exchange Act of 1934, the registrant has duly caused this report to be signed on its behalf by the undersigned, thereunto duly authorized.
|
First Financial Corporation
|
||
|
|
||
|
Date:
|
March 6, 2020
|
/s/ Rodger A. McHargue
|
|
Rodger A. McHargue, Chief Financial Officer
|
||
|
(Principal Financial Officer and Principal Accounting Officer)
|
||
98
Pursuant to the requirements of the Securities Exchange Act of 1934, this report has been signed below by the following persons on behalf of the registrant and in the capacities and on the dates indicated.
|
NAME
|
DATE
|
|
|
|
|
/s/ Rodger A. McHargue
|
March 6, 2020
|
|
Rodger A. McHargue, Chief Financial Officer
|
|
|
(Principal Financial Officer and Principal Accounting Officer)
|
|
|
|
|
|
/s/ W. Curtis Brighton
|
March 6, 2020
|
|
W. Curtis Brighton, Director
|
|
|
|
|
|
/s/ Thomas T. Dinkel
|
March 6, 2020
|
|
Thomas T. Dinkel, Director
|
|
|
|
|
|
/s/ Anton H. George
|
March 6, 2020
|
|
Anton H. George, Director
|
|
|
|
|
|
/s/ Gregory L. Gibson
|
March 6, 2020
|
|
Gregory L. Gibson, Director
|
|
|
|
|
|
/s/ William R. Krieble
|
March 6, 2020
|
|
William R. Krieble, Director
|
|
|
/s/ Norman L. Lowery
|
March 6, 2020
|
|
Norman L. Lowery, Vice Chairman, President, CEO & Director
|
|
|
(Principal Executive Officer)
|
|
|
/s/ Tina J. Maher
|
March 6, 2020
|
|
Tina J. Maher, Director
|
|
|
|
|
|
/s/ Thomas C. Martin
|
March 6, 2020
|
|
Thomas C. Martin, Director
|
|
|
/s/ Paul J. Pierson II
|
March 6, 2020
|
|
Paul J. Pierson II, Director
|
|
|
/s/ Ronald K. Rich
|
March 6, 2020
|
|
Ronald K. Rich, Director
|
|
|
|
|
|
/s/ William J. Voges
|
March 6, 2020
|
|
William J. Voges, Director
|
|
|
|
|
99
EXHIBIT INDEX
|
Exhibit
|
|
|
Number
|
Description
|
|
|
|
|
21
|
Subsidiaries
|
|
|
|
|
31.1
|
Certification Pursuant to Rule 13a-14(a) for Annual Report of Form 10-K by Principal Executive Officer
|
|
|
|
|
31.2
|
Certification Pursuant to Rule 13a-14(a) for Annual Report of Form 10-K by Principal Financial Officer
|
|
|
|
|
32.1
|
Certification Pursuant to Rule 18 U.S.C. Section 1350 of Principal Executive Officer
|
|
|
|
|
32.2
|
Certification Pursuant to Rule 18 U.S.C. Section 1350 of Principal Financial Officer
|
|
|
|
|
101.
|
The following material from First Financial Corporation’s Form 10-K Report for the annual period ended December 31, 2019, formatted in XBRL pursuant to Rule 405 of Regulation S-T: (i) the Consolidated Balance Sheets, (ii) the Consolidated Statements of Income and Comprehensive Income, (iii) the Consolidated Statements of Cash Flows, (iv) the Consolidated Statements of Changes in Shareholders’ Equity, and (v) the Notes to Consolidated Financial Statements.*
|
*Furnished, not filed, for purposes of Sections 11 and 12 of the Securities Act of 1933 and Section 18 of the Securities Exchange Act of 1934.
100
TABLE OF CONTENTS
Part IItem 1. BusinessItem 1A. Risk FactorsItem 1B. Unresolved Staff CommentsItem 2. PropertiesItem 3. Legal ProceedingsItem 4. Mine Safety DisclosuresPart IIItem 5. Market For Registrant S Common Equity, Related Stockholder Matters and Issuer Purchases Of Equity SecuritiesItem 6. Selected Financial DataItem 7. Management S Discussion and Analysis Of Financial Condition and Results Of OperationItem 7A. Quantitative and Qualitative Disclosures About Market RiskItem 8. Financial Statements and Supplementary DataItem 9. Changes in and Disagreements with Accountants on Accounting and Financial DisclosureItem 9A. Controls and ProceduresItem 9B. Other InformationPart IIIItem 10. Directors, Executive Officers and Corporate GovernanceItem 11. Executive CompensationItem 12. Security Ownership Of Certain Beneficial Owners and Management and Related Shareholder MattersItem 13. Certain Relationships and Related Transactions and Director IndependenceItem 14. Principal Accountant Fees and ServicesPart IVItem 15. Exhibits, Financial Statement Schedules