THERMON GROUP HOLDINGS, INC.
10-Ks and 10-Qs
|
|
|
|
|
|
|
|
|
|
|
|
|
|
|
|
|
|
|
|
|
|
|
|
|
|
|
|
|
|
|
|
|
|
|
|
|
|
|
|
|
|
|
|
|
|
|
|
|
|
|
|
|
UNITED STATES
SECURITIES AND EXCHANGE COMMISSION
WASHINGTON, DC 20549
FORM 10-K
x
ANNUAL REPORT PURSUANT TO SECTION 13 OR 15(d) OF THE SECURITIES EXCHANGE ACT OF 1934
For The Fiscal Year Ended
March 31, 2014
or
¨
TRANSITION REPORT PURSUANT TO SECTION 13 OR 15(d) OF THE SECURITIES EXCHANGE ACT OF 1934
For the transition period from to
Commission File Number: 001-35159
THERMON GROUP HOLDINGS, INC.
(Exact name of registrant as specified in its charter)
|
Delaware
(State or other jurisdiction of incorporation or organization)
|
27-2228185
(IRS Employer Identification No.)
|
|
|
100 Thermon Drive, San Marcos, Texas
(Address of principal executive offices)
|
78666
(Zip Code)
|
|
(512) 396-5801
(Registrant's telephone number, including area code)
Securities registered pursuant to Section 12(b) of the Act:
|
Title of each class
|
Name of each exchange
on which registered
|
|
|
Common Stock, $0.001 par value per share
|
New York Stock Exchange
|
|
Securities registered pursuant to Section 12(g) of the Act:
None
Indicate by check mark if the registrant is a well-known seasoned issuer, as defined in Rule 405 of the Securities Act.
x
Yes
¨
No
Indicate by check mark if the registrant is not required to file reports pursuant to Section 13 or Section 15(d) of the Act.
¨
Yes
x
No
Indicate by check mark whether the registrant (1) has filed all reports required to be filed by Section 13 or 15(d) of the Securities Exchange Act of 1934 during the preceding 12 months (or for such shorter period that the registrant was required to file such reports), and (2) has been subject to such filing requirements for the past 90 days.
x
Yes
¨
No
Indicate by check mark whether the registrant has submitted electronically and posted on its corporate Web site, if any, every Interactive Data File required to be submitted and posted pursuant to Rule 405 of Regulation S-T (§ 232.405 of this chapter) during the preceding 12 months (or for such shorter period that the registrant was required to submit and post such files).
x
Yes
¨
No
Indicate by check mark if disclosure of delinquent filers pursuant to Item 405 of Regulation S-K (§229.405 of this chapter) is not contained herein, and will not be contained, to the best of registrant's knowledge, in definitive proxy or information statements incorporated by reference in Part III of this Form 10-K or any amendment to this Form 10-K.
¨
Indicate by check mark whether the registrant is a large accelerated filer, an accelerated filer, a non-accelerated filer, or a smaller reporting company in Rule 12b-2 of the Exchange Act.
|
Large accelerated filer
x
|
Accelerated filer
|
|
|
Non-accelerated filer
o
|
Smaller reporting company
o
|
|
Indicate by check mark whether the registrant is a shell company (as defined in Rule 12b-2 of the Exchange Act).
¨
Yes
x
No
The aggregate market value of the registrant's common equity held by non-affiliates as of September 30, 2013 was $716,482,796 based on the closing price of $23.11 as reported on the New York Stock Exchange. Solely for the purposes of this calculation, directors and officers of the registrant are deemed to be affiliates.
As of May 27, 2014, the registrant had 31,932,562 shares of common stock, par value $0.001 per share, outstanding.
DOCUMENTS INCORPORATED BY REFERENCE
As permitted by General Instruction G of Form 10-K, certain portions, as expressly described in this report, of the registrant's Definitive Proxy Statement for the 2014 Annual Meeting of Stockholders to be filed with the SEC are incorporated by reference into Part III of this Annual Report on Form 10-K.
1
THERMON GROUP HOLDINGS, INC.
ANNUAL REPORT
FOR THE FISCAL YEAR ENDED MARCH 31, 2014
TABLE OF CONTENTS
|
|
Page
|
|
PART I
|
|
|
|
|
|
PART II
|
|
|
PART III
|
|
|
|
|
|
PART IV
|
|
|
|
|
|
|
|
i
FORWARD-LOOKING STATEMENTS
This annual report on Form 10-K ("this annual report") includes forward-looking statements within the meaning of the U.S. federal securities laws in addition to historical information. These forward looking statements are made pursuant to the safe harbor provisions of the Private Securities Litigation Reform Act of 1995. These forward-looking statements are included throughout this annual report, including in the sections entitled “Risk Factors”, “Management's Discussion and Analysis of Financial Condition and Results of Operations” and “Business” and include, without limitation, statements regarding our industry, business strategy, plans, goals and expectations concerning our market position, future operations, margins, profitability, capital expenditures, liquidity and capital resources and other financial and operating information. When used in this discussion, the words “anticipate”, “assume”, “believe”, “budget”, “continue”, “could”, “estimate”, “expect”, “intend”, “may”, “plan”, “potential”, “predict”, “project”, “will”, “future” and similar terms and phrases are intended to identify forward-looking statements in this annual report.
Forward-looking statements reflect our current expectations regarding future events, results or outcomes. These expectations may or may not be realized. Some of these expectations may be based upon assumptions, data or judgments that prove to be incorrect. In addition, our business and operations involve numerous risks and uncertainties, many of which are beyond our control, which could result in our expectations not being realized or otherwise materially affect our financial condition, results of operations and cash flows. The statements include but are not limited to statements regarding: (i) our plans to strategically pursue emerging growth opportunities in diverse regions and across industry sectors; (ii) our plans to secure more new facility, or Greenfield, project bids; (iii) our ability to generate more facility maintenance, repair and operations or upgrades or expansions, or MRO/UE, revenue from our existing and future installed base; (iv) our ability to timely deliver backlog; (v) our ability to respond to new market developments and technological advances; (vi) our expectations regarding energy consumption and demand in the future and its impact on our future results of operations; (vii) our plans to develop strategic alliances with major customers and suppliers; (viii) our expectations that our revenues will continue to increase; (ix) our belief in the sufficiency of our cash flows to meet our needs for the next year; and (x) our expectations regarding anticipated benefits from the April 2012 expansion and anticipated future expansion of our principal manufacturing facilities in San Marcos, Texas.
Actual events, results and outcomes may differ materially from our expectations due to a variety of factors. Although it is not possible to identify all of these factors, they include, among others, (i) general economic conditions and cyclicality in the markets we serve; (ii) future growth of energy and chemical processing capital investments; (iii) our ability to deliver existing orders within our backlog; (iv) our ability to bid and win new contracts; (v) competition from various other sources providing similar heat tracing products and services, or alternative technologies, to customers; (vi) changes in relevant currency exchange rates; (vii) our ability to comply with the complex and dynamic system of laws and regulations applicable to international operations; (viii) a material disruption at any of our manufacturing facilities ; (ix) our dependence on subcontractors and suppliers; (x) our ability to obtain standby letters of credit, bank guarantees or performance bonds required to bid on or secure certain customer contracts; (xi) our ability to attract and retain qualified management and employees, particularly in our overseas markets; (xii) our ability to continue to generate sufficient cash flow to satisfy our liquidity needs; and (xiii) the extent to which federal, state, local, and foreign governmental regulations of energy, chemical processing and power generation products and services limits or prohibits the operation of our business. Any one of these factors or a combination of these factors could materially affect our future results of operations and could influence whether any forward-looking statements contained in this annual report ultimately prove to be accurate. See also Item 1A, “Risk Factors” for information regarding the additional factors that have impacted or may impact our business and operations.
Our forward-looking statements are not guarantees of future performance, and actual results and future performance may differ materially from those suggested in any forward-looking statements. We do not intend to update these statements unless we are required to do so under applicable securities laws.
ii
References in this annual report to “we”, “our”, “us” or the “Company” mean Thermon Group Holdings, Inc. (“TGH”) and its consolidated subsidiaries taken together as a combined entity. A particular fiscal year is the twelve months ended on March 31 of the given calendar year ( e.g. “fiscal 2014”, “fiscal 2013” and “fiscal 2012” mean the Company's fiscal years ended March 31, 2014, March 31, 2013 and March 31, 2012, respectively). We are a holding company that conducts all of our business through our subsidiaries. Our common stock is listed on the New York Stock Exchange under the symbol “THR”.
Business Overview
We are one of the largest providers of highly engineered thermal solutions for process industries. For 60 years, we have served a diverse base of thousands of customers around the world in attractive and growing markets, including energy, chemical processing and power generation. We are a global leader and one of the few thermal solutions providers with a global footprint and a full suite of products (heating cables, tubing bundles and control systems) and services (design optimization, engineering, installation and maintenance services) required to deliver comprehensive solutions to complex projects. We serve our customers locally through a global network of sales and service professionals and distributors in more than 30 countries and through our four manufacturing facilities on three continents. These global capabilities and longstanding relationships with some of the largest multinational energy, chemical processing, power and engineering, procurement and construction, or "EPC", companies in the world have enabled us to diversify our revenue streams and opportunistically access high growth markets worldwide. For
fiscal 2014
, approximately
67%
of our revenues were generated outside of the United States.
Our thermal solutions, also referred to as heat tracing, provide an external heat source to pipes, vessels and instruments for the purposes of freeze protection, temperature and flow maintenance, environmental monitoring, and surface snow and ice melting. Customers typically purchase our products when constructing a new facility, which we refer to as Greenfield projects, or when performing maintenance, repair and operations on a facility's existing heat-traced pipes or upgrading or expanding a current facility, which we refer to collectively as "MRO/UE". A large processing facility may require our thermal solutions for a majority of its pipes, with the largest facilities containing hundreds of thousands of feet of heat-tracing cable and thousands of control points. Our products are low in cost relative to the total cost of a typical processing facility, but critical to the safe and profitable operation of the facility. These facilities are often complex, with numerous classified areas that are inherently hazardous and where product safety concerns are paramount. We believe that our strong brand and established reputation for safety, reliability and customer service are critical contributors to our customers' purchasing decisions.
Our customers' need for MRO/UE solutions provides us with an attractive recurring revenue stream. Customers typically use the incumbent heat tracing provider for MRO/UE projects to avoid complications and compatibility problems associated with switching providers. We typically begin to realize meaningful MRO/UE revenue from new Greenfield installations one to three years after completion of the project as customers begin to remove and replace our products during routine and preventative maintenance on in-line mechanical equipment, such as pipes and valves. As a result, our growth has been driven by new facility construction, as well as by servicing our continually growing base of solutions installed around the world, which we refer to as our installed base. Approximately
67%
of our revenues for
fiscal 2014
were derived from such MRO/UE activities.
Our corporate offices are located at 100 Thermon Drive, San Marcos, TX 78666. Our telephone number is (512) 396-5801. Our website address is
www.thermon.com.
Copies of the charters of the committees of our board of directors, our code of business conduct and ethics and our corporate governance guidelines are available on our Investor Relations website located at
http://ir.thermon.com
. All reports that we have filed with the Securities and Exchange Commission (“SEC”), including this Annual Report on Form 10-K and our Current Reports on Form 8-K, can be obtained free of charge from the SEC's website at www.sec.gov or through our Investor Relations website. In addition, all reports filed with the SEC may be read and copied at the SEC's Public Reference Room at 100 F Street, NE, Washington, D.C. 20549-1090. Information regarding the operation of the public reference room may be obtained by calling the SEC at 1-800-SEC-0330. None of the information on our website or any other website identified herein is incorporated by reference in this annual report and should not be considered a part of this annual report.
1
Company History
Thermon Manufacturing Company, historically our principal operating subsidiary, was founded as a partnership in October 1954 and later incorporated in Texas in 1960. At that time, our primary product was a thermally conductive heat transfer compound invented by our founder, Richard Burdick. Under Mr. Burdick's leadership, we experienced steady growth by diversifying our products and expanding our geographic reach. Mr. Burdick and his family maintained a controlling interest in us until August 2007, when the controlling interest was sold to an affiliate of the Audax Group private equity firm in the Audax Transaction. During Audax's tenure as our majority owner, we positioned ourselves to take advantage of rising demand in the energy end market and secured significant capital projects. Over the last seven years, our management team has focused on significant organic growth opportunities, particularly in high growth markets such as the Canadian oil sands region and Russia.
On April 30, 2010, an investor group led by entities affiliated with CHS Capital LLC and two other private equity firms, which we refer to collectively as our former private equity sponsors acquired Audax's controlling interest in us. The acquisition and related transaction fees and expenses were financed through (i) the issuance of $210.0 million aggregate principal amount of our senior secured notes and (ii) a $129.3 million equity investment by our private equity sponsors and certain members of our current and former management team. As used in this annual report, the “CHS Transactions” refer collectively to such acquisition, the equity investment in us by CHS, our other former private equity sponsors and certain members of our management team and related financing transactions.
In May 2011, we completed the initial public offering of our common stock (or “IPO”), and our common stock became listed on The New York Stock Exchange under the ticker symbol “THR.” Our former private equity sponsors sold shares of our common stock in both the IPO and a secondary public offering in September 2012. As of March 31, 2013, our former private equity sponsors had sold or otherwise disposed of all of their shares of common stock in the Company.
Industry Overview
Alvarez & Marsal Private Equity Performance Improvement Group, LLC, or "A&M", estimated in 2012 that the market for industrial electric heat tracing is approximately $1.2 billion in annual revenues and estimates that it is growing its share of the overall heat tracing market as end users appear to continue to favor electric heat tracing solutions over steam heat tracing solutions for new installations. When revenues for steam heat tracing parts are included, A&M estimated in 2012 the overall addressable market for heat tracing to be approximately $2.8 billion in annual revenues. The industrial electric heat tracing industry is fragmented and consists of more than 30 companies that typically only serve discrete local markets with manufactured products and provide a limited service offering. Heat tracing providers differentiate themselves through the quality and reputation of their products, the length and quality of their customer relationships and their ability to provide comprehensive solutions. Large multinational companies drive the majority of spending for the types of major industrial facilities that require heat tracing, and we believe that they prefer providers who have a global footprint and a comprehensive suite of products and services. We believe we are one of only a few companies that meet these criteria.
The major end markets that drive demand for heat tracing include energy, chemical processing and power generation. We believe that there are attractive near-to medium-term trends in each of these end markets. In addition, we believe that the growth rate of the electric heat tracing market is accelerating as end-users continue to favor electric-based heat tracing solutions over steam-based heat tracing solutions for new installations.
|
·
|
Energy.
Heat tracing is used to facilitate the processing, transportation and freeze protection of energy products in both upstream and downstream oil and gas applications. In order to meet growing demand and offset natural declines in existing oil and gas production, a significant increase in capital expenditures in upstream infrastructure will be required, with a particular focus on reservoirs that are in harsher climates, are deeper or have other complex characteristics that magnify the need for heat tracing. A&M estimated in 2012 that the oil and gas end market accounted for approximately 67% of the total market for electric heat tracing in 2012, or approximately $800 million. Additionally, A&M forecasted in 2012 an 8.2% compound annual growth rate through 2017 for electric heat tracing within the oil and gas production industry.
|
|
·
|
Chemical Processing.
Heat tracing is required for temperature maintenance and freeze protection in a variety of chemical processing applications. Factors that may impact heat tracing demand in chemicals end markets include the rapid industrialization of the developing world, a shift in base chemical processing operations to low-cost feedstock regions, a transition of Western chemical processing activities from commodity products to specialty products and environmental compliance. A&M estimated in 2012 that the chemicals end market accounted for
|
2
approximately 10% of the total market for electric heat tracing in 2012, or approximately $123 million and forecasted in 2012 a compound annual growth rate of 6.8% through 2017.
|
·
|
Power Generation.
Heat tracing is required in high-temperature processes, freeze protection and environmental regulation compliance in coal and gas facilities and for safety injection systems in nuclear facilities. An important driver of demand for heat tracing solutions for power generation is increasing demand for electricity worldwide. A&M estimated in 2012 that the power generation end market accounted for approximately 20% of the total market for electric heat tracing in 2012, or approximately $243 million. The U.S. Energy Information Administration, or "EIA", projects that global net electricity generation will increase 93% between 2010 and 2040. We believe capital spending on new and existing power generation infrastructure will be required to meet this demand.
|
|
·
|
Continuing selection of electric-based heat tracing solutions over steam-based solutions.
Beginning in the 1960s, electric heat tracing products entered the market as an alternative to steam heat tracing products. While steam-based products are still used today for heavy oil, chemical and processing applications, electric-based products generally offer greater cost savings and operating efficiencies. As a consequence, Greenfield projects commissioned in recent years are increasingly designed to incorporate electric heat tracing.
|
Segments
We operate in one reportable segment, thermal engineered solutions. We have further defined our reportable segment based on four geographic countries or regions; United States, Canada, Europe and Asia. See Note 15, “Geographic Information” to our consolidated financial statements for
fiscal 2014
contained elsewhere in this annual report for geographic financial data relating to our business.
Products and Services
Our products include a wide range of electric heat tracing cables, steam tracing components, and tubing bundles, as well as instrument and control products, including:
|
•
|
self-regulating and power limiting heating cables, which automatically increase or decrease heat output as pipe temperature changes;
|
|
•
|
mineral insulated, or "MI", cable, which is a high performance heat tracing cable for generating high temperatures that is typically used in harsh environments;
|
|
•
|
skin effect trace heater, which can heat lines up to 15 miles long from a single power point;
|
|
•
|
heat traced tube bundles for environmental gas sampling systems;
|
|
•
|
heat transfer compounds and steam tracers for comprehensive steam tracing solutions;
|
|
•
|
control and monitoring systems for electric tracing of pipes, tanks, hoppers and instrument sampling systems; and
|
|
•
|
turnkey solutions that provide customers with complete solutions for heat tracing, including design, optimization, installation and ongoing maintenance.
|
Electric Heat Tracing Applications
We manufacture critical components of an electric heat tracing system, including heating cables, control and monitoring systems and heating systems for tanks and hoppers. We customize these products to fit the specific design parameters for each client's installation. We offer various electric heating cables, including conductive polymer self-regulating heating cables, power limiting cables and MI high temperature heating cables.
Self-regulating heating cables
-Our self-regulating heating cables are flexible and engineered to automatically increase or decrease heat output as pipe or vessel temperature changes. BSX™ self-regulating cables are designed to provide freeze protection or process temperature maintenance to metallic and non-metallic piping, vessels and equipment. HTSX™ self-regulating heating cable is suitable for heat tracing applications involving crude oil and most chemicals. VSX™ premium self-
3
regulating cable is rated for maintenance temperatures of 300°F/149°C and exposure temperatures of up to 450°F/232°C and has among the highest self-regulating temperature ratings in the industry.
Power-limiting and constant watt heating cables
-Power limiting and constant watt heating cables are flexible parallel resistance cables used to heat trace piping in lengths longer than 500 feet. Such intermediate lengths of pipe are commonly found in pipe racks that connect process units within a plant. These heaters allow longer lengths between power supply points than self-regulating cables.
TEK™ HTEK™ and MIQ™ cables
-The TEK™ and HTEK™ series resistance, constant watt heating cables are used where circuit lengths exceed the limitations of parallel resistance heating cables. By using series constant watt heating cables, a single power supply point can energize circuit lengths up to 12,000 feet. MIQ™ high performance mineral insulated heating cables are used for high temperature maintenance, high temperature exposure and/or high watt density applications that exceed the limitations of thermoplastic insulated cables. MIQ™ cables are composed of a high nickel/chromium alloy sheath, which is well-suited for high temperature service and offers high resistance to stress corrosion in chloride, acid, salt and alkaline environments.
ThermTrac
TM
cables
- A ThermTrac skin effect system provides a cost-effective alternative to conventional resistance heat tracing on long pipelines by eliminating the need for an extensive power distribution system. A ThermTrac system is designed to heat a pipeline up to 15 miles long from a single power point. The versatility of the system makes it well-suited for temperature maintenance, freeze protection and heat-up applications. The system generates heat by the resistance of the electrical current flowing through both the conductor and the inner skin of a heat tube.
Steam Heat Tracing
In 1954, we began manufacturing heat transfer compounds that greatly improved the heat delivery of steam tracing systems. Today, in addition to the broad range of heat transfer compounds, we also offer steam tracers and tubing bundles that provide our customers with comprehensive steam tracing solutions. We manufacture our heat transfer compounds in various configurations so that they can be applied to different surfaces, which increases the heat transfer rate of steam or fluid tracers.
Our heat transfer compounds create an efficient thermal connection between the heat tracing system and the process equipment. Through the elimination of air voids, heat is directed into the pipe wall primarily through conduction rather than convection and radiation. This requires fewer tracing pipes to maintain specified temperature requirements, substantially reducing operating and investment cost. Steam tracing offers the most cost effective solution for certain heavy oil and natural gas processing applications.
Temperature Controls and Monitoring
We supply a wide range of control and monitoring products, from simple mechanical thermostats to sophisticated microprocessor-based systems that control and monitor the status of electric heat tracing systems. We provide individual units for smaller projects, as well as multi-point controllers that can be integrated into and communicate with a plant's central operating controls.
The TraceNet™ TCN18, our newest temperature control monitoring system, is an extension of our TraceNet™ family of controllers. TraceNet™ controllers allow the operator to assess operating control parameters and operating conditions throughout the heat tracing system network utilizing our TraceView control system software. TraceNet™ TCN18 can communicate with up to 4,096 controllers over 32 channels, allowing up to 15,000 heat trace circuits to be monitored within the same network.
Instrumentation
We specialize in pre-insulated and heat-traced tubing bundles with accessories that offer a complete instrument heating system. Our complete range of products includes both electric- and steam-heated bundles containing various types of tubing (such as copper, stainless steel and polymer) to meet the needs of process and environmental applications. Such applications include transporting samples of gas or liquid in our customized, temperature-controlled tubing bundles to an instrument that typically performs an analysis for purposes of process management or ensuring compliance with internal requirements or applicable environmental laws and regulations.
4
Hopper Heating
The HT Hopper Heating Module is a self-contained heater designed for operation on surfaces prone to vibration. In cement plants and fossil fuel power facilities, hoppers facilitate the filtering of a facility's ash emissions. Hopper heaters maintain the walls of the hopper at a temperature above the dew point to prevent moisture from combining with ash, thus clogging the filtering equipment. We engineer each system based on the heating requirements of the specific application. The HT Hopper Heating Module has multiple flow paths for electrical current, which eliminates the burnout potential common with series wire-based designs. Protection of the heating element from vibration is accomplished with a cushion layer of insulation that also directs the flow of heat from the module to the surface being heated. The module provides mechanical protection during handling, installation and operation, and its low profile design helps facilitate installation.
Turnkey Services
We provide customers with complete turnkey solutions for their heat tracing needs. Turnkey services include project planning, product supply, engineering services, system integration, installation, commissioning and maintenance. Specialized, turnkey heat tracing services meet the needs of many of our industrial customers who have downsized and outsourced their non-core competencies and are requiring their vendor base to have multi-service and multi-site capabilities.
Our turnkey business in the United States is based in Houston, Texas and Baton Rouge, Louisiana. As of March 31, 2014, we had over 299 turnkey clients, and the largest project during fiscal 2014 was approximately $1.8 million in revenue. Engineering and construction companies in the United States often subcontract their heat tracing projects to outside parties, including us, because of the field's highly specialized nature.
Design and Engineering Services
We offer heat tracing design and engineering services during every stage of a project. Providing design services within the quote process is a core element of our business strategy. By delivering design drawings in conjunction with early project specifications, we can determine the customer's heat tracing requirements which leads to subsequent sales of heat tracing products for that project.
We are focused on providing comprehensive solutions to fulfill the heat tracing needs of our customers. As a manufacturer of a wide range of heat tracing products, we believe that we are well positioned to evaluate and optimize a system for a customer without bias towards a particular product, and rely on 60 years of experience to craft the most appropriate heat tracing solution for a customer's situation and demands.
We provide design and engineering services to our customers through our full-time staff of engineers and technicians. Through the design and engineering process, our engineers and technicians located throughout the world provide our customers with design optimization studies, product selection assistance, computer-generated drawing packages and detailed wiring diagrams.
Manufacturing and Operations
We have four manufacturing facilities on three continents. We manufacture the products that generate a majority of our total sales at our principal facility in San Marcos, Texas including flexible heating cables, heat tracing compound and tubing bundles. Our facilities are highly automated, which reduces labor costs. Our facilities incorporate numerous manufacturing processes that utilize computer-controlled equipment and laser technology. We maintain a ready supply of spare parts and have on-site personnel trained to repair and perform preventative maintenance on our specialized equipment, reducing the likelihood of long term interruptions at our manufacturing facilities. Our manufacturing facilities are equipped to provide us with maximum flexibility to manufacture our products efficiently and with short lead times. This in turn allows for lower inventory levels and faster responses to customer demands.
In April 2012, we opened a new manufacturing building at our production facility in San Marcos, Texas. The expansion was completed at an approximate cost of $6.2 million. The new manufacturing building has approximately 48,000 square feet of floor space, including offices. In addition to purchasing new manufacturing equipment, we have moved certain of our existing manufacturing lines to the new building, which we believe will create efficiencies in the cable production process. We expect the new manufacturing building will enable us to approximately double production capacity for our low temperature cables, as well as increase our high temperature cable production capacity by approximately 30%. We currently estimate that the facility expansion, when operating at full capacity, will support revenue levels of up to $400 to $500 million. This should satisfy our core cable growth needs for the next several years, assuming that current trends in product mix continue.
5
Our electronic cross-linking facility, which we refer to as our "ECLF", is also located at the San Marcos facility. Cross-linking enhances the thermal, chemical and electrical stability of our low-temperature self-regulating heater cables. By performing cross-linking in-house, we condense the overall manufacturing cycle by approximately six weeks. This enhances our ability to ensure a high level of product quality and to better control the production process.
Our pre-insulated tubing products are manufactured in our facilities in San Marcos and the Netherlands. The majority of our pre-insulated tubing product is custom ordered and made to customers' specifications in a two-part process. The thermal insulation is first applied over the heating cable and process tubing, and a protective plastic outer jacket is extruded onto the bundle to protect the insulation.
Our MI cable manufacturing facility in Calgary, Canada gives us adequate capacity to service the demands of clients in the oil sands projects of Western Canada in a time efficient manner. The facility's strategic location has enabled us to expand our sale of MI cable, which is well-suited for high temperature applications and harsh, arctic environments, into a global business.
We maintain quality control testing standards in all of our manufacturing operations and perform various quality control checks on our products during the manufacturing process. We believe that our highly automated manufacturing process and multiple quality control checkpoints create high levels of operational efficiency.
Purchasing Strategy-
Our critical raw materials include polymer, graphite, copper and stainless steel. For most of these materials, we purchase from multiple suppliers in order to avoid any potential disruption of our manufacturing process. For a small number of raw material items that require specific quality specifications, we have single source supply arrangements. We manage the inherent supply risk through purchase contracts and the maintenance of
increased safety stock levels at all times. We evaluate pricing and performance of all suppliers annually. For our low-volume custom-built electronic controller components, we select a single supplier based on past performance reliability and monitor the process closely as volumes are too low to divide this product over multiple suppliers. Our purchase specifications are usually based on industry or manufacturer standards. Testing of the raw materials is performed and documented by our suppliers and is reviewed by us at the time of receipt.
Distribution
-We maintain three central distribution centers located in San Marcos, Texas, Calgary, Alberta and the Netherlands. Inventory is typically shipped directly from these distribution centers to customers, the construction site or our regional sales agents or distributors. Our sales agents may maintain “safety stocks” of core products to service the immediate MRO/UE requirements of customers who are time-sensitive and cannot wait for delivery from one of the central distribution centers. In the United States, a network of agents maintains safety stocks of core products. In Canada, customers are serviced from the central distribution center in Calgary. In Europe, customers are serviced from the central distribution center in the Netherlands. In Asia, safety stock of materials are kept in Yokohama, Japan; Seoul, Korea; Shanghai, China; Pune, India and Melbourne, Australia. Safety stocks are also warehoused in Moscow, Russia.
Customers
We serve a broad base of large multinational customers, many of which we have served for 60 years. We have a diversified revenue mix with thousands of customers. None of our customers represented more than 10% of total revenues in
fiscal 2014
.
Sales and Marketing
Our direct sales force, consisting of 105 employees, is focused on positioning us with major end-users and EPC companies during the development phase of Greenfield projects with the goal of providing reliable, cost-effective heat tracing solutions. We utilize a network of more than 100 independent sales agents and distributors in over 30 countries to provide local support to customer facilities for MRO/UE. We actively participate in the growth and development of the domestic and international heat tracing standards established in the countries in which we sell products. We believe that we have established credibility as a reliable provider of high quality heat tracing products. In addition, we believe that our 15 registered trademarks in the United States and numerous additional brand names are recognized globally, giving us excellent brand recognition.
Standards and Certifications
-We continually test our products to demonstrate that they can withstand harsh operating environments. Our heating cable products and associated design practices are subjected to various tests, including heat output, thermal stability and long-term aging, with the goal of producing products capable of performing at or beyond the expectations
6
of our customers. All products are further tested and certified by various approval agencies to verify compliance with applicable industry standards.
We evaluate our products for electrical safety requirements, environmental assessments and market based assessments for the particular applications and harsh climates that Thermon services. Our products comply with national and international heat tracing industry standards such as ANSI/IEEE-515 in the United States, Canadian Standards Association 130.03 in Canada; International Electrical Commission 60079-30-1 in Europe, IECEx in Australia and ANSI/IEC in the Middle East. We also hold product certifications from approval agencies around the world.
Competition
The global industrial electric heat tracing industry is fragmented and consists of more than 30 companies, which typically only serve discrete local markets and provide a limited service offering. We believe that we are the second largest
participant in the industrial electric heat tracing market and one of only a few solutions providers with a comprehensive suite of products and services, global capabilities and local on-site presence. Our most significant competitor is the Thermal Controls subdivision of Pentair Ltd. (NYSE: PNR).
Heat tracing providers differentiate themselves through value-added services, long-term customer relationship management and the ability to provide a full range of solutions. We differentiate ourselves from local providers by a global footprint, a full suite of products and services and a track record with some of the largest multinational energy, chemical processing, power and EPC companies in the world. In addition, we are dedicated solely to providing thermal solutions, whereas some of our competitors' thermal solutions operations constitute only one of numerous operating segments.
Intellectual Property and Technology
The heat tracing industry is highly competitive and subject to the introduction of innovative techniques and services using new technologies. We have at least 40 registered patents in the United States, some of which have foreign equivalents. Of our United States registered patents, seven remain active, along with several foreign equivalents. While we have patented some of our products and processes, we historically have not relied upon patents to protect our design or manufacturing processes or products, and our patents are not material to our operations or business. Instead, we rely significantly on maintaining the confidentiality of our trade secrets, manufacturing know-how and other proprietary rights and other information related to our operations. Accordingly, we require all employees to sign a nondisclosure agreement to protect our trade secrets, business strategy and other proprietary information. We have 15 registered trademarks in the United States and approximately 40 recognized brand names. We also rely on a significant number of unregistered trademarks, primarily abroad, but also in the United States, in the day-to-day operation of our business.
Research and Development
Our research and development group is focused on identifying new technologies to enhance our industrial heat tracing solutions through identifying opportunities to maximize product reliability and reduce the customer's total cost of ownership, which consists of capital expenses, maintenance costs and energy costs. Current initiatives include conductive polymer technology research and the development of integrated control and monitoring systems and advanced heat tracing network monitoring communication software for our electric heat tracing systems.
Employees
As of
March 31, 2014
, we employed approximately 829 persons on a full-time basis worldwide. None of our employees is covered by a collective-bargaining agreement, and we have never experienced any organized work stoppage or strike. We consider our employee relations to be good.
Governmental Regulation
Due to the international scope of our operations, we are subject to complex United States and foreign laws governing, among others, anti-corruption matters, export controls, economic sanctions, antiboycott rules, currency exchange controls and transfer pricing rules. These laws are administered, among others, the U.S. Department of Justice, the SEC, the Internal Revenue Service, Customs and Border Protection, the Bureau of Industry and Security, or "BIS", the Office of Antiboycott Compliance, or "OAC", and the Office of Foreign Assets Control, or "OFAC", as well as the counterparts of these agencies in foreign countries. Our policies mandate compliance with these laws. Despite our training and compliance programs, no assurances can be made that we will be found to be operating in full compliance with, or be able to detect every violation of,
7
any such laws. We cannot predict the nature, scope or effect of future regulatory requirements to which our international operations might be subject or the manner in which existing laws might be administered or interpreted.
Environmental Compliance
Our operations and properties are subject to a variety of federal, state, local and foreign environmental laws and regulations, including those governing the discharge of pollutants into the air or water, the management and disposal of hazardous substances or wastes, the cleanup of contaminated sites, the emission of greenhouse gases, and workplace health and safety. Certain environmental laws, including the Comprehensive Environmental Response, Compensation, and Liability Act, impose joint and several liability for cleanup costs, without regard to fault, on persons who have disposed of or released hazardous substances into the environment. In addition, we could become liable to third parties for damages resulting from the disposal or release of hazardous substances into the environment. Some of our sites are affected by soil and groundwater contamination relating to historical site operations, which could require us to incur expenses to investigate and remediate the contamination in compliance with environmental laws. Some of our operations require environmental permits and controls to prevent and reduce air and water pollution, and these permits are subject to modification, renewal and revocation by issuing authorities. A failure to obtain, maintain, and comply with these permit requirements could result in substantial penalties, including facility shutdowns. From time to time, we could be subject to requests for information, notices of violation, and/or investigations initiated by environmental regulatory agencies relating to our operations and properties. Violations of environmental and health and safety laws can result in substantial penalties, civil and criminal sanctions, permit revocations, and facility shutdowns. Environmental and health and safety laws may change rapidly and have tended to become more stringent over time. As a result, we could incur costs for past, present, or future failure to comply with all environmental and health and safety laws and regulations. In addition, we could become subject to potential regulations concerning the emission of greenhouse gasses, and while the effect of such future regulations cannot be determined at this time, they could require us to incur substantial costs in order to achieve and maintain compliance. In the ordinary course of business, we may be held responsible for any environmental damages we may cause to our customers' premises.
Seasonality
For information on seasonality, see Item 7, “Management's Discussion and Analysis of Financial Condition and Results of Operations-Seasonality”, which is hereby incorporated by reference into this Item 1.
Backlog
For information on backlog, see Item 7, “Management's Discussion and Analysis of Financial Condition and Results of Operations- Overview- Revenue”, which is hereby incorporated by reference into this Item 1.
The following risk factors address the material risks concerning our business. If any of the risks discussed in this annual report were to occur, our business, prospects, financial condition, results of operation and our ability to service our debt could be materially and adversely affected and the trading price of our common stock could decline significantly. Some statements in this annual report, including statements in the following risk factors, constitute forward-looking statements. Please refer to the section entitled “Forward-Looking Statements”.
Risks Related to Our Business and Industry
The markets we serve are subject to general economic conditions and cyclical demand, which could harm our business and lead to significant shifts in our results of operations from quarter to quarter that make it difficult to project long-term performance.
Our operating results have been and may in the future be adversely affected by general economic conditions and the cyclical pattern of certain industries in which our customers and end users operate. Demand for our products and services depends in large part upon the level of capital and maintenance expenditures by many of our customers and end users, in particular those in the energy, chemical processing and power generation industries, and firms that design and construct facilities for these industries. These customers' expenditures historically have been cyclical in nature and vulnerable to economic downturns. Prolonged periods of little or no economic growth could decrease demand for oil and gas which, in turn, could result in lower demand for our products and a negative impact on our results of operations and cash flows. In addition, this historically cyclical demand may lead to significant shifts in our results of operations from quarter to quarter, which limits our ability to make accurate long-term predictions about our future performance.
8
A sustained downturn in the energy industry, due to oil and gas prices decreasing or otherwise, could decrease demand for some of our products and services, which could materially and adversely affect our business, financial condition and results of operations.
A significant portion of our revenue historically has been generated by end-users in the oil and gas markets. The businesses of most of our customers in the energy industry are, to varying degrees, cyclical and historically have experienced periodic downturns. Profitability in the energy industry is highly sensitive to supply and demand cycles and commodity prices, which historically have been volatile, and our customers in this industry historically have tended to delay large capital projects, including expensive maintenance and upgrades, during industry downturns. Customer project delays may limit our ability to realize value from our backlog as expected and cause fluctuations in the timing or the amount of revenue earned and the profitability of our business in a particular period. In addition, such delays may lead to significant fluctuations in results of operations from quarter to quarter, making it difficult to predict our financial performance on a quarterly basis.
Demand for a significant portion of our products and services depends upon the level of capital expenditure by companies in the energy industry, which depends, in part, on energy prices. Prices of oil and gas have been very volatile over the past six years, with significant increases until achieving historic highs in July 2008, followed immediately by a steep decline through 2009. Since 2009, the price of crude oil in the United States has increased 71%. A sustained downturn in the capital expenditures of our customers, whether due to a decrease in the market price of oil and gas or otherwise, may delay projects, decrease demand for our products and services and cause downward pressure on the prices we charge, which, in turn, could have a material adverse effect on our business, financial condition and results of operations. Such downturns, including the perception that they might continue, could have a significant negative impact on the market price of our common stock.
A failure to deliver our backlog on time could affect our future sales and profitability and our relationships with our customers, and if we were to experience a material amount of modifications or cancellations of orders, our sales could be negatively impacted.
Our backlog is comprised of the portion of firm signed purchase orders or other written contractual commitments received from customers that we have not recognized as revenue. The dollar amount of backlog as of
March 31, 2014
was
$84.8
million. The timing of our recognition of revenue out of our backlog is subject to a variety of factors that may cause delays, many of which, including fluctuations in our customers' delivery schedules, are beyond our control. Such delays may lead to significant fluctuations in results of operations from quarter to quarter, making it difficult to predict our financial performance on a quarterly basis. Further, while we have historically experienced few order cancellations and the amount of order cancellations has not been material compared to our total contract volume, if we were to experience a significant amount of cancellations of or reductions in purchase orders, it would reduce our backlog and, consequently, our future sales and results of operations.
Our ability to meet customer delivery schedules for our backlog is dependent on a number of factors including, but not limited to, access to raw materials, an adequate and capable workforce, engineering expertise for certain projects, sufficient manufacturing capacity and, in some cases, our reliance on subcontractors. The availability of these factors may in some cases be subject to conditions outside of our control. A failure to deliver in accordance with our performance obligations may result in financial penalties and damage to existing customer relationships, our reputation and a loss of future bidding opportunities, which could cause the loss of future business and could negatively impact our financial performance.
As a global business, we are exposed to economic, political and other risks in a number of countries, which could materially reduce our revenues, profitability or cash flows or materially increase our liabilities. If we are unable to continue operating successfully in one or more foreign countries, it may have a material adverse effect on our business and financial condition.
For
fiscal 2014
, approximately
67%
of our revenues were generated outside of the United States, and approximately
33%
were generated outside North America. In addition, one of our key growth strategies is to continue to expand our global footprint in emerging and high growth markets around the world, although we may not be successful in expanding our international business.
Conducting business outside the United States is subject to additional risks, including the following:
|
•
|
changes in a specific country's or region's political, social or economic conditions, particularly in emerging markets;
|
9
|
•
|
trade relations between the United States and those foreign countries in which our customers and suppliers have operations, including protectionist measures such as tariffs, import or export licensing requirements and trade sanctions;
|
|
•
|
restrictions on our ability to own or operate subsidiaries in, expand in and, if necessary, repatriate cash from, foreign jurisdictions;
|
|
•
|
exchange controls and currency restrictions;
|
|
•
|
the burden of complying with numerous and potentially conflicting laws;
|
|
•
|
potentially negative consequences from changes in U.S. and foreign tax laws;
|
|
•
|
difficulty in staffing and managing (including ensuring compliance with internal policies and controls) geographically widespread operations;
|
|
•
|
different regulatory regimes controlling the protection of our intellectual property;
|
|
•
|
difficulty in the enforcement of contractual obligations in non-U.S. jurisdictions and the collection of accounts receivable from foreign accounts; and
|
|
•
|
transportation delays or interruptions.
|
One or more of these factors could prevent us from successfully expanding our presence in international markets, could have a material adverse effect on our revenues, profitability or cash flows or cause an increase in our liabilities. We may not succeed in developing and implementing policies and strategies to counter the foregoing factors effectively in each location where we do business. In addition, the imposition of trade restrictions, economic sanctions or embargoes by the United States or foreign governments could adversely affect our operations and financial results.
Our future revenue depends in part on our ability to bid and win new contracts. Our failure to effectively obtain future contracts could adversely affect our profitability.
Our future revenue and overall results of operations require us to successfully bid on new contracts and, in particular, contracts for large Greenfield projects, which are frequently subject to competitive bidding processes. Our revenue from major projects depends in part on the level of capital expenditures in our principal end markets, including the energy, chemical processing and power generation industries. In addition, if we fail to replace completed or canceled large Greenfield projects with new order volume of the same magnitude, our backlog will decrease and our future revenue and financial results may be adversely affected. The number of such projects we win in any year fluctuates, and is dependent upon the number of projects available and our ability to bid successfully for such projects. Contract proposals and negotiations are complex and frequently involve a lengthy bidding and selection process, which is affected by a number of factors, such as competitive position, market conditions, financing arrangements and required governmental approvals. For example, a client may require us to provide a bond or letter of credit to protect the client should we fail to perform under the terms of the contract. If negative market conditions arise, or if we fail to secure adequate financial arrangements or required governmental approvals, we may not be able to pursue particular projects, which could adversely affect our profitability.
We may be unable to compete successfully in the highly competitive markets in which we operate.
We operate in competitive domestic and international markets and compete with highly competitive domestic and international manufacturers and service providers. The fragmented nature of the industrial electric heat tracing industry, which consists of more than 30 companies, makes the market for our products and services highly competitive. A number of our direct and indirect competitors are major multinational corporations, some of which have substantially greater technical, financial and marketing resources than us, and additional competitors may enter these markets. Our competitors may develop products that are superior to our products, develop methods of more efficiently and effectively providing products and services, or adapt more quickly than we do to new technologies or evolving customer requirements. Any increase in competition may cause us to lose market share or compel us to reduce prices to remain competitive, which could result in reduced sales and earnings.
10
Volatility in currency exchange rates may adversely affect our financial condition, results of operations or cash flows.
We may not be able to effectively manage our exchange rate and/or currency transaction risks. Volatility in currency exchange rates may decrease our revenues and profitability, adversely affect our liquidity and impair our financial condition. While we have entered into hedging instruments to manage our exchange rate risk as it relates to certain intercompany balances with certain of our foreign subsidiaries, these hedging activities do not eliminate this exchange rate risk, nor do they reduce risk associated with total foreign sales.
Our non-U.S. subsidiaries generally sell their products and services in the local currency, but obtain a significant amount of their products from our facilities located in another country, primarily the United States, Canada or Europe. In particular, significant fluctuations in the Canadian Dollar, the Russian Ruble, the Euro or the Pound Sterling against the U.S. Dollar could adversely affect our results of operations. We also bid for certain foreign projects in U.S. dollars or Euros. If the U.S. dollar or Euro strengthens relative to the value of the local currency, we may be less competitive in bidding for those projects. See Item 7A, “Quantitative and Qualitative Disclosures about Market Risk” for additional information regarding our foreign currency exposure relating to operations.
Because our consolidated financial results are reported in U.S. dollars, and we generate a substantial amount of our sales and earnings in other currencies, the translation of those results into U.S. dollars can result in a significant decrease in the amount of those sales and earnings. In addition, fluctuations in currencies relative to the U.S. dollar may make it more difficult to perform period-to-period comparisons of our reported results of operations.
Due to the nature of our business, we may be liable for damages based on product liability claims. We are also exposed to potential indemnity claims from customers for losses due to our work or if our employees are injured performing services.
We face a risk of exposure to claims in the event that the failure, use or misuse of our products results, or is alleged to result, in death, bodily injury, property damage or economic loss. Although we maintain quality controls and procedures, we cannot be sure that our products will be free from defects. If any of our products prove to be defective, we may be required to replace the product. In addition, we may be required to recall or redesign such products, which could result in significant unexpected costs. Some of our products contain components manufactured by third parties, which may also have defects. In addition, if we are installing our products, we may be subject to claims that our installation caused damage or loss. Our products are often installed in our customers' or end users' complex and capital intensive facilities in inherently hazardous or dangerous industries, including energy, chemical processing and power generation, where the potential liability from risk of loss could be substantial. Although we currently maintain product liability coverage, which we believe is adequate for the continued operation of our business, we cannot be certain that this insurance coverage will continue to be available to us at a reasonable cost or, if available, will be adequate to cover any potential liabilities. With respect to components manufactured by third-party suppliers, the contractual indemnification that we seek from our third-party suppliers may be insufficient to cover claims made against us. In the event that we do not have adequate insurance or contractual indemnification, product liabilities could have a material adverse effect on our business, financial condition or results of operations.
Under our customer contracts, we often indemnify our customers from damages and losses they incur due to our work or services performed by us, as well as for losses our customers incur due to any injury or loss of life suffered by any of our employees or our subcontractor's personnel occurring on our customer's property. Many, but not all, of our customer contracts include provisions designed to limit our potential liability by excluding consequential damages and lost profits from our indemnity obligations. However, substantial indemnity claims may exceed the amount of insurance we maintain and could have a material adverse effect on our reputation, business, financial condition or results of operations.
A material disruption at any of our manufacturing facilities could adversely affect our results of operations.
If operations at any of our manufacturing facilities were to be disrupted as a result of significant equipment failures, natural disasters, power outages, fires, explosions, terrorism, adverse weather conditions, labor disputes or other reasons, we may be unable to fill customer orders and otherwise meet customer demand for our products, which could adversely affect our financial performance. For example, our marketing and research & development buildings, located on the same campus as our corporate headquarters and primary manufacturing facility in San Marcos, Texas, were destroyed by a tornado in January 2007.
Interruptions in production, in particular at our manufacturing facilities in San Marcos, Texas, or Calgary, Canada, at which we manufacture the majority of our products, could increase our costs and reduce our sales. Any interruption in production capability could require us to make substantial capital expenditures to fill customer orders, which could negatively affect our profitability and financial condition. We maintain property damage insurance that we believe to be adequate to provide for reconstruction of facilities and equipment, as well as business interruption insurance to mitigate losses resulting
11
from any production interruption or shutdown caused by an insured loss. However, any recovery under our insurance policies may not offset the lost sales or increased costs that may be experienced during the disruption of operations, which could adversely affect our financial performance.
The current geopolitical instability in Russia and Ukraine and related sanctions by the U.S. government against certain companies and individuals may hinder our ability to conduct business with potential or existing customers and vendors in these countries.
We derived approximately 6% and 5% of our revenue from Russia in the years ended March 31, 2014 and March 31, 2013, respectively. The continuation or escalation of the current geopolitical instability in Russia and Ukraine could negatively impact our operations, sales, and future growth prospects in that region. Recently, the U.S. government imposed sanctions through several executive orders restricting U.S. companies from conducting business with specified Russian and Ukrainian individuals and companies. While we believe that the executive orders currently do not preclude us from conducting business with our current customers in Russia, the sanctions imposed by the U.S. government may be expanded in the future to restrict us from engaging with them. If we are unable to conduct business with new or existing customers or pursue opportunities in Russia or Ukraine, our business, including revenue, profitability and cash flows, could be materially adversely affected. In addition, we are currently evaluating the impact of the executive orders on our relationships with vendors. If we are unable to conduct business with certain vendors, our operations in Russia and the Ukraine could be materially adversely affected.
Our business strategy includes acquiring smaller, value-added companies and making investments that complement our existing business. These acquisitions and investments could be unsuccessful or consume significant resources, which could adversely affect our operating results.
Acquisitions and investments may involve cash expenditures, debt incurrence, operating losses and expenses that could have a material adverse effect on our financial condition and operating results. Acquisitions involve numerous other risks, including:
|
•
|
diversion of management time and attention from daily operations;
|
|
•
|
difficulties integrating acquired businesses, technologies and personnel into our business;
|
|
•
|
potential loss of key employees, key contractual relationships or key customers of acquired companies or of us; and
|
|
•
|
assumption of the liabilities and exposure to unforeseen liabilities of acquired companies.
|
We have limited experience in acquiring or integrating other businesses or making investments or undertaking joint ventures with others. It may be difficult for us to complete transactions quickly and to integrate acquired operations efficiently into our current business operations. Any acquisitions or investments may ultimately harm our business or financial condition, as such acquisitions may not be successful and may ultimately result in impairment charges.
Our international operations and non-U.S. subsidiaries are subject to a variety of complex and continually changing laws and regulations and, in particular, export control regulations or sanctions
Due to the international scope of our operations, we are subject to a complex system of laws and regulations, including regulations issued by the U.S. Department of Justice, or the "DOJ", the SEC, the Internal Revenue Service, or the "IRS", the U.S. Department of Treasury, the U.S. Department of State, Customs and Border Protection, BIS, OAC and OFAC, as well as the counterparts of these agencies in foreign countries. While we believe we are in material compliance with these regulations and maintain programs intended to achieve compliance, we may currently or may in the future be in violation of these regulations. In 2009, we entered into settlement agreements with BIS and OFAC, and in 2010, we entered into a settlement agreement with OAC, in each case with respect to matters we voluntarily disclosed to such agencies.
Any alleged or actual violations may subject us to government scrutiny, investigation and civil and criminal penalties and may limit our ability to export our products or provide services outside the United States. Additionally, we cannot predict the nature, scope or effect of future regulatory requirements to which our international operations might be subject or the manner in which existing laws might be administered or interpreted.
In addition, our geographically widespread operations, coupled with our relatively smaller offices in many countries and our reliance on third party subcontractors, suppliers and manufacturers in the completion of our projects, make it more difficult to oversee and ensure that all our offices and employees comply with our internal policies and control procedures. We
12
have in the past experienced employee theft, although the amounts involved have not been material, and we cannot assure you that we can ensure compliance with our internal control policies and procedures
We operate in many different jurisdictions and we could be adversely affected by violations of the U.S. Foreign Corrupt Practices Act and similar foreign anti-corruption laws.
The U.S. Foreign Corrupt Practices Act, which we refer to as the "FCPA", and similar foreign anti-corruption laws generally prohibit companies and their intermediaries from making improper payments or providing anything of value to influence foreign government officials for the purpose of obtaining or retaining business or obtaining an unfair advantage. Recent years have seen a substantial increase in the global enforcement of anti-corruption laws, with more frequent voluntary self-disclosures by companies, aggressive investigations and enforcement proceedings by both the DOJ and the SEC resulting in record fines and penalties, increased enforcement activity by non-U.S. regulators, and increases in criminal and civil proceedings brought against companies and individuals. Because many of our customers and end users are involved in infrastructure construction and energy production, they are often subject to increased scrutiny by regulators. Our internal policies mandate compliance with these anti-corruption laws. We operate in many parts of the world that are recognized as having governmental corruption problems to some degree and where strict compliance with anti-corruption laws may conflict with local customs and practices. Our continued operation and expansion outside the United States, including in developing countries, could increase the risk of such violations in the future. Despite our training and compliance programs, we cannot assure you that our internal control policies and procedures always will protect us from unauthorized reckless or criminal acts committed by our employees or agents. In the event that we believe or have reason to believe that our employees or agents have or may have violated applicable anti-corruption laws, including the FCPA, we may be required to investigate or have outside counsel investigate the relevant facts and circumstances, which can be expensive and require significant time and attention from senior management. Violations of these laws may result in severe criminal or civil sanctions, which could disrupt our business and result in a material adverse effect on our reputation, business, results of operations or financial condition.
Our dependence on subcontractors could adversely affect our results of operations.
We often rely on third party subcontractors as well as third party suppliers and manufacturers to complete our projects. To the extent that we cannot engage subcontractors or acquire supplies or materials, our ability to complete a project in a timely fashion or at a profit may be impaired. If the amount we are required to pay for these goods and services exceeds the amount we have estimated in bidding for fixed-price contracts, we could experience losses on these contracts. In addition, if a subcontractor or supplier is unable to deliver its services or materials according to the negotiated contract terms for any reason, including the deterioration of its financial condition or over-commitment of its resources, we may be required to purchase the services or materials from another source at a higher price. This may reduce the profit to be realized or result in a loss on a project for which the services or materials were needed.
We may lose money on fixed-price contracts, and we are exposed to liquidated damages risks in many of our customer contracts.
We often agree to provide products and services under fixed-price contracts, including our turnkey solutions. Under these contracts, we are typically responsible for all cost overruns, other than the amount of any cost overruns resulting from requested changes in order specifications. Our actual costs and any gross profit realized on these fixed-price contracts could vary from the estimated costs on which these contracts were originally based. This may occur for various reasons, including errors in estimates or bidding, changes in availability and cost of labor and raw materials and unforeseen technical and logistical challenges, including with managing our geographically widespread operations and use of third party subcontractors, suppliers and manufacturers in many countries. These variations and the risks inherent in our projects may result in reduced profitability or losses on projects. Depending on the size of a project, variations from estimated contract performance could have a material adverse impact on our operating results. In addition, many of our customer contracts, including fixed-price contracts, contain liquidated damages provisions in the event that we fail to perform our obligations thereunder in a timely manner or in accordance with the agreed terms, conditions and standards.
If we lose our senior management or other key employees, our business may be adversely affected.
Our ability to successfully operate and grow our global business and implement our strategies is largely dependent on the efforts, abilities and services of our senior management and other key employees. If we lose the services of our senior management or other key employees and are unable to find qualified replacements with comparable experience in the industry, our business could be negatively affected. Our future success will also depend on, among other factors, our ability to attract and retain qualified personnel, such as engineers and other skilled labor, and in particular management and skilled employees for our foreign operations.
13
We are subject to numerous environmental and health and safety laws and regulations, as well as potential environmental liabilities, which may require us to make substantial expenditures.
Our operations and properties are subject to a variety of federal, state, local and foreign environmental laws and regulations, including those governing the discharge of pollutants into the air or water, the management and disposal of hazardous substances or wastes, the cleanup of contaminated sites and workplace health and safety. As an owner or operator of real property, or generator of waste, we could become subject to liability for environmental contamination, regardless of whether we caused such contamination. Certain environmental laws, including the Comprehensive Environmental Response, Compensation, and Liability Act, impose joint and several liability for cleanup costs, without regard to fault, on persons who have disposed of or released hazardous substances into the environment. In addition, we could become liable to third parties for damages resulting from the disposal or release of hazardous substances into the environment. Some of our operations require environmental permits and controls to prevent and reduce air and water pollution, and these permits are subject to modification, renewal and revocation by issuing authorities. From time to time, we could be subject to requests for information, notices of violation, and/or investigations initiated by environmental regulatory agencies relating to our operations and properties. Violations of environmental and health and safety laws can result in substantial penalties, civil and criminal sanctions, permit revocations, and facility shutdowns. Environmental and health and safety laws may change rapidly and have tended to become more stringent over time. As a result, we could incur costs for past, present, or future failure to comply with all environmental and health and safety laws and regulations. In addition, we could become subject to potential regulations concerning the emission of greenhouse gases, and while the effect of such future regulations cannot be determined at this time, they could require us to incur substantial costs in order to achieve and maintain compliance. In the ordinary course of business, we may be held responsible for any environmental damages we may cause to our customers' premises.
Additional liabilities related to taxes or potential tax adjustments could adversely impact our financial results, financial condition and cash flow.
We are subject to tax and related obligations in the jurisdictions in which we operate or do business, including state, local, federal and foreign taxes. The taxing rules of the various jurisdictions in which we operate or do business often are complex and subject to varying interpretations. Tax authorities may challenge tax positions that we take or historically have taken, and may assess taxes where we have not made tax filings or may audit the tax filings we have made and assess additional taxes, as they have done from time to time in the past. Some of these assessments may be substantial, and also may involve the imposition of substantial penalties and interest. Significant judgment is required in evaluating our tax positions and in establishing appropriate reserves. The resolutions of our tax positions are unpredictable. The payment of substantial additional taxes, penalties or interest resulting from any assessments could materially and adversely impact our results of operations, financial condition and cash flow.
We have determined that our earnings outside the United States are permanently reinvested and will not be repatriated. Accordingly, our current estimated annual effective tax rate reflects the blended tax rates in jurisdictions where we have generated earnings and assumes no repatriation of cash earned by our non-U.S. subsidiaries. That effective rate is lower than the United States statutory rate of 35%. The repatriation of earnings requires that we pay tax at the United States corporate tax rate after accounting for the foreign tax already paid. If we need to repatriate cash into the United States or our needs change, significant tax adjustments may result.
The obligations associated with being a public company require significant resources and management attention.
Because we are a public company with equity securities listed on a national securities exchange we are required to comply with certain laws, regulations and requirements, including the requirements of the Securities Exchange Act of 1934, as amended, which we refer to the "Exchange Act", certain corporate governance provisions of the Sarbanes-Oxley Act of 2002, which we refer to as the "Sarbanes-Oxley Act", related regulations of the SEC and requirements of the NYSE. Complying with these statutes, regulations and requirements occupies a significant amount of time of our board of directors and management and results in significant legal, accounting and other expenses. We maintain, and will continue to maintain, internal controls and procedures for financial reporting and accounting systems to meet our reporting obligations as a public company. However, the measures we take may not be sufficient to satisfy our obligations. In addition, we cannot predict or estimate the amount of additional costs incurred in order to comply with these requirements.
Section 404 of the Sarbanes-Oxley Act requires annual management assessments and attestation by our independent registered public accounting firm of the effectiveness of our internal control over financial reporting. In connection with the necessary procedures and practices related to internal control over financial reporting, we or our independent registered public accounting firm may identify deficiencies that we may not be able to remediate in time to meet the deadline imposed by the Sarbanes-Oxley Act for compliance with the requirements of Section 404. If we fail to comply with Section 404, or if we or our
14
independent registered public accounting firm identify and report a material weakness, it may affect the reliability of our internal control over financial reporting, which could adversely affect the market price of our common stock and subject us to sanctions or investigations by the NYSE, the SEC or other regulatory authorities, which would require additional financial and management resources.
Our current or future indebtedness could impair our financial condition and reduce the funds available to us for other purposes. Our debt agreements impose certain operating and financial restrictions, with which failure to comply could result in an event of default that could adversely affect our results of operations.
We have substantial indebtedness. At
March 31, 2014
, we had
$121.5 million
of outstanding indebtedness. If our cash flows and capital resources are insufficient to fund the interest payments on our outstanding borrowings under our credit facility and other debt service obligations and keep us in compliance with the covenants under our debt agreements or to fund our other liquidity needs, we may be forced to reduce or delay capital expenditures, sell assets or operations, seek additional capital or restructure or refinance our indebtedness. We cannot ensure that we would be able to take any of these actions, that these actions would permit us to meet our scheduled debt service obligations or that these actions would be permitted under the terms of our existing or future debt agreements, which may impose significant operating and financial restrictions on us and could adversely affect our ability to finance our future operations or capital needs; obtain standby letters of credit, bank guarantees or performance bonds required to bid on or secure certain customer contracts; make strategic acquisitions or investments or enter into alliances; withstand a future downturn in our business or the economy in general; engage in business activities, including future opportunities, that may be in our interest; and plan for or react to market conditions or otherwise execute our business strategies.
If we cannot make scheduled payments on our debt, or if we breach any of the covenants in our debt agreements, we will be in default and, as a result, our debt holders could declare all outstanding principal and interest to be due and payable, the lenders under our credit facility could terminate their commitments to lend us money and foreclose against the assets securing our borrowings, and we could be forced into bankruptcy or liquidation.
In addition, we and certain of our subsidiaries may incur significant additional indebtedness, including additional secured indebtedness. Although the terms of our debt agreements contain restrictions on the incurrence of additional indebtedness, these restrictions are subject to a number of qualifications and exceptions, and additional indebtedness incurred in compliance with these restrictions could be significant. Incurring additional indebtedness could increase the risks associated with our substantial indebtedness, including our ability to service our indebtedness.
A significant portion of our business is conducted through foreign subsidiaries and our failure to generate sufficient cash flow from these subsidiaries, or otherwise repatriate or receive cash from these subsidiaries, could result in our inability to repay our indebtedness.
Approximately
67%
of our
fiscal 2014
revenues were generated outside of the United States. While we have been able to meet our regular debt service obligations to date from cash generated through our U.S. operations and expect to be able to continue to do so in the future, we may seek to repatriate cash for other uses, and our ability to withdraw cash from foreign subsidiaries will depend upon the results of operations of these subsidiaries and may be subject to legal, contractual or other restrictions and other business considerations. Our foreign subsidiaries may enter into financing arrangements that limit their ability to make loans or other payments to fund payments of our debt. In particular, to the extent our foreign subsidiaries incur additional indebtedness,
the ability
of our foreign subsidiaries to provide us with cash may be limited. In addition, dividend and interest payments to us from our foreign subsidiaries may be subject to foreign withholding taxes, which could reduce the amount of funds we receive from our foreign subsidiaries. Dividends and other distributions from our foreign subsidiaries may also be subject to fluctuations in currency exchange rates and legal and other restrictions on repatriation, which could further reduce the amount of funds we receive from our foreign subsidiaries.
In general, when an entity in a foreign jurisdiction repatriates cash to the United States, the amount of such cash is treated as a dividend taxable at current U.S. tax rates. Accordingly, upon the distribution of cash to us from our foreign subsidiaries, we will be subject to U.S. income taxes. Although foreign tax credits may be available to reduce the amount of the additional tax liability, these credits may be limited based on our tax attributes. Therefore, to the extent that we must use cash generated in foreign jurisdictions, there may be a cost associated with repatriating cash to the United States.
15
We rely heavily on trade secrets to gain a competitive advantage in the market and the unenforceability of our nondisclosure agreements may adversely affect our operations.
The heat tracing industry is highly competitive and subject to the introduction of innovative techniques and services using new technologies. While we have patented some of our products and processes, we historically have not relied upon patents to protect our design or manufacturing processes or products, and our patents are not material to our operations or business. Instead, we rely significantly on maintaining confidential our trade secrets and other information related to our operations. Accordingly, we require all employees to sign a nondisclosure agreement to protect our trade secrets, business strategy and other proprietary information. If the provisions of these agreements are found unenforceable in any jurisdiction in which we operate, the disclosure of our proprietary information may place us at a competitive disadvantage. Even where the provisions are enforceable, the confidentiality clauses may not provide adequate protection of our trade secrets and proprietary information in every such jurisdiction.
We may be unable to prevent third parties from using our intellectual property rights, including trade secrets and know-how, without our authorization or from independently developing intellectual property that is the same as or similar to ours, particularly in those countries where the laws do not protect our intellectual property rights as fully as in the United States. The unauthorized use of our trade secrets or know-how by third parties could reduce or eliminate any competitive advantage we have developed, cause us to lose sales or otherwise harm our business or increase our expenses as we attempt to enforce our rights.
Our intellectual property rights may not be successfully asserted in the future or may be invalidated, circumvented or challenged.
We have obtained and applied for some U.S. and, to a lesser extent, foreign trademark registrations and will continue to evaluate the registration of additional trademarks. We cannot guarantee that any of our pending applications will be approved. Moreover, even if the applications are approved, third parties may seek to oppose or otherwise challenge them. In addition, we rely on a number of significant unregistered trademarks, primarily abroad, but also in the United States, in the day-to-day operation of our business. Without the protections afforded by registration, our ability to protect and use our trademarks may be limited and could negatively affect our business.
In addition, while we have not faced intellectual property infringement claims from others in recent years, in the event successful infringement claims are brought against us, particularly claims (under patents or otherwise) against our product design or manufacturing processes, such claims could have a material adverse effect on our business, financial condition or results of operation.
We are exposed to potential regulatory, financial and reputational risks related to certain “conflict minerals."
In 2012, the SEC adopted disclosure requirements related to certain minerals sourced from the Democratic Republic of Congo or adjoining countries, as required by Section 1502 of the Dodd-Frank Wall Street Reform and Consumer Protection Act. The final rules impose inquiry, diligence and disclosure obligations with respect to “conflict minerals,” defined as tin, tantalum, tungsten and gold, that are necessary to the functionality of a product manufactured, or contracted to be manufactured, by an SEC reporting company. The first disclosure deadline under the final rules is May 31, 2014, and by that date, an SEC reporting company must make disclosures regarding products it sold during the 2013 calendar year. Certain of these minerals are used extensively in components manufactured by our suppliers (or in components incorporated by our suppliers into components supplied to us) for use in our products. Under the final rules, an SEC reporting company must conduct a country of origin inquiry that is reasonably designed to determine whether any of the “conflict minerals” that are necessary to the functionality of a product manufactured, or contracted to be manufactured, by the company originated in the Democratic Republic of the Congo or an adjoining country. If any such “conflict minerals” originated in the Democratic Republic of Congo or an adjoining country, the final rules require the issuer to exercise due diligence on the source of such “conflict minerals” and their chain of custody with the ultimate objective of determining whether the “conflict minerals” directly or indirectly financed or benefited armed groups in the Democratic Republic of the Congo or an adjoining country. The issuer must then prepare and file with the SEC a report regarding its diligence efforts. We have incurred and expect to incur significant costs to conduct our country of origin inquiry and, if necessary, to exercise such due diligence.
We have a very large number of suppliers and our supply chain is very complex and multifaceted. While we have no intention to use minerals sourced from the Democratic Republic of Congo or adjoining countries that are not “conflict free” (meaning that they do not contain “conflict minerals” that directly or indirectly finance or benefit armed groups in the Democratic Republic of the Congo or an adjoining country), a significant number of our suppliers are small businesses, and those small businesses have limited or no resources to track their sources of minerals. As a result, we expect significant
16
difficulty in determining the country of origin or the source and chain of custody for all “conflict minerals” used in our products and disclosing that our products are “conflict free.” We may face reputational challenges if we are unable to verify the country of origin or the source and chain of custody for all “conflict minerals” used in our products or if we are unable to disclose that our products are “conflict free.” Implementation of these rules may also affect the sourcing and availability of some minerals necessary to the manufacture of our products and may affect the availability and price of “conflict minerals” capable of certification as “conflict free.” Accordingly, we may incur significant costs as a consequence of these rules, which may adversely affect our business, financial condition or results of operations.
Risks Related to Ownership of Our Common Stock
Our quarterly operating results may vary significantly, which could negatively impact the price of our common stock.
Our quarterly results of operations have fluctuated in the past and will continue to fluctuate in the future. You should not rely on the results of any past quarter or quarters as an indication of future performance in our business operations or the price of our common stock. Factors that might cause our operating results to vary from quarter to quarter include, but are not limited to:
|
•
|
general economic conditions and cyclicality in the end markets we serve;
|
|
•
|
future growth of energy and chemical processing capital investments;
|
|
•
|
a material disruption at any of our manufacturing facilities;
|
|
•
|
delays in our customers' projects for which our products are a component;
|
|
•
|
the timing of completion of large Greenfield projects;
|
|
•
|
competition from various other sources providing similar heat tracing products and services, or other alternative technologies, to customers; and
|
|
•
|
the seasonality of demand for MRO/UE orders, which is typically highest during the second and third fiscal quarters.
|
If our results of operations from quarter to quarter fail to meet the expectations of securities analysts and investors, the price of our common stock could be negatively impacted.
The market price of our common stock may fluctuate significantly, and this may make it difficult for holders to resell our common stock when they want or at prices that they find attractive.
The price of our common stock on the NYSE constantly changes. We expect that the market price of our common stock will continue to fluctuate. The market price of our common stock may fluctuate as a result of a variety of factors, many of which are beyond our control. These factors include:
|
•
|
quarterly fluctuations in our operating results;
|
|
•
|
changes in investors' and analysts' perception of the business risks and conditions of our business or our competitors;
|
|
•
|
our ability to meet the earnings estimates and other performance expectations of financial analysts or investors;
|
|
•
|
unfavorable commentary or downgrades of our stock by equity research analysts;
|
|
•
|
the emergence of new sales channels in which we are unable to compete effectively;
|
|
•
|
disruption to our operations;
|
|
•
|
fluctuations in the stock prices of our peer companies or in stock markets in general; and
|
|
•
|
general economic or political conditions.
|
17
In addition, in recent years, global equity markets have experienced extreme price and volume fluctuations. This volatility has had a significant effect on the market price of securities issued by many companies for reasons often unrelated to their operating performance. These broad market fluctuations may adversely affect the market price of our common stock, regardless of our operating results.
Anti-takeover provisions contained in our amended and restated certificate of incorporation and amended and restated bylaws could impair a takeover attempt that our stockholders may find beneficial.
Our second amended and restated certificate of incorporation, amended and restated bylaws and Delaware law contain provisions that could have the effect of rendering more difficult or discouraging an acquisition deemed undesirable by our board of directors. Our corporate governance documents include provisions:
|
•
|
authorizing our board of directors, without further action by the stockholders, to issue blank check preferred stock;
|
|
•
|
limiting the ability of our stockholders to call and bring business before special meetings and to take action by written consent in lieu of a meeting;
|
|
•
|
requiring advance notice of stockholder proposals for business to be conducted at meetings of our stockholders and for nominations of candidates for election to our board of directors;
|
|
•
|
authorizing our board of directors, without stockholder approval, to amend our amended and restated bylaws;
|
|
•
|
limiting the determination of the number of directors on our board of directors and the filling of vacancies or newly created seats on our board of directors to our board of directors then in office; and
|
|
•
|
subject to certain exceptions, limiting our ability to engage in certain business combinations with an “interested stockholder” for a three-year period following the time that the stockholder became an interested stockholder.
|
These provisions, alone or together, could delay hostile takeovers and changes in control of our company or changes in our management.
Though we have opted out of the Delaware anti-takeover statute, our second amended and restated certificate of incorporation contains provisions that are similar to the Delaware anti-takeover statute, which may impair a takeover attempt that our stockholders may find beneficial. Any provision of our second amended and restated certificate of incorporation or amended and restated bylaws that has the effect of delaying or deterring a change in control could limit the opportunity for our stockholders to receive a premium for their shares of our common stock, and could also affect the price that some investors are willing to pay for our common stock.
We do not currently intend to pay dividends on our common stock and, consequently, your ability to achieve a return on your investment will depend on appreciation in the price of our common stock.
We do not expect to pay dividends on our common stock. Any future dividend payments are within the discretion of our board of directors or a duly authorized committee of the board of directors and will depend on, among other things, our results of operations, working capital requirements, capital expenditure requirements, financial condition, level of indebtedness, contractual restrictions with respect to payment of dividends, business opportunities, anticipated cash needs, provisions of applicable law and other factors that our board of directors may deem relevant. In particular, our credit facility limits our ability to pay dividends from cash generated from operations. We may not generate sufficient cash from operations in the future to pay dividends on our common stock. See Item 5, “Market for Registrant's Common Equity, Related Stockholder Matters and Issuer Purchases of Equity Securities-Dividend Policy”.
None.
Our headquarters and principal executive offices are located at 100 Thermon Drive, San Marcos, Texas. A summary of the physical properties that we use as of
March 31, 2014
follows in the table below. We believe that our facilities are suitable for their purpose and adequate to meet our business operations requirements. We have manufacturing facilities in the United States, Canada, Europe and India. Most of our operations are registered to International Organization for Standardization (ISO) 9001 quality standards.
18
|
Location
|
Country
|
Approximate Size
|
Function
|
Owned/Leased
|
||||
|
Corporate Headquarters San Marcos ,TX
|
United States
|
203,000 sq. ft. on 30 acres
|
Manufacturing, fabrication, , sales, engineering, marketing, research & development, warehouse and Corporate Headquarters
|
Owned
|
||||
|
McCarty Lane Property San Marcos, TX
|
United States
|
9,300 sq. ft. on 6.6 acres
|
Storage
|
Owned
|
||||
|
Houston, TX
|
United States
|
41,000 sq. ft.
|
Fabrication, engineering, and sales
|
Leased
|
||||
|
Houston, TX
|
United States
|
44,000 sq. ft.
|
Office and warehouse
|
Owned
|
||||
|
Baton Rouge, LA
|
United States
|
10,000 sq. ft.
|
Sales, engineering and warehouse
|
Owned
|
||||
|
Newark, DE
|
United States
|
500 sq. ft.
|
Sales
|
Leased
|
||||
|
Office: Calgary, AB
|
Canada
|
34,000 sq. ft.
|
Fabrication, sales, engineering and warehouse
|
Leased
|
||||
|
MI Plant: Calgary, AB
|
Canada
|
46,000 sq. ft.
|
Manufacturing, fabrication, and warehouse
|
Leased
|
||||
|
Edmonton, AB
|
Canada
|
9,800 sq. ft.
|
Sales and warehouse
|
Leased
|
||||
|
Sarnia, ON
|
Canada
|
4,500 sq. ft.
|
Sales and warehouse
|
Leased
|
||||
|
London, ON
|
Canada
|
1,200 sq. ft.
|
Sales
|
Leased
|
||||
|
Mexico City
|
Mexico
|
2,000 sq. ft.
|
Sales and Engineering
|
Leased
|
||||
|
Rio de Janeiro
|
Brazil
|
625 sq. ft.
|
Sales and engineering
|
Leased
|
||||
|
Pijnacker
|
Netherlands
|
35,000 sq. ft. on 1.5 acres
|
Manufacturing, fabrication, sales, engineering, warehouse, marketing and European Headquarters
|
Owned
|
||||
|
Moscow
|
Russia
|
2,600 sq. ft.
|
Sales and engineering
|
Leased
|
||||
|
Paris
|
France
|
4,300 sq. ft.
|
Sales and engineering
|
Leased
|
||||
|
Gateshead, Tyne & Wear
|
United Kingdom
|
5,000 sq. ft.
|
Sales, engineering, and warehouse
|
Leased
|
||||
|
Bergisch Gladbach
|
Germany
|
2,800 sq. ft.
|
Sales and engineering
|
Leased
|
||||
|
Manama
|
Bahrain
|
1,100 sq. ft.
|
Sales and engineering
|
Leased
|
||||
|
Shanghai
|
China
|
2,500 sq. ft.
|
Sales and engineering
|
Leased
|
||||
|
Shanghai
|
China
|
4,600 sq. ft.
|
Warehouse
|
Leased
|
||||
|
Shanghai
|
China
|
400 sq. ft.
|
Warehouse
|
Leased
|
||||
|
Beijing
|
China
|
1,650 sq. ft.
|
Sales and engineering
|
Leased
|
||||
|
Mumbai
|
India
|
1,500 sq. ft.
|
Sales and engineering
|
Leased
|
||||
|
Koregon Bhima, Pune
|
India
|
15,000 sq. ft. on 3 acres
|
Manufacturing, fabrication and warehouse
|
Owned
|
||||
|
Noida
|
India
|
2,000 sq. ft.
|
Engineering
|
Leased
|
||||
|
Caringbah, New South Wales
|
Australia
|
200 sq. ft.
|
Sales
|
Leased
|
||||
|
Bayswater, Victoria
|
Australia
|
1,350 sq. ft.
|
Fabrication, sales, engineering and warehouse
|
Owned
|
||||
|
Kuala Lumpur
|
Malaysia
|
475 sq. ft.
|
Sales and engineering
|
Leased
|
||||
|
Yokohama
|
Japan
|
1,500 sq. ft.
|
Sales and engineering
|
Leased
|
||||
|
Seoul
|
South Korea
|
3,500 sq. ft.
|
Sales and engineering
|
Leased
|
||||
|
Seoul
|
South Korea
|
950 sq. ft.
|
Warehouse
|
Leased
|
||||
For information on legal proceedings, see Note 12, “Commitments and Contingencies” to our consolidated financial statements contained elsewhere in this annual report, which is hereby incorporated by reference into this Item 3.
Not applicable.
The common stock of the Company began trading on the NYSE under the symbol “THR” in connection with our IPO, on May 5, 2011. Prior to that date, there was no public market for the common stock of the Company. The following table sets forth for each period indicated the reported high and low sales prices for the common stock of the Company on the NYSE.
|
Thermon Common Stock
|
||||||||||||
|
High
|
Low
|
Dividends Paid
|
||||||||||
|
For the quarterly period ended:
|
||||||||||||
|
June 30, 2012
|
$
|
23.17
|
|
$
|
19.28
|
|
—
|
|
||||
|
September 30, 2012
|
$
|
26.14
|
|
$
|
19.94
|
|
—
|
|
||||
|
December 31, 2012
|
$
|
26.24
|
|
$
|
21.76
|
|
—
|
|
||||
|
March 31, 2013
|
$
|
24.50
|
|
$
|
20.03
|
|
—
|
|
||||
|
For the quarterly period ended:
|
||||||||||||
|
June 30, 2013
|
$
|
22.25
|
|
$
|
17.99
|
|
—
|
|
||||
|
September 30, 2013
|
$
|
23.23
|
|
$
|
19.01
|
|
—
|
|
||||
|
December 31, 2013
|
$
|
29.06
|
|
$
|
22.71
|
|
—
|
|
||||
|
March 31, 2014
|
$
|
28.63
|
|
$
|
22.70
|
|
—
|
|
||||
|
For the quarterly period ended:
|
||||||||||||
|
June 30, 2014 (Through May 29, 2014)
|
$
|
24.85
|
|
$
|
22.42
|
|
||||||
On May 27, 2014, the closing sale price of our common stock, as reported by the NYSE, was $23.72. As of May 27, 2014, there were approximately 64 holders of our common stock of record.
19
Stock Performance
The following line graph and table present a comparison of cumulative total returns for our common stock on an annual basis since our IPO, as compared to the (i) the Russell 2000 index, (ii) Russell 3000 Index and (ii) a peer group selected by the Company, for the same period. Our peer group was selected in good faith and is comprised of manufacturing companies who compete in similar industries and possess similar sales and market capitalizations. The returns of each company in the peer group have been weighted according to market capitalization. The plotted points in the line graph are based on the closing price on the last trading date of the fiscal year. The values assume an initial investment of $100 was made in our common stock and the respective indexes on May 5, 2011, the date our common stock began trading on the NYSE in connection with our IPO. The stock price performance shown below is not necessarily indicative of future price performance.
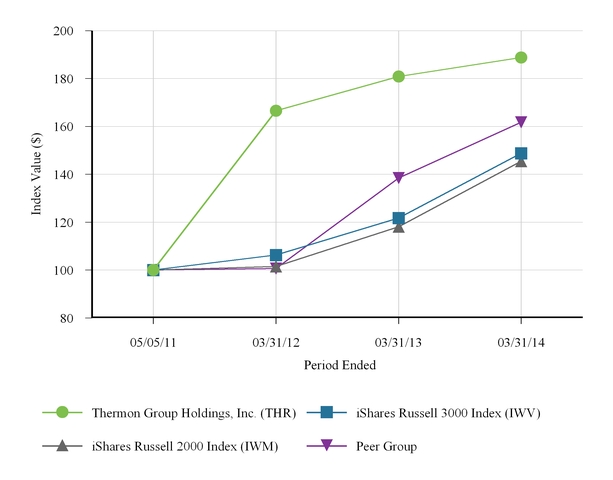
|
May 5, 2011
|
March 31, 2012
|
March 31, 2013
|
March 31, 2014
|
|||||||||
|
Thermon Group Holdings, Inc.
|
$
|
100.00
|
|
$
|
166.53
|
|
$
|
180.86
|
|
$
|
188.76
|
|
|
iShares Russell 3000 Index
|
$
|
100.00
|
|
$
|
106.29
|
|
$
|
121.72
|
|
$
|
148.83
|
|
|
iShares Russell 2000 Index
|
$
|
100.00
|
|
$
|
101.46
|
|
$
|
118.07
|
|
$
|
145.46
|
|
|
Peer Group (a)
|
$
|
100.00
|
|
$
|
100.66
|
|
$
|
138.50
|
|
$
|
161.77
|
|
(a) Our peer group is comprised of the following companies that trade under the following ticker symbols, Graham Corp. (GHM), Vicor Corp. (VICR), ENGlobal Corp. (ENG), Ampco-Pittsburgh Corp. (AP), AAON Inc. (AAON), Flotek Industries Inc. (FTK), Measurement Specialties Inc. (MEAS), Gorman-Rupp Co. (GRC), Advanced Energy Industries Inc. (AEIS), ESCO Technologies Inc. (ESE), Methode Electronics Inc. (MEI), AZZ Inc. (AZZ), and Powell Industries Inc. (POWL)
The information in this "Stock Performance" section shall not be deemed to be "soliciting material" or to be "filed" with the SEC or subject to Regulation 14A or 14C, or to the liabilities of Section 18 of the Exchange Act.
20
Dividend Policy
Since the completion of the CHS Transactions on April 30, 2010, we have not declared or paid any cash dividends on our capital stock, and we do not currently intend to pay any cash dividends on our common stock. We currently intend to retain earnings to finance the growth and development of our business and for working capital and general corporate purposes. Any payment of dividends will be at the discretion of our board of directors and will depend upon earnings, financial condition, capital requirements, level of indebtedness, contractual restrictions with respect to payment of dividends, restrictions imposed by applicable law and other factors. In particular, our credit facility limits our ability to pay dividends from cash generated from operations. See Item 7, “Management's Discussion and Analysis of Financial Condition and Results of Operations-Liquidity and Capital Resources.”
Equity Compensation Plan Information
For information on our equity compensation plans, see Item 12, “Security Ownership of Certain Beneficial Owners and Management and Related Stockholder Matters-Equity Compensation Plan Information”. See also Note 13, “Stock-Based Compensation Expense” to our consolidated financial statements included elsewhere in this annual report.
Issuer Purchases of Equity Securities
None.
Recent Sales of Unregistered Securities
None.
The following table sets forth certain selected historical consolidated financial and operating data as of and for the fiscal years ended March 31, 2014 (“fiscal 2014”), March 31, 2013 (“fiscal 2013”), March 31, 2012 (“fiscal 2012”), March 31, 2011 (“fiscal 2011”) and March 31, 2010 ("fiscal 2010"). The data set forth below should be read in conjunction with Item 7, “Management's Discussion and Analysis of Financial Condition and Results of Operations”, which is contained elsewhere in this annual report, and our consolidated financial statements and the notes thereto as of March 31, 2014 and 2013 and for fiscal 2014, fiscal 2013 and fiscal 2012, which are contained elsewhere in this annual report.
In this annual report, we have included the consolidated financial and operating data of Thermon Group Holdings, Inc. (“successor”) for fiscal 2014, fiscal 2013, fiscal 2012 and the period from May 1, 2010 through March 31, 2011 and the consolidated financial and operating data of Thermon Holdings, LLC (“predecessor”) for the period from April 1, 2010 to April 30, 2010 and for fiscal 2010. Concurrent with the completion of the CHS Transactions on April 30, 2010, predecessor no longer owned any interest in us, and, beginning with the period from May 1, 2010 through March 31, 2011, we have reported the consolidated financial and operating data of successor. We do not anticipate that there would have been any material difference in our consolidated financial and operational data and notes thereto for fiscal 2010 and the period from April 1, 2010 to April 30, 2010 had such financial and operating data been prepared for Thermon Group Holdings, Inc., except as it relates to purchase accounting in connection with the CHS Transactions.
The presentation of fiscal 2011 includes the combined results of the predecessor and successor periods. We have presented the combination of these periods because it provides an easier-to-read discussion of the results of operations and provides the investor with information from which to analyze our financial results in a manner that is consistent with the way management reviews and analyzes our results of operations. In addition, the combined results provide investors with the most meaningful comparison between our results for prior and future periods. Please refer to Note 1 to the table set forth below for a separate presentation of the results for the predecessor and successor periods for fiscal 2011.
21
|
Successor
|
Predecessor/Successor Combined (Non-GAAP) (1)
|
Predecessor
|
|||||||||||||||||||
|
Year Ended March 31,
|
|||||||||||||||||||||
|
2014
|
2013
|
2012
|
2011
|
2010
|
|||||||||||||||||
|
(dollars in thousands, except per share data)
|
|||||||||||||||||||||
|
Consolidated Statements of Operations Data:
|
|||||||||||||||||||||
|
Sales
|
$
|
277,323
|
|
$
|
284,036
|
|
$
|
272,323
|
|
$
|
241,063
|
|
$
|
194,096
|
|
||||||
|
Cost of sales
|
142,153
|
|
151,204
|
|
140,208
|
|
131,348
|
|
102,784
|
|
|||||||||||
|
Purchase accounting adjustments (2)
|
—
|
|
—
|
|
—
|
|
7,614
|
|
—
|
|
|||||||||||
|
Gross profit
|
$
|
135,170
|
|
$
|
132,832
|
|
$
|
132,115
|
|
$
|
102,101
|
|
$
|
91,312
|
|
||||||
|
Operating expenses:
|
|||||||||||||||||||||
|
Marketing, general and administrative and engineering
|
65,463
|
|
64,633
|
|
76,280
|
|
58,893
|
|
47,344
|
|
|||||||||||
|
Amortization of intangible assets
|
11,090
|
|
11,211
|
|
11,379
|
|
18,245
|
|
2,426
|
|
|||||||||||
|
Income from operations
|
$
|
58,617
|
|
$
|
56,988
|
|
$
|
44,456
|
|
$
|
24,963
|
|
$
|
41,542
|
|
||||||
|
Interest income
|
246
|
|
112
|
|
122
|
|
49
|
|
6
|
|
|||||||||||
|
Interest expense (3)
|
(10,019
|
)
|
(15,225
|
)
|
(19,584
|
)
|
(29,000
|
)
|
(7,357
|
)
|
|||||||||||
|
Loss on retirement of debt
|
(15,485
|
)
|
—
|
|
(3,825
|
)
|
(630
|
)
|
—
|
|
|||||||||||
|
Success fees to owners related to the CHS Transactions (4)
|
—
|
|
—
|
|
—
|
|
(7,738
|
)
|
—
|
|
|||||||||||
|
Other expense (5)
|
(596
|
)
|
(325
|
)
|
(1,671
|
)
|
(14,125
|
)
|
(1,285
|
)
|
|||||||||||
|
Income (loss) from continuing
|
|||||||||||||||||||||
|
operations before provision for
|
|||||||||||||||||||||
|
income taxes
|
$
|
32,763
|
|
$
|
41,550
|
|
$
|
19,498
|
|
$
|
(26,481
|
)
|
$
|
32,906
|
|
||||||
|
Income tax expense (benefit)
|
6,964
|
|
14,576
|
|
7,468
|
|
(11,274
|
)
|
13,966
|
|
|||||||||||
|
Net income (loss)
|
$
|
25,799
|
|
$
|
26,974
|
|
$
|
12,030
|
|
$
|
(15,207
|
)
|
$
|
18,940
|
|
||||||
|
Net income (loss) per common share: (6)
|
|||||||||||||||||||||
|
Basic
|
$
|
0.82
|
|
$
|
0.88
|
|
$
|
0.41
|
|
—
|
|
—
|
|
||||||||
|
Diluted
|
0.80
|
|
0.85
|
|
0.40
|
|
—
|
|
—
|
|
|||||||||||
|
Weighted-average shares used in
|
|||||||||||||||||||||
|
computing net income (loss) per
|
|||||||||||||||||||||
|
common share (thousands) (6):
|
|||||||||||||||||||||
|
Basic
|
31,595
|
|
30,797
|
|
29,083
|
|
—
|
|
—
|
|
|||||||||||
|
Diluted
|
32,154
|
|
31,797
|
|
30,454
|
|
—
|
|
—
|
|
|||||||||||
|
Cash dividends per share
|
—
|
|
—
|
|
—
|
|
—
|
|
$
|
182.18
|
|
||||||||||
|
Other Financial and Operating Data:
|
|||||||||||||||||||||
|
Capital expenditures
|
3,367
|
|
$
|
6,264
|
|
$
|
8,883
|
|
$
|
1,799
|
|
$
|
1,587
|
|
|||||||
|
Backlog at end of period (7)
|
84,840
|
|
$
|
95,228
|
|
$
|
117,748
|
|
$
|
76,298
|
|
$
|
82,459
|
|
|||||||
22
|
Successor
|
Predecessor
|
|||||||||||||||||||
|
At March 31,
|
||||||||||||||||||||
|
2014
|
2013
|
2012
|
2011
|
2010
|
||||||||||||||||
|
(dollars in thousands)
|
||||||||||||||||||||
|
Balance Sheet Data:
|
||||||||||||||||||||
|
Cash and cash equivalents
|
$
|
72,640
|
|
$
|
43,847
|
|
$
|
21,468
|
|
$
|
51,266
|
|
$
|
30,147
|
|
|||||
|
Accounts receivable, net
|
52,578
|
|
56,123
|
|
50,037
|
|
40,013
|
|
41,882
|
|
||||||||||
|
Inventory, net
|
37,316
|
|
34,391
|
|
38,453
|
|
31,118
|
|
22,835
|
|
||||||||||
|
Total assets
|
442,459
|
|
435,523
|
|
425,579
|
|
451,032
|
|
221,116
|
|
||||||||||
|
Total debt
|
121,500
|
|
118,145
|
|
139,145
|
|
212,063
|
|
109,249
|
|
||||||||||
|
Total shareholders' equity
|
250,466
|
|
226,047
|
|
192,480
|
|
126,532
|
|
55,074
|
|
||||||||||
|
(1)
|
The closing of the CHS Transactions on April 30, 2010 established a new basis of accounting that primarily affected inventory, intangible assets, goodwill, taxes, debt and equity. This resulted in additional amortization expense, interest expense and tax expense for the period from May 1, 2010 through March 31, 2011 (“successor”) as compared to the period from April 1, 2010 through April 30, 2010 (“predecessor”). Except for purchase accounting adjustments, the results for the two combined periods are comparable. Therefore, we believe that combining the two periods into a single period for comparative purposes gives the most clarity for the users of this financial information. Please also refer to our historical consolidated financial statements and notes thereto for the fiscal year ended March 31, 2011 included in our fiscal 2011 annual report filed with the Securities and Exchange Commission, on June 20, 2011 for a separate presentation of the results for the predecessor and successor periods in accordance with U.S. generally accepted accounting principles (“GAAP”).
|
|
For the Period From May 1, 2010 Through March 31, 2011 (Successor)
|
For the Period from April 1, Through April 30 2010 (Predecessor)
|
Fiscal Year Ended March 31, 2011 (Predecessor/Successor Combined)
|
||||||||||
|
(dollars in thousands)
|
||||||||||||
|
Consolidated Statements of Operations Data:
|
||||||||||||
|
Sales
|
$
|
227,880
|
|
$
|
13,183
|
|
$
|
241,063
|
|
|||
|
Cost of sales
|
124,781
|
|
6,567
|
|
131,348
|
|
||||||
|
Purchase accounting non-cash adjustment
|
7,614
|
|
—
|
|
7,614
|
|
||||||
|
Gross profit
|
220,266
|
|
6,616
|
|
102,101
|
|
||||||
|
Marketing, general and administrative and engineering
|
54,630
|
|
4,263
|
|
58,893
|
|
||||||
|
Amortization of intangible assets
|
18,030
|
|
215
|
|
18,245
|
|
||||||
|
Income from operations
|
147,606
|
|
2,138
|
|
24,963
|
|
||||||
|
Interest income
|
42
|
|
7
|
|
49
|
|
||||||
|
Interest expense
|
(22,771
|
)
|
(6,229
|
)
|
(29,000
|
)
|
||||||
|
Loss on retirement of debt
|
(630
|
)
|
—
|
|
(630
|
)
|
||||||
|
Success fees to owners related to the CHS Transactions
|
(3,022
|
)
|
(4,716
|
)
|
(7,738
|
)
|
||||||
|
Other expense
|
(5,224
|
)
|
(8,901
|
)
|
(14,125
|
)
|
||||||
|
Loss before provision for income taxes
|
116,001
|
|
(17,701
|
)
|
(26,481
|
)
|
||||||
|
Income tax expense (benefit)
|
6,160
|
|
(17,434
|
)
|
(11,274
|
)
|
||||||
|
Net loss
|
$
|
109,841
|
|
$
|
(267
|
)
|
$
|
(15,207
|
)
|
|||
|
Statement of Cash Flows Data:
|
||||||||||||
|
Net cash used in:
|
||||||||||||
|
Capital expenditures
|
$
|
1,702
|
|
$
|
97
|
|
$
|
1,799
|
|
|||
23
|
(2)
|
In fiscal 2011, there was a non-cash negative impact of $7.6 million to cost of sales and, consequently, gross profit due to a purchase accounting adjustment related to the CHS Transactions.
|
|
(3)
|
Interest expense for fiscal 2014 included a $4.0 million acceleration of amortization on our deferred debt issuance costs related to the redemption of all $118.1 million of aggregate outstanding principal on our 9.5% senior secured notes and an additional $0.6 million of amortized deferred debt issuance costs. Interest expense for fiscal 2013 included a $2.3 million acceleration of the amortization of our deferred debt issuance costs due to partial redemptions of our senior secured notes and a refinancing of our prior revolving credit facility and $1.0 million of additional amortized deferred debt issuance costs. Interest expense for fiscal 2012 included a $3.1 million acceleration of the amortization of our deferred debt issuance costs due to certain partial redemptions of our senior secured notes and $1.0 million of additional amortized deferred debt issuance costs. Interest expense for fiscal 2011 of $29.0 million reflected in part increased interest expense on our senior secured notes issued in connection with the CHS Transactions. In addition, we recorded a $4.9 million acceleration of the amortization on our deferred debt issuance costs of the predecessor as well as $1.6 million of amortized deferred debt issuance costs related to the successor.
|
|
(4)
|
We paid fees to both the predecessor and successor owners related to the successful completion of the CHS Transactions. As related party transactions, they were reported separately from other CHS Transactions expenses included in other expense.
|
|
(5)
|
Other expense for fiscal 2011 of $14.1 million consisted primarily of $15.0 million of non-recurring expenses related to the CHS Transactions, partially offset by $0.6 million of income related to the reversal of our compliance reserve.
|
|
(6)
|
While we have presented net income per common share and weighted-average shares used in computing net income per common share for fiscal 2014, fiscal 2013 and fiscal 2012, we have not presented such information for the prior periods, as the capital structures of the predecessor and successor are substantially different, and the net income (loss) per share amounts and weighted-average shares used in computing net income (loss) per common share are therefore not comparable or meaningful. Please refer to our consolidated financial statements and notes thereto included in our fiscal 2011 annual report filed with the Securities and Exchange Commission on June 20, 2011 for a presentation of the net income (loss) per share and the weighted average shares outstanding for the predecessor periods.
|
|
(7)
|
Represents the future revenue attributable to signed, but unperformed, purchase orders that set forth specific revenue amounts at the end of the applicable period.
|
The following discussion should be read in conjunction with, and is qualified in its entirety by reference to, Item 6,
“
Selected Financial Data” and our consolidated financial statements and related notes included elsewhere in this annual report. The discussions in this section contain forward-looking statements that involve risks and uncertainties, including, but not limited to, those described in Item 1A,“Risk Factors.” Actual results could differ materially from those discussed below.
Overview
We are one of the largest providers of highly engineered thermal solutions for process industries. For 60 years, we have served a diverse base of thousands of customers around the world in attractive and growing markets, including energy, chemical processing and power generation. We are a global leader and one of the few thermal solutions providers with a global footprint and a full suite of products and services required to deliver comprehensive solutions to complex projects. We serve our customers locally through a global network of sales and service professionals and distributors in more than 30 countries and through our four manufacturing facilities on three continents. These global capabilities and longstanding relationships with some of the largest multinational energy, chemical processing, power and EPC companies in the world have enabled us to diversify our revenue streams and opportunistically access high growth markets worldwide. For
fiscal 2014
, approximately
67%
of our revenues were generated outside of the United States.
Revenue.
Our revenues are derived from providing customers with a full suite of innovative and reliable heat tracing solutions, including electric and steam heat tracing, tubing bundles, control systems, design optimization, engineering services and installation services. Our sales are primarily to industrial customers for petroleum and chemical plants, oil and gas
24
production facilities and power generation facilities. Demand for industrial heat tracing solutions falls into two categories: (i) new facility construction, which we refer to as Greenfield projects, and (ii) recurring maintenance, repair and operations and facility upgrades or expansions, which we refer to as MRO/UE. Greenfield construction projects often require comprehensive heat tracing solutions. We believe that Greenfield revenue consists of sales revenues by customer in excess of $1 million annually (excluding sales to resellers), and typically includes most orders for projects related to facilities that are new or that are built independent of existing facilities. We refer to sales revenues by customer of less than $1 million annually, which we believe are typically derived from MRO/UE, as MRO/UE revenue. Based on our experience, we believe that $1 million in annual sales is an appropriate threshold for distinguishing between Greenfield revenue and MRO/UE revenue. However, we often sell our products to intermediaries or subcontract our services; accordingly, we have limited visibility into how our products or services may ultimately be used and can provide no assurance that our categorization may accurately reflect the sources of such revenue. Furthermore, our customers do not typically enter into long-term forward maintenance contracts with us. In any given year, certain of our smaller Greenfield projects may generate less than $1 million in annual sales, and certain of our larger plant expansions or upgrades may generate in excess of $1 million in annual sales, though we believe that such exceptions are few in number and insignificant to our overall results of operations.
We believe that our pipeline of planned projects, in addition to our backlog of signed purchase orders, provides us with strong visibility into our future revenue, as historically we have experienced few order cancellations, and the cancellations that have occurred in the past have not been material compared to our total contract volume or total backlog. The small number of order cancellations is attributable in part to the fact that a large portion of our solutions are ordered and installed toward the end of Greenfield project construction. Our backlog at
March 31, 2014
was
$84.8
million, as compared to $95.2 million at March 31, 2013. The decline in backlog is mostly attributable to the progress and completion of several large Greenfield projects and a decrease in new order volume of the same magnitude. The timing of recognition of revenue out of backlog is not always certain, as it is subject to a variety of factors that may cause delays, many of which are beyond our control (such as customers' delivery schedules and levels of capital and maintenance expenditures). When delays occur, the recognition of revenue associated with the delayed project is likewise deferred.
Cost of sales.
Our cost of revenues includes primarily the cost of raw material items used in the manufacture of our products, cost of ancillary products that are sourced from external suppliers and construction labor cost. Additional costs of revenue include contract engineering cost directly associated to projects, direct labor cost, external sales commissions, and other costs associated with our manufacturing/fabrication shops. The other costs associated with our manufacturing/fabrication shops are mainly indirect production costs, including depreciation, indirect labor costs, and the costs of manufacturing support functions such as logistics and quality assurance. Key raw material costs include polymers, copper, stainless steel, insulating material, and other miscellaneous parts related to products manufactured or assembled as part of our heat tracing solutions. Historically, the costs of our primary raw materials have been stable and readily available from multiple suppliers, and we have been generally successful with passing along raw material cost increases to our customers. Therefore, increases in the cost of key raw materials of our products have not generally affected our gross margins. We cannot provide any assurance that we may be able to pass along such cost increases to our customers in the future, and if we are unable to do so, our results of operations may be adversely affected.
Operating expenses.
Our marketing, general and administrative and engineering expenses are primarily comprised of compensation and related costs for sales, marketing, pre-sales engineering and administrative personnel, as well as other sales related expenses and other costs related to research and development, insurance, professional fees, the global integrated business information system, provisions for bad debts and warranty expense.
Key drivers affecting our results of operations.
Our results of operations and financial condition are affected by numerous factors, including those described above under Item 1A, “Risk Factors” and elsewhere in this annual report and those described below:
Timing of Greenfield projects.
Our results of operations in recent years have been impacted by the various construction phases of large Greenfield projects. On very large projects, we are typically designated as the heat tracing provider of choice by the project owner. We then engage with multiple contractors to address incorporating various heat tracing solutions throughout the overall project. Our largest Greenfield projects may generate revenue for several quarters. In the early stages of a Greenfield project, our revenues are typically realized from the provision of engineering services. In the middle stages, or the material requirements phase, we typically experience the greatest demand for our heat tracing cable, at which point our revenues tend to accelerate. Revenues tend to decrease gradually in the final stages of a project and are generally derived from installation services and demand for electrical panels and other miscellaneous electronic components used in the final installation of heat tracing cable, which we frequently outsource from third-party manufacturers. Therefore, we
25
typically provide a mix of products and services during each phase of a Greenfield project, and our margins fluctuate accordingly.
Cyclicality of end-users' markets.
Demand for our products and services depends in large part upon the level of capital and maintenance expenditures of our customers and end users, in particular those in the energy, chemical processing and power generation industries, and firms that design and construct facilities for these industries. These customers' expenditures historically have been cyclical in nature and vulnerable to economic downturns. Greenfield projects, and in particular large Greenfield projects (
i.e.
, new facility construction projects generating in excess of $5 million in annual sales), have been a substantial source of revenue growth in recent years, and Greenfield revenues tend to be more cyclical than MRO/UE revenues. In recent years we have noted particular cyclicality in capital spending for new facilities in Asia, Eastern Europe and the Middle East. Revenues derived from Europe, including the Middle East, accounted for
21%
of our total revenues during each of
fiscal 2014
and
fiscal 2013
and revenues derived from the Asia region accounted for
12%
and
15%
of our total revenues during
fiscal 2014
and
fiscal 2013
, respectively. A sustained decrease in capital and maintenance spending or in new facility construction by our customers could have a material adverse effect on the demand for our products and services and our business, financial condition and results of operations.
Impact of product mix.
Typically, both Greenfield and MRO/UE customers require our products as well as our engineering and construction services. The level of service and construction needs will affect the profit margin for each type of revenue. We tend to experience lower margins from our design optimization, engineering, installation and maintenance services than we do from sales of our heating cable, tubing bundle and control system products. We also tend to experience lower margins from our outsourced products, such as electrical switch gears and transformers, than we do from our manufactured products. Accordingly, our results of operations are impacted by our mix of products and services.
We estimate that Greenfield and MRO/UE have each made the following contribution as a percentage of revenue in the periods listed:
|
Fiscal Year Ended March 31,
|
|||||||||
|
2014
|
2013
|
2012
|
|||||||
|
Greenfield
|
33
|
%
|
42
|
%
|
39
|
%
|
|||
|
MRO/UE
|
67
|
%
|
58
|
%
|
61
|
%
|
|||
We believe that our analysis of Greenfield and MRO/UE is an important measurement to explain the trends in our business to investors. Greenfield revenue is an indicator of both our ability to successfully compete for new contracts as well as the economic health of the industries we serve. Furthermore, Greenfield revenue is an indicator of potential MRO/UE revenue in future years.
For MRO/UE orders, the sale of our manufactured products typically represents a higher proportion of the overall revenues associated with such order than the provision of our services. Greenfield projects, on the other hand, require a higher level of our services than MRO/UE orders, and often require us to purchase materials from third party vendors. Therefore, we typically realize higher margins from MRO/UE revenues than Greenfield revenues.
Large and growing installed base.
Customers typically use the incumbent heat tracing provider for MRO/UE projects to avoid complications and compatibility problems associated with switching providers. Therefore, with the significant Greenfield activity we have experienced in recent years, our installed base has continued to grow, and we expect that such installed base will continue to generate ongoing high margin MRO/UE revenues. For fiscal 2014, MRO/UE sales comprised approximately
67%
of our consolidated revenues.
Seasonality of MRO/UE revenues.
Revenues realized from MRO/UE orders tend to be less cyclical than Greenfield projects and more consistent quarter over quarter, although MRO/UE revenues are impacted by seasonal factors. MRO/UE revenues are typically highest during the second and third fiscal quarters, as most of our customers perform preventative maintenance prior to the winter season.
26
Results of Operations
The following table sets forth data from our statements of operations as a percentage of sales for the periods indicated.
|
Fiscal Year Ended March 31,
|
|||||||||||||||||||||||
|
2014
|
2013
|
2012
|
|||||||||||||||||||||
|
(dollars in thousands)
|
|||||||||||||||||||||||
|
Consolidated Statements of Operations Data:
|
|||||||||||||||||||||||
|
Sales
|
$
|
277,323
|
|
100
|
%
|
$
|
284,036
|
|
100
|
%
|
$
|
272,323
|
|
100
|
%
|
||||||||
|
Cost of sales
|
142,153
|
|
51
|
%
|
151,204
|
|
53
|
|
140,208
|
|
51
|
|
|||||||||||
|
Gross profit
|
$
|
135,170
|
|
49
|
%
|
$
|
132,832
|
|
47
|
%
|
$
|
132,115
|
|
49
|
%
|
||||||||
|
Operating Expenses:
|
|||||||||||||||||||||||
|
Marketing, general, and
|
|||||||||||||||||||||||
|
administrative and engineering
|
65,463
|
|
24
|
%
|
64,633
|
|
23
|
%
|
76,280
|
|
28
|
%
|
|||||||||||
|
Amortization of intangible assets
|
11,090
|
|
4
|
|
11,211
|
|
4
|
|
11,379
|
|
4
|
|
|||||||||||
|
Income from operations
|
$
|
58,617
|
|
21
|
%
|
$
|
56,988
|
|
20
|
%
|
$
|
44,456
|
|
16
|
%
|
||||||||
|
Interest expense, net (1)
|
(9,773
|
)
|
(4
|
)
|
(15,113
|
)
|
(5
|
)
|
(19,462
|
)
|
(7
|
)
|
|||||||||||
|
Loss on redemption of debt
|
(15,485
|
)
|
(6
|
)
|
—
|
|
—
|
|
(3,825
|
)
|
(1
|
)
|
|||||||||||
|
Other expense
|
(596
|
)
|
—
|
|
(325
|
)
|
—
|
|
(1,671
|
)
|
(1
|
)
|
|||||||||||
|
Income before provision for income taxes
|
$
|
32,763
|
|
12
|
%
|
$
|
41,550
|
|
15
|
%
|
$
|
19,498
|
|
7
|
%
|
||||||||
|
Income tax expense
|
6,964
|
|
3
|
|
14,576
|
|
5
|
|
7,468
|
|
3
|
|
|||||||||||
|
Net income
|
$
|
25,799
|
|
9
|
%
|
$
|
26,974
|
|
9
|
%
|
$
|
12,030
|
|
4
|
%
|
||||||||
|
(1)
|
Interest expense for fiscal 2014 included a $4.0 million acceleration of the amortization of our deferred debt issuance costs as we redeemed all $118.1 million of aggregate outstanding principal on our 9.5% senior secured notes. During the period we incurred an additional $0.6 million of amortized deferred debt issuance costs. Interest expense for fiscal 2013 included a $2.3 million acceleration of the amortization of our deferred debt issuance costs due to partial redemptions of our senior secured notes and a refinancing of our prior revolving credit facility. $1.0 million of additional amortized deferred debt issuance costs were recorded in the period. Interest expense for fiscal 2012 included a $3.1 million acceleration of the amortization of our deferred debt issuance costs due to certain partial redemptions of our senior secured notes and $1.0 million of additional amortized deferred debt issuance costs.
|
Year Ended March 31, 2014 Compared to the Year Ended March 31, 2013
Revenues.
Revenues for
fiscal 2014
were
$277.3
million, compared to
$284.0
million for
fiscal 2013
, a decrease of
$6.7 million
, or
2.4%
. The decrease in revenue during
fiscal 2014
was mainly attributable to Greenfield revenues which declined $25.7 million or 22%. MRO/UE revenues, on the other hand increased $19.0 million or 12% as compared to fiscal 2013. We believe that the decline in Greenfield sales in fiscal 2014 is a reflection of strong comparative sales in fiscal 2013. The increase of MRO/UE revenue in fiscal 2014 is reflective of our significant installed base of customers who source our products during maintenance and upgrade activities.
In fiscal 2014, we experienced revenue growth of
$7.7 million
in the United States as compared to fiscal 2013. The increase in demand within the United States is largely attributable to upgrade efforts at refineries that are now processing heavy crude oil, from the Canadian oil sands region, which needs to be heated throughout the refining process, as well demand driven by the proliferation of hydraulic fracturing methods to extract natural gas. We experienced revenue declines in Canada and our Asia regions of
$6.2 million
and
$7.0 million
, respectively, as compared to fiscal 2013. In Canada, fiscal 2014 revenues generated from our largest Greenfield project declined $6.0 million from $30.6 million in fiscal 2013 to $24.6 million in fiscal 2014 due to the project being in its later stages when demand for our heat tracing products tends to diminish. Canadian revenues were also negatively impacted during fiscal 2014 by approximately $4.8 million due to the depreciation of the Canadian dollar relative to the U.S. dollar. Within our Asia region, we had several large Greenfield projects in fiscal 2013
27
whose revenues were not replaced in fiscal 2014. Revenues in our European region declined
$1.2 million
in fiscal 2014 largely due to overall economic weakness in the region experienced in the first quarter of fiscal 2014, offset in part by improved results in Europe for the remainder of fiscal 2014.
Gross profit and margin.
Gross profit totaled
$135.2
million in
fiscal 2014
, compared to
$132.8
million in
fiscal 2013
, an increase of $2.4 million, or
1.8%
. As a percentage of revenues, profit margin increased to
48.7%
in
fiscal 2014
from
46.8%
in
fiscal 2013
. This increase is attributable to the higher mix of MRO/UE sales during fiscal 2014 from which we typically realize higher gross margins than Greenfield sales. In addition, our fiscal 2013 Greenfield sales included two large projects that were competitively bid with comparatively lower margins and in turn reduced overall margins.
Marketing, general and administrative and engineering.
Marketing, general and administrative and engineering costs were
$65.5
million in
fiscal 2014
, compared to
$64.6
million in
fiscal 2013
, an increase of $0.9 million, or
1.3%
. As a percentage of total revenues, marketing, general and administrative and engineering costs were
23.6%
and
22.8%
in fiscal 2014 and 2013, respectively. In fiscal 2014, we switched vendors for our data communications and as a result incurred a $0.7 million increase in communication costs related to fees and duplicate services incurred during the transition. As of March 31, 2014, we had nearly completed the transition and do not expect to continue to incur such communication costs in fiscal 2015. Building expenses increased approximately $0.6 million as compared to fiscal 2013, as we relocated our Houston office to a larger and more updated facility. Stock compensation expense increased $0.9 million due to the full year effect of awards granted in August 2012 (fiscal 2013) and additional awards granted in fiscal 2014. The increases in data communications costs, building expenses and stock compensation expense were partially offset by a $1.5 million reduction in our personnel costs, which was driven by a decrease in our annual incentive expense of $3.0 million, as we did not meet the internal goals for the short term incentive plan established by our board of directors, offset in part by an increase in salaries, wages and benefit expense due to additional sales and engineering personnel.
Amortization of intangible assets.
Amortization of intangible assets was
$11.1
million in
fiscal 2014
, compared to
$11.2
million in
fiscal 2013
. The decrease is attributed to foreign currency translation adjustments. We expect fiscal 2014 and fiscal 2013 to be representative of our annual amortization expense for the foreseeable future.
Interest expense, net.
Interest expense and loss on redemptions of debt totaled
$25.3
million in
fiscal 2014
, compared to
$15.1
million in
fiscal 2013
, an increase of $10.2 million. In fiscal 2014 we redeemed all $118.1 million of the outstanding aggregate principal amount of our 9.5% senior secured notes. In connection with the redemption, we incurred acceleration of deferred debt issuance costs of $4.0 million and a loss on retirement of debt of $15.5 million, related to redemption premiums paid to the noteholders. In fiscal 2013, we made partial redemptions of our 9.5% senior secured notes with $21.0 million of aggregate principal being redeemed, and negotiated a new revolving credit facility. In connection with the fiscal 2013 bond redemptions and the termination of the previous revolving credit facility, we incurred acceleration of deferred debt issuance costs of $2.3 million. Interest expense on outstanding principal was $5.4 million and $11.9 million in fiscal 2014 and fiscal 2013, respectively. The decrease in interest on outstanding principal is due to the difference in the interest rate on our redeemed 9.5% senior secured notes and that of our term loan, which is fixed at approximately 3.62% as a result of our interest rate swap. We expect annual interest expense in fiscal 2015 to be approximately $4.2 million after accounting for scheduled principal reduction payments.
Other expense.
Other expense was
$0.6
million in
fiscal 2014
, compared to
$0.3
million in
fiscal 2013
, an increase of $0.3 million due mostly to increased losses on foreign currency exchange transactions in fiscal 2014. See Note 2, "Fair Value Measurements" to our consolidated financial statements included elsewhere in this annual report, for further discussion of our foreign currency exchange transactions.
Income taxes.
We reported an income tax expense of
$7.0
million in
fiscal 2014
, compared to
$14.6
million in
fiscal 2013
, a decrease of
$7.6 million
. Our effective tax rates were
21.3%
in
fiscal 2014
and
35.1%
in
fiscal 2013
, respectively.
During fiscal 2014, we concluded an income tax audit in the United States and, as a result, released certain liabilities for uncertain tax positions in the amount of $1.0 million. In addition, we received an income tax benefit of $0.6 million in fiscal 2014 related to estimated tax benefits that were determined not to be payable to the Predecessor owners. Excluding these discrete tax benefits, our effective tax rate in fiscal 2014 would hav
e been 25.5%. During fiscal 2014, we adopted a permanent reinvestment position on our foreign earned earnings. Accordingly, we no longer accrue incremental taxation for expected repatriation of earnings into the United States. As a result, our estimated tax rate was reduced from 35.0% to 25.5%, excluding discrete events. The decrease in income tax expense from fiscal 2013 is attributable to our reduced pre-tax net income, the
adoption of a permanent reinvestment position as well as the two aforementioned discrete events. See Note 14, "Income Taxes," to our consolidated financial statements, included elsewhere in this annual report, for further detail on income taxes.
28
Net income.
Net income was
$25.8
million in
fiscal 2014
as compared to
$27.0
million in
fiscal 2013
, a decrease of
$1.2 million
. In fiscal 2014, interest expense increased $10.2 million, which was attributable to increases in the acceleration of the amortization of our deferred debt issuance costs, as well as the loss on retirement of debt related to the redemption of our 9.5% senior secured notes. Marketing, general and administrative and engineering costs increased $0.9 million in fiscal 2014. These increases in expenses were offset by an increase in fiscal 2014 gross profit of $2.4 million and a decrease of income tax expense of
$7.6 million
in the same period. The increase in fiscal 2014 gross profit was due to higher gross profit as a percent of total revenues in fiscal 2014, primarily attributable to the increase in MRO/UE sales as a percentage of total revenues. The decrease of income tax expense is due to lower pre-tax net income in fiscal 2014, the adoption of a permanent reinvestment of foreign earnings position, and $1.6 million of income tax benefits from non-recurring discrete events.
Year Ended March 31, 2013 Compared to the Year Ended March 31, 2012
Revenues.
Revenues for fiscal 2013 were $284.0 million, compared to $272.3 million for fiscal 2012, an increase of $11.7 million, or 4%. During fiscal 2013, we experienced growth in both Greenfield and MRO/UE sales. In fiscal 2013, we experienced higher than usual Greenfield sales at approximately 42% of total revenue. In fiscal 2012, Greenfield sales contributed approximately 39% to total revenue, whereas MRO/UE sales contributed approximately 61%, which is more in line with our expected product mix based on historical results.
In fiscal 2013, we experienced growth of $16.3 million and $12.3 million in our Canada and Asia regions, respectively. We continued to see strong demand from customers in the Canadian oil sands region, as well as continued growth in our MRO/UE business as we grow our installed base. In Asia, our growth was driven by several large Greenfield jobs. In the United States, revenue declined $9.6 million in fiscal 2013 compared to fiscal 2012. The decline in the United States was attributable to a strong comparable year in fiscal 2012 when we experienced $5.0 million of unexpected revenue due to freeze protection initiatives after an unusually cold winter in the southern United States. Within Europe, our fiscal 2013 revenue decreased $7.2 million from fiscal 2012, which is primarily attributable to macroeconomic volatility in the region, as well as the depreciation of the Euro relative to the U.S. dollar in fiscal 2013.
We expect that revenue contributed from large Greenfield projects will fluctuate from period to period as construction schedules are inherently difficult to estimate. While our percentage of revenue from MRO/UE during fiscal 2013 was comparable to historical averages, we expect MRO/UE percentage to fluctuate as large project volume increases or decreases.
Gross profit and margin.
Gross profit totaled $132.8 million in fiscal 2013, compared to $132.1 million in fiscal 2012, an increase of $0.7 million, or 0.5%. As a percentage of revenues, profit margin decreased to 46.8% in fiscal 2013 from 48.5% in fiscal 2012. This decrease is attributable to the higher mix of Greenfield sales during fiscal 2013 as we typically realize higher margins from MRO/UE sales. Within our Greenfield sales in fiscal 2013, we had two large projects that were competitively bid and generated comparatively lower margins which in turn reduced overall margins.
Marketing, general and administrative and engineering.
Marketing, general and administrative and engineering costs were $64.6 million in fiscal 2013, compared to $76.3 million in fiscal 2012, a decrease of $11.7 million, or 15.3%. The decrease is primarily attributable to expenses incurred during fiscal 2012 related to our IPO. In connection with our IPO, $7.4 million was paid to our former private equity sponsors to terminate our management services agreement. Additionally, we incurred $6.1 million of stock compensation expense relating to the vesting of all outstanding stock options in connection with our IPO. These decreases were offset by increases in our salaries and benefits of approximately $3.4 million, which were primarily incurred to meet the needs of our growing sales and engineering operations. Excluding stock compensation and other expenses associated with our IPO, marketing, general and administrative and engineering expenses were 23% in both fiscal 2013 and fiscal 2012.
Amortization of intangible assets.
Amortization of intangible assets was $11.2 million in
fiscal 2014
, compared to $11.4 million in fiscal 2012, a decrease of $0.2 million. The decrease is attributed to foreign currency translation adjustments. We expect fiscal 2013 and fiscal 2012 to be representative of our annual amortization expense for the foreseeable future.
Interest expense, net.
Interest expense and loss on redemptions of debt totaled $15.1 million in fiscal 2013, compared to $23.3 million in fiscal 2012, a decrease of $8.2 million. In fiscal 2013 and fiscal 2012, we made redemptions on our senior notes totaling $21.0 million and $70.9 million, respectively. The decrease in our senior secured notes outstanding resulted in an approximate decrease of $3.6 million of interest expense during fiscal 2013. In connection with the senior note redemptions, we accelerated the amortization of our deferred debt issuance costs in the amounts of $0.9 million and $3.1 million in fiscal 2013 and fiscal 2012, respectively. In fiscal 2013, we refinanced our prior revolving credit facility and incurred $1.4 million in acceleration of deferred debt issuance costs. In fiscal 2012, we experienced a $3.8 million loss on retirement of debt related to early redemption premium payments on the senior notes.
29
Other expense.
Other expense was $0.3 million in fiscal 2013, compared to $1.7 million in fiscal 2012, a decrease in expense of $1.4 million due mostly to decreased losses on foreign exchange transactions in fiscal 2013. Other expense consisted primarily of losses on foreign exchange transactions and our use of foreign currency forward contracts which were $0.4 million and $1.6 million in fiscal 2013 and 2012, respectively.
Income taxes.
We reported an income tax expense of $14.6 million in fiscal 2013, compared to $7.5 million in fiscal 2012, an increase of $7.1 million due to an increase of $22.1 million of taxable income in fiscal 2013. Our effective tax rates were 35.1% in fiscal 2013 and 38.3% in fiscal 2012, respectively.
We have subsidiaries in multiple foreign locations and the statutory income tax rate in many of our foreign subsidiaries is lower than the U.S. federal rate of 35%. To the extent that we expect to repatriate dividends from these subsidiaries, we are required to accrue the estimated incremental U.S. tax in anticipation of the foreign dividends being repatriated. The accrual for these estimated taxes results in an effective tax rate which is nearly the same as the U.S. federal statutory rate plus state and other miscellaneous taxes. In fiscal 2012, our effective tax rate was higher due to the permanent tax effect of items related to our IPO such as the accelerated vesting of stock options. Some of the accelerated stock options had been granted to employees in foreign jurisdictions in which there is no tax deduction for stock compensation expense. See also Note 14, “Income Taxes” to our consolidated financial statements included elsewhere in this annual report.
Net income.
Net income was $27.0 million in fiscal 2013 as compared to $12.0 million in fiscal 2012, an increase of $15.0 million. In connection with our IPO, during fiscal 2012 we incurred $13.5 million of expenses related to the termination of our management services agreement and the acceleration of stock compensation expenses. Expenses related to our debt redemptions and refinancing of our prior revolving credit facility and the decrease in interest expense on our senior secured notes resulted in a decrease in interest expenses of $8.2 million in fiscal 2013. These decreases in expenses were partially offset by an increase of $7.1 million in income taxes as a result of a $22.1 million increase in pre-tax income in fiscal 2013.
Contractual Obligations and Contingencies
Contractual Obligations.
The following table summarizes our significant contractual payment obligations as of
March 31, 2014
and the effect such obligations are expected to have on our liquidity position assuming all obligations reach maturity.
|
Payment Due By Period
|
|||||||||||||||||||||
|
Total
|
Less than 1 Year
|
1-3 Years
|
3-5 Years
|
More than 5 Years
|
|||||||||||||||||
|
(dollars in thousands)
|
|||||||||||||||||||||
|
Variable rate term loan (1)
|
$
|
121,500
|
|
$
|
13,500
|
|
$
|
33,750
|
|
$
|
74,250
|
|
$
|
—
|
|
||||||
|
Interest payments on variable rate term loan (2)
|
13,597
|
|
4,233
|
|
6,876
|
|
2,488
|
|
—
|
|
|||||||||||
|
Operating lease obligations (3)
|
9,219
|
|
2,940
|
|
3,665
|
|
1,161
|
|
1,453
|
|
|||||||||||
|
Obligations in settlement of the CHS Transaction (4)
|
567
|
|
567
|
|
—
|
|
—
|
|
—
|
|
|||||||||||
|
Information technology services agreements (5)
|
3,161
|
|
2,110
|
|
1,051
|
|
—
|
|
—
|
|
|||||||||||
|
Total
|
$
|
148,044
|
|
$
|
23,350
|
|
$
|
45,342
|
|
$
|
77,899
|
|
$
|
1,453
|
|
||||||
|
(1)
|
Consists of monthly principal payments of $1.125 million through March 31, 2016; increasing in April 2016 to $1.668 million through maturity with a lump-sum payment of $54.0 million due in April 2018.
|
(2) Consist of estimated future interest payments at an interest rate of 3.62%, based on our interest rate swap agreement.
|
(3)
|
We enter into operating leases in the normal course of business. Our operating leases include the leases on certain of our manufacturing and warehouse facilities, in addition to certain offices of our affiliates.
|
|
(4)
|
Consists of estimated amounts owed to sellers in the CHS Transactions for restricted cash in satisfaction of the post-closing adjustment for the remaining encumbered cash to be released as letters of credit expire.
|
|
(5)
|
Represents the future annual service fees associated with certain information technology service agreements with several vendors.
|
30
Contingencies.
We are involved in various legal and administrative proceedings that arise from time to time in the ordinary course of doing business. Some of these proceedings may result in fines, penalties or judgments being assessed against us, which may adversely affect our financial results. In addition, from time to time, the Company is involved in various disputes, which may or may not be settled prior to legal proceedings being instituted and which may result in losses in excess of accrued liabilities, if any, relating to such unresolved disputes. As of March 31, 2014, management believes that adequate reserves have been established for any probable losses. Expenses related to litigation reduce operating income. We do not believe that the outcome of any of these proceedings or disputes would have a significant adverse effect on our financial position, long-term results of operations, or cash flows. It is possible, however, that charges related to these matters could be significant to our results of operations or cash flows in any one accounting period.
The Company has no outstanding legal matters outside of matters arising in the ordinary course of business, except as described below. We can give no assurances we will prevail in any of these matters.
Notice of Tax Dispute with the Canada Revenue Agency
.
On June 13, 2011, we received notice from the Canada Revenue Agency, which we refer to as the "Agency," advising us that they disagree with the tax treatment we proposed with respect to certain asset transfers that were completed in August 2007 by our predecessor owners. During fiscal 2013, we were informed by the Agency that their initial audit was concluded but they intended to make an assessment under Canada's General Anti Avoidance Rule. Under this rule, the Agency may assess a withholding tax on dividends deemed to have been made on loans made to our Canadian subsidiary during 2007. Such assessment could total $3.0 million plus penalties and interest. At March 31, 2014, we have not recorded a tax liability reserve due for this matter with the Agency as we consider it more likely than not that our tax position will be fully sustained. While we intend to vigorously contest any assessment the Agency may make against us in this matter, we expect that any liability will be covered under an indemnity agreement with the predecessor owners.
Russia Tax Audit
.
Our income tax returns in Russia for the three years ended December 31, 2012 are subject to ongoing audits with the Russian tax authority. As of March 31, 2014, we were issued an assessment by the Russian tax authority for which we will file an objection. As of March 31, 2014, we have accrued a
$0.2
million tax obligation, related to this matter, in our consolidated financial statements for the amount we believe to be payable to the Russian tax authority.
Other than the items noted above, there are no other gains or losses or litigation settlements that are not provided for in the accounts.
To bid on or secure certain contracts, we are required at times to provide a performance guaranty to our customers in the form of a surety bond, standby letter of credit or foreign bank guaranty. On
March 31, 2014
, we had in place standby letters of credit, bank guarantees and performance bonds totaling
$13.3
million to back our various customer contracts. Our Indian subsidiary also has
$4.0
million in customs bonds outstanding.
Liquidity and Capital Resources
Our primary sources of liquidity are cash flows from operations and funds available under our revolving credit facility and other revolving lines of credit. Our primary liquidity needs are to finance our working capital, capital expenditures and debt service needs. On May 20, 2013, we completed a $118.1 million redemption of all of our outstanding senior secured notes. In connection with the redemption, we entered into a five year $135.0 million variable rate term loan and subsequently an interest rate swap agreement that fixed our interest rate at 3.62%. At March 31, 2014, outstanding principal on the variable rate term loan was
$121.5
million. As a result of the redemption of our senior secured notes and refinancing our senior secured credit facility we reduced our annual interest expense on outstanding principal by approximately $6.5 million in fiscal 2014.
Cash and cash equivalents.
At
March 31, 2014
, we had
$72.6
million in cash and cash equivalents. We maintain cash and cash equivalents at various financial institutions located in many countries throughout the world. Approximately
$23.4 million
, or
32%
, of these amounts were held in domestic accounts with various institutions and approximately
$49.2 million
, or
68%
, of these amounts were held in accounts outside of the United States with various financial institutions.
Senior secured credit facility.
On April 19, 2013, we entered into an amended and restated credit agreement with a group of lenders in the United States and Canada with JP Morgan Chase Bank, N.A. continuing to serve as lead administrative agent, which provided for (i) a five-year $135.0 million senior secured term loan facility and (ii) a five-year $60.0 million senior secured revolving credit
31
facility, which we refer to collectively as our "credit facility". The term loan borrowings were used to redeem our outstanding senior secured notes, see "senior secured notes and refinancing under a term loan" below.
Under our credit facility, in no case shall availability exceed commitments thereunder. The credit facility will mature in April 2018. Any credit facility borrowings will bear interest, at our option, at a rate equal to either (i) a base rate determined by reference to the greatest of (a) JPMorgan Chase Bank's prime rate in New York City, (b) the federal funds effective rate in effect on such day plus ½ of 1% and (c) the adjusted LIBOR rate for a one month interest period on such day plus 1%, in each case plus an applicable margin dictated by our leverage ratio, or (ii) the LIBOR rate, plus an applicable margin dictated by our leverage ratio. Borrowings denominated in Canadian Dollars under the Canadian sub-facility bear interest at our option, at a rate equal to either (i) a base rate determined by reference to the greater of (a) JPMorgan Chase Bank, Toronto branch's prime rate and (b) the sum of (x) the yearly interest rate to which the one-month Canadian deposit offered rate is equivalent plus (y) 1.0%, in each case plus an applicable margin dictated by our leverage ratio, or (ii) a Canadian deposit offered rate determined by the sum of (a) the annual rate of interest determined with reference to the arithmetic average of the discount rate quotations of all institutions listed in respect of the relevant period for Canadian dollar-denominated bankers' acceptances plus (b) 0.10% per annum, plus an applicable margin dictated by our leverage ratio. In addition to paying interest on outstanding borrowings under our credit facility, we are currently required to pay a 0.4% per annum commitment fee to the lenders in respect of the unutilized commitments thereunder, which commitment fee could change based on our leverage ratio, and letter of credit fees equal to the LIBOR margin or the Canadian deposit offered rate, as applicable, on the undrawn amount of all outstanding letters of credit, in addition to a 0.125% annual fronting fee. At March 31, 2014, we had no outstanding borrowings under our revolving credit facility. If there had been any outstanding borrowings thereunder, the interest rate would have been approximately
2.69%
. As of March 31, 2014, we had
$59.1 million
of capacity available under our revolving credit facility after taking into account outstanding letters of credit. The variable rate term loan bears interest at the LIBOR rate plus an applicable margin dictated by our leverage ratio. As of
March 31, 2014
, our interest rate was approximately
2.69%
. The term loan includes monthly principal payments of $1.1 million through March 31, 2016, increasing in April 2016 to $1.7 million through maturity, with a lump-sum payment of $54.0 million in April 2018.
Senior secured notes and refinancing under a term loan
.
On May 20, 2013, we utilized the proceeds from our new variable rate term loan to redeem the remaining $118.1 million of aggregate principal amount outstanding of our 9.5% senior secured notes. In conjunction with the redemption, we paid a total of $15.5 million in redemption premiums and expensed the remaining $4.0 million of associated deferred debt issuance costs.
Interest rate swap.
On June 13, 2013, the Company entered into an interest rate swap to reduce the exposure to interest rate fluctuations associated with its variable rate term loan. Under the agreement we will pay a fixed amount and receive payments based on a variable interest rate. The swap became effective as of July 31, 2013 and fixed the interest rate of the term loan at 3.62%. As of March 31, 2014, have hedged 100% of the future interest payments on our variable rate term loan through its maturity.
Guarantees; security.
The obligations under our credit facility are guaranteed on a senior secured basis by each of our existing and future domestic restricted subsidiaries, including Thermon Industries, Inc., the U.S. borrower under our credit facility. The obligations under our credit facility are secured by a first priority perfected security interest in substantially all of our assets, subject to certain exceptions, permitted liens and encumbrances reasonably acceptable to the administrative agent under our credit facility.
Restrictive covenants.
The credit facility contains various restrictive covenants that, among other things, restrict, subject to certain negotiated exceptions, our ability to: incur additional indebtedness or issue disqualified capital stock unless certain financial tests are satisfied; pay dividends, redeem subordinated debt or make other restricted payments; make certain investments or acquisitions; issue stock of subsidiaries; grant or permit certain liens on our assets; enter into certain transactions with affiliates; merge, consolidate or transfer substantially all of our assets; incur dividend or other payment restrictions affecting certain of our subsidiaries; transfer or sell assets, including capital stock of our subsidiaries; and change the business we conduct.
Repatriation considerations.
A substantial portion of our cash flows are generated by our non-U.S. subsidiaries. In general, when an entity in a foreign jurisdiction repatriates cash to the United States, the amount of such cash is treated as a dividend taxable at current U.S. tax rates. Accordingly, upon the distribution of cash to us from our non-U.S. subsidiaries, we will be subject to U.S. income taxes. Although foreign tax credits may be available to reduce the amount of the additional tax liability, these credits may be limited based on our tax attributes.
During the first quarter of fiscal 2014 and following the redemption of our senior secured notes, we estimated that domestic U.S. cash flow will be able to service our future debt service obligations and therefore we adopted a permanent reinvestment position whereby we expect to permanently reinvest our foreign earnings for most of our foreign subsidiaries and
32
do not expect to repatriate future earnings generated by our foreign operations. As a result of this policy change, we will no longer accrue a tax liability in anticipation of future dividends from our foreign subsidiaries. If we were to repatriate foreign earnings, we would incur additional income tax expense. This policy change resulted in the decrease in our effective tax rate from 35.1% of pretax income in fiscal 2013 to an effective rate of approximately 25.5%, before discrete events for fiscal 2014.
Future capital requirements.
Based on our current level of operations, we believe that cash flow from operations and available cash, together with available borrowings under our credit facility, will be adequate to meet our liquidity needs for the next 12 months. We cannot assure you, however, that our business will generate sufficient cash flow from operations or that future borrowing will be available to us in an amount sufficient to enable us to service our indebtedness, including our credit facility borrowings, or to fund our other liquidity needs. In addition, upon the occurrence of certain events, such as a change of control, we could be required to repay or refinance our indebtedness. We cannot assure you that we will be able to refinance any of our indebtedness, including our credit facility, on commercially reasonable terms or at all.
In
fiscal 2014
, we invested
$3.4 million
in capital expenditures, of which $0.8 million related to the development of a new heat tracing design software solution, $0.4 million related to a disaster recovery solution, and $0.2 million related to building improvements at our main manufacturing campus. The remaining $2.0 million represents our annual expected investments in technology, furniture and fixture replacements, and capital maintenance. Going forward, we expect to invest approximately $9.0 million in fiscal 2015, including $4.8 million of investments related to the expansion of our tube bundle manufacturing facility and our main warehouse in San Marcos, Texas and between $1.5 million and $2.5 million in capital equipment related to the expanded manufacturing facilities. We expect that the expansion of our tube bundle manufacturing facility will enable us to use more efficient high-speed equipment, increase our manufacturing footprint by approximately 8,000 square feet, and increase our manufacturing capacity by approximately 80%. We currently expect this expansion, when operating at full capacity, to support our anticipated sales growth for the next five years. Approximately $0.5 million of our budget is dedicated to an upgrade to a new version of our existing enterprise resource planning software with the remainder being utilized to address general capital maintenance needs.
Year Ended March 31, 2014 Compared to the Year Ended March 31, 2013
Net cash provided by operating activities
totaled
$46.1
million for
fiscal 2014
compared to
$41.4
million for
fiscal 2013
, an
increase
of
$4.7
million. Our net income decreased from
$27.0
million in
fiscal 2013
to
$25.8
million in
fiscal 2014
. The decrease in net income is primarily attributable to
$15.5
million in redemption premiums paid for the redemption of our senior secured notes, offset by a decrease in interest expense on outstanding principal of $6.5 million and a reduction of our income tax expense of
$7.6
million. Non-cash reconciling items such as depreciation and amortization, amortization of debt issuance costs, compensation expense and changes in deferred taxes amounted to a source of cash of
$16.5
million and
$16.6
million in fiscal 2014 and fiscal 2013, respectively. In fiscal 2014, decreases in accounts receivable resulted in a source of cash of
$2.9
million compared to a use of cash of
$7.1
million in fiscal 2013, an improvement of
$10.0
million. In fiscal 2014, our inventory grew representing a use of cash of
$3.5 million
compared to fiscal 2013 when our inventory declined representing a source of cash of
$3.4
million. The growth in our inventory in fiscal 2014 is primarily attributable to project and order delays that occurred at the end of the period. Our accounts payable and accrued liabilities in fiscal 2014 represented a use of cash of
$14.2
million compared to a source of cash of
$1.5
million in fiscal 2013, representing a comparative decrease of
$15.8
million. Our accrued liabilities decreased $4.7 million due to the fact we currently pay interest on our long term debt monthly whereas in fiscal 2013 we paid interest semi-annually at a higher interest rate. Additionally, our annual incentive accrual was reduced $2.9 million in fiscal 2014 compared to fiscal 2013. The comparative change in our income tax payable balance represented a comparative source of cash of
$0.5
million in fiscal 2014.
Net cash used in investing activities
totaled
$5.4
million for
fiscal 2014
compared to
$6.6
million for
fiscal 2013
, a decrease of $1.2 million. In fiscal 2014 and fiscal 2013, we spent
$3.4
million and
$6.3
million, respectively, to purchase property, plant and equipment. The decrease of $2.9 million is primarily attributable to expenditures in fiscal 2013 to improve our manufacturing facilities. In fiscal 2014 we paid
$2.1
million to our Predecessor owners primarily related to a tax refund that we received in fiscal 2014 relating to prior tax years when the Predecessor owners were in control. In fiscal 2013 we paid
$0.3
million to our Predecessor owners related to the release of certain restricted cash balances from the CHS Transactions.
Net cash used in financing activities
totaled
$10.6
million in
fiscal 2014
, compared to
$12.2
million for fiscal 2013. In fiscal 2014, we redeemed all of the outstanding aggregate principal amount of our 9.5% senior secured notes representing a use of cash of
$118.1
million. In connection with the redemption we paid
$15.5
million in prepayment redemption premiums. In fiscal 2014, we entered into a term loan agreement whereby we received
$135.0
million in proceeds and incurred
$1.7
million of debt issuance costs. During fiscal 2014 we made principal payments on our term loan totaling
$13.5
million. In fiscal 2013, redemption and premiums paid on redemption of our 9.5% senior secured notes represented a use of cash of
$21.6
33
million. Stock option exercises and our associated tax benefit represented a source of cash of
$3.2
million in fiscal 2014 compared to
$9.7
million in fiscal 2013.
Year Ended March 31, 2013 Compared to the Year Ended March 31, 2012
Net cash provided by operating activities
totaled $41.4 million for fiscal 2013 compared to $3.1 million for fiscal 2012, an increase of $38.3 million. Our net income increased from $12.0 million in fiscal 2012 to $27.0 million in fiscal 2013, an increase of $15.0 million. In fiscal 2013, increases in accounts receivable resulted in a use of cash of $7.1 million compared to a use of cash of $11.4 million in fiscal 2012, an improvement of $4.3 million. In fiscal 2013, our inventories declined and thereby generated cash of $3.4 million compared to fiscal 2012 when our inventory grew in preparation for a temporary shutdown as we moved into our new manufacturing facility. Improvement in our accounts receivable are attributed to the timing and collection of our billings. Our accounts payable and accrued liabilities in fiscal 2013 were a source of cash of $1.5 million compared to a use of cash of $4.8 million in fiscal 2012, an improvement of $6.3 million.
Net cash used in investing activities
totaled $6.6 million for fiscal 2013 compared to $9.6 million for fiscal 2012, a decrease of $3.0 million. The decrease is primarily attributable to expenditures to improve our manufacturing facilities. In fiscal 2012, we incurred $5.8 million of expenses for our new manufacturing facility, where in fiscal 2013 we only invested $2.1 million on facility enhancements as we completed the project.
Net cash used in financing activities
totaled $12.2 million in fiscal 2013, compared to $22.7 million used in financing activities for fiscal 2012. In fiscal 2012, we received net proceeds on our IPO of $48.5 million. From a combination of IPO proceeds and cash on hand, we redeemed $70.9 million in aggregate principal amount of our senior secured notes for a use of cash totaling $74.7 million including cash premiums paid. In fiscal 2013, redemption and premiums paid on redemption of our senior secured notes were a use of cash of $21.6 million. Stock option exercises and our associated tax benefit were a source of cash of $9.7 million in fiscal 2013 compared to $5.6 million in fiscal 2012.
Off-Balance Sheet Arrangements
We do not have any off balance sheet arrangements. In addition, we do not have any interest in entities referred to as variable interest entities, which include special purpose entities and other structured finance entities.
Effect of Inflation
While inflationary increases in certain input costs, such as wages, have an impact on our operating results, inflation has had minimal net impact on our operating results during the last three years, as overall inflation has been offset by increased selling prices and cost reduction actions. We cannot assure you, however, that we will not be affected by general inflation in the future.
Seasonality
Our quarterly revenues are impacted by the level of large Greenfield projects that may be occurring at any given time. Demand for our products depends in large part upon the level of capital and maintenance expenditures by many of our customers and end users, in particular those customers in the oil and gas, refining, and chemical processing markets. These customers' expenditures historically have been cyclical in nature and vulnerable to economic downturns.
Our operating expenses remain relatively consistent with some variability related to overall headcount of the Company.
Our quarterly operating results may fluctuate based on the cyclical pattern of industries to which we provide heat tracing solutions and the seasonality of MRO/UE demand for our products. Most of our customers perform preventative maintenance prior to the winter season, thus in our experience typically making our second and third quarters the largest for MRO/UE revenue. However, revenues from Greenfield projects are not seasonal and tend to be level throughout the year, depending on the capital spending environment. Overall, seasonality does not have a material effect on our business.
Critical Accounting Policies and Estimates
The preparation of our financial statements in accordance with GAAP requires us to make estimates and assumptions that affect the reported amounts of assets, liabilities, revenues, expenses and related disclosures of contingent assets and liabilities. We base our estimates on past experience and other assumptions that we believe are reasonable under the
34
circumstances, and we evaluate these estimates on an ongoing basis. Our critical accounting policies are those that materially affect our financial statements and involve difficult, subjective or complex judgments by management. Our most significant financial statement estimates include revenue recognition, allowances for bad debts, warranty reserves, inventory reserves and potential litigation claims and settlements.
Although these estimates are based on management's best knowledge of current events and actions that may impact the Company in the future, actual results may be materially different from the estimates.
Revenue recognition
.
Revenues from sales of products are recognized when persuasive evidence of an agreement exists, delivery of the product has occurred, the fee is fixed or determinable, and collectability is probable.
On average, less than 20% of our annual revenues are derived from the installation of heat tracing solutions for which we apply construction-type accounting. These construction-related contracts are awarded on a competitive bid and negotiated basis. We offer our customers a range of contracting options, including cost-reimbursable, fixed-price and hybrid, which has both cost-reimbursable and fixed-price characteristics. Most of our construction contract revenue is recognized using either the percentage-of-completion method, based on the percentage that actual costs-to-date bear to total estimated costs to complete each contract or as it relates to cost-reimbursable projects, revenue is recognized as work is performed. We follow the guidance of FASB ASC Revenue Recognition Topic 605-35 for accounting policies relating to our use of the percentage-of-completion method, estimating costs and revenue recognition, including the recognition of profit incentives, unapproved change orders and claims and combining and segmenting contracts. We utilize the cost-to-cost approach to measure the extent of progress toward completion, as we believe this method is less subjective than relying on assessments of physical progress. Under the cost-to-cost approach, the use of total estimated cost to complete each contract is a significant variable in the process of determining recognized revenue and is a significant factor in the accounting for contracts. Significant estimates that impact the cost to complete each contract are costs of engineering, materials, components, equipment, labor and subcontracts; labor productivity; schedule durations, including subcontract and supplier progress; liquidated damages; contract disputes, including claims; achievement of contractual performance requirements; and contingency, among others. The cumulative impact of revisions in total cost estimates as contracts progress is reflected in the period in which these changes become known, including the recognition of any losses expected to be incurred on contracts in progress. Due to the various estimates inherent in our construction contract accounting, actual results could differ from those estimates. Our historical construction contract cost estimates have generally been accurate, and management does not believe that there is a reasonable likelihood that there will be a material change in future estimates or the methodology used to calculate these estimates.
Sales which are not accounted for under ASC 605-35 may have multiple elements, including heat tracing product, engineering and “field” services such as inspection, repair and/or training. We assess such revenue arrangements to determine the appropriate units of accounting. Each deliverable provided under multiple-element arrangements is considered a separate unit of accounting. Revenues associated with the sale of a product are recognized upon delivery, while the revenue for engineering and field services are recognized as services are rendered, limited to the amount of consideration which is not contingent upon the successful provision of future products or services under the arrangement. Amounts assigned to each unit of accounting are based on an allocation of total arrangement consideration using a hierarchy of estimated selling price for the deliverables. The selling price used for each deliverable will be based on Vendor Specific Objective Evidence (“VSOE”), if available, Third Party Evidence (“TPE”), if VSOE is not available, or estimated selling price, if neither VSOE nor TPE is available.
Estimating allowances, specifically the allowance for doubtful accounts and the adjustment for excess and obsolete inventories.
The Company's receivables are recorded at cost when earned and represent claims against third parties that will be settled in cash. The carrying value of the Company's receivables, net of allowance for doubtful accounts, represents their estimated net realizable value. If events or changes in circumstances indicate specific receivable balances may be impaired, further consideration is given to the Company's ability to collect those balances and the allowance is adjusted accordingly. The Company has established an allowance for doubtful accounts based upon an analysis of aged receivables. Past-due receivable balances are written-off when the Company's internal collection efforts have been unsuccessful in collecting the amounts due.
The Company's primary base of customers operates in the oil, chemical processing and power generation industries. Although the Company has a concentration of credit risk within these industries, the Company has not experienced significant collection losses on sales to these customers. The Company's foreign receivables are not concentrated within any one geographic region nor are they subject to any current economic conditions that would subject the Company to unusual risk. The Company does not generally require collateral or other security from customers.
We perform credit evaluations of new customers and sometimes require deposits, prepayments or use of trade letters of credit to mitigate our credit risk. Allowance for doubtful account balances are
$0.8
million and
$1.1 million
as of
March 31,
35
2014
and
2013
, respectively. Although we have fully provided for these balances, we continue to pursue collection of these receivables.
We write down our inventory for estimated excess or obsolete inventory equal to the difference between the cost of inventory and estimated fair market value based on assumptions of future demand and market conditions. Fair market value is determined quarterly by comparing inventory levels of individual products and components to historical usage rates, current backlog and estimated future sales and by analyzing the age and potential applications of inventory, in order to identify specific products and components of inventory that are judged unlikely to be sold. Our finished goods inventory consists primarily of completed electrical cable that has been manufactured for various heat tracing solutions. Most of our manufactured product offerings are built to industry standard specifications that have general purpose applications and therefore are sold to a variety of customers in various industries. Some of our products, such as custom orders and ancillary components outsourced from third-party manufacturers, have more specific applications and therefore may be at a higher risk of inventory obsolescence. Inventory is written-off in the period in which the disposal occurs. Actual future write-offs of inventory for salability and obsolescence reasons may differ from estimates and calculations used to determine valuation allowances due to changes in customer demand, customer negotiations, product application, technology shifts and other factors. Our allowance for excess and obsolete inventories was
$0.9
million and
$1.1
million at both
March 31, 2014
and
2013
, respectively. Historically, inventory obsolescence and potential excess cost adjustments have been within our expectations, and management does not believe that there is a reasonable likelihood that there will be a material change in future estimates or assumptions used to calculate the inventory valuation reserves.
Significant judgments and estimates must be made and used in connection with establishing these allowances. If our assumptions used to calculate these allowances do not agree with our future ability to collect outstanding receivables, actual demand for our inventory, or the number of products and installations returned under warranty, additional provisions may be needed and our future results of operations could be adversely affected.
Valuation of long-lived, goodwill and other intangible assets.
We evaluate goodwill for impairment annually during the fourth quarter of our fiscal year, or more frequently when indicators of impairment are present. We operate as a single report
able
segment with four geographic reporting units, each of which are assessed. We perform a qualitative analysis to determine whether it is more likely than not that the fair value of goodwill is less than its carrying amount. Some of the impairment indicators we consider include significant differences between the carrying amount and the estimated fair value of our assets and liabilities; macroeconomic conditions such as a deterioration in general economic condition or limitations on accessing capital; industry and market considerations such as a deterioration in the environment in which we operate and an increased competitive environment; cost factors such as increases in raw materials, labor, or other costs that have a negative effect on earnings and cash flows; overall financial performance such as negative or declining cash flows or a decline in actual or planned revenue or earnings compared with actual and projected results of relevant prior periods; other relevant events such as litigation, changes in management, key personnel, strategy or customers; the testing for recoverability of our long-lived assets; and a potential decrease in share price. We evaluate the significance of identified events and circumstances on the basis of the weight of evidence along with how they could affect the relationship between the reporting unit's fair value and carrying amount, including positive mitigating events and circumstances. If we determine it is more likely than not that the fair value of goodwill is less than its carrying amount, then a second step is performed to quantify the amount of goodwill impairment. If impairment is indicated, a goodwill impairment charge is recorded to write the goodwill down to its implied fair value.
The Company determined that no impairment of goodwill existed during fiscal
2014
and fiscal
2013
.
Other intangible assets include indefinite lived intangible assets for which we must also perform an annual test of impairment. The Company's indefinite lived intangible assets consist primarily of trademarks. The fair value of the Company's trademarks is calculated using a “relief from royalty payments” methodology. This approach involves first estimating reasonable royalty rates for each trademark, then applying these royalty rates to a net sales stream and discounting the resulting cash flows to determine the fair value. The royalty rate is estimated using both a market and income approach. The market approach relies on the existence of identifiable transactions in the marketplace involving the licensing of trademarks similar to those owned by the Company. The income approach uses a projected pretax profitability rate relevant to the licensed income stream. We believe the use of multiple valuation techniques results in a more accurate indicator of the fair value of each trademark. This fair value is then compared with the carrying value of each trademark. The results of this test during the fourth quarter of our fiscal year indicated that there was no impairment of our indefinite life intangible assets during fiscal
2014
or
2013
.
Accounting for income taxes.
We account for income taxes under the asset and liability method that requires the recognition of deferred tax assets and liabilities for the expected future tax consequences of events that have been recognized in our financial statements or tax returns. Judgment is required in assessing the future tax consequences of events that have been
36
recognized in our financial statements or tax returns. Variations in the actual outcome of these future tax consequences could materially impact our financial position, results of operations or effective tax rate.
Significant judgment is required in determining our worldwide income tax provision. In the ordinary course of a global business, there are many transactions and calculations where the ultimate tax outcome is uncertain. Some of these uncertainties arise as a consequence of revenue sharing and cost reimbursement arrangements among related entities, the process of identifying items of revenues and expenses that qualify for preferential tax treatment, and segregation of foreign and domestic earnings and expenses to avoid double taxation. Although we believe that our estimates are reasonable, the final tax outcome of these matters could be different from that which is reflected in our historical income tax provisions and accruals. Such differences could have a material effect on our income tax provision and net income in the period in which such determination is made.
In estimating future tax consequences, all expected future events are considered other than enactments of changes in tax laws or rates. Valuation allowances are established when necessary to reduce deferred tax assets to amounts which are more likely than not to be realized. We consider future growth, forecasted earnings, future taxable income, the mix of earnings in the jurisdictions in which we operate, historical earnings, taxable income in prior years, if carryback is permitted under the law, and prudent and feasible tax planning strategies in determining the need for a valuation allowance. In the event we were to determine that we would not be able to realize all or part of our net deferred tax assets in the future, an adjustment to the deferred tax assets valuation allowance would be charged to earnings in the period in which we make such a determination, or goodwill would be adjusted at our final determination of the valuation allowance related to an acquisition within the measurement period. If we later determine that it is more likely than not that the net deferred tax assets would be realized, we would reverse the applicable portion of the previously provided valuation allowance as an adjustment to earnings at such time. The amount of income tax we pay is subject to ongoing audits by federal, state and foreign tax authorities, which often result in proposed assessments. Our estimate of the potential outcome for any uncertain tax issue is highly judgmental. We account for these uncertain tax issues pursuant to ASC 740,
Income Taxes
, which contains a two-step approach to recognizing and measuring uncertain tax positions taken or expected to be taken in a tax return. The first step is to determine if the weight of available evidence indicates that it is more likely than not that the tax position will be sustained on audit, including resolution of any related appeals or litigation processes. The second step is to measure the tax benefit as the largest amount that is more than 50% likely to be realized upon ultimate settlement. Although we believe we have adequately reserved for our uncertain tax positions, no assurance can be given with respect to the final outcome of these matters. We adjust reserves for our uncertain tax positions due to changing facts and circumstances, such as the closing of a tax audit, judicial rulings, refinement of estimates or realization of earnings or deductions that differ from our estimates. To the extent that the final outcome of these matters is different than the amounts recorded, such differences generally will impact our provision for income taxes in the period in which such a determination is made. Our provisions for income taxes include the impact of reserve provisions and changes to reserves that are considered appropriate and also include the related interest and penalties.
During the first quarter of fiscal 2014 and following the redemption of our senior secured notes, we estimate that domestic U.S. cash flow will be able to service our future debt service obligations and therefore we adopted a permanent reinvestment position whereby we expect to permanently reinvest our foreign earnings for most of our foreign subsidiaries and do not expect to repatriate future earnings generated by our foreign operations. As a result of this policy change, we will no longer accrue a tax liability in anticipation of future dividends from our foreign subsidiaries.
Loss contingencies.
We accrue for probable losses from contingencies including legal defense costs, on an undiscounted basis, when such costs are considered probable of being incurred and are reasonably estimable. We periodically evaluate available information, both internal and external, relative to such contingencies and adjust this accrual as necessary. Disclosure of a contingency is required if there is at least a reasonable possibility that a loss has been incurred. In determining whether a loss should be accrued we evaluate, among other factors, the degree of probability of an unfavorable outcome and the ability to make a reasonable estimate of the amount of loss.
Stock-based compensation expense.
We account for share-based payments to employees in accordance with ASC 718,
Compensation-Stock Compensation
, which requires that share-based payments (to the extent they are compensatory) be recognized in our consolidated statements of operations and comprehensive income based on their fair values.
As required by ASC 718, we recognize stock-based compensation expense for share-based payments that are expected to vest. In determining whether an award is expected to vest, we use an estimated, forward-looking forfeiture rate based upon our historical forfeiture rates. Stock-based compensation expense recorded using an estimated forfeiture rate is updated for actual forfeitures quarterly. To the extent our actual forfeitures are different than our estimates, we record a true-up for the differences in the period that the awards vest, and such true-ups could materially affect our operating results. We also consider
37
on a quarterly basis whether there have been any significant changes in facts and circumstances that would affect our expected forfeiture rate.
We are also required to determine the fair value of stock-based awards at the grant date. For option awards that are subject to service conditions and/or performance conditions, we estimate the fair values of employee stock options using a Black-Scholes-Merton valuation model. For restricted stock awards and restricted stock units, fair value is determined by the market price of our common stock as of the grant date. Some of our option grants and awards included a market condition for which we used a Monte Carlo pricing model to establish grant date fair value. These determinations require judgment, including estimating expected volatility. If actual results differ significantly from these estimates, stock- based compensation expense and our results of operations could be impacted.
Recent Accounting Pronouncements
Presentation of Comprehensive Income -
In February 2013, the Accounting Standards Codification (ASC) ASC Topic 220, "Comprehensive Income," was amended to require an entity to disclose information about the amounts reclassified out of accumulated other comprehensive income by component. For amounts required to be reclassified out of accumulated other comprehensive income in their entirety in the same reporting period, the guidance requires entities to present significant amounts by their respective line items of net income, either on the face of the income statement or in the notes to the financial statements. For other amounts that are not required to be reclassified to net income in their entirety, a cross-reference is required to other disclosures that provide additional details about those amounts. These provisions are effective for interim and annual reporting periods beginning after December 15, 2012. The adoption of this guidance effective April 1, 2013 did not have a material impact on our consolidated financial statements.
Fair Value Measurements and Disclosures -
The FASB issued an Accounting Standard Update ("ASU") in December 2011, which requires an entity to disclose information about offsetting and related arrangements to enable users of its financial statements to understand the effect of these arrangements on its financial position. The guidance requires entities to disclose both gross and net information about both instruments and transactions eligible for offset in the balance sheet and instruments and transactions subject to an agreement similar to a master netting arrangement. In January 2013, the FASB amended and clarified the scope of the disclosures to include only derivative instruments, repurchase agreements and securities lending transactions. The provisions for this ASU are effective for annual periods and interim periods within those years beginning on or after January 1, 2013. The adoption of this ASU did not have a material impact on our consolidated financial statements.
Non-GAAP Financial Measures
References in this annual report to “Adjusted EPS,” “Adjusted EBITDA,” “Adjusted net income,” and “Free cash flow per share” which are "non-GAAP financial measures" as defined under the rules of the Securities and Exchange Commission (the "SEC"), are intended as supplemental measures of our financial performance that are not required by, or presented in accordance with, U.S. generally accepted accounting principles ("GAAP"). “Adjusted net income” represents net income before certain transaction expenses and expenses related to the our initial public offering ("IPO"), debt redemptions, debt extinguishment, refinancing of our revolving credit facility, certain discrete tax items and expenses related to the release of a liability for uncertain tax positions. "Adjusted EPS" represents Adjusted net income per fully-diluted common share. “Adjusted EBITDA” represents net income before interest expense (net of interest income), income tax expense, depreciation and amortization expense and other non-cash charges such as stock-based compensation expense, our IPO, shelf registration and secondary offering, and other transactions not associated with our ongoing operations, such as the loss on retirement of debt. "Return on equity" represents Adjusted EBITDA for the fiscal year divided by the average total shareholders' equity for the respective twelve month period ended March 31. “Free cash flow per share” represents cash provided by operations less cash used for the purchase of property, plant and equipment. The resultant cash provided or used is then divided by the fully diluted common shares outstanding.
We believe these non-GAAP financial measures are meaningful to our investors to enhance their understanding of our financial performance and are frequently used by securities analysts, investors and other interested parties to compare our performance with the performance of other companies that report Adjusted EPS, Adjusted EBITDA, Return on equity, Adjusted net income or Free cash flow per share. Adjusted EPS, Adjusted EBITDA, Return on equity Adjusted net income and Free cash flow per share should be considered in addition to, and not as substitutes for, income from operations, net income, net income per share, net cash provided by operating activities and other measures of financial performance reported in accordance with GAAP. Our calculation of Adjusted EPS, Adjusted EBITDA, Return on equity Adjusted net income and Free cash flow per share may not be comparable to similarly titled measures reported by other companies.
38
The following table reconciles net income to Adjusted EBITDA and Return on equity for the periods presented:
|
Year Ended March 31,
|
||||||||||||||
|
2014
|
2013
|
2012
|
||||||||||||
|
Net income
|
$
|
25,799
|
|
$
|
26,974
|
|
$
|
12,030
|
|
|||||
|
Interest expense, net
|
9,773
|
|
15,113
|
|
19,462
|
|
||||||||
|
Income tax expense
|
6,964
|
|
14,576
|
|
7,468
|
|
||||||||
|
Depreciation and amortization Expense
|
14,178
|
|
13,831
|
|
13,971
|
|
||||||||
|
Stock-based compensation Expense
|
2,203
|
|
1,341
|
|
6,514
|
|
||||||||
|
Loss on retirement of debt (a)
|
15,485
|
|
—
|
|
3,825
|
|
||||||||
|
Management fees (b)
|
—
|
|
—
|
|
8,105
|
|
||||||||
|
Secondary offering expenses (c)
|
—
|
|
536
|
|
—
|
|
||||||||
|
Adjusted EBITDA
|
$
|
74,402
|
|
$
|
72,371
|
|
$
|
71,375
|
|
|||||
|
Average total shareholders' equity for the twelve month period ended March 31
|
238,257
|
|
209,264
|
|
159,506
|
|
||||||||
|
Return on Equity - non-GAAP basis
|
31
|
%
|
35
|
%
|
45
|
%
|
||||||||
|
(a)
|
In fiscal 2014, we redeemed all $118.1 million of outstanding aggregate principal amount of our 9.5% senior secured notes. In connection with the redemption, we paid $15.5 million in related redemption premiums. Represents premium expense associated with redemptions totaling $70.9 million of our senior secured notes. These redemptions took place between April 30, 2011 and April 30, 2012.
|
|
(b)
|
Represents management fees paid to our former private equity sponsors that terminated in connection with our May 2011 IPO.
|
|
(c)
|
Represents legal, financial and other advisory and consulting fees and expenses incurred during fiscal 2013 in connection with our shelf registration and secondary offering in which our former private equity sponsors sold 11.5 million shares of our common stock.
|
39
The following table reconciles net income to Adjusted net income and Adjusted EPS for the periods presented:
|
Year ended March 31,
|
||||||||||||||
|
2014
|
2013
|
2012
|
||||||||||||
|
Net income
|
$
|
25,799
|
|
$
|
26,974
|
|
$
|
12,030
|
|
|||||
|
Acceleration of stock compensation in connection with the IPO
|
—
|
|
—
|
|
6,341
|
|
||||||||
|
Management fees which terminated at the IPO
|
—
|
|
—
|
|
8,105
|
|
||||||||
|
Premium charges on long term debt
|
15,485
|
|
—
|
|
3,825
|
|
||||||||
|
Acceleration of unamortized debt costs
|
4,010
|
|
2,318
|
|
3,096
|
|
||||||||
|
Discrete tax items related to the CHS Transactions
|
(575
|
)
|
—
|
|
||||||||||
|
Release of liability for uncertain tax positions
|
(1,047
|
)
|
||||||||||||
|
Secondary offering expenses
|
—
|
|
536
|
|
—
|
|
||||||||
|
Tax effect of financial adjustments
|
(5,088
|
)
|
(1,007
|
)
|
(7,500
|
)
|
||||||||
|
Adjusted Net Income - non-GAAP basis
|
$
|
38,584
|
|
$
|
28,821
|
|
$
|
25,897
|
|
|||||
|
Adjusted fully-diluted earnings per common share - non-GAAP basis
|
$
|
1.20
|
|
$
|
0.91
|
|
$
|
0.85
|
|
|||||
|
Fully-diluted common shares - non-GAAP basis (thousands)
|
32,154
|
|
31,797
|
|
30,454
|
|
||||||||
The following table reconciles cash provided by operating activities to Free cash flow per share for the periods presented:
|
Year Ended March 31,
|
|||||||||
|
2014
|
2013
|
2012
|
|||||||
|
Cash provided by operating activities
|
46,114
|
|
41,370
|
|
3,112
|
|
|||
|
Less: Purchases of property, plant and equipment
|
(3,367
|
)
|
(6,264
|
)
|
(8,883
|
)
|
|||
|
Free cash flow provided (used)
|
42,747
|
|
35,106
|
|
(5,771
|
)
|
|||
|
Free cash flow provided (used) per fully-diluted common share
|
1.33
|
|
1.10
|
|
(0.19
|
)
|
|||
|
Fully-diluted common shares
|
32,154
|
|
31,797
|
|
30,454
|
|
|||
Our primary market risk exposures include the effect of fluctuations in foreign exchange rates, interest rates and commodity prices.
Foreign currency risk relating to operations.
We transact business globally and are subject to risks associated with fluctuating foreign exchange rates. Approximately
67%
of our
fiscal 2014
consolidated revenues were generated by sales from our non-U.S. subsidiaries. Our non-U.S. subsidiaries generally sell their products and services in the local currency, but obtain a significant amount of their products from our manufacturing facilities located in another country, primarily the United States, Canada or Europe. Significant changes in the relevant exchange rates could adversely affect our margins on foreign sales of products. Our non-U.S. subsidiaries incur most of their expenses (other than intercompany expenses) in their local functional currency. These currencies include the Canadian Dollar, Euro, British Pound, Russian Ruble, Australian Dollar, South Korean Won, Chinese Renminbi, Indian Rupee, Mexican Peso, and Japanese Yen.
During fiscal 2012, we established a program that primarily utilizes foreign currency forward contracts to offset the risk associated with the effects of certain foreign currency exposures. Under this program, increases or decreases in our foreign currency exposures are offset by gains or losses on the forward contracts, to mitigate the possibility of foreign currency transaction gains or losses. These foreign currency exposures typically arise from intercompany transactions. Our forward
40
contracts generally have terms of 30 days or less. We do not use forward contracts for trading purposes nor do we designate these forward contracts as hedging instruments pursuant to ASC 815. We adjust the carrying amount of all contracts to their fair value at the end of each reporting period and unrealized gains and losses are included in our results of operations for that period. These gains and losses largely offset gains and losses resulting from settlement of payments received from our foreign operations which are settled in U.S. dollars. All outstanding foreign currency forward contracts are marked to market at the end of the period with unrealized gains and losses included in other expense. The fair value is determined by quoted prices on identical forward contracts (Level 2 fair value). The balance sheet reflects unrealized gains within accounts receivable and unrealized losses within accrued liabilities. Our ultimate realized gain or loss with respect to currency fluctuations will depend on the currency exchange rates and other factors in effect as the contracts mature. As of
March 31, 2014
and
2013
, the notional amounts of forward contracts we held to buy U.S. dollars in exchange for other major international currencies were
$8.2 million
and
$10.1 million
, respectively.
During
fiscal 2014
, our largest exposures to foreign exchange rates consisted primarily of the Canadian Dollar and the Euro against the U.S. dollar. The market risk related to the foreign currency exchange rates is measured by estimating the potential impact of a 10% change in the value of the U.S. dollar relative to the local currency exchange rates. The rates used to perform this analysis were based on a weighted average of the market rates in effect during the relevant period. A 10% appreciation of the U.S. dollar relative to the Canadian Dollar would result in a net decrease in net income of $1.9 million for
fiscal 2014
. Conversely, a 10% depreciation of the U.S. dollar relative to the Canadian Dollar would result in a net increase in net income of $2.3 million for
fiscal 2014
. A 10% appreciation of the U.S. dollar relative to the Euro would result in a net decrease in net income of $0.4 million for
fiscal 2014
. Conversely, a 10% depreciation of the U.S. dollar relative to the Euro would result in a net increase in net income of $0.5 million for
fiscal 2014
.
The geographic areas outside the United States in which we operate are generally not considered to be highly inflationary. Nonetheless, these foreign operations are sensitive to fluctuations in currency exchange rates arising from, among other things, certain intercompany transactions that are generally denominated in U.S. dollars rather than their respective functional currencies. The impact of foreign currency transaction gains and losses on our consolidated statements of operations were losses of
$0.6
million and
$0.4
million in fiscal 2014 and
fiscal 2013
, respectively.
Because our consolidated financial results are reported in U.S. dollars, and we generate a substantial amount of our sales and earnings in other currencies, the translation of those results into U.S. dollars can result in a significant decrease in the amount of those sales and earnings. In addition, fluctuations in currencies relative to the U.S. dollar may make it more difficult to perform period-to-period comparisons of our reported results of operations.
At each balance sheet date, we translate our assets and liabilities denominated in foreign currency to U.S. dollars. The balances of our foreign equity accounts are translated at their historical value. The difference between the current rates and the historical rates are posted to our currency translation account and reflected in the shareholders' equity section of our balance sheet. The unrealized effect of foreign currency translation were losses of
$6.7
million and
$4.1
million in fiscal 2014 and
fiscal 2013
, respectively. Currency translation gains or losses are reported as part of comprehensive income or loss in our accompanying consolidated financial statements.
Interest rate risk and foreign currency risk relating to debt.
Any borrowings on our term loan and revolving credit facility will incur interest expense that is variable in relation to the LIBOR rate. During fiscal 2014, we entered into an interest rate swap agreement that fixed our interest rate on the variable rate term loan at 3.62% for the life of the term loan. During fiscal 2014, we did not draw on our revolving credit facility. If there had been any outstanding revolving credit facility borrowings, at March 31, 2014, the interest rate would have been approximately 2.69%. Based on historical balances on our revolving credit facility, we do not anticipate that a one percent increase or decrease in our interest rate would have a significant impact on our operations. We cannot provide assurance that historical borrowings will be reflective of our future use of the revolving credit facility. As of
March 31, 2014
, we had
$121.5 million
of outstanding principal on our variable rate term loan. Based on outstanding borrowings, a 1% change in the interest rate would result in a $1.2 million increase or decrease in our annual interest expense. Although we cannot provide assurance, we believe that any increase or decrease in interest rates on our term loan borrowings will be largely offset by gains or losses from our variable to fixed interest rate swap.
Commodity price risk.
We use various commodity-based raw materials in our manufacturing processes. Generally, we acquire such components at market prices and do not typically enter into long-term purchase commitments with suppliers or hedging instruments to mitigate commodity price risk. As a result, we are subject to market risks related to changes in commodity prices and supplies of key components of our products. Historically, the costs of our primary raw materials have been stable and readily available from multiple suppliers. Typically, we have been able to pass on raw material cost increases to our customers. We cannot provide any assurance, however, that we may be able to pass along such cost increases to our
41
customers or source sufficient amounts of key components on commercially reasonable terms or at all in the future, and if we are unable to do so, our results of operations may be adversely affected.
42
INDEX TO FINANCIAL STATEMENTS
|
Page
|
|
|
Audited Financial Statements of Thermon Group Holdings, Inc. and its Consolidated Subsidiaries
|
|
43
Report of Independent Registered Public Accounting Firm
The Board of Directors and Shareholders of Thermon Group Holdings, Inc.:
We have audited the accompanying consolidated balance sheet of Thermon Group Holdings, Inc. and subsidiaries as of March 31, 2014, and the related consolidated statements of operations and comprehensive income, shareholders' equity, and cash flows for the year ended March 31, 2014. These consolidated financial statements are the responsibility of the Company’s management. Our responsibility is to express an opinion on these consolidated financial statements based on our audit.
We conducted our audit in accordance with the standards of the Public Company Accounting Oversight Board (United States). Those standards require that we plan and perform the audit to obtain reasonable assurance about whether the financial statements are free of material misstatement. An audit includes examining, on a test basis, evidence supporting the amounts and disclosures in the financial statements. An audit also includes assessing the accounting principles used and significant estimates made by management, as well as evaluating the overall financial statement presentation. We believe that our audit provides a reasonable basis for our opinion.
In our opinion, the consolidated financial statements referred to above present fairly, in all material respects, the financial position of Thermon Group Holdings, Inc. and subsidiaries as of March 31, 2014, and the results of their operations and their cash flows for the year ended March 31, 2014, in conformity with U.S. generally accepted accounting principles.
We also have audited, in accordance with the standards of the Public Company Accounting Oversight Board (United States), Thermon Group Holdings, Inc.’s internal control over financial reporting as of March 31, 2014, based on criteria established in
Internal Control-Integrated Framework (1992)
issued by the Committee of Sponsoring Organizations of the Treadway Commission and our report dated May 30, 2014 expressed an
unqualified opinion on the effectiveness of the Company’s internal control over financial reporting
.
/s/ KPMG LLP
San Antonio, Texas
May 30, 2014
44
Report of Independent Registered Public Accounting Firm
The Board of Directors and Shareholders of Thermon Group Holdings, Inc.:
We have audited Thermon Group Holdings, Inc.’s internal control over financial reporting as of March 31, 2014, based on criteria established in
Internal Control - Integrated Framework (1992)
issued by the Committee of Sponsoring Organizations of the Treadway Commission (COSO). Thermon Group Holdings, Inc.’s management is responsible for maintaining effective internal control over financial reporting and for its assessment of the effectiveness of internal control over financial reporting, included in the accompanying Management’s Annual Report on Internal Control Over Financial Reporting. Our responsibility is to express an opinion on the Company’s internal control over financial reporting based on our audit.
We conducted our audit in accordance with the standards of the Public Company Accounting Oversight Board (United States). Those standards require that we plan and perform the audit to obtain reasonable assurance about whether effective internal control over financial reporting was maintained in all material respects. Our audit included obtaining an understanding of internal control over financial reporting, assessing the risk that a material weakness exists, and testing and evaluating the design and operating effectiveness of internal control based on the assessed risk. Our audit also included performing such other procedures as we considered necessary in the circumstances. We believe that our audit provides a reasonable basis for our opinion.
A company’s internal control over financial reporting is a process designed to provide reasonable assurance regarding the reliability of financial reporting and the preparation of financial statements for external purposes in accordance with generally accepted accounting principles. A company’s internal control over financial reporting includes those policies and procedures that (1) pertain to the maintenance of records that, in reasonable detail, accurately and fairly reflect the transactions and dispositions of the assets of the company; (2) provide reasonable assurance that transactions are recorded as necessary to permit preparation of financial statements in accordance with generally accepted accounting principles, and that receipts and expenditures of the company are being made only in accordance with authorizations of management and directors of the company; and (3) provide reasonable assurance regarding prevention or timely detection of unauthorized acquisition, use, or disposition of the company’s assets that could have a material effect on the financial statements.
Because of its inherent limitations, internal control over financial reporting may not prevent or detect misstatements. Also, projections of any evaluation of effectiveness to future periods are subject to the risk that controls may become inadequate because of changes in conditions, or that the degree of compliance with the policies or procedures may deteriorate.
In our opinion, Thermon Group Holdings, Inc. maintained, in all material respects, effective internal control over financial reporting as of March 31, 2014, based on criteria established in
Internal Control - Integrated Framework (1992)
issued by the Committee of Sponsoring Organizations of the Treadway Commission (COSO).
We also have audited, in accordance with the standards of the Public Company Accounting Oversight Board (United States), the consolidated balance sheet of Thermon Group Holdings, Inc. as of March 31, 2014, and the related consolidated statements of operations and comprehensive income, shareholders' equity, and cash flows for the year ended March 31, 2014, and our report dated May 30, 2014 expressed an unqualified opinion on those consolidated financial statements.
/s/ KPMG LLP
San Antonio, Texas
May 30, 2014
45
Report of Independent Registered Public Accounting Firm
The Board of Directors and Shareholders of Thermon Group Holdings, Inc.
We have audited the accompanying consolidated balance sheet of Thermon Group Holdings, Inc. (the Company) as of March 31, 2013 and the related consolidated statements of operations and comprehensive income, shareholders' equity and cash flows for each of the two years in the period then ended. These financial statements are the responsibility of the Company's management. Our responsibility is to express an opinion on these financial statements based on our audits.
We conducted our audits in accordance with the standards of the Public Company Accounting Oversight Board (United States). Those standards require that we plan and perform the audit to obtain reasonable assurance about whether the financial statements are free of material misstatement. An audit includes examining, on a test basis, evidence supporting the amounts and disclosures in the financial statements. An audit also includes assessing the accounting principles used and significant estimates made by management, as well as evaluating the overall financial statement presentation. We believe that our audits provide a reasonable basis for our opinion.
In our opinion, the financial statements referred to above present fairly, in all material respects, the consolidated financial position of Thermon Group Holdings, Inc. at March 31, 2013, and the consolidated results of its operations and its cash flows for each of the two years in the period then ended, in conformity with U.S. generally accepted accounting principles.
/s/ Ernst & Young LLP
San Antonio, Texas
June 10, 2013
46
Thermon Group Holdings, Inc.
Consolidated Statements of Operations and Comprehensive Income
(Dollars in Thousands, except share and per share data)
|
Year Ended March 31, 2014
|
Year Ended March 31, 2013
|
Year Ended March 31, 2012
|
||||||||||
|
Sales
|
$
|
277,323
|
|
$
|
284,036
|
|
$
|
272,323
|
|
|||
|
Cost of sales
|
142,153
|
|
151,204
|
|
140,208
|
|
||||||
|
Gross profit
|
135,170
|
|
132,832
|
|
132,115
|
|
||||||
|
Operating expenses:
|
||||||||||||
|
Marketing, general and administrative and engineering
|
65,463
|
|
64,633
|
|
76,280
|
|
||||||
|
Amortization of intangible assets
|
11,090
|
|
11,211
|
|
11,379
|
|
||||||
|
Income from operations
|
58,617
|
|
56,988
|
|
44,456
|
|
||||||
|
Other income/(expenses):
|
||||||||||||
|
Interest income
|
246
|
|
112
|
|
122
|
|
||||||
|
Interest expense
|
(10,019
|
)
|
(15,225
|
)
|
(19,584
|
)
|
||||||
|
Loss on retirement of senior secured notes
|
(15,485
|
)
|
—
|
|
(3,825
|
)
|
||||||
|
Other expense
|
(596
|
)
|
(325
|
)
|
(1,671
|
)
|
||||||
|
Income before provision for income taxes
|
32,763
|
|
41,550
|
|
19,498
|
|
||||||
|
Income tax expense
|
6,964
|
|
14,576
|
|
7,468
|
|
||||||
|
Net income
|
$
|
25,799
|
|
$
|
26,974
|
|
$
|
12,030
|
|
|||
|
Other comprehensive income:
|
||||||||||||
|
Net income
|
$
|
25,799
|
|
$
|
26,974
|
|
$
|
12,030
|
|
|||
|
Foreign currency translation adjustment
|
(6,724
|
)
|
(4,133
|
)
|
(6,517
|
)
|
||||||
|
Derivative valuation, net of tax
|
70
|
|
—
|
|
—
|
|
||||||
|
Other
|
—
|
|
(304
|
)
|
(152
|
)
|
||||||
|
Total comprehensive income
|
$
|
19,145
|
|
$
|
22,537
|
|
$
|
5,361
|
|
|||
|
Net income per common share:
|
||||||||||||
|
Basic
|
$
|
0.82
|
|
$
|
0.88
|
|
$
|
0.41
|
|
|||
|
Diluted
|
0.80
|
|
0.85
|
|
0.40
|
|
||||||
|
Weighted-average shares used in computing net income per common share:
|
||||||||||||
|
Basic
|
31,595,019
|
|
30,796,675
|
|
29,083,478
|
|
||||||
|
Diluted
|
32,153,912
|
|
31,796,830
|
|
30,454,255
|
|
||||||
The accompanying notes are an integral part of these consolidated financial statements
47
Thermon Group Holdings, Inc.
Consolidated Balance Sheets
(Dollars in Thousands, except share and per share data)
|
|
March 31,
2014 |
March 31,
2013 |
|||||
|
Assets
|
|
|
|
|
|||
|
Current assets:
|
|
|
|
|
|||
|
Cash and cash equivalents
|
$
|
72,640
|
|
$
|
43,847
|
|
|
|
Accounts receivable, net of allowance for doubtful accounts of $751 and $1,141 as of March 31, 2014 and March 31, 2013, respectively
|
52,578
|
|
56,123
|
|
|||
|
Inventories, net
|
37,316
|
|
34,391
|
|
|||
|
Costs and estimated earnings in excess of billings on uncompleted contracts
|
2,880
|
|
3,515
|
|
|||
|
Income taxes receivable
|
3,310
|
|
5,287
|
|
|||
|
Prepaid expenses and other current assets
|
5,058
|
|
6,203
|
|
|||
|
Deferred income taxes
|
2,325
|
|
2,211
|
|
|||
|
Total current assets
|
176,107
|
|
151,577
|
|
|||
|
Property, plant and equipment, net
|
31,532
|
|
31,211
|
|
|||
|
Goodwill
|
114,112
|
|
116,303
|
|
|||
|
Intangible assets, net
|
118,917
|
|
131,916
|
|
|||
|
Debt issuance costs, net
|
1,528
|
|
4,373
|
|
|||
|
Other long term assets
|
263
|
|
143
|
|
|||
|
Total assets
|
$
|
442,459
|
|
$
|
435,523
|
|
|
|
Liabilities and shareholders’ equity
|
|
|
|
|
|||
|
Current liabilities:
|
|
|
|
|
|||
|
Accounts payable
|
$
|
17,066
|
|
$
|
20,370
|
|
|
|
Accrued liabilities
|
9,869
|
|
18,715
|
|
|||
|
Current portion of long term debt
|
13,500
|
|
—
|
|
|||
|
Billings in excess of costs and estimated earnings on uncompleted contracts
|
1,749
|
|
1,629
|
|
|||
|
Income taxes payable
|
956
|
|
1,706
|
|
|||
|
Obligations due to settle the CHS Transactions
|
567
|
|
3,239
|
|
|||
|
Total current liabilities
|
43,707
|
|
45,659
|
|
|||
|
Long-term debt, net of current maturities
|
108,000
|
|
118,145
|
|
|||
|
Deferred income taxes
|
37,896
|
|
42,599
|
|
|||
|
Other noncurrent liabilities
|
2,390
|
|
3,073
|
|
|||
|
Common stock: $.001 par value; 150,000,000 authorized; 31,920,865 and 31,307,582 shares issued and outstanding at March 31, 2014 and March 31, 2013, respectively
|
32
|
|
31
|
|
|||
|
Preferred stock: $.001 par value; 10,000,000 authorized; no shares issued and outstanding
|
—
|
|
—
|
|
|||
|
Additional paid in capital
|
208,451
|
|
203,027
|
|
|||
|
Accumulated other comprehensive loss
|
(7,880
|
)
|
(1,075
|
)
|
|||
|
Retained earnings
|
49,863
|
|
24,064
|
|
|||
|
Shareholders’ equity
|
250,466
|
|
226,047
|
|
|||
|
Total liabilities and shareholders' equity
|
$
|
442,459
|
|
$
|
435,523
|
|
|
The accompanying notes are an integral part of these consolidated financial statements
48
|
Thermon Group Holdings, Inc.
|
|||||||||||||||||||||
|
Consolidated Statements of Shareholders' Equity
|
|||||||||||||||||||||
|
(Dollars in Thousands)
|
|||||||||||||||||||||
|
Common Stock Outstanding
|
Stock/Capital Account
|
Retained Earnings/ (Deficit)
|
Accumulated Other Comprehensive Income (Loss)
|
Total
|
|||||||||||||||||
|
Balances at March 31, 2011
|
24,933,407
|
|
$
|
131,441
|
|
$
|
(14,940
|
)
|
$
|
10,031
|
|
$
|
126,532
|
|
|||||||
|
Issuance of common stock on initial public offering net of issuance costs
|
4,575,098
|
|
48,459
|
|
—
|
|
—
|
|
48,459
|
|
|||||||||||
|
Issuance of common stock in exercise of stock options
|
683,443
|
|
3,433
|
|
—
|
|
—
|
|
3,433
|
|
|||||||||||
|
Stock-based compensation expense
|
—
|
|
6,514
|
|
—
|
|
—
|
|
6,514
|
|
|||||||||||
|
Issuance of restricted stock as deferred compensation to employees and directors
|
16,136
|
|
—
|
|
—
|
|
—
|
|
—
|
|
|||||||||||
|
Excess tax deduction from stock option exercises
|
—
|
|
2,181
|
|
—
|
|
—
|
|
2,181
|
|
|||||||||||
|
Net income
|
—
|
|
—
|
|
12,030
|
|
—
|
|
12,030
|
|
|||||||||||
|
Foreign currency translation adjustment (net of $135 tax expense)
|
—
|
|
—
|
|
—
|
|
(6,517
|
)
|
(6,517
|
)
|
|||||||||||
|
Other
|
—
|
|
—
|
|
—
|
|
(152
|
)
|
(152
|
)
|
|||||||||||
|
Balances at March 31, 2012
|
30,208,084
|
|
$
|
192,028
|
|
$
|
(2,910
|
)
|
$
|
3,362
|
|
$
|
192,480
|
|
|||||||
|
Issuance of common stock in exercise of stock options
|
1,086,486
|
|
5,558
|
|
—
|
|
—
|
|
5,558
|
|
|||||||||||
|
Issuance of restricted stock as deferred compensation to employees and directors
|
13,012
|
|
—
|
|
—
|
|
—
|
|
—
|
|
|||||||||||
|
Stock compensation expense
|
—
|
|
1,341
|
|
—
|
|
—
|
|
1,341
|
|
|||||||||||
|
Excess tax deduction from stock options
|
—
|
|
4,131
|
|
—
|
|
—
|
|
4,131
|
|
|||||||||||
|
Net income
|
—
|
|
—
|
|
26,974
|
|
—
|
|
26,974
|
|
|||||||||||
|
Foreign currency translation adjustment
|
—
|
|
—
|
|
—
|
|
(4,133
|
)
|
(4,133
|
)
|
|||||||||||
|
Other
|
—
|
|
—
|
|
—
|
|
(304
|
)
|
(304
|
)
|
|||||||||||
|
Balances at March 31, 2013
|
31,307,582
|
|
$
|
203,058
|
|
$
|
24,064
|
|
$
|
(1,075
|
)
|
$
|
226,047
|
|
|||||||
|
Issuance of common stock in exercise of stock options
|
566,487
|
|
3,340
|
|
—
|
|
—
|
|
3,340
|
|
|||||||||||
|
Issuance of restricted stock as deferred compensation to employees and directors
|
17,416
|
|
—
|
|
—
|
|
—
|
|
—
|
|
|||||||||||
|
Issuance of common stock as deferred compensation to employees
|
18,786
|
|
—
|
|
—
|
|
—
|
|
—
|
|
|||||||||||
|
Issuance of common stock as deferred compensation to named executive officers
|
10,594
|
|
—
|
|
—
|
|
—
|
|
|||||||||||||
|
Stock compensation expense
|
—
|
|
2,203
|
|
—
|
|
—
|
|
2,203
|
|
|||||||||||
|
Excess tax deduction from stock options
|
—
|
|
(118
|
)
|
—
|
|
—
|
|
(118
|
)
|
|||||||||||
|
Net income
|
—
|
|
—
|
|
25,799
|
|
—
|
|
25,799
|
|
|||||||||||
|
Foreign currency translation adjustment
|
—
|
|
—
|
|
—
|
|
(6,724
|
)
|
(6,724
|
)
|
|||||||||||
|
Interest rate swap
|
—
|
|
—
|
|
—
|
|
(81
|
)
|
(81
|
)
|
|||||||||||
|
Balances at March 31, 2014
|
31,920,865
|
|
$
|
208,483
|
|
$
|
49,863
|
|
$
|
(7,880
|
)
|
$
|
250,466
|
|
|||||||
The accompanying notes are an integral part of these consolidated financial statements
49
Thermon Group Holdings, Inc.
Consolidated Statement of Cash Flows
(Dollars in Thousands)
|
Year Ended March 31, 2014
|
Year Ended March 31, 2013
|
Year Ended March 31, 2012
|
|||||||||
|
Operating activities
|
|
|
|
|
|||||||
|
Net income
|
$
|
25,799
|
|
$
|
26,974
|
|
$
|
12,030
|
|
||
|
Adjustment to reconcile net income to net cash provided by operating activities:
|
|
|
|
|
|||||||
|
Depreciation and amortization
|
14,178
|
|
13,831
|
|
13,971
|
|
|||||
|
Amortization of debt costs
|
4,572
|
|
3,321
|
|
4,127
|
|
|||||
|
Stock compensation expense
|
2,203
|
|
1,341
|
|
6,514
|
|
|||||
|
Deferred income taxes
|
(4,429
|
)
|
(1,919
|
)
|
(4,947
|
)
|
|||||
|
Premiums paid on redemptions, included as financing activities
|
15,485
|
|
—
|
|
3,825
|
|
|||||
|
Other non-cash operating activities
|
(177
|
)
|
551
|
|
721
|
|
|||||
|
Changes in operating assets and liabilities:
|
|
|
|
|
|||||||
|
Accounts receivable
|
2,894
|
|
(7,120
|
)
|
(11,435
|
)
|
|||||
|
Inventories
|
(3,500
|
)
|
3,389
|
|
(8,189
|
)
|
|||||
|
Costs and estimated earnings in excess of billings on uncompleted contracts
|
648
|
|
(1,807
|
)
|
(478
|
)
|
|||||
|
Other current and noncurrent assets
|
1,477
|
|
611
|
|
1,591
|
|
|||||
|
Accounts payable
|
(3,157
|
)
|
4,895
|
|
(1,292
|
)
|
|||||
|
Accrued liabilities and noncurrent liabilities
|
(11,069
|
)
|
(3,354
|
)
|
(3,549
|
)
|
|||||
|
Income taxes payable
|
1,190
|
|
657
|
|
(9,777
|
)
|
|||||
|
Net cash provided by operating activities
|
46,114
|
|
41,370
|
|
3,112
|
|
|||||
|
Investing activities
|
|
|
|
|
|||||||
|
Purchases of property, plant and equipment
|
(3,367
|
)
|
(6,264
|
)
|
(8,883
|
)
|
|||||
|
Cash paid to settle the CHS Transactions
|
(2,055
|
)
|
(289
|
)
|
(685
|
)
|
|||||
|
Net cash used in investing activities
|
(5,422
|
)
|
(6,553
|
)
|
(9,568
|
)
|
|||||
|
Financing activities
|
|
|
|
|
|||||||
|
Proceeds from long term debt
|
135,000
|
|
—
|
|
—
|
|
|||||
|
Payments on senior secured notes
|
(118,145
|
)
|
(21,000
|
)
|
(70,855
|
)
|
|||||
|
Payments on long term debt
|
(13,500
|
)
|
—
|
|
—
|
|
|||||
|
Proceeds or payments on revolving lines of credit
|
—
|
|
—
|
|
(2,063
|
)
|
|||||
|
Lease financing, net
|
59
|
|
—
|
|
—
|
|
|||||
|
Proceeds from Initial Public Offering, net of transaction costs
|
—
|
|
—
|
|
48,459
|
|
|||||
|
Issuance costs associated with debt financing
|
(1,728
|
)
|
(248
|
)
|
—
|
|
|||||
|
Issuance of common stock including exercise of stock options
|
3,340
|
|
5,558
|
|
3,432
|
|
|||||
|
Benefit (loss) from excess tax deduction from option exercises
|
(118
|
)
|
4,131
|
|
2,181
|
|
|||||
|
Premium paid on redemption of senior secured notes
|
(15,485
|
)
|
(630
|
)
|
(3,825
|
)
|
|||||
|
Net cash used in financing activities
|
(10,577
|
)
|
(12,189
|
)
|
(22,671
|
)
|
|||||
|
Effect of exchange rate changes on cash and cash equivalents
|
(1,321
|
)
|
(249
|
)
|
(671
|
)
|
|||||
|
Change in cash and cash equivalents
|
28,794
|
|
22,379
|
|
(29,798
|
)
|
|||||
|
Cash and cash equivalents at beginning of period
|
$
|
43,847
|
|
21,468
|
|
51,266
|
|
||||
|
Cash and cash equivalents at end of period
|
$
|
72,640
|
|
$
|
43,847
|
|
$
|
21,468
|
|
||
|
Cash paid for interest and income taxes
|
|||||||||||
|
Interest, net
|
$
|
10,138
|
|
$
|
12,734
|
|
$
|
19,022
|
|
||
|
Income taxes paid
|
$
|
11,098
|
|
$
|
10,639
|
|
$
|
17,723
|
|
||
|
Income tax refunds received
|
$
|
(2,004
|
)
|
$
|
(207
|
)
|
$
|
(512
|
)
|
||
The accompanying notes are an integral part of these consolidated financial statements.
50
|
Thermon Group Holdings, Inc.
|
||||
|
Notes to Consolidated Financial Statements
|
||||
|
(Dollars in Thousands, Except Share and Per Share Data)
|
||||
|
March 31, 2014
|
||||
1. Organization and Summary of Significant Accounting Policies
Organization
On April 30, 2010, a group of investors led by entities affiliated with CHS Capital LLC (“CHS”) and
two
other private equity firms acquired a controlling interest in Thermon Holding Corp. and its subsidiaries from Thermon Holdings, LLC (“Predecessor”) for approximately
$321,500
in a transaction that was financed by approximately
$129,252
of equity investments by CHS, two other private equity firms and certain members of our current and former management team (collectively, the “management investors”) and
$210,000
of debt raised in an exempt Rule 144A senior secured note offering to qualified institutional investors (collectively, the “CHS Transactions”). The proceeds from the equity investments and debt financing were used both to finance the acquisition and pay related transaction costs. As a result of the CHS Transactions, Thermon Group Holdings, Inc. became the ultimate parent of Thermon Holding Corp. Thermon Group Holdings, Inc. and its direct and indirect subsidiaries are referred to collectively as “we,” “our,” the “Company” or “Successor” herein. We refer to CHS and the two other private equity fund investors collectively as “our former private equity sponsors.”
Basis of Consolidation
The consolidated financial statements include the accounts of the Company and its subsidiaries. All significant inter-company balances and transactions have been eliminated in consolidation. Consolidated subsidiaries domiciled in foreign countries comprised approximately
67%
,
71%
and
66%
, of the Company's consolidated sales and
$39,078
,
$36,358
and
$33,912
of the Company's consolidated pretax income for
fiscal 2014
,
fiscal 2013
and
fiscal 2012
, respectively, and
55%
and
54%
, of the Company's consolidated total assets at
March 31, 2014
and
2013
, respectively.
Segment Reporting
The Company's senior management allocates resources and assesses the performance of its electrical and steam heat tracing of piping, vessels, instrumentation and associated equipment sales activities as one reportable segment. Resources are further allocated to four geographic segments which are the United States, Canada, Europe and Asia.
Use of Estimates
The preparation of financial statements in conformity with U.S. generally accepted accounting principles requires management to make estimates and assumptions that affect the amounts reported in the financial statements and accompanying notes. Actual results inevitably will differ from those estimates, and such differences may be material to the financial statements.
Cash Equivalents
Cash and cash equivalents consist of cash in bank and money market funds. All highly liquid investments purchased with original maturities of three months or less are considered to be cash equivalents.
Receivables
The Company's receivables are recorded at cost when earned and represent claims against third parties that will be settled in cash. The carrying value of the Company's receivables, net of allowance for doubtful accounts, represents their estimated net realizable value. If events or changes in circumstances indicate specific receivable balances may be impaired, further consideration is given to the Company's ability to collect those balances and the allowance is adjusted accordingly. The Company has established an allowance for doubtful accounts based upon an analysis of aged receivables. Past-due receivable balances are written-off when the Company's internal collection efforts have been unsuccessful in collecting the amounts due.
51
The Company's primary base of customers operates in the oil, chemical processing and power generation industries. Although the Company has a concentration of credit risk within these industries, the Company has not experienced significant collection losses on sales to these customers. The Company's foreign receivables are not concentrated within any one geographic region nor are they subject to any current economic conditions that would subject the Company to unusual risk. The Company does not generally require collateral or other security from customers.
The Company performs credit evaluations of new customers and sometimes requires deposits, prepayments or use of trade letters of credit to mitigate our credit risk. Allowance for doubtful account balances were
$751
and
$1,141
as of
March 31, 2014
and
2013
, respectively. Although we have fully provided for these balances, we continue to pursue collection of these receivables.
The following table summarizes the annual changes in our allowance for doubtful accounts:
|
Balance at March 31, 2011
|
$
|
1,487
|
|
|||
|
Additions charged to expense
|
307
|
|
||||
|
Write-off of uncollectible accounts
|
(360
|
)
|
||||
|
Balance at March 31, 2012
|
1,434
|
|
||||
|
Reductions charged to expense
|
(21
|
)
|
||||
|
Write-off of uncollectible accounts
|
(272
|
)
|
||||
|
Balance at March 31, 2013
|
1,141
|
|
||||
|
Reductions to expense
|
(175
|
)
|
||||
|
Write-off of uncollectible accounts
|
(215
|
)
|
||||
|
Balance at March 31, 2014
|
$
|
751
|
|
|||
Inventories
Inventories, principally raw materials and finished goods, are valued at the lower of cost (weighted average cost) or market. We write down our inventory for estimated excess or obsolete inventory equal to the difference between the cost of inventory and estimated fair market value based on assumptions of future demand and market conditions. Fair market value is determined quarterly by comparing inventory levels of individual products and components to historical usage rates, current backlog and estimated future sales and by analyzing the age and potential applications of inventory, in order to identify specific products and components of inventory that are judged unlikely to be sold. Our finished goods inventory consists primarily of completed electrical cable that has been manufactured for various heat tracing solutions. Most of our manufactured product offerings are built to industry standard specifications that have general purpose applications and therefore are sold to a variety of customers in various industries. Some of our products, such as custom orders and ancillary components outsourced from third-party manufacturers, have more specific applications and therefore may be at a higher risk of inventory obsolescence. Inventory is written-off in the period in which the disposal occurs. Actual future write-offs of inventory may differ from estimates and calculations used to determine valuation allowances due to changes in customer demand, customer negotiations, product application, technology shifts and other factors. Historically, inventory obsolescence and potential excess cost adjustments have been within our expectations, and management does not believe that there is a reasonable likelihood that there will be a material change in future estimates or assumptions used to calculate the inventory valuation reserves.
Significant judgments and estimates must be made and used in connection with establishing these allowances. If our assumptions used to calculate these allowances do not agree with our future ability to collect outstanding receivables, actual demand for our inventory, or the number of products and installations returned under warranty, additional provisions may be needed and our future results of operations could be adversely affected.
Revenue Recognition
Revenues from sales of products are recognized when persuasive evidence of an agreement exists, delivery of the product has occurred, the fee is fixed or determinable, and collectability is probable.
On average, less than 20% of our annual revenues are derived from the installation of heat tracing solutions for which we apply construction-type accounting. These construction-related contracts are awarded on a competitive bid and negotiated basis. We offer our customers a range of contracting options, including cost-reimbursable, fixed-price and hybrid, which has
52
both cost-reimbursable and fixed-price characteristics. Most of our construction contract revenue is recognized using either the percentage-of-completion method, based on the percentage that actual costs-to-date bear to total estimated costs to complete each contract or as it relates to cost-reimbursable projects, revenue is recognized as work is performed. We follow the guidance of FASB ASC Revenue Recognition Topic 605-35 for accounting policies relating to our use of the percentage-of-completion method, estimating costs and revenue recognition, including the recognition of profit incentives, unapproved change orders and claims and combining and segmenting contracts. We utilize the cost-to-cost approach to measure the extent of progress toward completion, as we believe this method is less subjective than relying on assessments of physical progress. Under the cost-to-cost approach, the use of total estimated cost to complete each contract is a significant variable in the process of determining recognized revenue and is a significant factor in the accounting for contracts. Significant estimates that impact the cost to complete each contract are costs of engineering, materials, components, equipment, labor and subcontracts; labor productivity; schedule durations, including subcontract and supplier progress; liquidated damages; contract disputes, including claims; achievement of contractual performance requirements; and contingency, among others. The cumulative impact of revisions in total cost estimates as contracts progress is reflected in the period in which these changes become known, including the recognition of any losses expected to be incurred on contracts in progress. Due to the various estimates inherent in our construction contract accounting, actual results could differ from those estimates. Our historical construction contract cost estimates have generally been accurate, and management does not believe that there is a reasonable likelihood that there will be a material change in future estimates or the methodology used to calculate these estimates.
Sales which are not accounted for under ASC 605-35 may have multiple elements, including heat tracing product, engineering and “field” services such as inspection, repair and/or training. We assess such revenue arrangements to determine the appropriate units of accounting. Each deliverable provided under multiple-element arrangements is considered a separate unit of accounting. Revenues associated with the sale of a product are recognized upon delivery, while the revenue for engineering and field services are recognized as services are rendered, limited to the amount of consideration which is not contingent upon the successful provision of future products or services under the arrangement. Amounts assigned to each unit of accounting are based on an allocation of total arrangement consideration using a hierarchy of estimated selling price for the deliverables. The selling price used for each deliverable will be based on Vendor Specific Objective Evidence (“VSOE”), if available, Third Party Evidence (“TPE”), if VSOE is not available, or estimated selling price, if neither VSOE nor TPE is available.
Property, Plant and Equipment
Property, plant and equipment are stated at cost. Expenditures for renewals and improvements that significantly extend the useful life of an asset are capitalized. Expenditures for maintenance and repairs of assets are charged to operations as incurred when assets are sold or retired, the cost and accumulated depreciation are removed from the accounts and any gain or loss is credited or changed to operations.
Depreciation is computed using the straight-line method over the following lives:
|
Useful Lives in Years
|
|||||
|
Land improvements
|
15
|
-
|
20
|
||
|
Buildings and improvements
|
10
|
-
|
40
|
||
|
Machinery and equipment
|
3
|
-
|
25
|
||
|
Office furniture and equipment
|
3
|
-
|
10
|
||
|
Internally developed software
|
5
|
-
|
7
|
||
Goodwill and Other Intangible Assets
We evaluate goodwill for impairment annually during the fourth quarter of our fiscal year, or more frequently when indicators of impairment are present. We operate as a single report
able
segment with four geographic reporting units, each of which are assessed. We perform a qualitative analysis to determine whether it is more likely than not that the fair value of goodwill is less than its carrying amount. Some of the impairment indicators we consider include significant differences between the carrying amount and the estimated fair value of our assets and liabilities; macroeconomic conditions such as a deterioration in general economic condition or limitations on accessing capital; industry and market considerations such as a deterioration in the environment in which we operate and an increased competitive environment; cost factors such as increases in raw materials, labor, or other costs that have a negative effect on earnings and cash flows; overall financial performance such
53
as negative or declining cash flows or a decline in actual or planned revenue or earnings compared with actual and projected results of relevant prior periods; other relevant events such as litigation, changes in management, key personnel, strategy or customers; the testing for recoverability of our long-lived assets and a potential decrease in share price. We evaluate the significance of identified events and circumstances on the basis of the weight of evidence along with how they could affect the relationship between the reporting unit's fair value and carrying amount, including positive mitigating events and circumstances. If we determine it is more likely than not that the fair value of goodwill is less than its carrying amount, then we perform the first step of the two-step goodwill impairment test. In the first step of the goodwill impairment test, the reporting unit's carrying amount (including goodwill) and its fair value are compared. If the estimated fair value of a reporting unit is less than the carrying value, a second step is performed to compute the amount of the impairment by determining an "implied fair value" of goodwill. The determination of the "implied fair value" requires us to allocate the estimated value of the reporting unit to the assets and liabilities of the reporting unit. Any unallocated fair value represents the "implied fair value" of goodwill, which is compared to the corresponding carrying value. If the "implied fair value" is less than the carrying value, an impairment charge will be recorded.
The Company determined that no impairment of goodwill existed during fiscal
2014
, fiscal
2013
or fiscal
2012
.
Other intangible assets include indefinite lived intangible assets for which we must also perform an annual test of impairment. The Company's indefinite lived intangible assets consist primarily of trademarks. The fair value of the Company's trademarks is calculated using a “relief from royalty payments” methodology. This approach involves first estimating reasonable royalty rates for each trademark then applying these royalty rates to a net sales stream and discounting the resulting cash flows to determine the fair value. The royalty rate is estimated using both a market and income approach. The market approach relies on the existence of identifiable transactions in the marketplace involving the licensing of trademarks similar to those owned by the Company. The income approach uses a projected pretax profitability rate relevant to the licensed income stream. We believe the use of multiple valuation techniques results in a more accurate indicator of the fair value of each trademark. This fair value is then compared with the carrying value of each trademark. The results of this test during the fourth quarter of our fiscal year indicated that there was no impairment of our indefinite life intangible assets during fiscal
2014
, fiscal
2013
or fiscal
2012
.
Debt Issuance Costs
The Company defers the costs associated with debt and financing arrangements. These costs are amortized over the life of the loan or financing as interest expense using the effective interest method. When debt or the contract is retired prematurely, the proportionate unamortized deferred issuance costs are expensed as loss on retirement. Deferred debt issuance costs expensed as part of interest expense for fiscal
2014
,
fiscal 2013
and
fiscal 2012
were
$4,572
,
$3,321
and
$4,127
, respectively. Included in these amounts are the acceleration of amortization associated with redemptions of our senior secured notes and our prior revolving credit facility.
Long-Lived Assets
The Company evaluates its long-lived assets for impairment whenever events or changes in circumstances indicate that the carrying amount of an asset may not be recoverable. Recoverability of these assets is measured by comparison of the carrying amounts to the future undiscounted cash flows that the assets are expected to generate. If the long-lived assets are considered impaired, the impairment to be recognized equals the amount by which the carrying value of the asset exceeds the estimated fair value and is recorded in the period the determination was made.
Stock-based Compensation
We account for share-based payments to employees in accordance with ASC 718,
Compensation-Stock Compensation
, which requires that share-based payments (to the extent they are compensatory) be recognized in our consolidated statements of operations and comprehensive income based on their fair values.
As required by ASC 718, we recognize stock-based compensation expense for share-based payments that are expected to vest. In determining whether an award is expected to vest, we use an estimated, forward-looking forfeiture rate based upon our historical forfeiture rates. Stock-based compensation expense recorded using an estimated forfeiture rate is updated for actual forfeitures quarterly. To the extent our actual forfeitures are different than our estimates, we record a true-up for the differences in the period that the awards vest, and such true-ups could materially affect our operating results. We also consider on a quarterly basis whether there have been any significant changes in facts and circumstances that would affect our expected forfeiture rate.
54
We are also required to determine the fair value of stock-based awards at the grant date. For option awards that are subject to service conditions and/or performance conditions, we estimate the fair values of employee stock options using a Black-Scholes-Merton valuation model. Some of our option grants and awards included a market condition for which we used a Monte Carlo pricing model to establish grant date fair value. These determinations require judgment, including estimating expected volatility. If actual results differ significantly from these estimates, stock- based compensation expense and our results of operations could be impacted.
Income Taxes
We account for income taxes under the asset and liability method that requires the recognition of deferred tax assets and liabilities for the expected future tax consequences of events that have been recognized in our financial statements or tax returns. Judgment is required in assessing the future tax consequences of events that have been recognized in our financial statements or tax returns. Variations in the actual outcome of these future tax consequences could materially impact our financial position, results of operations or effective tax rate.
Significant judgment is required in determining our worldwide income tax provision. In the ordinary course of a global business, there are many transactions and calculations where the ultimate tax outcome is uncertain. Some of these uncertainties arise as a consequence of revenue sharing and cost reimbursement arrangements among related entities, the process of identifying items of revenues and expenses that qualify for preferential tax treatment, and segregation of foreign and domestic earnings and expenses to avoid double taxation. Although we believe that our estimates are reasonable, the final tax outcome of these matters could be different from that which is reflected in our historical income tax provisions and accruals. Such differences could have a material effect on our income tax provision and net income in the period in which such determination is made.
In estimating future tax consequences, all expected future events are considered other than enactments of changes in tax laws or rates. Valuation allowances are established when necessary to reduce deferred tax assets to amounts which are more likely than not to be realized. We consider future growth, forecasted earnings, future taxable income, the mix of earnings in the jurisdictions in which we operate, historical earnings, taxable income in prior years, if carryback is permitted under the law, and prudent and feasible tax planning strategies in determining the need for a valuation allowance. In the event we were to determine that we would not be able to realize all or part of our net deferred tax assets in the future, an adjustment to the deferred tax assets valuation allowance would be charged to earnings in the period in which we make such a determination, or goodwill would be adjusted at our final determination of the valuation allowance related to an acquisition within the measurement period. If we later determine that it is more likely than not that the net deferred tax assets would be realized, we would reverse the applicable portion of the previously provided valuation allowance as an adjustment to earnings at such time. The amount of income tax we pay is subject to ongoing audits by federal, state and foreign tax authorities, which often result in proposed assessments. Our estimate of the potential outcome for any uncertain tax issue is highly judgmental. We account for these uncertain tax issues pursuant to ASC 740,
Income Taxes
, which contains a two-step approach to recognizing and measuring uncertain tax positions taken or expected to be taken in a tax return. The first step is to determine if the weight of available evidence indicates that it is more likely than not that the tax position will be sustained on audit, including resolution of any related appeals or litigation processes. The second step is to measure the tax benefit as the largest amount that is more than 50% likely to be realized upon ultimate settlement. Although we believe we have adequately reserved for our uncertain tax positions, no assurance can be given with respect to the final outcome of these matters. We adjust reserves for our uncertain tax positions due to changing facts and circumstances, such as the closing of a tax audit, judicial rulings, refinement of estimates or realization of earnings or deductions that differ from our estimates. To the extent that the final outcome of these matters is different than the amounts recorded, such differences generally will impact our provision for income taxes in the period in which such a determination is made. Our provisions for income taxes include the impact of reserve provisions and changes to reserves that are considered appropriate and also include the related interest and penalties.
During fiscal 2014, we adopted a permanent reinvestment position whereby we expect to reinvest our foreign earnings for most of our foreign subsidiaries and do not expect to repatriate future earnings. As a result of this policy change, we will no longer accrue a tax liability in anticipation of future dividends from our foreign subsidiaries.
Foreign Currency Transactions and Translation
Exchange adjustments resulting from foreign currency transactions are recognized in income as realized. For the Company's non-U.S. dollar functional currency subsidiaries, assets and liabilities of foreign subsidiaries are translated into U.S. dollars using year-end exchange rates. Income and expense items are translated at a weighted average exchange rate prevailing during the year. Adjustments resulting from translation of financial statements are reflected as a separate component of shareholders' equity.
55
Loss Contingencies
We accrue for probable losses from contingencies on an undiscounted basis, when such costs are considered probable of being incurred and are reasonably estimable. Legal expense related to such matters are expensed as incurred. We periodically evaluate available information, both internal and external, relative to such contingencies and adjust this accrual as necessary. Disclosure of a contingency is required if there is at least a reasonable possibility that a material loss has been incurred. In determining whether a loss should be accrued we evaluate, among other factors, the degree of probability of an unfavorable outcome and the ability to make a reasonable estimate of the amount of loss.
Warranties
The Company offers a standard warranty on product sales in which we will replace a defective product for a period of one year. Warranties on construction projects are negotiated individually, are typically one year in duration, and may include the cost of labor to replace products. Factors that affect the Company's warranty liability include the amount of sales, historical and anticipated rates of warranty claims, and cost per claim. The Company periodically assesses the adequacy of its recorded warranty liabilities and adjusts the amounts as necessary.
Research and Development
Research and development expenditures are expensed when incurred and are included in marketing, general and administrative and engineering expenses. Research and development expenses include salaries, direct costs incurred, and building and overhead expenses. The amounts expensed for
fiscal 2014
,
fiscal 2013
and
fiscal 2012
were
$3,008
,
$2,832
and
$881
, respectively.
Shipping and Handling Cost
The Company includes shipping and handling as part of cost of goods sold and freight collections from customers is included as part of sales.
Economic Dependence
No customer represented more than 10% of the Company's accounts receivable at
March 31, 2014
and March 31,
2013
, or sales for
fiscal 2014
,
fiscal 2013
or
fiscal 2012
.
Reclassifications
Certain reclassifications have been made within these consolidated financial statements to conform prior periods to current year presentation.
Recent Accounting Pronouncements
Presentation of Comprehensive Income -
In February 2013, the Accounting Standards Codification (ASC) ASC Topic 220, "Comprehensive Income," was amended to require an entity to disclose information about the amounts reclassified out of accumulated other comprehensive income by component. For amounts required to be reclassified out of accumulated other comprehensive income in their entirety in the same reporting period, the guidance requires entities to present significant amounts by their respective line items of net income, either on the face of the income statement or in the notes to the financial statements. For other amounts that are not required to be reclassified to net income in their entirety, a cross-reference is required to other disclosures that provide additional details about those amounts. These provisions are effective for interim and annual reporting periods beginning after December 15, 2012. The adoption of this guidance effective April 1, 2013 did not have a material impact on our consolidated financial statements.
Fair Value Measurements and Disclosures -
The FASB issued an Accounting Standard Update ("ASU") in December 2011, which requires an entity to disclose information about offsetting and related arrangements to enable users of its financial statements to understand the effect of these arrangements on its financial position. The guidance requires entities to disclose both gross and net information about both instruments and transactions eligible for offset in the balance sheet and instruments and transactions subject to an agreement similar to a master netting arrangement. In January 2013, the FASB amended and clarified the scope of the disclosures to include only derivative instruments, repurchase agreements and securities lending transactions. The provisions for this ASU are effective for annual periods and interim periods within those years beginning on or after January 1, 2013. The adoption of this ASU did not have a material impact on our consolidated financial statements.
56
2. Fair Value Measurements
Fair Value
. We measure fair value based on authoritative accounting guidance, which defines fair value, establishes a framework for measuring fair value and expands on required disclosures regarding fair value measurements.
Inputs are referred to as assumptions that market participants would use in pricing the asset or liability. The uses of inputs in the valuation process are categorized into a three-level fair value hierarchy.
|
•
|
Level 1 — uses quoted prices in active markets for identical assets or liabilities we have the ability to access.
|
|
•
|
Level 2 — uses observable inputs other than quoted prices in Level 1, such as quoted prices for similar assets and liabilities in active markets; quoted prices for identical or similar assets and liabilities in markets that are not active; or other inputs that are observable or can be corroborated by observable market data.
|
|
•
|
Level 3 — uses one or more significant inputs that are unobservable and supported by little or no market activity, and that reflect the use of significant management judgment.
|
Financial assets and liabilities with carrying amounts approximating fair value include cash, trade accounts receivable, accounts payable, accrued expenses and other current liabilities. The carrying amount of these financial assets and liabilities approximates fair value because of their short maturities. At
March 31, 2014
and
March 31, 2013
, no assets or liabilities were valued using Level 3 criteria.
Information about our long-term debt that is not measured at fair value follows:
|
|
March 31, 2014
|
March 31, 2013
|
|
||||||||||||||
|
|
Carrying
Value
|
Fair Value
|
Carrying
Value
|
Fair Value
|
Valuation Technique
|
||||||||||||
|
Financial Liabilities
|
|
|
|
|
|
|
|
|
|
||||||||
|
Senior secured credit facility
|
$
|
121,500
|
|
$
|
121,500
|
|
$
|
—
|
|
$
|
—
|
|
Level 2 - Market Approach
|
||||
|
9.5% senior secured notes
|
$
|
—
|
|
$
|
—
|
|
$
|
118,145
|
|
$
|
131,436
|
|
Level 2 - Market Approach
|
||||
At
March 31, 2014
, the fair value of our variable rate term loan approximates its carrying value as we pay interest based on the current market rate. As the quoted price is only available for similar financial assets, the Company concluded the pricing is indirectly observable through dealers and has been classified as Level 2. Differences between the fair value and the carrying value for the senior secured notes as of March 31, 2013 are primarily due to the instruments' fixed interest rate. Inherently, such instruments are subject to fluctuations in fair value due to movements in interest rates. Our 9.5% senior secured notes, which we fully redeemed in fiscal 2014, traded on over the counter markets. As the quoted price was only available through a dealer, the Company concluded the market was not active enough to be classified as a Level 1 valuation. However, the pricing was indirectly observable through dealers and has been classified as Level 2.
Foreign Currency Forward Contracts
We transact business in various foreign currencies and have established a program that primarily utilizes foreign currency forward contracts to offset the risk associated with fluctuations of certain foreign currencies. Under this program, increases or decreases in our foreign currency exposures are offset by gains or losses on the forward contracts to mitigate foreign currency transaction gains or losses. These foreign currency exposures typically arise from intercompany transactions. Our forward contracts generally have terms of
30
days. We do not use forward contracts for trading purposes or designate these forward contracts as hedging instruments pursuant to ASC 815. We adjust the carrying amount of all contracts to their fair value at the end of each reporting period and unrealized gains and losses are included in our results of operations for that period. These gains and losses largely offset gains and losses resulting from settlement of payments received from our foreign operations which are settled in U.S. dollars. All outstanding foreign currency forward contracts are marked to market at the end of the period with unrealized gains and losses included in other expense. The fair value is determined by quoted prices from active foreign currency markets (Level 2). The consolidated balance sheets reflect unrealized gains within accounts receivable, net and unrealized losses within accrued liabilities. Our ultimate realized gain or loss with respect to currency fluctuations will depend on the currency exchange rates and other factors in effect as the contracts mature. As of
March 31, 2014
and
March 31, 2013
, the notional amounts of forward contracts were as follows:
57
|
Notional amount of foreign exchange forward contracts by currency
|
|||||||
|
March 31, 2014
|
March 31, 2013
|
||||||
|
Russian Ruble
|
$
|
772
|
|
$
|
4,233
|
|
|
|
Euro
|
2,386
|
|
2,510
|
|
|||
|
Canadian Dollar
|
—
|
|
2,134
|
|
|||
|
South Korean Won
|
532
|
|
919
|
|
|||
|
Indian Rupee
|
2,574
|
|
329
|
|
|||
|
Mexican Peso
|
1,077
|
|
—
|
|
|||
|
Other
|
837
|
|
—
|
|
|||
|
Total notional amounts
|
$
|
8,178
|
|
$
|
10,125
|
|
|
|
March 31, 2014
|
March 31, 2013
|
|||||||||||||
|
Fair Value
|
Fair Value
|
|||||||||||||
|
Assets
|
Liabilities
|
Assets
|
Liabilities
|
|||||||||||
|
Foreign exchange contract forwards
|
$
|
35
|
|
$
|
93
|
|
$
|
87
|
|
$
|
32
|
|
||
Recognized foreign currency gains or losses related to our forward contracts in the accompanying consolidated statements of operations and comprehensive income were a loss of
$309
and a gain of
$3
for fiscal
2014
and fiscal
2013
, respectively. In fiscal 2012, we incurred losses of
$554
on our foreign currency forward contracts. Gains and losses from our forward contracts were offset by transaction gain and losses from the settlement of transactions denominated in foreign currencies. Our net foreign currency losses were
$613
,
$423
,
and
$1,625
for
fiscal 2014
,
fiscal 2013
, and
fiscal 2012
, respectively. Foreign currency gains and losses are recorded within other expense in our consolidated statements of operations and comprehensive income.
Interest Rate Swap
On June 13, 2013, the Company entered into an interest rate swap contract to reduce the exposure to interest rate fluctuations associated with its variable rate term loan. Under the agreement we will pay a fixed amount and receive or make payments based on a variable rate. Effective July 1, 2013, the Company designated the interest rate swap contract as a cash flow hedge pursuant to ASC 815. The Company formally documents all relationships between the hedging instrument and hedged item, its risk management objective and strategy, as well as counter-party creditworthiness. At each reporting period our interest rate swap contract is adjusted to fair value based on dealer quotes, which consider forward curves and volatility levels (Level 2). Unrealized gains, representing derivative assets, are reported within accounts receivable, net and unrealized losses, representing derivative liabilities, are reported within accrued liabilities on the accompanying condensed consolidated balance sheets. As of
March 31, 2014
, the fair value of the interest rate swap contract was an unrealized gain of
$108
. The change in fair value of the derivative instrument is recorded in accumulated other comprehensive loss to the extent the derivative instruments are deemed effective. Ineffectiveness is measured based on the changes in fair value of the interest rate swap contract and the change in fair value of the hypothetical derivative and is recognized in earnings in the period in which ineffectiveness is realized. Based on the criteria established by ASC 815, the interest rate swap contract is deemed to be highly effective. Any realized gains or losses resulting from the interest rate swap contract are recognized within interest expense. Gains and losses from our interest rate swap contract are offset by changes in the variable interest rate on our term loan. Since the effective date of our interest rate swap contract, interest expense on outstanding principal has been 3.62%. We have hedged 100% of the future interest payments on our variable rate term loan through its maturity date.
58
The following table summarizes the aggregate unrealized loss in accumulated other comprehensive loss, and the losses reclassified into earnings for the year ended
March 31, 2014
:
|
Year Ended March 31, 2014
|
|||
|
Unrealized gain/(loss) at beginning of the period
|
$
|
—
|
|
|
Add: gain/(loss) from change in fair value of cash flow hedge
|
(689
|
)
|
|
|
Add: non-fair value derivative asset transferred into accumulated other comprehensive income
|
(211
|
)
|
|
|
Less: loss reclassified into earnings from effective hedge
|
(797
|
)
|
|
|
Less: ineffective portion of hedge transferred into earnings
|
(22
|
)
|
|
|
Unrealized loss at end of the period
|
$
|
(81
|
)
|
We did not have any interest rate swaps during the years ended March 31, 2013 and March 31, 2012, respectively.
Transfers out of accumulated other comprehensive loss
During the year ended March 31, 2014,
$797
and
$22
of were transferred out of accumulated other comprehensive loss related to realized losses on our interest rate swap contract, and hedge ineffectiveness, respectively.
3. Net Income per Common Share
Basic net income per share is computed by dividing net income by the weighted average number of common shares outstanding during each period. Diluted net income per share is computed by dividing net income by the weighted average number of common shares and common share equivalents outstanding (if dilutive) during each period. The number of common share equivalents, which includes options and both restricted and performance stock units, is computed using the treasury stock method. With regard to the performance stock units, we assumed that the associated performance targets will be met at the target level of performance for purposes of calculating diluted net income per common share for fiscal 2014 and 2013, the only periods in which the performance stock units were outstanding.
The reconciliation of the denominators used to calculate basic EPS and diluted EPS for fiscal
2014
, fiscal
2013
, and
fiscal 2012
, respectively, is as follows:
|
Year Ended March 31, 2014
|
Year Ended March 31, 2013
|
Year Ended March 31, 2012
|
||||||||||
|
Basic net income per common share
|
||||||||||||
|
Net income
|
$
|
25,799
|
|
$
|
26,974
|
|
$
|
12,030
|
|
|||
|
Weighted-average common shares outstanding
|
31,595,019
|
|
30,796,675
|
|
29,083,478
|
|
||||||
|
Basic net income per common share
|
$
|
0.82
|
|
$
|
0.88
|
|
$
|
0.41
|
|
|||
|
Year Ended March 31, 2014
|
Year Ended March 31, 2013
|
Year Ended March 31, 2012
|
||||||||||
|
Diluted net income per common share
|
|
|
|
|
||||||||
|
Net income
|
$
|
25,799
|
|
$
|
26,974
|
|
$
|
12,030
|
|
|||
|
Weighted-average common shares outstanding
|
31,595,019
|
|
30,796,675
|
|
29,083,478
|
|
||||||
|
Common share equivalents:
|
||||||||||||
|
Stock options issued
|
502,886
|
|
953,710
|
|
1,370,777
|
|
||||||
|
Restricted and performance stock units issued
|
56,007
|
|
46,445
|
|
—
|
|
||||||
|
Weighted average shares outstanding – dilutive
|
32,153,912
|
|
31,796,830
|
|
30,454,255
|
|
||||||
|
Diluted net income per common share
|
$
|
0.80
|
|
$
|
0.85
|
|
$
|
0.40
|
|
|||
For the year ended March 31, 2014,
168,118
equity awards were not included in the calculation of diluted net income per common share since they would have had an anti-dilutive effect. In fiscal 2013 and 2012, all equity awards were dilutive and included in the calculation above.
59
4. Inventories
Inventories consisted of the following at March 31:
|
2014
|
2013
|
||||||
|
Raw materials
|
$
|
12,036
|
|
$
|
10,232
|
|
|
|
Work in process
|
2,200
|
|
1,685
|
|
|||
|
Finished goods
|
23,973
|
|
23,550
|
|
|||
|
|
38,209
|
|
35,467
|
|
|||
|
Valuation reserves
|
(893
|
)
|
(1,076
|
)
|
|||
|
Inventories, net
|
$
|
37,316
|
|
$
|
34,391
|
|
|
The following table summarizes the annual changes in our valuation reserve accounts:
|
Balance at March 31, 2011
|
$
|
1,705
|
|
||
|
Reduction in reserve
|
(594
|
)
|
|||
|
Charged to reserve
|
(17
|
)
|
|||
|
Balance at March 31, 2012
|
1,094
|
|
|||
|
Additions charged to expense
|
179
|
|
|||
|
Charged to reserve
|
(197
|
)
|
|||
|
Balance at March 31, 2013
|
1,076
|
|
|||
|
Reduction in reserve
|
(129
|
)
|
|||
|
Charged to reserve
|
(54
|
)
|
|||
|
Balance at March 31, 2014
|
$
|
893
|
|
||
5. Property, Plant and Equipment
Property, plant and equipment consisted of the following at March 31:
|
2014
|
2013
|
|||||||
|
Land, buildings and improvements
|
$
|
19,874
|
|
$
|
19,372
|
|
||
|
Machinery and equipment
|
13,641
|
|
12,114
|
|
||||
|
Office furniture and equipment
|
3,491
|
|
3,110
|
|
||||
|
Internally developed software
|
1,744
|
|
1,744
|
|
||||
|
Construction in Progress
|
1,732
|
|
1,042
|
|
||||
|
Accumulated depreciation
|
(8,950
|
)
|
(6,171
|
)
|
||||
|
$
|
31,532
|
|
$
|
31,211
|
|
|||
Depreciation expense was
$3,088
,
$2,619
and
$2,593
, in fiscal
2014
, fiscal
2013
, and
fiscal 2012
, respectively.
Included within depreciation expense was amortization of internally developed software of
$368
,
$237
, and
$151
, in fiscal
2014
, fiscal
2013
and
fiscal 2012
, respectively.
60
6. Goodwill and Other Intangible Assets
The carrying amount of goodwill as of
March 31, 2014
, is as follows:
|
Amount
|
||||
|
Balance as of March 31, 2013
|
$
|
116,303
|
|
|
|
Foreign currency translation impact
|
(2,191
|
)
|
||
|
Balance as of March 31, 2014
|
$
|
114,112
|
|
|
The Company does not expect goodwill recorded to be deductible for tax purposes.
Intangible assets at
March 31, 2014
and
March 31, 2013
consisted of the following:
|
Gross Carrying Amount at March 31, 2014
|
Accumulated Amortization
|
Net Carrying Amount at March 31, 2014
|
Gross Carrying Amount at March 31, 2013
|
Accumulated Amortization
|
Net Carrying Amount at March 31, 2013
|
|||||||||||||||||||
|
Trademarks
|
$
|
47,042
|
|
$
|
—
|
|
$
|
47,042
|
|
$
|
47,693
|
|
$
|
—
|
|
$
|
47,693
|
|
||||||
|
Developed technology
|
10,781
|
|
(2,167
|
)
|
8,614
|
|
10,929
|
|
(1,659
|
)
|
9,270
|
|
||||||||||||
|
Customer relationships
|
99,578
|
|
(37,383
|
)
|
62,195
|
|
101,355
|
|
(27,723
|
)
|
73,632
|
|
||||||||||||
|
Backlog
|
9,874
|
|
(9,874
|
)
|
—
|
|
10,167
|
|
(10,167
|
)
|
—
|
|
||||||||||||
|
Certification
|
498
|
|
—
|
|
498
|
|
498
|
|
—
|
|
498
|
|
||||||||||||
|
Other
|
1,630
|
|
(1,062
|
)
|
568
|
|
1,630
|
|
(807
|
)
|
823
|
|
||||||||||||
|
Total
|
$
|
169,403
|
|
$
|
(50,486
|
)
|
$
|
118,917
|
|
$
|
172,272
|
|
$
|
(40,356
|
)
|
$
|
131,916
|
|
||||||
Trademarks and certifications have indefinite lives. Developed technology, customer relationships, backlog and other intangible assets have estimated lives of
20 years
,
10 years
,
4 months
and
6 years
, respectively. The weighted average useful life for the group is
10 years
. Portions of intangible assets are valued in foreign currencies; accordingly changes in indefinite life intangible assets at March 31,
2014
and March 31,
2013
were the result of foreign currency translation adjustments.
The Company recorded amortization expense of
$11,090
,
$11,211
, and
$11,379
in fiscal
2014
, fiscal
2013
and
fiscal 2012
, respectively. Annual amortization for the next five years and thereafter will approximate the following:
|
2015
|
$
|
10,964
|
|
|
|
2016
|
10,964
|
|
||
|
2017
|
10,767
|
|
||
|
2018
|
10,709
|
|
||
|
2019
|
10,709
|
|
||
|
Thereafter
|
17,264
|
|
||
|
Total
|
$
|
71,377
|
|
|
61
7. Accrued Liabilities
Accrued current liabilities consisted of the following:
|
|
March 31,
2014 |
March 31,
2013 |
|||||
|
Accrued employee compensation and related expenses
|
$
|
5,043
|
|
$
|
8,047
|
|
|
|
Interest
|
—
|
|
4,703
|
|
|||
|
Customer prepayment
|
1,235
|
|
2,197
|
|
|||
|
Warranty reserve
|
645
|
|
552
|
|
|||
|
Professional fees
|
1,250
|
|
1,436
|
|
|||
|
Sales tax payable
|
707
|
|
175
|
|
|||
|
Other
|
989
|
|
1,605
|
|
|||
|
Total accrued current liabilities
|
$
|
9,869
|
|
$
|
18,715
|
|
|
8. Short-Term Revolving Credit Facilities
The Company’s subsidiary in the Netherlands has a revolving credit facility in the amount of Euro
4,000
(equivalent to
$5,501
USD at
March 31, 2014
). The facility is collateralized by receivables, inventory, equipment, furniture and real estate.
No
loans were outstanding on this facility at
March 31, 2014
and
2013
.
The Company’s subsidiary in India has a revolving credit facility in the amount of
80,000
Rupees (equivalent to
$1,331
USD at
March 31, 2014
). The facility is collateralized by receivables, inventory, real estate, a letter of credit and cash.
No
loans were outstanding under the facility at
March 31, 2014
and
2013
.
The Company’s subsidiary in Australia has a revolving credit facility in the amount of
$325
Australian Dollars (equivalent to
$301
USD at
March 31, 2014
). The facility is collateralized by real estate.
No
loans were outstanding under the facility at
March 31, 2014
and
2013
.
The Company’s subsidiary in Japan has a revolving credit facility in the amount of
45,000
Japanese Yen (equivalent to
$438
USD at
March 31, 2014
).
No
loans were outstanding under the Japanese revolving credit facility at
March 31, 2014
and
2013
.
Under the Company’s senior secured revolving credit facility described below in Note 9, “Long-Term Debt,” there were
no
outstanding borrowings at
March 31, 2014
and
2013
.
Long-term debt consisted of the following:
|
|
March 31,
2014 |
March 31,
2013 |
|||||
|
9.500% Senior Secured Notes, due May 2017
|
$
|
—
|
|
$
|
118,145
|
|
|
|
Variable Rate Term Loan, due April 2018
|
121,500
|
|
—
|
|
|||
|
|
121,500
|
|
118,145
|
|
|||
|
Less current portion
|
(13,500
|
)
|
—
|
|
|||
|
|
$
|
108,000
|
|
$
|
118,145
|
|
|
Senior secured credit facility
On April 19, 2013, we entered into an amended and restated credit agreement with a group of lenders in the United States and Canada with JPMorgan Chase Bank, N.A. continuing to serve as lead administrative agent, which provided for (i) a five-year
$135,000
senior secured term loan facility and (ii) a five-year
$60,000
senior secured revolving credit facility, which
62
we refer to collectively as our "credit facility." The term loan borrowings were used to redeem our outstanding senior secured notes, see "senior secured notes and refinancing under a term loan" below.
Under our credit facility, in no case shall availability exceed commitments thereunder. The credit facility will mature in April 2018. Any credit facility borrowings will bear interest, at our option, at a rate equal to either (i) a base rate determined by reference to the greatest of (a) JP Morgan Chase Bank's prime rate in New York City, (b) the federal funds effective rate in effect on such day plus ½ of 1% and (c) the adjusted LIBOR rate for a one month interest period on such day plus 1%, in each case plus an applicable margin dictated by our leverage ratio, or (ii) the LIBOR rate, plus an applicable margin dictated by our leverage ratio. Borrowings denominated in Canadian Dollars under the Canadian sub-facility bear interest at our option, at a rate equal to either (i) a base rate determined by reference to the greater of (a) JPMorgan Chase Bank, Toronto branch's prime rate and (b) the sum of (x) the yearly interest rate to which the one-month Canadian deposit offered rate is equivalent plus (y) 1.0%, in each case plus an applicable margin dictated by our leverage ratio, or (ii) a Canadian deposit offered rate determined by the sum of (a) the annual rate of interest determined with reference to the arithmetic average of the discount rate quotations of all institutions listed in respect of the relevant period for Canadian dollar-denominated bankers' acceptances plus (b) 0.10% per annum, plus an applicable margin dictated by our leverage ratio. In addition to paying interest on outstanding borrowings under our credit facility, we are currently required to pay a
0.4%
per annum commitment fee to the lenders in respect of the unutilized commitments thereunder, which commitment fee could change based on our leverage ratio, and letter of credit fees equal to the LIBOR margin or the Canadian deposit offered rate, as applicable, on the undrawn amount of all outstanding letters of credit, in addition to a
0.125%
annual fronting fee. At
March 31, 2014
, we had
no
outstanding borrowings under our revolving credit facility. If there had been any outstanding borrowings thereunder, the interest rate would have been approximately
2.69%
. As of
March 31, 2014
, we had
$59,137
of capacity available under our revolving credit facility after taking into account outstanding letters of credit. The variable rate term loan bears interest at the LIBOR rate plus an applicable margin dictated by our leverage ratio. As of
March 31, 2014
, our interest rate was
2.69%
. The term loan includes monthly principal payments of
$1,125
through March 31, 2016, increasing to
$1,688
for the last two years of the loan. The remaining
$54,000
is due in April 2018.
Senior secured notes and refinancing under a term loan.
On May 20, 2013, we utilized the proceeds from our new variable rate term loan to redeem the remaining
$118,145
of aggregate principal amount outstanding of our 9.5% senior secured notes. In conjunction with the redemption, we paid a total of
$15,485
in redemption premiums and expensed the remaining
$4,010
of associated deferred debt issuance costs. In fiscal 2013, the Company made partial redemptions of the senior secured notes in the amount of
$21,000
. As of the result of the redemption
$871
of deferred debt issuance cost amortization was recorded.
Interest rate swap.
On June 13, 2013, the Company entered into an interest rate swap to reduce the exposure to interest rate fluctuations associated with its variable rate term loan. Under the agreement we pay a fixed amount and receive payments based on a variable interest rate. The swap became effective as of July 31, 2013 and fixed the interest rate of the term loan at
3.62%
. As of March 31, 2014, we have hedged 100% of the future interest payments on our variable rate term loan through its maturity date.
Guarantees; security.
The obligations under our credit facility are guaranteed on a senior secured basis by each of our existing and future domestic restricted subsidiaries, including Thermon Industries, Inc., the U.S. borrower under our credit facility. The obligations under our credit facility are secured by a first priority perfected security interest in substantially all of our assets, subject to certain exceptions, permitted liens and encumbrances reasonably acceptable to the administrative agent under our credit facility.
Restrictive covenants.
The credit facility contains various restrictive covenants that, among other things, restrict, subject to certain negotiated exceptions, our ability to: incur additional indebtedness or issue disqualified capital stock unless certain financial tests are satisfied; pay dividends, redeem subordinated debt or make other restricted payments; make certain investments or acquisitions; issue stock of subsidiaries; grant or permit certain liens on our assets; enter into certain transactions with affiliates; merge, consolidate or transfer substantially all of our assets; incur dividend or other payment restrictions affecting certain of our subsidiaries; transfer or sell assets, including capital stock of our subsidiaries; and change the business we conduct. As of March 31, 2014, we were in compliance with all restrictive covenants of the credit facility.
63
Maturities of long-term debt are as follows for the fiscal years ended March 31:
|
2015
|
$
|
13,500
|
|
|
|
2016
|
13,500
|
|
||
|
2017
|
20,250
|
|
||
|
2018
|
20,250
|
|
||
|
2019
|
54,000
|
|
||
|
Total
|
$
|
121,500
|
|
|
10. Related-Party Transactions
Included in our consolidated balance sheets is “Obligations due to settle the CHS Transactions,” which totaled
$567
and
$3,239
at
March 31, 2014
and March 31, 2013, respectively. These amounts represent amounts due to the Predecessor owners in final settlement of the acquisition by our former private equity sponsors of a controlling interest in us that was completed on April 30, 2010. During fiscal 2014 and fiscal 2013, we paid
$2,055
and
$289
, respectively, to the Predecessor owners, in each case reflected in "Obligations due to settle the CHS Transactions." During fiscal 2014, we received an income tax refund, in the amount of
$2,004
from the United States Internal Revenue Service which we paid to the Predecessor owners because the refund related to tax periods in which they were in control of the Company, additionally the obligation was reduced by
$617
, of which
$42
was withheld for professional fees incurred by the Company in connection with a concluded audit by the United States Internal Revenue Service, the remaining
$575
was determined not to be payable to the Predecessor owners of the Company. At
March 31, 2014
, the remaining
$567
outstanding represents remaining encumbered cash to be released as letters of credit and bank guarantees expire.
At March 31, 2014, approximately
$3,589
of the purchase price consideration from the CHS Transactions was held in escrow to secure the Predecessor's indemnification obligations in the event of any breaches of representation and warranties contained in the definitive agreements.
We paid management and transaction success fees to, and reimbursed the out of pocket expenses of, our former private
equity sponsors of
$8,158
in fiscal 2012 which is reported as part of marketing general and administrative and engineering expense and included
$7,400
paid to the former private equity sponsors in fees for the termination of their respective management agreements.
11. Employee Benefits
The Company has defined contribution plans covering substantially all domestic employees and certain foreign subsidiary employees who meet certain service and eligibility requirements. Participant benefits are
100%
vested upon participation. The Company matches employee contributions, limited to
50%
of the first
6%
of each employee's salary contributed. The Company's matching contributions to defined contribution plans on a consolidated basis were approximately
$1,579
,
$1,458
, and
$1,357
in
fiscal 2014
,
fiscal 2013
, and
fiscal 2012
, respectively.
The Company has an incentive compensation program to provide employees with incentive pay based on the Company's ability to achieve certain profitability objectives. The Company recorded approximately
$1,272
, $
4,268
, and
$6,943
for incentive compensation earned in
fiscal 2014
,
fiscal 2013
, and
fiscal 2012
, respectively.
12. Commitments and Contingencies
At
March 31, 2014
, the Company had in place letter of credit guarantees and performance bonds securing performance obligations of the Company. These arrangements totaled approximately
$13,347
. Of this amount,
$1,307
is secured by cash deposits at the Company's financial institutions. The remaining
$12,040
represents a reduction of the available amount of the Company's short term and long term revolving lines of credit. Included in prepaid expenses and other current assets at
March 31, 2014
and March 31, 2013, was approximately
$1,307
and
$1,978
, respectively, of cash deposits pledged as collateral on performance bonds and letters of credit.
The Company leases various property and equipment under operating leases. Lease expense was approximately
$3,033
,
$2,362
, and
$2,021
in fiscal
2014
,
fiscal 2013
and
fiscal 2012
, respectively. Future minimum annual lease payments under these leases are as follows for the fiscal years ended March 31:
|
2015
|
$
|
2,940
|
|
|
|
2016
|
2,308
|
|
||
|
2017
|
1,357
|
|
||
|
2018
|
741
|
|
||
|
2019
|
420
|
|
||
|
Thereafter
|
1,453
|
|
||
|
$
|
9,219
|
|
||
64
The Company has entered into information technology service agreements with several vendors. The service fees expense amounted to
$2,060
,
$1,160
, and
$1,026
in fiscal
2014
,
fiscal 2013
and
fiscal 2012
, respectively. The future annual service fees under the service agreements are as follows for the fiscal years ended March 31:
|
2015
|
$
|
2,110
|
|
|
|
2016
|
889
|
|
||
|
2017
|
162
|
|
||
|
2018
|
—
|
|
||
|
2019
|
—
|
|
||
|
Thereafter
|
—
|
|
||
|
$
|
3,161
|
|
||
In the ordinary course of conducting its business, the Company becomes involved in various lawsuits and administrative proceedings. Some of these proceedings may result in fines, penalties, or judgment being assessed against the Company, which, from time to time, may have an impact on earnings. As of
March 31, 2014
, management believes that adequate reserves have been established for any probable losses.
We do not currently expect any of the following proceedings will have a material adverse effect on the Company's operations or financial position. We cannot, however, provide any assurances that we will prevail in any of these matters.
Notice of Tax Dispute with the Canada Revenue Agency.
On June 13, 2011, we received notice from the Canada Revenue Agency, which we refer to as the "Agency," advising us that they disagree with the tax treatment we proposed with respect to certain asset transfers that were completed in August 2007 by our Predecessor owners. During fiscal 2013, we were informed by the Agency that their initial audit was concluded but they intended to make an assessment under Canada's General Anti Avoidance Rule. Under this rule, the Agency may assess a withholding tax on dividends deemed to have been made on loans made to our Canadian subsidiary during 2007. Such assessment could total
$3,000
plus penalties and interest. At March 31, 2014, we have not recorded a tax liability reserve due for this matter with the Agency as we consider it more likely than not that our tax position will be fully sustained. While we intend to vigorously contest any assessment the Agency may make against us in this matter, we expect that any liability will be covered under an indemnity agreement with the Predecessor owners.
Russia Tax Audit.
Our income tax returns for the three years ended December 31, 2012 are subject to ongoing audits with the Russian tax authority. As of March 31, 2014, we were issued an assessment by the Russian tax authority for which we will file an objection. As of March 31, 2014, we have accrued
$167
in our consolidated financial statements for the amount we believe to be payable to the Russian tax authority. See Note 14, “Income Taxes.”
Changes in the Company's warranty reserve are as follows:
|
Balance at March 31, 2011
|
$
|
1,325
|
|
||
|
Reserve for warranties issued during the period
|
445
|
|
|||
|
Settlements made during the period
|
(913
|
)
|
|||
|
Balance at March 31, 2012
|
$
|
857
|
|
||
|
Reserve for warranties issued during the period
|
15
|
|
|||
|
Settlements made during the period
|
(320
|
)
|
|||
|
Balance at March 31, 2013
|
$
|
552
|
|
||
|
Reserve for warranties issued during the period
|
364
|
|
|||
|
Settlements made during the period
|
(271
|
)
|
|||
|
Balance at March 31, 2014
|
$
|
645
|
|
||
Management Employment Contracts-
Our four named executive officers were subject to employment agreements that provided for the payment of benefits in connection with certain qualifying termination events, which included continued
65
payment of their base salary for up to twelve months and any earned but unpaid bonus for the current fiscal year. As a group, the combined possible severance payment would have been
$1,463
in continued base salary and earned but unpaid bonus for the fiscal year ended March 31, 2014 if they were terminated in connection with a qualifying termination event as of March 31, 2014. Effective May 1, 2014, we entered into new employment agreements with our four named executive officers.
The new employment agreements provide for the payment of benefits in connection with certain qualifying termination events, which include continuation of base salary for 6 to 18 months, depending on the qualifying termination event, and any earned but unpaid bonus for the current fiscal year. If such qualifying termination event occurs under the new employment agreements, the senior executive officers as a group would be entitled to receive between
$568
and
$1,705
in continuation of base salary, plus any accrued but unpaid bonus for the current fiscal year.
13. Stock-Based Compensation Expense
Since the completion of the CHS Transactions on April 30, 2010, the Board of Directors has adopted and the shareholders have approved two stock option award plans. The 2010 Thermon Group Holdings, Inc. Restricted Stock and Stock Option Plans (“2010 Plan”) was approved on July 28, 2010. The plan authorized the issuance of
2,767,171
stock options or restricted shares (on a post stock split basis). On April 8, 2011, the Board of Directors approved the Thermon Group Holdings, Inc. 2011 Long-Term Incentive Plan (“2011 LTIP”). The 2011 LTIP made available
2,893,341
shares of the Company's common stock that may be awarded to employees, directors or non-employee contractor's compensation in the form of stock options or restricted stock awards. Collectively, the 2010 Plan and the 2011 LTIP are referred to as the “Stock Plans.” The Company does not hold any shares of its own stock as treasury shares. Accordingly, the vesting of restricted stock units and performance stock units and the exercise of stock options result in the issuance of additional new shares of the Company's stock.
At the completion of the IPO on May 5, 2011,
2,757,524
options that were then unvested became vested and exercisable. Accordingly, the Company recorded stock compensation expense of
$6,310
which represented all unamortized stock compensation expense related to the outstanding stock options under the 2010 Plan.
Unvested options outstanding are scheduled to vest over
five
years with
20%
vesting on the anniversary date of the grant each year. Stock options must be exercised within
10
years from date of grant. Stock options were issued with an exercise price which was equal to the market price of our common stock at the grant date. We estimate potential forfeitures of stock grants and adjust compensation cost recorded accordingly. The estimate of forfeitures will be adjusted over the requisite service period to the extent that actual forfeitures differ, or are expected to differ, from such estimates. Changes in estimated forfeitures will be recognized through a cumulative catch-up adjustment in the period of change and will also impact the amount of stock compensation expense to be recognized in future periods. During
fiscal 2014
, we did not make any changes in accounting principles or methods of estimates relating to stock-based compensation expense.
66
Stock Options
A summary of stock option activity under our Stock Plans for
fiscal 2014
,
fiscal 2013
and
fiscal 2012
are as follows:
|
Options Outstanding
|
||||||||
|
Number of Shares
|
Weighted Average Exercise Price
|
|||||||
|
Balance at March 31, 2011
|
2,757,524
|
|
$
|
5.38
|
|
|||
|
Granted
|
117,600
|
|
12.00
|
|
||||
|
Exercised
|
(683,443
|
)
|
5.38
|
|
||||
|
Forfeited
|
(12,056
|
)
|
6.46
|
|
||||
|
Balance at March 31, 2012
|
2,179,625
|
|
$
|
5.74
|
|
|||
|
Granted
|
56,532
|
|
21.52
|
|
||||
|
Exercised
|
(1,086,486
|
)
|
5.31
|
|
||||
|
Forfeited
|
(16,891
|
)
|
7.98
|
|
||||
|
Balance at March 31, 2013
|
1,132,780
|
|
$
|
6.98
|
|
|||
|
Exercised
|
(566,487
|
)
|
5.90
|
|
||||
|
Forfeited
|
(7,827
|
)
|
15.73
|
|
||||
|
Balance at March 31, 2014
|
558,466
|
|
$
|
7.96
|
|
|||
For
fiscal 2014
,
fiscal 2013
and fiscal 2012 the intrinsic value of stock option exercises was
$10,285
,
$18,387
, and
$8,860
, respectively. For the year ended
March 31, 2014
, the Company had a tax loss in the United States and therefore did not recognize an excess tax deduction from options exercised of
$1,452
. For the years ended March 31, 2013 and 2012, this benefit was
$4,131
and
$2,181
, respectively and was recorded in Additional paid in capital.
|
Unvested Options
|
||||||||
|
Number of Shares
|
Weighted Average Grant Date Fair Value
|
|||||||
|
Balance at March 31, 2011
|
2,757,524
|
|
$
|
2.97
|
|
|||
|
Granted
|
117,600
|
|
5.99
|
|
||||
|
Vested
|
(2,757,524
|
)
|
2.97
|
|
||||
|
Balance at March 31, 2012
|
117,600
|
|
$
|
5.99
|
|
|||
|
Granted
|
56,532
|
|
12.26
|
|
||||
|
Vested
|
(23,520
|
)
|
5.99
|
|
||||
|
Forfeited
|
(4,386
|
)
|
8.32
|
|
||||
|
Balance at March 31, 2013
|
146,226
|
|
$
|
8.34
|
|
|||
|
Vested
|
(33,001
|
)
|
6.92
|
|
||||
|
Forfeited
|
(7,827
|
)
|
8.32
|
|
||||
|
Balance at March 31, 2014
|
105,398
|
|
$
|
8.33
|
|
|||
For
fiscal 2014
,
fiscal 2013
and fiscal 2012, we recorded stock based compensation of
$2,203
,
$1,341
, and
$6,514
, respectively. Total unrecognized expense related to non-vested stock option awards was approximately
$704
as of
March 31, 2014
. We anticipate this expense will be recognized over a weighted average period of approximately
2.58
years.
67
The following table summarizes information about stock options outstanding as of
March 31, 2014
:
|
Options Outstanding
|
Options Vested and Exercisable
|
|||||||||||||||||||||||||
|
Exercise Price
|
Number Outstanding
|
Weighted Average Contractual Life (Years)
|
Weighted Average Exercise Price
|
Aggregate Intrinsic Value at March 31, 2014
|
Number Vested and Exercisable
|
Weighted Average Contractual Life (Years)
|
Weighted Average Exercise Price
|
Aggregate Intrinsic Value at March 31, 2014
|
||||||||||||||||||
|
$5.20
|
393,327
|
|
6.55
|
$
|
5.20
|
|
$
|
7,072,019
|
|
393,327
|
|
6.55
|
$
|
5.20
|
|
$
|
7,072,019
|
|
||||||||
|
$9.82
|
26,821
|
|
6.91
|
9.82
|
|
358,329
|
|
26,821
|
|
6.91
|
9.82
|
|
358,329
|
|
||||||||||||
|
$12.00
|
88,104
|
|
7.12
|
12.00
|
|
985,003
|
|
24,054
|
|
7.12
|
12.00
|
|
268,924
|
|
||||||||||||
|
$21.52
|
50,214
|
|
8.34
|
21.52
|
|
83,355
|
|
8,866
|
|
8.34
|
21.52
|
|
14,718
|
|
||||||||||||
|
$5.20-$21.52
|
558,466
|
|
6.81
|
$
|
7.96
|
|
$
|
8,498,706
|
|
453,068
|
|
6.64
|
$
|
6.15
|
|
$
|
7,713,990
|
|
||||||||
The aggregate intrinsic value in the preceding table represents the total intrinsic value based on our closing stock price of
$23.18
as of March 31, 2014, which would have been received by the option holders had all option holders exercised as of that date.
Stock options are valued by using a Black-Scholes-Merton option pricing model. We calculate the value of our stock option awards when they are granted. Accordingly, we update our valuation assumptions for volatility and the risk free interest rate each quarter that option grants are awarded. Annually, we prepare an analysis of the historical activity within our option plans as well as the demographic characteristics of the grantees of options within our stock option plan to determine the estimated life of the grants and possible ranges of estimated forfeiture. The expected life was determined using the simplified method for estimating expected option life, which qualify as “plain-vanilla” options. Due to the fact that the common stock underlying the options was not publicly traded for an equivalent period of the expected term of the options, the expected volatility was based on a comparable group of companies in conjunction with the historical volatility from traded shares of our stock. The risk-free interest rate is based on the rate of a zero-coupon U.S. Treasury instrument with a remaining term approximately equal to the expected term. We do not expect to pay dividends in the near term and therefore do not incorporate the dividend yield as part of our assumptions.
The following table reflects the assumptions used for fiscal 2013 and 2012. No options were granted in fiscal 2014.
|
Year Ended March 31, 2013
|
Year Ended March 31, 2012
|
||||||
|
Expected life
|
6.50
|
|
6.66
|
|
|||
|
Expected volatility
|
59.9
|
%
|
45.0
|
%
|
|||
|
Risk free interest rate
|
0.98
|
%
|
3.25
|
%
|
|||
|
Dividend expense yield
|
—
|
|
—
|
|
|||
Restricted Stock Awards and Units
Restricted stock awards have been issued to members of our board of directors and restricted stock units have been issued to certain employees. For restricted stock awards, the actual common shares have been issued with voting rights and are included as part of our total common shares outstanding. The common shares may not be sold or exchanged until the vesting period is completed. For restricted stock units, no common shares are issued until the vesting period is completed. For restricted stock units, the Company allows its employees to withhold a portion of their units upon the vesting dates in order to satisfy their tax obligation. For both restricted stock awards and units, fair value is determined by the market value of our common stock on the date of the grant
68
The following table summarizes the activity with regard to unvested restricted stock awards during
fiscal 2014
,
fiscal 2013
and
fiscal 2012
.
|
Restricted Stock Awards
|
Number of Shares
|
Weighted Average Grant Price
|
||||||
|
Balance at March 31, 2011
|
—
|
|
$
|
—
|
|
|||
|
Granted
|
16,136
|
|
12.42
|
|
||||
|
Released
|
—
|
|
—
|
|
||||
|
Forfeited
|
—
|
|
—
|
|
||||
|
Balance of unvested awards at March 31, 2012
|
16,136
|
|
$
|
12.42
|
|
|||
|
Granted
|
13,012
|
|
21.52
|
|
||||
|
Released
|
(8,068
|
)
|
12.42
|
|
||||
|
Forfeited
|
—
|
|
—
|
|
||||
|
Balance of unvested awards at March 31, 2013
|
21,080
|
|
$
|
18.09
|
|
|||
|
Granted
|
17,416
|
|
20.09
|
|
||||
|
Released
|
(20,980
|
)
|
18.09
|
|
||||
|
Forfeited
|
—
|
|
—
|
|
||||
|
Balance of unvested awards at March 31, 2014
|
17,516
|
|
$
|
20.09
|
|
|||
Based on our closing stock price of
$23.18
, the aggregate intrinsic value of the unvested restricted stock awards at
March 31, 2014
was
$406
. Total unrecognized expense related to unvested restricted stock awards was approximately
$130
as of
March 31, 2014
. We anticipate this expense to be recognized over a weighted average period of approximately
0.3 years
.
The following table summarizes the activity with regard to unvested restricted stock units during
fiscal 2014
and
fiscal 2013
. There were no restricted stock units granted or outstanding during fiscal 2012.
|
Restricted Stock Units
|
Number of Shares
|
Weighted Average Grant Fair Value
|
||||||
|
Balance at March 31, 2012
|
—
|
|
$
|
—
|
|
|||
|
Granted
|
71,923
|
|
21.52
|
|
||||
|
Released
|
—
|
|
—
|
|
||||
|
Forfeited
|
(814
|
)
|
21.52
|
|
||||
|
Balance of unvested units at March 31, 2013
|
71,109
|
|
$
|
21.52
|
|
|||
|
Granted
|
117,904
|
|
20.14
|
|
||||
|
Released
|
(18,786
|
)
|
21.52
|
|
||||
|
Forfeited
|
(5,902
|
)
|
21.52
|
|
||||
|
Balance of unvested units at March 31, 2014
|
164,325
|
|
$
|
20.53
|
|
|||
Based on our closing stock price of
$23.18
, the aggregate intrinsic value of the unvested restricted stock units at
March 31, 2014
was
$3,809
. Total unrecognized expense related to unvested restricted stock awards was approximately
$2,558
as of
March 31, 2014
. We anticipate this expense to be recognized over a weighted average period of approximately
2.17 years
.
Performance Stock Units
During
fiscal 2014
and fiscal 2013, performance stock unit awards were issued to our
four
named executive officers and had a total fair value at grant date of
$480
and
$960
, respectively. The performance indicator for these stock awards is based on the market performance of our stock price as compared to a pre-determined peer group of companies with similar business characteristics as ours. Since the performance indicator is market based, we prepared a Monte Carlo valuation model
69
to calculate the probable outcome of the performance measure to arrive at the fair value. The fair value of the performance stock units will be expensed over
three
years, whether or not the market condition is met. At the end of each fiscal year, one-third of the performance stock units will be evaluated. It will then be determined how many shares of stock will be issued. In each year of the performance period, the possible number of shares will range from zero percent to two hundred percent of the target shares. In fiscal 2014 the target amount of shares ranged from
zero
to
29,036
in the aggregate and
zero
to
29,430
in fiscal 2013. In fiscal 2014,
10,594
shares in respect of vested performance stock units were issued to our four named executive officers. The Company withheld an additional
1,660
shares, to satisfy our named executive officers' tax obligations, for a total of
12,254
vested shares earned in fiscal 2014.
No
performance stock units were vested in fiscal 2013. Shares that are not awarded in a given year will be forfeited. At March 31, 2014, there was
$384
in stock compensation that remained to be expensed.
14. Income Taxes
Income taxes included in the consolidated income statement consisted of the following
|
Year Ended March 31, 2014
|
Year Ended March 31, 2013
|
Year Ended March 31, 2012
|
|||||||||||
|
Current provision:
|
|||||||||||||
|
Federal provision (benefit)
|
$
|
(1,594
|
)
|
$
|
3,835
|
|
$
|
(1,072
|
)
|
||||
|
Foreign provision
|
12,451
|
|
12,352
|
|
12,551
|
|
|||||||
|
State provision
|
484
|
|
422
|
|
356
|
|
|||||||
|
Deferred provision:
|
|||||||||||||
|
Federal deferred benefit
|
(2,515
|
)
|
(376
|
)
|
(1,424
|
)
|
|||||||
|
Foreign deferred benefit
|
(1,790
|
)
|
(1,646
|
)
|
(2,788
|
)
|
|||||||
|
State deferred benefit
|
(72
|
)
|
(11
|
)
|
(155
|
)
|
|||||||
|
Total provision for income taxes
|
$
|
6,964
|
|
$
|
14,576
|
|
$
|
7,468
|
|
||||
70
Deferred income tax assets and liabilities were as follows:
|
March 31,
|
|||||||||
|
2014
|
2013
|
||||||||
|
Deferred tax assets:
|
|||||||||
|
Current
|
|||||||||
|
Accrued liabilities and reserves
|
$
|
1,934
|
|
$
|
1,891
|
|
|||
|
Unrealized gain on hedge
|
39
|
|
11
|
|
|||||
|
Inventories
|
399
|
|
433
|
|
|||||
|
Total current deferred tax assets
|
2,372
|
|
2,335
|
|
|||||
|
Non-current
|
|||||||||
|
Foreign tax credit carry forward
|
1,722
|
|
1,159
|
|
|||||
|
Capitalized transaction costs
|
670
|
|
740
|
|
|||||
|
Stock option compensation
|
796
|
|
963
|
|
|||||
|
Other
|
133
|
|
18
|
|
|||||
|
Total non-current deferred tax assets
|
3,321
|
|
2,880
|
|
|||||
|
Deferred tax liabilities:
|
|||||||||
|
Current
|
|||||||||
|
Prepaid expenses
|
(47
|
)
|
(124
|
)
|
|||||
|
Total current deferred tax liabilities
|
(47
|
)
|
(124
|
)
|
|||||
|
Non-current
|
|||||||||
|
Intangible assets
|
(35,088
|
)
|
(38,783
|
)
|
|||||
|
Property, plant and equipment
|
(2,988
|
)
|
(3,011
|
)
|
|||||
|
Undistributed foreign earnings
|
(3,141
|
)
|
(3,685
|
)
|
|||||
|
Total non-current tax liabilities
|
(41,217
|
)
|
(45,479
|
)
|
|||||
|
Net current deferred tax asset
|
$
|
2,325
|
|
$
|
2,211
|
|
|||
|
Net non-current deferred tax liability
|
$
|
(37,896
|
)
|
$
|
(42,599
|
)
|
|||
As of
March 31, 2014
, the Company had foreign tax credit carryforwards of
$1,722
. These carryforwards expire in fiscal
2023
. Recognition of these credit carryforwards is subject to an annual limit, which may cause them to expire before they are used.
The U.S. and non-U.S. components of income (loss) from continuing operations before income taxes were as follows:
|
Year Ended March 31, 2014
|
Year Ended March 31, 2013
|
Year Ended March 31, 2012
|
|||||||||||
|
U.S.
|
$
|
(6,315
|
)
|
$
|
4,951
|
|
$
|
(14,480
|
)
|
||||
|
Non-U.S.
|
39,078
|
|
36,599
|
|
33,978
|
|
|||||||
|
Income from continuing operations
|
$
|
32,763
|
|
$
|
41,550
|
|
$
|
19,498
|
|
||||
71
The difference between the provision for income taxes and the amount that would result from applying the U.S. statutory tax rate to income before provision for income taxes is as follows:
|
Year Ended March 31, 2014
|
Year Ended March 31, 2013
|
Year Ended March 31, 2012
|
||||||||||||
|
Notional U.S. federal income tax expense at statutory rate
|
$
|
11,467
|
|
$
|
14,543
|
|
$
|
6,825
|
|
|||||
|
Adjustments to reconcile to the income tax provision:
|
||||||||||||||
|
U.S. state income tax provision, net
|
243
|
|
263
|
|
77
|
|
||||||||
|
Undistributed foreign earnings
|
—
|
|
44
|
|
1,728
|
|
||||||||
|
Effects on Canadian debt facility
|
—
|
|
—
|
|
—
|
|
||||||||
|
Rate difference-international subsidiaries
|
(3,409
|
)
|
(270
|
)
|
(1,974
|
)
|
||||||||
|
Nondeductible expenses
|
179
|
|
115
|
|
774
|
|
||||||||
|
Charges/(benefits) related to uncertain tax positions
|
(797
|
)
|
143
|
|
211
|
|
||||||||
|
Release of tax liability from Predecessor owners
|
(575
|
)
|
—
|
|
—
|
|
||||||||
|
Other
|
(144
|
)
|
(262
|
)
|
(173
|
)
|
||||||||
|
Provision for income taxes
|
$
|
6,964
|
|
$
|
14,576
|
|
$
|
7,468
|
|
|||||
During the year ended March 31, 2014, we have adopted a permanent reinvestment position whereby we expect to reinvest our foreign earnings for most of our foreign subsidiaries and do not expect to repatriate future earnings. As a result of this policy change, we will no longer accrue a tax liability in anticipation of future dividends from our significant foreign subsidiaries. The estimated annual effective tax rate for the fiscal year ended March 31, 2014 reflects the estimated taxable earnings of our various foreign subsidiaries and the applicable local tax rates and after accounting for certain permanent differences, such as nondeductible compensation expenses. The deferred tax liability recorded on the U.S. financial statements that was previously recorded on prior foreign earnings is subject to fluctuations in the U.S. dollar/foreign currency exchange rate each year. The translation effect to our deferred tax liability is included as part of the “Foreign currency translation adjustment” within “Other comprehensive income” and was a
$525
and
$52
increase to other comprehensive income for the years ended March 31, 2014 and March 31, 2013, respectively and a
$287
reduction for the year ended March 31, 2012.
For the year ended March 31, 2014, the United States entities generated a net operating loss as result of the premiums paid and other costs related to the refinancing of the senior secured notes. As previous tax periods that remain open do not have available taxable income to apply this loss, it can only be carried forward. The net operating loss may be carried forward to tax periods until the fiscal year ending March 31, 2034. Without the debt refinancing costs during the year ended March 31, 2014, the United States entities would have generated taxable income in fiscal 2014 and we expect that the Company will generate taxable income in the U.S. in the fiscal year ending March 31, 2015. Accordingly, we recognized the tax benefit of this loss in the fiscal year ended March 31, 2014 and have not applied a valuation allowance.
In connection with the Audax Transaction in 2007, the Predecessor obtained financing in Canada, which was repaid through the CHS Transactions. In completing the Audax Transaction, the stock of Thermon Canada, a subsidiary of Thermon Manufacturing Company (“TMC”), was distributed to Thermon Holding Corp. (“THC”). This caused TMC to realize a gain on the difference between its tax basis in Thermon Canada and the fair market value of Thermon Canada's stock under Section 311(b) of the Internal Revenue Code; however, the gain was deferred under the consolidated return rules and created a “deferred intercompany gain.” This deferred gain is a tax attribute that is not reflected on the financial statements of the Company since it is avoidable.
As of
March 31, 2014
, the tax years 2011 through 2014 remain open to examination by the major taxing jurisdictions to which we are subject with the exception of Canada as discussed below. The Company’s U.S. federal income tax return is under exam for the tax year ended March 31, 2011. The Company’s Canadian federal income tax returns are under exam for the Predecessor’s tax years ended March 31, 2008, 2009 and 2010. See Note 12, “Commitments and Contingencies.”
72
A liability for uncertain tax positions of
$167
was recorded during the year ended
March 31, 2014
which relates to an ongoing Russian tax audit. See Note 12, “Commitments and Contingencies.” During the year ended
March 31, 2014
, we concluded an income tax audit with the United States Internal Revenue Service. As a result, we released reserves for uncertain tax positions taken on the periods under examination and recorded a related tax benefit of
$944
. Additionally,
$60
of interest and penalties were accrued on previously established reserves. Activity within our reserve for uncertain tax positions as well as the penalties and interest are recorded as a component of the Company's income tax expense. A reconciliation of the beginning and ending amount of unrecognized tax benefits is as follows:
|
Year Ended March 31, 2014
|
Year Ended March 31, 2013
|
||||||||
|
Beginning balance
|
$
|
1,651
|
|
$
|
1,509
|
|
|||
|
Additions based on tax positions related to the current year
|
167
|
|
—
|
|
|||||
|
Reductions for tax positions of prior years
|
(944
|
)
|
—
|
|
|||||
|
Settlements
|
(80
|
)
|
—
|
|
|||||
|
Interest and penalties on prior reserves
|
60
|
|
142
|
|
|||||
|
Reserve for uncertain income taxes
|
$
|
854
|
|
$
|
1,651
|
|
|||
With the conclusion of an audit with the United States Internal Revenue Service, we received a refund of
$2,004
. This amount related to tax periods associated with our Predecessor owners and was therefore payable as part of "Obligations due to settle the CHS Transactions", see Note 10. Related-Party Transactions. The payment of this refund represented the final transaction tax benefit due to the Predecessor owners. Accordingly, we released
$575
of additional estimated tax benefits as a reduction of tax expense that we determined would not be realized and are no longer payable.
15. Geographic Information
We have defined our operating segments based on geographic regions. These regions share similar economic characteristics, product mix, customers and distribution methods. Accordingly, we have elected to aggregate these geographic regions into a single reportable segment.
Within our single reportable segment, we present additional detail for those countries or regions that generate significant revenue and operating income. For purposes of this note, revenue is attributed to individual countries on the basis of the physical location and jurisdiction of organization of the subsidiary that invoices the material and services.
Total sales, income from operations and property, plant and equipment,net classified by major geographic area in which the Company operates are as follows:
73
|
Year Ended March 31, 2014
|
Year Ended March 31, 2013
|
Year Ended March 31, 2012
|
||||||||||
|
Sales by geographic area:
|
||||||||||||
|
United States
|
$
|
91,187
|
|
$
|
83,458
|
|
$
|
93,074
|
|
|||
|
Canada
|
93,626
|
|
99,808
|
|
83,532
|
|
||||||
|
Europe
|
58,248
|
|
59,495
|
|
66,709
|
|
||||||
|
Asia
|
34,262
|
|
41,275
|
|
29,008
|
|
||||||
|
|
$
|
277,323
|
|
$
|
284,036
|
|
$
|
272,323
|
|
|||
|
Income from Operations:
|
||||||||||||
|
United States
|
$
|
14,847
|
|
$
|
15,571
|
|
$
|
17,513
|
|
|||
|
Canada
|
32,190
|
|
34,352
|
|
29,648
|
|
||||||
|
Europe
|
9,398
|
|
4,080
|
|
8,252
|
|
||||||
|
Asia
|
5,737
|
|
5,943
|
|
5,095
|
|
||||||
|
Unallocated:
|
||||||||||||
|
Management fees
|
—
|
|
—
|
|
(8,158
|
)
|
||||||
|
Public company costs
|
(1,352
|
)
|
(1,617
|
)
|
(1,380
|
)
|
||||||
|
Stock compensation
|
(2,203
|
)
|
(1,341
|
)
|
(6,514
|
)
|
||||||
|
|
$
|
58,617
|
|
$
|
56,988
|
|
$
|
44,456
|
|
|||
|
March 31,
|
||||||||||||
|
2014
|
2013
|
|||||||||||
|
Property, plant and equipment, net:
|
||||||||||||
|
United States
|
$
|
26,428
|
|
$
|
25,906
|
|
||||||
|
Canada
|
1,235
|
|
1,573
|
|
||||||||
|
Europe
|
3,290
|
|
3,069
|
|
||||||||
|
Asia
|
579
|
|
663
|
|
||||||||
|
$
|
31,532
|
|
$
|
31,211
|
|
|||||||
At March 31, 2014 and March 31, 2013, non-current deferred tax assets of
$3,321
and
$2,880
respectively, were applicable to the United States.
74
16. Quarterly Results (Unaudited)
The following quarterly results have been derived from unaudited consolidated financial statements that, in the opinion of management, reflect all adjustments (consisting only of normal recurring adjustments) necessary for a fair presentation of such quarterly information. The operating results for any quarter are not necessarily indicative of the results to be expected for any future period. The unaudited quarterly financial data for each of the eight quarters in the two years ended
March 31, 2014
are as follows:
|
Three Months Ended
|
||||||||||||||||
|
June 30, 2013
|
September 30, 2013
|
December 31, 2013
|
March 31, 2014
|
|||||||||||||
|
Sales
|
$
|
65,600
|
|
$
|
72,783
|
|
$
|
71,465
|
|
$
|
67,475
|
|
||||
|
Gross Profit
|
31,014
|
|
35,355
|
|
36,056
|
|
32,745
|
|
||||||||
|
Income from operations
|
12,055
|
|
14,453
|
|
17,758
|
|
14,351
|
|
||||||||
|
Net income (loss) (a)
|
$
|
(6,938
|
)
|
$
|
10,572
|
|
$
|
12,583
|
|
$
|
9,582
|
|
||||
|
Net income (loss) per common share
|
||||||||||||||||
|
Basic
|
$
|
(0.22
|
)
|
$
|
0.34
|
|
$
|
0.40
|
|
$
|
0.30
|
|
||||
|
Diluted
|
(0.22
|
)
|
0.33
|
|
0.39
|
|
0.30
|
|
||||||||
(a) During the three months ended June 30, 2013, we redeemed the remaining $118,145 of the aggregate outstanding principal amount of our 9.5% senior secured notes. In conjunction with the redemption, we paid a total of $15,485 in call premiums and expensed the remaining $4,010 of associated deferred debt issuance costs.
|
Three Months Ended
|
||||||||||||||||
|
June 30, 2012
|
September 30, 2012
|
December 31, 2012
|
March 31, 2013
|
|||||||||||||
|
Sales
|
$
|
67,690
|
|
$
|
67,849
|
|
$
|
76,830
|
|
$
|
71,667
|
|
||||
|
Gross Profit
|
33,339
|
|
32,639
|
|
34,951
|
|
31,903
|
|
||||||||
|
Income from operations
|
14,530
|
|
15,347
|
|
15,253
|
|
11,858
|
|
||||||||
|
Net income
|
$
|
6,600
|
|
$
|
6,987
|
|
$
|
7,738
|
|
$
|
5,649
|
|
||||
|
Net income per common share
|
||||||||||||||||
|
Basic
|
$
|
0.22
|
|
$
|
0.23
|
|
$
|
0.25
|
|
$
|
0.18
|
|
||||
|
Diluted
|
0.21
|
|
0.22
|
|
0.24
|
|
0.18
|
|
||||||||
As disclosed in the Company’s Current Report on Form 8-K filed with the Securities and Exchange Commission on June 17, 2013, following a competitive bid process, the Company changed its independent registered public accounting firm, effective June 14, 2013 and for the fiscal year ended March 31, 2014, from Ernst & Young LLP (“E&Y”) to KPMG LLP (“KPMG”).
E&Y’s report on our consolidated financial statements as of and for the fiscal year ended March 31, 2012 noted (i) E&Y did not audit the 2010 financial statements of Thermon Canada Inc., Thermon Australia, PTY., LTD, and Thermon Heat Tracing & Engineering (Shanghai) Co., Ltd., all wholly owned subsidiaries of Thermon; (ii) those financial statements were audited by other auditors whose reports had been furnished to E&Y; (iii) E&Y’s opinion on our consolidated financial statements as of and for the fiscal year ended March 31, 2012, insofar as it related to the amounts included for Thermon Canada Inc., Thermon Australia, PTY., LTD (each of which are before certain adjustments to conform to U.S. generally accepted accounting principles), and Thermon Heat Tracing & Engineering (Shanghai) Co., Ltd., was based solely on the reports of such other auditors; and (iv) E&Y audited significant differences from Canadian generally accepted accounting principles and Australian generally accepted accounting principles to U.S. generally accepted accounting principles for 2010 related to Thermon Canada Inc. and Thermon Australia, PTY., LTD, respectively, reflected in Note 18 to our consolidated financial statements for the fiscal year ended March 31, 2012.
75
Except as described in the immediately preceding paragraph, E&Y’s reports on our consolidated financial statements as of and for the fiscal years ended March 31, 2013 and 2012 did not contain an adverse opinion or a disclaimer of opinion, nor were they qualified or modified as to uncertainty, audit scope or accounting principles. E&Y’s report on the effectiveness of internal control over financial reporting as of March 31, 2013 did not contain an adverse opinion or a disclaimer of opinion, nor was it qualified or modified as to uncertainty, audit scope or accounting principles.
During the fiscal years ended March 31, 2013 and 2012, and the subsequent interim period through June 14, 2013, the date of E&Y’s dismissal, (i) there were no “disagreements” (as that term is defined in Item 304(a)(1)(iv) of Regulation S-K and the related instructions) between us and E&Y on any matter of accounting principles or practices, financial statement disclosure, or auditing scope or procedure, which, if not resolved to the satisfaction of E&Y would have caused E&Y to make reference to the subject matter of any such disagreement in connection with its reports for such fiscal years and interim period, and (ii) there were no “reportable events” (as that term is defined in Item 304(a)(1)(v) of Regulation S-K).
During the fiscal years ended March 31, 2013 and 2012, and the subsequent interim period through June 14, 2013, neither we, nor anyone acting on our behalf, consulted with KPMG regarding either (i) the application of accounting principles to a specified transaction, either completed or proposed, or the type of audit opinion that might be rendered on our consolidated financial statements, in any case where either a written report or oral advice was provided to us by KPMG that KPMG concluded was an important factor considered by us in reaching a decision as to any accounting, auditing or financial reporting issue; or (ii) any matter that was either the subject of a “disagreement” (as that term is defined in Item 304(a)(1)(iv) of Regulation S-K and the related instructions) or a “reportable event” (as that term is defined in Item 304(a)(1)(v) of Regulation S-K).
Controls and Procedures
Disclosure Controls and Procedures
Under the supervision and with the participation of the Company's management, including its Chief Executive Officer and Chief Financial Officer, the Company has evaluated the effectiveness of the design and operation of its disclosure controls and procedures pursuant to Rule 13a-15(b) under the Exchange Act as of the end of the period covered by this annual report. Based on that evaluation, the Company's Chief Executive Officer and Chief Financial Officer have concluded that, as of the end of the period covered by this annual report, these disclosure controls and procedures were effective to provide reasonable
76
assurance that information required to be disclosed in the reports filed or submitted under the Exchange Act is recorded, processed, summarized and reported within the time periods specified in the SEC's rules and forms, and that such information is accumulated and communicated to the Company's management to allow timely decisions regarding required disclosure.
Management's Annual Report on Internal Control Over Financial Reporting
The Company's management is responsible for establishing and maintaining adequate internal control over financial reporting, as such term is defined in Rule 13a-15(f) under the Exchange Act. Our internal control system was designed to provide reasonable assurance regarding the reliability of financial reporting and the preparation of financial statements for external purposes in accordance with generally accepted accounting principles and includes those policies and procedures that: (1) pertain to the maintenance of records that in reasonable detail accurately and fairly reflect the transactions and dispositions of the assets of the Company; (2) provide reasonable assurance that transactions are recorded as necessary to permit preparation of financial statements in accordance with generally accepted accounting principles, and that receipts and expenditures of the Company are being made only in accordance with authorizations of management and directors of the Company; and (3) provide reasonable assurance regarding prevention or timely detection of unauthorized acquisition, use or disposition of the Company's assets that could have a material effect on the financial statements. All internal control systems, no matter how well designed, have inherent limitations. Therefore, even those systems determined to be effective can provide only reasonable assurance with respect to financial statement preparation and presentation.
Management assessed the effectiveness of the Company's internal control over financial reporting as of
March 31, 2014
, based on the criteria set forth in the Internal Control - Integrated Framework (1992) issued by the Committee of Sponsoring Organizations of the Treadway Commission (“COSO”). Based on this assessment, management has concluded that, as of
March 31, 2014
, our internal control over financial reporting is effective.
KPMG LLP, the independent registered public accounting firm that audited the Company's consolidated financial statements as of and for the year ended March 31, 2014 included in this annual report, has issued an attestation report on the effectiveness of the Company's internal control over financial reporting as of March 31, 2014. The report, which expressed an unqualified opinion on the effectiveness of the Company's internal control over financial reporting as of March 31, 2014, is included in Item 8 in this Annual Report.
Changes in Internal Control
There have been no changes in the Company's internal control over financial reporting that occurred during the most recently completed fiscal year ended
March 31, 2014
that have materially affected, or are reasonably likely to materially affect, the Company's internal control over financial reporting.
None.
Information regarding to our directors and executive officers is incorporated herein by reference to the “Directors and Executive Officers" section of our Definitive Proxy Statement for the 2014 Annual Meeting of Stockholders.
Information regarding compliance with Section 16(a) of the Securities Exchange Act of 1934 is incorporated herein by reference to the “Section 16(a) Beneficial Ownership Reporting Compliance” section of our Definitive Proxy Statement for the 2014 Annual Meeting of Stockholders.
Information regarding the audit committee financial expert and the audit committee is incorporated herein by reference to the sections entitled “Corporate Governance-Committees of the Board” and “Audit Committee Report” in our Definitive Proxy Statement for the 2014 Annual Meeting of Stockholders.
Code of Business Conduct and Ethics
77
We have adopted a written code of business conduct and ethics, which we refer to as our "code of conduct", which applies to all of our employees, officers and directors. Our code of conduct is available on our Investor Relations website located at
http://ir.thermon.com
. Stockholders can also obtain a free copy of our code of conduct by writing to the Director of Investor Relations, Thermon Group Holdings, Inc., 100 Thermon Drive, San Marcos, Texas 78666. We will post any amendments to our code of conduct, and any waivers that are required to be disclosed pursuant to SEC or NYSE rules, on our Investor Relations website.
Information regarding executive and director compensation is incorporated by reference to the “Compensation Discussion and Analysis” section of our Definitive Proxy Statement for the 2014 Annual Meeting of Stockholders.
The material incorporated herein by reference to the information set forth under the “Compensation Committee Report” in our Definitive Proxy Statement for the 2014 Annual Meeting of Stockholders shall be deemed furnished, and not filed, in this Annual Report on Form 10-K and shall not be deemed incorporated by reference into any of our filings under the Securities Act of 1933 or the Securities Exchange Act of 1934 as a result of this furnishing, except to the extent that we have specifically incorporated such materials by reference.
Information regarding compensation committee interlocks and insider participation is incorporated herein by reference to the information under the heading “Corporate Governance-Compensation Committee Interlocks and Insider Participation” section of our Definitive Proxy Statement for the 2014 Annual Meeting of Stockholders.
Information regarding security ownership of certain beneficial owners and management is incorporated herein by reference to the “Security Ownership of Certain Beneficial Owners and Management” section of our Definitive Proxy Statement for the 2014 Annual Meeting of Stockholders.
Information related to compensation plans under which our equity securities are authorized for issuance as of March 31, 2014 is set forth in the table below.
Equity Compensation Plan Information
The following table sets forth information regarding our equity compensation plans as of March 31, 2014. Specifically, the table provides information regarding our 2010 Equity Plan and the LTIP, described elsewhere in this annual report.
|
Plan Category
|
Number of securities to be issued upon exercise of outstanding equity awards
|
Weighted-average exercise price of outstanding options
|
Number of securities remaining available for future issuances under equity compensation plans (1)
|
||||||||
|
Equity compensation plans
|
|||||||||||
|
approved by security holders (2)
|
375,629
|
|
(3)
|
|
2,400,318
|
|
|||||
|
Equity plans not approved by security holders (4)
|
420,148
|
|
$
|
5.49
|
|
—
|
|
||||
|
(1)
|
Excludes securities reflected in the column entitled “Number of securities to be issued upon exercise of outstanding equity awards”
|
|
(2)
|
On April 8, 2011, our board of directors and pre-IPO stockholders approved the Thermon Group Holdings, Inc. 2011 Long-Term Incentive Plan (“2011 LTIP”). The 2011 LTIP authorized the issuance of 2,893,341 equity awards.
|
78
|
(3)
|
At March 31, 2014, the Company had outstanding under the LTIP: (i) 138,318 stock options, with a weighted average exercise price of $15.46, (ii) 164,325 unvested restricted stock units, with a weighted average grant date fair value of $20.53, and (iii) 72,9876 performance units, with a weighted average grant date fair value of $15.34.
|
|
(4)
|
The 2010 Thermon Group Holdings, Inc. Restricted Stock and Stock Option Plans (the “2010 Plan”) was approved by our board of directors on July 28, 2010. The 2010 Plan authorized the issuance of 2,767,171 equity awards and provides for the grant of non-qualified stock options and restricted stock. In connection with our May 2011 IPO, all 2,757,524 of the unvested stock options that were then outstanding under the 2010 Plan became fully vested and exercisable. The 2010 Plan will terminate as of the earlier of (i) the date on which all equity awards under the 2010 Plan have been issued, (ii) the termination of the 2010 Plan by our board of directors, or (iii) the tenth anniversary of the effective date of the 2010 Plan; however, no further grants or equity awards will be made under the 2010 Plan. Under the 2010 Plan, the compensation committee of our board of directors has the authority to designate participants in the plan, determine the form of awards, the number of shares subject to individual awards, and the terms and conditions, including the vesting schedule, of each award granted under the 2010 Plan. The term of any option shall be fixed by the compensation committee and shall not exceed ten years from the date of grant. At March 31, 2014, the Company had outstanding under the 2010 Plan 420,148 non-qualified stock options, with a weighted average exercise price of $5.49.
|
Information regarding certain relationships and related transactions and director independence is incorporated herein by reference to the “Certain Relationships and Related Party Transactions” and “Corporate Governance-Director Independence” sections, respectively, of our Definitive Proxy Statement for the 2014 Annual Meeting of Stockholders.
Information regarding our principal accountant fees and services is incorporated herein by reference to the “Audit and Non-Audit Fees” section of our Definitive Proxy Statement for the 2014 Annual Meeting of Stockholders.
The following documents are filed as a part of this annual report:
|
1.
|
Financial Statements:
Included herein at pag
es 43 through 75
|
|
2.
|
Financial statement schedules
: None. Financial statement schedules have been omitted since the required information is included in our consolidated financial statements contained elsewhere in this annual report.
|
|
3.
|
Exhibits:
See the Exhibit Index following the signature page of this annual report, which is incorporated herein by reference. Each management contract and compensatory plan or arrangement required to be filed as an exhibit to this annual report is identified in the Exhibit Index by a single asterisk following its exhibit number.
|
Certain of the agreements included as exhibits to this annual report contain representations and warranties by each of the parties to the applicable agreement. These representations and warranties have been made solely for the benefit of the other parties to the applicable agreement and:
|
•
|
should not in all instances be treated as categorical statements of fact, but rather as a way of allocating the risk to one of the parties if those statements prove to be inaccurate;
|
|
•
|
have been qualified by disclosures that were made to the other party in connection with the negotiation of the applicable agreement, which disclosures are not necessarily reflected in the agreement;
|
|
•
|
may apply standards of materiality in a way that is different from what may be viewed as material to you or other investors; and
|
79
|
•
|
were made only as of the date of the applicable agreement or such other date or dates as may be specified in the agreement and are subject to more recent developments.
|
The registrant acknowledges that, notwithstanding the inclusion of the foregoing cautionary statements, it is responsible for considering whether additional specific disclosures of material information regarding material contractual provisions are required to make the statements in this registration statement not misleading.
80
SIGNATURE
Pursuant to the requirements of the Securities Exchange Act of 1934, the registrant has duly caused this report to be signed on its behalf by the undersigned thereunto duly authorized.
|
|
THERMON GROUP HOLDINGS, INC. (registrant)
|
|
|
Date: May 30 2014
|
By:
|
/s/ Jay Peterson
|
|
|
|
Jay Peterson
|
|
|
|
Chief Financial Officer
(Principal Financial and Accounting Officer)
|
Pursuant to the requirements of the Securities Exchange Act of 1934, this annual report has been signed below by the following persons on behalf of the registrants and in the capacities and on the date indicated.
|
Date
|
Title
|
Signatures
|
|||
|
May 30, 2014
|
President and Chief Executive Officer
|
By:
|
/s/ Rodney Bingham
|
||
|
(Principal Executive Officer); Director
|
Rodney Bingham
|
||||
|
May 30, 2014
|
Chief Financial Officer, Senior Vice President, Finance and Secretary
|
By:
|
/s/ Jay Peterson
|
||
|
(Principal Financial and Accounting Officer)
|
Jay Peterson
|
||||
|
May 30, 2014
|
Chairman of the Board
|
By:
|
/s/ Charles A. Sorrentino
|
||
|
Charles A. Sorrentino
|
|||||
|
May 30, 2014
|
Director
|
By:
|
/s/ Marcus J. George
|
||
|
Marcus J. George
|
|||||
|
May 30, 2014
|
Director
|
By:
|
/s/ Richard E. Goodrich
|
||
|
Richard E. Goodrich
|
|||||
|
May 30, 2014
|
Director
|
By:
|
/s/ Kevin J. McGinty
|
||
|
Kevin J. McGinty
|
|||||
|
May 30, 2014
|
Director
|
By:
|
/s/ John T. Nesser
|
||
|
John T. Nesser
|
|||||
|
May 30, 2014
|
Director
|
By:
|
/s/ Michael W. Press
|
||
|
Michael W. Press
|
|||||
|
May 30, 2014
|
Director
|
By:
|
/s/ Stephen A. Snider
|
||
|
Stephen A. Snider
|
|||||
81
EXHIBIT INDEX
|
|
||
|
Exhibit
Number
|
|
Description
|
|
|
|
|
|
2.1
|
Stock Purchase Agreement, dated as of March 26, 2010, by and among Thermon Holdings, LLC, Thermon Holding Corp. and Thermon Group, Inc. (incorporated by reference to Exhibit 2.1 to Registration Statement on Form S-4 (File No. 333-168915) of Thermon Industries, Inc. and additional registrants named therein filed on August 18, 2010)**
|
|
|
2.2
|
First Amendment to the Stock Purchase Agreement, dated as of April 28, 2010, by and among Thermon Holdings, LLC, Thermon Holding Corp. and Thermon Group, Inc. (incorporated by reference to Exhibit 2.2 to Registration Statement on Form S-4 (File No. 333-168915) of Thermon Industries, Inc. and additional registrants named therein filed on August 18, 2010)**
|
|
|
2.3
|
Amendment to the Stock Purchase Agreement, dated as of July 12, 2010, by and among Thermon Holdings, LLC, Thermon Holding Corp. and Thermon Group, Inc. (incorporated by reference to Exhibit 2.3 to Registration Statement on Form S-4 (File No. 333-168915) of Thermon Industries, Inc. and additional registrants named therein filed on August 18, 2010)**
|
|
|
2.4
|
Form of Certificate of Ownership and Merger merging Thermon Group, Inc. with and into Thermon Group Holdings, Inc. (incorporated by reference to Exhibit 2.5 to Amendment No. 2 to Registration Statement on Form S-1 (File No. 333-172007) of the registrant filed on April 1, 2011)
|
|
|
3.1
|
Second Amended and Restated Certificate of Incorporation of Thermon Group Holdings, Inc., effective as of May 10, 2011 (incorporated by reference to Exhibit 3.1 to the registrant's Current Report on Form 8-K filed on May 13, 2011)
|
|
|
3.2
|
Amended and Restated Bylaws of Thermon Group Holdings, Inc., effective as of May 10, 2011 (incorporated by reference to Exhibit 3.2 to the registrant's Current Report on Form 8-K filed on May 13, 2011)
|
|
|
4.1
|
Specimen Common Stock Certificate (incorporated by reference to Exhibit 4.1 to Amendment No. 2 to Registration Statement on Form S-1 (File No. 333-172007) of the registrant filed on April 1, 2011)
|
|
|
10.1
|
Amended and Restated Credit Agreement, dated as of April 19, 2013, among Thermon Industries, Inc. and Thermon Canada Inc., as borrowers, the other credit parties named therein, JPMorgan Chase Bank, N.A. and JPMorgan Chase Bank, N.A., Toronto Branch as administrative agents, and the other financial institutions and entities party thereto (incorporated by reference to Exhibit 10.1 to the registrant's Current Report on Form 8-K filed on April 23, 2013)
|
|
|
10.2
|
Guaranty and Security Agreement, dated as of August 7, 2012, among Thermon Industries, Inc., as borrower, the other grantors named therein and JPMorgan Chase Bank, N.A., as US agent
|
|
|
10.3
|
Guarantee and Security Agreement, dated as of August 7, 2012, between Thermon Canada Inc., as borrower, and JPMorgan Chase Bank, N.A., Toronto Branch, as Canadian agent
|
|
|
10.4
|
Amended and Restated Securtityholder Agreement, dated as of April 30, 2010, among Thermon Group Holdings, Inc. and the other parties identified therein (incorporated by reference to Exhibit 10.5 to Registration Statement on Form S-4 (File No. 333-168915) of Thermon Industries, Inc. and additional registrants named therein filed on August 18, 2010)
|
|
|
10.5
|
Amendment No. 1, dated as of April 1, 2011 and effective May 10, 2011, to Amended and Restated Securityholder Agreement, dated as of April 30, 2010, among Thermon Group Holdings, Inc. and the other parties identified therein (incorporated by reference to Exhibit 10.24 to Amendment No. 2 Registrant Statement on Form S-1 (File No. 333-172007 of the registrant filed on April 1, 2011)
|
|
|
10.6
|
Amendment No. 2, dated as of May 4, 2012, to Amended and Restated Securityholder Agreement, dated as of April 30, 2010, as previously Amended by Amendment No. 1, dated as of April 1, 2011 and effective as of May 10, 2011, among Thermon Group Holdings, Inc. and the other parties identified therein (incorporated by reference to Exhibit 10.1 to the registrant's Current Report on Form 8-K of Thermon Group Holdings, Inc. filed on May 10, 2012)
|
|
|
10.7
|
Thermon Group Holdings, Inc. Restricted Stock and Stock Option Plan, as adopted on July 28, 2010 (incorporated by reference to Exhibit 10.7 to Registration Statement on Form S-4 (File No. 333-168915) of Thermon Industries, Inc. and additional registrants named therein filed on August 18, 2010)*
|
|
|
10.8
|
Amendment No. 1 to the Thermon Group Holdings, Inc. Restricted Stock and Stock Option Plan, as adopted on October 27, 2010 (incorporated by reference to Exhibit 10.9 to Amendment No. 3 to Registration Statement on Form S-4 (File No. 333-168915) of Thermon Industries, Inc. and additional registrants named therein filed on November 22, 2010)*
|
|
|
10.9
|
Form of Stock Option Agreement under Thermon Group Holdings, Inc. Restricted Stock and Stock Option Plan (incorporated by reference to Exhibit 10.9 to Amendment No. 2 to Registration Statement on Form S-4 (File No. 333-168915) of Thermon Industries, Inc. and additional registrants named therein filed on October 22, 2010)*
|
|
82
|
|
||
|
Exhibit
Number
|
|
Description
|
|
10.10
|
Amended & Restated Thermon Group Holdings, Inc. 2011 Long-Term Incentive Plan (incorporated by reference to Exhibit 10.1 to the registrant's Current Report on Form 8-K filed on August 6, 2013)
|
|
|
10.11
|
Form of Option Award Notice and Stock Option Agreement under Thermon Group Holdings, Inc. 2011 Long-Term Incentive Plan (incorporated by reference to Exhibit 10.14 to Amendment No. 3 to Registration Statement on Form S-1 (File No. 333-172007) of the registrant filed on April 13, 2011)*
|
|
|
10.12
|
Form of Non-Employee Director Restricted Stock Award Agreement under Thermon Group Holdings, Inc. 2011 Long Term Incentive Plan (incorporated by reference to Exhibit 10.15 to the registrant's Annual Report on Form 10-K for the fiscal year ended March 31, 2011)*
|
|
|
10.13
|
Amended and Restated Employment Agreement, effective as of April 1, 2011, between Rodney Bingham and Thermon Holding Corp. (incorporated by reference to Exhibit 10.15 to Amendment No. 3 to Registration Statement on Form S-1 (File No. 333-172007) of the registrant filed on April 13, 2011)*
|
|
|
10.14
|
Amended and Restated Employment Agreement, effective as of April 1, 2011 between George P. Alexander and Thermon Holding Corp. (incorporated by reference to Exhibit 10.16 to Amendment No. 3 to Registration Statement on Form S-1 (File No. 333-172007) of the registrant filed on April 13, 2011)*
|
|
|
10.15
|
Amended and Restated Employment Agreement, effective as of April 1, 2011 between Jay Peterson and Thermon Holding Corp. (incorporated by reference to Exhibit 10.17 to Amendment No. 3 to Registration Statement on Form S-1 (File No. 333-172007) of the registrant filed on April 13, 2011)*
|
|
|
10.16
|
Amended and Restated Employment Agreement, effective as of August 1, 2011, between Johannes (
René) van der Salm and Thermon Holding Corp. (incorporated by reference to Exhibit 10.2 to the Current Report on Form 8-K of Thermon Group Holdings, Inc. and Thermon Holding Corp. filed August 5, 2011)*
|
|
|
10.17
|
Second Amended and Restated Employment Agreement, effective as of May 1, 2014, between Rodney Bingham and Thermon Holding Corp. (incorporated by reference to Exhibit 10.1 to the registrant's Current Report on Form 8-K filed May 8, 2014)*
|
|
|
10.18
|
Second Amended and Restated Employment Agreement, effective as of May 1, 2014, between George Alexander and Thermon Holding Corp. (incorporated by reference to Exhibit 10.2 to the registrant's Current Report on Form 8-K filed May 8, 2014)*
|
|
|
10.19
|
Second Amended and Restated Employment Agreement, effective as of May 1, 2014, between Jay Peterson and Thermon Holding Corp. (incorporated by reference to Exhibit 10.3 to the registrant's Current Report on Form 8-K filed May 8, 2014)*
|
|
|
10.20
|
Second Amended and Restated Employment Agreement, effective as of May 1, 2014, between Johannes (René) van der Salm and Thermon Holding Corp. (incorporated by reference to Exhibit 10.4 to the registrant's Current Report on Form 8-K filed May 8, 2014)*
|
|
|
10.21
|
Form of Manager Equity Agreement among Thermon Group Holdings, Inc., CHS Private Equity V LP, and the management investors (incorporated by reference to Exhibit 10.17 to Registration Statement on Form S-1 (File No. 333-172007) of the registrant filed on February 2, 2011)*
|
|
|
10.22
|
Form of indemnification agreement for directors and certain officers of Thermon Group Holdings, Inc. (incorporated by reference to Exhibit 10.22 to Amendment No. 2 to Registration Statement on Form S-1 (File No. 333-172007) of the registrant filed on April 1, 2012)*
|
|
|
10.23
|
Form of Amendment No. 1 to the Manager Equity Agreement among Thermon Group Holdings, Inc. CHS Private Equity V LP, and the management investors (incorporated by reference to Exhibit 10.25 to Amendment No. 3 to Registration Statement on Form S-1 (File No. 333-172007) of the registrant filed on April 13, 2011)*
|
|
|
10.24
|
Form of Employee Restricted Stock Award Agreement under Thermon Group Holdings, Inc. 2011 Long-Term Incentive Plan (incorporated by reference to Exhibit 10.28 to the registrant's Annual Report on Form 10-K for the fiscal year ended March 31, 2012)*
|
|
|
10.25
|
Thermon Group Holdings, Inc. 2012 Short-Term Incentive Plan (incorporated by reference to Exhibit 10.1 to the registrant's Current Report on Form 8-K filed on August 6, 2012)*
|
|
|
10.26
|
Form of Performance Unit Award Agreement under Thermon Group Holdings, Inc. 2011 Long-Term Incentive Plan (incorporated by reference to Exhibit 10.3 to the registrant's Quarterly Report on Form 10-Q filed on November 13, 2012)*
|
|
|
10.27
|
Form of Restricted Stock Unit Award Agreement under Thermon Group Holdings, Inc. 2011 Long-Term Incentive Plan (incorporated by reference to Exhibit 10.4 to registrant's Quarterly Report on Form 10-Q filed on November 13, 2012)*
|
|
83
|
|
||
|
16.1
|
Letter from Ernst & Young LLP addressed to the U.S. Securities and Exchange Commission, dated June 17, 2013 (incorporated by reference to Exhibit 16.1 to the registrant's Current Report on Form 8-K filed on June 17, 2013)
|
|
|
21.1
|
Subsidiaries of Thermon Group Holdings, Inc.
|
|
|
23.1
|
Consent of KPMG LLP
|
|
|
23.2
|
Consent of Ernst & Young LLP
|
|
|
23.3
|
Consent of Alvarez & Marsal Private Equity Performance Improvement Group, LLC
|
|
|
31.1
|
|
Certification of Rodney Bingham, Chief Executive Officer pursuant to Rule 13a-14(a)/15d-14(a), as adopted pursuant to Section 302 of the Sarbanes-Oxley Act of 2002
|
|
|
|
|
|
Exhibit
Number
|
|
Description
|
|
31.2
|
|
Certification of Jay Peterson, Chief Financial Officer pursuant to Rule 13a-14(a)/15d-14(a), as adopted pursuant to Section 302 of the Sarbanes-Oxley Act of 2002
|
|
|
|
|
|
32.1
|
|
Certification of Rodney Bingham, Chief Executive Officer pursuant to 18 U.S.C. Section 1350, as adopted pursuant to Section 906 of the Sarbanes-Oxley Act of 2002
|
|
|
|
|
|
32.2
|
|
Certification of Jay Peterson, Chief Financial Officer pursuant to 18 U.S.C. Section 1350, as adopted pursuant to Section 906 of the Sarbanes-Oxley Act of 2002
|
|
|
|
|
|
101
|
|
Interactive Data Files Pursuant to Rule 405 of Regulation S-T: (i) Consolidated Balance Sheets, (ii) Consolidated Statements of Operations and Comprehensive Income (Loss), (iii) Consolidated Statements of Shareholders'/Members' Equity, (iv) Consolidated Statements of Cash Flows, and (v) Notes to Consolidated Financial Statements
|
__________________________________
*
Management contract and compensatory plan or arrangement
**
The registrant agrees to furnish supplementally to the SEC a copy of any omitted schedule or exhibit upon the request of the SEC in accordance with Item 601(b)(2) of Regulation S-K
84
TABLE OF CONTENTS
Part IItem 1. BusinessItem 1A. Risk FactorsItem 1B. Unresolved Staff CommentsItem 2. PropertiesItem 3. Legal ProceedingsItem 4. Mine Safety DisclosuresPart IIItem 5. Market For Registrant's Common Equity, Related Stockholder Matters and Issuer Purchases Of Equity SecuritiesItem 6. Selected Financial DataItem 7. Management's Discussion and Analysis Of Financial Condition and Results Of OperationsItem 7A. Quantitative and Qualitative Disclosures About Market RiskItem 8. Financial Statements and Supplementary DataItem 9. Changes in and Disagreements with Accountants on Accounting and Financial DisclosureItem 9A. Controls and ProceduresItem 9B. Other InformationPart IIIItem 10. Directors, Executive Officers and Corporate GovernanceItem 11. Executive CompensationItem 12. Security Ownership Of Certain Beneficial Owners and Management and Related Stockholder MattersItem 13. Certain Relationships and Related Transactions, and Director IndependenceItem 14. Principal Accountant Fees and ServicesPart IVItem 15. Exhibits and Financial Statement Schedules